UNITED STATES
SECURITIES AND EXCHANGE COMMISSION
Washington, D.C. 20549
FORM N-CSR
CERTIFIED SHAREHOLDER REPORT OF
REGISTERED MANAGEMENT INVESTMENT COMPANIES
| | |
Investment Company Act file number: | | 811-07692 |
Legg Mason Investors Trust, Inc.
| | |
| 100 Light Street, Baltimore, MD | | 21202 |
| Address of Principal Executive Offices: | | |
Robert I. Frenkel
Legg Mason & Co., LLC
100 First Stamford Place
Stamford, CT 06902
|
| Name and address of agent for service: |
Registrant’s telephone number, including area code: (410) 539-0000
| | |
Date of fiscal year end: March 31 | | |
Date of reporting period: March 31, 2009
Item 1. Report to Shareholders
Legg Mason
Investors Trust, Inc.
Investment Commentary and
Annual Report to Shareholders
March 31, 2009
American Leading Companies Trust
U.S. Small-Capitalization Value Trust

American Leading Companies Trust
Market Commentary
The stock market experienced one of the worst twelve-month periods in history during the fiscal year ended March 31, 2009, as all of the major U.S. market indices posted declines in excess of 32%. The decline persisted with little respite throughout the year, as the widely followed Dow Jones Industrial Average (“DJIA”)A and S&P 500 IndexB both registered declines in all four quarters of the fiscal year. Value-based investment styles were especially hard hit during the year, as the Russell 1000 Value IndexC underperformed the S&P 500 Index by more than four percentage points and also underperformed the Russell 1000 Growth IndexD by over eight percentage points.
Equity returns for the twelve-month period ended March 31, 2009 are shown below:
| | |
| | | Total ReturnsE |
| | | 12 Months |
S&P 500 Index | | –38.09% |
DJIA | | –35.94% |
NASDAQ Composite IndexF | | –32.25% |
S&P MidCap 400 IndexG | | –36.09% |
Russell 2000 IndexH | | –37.50% |
Dow Jones Wilshire 5000 IndexI | | –37.96% |
S&P 100 IndexJ | | –36.68% |
Russell 1000 Growth Index | | –34.28% |
Russell 1000 Value Index | | –42.42% |
The recession that began in the fourth calendar quarter of 2007 deepened throughout 2008, and, in September 2008, morphed into a full blown financial crisis following the bankruptcy of Lehman Brothers and the effective nationalization of Fannie Mae, Freddie Mac and AIG. Credit markets froze up, credit spreads widened to multi-decade highs and financial markets worldwide went into a freefall. Financial stocks were at the epicenter of the crisis and were especially hard hit, with the S&P 500 Financial IndexK down 63.03% for the fiscal year. The breathtaking declines in the financial markets in the fall of 2008 stunned both business leaders and consumers, alike, causing a sharp drop in economic activity, as U.S. gross domestic product (“GDP”)L fell 6.3% in the last three months of 2008, its largest quarterly drop since 1982. Financial markets appeared for a time to have bottomed in late November 2008 and rallied more than +20% off their lows into the early days of the new year. Markets turned down again in 2009 as questions arose about the financial soundness of the major U.S. banks. At its March 6th inter-day low of 666.79, the S&P 500 Index was nearly 900 points (-57.4%) below its October 9, 2007 closing high of 1565.15. Even following a spirited rally through the end of the month, the S&P 500 Index closed the fiscal year ended March 31, 2009 at barely more than half its October 9, 2007 value.
The Investment Commentary is not a part of the Annual Report to Shareholders.
| | |
Investment Commentary | | iii |
As bad as returns were in the U.S., they were mostly worse overseas. Of the major foreign markets listed below, only Japan’s NIKKEI 225 IndexM and China’s Shanghai Stock Exchange Composite IndexN posted smaller declines than our S&P 500 Index.
Overseas returns in U.S. dollars for the twelve-month period ended March 31, 2009 are shown below:
| | |
| | | Total ReturnsE |
| | | 12 Months |
FTSE 100 IndexO (UK) | | –48.06% |
DAX IndexP (Germany) | | –47.70% |
CAC 40 IndexQ (France) | | –48.02% |
MICEX IndexR (Russia) | | –67.09% |
NIKKEI 225 Index (Japan) | | –33.76% |
Hang Seng IndexS (Hong Kong) | | –38.27% |
Kospi IndexT (South Korea) | | –48.68% |
Shanghai Stock Exchange Composite Index (China) | | –28.86% |
BSE Sensex 30 IndexU (India) | | –50.26% |
The recent behavior of the economy and stock market is, in many respects, without precedent in the post-WWII era. Not since the Great Depression era of the 1930s have we witnessed some of the things we are seeing today. Until very recently, the parallels have all been about how bad things are now, with this or that market or economic condition being the worst “since the Great Depression.” We should all probably agree to use the acronym STGD as short-hand for “since the Great Depression” to save time and ink. In this vein, Barrons’s writer Michael Santoli recently noted in an article entitled “Listening to the Echoes of 1938” that, at their early March low, the broad indices were as far below their 200-day moving averages as they had been at any time since 1938. He further observed that large companies (including GE) were on track to cut their dividends by a larger percentage than any year since 1938. We ourselves have reported that the trailing ten-year return on the S&P 500 Index has recently reached an all-time record low, worse even than the decade from 1929 to 1939, the previous record holder.
We think it is quite likely that all the recent references by news commentators, market pundits and political leaders – including our new president – to this being the worst economy STGD have served to exacerbate the downturn, as both businesses and consumers have been frozen into inaction fearing that we might be facing another depression. We have no hard evidence of this assertion, but anecdotally it seems valid. On a personal basis, it certainly rings true to me. My parents – who were born in 1910 and 1912 – were in their 20s during the depression of the 1930s, and the economic devastation of that period was burned into their psyches such that they were both highly risk-averse until the day they died.
The Investment Commentary is not a part of the Annual Report to Shareholders.
More happily, the market’s recent strength is without precedent since the 1930s as well. According to Robert Farrell of Farrell Advisory Associates, the S&P 500 Index’s ten-day gain of +21.64% through Monday, March 23, 2009 was its best since the ten days ended April 29, 1933. Farrell also noted that the ten-day breadth thrust through March 23rd was also an impressive 2.26 times advances over declines. In the post-WWII period, ten-day breadth thrusts over 1.97 times have all heralded the beginning of a new bull market. Frustratingly for the bulls, this pattern did not hold in the 1930s, when breadth thrusts over 1.97 times sometimes heralded new bull markets and sometimes only bear rallies, according to Farrell.
So far, it is unclear whether the market’s recent strength – which has continued in the first two weeks of the new quarter and taken the S&P 500 Index up +31.3% from its March 6th inter-day low of 666.79 to a recent inter-day high on April 17th of 875.63 – is “only” a bear market rally or the start of a new bull market cycle. We have wrongly called “the turn” a couple of times in the last year, so we want to be somewhat cautious in calling it now, but we believe that a plausible case can be made for the March 6th inter-day low being “the low” for this market cycle. One thing we find encouraging is the massive policy response to the crisis by the U.S. government, which is without precedent in the post-WWII era. After a few missteps and false starts, the Obama Administration, together with the U.S. Department of the Treasury, the Federal Reserve Board (“Fed”)V and the U.S. Congress, has implemented a broad range of monetary and fiscal measures designed to stabilize the financial markets, unfreeze the credit markets and get the U.S. economy growing again. Economic prospects remain highly uncertain, but some improvement in credit conditions and the recent rally in the financial markets offer tentative hope that the worst of the recession and the market decline may be behind us.
The Investment Commentary is not a part of the Annual Report to Shareholders.
Investment Results
Total returns for the Fund for various periods ended March 31, 2009 are presented below, along with those of comparative indices:
| | | | | | | | | | | | |
| | | | | | | Average Annual Total Returns |
| | | Three Months | | One
Year | | Three
Years | | Five
Years | | Ten
Years | | Since
Inception |
Without Sales Charges | | | | | | | | | | | | |
Class A | | N/A | | N/A | | N/A | | N/A | | N/A | | –9.96% |
Class C* | | –17.41% | | –51.32% | | –24.23% | | –11.63% | | –6.02% | | +1.97% |
Institutional Class | | –17.29% | | –50.86% | | –23.47% | | –10.75% | | N/A | | –6.20% |
S&P 500 IndexW | | –11.01% | | –38.09% | | –13.06% | | –4.77% | | –3.00% | | +5.52% |
Lipper Large-Cap Value Funds Category AverageX | | –13.15% | | –39.80% | | –14.40% | | –5.11% | | –1.11% | | +5.07% |
With Sales Charges | | | | | | | | | | | | |
Class A | | N/A | | N/A | | N/A | | N/A | | N/A | | –15.16% |
Class C* | | –18.24% | | –51.80% | | –24.23% | | –11.63% | | –6.02% | | +1.97% |
Institutional Class | | –17.29% | | –50.86% | | –23.47% | | –10.75% | | N/A | | –6.20% |
The performance data quoted represent past performance and do not guarantee future results. Current performance may be lower or higher than the performance data quoted. To obtain performance data current to the most recent month-end, please visit our website at www.leggmason.com/individualinvestors. The investment return and principal value of the Fund will fluctuate so that an investor’s shares, when redeemed, may be worth more or less than the original cost. Calculations assume the reinvestment of dividends and capital gain distributions. Performance would have been lower if fees and expenses had not been waived and/or reimbursed in various periods. Performance figures for periods shorter than one year represent cumulative figures and are not annualized. Please note that Class A has been in existence for less than one year. Results for longer periods may differ, in some cases, substantially.
For performance data including the effects of sales charges, Class A shares reflect the deduction of a maximum initial sales charge of 5.75%, and Class C shares reflect the deduction of a contingent deferred sales charge of 1.00%, which applies if shares are redeemed within one year of purchase.
The inception dates of the A, C and Institutional Classes are February 3, 2009, September 1, 1993 and June 14, 2001, respectively. The Index return is for the period beginning September 1, 1993. The Lipper return is for the period beginning August 31, 1993. All index performance reflects no deduction for fees, expenses or taxes. Please note that an investor cannot invest directly in an index.
The Investment Commentary is not a part of the Annual Report to Shareholders.
The gross expense ratios for the A, C and Institutional Classes were 1.14%, 1.89% and 0.86%, respectively, as indicated in the Fund’s most current prospectus dated February 1, 2009. These expenses include management fees, 12b-1 distribution and/or service fees and other expenses.
* Prior to February 1, 2009, Class C was known as the Primary Class. In addition, on February 1, 2009, the class began to charge a contingent deferred sales charge for shares bought by investors on and after that date and redeemed within one year of purchase.
For the twelve months ended March 31, 2009, Class C shares of Legg Mason American Leading Companies Trust, excluding sales charges, returned -51.32%. The Fund’s unmanaged benchmark, the S&P 500 Index, returned -38.09% for the same period. The Lipper Large-Cap Value Funds Category Average returned -39.80% over the same time frame. Following two very poor years, the longer-term performance results – which until about mid-2007 were reasonably respectable – are now painful to look at.
By far, the largest factor contributing to the underperformance of the portfolio in the quarter and for the full year was an overweighting in Financials stocks, which were the worst performing stocks in the S&P 500 Index for the twelve months ended March 31, 2009. Particularly damaging were large positions in Bank of America Corp., Citigroup Inc. and American International Group. These three stocks alone cost the portfolio nearly 700 basis pointsY of relative performance versus the S&P 500 Index during the year, thus accounting for about half of the portfolio’s shortfall versus its benchmark for the fiscal year. Other Financials stocks which hurt performance were Lloyds TSB Group PLC, Freddie Mac and Merrill Lynch and Co. Inc. (which was acquired during the reporting period by Bank of America). Other major contributors to the portfolio’s poor results for the reporting period were: General Electric Co. and UAL Corporation, the parent company of United Airlines.
There were not a lot of bright spots in the portfolio in a year in which most stocks in the market declined. An exception was Amgen Inc. which advanced 18.4% during the fiscal year, outperforming the S&P 500 Index by over fifty percentage points. A number of other holdings – while declining in value for the fiscal year – held up much better than the overall market and, therefore, helped the portfolio on a relative return basis. These included Johnson and Johnson and WellPoint Inc. in Health Care; Kraft Foods Inc., Philip Morris International Inc. and Altria Group Inc. in Consumer Staples; International Business Machines Corp. and Accenture Ltd. in Information Technology; The TJX Cos. Inc. in Consumer Discretionary; and Exxon Mobil Corp. in the Energy group. Following the market’s severe decline in the fall, a number of purchases contributed positively to performance in the last few months of the fiscal year. Notable among these were: Freeport McMoRan Copper and Gold Inc., The Goldman Sachs Group Inc. and National Oilwell Varco Inc.
The Investment Commentary is not a part of the Annual Report to Shareholders.
| | |
Investment Commentary | | vii |
In an effort to broaden the Fund’s diversification and reduce downside volatility without compromising upside potential, I added fifteen new stocks to the portfolio during the quarter. A sixteenth stock was added via the spin-off of Time Warner Cable to Time Warner shareholders, bringing the total number of holdings to sixty-two as of March 31, 2009. In Financials, insurance companies Aflac Inc. and MetLife Inc. were added, as well as Morgan Stanley and Wells Fargo & Co., while Bank of America, Citigroup Inc. and Merrill Lynch and Co. Inc. were eliminated. To boost our Consumer Staples holdings, we bought Costco Wholesale Corp., PepsiCo Inc. and Proctor and Gamble Co. In Industrials, we added Emerson Electric Co., United Technologies Corp. and Delta Air Lines Inc. In Information Technology, we bought Cisco Systems Inc. and storage provider EMC Corp. We also bought Freeport-McMoRan Copper and Gold Inc. in the Materials sector, global power producer The AES Corp. in the Utilities sector, and re-acquired shares of Sprint Nextel Corp. in Telecommunication Services.
In aggregate, the purchases were intended to improve the overall quality of the portfolio, while still retaining solid appreciation potential. Based on data from Mellon Analytical Solutions, at March fiscal year end, the portfolio had a forward twelve-month price-to-earnings (“P/E”) ratioZ of 11.1X, versus 12.2X for the S&P 500 Index, while offering a return-on-equity comparable to the benchmark (21.7% versus 21.9%) and higher estimated long-term growth prospects than the S&P 500 Index (11.1% versus 10.0%). Of course, these characteristics do not guarantee success in the future, but they do offer evidence that our efforts to buy good quality companies at attractive valuations are being reflected in the portfolio.
Outlook
In addition to the massive monetary and fiscal stimuli that have been put in place since last fall, there have been a number of encouraging developments of late on the economic, policy and regulatory fronts that, in combination, give us growing confidence that we may be near an important inflection point, both in terms of the economy and the stock market. We believe these developments, together with the brutal market decline through early March that we believe discounted an enormous amount of bad news, have set the stage for a potentially strong rally in the market. As we will argue further on, we think that we may be in the early stages of a new cyclical bull market, rather than just enjoying yet another bear market rally.
On the economic front, we think the economy may have bottomed in the first quarter of 2009. We believe the U.S. economy contracted at a slightly slower pace in the first three months of 2009 as compared to the fourth quarter of 2008 (-6.3%).
The Investment Commentary is not a part of the Annual Report to Shareholders.
| | |
viii | | Investment Commentary |
Things have been so bad for the last 180 days that mathematically, they almost have to get better. We are seeing that in car sales, which despite falling 34% year-over-year in March, were at an annualized pace of 9.86 million vehicles, up over +8% from February’s 9.12 million annualized rate. We are also seeing it in the manufacturing sector generally, where the Institute for Supply Management’s Composite PMI IndexAA was up in March for the third month in a row. Recent data on housing activity are also coming in better than expected, and even mall traffic and restaurant sales seem to be perking up.
On the policy front, we believe the Treasury’s recently announced Public-Private Partnership Investment Program (dubbed “PPIP” in Washington), designed to assist banks in removing legacy assets from their balance sheets, has a reasonably good chance of working. The devil is always in the details, but we think the size of the program is meaningful, and we like the shared risk/shared profits aspect of the program. With the non-recourse leverage the government is providing buyers, the returns from the program should be reasonably attractive, even if asset pricing is not as distressed as it might have been without the refinements in mark-to-market accounting regulations that were approved by the Financial Accounting Standards Board (“FASB”).
It is these regulatory changes with respect to mark-to-market accounting that we find most encouraging. We know this is a controversial topic, with passionate views on both sides. In our opinion, the key issue is determining what best constitutes “fair value” for an asset. The “mark-to-model” regime that existed prior to the implementation of FASB 157 in November 2007 led to substantial abuses. FASB 157 was an honest effort to curb those abuses by requiring that “observable market inputs” be the primary determinant of “fair value” in pricing securities. When credit markets became dysfunctional, however, we believe “market” prices began giving overly pessimistic signals as to what many assets were worth. In our view, forcing banks and other financial institutions to mark assets to these increasingly distressed and illiquid “market” prices greatly exacerbated the banking crisis and subsequent economic downturn. In our opinion, the latest modification of “fair value” guidelines (FASB 157-e) allowing greater use of cash flow-based valuation methodologies takes a more balanced and sensible approach to how securities should be valued when markets are under great stress, as they have been for the last year or so. We disagree with those who view this as a cave-in or cop-out.
Interestingly, a similar move away from strict adherence to mark-to-market accounting for regulatory capital purposes is thought to have been an important step to ending the Great Depression, according to a March 20, 2009 article by Peter Niculescu in American Banker entitled “Lesson Learned in ‘30s: End Marking to Market.” Mr. Niculescu writes that the Office of the Comptroller of the Currency (“OCC”) ended mark-to-market securities evaluations for banks in 1938, saying, “Bank investments should be considered in the light of inherent soundness rather than on a basis of day-to-day market fluctuations” (Federal Reserve Bulletin, July 1938). He goes
The Investment Commentary is not a part of the Annual Report to Shareholders.
on to quote the OCC as saying in 1938, “By severing appraisal of bank investments from current market quotations, it is believed that the banks will be encouraged to purchase securities of sound business and industrial concerns, whether large or small, for their true worth and not speculative gains.” And “as the banks avail themselves of the opportunity, the necessity will be diminished for the creation of government agencies to furnish credit facilities which the banks should provide.” This sounds eminently sensible to us. The Obama Administration wants the banks to start lending again. By relieving or greatly diminishing the banks’ need to raise capital to fill balance sheet holes caused by accounting convention, the modified mark-to-market accounting rules increase the likelihood of that happening, in our opinion.
Now that a more balanced interpretation of the mark-to-market accounting rules has been put in place, we have two items left on our wish list: (1) reinstating the “uptick” rule and (2) reining in abusive practices in the credit default swap (“CDS”) market. In our opinion, these changes would re-level the financial playing field, which we believe has been tilted in favor of the bear since 2007.
The uptick rule was instituted in 1938 by then Chairman of the Securities and Exchange Commission (“SEC”) Joseph Kennedy, who, as a veteran short-seller himself, knew what a powerful weapon it was to be able to short stocks into weakness in distressed markets and wanted to remove that arrow from the short’s quiver. The uptick rule remained in place for sixty-nine years, until July 2007, when intense lobbying by a number of hedge funds convinced the SEC to rescind the rule. Since the elimination of the uptick rule, the downside volatility of stocks, especially financial stocks, has been enormous. Shorts have used the absence of the uptick rule in conjunction with purchases of CDSs to initiate “bear raids” on financial institutions regularly since mid-2007. The shorts’ playbook has been very effective, in our judgment: blow out the CDS spreads while simultaneously shorting the stock, then lobby the rating agencies to downgrade the company because of the poor market action of its CDS, bonds and stock price.
As George Soros argued persuasively in a must-read op-ed piece entitled “One Way to Stop Bear Raids” (The Wall Street Journal, Tuesday, March 24, 2009), the shorts’ playbook was particularly effective against financial companies because their business is so dependent upon trust and confidence, and once confidence is shaken, bear raids can be self-validating. Soros opines that “AIG, Bear Stearns, Lehman Brothers and others were destroyed by bear raids in which the shorting of stocks and buying CDSs mutually amplified and reinforced each other. The unlimited shorting of stocks was made possible by the abolition of the uptick rule, which would have hindered bear raids by allowing short selling only when prices were rising. The unlimited shorting of bonds was facilitated by the CDS market. The two made a lethal combination.”
Soros’s prescription for leveling the playing field is to reinstate the uptick rule and to require that only those who own the underlying bonds ought to be allowed to buy
The Investment Commentary is not a part of the Annual Report to Shareholders.
CDSs on those bonds. We think both of those ideas have merit. Our preference would be to have the uptick rule reinstated in its original form, but, as a compromise, we would also be supportive of the “modified uptick rule” proposed by the four major U.S. stock exchanges that would be triggered after the price of a stock fell by a certain percentage (suggested at 10%). With respect to the CDS market, we could see expanding the list of eligible CDS buyers to include entities, such as suppliers, creditors or customers, who had some economic relationship with the company in question.
As always, we thank you for your support and welcome your comments.
David E. Nelson, CFA
Chairman, Investment Policy Committee
Legg Mason Capital Management
April 20, 2009
All investments are subject to risk including possible loss of principal.
The value approach to investing involves the risk that those stocks deemed to be undervalued by the portfolio manager may remain undervalued. The Fund may focus its investments in certain regions or industries, thereby increasing its potential vulnerability to market volatility. Please see the Fund’s prospectus for more information on these and other risks.
The views expressed in this commentary reflect those solely of the portfolio manager as of the date of this commentary and may differ from those of Legg Mason, Inc. as a whole or the other portfolio managers of its affiliates. Any such views are subject to change at any time based on market or other conditions, and the portfolio manager, Legg Mason Investors Trust, Inc. and Legg Mason Investor Services, LLC disclaim any responsibility to update such views. These views are not intended to be a forecast of future events, a guarantee of future results or investment advice. Because investment decisions for the Legg Mason Funds are based on numerous factors, these views may not be relied upon as an indication of trading intent on behalf of any Legg Mason Fund. The information contained herein has been prepared from sources believed to be reliable, but is not guaranteed by the portfolio manager, Legg Mason Investors Trust, Inc. or Legg Mason Investor Services, LLC as to its accuracy or completeness. Predictions are inherently limited and should not be relied upon as an indication of actual or future performance.
References to particular securities are intended only to explain the rationale for the Adviser’s action with respect to such securities. Such references do not include all material information about such securities, including risks, and are not intended to be recommendations to take any action with respect to such securities. Please note that an investor cannot invest directly in an index.
The Investment Commentary is not a part of the Annual Report to Shareholders.
A | The Dow Jones Industrial Average (“DJIA”) is a widely followed measurement of the stock market. The average is comprised of thirty stocks that represent leading companies in major industries. These stocks, widely held by both individual and institutional investors, are considered to be all blue-chip companies. |
B | The S&P 500 Index is an unmanaged index of 500 stocks and is generally representative of the performance of larger companies in the U.S. |
C | The Russell 1000 Value Index measures the performance of those Russell 1000 Index companies with lower price-to-book ratios and lower forecasted growth values. (A price-to-book ratio is the price of a stock compared to the difference between a company’s assets and liabilities.) The Russell 1000 Index measures the performance of the 1,000 largest companies in the Russell 3000 Index, which represents approximately 92% of the total market capitalization of the Russell 3000 Index. The Russell 3000 Index measures the performance of the 3,000 largest U.S. companies based on total market capitalization, which represents approximately 98% of the U.S. equity market. |
D | The Russell 1000 Growth Index measures the performance of those Russell 1000 Index companies with higher price-to-book ratios and higher forecasted growth values. |
F | The NASDAQ Composite Index is a market-value weighted index, which measures all securities listed on the NASDAQ stock market. |
G | The S&P MidCap 400 Index is a market value weighted index which consists of 400 domestic stocks chosen for market size, liquidity and industry group representation. |
H | The Russell 2000 Index measures the performance of the 2,000 smallest companies in the Russell 3000 Index, which represents approximately 8% of the total market capitalization of the Russell 3000 Index. |
I | The Dow Jones Wilshire 5000 Index represents the broadest index for the U.S. equity market, measuring the performance of all U.S. equity securities with readily available price data. |
J | The S&P 100 Index is a market-capitalization weighted index consisting of 100 large blue-chip stocks covering a broad range of industries. |
K | The S&P 500 Financial Index is a capitalization-weighted index representing nine financial groups and fifty-three financial companies, calculated monthly with dividends reinvested at month end. |
L | Gross domestic product (“GDP”) is the market value of all final goods and services produced within a country in a given period of time. |
M | The NIKKEI 225 Index is a price-weighted average of 225 top-rated Japanese companies listed in the First Section of the Tokyo Stock Exchange. |
N | The Shanghai Stock Exchange Composite Index is a capitalization-weighted index. The Index tracks the daily price performance of all A-shares and B-shares listed on the Shanghai Stock Exchange. |
O | The FTSE 100 Index comprises the 100 most highly capitalized blue-chip companies, representing approximately 81% of the UK market. It is used extensively as a basis for investment products, such as derivatives and exchange-traded funds. |
P | The DAX Index is a total return index of thirty selected German blue-chip stocks traded on the Frankfurt Stock Exchange. The equities use free float shares in the index calculation. The Index has a base value of 1,000 as of December 31, 1987. As of June 18, 1999 only XETRA equity prices are used to calculate all DAX indices. |
Q | The CAC 40 Index is a narrow-based, modified capitalization-weighted index of 40 companies listed on the Paris Bourse. The Index was developed with a base level of 1,000 as of December 31, 1987. As of December 1, 2003, the Index has become a free float weighted index. |
R | The MICEX Index is the real-time cap-weighted Russian composite index. It comprises the thirty most liquid stocks of Russia’s largest and most developed companies from ten main economy sectors. |
S | The Hang Seng Index is a free-float capitalization-weighted index of a selection of companies from the Stock Exchange of Hong Kong. The components of the Index are divided into four sub-indices: Commerce and Industry, Finance, Utilities and Properties. |
T | The Kospi Index is a capitalization-weighted index of all common shares on the Korean Stock Exchanges. |
The Investment Commentary is not a part of the Annual Report to Shareholders.
| | |
xii | | Investment Commentary |
U | The Bombay Stock Exchange Sensitive Index (“BSE Sensex”) is a cap-weighted index. The selection of the index members has been made on the basis of liquidity, depth, and floating-stock-adjustment depth and industry representation. Sensex has a base date and value of 100 in 1978-1979. The Index uses free float. |
V | The Federal Reserve Board (“Fed”) is responsible for the formulation of policies designed to promote economic growth, full employment, stable prices and a sustainable pattern of international trade and payments. |
W | The S&P 500 Index is an unmanaged index of 500 stocks and is generally representative of the performance of larger companies in the U.S. |
X | Lipper, Inc., a wholly-owned subsidiary of Reuters, provides independent insight on global collective investments. The Lipper Large-Cap Value Funds Category Average is comprised of the Fund’s peer group of mutual funds. |
Y | A basis point is one one-hundredth (1/100 or 0.01) of one percent. |
Z | The price-to-earnings (“P/E”) ratio is a stock’s price divided by its earnings per share. |
AA | The Institute for Supply Management’s Composite PMI Index is based on a survey of purchasing executives who buy the raw materials for manufacturing at more than 350 companies. It offers an early reading on the health of the manufacturing sector. |
N/A — Not applicable.
The Investment Commentary is not a part of the Annual Report to Shareholders.
| | |
Investment Commentary | | xiii |
U.S. Small–Capitalization Value Trust
Total returns for the Fund for various periods ended March 31, 2009 are presented below, along with those of comparative indices:
| | | | | | | | | | | | |
| | | | | | | Average Annual Total Returns |
| | | Three
Months | | One
Year | | Three
Years | | Five
Years | | Ten
Years | | Since
Inception |
Without Sales Charges | | | | | | | | | | | | |
Class A | | N/A | | N/A | | N/A | | N/A | | N/A | | –7.54% |
Class C* | | –19.09% | | –41.75% | | –20.03% | | –8.78% | | +2.06% | | –0.40% |
Institutional Class | | –18.96% | | –41.24% | | –19.27% | | –7.84% | | +3.09% | | +0.69% |
Russell 2000 IndexA | | –14.95% | | –37.50% | | –16.80% | | –5.24% | | +1.93% | | +1.06% |
Lipper Small-Cap Value Funds Category AverageB | | –15.26% | | –39.49% | | –17.56% | | –5.26% | | +4.86% | | +2.38% |
With Sales Charges | | | | | | | | | | | | |
Class A | | N/A | | N/A | | N/A | | N/A | | N/A | | –12.80% |
Class C* | | –19.90% | | –42.33% | | –20.03% | | –8.78% | | +2.06% | | –0.40% |
Institutional Class | | –18.96% | | –41.24% | | –19.27% | | –7.84% | | +3.09% | | +0.69% |
The performance data quoted represent past performance and do not guarantee future results. Current performance may be lower or higher than the performance data quoted. To obtain performance data current to the most recent month-end, please visit our website at www.leggmason.com/individualinvestors. The investment return and principal value of the Fund will fluctuate so that an investor’s shares, when redeemed, may be worth more or less than the original cost. Calculations assume the reinvestment of dividends and capital gain distributions. Performance would have been lower if fees and expenses had not been waived and/or reimbursed in various periods. Performance figures for periods shorter than one year represent cumulative figures and are not annualized. Please note that Class A has been in existence for less than one year. Results for longer periods may differ, in some cases, substantially.
For performance data including the effects of sales charges, Class A shares reflect the deduction of a maximum initial sales charge of 5.75%, and Class C shares reflect the deduction of a contingent deferred sales charge of 1.00%, which applies if shares are redeemed within one year of purchase.
The inception dates of the A, C and Institutional Classes are February 3, 2009, June 15, 1998 and June 19, 1998, respectively. The Index return is for the period beginning June 15, 1998. The Lipper return is for the period beginning June 30, 1998. All index performance reflects no deduction for fees, expenses or taxes. Please note that an investor cannot invest directly in an index.
The gross expense ratios for the A, C and Institutional Classes were 1.52%, 2.27% and 1.26%, respectively, as indicated in the Fund’s most current prospectus dated February 1, 2009. These expenses include management fees, 12b-1 distribution and/or service fees and other expenses. As a result of voluntary expense limitations, the ratio of expenses, other than interest, brokerage, taxes and extraordinary expenses, to average net assets will not
The Investment Commentary is not a part of the Annual Report to Shareholders.
| | |
xiv | | Investment Commentary |
exceed 1.25% for Class A, 2.00% for Class C and 1.00% for the Institutional Class. These voluntary waivers are currently expected to continue until August 1, 2009, but may be terminated at any time.
* Prior to February 1, 2009, Class C was known as the Primary Class. In addition, on February 1, 2009, the class began to charge a contingent deferred sales charge for shares bought by investors on and after that date and redeemed within one year of purchase.
Market Commentary
After the Lehman Brothers bankruptcy in September 2008, credit markets from auction rate bonds to conventional mortgages to short-term lines of credit locked up as lenders became too fearful to put capital at risk. Coordinated efforts from the Federal Reserve Board (“Fed”)C, the U.S. Department of the Treasury and global governmental agencies sought to provide liquidity and backing to help unlock the credit markets. Unprecedented governmental response occurred as the Fed cut interest rates to near zero. In addition, the Treasury became the banker for Main Street and Wall Street when Congress intervened with the $700 billion Troubled Asset Relief Program (“TARP”) in an effort to unfreeze credit and recapitalize the banking system. The Volatility Index (“VIX”)D reached record highs in October, credit spreads widened dramatically, and credit remained tight. Volatility was especially evident in the prices of commodities, and oil in particular. Oil reached a peak of over $145 per barrel in July, then plummeted to nearly $30 per barrel in late December, and ended the fiscal year at nearly $50 per barrel. After years of resiliency, consumers finally retrenched as consumer confidence hit record lows and the 2008 holiday shopping period was the worst in decades. The National Bureau of Economic Research (“NBER”) confirmed that which consumers intuitively knew with the December 2008 announcement that the economy had entered recession in December of 2007.
In the twelve months ended March 31, 2009, employment figures, housing prices, new home construction, industrial activity, and other economic indicators continued at severe recession levels. Investors, however, received more encouraging news in March as several major troubled banks reported seeing stronger positive profits developing for the quarter. Citigroup’s encouraging first quarter comments, on the same day the Treasury provided greater details on the public-private TARP to buy distressed assets, ignited a market upturn that lasted most of the month. The rally also gained support from the Fed’s announced plans to buy Treasury debt to lower interest rates and inject additional liquidity into the financial system. Enormous uncertainty remains on many fronts, but the stock market historically has begun to move higher well before the economy provides conclusive evidence of a turnaround.
The Fund outperformed as the markets rebounded recently, but the Fund trailed the benchmark over the last fiscal year. Poor performance in Information Technology and Industrials holdings detracted from results as capital projects and spending were curtailed due to economic pressures. Although the Fund sold Energy names in mid-2008 as oil climbed, the Fund, on average, remained overweighted in Energy
The Investment Commentary is not a part of the Annual Report to Shareholders.
which detracted from performance as oil prices collapsed. On the positive side, Financials holdings, particularly insurance companies, were defensive. The Fund’s consumer-related stocks also outperformed as earnings expectations fell significantly last year and consequently some of our holdings in these areas produced upside earnings surprises.
Regarding portfolio positioning, we are below the benchmark weight in Utilities and Consumer Staples as these stocks have been among the most defensive stocks during the bear market and no longer appear as attractive on a valuation basis. We also sold oil services firms, banks and insurance companies, often because the stocks had fallen less than other small-caps and exceeded our capitalization sell target. The portfolio is now well below the benchmark’s Financials weighting with a below benchmark weighting in banks and an overweight in insurance. We increased our weighting in consumer-oriented stocks in the restaurant, leisure and retailing areas as earnings held up better than expected and price momentum leveled out after a difficult period last year. We also added to our Information Technology weighting, particularly in hardware and equipment. The portfolio also has above benchmark weights in Consumer Discretionary, Information Technology and Industrials.
Outlook
We believe that the portfolio is more economically-sensitive and is now positioned to benefit more from signs of economic recovery and positive equity markets. As always, this stance is the result of our bottom-up stock selection process rather than a macro call on our part. Defensive sectors have performed relatively well over the last year of down markets and many of these stocks no longer look attractive on a valuation basis. With respect to more cyclical stocks, such as retailing, technology, manufacturing and basic materials, many have fallen significantly during the bear market and have low valuation metrics. Stock price declines have slowed and fewer companies are being excluded by the price momentum screens we used to avoid the worst recent performers. Much of the economic news remains gloomy, particularly employment figures that often continue to drop well after other economic signs improve. However, the dire news in some areas has been balanced with reports that show moderating, though usually not improving conditions. As we have discussed in the past, the equity markets often rally, sometimes quite powerfully, upon these early signs of an economic bottom. We also have seen historically, that small-cap value stocks do relatively well through the middle of the recession and often have been lead performers during the recovery phase.
As always, we appreciate your investment in the Fund and look forward to better times for the equity markets and for the Fund.
Henry F. Otto
Steven M. Tonkovich
April 15, 2009
The Investment Commentary is not a part of the Annual Report to Shareholders.
| | |
xvi | | Investment Commentary |
Investment risks: A fund that invests in small companies may involve higher risk than a fund that invests in larger, more established companies. Small companies may have limited product lines, markets or financial resources. Therefore, the Fund may involve considerably more risk of loss and its returns may differ significantly from funds investing in large-cap companies or other asset classes.
The value approach to investing involves the risk that those stocks deemed to be undervalued by the portfolio manager may remain undervalued. Please see the Fund’s prospectus for more information on these and other risks.
The views expressed in this commentary reflect those solely of the portfolio managers as of the date of this commentary and may differ from those of Legg Mason, Inc. as a whole or the other portfolio managers of its affiliates. Any such views are subject to change at any time based on market or other conditions, and the portfolio manager, Legg Mason Investors Trust, Inc. and Legg Mason Investor Services, LLC disclaim any responsibility to update such views. These views are not intended to be a forecast of future events, a guarantee of future results or investment advice. Because investment decisions for the Legg Mason Funds are based on numerous factors, these views may not be relied upon as an indication of trading intent on behalf of any Legg Mason Fund. The information contained herein has been prepared from sources believed to be reliable, but is not guaranteed by the portfolio manager, Legg Mason Investors Trust, Inc. and Legg Mason Investor Services, LLC as to its accuracy or completeness.
References to particular securities are intended only to explain the rationale for the Adviser’s action with respect to such securities. Such references do not include all material information about such securities, including risks, and are not intended to be recommendations to take any action with respect to such securities.
A | The Russell 2000 Index measures the performance of the 2,000 smallest companies in the Russell 3000 Index, which represents approximately 8% of the total market capitalization of the Russell 3000 Index. The Russell 3000 Index measures the performance of the 3,000 largest U.S. companies based on total market capitalization, which represents approximately 98% of the U.S. equity market. |
B | Lipper, Inc., a wholly-owned subsidiary of Reuters, provides independent insight on global collective investments. The Lipper Small-Cap Value Funds Category Average is comprised of the Fund’s peer group of mutual funds. |
C | The Federal Reserve Board (“Fed”) is responsible for the formulation of policies designed to promote economic growth, full employment, stable prices and a sustainable pattern of international trade and payments. |
D | VIX is a volatility index for the Chicago Board Options Exchange, known by its ticker symbol, VIX. It is calculated by taking a weighted average of the implied volatility from eight calls and puts on the S&P 100 Index. The S&P 100 Index is a market-capitalization weighted index consisting of 100 large blue-chip stocks covering a broad range of industries. |
N/A — Not applicable.
The Investment Commentary is not a part of the Annual Report to Shareholders.
Annual Report to Shareholders
Legg Mason
Investors Trust, Inc.
March 31, 2009
| | |
Annual Report to Shareholders | | 1 |
To Our Shareholders
We are pleased to provide you with Legg Mason Investors Trust’s annual report for American Leading Companies Trust and U.S. Small-Capitalization Value Trust for the twelve months ended March 31, 2009.
Total returns, excluding sales charges, for periods ended March 31, 2009 were:
| | | | | | |
| | | Three
Months | | Six
Months | | Twelve
Months |
American Leading Companies Trust: | | | | | | |
Class C* | | –17.41% | | –39.90% | | –51.32% |
Institutional Class | | –17.29% | | –39.65% | | –50.86% |
U.S. Small-Capitalization Value Trust: | | | | | | |
Class C* | | –19.09% | | –38.98% | | –41.75% |
Institutional Class | | –18.96% | | –38.75% | | –41.24% |
The performance data quoted represent past performance and do not guarantee future results. Current performance may be lower or higher than the performance data quoted. To obtain performance data current to the most recent month-end, please visit our website at www.leggmason.com/individualinvestors. The investment return and principal value of the Funds will fluctuate so that an investor’s shares, when redeemed, may be worth more or less than the original cost. Calculations assume the reinvestment of dividends and capital gain distributions. Returns have not been adjusted to include sales charges that may apply or the deduction of taxes that a shareholder would pay on Fund distributions. If sales charges were reflected, the performance quoted would be lower. Performance would have been lower if fees and expenses had not been waived and/or reimbursed in various periods. Performance figures for periods shorter than one year represent cumulative figures and are not annualized.
Performance of Class A shares of American Leading Companies Trust is not shown because this share class commenced operations on February 3, 2009.
Performance of Class A shares of U.S. Small-Capitalization Value Trust is not shown because this share class commenced operations on February 3, 2009.
* Prior to February 1, 2009, Class C was known as the Primary Class. In addition, on February 1, 2009, the class began to charge a contingent deferred sales charge for shares bought by investors on and after that date and redeemed within one year of purchase.
The market environment of the past twelve months has been among the most challenging seen by equity investors for generations. Concerns about our global financial system and the health of the global economy have negatively affected virtually all asset classes, including, of course, U.S. equities.
We understand the concerns created by market turmoil and declining prices. While no one can predict with certainty when the current crisis will end, we are heartened by the recent actions of the U.S. government to support and repair our financial system.
| | |
2 | | Annual Report to Shareholders |
We continue to believe in the resiliency of the U.S. economy. We believe that turmoil and downturn will eventually be followed by recovery and appreciation. And we believe in the long-term potential of our equity markets to provide rewards to patient investors. We remain committed to helping you, our shareholders, build wealth over the long term.
Information about each Fund’s performance over longer periods of time is shown in the respective Performance Information sections within this report. For more information about the Funds’ share classes included in this report, please contact your financial advisor.
PricewaterhouseCoopers LLP, the Funds’ independent registered public accounting firm, has completed its annual examination of the Funds, and audited financial statements for the fiscal year ended March 31, 2009 are included in this report.
Many Class A and Class C shareholders invest regularly in Fund shares on a dollar cost averaging basis. Most do so by authorizing automatic, monthly transfers of $50 or more from their bank checking or brokerage accounts. Dollar cost averaging is a convenient and sensible way to invest, as it encourages continued purchases over time regardless of fluctuating price levels. Of course, it does not ensure a profit nor protect against declines in the value of your investment. Your financial advisor will be happy to help you establish a dollar cost averaging account should you wish to do so.
On behalf of the Board and the entire team at Legg Mason, we appreciate your support.
| | |
Sincerely, | | | 
Mark R. Fetting Chairman | | 
David R. Odenath President |
May 19, 2009
| | |
Annual Report to Shareholders | | 3 |
Management’s Discussion of Fund Performance
American Leading Companies Trust
Total returns, excluding sales charges, for the Fund for periods ended March 31, 2009 are presented below, along with those of comparative indices:
| | | | |
| | | Six
Months | | Twelve
Months |
Class C* | | –39.90% | | –51.32% |
Institutional Class | | –39.65% | | –50.86% |
S&P 500 IndexA | | –30.54% | | –38.09% |
Lipper Large-Cap Value Funds Category AverageB | | –32.00% | | –39.80% |
The performance data quoted represent past performance and do not guarantee future results. Current performance may be lower or higher than the performance data quoted. To obtain performance data current to the most recent month-end, please visit our website at www.leggmason.com/individualinvestors. The investment return and principal value of the Fund will fluctuate so that an investor’s shares, when redeemed, may be worth more or less than the original cost. Calculations assume the reinvestment of dividends and capital gain distributions. Returns have not been adjusted to include sales charges that may apply or the deduction of taxes that a shareholder would pay on Fund distributions. If sales charges were reflected, the performance quoted would be lower. Performance would have been lower if fees and expenses had not been waived and/or reimbursed in various periods. Performance figures for periods shorter than one year represent cumulative figures and are not annualized.
Performance of Class A shares is not shown because this share class commenced operations on February 3, 2009.
* Prior to February 1, 2009, Class C was known as the Primary Class. In addition, on February 1, 2009, the class began to charge a contingent deferred sales charge for shares bought by investors on and after that date and redeemed within one year of purchase.
The stock market experienced one of the worst twelve-month periods in history during the fiscal year ended March 31, 2009, as all of the major U.S. market indices posted declines in excess of 32%. The decline persisted with little respite throughout the year, as the widely followed Dow Jones Industrial Average (“DJIA”)C and S&P 500 Index both registered declines in all four quarters of the fiscal year. Value-based investment styles were especially hard hit during the year, as the Russell 1000 Value IndexD underperformed the S&P 500 Index by more than four percentage points and also underperformed the Russell 1000 Growth IndexE by over eight percentage points.
| | |
4 | | Annual Report to Shareholders |
Management’s Discussion of Fund Performance — Continued
Equity returns for the year ended March 31, 2009 are shown below:
| | |
| | | Total ReturnsF |
| | | 12 Months |
S&P 500 Index | | –38.09% |
DJIA | | –35.94% |
NASDAQ Composite IndexG | | –32.25% |
S&P MidCap 400 IndexH | | –36.09% |
Russell 2000 IndexI | | –37.50% |
Dow Jones Wilshire 5000 IndexJ | | –37.96% |
S&P 100 IndexK | | –36.68% |
Russell 1000 Growth Index | | –34.28% |
Russell 1000 Value Index | | –42.42% |
The recession that began in the fourth calendar quarter of 2007 deepened throughout 2008, and, in September, morphed into a full blown financial crisis following the bankruptcy of Lehman Brothers and the effective nationalization of Fannie Mae, Freddie Mac and AIG. Credit markets froze up, credit spreads widened to multi-decade highs and financial markets worldwide went into a freefall. Financial stocks were at the epicenter of the crisis and were especially hard hit, with the S&P 500 Financial IndexL down 63.03% for the fiscal year. The breathtaking declines in the financial markets in the fall stunned both business leaders and consumers, alike, causing a sharp drop in economic activity, as U.S. real gross domestic product (“GDP”)M fell 6.3% in the last three months of 2008, its largest quarterly drop since 1982. Financial markets appeared for a time to have bottomed in late November 2008 and rallied more than +20% off their lows into the early days of the new year. Markets turned down again in 2009 as questions arose about the financial soundness of the major U.S. banks, and the equity market made a new low in early March 2009. After a few missteps and false starts, the monetary and fiscal response by the U.S. government to the financial crisis has been without precedent in the post-WWII era. The Obama Administration, together with the U.S. Department of the Treasury, the Federal Reserve Board (“Fed”)N and the U.S. Congress, has implemented a broad range of monetary and fiscal measures designed to stabilize the financial markets, unfreeze the credit markets and get the U.S. economy growing again. Economic prospects remain highly uncertain, but some improvement in credit conditions and a rally in the financial markets in late March offer tentative hope that the worst of the recession may be behind us.
For the twelve months ended March 31, 2009, Class C shares of Legg Mason American Leading Companies Trust, excluding sales charges, returned -51.32%. The Fund’s unmanaged benchmark, the S&P 500 Index, returned -38.09% for the same
| | |
Annual Report to Shareholders | | 5 |
period. The Lipper Large-Cap Value Funds Category Average returned -39.80% over the same time frame.
By far, the largest factor contributing to the underperformance of the portfolio in the quarter and for the fiscal year was an overweighting in Financials stocks, which were the worst performing stocks in the S&P 500 Index for the twelve months ended March 31, 2009. Particularly damaging were large positions in Bank of America Corp., Citigroup Inc. and American International Group. These three stocks alone cost the portfolio nearly 700 basis pointsO of relative performance versus the S&P 500 Index during the year, thus accounting for about half of the portfolio’s shortfall versus its benchmark for the fiscal year. Other Financials stocks which hurt performance were Lloyds TSB Group PLC, Freddie Mac and Merrill Lynch and Co. Inc. (which was acquired during the year by Bank of America). Other major contributors to the portfolio’s poor results for the year were: General Electric Co. and UAL Corporation, the parent company of United Airlines. There were not a lot of bright spots in the portfolio in a year in which most stocks in the market declined. An exception was Amgen Inc. which advanced 18.4% during the fiscal year, outperforming the S&P 500 Index by over fifty percentage points. A number of other holdings — while declining in value for the year — held up much better than the overall market and, therefore, helped the portfolio on a relative return basis. These included Johnson and Johnson and WellPoint Inc. in Health Care; Kraft Foods Inc., Philip Morris International Inc. and Altria Group Inc. in Consumer Staples; International Business Machines Corp. and Accenture Ltd. in Information Technology; The TJX Cos. Inc. in Consumer Discretionary; and Exxon Mobil Corp. in the Energy group. Following the market’s severe decline in the fall, a number of purchases contributed positively to performance in the last few months of the fiscal year. Notable among these were: Freeport McMoRan Copper and Gold Inc., The Goldman Sachs Group Inc. and National Oilwell Varco Inc.
David E. Nelson, CFA
April 15, 2009
| | |
6 | | Annual Report to Shareholders |
Management’s Discussion of Fund Performance — Continued
Portfolio holdings and breakdowns are as of March 31, 2009 and are subject to change and may not be representative of the portfolio manager’s current or future investments. The Fund’s top ten holdings (as a percentage of net assets) as of this date were: International Business Machines Corp. (4.2%), Hewlett-Packard Co. (4.0%), Texas Instruments Inc. (4.0%), UnitedHealth Group Inc. (3.6%), The TJX Cos. Inc. (3.6%), Nokia Oyj - ADR (3.3%), J.P. Morgan Chase and Co. (3.3%), Microsoft Corp. (3.3%), Johnson and Johnson (3.1%) and WellPoint Inc. (2.8%). Please refer to pages 17 through 21 for a list and percentage breakdown of the Fund’s holdings.
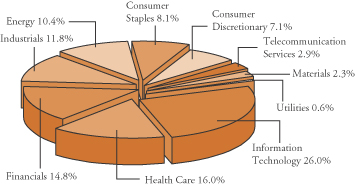
The mention of sector breakdowns is for informational purposes only and should not be construed as a recommendation to purchase or sell any securities. The information provided regarding such sectors is not a sufficient basis upon which to make an investment decision. Investors seeking financial advice regarding the appropriateness of investing in any securities or investment strategies discussed should consult their financial professional. The Fund’s top five sector holdings (as a percentage of net assets) as of March 31, 2009 were: Information Technology (25.6%), Health Care (15.8%), Financials (14.6%), Industrials (11.6%) and Energy (10.3%). The Fund’s portfolio composition is subject to change at any time.
All index performance reflects no deduction for fees, expenses or taxes. Please note that an investor cannot invest directly in an index.
A | The S&P 500 Index is an unmanaged index of 500 stocks and is generally representative of the performance of larger companies in the U.S. |
B | Lipper, Inc., a wholly-owned subsidiary of Reuters, provides independent insight on global collective investments. Returns are based on the period ended March 31, 2009, including the reinvestment of all distributions, including returns of capital, if any, calculated among the 608 funds for the six-month period and among the 589 funds for the twelve-month period in the Fund’s Lipper category, and excluding sales charges. |
C | The Dow Jones Industrial Average (“DJIA”) is a widely followed measurement of the stock market. The average is comprised of thirty stocks that represent leading companies in major industries. These stocks, widely held by both individual and institutional investors, are considered to be all blue-chip companies. |
D | The Russell 1000 Value Index measures the performance of those Russell 1000 Index companies with lower price-to-book ratios and lower forecasted growth values. (A price-to-book ratio is the price of a stock compared to the difference between a company’s assets and liabilities.) The Russell 1000 Index measures the performance of the 1,000 largest companies in the Russell 3000 Index, which represents approximately 92% of the total market capitalization of the Russell 3000 Index. The Russell 3000 Index measures the performance of the 3,000 largest U.S. companies based on total market capitalization, which represents approximately 98% of the U.S. equity market. |
E | The Russell 1000 Growth Index measures the performance of those Russell 1000 Index companies with higher price-to-book ratios and higher forecasted growth values. |
| | |
Annual Report to Shareholders | | 7 |
G | The NASDAQ Composite Index is a market-value weighted index, which measures all securities listed on the NASDAQ stock market. |
H | The S&P MidCap 400 Index is a market value weighted index which consists of 400 domestic stocks chosen for market size, liquidity and industry group representation. |
I | The Russell 2000 Index measures the performance of the 2,000 smallest companies in the Russell 3000 Index, which represents approximately 8% of the total market capitalization of the Russell 3000 Index. |
J | The Dow Jones Wilshire 5000 Index represents the broadest index for the U.S. equity market, measuring the performance of all U.S. equity securities with readily available price data. |
K | The S&P 100 Index is a market-capitalization weighted index consisting of 100 large blue-chip stocks covering a broad range of industries. |
L | The S&P 500 Financial Index is a capitalization-weighted index representing nine financial groups and fifty-three financial companies, calculated monthly with dividends reinvested at month end. |
M | Gross domestic product (“GDP”) is the market value of all final goods and services produced within a country in a given period of time. |
N | The Federal Reserve Board (“Fed”) is responsible for the formulation of policies designed to promote economic growth, full employment, stable prices and a sustainable pattern of international trade and payments. |
O | A basis point is one one-hundredth (1/100 or 0.01) of one percent. |
| | |
8 | | Annual Report to Shareholders |
Expense Example
American Leading Companies Trust
As a shareholder of the Fund, you may incur two types of costs (1) transactions costs, including front-end and back-end sales charges (loads) on purchase payments; and (2) ongoing costs, including management fees, distribution and/or service (12b-1) fees; and other Fund expenses. These examples are intended to help you understand your ongoing costs (in dollars) of investing in the Fund and to compare these costs with the ongoing costs of investing in other mutual funds.
For Class CA and Institutional Class shares, the examples are based on an investment of $1,000 invested on October 1, 2008 and held through March 31, 2009. For Class A shares the example is based on an investment of $1,000 invested on February 3, 2009 (commencement of operations) and held through March 31, 2009. The ending value assumes dividends were reinvested at the time they were paid.
Actual Expenses
The first line for each class in the table below provides information about actual account values and actual expenses for each class. You may use the information in this line, together with the amount you invested, to estimate the expenses that you paid over the period. Simply divide your account value by $1,000 (for example, an $8,600 account value divided by $1,000 = 8.6), then multiply the result by the number in the first line under the heading entitled “Expenses Paid During the Period” to estimate the expenses you paid on your account if your shares were held through the entire period.
Hypothetical Example for Comparison Purposes
The second line for each class in the table below provides information about hypothetical account values and hypothetical expenses based on the relevant class’s actual expense ratio and an assumed rate of return of 5% per year before expenses, which is not the class’s actual return. The hypothetical account values and expenses may not be used to estimate the actual ending account balance or expenses you paid for the period. You may use this information to compare the ongoing costs of investing in the Fund and other funds. To do so, compare these 5% hypothetical examples with the 5% hypothetical examples for the relevant class that appear in the shareholder reports of other funds. Because the example is intended to be comparable to the examples provided by other funds, it is based on a hypothetical investment of $1,000 invested on October 1, 2008 and held through March 31, 2009 for each class, even though the Class A shares did not begin operations until February 3, 2009. The ending values assume dividends were reinvested at the time they were paid.
Please note that the expenses shown in the table are meant to highlight your ongoing costs only and do not reflect any transactional costs, such as sales charges (loads). Therefore the second line for each class of the table is useful in comparing ongoing costs only, and will not help you determine the relative total costs of owning different funds. In addition, if these transactional costs were included, your costs would have been higher.
| | |
Annual Report to Shareholders | | 9 |
| | | | | | | | | | | |
| | | Beginning
Account Value
(See footnotes
below) | | | Ending
Account
Value
3/31/09 | | Expenses Paid
During the Period
(See footnotes below) | |
Class A | | | | | | | | | | | |
Actual | | $ | 1,000.00 | B | | $ | 900.40 | | $ | 1.60 | C |
Hypothetical (5% return before expenses) | | | 1,000.00 | D | | | 1,019.45 | | | 5.54 | E |
Class CA | | | | | | | | | | | |
Actual | | $ | 1,000.00 | D | | $ | 601.00 | | $ | 7.78 | E |
Hypothetical (5% return before expenses) | | | 1,000.00 | D | | | 1,015.21 | | | 9.80 | E |
Institutional Class | | | | | | | | | | | |
Actual | | $ | 1,000.00 | D | | $ | 603.50 | | $ | 4.00 | E |
Hypothetical (5% return before expenses) | | | 1,000.00 | D | | | 1,019.95 | | | 5.04 | E |
A | On February 1, 2009, Primary Class shares were renamed Class C shares. |
B | Beginning account value is as of February 3, 2009 (commencement of operations). |
C | This calculation is based on expenses incurred from February 3, 2009 (commencement of operations) to March 31, 2009. The dollar amount shown as “Expenses Paid” is equal to the annualized expense ratio of 1.10% for Class A shares, multiplied by the average values over the period, multiplied by the number of days in the fiscal period (56) and divided by 365. |
D | Beginning account value is as of October 1, 2008. |
E | These calculations are based on expenses incurred in the most recent fiscal half-year, unless otherwise noted. The dollar amounts shown as “Expenses Paid” are equal to the annualized expense ratios of 1.10%, 1.95% and 1.00% for Class A, Class C and Institutional Class shares respectively, multiplied by the average values over the period, multiplied by the number of days in the most recent fiscal half-year (182) and divided by 365. |
| | |
10 | | Annual Report to Shareholders |
Performance Information
Fund Performance (Unaudited)
| | | | | | | | | |
Average Annual Total ReturnsA | | | | | | | | | |
| | | Without Sales ChargesB | |
| | | Class A | | | Class CC | | | Institutional
Class | |
Twelve Months Ended 3/31/09 | | N/A | | | –51.32 | % | | –50.86 | % |
Five Years Ended 3/31/09 | | N/A | | | –11.63 | | | –10.75 | |
Ten Years Ended 3/31/09 | | N/A | | | –6.02 | | | N/A | |
Inception* through 3/31/09 | | –9.96 | %D | | 1.97 | | | –6.20 | |
| | | | |
| | | With Sales ChargesE | |
| | | Class A | | | Class CC | | | Institutional
Class | |
Twelve Months Ended 3/31/09 | | N/A | | | –51.80 | % | | –50.86 | % |
Five Years Ended 3/31/09 | | N/A | | | –11.63 | | | –10.75 | |
Ten Years Ended 3/31/09 | | N/A | | | –6.02 | | | N/A | |
Inception* through 3/31/09 | | –15.16 | %D | | 1.97 | | | –6.20 | |
| | | | | | | | | |
Cumulative Total ReturnsA | | | | | | | | | |
| | | Without Sales ChargesB | |
Class A (Inception date of 2/3/09 through 3/31/09) | | | | | –9.96 | % | | | |
Class CC (3/31/99 through 3/31/09) | | | | | –46.25 | | | | |
Institutional Class
(Inception date of 6/14/01 through 3/31/09) | | | | | –39.28 | | | | |
A | All figures represent past performance and are not a guarantee of future results. Investment return and principal value of an investment will fluctuate so that an investor’s shares, when redeemed, may be worth more or less than their original cost. The returns shown do not reflect the deduction of taxes that a shareholder would pay on Fund distributions or the redemption of Fund shares. Performance figures may reflect fee waivers and/or expense reimbursements. In the absence of fee waivers and/or expense reimbursements, the total return would have been lower. |
B | Assumes the reinvestment of all distributions, including return of capital, if any, at net asset value and does not reflect the deduction of the applicable sales charge with respect to Class A shares or the applicable contingent deferred sales charges (“CDSC”) with respect to Class C shares. On February 1, 2009, Class C shares began to charge a CDSC for shares bought by investors on and after that date and redeemed within one year of purchase. |
C | On February 1, 2009, Primary Class shares were renamed Class C shares. |
E | Assumes the reinvestment of all distributions, including returns of capital, if any, at net asset value. In addition, Class A shares reflect the deduction of the maximum initial sales charge of 5.75%. Class C shares reflect the deduction of a 1.00% CDSC, which applies if shares are redeemed within one year from purchase payment. |
| * | Inception dates for Class A, Class C and Institutional Class shares are February 3, 2009, September 1, 1993 and June 14, 2001, respectively. |
| | |
Annual Report to Shareholders | | 11 |
American Leading Companies Trust
The graphs on the following pages compare the Fund’s total returns to those of a closely matched broad-based securities market index. The graphs illustrate the cumulative total return of an initial $10,000 investment in Class CA shares and an initial $1,000,000 investment in Institutional Class shares, for the periods indicated. The lines for the Fund represent the total return after deducting all Fund investment management and other administrative expenses and the transaction costs of buying and selling securities. The lines representing the securities market Index do not take into account any transaction costs associated with buying and selling portfolio securities in the Index or other administrative expenses. Due to the limited operating history of Class A, a performance graph is not presented.
Total return measures investment performance in terms of appreciation or depreciation in a fund’s net asset value per share, plus dividends and any capital gain distributions. Both the Fund’s results and the Index’s results assume the reinvestment of all dividends and distributions at the time they were paid. Average annual returns tend to smooth out variations in a fund’s return, so that they differ from actual year-to-year results.
A | On February 1, 2009 Primary Class shares were renamed Class C shares. |
| | |
12 | | Annual Report to Shareholders |
Performance Information — Continued
Growth of a $10,000 Investment — Class CA Shares
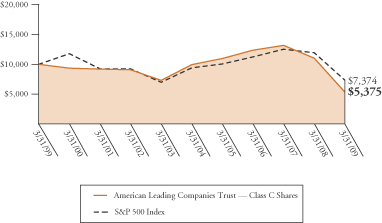
Hypothetical illustration of $10,000 invested in Class C shares on March 31, 1999, assuming the reinvestment of all distributions, including returns of capital, if any, at net asset value through March 31, 2009. The performance data quoted represent past performance and do not guarantee future results. The performance stated may have been due to extraordinary market conditions, which may not be duplicated in the future. Current performance may be lower or higher than the performance data quoted. To obtain the most recent month-end performance information, please visit www.leggmason.com/individualinvestors. The investment return and principal value of the Fund will fluctuate so that an investor’s shares, when redeemed, may be worth more or less than the original cost. Performance would have been lower if fees and expenses had not been waived and/or reimbursed in various periods. Performance for other share classes will vary due to differences in sales charge structure and class expenses.
The graph does not reflect the deduction of taxes that a shareholder would pay on Fund distributions or the redemption of Fund shares.
A | On February 1, 2009, Primary Class shares were renamed Class C shares. |
| | |
Annual Report to Shareholders | | 13 |
Growth of a $1,000,000 Investment — Institutional Class Shares
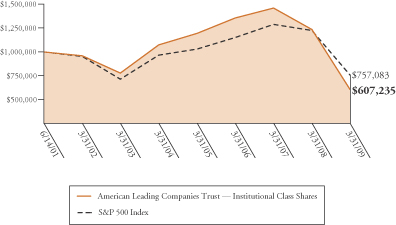
Hypothetical illustration of $1,000,000 invested in Institutional Class shares on June 14, 2001 (commencement of operations), assuming the reinvestment of all distributions, including returns of capital, if any, at net asset value through March 31, 2009. The performance data quoted represent past performance and do not guarantee future results. The performance stated may have been due to extraordinary market conditions, which may not be duplicated in the future. Current performance may be lower or higher than the performance data quoted. To obtain the most recent month-end performance information, please visit www.leggmason.com/individualinvestors. The investment return and principal value of the Fund will fluctuate so that an investor’s shares, when redeemed, may be worth more or less than the original cost. Performance would have been lower if fees and expenses had not been waived and/or reimbursed in various periods. Performance for other share classes will vary due to differences in sales charge structure and class expenses.
The graph does not reflect the deduction of taxes that a shareholder would pay on Fund distributions or the redemption of Fund shares.
| | |
14 | | Annual Report to Shareholders |
Performance Information — Continued
Portfolio Composition (as of March 31, 2009)A
(As a percentage of the portfolio)
Top 10 Holdings (as of March 31, 2009)
| | |
| Security | | % of
Net Assets |
International Business Machines Corp. | | 4.2% |
Hewlett-Packard Co. | | 4.0% |
Texas Instruments Inc. | | 4.0% |
UnitedHealth Group Inc. | | 3.6% |
The TJX Cos. Inc. | | 3.6% |
Nokia Oyj — ADR | | 3.3% |
J.P. Morgan Chase and Co. | | 3.3% |
Microsoft Corp. | | 3.3% |
Johnson and Johnson | | 3.1% |
WellPoint Inc. | | 2.8% |
A | The Fund is actively managed. As a result, the composition of its portfolio holdings and sectors is subject to change at any time. |
| | |
Annual Report to Shareholders | | 15 |
American Leading Companies Trust
Selected Portfolio PerformanceA
| | | | |
| Strongest performers for the year ended March 31, 2009B |
| 1 | | Amgen Inc. | | 18.4% |
| 2 | | WellPoint Inc. | | –13.5% |
| 3 | | International Business Machines Corp. | | –14.5% |
| 4 | | Johnson and Johnson | | –16.4% |
| 5 | | Exxon Mobil Corp. | | –17.7% |
| 6 | | Accenture Ltd. | | –18.8% |
| 7 | | The TJX Cos. Inc. | | –21.1% |
| 8 | | Altria Group Inc. | | –23.7% |
| 9 | | Kraft Foods Inc. | | –25.5% |
| 10 | | Philip Morris International Inc. | | –26.0% |
| | | | |
| Weakest performers for the year ended March 31, 2009B |
| 1 | | UAL Corp. | | –78.5% |
| 2 | | Capital One Financial Corp. | | –72.2% |
| 3 | | General Electric Co. | | –70.1% |
| 4 | | Caterpillar Inc. | | –62.7% |
| 5 | | Nokia Oyj — ADR | | –62.4% |
| 6 | | Baker Hughes Inc. | | –58.9% |
| 7 | | eBay Inc. | | –57.9% |
| 8 | | Devon Energy Corp. | | –57.1% |
| 9 | | Transocean Ltd. | | –56.6% |
| 10 | | Yahoo! Inc. | | –56.2% |
A | Individual security performance is measured by the change in the security’s price; for stocks, dividends are assumed to be reinvested at the time they were paid. |
B | Securities held for the entire year. |
| | |
16 | | Annual Report to Shareholders |
Portfolio Changes
| | |
New positions established during
the quarter | | Positions completely sold during
the quarter |
Aflac Inc. | | Bank of America Corp. |
The AES Corp. | | Citigroup Inc. |
Cisco Systems Inc. | | Merrill Lynch & Co., Inc. |
Costco Wholesale Corp. | | The Mosaic Co. |
Delta Air Lines Inc. | | |
EMC Corp. | | |
Emerson Electric Co. | | |
Freeport-McMoRan Copper
and Gold Inc. | | |
MetLife Inc. | | |
Morgan Stanley | | |
PepsiCo Inc. | | |
Procter and Gamble Co. | | |
Sprint Nextel Corp. | | |
Time Warner Cable Inc. | | |
United Technologies Corp. | | |
Wells Fargo & Co. | | |
| | |
Annual Report to Shareholders | | 17 |
Portfolio of Investments
American Leading Companies Trust
March 31, 2009
| | | | | | |
| | | Shares | | Value | |
| | | | | | |
Common Stocks and Equity Interests — 98.6% | | | | |
| | |
Consumer Discretionary — 7.0% | | | | | | |
Media — 3.4% | | | | | | |
CBS Corp. | | 320,000 | | $ | 1,228,800 | |
Time Warner Cable Inc. | | 47,608 | | | 1,180,684 | |
Time Warner Inc. | | 189,667 | | | 3,660,567 | |
| | | | | | |
| | | | | 6,070,051 | |
| | | | | | |
| | |
Specialty Retail — 3.6% | | | | | | |
The TJX Cos. Inc. | | 250,000 | | | 6,410,000 | |
| | | | | | |
| | |
Consumer Staples — 8.0% | | | | | | |
Beverages — 0.5% | | | | | | |
PepsiCo Inc. | | 18,000 | | | 926,640 | |
| | | | | | |
| | |
Food and Staples Retailing — 1.4% | | | | | | |
Costco Wholesale Corp. | | 55,000 | | | 2,547,600 | |
| | | | | | |
| | |
Food Products — 1.3% | | | | | | |
Kraft Foods Inc. | | 100,000 | | | 2,229,000 | |
| | | | | | |
| | |
Household Products — 0.5% | | | | | | |
Procter and Gamble Co. | | 19,000 | | | 894,710 | |
| | | | | | |
| | |
Tobacco — 4.3% | | | | | | |
Altria Group Inc. | | 190,000 | | | 3,043,800 | |
Philip Morris International Inc. | | 130,000 | | | 4,625,400 | |
| | | | | | |
| | | | | 7,669,200 | |
| | | | | | |
| | |
Energy — 10.3% | | | | | | |
Energy Equipment and Services — 5.8% | | | | | | |
Baker Hughes Inc. | | 73,000 | | | 2,084,150 | |
National Oilwell Varco Inc. | | 70,000 | | | 2,009,700 | A |
Noble Corp. | | 88,000 | | | 2,119,920 | |
Transocean Ltd. | | 70,000 | | | 4,118,800 | A |
| | | | | | |
| | | | | 10,332,570 | |
| | | | | | |
| | |
18 | | Annual Report to Shareholders |
Portfolio of Investments — Continued
American Leading Companies Trust — Continued
| | | | | | |
| | | Shares | | Value | |
| | | | | | |
Energy — Continued | | | | | | |
Oil, Gas and Consumable Fuels — 4.5% | | | | | | |
Anadarko Petroleum Corp. | | 32,750 | | $ | 1,273,647 | |
Apache Corp. | | 34,000 | | | 2,179,060 | |
ConocoPhillips | | 30,000 | | | 1,174,800 | |
Devon Energy Corp. | | 46,000 | | | 2,055,740 | |
Exxon Mobil Corp. | | 20,000 | | | 1,362,000 | |
| | | | | | |
| | | | | 8,045,247 | |
| | | | | | |
| | |
Financials — 14.6% | | | | | | |
Capital Markets — 4.7% | | | | | | |
Morgan Stanley | | 105,000 | | | 2,390,850 | |
State Street Corp. | | 70,000 | | | 2,154,600 | |
The Goldman Sachs Group Inc. | | 36,000 | | | 3,816,720 | |
| | | | | | |
| | | | | 8,362,170 | |
| | | | | | |
Commercial Banks — 0.7% | | | | | | |
Wells Fargo & Co. | | 87,500 | | | 1,246,000 | |
| | | | | | |
| | |
Consumer Finance — 1.2% | | | | | | |
Capital One Financial Corp. | | 175,000 | | | 2,142,000 | |
| | | | | | |
| | |
Diversified Financial Services — 3.9% | | | | | | |
J.P. Morgan Chase and Co. | | 220,000 | | | 5,847,600 | |
NYSE Euronext | | 67,500 | | | 1,208,250 | |
| | | | | | |
| | | | | 7,055,850 | |
| | | | | | |
| | |
Insurance — 4.1% | | | | | | |
Aflac Inc. | | 75,000 | | | 1,452,000 | |
Hartford Financial Services Group Inc. | | 250,000 | | | 1,962,500 | |
MetLife Inc. | | 95,000 | | | 2,163,150 | |
Prudential Financial Inc. | | 97,500 | | | 1,854,450 | |
| | | | | | |
| | | | | 7,432,100 | |
| | | | | | |
| | |
Health Care — 15.8% | | | | | | |
Biotechnology — 2.5% | | | | | | |
Amgen Inc. | | 90,000 | | | 4,456,800 | A |
| | | | | | |
| | |
Annual Report to Shareholders | | 19 |
| | | | | | |
| | | Shares | | Value | |
| | | | | | |
Health Care — Continued | | | | | | |
Health Care Providers and Services — 9.2% | | | | | | |
Aetna Inc. | | 40,000 | | $ | 973,200 | |
Health Net Inc. | | 275,000 | | | 3,982,000 | A |
UnitedHealth Group Inc. | | 311,000 | | | 6,509,230 | |
WellPoint Inc. | | 131,500 | | | 4,993,055 | A |
| | | | | | |
| | | | | 16,457,485 | |
| | | | | | |
| | |
Pharmaceuticals — 4.1% | | | | | | |
Johnson and Johnson | | 106,000 | | | 5,575,600 | |
Pfizer Inc. | | 130,000 | | | 1,770,600 | |
| | | | | | |
| | | | | 7,346,200 | |
| | | | | | |
| | |
Industrials — 11.6% | | | | | | |
Aerospace and Defense — 4.3% | | | | | | |
General Dynamics Corp. | | 75,000 | | | 3,119,250 | |
Lockheed Martin Corp. | | 54,000 | | | 3,727,620 | |
United Technologies Corp. | | 20,000 | | | 859,600 | |
| | | | | | |
| | | | | 7,706,470 | |
| | | | | | |
| | |
Airlines — 2.8% | | | | | | |
Delta Air Lines Inc. | | 100,000 | | | 563,000 | A |
UAL Corp. | | 1,000,000 | | | 4,480,000 | A |
| | | | | | |
| | | | | 5,043,000 | |
| | | | | | |
| | |
Electrical Equipment — 0.6% | | | | | | |
Emerson Electric Co. | | 40,000 | | | 1,143,200 | |
| | | | | | |
| | |
Industrial Conglomerates — 1.5% | | | | | | |
General Electric Co. | | 265,000 | | | 2,679,150 | |
| | | | | | |
| | |
Machinery — 2.4% | | | | | | |
Caterpillar Inc. | | 152,500 | | | 4,263,900 | |
| | | | | | |
| | |
Information Technology — 25.6% | | | | | | |
Communications Equipment — 3.8% | | | | | | |
Cisco Systems Inc. | | 55,000 | | | 922,350 | A |
Nokia Oyj — ADR | | 506,003 | | | 5,905,055 | |
| | | | | | |
| | | | | 6,827,405 | |
| | | | | | |
| | |
20 | | Annual Report to Shareholders |
Portfolio of Investments — Continued
American Leading Companies Trust — Continued
| | | | | | |
| | | Shares | | Value | |
| | | | | | |
Information Technology — Continued | | | | | | |
Computers and Peripherals — 9.2% | | | | | | |
EMC Corp. | | 154,000 | | $ | 1,755,600 | A |
Hewlett-Packard Co. | | 225,000 | | | 7,213,500 | |
International Business Machines Corp. | | 77,500 | | | 7,508,975 | |
| | | | | | |
| | | | | 16,478,075 | |
| | | | | | |
| | |
Electronic Equipment, Instruments & Components — 0.9% | | | | | | |
Jabil Circuit Inc. | | 300,000 | | | 1,668,000 | |
| | | | | | |
| | |
Internet Software and Services — 3.6% | | | | | | |
eBay Inc. | | 319,900 | | | 4,017,944 | A |
Yahoo! Inc. | | 186,000 | | | 2,382,660 | A |
| | | | | | |
| | | | | 6,400,604 | |
| | | | | | |
| | |
IT Services — 0.9% | | | | | | |
Accenture Ltd. | | 57,000 | | | 1,566,930 | |
| | | | | | |
| | |
Semiconductors and Semiconductor Equipment — 4.0% | | | | | | |
Texas Instruments Inc. | | 430,000 | | | 7,099,300 | |
| | | | | | |
| | |
Software — 3.2% | | | | | | |
Microsoft Corp. | | 318,000 | | | 5,841,660 | |
| | | | | | |
| | |
Materials — 2.3% | | | | | | |
Metals and Mining — 2.3% | | | | | | |
Alcoa Inc. | | 130,000 | | | 954,200 | |
Freeport-McMoRan Copper and Gold Inc. | | 50,000 | | | 1,905,500 | |
United States Steel Corp. | | 60,000 | | | 1,267,800 | |
| | | | | | |
| | | | | 4,127,500 | |
| | | | | | |
| | |
Telecommunication Services — 2.8% | | | | | | |
Diversified Telecommunication Services —1.5% | | | | |
AT&T Inc. | | 110,000 | | | 2,772,000 | |
| | | | | | |
| |
Wireless Telecommunication Services — 1.3% | | | | |
Sprint Nextel Corp. | | 650,000 | | | 2,320,500 | A |
| | | | | | |
| | |
Annual Report to Shareholders | | 21 |
| | | | | | |
| | | Shares | | Value | |
| | | | | | |
Utilities — 0.6% | | | | | | |
Independent Power Producers and Energy Traders — 0.6% | | | | | | |
The AES Corp. | | 200,000 | | $ | 1,162,000 | A |
| | | | | | |
Total Common Stocks and Equity Interests
(Cost — $204,280,524) | | | 176,723,317 | |
Total Investments — 98.6% (Cost — $204,280,524)B | | | 176,723,317 | |
Other Assets Less Liabilities — 1.4% | | | | | 2,523,685 | |
| | | | | | |
| | |
Net Assets — 100.0% | | | | $ | 179,247,002 | |
| | | | | | |
B | At March 31, 2009, the aggregate gross unrealized appreciation and depreciation of investments for federal income tax purposes were as follows: |
| | | | |
| Gross unrealized appreciation | | $ | 38,532,867 | |
| Gross unrealized depreciation | | | (67,220,549 | ) |
| | | | |
| Net unrealized depreciation | | $ | (28,687,682 | ) |
| | | | |
ADR — American Depository Receipt
See notes to financial statements.
| | |
22 | | Annual Report to Shareholders |
Statement of Assets and Liabilities
American Leading Companies Trust
March 31, 2009
| | | | | | | |
Assets: | | | | | | | |
Investment securities at value (Cost – $204,280,524) | | | | | $ | 176,723,317 | |
Cash | | | | | | 862,368 | |
Receivable for securities sold | | | | | | 2,928,036 | |
Dividends receivable | | | | | | 382,445 | |
Receivable for fund shares sold | | | | | | 127,693 | |
| | | | | | | |
Total assets | | | | | | 181,023,859 | |
Liabilities: | | | | | | | |
Payable for securities purchased | | $ | 913,501 | | | | |
Payable for fund shares repurchased | | | 379,390 | | | | |
Accrued distribution and service fees | | | 135,676 | | | | |
Accrued management fee | | | 71,904 | | | | |
Accrued expenses | | | 276,386 | | | | |
| | | | | | | |
Total liabilities | | | | | | 1,776,857 | |
| | | | | | | |
Net Assets | | | | | $ | 179,247,002 | |
| | | | | | | |
Net assets consist of: | | | | | | | |
Accumulated paid-in-capital | | | | | $ | 287,254,512 | |
Undistributed net investment income | | | | | | 28,635 | |
Accumulated net realized loss on investments and foreign currency transactions | | | | | | (80,478,938 | ) |
Net unrealized depreciation of investments | | | | | | (27,557,207 | ) |
| | | | | | | |
Net Assets | | | | | $ | 179,247,002 | |
| | | | | | | |
Net Asset Value Per Share: | | | | | | | |
Class A (and redemption price) (1,050,815 shares outstanding) | | | | | | $9.40 | |
Class CA,B (17,030,126 shares outstanding) | | | | | | $9.39 | |
Institutional Class (and redemption price) (960,628 shares outstanding) | | | | | | $9.81 | |
Maximum Public Offering Price Per Share: | | | | | | | |
Class A (based on maximum initial sales charge of 5.75%) | | | | | | $9.97 | |
| | | | | | | | |
A | On February 1, 2009, Primary Class shares were renamed Class C shares. |
B | Redemption price per share is NAV of Class C shares reduced by 1.00% CDSC, if shares are redeemed within one year from purchase payment. |
See notes to financial statements.
| | |
Annual Report to Shareholders | | 23 |
Statement of Operations
American Leading Companies Trust
For the Year Ended March 31, 2009
| | | | | | | | |
Investment Income: | | | | | | | | |
Dividends | | $ | 9,264,485 | | | | | |
Interest | | | 11,404 | | | | | |
Less: Foreign taxes withheld | | | (74,297 | ) | | | | |
| | | | | | | | |
Total income | | | | | | $ | 9,201,592 | |
Expenses: | | | | | | | | |
Management fees | | | 2,571,941 | | | | | |
Distribution and service fees: | | | | | | | | |
Class AA | | | 3,804 | | | | | |
Class CB | | | 3,366,961 | | | | | |
Audit and legal fees | | | 46,351 | | | | | |
Custodian fees | | | 63,426 | | | | | |
Directors’ fees and expenses | | | 63,535 | | | | | |
Registration fees | | | 74,181 | | | | | |
Reports to shareholders: | | | | | | | | |
Class AA | | | 1,230 | | | | | |
Class CB | | | 166,042 | | | | | |
Institutional Class | | | 4,174 | | | | | |
Transfer agent and shareholder servicing expense: | | | | | | | | |
Class AA | | | 1,953 | | | | | |
Class CB | | | 202,746 | | | | | |
Institutional Class | | | 19,621 | | | | | |
Other expenses | | | 55,074 | | | | | |
| | | | | | | | |
| | | 6,641,039 | | | | | |
Less: Fee waivers and/or expense reimbursements (Note 3) | | | (31,173 | ) | | | | |
| | | | | | | | |
Net expenses | | | | | | | 6,609,866 | |
| | | | | | | | |
Net Investment Income | | | | | | | 2,591,726 | |
Net Realized and Unrealized Gain/(Loss) on Investments: | | | | | | | | |
Net realized loss on: | | | | | | | | |
Investments | | | (61,880,487 | ) | | | | |
Foreign currency transactions | | | (48,515 | ) | | | | |
| | | | | | | | |
| | | | | | | (61,929,002 | ) |
Change in unrealized appreciation/(depreciation) of: | | | | | | | | |
Investments | | | (177,339,424 | ) | | | | |
Assets and liabilities denominated in
foreign currency | | | 4,406 | | | | | |
| | | | | | | | |
| | | | | | | (177,335,018 | ) |
| | | | | | | | |
Net Realized and Unrealized Loss on Investments | | | | | | | (239,264,020 | ) |
Change in Net Assets Resulting From Operations | | | | | | $ | (236,672,294 | ) |
A | For the period February 3, 2009 (commencement of operations) to March 31, 2009. |
B | On February 1, 2009, Primary Class shares were renamed Class C shares. |
See notes to financial statements.
| | |
24 | | Annual Report to Shareholders |
Statement of Changes in Net Assets
American Leading Companies Trust
| | | | | | |
| | | For the Year Ended
March 31, 2009 | | | For the Year Ended
March 31, 2008 | |
Change in Net Assets: | | | | | | |
Net investment income | | $2,591,726 | | | $1,793,894 | |
Net realized gain/(loss) | | (61,929,002 | ) | | 38,783,820 | |
Change in unrealized appreciation/(depreciation) | | (177,335,018 | ) | | (160,538,236 | ) |
Change in net assets resulting from operations | | (236,672,294 | ) | | (119,960,522 | ) |
Distributions to shareholders from: | | | | | | |
Net investment income: | | | | | | |
Class CA | | (2,036,660 | ) | | — | |
Institutional Class | | (640,229 | ) | | — | |
Net realized gain on investments: | | | | | | |
Class CA | | (1,224,154 | ) | | (44,369,956 | ) |
Institutional Class | | (159,648 | ) | | (4,690,375 | ) |
Change in net assets from fund share transactions: | | | | | | |
Class AB | | 11,074,428 | | | — | |
Class CA | | (149,544,854 | ) | | (82,074,308 | ) |
Institutional Class | | (41,294,536 | ) | | 13,294,031 | |
Change in net assets | | (420,497,947 | ) | | (237,801,130 | ) |
Net Assets: | | | | | | |
Beginning of year | | 599,744,949 | | | 837,546,079 | |
End of year | | $179,247,002 | | | $599,744,949 | |
Undistributed net investment income | | $28,635 | | | $1,667,958 | |
A | On February 1, 2009, Primary Class shares were renamed Class C shares. |
B | For the period February 3, 2009 (commencement of operations) to March 31, 2009. |
See notes to financial statements.
| | |
Annual Report to Shareholders | | 25 |
Financial Highlights
American Leading Companies Trust
For a share of each class of capital stock outstanding:
Class A :
| | | |
| | | Period Ended
March 31, | |
| | | 2009A | |
Net asset value, beginning of period | | $10.44 | |
Investment operations: | | | |
Net investment incomeB | | .03 | |
Net realized and unrealized loss | | (1.07 | ) |
Total from investment operations | | (1.04 | ) |
Net asset value, end of period | | $ 9.40 | |
Total returnC | | (9.96 | )% |
Ratios to Average Net Assets:D | | | |
Total expensesE | | 1.34 | % |
Expenses net of waivers and/or expense reimbursements, if anyE | | 1.10 | % |
Expenses net of all reductionsE | | 1.10 | % |
Net investment income | | 1.93 | % |
Supplemental Data: | | | |
Portfolio turnover rate | | 33.4 | % |
Net assets, end of period (in thousands) | | $9,877 | |
A | For the period February 3, 2009 (commencement of operations) to March 31, 2009. |
B | Computed using average daily shares outstanding. |
C | Performance figures, exclusive of sales charge, may reflect compensating balance credits, fee waivers and/or expense reimbursements. In the absence of compensating balance credits, fee waivers and/or expense reimbursements, the total return would have been lower. Past performance is no guarantee of future results. Total returns for periods of less than one year are not annualized. |
E | Total expenses reflect operating expenses prior to any voluntary expense waivers, expense reimbursements and/or compensating balance credits. Expenses net of waivers and/or expense reimbursements reflect total expenses before compensating balance credits but net of any voluntary expense waivers and/or expense reimbursements. Expenses net of all reductions reflects expenses less any compensating balance credits, voluntary expense waivers and/or expense reimbursements. |
See notes to financial statements.
| | |
26 | | Annual Report to Shareholders |
Financial Highlights — Continued
American Leading Companies Trust
For a share of each class of capital stock outstanding:
Class CA:
| | | | | | | | | | | | | | | |
| | | Years Ended March 31, | |
| | | 2009 | | | 2008 | | | 2007 | | | 2006 | | | 2005 | |
Net asset value, beginning of year | | $19.52 | | | $24.87 | | | $24.59 | | | $21.85 | | | $19.85 | |
Investment operations: | | | | | | | | | | | | | | | |
Net investment income/(loss) | | .09 | B | | .03 | B | | (.06 | )B | | .01 | | | — | C |
Net realized and unrealized gain/(loss) | | (10.07 | ) | | (3.81 | ) | | 1.64 | | | 2.73 | | | 2.01 | |
Total from investment operations | | (9.98 | ) | | (3.78 | ) | | 1.58 | | | 2.74 | | | 2.01 | |
Distributions from: | | | | | | | | | | | | | | | |
Net investment income | | (.10 | ) | | — | | | (.01 | ) | | — | | | (.01 | ) |
Net realized gain on investments | | (.05 | ) | | (1.57 | ) | | (1.29 | ) | | — | | | — | |
Total distributions | | (.15 | ) | | (1.57 | ) | | (1.30 | ) | | — | | | (.01 | ) |
Net asset value, end of year | | $ 9.39 | | | $19.52 | | | $24.87 | | | $24.59 | | | $21.85 | |
Total returnD | | (51.32 | )% | | (16.24 | )% | | 6.68 | % | | 12.54 | % | | 10.12 | % |
Ratios to Average Net Assets: | | | | | | | | | | | | | | | |
Total expensesE | | 1.89 | % | | 1.83 | % | | 1.85 | % | | 1.86 | % | | 1.88 | % |
Expenses net of waivers and/or expense reimbursements, if anyE | | 1.88 | % | | 1.83 | % | | 1.85 | % | | 1.86 | % | | 1.88 | % |
Expense net of all reductionsE | | 1.88 | % | | 1.83 | % | | 1.85 | % | | 1.86 | % | | 1.88 | % |
Net investment income (loss) | | .62 | % | | .12 | % | | (.23 | )% | | .04 | % | | (.01 | )% |
Supplemental Data: | | | | | | | | | | | | | | | |
Portfolio turnover rate | | 33.4 | % | | 28.4 | % | | 19.0 | % | | 14.3 | % | | 19.4 | % |
Net assets, end of year
(in thousands) | | $159,944 | | | $531,186 | | | $765,000 | | | $757,630 | | | $654,019 | |
A | On February 1, 2009, Primary Class shares were renamed Class C shares. |
B | Computed using average daily shares outstanding. |
C | Amount less than $.01 per share. |
D | Performance figures may reflect compensating balance credits, fee waivers and/or expense reimbursements. In the absence of compensating balance credits, fee waivers and/or expense reimbursements, the total return would have been lower. Past performance is no guarantee of future results. Total returns for periods of less than one year are not annualized. |
E | Total expenses reflects operating expenses prior to any voluntary expense waivers, expense reimbursements and/or compensating balance credits. Expenses net of waivers and/or expense reimbursements reflect total expenses before compensating balance credits but net of any voluntary expense waivers and/or expense reimbursements. Expenses net of all reductions reflects expenses less any compensating balance credits, voluntary expense waivers and/or expense reimbursements. |
See notes to financial statements.
| | |
Annual Report to Shareholders | | 27 |
For a share of each class of capital stock outstanding:
Institutional Class:
| | | | | | | | | | | | | | | |
| | | Years Ended March 31, | |
| | | 2009 | | | 2008 | | | 2007 | | | 2006 | | | 2005 | |
Net asset value, beginning of year | | $20.57 | | | $25.86 | | | $25.33 | | | $22.34 | | | $20.28 | |
Investment operations: | | | | | | | | | | | | | | | |
Net investment income | | .28 | A | | .31 | A | | .23 | A | | .22 | | | .21 | |
Net realized and unrealized
gain/(loss) | | (10.63 | ) | | (4.03 | ) | | 1.67 | | | 2.82 | | | 2.06 | |
Total from investment operations | | (10.35 | ) | | (3.72 | ) | | 1.90 | | | 3.04 | | | 2.27 | |
Distributions from: | | | | | | | | | | | | | | | |
Net investment income | | (.36 | ) | | — | | | (.08 | ) | | (.05 | ) | | (.21 | ) |
Net realized gain on investments | | (.05 | ) | | (1.57 | ) | | (1.29 | ) | | — | | | — | |
Total distributions | | (.41 | ) | | (1.57 | ) | | (1.37 | ) | | (.05 | ) | | (.21 | ) |
Net asset value, end of year | | $ 9.81 | | | $20.57 | | | $25.86 | | | $25.33 | | | $22.34 | |
Total returnB | | (50.86 | )% | | (15.37 | )% | | 7.77 | % | | 13.63 | % | | 11.21 | % |
Ratios to Average Net Assets: | | | | | | | | | | | | | | | |
Total expensesC | | .87 | % | | .79 | % | | .82 | % | | .84 | % | | .90 | % |
Expenses net of waivers and/or expense reimbursements, if anyC | | .86 | % | | .79 | % | | .82 | % | | .84 | % | | .90 | % |
Expenses net of all reductionsC | | .86 | % | | .79 | % | | .82 | % | | .84 | % | | .90 | % |
Net investment income | | 1.61 | % | | 1.22 | % | | .90 | % | | 1.09 | % | | .99 | % |
Supplemental Data: | | | | | | | | | | | | | | | |
Portfolio turnover rate | | 33.4 | % | | 28.4 | % | | 19.0 | % | | 14.3 | % | | 19.4 | % |
Net assets, end of year
(in thousands) | | $9,426 | | | $68,559 | | | $72,546 | | | $41,476 | | | $21,386 | |
A | Computed using average daily shares outstanding. |
B | Performance figures may reflect compensating balance credits, fee waivers and/or expense reimbursements. In the absence of compensating balance credits, fee waivers and/or expense reimbursements, the total return would have been lower. Past performance is no guarantee of future results. Total returns for periods of less than one year are not annualized. |
C | Total expenses reflects operating expenses prior to any voluntary expense waivers, expense reimbursements and/or compensating balance credits. Expenses net of waivers and/or expense reimbursements reflect total expenses before compensating balance credits but net of any voluntary expense waivers and/or expense reimbursements. Expenses net of all reductions reflects expenses less any compensating balance credits, voluntary expense waivers and/or expense reimbursements. |
See notes to financial statements.
| | |
28 | | Annual Report to Shareholders |
Management’s Discussion of Fund Performance
U.S. Small-Capitalization Value Trust
Total returns, excluding sales charges, for the Fund for periods ended March 31, 2009 are presented below, along with those of comparative indices:
| | | | | | |
| | | Six
Months | | | Twelve
Months | |
U.S. Small-Capitalization Value Trust: | | | | |
Class C* | | –38.98 | % | | –41.75 | % |
Institutional Class | | –38.75 | % | | –41.24 | % |
Russell 2000 IndexA | | –37.17 | % | | –37.50 | % |
Lipper Small-Cap Value Funds Category AverageB | | –37.18 | % | | –39.49 | % |
The performance data quoted represent past performance and do not guarantee future results. Current performance may be lower or higher than the performance data quoted. To obtain performance data current to the most recent month-end, please visit our website at www.leggmason.com/individualinvestors. The investment return and principal value of the Fund will fluctuate so that an investor’s shares, when redeemed, may be worth more or less than the original cost. Calculations assume the reinvestment of dividends and capital gain distributions. Returns have not been adjusted to include sales charges that may apply or the deduction of taxes that a shareholder would pay on Fund distributions. If sales charges were reflected, the performance quoted would be lower. Performance would have been lower if fees and expenses had not been waived and/or reimbursed in various periods. Performance figures for periods shorter than one year represent cumulative figures and are not annualized.
Performance of Class A shares is not shown because this share class commenced operations on February 3, 2009.
* Prior to February 1, 2009, Class C was known as the Primary Class. In addition, on February 1, 2009, the class began to charge a contingent deferred sales charge for shares bought by investors on and after that date and redeemed within one year of purchase.
For the twelve months ended March 31, 2009, Class C shares of Legg Mason U.S. Small-Capitalization Value Trust, excluding sales charges, returned -41.75%. The Fund’s unmanaged benchmark, the Russell 2000 Index, returned -37.50% for the same period. The Lipper Small-Cap Value Funds Category Average returned -39.49% over the same time frame.
The global markets plunged over the last twelve months. March 2009, however, provided some welcome relief from the persistent negative equity returns of the last year as the markets bounced strongly. In the last year, the modern day investment bank and other financial firms were transformed as excessive leverage tied to high risk mortgage-based derivatives toppled Lehman Brothers, Bear Stearns and AIG, to name a few. Lehman Brothers went from troubled to bankrupt in the second week of September while others were acquired or restructured as regulated banks in the second half of 2008.
| | |
Annual Report to Shareholders | | 29 |
Early in 2009, optimism over the new administration was overwhelmed by relentless bad news from both the financial system and the broader economy. Even with the welcome rally in March, markets endured some of the steepest declines since the 1920-30s. In the last twelve months, the broad market S&P 500 IndexC returned -38.09% and large-cap value fell even more as the Russell 1000 Value IndexD returned -42.42% hampered by the collapse of financial stocks. Small-cap value stocks fared marginally better as the Russell 2000 Value IndexE declined 38.89% for the period.
During this twelve-month period, the Fund trailed both its benchmark and the Russell 2000 Value Index. The Fund performed poorly in the Information Technology, Industrials and Transportation sectors, all areas where the sharp drop in economic activity in late 2008 hit our holdings particularly hard. In addition, below benchmark weights in the more defensive sectors, such as Food Stores and Health Care, hurt the portfolio as the market fell sharply for most of this period. The Fund’s Insurance holdings provided the biggest positive contribution to relative performance. The small-cap insurance companies held up much better than the rest of the Financials sector and the Fund had a significant overweight position in this group. These companies generally had not participated in the more exotic investments and strategies that severely damaged so many larger financials. The Fund also benefited from holding a smaller than benchmark position in the auto suppliers, who suffered significantly with the declining car market.
Henry Otto
Steve Tonkovich
April 15, 2009
| | |
30 | | Annual Report to Shareholders |
Management’s Discussion of Fund Performance — Continued
The mention of sector breakdowns is for informational purposes only and should not be construed as a recommendation to purchase or sell any securities. The information provided regarding such sectors is not a sufficient basis upon which to make an investment decision. Investors seeking financial advice regarding the appropriateness of investing in any securities or investment strategies discussed should consult their financial professional. Portfolio holdings are subject to change at any time and may not be representative of the portfolio manager’s current or future investments. The Fund’s top five sector holdings (as a percentage of net assets) as of March 31, 2009 were: Financials (30.8%), Industrials (20.8%), Consumer Discretionary (15.4%), Information Technology (14.2%) and Health Care (3.9%). The Fund’s portfolio composition is subject to change at any time.
All index performance reflects no deduction for fees, expenses or taxes. Please note that an investor cannot invest directly in an index.
A | The Russell 2000 Index measures the performance of the 2,000 smallest companies in the Russell 3000 Index, which represents approximately 8% of the total market capitalization of the Russell 3000 Index. The Russell 3000 Index measures the performance of the 3,000 largest U.S. companies based on total market capitalization, which represents approximately 98% of the U.S. equity market. |
B | Lipper, Inc., a wholly-owned subsidiary of Reuters, provides independent insight on global collective investments. Returns are based on the period ended March 31, 2009, including the reinvestment of all distributions, including returns of capital, if any, calculated among the 338 funds for the six-month period and among the 329 funds for the twelve-month period in the Fund’s Lipper category, and excluding sales charges. |
C | The S&P 500 Index is an unmanaged index of 500 stocks and is generally representative of the performance of larger companies in the U.S. |
D | The Russell 1000 Value Index measures the performance of those Russell 1000 Index companies with lower price-to-book ratios and lower forecasted growth values. (A price-to-book ratio is the price of a stock compared to the difference between a company’s assets and liabilities.) The Russell 1000 Index measures the performance of the 1,000 largest companies in the Russell 3000 Index, which represents approximately 92% of the total market capitalization of the Russell 3000 Index. |
E | The Russell 2000 Value Index measures the performance of those Russell 2000 Index companies with lower price-to-book ratios and lower forecasted growth values. |
| | |
Annual Report to Shareholders | | 31 |
Expense Example
U.S. Small-Capitalization Value Trust
As a shareholder of the Fund, you may incur two types of costs (1) transaction costs, including front-end and back-end sales charges (loads) on purchase payments; and (2) ongoing costs, including management fees, distribution and/or service (12b-1) fees; and other Fund expenses. These examples are intended to help you understand your ongoing costs (in dollars) of investing in the Fund and to compare these costs with the ongoing costs of investing in other mutual funds.
For Class CA and Institutional Class shares, the examples are based on an investment of $1,000 invested on October 1, 2008, and held through March 31, 2009. For Class A shares, the example is based on an investment of $1,000 invested on February 3, 2009 (commencement of operations) and held through March 31, 2009. The ending value assumes dividends were reinvested at the time they were paid.
Actual Expenses
The first line for each class in the table below provides information about actual account values and actual expenses for each class. You may use the information in this line, together with the amount you invested, to estimate the expenses that you paid over the period. Simply divide your account value by $1,000 (for example, an $8,600 account value divided by $1,000 = 8.6), then multiply the result by the number in the first line under the heading entitled “Expenses Paid During the Period” to estimate the expenses you paid on your account if your shares were held through the entire period.
Hypothetical Example for Comparison Purposes
The second line for each class in the table below provides information about hypothetical account values and hypothetical expenses based on the relevant class’s actual expense ratio and an assumed rate of return of 5% per year before expenses, which is not the class’s actual return. The hypothetical account values and expenses may not be used to estimate the actual ending account balance or expenses you paid for the period. You may use this information to compare the ongoing costs of investing in the Fund and other funds. To do so, compare these 5% hypothetical examples with the 5% hypothetical examples for the relevant class that appear in the shareholder reports of other funds. Because the example is intended to be comparable to the examples provided by other funds, it is based on a hypothetical investment of $1,000 invested on October 1, 2008 and held through March 31, 2009 for each class, even though the Class A shares, did not begin operations until February 3, 2009. The ending values assume dividends were reinvested at the time they were paid.
A | On February 1, 2009, Primary Class shares were renamed Class C shares. |
| | |
32 | | Annual Report to Shareholders |
Expense Example — Continued
Please note that the expenses shown in the table are meant to highlight your ongoing costs only and do not reflect any transactional costs, such as sales charges (loads). Therefore the second line for each class of the table is useful in comparing ongoing costs only, and will not help you determine the relative total costs of owning different funds. In addition, if these transactional costs were included, your costs would have been higher.
| | | | | | | | | | | |
| | | Beginning
Account
Value
(See footnotes below) | | | Ending
Account
Value
3/31/09 | | Expenses Paid
During the Period
(See footnotes
below) | |
Class A | | | | | | | | | | | |
Actual | | $ | 1,000.00 | B | | $ | 924.60 | | $ | 1.85 | C |
Hypothetical (5% return before expenses) | | | 1,000.00 | D | | | 1,018.70 | | | 6.29 | E |
Class CA | | | | | | | | | | | |
Actual | | $ | 1,000.00 | D | | $ | 610.20 | | $ | 8.03 | E |
Hypothetical (5% return before expenses) | | | 1,000.00 | D | | | 1,014.96 | | | 10.05 | E |
Institutional Class | | | | | | | | | | | |
Actual | | $ | 1,000.00 | D | | $ | 612.50 | | $ | 4.02 | E |
Hypothetical (5% return before expenses) | | | 1,000.00 | D | | | 1,019.95 | | | 5.04 | E |
A | On February 1, 2009, Primary Class shares were renamed Class C shares. |
B | Beginning account value is as of February 3, 2009 (commencement of operations). |
C | This calculation is based on expenses incurred from February 3, 2009 (commencement of operations) to March 31, 2009. The dollar amount shown as “Expenses Paid” is equal to the annualized expense ratio of 1.25% for Class A shares multiplied by the average values over the period, multiplied by the number of days in the fiscal period (56) and divided by 365. |
D | Beginning account value is as of October 1, 2008. |
E | These calculations are based on expenses incurred in the most recent fiscal half-year, unless otherwise noted. The dollar amounts shown as “Expenses Paid” are equal to the annualized expense ratios of 1.25%, 2.00% and 1.00% for Class A, Class C and Institutional Class shares, respectively, multiplied by the average values over the period, multiplied by the number of days in the most recent fiscal half-year (182) and divided by 365. |
| | |
Annual Report to Shareholders | | 33 |
Performance Information
Fund Performance (Unaudited)
| | | | | | | | | |
Average Annual Total ReturnsA | | | |
| | | Without Sales ChargesB | |
| | | Class A | | | Class CC | | | Institutional
Class | |
Twelve Months Ended 3/31/09 | | N/A | | | –41.75 | % | | –41.24 | % |
Five Years Ended 3/31/09 | | N/A | | | –8.78 | | | –7.84 | |
Ten Years Ended 3/31/09 | | N/A | | | 2.06 | | | 3.09 | |
Inception* through 3/31/09 | | –7.54 | %D | | –0.40 | | | 0.69 | |
| | | | |
| | | With Sales ChargesE | |
| | | Class A | | | Class CC | | | Institutional
Class | |
Twelve Months Ended 3/31/09 | | N/A | | | –42.33 | % | | –41.24 | % |
Five Years Ended 3/31/09 | | N/A | | | –8.78 | | | –7.84 | |
Ten Years Ended 3/31/09 | | N/A | | | 2.06 | | | 3.09 | |
Inception* through 3/31/09 | | –12.80 | %D | | –0.40 | | | 0.69 | |
| | | | | | | | | |
Cumulative Total ReturnsA | | | |
| | | Without Sales ChargesB | |
Class A (Inception date of 2/3/09 through 3/31/09) | | | | | –7.54 | % | | | |
Class CC (3/31/99 through 3/31/09) | | | | | 22.65 | | | | |
Institutional Class (3/31/99 through 3/31/09) | | | | | 35.51 | | | | |
A | All figures represent past performance and are not a guarantee of future results. Investment return and principal value of an investment will fluctuate so that an investor’s shares, when redeemed, may be worth more or less than their original cost. The returns shown do not reflect the deduction of taxes that a shareholder would pay on Fund distributions or the redemption of Fund shares. Performance figures may reflect fee waivers and/or expense reimbursements. In the absence of fee waivers and/or expense reimbursements, the total return would have been lower. |
B | Assumes the reinvestment of all distributions, including return of capital, if any, at net asset value and does not reflect the deduction of the applicable sales charge with respect to Class A shares or the applicable CDSC with respect to Class C shares. On February 1, 2009, Class C shares began to charge a CDSC for shares bought by investors in and after that date and redeemed within one year of purchase. |
C | On February 1, 2009, Primary Class shares were renamed Class C shares. |
E | Assumes the reinvestment of all distributions, including returns of capital, if any, at net asset value. In addition, Class A shares reflect the deduction of the maximum initial sales charge of 5.75%. Class C shares reflect the deduction of a 1.00% CDSC, which applies if shares are redeemed within one year from purchase payment. |
| * | Inception dates for Class A, Class C and Institutional Class shares are February 3, 2009, June 15, 1998 and June 19, 1998, respectively. |
| | |
34 | | Annual Report to Shareholders |
Performance Information — Continued
U.S. Small-Capitalization Value Trust
The graphs on the following pages compare the Fund’s total returns to those of a closely matched broad-based securities market index. The graphs illustrate the cumulative total return of an initial $10,000 investment in Class CA shares and an initial $1,000,000 investment in Institutional Class shares, for the periods indicated. The lines for the Fund represent the total return after deducting all Fund investment management and other administrative expenses and the transaction costs of buying and selling securities. The lines representing the securities market Index do not take into account any transaction costs associated with buying and selling portfolio securities in the Index or other administrative expenses. Due to the limited operating history of Class A, a performance graph is not presented.
Total return measures investment performance in terms of appreciation or depreciation in a fund’s net asset value per share, plus dividends and any capital gain distributions. Both the Fund’s results and the Index’s results assume the reinvestment of all dividends and distributions at the time they were paid. Average annual returns tend to smooth out variations in a fund’s return, so that they differ from actual year-to-year results.
A | On February 1, 2009, Primary Class shares were renamed Class C shares. |
| | |
Annual Report to Shareholders | | 35 |
Growth of a $10,000 Investment — Class CA Shares
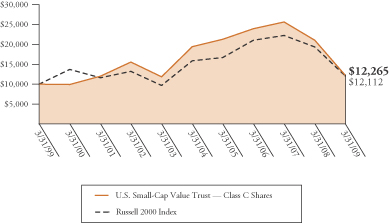
Hypothetical illustration of $10,000 invested in Class C shares on March 31, 1999, assuming the reinvestment of all distributions, including returns of capital, if any, at net asset value through March 31, 2009. The performance data quoted represent past performance and do not guarantee future results. The performance stated may have been due to extraordinary market conditions, which may not be duplicated in the future. Current performance may be lower or higher than the performance data quoted. To obtain the most recent month-end performance information, please visit www.leggmason.com/individualinvestors. The investment return and principal value of the Fund will fluctuate so that an investor’s shares, when redeemed, may be worth more or less than the original cost. Performance would have been lower if fees and expenses had not been waived and/or reimbursed in various periods. Performance for other share classes will vary due to differences in sales charge structure and class expenses.
The graph does not reflect the deduction of taxes that a shareholder would pay on Fund distributions or the redemption of Fund shares.
A | On February 1, 2009, Primary Class shares were renamed Class C shares. |
| | |
36 | | Annual Report to Shareholders |
Performance Information — Continued
Growth of a $1,000,000 Investment — Institutional Class Shares
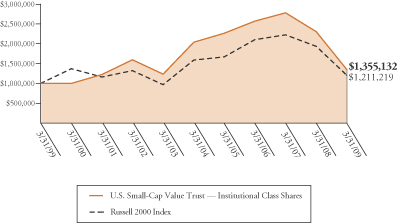
Hypothetical illustration of $1,000,000 invested in Institutional Class shares on March 31, 1999, assuming the reinvestment of all distributions, including returns of capital, if any, at net asset value through March 31, 2009. The performance data quoted represent past performance and do not guarantee future results. The performance stated may have been due to extraordinary market conditions, which may not be duplicated in the future. Current performance may be lower or higher than the performance data quoted. To obtain the most recent month-end performance information, please visit www.leggmason.com/individualinvestors. The investment return and principal value of the Fund will fluctuate so that an investor’s shares, when redeemed, may be worth more or less than the original cost. Performance would have been lower if fees and expenses had not been waived and/or reimbursed in various periods. Performance for other share classes will vary due to differences in sales charge structure and class expenses.
The graph does not reflect the deduction of taxes that a shareholder would pay on Fund distributions or the redemption of Fund shares.
| | |
Annual Report to Shareholders | | 37 |
Portfolio Composition (as of March 31, 2009)A
(As a percentage of the portfolio)
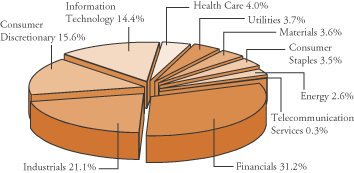
Top 10 Holdings (as of March 31, 2009)
| | |
| Security | | % of
Net Assets |
CNA Surety Corp. | | 1.5% |
Cracker Barrel Old Country Store Inc. | | 1.5% |
SYNNEX Corp. | | 1.4% |
Safety Insurance Group Inc. | | 1.3% |
Olin Corp. | | 1.3% |
Tech Data Corp. | | 1.2% |
MKS Instruments Inc. | | 1.1% |
Benchmark Electronics Inc. | | 1.1% |
Delphi Financial Group Inc. | | 1.1% |
Mueller Industries Inc. | | 1.1% |
A | The Fund is actively managed. As a result, the composition of its portfolio holdings and sectors is subject to change at any time. |
| | |
38 | | Annual Report to Shareholders |
Performance Information — Continued
U.S. Small-Capitalization Value TrustA
Selected Portfolio PerformanceB
| | | | |
| Strongest performers for the year ended March 31, 2009 |
| 1 | | Brigham Exploration Co. | | 157.99% |
| 2 | | Emergent Biosolutions Inc. | | 122.62% |
| 3 | | Central Garden and Pet Co. (Class A) | | 118.60% |
| 4 | | hhgregg Inc. | | 89.17% |
| 5 | | Genesco Inc. | | 84.17% |
| 6 | | Republic First Bancorp Inc. | | 82.56% |
| 7 | | AZZ Inc. | | 81.99% |
| 8 | | IXYS Corp. | | 78.86% |
| 9 | | VSE Corp. | | 74.64% |
| 10 | | GEHL Co. | | 74.26% |
| | | | |
| Weakest performers for the year ended March 31, 2009 |
| 1 | | Wabash National Corp. | | –93.15% |
| 2 | | Nautilus Inc. | | –91.61% |
| 3 | | Valassis Communications Inc. | | –89.77% |
| 4 | | Eddie Bauer Holdings Inc. | | –89.51% |
| 5 | | NCI Building Systems Inc. | | –88.80% |
| 6 | | Swift Energy Co. | | –88.78% |
| 7 | | Meridian Resource Corp. | | –88.32% |
| 8 | | FBL Financial Group Inc. (Class A) | | –87.63% |
| 9 | | TBS International Ltd. (Class A) | | –87.38% |
| 10 | | Fairchild Corp. | | –87.19% |
A | Portfolio changes are not reported for U.S. Small-Cap due to the Fund’s high volume of trading. |
B | Individual security performance is measured by the change in the security’s price; for stocks, dividends are assumed to be reinvested at the time they were paid. |
| | |
Annual Report to Shareholders | | 39 |
Portfolio of Investments
U.S. Small-Capitalization Value Trust
March 31, 2009
| | | | | | |
| | | Shares | | Value | |
| | | | | | |
Common Stocks and Equity Interests — 98.6% | | | | |
| | |
Consumer Discretionary — 15.4% | | | | | | |
Auto Components — 0.5% | | | | | | |
Dorman Products Inc. | | 3,680 | | $ | 34,333 | A |
Hawk Corp. | | 4,900 | | | 56,595 | A |
Superior Industries International Inc. | | 13,995 | | | 165,841 | |
| | | | | | |
| | | | | 256,769 | |
| | | | | | |
| | |
Distributors — 0.2% | | | | | | |
Audiovox Corp. | | 3,150 | | | 10,805 | A |
Core-Mark Holding Co. Inc. | | 5,770 | | | 105,129 | A |
| | | | | | |
| | | | | 115,934 | |
| | | | | | |
| | |
Diversified Consumer Services — 0.7% | | | | | | |
Pre-Paid Legal Services Inc. | | 11,100 | | | 322,233 | A |
| | | | | | |
| | |
Hotels, Restaurants and Leisure — 3.0% | | | | | | |
Carrols Restaurant Group Inc. | | 8,400 | | | 29,484 | A |
Cracker Barrel Old Country Store Inc. | | 24,910 | | | 713,422 | |
Domino’s Pizza Inc. | | 6,490 | | | 42,510 | A |
Dover Downs Gaming and Entertainment Inc. | | 5,390 | | | 16,547 | |
Einstein Noah Restaurant Group Inc. | | 5,200 | | | 30,316 | A |
Frisch’s Restaurants Inc. | | 2,500 | | | 50,625 | |
Luby’s Inc. | | 12,366 | | | 60,717 | A |
Pinnacle Entertainment Inc. | | 25,000 | | | 176,000 | A |
Speedway Motorsports Inc. | | 20,350 | | | 240,537 | |
The Steak n Shake Co. | | 16,100 | | | 121,877 | A |
| | | | | | |
| | | | | 1,482,035 | |
| | | | | | |
| | |
Household Durables — 2.1% | | | | | | |
CSS Industries Inc. | | 15,880 | | | 269,960 | |
Ethan Allen Interiors Inc. | | 22,970 | | | 258,643 | |
Helen of Troy Ltd. | | 16,900 | | | 232,375 | A |
Hooker Furniture Corp. | | 2,780 | | | 23,463 | |
Jarden Corp. | | 17,100 | | | 216,657 | A |
Tempur-Pedic International Inc. | | 7,370 | | | 53,801 | |
| | | | | | |
| | | | | 1,054,899 | |
| | | | | | |
| | |
40 | | Annual Report to Shareholders |
Portfolio of Investments — Continued
U.S. Small-Capitalization Value Trust — Continued
| | | | | | |
| | | Shares | | Value | |
| | | | | | |
Consumer Discretionary — Continued | | | | | | |
Internet and Catalog Retail — 0.4% | | | | | | |
dELiA*s Inc. | | 10,500 | | $ | 17,640 | A |
NutriSystem Inc. | | 12,600 | | | 179,802 | |
| | | | | | |
| | | | | 197,442 | |
| | | | | | |
| | |
Leisure Equipment and Products — 1.6% | | | | | | |
Arctic Cat Inc. | | 5,400 | | | 20,682 | |
Callaway Golf Co. | | 28,000 | | | 201,040 | |
JAKKS Pacific Inc. | | 31,140 | | | 384,579 | A |
Polaris Industries Inc. | | 7,760 | | | 166,374 | |
| | | | | | |
| | | | | 772,675 | |
| | | | | | |
| | |
Media — 0.5% | | | | | | |
Alloy Inc. | | 7,400 | | | 31,080 | A |
Cox Radio Inc. | | 3,350 | | | 13,735 | A |
Fisher Communications Inc. | | 1,400 | | | 13,664 | |
Lakes Entertainment Inc. | | 10,200 | | | 20,910 | A |
Scholastic Corp. | | 10,190 | | | 153,563 | |
| | | | | | |
| | | | | 232,952 | |
| | | | | | |
| | |
Specialty Retail — 5.7% | | | | | | |
America’s Car-Mart Inc. | | 6,350 | | | 86,297 | A |
Big 5 Sporting Goods Corp. | | 6,600 | | | 38,742 | |
Build-A-Bear Workshop Inc. | | 8,000 | | | 48,560 | A |
Cabela’s Inc. | | 23,575 | | | 214,768 | A |
Conn’s Inc. | | 24,590 | | | 345,244 | A |
Genesco Inc. | | 10,700 | | | 201,481 | A |
Group 1 Automotive Inc. | | 3,260 | | | 45,542 | |
Gymboree Corp. | | 8,700 | | | 185,745 | A |
Haverty Furniture Cos. Inc. | | 7,600 | | | 80,028 | |
hhgregg Inc. | | 5,300 | | | 74,995 | A |
Jos. A Bank Clothiers Inc. | | 5,948 | | | 165,414 | A |
Penske Automotive Group Inc. | | 13,830 | | | 129,034 | |
Rent-A-Center Inc. | | 5,420 | | | 104,985 | A |
REX Stores Corp. | | 3,195 | | | 34,250 | A |
Shoe Carnival Inc. | | 6,910 | | | 71,519 | A |
Stage Stores Inc. | | 20,685 | | | 208,505 | |
| | |
Annual Report to Shareholders | | 41 |
| | | | | | |
| | | Shares | | Value | |
| | | | | | |
Consumer Discretionary — Continued | | | | | | |
Specialty Retail — Continued | | | | | | |
Syms Corp. | | 4,500 | | $ | 27,540 | A |
Systemax Inc. | | 19,900 | | | 257,108 | A |
The Dress Barn Inc. | | 5,190 | | | 63,785 | A |
The Finish Line Inc. | | 28,250 | | | 187,015 | |
The Wet Seal Inc. | | 52,600 | | | 176,736 | A |
West Marine Inc. | | 9,600 | | | 51,360 | A |
| | | | | | |
| | | | | 2,798,653 | |
| | | | | | |
| | |
Textiles, Apparel and Luxury Goods — 0.7% | | | | | | |
Columbia Sportswear Co. | | 2,940 | | | 87,965 | |
K-Swiss Inc. | | 6,030 | | | 51,496 | |
Maidenform Brands Inc. | | 16,540 | | | 151,507 | A |
R.G. Barry Corp. | | 3,200 | | | 19,168 | A |
Skechers U.S.A. Inc. | | 2,860 | | | 19,076 | A |
| | | | | | |
| | | | | 329,212 | |
| | | | | | |
| | |
Consumer Staples — 3.4% | | | | | | |
Food and Staples Retailing — 0.8% | | | | | | |
Ingles Markets Inc. | | 7,100 | | | 106,003 | |
The Andersons Inc. | | 5,510 | | | 77,912 | |
Winn-Dixie Stores Inc. | | 19,800 | | | 189,288 | A |
| | | | | | |
| | | | | 373,203 | |
| | | | | | |
| | |
Food Products — 0.9% | | | | | | |
Cal-Maine Foods Inc. | | 11,600 | | | 259,724 | |
Del Monte Foods Co. | | 17,080 | | | 124,513 | |
Imperial Sugar Co. | | 5,000 | | | 35,950 | |
John B. Sanfilippo and Son Inc. | | 4,400 | | | 23,496 | A |
Overhill Farms Inc. | | 6,700 | | | 25,594 | A |
| | | | | | |
| | | | | 469,277 | |
| | | | | | |
| | |
Household Products — 0.1% | | | | | | |
Central Garden and Pet Co., Class A Shares | | 5,700 | | | 42,864 | A |
| | | | | | |
| | |
Personal Products — 0.8% | | | | | | |
Elizabeth Arden Inc. | | 2,740 | | | 15,974 | A |
| | |
42 | | Annual Report to Shareholders |
Portfolio of Investments — Continued
U.S. Small-Capitalization Value Trust — Continued
| | | | | | |
| | | Shares | | Value | |
| | | | | | |
Consumer Staples — Continued | | | | | | |
Personal Products — Continued | | | | | | |
NBTY Inc. | | 13,120 | | $ | 184,730 | A |
Nutraceutical International Corp. | | 9,390 | | | 62,913 | A |
Prestige Brands Holdings Inc. | | 27,200 | | | 140,896 | A |
Schiff Nutrition International Inc. | | 3,140 | | | 14,130 | A |
| | | | | | |
| | | | | 418,643 | |
| | | | | | |
| | |
Tobacco — 0.8% | | | | | | |
Alliance One International Inc. | | 20,100 | | | 77,184 | A |
Universal Corp. | | 10,360 | | | 309,971 | |
| | | | | | |
| | | | | 387,155 | |
| | | | | | |
| | |
Energy — 2.5% | | | | | | |
Energy Equipment and Services — 1.4% | | | | | | |
Bristow Group Inc. | | 7,840 | | | 168,011 | A |
Cal Dive International Inc. | | 38,295 | | | 259,257 | A |
Gulfmark Offshore Inc. | | 12,090 | | | 288,468 | A |
| | | | | | |
| | | | | 715,736 | |
| | | | | | |
| | |
Oil, Gas and Consumable Fuels — 1.1% | | | | | | |
Adams Resources and Energy Inc. | | 1,300 | | | 18,213 | |
GeoResources Inc. | | 2,700 | | | 18,144 | A |
Overseas Shipholding Group Inc. | | 2,400 | | | 54,408 | |
USEC Inc. | | 60,700 | | | 291,360 | A |
World Fuel Services Corp. | | 4,700 | | | 148,661 | |
| | | | | | |
| | | | | 530,786 | |
| | | | | | |
| | |
Financials — 30.8% | | | | | | |
Capital Markets — 1.8% | | | | | | |
Cowen Group Inc. | | 5,500 | | | 26,785 | A |
Evercore Partners Inc. | | 6,500 | | | 100,425 | |
FBR Capital Markets Corp. | | 33,500 | | | 110,215 | A |
JMP Group Inc. | | 1,600 | | | 7,696 | |
LaBranche Co. Inc. | | 23,600 | | | 88,264 | A |
Penson Worldwide Inc. | | 10,700 | | | 68,801 | A |
Piper Jaffray Cos. Inc. | | 10,300 | | | 265,637 | A |
Sanders Morris Harris Group Inc. | | 15,260 | | | 59,514 | |
| | |
Annual Report to Shareholders | | 43 |
| | | | | | |
| | | Shares | | Value | |
| | | | | | |
Financials — Continued | | | | | | |
Capital Markets — Continued | | | | | | |
Thomas Weisel Partners Group Inc. | | 14,000 | | $ | 50,120 | A |
TradeStation Group Inc. | | 12,180 | | | 80,388 | A |
| | | | | | |
| | | | | 857,845 | |
| | | | | | |
| | |
Commercial Banks — 7.0% | | | | | | |
American National Bankshares Inc. | | 1,600 | | | 24,960 | |
Ameris Bancorp | | 4,840 | | | 22,796 | |
BancTrust Financial Group Inc. | | 9,500 | | | 60,135 | |
Camden National Corp. | | 10,740 | | | 245,409 | |
Cathay General Bancorp | | 13,800 | | | 143,934 | |
Center Financial Corp. | | 6,500 | | | 18,330 | |
Central Pacific Financial Corp. | | 10,400 | | | 58,240 | |
CoBiz Financial Inc. | | 9,700 | | | 50,925 | |
East West Bancorp Inc. | | 30,000 | | | 137,100 | |
F.N.B. Corp. | | 12,700 | | | 97,409 | |
First M&F Corp. | | 9,766 | | | 59,768 | |
First Merchants Corp. | | 6,850 | | | 73,912 | |
First Midwest Bancorp Inc. | | 8,090 | | | 69,493 | |
First United Corp. | | 7,386 | | | 61,895 | |
Firstbank Corp. | | 1,091 | | | 5,466 | |
German American Bancorp Inc. | | 3,325 | | | 39,734 | |
Greene Bancshares Inc. | | 5,143 | | | 45,258 | |
International Bancshares Corp. | | 200 | | | 1,560 | |
MB Financial Inc. | | 4,900 | | | 66,640 | |
Merchants Bancshares Inc. | | 1,940 | | | 35,890 | |
National Penn Bancshares Inc. | | 20,743 | | | 172,167 | |
Northrim BanCorp Inc. | | 8,060 | | | 80,358 | |
Pacific Capital Bancorp | | 7,910 | | | 53,551 | |
Peoples Bancorp Inc. | | 10,568 | | | 137,173 | |
Preferred Bank | | 5,400 | | | 28,296 | |
Provident Bankshares Corp. | | 11,400 | | | 80,370 | |
Renasant Corp. | | 11,422 | | | 143,460 | |
Sierra Bancorp | | 5,340 | | | 51,958 | |
Southwest Bancorp Inc. | | 9,560 | | | 89,673 | |
StellarOne Corp. | | 5,400 | | | 64,314 | |
Sun Bancorp Inc | | 8,576 | | | 44,509 | A |
| | |
44 | | Annual Report to Shareholders |
Portfolio of Investments — Continued
U.S. Small-Capitalization Value Trust — Continued
| | | | | | |
| | | Shares | | Value | |
| | | | | | |
Financials — Continued | | | | | | |
Commercial Banks — Continued | | | | | | |
Susquehanna Bancshares Inc. | | 21,840 | | $ | 203,767 | |
UCBH Holdings Inc. | | 19,700 | | | 29,747 | |
Umpqua Holdings Corp. | | 32,800 | | | 297,168 | |
United Community Banks Inc. | | 8,355 | | | 34,756 | |
WesBanco Inc. | | 3,470 | | | 79,220 | |
Whitney Holding Corp. | | 33,670 | | | 385,521 | |
Wilshire Bancorp Inc. | | 5,000 | | | 25,800 | |
Wintrust Financial Corp. | | 7,390 | | | 90,897 | |
| | | | | | |
| | | | | 3,411,559 | |
| | | | | | |
| | |
Consumer Finance — 1.9% | | | | | | |
AmeriCredit Corp. | | 40,170 | | | 235,396 | A |
Cash America International Inc. | | 5,800 | | | 90,828 | |
Credit Acceptance Corp. | | 12,460 | | | 267,766 | A |
Dollar Financial Corp. | | 6,760 | | | 64,355 | A |
Nelnet Inc. | | 15,770 | | | 139,407 | A |
World Acceptance Corp. | | 6,340 | | | 108,414 | A |
| | | | | | |
| | | | | 906,166 | |
| | | | | | |
| | |
Diversified Financial Services — 0.7% | | | | | | |
Asset Acceptance Capital Corp. | | 11,010 | | | 58,463 | A |
Encore Capital Group Inc. | | 11,300 | | | 51,189 | A |
Medallion Financial Corp. | | 9,520 | | | 70,543 | |
PHH Corp. | | 12,700 | | | 178,435 | A |
| | | | | | |
| | | | | 358,630 | |
| | | | | | |
| | |
Insurance — 16.9% | | | | | | |
American Equity Investment Life Holding Co. | | 49,380 | | | 205,421 | |
American Physicians Capital Inc. | | 2,890 | | | 118,259 | |
American Physicians Service Group Inc. | | 3,924 | | | 75,223 | |
American Safety Insurance Holdings Ltd. | | 5,600 | | | 64,456 | A |
Amerisafe Inc. | | 10,200 | | | 156,264 | A |
Amtrust Financial Services Inc. | | 32,700 | | | 312,285 | |
Argo Group International Holdings Ltd. | | 16,792 | | | 505,943 | A |
Baldwin and Lyons Inc. | | 3,830 | | | 72,464 | |
CNA Surety Corp. | | 40,170 | | | 740,735 | A |
| | |
Annual Report to Shareholders | | 45 |
| | | | | | |
| | | Shares | | Value | |
| | | | | | |
Financials — Continued | | | | | | |
Insurance — Continued | | | | | | |
Delphi Financial Group Inc. | | 39,155 | | $ | 527,026 | |
Donegal Group Inc. | | 572 | | | 8,666 | |
Eastern Insurance Holdings Inc. | | 2,680 | | | 20,824 | |
EMC Insurance Group Inc. | | 3,852 | | | 81,162 | |
Employers Holdings Inc. | | 26,600 | | | 253,764 | |
First Acceptance Corp. | | 21,200 | | | 51,304 | A |
First Mercury Financial Corp. | | 7,700 | | | 111,188 | A |
Flagstone Reinsurance Holdings Ltd. | | 43,500 | | | 338,865 | |
FPIC Insurance Group Inc. | | 2,410 | | | 89,242 | A |
Hallmark Financial Services Inc. | | 11,350 | | | 78,655 | A |
Hilltop Holdings Inc. | | 5,000 | | | 57,000 | A |
Horace Mann Educators Corp. | | 15,670 | | | 131,158 | |
Infinity Property and Casualty Corp. | | 9,240 | | | 313,513 | |
IPC Holdings Ltd. | | 9,190 | | | 248,498 | |
Max Capital Group Ltd. | | 18,240 | | | 314,458 | |
Meadowbrook Insurance Group Inc. | | 43,060 | | | 262,666 | |
Mercer Insurance Group Inc. | | 1,730 | | | 24,722 | |
Montpelier Re Holdings Ltd. | | 14,270 | | | 184,939 | |
National Western Life Insurance Co. | | 2,920 | | | 329,960 | |
Navigators Group Inc. | | 6,670 | | | 314,690 | A |
Nymagic Inc. | | 7,480 | | | 91,256 | |
OneBeacon Insurance Group Ltd. | | 6,500 | | | 62,790 | |
PMA Capital Corp. | | 17,410 | | | 72,600 | A |
Presidential Life Corp. | | 29,960 | | | 233,388 | |
Safety Insurance Group Inc. | | 20,305 | | | 631,079 | |
SeaBright Insurance Holdings | | 11,680 | | | 122,173 | A |
Selective Insurance Group Inc. | | 2,410 | | | 29,306 | |
Specialty Underwriters’ Alliance Inc. | | 5,850 | | | 21,235 | A |
Stewart Information Services Corp. | | 9,900 | | | 193,050 | |
Tower Group Inc. | | 7,000 | | | 172,410 | |
Unico American Corp. | | 4,750 | | | 35,625 | A |
United America Indemnity Ltd. | | 10,360 | | | 41,647 | A |
United Fire and Casualty Co. | | 13,176 | | | 289,345 | |
Universal Insurance Holdings Inc. | | 16,925 | | | 63,638 | |
| | |
46 | | Annual Report to Shareholders |
Portfolio of Investments — Continued
U.S. Small-Capitalization Value Trust — Continued
| | | | | | |
| | | Shares | | Value | |
| | | | | | |
Financials — Continued | | | | | | |
Insurance — Continued | | | | | | |
Zenith National Insurance Corp. | | 10,380 | | $ | 250,262 | |
| | | | | | |
| | | | | 8,303,154 | |
| | | | | | |
| | |
Real Estate Management and Development —N.M. | | | | | | |
Market Leader Inc. | | 7,400 | | | 10,878 | A |
| | | | | | |
| | |
Thrifts and Mortgage Finance — 2.5% | | | | | | |
Abington Bancorp Inc. | | 9,970 | | | 82,551 | |
BankFinancial Corp. | | 5,300 | | | 52,841 | |
Berkshire Hills Bancorp Inc. | | 6,670 | | | 152,876 | |
First Financial Holdings Inc. | | 3,740 | | | 28,611 | |
Home Federal Bancorp Inc | | 4,830 | | | 42,166 | |
Legacy Bancorp Inc. | | 2,500 | | | 23,925 | |
NewAlliance Bancshares Inc. | | 17,420 | | | 204,511 | |
Parkvale Financial Corp. | | 7,850 | | | 86,193 | |
Provident Financial Services Inc. | | 32,500 | | | 351,325 | |
Washington Federal Inc. | | 16,837 | | | 223,764 | |
| | | | | | |
| | | | | 1,248,763 | |
| | | | | | |
| | |
Health Care — 3.9% | | | | | | |
Health Care Equipment and Supplies — 0.3% | | | | | | |
AngioDynamics Inc. | | 6,600 | | | 74,184 | A |
Cardiac Science Corp. | | 9,810 | | | 29,528 | A |
HealthTronics Inc. | | 11,810 | | | 16,062 | A |
Invacare Corp. | | 2,700 | | | 43,281 | |
| | | | | | |
| | | | | 163,055 | |
| | | | | | |
| | |
Health Care Providers and Services — 3.3% | | | | | | |
Allion Healthcare Inc. | | 5,900 | | | 27,140 | A |
Cross Country Healthcare Inc. | | 16,800 | | | 110,040 | A |
Healthspring Inc. | | 31,900 | | | 267,003 | A |
Kindred Healthcare Inc. | | 12,100 | | | 180,895 | A |
LifePoint Hospitals Inc. | | 24,830 | | | 517,954 | A |
Molina Healthcare Inc. | | 5,500 | | | 104,610 | A |
PDI Inc. | | 7,690 | | | 23,377 | A |
| | |
Annual Report to Shareholders | | 47 |
| | | | | | |
| | | Shares | | Value | |
| | | | | | |
Health Care — Continued | | | | | | |
Health Care Providers and Services —Continued | | | | | | |
Universal American Financial Corp. | | 44,200 | | $ | 374,374 | A |
| | | | | | |
| | | | | 1,605,393 | |
| | | | | | |
| | |
Health Care Technology — N.M. | | | | | | |
AMICAS Inc. | | 6,400 | | | 12,992 | A |
| | | | | | |
| | |
Pharmaceuticals — 0.3% | | | | | | |
Hi-Tech Pharmacal Co. Inc. | | 2,200 | | | 12,540 | A |
ViroPharma Inc. | | 23,400 | | | 122,850 | A |
| | | | | | |
| | | | | 135,390 | |
| | | | | | |
| | |
Industrials — 20.8% | | | | | | |
Aerospace and Defense — 1.6% | | | | | | |
AAR Corp. | | 12,700 | | | 159,258 | A |
Astronics Corp. | | 3,800 | | | 41,800 | A |
Ceradyne Inc. | | 10,300 | | | 186,739 | A |
Esterline Technologies Corp. | | 4,500 | | | 90,855 | A |
Herley Industries Inc. | | 3,380 | | | 40,425 | A |
Kratos Defense and Security Solutions Inc. | | 11,100 | | | 8,658 | A |
Triumph Group Inc. | | 6,900 | | | 263,580 | |
| | | | | | |
| | | | | 791,315 | |
| | | | | | |
| | |
Airlines — 1.3% | | | | | | |
Republic Airways Holdings Inc. | | 18,570 | | | 120,334 | A |
SkyWest Inc. | | 40,550 | | | 504,442 | |
| | | | | | |
| | | | | 624,776 | |
| | | | | | |
| | |
Building Products — 2.1% | | | | | | |
Apogee Enterprises Inc. | | 11,900 | | | 130,662 | |
Armstrong World Industries Inc. | | 15,500 | | | 170,655 | A |
Griffon Corp. | | 33,434 | | | 250,755 | A |
Insteel Industries Inc. | | 7,700 | | | 53,592 | |
Universal Forest Products Inc. | | 15,710 | | | 418,043 | |
| | | | | | |
| | | | | 1,023,707 | |
| | | | | | |
| | |
48 | | Annual Report to Shareholders |
Portfolio of Investments — Continued
U.S. Small-Capitalization Value Trust — Continued
| | | | | | |
| | | Shares | | Value | |
| | | | | | |
Industrials — Continued | | | | | | |
Commercial Services and Supplies — 3.6% | | | | | | |
ATC Technology Corp. | | 6,575 | | $ | 73,640 | A |
Comfort Systems USA Inc. | | 13,400 | | | 138,958 | |
Deluxe Corp. | | 15,100 | | | 145,413 | |
Ennis Inc. | | 16,510 | | | 146,279 | |
G & K Services Inc. | | 3,711 | | | 70,175 | |
GeoEye Inc. | | 5,090 | | | 100,527 | A |
Herman Miller Inc. | | 16,710 | | | 178,129 | |
ICT Group Inc. | | 4,300 | | | 23,951 | A |
Kimball International Inc. | | 14,607 | | | 95,822 | |
Knoll Inc. | | 20,100 | | | 123,213 | |
North American Galvanizing and Coating Inc. | | 9,099 | | | 27,479 | A |
RSC Holdings Inc. | | 56,400 | | | 296,664 | A |
United Stationers Inc. | | 12,770 | | | 358,581 | A |
WCA Waste Corp. | | 1,000 | | | 1,650 | A |
| | | | | | |
| | | | | 1,780,481 | |
| | | | | | |
| | |
Construction and Engineering — 0.4% | | | | | | |
Dycom Industries Inc. | | 10,200 | | | 59,058 | A |
EMCOR Group Inc. | | 8,700 | | | 149,379 | A |
| | | | | | |
| | | | | 208,437 | |
| | | | | | |
| | |
Electrical Equipment — 3.1% | | | | | | |
A.O. Smith Corp. | | 14,800 | | | 372,664 | |
Acuity Brands Inc. | | 10,580 | | | 238,473 | |
AZZ Inc. | | 7,000 | | | 184,730 | A |
Baldor Electric Co. | | 5,400 | | | 78,246 | |
Belden CDT Inc. | | 4,000 | | | 50,040 | |
LaBarge Inc. | | 6,600 | | | 55,242 | A |
Ocean Power Technologies Inc. | | 5,500 | | | 36,300 | A |
Regal-Beloit Corp. | | 16,880 | | | 517,203 | |
| | | | | | |
| | | | | 1,532,898 | |
| | | | | | |
| | |
Machinery — 3.0% | | | | | | |
Actuant Corp. | | 4,900 | | | 50,617 | |
Alamo Group Inc. | | 5,470 | | | 58,310 | |
American Railcar Industries Inc. | | 5,280 | | | 40,286 | |
| | |
Annual Report to Shareholders | | 49 |
| | | | | | |
| | | Shares | | Value | |
| | | | | | |
Industrials — Continued | | | | | | |
Machinery — Continued | | | | | | |
Astec Industries Inc. | | 7,000 | | $ | 183,610 | A |
Barnes Group Inc. | | 10,900 | | | 116,521 | |
Cascade Corp. | | 4,000 | | | 70,520 | |
CIRCOR International Inc. | | 3,500 | | | 78,820 | |
Columbus McKinnon Corp. | | 5,820 | | | 50,750 | A |
Hurco Cos. Inc. | | 560 | | | 5,953 | A |
Middleby Corp. | | 2,100 | | | 68,103 | A |
Miller Industries Inc. | | 6,500 | | | 42,250 | A |
Mueller Industries Inc. | | 23,920 | | | 518,825 | |
NACCO Industries Inc. | | 600 | | | 16,308 | |
Watts Water Technologies Inc. | | 7,500 | | | 146,700 | |
| | | | | | |
| | | | | 1,447,573 | |
| | | | | | |
| | |
Marine — 0.2% | | | | | | |
International Shipholding Corp. | | 4,000 | | | 78,680 | |
| | | | | | |
| | |
Professional Services — 2.3% | | | | | | |
Barrett Business Services Inc. | | 2,100 | | | 20,202 | |
Heidrick and Struggles International Inc. | | 6,920 | | | 122,761 | |
Kelly Services Inc. | | 11,640 | | | 93,702 | |
Korn/Ferry International | | 19,100 | | | 173,046 | A |
MPS Group Inc. | | 37,610 | | | 223,780 | A |
School Specialty Inc. | | 7,960 | | | 140,016 | A |
TrueBlue Inc. | | 27,350 | | | 225,637 | A |
Volt Information Sciences Inc. | | 11,310 | | | 75,212 | A |
VSE Corp. | | 2,100 | | | 56,070 | |
| | | | | | |
| | | | | 1,130,426 | |
| | | | | | |
| | |
Road and Rail — 1.4% | | | | | | |
Arkansas Best Corp. | | 4,310 | | | 81,976 | |
Con-way Inc. | | 23,650 | | | 424,044 | |
Frozen Food Express Industries Inc. | | 9,320 | | | 27,960 | |
P.A.M. Transportation Services Inc. | | 3,380 | | | 18,556 | A |
Saia Inc. | | 10,330 | | | 123,444 | A |
USA Truck Inc. | | 444 | | | 5,741 | A |
| | | | | | |
| | | | | 681,721 | |
| | | | | | |
| | |
50 | | Annual Report to Shareholders |
Portfolio of Investments — Continued
U.S. Small-Capitalization Value Trust — Continued
| | | | | | |
| | | Shares | | Value | |
| | | | | | |
Industrials — Continued | | | | | | |
Trading Companies and Distributors — 1.8% | | | | | | |
Applied Industrial Technologies Inc. | | 11,820 | | $ | 199,403 | |
BlueLinx Holdings Inc. | | 8,200 | | | 21,402 | A |
DXP Enterprises Inc. | | 7,000 | | | 72,310 | A |
GATX Corp. | | 11,430 | | | 231,229 | |
Houston Wire & Cable Co. | | 3,040 | | | 23,560 | |
Interline Brands Inc. | | 3,650 | | | 30,770 | A |
Rush Enterprises Inc. | | 6,290 | | | 56,107 | A |
TAL International Group Inc. | | 2,620 | | | 19,178 | |
WESCO International Inc. | | 11,100 | | | 201,132 | A |
Willis Lease Finance Corp. | | 2,320 | | | 24,546 | A |
| | | | | | |
| | | | | 879,637 | |
| | | | | | |
| | |
Information Technology — 14.2% | | | | | | |
Communications Equipment — 2.2% | | | | | | |
Avocent Corp. | | 8,700 | | | 105,618 | A |
Bel Fuse Inc. | | 2,500 | | | 33,600 | |
Black Box Corp. | | 9,800 | | | 231,378 | |
Communications Systems Inc. | | 2,400 | | | 18,384 | |
Globecomm Systems Inc. | | 8,800 | | | 50,952 | A |
Harris Stratex Networks Inc. | | 11,100 | | | 42,735 | A |
Loral Space and Communications Inc. | | 2,400 | | | 51,264 | A |
Oplink Communications Inc. | | 11,100 | | | 85,470 | A |
PC-Tel Inc. | | 9,900 | | | 42,570 | |
Sycamore Networks Inc. | | 121,460 | | | 324,298 | A |
Symmetricom Inc. | | 22,724 | | | 79,534 | A |
Tollgrade Communications Inc. | | 5,100 | | | 29,580 | A |
| | | | | | |
| | | | | 1,095,383 | |
| | | | | | |
| | |
Computers and Peripherals — 1.2% | | | | | | |
Adaptec Inc. | | 68,300 | | | 163,920 | A |
Electronics for Imaging Inc. | | 20,200 | | | 197,960 | A |
Imation Corp. | | 14,700 | | | 112,455 | |
Rackable Systems Inc. | | 4,960 | | | 20,138 | A |
Super Micro Computer Inc. | | 18,900 | | | 92,988 | A |
| | | | | | |
| | | | | 587,461 | |
| | | | | | |
| | |
Annual Report to Shareholders | | 51 |
| | | | | | |
| | | Shares | | Value | |
| | | | | | |
Information Technology — Continued | | | | | | |
Electronic Equipment, Instruments &
Components — 5.5% | | | | | | |
Benchmark Electronics Inc. | | 49,290 | | $ | 552,048 | A |
Coherent Inc. | | 2,560 | | | 44,160 | A |
CPI International Inc. | | 8,980 | | | 84,412 | A |
CTS Corp. | | 5,290 | | | 19,097 | |
DDi Corp. | | 7,020 | | | 21,622 | A |
Electro Scientific Industries Inc. | | 7,710 | | | 45,643 | A |
Methode Electronics Inc. | | 4,300 | | | 15,394 | |
Multi-Fineline Electronix Inc. | | 7,900 | | | 133,036 | A |
Newport Corp. | | 5,400 | | | 23,868 | A |
PC Connection Inc. | | 8,800 | | | 33,440 | A |
Plexus Corp. | | 12,000 | | | 165,840 | A |
RadiSys Corp. | | 8,920 | | | 54,055 | A |
Richardson Electronics Ltd. | | 8,300 | | | 28,054 | |
Spectrum Control Inc. | | 5,000 | | | 35,150 | A |
SYNNEX Corp. | | 34,480 | | | 678,222 | A |
Tech Data Corp. | | 27,260 | | | 593,723 | A |
TTM Technologies Inc. | | 13,400 | | | 77,720 | A |
Vishay Intertechnology Inc. | | 14,715 | | | 51,208 | A |
Zygo Corp. | | 6,000 | | | 27,540 | A |
| | | | | | |
| | | | | 2,684,232 | |
| | | | | | |
| | |
Internet Software and Services — 1.7% | | | | | | |
Earthlink Inc. | | 45,400 | | | 298,278 | A |
Internap Network Services Corp. | | 27,400 | | | 73,706 | A |
Keynote Systems Inc. | | 4,600 | | | 36,478 | A |
RealNetworks Inc. | | 10,320 | | | 24,045 | A |
Spark Networks Inc. | | 9,100 | | | 20,475 | A |
United Online Inc. | | 61,580 | | | 274,647 | |
Vignette Corp. | | 12,900 | | | 86,172 | A |
| | | | | | |
| | | | | 813,801 | |
| | | | | | |
| | |
IT Services — 0.7% | | | | | | |
Ciber Inc. | | 26,600 | | | 72,618 | A |
Computer Task Group Inc. | | 2,890 | | | 9,971 | A |
Convergys Corp. | | 3,800 | | | 30,704 | A |
| | |
52 | | Annual Report to Shareholders |
Portfolio of Investments — Continued
U.S. Small-Capitalization Value Trust — Continued
| | | | | | |
| | | Shares | | Value | |
| | | | | | |
Information Technology — Continued | | | | | | |
IT Services — Continued | | | | | | |
CSG Systems International Inc. | | 10,700 | | $ | 152,796 | A |
infoGROUP Inc. | | 2,700 | | | 11,232 | A |
Ness Technologies Inc. | | 6,440 | | | 18,998 | A |
TechTeam Global Inc. | | 3,700 | | | 18,056 | A |
The Hackett Group Inc. | | 17,400 | | | 35,148 | A |
Tier Technologies Inc. | | 3,180 | | | 14,723 | A |
| | | | | | |
| | | | | 364,246 | |
| | | | | | |
| | |
Semiconductors and Semiconductor
Equipment — 2.7% | | | | | | |
Applied Micro Circuits Corp. | | 2,000 | | | 9,720 | A |
Brooks Automation Inc. | | 19,400 | | | 89,434 | A |
California Micro Devices Corp. | | 3,800 | | | 9,234 | A |
DSP Group Inc. | | 8,500 | | | 36,720 | A |
Exar Corp. | | 13,100 | | | 81,744 | A |
GSI Technology Inc. | | 10,960 | | | 27,181 | A |
Integrated Device Technology Inc. | | 68,800 | | | 313,040 | A |
International Rectifier Corp. | | 6,400 | | | 86,464 | A |
MKS Instruments Inc. | | 38,360 | | | 562,741 | A |
Omnivision Technologies Inc. | | 2,600 | | | 17,472 | A |
Silicon Storage Technology Inc. | | 31,100 | | | 51,315 | A |
White Electronic Designs Corp. | | 8,920 | | | 35,769 | A |
| | | | | | |
| | | | | 1,320,834 | |
| | | | | | |
| | |
Software — 0.2% | | | | | | |
Catapult Communications Corp. | | 4,200 | | | 29,274 | A |
Dynamics Research Corp. | | 2,580 | | | 18,679 | A |
Pervasive Software Inc. | | 3,080 | | | 12,012 | A |
Versant Corp. | | 1,989 | | | 34,191 | A |
| | | | | | |
| | | | | 94,156 | |
| | | | | | |
| | |
Materials — 3.6% | | | | | | |
Chemicals — 2.5% | | | | | | |
GenTek Inc. | | 5,481 | | | 95,863 | A |
Innophos Holdings Inc. | | 2,400 | | | 27,072 | |
Koppers Holdings Inc. | | 2,400 | | | 34,848 | |
| | |
Annual Report to Shareholders | | 53 |
| | | | | | |
| | | Shares | | Value | |
| | | | | | |
Materials — Continued | | | | | | |
Chemicals — Continued | | | | | | |
NewMarket Corp. | | 3,400 | | $ | 150,620 | |
Olin Corp. | | 43,030 | | | 614,038 | |
Westlake Chemical Corp. | | 19,380 | | | 283,529 | |
| | | | | | |
| | | | | 1,205,970 | |
| | | | | | |
| | |
Metals and Mining — 0.8% | | | | | | |
Gibraltar Industries Inc. | | 2,252 | | | 10,629 | |
Schnitzer Steel Industries Inc. | | 3,300 | | | 103,587 | |
Worthington Industries Inc. | | 33,750 | | | 293,963 | |
| | | | | | |
| | | | | 408,179 | |
| | | | | | |
| | |
Paper and Forest Products — 0.3% | | | | | | |
Glatfelter | | 10,500 | | | 65,520 | |
Schweitzer-Mauduit International Inc. | | 3,360 | | | 62,026 | |
| | | | | | |
| | | | | 127,546 | |
| | | | | | |
| | |
Telecommunication Services — 0.3% | | | | | | |
Diversified Telecommunication
Services — 0.3% | | | | | | |
Cincinnati Bell Inc. | | 19,270 | | | 44,321 | A |
D&E Communications Inc. | | 7,800 | | | 41,886 | |
SureWest Communications | | 7,600 | | | 59,280 | |
| | | | | | |
| | | | | 145,487 | |
| | | | | | |
| | |
Utilities — 3.7% | | | | | | |
Electric Utilities — 2.1% | | | | | | |
El Paso Electric Co. | | 8,300 | | | 116,947 | A |
IDACORP Inc. | | 19,370 | | | 452,483 | |
Portland General Electric Co. | | 25,510 | | | 448,721 | |
| | | | | | |
| | | | | 1,018,151 | |
| | | | | | |
| | |
Gas Utilities — 0.1% | | | | | | |
Southwest Gas Corp. | | 2,130 | | | 44,879 | |
| | | | | | |
| | |
Multi-Utilities — 1.5% | | | | | | |
Avista Corp. | | 12,250 | | | 168,805 | |
Black Hills Corp. | | 10,020 | | | 179,258 | |
| | |
54 | | Annual Report to Shareholders |
Portfolio of Investments — Continued
U.S. Small-Capitalization Value Trust — Continued
| | | | | | |
| | | Shares | | Value | |
| | | | | | |
Utilities — Continued | | | | | | |
Multi-Utilities — Continued | | | | | | |
PNM Resources Inc. | | 47,200 | | $ | 389,872 | |
| | | | | | |
| | | | | 737,935 | |
| | | | | | |
Total Common Stocks and Equity Interests
(Cost — $69,003,619) | | | 48,342,204 | |
| | |
Rights — N.M. | | | | | | |
Financials — N.M. | | | | | | |
Insurance — N.M. | | | | | | |
United America Indemnity Ltd. (Cost — $0) | | 10,360 | | | 4,855 | A |
Total Investments — 98.6% (Cost — $69,003,619)B | | | 48,347,059 | |
Other Assets Less Liabilities — 1.4% | | | | | 695,017 | |
| | | | | | |
| | |
Net Assets — 100.0% | | | | $ | 49,042,076 | |
| | | | | | |
B | At March 31, 2009, the aggregate gross unrealized appreciation and depreciation of investments for federal income tax purposes were as follows: |
| | | | |
| Gross unrealized appreciation | | $ | 1,714,571 | |
| Gross unrealized depreciation | | | (22,443,540 | ) |
| | | | |
| Net unrealized depreciation | | $ | (20,728,969 | ) |
| | | | |
See notes to financial statements.
| | |
Annual Report to Shareholders | | 55 |
Statement of Assets and Liabilities
U.S. Small-Capitalization Value Trust
March 31, 2009
| | | | | | | |
Assets: | | | | | | | |
Investment securities, at value
(Cost – $69,003,619) | | | | | $ | 48,347,059 | |
Cash | | | | | | 1,081,522 | |
Receivable for fund shares sold | | | | | | 86,778 | |
Receivable for securities sold | | | | | | 51,199 | |
Dividends receivable | | | | | | 32,105 | |
| | | | | | | |
Total assets | | | | | | 49,598,663 | |
Liabilities: | | | | | | | |
Payable for securities purchased | | $ | 260,692 | | | | |
Payable for fund shares repurchased | | | 140,995 | | | | |
Accrued distribution and service fees | | | 31,067 | | | | |
Accrued management fee | | | 11,343 | | | | |
Accrued expenses | | | 112,490 | | | | |
| | | | | | | |
Total liabilities | | | | | | 556,587 | |
| | | | | | | |
Net Assets | | | | | $ | 49,042,076 | |
| | | | | | | |
Net assets consist of: | | | | | | | |
Accumulated paid-in-capital | | | | | $ | 96,769,155 | |
Overdistributed net investment income | | | | | | (76,982 | ) |
Accumulated net realized loss on investments and foreign currency transactions | | | | | | (26,993,537 | ) |
Net unrealized depreciation of investments | | | | | | (20,656,560 | ) |
| | | | | | | |
Net Assets | | | | | $ | 49,042,076 | |
| | | | | | | |
Net Asset Value Per Share: | | | | | | | |
Class A (and redemption price) (379,025 shares outstanding) | | | | | | $5.52 | |
Class CA,B (6,948,579 shares outstanding) | | | | | | $5.51 | |
Institutional Class (and redemption price) (1,356,529 shares outstanding) | | | $6.37 | |
Maximum Public Offering Price Per Share: | | | | | | | |
Class A (based on maximum initial sales charge of 5.75%) | | | | | | $5.86 | |
| | | | | | | | |
A | On February 1, 2009, Primary Class shares were renamed Class C shares. |
B | Redemption price per share is NAV of Class C shares reduced by 1.00% CDSC, if shares are redeemed within one year from purchase payment. |
See notes to financial statements.
| | |
56 | | Annual Report to Shareholders |
Statement of Operations
U.S. Small-Capitalization Value Trust
For the Year Ended March 31, 2009
| | | | | | | | |
Investment Income: | | | | | | | | |
Dividends | | $ | 1,603,946 | | | | | |
Interest | | | 22,215 | | | | | |
Less: Foreign taxes withheld | | | (140 | ) | | | | |
| | | | | | | | |
Total income | | | | | | $ | 1,626,021 | |
Expenses: | | | | | | | | |
Management fees | | | 722,679 | | | | | |
Distribution and service fees: | | | | | | | | |
Class AA | | | 777 | | | | | |
Class CB | | | 714,022 | | | | | |
Audit and legal fees | | | 42,172 | | | | | |
Custodian fees | | | 42,004 | | | | | |
Directors’ fees and expenses | | | 43,771 | | | | | |
Registration fees | | | 39,385 | | | | | |
Reports to shareholders: | | | | | | | | |
Class AA | | | 275 | | | | | |
Class CB | | | 81,509 | | | | | |
Institutional Class | | | 6,507 | | | | | |
Transfer agent and shareholder servicing expense: | | | | | | | | |
Class AA | | | 500 | | | | | |
Class CB | | | 70,236 | | | | | |
Institutional Class | | | 18,609 | | | | | |
Other expenses | | | 38,356 | | | | | |
| | | | | | | | |
| | | 1,820,802 | | | | | |
Less: Fee waivers and/or expense reimbursements (Note 3) | | | (255,439 | ) | | | | |
Compensating balance credits | | | (281 | ) | | | | |
| | | | | | | | |
Net expenses | | | | | | | 1,565,082 | |
| | | | | | | | |
Net Investment Income | | | | | | | 60,939 | |
Net realized loss on: | | | | | | | | |
Investments | | | (26,990,899 | ) | | | | |
Foreign currency transactions | | | (51 | ) | | | | |
| | | | | | | | |
| | | | | | | (26,990,950 | ) |
Change in unrealized appreciation/(depreciation) of: | | | | | | | | |
Investments | | | | | | | (12,916,768 | ) |
| | | | | | | | |
Net Realized and Unrealized Loss on Investments | | | | | | | (39,907,718 | ) |
Change in Net Assets Resulting From Operations | | | | | | $ | (39,846,779 | ) |
A | For the period February 3, 2009 (commencement of operations) to March 31, 2009. |
B | On February 1, 2009, Primary Class shares were renamed Class C shares. |
See notes to financial statements.
| | |
Annual Report to Shareholders | | 57 |
Statement of Changes in Net Assets
U.S. Small-Capitalization Value Trust
| | | | | | | | |
| | | For the
Year Ended
March 31, 2009 | | | For the
Year Ended
March 31, 2008 | |
Change in Net Assets: | | | | | | | | |
Net investment income | | $ | 60,939 | | | $ | 514,176 | |
Net realized gain/(loss) | | | (26,990,950 | ) | | | 20,425,094 | |
Change in unrealized appreciation/(depreciation) | | | (12,916,768 | ) | | | (56,545,169 | ) |
Change in net assets resulting from operations | | | (39,846,779 | ) | | | (35,605,899 | ) |
Distributions to shareholders from: | | | | | | | | |
Net investment income: | | | | | | | | |
Class CA | | | (196,623 | ) | | | — | |
Institutional Class | | | (259,266 | ) | | | — | |
Net realized gain on investments: | | | | | | | | |
Class CA | | | (208,539 | ) | | | (23,950,967 | ) |
Institutional Class | | | (28,656 | ) | | | (3,985,324 | ) |
Change in net assets from fund share transactions: | | | | | | | | |
Class AB | | | 2,283,526 | | | | — | |
Class CA | | | (31,522,776 | ) | | | (49,660,316 | ) |
Institutional Class | | | (10,469,823 | ) | | | 673,996 | |
Change in net assets | | | (80,248,936 | ) | | | (112,528,510 | ) |
Net Assets: | | | | | | | | |
Beginning of year | | | 129,291,012 | | | | 241,819,522 | |
End of year | | $ | 49,042,076 | | | $ | 129,291,012 | |
(Overdistributed)/undistributed net investment income | | $ | (76,982 | ) | | $ | 318,019 | |
A | On February 1, 2009, Primary Class shares were renamed Class C shares. |
B | For the period February 3, 2009 (commencement of operations) to March 31, 2009. |
See notes to financial statements.
| | |
58 | | Annual Report to Shareholders |
Financial Highlights
U.S. Small-Capitalization Value Trust
For a share of each class of capital stock outstanding:
Class A :
| | | |
| | | Period Ended
March 31, | |
| | | 2009A | |
Net asset value, beginning of period | | $5.97 | |
Investment operations: | | | |
Net investment incomeB | | .01 | |
Net realized and unrealized loss | | (.46 | ) |
Total from investment operations | | (.45 | ) |
Net asset value, end of period | | $5.52 | |
Total returnC | | (7.54 | )% |
Ratios to Average Net Assets:D | | | |
Total expensesE | | 1.80 | % |
Expenses net of waivers and/or expense reimbursements, if anyE | | 1.25 | % |
Expenses net of all reductionsE | | 1.25 | % |
Net investment income | | .80 | % |
Supplemental Data: | | | |
Portfolio turnover rate | | 59.9 | % |
Net assets, end of period (in thousands) | | $2,091 | |
A | For the period February 3, 2009 (commencement of operations) to March 31, 2009. |
B | Computed using average daily shares outstanding. |
C | Performance figures, exclusive of sales charge, may reflect compensating balance credits, fee waivers and/or expense reimbursements. In the absence of compensating balance credits, fee waivers and/or expense reimbursements, the total return would have been lower. Past performance is no guarantee of future results. Total returns for periods of less than one year are not annualized. |
E | Total expenses reflects operating expenses prior to any voluntary expense waivers, expense reimbursements and/or compensating balance credits. Expenses net of waivers and/or expense reimbursements, reflect total expenses before compensating balance credits but net of any voluntary expense waivers and/or expense reimbursements. Expenses net of all reductions reflects expenses less any compensating balance credits, voluntary expense waivers and/or expense reimbursements. |
See notes to financial statements.
| | |
Annual Report to Shareholders | | 59 |
For a share of each class of capital stock outstanding:
Class CA:
| | | | | | | | | | | | | | | |
| | | Years Ended March 31, | |
| | | 2009 | | | 2008 | | | 2007 | | | 2006 | | | 2005 | |
Net asset value, beginning of year | | $9.50 | | | $13.73 | | | $14.51 | | | $14.43 | | | $14.52 | |
Investment operations: | | | | | | | | | | | | | | | |
Net investment income/(loss) | | (.01 | )B | | .01 | B | | (.02 | )B | | (.06 | ) | | (.05 | ) |
Net realized and unrealized gain/(loss) | | (3.94 | ) | | (2.30 | ) | | .98 | | | 1.77 | | | 1.38 | |
Total from investment operations | | (3.95 | ) | | (2.29 | ) | | .96 | | | 1.71 | | | 1.33 | |
Distributions from: | | | | | | | | | | | | | | | |
Net investment income | | (.02 | ) | | — | | | — | | | — | | | — | |
Net realized gain on investments | | (.02 | ) | | (1.94 | ) | | (1.74 | ) | | (1.63 | ) | | (1.42 | ) |
Total distributions | | (.04 | ) | | (1.94 | ) | | (1.74 | ) | | (1.63 | ) | | (1.42 | ) |
Net asset value, end of year | | $5.51 | | | $ 9.50 | | | $13.73 | | | $14.51 | | | $14.43 | |
Total returnC | | (41.75 | )% | | (17.94 | )% | | 7.00 | % | | 12.63 | % | | 9.67 | % |
Ratios to Average Net Assets: | | | | | | | | | | | | | | | |
Total expensesD | | 2.30 | % | | 2.05 | % | | 2.04 | % | | 2.01 | % | | 2.00 | % |
Expenses net of waivers and/or expense reimbursements, if anyD | | 2.00 | % | | 2.00 | % | | 2.00 | % | | 2.00 | % | | 2.00 | % |
Expenses net of all reductionsD | | 2.00 | % | | 2.00 | % | | 2.00 | % | | 2.00 | % | | 2.00 | % |
Net investment income (loss) | | (.08 | )% | | .10 | % | | (.15 | )% | | (.40 | )% | | (.39 | )% |
Supplemental Data: | | | | | | | | | | | | | | | |
Portfolio turnover rate | | 59.9 | % | | 31.7 | % | | 28.9 | % | | 30.9 | % | | 46.7 | % |
Net assets, end of year
(in thousands) | | $38,306 | | | $104,013 | | | $207,926 | | | $232,061 | | | $242,719 | |
A | On February 1, 2009, Primary Class shares were renamed Class C shares. |
B | Computed using average daily shares outstanding. |
C | Performance figures may reflect compensating balance credits, fee waivers and/or expense reimbursements. In the absence of compensating balance credits, fee waivers and/or expense reimbursements, the total return would have been lower. Past performance is no guarantee of future results. Total returns for periods of less than one year are not annualized. |
D | Total expenses reflects operating expenses prior to any voluntary expense waivers, expense reimbursements and/or compensating balance credits. Expenses net of waivers and/or expense reimbursements reflect total expenses before compensating balance credits but net of any voluntary expense waivers and/or expense reimbursements. Expenses net of all reductions reflects expenses less any compensating balance credits, voluntary expense waivers and/or expense reimbursements. |
See notes to financial statements.
| | |
60 | | Annual Report to Shareholders |
Financial Highlights — Continued
U.S. Small-Capitalization Value Trust — Continued
For a share of each class of capital stock outstanding:
Institutional Class:
| | | | | | | | | | | | | | | |
| | | Years Ended March 31, | |
| | | 2009 | | | 2008 | | | 2007 | | | 2006 | | | 2005 | |
Net asset value, beginning of year | | $11.05 | | | $15.48 | | | $15.99 | | | $15.59 | | | $15.39 | |
Investment operations: | | | | | | | | | | | | | | | |
Net investment income | | .08 | A | | .16 | A | | .13 | A | | — | B | | .09 | |
Net realized and unrealized gain/(loss) | | (4.55 | ) | | (2.65 | ) | | 1.10 | | | 2.03 | | | 1.53 | |
Total from investment operations | | (4.47 | ) | | (2.49 | ) | | 1.23 | | | 2.03 | | | 1.62 | |
Distributions from: | | | | | | | | | | | | | | | |
Net investment income | | (.19 | ) | | — | | | — | | | — | | | — | |
Net realized gain on investments | | (.02 | ) | | (1.94 | ) | | (1.74 | ) | | (1.63 | ) | | (1.42 | ) |
Total distributions | | (.21 | ) | | (1.94 | ) | | (1.74 | ) | | (1.63 | ) | | (1.42 | ) |
Net asset value, end of year | | $ 6.37 | | | $11.05 | | | $15.48 | | | $15.99 | | | $15.59 | |
Total returnC | | (41.24 | )% | | (17.17 | )% | | 8.09 | % | | 13.81 | % | | 11.06 | % |
Ratios to Average Net Assets: | | | | | | | | | | | | | | | |
Total expensesD | | 1.29 | % | | 1.01 | % | | 1.00 | % | | .98 | % | | .93 | % |
Expenses net of waivers and/or expense reimbursements, if anyD | | 1.00 | % | | 1.00 | % | | 1.00 | % | | .98 | % | | .93 | % |
Expenses net of all reductionsD | | 1.00 | % | | 1.00 | % | | 1.00 | % | | .98 | % | | .93 | % |
Net investment income | | .88 | % | | 1.13 | % | | .85 | % | | .66 | % | | .69 | % |
Supplemental Data: | | | | | | | | | | | | | | | |
Portfolio turnover rate | | 59.9 | % | | 31.7 | % | | 28.9 | % | | 30.9 | % | | 46.7 | % |
Net assets, end of year
(in thousands) | | $8,645 | | | $25,278 | | | $33,894 | | | $35,997 | | | $14,349 | |
A | Computed using average daily shares outstanding. |
B | Amount less than $.01 per share. |
C | Performance figures may reflect compensating balance credits, fee waivers and/or expense reimbursements. In the absence of compensating balance credits, fee waivers and/or expense reimbursements, the total return would have been lower. Past performance is no guarantee of future results. Total returns for periods of less than one year are not annualized. |
D | Total expenses reflects operating expenses prior to any voluntary expense waivers, expense reimbursements and/or compensating balance credits. Expenses net of waivers and/or expense reimbursements reflect total expenses before compensating balance credits but net of any voluntary expense waivers and/or expense reimbursements. Expenses net of all reductions reflects expenses less any compensating balance credits, voluntary expense waivers and/or expense reimbursements. |
See notes to financial statements.
| | |
Annual Report to Shareholders | | 61 |
Notes to Financial Statements
Legg Mason Investors Trust, Inc.
1. Organization and Significant Accounting Policies:
Legg Mason Investors Trust, Inc. (“Corporation”), consisting of American Leading Companies Trust (“American Leading Companies”) and U.S. Small-Capitalization Value Trust (“U.S. Small-Cap”) (each a “Fund”), is registered under the Investment Company Act of 1940, as amended (“1940 Act”), as an open-end, diversified investment company.
Each Fund consists of three classes of shares: Class A, Class C (formerly known as Primary Class) and Institutional Class. The income and expenses of the Funds are allocated proportionately to each class of shares based on daily net assets, except for Rule 12b-1 distribution and/or service fees, which are charged only on Class A and Class C shares, and transfer agent and shareholder servicing expenses, which are determined separately for each class.
Preparation of the financial statements in accordance with accounting principles generally accepted in the United States of America (“GAAP”) requires management to make estimates and assumptions that affect the reported amounts and disclosures in the financial statements. Actual results could differ from those estimates. The following is a summary of significant accounting policies followed by the Funds in the preparation of their financial statements:
Investment Valuation
The Funds’ securities are valued under policies approved by and under the general oversight of the Board of Directors. Effective April 1, 2008, each Fund adopted Statement of Financial Accounting Standards No. 157 (“FAS 157”). FAS 157 establishes a single definition of fair value, creates a three-tier hierarchy as a framework for measuring fair value based on inputs used to value the Funds’ investments, and requires additional disclosure about fair value. The hierarchy of inputs is summarized below.
| | • | | Level 1 — quoted prices in active markets for identical investments |
| | • | | Level 2 — other significant observable inputs (including quoted prices for similar investments, interest rates, prepayment speeds, credit risk, etc.) |
| | • | | Level 3 — significant unobservable inputs (including the Funds’ own assumptions in determining the fair value of investments) |
Equity securities for which market quotations are available are valued at the last sale price or official closing price on the primary market or exchange on which they trade. Debt securities are valued at the last quoted bid prices provided by an independent pricing service that are based on transactions in debt obligations, quotations from bond dealers, market transactions in comparable securities and various other relationships between securities. Publicly traded foreign government debt securities are typically
| | |
62 | | Annual Report to Shareholders |
Notes to Financial Statements — Continued
Legg Mason Investors Trust, Inc. — Continued
traded internationally in the over-the-counter market and are valued at the bid price as of the close of business of that market. When prices are not readily available, or are determined not to reflect fair value, such as when the value of a security has been significantly affected by events after the close of the exchange or market on which the security is principally traded, but before each Fund calculates its net asset value, the Fund values these securities at fair value as determined in accordance with the procedures approved by the Funds’ Board of Directors.
The inputs or methodology used for valuing securities are not necessarily an indication of the risk associated with investing in those securities.
The following is a summary of the inputs used in valuing the Funds’ assets carried at fair value:
American Leading Companies Trust
| | | | | | | | | | |
| | | March 31, 2009 | | Quoted Prices
(Level 1) | | Other Significant
Observable Inputs
(Level 2) | | Significant
Unobservable
Inputs
(Level 3) |
Investments in securities | | $ | 176,723,317 | | $ | 176,723,317 | | — | | — |
U.S. Small-Capitalization Value Trust
| | | | | | | | | | | |
| | | March 31, 2009 | | Quoted Prices
(Level 1) | | Other Significant
Observable Inputs
(Level 2) | | Significant
Unobservable
Inputs
(Level 3) |
Investments in Securities | | $ | 48,347,059 | | $ | 48,342,204 | | $ | 4,855 | | — |
Security Transactions
Security transactions are accounted for as of the trade date. Realized gains and losses from security transactions are reported on an identified cost basis for both financial reporting and federal income tax purposes.
For the year ended March 31, 2009, security transactions (excluding short-term investments) were:
| | | | | | |
| | | Purchases | | Proceeds From Sales |
American Leading Companies | | $ | 122,944,948 | | $ | 304,725,832 |
U.S. Small-Cap | | | 50,788,459 | | | 89,808,021 |
Foreign Currency Translation
Assets and liabilities initially expressed in non-U.S. currencies are translated into U.S. dollars using currency exchange rates determined prior to the close of trading on
| | |
Annual Report to Shareholders | | 63 |
the New York Stock Exchange, usually at 2:00 p.m. Eastern time. Purchases and sales of securities and income and expenses are translated into U.S. dollars at the prevailing market rates on the dates of such transactions. The effects of changes in non-U.S. currency exchange rates on investment securities and other assets and liabilities are included with the net realized and unrealized gain or loss on investment securities for each fund.
Repurchase Agreements
Each Fund may enter into repurchase agreements with institutions that its investment adviser has determined are creditworthy. Each repurchase agreement is recorded at cost. Under the terms of a typical repurchase agreement, a fund takes possession of an underlying debt obligation subject to an obligation of the seller to repurchase, and of the fund to resell, the obligation at an agreed-upon price and time, thereby determining the yield during a fund’s holding period. When entering into repurchase agreements, it is each Fund’s policy that its custodian acting on the Fund’s behalf, or a third party custodian take possession of the underlying collateral securities, the market value of which, at all times, at least equals the principal amount of the repurchase transaction, including accrued interest. To the extent that any repurchase transaction exceeds one business day, the value of the collateral is marked to market daily to ensure the adequacy of the collateral. If the counterparty defaults, a fund generally has the right to use the collateral to satisfy the terms of the repurchase transaction. However, if the market value of the collateral declines during the period in which a fund seeks to assert its rights or if bankruptcy proceedings are commenced with respect to the seller of the security, realization of the collateral by a fund may be delayed or limited.
Compensating Balance Credits
Each Fund has an arrangement with their custodian bank whereby a portion of the custodian’s fee is paid indirectly by credits earned on the Fund’s cash on deposit with the bank. This deposit arrangement is an alternative to purchasing overnight investments.
Commission Recapture
American Leading Companies has entered into a directed brokerage agreement with State Street Bank & Trust Company (“State Street”). Under the agreement, State Street Bank will rebate to the Fund a percentage of commissions generated by the Fund. Such payments are included with realized gain/(loss) on investment transactions. During the year ended March 31, 2009, the Fund did not receive any commission rebates.
| | |
64 | | Annual Report to Shareholders |
Notes to Financial Statements — Continued
Legg Mason Investors Trust, Inc. — Continued
Redemptions In-Kind
The Funds under certain conditions may redeem their shares in-kind by distributing portfolio securities rather than making cash payment. Gains and losses realized on redemption in-kind transactions are not recognized for tax purposes, and are reclassified from undistributed realized gain/(loss) to paid in-capital. During the year ended March 31, 2009, American Leading Companies realized $11,187,372 of net gain on $35,396,097 redemption in-kind transactions, which will not be recognized for tax purposes.
Investment Income and Distributions to Shareholders
Interest income and expenses are recorded on the accrual basis. Bond premiums and discounts are amortized for financial reporting and federal income tax purposes. Dividend income is recorded on the ex-dividend date. Dividends from net investment income, if available, are determined at the class level and paid annually for each Fund. Distributions from net realized capital gains, which are calculated at the Fund level, are declared and paid annually in June, if available. An additional distribution may be made in December, to the extent necessary, in order to comply with federal excise tax requirements. Distributions are determined in accordance with federal income tax regulations, which may differ from those determined in accordance with GAAP. Accordingly, periodic reclassifications are made within each Fund’s capital accounts to reflect income and gains available for distribution under federal income tax regulations.
Foreign Taxes
The Funds are subject to foreign income taxes imposed by certain countries in which each invests. Foreign income taxes are accrued by the Funds and withheld from dividend and interest income.
Market Price Risk
The prices of securities held by each Fund may decline in response to certain events, including those directly involving the companies whose securities are owned by each Fund; conditions affecting the general economy; overall market changes; local, regional or global political, social or economic instability; and currency, interest rate and commodity price fluctuations. The value-oriented, equity-type securities generally purchased by each Fund may involve large price swings and potential for loss.
Other
In the normal course of business, each Fund enters into contracts that provide general indemnifications. Each Fund’s maximum exposure under these arrangements is dependent on claims that may be made against that Fund in the future and, therefore,
| | |
Annual Report to Shareholders | | 65 |
cannot be estimated. However, based on experience, the risk of material loss from such claims is considered remote.
2. Federal Income Taxes:
It is each Fund’s policy to comply with the federal income and excise tax requirements of the Internal Revenue Code of 1986, as amended, applicable to regulated investment companies. Accordingly, each Fund intends to distribute substantially all of its taxable income and net realized gains, if any, to shareholders each year. Therefore, no federal income tax provision is required in either Fund’s financial statements.
Management has analyzed each Fund’s tax positions taken on federal income tax returns for all open tax years and has concluded that as of March 31, 2009, no provision for income tax would be required in either Fund’s financial statements. Each Fund’s federal and state income and federal excise tax returns for tax years for which the applicable statutes of limitations have not expired are subject to examination by the Internal Revenue Service and state departments of revenue.
Under the applicable foreign tax laws, a withholding tax may be imposed on interest, dividends and capital gains at various rates.
Reclassifications:
GAAP requires that certain components of net assets be adjusted to reflect permanent differences between financial and tax reporting. These reclassifications have no effect on net assets or net asset values per share. During the current year, the following reclassifications have been made:
| | | | | | | | | | | | | |
| Fund | | | | Undistributed/
(Overdistributed)
Net
Investment Income | | | Accumulated Net
Realized Loss | | | Paid-in
Capital |
American Leading Companies | | A | | | — | | | $ | (10,982,346 | ) | | $ | 10,982,346 |
| | B | | $ | (272,760 | ) | | | 272,760 | | | | — |
U.S. Small-Cap | | C | | | — | | | | (540 | ) | | | 540 |
| | D | | | (51 | ) | | | 51 | | | | — |
A | Reclassifications are primarily due to realized gains associated with securities involved in an in-kind distribution (see Note 1). |
B | Reclassifications are primarily due to foreign currency transactions treated as ordinary income for tax purposes, book/tax differences in the treatment of distributions and book/tax differences in the treatment of sales of certain securities. |
C | Reclassifications are primarily due to prior year distributions paid in connection with the redemption of Fund shares. |
D | Reclassifications are primarily due to foreign currency transactions treated as ordinary income for tax purposes. |
| | |
66 | | Annual Report to Shareholders |
Notes to Financial Statements — Continued
Legg Mason Investors Trust, Inc. — Continued
Additionally, during the current period American Leading Companies has adjusted Undistributed Net Investment Income and Cost of Investments, reducing each by $1,281,400 as a result of a return of capital distribution. These adjustments have no effect on net assets or asset values per share.
Distributions to Shareholders:
The tax character of distributions paid during the fiscal year ended March 31, 2009 was as follows:
| | | | | | |
| | | American Leading Companies | | U.S. Small-Cap |
Distributions Paid From: | | | | | | |
Ordinary income | | $ | 4,060,691 | | $ | 455,889 |
Net long-term capital gains | | | — | | | 237,195 |
| | | | | | |
Total distributions paid | | $ | 4,060,691 | | $ | 693,084 |
| | | | | | |
The tax character of distributions paid during the fiscal years ended March 31, 2008 were as follows:
| | | | | | |
| | | American Leading
Companies | | U.S. Small-Cap |
Distributions Paid From: | | | | | | |
Ordinary income | | $ | 1,708,893 | | $ | 4,083,013 |
Net long-term capital gains | | | 47,351,438 | | | 23,853,278 |
| | | | | | |
Total distributions paid | | $ | 49,060,331 | | $ | 27,936,291 |
| | | | | | |
Accumulated Earnings on a Tax Basis:
As of March 31, 2009, the components of accumulated earnings on a tax basis were as follows:
| | | | | | | | |
| | | American Leading
Companies | | | U.S. Small-Cap | |
Undistributed ordinary income — net | | $ | 141,407 | | | $ | 16,167 | |
Capital loss carryforward* | | | (36,469,435 | ) | | | (9,157,674 | ) |
Other book/tax temporary differences | | | (42,991,800 | )A | | | (17,856,603 | )A |
Unrealized appreciation/(depreciation) | | | (28,687,682 | )B | | | (20,728,969 | )B |
| | | | | | | | |
Total accumulated earnings/(losses) — net | | $ | (108,007,510 | ) | | $ | (47,727,079 | ) |
| | | | | | | | |
A | Other book/tax temporary differences are attributable primarily to the deferral of post-October capital losses for tax purposes and book/tax differences in the timing of the deductibility of various expenses. |
B | The difference between book-basis and tax-basis unrealized appreciation/(depreciation) is attributable primarily to the tax deferral of losses on wash sales. |
| | |
Annual Report to Shareholders | | 67 |
| * | As of the taxable year ended March 31, 2009, the following capital loss carryforwards are available: |
| | | | | | | | |
| Year of Expiration | | American Leading
Companies | | | U.S. Small-Cap | |
3/31/2017 | | $ | (36,469,435 | ) | | $ | (9,157,674 | ) |
| | | | | | | | |
These amounts will be available to offset any future taxable capital gains.
Tax Cost of Investments:
As of March 31, 2009, the aggregate cost of investments for federal income tax purposes was as follows:
| | |
American Leading Companies | | $205,410,999 |
U.S. Small-Cap | | $69,076,028 |
3. Transactions With Affiliates:
American Leading Companies has an investment advisory and management agreement with Legg Mason Capital Management, Inc. (“LMCM”). Pursuant to the agreement, LMCM provides American Leading Companies with investment advisory, management and administrative services for which the Fund pays a fee, computed daily and payable monthly, at an annual rate of the Fund’s average daily net assets shown in the table below.
U.S. Small-Cap has a management agreement with Legg Mason Fund Adviser, Inc. (“LMFA”). Pursuant to the agreement, LMFA provides U.S. Small-Cap with management and administrative services for which the Fund pays a fee, computed daily and payable monthly, at the annual rate of the Fund’s average daily net assets shown in the table below.
The following chart summarizes the management fees for each of the Funds:
| | | | |
| Fund | | Management
Fee | | Net Asset Breakpoint |
American Leading Companies | | 0.70% | | on net assets up to $1 billion |
| | 0.68% | | on net assets $1 billion –$2 billion |
| | 0.65% | | on net assets $2 billion –$5 billion |
| | 0.62% | | on net assets $5 billion –$10 billion |
| | 0.59% | | on net assets in excess of $10 billion |
U.S. Small-Cap | | 0.85% | | on net assets up to $100 million |
| | 0.75% | | on net assets $100 million – $1 billion |
| | 0.65% | | on net assets in excess of $1 billion |
LMCM and LMFA have voluntarily agreed to waive their fees and/or reimburse expenses in any month to the extent a Fund’s expenses (exclusive of taxes, interest, brokerage and extraordinary expenses) exceed, during that month, certain annual rates
| | |
68 | | Annual Report to Shareholders |
Notes to Financial Statements — Continued
Legg Mason Investors Trust, Inc. — Continued
of that Fund’s average daily net assets until August 1, 2009. These voluntary waivers and/or expense reimbursements may be terminated at any time. For the year ended March 31, 2009, LMCM and LMFA waived fees and reimbursed expenses in the amount of $31,173 for American Leading Companies and $255,439 for U.S. Small-Cap.
The following chart summarizes the expense limitations for each of the Funds:
| | | | | | | | | |
| Fund | | Class A
Expense Limitation | | | Class C
Expense Limitation | | | Institutional Class
Expense Limitation | |
American Leading Companies | | 1.20 | % | | 1.95 | % | | 0.95 | % |
U.S. Small-Cap | | 1.25 | % | | 2.00 | % | | 1.00 | % |
Brandywine Global Investment Management, LLC (“Brandywine Global”) serves as investment adviser to U.S. Small-Cap. Brandywine Global is responsible, subject to the general supervision of LMFA, for the actual investment activity of the Fund. LMFA pays Brandywine Global a fee for its services, computed daily and payable monthly, at an annual rate equal to 58.8% of the fee received by LMFA.
Legg Mason Investor Services, LLC (“LMIS”), serves as the Funds’ distributor. LMIS receives an annual distribution and/or service fee based on each Fund’s Class A and Class C average daily net assets, computed daily and payable monthly as follows:
| | | | | | |
| Fund | | Distribution Fee | | | Service Fee | |
American Leading Companies | | | | | | |
Class A | | — | | | 0.25 | % |
Class C | | 0.75 | % | | 0.25 | % |
U.S. Small-Cap | | | | | | |
Class A | | — | | | 0.25 | % |
Class C | | 0.75 | % | | 0.25 | % |
LMFA serves as administrator to American Leading Companies under an administrative services agreement with LMCM. For LMFA’s services to American Leading Companies, LMCM (not the Fund) pays LMFA a fee, calculated daily and payable monthly, of 0.05% of the average daily net assets of the Fund.
LMCM, LMFA, Brandywine Global and LMIS are wholly owned subsidiaries and corporate affiliates of Legg Mason, Inc.
For American Leading Companies Trust, there is a maximum initial sales charge of 5.75% for Class A shares. On February 1, 2009, Class C shares began to charge a contingent deferred sales charge (“CDSC”) of 1.00% for shares bought by investors on or after that date, which applies if shares are redeemed within one year from purchase payment. In certain cases, Class A shares have a 1.00% CDSC, which applies to certain
| | |
Annual Report to Shareholders | | 69 |
redemptions made within 12 months following purchases of $1,000,000 or more without an initial sales charge.
During the year ended March 31, 2009, LMIS and its affiliates did not receive sales charges on sales of American Leading Companies’ Class A shares. In addition, for the year ended March 31, 2009, CDSCs paid to LMIS and its affiliates were approximately $100 on American Leading Companies’ Class C shares.
For U.S. Small Cap, there is a maximum initial sales charge of 5.75% for Class A shares. On February 1, 2009, Class C shares began to charge a CDSC of 1.00% for shares bought by investors on or after that date, which applies if shares are redeemed within one year from purchase payment. In certain cases, Class A shares have a 1.00% CDSC, which applies to certain redemptions made within 12 months following purchase of $1,000,000 or more without an initial sales charge.
During the year ended March 31, 2009, LMIS and its affiliates did not receive sales charges on sales of U.S. Small Cap’s Class A shares. In addition, for the year ended March 31, 2009, there were no CDSCs paid to LMIS and its affiliates on U.S. Small Cap’s Class C shares.
Under a Deferred Compensation Plan (the “Plan”), directors may elect to defer receipt of all or a specified portion of their compensation. A participating director may select one or more funds in which his or her deferred director’s fees will be invested. Deferred fees remain invested in certain funds until distributed in accordance with the Plan.
4. Line of Credit:
The Funds, along with certain other Legg Mason Funds, participate in a $200 million line of credit (“Credit Agreement”) to be used for temporary or emergency purposes. Pursuant to the Credit Agreement, each participating Fund is liable only for principal and interest payments related to borrowings made by that Fund. Borrowings under the Credit Agreement bear interest at a rate equal to the prevailing federal funds rate plus the federal funds rate margin. Neither Fund utilized the line of credit during the year ended March 31, 2009.
5. Fund Share Transactions:
At March 31, 2009, there were 100,000,000 shares authorized at $.001 par value for Class A of American Leading Companies and U.S. Small-Cap. At March 31, 2009, there were 250,000,000 and 50,000,000 shares authorized at $.001 par value for Class C of American Leading Companies and U.S. Small-Cap, respectively. At March 31, 2009, there were 250,000,000, and 50,000,000 shares authorized at $.001 par value for the Institutional Classes of American Leading Companies and U.S. Small-Cap, respectively.
| | |
70 | | Annual Report to Shareholders |
Notes to Financial Statements — Continued
Legg Mason Investors Trust, Inc. — Continued
Share transactions are detailed below:
American Leading Companies Trust
| | | | | | | | | | | | | | |
| | | Year Ended
March 31, 2009 | | | Year Ended
March 31, 2008 | |
| | | Shares | | | Amount | | | Shares | | | Amount | |
Class AA | | | | | | | | | | | | | | |
Shares sold | | 1,201,487 | | | $ | 12,544,198 | | | — | | | | — | |
Shares repurchased | | (150,672 | ) | | | (1,469,770 | ) | | — | | | | — | |
| | | | | | | | | | | | | | |
Net Increase | | 1,050,815 | | | $ | 11,074,428 | | | — | | | | — | |
| | | | | | | | | | | | | | |
Class CB | | | | | | | | | | | | | | |
Shares sold | | 2,832,671 | | | $ | 39,612,249 | | | 2,357,186 | | | $ | 56,648,242 | |
Shares issued on reinvestment | | 251,573 | | | | 3,257,702 | | | 1,793,915 | | | | 42,205,622 | |
Shares repurchased | | (13,270,477 | ) | | | (192,414,805 | ) | | (7,694,594 | ) | | | (180,928,172 | ) |
| | | | | | | | | | | | | | |
Net Decrease | | (10,186,233 | ) | | $ | (149,544,854 | ) | | (3,543,493 | ) | | $ | (82,074,308 | ) |
| | | | | | | | | | | | | | |
Institutional Class | | | | | | | | | | | | | | |
Shares sold | | 568,283 | | | $ | 9,715,962 | | | 978,756 | | | $ | 24,402,089 | |
Shares issued on reinvestment | | 49,581 | | | | 783,332 | | | 188,146 | | | | 4,645,699 | |
Shares repurchased | | (2,989,913 | ) | | | (51,793,830 | ) | | (639,339 | ) | | | (15,753,757 | ) |
| | | | | | | | | | | | | | |
Net Increase (Decrease) | | (2,372,049 | ) | | $ | (41,294,536 | ) | | 527,563 | | | $ | 13,294,031 | |
| | | | | | | | | | | | | | |
|
| U.S. Small-Capitalization Value Trust | |
| | | Year Ended
March 31, 2009 | | | Year Ended
March 31, 2008 | |
| | | Shares | | | Amount | | | Shares | | | Amount | |
Class AA | | | | | | | | | | | | | | |
Shares sold | | 394,985 | | | $ | 2,361,502 | | | — | | | | — | |
Shares repurchased | | (15,960 | ) | | | (77,976 | ) | | — | | | | — | |
| | | | | | | | | | | | | | |
Net Increase | | 379,025 | | | $ | 2,283,526 | | | — | | | | — | |
| | | | | | | | | | | | | | |
A | For the period February 3, 2009 (commencement of operations) to March 31, 2009. |
B | On February 1, 2009, Primary Class shares were renamed Class C shares. |
| | |
Annual Report to Shareholders | | 71 |
| | | | | | | | | | | | | | |
| | | Year Ended
March 31, 2009 | | | Year Ended
March 31, 2008 | |
| | | Shares | | | Amount | | | Shares | | | Amount | |
Class CB | | | | | | | | | | | | | | |
Shares sold | | 751,097 | | | $ | 5,878,888 | | | 546,261 | | | $ | 6,603,007 | |
Shares issued on reinvestment | | 42,395 | | | | 403,602 | | | 2,093,967 | | | | 22,785,853 | |
Shares repurchased | | (4,797,830 | ) | | | (37,805,266 | ) | | (6,828,085 | ) | | | (79,049,176 | ) |
| | | | | | | | | | | | | | |
Net Decrease | | (4,004,338 | ) | | $ | (31,522,776 | ) | | (4,187,857 | ) | | $ | (49,660,316 | ) |
| | | | | | | | | | | | | | |
Institutional Class | | | | | | | | | | | | | | |
Shares sold | | 420,558 | | | $ | 3,820,412 | | | 822,469 | | | $ | 11,074,327 | |
Shares issued on reinvestment | | 26,318 | | | | 287,922 | | | 319,399 | | | | 3,985,324 | |
Shares repurchased | | (1,378,142 | ) | | | (14,578,157 | ) | | (1,043,915 | ) | | | (14,385,655 | ) |
| | | | | | | | | | | | | | |
Net Increase (Decrease) | | (931,266 | ) | | $ | (10,469,823 | ) | | 97,953 | | | $ | 673,996 | |
| | | | | | | | | | | | | | |
6. Recent Accounting Pronouncements
In March 2008, the Financial Accounting Standards Board (“FASB”) issued Statement of Financial Accounting Standards No. 161, “Disclosures about Derivative Instruments and Hedging Activities” (“FAS 161”). FAS 161 is effective for fiscal years and interim periods beginning after November 15, 2008. FAS 161 requires enhanced disclosures about the Funds’ derivative and hedging activities, including how such activities are accounted for and their effect on the Funds’ financial position, performance and cash flows. Management is currently evaluating the impact the adoption of FAS 161 will have on the Funds’ financial statements and related disclosures.
In April 2009, FASB issued FASB Staff Position No. 157-4, “Determining Fair Value When the Volume and Level of Activity for the Asset or Liability Have Significantly Decreased and Identifying Transactions That Are Not Orderly” (“FSP 157-4”). FSP 157-4 provides additional guidance for estimating fair value in accordance with FAS 157, when the volume and level of activity for the asset or liability have significantly decreased as well as guidance on identifying circumstances that indicate a transaction is not orderly. FSP 157-4 is effective for fiscal years and interim periods ending after June 15, 2009. Management is currently evaluating the impact the adoption of FSP 157-4 will have on the Funds’ financial statement disclosures.
B | On February 1, 2009, Primary Class shares were renamed Class C shares. |
| | |
72 | | Annual Report to Shareholders |
Report of Independent Registered Public Accounting Firm
To the Board of Directors of Legg Mason Investors Trust, Inc. and Shareholders of American Leading Companies Trust and U.S. Small-Capitalization Value Trust:
In our opinion, the accompanying statements of assets and liabilities, including the portfolios of investments, and the related statements of operations and of changes in net assets and the financial highlights present fairly, in all material respects, the financial position of American Leading Companies Trust and U.S. Small-Capitalization Value Trust (comprising Legg Mason Investors Trust, Inc., the “Funds”) at March 31, 2009, the results of their operations, the changes in their net assets, and the financial highlights for each of the periods presented, in conformity with accounting principles generally accepted in the United States of America. These financial statements and financial highlights (hereafter referred to as “financial statements”) are the responsibility of the Funds’ management; our responsibility is to express an opinion on these financial statements based on our audits. We conducted our audits of these financial statements in accordance with the standards of the Public Company Accounting Oversight Board (United States). Those standards require that we plan and perform the audit to obtain reasonable assurance about whether the financial statements are free of material misstatement. An audit includes examining, on a test basis, evidence supporting the amounts and disclosures in the financial statements, assessing the accounting principles used and significant estimates made by management, and evaluating the overall financial statement presentation. We believe that our audits, which included confirmation of securities at March 31, 2009 by correspondence with the custodian and brokers, provide a reasonable basis for our opinion.
PricewaterhouseCoopers LLP
Baltimore, Maryland
May 19, 2009
| | |
Annual Report to Shareholders | | 73 |
Important Tax Information (Unaudited):
The following information is provided with respect to the distributions paid during the taxable year ended March 31, 2009:
| | | | | | | | |
| | | American Leading
Companies | | U.S. Small-Cap |
Record date: | | 6/18/2008 | | 12/11/2008 | | | | 6/18/2008 |
Payable date: | | 6/20/2008 | | 12/12/2008 | | | | 6/20/2008 |
Ordinary income: | | | | | | | | |
Qualified dividend income for individuals | | 100.00% | | 100.00% | | | | 100.00% |
Dividends qualifying for the dividends received deduction for corporations | | 100.00% | | 100.00% | | | | 100.00% |
Long-term capital gain dividend | | — | | — | | | | $0.021000 |
Please retain this information for your records.
| | |
74 | | Annual Report to Shareholders |
Directors and Officers
The table below provides information about each of the Corporation’s directors and officers, including biographical information about their business experience and information about their relationships with Legg Mason, Inc. and its affiliates. The mailing address of each director and officer is 100 Light Street, Attn: Fund Secretary, 32nd Floor, Baltimore, Maryland 21202.
| | | | | | | | |
Name, (Year of
Birth) and Position
with Corporation | | Term of
Office and
Length of
Time
ServedA | | Number of Funds
in Fund Complex
Overseen by
Director | | Other
Directorships
Held by Director | | Principal Occupation(s)
During the Past Five Years |
| INDEPENDENT DIRECTORSB: |
Hearn, Ruby P. (1940) Director | | Since 2004 | | 14 | | None | | Senior Vice President Emerita of The Robert Wood Johnson Foundation (non-profit) since 2001. Formerly: Senior Vice President of The Robert Wood Johnson Foundation (1996-2001). |
Lehman, Arnold L. (1944) Lead Independent Director | | Since 1993 | | 14 | | None | | Director of the Brooklyn Museum since 1997; Trustee of American Federation of Arts since 1998. Formerly: Director of The Baltimore Museum of Art (1979-1997). |
Masters, Robin J.W. (1955) Director | | Since 2002 | | 14 | | Director of Cheyne Capital International Limited (investment advisory firm). Director/Trustee of Legg Mason Asian Funds plc, Legg Mason Institutional Funds plc, Western Asset Fixed Income Funds plc., and Western Asset Debt Securities Fund plc. | | Retired. Formerly: Chief Investment Officer of ACE Limited (insurance) (1986-2000). |
McGovern, Jill E. (1944) Director | | Since 1993 | | 14 | | None | | Senior Consultant, American Institute for Contemporary German Studies (AICGS) since 2007. Formerly: Chief Executive Officer of The Marrow Foundation (non-profit) (1993-2007); Executive Director of the Baltimore International Festival (1991-1993); Senior Assistant to the President of The Johns Hopkins University (1986-1990). |
| | |
Annual Report to Shareholders | | 75 |
| | | | | | | | |
Name, (Year of
Birth) and Position
with Corporation | | Term of
Office and
Length of
Time
ServedA | | Number of Funds
in Fund Complex
Overseen by
Director | | Other
Directorships
Held by Director | | Principal Occupation(s)
During the Past Five Years |
Mehlman, Arthur S. (1942) Director | | Since 2002 | | Director/Trustee of all Legg Mason funds consisting of 14 portfolios; Director/Trustee of the Royce Family of Funds consisting of 28 portfolios. | | Director of Municipal Mortgage & Equity, LLC. | | Retired. Formerly: Partner, KPMG LLP (international accounting firm) (1972-2002). |
O’Brien, G. Peter (1945) Director | | Since 1999 | | Director/Trustee of all Legg Mason funds consisting of 14 portfolios; Director/Trustee of the Royce Family of Funds consisting of 28 portfolios. | | Director of Technology Investment Capital Corp. | | Retired. Trustee Emeritus of Colgate University; Board Member, Hill House, Inc. (residential home care); Board Member, Bridges School (pre- school). Formerly: Managing Director, Equity Capital Markets Group of Merrill Lynch & Co. (1971-1999). |
Rowan, S. Ford (1943) Director | | Since 2002 | | 14 | | None | | Chairman, National Center for Critical Incident Analysis, National Defense University, since 2004; Professional Lecturer in Organizational Sciences, The George Washington University, Since 2008. Formerly: Consultant, Rowan & Blewitt Inc. (management consulting) (1984-2007). |
Tarola, Robert M.
(1950)
Director | | Since 2004 | | 14 | | Director of TeleTech Holdings, Inc. | | President of Right Advisory LLC (corporate finance and governance consulting) since 2008; Formerly: Senior Vice President and Chief Financial Officer of W.R. Grace & Co. (specialty chemicals and materials) (1999 to 2008), and of MedStar Health, Inc. (hospitals and healthcare) (1996 to 1999); Partner, Price Waterhouse LLP (accounting and auditing) from (1984 to 1996). |
| | |
76 | | Annual Report to Shareholders |
Directors and Officers — Continued
| | | | | | | | |
Name, (Year of
Birth) and Position
with Corporation | | Term of
Office and
Length of
Time
ServedA | | Number of Funds
in Fund Complex
Overseen by
Director | | Other
Directorships
Held by Director | | Principal Occupation(s)
During the Past Five Years |
| INTERESTED DIRECTORSC: |
Fetting, Mark R. (1954) Chairman and Director | | Director since 2002 and Chairman since 2008 | | Chairman and Director/Trustee of all Legg Mason Funds consisting of 14 portfolios; Director/Trustee of the Royce Family of Funds consisting of 28 portfolios. | | None | | President, CEO, Chairman and Director of Legg Mason, Inc. and Chairman of Legg Mason Funds since 2008. Formerly: President of all Legg Mason Funds (2001-2008). Senior Executive Vice President of Legg Mason, Inc., Director and/or officer of various Legg Mason, Inc. affiliates (2000-2008). Division President and Senior Officer of Prudential Financial Group, Inc. and related companies, including fund boards and consulting services to subsidiary companies (1991-2000); Partner, Greenwich Associates (financial consulting); Vice President, T. Rowe Price Group, Inc. |
Odenath, David (1957) President and Director | | Since 2008 | | 14 | | None | | Senior Executive Vice President of Legg Mason, Inc. and President of Legg Mason Funds since 2008. Formerly: President of Prudential Annuities (2002-2008); Executive Vice President (2003-2008) of American Skandia Investment Services, Inc; Chief Executive Officer and Director (2003-2008) of American Skandia Life Assurance Corporation, American Skandia Information Services and Technology Corporation and Skandia U.S. Inc.; President, Chief Executive Officer and Director (2003-2008) of American Skandia Marketing, Inc.; Formerly President, Chief Executive Officer, Chief Operating Officer and Officer-In-Charge (1999-2003) of PI; Senior Vice President (1999-2003) of Prudential; formerly Senior Vice President (1993-1999) of PaineWebber Group, Inc. |
| | |
Annual Report to Shareholders | | 77 |
| | | | | | | | |
Name, (Year of
Birth) and Position
with Corporation | | Term of
Office and
Length of
Time
ServedA | | Number of Funds
in Fund Complex
Overseen
by Director | | Other
Directorships
Held by Director | | Principal Occupation(s)
During the Past Five Years |
| EXECUTIVE OFFICERS: |
Gerken, R. Jay (1951) Vice President | | Since 2009 | | N/A | | N/A | | Managing Director of Legg Mason & Co., LLC, Chairman, President and Chief Executive Officer of certain mutual funds associated with Legg Mason & Co., LLC or its affiliates (2005-present); President of Legg Mason Partners Fund Advisor, LLC (“LMPFA”) (2006-present); Chairman of Smith Barney Fund Management LLC and Citi Fund Management Inc. (2002-2005); Chairman, President and Chief Executive Officer of Travelers Investment Adviser, Inc. (2002-2005). |
Ozsolak, Kaprel (1965) Chief Financial Officer and Treasurer | | Since 2009 | | N/A | | N/A | | Director of Legg Mason; Chief Financial Officer and Treasurer of certain mutual funds associated with Legg Mason; formerly, Controller of certain mutual funds associated with certain predecessor firms of Legg Mason (from 2002 to 2004) |
Frenkel, Robert I. (1954) Secretary and Chief Legal Officer | | Since 2009 | | N/A | | N/A | | Managing Director and General Counsel of Global Mutual Funds for Legg Mason and its predecessor (since 1994); Secretary and Chief Legal Officer of mutual funds associated with Legg Mason (since 2003); formerly, Secretary of CFM (from 2001 to 2004) |
| | |
78 | | Annual Report to Shareholders |
Directors and Officers — Continued
| | | | | | | | |
Name, (Year of
Birth) and Position
with Corporation | | Term of
Office and
Length of
Time
ServedA | | Number of Funds
in Fund Complex
Overseen
by Director | | Other
Directorships
Held by Director | | Principal Occupation(s)
During the Past Five Years |
Becker, Ted P.
(1951)
Vice President and Chief Compliance Officer | | Since 2007 | | N/A | | N/A | | Director of Global Compliance at Legg Mason (2006 to present); Managing Director of Compliance at Legg Mason & Co. (2005 to present); Chief Compliance Officer with certain mutual funds associated with Legg Mason & Co. (since 2006); Chief Compliance Officer of Legg Mason Partners Funds and certain affiliates; Managing Director of Compliance at Citigroup Asset Management (2002 to 2005). Prior to 2002, Managing Director-Internal Audit & Risk Review at Citigroup Inc. |
ADDITIONAL INFORMATION ABOUT THE CORPORATION’S DIRECTORS AND OFFICERS IS CONTAINED IN THE STATEMENT OF ADDITIONAL INFORMATION, AVAILABLE WITHOUT CHARGE UPON REQUEST BY CALLING 1-800-822-5544 OR ON THE SECURITIES AND EXCHANGE COMMISSION WEBSITE (http://www.sec.gov).
A | Officers of the Corporation are elected annually to serve until their successors are elected and qualified. Directors of the Corporation serve a term of indefinite length until their retirement, in accordance with the Board’s retirement policy, resignation or removal, and stand for re-election by shareholders only as and when required by the 1940 Act. |
B | Each of the Independent Directors serves on the standing committees of the Board of Directors, which include the Audit Committee (chair: Arthur Mehlman), the Nominating Committee (co-chairs: Peter O’Brien and Jill McGovern), and the Independent Directors Committee (chair: Arnold Lehman). |
C | Mr. Fetting and Mr. Odenath are considered to be interested persons, as defined in the 1940 Act, of the Corporation on the basis of their current employment with the Funds’ investment advisers or its affiliated entities (including the Funds’ principal underwriter) and Legg Mason, Inc., the parent holding company of these entities as well as their ownership of Legg Mason, Inc. stock. |
| | |
Annual Report to Shareholders | | 79 |
Board Consideration of Legg Mason American Leading Companies Trust’s Investment Advisory and Management Agreement
At its November 2008 meeting, the Board of Directors (the “Board”), including all of the Independent Directors, approved the continuation of the Investment Advisory and Management Agreement (the “Agreement”) between Legg Mason Capital Management, Inc. (the “Adviser”) and Legg Mason Investors Trust, Inc., on behalf of Legg Mason American Leading Companies Trust (“American Leading Companies”). In voting to approve the continuation of the Agreement, the Board considered whether continuance would be in the best interest of American Leading Companies and its shareholders, an evaluation largely based on the nature and quality of the services provided under the Agreement and the overall fairness of the Agreement to American Leading Companies. In considering the Agreement, the Board did not identify any single factor or item of information as all-important or controlling. Based on its evaluation of all material factors, including those described below, the Board concluded that the terms of the Agreement are reasonable and fair and that the continuation of the Agreement is in the best interest of American Leading Companies and its shareholders.
Prior to the Board action, the Independent Directors met as a committee, together with experienced 1940 Act counsel, to consider their recommendation as to continuance of the Agreement. As part of the process to consider the Agreement, legal counsel to American Leading Companies requested certain information from the Adviser on behalf of the Independent Directors, and in response, the Adviser provided an extensive report that addressed specific factors designed to inform the Board’s consideration of the Agreement. Counsel also provided the Independent Directors and the Board with a memorandum detailing their responsibilities pertaining to the continuance of the Agreement.
In addition to the November meeting, the Independent Directors met in executive session in October 2008, at which time they reviewed and analyzed materials relating to the Agreement. The Independent Directors also retained independent consultants to assist them in their review and analysis of the Agreement. The Board meets at least another three times per year in order to oversee the Legg Mason Funds, including meetings at which the portfolio manager of American Leading Companies or others make presentations and discuss performance, compliance and other applicable issues. The Board also drew upon its long association with the Adviser and its personnel and the Board members’ familiarity with the Adviser’s culture and the manner in which it has sought to strengthen and enhance itself.
With respect to the nature, scope and quality of the services provided, the Board considered the experience and commitment of the Adviser’s personnel and its efforts to build and support a strong service team. The Board also considered the nature and quality of the Adviser’s investment process. In assessing performance, the Board
| | |
80 | | Annual Report to Shareholders |
Board Consideration of Legg Mason American Leading Companies Trust’s Investment Advisory and Management Agreement — Continued
compared American Leading Companies’ returns to the average of an appropriate Lipper category, a specified benchmark index and a peer group of investment companies pursuing similar strategies, all over multiple time periods. The Board considered very carefully American Leading Companies’ performance and discussed with the Adviser steps that the Adviser had taken, or intended to take, to improve performance. The Board considered whether a reduction in assets under management would adversely affect the resources available to the Adviser. The Board also considered the level of service provided by the Adviser and its affiliates to American Leading Companies, including oversight of the transfer agent and the custodian and preparation of regulatory filings. The Board considered the Adviser’s procedures for executing portfolio transactions for American Leading Companies. The Board also reviewed the Adviser’s policies and procedures for the selection of brokers and dealers and on obtaining research from brokers.
In determining whether the terms of the Agreement are reasonable and fair, the Board considered the terms and fee structure of the Agreement. In that connection, the Board considered the costs to the Adviser in providing services to American Leading Companies and profitability for the Adviser and its affiliates from their overall association with American Leading Companies. The Board reviewed information about the advisory fee schedule and overall expense ratio of American Leading Companies and comparable fee schedules and expense ratios of a peer group of funds. In considering whether any economies of scale experienced by the Adviser in providing services to American Leading Companies were shared with American Leading Companies, the Board noted that American Leading Companies’ advisory fee structure provides for a reduction of the effective fee rate as asset levels increase; that during the Board’s discussion of the Agreement the Adviser offered, and the Board agreed, to add additional breakpoint reductions to the contractual fee schedule; and that the Adviser has agreed to voluntarily waive fees for American Leading Companies. Finally, the Board considered other benefits accruing to the Adviser and its affiliates by virtue of their relationship to American Leading Companies.
After an evaluation of all material factors, including those in the foregoing discussion, the Board concluded that the continuation of the Agreement is in the best interest of American Leading Companies.
| | |
Annual Report to Shareholders | | 81 |
Board Consideration of Legg Mason U.S. Small-Capitalization Value Trust’s Investment Advisory Agreement and Management Agreement
At its November 2008 meeting, the Board of Directors (the “Board”), including all of the Independent Directors, approved the continuation of the Management Agreement between Legg Mason Fund Adviser, Inc. (the “Manager”) and Legg Mason Investors Trust, Inc., on behalf of Legg Mason U.S. Small-Capitalization Value Trust (“U.S. Small-Cap”), and the Investment Advisory Agreement between the Manager and Brandywine Global Investment Management, LLC (the “Adviser”) (each an “Agreement”). In voting to approve the continuation of each Agreement, the Board considered whether continuance would be in the best interest of U.S. Small-Cap and its shareholders, an evaluation largely based on the nature and quality of the services provided under each Agreement and the overall fairness of each Agreement to U.S. Small-Cap. In considering each Agreement, the Board did not identify any single factor or item of information as all-important or controlling. Based on its evaluation of all material factors, including those described below, the Board concluded that the terms of each Agreement are reasonable and fair and that the continuation of each Agreement is in the best interest of U.S. Small-Cap and its shareholders.
Prior to the Board action, the Independent Directors met as a committee, together with experienced 1940 Act counsel, to consider their recommendation as to continuance of each Agreement. As part of the process to consider each Agreement, legal counsel to U.S. Small-Cap requested certain information from the Manager and the Adviser on behalf of the Independent Directors, and in response, the Manager and the Adviser provided extensive reports that addressed specific factors designed to inform the Board’s consideration of each Agreement. Counsel also provided the Independent Directors and the Board with a memorandum detailing their responsibilities pertaining to the continuance of each Agreement.
In addition to the November meeting, the Independent Directors met in executive session in October 2008, at which time they reviewed and analyzed materials relating to each Agreement. The Independent Directors also retained independent consultants to assist them in their review and analysis of each Agreement. The Board meets at least another three times per year in order to oversee the Legg Mason Funds, including meetings at which the portfolio managers of U.S. Small-Cap or others make presentations and discuss performance, compliance and other applicable issues. The Board also drew upon its long association with the Manager, the Adviser and their personnel and the Board members’ familiarity with their culture and the manner in which the management entities have sought to strengthen and enhance themselves.
With respect to the nature, scope and quality of the services provided, the Board considered the experience and commitment of the Manager’s and the Adviser’s personnel and their efforts to build and support a strong service team. The Board also considered the nature and quality of the Adviser’s investment process. In assessing
| | |
82 | | Annual Report to Shareholders |
Board Consideration of Legg Mason U.S. Small-Capitalization Value Trust’s Investment Advisory Agreement and Management Agreement — Continued
performance, the Board compared U.S. Small-Cap’s returns to the average of an appropriate Lipper category, a specified benchmark index and a peer group of investment companies pursuing similar strategies, all over multiple time periods. The Board considered very carefully U.S. Small-Cap’s performance and discussed with the Manager and the Adviser steps that the Manager and the Adviser had taken, or intended to take, to improve performance. The Board considered whether a reduction in assets under management would adversely affect the resources available to the Manager and the Adviser. The Board also considered the level of service provided by the Manager to U.S. Small-Cap, including oversight of the transfer agent and the custodian and preparation of regulatory filings. The Board considered the Adviser’s procedures for executing portfolio transactions for U.S. Small-Cap. The Board also reviewed the Adviser’s policies and procedures for the selection of brokers and dealers and on obtaining research from brokers.
In determining whether the terms of each Agreement are reasonable and fair, the Board considered the terms and fee structure of each Agreement. In that connection, the Board considered the costs to the Manager and the Adviser in providing services to U.S. Small-Cap and profitability for the Manager and its affiliates from their overall association with U.S. Small-Cap. The Board reviewed information about the advisory fee schedule and overall expense ratio of U.S. Small-Cap and comparable fee schedules and expense ratios of a peer group of funds. In considering whether any economies of scale experienced by the Manager and the Adviser in providing services to U.S. Small-Cap were shared with U.S. Small-Cap, the Board noted that U.S. Small-Cap’s advisory fee structure provides for a reduction of the effective fee rate as asset levels increase and that the Manager has voluntarily waived fees for U.S. Small Cap. The Board also compared U.S. Small-Cap’s advisory fee schedule to the advisory fees charged by the Manager and the Adviser to their other accounts managed in a similar style. In that connection, the Board considered the differences in the level of services provided and the differences in responsibility of the Manager and the Adviser to U.S. Small-Cap and to the other accounts. Finally, the Board considered other benefits accruing to the Manager, the Adviser and their affiliates by virtue of their relationship to U.S. Small-Cap.
After an evaluation of all material factors, including those in the foregoing discussion, the Board concluded that the continuation of each Agreement is in the best interest of U.S. Small-Cap.
Investment Managers
For American Leading Companies Trust:
Legg Mason Capital Management, Inc.
Baltimore, MD
For U.S. Small-Cap Value Trust:
Legg Mason Fund Adviser, Inc.
Baltimore, MD
Investment Advisers
For American Leading Companies Trust:
Legg Mason Capital Management, Inc.
Baltimore, MD
For U.S. Small-Cap Value Trust:
Brandywine Global Investment Management, LLC
Philadelphia, PA
Board of Directors
Mark R. Fetting, Chairman
David R. Odenath, President
Dr. Ruby P. Hearn
Arnold L. Lehman
Robin J.W. Masters
Dr. Jill E. McGovern
Arthur S. Mehlman
G. Peter O’Brien
S. Ford Rowan
Robert M. Tarola
Officers
R. Jay Gerken, Vice President
Kaprel Ozsolak, Chief Financial Officer and Treasurer
Robert I. Frenkel, Secretary and Chief Legal Officer
Ted P. Becker, Vice President and Chief Compliance Officer
Transfer and Shareholder Servicing Agent
Boston Financial Data Services
Braintree, MA
Custodian
State Street Bank & Trust Company
Boston, MA
Counsel
K&L Gates LLP
Washington, DC
Independent Registered Public Accounting Firm
PricewaterhouseCoopers LLP
Baltimore, MD
About the Legg Mason Funds
| | | | |
| | Equity Funds American Leading Companies Trust Batterymarch U.S. Small Capitalization Equity Portfolio Classic Valuation Fund Growth Trust Special Investment Trust U.S. Small-Capitalization Value Trust Value Trust Specialty Fund Opportunity Trust Global Funds Emerging Markets Trust International Equity Trust Taxable Bond Funds Investment Grade Income Portfolio Limited Duration Bond Portfolio Tax-Free Bond Fund Maryland Tax-Free Income Trust | | Legg Mason, Inc., based in Baltimore, Maryland, has built its reputation, at least in part, on the success of the Legg Mason Funds, introduced in 1979. The primary purpose of our funds is to enable investors to diversify their portfolios across various asset classes and, consequently, enjoy the stability and growth prospects generally associated with diversification. The success of our funds is contingent on the experience, discipline, and acumen of our fund managers. We believe the quality of our managers is crucial to investment success. Unlike many firms, which focus on a particular asset class or the fluctuations of the market, at Legg Mason we focus on providing a collection of top-notch managers in all the major asset classes. Information about the policies and procedures that each Fund uses to determine how to vote proxies relating to its portfolio securities is contained in the Statement of Additional Information, available without charge upon request by calling 1-800-822-5544 or on the Securities and Exchange Commission’s (“SEC”) website (http://www.sec.gov). Information regarding how each Fund voted proxies relating to portfolio securities during the most recent twelve-month period ended June 30 is also available on the SEC’s website or through the Legg Mason Funds’ website at www.leggmason.com/individualinvestors. Each Fund files a complete schedule of portfolio holdings with the SEC for the first and third quarters of each fiscal year on Form N-Q. You may obtain a free copy of each Fund’s portfolio holdings as filed on Form N-Q, by contacting each Fund at the appropriate phone number, address or website listed below. Additionally, each Fund’s Form N-Q is available on the SEC’s website (http://www.sec.gov) or may be reviewed and copied at the SEC’s Public Reference Room in Washington, DC. Information about the operation of the Public Reference Room may be obtained by calling 1-800-SEC-0330. |
This report must be preceded or accompanied by a free prospectus. Investors should consider each Fund’s investment objectives, risks, charges, and expenses carefully before investing. The prospectus contains this and other important information about each Fund. For a free prospectus for this or any other Legg Mason Fund, visit www.leggmason.com/individualinvestors. Please read the prospectus carefully before investing.
| | |
Legg Mason Funds For A and C Class Shareholders P.O. Box 55214 Boston, MA 02205-8504 800-822-5544 www.leggmason.com/individualinvestors | | Legg Mason Funds For R, FI and I Class Shareholders P.O. Box 55214 Boston, MA 02205-8504 888-425-6432 www.leggmason.com/individualinvestors |
Legg Mason Investor Services, LLC, Distributor
A Legg Mason, Inc. Subsidiary
LMF-013/A (5/09)/SR09-816
Item 2. Code of Ethics Applicable to Registrant’s Principal Executive Officer and Principal Financial Officer
| | | | | | |
| (a) | | | | Legg Mason Investors Trust, Inc. | | (“Registrant”) has adopted a Code of Ethics, as |
| | | | defined in the instructions to Form N-CSR that applies to the Registrant’s President and Treasurer, which is designed to deter wrongdoing and to promote: |
| | • | | Honest and ethical conduct, including the ethical handling of actual or apparent conflicts of interest between personal and professional relationships; |
| | • | | Full, fair, accurate, timely and understandable disclosure in reports and documents the Registrant files with, or submits to, the SEC or in other public communications made by the Registrant; |
| | • | | Compliance with applicable governmental laws, rules and regulations; |
| | • | | Prompt internal reporting of violations of the Code of Ethics to an appropriate person or persons identified in the Code of Ethics; and |
| | • | | Accountability for adherence to the Code of Ethics. |
| | (d) | The Registrant has not granted a waiver, including an implicit waiver, from a provision of the Code of Ethics to the Registrant’s principal executive officer, principal financial officer, principal accounting officer or controller, or persons performing similar functions during the period covered by this report. |
| | (f) | A copy of the Code of Ethics is attached as Exhibit 12(a)(1) to this Form N-CSR. |
Item 3. Audit Committee Financial Expert
| | | | |
| (a) | | (1) | | The Registrant’s Board of Directors have determined that the Registrant has at least one Audit Committee financial expert serving on its Audit Committee. |
| | | | |
| (a) | | (2) | | The Audit Committee’s financial experts are Mr. Arthur S. Mehlman and Mr. Robert M. Tarola. They are “independent” as defined in Form N-CSR Item 3(a)(2). |
Item 4. Principal Accounting Fees and Services
PricewaterhouseCoopers LLP
Fiscal Year Ended March 31, 2008 – $50,060
| | |
Fiscal Year Ended March 31, 2009 – $72,800 | | |
There were no additional fees billed to the Registrant during either of the last two fiscal years in addition to those disclosed in Item 4(a).
There were no fees billed to the Registrant for assurance and related services that required preapproval by the Audit Committee pursuant to paragraph (c)(7)(ii) of Rule 2-01 of Regulation S-X during the Registrant’s last two fiscal years.
PricewaterhouseCoopers LLP
Fiscal Year Ended March 31, 2008 – $4,800
| | |
Fiscal Year Ended March 31, 2009 – $4,800 | | |
Services include preparation of federal and state income tax returns and preparation of excise tax returns.
There were no fees billed to the Registrant for tax services that required preapproval by the Audit Committee pursuant to paragraph (c)(7)(ii) of Rule 2-01 of Regulation S-X during the Registrant’s last two fiscal years.
There were no fees billed to the Registrant during either of the last two fiscal years in addition to those disclosed in Item 4(a) through Item 4(c) above.
There were no fees billed to the Registrant for services not included in Items 4(a) through 4(c) above that required preapproval by the Audit Committee pursuant to paragraph (c)(7)(ii) of Rule 2-01 of Regulation S-X during the Registrant’s last two fiscal years.
| | | | |
| (e) | | (1) | | The Audit Committee’s policy is to delegate to its chairperson the authority to preapprove items prior to the next meeting of the Committee. Such preapprovals are reported at the next quarterly meeting of the Audit Committee. |
| | |
| | (2) | | There were no services provided to the Registrant that were approved by the Audit Committee pursuant to paragraph (c)(7)(i)(C) of Rule 2-01 of Regulation S-X. |
There were no fees billed to the Registrant for services where pre-approval by the Audit Committee pursuant to paragraph (c)(7)(i)(C) of Rule 2-01 of Regulation S-X during the Registrant’s last two fiscal years.
| | (f) | The percentage of hours expended by the principal accountant’s engagement to audit the Registrant’s financial statements for the most recent fiscal year that were attributed to work performed by persons other than the principal accountants’ full-time, permanent employees was zero. |
| | (g) | Non-Audit Fees for services rendered to Registrant or Registrant’s investment manager and any entity controlling, controlled by, or under common control with the investment manager. |
PricewaterhouseCoopers LLP
Fiscal Year Ended March 31, 2008 – $1,249,000
| | |
Fiscal Year Ended March 31, 2009 –$589,500 | | |
| | (h) | The members of the Registrant’s Audit Committee have considered whether the non-audit services that were rendered by the Registrant’s principal accountant to the Registrant’s investment adviser and any entity controlling, controlled by, or under common control with the investment adviser that provides ongoing services to the Registrant that were not pre-approved pursuant to paragraph (c)(7)(ii) of Rule 2-01 of Regulation S-X are compatible with maintaining the principal accountant’s independence. |
Item 5. Audit Committee of Listed Registrants
The Registrant is not a listed issuer as defined in Rule 10A-3 under the Securities Exchange Act of 1934.
Item 6. Schedule of Investments
The schedule of investments in securities of unaffiliated issuers is included in the annual report.
Item 7. Disclosure of Proxy Voting Policies and Procedures for Closed-End Management Investment Companies
Not applicable.
Item 8. Portfolio Managers of Closed-End Management Investment Companies
Not applicable.
Item 9. Purchases of Equity Securities by Closed-End Management Investment Companies and Affiliated Purchasers
Not applicable.
Item 10. Submission of Matters to a Vote of Security Holders
The Nominating Committee will accept recommendations for nominations from shareholders. Shareholders may forward recommendations to the Fund Secretary at 100 Light Street, 32nd Floor, Baltimore, Maryland 21202, Attn.: Fund Secretary.
Item 11. Controls and Procedures
| | (a) | The Registrant’s principal executive and principal financial officers have concluded, based on their evaluation of the effectiveness of the design and operation of the Registrant’s disclosure controls and procedures (as defined in Rule 30a-3(c) under the Investment Company Act of 1940) as of a date within 90 days of the filing date of this report, that the Registrant’s disclosure controls and procedures are reasonably designed to ensure that information required to be disclosed by the Registrant on Form N-CSR is recorded, processed, summarized and reported within the time periods specified in the SEC’s rule and forms and that information required to be disclosed by the Registrant in the reports that it files or submits on Form N-CSR is accumulated and communicated to the Registrant’s management, including its principal executive and principal financial officers, as appropriate to allow timely decisions regarding required disclosure. |
| | (b) | There were no changes in the Registrant’s internal control over financial reporting (as defined in Rule 30a-3(d) under the Investment Company Act of 1940) during the Registrant’s second fiscal quarter of the period covered by this report that have materially affected, or are reasonably likely to materially affect, the Registrant’s internal control over financial reporting. |
Item 12. Exhibits
| | (a) | File the exhibits listed below as part of this Form. |
| | (1) | The Registrant’s Code of Ethics applicable to Registrant’s principal executive officer and principal financial officer is attached hereto. |
| | (2) | Separate certifications for the Registrant’s chief executive officer and chief financial officer as required by Rule 30a-2(a) under the Investment Company Act of 1940 are attached hereto. |
| | (b) | Separate certifications for the Registrant’s chief executive officer and chief financial officer pursuant to Section 906 of the Sarbanes-Oxley Act of 2002 are attached hereto. |
SIGNATURES
Pursuant to the requirements of the Securities Exchange Act of 1934 and the Investment Company Act of 1940, the Registrant has duly caused this report to be signed on its behalf by the undersigned, thereunto duly authorized.
| | | | |
| Legg Mason Investors Trust, Inc. | | |
| | |
| |
| By: | | /s/ David R. Odenath |
David R. Odenath |
| | | | |
President, | | Legg Mason Investors Trust, Inc. | | |
Pursuant to the requirements of the Securities Exchange Act of 1934 and the Investment Company Act of 1940, this report has been signed below by the following persons on behalf of the Registrant and in the capacities and on the dates indicated.
| | |
| |
| By: | | /s/ David R. Odenath |
David R. Odenath |
| | |
President, Legg Mason Investors Trust, Inc. | | |
| | | | |
| Chief Financial Officer and Treasurer, | | Legg Mason Investors Trust, Inc. | | |