UNITED STATES
SECURITIES AND EXCHANGE COMMISSION
Washington, D.C. 20549
FORM N-CSR
CERTIFIED SHAREHOLDER REPORT OF REGISTERED
MANAGEMENT INVESTMENT COMPANIES
Investment Company Act file number: 811-07692
Name of Registrant: Legg Mason Investors Trust, Inc.
Address of Principal Executive Offices: 100 International Drive, Baltimore, MD 21202
Name and address of agent for service:
Robert I. Frenkel, Esq.
Legg Mason & Co., LLC
100 First Stamford Place
Stamford, CT 21202
Registrant’s telephone number, including area code:
Funds Investor Services 1-800-822-5544
Or
Institutional Shareholder Services 1-888-425-6432
Date of fiscal year end: October 31
Date of reporting period: October 31, 2009
| Item 1. | Report to Shareholders |
Legg Mason Capital Management
American Leading Companies Trust
Annual Report to Shareholders
October 31, 2009

Fund Objective
The Fund seeks long-term capital appreciation and current income consistent with prudent investment risk.
Fund Name Change
Prior to October 5, 2009, the Fund was known as Legg Mason American Leading Companies Trust. There was no change in the Fund’s investment objective or investment policies as a result of the name change.
| | |
Annual Report to Shareholders | | 1 |
To Our Shareholders
We are pleased to provide you with Legg Mason Capital Management American Leading Companies Trust’s short period annual report for the seven months ended October 31, 2009.
Total returns, excluding sales charges, for the seven-month period ended October 31, 2009 were:
| | |
| | | Total Returns (Unaudited)
Seven Months |
Class A | | 43.94% |
Class C* | | 43.34% |
Class I* | | 44.14% |
The performance data quoted represent past performance and do not guarantee future results. The performance stated may have been due to extraordinary market conditions, which may not be sustainable over longer periods. Current performance may be lower or higher than the performance data quoted. To obtain performance data current to the most recent month end, please visit our website at www.leggmason.com/individualinvestors. The investment return and principal value of the Fund will fluctuate so that an investor’s shares, when redeemed, may be worth more or less than the original cost. Calculations assume the reinvestment of dividends and capital gain distributions. Returns have not been adjusted to include sales charges that may apply or the deduction of taxes that a shareholder would pay on Fund distributions. If sales charges were reflected, the performance quoted would be lower. Performance would have been lower if fees and expenses had not been waived and/or reimbursed. Performance figures for periods shorter than one year represent cumulative figures and are not annualized.
The gross expense ratios for Classes A, C and I were 1.34%, 1.89% and 0.87%, respectively, as indicated in the Fund’s most current prospectus dated August 1, 2009. These expenses include management fees, 12b-1 distribution and/or service fees and other expenses. Actual expenses may be higher. For example, expenses may be higher than those shown if average net assets decrease. Net assets are more likely to decrease and Fund expense ratios are more likely to increase when markets are volatile. As a result of expense limitations, the ratio of expenses, other than interest, brokerage, taxes and extraordinary expenses, to average net assets will not exceed 1.20% for Class A shares, 1.95% for Class C shares and 0.95% for Class I shares. These expense limitations may be reduced or terminated at any time.
* Prior to February 1, 2009, Class C was known as the Primary Class. In addition, on February 1, 2009, the class began to charge a contingent deferred sales charge of 1.00% for shares purchased by investors on and after that date and redeemed within one year of purchase. Prior to October 5, 2009, Class I was known as the Institutional Class.
At a meeting held in May 2009, the Fund’s Board of Directors approved changing the fiscal year-end of the Fund from March 31 to October 31. As a result of this change,
| | |
2 | | Annual Report to Shareholders |
shareholders are being provided with a short period annual report and a “stub-period” audit for the seven-month period from April 1, 2009 through October 31, 2009.
Please read on for a more detailed look at the prevailing economic and market conditions during the Fund’s abbreviated reporting period and to learn how those conditions have affected Fund performance. Important information with regard to recent regulatory developments that may affect the Fund is contained in the Notes to Financial Statements included in this report.
Information about the Fund’s performance over longer periods of time is shown in the Performance Information section within this report. For more information about the Fund’s share classes included in this report, please contact your financial advisor.
On behalf of the Board and the entire team at Legg Mason, we appreciate your support.
| | |
Sincerely, 
| | 
|
Mark R. Fetting Chairman | | David R. Odenath President |
November 27, 2009
| | |
Annual Report to Shareholders | | 3 |
Management’s Discussion of Fund Performance
Legg Mason Capital Management American Leading Companies Trust
Total returns, excluding sales charges, for the Fund for the seven-month period from April 1, 2009 through October 31, 2009 are presented below, along with those of comparative indices:
| | |
| | | Total Returns (Unaudited)
Seven Months |
Class A | | 43.94% |
Class C* | | 43.34% |
Class I* | | 44.14% |
S&P 500 IndexA | | 31.53% |
Lipper Large-Cap Value Funds Category AverageB | | 32.40% |
The performance data quoted represent past performance and do not guarantee future results. The performance stated may have been due to extraordinary market conditions, which may not be sustainable over longer periods. Current performance may be lower or higher than the performance data quoted. To obtain performance data current to the most recent month end, please visit our website at www.leggmason.com/individualinvestors. The investment return and principal value of the Fund will fluctuate so that an investor’s shares, when redeemed, may be worth more or less than the original cost. Calculations assume the reinvestment of dividends and capital gain distributions. Returns have not been adjusted to include sales charges that may apply or the deduction of taxes that a shareholder would pay on Fund distributions. If sales charges were reflected, the performance quoted would be lower. Performance would have been lower if fees and expenses had not been waived and/or reimbursed. Performance figures for periods shorter than one year represent cumulative figures and are not annualized.
* Prior to February 1, 2009, Class C was known as the Primary Class. In addition, on February 1, 2009, the class began to charge a contingent deferred sales charge of 1.00% for shares purchased by investors on and after that date and redeemed within one year of purchase. Prior to October 5, 2009, Class I was known as the Institutional Class.
For the seven-month period from April 1, 2009 through October 31, 2009, Class C shares of Legg Mason Capital Management American Leading Companies Trust, excluding sales charges, returned 43.34%. The Fund’s unmanaged benchmark, the S&P 500 Index, returned 31.53% for the same period. The Lipper Large-Cap Value Funds Category Average returned 32.40% over the same time frame.
Following the stock market bottom in early March, equities rallied strongly on the back of encouraging leading economic indicators and earnings surprises to the upside across most market sectors. Many commentators called it a “junk bull market,” as lower-quality firms — those that appeared close to collapse during the downturn — saw the
| | |
4 | | Annual Report to Shareholders |
Management’s Discussion of Fund Performance — Continued
greatest upside on the rebound. While unemployment remains high and is expected to persist in the near term, productivity measurements reached a bottom in the middle of the summer and have since seemed to indicate stabilization. Moreover, it is widely thought that the U.S. economy exited the recession in the summer, which helped stocks rally strongly in August before settling down modestly this fall. The continued weakening of the U.S. dollar, coupled with investor optimism about recovering demand for industrial commodities, helped push crude prices and other commodity prices higher throughout the period. Gold, for instance, made all-time nominal highs into the fall, breaking the psychologically important $1,000 per ounce mark.
The best performing stocks in the Fund during the period were: Hartford Financial Services Group Inc., CBS Corp., Capital One Financial Corp., Jabil Circuit Inc., Prudential Financial Inc., The AES Corp., Aflac Inc., Bank of America Corp., Caterpillar Inc. and Wells Fargo & Co. Laggards included: Sprint Nextel Corp., Lockheed Martin Corp., Health Net Inc., Exxon Mobil Corp., AT&T Inc., Aetna Inc., QUALCOMM Inc., Amgen Inc. and Nokia Oyj (ADR).
On a performance contribution basis, which takes into account both price performance and portfolio weighting, the biggest contributors to performance during the period were: Capital One Financial Corp., eBay Inc., JPMorgan Chase and Co., Hartford Financial Services Group Inc., Hewlett-Packard Co., Texas Instruments Inc., Microsoft Corp. and Caterpillar Inc. The only stocks that detracted from the Fund’s absolute performance during the period were Health Net Inc., Sprint Nextel Corp. and QUALCOMM Inc. Other stocks that contributed the least to the Fund’s performance included Exxon Mobil Corp., Aetna Inc., PepsiCo Inc., AT&T Inc., Procter and Gamble Co., Delta Air Lines Inc., Lockheed Martin Corp. and Pfizer Inc. On a sector basis, the largest contribution to relative performance came from the portfolio’s overweighting in the Financials sector, with strong contributions from Energy and Consumer Discretionary stocks as well. Health Care and Telecommunication Services were lagging sectors in the portfolio, but we mitigated the negative effects by being underweight these groups relative to the benchmark.
Legg Mason Capital Management, Inc.
November 25, 2009
| | |
Annual Report to Shareholders | | 5 |
Portfolio holdings and breakdowns are as of October 31, 2009 and are subject to change and may not be representative of the portfolio manager’s current or future investments. The Fund’s top ten holdings (as a percentage of net assets) as of this date were: Microsoft Corp. (3.9%), Hewlett-Packard Co. (3.8%), eBay Inc. (3.4%), UnitedHealth Group Inc. (3.3%), JPMorgan Chase and Co. (3.2%), International Business Machines Corp. (3.2%), Texas Instruments Inc. (2.9%), Nokia Oyj — ADR (2.7%), Time Warner Inc. (2.7%) and The Goldman Sachs Group Inc. (2.5%). Please refer to pages 16 through 20 for a list and percentage breakdown of the Fund’s holdings.
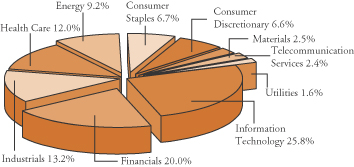
The mention of sector breakdowns is for informational purposes only and should not be construed as a recommendation to purchase or sell any securities. The information provided regarding such sectors is not a sufficient basis upon which to make an investment decision. Investors seeking financial advice regarding the appropriateness of investing in any securities or investment strategies discussed should consult their financial professional. The Fund’s top five sector holdings (as a percentage of net assets) as of October 31, 2009 were: Information Technology (25.8%), Financials (20.0%), Industrials (13.2%), Health Care (12.0%) and Energy (9.3%). The Fund’s portfolio composition is subject to change at any time.
RISKS: Equity securities are subject to price fluctuation and possible loss of principal. The manager’s investment style may become out of favor and/or the manager’s selection process may prove incorrect, which may have a negative impact on the Fund’s performance. Additional risks may include those risks associated with investing in foreign and fixed-income securities. Please see the Fund’s prospectus for more information on these and other risks.
All index performance reflects no deduction for fees, expenses or taxes. Please note that an investor cannot invest directly in an index.
| A | The S&P 500 Index is an unmanaged index of 500 stocks and is generally representative of the performance of larger companies in the U.S. |
| B | Lipper, Inc., a wholly-owned subsidiary of Reuters, provides independent insight on global collective investments. Returns are based on the seven-month period from April 1, 2009 through October 31, 2009, including the reinvestment of all distributions, including returns of capital, if any, calculated among the 550 funds in the Fund’s Lipper category, and excluding sales charges. |
| | |
6 | | Annual Report to Shareholders |
Expense Example (Unaudited)
Legg Mason Capital Management American Leading Companies Trust
As a shareholder of the Fund, you may incur two types of costs: (1) transaction costs, including front-end and back-end sales charges (loads) on purchase payments; and (2) ongoing costs, including management fees, distribution and/or service (12b-1) fees; and other Fund expenses. This example is intended to help you understand your ongoing costs (in dollars) of investing in the Fund and to compare these costs with the ongoing costs of investing in other mutual funds.
This example is based on an investment of $1,000 invested on May 1, 2009 and held through October 31, 2009. The ending values assume dividends were reinvested at the time they were paid.
Actual Expenses
The first line for each class in the table on the next page provides information about actual account values and actual expenses for each class. You may use the information in this line, together with the amount you invested, to estimate the expenses that you paid over the period. Simply divide your account value by $1,000 (for example, an $8,600 account value divided by $1,000 = 8.6), then multiply the result by the number in the first line under the heading entitled “Expenses Paid During the Period” to estimate the expenses you paid on your account if your shares were held through the entire period.
Hypothetical Example for Comparison Purposes
The second line for each class in the table on the next page provides information about hypothetical account values and hypothetical expenses based on the relevant class’s actual expense ratio and an assumed rate of return of 5% per year before expenses, which is not the class’s actual return. The hypothetical account values and expenses may not be used to estimate the actual ending account balance or expenses you paid for the period. You may use this information to compare the ongoing costs of investing in the Fund and other funds. To do so, compare these 5% hypothetical examples with the 5% hypothetical examples for the relevant class that appear in the shareholder reports of other funds. Because the example is intended to be comparable to the examples provided by other funds, it is based on a hypothetical investment of $1,000 invested on May 1, 2009 and held through October 31, 2009. The ending values assume dividends were reinvested at the time they were paid.
| | |
Annual Report to Shareholders | | 7 |
Please note that the expenses shown in the table are meant to highlight your ongoing costs only and do not reflect any transactional costs, such as front-end or back-end sales charges (loads). Therefore, the second line for each class of the table is useful in comparing ongoing costs only, and will not help you determine the relative total costs of owning different funds. In addition, if these transactional costs were included, your costs would have been higher.
| | | | | | | | | |
| | | Beginning
Account
Value
5/1/09 | | Ending
Account
Value
10/31/09 | | Expenses Paid
During the Period1
5/1/09 - 10/31/09 |
Class A | | | | | | | | | |
Actual | | $ | 1,000.00 | | $ | 1,256.30 | | $ | 6.37 |
Hypothetical (5% return before expenses) | | | 1,000.00 | | | 1,019.56 | | | 5.70 |
Class C | | | | | | | | | |
Actual | | $ | 1,000.00 | | $ | 1,252.10 | | $ | 10.62 |
Hypothetical (5% return before expenses) | | | 1,000.00 | | | 1,015.78 | | | 9.50 |
Class I2 | | | | | | | | | |
Actual | | $ | 1,000.00 | | $ | 1,258.00 | | $ | 5.07 |
Hypothetical (5% return before expenses) | | | 1,000.00 | | | 1,020.72 | | | 4.53 |
| 1 | These calculations are based on expenses incurred in the most recent fiscal half-year. The dollar amounts shown as “Expenses Paid” are equal to the annualized expense ratios of 1.12%, 1.87% and 0.89% for Class A, Class C and Class I shares respectively, multiplied by the average values over the period, multiplied by the number of days in the most recent fiscal half-year (184) and divided by 365. |
| 2 | On October 5, 2009, Institutional Class shares were renamed Class I shares. |
| | |
8 | | Annual Report to Shareholders |
Performance Information (Unaudited)
Fund Performance
| | | | | | | | | |
Average Annual Total Returns1 | | | | | | | | | |
| | | Without Sales Charges2 | |
| | | Class A | | | Class C | | | Class I3 | |
Six Months Ended 10/31/09 | | 25.63 | %† | | 25.21 | %† | | 25.80 | %† |
Twelve Months Ended 10/31/09 | | N/A | | | 5.48 | | | 6.39 | |
Five Years Ended 10/31/09 | | N/A | | | –5.13 | | | –4.19 | |
Ten Years Ended 10/31/09 | | N/A | | | –1.95 | | | N/A | |
Inception* through 10/31/09 | | 29.60 | † | | 4.19 | | | –1.58 | |
| | | | |
| | | With Sales Charges4 | |
| | | Class A | | | Class C | | | Class I3 | |
Six Months Ended 10/31/09 | | 18.37 | %† | | 24.21 | %† | | 25.80 | %† |
Twelve Months Ended 10/31/09 | | N/A | | | 4.48 | | | 6.39 | |
Five Years Ended 10/31/09 | | N/A | | | –5.13 | | | –4.19 | |
Ten Years Ended 10/31/09 | | N/A | | | –1.95 | | | N/A | |
Inception* through 10/31/09 | | 22.11 | † | | 4.19 | | | –1.58 | |
| | | | | | | | | |
Cumulative Total Returns1 | | | | | | | | | |
| | | Without Sales Charges2 | |
Class A (Inception date of 2/3/09 through 10/31/09) | | | 29.60 | % | | | |
Class C (10/31/99 through 10/31/09) | | | | | –17.86 | | | | |
Class I3 (Inception date of 6/14/01 through 10/31/09) | | | –12.48 | | | | |
| 1 | All figures represent past performance and are not a guarantee of future results. Investment return and principal value of an investment will fluctuate so that an investor’s shares, when redeemed, may be worth more or less than their original cost. The returns shown do not reflect the deduction of taxes that a shareholder would pay on Fund distributions or the redemption of Fund shares. Performance figures may reflect fee waivers and/or expense reimbursements. In the absence of fee waivers and/or expense reimbursements, the total return would have been lower. |
| 2 | Assumes the reinvestment of all distributions, including returns of capital, if any, at net asset value and does not reflect the deduction of the applicable sales charge with respect to Class A shares or the applicable contingent deferred sales charge (“CDSC”) with respect to Class C shares. On February 1, 2009, Class C shares began to charge a CDSC for shares bought by investors on and after that date and redeemed within one year of purchase. |
| 3 | On October 5, 2009, Institutional Class shares were renamed Class I shares. |
| 4 | Assumes the reinvestment of all distributions, including returns of capital, if any, at net asset value. In addition, Class A shares reflect the deduction of the maximum initial sales charge of 5.75%. Class C shares reflect the deduction of a 1.00% CDSC, which applies if shares are redeemed within one year from purchase payment. |
| * | Inception dates for Class A, Class C and Class I shares are February 3, 2009, September 1, 1993 and June 14, 2001, respectively. |
| | |
Annual Report to Shareholders | | 9 |
Legg Mason Capital Management American Leading Companies Trust
The graphs on the following pages compare the Fund’s total returns to those of the S&P 500 Index. The graphs illustrate the cumulative total return of an initial $10,000 investment in Class A and Class C shares and an initial $1,000,000 investment in Class I1 shares, for the periods indicated. The lines for the Fund represent the total return after deducting all Fund investment management and other administrative expenses and the transaction costs of buying and selling portfolio securities. The lines representing the securities market index do not take into account any transaction costs associated with buying and selling portfolio securities in the index or other administrative expenses.
Total return measures investment performance in terms of appreciation or depreciation in a fund’s net asset value per share, plus dividends and any capital gain distributions. Both the Fund’s results and the index’s results assume the reinvestment of all dividends and distributions at the time they were paid. Average annual returns tend to smooth out variations in a fund’s return, so that they differ from actual year-to-year results.
| 1 | On October 5, 2009, Institutional Class shares were renamed Class I shares. |
| | |
10 | | Annual Report to Shareholders |
Performance Information (Unaudited) — Continued
Growth of a $10,000 Investment — Class A Shares
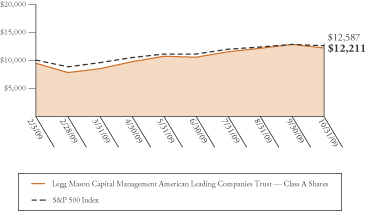
Hypothetical illustration of $10,000 invested in Class A shares on February 3, 2009 (commencement of operations), assuming the deduction of the maximum initial sales charge of 5.75% at the time of investment and the reinvestment of all distributions, including returns of capital, if any, at net asset value through October 31, 2009. The performance data quoted represent past performance and do not guarantee future results. The performance stated may have been due to extraordinary market conditions, which may not be duplicated in the future. Current performance may be lower or higher than the performance data quoted. To obtain the most recent month-end performance information, please visit www.leggmason.com/individualinvestors. The investment return and principal value of the Fund will fluctuate so that an investor’s shares, when redeemed, may be worth more or less than the original cost. Performance would have been lower if fees and expenses had not been waived and/or reimbursed in various periods. Performance for other share classes will vary due to differences in sales charge structure and class expenses.
The graph does not reflect the deduction of taxes that a shareholder would pay on Fund distributions or the redemption of Fund shares.
| | |
Annual Report to Shareholders | | 11 |
Growth of a $10,000 Investment — Class C Shares

Hypothetical illustration of $10,000 invested in Class C shares on October 31, 1999, assuming the reinvestment of all distributions, including returns of capital, if any, at net asset value through October 31, 2009. The performance data quoted represent past performance and do not guarantee future results. The performance stated may have been due to extraordinary market conditions, which may not be duplicated in the future. Current performance may be lower or higher than the performance data quoted. To obtain the most recent month-end performance information, please visit www.leggmason.com/individualinvestors. The investment return and principal value of the Fund will fluctuate so that an investor’s shares, when redeemed, may be worth more or less than the original cost. Performance would have been lower if fees and expenses had not been waived and/or reimbursed in various periods. Performance for other share classes will vary due to differences in sales charge structure and class expenses.
The graph does not reflect the deduction of taxes that a shareholder would pay on Fund distributions or the redemption of Fund shares.
| | |
12 | | Annual Report to Shareholders |
Performance Information (Unaudited) — Continued
Growth of a $1,000,000 Investment — Class I1 Shares
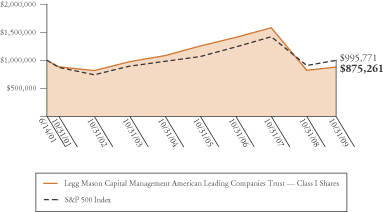
Hypothetical illustration of $1,000,000 invested in Class I shares on June 14, 2001 (commencement of operations), assuming the reinvestment of all distributions, including returns of capital, if any, at net asset value through October 31, 2009. The performance data quoted represent past performance and do not guarantee future results. The performance stated may have been due to extraordinary market conditions, which may not be duplicated in the future. Current performance may be lower or higher than the performance data quoted. To obtain the most recent month-end performance information, please visit www.leggmason.com/individualinvestors. The investment return and principal value of the Fund will fluctuate so that an investor’s shares, when redeemed, may be worth more or less than the original cost. Performance would have been lower if fees and expenses had not been waived and/or reimbursed in various periods. Performance for other share classes will vary due to differences in sales charge structure and class expenses.
The graph does not reflect the deduction of taxes that a shareholder would pay on Fund distributions or the redemption of Fund shares.
| 1 | On October 5, 2009, Institutional Class shares were renamed Class I shares. |
| | |
Annual Report to Shareholders | | 13 |
Portfolio Composition (as of October 31, 2009)1
(As a percentage of the portfolio)
Top 10 Holdings (as of October 31, 2009)1
| | |
| Security | | % of
Net Assets |
Microsoft Corp. | | 3.9% |
Hewlett-Packard Co. | | 3.8% |
eBay Inc. | | 3.4% |
UnitedHealth Group Inc. | | 3.3% |
JPMorgan Chase and Co. | | 3.2% |
International Business Machines Corp. | | 3.2% |
Texas Instruments Inc. | | 2.9% |
Nokia Oyj — ADR | | 2.7% |
Time Warner Inc. | | 2.7% |
The Goldman Sachs Group Inc. | | 2.5% |
| 1 | The Fund is actively managed. As a result, the composition of its portfolio holdings and sectors is subject to change at any time. |
| | |
14 | | Annual Report to Shareholders |
Performance Information (Unaudited) — Continued
Selected Portfolio Performance2
| | | | |
| Strongest performers for the period April 1, 2009 through October 31, 2009 |
| 1. | | Hartford Financial Services Group Inc. | | 214.11% |
| 2. | | CBS Corp. | | 209.70% |
| 3. | | Capital One Financial Corp. | | 200.02% |
| 4. | | Jabil Circuit Inc.* | | 144.75% |
| 5. | | Prudential Financial Inc. | | 137.80% |
| 6. | | The AES Corp. | | 124.96% |
| 7. | | Aflac Inc. | | 117.52% |
| 8. | | Bank of America Corp.* | | 114.11% |
| 9. | | Caterpillar Inc. | | 103.35% |
| 10. | | Wells Fargo & Co. | | 93.96% |
| | | | |
| Weakest performers for the period April 1, 2009 through October 31, 2009 |
| 1. | | Sprint Nextel Corp. | | –17.09% |
| 2. | | Lockheed Martin Corp. | | 1.10% |
| 3. | | Health Net Inc.* | | 2.97% |
| 4. | | Exxon Mobil Corp. | | 6.53% |
| 5. | | AT&T Inc. | | 6.95% |
| 6. | | Aetna Inc. | | 6.99% |
| 7. | | QUALCOMM Inc.* | | 7.03% |
| 8. | | Amgen Inc. | | 8.28% |
| 9. | | Safeway Inc.* | | 11.70% |
| 10. | | Nokia Oyj – ADR | | 12.27% |
| 2 | Individual security performance is measured by the change in the security’s price; for stocks, dividends are assumed to be reinvested at the time they were paid. |
| * | Security held for only a portion of the period. |
| | |
Annual Report to Shareholders | | 15 |
Portfolio Changes
| | |
New positions established during
the period ended October 31, 2009 | | Positions completely sold during
the period ended October 31, 2009 |
Stryker Corp. | | Health Net Inc. |
Safeway Inc. | | Kraft Foods Inc. |
The Boeing Co. | | Devon Energy Corp. |
Bank of America Corp. | | Jabil Circuit Inc. |
Chesapeake Energy Corp. | | Anadarko Petroleum Corp. |
QUALCOMM Inc. | | ConocoPhillips |
| | |
16 | | Annual Report to Shareholders |
Portfolio of Investments
Legg Mason Capital Management American Leading Companies Trust
October 31, 2009
| | | | | | |
| | | Shares | | Value | |
| | | | | | |
Common Stocks and Equity Interests — 100.1% | | | | |
| | |
Consumer Discretionary — 6.6% | | | | | | |
Media — 5.1% | | | | | | |
CBS Corp. | | 320,000 | | $ | 3,766,400 | |
Time Warner Cable Inc. | | 47,608 | | | 1,877,660 | |
Time Warner Inc. | | 200,000 | | | 6,024,000 | |
| | | | | | |
| | | | | 11,668,060 | |
| | | | | | |
Specialty Retail — 1.5% | | | | | | |
The TJX Cos. Inc. | | 90,000 | | | 3,361,500 | |
| | | | | | |
| | |
Consumer Staples — 6.7% | | | | | | |
Beverages — 0.5% | | | | | | |
PepsiCo Inc. | | 18,000 | | | 1,089,900 | |
| | | | | | |
| | |
Food and Staples Retailing — 2.5% | | | | | | |
Costco Wholesale Corp. | | 55,000 | | | 3,126,750 | |
Safeway Inc. | | 120,000 | | | 2,679,600 | |
| | | | | | |
| | | | | 5,806,350 | |
| | | | | | |
Household Products — 0.5% | | | | | | |
Procter and Gamble Co. | | 19,000 | | | 1,102,000 | |
| | | | | | |
| | |
Tobacco — 3.2% | | | | | | |
Altria Group Inc. | | 125,000 | | | 2,263,750 | |
Philip Morris International Inc. | | 105,000 | | | 4,972,800 | |
| | | | | | |
| | | | | 7,236,550 | |
| | | | | | |
| | |
Energy — 9.3% | | | | | | |
Energy Equipment and Services — 6.7% | | | | | | |
Baker Hughes Inc. | | 73,000 | | | 3,071,110 | |
National Oilwell Varco Inc. | | 70,000 | | | 2,869,300 | A |
Noble Corp. | | 88,000 | | | 3,585,120 | |
Transocean Ltd. | | 66,000 | | | 5,538,060 | A |
| | | | | | |
| | | | | 15,063,590 | |
| | | | | | |
| | |
Annual Report to Shareholders | | 17 |
| | | | | | |
| | | Shares | | Value | |
| | | | | | |
Energy — Continued | | | | | | |
Oil, Gas and Consumable Fuels — 2.6% | | | | | | |
Apache Corp. | | 34,000 | | $ | 3,200,080 | |
Chesapeake Energy Corp. | | 50,000 | | | 1,225,000 | |
Exxon Mobil Corp. | | 20,000 | | | 1,433,400 | |
| | | | | | |
| | | | | 5,858,480 | |
| | | | | | |
| | |
Financials — 20.0% | | | | | | |
Capital Markets — 5.2% | | | | | | |
Morgan Stanley | | 100,000 | | | 3,212,000 | |
State Street Corp. | | 70,000 | | | 2,938,600 | |
The Goldman Sachs Group Inc. | | 33,500 | | | 5,700,695 | |
| | | | | | |
| | | | | 11,851,295 | |
| | | | | | |
| | |
Commercial Banks — 1.1% | | | | | | |
Wells Fargo & Co. | | 87,500 | | | 2,408,000 | |
| | | | | | |
| | |
Consumer Finance — 2.5% | | | | | | |
Capital One Financial Corp. | | 155,000 | | | 5,673,000 | |
| | | | | | |
| | |
Diversified Financial Services — 4.6% | | | | | | |
Bank of America Corp. | | 105,000 | | | 1,530,900 | |
JPMorgan Chase and Co. | | 175,000 | | | 7,309,750 | |
NYSE Euronext | | 60,000 | | | 1,551,000 | |
| | | | | | |
| | | | | 10,391,650 | |
| | | | | | |
Insurance — 6.6% | | | | | | |
Aflac Inc. | | 75,000 | | | 3,111,750 | |
Hartford Financial Services Group Inc. | | 175,000 | | | 4,291,000 | |
MetLife Inc. | | 93,000 | | | 3,164,790 | |
Prudential Financial Inc. | | 95,500 | | | 4,319,465 | |
| | | | | | |
| | | | | 14,887,005 | |
| | | | | | |
| | |
Health Care — 12.0% | | | | | | |
Biotechnology — 1.8% | | | | | | |
Amgen Inc. | | 73,000 | | | 3,922,290 | A |
| | | | | | |
| |
Health Care Equipment and Supplies — 1.5% | | | | |
Stryker Corp. | | 75,000 | | | 3,450,000 | |
| | | | | | |
| | |
18 | | Annual Report to Shareholders |
Portfolio of Investments — Continued
Legg Mason Capital Management American Leading Companies Trust — Continued
| | | | | | |
| | | Shares | | Value | |
| | | | | | |
Health Care — Continued | | | | | | |
Health Care Providers and Services — 6.1% | | | | |
Aetna Inc. | | 40,000 | | $ | 1,041,200 | |
UnitedHealth Group Inc. | | 290,000 | | | 7,525,500 | |
WellPoint Inc. | | 112,500 | | | 5,260,500 | A |
| | | | | | |
| | | | | 13,827,200 | |
| | | | | | |
Pharmaceuticals — 2.6% | | | | | | |
Johnson and Johnson | | 70,000 | | | 4,133,500 | |
Pfizer Inc. | | 100,000 | | | 1,703,000 | |
| | | | | | |
| | | | | 5,836,500 | |
| | | | | | |
| | |
Industrials — 13.2% | | | | | | |
Aerospace and Defense — 5.0% | | | | | | |
General Dynamics Corp. | | 62,000 | | | 3,887,400 | |
Lockheed Martin Corp. | | 42,000 | | | 2,889,180 | |
The Boeing Co. | | 40,000 | | | 1,912,000 | |
United Technologies Corp. | | 45,000 | | | 2,765,250 | |
| | | | | | |
| | | | | 11,453,830 | |
| | | | | | |
Airlines — 3.4% | | | | | | |
Delta Air Lines Inc. | | 300,000 | | | 2,142,000 | A |
UAL Corp. | | 850,000 | | | 5,533,500 | A |
| | | | | | |
| | | | | 7,675,500 | |
| | | | | | |
Electrical Equipment — 0.7% | | | | | | |
Emerson Electric Co. | | 40,000 | | | 1,510,000 | |
| | | | | | |
| | |
Industrial Conglomerates — 1.7% | | | | | | |
General Electric Co. | | 265,000 | | | 3,778,900 | |
| | | | | | |
| | |
Machinery — 2.4% | | | | | | |
Caterpillar Inc. | | 100,000 | | | 5,506,000 | |
| | | | | | |
| | |
Information Technology — 25.8% | | | | | | |
Communications Equipment — 4.3% | | | | | | |
Cisco Systems Inc. | | 110,000 | | | 2,513,500 | A |
Nokia Oyj – ADR | | 485,000 | | | 6,115,850 | |
QUALCOMM Inc. | | 25,000 | | | 1,035,250 | |
| | | | | | |
| | | | | 9,664,600 | |
| | | | | | |
| | |
Annual Report to Shareholders | | 19 |
| | | | | | |
| | | Shares | | Value | |
| | | | | | |
Information Technology — Continued | | | | | | |
Computers and Peripherals — 9.1% | | | | | | |
EMC Corp. | | 290,000 | | $ | 4,776,300 | A |
Hewlett-Packard Co. | | 180,000 | | | 8,542,800 | |
International Business Machines Corp. | | 60,300 | | | 7,272,783 | |
| | | | | | |
| | | | | 20,591,883 | |
| | | | | | |
Internet Software and Services — 4.7% | | | | | | |
eBay Inc. | | 345,000 | | | 7,683,150 | A |
Yahoo! Inc. | | 186,000 | | | 2,957,400 | A |
| | | | | | |
| | | | | 10,640,550 | |
| | | | | | |
IT Services — 0.9% | | | | | | |
Accenture PLC | | 57,000 | | | 2,113,560 | |
| | | | | | |
| | |
Semiconductors and Semiconductor Equipment — 2.9% | | | | | | |
Texas Instruments Inc. | | 278,000 | | | 6,519,100 | |
| | | | | | |
| | |
Software — 3.9% | | | | | | |
Microsoft Corp. | | 315,000 | | | 8,734,950 | |
| | | | | | |
| | |
Materials — 2.5% | | | | | | |
Metals and Mining — 2.5% | | | | | | |
Alcoa Inc. | | 25,000 | | | 310,500 | |
Freeport-McMoRan Copper and Gold Inc. | | 22,000 | | | 1,613,920 | A |
United States Steel Corp. | | 107,000 | | | 3,690,430 | |
| | | | | | |
| | | | | 5,614,850 | |
| | | | | | |
| | |
Telecommunication Services — 2.4% | | | | | | |
Diversified Telecommunication Services —1.2% | | | | |
AT&T Inc. | | 110,000 | | | 2,823,700 | |
| | | | | | |
| |
Wireless Telecommunication Services — 1.2% | | | | |
Sprint Nextel Corp. | | 900,000 | | | 2,664,000 | A |
| | | | | | |
| | |
Utilities — 1.6% | | | | | | |
Independent Power Producers and Energy Traders — 1.6% | | | | | | |
The AES Corp. | | 275,000 | | | 3,594,250 | A |
| | | | | | |
| | |
20 | | Annual Report to Shareholders |
Portfolio of Investments — Continued
Legg Mason Capital Management American Leading Companies Trust — Continued
| | | | | | |
| | | | | Value | |
| | | | | | |
Total Common Stocks and Equity Interests
(Cost — $182,191,254) | | | | $ | 226,319,043 | |
Total Investments — 100.1% (Cost — $182,191,254)B | | | 226,319,043 | |
Other Assets Less Liabilities — (0.1)% | | | | | (306,612 | ) |
| | | | | | |
| | |
Net Assets — 100.0% | | | | $ | 226,012,431 | |
| | | | | | |
| B | At October 31, 2009, the aggregate gross unrealized appreciation and depreciation of investments for federal income tax purposes were as follows: |
| | | | |
| Gross unrealized appreciation | | $ | 70,518,177 | |
| Gross unrealized depreciation | | | (26,601,049 | ) |
| | | | |
| Net unrealized appreciation | | $ | 43,917,128 | |
| | | | |
ADR — American Depositary Receipt
See notes to financial statements.
| | |
Annual Report to Shareholders | | 21 |
Statement of Assets and Liabilities
Legg Mason Capital Management American Leading Companies Trust
October 31, 2009
| | | | | | | |
Assets: | | | | | | | |
Investment securities at value
(Cost – $182,191,254) | | | | | $ | 226,319,043 | |
Cash | | | | | | 281,713 | |
Dividends receivable | | | | | | 269,907 | |
Receivable for securities sold | | | | | | 256,943 | |
Receivable for fund shares sold | | | | | | 79,635 | |
Other assets | | | | | | 6,975 | |
| | | | | | | |
Total assets | | | | | | 227,214,216 | |
Liabilities: | | | | | | | |
Payable for fund shares repurchased | | $ | 639,753 | | | | |
Accrued distribution and service fees | | | 184,112 | | | | |
Accrued management fee | | | 141,812 | | | | |
Accrued expenses | | | 236,108 | | | | |
| | | | | | | |
Total liabilities | | | | | | 1,201,785 | |
| | | | | | | |
Net Assets | | | | | $ | 226,012,431 | |
| | | | | | | |
Net assets consist of: | | | | | | | |
Accumulated paid-in-capital | | | | | $ | 258,541,612 | |
Undistributed net investment income | | | | | | 34,443 | |
Accumulated net realized loss on investments | | | | | | (76,691,413 | ) |
Unrealized appreciation of investments | | | | | | 44,127,789 | |
| | | | | | | |
Net Assets | | | | | $ | 226,012,431 | |
| | | | | | | |
Net Asset Value Per Share: | | | | | | | |
Class A (and redemption price) (968,215 shares outstanding) | | | | | | $13.53 | |
Class CA (14,925,554 shares outstanding) | | | | | | $13.46 | |
Class IB (and redemption price) (849,039 shares outstanding) | | | | | | $14.14 | |
Maximum Public Offering Price Per Share: | | | | | | | |
Class A (based on maximum initial sales charge of 5.75%) | | | | | | $14.36 | |
| | | | | | | | |
| A | Redemption price per share is NAV of Class C shares reduced by 1.00% CDSC, if shares are redeemed within one year from purchase payment. |
| B | On October 5, 2009, Institutional Class shares were renamed Class I shares. |
See notes to financial statements.
| | |
22 | | Annual Report to Shareholders |
Statement of Operations
Legg Mason Capital Management American Leading Companies Trust
| | | | | | | | |
For the period ended October 31, 2009† and the year ended March 31, 2009 | | | | | | |
| | | October 31, 2009 | | | March 31, 2009 | |
Investment Income: | | | | | | | | |
Dividends | | $ | 2,110,936 | | | $ | 9,264,485 | |
Interest | | | 327 | | | | 11,404 | |
Less: Foreign taxes withheld | | | (40,202 | ) | | | (74,297 | ) |
| | | | | | | | |
Total income | | $ | 2,071,061 | | | $ | 9,201,592 | |
Expenses: | | | | | | | | |
Distribution and service fees (Notes 3 and 5) | | $ | 1,174,920 | | | $ | 3,370,765 | |
Management fees (Note 3) | | | 908,029 | | | | 2,571,941 | |
Transfer agent and shareholder servicing expenses (Note 5) | | | 82,276 | | | | 224,320 | |
Audit and legal fees | | | 46,954 | | | | 46,351 | |
Directors’ fees and expenses | | | 39,691 | | | | 63,535 | |
Registration fees | | | 25,965 | | | | 74,181 | |
Shareholder reports expenses (Note 5) | | | 24,332 | | | | 171,446 | |
Custodian fees | | | 14,175 | | | | 63,426 | |
Other expenses | | | 1,119 | | | | 55,074 | |
| | | | | | | | |
| | | 2,317,461 | | | | 6,641,039 | |
Less: Fee waivers and/or expense reimbursements
(Notes 3 and 5) | | | (811 | ) | | | (31,173 | ) |
| | | | | | | | |
Net expenses | | | 2,316,650 | | | | 6,609,866 | |
| | | | | | | | |
Net Investment Income (Loss) | | | (245,589 | ) | | | 2,591,726 | |
Net Realized and Unrealized Gain/(Loss) on Investments: | | | | | | | | |
Net realized gain/(loss) on: | | | | | | | | |
Investments | | | 3,787,525 | | | | (61,880,487 | ) |
Foreign currency transactions | | | — | | | | (48,515 | ) |
| | | | | | | | |
| | | 3,787,525 | | | | (61,929,002 | ) |
Change in unrealized appreciation/(depreciation) of: | | | | | | | | |
Investments | | | 71,684,996 | | | | (177,339,424 | ) |
Foreign currency translations | | | — | | | | 4,406 | |
| | | | | | | | |
| | | 71,684,996 | | | | (177,335,018 | ) |
| | | | | | | | |
Net Realized and Unrealized Gain/(Loss) on Investments | | | 75,472,521 | | | | (239,264,020 | ) |
Change in Net Assets Resulting From Operations | | $ | 75,226,932 | | | $ | (236,672,294 | ) |
| † | For the period April 1, 2009 through October 31, 2009. |
See notes to financial statements.
| | |
Annual Report to Shareholders | | 23 |
Statement of Changes in Net Assets
Legg Mason Capital Management American Leading Companies Trust
| | | | | | | | | | | | |
| | | For the
Period Ended,
October 31, 2009† | | | For the Years Ended March 31, | |
| | | | 2009 | | | 2008 | |
Change in Net Assets: | | | | | | | | | | | | |
Net investment income (loss) | | $ | (245,589 | ) | | $ | 2,591,726 | | | $ | 1,793,894 | |
Net realized gain/(loss) | | | 3,787,525 | | | | (61,929,002 | ) | | | 38,783,820 | |
Change in unrealized appreciation/(depreciation) | | | 71,684,996 | | | | (177,335,018 | ) | | | (160,538,236 | ) |
Change in net assets resulting from operations | | | 75,226,932 | | | | (236,672,294 | ) | | | (119,960,522 | ) |
Distributions to shareholders from: | | | | | | | | | | | | |
Net investment income: | | | | | | | | | | | | |
Class CA | | | — | | | | (2,036,660 | ) | | | — | |
Class IB | | | — | | | | (640,229 | ) | | | — | |
Net realized gain on investments: | | | | | | | | | | | | |
Class CA | | | — | | | | (1,224,154 | ) | | | (44,369,956 | ) |
Class IB | | | — | | | | (159,648 | ) | | | (4,690,375 | ) |
Change in net assets from fund share transactions: | | | | | | | | | | | | |
Class A | | | (992,472 | ) | | | 11,074,428 | C | | | — | |
Class CA | | | (26,093,270 | ) | | | (149,544,854 | ) | | | (82,074,308 | ) |
Class IB | | | (1,375,761 | ) | | | (41,294,536 | ) | | | 13,294,031 | |
Change in net assets | | | 46,765,429 | | | | (420,497,947 | ) | | | (237,801,130 | ) |
Net Assets: | | | | | | | | | | | | |
Beginning of period | | | 179,247,002 | | | | 599,744,949 | | | | 837,546,079 | |
End of period | | $ | 226,012,431 | | | $ | 179,247,002 | | | $ | 599,744,949 | |
Undistributed net investment income | | | $34,443 | | | | $28,635 | | | | $1,667,958 | |
| † | For the period April 1, 2009 through October 31, 2009. |
| A | On February 1, 2009, Primary Class shares were renamed Class C shares. |
| B | On October 5, 2009, Institutional Class shares were renamed Class I shares. |
| C | For the period February 3, 2009 (commencement of operations) to March 31, 2009. |
See notes to financial statements.
| | |
24 | | Annual Report to Shareholders |
Financial Highlights
Legg Mason Capital Management American Leading Companies Trust
For a share of each class of capital stock outstanding:
Class A:
| | | | | | |
| | | Period Ended
October 31,
2009A | | | Period Ended
March 31,
2009B | |
Net asset value, beginning of period | | $ 9.40 | | | $10.44 | |
Investment operations: | | | | | | |
Net investment incomeC | | .03 | | | .03 | |
Net realized and unrealized gain/(loss) | | 4.10 | | | (1.07 | ) |
Total from investment operations | | 4.13 | | | (1.04 | ) |
Net asset value, end of period | | $13.53 | | | $ 9.40 | |
Total returnD | | 43.94 | % | | (9.96 | )% |
Ratios to Average Net Assets:E | | | | | | |
Total expensesF | | 1.14 | % | | 1.34 | % |
Expenses net of waivers and/or expense reimbursements, if anyF | | 1.13 | % | | 1.10 | % |
Expenses net of all reductionsF | | 1.13 | % | | 1.10 | % |
Net investment income | | .46 | % | | 1.93 | % |
Supplemental Data: | | | | | | |
Portfolio turnover rate | | 9.0 | % | | 33.4 | % |
Net assets, end of period (in thousands) | | $13,099 | | | $9,877 | |
| A | For the period April 1, 2009 through October 31, 2009. |
| B | For the period February 3, 2009 (commencement of operations) to March 31, 2009. |
| C | Computed using average daily shares outstanding. |
| D | Performance figures, exclusive of sales charges, may reflect compensating balance credits, fee waivers and/or expense reimbursements. In the absence of compensating balance credits, fee waivers and/or expense reimbursements, the total return would have been lower. Past performance is no guarantee of future results. Total returns for periods of less than one year are not annualized. |
| F | Total expenses reflects operating expenses prior to any expense waivers, expense reimbursements and/or compensating balance credits. Expenses net of waivers and/or expense reimbursements reflects total expenses before compensating balance credits but net of any expense waivers and/or expense reimbursements. Expenses net of all reductions reflects expenses less any compensating balance credits, expense waivers and/or expense reimbursements. |
| See | notes to financial statements. |
| | |
Annual Report to Shareholders | | 25 |
For a share of each class of capital stock outstanding:
Class CA:
| | | | | | | | | | | | | | | | | | |
| | | Period Ended
October 31,
2009B | | | Years Ended March 31, | |
| | | 2009 | | | 2008 | | | 2007 | | | 2006 | | | 2005 | |
Net asset value, beginning of period | | $ 9.39 | | | $19.52 | | | $24.87 | | | $24.59 | | | $21.85 | | | $19.85 | |
Investment operations: | | | | | | | | | | | | | | | | | | |
Net investment income/(loss) | | (.02 | )C | | .09 | C | | .03 | C | | (.06 | )C | | .01 | | | .00 | D |
Net realized and unrealized gain/(loss) | | 4.09 | | | (10.07 | ) | | (3.81 | ) | | 1.64 | | | 2.73 | | | 2.01 | |
Total from investment operations | | 4.07 | | | (9.98 | ) | | (3.78 | ) | | 1.58 | | | 2.74 | | | 2.01 | |
Distributions from: | | | | | | | | | | | | | | | | | | |
Net investment income | | — | | | (.10 | ) | | — | | | (.01 | ) | | — | | | (.01 | ) |
Net realized gain on investments | | — | | | (.05 | ) | | (1.57 | ) | | (1.29 | ) | | — | | | — | |
Total distributions | | — | | | (.15 | ) | | (1.57 | ) | | (1.30 | ) | | — | | | (.01 | ) |
Net asset value, end of period | | $13.46 | | | $ 9.39 | | | $19.52 | | | $24.87 | | | $24.59 | | | $21.85 | |
Total returnE | | 43.34 | % | | (51.32 | )% | | (16.24 | )% | | 6.68 | % | | 12.54 | % | | 10.12 | % |
Ratios to Average Net Assets: | | | | | | | | | | | | | | | | | | |
Total expensesF | | 1.88 | %G | | 1.89 | % | | 1.83 | % | | 1.85 | % | | 1.86 | % | | 1.88 | % |
Expenses net of waivers and/or expense reimbursements, if anyF | | 1.88 | %G | | 1.88 | % | | 1.83 | % | | 1.85 | % | | 1.86 | % | | 1.88 | % |
Expenses net of all reductionsF | | 1.88 | %G | | 1.88 | % | | 1.83 | % | | 1.85 | % | | 1.86 | % | | 1.88 | % |
Net investment income (loss) | | (.28 | )%G | | .62 | % | | .12 | % | | (.23 | )% | | .04 | % | | (.01 | )% |
Supplemental Data: | | | | | | | | | | | | | | | | | | |
Portfolio turnover rate | | 9.0 | % | | 33.4 | % | | 28.4 | % | | 19.0 | % | | 14.3 | % | | 19.4 | % |
Net assets, end of period (in thousands) | | $200,905 | | | $159,944 | | | $531,186 | | | $765,000 | | | $757,630 | | | $654,019 | |
| A | On February 1, 2009, Primary Class shares were renamed Class C shares. |
| B | For the period April 1, 2009 through October 31, 2009. |
| C | Computed using average daily shares outstanding. |
| D | Amount less than $.01 per share. |
| E | Performance figures, exclusive of CDSC, may reflect compensating balance credits, fee waivers and/or expense reimbursements. In the absence of compensating balance credits, fee waivers and/or expense reimbursements, the total return would have been lower. Past performance is no guarantee of future results. Total returns for periods of less than one year are not annualized. |
| F | Total expenses reflects operating expenses prior to any expense waivers, expense reimbursements and/or compensating balance credits. Expenses net of waivers and/or expense reimbursements reflects total expenses before compensating balance credits but net of any expense waivers and/or expense reimbursements. Expenses net of all reductions reflects expenses less any compensating balance credits, expense waivers and/or expense reimbursements. |
| See | notes to financial statements. |
| | |
26 | | Annual Report to Shareholders |
Financial Highlights — Continued
Legg Mason Capital Management American Leading Companies Trust
For a share of each class of capital stock outstanding:
Class IA:
| | | | | | | | | | | | | | | | | | |
| | | Period Ended
October 31,
2009B | | | Years Ended March 31, | |
| | | 2009 | | | 2008 | | | 2007 | | | 2006 | | | 2005 | |
Net asset value, beginning of
period | | $ 9.81 | | | $20.57 | | | $25.86 | | | $25.33 | | | $22.34 | | | $20.28 | |
Investment operations: | | | | | | | | | | | | | | | | | | |
Net investment income | | .05 | C | | .28 | C | | .31 | C | | .23 | C | | .22 | | | .21 | |
Net realized and unrealized
gain/(loss) | | 4.28 | | | (10.63 | ) | | (4.03 | ) | | 1.67 | | | 2.82 | | | 2.06 | |
Total from investment
operations | | 4.33 | | | (10.35 | ) | | (3.72 | ) | | 1.90 | | | 3.04 | | | 2.27 | |
Distributions from: | | | | | | | | | | | | | | | | | | |
Net investment income | | — | | | (.36 | ) | | — | | | (.08 | ) | | (.05 | ) | | (.21 | ) |
Net realized gain on
investments | | — | | | (.05 | ) | | (1.57 | ) | | (1.29 | ) | | — | | | — | |
Total distributions | | — | | | (.41 | ) | | (1.57 | ) | | (1.37 | ) | | (.05 | ) | | (.21 | ) |
Net asset value, end of period | | $14.14 | | | $ 9.81 | | | $20.57 | | | $25.86 | | | $25.33 | | | $22.34 | |
Total returnD | | 44.14 | % | | (50.86 | )% | | (15.37 | )% | | 7.77 | % | | 13.63 | % | | 11.21 | % |
Ratios to Average Net Assets: | | | | | | | | | | | | | | | | | | |
Total expensesE | | .89 | %F | | .87 | % | | .79 | % | | .82 | % | | .84 | % | | .90 | % |
Expenses net of waivers and/
or expense
reimbursements, if anyE | | .89 | %F | | .86 | % | | .79 | % | | .82 | % | | .84 | % | | .90 | % |
Expenses net of all
reductionsE | | .89 | %F | | .86 | % | | .79 | % | | .82 | % | | .84 | % | | .90 | % |
Net investment income | | .70 | %F | | 1.61 | % | | 1.22 | % | | .90 | % | | 1.09 | % | | .99 | % |
Supplemental Data: | | | | | | | | | | | | | | | | | | |
Portfolio turnover rate | | 9.0 | % | | 33.4 | % | | 28.4 | % | | 19.0 | % | | 14.3 | % | | 19.4 | % |
Net assets, end of period (in thousands) | | $12,008 | | | $9,426 | | | $68,559 | | | $72,546 | | | $41,476 | | | $21,386 | |
| A | On October 5, 2009, Institutional Class shares were renamed Class I shares. |
| B | For the period April 1, 2009 through October 31, 2009. |
| C | Computed using average daily shares outstanding. |
| D | Performance figures may reflect compensating balance credits, fee waivers and/or expense reimbursements. In the absence of compensating balance credits, fee waivers and/or expense reimbursements, the total return would have been lower. Past performance is no guarantee of future results. Total returns for periods of less than one year are not annualized. |
| E | Total expenses reflects operating expenses prior to any expense waivers, expense reimbursements and/or compensating balance credits. Expenses net of waivers and/or expense reimbursements reflects total expenses before compensating balance credits but net of any expense waivers and/or expense reimbursements. Expenses net of all reductions reflects expenses less any compensating balance credits, expense waivers and/or expense reimbursements. |
See notes to financial statements.
| | |
Annual Report to Shareholders | | 27 |
Notes to Financial Statements
Legg Mason Capital Management American Leading Companies Trust
1. Organization and Significant Accounting Policies:
Legg Mason Capital Management American Leading Companies Trust (formerly known as Legg Mason American Leading Companies Trust) (the “Fund”) is a separate series of Legg Mason Investors Trust, Inc. (“Corporation”) registered under the Investment Company Act of 1940, as amended (“1940 Act”), as an open-end, diversified investment company. At the May 2009 meeting, the Board of Directors approved changing the Fund’s fiscal year end from March 31st to October 31st. This change resulted in the “stub period” annual report being produced for the seven-month period ending October 31, 2009.
The Fund currently offers three classes of shares: Class A, Class C and Class I (formerly known as Institutional Class). The income and expenses of the Fund are allocated proportionately to each class of shares based on daily net assets, except for Rule 12b-1 distribution and/or service fees, which are charged only on Class A and Class C shares. Transfer agent and shareholder servicing expenses are charged separately for each class.
The following are significant accounting policies consistently followed by the Fund and are in conformity with U.S. generally accepted accounting principles (“GAAP”). Estimates and assumptions are required to be made regarding assets, liabilities and changes in net assets resulting from operations when financial statements are prepared. Changes in the economic environment, financial markets and any other parameters used in determining these estimates could cause actual results to differ. Subsequent events have been evaluated through December 21, 2009, the issuance date of the financial statements.
Investment Valuation
The Fund’s securities are valued under policies approved by and under the general oversight of the Board of Directors. The Fund has adopted Financial Accounting Standards Board Codification Topic 820 (formerly Statement of Financial Accounting Standards No. 157) (“ASC Topic 820”). ASC Topic 820 establishes a single definition of fair value, creates a three-tier hierarchy as a framework for measuring fair value based on inputs used to value the Fund’s investments, and requires additional disclosure about fair value. The hierarchy of inputs is summarized below.
| | • | | Level 1 – quoted prices in active markets for identical investments |
| | • | | Level 2 – other significant observable inputs (including quoted prices for similar investments, interest rates, prepayment speeds, credit risk, etc.) |
| | • | | Level 3 – significant unobservable inputs (including the Fund’s own assumptions in determining the fair value of investments) |
Equity securities for which market quotations are available are valued at the last sale price or official closing price on the primary market or exchange on which they trade. Debt securities are valued at the last quoted bid prices provided by an independent pricing service that are based on transactions in debt obligations, quotations from bond
| | |
28 | | Annual Report to Shareholders |
Notes to Financial Statements — Continued
Legg Mason Capital Management American Leading Companies Trust — Continued
dealers, market transactions in comparable securities and various other relationships between securities. When prices are not readily available, or are determined not to reflect fair value, such as when the value of a security has been significantly affected by events after the close of the exchange or market on which the security is principally traded, but before the Fund calculates its net asset value, the Fund values these securities at fair value as determined in accordance with the procedures approved by the Fund’s Board of Directors. Short-term obligations with maturities of 60 days or less are valued at amortized cost, which approximates fair value.
The inputs or methodology used for valuing securities are not necessarily an indication of the risk associated with investing in those securities.
The Fund uses valuation techniques to measure fair value that are consistent with the market approach and/or income approach, depending on the type of the security and the particular circumstance. The market approach uses prices and other relevant information generated by market transactions involving identical or comparable securities. The income approach uses valuation techniques to discount estimated future cash flows to present value.
The following is a summary of the inputs used in valuing the Fund’s assets carried at fair value:
| | | | | | | | | | |
| Description | | Quoted Prices
(Level 1) | | Other Significant
Observable Inputs
(Level 2) | | Significant
Unobservable
Inputs
(Level 3) | | Total |
Common Stocks and Equity Interests† | | $ | 226,319,043 | | — | | — | | $ | 226,319,043 |
| | | | | | | | | | |
| †See | Portfolio of Investments for additional detailed categorizations. |
Security Transactions
Security transactions are accounted for as of the trade date. Realized gains and losses from security transactions are reported on an identified cost basis for both financial reporting and federal income tax purposes.
For the period ended October 31, 2009, security transactions (excluding short-term investments) were as follows:
| | |
| Purchases | | Proceeds From Sales |
| $19,490,040 | | $45,257,394 |
Foreign Currency Translation
Assets and liabilities initially expressed in non-U.S. currencies are translated into U.S. dollars using currency exchange rates determined prior to the close of trading on
| | |
Annual Report to Shareholders | | 29 |
the New York Stock Exchange, usually at 2:00 p.m. Eastern time. Purchases and sales of securities and income and expenses are translated into U.S. dollars at the prevailing market rates on the dates of such transactions. The effects of changes in non-U.S. currency exchange rates on investment securities and other assets and liabilities are included with the net realized and unrealized gain or loss on investment securities for the Fund.
Repurchase Agreements
When entering into repurchase agreements, it is the Fund’s policy that its custodian or a third party custodian take possession of the underlying collateral securities, the market value of which, at all times, at least equals the principal amount of the repurchase transaction, including accrued interest. To the extent that any repurchase transaction exceeds one business day, the value of the collateral is marked-to-market daily to ensure the adequacy of the collateral. If the seller defaults, and the market value of the collateral declines or if bankruptcy proceedings are commenced with respect to the seller of the security, realization of the collateral by the Fund may be delayed or limited.
Compensating Balance Credits
The Fund has an arrangement with its custodian bank, whereby a portion of the custodian’s fee is paid indirectly by credits earned on the Fund’s cash on deposit with the bank. This deposit arrangement is an alternative to purchasing overnight investments.
Commission Recapture
The Fund has entered into a directed brokerage agreement with State Street Bank & Trust Company, its custodian, whereby a portion of commissions paid on investment transactions may be rebated to the Fund. Such payments are included in the realized gain/(loss) on investment transactions. During the period ended October 31, 2009, the Fund did not receive any commission rebates.
Redemptions In-Kind
The Fund under certain conditions may redeem its shares in-kind by distributing portfolio securities rather than making cash payment. Gains and losses realized on redemption in-kind transactions are not recognized for tax purposes, and are reclassified from undistributed realized gain (loss) to paid in-capital. During the period ended October 31, 2009, the Fund did not have any redemptions in-kind.
Investment Income and Distributions to Shareholders
Interest income and expenses are recorded on the accrual basis. Bond premiums and discounts are amortized for financial reporting and federal income tax purposes.
| | |
30 | | Annual Report to Shareholders |
Notes to Financial Statements — Continued
Legg Mason Capital Management American Leading Companies Trust — Continued
Dividend income is recorded on the ex-dividend date. Dividends from net investment income, if available, are determined at the class level and paid annually. Net realized capital gain distributions, which are calculated at the Fund level, are declared and paid annually in June, if available. An additional distribution may be made in December, to the extent necessary, in order to comply with federal excise tax requirements. Distributions are determined in accordance with federal income tax regulations, which may differ from those determined in accordance with GAAP. Accordingly, periodic reclassifications are made within the Fund’s capital accounts to reflect income and gains available for distribution under federal income tax regulations.
Foreign Taxes
The Fund is subject to foreign income taxes imposed by certain countries in which it invests. Foreign income taxes are accrued by the Fund and withheld from dividend and interest income.
Market Price Risk
The prices of securities held by the Fund may decline in response to certain events, including those directly involving the companies whose securities are owned by the Fund; conditions affecting the general economy; overall market changes; local, regional or global political, social or economic instability; and currency, interest rate and commodity price fluctuations. The value-oriented, equity-type securities generally purchased by the Fund may involve large price swings and potential for loss.
Other
In the normal course of business, the Fund enters into contracts that provide general indemnifications. The Fund’s maximum exposure under these arrangements is dependent upon claims that may be made against the Fund in the future and, therefore, cannot be estimated; however, based on experience, the risk of material loss from such claims is considered remote.
2. Federal Income Taxes:
It is the Fund’s policy to comply with the federal income and excise tax requirements of the Internal Revenue Code of 1986 (the “Code”), as amended, applicable to regulated investment companies. Accordingly, the Fund intends to distribute its taxable income and net realized gains, if any, to shareholders in accordance with timing requirements imposed by the Code. Therefore, no federal income tax provision is required in the Fund’s financial statements.
Management has analyzed the Fund’s tax positions taken on federal income tax returns for all open tax years and has concluded that as of October 31, 2009, no
| | |
Annual Report to Shareholders | | 31 |
provision for income tax would be required in the Fund’s financial statements. The Fund's federal and state income and federal excise tax returns for tax years for which the applicable statutes of limitations have not expired are subject to examination by Internal Revenue Service and state departments of revenue.
Under the applicable foreign tax laws, a withholding tax may be imposed on interest, dividends and capital gains at various rates.
Reclassifications
GAAP requires that certain components of net assets be adjusted to reflect permanent differences between financial and tax reporting. These reclassifications have no effect on net assets or net asset values per share. During the current period, the following reclassifications have been made:
| | | | | | | |
| | | Undistributed Net
Investment Income | | Paid-in Capital | |
(a) | | $ | 251,397 | | $ | (251,397 | ) |
| (a) | Reclassifications are primarily due to a tax net operating loss. |
Distributions to Shareholders
Subsequent to the fiscal year end, the Fund has made the following ordinary income distributions:
| | | | | | |
Record date Payable date | | Class A | | Class I* |
12/9/2009 | | | | | | |
12/10/2009 | | $ | 0.084553 | | $ | 0.119352 |
| * | On October 5, 2009, Institutional Class shares were renamed Class I shares. |
The Fund did not make any distributions during the fiscal period ended October 31, 2009.
The tax character of distributions paid during the fiscal years ended March 31, were as follows:
| | | | | | |
| | | March 31, 2009 | | March 31, 2008 |
Distributions Paid From: | | | | | | |
Ordinary income | | $ | 4,060,691 | | $ | 1,708,893 |
Net long-term capital gains | | | — | | | 47,351,438 |
| | | | | | |
Total distributions paid | | $ | 4,060,691 | | $ | 49,060,331 |
| | | | | | |
| | |
32 | | Annual Report to Shareholders |
Notes to Financial Statements — Continued
Legg Mason Capital Management American Leading Companies Trust — Continued
Accumulated Earnings on a Tax Basis
As of October 31, 2009, the components of accumulated earnings on a tax basis were as follows:
| | | | |
Undistributed ordinary income — net | | $ | 177,923 | |
Capital loss carryforward* | | | (76,480,752 | ) |
Other book/tax temporary differencesA | | | (143,480 | ) |
Unrealized appreciation/(depreciation)B | | | 43,917,128 | |
| | | | |
Total accumulated earnings/(losses) — net | | $ | (32,529,181 | ) |
| | | | |
| A | Other book/tax temporary differences are attributable primarily to the book/tax differences in the timing of the deductibility of various expenses. |
| B | The difference between book-basis and tax-basis unrealized appreciation/(depreciation) is attributable primarily to the tax deferral of losses on wash sales. |
| * | As of the taxable year ended October 31, 2009, the following capital loss carryforwards are available: |
| | |
Year of Expiration | | Amount |
10/31/2016 | | $(36,469,435) |
10/31/2017 | | (40,011,317) |
| | |
| | $(76,480,752) |
| | |
| | These amounts will be available to offset any future taxable capital gains. |
Tax Cost of Investments
As of October 31, 2009, the aggregate cost of investments for federal income tax purposes was $182,401,915.
3. Transactions With Affiliates:
The Fund has an investment advisory and management agreement with Legg Mason Capital Management, Inc. (“LMCM”). Pursuant to the agreement, LMCM provides the Fund with investment advisory, management and administrative services for which the Fund pays a fee, computed daily and payable monthly, at an annual rate of the Fund’s average daily net assets shown in the table below.
The following chart summarizes the management fees for the Fund:
| | |
Management
Fee | | Net Assets Breakpoint |
| 0.70% | | on net assets up to $1 billion |
| 0.68% | | on net assets $1 billion – $2 billion |
| 0.65% | | on net assets $2 billion – $5 billion |
| 0.62% | | on net assets $5 billion – $10 billion |
| 0.59% | | on net assets in excess of $10 billion |
| | |
Annual Report to Shareholders | | 33 |
LMCM has agreed to waive its fees and/or reimburse expenses in any month to the extent the Fund’s expenses (exclusive of taxes, interest, brokerage and extraordinary expenses) exceed during that month certain annual rates of the Fund’s average daily net assets. These waivers and/or expense reimbursements are effective through December 31, 2011 and cannot be terminated prior to this date without the Board of Directors’ consent. For the period ended October 31, 2009, LMCM waived fees and/or reimbursed expenses in the amount of $811.
The manager is permitted to recapture amounts previously forgone or reimbursed to the Fund during the same fiscal year if the Fund’s total annual operating expenses have fallen to a level below an expense limitation (“expense cap”). In no case will the manager recapture any amount that would result, on any particular business day of the Fund, in the Fund’s total operating expenses exceeding the expense cap.
The following chart summarizes the expense limitations for the Fund:
| | |
| Class | | Expense
Limitation |
Class A | | 1.20% |
Class C | | 1.95% |
Class I1 | | 0.95% |
| 1 | On October 5, 2009, Institutional Class shares were renamed Class I shares. |
During the period, Legg Mason Fund Adviser, Inc. (“LMFA”) served as administrator to the Fund under a sub-administration agreement with LMCM. For LMFA’s services to the Fund, LMCM (not the Fund) paid LMFA a fee, calculated daily and payable monthly, at an annual rate of 0.05% of the average daily net assets of the Fund.
As of September 30, 2009, Legg Mason Partners Fund Advisor, LLC (“LMPFA”) replaced LMFA. Effective upon the substitution, LMPFA assumed the rights and responsibilities of LMFA under its administrative services agreement as described in the Fund’s prospectus.
Legg Mason Investor Services, LLC (“LMIS”) serves as the Fund’s distributor.
There is a maximum initial sales charge of 5.75% for Class A shares. In addition, on February 1, 2009, Class C shares began to charge a contingent deferred sales charge (“CDSC”) of 1.00% on shares bought by investors on or after that date, which applies if shares are redeemed within one year from purchase payment. In certain cases, Class A shares have a 1.00% CDSC, which applies to certain redemptions made within 12 months following purchases of $1,000,000 or more without an initial sales charge.
For the period April 1, 2009 through October 31, 2009, LMIS and its affiliates did not receive sales charges on sales of the Fund’s Class A shares. In addition, for the period ended October 31, 2009, CDSCs paid to LMIS and its affiliates were approximately:
| | | | | | |
| | | Class A | | Class C |
CDSC | | $ | 300 | | $ | 1,500 |
| | |
34 | | Annual Report to Shareholders |
Notes to Financial Statements — Continued
Legg Mason Capital Management American Leading Companies Trust — Continued
LMCM, LMFA, LMPFA and LMIS are wholly owned subsidiaries and corporate affiliates of Legg Mason, Inc.
Under a Deferred Compensation Plan (“Plan”), directors may elect to defer receipt of all or a specified portion of their compensation. A participating director may select one or more funds in which his or her deferred director’s fees will be deemed to be invested. Deferred amounts remain in the Fund until distributed in accordance with the Plan.
4. Derivative Instruments and Hedging Activities:
Financial Accounting Standards Board Codification Topic 815 (formerly Statement of Financial Accounting Standards No. 161) (“ASC Topic 815”) requires enhanced disclosure about an entity’s derivative and hedging activities.
During the period ended October 31, 2009, the Fund did not invest in any derivative instruments.
5. Class Specific Expenses, Waivers and/or Expense Reimbursements:
The Fund has adopted a Rule 12b-1 distribution plan and under that plan the Fund pays a service fee with respect to its Class A and C shares calculated at the annual rate of 0.25% of the average daily net assets of each respective class. The Fund also pays a distribution fee with respect to its Class C shares calculated at the annual rate of 0.75% of the average daily net assets of its Class C shares. Distribution fees are accrued daily and paid monthly.
For the period April 1, 2009 through October 31, 2009, class specific expenses were as follows:
| | | | | | | | | |
| | | Distribution
Fees | | Transfer Agent
and Shareholder
Servicing Expenses | | Shareholder Reports
Expenses1 |
Class A | | $ | 18,238 | | $ | 6,339 | | $ | 182 |
Class C | | | 1,156,682 | | | 70,942 | | | 22,675 |
Class I* | | | — | | | 4,995 | | | 1,475 |
| | | | | | | | | |
Total | | $ | 1,174,920 | | $ | 82,276 | | $ | 24,332 |
| | | | | | | | | |
| | |
Annual Report to Shareholders | | 35 |
For the period April 1, 2009 through October 31, 2009, waivers and/or expense reimbursements by class were as follows:
| | | |
| | | Waivers/Expense
Reimbursements |
Class A | | $ | 811 |
Class C | | | — |
Class I* | | | — |
| | | |
Total | | $ | 811 |
| | | |
| * | On October 5, 2009, Institutional Class shares were renamed Class I shares. |
| 1 | For the period April 1, 2009 to September 10, 2009. Subsequent to September 10, 2009, these expenses were accrued as common fund expenses. |
For the year ended March 31, 2009, class specific expenses were as follows:
| | | | | | | | | |
| | | Distribution
Fees | | Transfer Agent
and Shareholder
Servicing Expenses | | Shareholder Reports
Expenses |
Class AA | | $ | 3,804 | | $ | 1,953 | | $ | 1,230 |
Class CB | | | 3,366,961 | | | 202,746 | | | 166,042 |
Class IC | | | — | | | 19,621 | | | 4,174 |
| | | | | | | | | |
Total | | $ | 3,370,765 | | $ | 224,320 | | $ | 171,446 |
| | | | | | | | | |
For the year ended March 31, 2009, waivers and/or expense reimbursements by class were as follows:
| | | |
| | | Waivers/Expense
Reimbursements |
Class AA | | $ | 3,722 |
Class CB | | | 25,809 |
Class IC | | | 1,642 |
| | | |
Total | | $ | 31,173 |
| | | |
| A | For the period February 3, 2009 (commencement of operations) to March 31, 2009. |
| B | On February 1, 2009, Primary Class shares were renamed Class C shares. |
| C | On October 5, 2009, Institutional Class shares were renamed Class I shares. |
| | |
36 | | Annual Report to Shareholders |
Notes to Financial Statements — Continued
Legg Mason Capital Management American Leading Companies Trust — Continued
6. Line of Credit:
The Fund, along with certain other Legg Mason Funds, participates in a $200 million line of credit (“Credit Agreement”) to be used for temporary or emergency purposes. This 364-day revolving Credit Agreement matures on March 4, 2010. Pursuant to the Credit Agreement, each participating fund is liable only for principal and interest payments related to borrowings made by that fund. Borrowings under the Credit Agreement bear interest at a rate equal to the prevailing federal funds rate plus the federal funds rate margin. The Fund did not utilize the line of credit during the period April 1, 2009 through October 31, 2009.
7. Fund Share Transactions:
At October 31, 2009, there were 100,000,000 shares authorized at $.001 par value for Class A and 250,000,000 shares authorized at $.001 par value for each of Class C and Class I of the Fund. Share transactions are detailed below:
| | | | | | | | | | | | | | | | | | | | | |
| | | Period Ended
October 31, 2009† | | | Year Ended
March 31, 2009 | | | Year Ended
March 31, 2008 | |
| | | Shares | | | Amount | | | Shares | | | Amount | | | Shares | | | Amount | |
Class A | | | | | | | | | | | | | | | | | | | | | |
Shares sold | | 22,568 | | | $ | 292,982 | | | 1,201,487 | A | | $ | 12,544,198 | A | | — | | | | — | |
Shares repurchased | | (105,168 | ) | | | (1,285,454 | ) | | (150,672 | )A | | | (1,469,770 | )A | | — | | | | — | |
| | | | | | | | | | | | | | | | | | | | | |
Net Increase (Decrease) | | (82,600 | ) | | $ | (992,472 | ) | | 1,050,815 | A | | $ | 11,074,428 | A | | — | | | | — | |
| | | | | | | | | | | | | | | | | | | | | |
Class CB | | | | | | | | | | | | | | | | | | | | | |
Shares sold | | 290,289 | | | $ | 3,557,107 | | | 2,832,671 | | | $ | 39,612,249 | | | 2,357,186 | | | $ | 56,648,242 | |
Shares issued on reinvestment | | — | | | | — | | | 251,573 | | | | 3,257,702 | | | 1,793,915 | | | | 42,205,622 | |
Shares repurchased | | (2,394,861 | ) | | | (29,650,377 | ) | | (13,270,477 | ) | | | (192,414,805 | ) | | (7,694,594 | ) | | | (180,928,172 | ) |
| | | | | | | | | | | | | | | | | | | | | |
Net Decrease | | (2,104,572 | ) | | $ | (26,093,270 | ) | | (10,186,233 | ) | | $ | (149,544,854 | ) | | (3,543,493 | ) | | $ | (82,074,308 | ) |
| | | | | | | | | | | | | | | | | | | | | |
Class IC | | | | | | | | | | | | | | | | | | | | | |
Shares sold | | 115,985 | | | $ | 1,481,123 | | | 568,283 | | | $ | 9,715,962 | | | 978,756 | | | $ | 24,402,089 | |
Shares issued on reinvestment | | — | | | | — | | | 49,581 | | | | 783,332 | | | 188,146 | | | | 4,645,699 | |
Shares repurchased | | (227,574 | ) | | | (2,856,884 | ) | | (2,989,913 | ) | | | (51,793,830 | ) | | (639,339 | ) | | | (15,753,757 | ) |
| | | | | | | | | | | | | | | | | | | | | |
Net Increase (Decrease) | | (111,589 | ) | | $ | (1,375,761 | ) | | (2,372,049 | ) | | $ | (41,294,536 | ) | | 527,563 | | | $ | 13,294,031 | |
| | | | | | | | | | | | | | | | | | | | | |
| † | For the period April 1, 2009 through October 31, 2009. |
| A | For the period February 3, 2009 (commencement of operations) to March 31, 2009. |
| B | On February 1, 2009, Primary Class shares were renamed Class C shares. |
| C | On October 5, 2009, Institutional Class shares were renamed Class I shares. |
| | |
Annual Report to Shareholders | | 37 |
Report of Independent Registered Public Accounting Firm
To the Board of Directors of Legg Mason Investors Trust, Inc. and Shareholders of Legg Mason Capital Management American Leading Companies Trust:
In our opinion, the accompanying statement of assets and liabilities, including the portfolio of investments, and the related statements of operations and of changes in net assets and the financial highlights present fairly, in all material respects, the financial position of Legg Mason Capital Management American Leading Companies Trust (a series of Legg Mason Investors Trust, Inc., the “Fund”) at October 31, 2009, the results of its operations, the changes in its net assets, and the financial highlights for each of the periods presented, in conformity with accounting principles generally accepted in the United States of America. These financial statements and financial highlights (hereafter referred to as “financial statements”) are the responsibility of the Fund’s management; our responsibility is to express an opinion on these financial statements based on our audits. We conducted our audits of these financial statements in accordance with the standards of the Public Company Accounting Oversight Board (United States). Those standards require that we plan and perform the audit to obtain reasonable assurance about whether the financial statements are free of material misstatement. An audit includes examining, on a test basis, evidence supporting the amounts and disclosures in the financial statements, assessing the accounting principles used and significant estimates made by management, and evaluating the overall financial statement presentation. We believe that our audits, which included confirmation of securities at October 31, 2009 by correspondence with the custodian and brokers, provide a reasonable basis for our opinion.
PricewaterhouseCoopers LLP
Baltimore, Maryland
December 21, 2009
| | |
38 | | Annual Report to Shareholders |
Directors and Officers
The table below provides information about each of the Corporation’s directors and officers, including biographical information about their business experience and information about their relationships with Legg Mason, Inc. and its affiliates. The mailing address of each director and officer is 100 International Drive, Attn: Fund Secretary, Baltimore, Maryland 21202.
| | | | | | | | |
Name, (Year of
Birth) and Position
with Corporation | | Term of
Office and
Length of
Time
ServedA | | Number of Funds
in Fund Complex
Overseen by
Director | | Other
Directorships
Held by Director | | Principal Occupation(s)
During the Past Five Years |
| INDEPENDENT DIRECTORSB: |
Hearn, Ruby P. (1940) Director | | Since 2004 | | 15 | | None | | Senior Vice President Emerita of The Robert Wood Johnson Foundation (non-profit) since 2001. Formerly: Senior Vice President of The Robert Wood Johnson Foundation (1996-2001). |
Lehman, Arnold L. (1944) Lead Independent Director | | Since 1993 | | 15 | | None | | Director of the Brooklyn Museum since 1997; Trustee of American Federation of Arts since 1998. Formerly: Director of The Baltimore Museum of Art (1979-1997). |
Masters, Robin J.W. (1955) Director | | Since 2002 | | 15 | | Director of Cheyne Capital International Limited (investment advisory firm). Director/Trustee of Legg Mason Asian Funds plc, Legg Mason Institutional Funds plc, Western Asset Fixed Income Funds plc., and Western Asset Debt Securities Fund plc. | | Retired. Formerly: Chief Investment Officer of ACE Limited (insurance) (1986-2000). |
McGovern, Jill E. (1944) Director | | Since 1993 | | 15 | | None | | Senior Consultant, American Institute for Contemporary German Studies (AICGS) since 2007. Formerly: Chief Executive Officer of The Marrow Foundation (non-profit) (1993-2007); Executive Director of the Baltimore International Festival (1991-1993); Senior Assistant to the President of The Johns Hopkins University (1986-1990). |
| | |
Annual Report to Shareholders | | 39 |
| | | | | | | | |
Name, (Year of
Birth) and Position
with Corporation | | Term of
Office and
Length of
Time
ServedA | | Number of Funds
in Fund Complex
Overseen by
Director | | Other
Directorships
Held by Director | | Principal Occupation(s)
During the Past Five Years |
Mehlman, Arthur S. (1942) Director | | Since 2002 | | Director/Trustee of all Legg Mason funds consisting of 15 portfolios; Director/Trustee of the Royce Family of Funds consisting of 28 portfolios. | | Director of Municipal Mortgage & Equity, LLC. | | Retired. Formerly: Partner, KPMG LLP (international accounting firm) (1972-2002). |
O’Brien, G. Peter (1945) Director | | Since 1999 | | Director/Trustee of all Legg Mason funds consisting of 15 portfolios; Director/Trustee of the Royce Family of Funds consisting of 28 portfolios. | | Director of Technology Investment Capital Corp. | | Retired. Trustee Emeritus of Colgate University; Board Member, Hill House, Inc. (residential home care); Board Member, Bridges School (pre- school). Formerly: Managing Director, Equity Capital Markets Group of Merrill Lynch & Co. (1971-1999). |
Rowan, S. Ford (1943) Director | | Since 2002 | | 15 | | None | | Chairman, National Center for Critical Incident Analysis, National Defense University, since 2004; Professional Lecturer in Organizational Sciences, The George Washington University, since 2008. Formerly: Consultant, Rowan & Blewitt Inc. (management consulting) (1984-2007). |
Tarola, Robert M.
(1950)
Director | | Since 2004 | | 15 | | Director of TeleTech Holdings, Inc. (business process outsourcing) | | President of Right Advisory LLC (corporate finance and governance consulting) since 2008; formerly: Senior Vice President and Chief Financial Officer of W.R. Grace & Co. (specialty chemicals and materials) (1999 to 2008), and of MedStar Health, Inc. (hospitals and healthcare) (1996 to 1999); Partner, Price Waterhouse LLP (accounting and auditing) (1984 to 1996). |
| | |
40 | | Annual Report to Shareholders |
Directors and Officers — Continued
| | | | | | | | |
Name, (Year of
Birth) and Position
with Corporation | | Term of
Office and
Length of
Time
ServedA | | Number of Funds
in Fund Complex
Overseen by
Director | | Other
Directorships
Held by Director | | Principal Occupation(s)
During the Past Five Years |
| INTERESTED DIRECTORSC: |
Fetting, Mark R. (1954) Chairman and Director | | Director since 2002 and Chairman since 2008 | | Chairman and Director/Trustee of all Legg Mason Funds consisting of 15 portfolios; Director/Trustee of the Royce Family of Funds consisting of 28 portfolios. | | None | | President, CEO, Chairman and Director of Legg Mason, Inc. and Chairman of Legg Mason Funds since 2008. Formerly: President of all Legg Mason Funds (2001-2008). Senior Executive Vice President of Legg Mason, Inc., Director and/or officer of various Legg Mason, Inc. affiliates (2000-2008). Division President and Senior Officer of Prudential Financial Group, Inc. and related companies, including fund boards and consulting services to subsidiary companies (1991-2000) |
Odenath, David (1957) President and Director | | Since 2008 | | 15 | | None | | Senior Executive Vice President of Legg Mason, Inc. and President of Legg Mason Funds since 2008. Formerly: President of Prudential Annuities (2002-2008); Executive Vice President (2003-2008) of American Skandia Investment Services, Inc; Chief Executive Officer and Director (2003-2008) of American Skandia Life Assurance Corporation, American Skandia Information Services and Technology Corporation and Skandia U.S. Inc.; President, Chief Executive Officer and Director (2003-2008) of American Skandia Marketing, Inc.; President, Chief Executive Officer, Chief Operating Officer and Officer-In-Charge (1999-2003) of Prudential Investments; Senior Vice President (1999-2008) of Prudential Financial, Inc.; formerly Senior Vice President (1993-1999) of PaineWebber Group, Inc. (investment banking) |
| | |
Annual Report to Shareholders | | 41 |
| | | | | | | | |
Name, (Year of
Birth) and Position
with Corporation | | Term of
Office and
Length of
Time
ServedA | | Number of Funds
in Fund Complex
Overseen
by Director | | Other
Directorships
Held by Director | | Principal Occupation(s)
During the Past Five Years |
| EXECUTIVE OFFICERS: |
Gerken, R. Jay (1951) Vice President | | Since 2009 | | N/A | | N/A | | Managing Director of Legg Mason & Co., LLC, Chairman, President and Chief Executive Officer of certain mutual funds associated with Legg Mason Partners Fund Advisor, LLC (“LMPFA”) and its affiliates; President of LMPFA (2006-present); President and CEO of Smith Barney Fund Management LLC and Chairman, President and CEO of Citi Fund Management Inc. (formerly registered investment adviser) (since 2002); formerly, Managing Director of Citigroup Global Markets, Inc. (prior to 2006); formerly, Chairman, President and Chief Executive Officer of Travelers Investment Adviser, Inc. (2002-2005) |
Ozsolak, Kaprel (1965) Chief Financial Officer and Treasurer | | Since 2009 | | N/A | | N/A | | Director of Legg Mason & Co. (since 2005); Chief Financial Officer and Treasurer of certain mutual funds associated with Legg Mason & Co. (since 2005); formerly, Vice President at Citigroup Asset Management (“CAM”) (1996 to 2005); Chief Financial Officer and Treasurer of certain mutual funds associated with CAM (2004 to 2005); Controller of certain mutual funds associated with CAM (2002 to 2004) |
| | |
42 | | Annual Report to Shareholders |
Directors and Officers — Continued
| | | | | | | | |
Name, (Year of
Birth) and Position
with Corporation | | Term of
Office and
Length of
Time
ServedA | | Number of Funds
in Fund Complex
Overseen
by Director | | Other
Directorships
Held by Director | | Principal Occupation(s)
During the Past Five Years |
Frenkel, Robert I. (1954) Secretary and Chief Legal Officer | | Since 2009 | | N/A | | N/A | | Managing Director and General Counsel of Global Mutual Funds for Legg Mason & Co. (since 2005); Secretary and Chief Legal Officer of mutual funds associated with Legg Mason & Co. (2003-present); formerly, Managing Director and General Counsel of Global Mutual Funds for CAM (2000 to 2005); Secretary of CFM (2001 to 2004) |
Becker, Ted P.
(1951)
Vice President and Chief Compliance Officer | | Since 2007 | | N/A | | N/A | | Director of Global Compliance at Legg Mason & Co. (2006 to present); Managing Director of Compliance at Legg Mason & Co. (2005 to present); Chief Compliance Officer with certain mutual funds associated with Legg Mason & Co. (since 2006); Chief Compliance Officer of Legg Mason Partners Fund Advisor, LLC Funds and certain affiliates; Managing Director of Compliance at CAM (2002 to 2005). Prior to 2002, Managing Director-Internal Audit & Risk Review at Citigroup Inc. |
ADDITIONAL INFORMATION ABOUT THE CORPORATION’S DIRECTORS AND OFFICERS IS CONTAINED IN THE STATEMENT OF ADDITIONAL INFORMATION, AVAILABLE WITHOUT CHARGE UPON REQUEST BY CALLING 1-800-822-5544 OR ON THE SECURITIES AND EXCHANGE COMMISSION WEBSITE (http://www.sec.gov).
| A | Officers of the Corporation are elected to serve until their successors are elected and qualified. Directors of the Corporation serve a term of indefinite length until their retirement, in accordance with the Board’s retirement policy, resignation or removal, and stand for re-election by shareholders only as and when required by the 1940 Act. |
| B | Each of the Independent Directors serves on the standing committees of the Board of Directors, which include the Audit Committee (chair: Arthur Mehlman), the Nominating Committee (co-chairs: Peter O’Brien and Jill McGovern), and the Independent Directors Committee (chair: Arnold Lehman). |
| C | Mr. Fetting and Mr. Odenath are considered to be interested persons, as defined in the 1940 Act, of the Corporation on the basis of their current employment with the Fund’s investment adviser or its affiliated entities (including the Fund’s principal underwriter) and Legg Mason, Inc., the parent holding company of these entities, as well as their ownership of Legg Mason, Inc. stock. |
Investment Adviser
Legg Mason Capital Management, Inc.
Baltimore, MD
Board of Directors
Mark R. Fetting, Chairman
David R. Odenath, President
Dr. Ruby P. Hearn
Arnold L. Lehman
Robin J.W. Masters
Dr. Jill E. McGovern
Arthur S. Mehlman
G. Peter O’Brien
S. Ford Rowan
Robert M. Tarola
Officers
R. Jay Gerken, Vice President
Kaprel Ozsolak, Chief Financial Officer and Treasurer
Robert I. Frenkel, Secretary and Chief Legal Officer
Ted P. Becker, Vice President and Chief Compliance Officer
Transfer and Shareholder Servicing Agent
Boston Financial Data Services, Inc.
Quincy, MA
Custodian
State Street Bank & Trust Company
Boston, MA
Counsel
K&L Gates LLP
Washington, DC
Independent Registered Public Accounting Firm
PricewaterhouseCoopers LLP
Baltimore, MD
Legg Mason Capital Management American Leading Companies Trust
LEGG MASON CAPITAL MANAGEMENT AMERICAN LEADING COMPANIES TRUST
Legg Mason Funds
55 Water Street
New York, New York 10041
The Fund files its complete schedules of portfolio holdings with the Securities and Exchange Commission (“SEC”) for the first and third quarters of each fiscal year on Form N-Q. The Fund’s Forms N-Q are available on the SEC’s website at www.sec.gov. The Fund’s Forms N-Q may be reviewed and copied at the SEC’s Public Reference Room in Washington, D.C., and information on the operation of the Public Reference Room may be obtained by calling 1-800-SEC-0330. To obtain information on Form N-Q from the Fund, shareholders can call Funds Investor Services at 1-800-822-5544 or Institutional Shareholder Services at 1-888-425-6432.
Information on how the Fund voted proxies relating to portfolio securities during the prior 12-month period ended June 30th of each year and a description of the policies and procedures that the Fund uses to determine how to vote proxies related to portfolio transactions are available (1) without charge, upon request, by calling Funds Investor Services at 1-800-822-5544 or Institutional Shareholder Services at 1-888-425-6432, (2) on the Fund’s website at www.leggmason.com/individualinvestors and (3) on the SEC’s website at www.sec.gov.
This report is submitted for the general information of the shareholders of Legg Mason Capital Management American Leading Companies Trust. This report is not authorized for distribution to prospective investors in Legg Mason Capital Management American Leading Companies Trust unless preceded or accompanied by a current prospectus.
Investors should consider the Fund’s investment objectives, risks, charges and expenses carefully before investing. The prospectus contains this and other important information about the Fund. Please read the prospectus carefully before investing.
www.leggmason.com/individualinvestors
©2009 Legg Mason Investor Services, LLC
Member FINRA, SIPC
Privacy policy
We are committed to keeping nonpublic personal information about you secure and confidential. This notice is intended to help you understand how we fulfill this commitment. From time to time, we may collect a variety of personal information about you, including:
| • | | Information we receive from you on applications and forms, via the telephone, and through our websites; |
| • | | Information about your transactions with us, our affiliates, or others (such as your purchases, sales, or account balances); and |
| • | | Information we receive from consumer reporting agencies. |
We do not disclose nonpublic personal information about our customers or former customers, except to our affiliates (such as broker-dealers or investment advisers within the Legg Mason family of companies) or as is otherwise permitted by applicable law or regulation. For example, we may share this information with others in order to process your transactions or service an account. We may also provide this information to companies that perform marketing services on our behalf, such as printing and mailing, or to other financial institutions with whom we have joint marketing agreements. When we enter into such agreements, we will require these companies to protect the confidentiality of this information and to use it only to perform the services for which we hired them.
With respect to our internal security procedures, we maintain physical, electronic, and procedural safeguards to protect your nonpublic personal information, and we restrict access to this information.
If you decide at some point either to close your account(s) or become an inactive customer, we will continue to adhere to our privacy policies and practices with respect to your nonpublic personal information.
NOT PART OF THE ANNUAL REPORT
BUILT TO WINSM

At Legg Mason, we’ve assembled a collection of experienced investment management firms and empowered each of them with the tools, the resources and, most importantly, the independence to pursue the strategies they know best.
| • | | Each was purposefully chosen for their commitment to investment excellence. |
| • | | Each is focused on specific investment styles and asset classes. |
| • | | Each exhibits thought leadership in their chosen area of focus. |
Together, we’ve built a powerful portfolio of solutions for financial advisors and their clients. And it has made us a world leader in money management.*
| * | Ranked eleventh-largest money manager in the world, according to Pensions & Investments, May 18, 2009, based on 12/31/08 worldwide assets under management. |
www.leggmason.com/individualinvestors
©2009 Legg Mason Investor Services, LLC Member FINRA, SIPC
LMF-013/A (12/09) SR09-987
NOT PART OF THE ANNUAL REPORT
| Item 2. | Code of Ethics Applicable to Registrant’s Principal Executive Officer and Principal Financial Officer |
| | (a) | Legg Mason Investors Trust, Inc. (“Registrant”) has adopted a Code of Ethics, as defined in the instructions to Form N-CSR that applies to the Registrant’s President and Treasurer, which is designed to deter wrongdoing and to promote: |
| | • | | Honest and ethical conduct, including the ethical handling of actual or apparent conflicts of interest between personal and professional relationships; |
| | • | | Full, fair, accurate, timely and understandable disclosure in reports and documents the Registrant files with, or submits to, the SEC or in other public communications made by the Registrant; |
| | • | | Compliance with applicable governmental laws, rules and regulations; |
| | • | | Prompt internal reporting of violations of the Code of Ethics to an appropriate person or persons identified in the Code of Ethics; and |
| | • | | Accountability for adherence to the Code of Ethics. |
| | (d) | The Registrant has not granted a waiver, including an implicit waiver, from a provision of the Code of Ethics to the Registrant’s principal executive officer, principal financial officer, principal accounting officer or controller, or persons performing similar functions during the period covered by this report. |
| | (f) | A copy of the Code of Ethics is attached as Exhibit 12(a)(1) to this Form N-CSR. |
| Item 3. | Audit Committee Financial Expert |
(a)(1) The Registrant’s Board of Directors have determined that the Registrant has at least one Audit Committee financial expert serving on its Audit Committee.
(a)(2) The Audit Committee’s financial experts are Mr. Arthur S. Mehlman and Mr. Robert M. Tarola. They are “independent” as defined in Form N-CSR Item 3(a)(2).
| Item 4. | Principal Accounting Fees and Services |
PricewaterhouseCoopers LLP
Fiscal Year Ended March 31, 2009 – $72,800
Fiscal Year Ended October 31, 2009 – $30,560
There were no additional fees billed to the Registrant during either of the last two fiscal years in addition to those disclosed in Item 4(a).
There were no fees billed to the Registrant for assurance and related services that required preapproval by the Audit Committee pursuant to paragraph (c)(7)(ii) of Rule 2-01 of Regulation S-X during the Registrant’s last two fiscal years.
PricewaterhouseCoopers LLP
Fiscal Year Ended March 31, 2009 – $4,800
Fiscal Year Ended October 31, 2009 – $7,000
Services include preparation of federal and state income tax returns and preparation of excise tax returns.
There were no fees billed to the Registrant for tax services that required preapproval by the Audit Committee pursuant to paragraph (c)(7)(ii) of Rule 2-01 of Regulation S-X during the Registrant’s last two fiscal years.
There were no fees billed to the Registrant during either of the last two fiscal years in addition to those disclosed in Item 4(a) through Item 4(c) above.
There were no fees billed to the Registrant for services not included in Items 4(a) through 4(c) above that required preapproval by the Audit Committee pursuant to paragraph (c)(7)(ii) of Rule 2-01 of Regulation S-X during the Registrant’s last two fiscal years.
| | | | |
(e) | | (1) | | The Audit Committee’s policy is to delegate to its chairperson the authority to preapprove items prior to the next meeting of the Committee. Such preapprovals are reported at the next quarterly meeting of the Audit Committee. |
| | |
| | (2) | | There were no services provided to the Registrant that were approved by the Audit Committee pursuant to paragraph (c)(7)(i)(C) of Rule 2-01 of Regulation S-X. |
There were no fees billed to the Registrant for services where pre-approval by the Audit Committee pursuant to paragraph (c)(7)(i)(C) of Rule 2-01 of Regulation S-X during the Registrant’s last two fiscal years.
| | (f) | The percentage of hours expended by the principal accountant’s engagement to audit the Registrant’s financial statements for the most recent fiscal year that were attributed to work performed by persons other than the principal accountants’ full-time, permanent employees was zero. |
| | (g) | Non-Audit Fees for services rendered to Registrant or Registrant’s investment manager and any entity controlling, controlled by, or under common control with the investment manager. |
PricewaterhouseCoopers LLP
Fiscal Year Ended March 31, 2009 – $589,500
Fiscal Year Ended October 31, 2009 – $ 589,500
| | (h) | The members of the Registrant’s Audit Committee have considered whether the non-audit services that were rendered by the Registrant’s principal accountant to the Registrant’s investment adviser and any entity controlling, controlled by, or under common control with the investment adviser that provides ongoing services to the Registrant that were not pre-approved pursuant to paragraph (c)(7)(ii) of Rule 2-01 of Regulation S-X are compatible with maintaining the principal accountant’s independence. |
| Item 5. | Audit Committee of Listed Registrants |
The Registrant is not a listed issuer as defined in Rule 10A-3 under the Securities Exchange Act of 1934.
| Item 6. | Schedule of Investments |
The schedule of investments in securities of unaffiliated issuers is included in the annual report.
| Item 7. | Disclosure of Proxy Voting Policies and Procedures for Closed-End Management Investment Companies |
Not applicable.
| Item 8. | Portfolio Managers of Closed-End Management Investment Companies |
Not applicable.
| Item 9. | Purchases of Equity Securities by Closed-End Management Investment Companies and Affiliated Purchasers |
Not applicable.
| Item 10. | Submission of Matters to a Vote of Security Holders |
The Nominating Committee will accept recommendations for nominations from shareholders. Shareholders may forward recommendations to the Fund Secretary at 100 International Drive, 7th. Floor, Baltimore, Maryland 21202, Attn.: Fund Secretary.
| Item 11. | Controls and Procedures |
| | (a) | The Registrant’s principal executive and principal financial officers have concluded, based on their evaluation of the effectiveness of the design and operation of the Registrant’s disclosure controls and procedures (as defined in Rule 30a-3(c) under the Investment Company Act of 1940) as of a date within 90 days of the filing date of this report, that the Registrant’s disclosure controls and procedures are reasonably designed to ensure that information required to be disclosed by the Registrant on Form N-CSR is recorded, processed, summarized and reported within the time periods specified in the SEC’s rule and forms and that information required to be disclosed by the Registrant in the reports that it files or submits on Form N-CSR is accumulated and communicated to the Registrant’s management, including its principal executive and principal financial officers, as appropriate to allow timely decisions regarding required disclosure. |
| | (b) | There were no changes in the Registrant’s internal control over financial reporting (as defined in Rule 30a-3(d) under the Investment Company Act of 1940) during the Registrant’s second fiscal quarter of the period covered by this report that have materially affected, or are reasonably likely to materially affect, the Registrant’s internal control over financial reporting. |
| | (a) | File the exhibits listed below as part of this Form. |
| | (1) | The Registrant’s Code of Ethics applicable to Registrant’s principal executive officer and principal financial officer is attached hereto. |
| | (2) | Separate certifications for the Registrant’s chief executive officer and chief financial officer as required by Rule 30a-2(a) under the Investment Company Act of 1940 are attached hereto. |
| | (b) | Separate certifications for the Registrant’s chief executive officer and chief financial officer pursuant to Section 906 of the Sarbanes-Oxley Act of 2002 are attached hereto. |
SIGNATURES
Pursuant to the requirements of the Securities Exchange Act of 1934 and the Investment Company Act of 1940, the Registrant has duly caused this report to be signed on its behalf by the undersigned, thereunto duly authorized.
| | |
| Legg Mason Investors Trust, Inc. |
| |
| By: | | /s/ David R. Odenath |
| | David R. Odenath |
| | President, |
| | Legg Mason Investors Trust, Inc. |
Date: December 30, 2009
Pursuant to the requirements of the Securities Exchange Act of 1934 and the Investment Company Act of 1940, this report has been signed below by the following persons on behalf of the Registrant and in the capacities and on the dates indicated.
| | |
| |
| By: | | /s/ David R. Odenath |
| | David R. Odenath |
| | President, |
| | Legg Mason Investors Trust, Inc. |
Date: December 30, 2009
| | |
| |
| By: | | /s/ Kaprel Ozsolak |
| | Kaprel Ozsolak |
| | Chief Financial Officer and Treasurer, |
| | Legg Mason Investors Trust, Inc. |
Date: December 30, 2009