UNITED STATES
SECURITIES AND EXCHANGE COMMISSION
Washington, D.C. 20549
FORM N-CSR
CERTIFIED SHAREHOLDER REPORT OF REGISTERED
MANAGEMENT INVESTMENT COMPANIES
Investment Company Act file number 811-07692
|
| Legg Mason Investors Trust, Inc. |
(Exact name of Registrant as specified in charter)
|
| 55 Water Street, New York, NY 10041 |
(Address of principal executive offices) (Zip code)
|
Robert I. Frenkel, Esq. Legg Mason & Co., LLC 100 First Stamford Place Stamford, CT 06902 |
(Name and address of agent for service)
Registrant’s telephone number, including area code: 1-877-721-1926
Date of fiscal year end: October 31
Date of reporting period: October 31, 2010
| ITEM 1. | REPORT TO STOCKHOLDERS. |
The Annual Report to Stockholders is filed herewith.
October 31, 2010

Investment Commentary and
Annual Repor t
Legg Mason
Capital Management
American Leading
Companies Trust
INVESTMENT PRODUCTS: NOT FDIC INSURED • NO BANK GUARANTEE • MAY LOSE VALUE
| | |
| II | | Legg Mason Capital Management American Leading Companies Trust |
Fund objective
The Fund seeks long-term capital appreciation and current income consistent with prudent investment risk.
Investment commentary
The U.S. equity market delivered strong returns for the fiscal year ended October 31, 2010, but the path to higher prices was far from smooth. With the exception of a slight pullback in January 2010, stocks moved generally higher in the first half of the fiscal year through mid-April, whereupon concerns about a sovereign debt crisis in Europe combined with a massive oil spill in the Gulf of Mexico and a regulatory assault on Goldman Sachs triggered a steep market correction in May and June, which took the equity market to new lows for the year. Particularly unnerving to investors was the so-called “flash crash” on May 6th, during which the Dow Jones Industrial Average (“DJIA”)i dropped nearly 1,000 points in a matter of minutes, before recovering to close lower for the day by a still discouraging 350 points. Stocks found their sea legs in early July and recovered strongly through the balance of the fiscal year, as investors’ fears about the possibility of a double-dip recession appeared to be overblown and corporate earnings continued their strong recovery.
| | | | |
| Total Returnsii | | | |
| | | 12 months
ended 10/31/10 | |
| S&P 500 Indexiii | | | 16.52 | % |
| DJIA | | | 17.62 | % |
| NASDAQ Composite Indexiv | | | 23.87 | % |
| S&P MidCap 400 Indexv | | | 27.64 | % |
| Russell 2000 Indexvi | | | 26.58 | % |
| Dow Jones U.S. Total Stock Market Indexvii | | | 18.76 | % |
| S&P 100 Indexviii | | | 12.98 | % |
| Russell 1000 Growth Indexix | | | 19.65 | % |
| Russell 1000 Value Indexx | | | 15.71 | % |
Past performance is no guarantee of future results. This table is for illustrative purposes only. Please note that an investor cannot directly invest in an index.
When all was said and done, the year was a solid one for stocks as shown above, but the accompanying volatility so unnerved many investors that they were hardly able to enjoy their gains. Throughout most of the year, investors showed a decided preference for bonds and bond funds over stocks. Gold, which gained 30% over the twelve-month period, has also attracted increasing investor attention as an inflation hedge and alternative to equities.
While investors’ recent infatuation with bonds is understandable, we believe it is wrong-headed. Our strong belief is that investors are once again practicing the “Rear-View Mirror” approach to investing by buying what has done well in the recent past, rather than thinking about what is most likely to do well in the future. Just as investors have been bitterly disappointed with their returns on stocks over the last decade, after loading up on them at the beginning of the millennium, we believe they will come to rue their current love affair with bonds, as rising interest rates over the next decade produce losses in fixed-income securities, particularly those with longer-dated maturities.
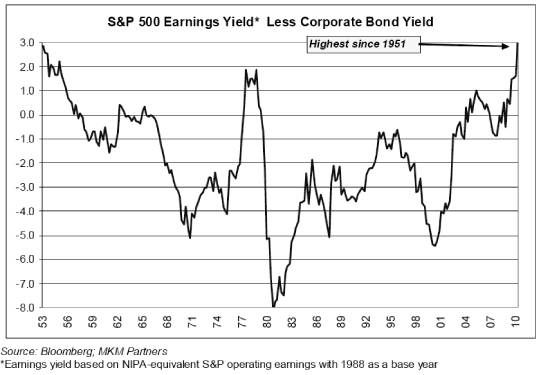
In our opinion, stocks are a much better bet to generate attractive returns over the next five to ten years than bonds. In fact, the chart on the following page (courtesy of Michael T. Darda, Chief Economist at MKM Partners) shows that the earnings yield (the inverse of the better known price-to-earnings (“P/E”) ratioxi) of the S&P 500 Index is at its most attractive level relative to corporate bonds in almost sixty years.
The Investment Commentary is not a part of the Annual Report.
| | | | |
| Legg Mason Capital Management American Leading Companies Trust | | | III | |
Importantly, in our view, the earnings yields below are not based on analysts’ estimates, which are notoriously unreliable, but are based on corporate profits as reported to the IRS and recorded in the Bureau of Economic Analysis’ National Income and Product Account (“NIPA”) tables.
If stocks are so attractive, why then are they not generating more enthusiasm among investors? We think the answer is simply that investors’ experience with equities over the last ten years has been so painful that they have lost faith in stocks as long-term wealth builders. As noted above, they have recently been putting their trust in asset classes which have treated them better, notably cash, Treasury securities and gold.
Taking a much longer-term view, in our opinion, the appeal of stocks as superior wealth builders is far more apparent. We first encountered the table below in Jeremy Siegel’s book, The Future for Investors. The table in the book appears on page 171 and shows total real returns for five assets — stocks, bonds, Treasury bills, gold and the U.S. dollar — from 1802 to 2003. We have updated the figures in the table below through 2009 from data on the author’s website, JeremySiegel.com. The table shows the inflation-adjusted value of one dollar invested in each asset in 1802 with income reinvested.
| | | | |
| Total Real Return Indicesxii | | | |
| | | 1802-2009 | |
| Dollar | | $ | 0.06 | |
| Gold | | $ | 3.17 | |
| Treasury Bills | | $ | 301.00 | |
| Treasury Bonds | | $ | 1,423.00 | |
| Stocks | | $ | 607,279.00 | |
We find the numbers in the table to be quite startling. Over the course of the 207-year period covered, the U.S. dollar has lost 94% of its value, proving that the risk of currency debasement is not a new problem. Gold has proven to be an effective hedge against currency depreciation, as its advocates argue, but has provided virtually no real return. Treasury bills have done considerably better than gold, and Treasury bonds better still, but the clear winner, by a factor of 426 times over its nearest rival, is stocks. In the very long run, it has been absolutely no contest.
The Investment Commentary is not a part of the Annual Report.
| | |
| IV | | Legg Mason Capital Management American Leading Companies Trust |
Investment commentary (cont’d)
Why do stocks so significantly outperform other financial assets over long periods of time? We actually think the answer is fairly simple. Stocks represent ownership interests in businesses. Over time, businesses have the ability to adapt and adjust to changing economic circumstances. Some succeed grandly; others fail miserably. But as a group, they have the ability to evolve, thus giving them the capacity to deliver returns that other financial instruments — whose terms are largely fixed —cannot match. To secure that advantage, equity owners must bear greater risk of short-term loss and higher volatility. Given the magnitude of the difference in returns over time, that strikes us as a risk worth taking.
The dismal performance of equities over the last ten years has caused investors to lose sight of the long-term appeal of equities. We believe stocks are now priced to begin delivering much better returns. One need not stray far from the beaten path to find good quality stocks at very attractive prices. Andrew Bary, in an article in the July 5, 2010 issue of Barron’s entitled “Tempting 10s,” found that thirteen of the top twenty-five companies in the S&P 500 Index traded at or below 10 times estimated 2011 earnings at that time. The average P/E ratio of the group was 8.5 times, with an average dividend yield of 2.6%, a yield, we might add, that is likely to grow to the mid-to-high single-digit range in the future, in contrast to the ten-year Treasury yield which will remain fixed. Though a number of these stocks have rallied along with the market since July, they still represent an attractive hunting ground for investment ideas, in our judgment.
If you gave me the choice of owning a stock portfolio with similar composite characteristics for the next ten years or owning a portfolio composed of equal parts ten-year Treasuries and gold over the same period, I’d take the stocks in a heartbeat.
As always, we thank you for your support and welcome your comments.
David E. Nelson, CFA
Senior Vice President & Portfolio Manager
Legg Mason Capital Management, Inc.
November 15, 2010
The views expressed in this commentary reflect those solely of the portfolio manager as of the date of this commentary and may differ from those of Legg Mason, Inc. as a whole or the other portfolio managers of its affiliates. Any such views are subject to change at any time based on market or other conditions. These views are not intended to be a forecast of future events, a guarantee of future results or investment advice. The information contained herein has been prepared from sources believed to be reliable, but cannot be guaranteed. Forecasts and predictions are inherently limited and should not be relied upon as an indication of actual or future performance. Investors should not use this information as the sole basis for investment decisions.
Any statistics have been obtained from sources the portfolio manager believes to be reliable, but the accuracy and completeness of the information cannot be guaranteed. Investors seeking financial advice regarding the appropriateness of investing in any securities or investment strategies should consult their financial professional.
All investments are subject to risk including the possible loss of principal. Past performance is no guarantee of future results. All index performance reflects no deduction for fees, expenses or taxes. Please note that an investor cannot invest directly in an index.
| i | The Dow Jones Industrial Average ("DJIA") is a widely followed measurement of the stock market. The average is comprised of thirty stocks that represent leading companies in major industries. These stocks, widely held by both individual and institutional investors, are considered to be all blue-chip companies. |
| ii | Source: Wilshire, Russell®, NASDAQ® via Bloomberg, S&P via Bloomberg. |
| iii | The S&P 500 Index is an unmanaged index of 500 stocks and is generally representative of the performance of larger companies in the U.S. |
| iv | The NASDAQ Composite Index is a market-value weighted index, which measures all securities listed on the NASDAQ stock market. |
| v | The S&P MidCap 400 Index is a market value weighted index which consists of 400 domestic stocks chosen for market size, liquidity and industry group representation. |
| vi | The Russell 2000 Index measures the performance of the 2,000 smallest companies in the Russell 3000 Index, which represents approximately 8% of the total market capitalization of the Russell 3000 Index. The Russell 3000 Index measures the performance of the 3,000 largest U.S. companies based on total market capitalization, which represents approximately 98% of the U.S. equity market. |
| vii | The Dow Jones U.S. Total Stock Market Index measures the performance of all U.S. equity securities with readily available prices. |
| viii | The S&P 100 Index is a market-capitalization weighted index consisting of 100 large blue-chip stocks covering a broad range of industries. |
| ix | The Russell 1000 Growth Index measures the performance of those Russell 1000 Index companies with higher price-to-book ratios and higher forecasted growth values. (A price-to-book ratio is the price of a stock compared to the difference between a company’s assets and liabilities.) The Russell 1000 Index measures the performance of the 1,000 largest companies in the Russell 3000 Index, which represents approximately 92% of the total market capitalization of the Russell 3000 Index. |
| x | The Russell 1000 Value Index measures the performance of those Russell 1000 Index companies with lower price-to-book ratios and lower forecasted growth values. |
| xi | The price-to-earnings ("P/E") ratio is a stock's price divided by its earnings per share. |
| xii | Source: JeremySiegel.com |
The Investment Commentary is not a part of the Annual Report.
October 31, 2010
Annual Repor t
Legg Mason
Capital Management
American Leading
Companies Trust
INVESTMENT PRODUCTS: NOT FDIC INSURED • NO BANK GUARANTEE • MAY LOSE VALUE
| | | | |
| Legg Mason Capital Management American Leading Companies Trust 2010 Annual Report | | | 1 | |
Letter to our shareholders
Dear Shareholder,
We are pleased to provide the annual report of Legg Mason Capital Management American Leading Companies Trust for the twelve-month reporting period ended October 31, 2010. Please read on for a detailed look at prevailing economic and market conditions during the Fund’s reporting period and to learn how those conditions have affected Fund performance.
As always, we remain committed to providing you with excellent service and a full spectrum of investment choices. We also remain committed to supplementing the support you receive from your financial advisor. One way we accomplish this is through our website, www.leggmason.com/individualinvestors. Here you can gain immediate access to market and investment information, including:
| Ÿ | | Fund prices and performance, |
| Ÿ | | Market insights and commentaries from our portfolio managers, and |
| Ÿ | | A host of educational resources. |
Special shareholder notice
The Board of Directors of Legg Mason Capital Management American Leading Companies Trust (the “Fund”) recently approved a reorganization pursuant to which the Fund’s assets would be acquired, and its liabilities would be assumed, by Legg Mason Capital Management Value Trust, Inc. (the “Acquiring Fund”) in exchange for shares of the Acquiring Fund. The Fund would then be liquidated, and shares of the Acquiring Fund would be distributed to Fund shareholders.
Under the reorganization, Fund shareholders would receive shares of the Acquiring Fund with the same aggregate net asset value (“NAV”)i as their shares of the Fund. It is anticipated that no gain or loss for federal income tax purposes would be recognized by Fund shareholders as a result of the reorganization.
The reorganization is subject to the satisfaction of certain conditions, including approval by Fund shareholders. Proxy materials describing the reorganization are expected to be mailed in the first quarter of 2011. If the reorganization is approved by Fund shareholders, it is expected to occur in April 2011. Prior to the reorganization, shareholders can continue to purchase, redeem and exchange shares subject to the limitations described in the Fund’s prospectus.
We look forward to helping you meet your financial goals.
Sincerely,
| | |
 | |  |
Mark R. Fetting Chairman | | David R. Odenath President |
November 26, 2010
| i | Net asset value ("NAV") is the dollar value of a single mutual fund share, based on the value of the underlying assets of the fund minus its liabilities, divided by the number of shares outstanding. NAV is calculated at the end of each business day. |
| | |
| 2 | | Legg Mason Capital Management American Leading Companies Trust 2010 Annual Report |
Fund overview
Q. What is the Fund’s investment strategy?
A. The Fund seeks long-term capital appreciation and current income consistent with prudent investment risk. The Fund invests primarily in securities that, in our opinion, offer the potential for capital appreciation and current income. Under normal circumstances, the Fund will seek to achieve its objective by investing at least 80% of its net assets in common stocks of “Leading Companies” that are tied economically to the United States. At least 75% of the dollar amount of stocks held by the Fund will have a recent history of paying dividends. We define a “Leading Company” as one that, in our opinion, has attained a major market share in one or more products or services within one or more of its principal industries and possesses the potential to maintain or increase market share and profit in the future. Such companies are typically well-known as leaders in their respective industries; most are found in the top half of the S&P 500 Indexi.
We follow a value discipline in selecting securities and, therefore, seek to purchase securities at large discounts to our assessment of their intrinsic value. Under normal circumstances, we expect that the Fund will own a minimum of thirty-five different securities. We currently anticipate that the Fund will not own more than 20% of its net assets in foreign securities, which is any security not economically tied to the United States. The Fund may invest up to 20% of its net assets in debt securities.
Q. What were the overall market conditions during the Fund’s reporting period?
A. Equity markets seesawed over the past year as investors tried to make sense of mixed economic reports, government debt worries, lingering mortgage concerns and policy changes. Investor attitudes were tepid toward stocks as evidenced by massive outflows. Despite lukewarm investor sentiment, stocks have risen over the past twelve months. The second quarter proved rocky, coinciding with surprisingly negative unemployment data, an increasingly complex sovereign debt situation in Europe, a massive oil spill in the Gulf of Mexico and a surprising regulatory assault on Goldman Sachs. May’s “flash crash” further compounded investors’ unease and hesitancy to buy stocks. The equity market bottomed in early July and rallied again on better-than-expected corporate profits. Fear about
mortgage putbacks hurting banks’ profitability and their willingness to lend money helped pull the market lower in August, with Financials stocks faring the worst of any sector that month. Stocks then rallied hard over the last two months of the reporting period on strong macro data and on expectations that the Federal Reserve Board (“Fed”)ii would remain accommodative. September began with robust manufacturing and labor data, sending the market higher by over 5% during the first three trading days of the month. The equity market continued its advance through October as investors came to interpret the Fed’s accommodative stance as a put option on the equity market, since the Fed said that inflation was short of their target while unemployment was too high.
Q. How did we respond to these changing market conditions?
A. We continued to follow our valuation discipline in navigating the volatile market environment over the past twelve months. This manifested itself in the portfolio in two main ways. First, as our pro-cyclical bets paid off and became incrementally less attractive from a valuation standpoint, we shifted capital toward sectors that benefited less from a cyclical rebound but that were increasingly embedding lower expectations due to investors chasing after growth in what seemed like a growth-challenged market. This included taking new positions in companies like Wal-Mart Stores Inc., Kellogg Co. and Colgate-Palmolive Co., as well as beaten-down Health Care companies like Johnson & Johnson, Medtronic Inc. and Stryker Corp. Second, as most measures of risk in the economy began to normalize, valuation dispersions shrank and there were less obvious mispricings in the market. This, coupled with the volatile market environment, suggested lowering the risk profile of the Fund was a prudent course of action. We accomplished this by increasing the number of names in the portfolio to add diversification benefits.
Performance review
For the twelve months ended October 31, 2010, Class C shares of Legg Mason Capital Management American Leading Companies Trust, excluding sales charges, returned 19.61%. The Fund’s unmanaged benchmark, the S&P 500 Index, returned 16.52% over the same time frame. The Lipper Large-Cap Value Funds Category Average1 returned 12.79% for the same period.
| 1 | Lipper, Inc., a wholly-owned subsidiary of Reuters, provides independent insight on global collective investments. Returns are based on the twelve-month period ended October 31, 2010, including the reinvestment of all distributions, including returns of capital, if any, calculated among the 469 funds in the Fund’s Lipper category, and excluding sales charges. |
| | | | |
| Legg Mason Capital Management American Leading Companies Trust 2010 Annual Report | | | 3 | |
| | | | | | | | |
| Performance Snapshot as of October 31, 2010 | |
| (excluding sales charges) (unaudited) | | 6 months | | | 12 months | |
| Legg Mason Capital Management American Leading Companies Trust: | |
Class A | | | 0.56 | % | | | 20.51 | % |
Class C | | | 0.19 | % | | | 19.61 | % |
Class I | | | 0.71 | % | | | 20.89 | % |
| S&P 500 Index | | | 0.74 | % | | | 16.52 | % |
| Lipper Large-Cap Value Funds Category Average1 | | | -1.74 | % | | | 12.79 | % |
The performance shown represents past performance. Past performance is no guarantee of future results and current performance may be higher or lower than the performance shown above. Principal value and investment returns will fluctuate and investors’ shares, when redeemed, may be worth more or less than their original cost. To obtain performance data current to the most recent month-end, please visit our website at www.leggmason.com/individualinvestors.
All share class returns assume the reinvestment of all distributions, including returns of capital, if any, at net asset value and the deduction of all Fund expenses. Returns have not been adjusted to include sales charges that may apply or the deduction of taxes that a shareholder would pay on Fund distributions. If sales charges were reflected, the performance quoted would be lower. Performance figures for periods shorter than one year represent cumulative figures and are not annualized.
Performance figures reflect compensating balance arrangements, expense reimbursements and/or fee waivers, without which the performance would have been lower.
Total Annual Operating Expenses (unaudited)
As of the Fund’s most current prospectus dated February 26, 2010, the gross total operating expense ratios for Class A, Class C and Class I shares were 1.16%, 1.92% and 0.91%, respectively.
Actual expenses may be higher. For example, expenses may be higher than those shown if average net assets decrease. Net assets are more likely to decrease and Fund expense ratios are more likely to increase when markets are volatile.
Q. What were the leading contributors to performance?
A. Airlines UAL Corp. (now United Continental Holdings Inc.) and Delta Air Lines Inc. were top contributors to performance over the past year as they benefited from the cyclical recovery playing out in the U.S. travel market. Furthermore, mergers in the airline industry forced capacity out of the market, allowing the remaining players to price rationally and build capital in a way that has not happened for a number of years. We believe that the airlines remain attractive as consolidation should continue pulling excess capacity out of the system.
UnitedHealth Group Inc. was also among the top-performing stocks in the portfolio as U.S. health care reform legislation proved to be less disruptive than investors expected. The uncertainty surrounding the attempted reform restrained managed-care stocks for much of 2009, but reports that the U.S. Senate would scrap the so-called “public option” in favor of covering more people under the plan ended up helping the stocks significantly toward the end of last year. UnitedHealth Group has sustained that momentum thus far in 2010 by reporting earnings that beat consensus for three consecutive quarters. We continue to believe that markets are underestimating the earnings potential of the managed-care companies, and we like the stock on a valuation basis over the longer term.
Q. What were the leading detractors from performance?
A. Financials and Information Technology (“IT”) stocks were the major detractors from performance during the period. The Financials bucket includes investment banks Morgan Stanley and Goldman Sachs Group Inc., as well as the large money-center banks Bank of America Corp., JPMorgan Chase & Co. and Wells Fargo & Co. Over the past year, these stocks were pushed lower as a result of the European sovereign debt crisis, the Securities and Exchange Commission charging Goldman with fraud, the “flash crash” and the mortgage putback scare. These events ignited investor fears of a double-dip recession and backlash against Wall Street, which stoked fears that fundamentals at these leveraged institutions would again deteriorate and necessitate another round of dilutive capital raises.
IT stocks Hewlett-Packard Co. and Nokia OYJ (ADR) were also significant detractors over the past twelve months. Hewlett-Packard shares fell as a result of the abrupt resignation of the company’s well-regarded CEO for violations of the company’s code of conduct. Despite this setback, we believe Hewlett-Packard shares are attractive given its low valuation, large base of recurring revenues, and a cyclical tailwind from a refresh of the aging personal computer installed base. Handset manufacturer Nokia suffered from several disappointing quarters and a gloomy outlook for its smartphone segment. The company failed to make up ground in the smartphone market as rivals Apple and Research in
| 1 | Lipper, Inc., a wholly-owned subsidiary of Reuters, provides independent insight on global collective investments. Returns are based on the period ended October 31, 2010, including the reinvestment of all distributions, including returns of capital, if any, calculated among the 475 funds for the six-month period and among the 469 funds for the twelve-month period in the Fund’s Lipper category, and excluding sales charges. |
| | |
| 4 | | Legg Mason Capital Management American Leading Companies Trust 2010 Annual Report |
Fund overview (cont’d)
Motion charged ahead with high-end devices. Nokia suffered even more setbacks and continued to lose market share after delaying the release of its new Symbian smartphone operating system. However, we believe the stock embeds increasingly low expectations as a result, and the company still has a chance to be a major player in the rapidly evolving mobile phone space given its massive global scale and distribution.
Q. Where there any significant changes to the Fund during the reporting period?
A. We initiated fourteen new positions during the year and eliminated eleven holdings, resulting in a net gain of three securities. At the end of the period, the number of holdings in the Fund was sixty-five, up from sixty-two a year ago.
Significant additions to the portfolio included retailers Lowe’s Cos. Inc., Wal-Mart and J.C. Penney Co. Inc., Financials Citigroup Inc. and American Express Co., IT company MasterCard Inc., medical devices maker Medtronic, Pharmaceuticals Abbott Laboratories and Merck & Co. Inc., cereal maker Kellogg, consumer products maker Colgate-Palmolive, and satellite-TV operator DIRECTV (Class A Shares). We also initiated positions in biotech company Genzyme Corp. and energy giant BP, but these positions were eliminated during the period.
Meaningful sales over the past year included procyclical industrial and commodities-based companies Caterpillar Inc., Alcoa Inc. and Freeport-McMoRan Copper and Gold Inc., online media company Yahoo! Inc., discount wholesale retailer Costco Wholesale Corp., tobacco maker Altria Group Inc., cable operator Time Warner Cable Inc., exchange operator NYSE Euronext, and natural gas producer Chesapeake Energy Corp.
Thank you for your investment in Legg Mason Capital Management American Leading Companies
Trust. As always, we appreciate that you have chosen us to manage your assets and we remain focused on seeking to achieve the Fund’s investment goals.
Sincerely,
Legg Mason Capital Management, Inc.
November 15, 2010
RISKS: Equity securities are subject to price fluctuation and possible loss of principal. The manager’s investment style may become out of favor and/or the manager’s selection process may prove incorrect, which may have a negative impact on the Fund’s performance. The value approach to investing involves the risk that those stocks deemed to be undervalued by the portfolio manager may remain undervalued. The Fund may focus its investments in certain regions or industries, thereby increasing its potential vulnerability to market volatility. Additional risks may include those risks associated with investing in foreign and fixed-income securities and small-and mid-sized companies. Please see the Fund’s prospectus for a more complete discussion of these and other risks, and the Fund’s principal investment strategies.
Portfolio holdings and breakdowns are as of October 31, 2010 and are subject to change and may not be representative of the portfolio manager’s current or future investments. The Fund’s top ten holdings (as a percentage of net assets) as of this date were: International Business Machines Corp. (3.8%), United Continental Holdings Inc. (3.7%), Microsoft Corp. (3.7%), eBay Inc. (3.6%), Hewlett-Packard Co. (3.3%), Time Warner Inc. (3.0%), Transocean Ltd. (2.9%), Texas Instruments Inc. (2.9%), EMC Corp. (2.8%) and JPMorgan Chase & Co. (2.6%). Please refer to pages 9 through 11 for a list and percentage breakdown of the Fund’s holdings.
The mention of sector breakdowns is for informational purposes only and should not be construed as a recommendation to purchase or sell any securities. The information provided regarding such sectors is not a sufficient basis upon which to make an investment decision. Investors seeking financial advice regarding the appropriateness of investing in any securities or investment strategies discussed should consult their financial professional. The Fund’s top five sector holdings (as a percentage of net assets) as of October 31, 2010 were: Information Technology (26.6%), Financials (17.7%), Industrials (14.3%), Health Care (12.3%) and Energy (9.0%). The Fund’s portfolio composition is subject to change at any time.
All investments are subject to risk including the possible loss of principal. Past performance is no guarantee of future results. All index performance reflects no deduction for fees, expenses or taxes. Please note that an investor cannot invest directly in an index.
The information provided is not intended to be a forecast of future events, a guarantee of future results or investment advice. Views expressed may differ from those of the firm as a whole.
| i | The S&P 500 Index is an unmanaged index of 500 stocks and is generally representative of the performance of larger companies in the U.S. |
| ii | The Federal Reserve Board ("Fed") is responsible for the formulation of policies designed to promote economic growth, full employment, stable prices and a sustainable pattern of international trade and payments. |
| | | | |
| Legg Mason Capital Management American Leading Companies Trust 2010 Annual Report | | | 5 | |
Fund at a glance† (unaudited)
Investment breakdown (%) as a percent of total investments
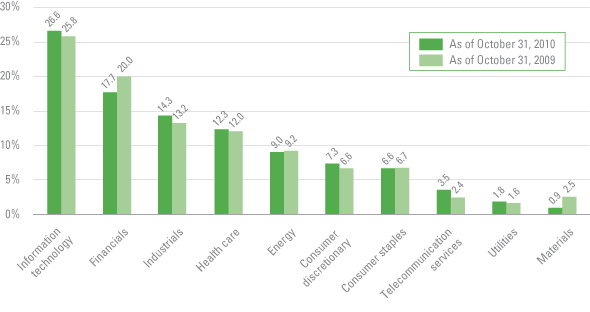
| † | The bar graph above represents the composition of the Fund’s investments as of October 31, 2010 and October 31, 2009. The Fund is actively managed. As a result, the composition of the Fund’s investments is subject to change at any time. |
| | |
| 6 | | Legg Mason Capital Management American Leading Companies Trust 2010 Annual Report |
Fund expenses (unaudited)
Example
As a shareholder of the Fund, you may incur two types of costs: (1) transaction costs, including front-end and back-end sales charges (loads) on purchase payments; and (2) ongoing costs, including management fees; distribution and/or service (12b-1) fees; and other Fund expenses. This example is intended to help you understand your ongoing costs (in dollars) of investing in the Fund and to compare these costs with the ongoing costs of investing in other mutual funds.
This example is based on an investment of $1,000 invested on May 1, 2010 and held for the six months ended October 31, 2010.
Actual expenses
The table below titled “Based on Actual Total Return” provides information about actual account values and actual expenses. You may use the information provided in this table, together with the amount you invested, to estimate the expenses that you paid over the period. To estimate the expenses you paid on your account, divide your ending account value by $1,000 (for example, an $8,600 ending account value divided by $1,000 = 8.6), then multiply the result by the number under the heading entitled “Expenses Paid During the Period”.
Hypothetical example for comparison purposes
The table below titled “Based on Hypothetical Total Return” provides information about hypothetical account values and hypothetical expenses based on the actual expense ratio and an assumed rate of return of 5.00% per year before expenses, which is not the Fund’s actual return. The hypothetical account values and expenses may not be used to estimate the actual ending account balance or expenses you paid for the period. You may use the information provided in this table to compare the ongoing costs of investing in the Fund and other funds. To do so, compare the 5.00% hypothetical example relating to the Fund with the 5.00% hypothetical examples that appear in the shareholder reports of the other funds.
Please note that the expenses shown in the table below are meant to highlight your ongoing costs only and do not reflect any transactional costs, such as front-end or back-end sales charges (loads). Therefore, the table is useful in comparing ongoing costs only, and will not help you determine the relative total costs of owning different funds. In addition, if these transaction costs were included, your costs would have been higher.
| | | | | | | | | | | | | | | | | | | | | | | | | | | | | | | | | | | | | | | | | | | | | | |
| Based on actual total return1 | | | | | | Based on hypothetical total return1 | | | | |
| | | Actual Total
Return
Without
Sales
Charges2 | | | Beginning
Account
Value | | | Ending
Account
Value | | | Annualized
Expense
Ratio | | | Expenses
Paid
During
the
Period3 | | | | | | | | Hypothetical
Annualized
Total
Return | | | Beginning
Account
Value | | | Ending
Account
Value | | | Annualized
Expense
Ratio | | | Expenses
Paid
During
the
Period3 | |
| Class A | | | 0.56 | % | | $ | 1,000.00 | | | $ | 1,005.60 | | | | 1.19 | % | | $ | 6.02 | | | | | | | Class A | | | 5.00 | % | | $ | 1,000.00 | | | $ | 1,019.21 | | | | 1.19 | % | | $ | 6.06 | |
| Class C | | | 0.19 | | | | 1,000.00 | | | | 1,001.90 | | | | 1.95 | | | | 9.84 | | | | | | | Class C | | | 5.00 | | | | 1,000.00 | | | | 1,015.38 | | | | 1.95 | | | | 9.91 | |
| Class I | | | 0.71 | | | | 1,000.00 | | | | 1,007.10 | | | | 0.87 | | | | 4.40 | | | | | | | Class I | | | 5.00 | | | | 1,000.00 | | | | 1,020.82 | | | | 0.87 | | | | 4.43 | |
| 1 | For the six months ended October 31, 2010. |
| 2 | Assumes the reinvestment of all distributions, including returns of capital, if any, at net asset value and does not reflect the deduction of the applicable initial sales charge with respect to Class A shares or the applicable contingent deferred sales charges (“CDSC”) with respect to Class C shares. Total return is not annualized, as it may not be representative of the total return for the year. Performance figures may reflect compensating balance arrangements, fee waivers and/or expense reimbursements. In the absence of compensating balance arrangements, fee waivers and/or expense reimbursements, the total return would have been lower. Past performance is no guarantee of future results. |
| 3 | Expenses (net of compensating balance arrangements, fee waivers and/or expense reimbursements) are equal to each class’ respective annualized expense ratio multiplied by the average account value over the period, multiplied by the number of days in the most recent fiscal half-year (184), then divided by 365. |
| | | | |
| Legg Mason Capital Management American Leading Companies Trust 2010 Annual Report | | | 7 | |
Fund performance (unaudited)
| | | | | | | | | | | | |
| Average annual total returns | | | |
| Without sales charges1 | | Class A | | | Class C | | | Class I | |
| Twelve Months Ended 10/31/10 | | | 20.51 | % | | | 19.61 | % | | | 20.89 | % |
| Five Years Ended 10/31/10 | | | N/A | | | | -4.25 | | | | -3.29 | |
| Ten Years Ended 10/31/10 | | | N/A | | | | -0.71 | | | | N/A | |
| Inception* through 10/31/10 | | | 29.21 | | | | 5.04 | | | | 0.60 | |
| | | |
| With sales charges2 | | Class A | | | Class C | | | Class I | |
| Twelve Months Ended 10/31/10 | | | 13.54 | % | | | 18.61 | % | | | 20.89 | % |
| Five Years Ended 10/31/10 | | | N/A | | | | -4.25 | | | | -3.29 | |
| Ten Years Ended 10/31/10 | | | N/A | | | | -0.71 | | |
| N/A
|
|
| Inception* through 10/31/10 | | | 24.86 | | | | 5.04 | | | | 0.60 | |
| | | | | | | | | | | | |
| Cumulative total returns | | | | | | | | | |
| Without sales charges1 | | | | | | | | | |
| Class A (Inception date of 2/3/09 through 10/31/10) | | | | | | | 56.17 | % | | | | |
| Class C (10/31/00 through 10/31/10) | | | | | | | -6.86 | | | | | |
| Class I (Inception date of 6/14/01 through 10/31/10) | | | | | | | 5.81 | | | | | |
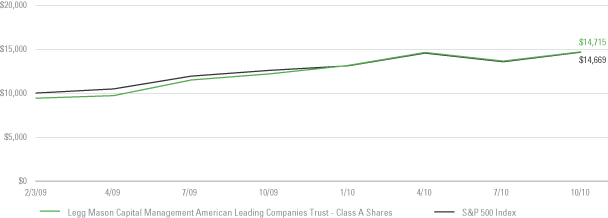
Historical performance
Value of $10,000 invested in
Class A Shares of Legg Mason Capital Management American Leading Companies Trust vs. S&P 500 Index† — February 3, 2009 - October 2010
| | |
| 8 | | Legg Mason Capital Management American Leading Companies Trust 2010 Annual Report |
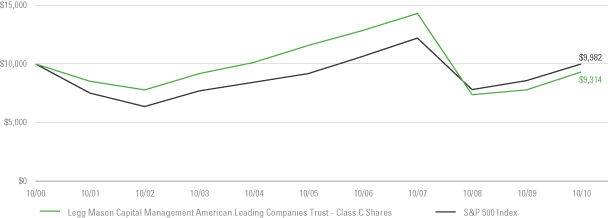
Fund performance (unaudited) (cont’d)
Value of $10,000 invested in
Class C Shares of Legg Mason Capital Management American Leading Companies Trust vs. S&P 500 Index† — October 2000 - October 2010
Value of $1,000,000 invested in
Class I Shares of Legg Mason Capital Management American Leading Companies Trust vs. S&P 500 Index† — June 14, 2001 - October 2010
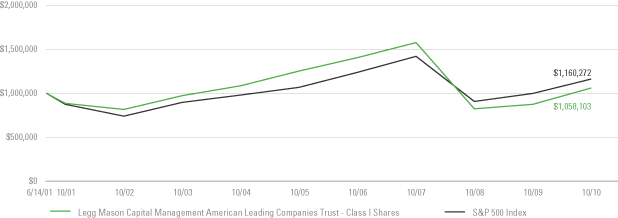
All figures represent past performance and are not a guarantee of future results. Investment return and principal value of an investment will fluctuate so that an investor’s shares, when redeemed, may be worth more or less than their original cost. The returns shown do not reflect the deduction of taxes that a shareholder would pay on Fund distributions or the redemption of Fund shares. Performance figures may reflect compensating balance arrangements, fee waivers and/or expense reimbursements. In the absence of compensating balance arrangements, fee waivers and/or expense reimbursements, the total return would have been lower.
| 1 | Assumes the reinvestment of all distributions, including returns of capital, if any, at net asset value and does not reflect the deduction of the applicable sales charge with respect to Class A shares or the applicable contingent deferred sales charges (“CDSC”) with respect to Class C shares. |
| 2 | Assumes the reinvestment of all distributions, including returns of capital, if any, at net asset value. In addition, Class A shares reflect the deduction of the maximum initial sales charge of 5.75%. Class C shares reflect the deduction of a 1.00% CDSC, which applies if shares are redeemed within one year from purchase payment. |
| * | Inception dates for Class A, Class C and Class I shares are February 3, 2009, September 1, 1993 and June 14, 2001, respectively. |
| † | Hypothetical illustration of $10,000 invested in Class A and C shares and $1,000,000 invested in Class I shares of Legg Mason Capital Management American Leading Companies Trust on February 3, 2009 (commencement of operations), October 31, 2000 and June 14, 2001 (commencement of operations), respectively, assuming the deduction of the maximum initial sales charge of 5.75% at the time of investment for Class A shares and the reinvestment of all distributions, including returns of capital, if any, at net asset value through October 31, 2010. The hypothetical illustration also assumes a $10,000 or $1,000,000 investment, as applicable, in the S&P 500 Index. The S&P 500 Index is an unmanaged index of 500 stocks and is generally representative of the performance of larger companies in the U.S. The Index is unmanaged and is not subject to the same management and trading expenses as a mutual fund. Please note that an investor cannot invest directly in an index. |
| | | | |
| Legg Mason Capital Management American Leading Companies Trust 2010 Annual Report | | | 9 | |
Schedule of investments
October 31, 2010
Legg Mason Capital Management American Leading Companies Trust
| | | | | | | | | | | | | | | | |
| Security | | | | | | | | Shares | | | Value | |
| Common Stocks — 100.0% | | | | | | | | | | | | | | | | |
| Consumer Discretionary — 7.3% | | | | | | | | | | | | | | | | |
Media — 4.4% | | | | | | | | | | | | | | | | |
CBS Corp., Class B Shares | | | | | | | | | | | 125,000 | | | $ | 2,116,250 | |
DIRECTV, Class A Shares | | | | | | | | | | | 20,000 | | | | 869,200 | * |
Time Warner Inc. | | | | | | | | | | | 200,000 | | | | 6,502,000 | |
Total Media | | | | | | | | | | | | | | | 9,487,450 | |
Multiline Retail — 0.6% | | | | | | | | | | | | | | | | |
J.C. Penney Co. Inc. | | | | | | | | | | | 40,000 | | | | 1,247,200 | |
Specialty Retail — 2.3% | | | | | | | | | | | | | | | | |
Lowe’s Cos. Inc. | | | | | | | | | | | 120,000 | | | | 2,559,600 | |
TJX Cos. Inc. | | | | | | | | | | | 55,000 | | | | 2,523,950 | |
Total Specialty Retail | | | | | | | | | | | | | | | 5,083,550 | |
Total Consumer Discretionary | | | | | | | | | | | | | | | 15,818,200 | |
| Consumer Staples — 6.6% | | | | | | | | | | | | | | | | |
Beverages — 0.5% | | | | | | | | | | | | | | | | |
PepsiCo Inc. | | | | | | | | | | | 18,000 | | | | 1,175,400 | |
Food & Staples Retailing — 1.7% | | | | | | | | | | | | | | | | |
Safeway Inc. | | | | | | | | | | | 90,000 | | | | 2,061,000 | |
Wal-Mart Stores Inc. | | | | | | | | | | | 31,000 | | | | 1,679,270 | |
Total Food & Staples Retailing | | | | | | | | | | | | | | | 3,740,270 | |
Food Products — 0.7% | | | | | | | | | | | | | | | | |
Kellogg Co. | | | | | | | | | | | 28,000 | | | | 1,407,280 | |
Household Products — 1.4% | | | | | | | | | | | | | | | | |
Colgate-Palmolive Co. | | | | | | | | | | | 23,500 | | | | 1,812,320 | |
Procter & Gamble Co. | | | | | | | | | | | 19,000 | | | | 1,207,830 | |
Total Household Products | | | | | | | | | | | | | | | 3,020,150 | |
Tobacco — 2.3% | | | | | | | | | | | | | | | | |
Philip Morris International Inc. | | | | | | | | | | | 85,000 | | | | 4,972,500 | |
Total Consumer Staples | | | | | | | | | | | | | | | 14,315,600 | |
| Energy — 9.0% | | | | | | | | | | | | | | | | |
Energy Equipment & Services — 7.1% | | | | | | | | | | | | | | | | |
Baker Hughes Inc. | | | | | | | | | | | 50,000 | | | | 2,316,500 | |
National-Oilwell Varco Inc. | | | | | | | | | | | 70,000 | | | | 3,763,200 | |
Noble Corp. | | | | | | | | | | | 85,000 | | | | 2,935,050 | |
Transocean Ltd. | | | | | | | | | | | 100,000 | | | | 6,336,000 | * |
Total Energy Equipment & Services | | | | | | | | | | | | | | | 15,350,750 | |
Oil, Gas & Consumable Fuels — 1.9% | | | | | | | | | | | | | | | | |
Apache Corp. | | | | | | | | | | | 28,000 | | | | 2,828,560 | |
Exxon Mobil Corp. | | | | | | | | | | | 20,000 | | | | 1,329,400 | |
Total Oil, Gas & Consumable Fuels | | | | | | | | | | | | | | | 4,157,960 | |
Total Energy | | | | | | | | | | | | | | | 19,508,710 | |
| Financials — 17.7% | | | | | | | | | | | | | | | | |
Capital Markets — 3.9% | | | | | | | | | | | | | | | | |
Goldman Sachs Group Inc. | | | | | | | | | | | 25,000 | | | | 4,023,750 | |
Morgan Stanley | | | | | | | | | | | 120,000 | | | | 2,984,400 | |
State Street Corp. | | | | | | | | | | | 35,000 | | | | 1,461,600 | |
Total Capital Markets | | | | | | | | | | | | | | | 8,469,750 | |
See Notes to Financial Statements.
| | |
| 10 | | Legg Mason Capital Management American Leading Companies Trust 2010 Annual Report |
Schedule of investments (cont’d)
October 31, 2010
Legg Mason Capital Management American Leading Companies Trust
| | | | | | | | | | | | | | | | |
| Security | | | | | | | | Shares | | | Value | |
Commercial Banks — 1.0% | | | | | | | | | | | | | | | | |
Wells Fargo & Co. | | | | | | | | | | | 87,500 | | | $ | 2,282,000 | |
Consumer Finance — 2.1% | | | | | | | | | | | | | | | | |
American Express Co. | | | | | | | | | | | 30,000 | | | | 1,243,800 | |
Capital One Financial Corp. | | | | | | | | | | | 90,000 | | | | 3,354,300 | |
Total Consumer Finance | | | | | | | | | | | | | | | 4,598,100 | |
Diversified Financial Services — 4.3% | | | | | | | | | | | | | | | | |
Bank of America Corp. | | | | | | | | | | | 160,000 | | | | 1,830,400 | |
Citigroup Inc. | | | | | | | | | | | 460,000 | | | | 1,918,200 | * |
JPMorgan Chase & Co. | | | | | | | | | | | 148,000 | | | | 5,569,240 | |
Total Diversified Financial Services | | | | | | | | | | | | | | | 9,317,840 | |
Insurance — 6.4% | | | | | | | | | | | | | | | | |
AFLAC Inc. | | | | | | | | | | | 75,000 | | | | 4,191,750 | |
Hartford Financial Services Group Inc. | | | | | | | | | | | 145,000 | | | | 3,477,100 | |
MetLife Inc. | | | | | | | | | | | 65,000 | | | | 2,621,450 | |
Prudential Financial Inc. | | | | | | | | | | | 67,000 | | | | 3,522,860 | |
Total Insurance | | | | | | | | | | | | | | | 13,813,160 | |
Total Financials | | | | | | | | | | | | | | | 38,480,850 | |
| Health Care — 12.3% | | | | | | | | | | | | | | | | |
Biotechnology — 1.9% | | | | | | | | | | | | | | | | |
Amgen Inc. | | | | | | | | | | | 73,000 | | | | 4,174,870 | * |
Health Care Equipment & Supplies — 2.7% | | | | | | | | | | | | | | | | |
Medtronic Inc. | | | | | | | | | | | 50,000 | | | | 1,760,500 | |
Stryker Corp. | | | | | | | | | | | 80,000 | | | | 3,959,200 | |
Total Health Care Equipment & Supplies | | | | | | | | | | | | | | | 5,719,700 | |
Health Care Providers & Services — 3.4% | | | | | | | | | | | | | | | | |
Aetna Inc. | | | | | | | | | | | 40,000 | | | | 1,194,400 | |
UnitedHealth Group Inc. | | | | | | | | | | | 125,000 | | | | 4,506,250 | |
WellPoint Inc. | | | | | | | | | | | 30,000 | | | | 1,630,200 | * |
Total Health Care Providers & Services | | | | | | | | | | | | | | | 7,330,850 | |
Pharmaceuticals — 4.3% | | | | | | | | | | | | | | | | |
Abbott Laboratories | | | | | | | | | | | 28,000 | | | | 1,436,960 | |
Johnson & Johnson | | | | | | | | | | | 75,000 | | | | 4,775,250 | |
Merck & Co. Inc. | | | | | | | | | | | 40,000 | | | | 1,451,200 | |
Pfizer Inc. | | | | | | | | | | | 100,000 | | | | 1,740,000 | |
Total Pharmaceuticals | | | | | | | | | | | | | | | 9,403,410 | |
Total Health Care | | | | | | | | | | | | | | | 26,628,830 | |
| Industrials — 14.3% | | | | | | | | | | | | | | | | |
Aerospace & Defense — 4.6% | | | | | | | | | | | | | | | | |
Boeing Co. | | | | | | | | | | | 40,000 | | | | 2,825,600 | |
General Dynamics Corp. | | | | | | | | | | | 62,000 | | | | 4,223,440 | |
Lockheed Martin Corp. | | | | | | | | | | | 42,000 | | | | 2,994,180 | |
Total Aerospace & Defense | | | | | | | | | | | | | | | 10,043,220 | |
Airlines — 5.2% | | | | | | | | | | | | | | | | |
Delta Air Lines Inc. | | | | | | | | | | | 230,000 | | | | 3,194,700 | * |
United Continental Holdings Inc. | | | | | | | | | | | 280,000 | | | | 8,131,200 | * |
Total Airlines | | | | | | | | | | | | | | | 11,325,900 | |
See Notes to Financial Statements.
| | | | |
| Legg Mason Capital Management American Leading Companies Trust 2010 Annual Report | | | 11 | |
Legg Mason Capital Management American Leading Companies Trust
| | | | | | | | | | | | | | | | |
| Security | | | | | | | | Shares | | | Value | |
Electrical Equipment — 1.0% | | | | | | | | | | | | | | | | |
Emerson Electric Co. | | | | | | | | | | | 40,000 | | | $ | 2,196,000 | |
Industrial Conglomerates — 3.5% | | | | | | | | | | | | | | | | |
General Electric Co. | | | | | | | | | | | 265,000 | | | | 4,245,300 | |
United Technologies Corp. | | | | | | | | | | | 45,000 | | | | 3,364,650 | |
Total Industrial Conglomerates | | | | | | | | | | | | | | | 7,609,950 | |
Total Industrials | | | | | | | | | | | | | | | 31,175,070 | |
| Information Technology — 26.6% | | | | | | | | | | | | | | | | |
Communications Equipment — 5.0% | | | | | | | | | | | | | | | | |
Cisco Systems Inc. | | | | | | | | | | | 110,000 | | | | 2,511,300 | * |
Nokia OYJ, ADR | | | | | | | | | | | 400,000 | | | | 4,272,000 | |
QUALCOMM Inc. | | | | | | | | | | | 90,000 | | | | 4,061,700 | |
Total Communications Equipment | | | | | | | | | | | | | | | 10,845,000 | |
Computers & Peripherals — 6.1% | | | | | | | | | | | | | | | | |
EMC Corp. | | | | | | | | | | | 290,000 | | | | 6,092,900 | * |
Hewlett-Packard Co. | | | | | | | | | | | 170,000 | | | | 7,150,200 | |
Total Computers & Peripherals | | | | | | | | | | | | | | | 13,243,100 | |
Internet Software & Services — 3.6% | | | | | | | | | | | | | | | | |
eBay Inc. | | | | | | | | | | | 260,000 | | | | 7,750,600 | * |
IT Services — 5.4% | | | | | | | | | | | | | | | | |
Accenture PLC, Class A Shares | | | | | | | | | | | 57,000 | | | | 2,548,470 | |
International Business Machines Corp. | | | | | | | | | | | 57,000 | | | | 8,185,200 | |
MasterCard Inc., Class A Shares | | | | | | | | | | | 4,000 | | | | 960,240 | |
Total IT Services | | | | | | | | | | | | | | | 11,693,910 | |
Semiconductors & Semiconductor Equipment — 2.8% | | | | | | | | | | | | | | | | |
Texas Instruments Inc. | | | | | | | | | | | 210,000 | | | | 6,209,700 | |
Software — 3.7% | | | | | | | | | | | | | | | | |
Microsoft Corp. | | | | | | | | | | | 300,000 | | | | 7,992,000 | |
Total Information Technology | | | | | | | | | | | | | | | 57,734,310 | |
| Materials — 0.9% | | | | | | | | | | | | | | | | |
Metals & Mining — 0.9% | | | | | | | | | | | | | | | | |
United States Steel Corp. | | | | | | | | | | | 45,000 | | | | 1,925,550 | |
| Telecommunication Services — 3.5% | | | | | | | | | | | | | | | | |
Diversified Telecommunication Services — 1.4% | | | | | | | | | | | | | | | | |
AT&T Inc. | | | | | | | | | | | 110,000 | | | | 3,135,000 | |
Wireless Telecommunication Services — 2.1% | | | | | | | | | | | | | | | | |
Sprint Nextel Corp. | | | | | | | | | | | 1,100,000 | | | | 4,532,000 | * |
Total Telecommunication Services | | | | | | | | | | | | | | | 7,667,000 | |
| Utilities — 1.8% | | | | | | | | | | | | | | | | |
Independent Power Producers & Energy Traders — 1.8% | | | | | | | | | | | | | | | | |
AES Corp. | | | | | | | | | | | 325,000 | | | | 3,880,500 | * |
Total Investments — 100.0% (Cost — $145,725,404#) | | | | | | | | | | | | | | | 217,134,620 | |
Other Assets in Excess of Liabilities — 0.0% | | | | | | | | | | | | | | | 90,969 | |
Total Net Assets — 100.0% | | | | | | | | | | | | | | $ | 217,225,589 | |
| * | Non-income producing security. |
| # | Aggregate cost for federal income tax purposes is $145,923,152. |
| | |
Abbreviation used in this schedule: |
| ADR | | —American Depositary Receipt |
See Notes to Financial Statements.
| | |
| 12 | | Legg Mason Capital Management American Leading Companies Trust 2010 Annual Report |
Statement of assets and liabilities
October 31, 2010
| | | | |
| |
| Assets: | | | | |
Investments, at value (Cost — $145,725,404) | | $ | 217,134,620 | |
Receivable for securities sold | | | 1,720,751 | |
Dividends receivable | | | 206,964 | |
Receivable for Fund shares sold | | | 97,587 | |
Other assets | | | 6,975 | |
Total Assets | | | 219,166,897 | |
| |
| Liabilities: | | | | |
Payable for securities purchased | | | 653,640 | |
Payable for Fund shares repurchased | | | 636,272 | |
Due to custodian | | | 218,045 | |
Distribution fees payable | | | 163,326 | |
Investment management fee payable | | | 122,820 | |
Directors’ fees payable | | | 558 | |
Accrued expenses | | | 146,647 | |
Total Liabilities | | | 1,941,308 | |
| Total Net Assets | | $ | 217,225,589 | |
| |
| Net Assets: | | | | |
Par value (Note 7) | | $ | 13,443 | |
Paid-in capital in excess of par value | | | 208,088,034 | |
Overdistributed net investment income | | | (115,924) | |
Accumulated net realized loss on investments | | | (62,169,180) | |
Net unrealized appreciation on investments | | | 71,409,216 | |
| Total Net Assets | | $ | 217,225,589 | |
| |
| Shares Outstanding: | | | | |
Class A | | | 851,645 | |
Class C | | | 11,797,706 | |
Class I | | | 793,409 | |
| |
| Net Asset Value: | | | | |
Class A (and redemption price) | | | $16.21 | |
Class C* | | | $16.10 | |
Class I (and redemption price) | | | $16.96 | |
| Maximum Public Offering Price Per Share: | | | | |
Class A (based on maximum initial sales charge of 5.75%) | | | $17.20 | |
| * | Redemption price per share is NAV of Class C shares reduced by a 1.00% CDSC, if shares are redeemed within one year from purchase payment (See Note 2). |
See Notes to Financial Statements.
| | | | |
| Legg Mason Capital Management American Leading Companies Trust 2010 Annual Report | | | 13 | |
Statement of operations
For the Year Ended October 31, 2010
| | | | |
| |
| Investment Income: | | | | |
Dividends | | $ | 3,483,102 | |
Interest | | | 1,109 | |
Less: Foreign taxes withheld | | | (33,335) | |
Total Investment Income | | | 3,450,876 | |
| |
| Expenses: | | | | |
Distribution fees (Notes 2 and 5) | | | 2,036,484 | |
Investment management fee (Note 2) | | | 1,588,044 | |
Transfer agent fees (Note 5) | | | 278,311 | |
Registration fees | | | 41,198 | |
Legal fees | | | 40,932 | |
Directors’ fees | | | 39,767 | |
Custody fees | | | 39,131 | |
Shareholder reports | | | 34,034 | |
Audit and tax | | | 31,025 | |
Insurance | | | 1,144 | |
Miscellaneous expenses | | | 10,654 | |
Total Expenses | | | 4,140,724 | |
Less: Fee waivers and/or expense reimbursements (Notes 2 and 5) | | | (18,863) | |
Compensating balance arrangements (Note 1) | | | (301) | |
Net Expenses | | | 4,121,560 | |
| Net Investment Loss | | | (670,684) | |
| |
| Realized and Unrealized Gain on Investments (Notes 1 and 3): | | | | |
Net Realized Gain from Investment Transactions | | | 14,522,233 | |
Change in Net Unrealized Appreciation (Depreciation) From Investments | | | 27,281,427 | |
| Net Gain on Investments | | | 41,803,660 | |
| Increase in Net Assets From Operations | | $ | 41,132,976 | |
See Notes to Financial Statements.
| | |
| 14 | | Legg Mason Capital Management American Leading Companies Trust 2010 Annual Report |
Statements of changes in net assets
| | | | | | | | | | | | |
For the Year Ended October 31, 2010, the Period Ended October 31, 2009 and the Year Ended March 31, 2009 | | 2010 | | | 2009† | | | 2009 | |
| | | |
| Operations: | | | | | | | | | | | | |
Net investment income (loss) | | $ | (670,684) | | | $ | (245,589) | | | $ | 2,591,726 | |
Net realized gain (loss) | | | 14,522,233 | | | | 3,787,525 | | | | (61,929,002) | |
Change in net unrealized appreciation (depreciation) | | | 27,281,427 | | | | 71,684,996 | | | | (177,335,018) | |
Increase (Decrease) in Net Assets From Operations | | | 41,132,976 | | | | 75,226,932 | | | | (236,672,294) | |
| | | |
| Distributions to Shareholders From (Notes 1 and 6): | | | | | | | | | | | | |
Net investment income | | | (177,924) | | | | — | | | | (2,676,889) | |
Net realized gains | | | — | | | | — | | | | (1,383,802) | |
Decrease in Net Assets From Distributions to Shareholders | | | (177,924) | | | | — | | | | (4,060,691) | |
| | | |
| Fund Share Transactions (Note 7): | | | | | | | | | | | | |
Net proceeds from sale of shares | | | 11,175,005 | | | | 5,331,212 | | | | 61,872,409 | |
Reinvestment of distributions | | | 173,428 | | | | — | | | | 4,041,034 | |
Cost of shares repurchased | | | (61,090,327) | | | | (33,792,715) | | | | (245,678,405) | |
Decrease in Net Assets From Fund Share Transactions | | | (49,741,894) | | | | (28,461,503) | | | | (179,764,962) | |
Increase (Decrease) in Net Assets | | | (8,786,842) | | | | 46,765,429 | | | | (420,497,947) | |
| | | |
| NET ASSETS: | | | | | | | | | | | | |
Beginning of year | | | 226,012,431 | | | | 179,247,002 | | | | 599,744,949 | |
End of year* | | $ | 217,225,589 | | | $ | 226,012,431 | | | $ | 179,247,002 | |
* Includes (overdistributed) and undistributed net investment income, respectively, of: | | | $(115,924) | | | | $34,443 | | | | $28,635 | |
| † | For the period April 1, 2009 through October 31, 2009. |
See Notes to Financial Statements.
| | | | |
| Legg Mason Capital Management American Leading Companies Trust 2010 Annual Report | | | 15 | |
Financial highlights
| | | | | | | | | | | | |
| For a share of each class of capital stock outstanding throughout each year ended October 31, unless otherwise noted: | |
Class A Shares1 | | 2010 | | | 20092 | | | 20093 | |
| | | |
| Net asset value, beginning of year | | | $13.53 | | | | $9.40 | | | | $10.44 | |
| | | |
| Income (loss) from operations: | | | | | | | | | | | | |
Net investment income | | | 0.05 | | | | 0.03 | | | | 0.03 | |
Net realized and unrealized gain (loss) | | | 2.71 | | | | 4.10 | | | | (1.07) | |
Total income (loss) from operations | | | 2.76 | | | | 4.13 | | | | (1.04) | |
| | | |
| Less distributions from: | | | | | | | | | | | | |
Net investment income | | | (0.08) | | | | — | | | | — | |
Total distributions | | | (0.08) | | | | — | | | | — | |
| | | |
| Net asset value, end of year | | | $16.21 | | | | $13.53 | | | | $9.40 | |
Total return4 | | | 20.51 | % | | | 43.94 | % | | | (9.96) | % |
| | | |
| Net assets, end of year (000s) | | | $13,807 | | | | $13,099 | | | | $9,877 | |
| | | |
| Ratios to average net assets: | | | | | | | | | | | | |
Gross expenses | | | 1.17 | % | | | 1.14 | %5 | | | 1.34 | %5 |
Net expenses6,7,8 | | | 1.17 | | | | 1.13 | 5 | | | 1.10 | 5 |
Net investment income | | | 0.35 | | | | 0.46 | 5 | | | 1.93 | 5 |
| | | |
| Portfolio turnover rate | | | 14 | % | | | 9 | % | | | 33 | % |
| 1 | Per share amounts have been calculated using the average shares method. |
| 2 | For the period April 1, 2009 through October 31, 2009. |
| 3 | For the period February 3, 2009 (commencement of operations) to March 31, 2009. |
| 4 | Performance figures, exclusive of sales charges, may reflect compensating balance arrangements, fee waivers and/or expense reimbursements. In the absence of compensating balance arrangements, fee waivers and/or expense reimbursements, the total return would have been lower. Past performance is no guarantee of future results. Total returns for periods of less than one year are not annualized. |
| 6 | The impact of compensating balance arrangements, if any, was less than 0.01%. |
| 7 | Reflects fee waivers and/or expense reimbursements. |
| 8 | As a result of an expense limitation arrangement, the ratio of expenses, other than brokerage, interest, taxes, extraordinary expenses and acquired fund fees and expenses, to average net asset of Class A shares did not exceed 1.20%. This expense limitation arrangement cannot be terminated prior to December 31, 2012 without the Board of Directors consent. |
See Notes to Financial Statements.
| | |
| 16 | | Legg Mason Capital Management American Leading Companies Trust 2010 Annual Report |
Financial highlights (cont’d)
| | | | | | | | | | | | | | | | | | | | | | | | |
| For a share of each class of capital stock outstanding throughout each year ended October 31, unless otherwise noted: | |
Class C Shares1 | | 20102 | | | 20092,3 | | | 20092,4 | | | 20082,4 | | | 20072,4 | | | 20064 | |
| | | | | | |
| Net asset value, beginning of year | | | $ 13.46 | | | | $ 9.39 | | | | $ 19.52 | | | | $ 24.87 | | | | $ 24.59 | | | | $ 21.85 | |
| | | | | | |
| Income (loss) from operations: | | | | | | | | | | | | | | | | | | | | | | | | |
Net investment income (loss) | | | (0.06) | | | | (0.02) | | | | 0.09 | | | | 0.03 | | | | (0.06) | | | | 0.01 | |
Net realized and unrealized gain (loss) | | | 2.70 | | | | 4.09 | | | | (10.07) | | | | (3.81) | | | | 1.64 | | | | 2.73 | |
Total income (loss) from operations | | | 2.64 | | | | 4.07 | | | | (9.98) | | | | (3.78) | | | | 1.58 | | | | 2.74 | |
| | | | | | |
| Less distributions from: | | | | | | | | | | | | | | | | | | | | | | | | |
Net investment income | | | — | | | | — | | | | (0.10) | | | | — | | | | (0.01) | | | | — | |
Net realized gains | | | — | | | | — | | | | (0.05) | | | | (1.57) | | | | (1.29) | | | | — | |
Total distributions | | | — | | | | — | | | | (0.15) | | | | (1.57) | | | | (1.30) | | | | — | |
| | | | | | |
| Net asset value, end of year | | | $16.10 | | | | $13.46 | | | | $9.39 | | | | $19.52 | | | | $24.87 | | | | $24.59 | |
Total return5 | | | 19.61 | % | | | 43.34 | % | | | (51.32) | % | | | (16.24) | % | | | 6.68 | % | | | 12.54 | % |
| | | | | | |
| Net assets, end of year (000s) | | | $189,961 | | | | $200,905 | | | | $159,944 | | | | $531,186 | | | | $765,000 | | | | $757,630 | |
| | | | | | |
| Ratios to average net assets: | | | | | | | | | | | | | | | | | | | | | | | | |
Gross expenses | | | 1.93 | % | | | 1.88 | %6 | | | 1.89 | % | | | 1.83 | % | | | 1.85 | % | | | 1.86 | % |
Net expenses7,8,9 | | | 1.92 | | | | 1.88 | 6 | | | 1.88 | | | | 1.83 | | | | 1.85 | | | | 1.86 | |
Net investment income (loss) | | | (0.40) | | | | (0.28) | 6 | | | 0.62 | | | | 0.12 | | | | (0.23) | | | | 0.04 | |
| | | | | | |
| Portfolio turnover rate | | | 14 | % | | | 9 | % | | | 33 | % | | | 28 | % | | | 19 | % | | | 14 | % |
| 1 | On February 1, 2009, Primary Class shares were renamed Class C shares. |
| 2 | Per share amounts have been calculated using the average shares method. |
| 3 | For the period April 1, 2009 through October 31, 2009. |
| 4 | For the year ended March 31. |
| 5 | Performance figures, exclusive of CDSC, may reflect compensating balance arrangements, fee waivers and/or expense reimbursements. In the absence of compensating balance arrangements, fee waivers and/or expense reimbursements, the total return would have been lower. Past performance is no guarantee of future results. Total returns for periods of less than one year are not annualized. |
| 7 | The impact of compensating balance arrangements, if any, was less than 0.01%. |
| 8 | As a result of an expense limitation arrangement, the ratio of expenses, other than brokerage, interest, taxes, extraordinary expenses and acquired fund fees and expenses, to average net asset of Class C shares did not exceed 1.95%. This expense limitation arrangement cannot be terminated prior to December 31, 2012 without the Board of Directors consent. |
| 9 | Reflects fee waivers and/or expense reimbursements. |
See Notes to Financial Statements.
| | | | |
| Legg Mason Capital Management American Leading Companies Trust 2010 Annual Report | | | 17 | |
| | | | | | | | | | | | | | | | | | | | | | | | |
| For a share of each class of capital stock outstanding throughout each year ended October 31, unless otherwise noted: | |
Class I Shares1 | | 20102 | | | 20092,3 | | | 20092,4 | | | 20082,4 | | | 20072,4 | | | 20064 | |
| | | | | | |
| Net asset value, beginning of year | | | $14.14 | | | | $9.81 | | | | $20.57 | | | | $25.86 | | | | $25.33 | | | | $22.34 | |
| | | | | | |
| Income (loss) from operations: | | | | | | | | | | | | | | | | | | | | | | | | |
Net investment income | | | 0.10 | | | | 0.05 | | | | 0.28 | | | | 0.31 | | | | 0.23 | | | | 0.22 | |
Net realized and unrealized gain (loss) | | | 2.84 | | | | 4.28 | | | | (10.63) | | | | (4.03) | | | | 1.67 | | | | 2.82 | |
Total income (loss) from operations | | | 2.94 | | | | 4.33 | | | | (10.35) | | | | (3.72) | | | | 1.90 | | | | 3.04 | |
| | | | | | |
| Less distributions from: | | | | | | | | | | | | | | | | | | | | | | | | |
Net investment income | | | (0.12) | | | | — | | | | (0.36) | | | | — | | | | (0.08) | | | | (0.05) | |
Net realized gains | | | — | | | | — | | | | (0.05) | | | | (1.57) | | | | (1.29) | | | | — | |
Total distributions | | | (0.12) | | | | — | | | | (0.41) | | | | (1.57) | | | | (1.37) | | | | (0.05) | |
| | | | | | |
| Net asset value, end of year | | | $16.96 | | | | $14.14 | | | | $9.81 | | | | $20.57 | | | | $25.86 | | | | $25.33 | |
Total return5 | | | 20.89 | % | | | 44.14 | % | | | (50.86) | % | | | (15.37) | % | | | 7.77 | % | | | 13.63 | % |
| | | | | | |
| Net assets, end of year (000s) | | | $13,458 | | | | $12,008 | | | | $9,426 | | | | $68,559 | | | | $72,546 | | | | $41,476 | |
| | | | | | |
| Ratios to average net assets: | | | | | | | | | | | | | | | | | | | | | | | | |
Gross expenses | | | 0.89 | % | | | 0.89 | %6 | | | 0.87 | % | | | 0.79 | % | | | 0.82 | % | | | 0.84 | % |
Net expenses7,8,9 | | | 0.89 | | | | 0.89 | 6 | | | 0.86 | | | | 0.79 | | | | 0.82 | | | | 0.84 | |
Net investment income | | | 0.63 | | | | 0.70 | 6 | | | 1.61 | | | | 1.22 | | | | 0.90 | | | | 1.09 | |
| | | | | | |
| Portfolio turnover rate | | | 14 | % | | | 9 | % | | | 33 | % | | | 28 | % | | | 19 | % | | | 14 | % |
| 1 | On October 5, 2009, Institutional Class shares were renamed Class I shares. |
| 2 | Per share amounts have been calculated using the average shares method. |
| 3 | For the period April 1, 2009 through October 31, 2009. |
| 4 | For the year ended March 31. |
| 5 | Performance figures may reflect compensating balance arrangements, fee waivers and/or expense reimbursements. In the absence of compensating balance arrangements, fee waivers and/or expense reimbursements, the total return would have been lower. Past performance is no guarantee of future results. Total returns for periods of less than one year are not annualized. |
| 7 | The impact of compensating balance arrangements, if any, was less than 0.01%. |
| 8 | As a result of an expense limitation arrangement, the ratio of expenses, other than brokerage, interest, taxes, extraordinary expenses and acquired fund fees and expenses, to average net asset of Class I shares did not exceed 0.95%. This expense limitation arrangement cannot be terminated prior to December 31, 2012 without the Board of Directors consent. |
| 9 | Reflects fee waivers and/or expense reimbursements. |
See Notes to Financial Statements.
| | |
| 18 | | Legg Mason Capital Management American Leading Companies Trust 2010 Annual Report |
Notes to financial statements
1. Organization and significant accounting policies
Legg Mason Capital Management American Leading Companies Trust (the “Fund”) is a separate series of Legg Mason Investors Trust, Inc. (the “Corporation”) registered under the Investment Company Act of 1940, as amended (the “1940 Act”), as an open-end diversified investment company.
The following are significant accounting policies consistently followed by the Fund and are in conformity with U.S. generally accepted accounting principles (“GAAP”). Estimates and assumptions are required to be made regarding assets, liabilities and changes in net assets resulting from operations when financial statements are prepared. Changes in the economic environment, financial markets and any other parameters used in determining these estimates could cause actual results to differ. Subsequent events have been evaluated through the date the financial statements were issued.
(a) Investment valuation. Equity securities for which market quotations are available are valued at the last reported sales price or official closing price on the primary market or exchange on which they trade. Debt securities are valued at the last quoted bid price provided by an independent pricing service, that is based on transactions in debt obligations, quotations from bond dealers, market transactions in comparable securities and various other relationships between securities. When prices are not readily available, or are determined not to reflect fair value, such as when the value of a security has been significantly affected by events after the close of the exchange or market on which the security is principally traded, but before the Fund calculates its net asset value, the Fund values these securities at fair value as determined in accordance with procedures approved by the Fund’s Board of Directors. Short-term obligations with maturities of 60 days or less are valued at amortized cost, which approximates fair value.
The Fund has adopted Financial Accounting Standards Board Codification Topic 820 (“ASC Topic 820”). ASC Topic 820 establishes a single definition of fair value, creates a three-tier hierarchy as a framework for measuring fair value based on inputs used to value the Fund’s investments, and requires additional disclosure about fair value. The hierarchy of inputs is summarized below.
| Ÿ | | Level 1 — quoted prices in active markets for identical investments |
| Ÿ | | Level 2 — other significant observable inputs (including quoted prices for similar investments, interest rates, prepayment speeds, credit risk, etc.) |
| Ÿ | | Level 3 — significant unobservable inputs (including the Fund’s own assumptions in determining the fair value of investments) |
The inputs or methodology used for valuing securities are not necessarily an indication of the risk associated with investing in those securities.
The Fund uses valuation techniques to measure fair value that are consistent with the market approach and/or income approach, depending on the type of security and the particular circumstance. The market approach uses prices and other relevant information generated by market transactions involving identical or comparable securities. The income approach uses valuation techniques to discount estimated future cash flows to present value.
The following is a summary of the inputs used in valuing the Fund’s assets carried at fair value:
| | | | | | | | | | | | | | | | |
| Description | | Quoted Prices
(Level 1) | | | Other Significant
Observable Inputs
(Level 2) | | | Significant
Unobservable
Inputs
(Level 3) | | | Total | |
| Common stocks† | | $ | 217,134,620 | | | | — | | | | — | | | $ | 217,134,620 | |
| † | See Schedule of Investments for additional detailed categorizations. |
(b) Repurchase agreements. The Fund may enter into repurchase agreements with institutions that its investment adviser has determined are creditworthy. Each repurchase agreement is recorded at cost. Under the terms of a typical repurchase agreement, the Fund acquires a debt security subject to an obligation of the seller to repurchase, and of the Fund to resell, the security at an agreed-upon price and time, thereby determining the yield during the Fund’s holding period. When entering into repurchase agreements, it is the Fund’s policy that its custodian or a third party custodian, acting on the Fund’s behalf, take possession of the underlying collateral securities, the market value of which, at all times, at least equals the principal
| | | | |
| Legg Mason Capital Management American Leading Companies Trust 2010 Annual Report | | | 19 | |
amount of the repurchase transaction, including accrued interest. To the extent that any repurchase transaction maturity exceeds one business day, the value of the collateral is marked-to-market and measured against the value of the agreement in an effort to ensure the adequacy of the collateral. If the counterparty defaults, the Fund generally has the right to use the collateral to satisfy the terms of the repurchase transaction. However, if the market value of the collateral declines during the period in which the Fund seeks to assert its rights or if bankruptcy proceedings are commenced with respect to the seller of the security, realization of the collateral by the Fund may be delayed or limited.
(c) Security transactions and investment income. Security transactions are accounted for on a trade date basis. Interest income, adjusted for amortization of premium and accretion of discount, is recorded on the accrual basis. Dividend income is recorded on the ex-dividend date. Foreign dividend income is recorded on the ex-dividend date or as soon as practicable after the Fund determines the existence of a dividend declaration after exercising reasonable due diligence. The cost of investments sold is determined by use of the specific identification method. To the extent any issuer defaults or a credit event occurs that impacts the issuer, the Fund may halt any additional interest income accruals and consider the realizability of interest accrued up to the date of default or credit event.
(d) Distributions to shareholders. Distributions from net investment income and distributions of net realized gains, if any, are declared at least annually. Distributions to shareholders of the Fund are recorded on the ex-dividend date and are determined in accordance with income tax regulations, which may differ from GAAP.
(e) Compensating balance arrangements. The Fund has an arrangement with its custodian bank whereby a portion of the custodian’s fees is paid indirectly by credits earned on the Fund’s cash on deposit with the bank. The amount is shown as a reduction of expenses in the Statement of Operations.
(f) Commission recapture. The Fund has entered into a directed brokerage agreement with State Street Bank & Trust Company, its custodian, whereby a portion of commissions paid on investment transactions may be rebated to the Fund. Such payments are included in the realized gain/(loss) on investment transactions. During the year ended October 31, 2010, the Fund did not receive any commission rebates.
(g) Share class accounting. Investment income, common expenses and realized/unrealized gains (losses) on investments are allocated to the various classes of the Fund on the basis of daily net assets of each class. Fees relating to a specific class are charged directly to that share class.
(h) Federal and other taxes. It is the Fund’s policy to comply with the federal income and excise tax requirements of the Internal Revenue Code of 1986 (the “Code”), as amended, applicable to regulated investment companies. Accordingly, the Fund intends to distribute its taxable income and net realized gains, if any, to shareholders in accordance with timing requirements imposed by the Code. Therefore, no federal or state income tax provision is required in the Fund’s financial statements.
Management has analyzed the Fund’s tax positions taken on income tax returns for all open tax years and has concluded that as of October 31, 2010, no provision for income tax is required in the Fund’s financial statements. The Fund’s federal and state income and federal excise tax returns for tax years for which the applicable statutes of limitations have not expired are subject to examination by Internal Revenue Service and state departments of revenue.
Under the applicable foreign tax laws, a withholding tax may be imposed on interest, dividends and capital gains at various rates.
(i) Reclassification. GAAP requires that certain components of net assets be reclassified to reflect permanent differences between financial and tax reporting. These reclassifications have no effect on net assets or net asset values per share. During the current year, the following reclassifications have been made:
| | | | | | | | |
| | | Overdistributed Net
Investment Income | | | Paid-in
Capital | |
| (a) | | $ | 698,241 | | | $ | (698,241) | |
| (a) | Reclassifications are primarily due to a tax net operating loss. |
| | |
| 20 | | Legg Mason Capital Management American Leading Companies Trust 2010 Annual Report |
Notes to financial statements (cont’d)
2. Investment advisory and management agreement and other transactions with affiliates
The Fund has an investment advisory and management agreement with Legg Mason Capital Management, Inc. (“LMCM”). Pursuant to the agreement, LMCM provides the Fund with investment advisory, management and administrative services for which the Fund pays a fee, computed daily and payable monthly, at annual rates based on the Fund’s average daily net assets. The annual advisory fee rates for the Fund are provided in the chart below:
| | | | |
| Average Daily Net Assets | | Annual Rate | |
| First $1 billion | | | 0.70 | % |
| Next $1 billion | | | 0.68 | |
| Next $3 billion | | | 0.65 | |
| Next $5 billion | | | 0.62 | |
| Over $10 billion | | | 0.59 | |
Legg Mason Partners Fund Advisor, LLC (“LMPFA”) provides certain administrative and oversight services to the Fund. For LMPFA’s services to the Fund, LMCM (not the Fund) pays LMPFA a fee, calculated daily and payable monthly, at an annual rate of 0.05% of the average daily net assets of the Fund. LMCM and LMPFA are wholly-owned subsidiaries and corporate affiliates of Legg Mason, Inc. (“Legg Mason”).
As a result of expense limitation arrangement between the Fund and LMCM, the ratio of expenses, other than brokerage, interest, taxes, extraordinary expenses and acquired fund fees and expenses, to average net assets of Class A, Class C and Class I shares did not exceed 1.20%, 1.95% and 0.95%, respectively. This expense limitation arrangement cannot be terminated prior to December 31, 2012 without the Board of Directors’ consent.
During the year ended October 31, 2010, fees waived and/or expenses reimbursed amounted to $18,863.
The manager is permitted to recapture amounts forgone or reimbursed to a class within three years after the year in which the manager earned the fee or incurred the expense if the class’ total annual operating expenses have fallen to a level below the expense limitation (“expense cap”) in effect at the time the fees were earned or the expense incurred. In no case will the manager recapture any amount that would result, on any particular business day of the Fund, in the class’ total annual operating expenses exceeding the expense cap or any other lower limit then in effect.
Pursuant to these agreements, at October 31, 2010, the Fund had remaining fee waivers and expense reimbursements subject to recapture by LMCM as follows:
| | | | | | | | | | | | |
| | | Class A | | | Class C | | | Class I | |
| Expires October 31, 2013 | | $ | 309 | | | $ | 18,554 | | | | — | |
| Total fee waivers/expenses reimbursements subject to recapture | | $ | 309 | | | $ | 18,554 | | | | — | |
For the year ended October 31, 2010, LMCM did not recapture any fees.
Legg Mason Investor Services, LLC (“LMIS”), a wholly-owned broker-dealer subsidiary of Legg Mason, serves as the Fund’s sole and exclusive distributor.
There is a maximum initial sales charge of 5.75% for Class A shares. Class C shares have a 1.00% contingent deferred sales charge (“CDSC”) which applies if shares are redeemed within one year from purchase payment. In certain cases, Class A shares have a 1.00% CDSC, which applies if redemption occurs within one year from purchase payment. This CDSC only applies to those purchases of Class A shares, which, when combined with current holdings of Class A shares, equal or exceed $1,000,000 in the aggregate. These purchases do not incur an initial sales charge.
| | | | |
| Legg Mason Capital Management American Leading Companies Trust 2010 Annual Report | | | 21 | |
For the year ended October 31, 2010, LMIS and its affiliates received sales charges of approximately $1,000 on sales of the Fund’s Class A shares. In addition, for the year ended October 31, 2010, CDSCs paid to LMIS and its affiliates were approximately:
| | | | | | | | |
| | | Class A | | | Class C | |
| CDSCs | | $ | 2,000 | | | $ | 9,000 | |
Under a Deferred Compensation Plan (the “Plan”), Directors may elect to defer receipt of all or a specified portion of their compensation. A participating director may select one or more funds managed by affiliates of Legg Mason in which his or her deferred director’s fees will be deemed to be invested. Deferred amounts remain in the Fund until distributed in accordance with the Plan.
All officers and two Directors of the Fund are employees of Legg Mason or its affiliates and do not receive compensation from the Fund.
3. Investments
During the year ended October 31, 2010, the aggregate cost of purchases and proceeds from sales of investments (excluding short-term investments) were as follows:
| | | | |
| Purchases | | $ | 30,829,921 | |
| Sales | | | 80,952,254 | |
At October 31, 2010, the aggregate gross unrealized appreciation and depreciation of investments for federal income tax purposes were as follows:
| | | | |
| Gross unrealized appreciation | | $ | 76,971,682 | |
| Gross unrealized depreciation | | | (5,760,214) | |
| Net unrealized appreciation | | $ | 71,211,468 | |
4. Derivative instruments and hedging activities
Financial Accounting Standards Board Codification Topic 815 requires enhanced disclosure about an entity’s derivative and hedging activities.
During the year ended October 31, 2010, the Fund did not invest in any derivative instruments.
5. Class specific expenses, waivers and/or reimbursements
The Fund has adopted Rule 12b-1 distribution plans and under the plans the Fund pays a service fee with respect to its Class A and C shares calculated at the annual rate of 0.25% of the average daily net assets of each class, respectively. The Fund also pays a distribution fee with respect to its Class C shares calculated at the annual rate of 0.75% of the average daily net assets of its Class C shares. Distribution fees are accrued daily and paid monthly.
For the year ended October 31, 2010, class specific expenses were as follows:
| | | | | | | | |
| | | Distribution
Fees | | | Transfer Agent
Fees | |
| Class A | | $ | 34,686 | | | $ | 16,177 | |
| Class C | | | 2,001,798 | | | | 251,545 | |
| Class I | | | — | | | | 10,589 | |
| Total | | $ | 2,036,484 | | | | $278,311 | |
For the year ended October 31, 2010, waivers and/or reimbursements by class were as follows:
| | | | |
| | | Waivers/
Reimbursements | |
| Class A | | | $309 | |
| Class C | | | 18,554 | |
| Class I | | | — | |
| Total | | | $18,863 | |
| | |
| 22 | | Legg Mason Capital Management American Leading Companies Trust 2010 Annual Report |
Notes to financial statements (cont’d)
6. Distributions to shareholders by class
| | | | | | | | | | | | |
| | | Year Ended
October 31, 2010 | | | Period Ended
October 31, 2009† | | | Year Ended
March 31, 2009 | |
| Net Investment Income: | | | | | | | | | | | | |
| Class A | | | $80,169 | | | | — | | | | — | |
| Class C | | | — | | | | — | | | | $2,036,660 | |
| Class I | | | 97,755 | | | | — | | | | 640,229 | |
| Total | | | $177,924 | | | | — | | | | $2,676,889 | |
| | | |
| Net Realized Gains: | | | | | | | | | | | | |
| Class A | | | — | | | | — | | | | — | |
| Class C | | | — | | | | — | | | | $1,224,154 | |
| Class I | | | — | | | | — | | | | 159,648 | |
| Total | | | — | | | | — | | | | $1,383,802 | |
| † | For the period April 1, 2009 through October 31, 2009. |
7. Shares of beneficial interest
At October 31, 2010, there were 100,000,000 shares authorized at $0.001 par value for Class A and 250,000,000 shares authorized at $0.001 par value for each of Class C and Class I of the Fund.
Transactions in shares of each class were as follows:
| | | | | | | | | | | | | | | | | | | | | | | | |
| | | Year Ended
October 31, 2010 | | | Period Ended
October 31, 2009† | | | Year Ended
March 31, 2009 | |
| | | Shares | | | Amount | | | Shares | | | Amount | | | Shares | | | Amount | |
| | |
| Class A | | | | | | | | | |
| Shares sold | | | 56,033 | | | $ | 879,677 | | | | 22,568 | | | $ | 292,982 | | | | 1,201,487 | * | | $ | 12,544,198 | * |
| Shares issued on reinvestment | | | 5,525 | | | | 80,115 | | | | — | | | | — | | | | — | | | | — | |
| Shares repurchased | | | (178,128) | | | | (2,724,485) | | | | (105,168) | | | | (1,285,454) | | | | (150,672) | * | | | (1,469,770) | * |
| Net increase (decrease) | | | (116,570) | | | $ | (1,764,693) | | | | (82,600) | | | $ | (992,472) | | | | 1,050,815 | * | | $ | 11,074,428 | * |
| | | | | | |
| Class C1 | | | | | | | | | | | | | | | | | | | | | | | | |
| Shares sold | | | 404,923 | | | $ | 6,145,383 | | | | 290,289 | | | $ | 3,557,107 | | | | 2,832,671 | | | $ | 39,612,249 | |
| Shares issued on reinvestment | | | — | | | | — | | | | — | | | | — | | | | 251,573 | | | | 3,257,702 | |
| Shares repurchased | | | (3,532,771) | | | | (53,285,005) | | | | (2,394,861) | | | | (29,650,377) | | | | (13,270,477) | | | | (192,414,805) | |
| Net decrease | | | (3,127,848) | | | $ | (47,139,622) | | | | (2,104,572) | | | $ | (26,093,270) | | | | (10,186,233) | | | $ | (149,544,854) | |
| | | | | | |
| Class I2 | | | | | | | | | | | | | | | | | | | | | | | | |
| Shares sold | | | 259,920 | | | $ | 4,149,945 | | | | 115,985 | | | $ | 1,481,123 | | | | 568,283 | | | $ | 9,715,962 | |
| Shares issued on reinvestment | | | 6,168 | | | | 93,313 | | | | — | | | | — | | | | 49,581 | | | | 783,332 | |
| Shares repurchased | | | (321,718) | | | | (5,080,837) | | | | (227,574) | | | | (2,856,884) | | | | (2,989,913) | | | | (51,793,830) | |
| Net decrease | | | (55,630) | | | $ | (837,579) | | | | (111,589) | | | $ | (1,375,761) | | | | (2,372,049) | | | $ | (41,294,536) | |
| † | For the period April 1, 2009 through October 31, 2009. |
| * | For the period February 3, 2009 (inception date) to March 31, 2009. |
| 1 | On February 1, 2009, Primary Class shares were renamed Class C shares. |
| 2 | On October 5, 2009, Institutional Class shares were renamed Class I shares. |
8. Income tax information and distributions to shareholders
The tax character of distributions paid during the fiscal year ended October 31, 2010 fiscal period ended October 31, 2009 and fiscal year ended March 31, 2009 were as follows:
| | | | | | | | | | | | |
| ` | | October 31, 2010 | | | October 31, 2009† | | | March 31, 2009 | |
| | | |
| Distributions Paid From: | | | | | | | | | | | | |
| Ordinary income | | | $177,924 | | | | — | | | | — | |
| † | For the period April 1, 2009 through October 31, 2009. |
| | | | |
| Legg Mason Capital Management American Leading Companies Trust 2010 Annual Report | | | 23 | |
As of October 31, 2010, the components of accumulated earnings on a tax basis were as follows:
| | | | |
| Capital loss carryforward* | | $ | (61,971,432) | |
| Other book/tax temporary differences(a) | | | (115,924) | |
| Unrealized appreciation (depreciation)(b) | | | 71,211,468 | |
| Total accumulated earnings (losses) — net | | $ | 9,124,112 | |
| * | During the taxable year ended October 31, 2010, the Fund utilized $14,509,320 of its capital loss carryover available from prior years. As of October 31, 2010, the Fund had the following net capital loss carryforwards remaining: |
| | | | |
| Year of Expiration | | Amount | |
| 10/31/2016 | | | $(21,960,115) | |
| 10/31/2017 | | | (40,011,317) | |
| | | | $(61,971,432) | |
These amounts will be available to offset any future taxable capital gains.
| (a) | Other book/tax temporary differences are attributable primarily to book/tax differences in the timing of the deductibility of various expenses. |
| (b) | The difference between book-basis and tax-basis unrealized appreciation (depreciation) is attributable primarily to the tax deferral of losses on wash sales. |
9. Line of credit
The Fund, along with certain other Legg Mason Funds, participates in a $200 million line of credit (“Credit Agreement”) to be used for temporary or emergency purposes. This 364-day revolving Credit Agreement matures on March 3, 2011. Pursuant to the Credit Agreement, each participating fund is liable only for principal and interest payments related to borrowings made by that fund. Borrowings under the Credit Agreement bear interest at a rate equal to the prevailing federal funds rate plus the federal funds rate margin. The Fund did not utilize the line of credit during the year ended October 31, 2010.
10. Other Matter
The Board of Directors of Legg Mason Investors Trust, Inc. recently approved a reorganization pursuant to which Legg Mason Capital Management American Leading Companies Trust’s (the “Fund”) assets would be acquired, and its liabilities would be assumed, by Legg Mason Capital Management Value Trust, Inc. (the “Acquiring Fund”) in exchange for shares of the Acquiring Fund. The Fund would then be liquidated, and shares of the Acquiring Fund would be distributed to Fund shareholders.
Under the reorganization, Fund shareholders would receive shares of the Acquiring Fund with the same aggregate net asset value (“NAV”) as their shares of the Fund. It is anticipated that no gain or loss for federal income tax purposes would be recognized by Fund shareholders as a result of the reorganization.
The reorganization is subject to the satisfaction of certain conditions, including approval by Fund shareholders. Proxy materials describing the reorganization are expected to be mailed in the first quarter of 2011. If the reorganization is approved by Fund shareholders, it is expected to occur in April 2011. Prior to the reorganization, shareholders can continue to purchase, redeem and exchange shares subject to the limitations described in the Fund’s prospectus.
| | |
| 24 | | Legg Mason Capital Management American Leading Companies Trust 2010 Annual Report |
Report of independent registered public accounting firm
To the Board of Directors of Legg Mason Investors Trust, Inc. and Shareholders of Legg Mason Capital Management American Leading Companies Trust:
In our opinion, the accompanying statement of assets and liabilities, including the schedule of investments, and the related statements of operations and of changes in net assets and the financial highlights present fairly, in all material respects, the financial position of Legg Mason Capital Management American Leading Companies Trust (one of the portfolios comprising Legg Mason Investors Trust, Inc., the “Fund”) at October 31, 2010, the results of its operations, the changes in its net assets, and the financial highlights for each of the periods presented, in conformity with accounting principles generally accepted in the United States of America. These financial statements and financial highlights (hereafter referred to as “financial statements”) are the responsibility of the Fund’s management; our responsibility is to express an opinion on these financial statements based on our audits. We conducted our audits of these financial statements in accordance with the standards of the Public Company Accounting Oversight Board (United States). Those standards require that we plan and perform the audit to obtain reasonable assurance about whether the financial statements are free of material misstatement. An audit includes examining, on a test basis, evidence supporting the amounts and disclosures in the financial statements, assessing the accounting principles used and significant estimates made by management, and evaluating the overall financial statement presentation. We believe that our audits, which included confirmation of securities at October 31, 2010 by correspondence with the custodian and brokers, provide a reasonable basis for our opinion.
PricewaterhouseCoopers LLP
Baltimore, Maryland
December 15, 2010
| | | | |
| Legg Mason Capital Management American Leading Companies Trust | | | 25 | |
Additional information (unaudited)
Information about Directors and Officers
The business and affairs of Legg Mason Capital Management American Leading Companies Trust (the “Fund”) are conducted by management under the supervision and subject to the direction of its Board of Directors. The business address of each Director is 100 International Drive, Attn: Fund Secretary, Baltimore, Maryland 21202. Information pertaining to the Directors and Officers of the Fund is set forth below.
The Statement of Additional Information includes additional information about Directors and is available, without charge, upon request by calling the Fund at 1-877-721-1926.
| | |
| Independent Directors1 |
|
| Ruby P. Hearn |
| |
| Year of birth | | 1940 |
| Position with Fund | | Director |
| Term of office and length of time served2 | | Since 2004 |
| Principal occupation(s) during past five years | | Senior Vice President Emerita of The Robert Wood Johnson Foundation (non-profit) since 2001; Trustee of the New York Academy of Medicine since 2004; Director of the Institute for Healthcare Improvement since 2002; Member of the Institute of Medicine since 1982; formerly: Senior Vice President of The Robert Wood Johnson Foundation (1996 to 2001); Fellow of The Yale Corporation (1992 to 1998). |
| Number of funds in fund complex overseen by Director | | 16 |
| Other directorships held by Director during past five years | | None |
|
| Arnold L. Lehman |
| |
| Year of birth | | 1944 |
| Position with Fund | | Lead Independent Director |
| Term of office and length of time served2 | | Since 1993 |
| Principal occupation(s) during past five years | | Director of the Brooklyn Museum since 1997; Trustee of American Federation of Arts since 1998. Formerly: Director of The Baltimore Museum of Art (1979 to 1997). |
| Number of funds in fund complex overseen by Director | | 16 |
| Other directorships held by Director during past five years | | None |
|
| Robin J.W. Masters |
| |
| Year of birth | | 1955 |
| Position with Fund | | Director |
| Term of office and length of time served2 | | Since 2002 |
| Principal occupation(s) during past five years | | Retired; formerly: Chief Investment Officer of ACE Limited (insurance) (1986 to 2000). |
| Number of funds in fund complex overseen by Director | | 16 |
| Other directorships held by Director during past five years | | Director of Cheyne Capital International Limited (investment advisory firm). Director/Trustee of Legg Mason Institutional Funds plc, WA Fixed Income Funds plc and Western Asset Debt Securities Fund plc. |
|
| Jill E. McGovern |
| |
| Year of birth | | 1944 |
| Position with Fund | | Director |
| Term of office and length of time served2 | | Since 1993 |
| Principal occupation(s) during past five years | | Senior Consultant, American Institute for Contemporary German Studies (AICGS) since 2007; formerly: Chief Executive Officer of The Marrow Foundation (non-profit) (1993 to 2007); Executive Director of the Baltimore International Festival (1991 to 1993); Senior Assistant to the President of The Johns Hopkins University (1986 to 1990). |
| Number of funds in fund complex overseen by Director | | 16 |
| Other directorships held by Director during past five years | | Director of International Biomedical Research Alliance; Director of Lois Roth Endowment |
| | |
| 26 | | Legg Mason Capital Management American Leading Companies Trust |
Additional information (unaudited) (cont’d)
Information about Directors and Officers
| | |
| Independent Directors1 cont’d |
|
| Arthur S. Mehlman |
| |
| Year of birth | | 1942 |
| Position with Fund | | Director |
| Term of office and length of time served2 | | Since 2002 |
| Principal occupation(s) during past five years | | Retired. Director, The University of Maryland Foundation since 1992; Director, The League for People with Disabilities since 2003; formerly: Partner, KPMG LLP (international accounting firm) (1972 to 2002). |
| Number of funds in fund complex overseen by Director | | Director/Trustee of all Legg Mason Funds consisting of 16 portfolios; Director/Trustee of the Royce Family of Funds consisting of 30 portfolios. |
| Other directorships held by Director during past five years | | Director of Municipal Mortgage & Equity, LLC. |
|
| G. Peter O’Brien |
| |
| Year of birth | | 1945 |
| Position with Fund | | Director |
| Term of office and length of time served2 | | Since 1999 |
| Principal occupation(s) during past five years | | Retired. Trustee Emeritus of Colgate University; Board Member, Hill House, Inc. (residential home care); Board Member, Bridges School (pre-school); formerly: Managing Director, Equity Capital Markets Group of Merrill Lynch & Co. (1971-1999). |
| Number of funds in fund complex overseen by Director | | Director/Trustee of all Legg Mason funds consisting of 16 portfolios; Director/Trustee of the Royce Family of Funds consisting of 30 portfolios. |
| Other directorships held by Director during past five years | | Director of Technology Investment Capital Corp. |
|
| S. Ford Rowan |
| |
| Year of birth | | 1943 |
| Position with Fund | | Director |
| Term of office and length of time served2 | | Since 2002 |
| Principal occupation(s) during past five years | | Chairman, National Center for Critical Incident Analysis, National Defense University Foundation, since 2004; Trustee, St. John’s College, since 2006; formerly: Consultant, Rowan & Blewitt Inc. (management consulting) (1984 to 2007); Lecturer in Journalism, Northwestern University (1980 to 1993); Lecturer in Organizational Sciences, George Washington University (2000 to 2008); Director, Sante Fe Institute (1999 to 2008). |
| Number of funds in fund complex overseen by Director | | 16 |
| Other directorships held by Director during past five years | | None |
|
| Robert M. Tarola |
| |
| Year of birth | | 1950 |
| Position with Fund | | Director |
| Term of office and length of time served2 | | Since 2004 |
| Principal occupation(s) during past five years | | President of Right Advisory LLC (corporate finance and governance consulting) since 2008; Member, Investor Advisory Group of the Public Company Accounting Oversight Board since 2009; Senior Vice President and Chief Financial Officer of The Howard University since 2010 (higher education and health care); formerly: Senior Vice President and Chief Financial Officer of W.R. Grace & Co. (specialty chemicals) (1999 to 2008) and MedStar Health, Inc. (healthcare) (1996 to 1999); Partner, Price Waterhouse, LLP (accounting and auditing) (1984 to 1996). |
| Number of funds in fund complex overseen by Director | | 16 |
| Other directorships held by Director during past five years | | Director of TeleTech Holdings, Inc. (business process outsourcing); Director of American Kidney Fund (renal disease assistance) |
| | | | |
| Legg Mason Capital Management American Leading Companies Trust | | | 27 | |
| | |
| Interested Directors3 |
|
| Mark R. Fetting |
| |
| Year of birth | | 1954 |
| Position with Fund | | Chairman and Director |
| Term of office and length of time served2 | | Director since 2002 and Chairman since 2008 |
| Principal occupation(s) during past five years | | President, CEO, Chairman and Director of Legg Mason, Inc. and Chairman of Legg Mason Funds since 2008; formerly: President of all Legg Mason Funds (2001 to 2008). Senior Executive Vice President of Legg Mason, Inc., Director and/or officer of various Legg Mason, Inc. affiliates (2000 to 2008). Division President and Senior Officer of Prudential Financial Group, Inc. and related companies, including fund boards and consulting services to subsidiary companies (1991 to 2000) |
| Number of funds in fund complex overseen by Director | | Chairman and Director/Trustee of all Legg Mason Funds consisting of 16 portfolios; Director/Trustee of the Royce Family of Funds consisting of 30 portfolios. |
| Other directorships held by Director during past five years | | None |
|
| David R. Odenath |
| |
| Year of birth | | 1957 |
| Position with Fund | | President and Director |
| Term of office and length of time served2 | | Since 2008 |
| Principal occupation(s) during past five years | | Senior Executive Vice President of Legg Mason, Inc. and President of Legg Mason Funds since 2008; formerly: President of Prudential Annuities (2002 to 2008); Executive Vice President (2003 to 2008) of American Skandia Investment Services, Inc; Chief Executive Officer and Director (2003 to 2008) of American Skandia Life Assurance Corporation, American Skandia Information Services and Technology Corporation and Skandia U.S. Inc.; President, Chief Executive Officer and Director (2003 to 2008) of American Skandia Marketing, Inc.; President, Chief Executive Officer, Chief Operating Officer and Officer-In-Charge (1999 to 2003) of Prudential Investments; Senior Vice President (1999 to 2008) of Prudential Financial, Inc.; Senior Vice President (1993 to 1999) of PaineWebber Group, Inc. (investment banking). |
| Number of funds in fund complex overseen by Director | | 16 |
| Other directorships held by Director during past five years | | None |
| Executive Officers |
| |
R. Jay Gerken, CFA Legg Mason 620 Eighth Avenue, New York NY 10018 | | |
| |
| Year of birth | | 1951 |
| Position(s) with Fund | | Vice President |
| Term of office and length of time served2 | | Since 2009 |
| Principal occupation(s) during past five years | | Managing Director of Legg Mason & Co., LLC (“Legg Mason & Co.”) (since 2005); Officer and Trustee/Director of 149 funds associated with Legg Mason Partners Fund Advisor, LLC (“LMPFA”) or its affiliates (since 2006) and Legg Mason & Co. predecessors (prior to 2006); President and Chief Executive Officer (“CEO”) of LMPFA (since 2006); President and CEO of Smith Barney Fund Management LLC (“SBFM”) and Citi Fund Management, Inc. (“CFM”) (formerly registered investment advisers) (since 2002); formerly, Chairman, President and CEO, Travelers Investment Adviser Inc. (prior to 2005) |
| |
Kaprel Ozsolak Legg Mason 55 Water Street, New York, NY 10041 | | |
| |
| Year of birth | | 1965 |
| Position(s) with Fund | | Chief Financial Officer |
| Term of office and length of time served2 | | Since 2009 |
| Principal occupation(s) during past five years | | Director of Legg Mason & Co. (since 2005); Chief Financial Officer of certain mutual funds associated with Legg Mason & Co. or its affiliates (since 2007) and Legg Mason & Co. predecessors (prior to 2007); formerly, Treasurer of certain mutual funds associated with Legg Mason & Co. or its affiliates (prior to 2010) and Legg Mason & Co. predecessors (prior to 2005); formerly, Controller of certain mutual funds associated with Legg Mason & Co. predecessors (prior to 2004) |
| | |
| 28 | | Legg Mason Capital Management American Leading Companies Trust |
Additional information (unaudited) (cont’d)
Information about Directors and Officers
| | |
| Executive Officers cont’d |
| |
Robert I. Frenkel
Legg Mason
100 First Stamford Place, Stamford, CT 06902 | | |
| |
| Year of birth | | 1954 |
| Position(s) with Fund | | Secretary and Chief Legal Officer |
| Term of office and length of time served2 | | Since 2009 |
| Principal occupation(s) during past five years | | Vice President and Deputy General Counsel of Legg Mason (since 2006); Managing Director and General Counsel of Global Mutual Funds for Legg Mason & Co. (since 2006) and Legg Mason & Co. predecessors (since 1994); Secretary and Chief Legal Officer of certain mutual funds associated with Legg Mason & Co. or its affiliates (since 2006) and Legg Mason & Co. predecessors (prior to 2006) |
| |
Ted P. Becker
Legg Mason
620 Eighth Avenue, New York, NY 10018 | | |
| |
| Year of birth | | 1951 |
| Position(s) with Fund | | Vice President and Chief Compliance Officer |
| Term of office and length of time served2 | | Since 2007 |
| Principal occupation(s) during past five years | | Director of Global Compliance at Legg Mason (since 2006); Chief Compliance Officer of LMPFA (since 2006); Managing Director of Compliance of Legg Mason & Co. (since 2005); Chief Compliance Officer of certain mutual funds associated with Legg Mason & Co. or its affiliates (since 2006) and Legg Mason & Co. predecessors (prior to 2006) |
| |
Christopher Berarducci Legg Mason 55 Water Street, New York, NY 10041 | | |
| |
| Year of birth | | 1974 |
| Position(s) with Fund | | Treasurer |
| Term of office and length of time served2 | | Since 2010 |
| Principal occupation(s) during past five years | | Assistant Vice President of Legg Mason & Co. (since 2007); Treasurer of certain mutual funds associated with LMPFA (since 2010); Assistant Controller of certain mutual funds associated with LMPFA (prior to 2010); Manager of Fund Administration at UBS Global Asset Management (prior to 2007); Assistant Vice President and Manager of Fund Administration at JP Morgan Chase & Co. (prior to 2005) |
| 1 | Directors who are not “interested persons” of the Fund within the meaning of Section 2(a)(19) of the 1940 Act. Each of the Independent Directors serves on the standing committees of the Board of Directors, which include the Audit Committee (chair: Arthur S. Mehlman), the Nominating Committee (co-chairs: G. Peter O’Brien and Jill E. McGovern), and the Independent Directors Committee (chair: Arnold L. Lehman). |
| 2 | Officers of the Fund are elected to serve until their successors are elected and qualified. Directors of the Fund serve a term of indefinite length until their retirement, in accordance with the Board’s retirement policy, resignation or removal, and stand for re-election by shareholders only as and when required by the Investment Company Act of 1940, as amended (the “1940 Act”). |
| 3 | Mr. Fetting and Mr. Odenath are considered to be interested persons, as defined in the 1940 Act, of the Fund on the basis of their current employment with the Fund’s investment adviser or its affiliated entities (including the Fund’s principal underwriter) and Legg Mason, Inc., the parent holding company of these entities as well as their ownership of Legg Mason, Inc. stock. |
| | | | |
| Legg Mason Capital Management American Leading Companies Trust | | | 29 | |
Important tax information (unaudited)
The following information is provided with respect to the distributions paid during the taxable year ended October 31, 2010:
| | | | |
| Record date: | | | 12/09/2009 | |
| Payable date: | | | 12/10/2009 | |
| Ordinary income: | | | | |
Qualified dividend income for individuals | | | 100.00 | % |
Dividends qualifying for the dividends | | | | |
Received deduction for corporations | | | 100.00 | % |
Please retain this information for your records.
Legg Mason Capital Management
American Leading Companies Trust
Directors
Mark R. Fetting
Chairman
David R. Odenath
President
Ruby P. Hearn
Arnold L. Lehman
Robin J.W. Masters
Jill E. McGovern
Arthur S. Mehlman
G. Peter O’Brien
S. Ford Rowan
Robert M. Tarola
Investment manager/adviser
Legg Mason Capital Management, Inc.
Distributor
Legg Mason Investor Services, LLC
Custodian
State Street Bank & Trust Company
Transfer agent and shareholder servicing agent
Boston Financial Data Services, Inc.
2000 Crown Colony Drive
Quincy, MA 02169
Independent registered public accounting firm
PricewaterhouseCoopers LLP
Baltimore, MD
Legg Mason Capital Management American Leading Companies Trust
Legg Mason Capital Management American Leading Companies Trust
Legg Mason Funds
55 Water Street
New York, NY 10041
The Fund files its complete schedule of portfolio holdings with the Securities and Exchange Commission (“SEC”) for the first and third quarters of each fiscal year on Form N-Q. The Fund’s Forms N-Q are available on the SEC’s website at www.sec.gov. The Fund’s Forms N-Q may be reviewed and copied at the SEC’s Public Reference Room in Washington, D.C., and information on the operation of the Public Reference Room may be obtained by calling 1-800-SEC-0330. To obtain information on Form N-Q, shareholders can call the Fund at 1-877-721-1926.
Information on how the Fund voted proxies relating to portfolio securities during the prior 12-month period ended June 30th of each year and a description of the policies and procedures that the Fund uses to determine how to vote proxies related to portfolio transactions are available (1) without charge, upon request, by calling the Fund at 1-877-721-1926 (2) on the Fund’s website at www.leggmason.com/individualinvestors and (3) on the SEC’s website at www.sec.gov.
This report is submitted for the general information of the shareholders of Legg Mason Capital Management American Leading Companies Trust. This report is not authorized for distribution to prospective investors in Legg Mason Capital Management American Leading Companies Trust unless preceded or accompanied by a current prospectus.
Investors should consider the Fund’s investment objectives, risks, charges and expenses carefully before investing. The prospectus contains this and other important information about the Fund. Please read the prospectus carefully before investing.
www.leggmason.com/individualinvestors
©2010 Legg Mason Investor Services, LLC
Member FINRA, SIPC
Privacy policy
We are committed to keeping nonpublic personal information about you secure and confidential. This notice is intended to help you understand how we fulfill this commitment. From time to time, we may collect a variety of personal information about you, including:
| Ÿ | | Information we receive from you on applications and forms, via the telephone, and through our websites; |
| Ÿ | | Information about your transactions with us, our affiliates, or others (such as your purchases, sales, or account balances); and |
| Ÿ | | Information we receive from consumer reporting agencies. |
We do not disclose nonpublic personal information about our customers or former customers, except to our affiliates (such as broker-dealers or investment advisers within the Legg Mason family of companies) or as is otherwise permitted by applicable law or regulation. For example, we may share this information with others in order to process your transactions or service an account. We may also provide this information to companies that perform marketing services on our behalf, such as printing and mailing, or to other financial institutions with whom we have joint marketing agreements. When we enter into such agreements, we will require these companies to protect the confidentiality of this information and to use it only to perform the services for which we hired them.
With respect to our internal security procedures, we maintain physical, electronic, and procedural safeguards to protect your nonpublic personal information, and we restrict access to this information.
If you decide at some point either to close your account(s) or become an inactive customer, we will continue to adhere to our privacy policies and practices with respect to your nonpublic personal information.
NOT PART OF THE ANNUAL REPORT
www.leggmason.com/individualinvestors
©2010 Legg Mason Investor Services, LLC Member FINRA, SIPC
LMF-013/A (12/10) SR10-1257
The registrant has adopted a code of ethics that applies to the registrant’s principal executive officer, principal financial officer, principal accounting officer or controller.
| ITEM 3. | AUDIT COMMITTEE FINANCIAL EXPERT. |
The Board of Trustees of the registrant has determined that Arthur S. Mehlman the Chairman of the Board’s Audit Committee and Robert M. Tarola, possess the technical attributes identified in Instruction 2(b) of Item 3 to Form N-CSR to qualify as “audit committee financial experts,” and have designated Mr. Mehlman and Mr. Tarola as the Audit Committee’s financial experts. Mr. Mehlman and Mr. Tarola are “independent” Trustees pursuant to paragraph (a) (2) of Item 3 to Form N-CSR.
| ITEM 4. | PRINCIPAL ACCOUNTANT FEES AND SERVICES. |
a) Audit Fees. The aggregate fees billed in the last two fiscal years ending October 31, 2009 and October 31, 2010 (the “Reporting Periods”) for professional services rendered by the Registrant’s principal accountant (the “Auditor”) for the audit of the Registrant’s annual financial statements, or services that are normally provided by the Auditor in connection with the statutory and regulatory filings or engagements for the Reporting Periods, were $30,560 in 2009 and $26,186 in 2010.
b) Audit-Related Fees. The aggregate fees billed in the Reporting Period for assurance and related services by the Auditor that are reasonably related to the performance of the Registrant’s financial statements were $0 in 2009 and $0 in 2010. These services consisted of procedures performed in connection with the Re-domiciliation of the various reviews of Prospectus supplements, and consent issuances related to the N-1A filings for the Legg Mason Capital Management Special Investment Trust, Inc.
In addition, there were no Audit-Related Fees billed in the Reporting Period for assurance and related services by the Auditor to the Registrant’s investment adviser (not including any sub-adviser whose role is primarily portfolio management and is subcontracted with or overseen by another investment adviser), and any entity controlling, controlled by or under common control with the investment adviser that provides ongoing services to the Legg Mason Capital Management Special Investment Trust, Inc. (“service affiliates”), that were reasonably related to the performance of the annual audit of the service affiliates. Accordingly, there were no such fees that required pre-approval by the Audit Committee for the Reporting Periods.
(c) Tax Fees. The aggregate fees billed in the Reporting Periods for professional services rendered by the Auditor for tax compliance, tax advice and tax planning (“Tax Services”) were $7,000 in 2009 and $3,500 in 2010. These services consisted of (i) review or preparation of U.S. federal, state, local and excise tax returns; (ii) U.S. federal, state and local tax planning, advice and assistance regarding statutory, regulatory or administrative developments, and (iii) tax advice regarding tax qualification matters and/or treatment of various financial instruments held or proposed to be acquired or held.
There were no fees billed for tax services by the Auditors to service affiliates during the Reporting Periods that required pre-approval by the Audit Committee.
d) All Other Fees. There were no other fees billed in the Reporting Periods for products and services provided by the Auditor, other than the services reported in paragraphs (a) through (c) of this Item for the Legg Mason Capital Management Special Investment Trust, Inc.
All Other Fees. There were no other non-audit services rendered by the Auditor to Legg Mason Partners Fund Advisors, LLC (“LMPFA”), and any entity controlling, controlled by or under common control with LMPFA that provided ongoing services to Legg Mason Capital Management Special Investment Trust, Inc. requiring pre-approval by the Audit Committee in the Reporting Period.
(e) Audit Committee’s pre–approval policies and procedures described in paragraph (c) (7) of Rule 2-01 of Regulation S-X.
(1) The Charter for the Audit Committee (the “Committee”) of the Board of each registered investment company (the “Fund”) advised by LMPFA or one of their affiliates (each, an “Adviser”) requires that the Committee shall approve (a) all audit and permissible non-audit services to be provided to the Fund and (b) all permissible non-audit services to be provided by the Fund’s independent auditors to the Adviser and any Covered Service Providers if the engagement relates directly to the operations and financial reporting of the Fund. The Committee may implement policies and procedures by which such services are approved other than by the full Committee.
The Committee shall not approve non-audit services that the Committee believes may impair the independence of the auditors. As of the date of the approval of this Audit Committee Charter, permissible non-audit services include any professional services (including tax services), that are not prohibited services as described below, provided to the Fund by the independent auditors, other than those provided to the Fund in connection with an audit or a review of the financial statements of the Fund. Permissible non-audit services may not include: (i) bookkeeping or other services related to the accounting records or financial statements of the Fund; (ii) financial information systems design and implementation; (iii) appraisal or valuation services, fairness opinions or contribution-in-kind reports; (iv) actuarial services; (v) internal audit outsourcing services; (vi) management functions or human resources; (vii) broker or dealer, investment adviser or investment banking services; (viii) legal services and expert services unrelated to the audit; and (ix) any other service the Public Company Accounting Oversight Board determines, by regulation, is impermissible.
Pre-approval by the Committee of any permissible non-audit services is not required so long as: (i) the aggregate amount of all such permissible non-audit services provided to the Fund, the Adviser and any service providers controlling, controlled by or under common control with the Adviser that provide ongoing services to the Fund (“Covered Service Providers”) constitutes not more than 5% of the total amount of revenues paid to the independent auditors during the fiscal year in which the permissible non-audit services are provided to (a) the Fund, (b) the Adviser and (c) any entity controlling, controlled by or under common control with the Adviser that provides ongoing services to the Fund during the fiscal year in which the services are provided that would have to be approved by the Committee; (ii) the permissible non-audit services were not recognized by the Fund at the time of the engagement to be non-audit services; and (iii) such services are promptly brought to the attention of the Committee and approved by the Committee (or its delegate(s)) prior to the completion of the audit.
(2) For the Legg Mason Capital Management Special Investment Trust, Inc., the percentage of fees that were approved by the audit committee, with respect to: Audit-Related Fees were 100% and 100% for 2009 and 2010; Tax Fees were 100% and 100% for 2009 and 2010; and Other Fees were 100% and 100% for 2009 and 2010.
(f) N/A
(g) Non-audit fees billed by the Auditor for services rendered to Legg Mason Capital Management Special Investment Trust, Inc., LMPFA and any entity controlling, controlled by, or under common control with LMPFA that provides ongoing services to Legg Mason Capital Management Special Investment Trust, Inc. during the reporting period were $0 in 2010.
(h) Yes. Legg Mason Capital Management Special Investment Trust, Inc.’s Audit Committee has considered whether the provision of non-audit services that were rendered to Service Affiliates, which were not pre-approved (not requiring pre-approval), is compatible with maintaining the Accountant’s independence. All services provided by the Auditor to the Legg Mason Capital Management Special Investment Trust, Inc. or to Service Affiliates, which were required to be pre-approved, were pre-approved as required.
| ITEM 5. | AUDIT COMMITTEE OF LISTED REGISTRANTS. |
| | a) | The independent board members are acting as the registrant’s audit committee as specified in Section 3(a)(58)(B) of the Exchange Act .The Audit Committee consists of the following Board members: |
Ruby P. Hearn
Arnold L. Lehman
Robin J.W. Masters
Jill E. McGovern
Arthur S. Mehlman
G. Peter O’Brien
S. Ford Rowan
Robert M. Tarola
| ITEM 6. | SCHEDULE OF INVESTMENTS. |
Included herein under Item 1.
| ITEM 7. | DISCLOSURE OF PROXY VOTING POLICIES AND PROCEDURES FOR CLOSED-END MANAGEMENT INVESTMENT COMPANIES. |
Not applicable.
| ITEM 8. | PORTFOLIO MANAGERS OF CLOSED-END MANAGEMENT INVESTMENT COMPANIES. |
Not applicable.
| ITEM 9. | PURCHASES OF EQUITY SECURITIES BY CLOSED-END MANAGEMENT INVESTMENT COMPANY AND AFFILIATED PURCHASERS. |
Not applicable.
| ITEM 10. | SUBMISSION OF MATTERS TO A VOTE OF SECURITY HOLDERS. |
Not applicable.
| ITEM 11. | CONTROLS AND PROCEDURES. |
| | (a) | The registrant’s principal executive officer and principal financial officer have concluded that the registrant’s disclosure controls and procedures (as defined in Rule 30a- 3(c) under the Investment Company Act of 1940, as amended (the “1940 Act”)) are effective as of a date within 90 days of the filing date of this report that includes the disclosure required by this paragraph, based on their evaluation of the disclosure controls and procedures required by Rule 30a-3(b) under the 1940 Act and 15d-15(b) under the Securities Exchange Act of 1934. |
| | (b) | There were no changes in the registrant’s internal control over financial reporting (as defined in Rule 30a-3(d) under the 1940 Act) that occurred during the registrant’s last fiscal half-year (the registrant’s second fiscal half-year in the case of an annual report) that have materially affected, or are likely to materially affect the registrant’s internal control over financial reporting. |
(a) (1) Code of Ethics attached hereto.
Exhibit 99.CODE ETH
(a) (2) Certifications pursuant to section 302 of the Sarbanes-Oxley Act of 2002 attached hereto.
Exhibit 99.CERT
(b) Certifications pursuant to Section 906 of the Sarbanes-Oxley Act of 2002 attached hereto.
Exhibit 99.906CERT
SIGNATURES
Pursuant to the requirements of the Securities Exchange Act of 1934 and the Investment Company Act of 1940, the Registrant has duly caused this Report to be signed on its behalf by the undersigned, thereunto duly authorized.
Legg Mason Investors Trust Inc.
| | |
| |
| By: | | /S/ R. JAY GERKEN |
| | (R. Jay Gerken) |
| | Principal Executive Officer of Legg Mason Investors Trust Inc. |
| |
| Date: | | December 22, 2010 |
Pursuant to the requirements of the Securities Exchange Act of 1934 and the Investment Company Act of 1940, this report has been signed below by the following persons on behalf of the Registrant and in the capacities and on the dates indicated.
| | |
| |
| By: | | /S/ R. JAY GERKEN |
| | (R. Jay Gerken) |
| | Principal Executive Officer of Legg Mason Investors Trust Inc. |
| |
| Date: | | December 22, 2010 |
| |
| By: | | /S/ KAPREL OZSOLAK |
| | (Kaprel Ozsolak) |
| | Chief Financial Officer of Legg Mason Investors Trust Inc. |
| |
| Date: | | December 22, 2010 |