UNITED STATES
SECURITIES AND EXCHANGE COMMISSION
Washington, D.C. 20549
FORM N-CSR
CERTIFIED SHAREHOLDER REPORT
OF
REGISTERED MANAGEMENT INVESTMENT COMPANIES
Investment Company Act file number: 811-07704
Schwab Capital Trust – Monthly Income Funds
(Exact name of registrant as specified in charter)
211 Main Street, San Francisco, California 94105
(Address of principal executive offices) (Zip code)
Jonathan de St. Paer
Schwab Capital Trust
211 Main Street, San Francisco, California 94105
(Name and address of agent for service)
Registrant’s telephone number, including area code: (415) 636-7000
Date of fiscal year end: December 31
Date of reporting period: December 31, 2021
Item 1: Report(s) to Shareholders.
Annual Report | December 31, 2021
Schwab Monthly Income Funds
Schwab Monthly Income Fund –
Moderate Payout
Schwab Monthly Income Fund –
Enhanced Payout
Schwab Monthly Income Fund –
Maximum Payout
This page is intentionally left blank.
Schwab Monthly Income Funds
Fund investment adviser: Charles Schwab Investment Management, Inc., dba Schwab Asset ManagementTM
Distributor: Charles Schwab & Co., Inc. (Schwab)
Schwab Monthly Income Funds | Annual Report
Schwab Monthly Income Funds
The performance data quoted represents past performance. Past performance does not guarantee future results. Investment returns and principal value will fluctuate so that an investor’s shares may be worth more or less than their original cost. Current performance may be lower or higher than performance data quoted. To obtain performance information current to the most recent month end, please visit www.schwabassetmanagement.com/schwabfunds_prospectus.
| Total Returns for the 12 Months Ended December 31, 2021 |
| Schwab Monthly Income Fund – Moderate Payout (Ticker Symbol: SWJRX) | 9.23% |
| Moderate Payout Composite Index | 9.75% |
| Fund Category: Morningstar Allocation - 30% to 50% Equity1 | 8.24% |
| Performance Details | pages 7-9 |
| |
| Schwab Monthly Income Fund – Enhanced Payout (Ticker Symbol: SWKRX) | 5.73% |
| Enhanced Payout Composite Index | 6.10% |
| Fund Category: Morningstar Allocation - 30% to 50% Equity1 | 8.24% |
| Performance Details | pages 10-12 |
| |
| Schwab Monthly Income Fund – Maximum Payout (Ticker Symbol: SWLRX) | 2.33% |
| Maximum Payout Composite Index | 2.53% |
| Fund Category: Morningstar Allocation - 15% to 30% Equity1 | 5.04% |
| Performance Details | pages 13-15 |
All total returns on this page assume dividends and distributions were reinvested. Index figures do not include trading and management costs, which would lower performance. Indices are unmanaged and cannot be invested in directly. Performance results less than one year are not annualized.
The components that make up each of the composite indices may vary over time. For index definitions, please see the Glossary.
Fund expenses have been absorbed by the investment adviser and its affiliates. Without these reductions, the funds’ returns would have been lower. These returns do not reflect the deduction of taxes that a shareholder would pay on fund distributions or the redemption of fund shares.
| 1 | Source for category information: Morningstar, Inc. The Morningstar Category return represents all active and index mutual funds within the category as of the report date. |
Schwab Monthly Income Funds | Annual Report
Schwab Monthly Income Funds
Jonathan de St. Paer
President of Schwab Asset
Management and the funds
covered in this report.
Dear Shareholder,
At the start of 2021, most hoped and expected that the rapid development of multiple COVID-19 vaccines would soon bring the pandemic under control. Despite early advances against the virus, increasingly virulent waves of COVID-19 variants continued to weigh on U.S. and global health systems throughout the year, constraining efforts to fully reopen the world’s economies to travel and commerce. Nevertheless, during the 12-month period ended December 31, 2021, the U.S. economy exhibited signs of remarkable strength, supported by unprecedented levels of fiscal and monetary stimulus. After declining in 2020, the U.S. gross domestic product (GDP) growth rate increased during 2021. Equities generally performed well in this environment with the S&P 500® Index, a bellwether for the overall U.S. stock market, returning 28.7% for the reporting period and repeatedly reaching new record territory. However, rapid economic growth, increasing inflationary pressures, and warnings from the U.S. Federal Reserve (Fed) of reduced monetary accommodation pressured bond prices, which typically move in the opposite direction of yields.
A wide range of open questions related to inflation and economic growth continue to confront investors at the start of the new year. At Schwab Asset Management, we believe maintaining a diversified, long-term investing plan that reflects your risk tolerance and long-term financial goals is important in the face of short-term uncertainty. The Schwab Monthly Income Funds can help you stick to your investment plan despite economic and market volatility. The funds allocate to a mix of underlying fixed-income and equity funds as they seek to generate income in line with their target payout ranges.1 All three solutions offer investors access to an appropriate mix of risk, return, and income in the convenience of a single fund.
Thank you for investing with Schwab Asset Management, and for trusting us to help you achieve your financial goals. For more information about the Schwab Monthly Income Funds, please continue reading this report. In addition, you can find further details about these funds by visiting our website at www.schwabassetmanagement.com. We are also happy to hear from you at 1-877-824-5615.
Sincerely,
“ The Schwab Monthly Income Funds can help you stick to your investment plan despite economic and market volatility.”
Past performance cannot guarantee future results.
Diversification and asset allocation strategies do not ensure a profit and cannot protect against losses in a declining market.
Management views may have changed since the report date.
Schwab Asset Management is the dba name for Charles Schwab Investment Management, Inc., the investment adviser for Schwab Funds and Schwab ETFs.
| 1 | While the Schwab Monthly Income Fund – Maximum Payout is typically expected to have the highest annual payout of the three funds, certain factors, including the interest rate environment, the allocation of fund assets across different asset classes and investments, and the performance of the financial markets in which the funds invest, may result in a different outcome. |
Schwab Monthly Income Funds | Annual Report
Schwab Monthly Income Funds
The Investment Environment
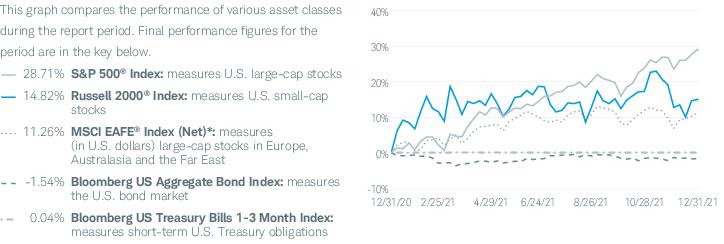
For the 12-month reporting period ended December 31, 2021, global equities generated mostly positive returns, particularly in the United States, where several key equity market indices ended the reporting period just off record highs. Developed international equity markets were less robust but still positive, while emerging markets and most U.S. fixed-income markets lost ground. Despite persisting COVID-19 pandemic-driven stresses on the global economy and the emergence and rapid spread of the Delta variant during the summer and the Omicron variant in the late fall, equity markets rose through most of the period on strong earnings, ongoing fiscal stimulus measures, and optimism related to increased COVID-19 vaccination rates. Amid growing evidence of a slowing global economy and rising inflation, stocks did weaken somewhat in September and again in late November and early December but quickly regained their momentum. U.S. and developed international equity markets maintained their strength, emerging markets declined, demand for bonds waned, and bond yields rose as prices sank. (Bond yields and bond prices typically move in opposite directions.) Over the reporting period, the U.S. dollar strengthened against a basket of international currencies, generally decreasing the returns on overseas investments in U.S. dollar terms. For the reporting period, the S&P 500® Index, a bellwether for the overall U.S. stock market, returned 28.71%. Outside the United States, the MSCI EAFE® Index (Net)*, a broad measure of developed international equity performance, returned 11.26%. Emerging market equities were weaker, with the MSCI Emerging Markets Index (Net)* returning -2.54%. Fixed-income markets were also weaker, with the Bloomberg US Aggregate Bond Index returning -1.54% and the FTSE non-US Dollar World Government Bond Index returning -9.68%.
Bolstered by the extensive emergency rescue and fiscal stimulus measures passed by the U.S. Congress and U.S. Federal Reserve (Fed) in March 2020, the U.S. economy began to recover from the dramatic impact of the COVID-19 pandemic beginning in the third quarter of 2020. U.S. gross domestic product (GDP) rose at an annualized rate of 6.4% for the first quarter of 2021 and 6.7% for the second quarter of 2021, before falling back to 2.0% for the third quarter of 2021 amid fading government stimuli, persistent inflation, and new surges in COVID-19 cases. Unemployment, which skyrocketed in April 2020, fell over the reporting period, and ended at its lowest level since February 2020. Inflation, which had remained well below the Fed’s traditional 2% target until it jumped in March 2021,
Asset Class Performance Comparison % returns during the 12 months ended December 31, 2021
Index figures assume dividends and distributions were reinvested. Index figures do not include trading and management costs, which would lower performance. Indices are unmanaged and cannot be invested in directly. Performance results less than one year are not annualized. Past performance is not an indication of future results.
For index definitions, please see the Glossary.
Data source: Index provider websites and Schwab Asset Management.
Nothing in this report represents a recommendation of a security by the investment adviser.
Management views may have changed since the report date.
| * | The net version of the index reflects reinvested dividends net of withholding taxes, but reflects no deductions for expenses or other taxes. |
Schwab Monthly Income Funds | Annual Report
Schwab Monthly Income Funds
The Investment Environment (continued)
continued to rise over the reporting period, largely due to imbalances in the labor market, supply chain bottlenecks, and higher energy costs.
Outside the United States, global economies also displayed resilience but were somewhat more constrained amid continuing struggles against COVID-19 and the emergence and spread of the Delta and Omicron variants. Oil prices rebounded over much of the reporting period, except for dips in July and August and November, on growing demand and reduced production. In the eurozone, GDP growth turned positive for the second and third quarters of 2021, following two previous quarters of contraction. In the United Kingdom, which was particularly hard-hit by the COVID-19 pandemic, GDP growth was negative for the first quarter of 2021, turned strongly positive for the second quarter of 2021, then fell back to just slightly positive for the third quarter of 2021. Japan’s economy vacillated between contraction in the first and third quarters of 2021 and a small gain in the second quarter of 2021 on a resurgence of COVID-19 cases and persistent supply chain disruptions. Among emerging markets, China’s GDP growth rate accelerated sharply for the first quarter of 2021 before easing for the subsequent two quarters, albeit remaining positive, in part because of the political landscape and an emphasis on domestic consumption over globalization. India, after plunging into one of the worst recessions of any major economy in 2020, posted a sharp jump in GDP growth for the second quarter of 2021 before falling back for the third quarter of 2021.
For the most part, central banks around the world, maintained the low—and for some international central banks, negative—interest rates instituted prior to, and in response to, the COVID-19 pandemic. In the United States, the Fed reiterated several times during the reporting period its intention to continue its support of the economy for as long as needed to achieve a full recovery. The Fed maintained the federal funds rate in a range of 0.00% to 0.25% throughout the reporting period. However, as inflation continued to rise and indicators of economic activity and employment continued to strengthen, the Fed began scaling back its bond-buying program in November 2021 citing significant progress made on its twin goals of maximum employment and price stability. The Fed subsequently accelerated its wind-down in December 2021 with expectations to end it altogether by March 2022. Fed officials also signaled that interest rates could begin to rise sooner in 2022 than previously anticipated, although the Fed cautioned that the path of the economy continues to depend on the course of the COVID-19 pandemic. In developed international markets, most central banks were similarly accommodative while acknowledging economic improvements and, in some cases, changes in monetary policy. The European Central Bank held its interest rate at 0.00%, unchanged since March 2016. However, in December 2021, it announced that in the first quarter of 2022 it would reduce the pace of its asset purchase program that it had instituted to help counter the serious risks posed by the COVID-19 pandemic. The Bank of Japan upheld its short-term interest rate target of -0.1%, also unchanged since 2016, and also announced its plans to taper its corporate debt buying to pre-pandemic levels. In December 2021, the Bank of England raised its key official bank rate from 0.1% to 0.25%, its first rate hike since the onset of the COVID-19 pandemic, citing inflation pressures. Emerging markets were mixed. China cut its interest rate by 0.05% in December. Indonesia and India maintained low policy rates implemented in 2020 and early 2021. Central banks in Mexico, Brazil, Russia, and Pakistan raised their rates, citing a stronger-than-expected recovery or to counteract the impacts of inflation.
After languishing at historically low levels since the onset of the COVID-19 pandemic, U.S. bond yields climbed steadily through the first quarter of the reporting period as COVID-19 vaccine distribution ramped up rapidly and investors anticipated an accelerating economic recovery. From April through July, yields drifted lower on tepid employment reports and growing inflation concerns before gradually, albeit non-linearly, rising again by the end of the reporting period. The yield on the 10-year U.S. Treasury began the reporting period at 0.93%, hit a reporting-period high of 1.74% in March, and fell back to end the reporting period at 1.52%. Short-term rates, which remained near historic lows, fell further, with the yield on the three-month U.S. Treasury dropping to 0.06% from 0.09% over the reporting period. Outside the U.S., bond yields generally remained low.
Schwab Monthly Income Funds | Annual Report
Schwab Monthly Income Funds
 | Zifan Tang, Ph.D., CFA, Senior Portfolio Manager, is responsible for the co-management of the funds. Prior to joining Schwab in 2012, Ms. Tang was a product manager at Thomson Reuters and from 1997 to 2009 worked as a portfolio manager at Barclays Global Investors (now known as BlackRock). |
 | Patrick Kwok, CFA, Portfolio Manager, is responsible for the co-management of the funds. Previously, Mr. Kwok served as an associate portfolio manager from 2012 to 2016. Prior to that, he worked as a fund administration manager, where he was responsible for oversight of sub-advisers, trading, cash management, and fund administration supporting the Charles Schwab Trust Bank Collective Investment Trusts and multi-asset Schwab Funds. Prior to joining Schwab Asset Management in 2008, Mr. Kwok spent two years as an asset operations specialist at Charles Schwab Trust Company. He also worked for one year at State Street Bank & Trust as a portfolio accountant and pricing specialist. |
Schwab Monthly Income Funds | Annual Report
Schwab Monthly Income Fund – Moderate Payout as of December 31, 2021
The Schwab Monthly Income Funds (the funds) seek to provide current income and, as a secondary investment objective, capital appreciation. The funds have a fund-of-funds structure that involves holding equity, fixed-income, and money market funds selected from within the Schwab Funds and Laudus Funds complex, but also may invest directly in equity and fixed-income securities, cash and cash equivalents (including money market securities), exchange-traded funds (ETFs) and nonproprietary mutual funds to accomplish these objectives. Holdings are based on each fund’s asset allocation, with returns reflecting the combined performance and respective weightings of the underlying investments.
The Schwab Monthly Income Fund – Moderate Payout (the fund) is designed to offer investors a targeted annual payout of 3% to 4%1 and an increase in capital over the long term. However, the fund’s actual annual payout could be higher or lower than the targeted annual payout based on the interest rate environment and other market factors occurring during that year. During a low interest rate environment, the fund’s anticipated annual payout is generally expected to be 1% to 3% and, during a high interest rate environment, is expected to be 3% to 6%. The fund uses the internally calculated, custom-blended Moderate Payout Composite Index (the composite index) as a performance gauge.
Market Highlights. For the 12-month reporting period ended December 31, 2021, global equities generated mostly positive returns, particularly in the United States, where several key equity market indices ended the reporting period just off record highs. Developed international equity markets were less robust but still positive, while emerging markets and most U.S. fixed-income markets lost ground. Despite persisting COVID-19 pandemic-driven stresses on the global economy and the emergence and rapid spread of the Delta variant during the summer and the Omicron variant in the late fall, equity markets rose through most of the period on strong earnings, ongoing fiscal stimulus measures, and optimism related to increased COVID-19 vaccination rates. Amid growing evidence of a slowing global economy and rising inflation, stocks did weaken somewhat in September and again in late November and early December but quickly regained their momentum. U.S. and developed international equity markets maintained their strength, emerging markets declined, demand for bonds waned, and bond yields rose as prices sank. (Bond yields and bond prices typically move in opposite directions.) Over the reporting period, the U.S. dollar strengthened against a basket of international currencies, generally decreasing the returns on overseas investments in U.S. dollar terms.
Performance. The fund’s distribution yield (payout) was 3.05% for the year ended December 31, 2021, generally in line with the investment adviser’s expectations in a low interest rate environment. For the 12-month reporting period, the fund’s total return was 9.23%, with the composite index returning 9.75%.
Positioning and Strategies. Although the fund’s allocations to equities and fixed income vary within certain established parameters, they were broadly aligned with those of the composite index.
The fund’s U.S. large-cap equity exposure was the largest contributor to the total return of the fund. The Schwab Dividend Equity Fund returned approximately 28% for the reporting period, generally in line with the S&P 500® Index, the composite’s underlying U.S. large-cap equity component, which returned approximately 29% for the reporting period.
The fund’s real estate exposure contributed to the fund’s total return and relative performance over the reporting period. The Schwab Global Real Estate Fund returned approximately 25% for the reporting period, outperforming the FTSE EPRA Nareit Global Index (Net), which returned approximately 22% for the reporting period.
The fund’s international equity exposure contributed to the total return of the fund but detracted from relative performance. The Laudus International MarketMasters Fund was the largest detractor from relative performance of the fund. The Laudus International MarketMasters Fund returned approximately 6% for the reporting period, underperforming the MSCI EAFE® Index (Net), which returned approximately 11% for the reporting period.
The fund’s fixed-income exposure detracted from the fund’s total return and relative performance over the reporting period. The Schwab U.S. Aggregate Bond Index Fund returned approximately -2% for the reporting period, generally tracking its benchmark, the Bloomberg US Aggregate Bond Index.
Management views and portfolio holdings may have changed since the report date.
| 1 | For more information about payouts, please see the fund’s prospectus. |
Schwab Monthly Income Funds | Annual Report
Schwab Monthly Income Fund – Moderate Payout
Performance and Fund Facts as of December 31, 2021
The performance data quoted represents past performance. Past performance does not guarantee future results. Investment returns and principal value will fluctuate so that an investor’s shares may be worth more or less than their original cost. Current performance may be lower or higher than performance data quoted. To obtain performance information current to the most recent month end, please visit www.schwabassetmanagement.com/schwabfunds_prospectus.
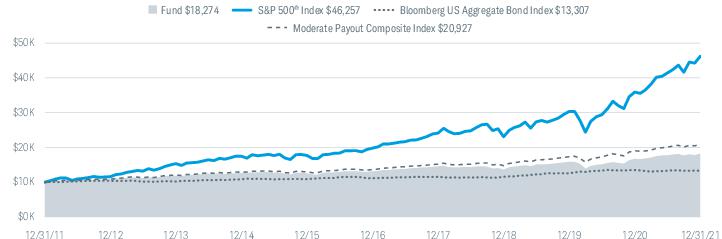
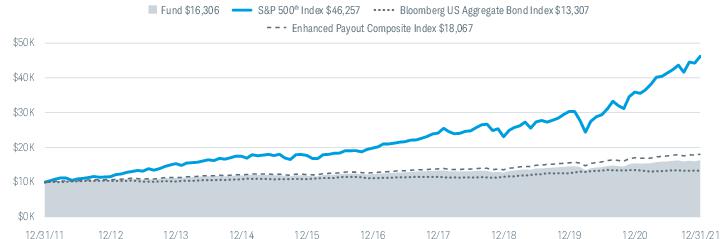
Performance of Hypothetical $10,000 Investment (December 31, 2011 – December 31, 2021)1
Average Annual Total Returns1
| Fund and Inception Date | 1 Year | 5 Years | 10 Years |
| Fund: Schwab Monthly Income Fund – Moderate Payout (3/28/08) | 9.23% | 6.81% | 6.21% |
| S&P 500® Index | 28.71% | 18.47% | 16.55% |
| Bloomberg US Aggregate Bond Index | -1.54% | 3.57% | 2.90% |
| Moderate Payout Composite Index | 9.75% | 8.91% | 7.66% |
| Fund Category: Morningstar Allocation – 30% to 50% Equity2 | 8.24% | 7.41% | 6.66% |
| Fund Expense Ratios3: Net 0.51%; Gross 0.72% |
All total returns on this page assume dividends and distributions were reinvested. Index figures do not include trading and management costs, which would lower performance. Indices are unmanaged and cannot be invested in directly. Performance results less than one year are not annualized.
For index definitions, please see the Glossary.
| 1 | The fund’s routine expenses have been absorbed by the investment adviser and its affiliates. Without these reductions, the fund’s returns would have been lower. These returns do not reflect the deduction of taxes that a shareholder would pay on fund distributions or the redemption of fund shares. |
| 2 | Source for category information: Morningstar, Inc. The Morningstar Category return represents all active and index mutual funds within the category as of the report date. |
| 3 | As stated in the prospectus. Includes 0.51% of acquired fund fees and expenses (AFFE), which are indirect expenses incurred by the fund through its investments in the underlying funds. Net Expense: Expenses reduced by a contractual fee waiver in effect for so long as Schwab Asset Management serves as adviser to the fund. Gross Expense: Does not reflect the effect of contractual fee waivers. For actual expense ratios during the period, not including AFFE, refer to the financial highlights section of the financial statements. |
Schwab Monthly Income Funds | Annual Report
Schwab Monthly Income Fund – Moderate Payout
Performance and Fund Facts as of December 31, 2021 (continued)
| Number of Holdings | 6 |
| Portfolio Turnover Rate | 11% |
| 12-Month Distribution Yield | 3.05% 1 |
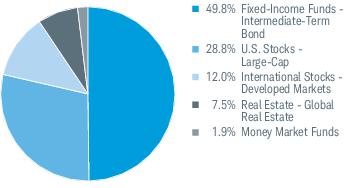
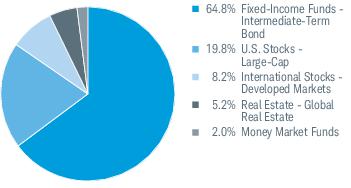
Asset Class Weightings % of Investments2,3
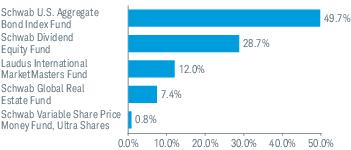
Top Holdings % of Net Assets2,4,5
Portfolio holdings may have changed since the report date.
| 1 | Calculation reflects the fund’s monthly ordinary income distributions for the last 12 months divided by the fund’s Net Asset Value as of the end of the reporting period. Distribution yield does not include capital gains distributions. Fund expenses may have been partially absorbed by the investment adviser and its affiliates. Without these reductions, the total return/yield may have been lower. |
| 2 | The fund intends to primarily invest in a combination of Schwab Funds, Laudus Funds, and Schwab ETFs. The fund may also invest directly in equity and fixed-income securities, as well as other unaffiliated mutual funds or ETFs, and cash and cash equivalents (including money market securities). |
| 3 | The percentage may differ from the Portfolio Holdings because the above calculation is based on a percentage of total investments, whereas the calculation in the Portfolio Holdings is based on a percentage of net assets. |
| 4 | This list is not a recommendation of any security by the investment adviser. |
| 5 | The holdings listed exclude any temporary liquidity investments. |
Schwab Monthly Income Funds | Annual Report
Schwab Monthly Income Fund – Enhanced Payout as of December 31, 2021
The Schwab Monthly Income Funds (the funds) seek to provide current income and, as a secondary investment objective, capital appreciation. The funds have a fund-of-funds structure that involves holding equity, fixed-income, and money market funds selected from within the Schwab Funds and Laudus Funds complex, but also may invest directly in equity and fixed-income securities, cash and cash equivalents (including money market securities), exchange-traded funds (ETFs) and nonproprietary mutual funds to accomplish these objectives. Holdings are based on each fund’s asset allocation, with returns reflecting the combined performance and respective weightings of the underlying investments.
The Schwab Monthly Income Fund – Enhanced Payout (the fund) is designed to offer investors a targeted annual payout of 4% to 5%1 and an increase in capital over the long term. However, the fund’s actual annual payout could be higher or lower than the targeted annual payout based on the interest rate environment and other market factors occurring during that year. During a low interest rate environment, the fund’s anticipated annual payout is generally expected to be 1% to 4% and, during a high interest rate environment, is expected to be 4% to 7%. The fund uses the internally calculated Enhanced Payout Composite Index (the composite index) as a performance gauge.
Market Highlights. For the 12-month reporting period ended December 31, 2021, global equities generated mostly positive returns, particularly in the United States, where several key equity market indices ended the reporting period just off record highs. Developed international equity markets were less robust but still positive, while emerging markets and most U.S. fixed-income markets lost ground. Despite persisting COVID-19 pandemic-driven stresses on the global economy and the emergence and rapid spread of the Delta variant during the summer and the Omicron variant in the late fall, equity markets rose through most of the period on strong earnings, ongoing fiscal stimulus measures, and optimism related to increased COVID-19 vaccination rates. Amid growing evidence of a slowing global economy and rising inflation, stocks did weaken somewhat in September and again in late November and early December but quickly regained their momentum. U.S. and developed international equity markets maintained their strength, emerging markets declined, demand for bonds waned, and bond yields rose as prices sank. (Bond yields and bond prices typically move in opposite directions.) Over the reporting period, the U.S. dollar strengthened against a basket of international currencies, generally decreasing the returns on overseas investments in U.S. dollar terms.
Performance. The fund’s distribution yield (payout) was 2.80% for the year ended December 31, 2021, generally in line with the investment adviser’s expectations in a low interest rate environment. For the 12-month reporting period, the fund’s total return was 5.73%, with the composite index returning 6.10%.
Positioning and Strategies. Although the fund’s allocations to equities and fixed income vary within certain established parameters, they were broadly aligned with those of the composite index.
The fund’s U.S. large-cap equity exposure was the largest contributor to the total return of the fund. The Schwab Dividend Equity Fund returned approximately 28% for the reporting period, generally in line with the S&P 500® Index, the composite’s underlying U.S. large-cap equity component, which returned approximately 29% for the reporting period.
The fund’s real estate exposure contributed to the fund’s total return and relative performance over the reporting period. The Schwab Global Real Estate Fund returned approximately 25% for the reporting period, outperforming the FTSE EPRA Nareit Global Index (Net), which returned approximately 22% for the reporting period.
The fund’s international equity exposure contributed to the total return of the fund but detracted from relative performance. The Laudus International MarketMasters Fund was the largest detractor from relative performance of the fund. The Laudus International MarketMasters Fund returned approximately 6% for the reporting period, underperforming the MSCI EAFE® Index (Net), which returned approximately 11% for the reporting period.
The fund’s fixed-income exposure detracted from the fund’s total return and relative performance over the reporting period. The Schwab U.S. Aggregate Bond Index Fund returned approximately -2% for the reporting period, generally tracking its benchmark, the Bloomberg US Aggregate Bond Index.
Management views and portfolio holdings may have changed since the report date.
| 1 | For more information about payouts, please see the fund’s prospectus. |
Schwab Monthly Income Funds | Annual Report
Schwab Monthly Income Fund – Enhanced Payout
Performance and Fund Facts as of December 31, 2021
The performance data quoted represents past performance. Past performance does not guarantee future results. Investment returns and principal value will fluctuate so that an investor’s shares may be worth more or less than their original cost. Current performance may be lower or higher than performance data quoted. To obtain performance information current to the most recent month end, please visit www.schwabassetmanagement.com/schwabfunds_prospectus.
Performance of Hypothetical $10,000 Investment (December 31, 2011 – December 31, 2021)1
Average Annual Total Returns1
| Fund and Inception Date | 1 Year | 5 Years | 10 Years |
| Fund: Schwab Monthly Income Fund – Enhanced Payout (3/28/08) | 5.73% | 5.76% | 5.01% |
| S&P 500® Index | 28.71% | 18.47% | 16.55% |
| Bloomberg US Aggregate Bond Index | -1.54% | 3.57% | 2.90% |
| Enhanced Payout Composite Index | 6.10% | 7.23% | 6.09% |
| Fund Category: Morningstar Allocation – 30% to 50% Equity2 | 8.24% | 7.41% | 6.66% |
| Fund Expense Ratios3: Net 0.36%; Gross 0.48% |
All total returns on this page assume dividends and distributions were reinvested. Index figures do not include trading and management costs, which would lower performance. Indices are unmanaged and cannot be invested in directly. Performance results less than one year are not annualized.
For index definitions, please see the Glossary.
| 1 | The fund’s routine expenses have been absorbed by the investment adviser and its affiliates. Without these reductions, the fund’s returns would have been lower. These returns do not reflect the deduction of taxes that a shareholder would pay on fund distributions or the redemption of fund shares. |
| 2 | Source for category information: Morningstar, Inc. The Morningstar Category return represents all active and index mutual funds within the category as of the report date. |
| 3 | As stated in the prospectus. Includes 0.36% of acquired fund fees and expenses (AFFE), which are indirect expenses incurred by the fund through its investments in the underlying funds. Net Expense: Expenses reduced by a contractual fee waiver for so long as Schwab Asset Management serves as the adviser to the fund. Gross Expense: Does not reflect the effect of contractual fee waivers. For actual expense ratios during the period, not including AFFE, refer to the financial highlights section in the financial statements. |
Schwab Monthly Income Funds | Annual Report
Schwab Monthly Income Fund – Enhanced Payout
Performance and Fund Facts as of December 31, 2021 (continued)
| Number of Holdings | 6 |
| Portfolio Turnover Rate | 20% |
| 12-Month Distribution Yield | 2.80% 1 |
Asset Class Weightings % of Investments2,3
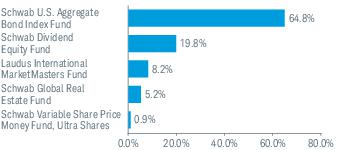
Top Holdings % of Net Assets2,4,5
Portfolio holdings may have changed since the report date.
| 1 | Calculation reflects the fund’s monthly ordinary income distributions for the last 12 months divided by the fund’s Net Asset Value as of the end of the reporting period. Distribution yield does not include capital gains distributions. Fund expenses may have been partially absorbed by the investment adviser and its affiliates. Without these reductions, the total return/yield may have been lower. |
| 2 | The fund intends to primarily invest in a combination of Schwab Funds, Laudus Funds, and Schwab ETFs. The fund may also invest directly in equity and fixed-income securities, as well as other unaffiliated mutual funds or ETFs, and cash and cash equivalents (including money market securities). |
| 3 | The percentage may differ from the Portfolio Holdings because the above calculation is based on a percentage of total investments, whereas the calculation in the Portfolio Holdings is based on a percentage of net assets. |
| 4 | This list is not a recommendation of any security by the investment adviser. |
| 5 | The holdings listed exclude any temporary liquidity investments. |
Schwab Monthly Income Funds | Annual Report
Schwab Monthly Income Fund – Maximum Payout as of December 31, 2021
The Schwab Monthly Income Funds (the funds) seek to provide current income and, as a secondary investment objective, capital appreciation. The funds have a fund-of-funds structure that involves holding equity, fixed-income, and money market funds selected from within the Schwab Funds and Laudus Funds complex, but also may invest directly in equity and fixed-income securities, cash and cash equivalents (including money market securities), exchange-traded funds (ETFs) and nonproprietary mutual funds to accomplish these objectives. Holdings are based on each fund’s asset allocation, with returns reflecting the combined performance and respective weightings of the underlying investments.
The Schwab Monthly Income Fund – Maximum Payout (the fund) is designed to offer investors a targeted annual payout of 5% to 6%1 and an increase in capital over the long term. However, the fund’s actual annual payout could be higher or lower than the targeted annual payout based on the interest rate environment and other market factors occurring during that year. During a low interest rate environment, the fund’s anticipated annual payout is generally expected to be 1% to 5% and, during a high interest rate environment, is expected to be 5% to 8%. The fund uses the internally calculated Maximum Payout Composite Index (the composite index) as a performance gauge.
Market Highlights. For the 12-month reporting period ended December 31, 2021, global equities generated mostly positive returns, particularly in the United States, where several key equity market indices ended the reporting period just off record highs. Developed international equity markets were less robust but still positive, while emerging markets and most U.S. fixed-income markets lost ground. Despite persisting COVID-19 pandemic-driven stresses on the global economy and the emergence and rapid spread of the Delta variant during the summer and the Omicron variant in the late fall, equity markets rose through most of the period on strong earnings, ongoing fiscal stimulus measures, and optimism related to increased COVID-19 vaccination rates. Amid growing evidence of a slowing global economy and rising inflation, stocks did weaken somewhat in September and again in late November and early December but quickly regained their momentum. U.S. and developed international equity markets maintained their strength, emerging markets declined, demand for bonds waned, and bond yields rose as prices sank. (Bond yields and bond prices typically move in opposite directions.) Over the reporting period, the U.S. dollar strengthened against a basket of international currencies, generally decreasing the returns on overseas investments in U.S. dollar terms.
Performance. The fund’s distribution yield (payout) was 2.45% for the year ended December 31, 2021, generally in line with the investment adviser’s expectations in a low interest rate environment. For the 12-month reporting period, the fund’s total return was 2.33%, with the composite index returning 2.53%.
Positioning and Strategies. Although the fund’s allocations to equities and fixed income vary within certain established parameters, they were broadly aligned with those of the composite index.
The fund’s U.S. large-cap equity exposure was the largest contributor to the total return of the fund. The Schwab Dividend Equity Fund returned approximately 28% for the reporting period, generally in line with the S&P 500® Index, the composite’s underlying U.S. large-cap equity component, which returned approximately 29% for the reporting period.
The fund’s real estate exposure contributed to the fund’s total return and relative performance over the reporting period. The Schwab Global Real Estate Fund returned approximately 25% for the reporting period, outperforming the FTSE EPRA Nareit Global Index (Net), which returned approximately 22% for the reporting period.
The fund’s international equity exposure contributed to the total return of the fund but detracted from relative performance. The Laudus International MarketMasters Fund was the largest detractor from relative performance of the fund. The Laudus International MarketMasters Fund returned approximately 6% for the reporting period, underperforming the MSCI EAFE® Index (Net), which returned approximately 11% for the reporting period.
The fund’s fixed-income exposure detracted from the fund’s total return and relative performance over the reporting period. The Schwab U.S. Aggregate Bond Index Fund returned approximately -2% for the reporting period, generally tracking its benchmark, the Bloomberg US Aggregate Bond Index.
Management views and portfolio holdings may have changed since the report date.
| 1 | For more information about payouts, please see the fund’s prospectus. |
Schwab Monthly Income Funds | Annual Report
Schwab Monthly Income Fund – Maximum Payout
Performance and Fund Facts as of December 31, 2021
The performance data quoted represents past performance. Past performance does not guarantee future results. Investment returns and principal value will fluctuate so that an investor’s shares may be worth more or less than their original cost. Current performance may be lower or higher than performance data quoted. To obtain performance information current to the most recent month end, please visit www.schwabassetmanagement.com/schwabfunds_prospectus.
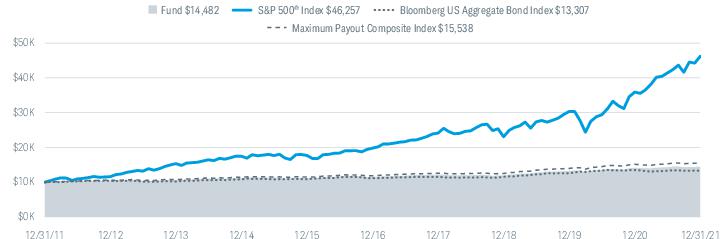
Performance of Hypothetical $10,000 Investment (December 31, 2011 – December 31, 2021)1
Average Annual Total Returns1
| Fund and Inception Date | 1 Year | 5 Years | 10 Years |
| Fund: Schwab Monthly Income Fund – Maximum Payout (3/28/08) | 2.33% | 4.66% | 3.77% |
| S&P 500® Index | 28.71% | 18.47% | 16.55% |
| Bloomberg US Aggregate Bond Index | -1.54% | 3.57% | 2.90% |
| Maximum Payout Composite Index | 2.53% | 5.51% | 4.51% |
| Fund Category: Morningstar Allocation – 15% to 30% Equity2 | 5.04% | 5.30% | 4.99% |
| Fund Expense Ratios3: Net 0.22%; Gross 0.36% |
All total returns on this page assume dividends and distributions were reinvested. Index figures do not include trading and management costs, which would lower performance. Indices are unmanaged and cannot be invested in directly. Performance results less than one year are not annualized.
For index definitions, please see the Glossary.
| 1 | The fund’s routine expenses have been absorbed by the investment adviser and its affiliates. Without these reductions, the fund’s returns would have been lower. These returns do not reflect the deduction of taxes that a shareholder would pay on fund distributions or the redemption of fund shares. |
| 2 | Source for category information: Morningstar, Inc. The Morningstar Category return represents all active and index mutual funds within the category as of the report date. |
| 3 | As stated in the prospectus. Includes 0.22% of acquired fund fees and expenses (AFFE), which are indirect expenses incurred by the fund through its investments in the underlying funds. Net Expense: Expenses reduced by a contractual fee waiver for so long as Schwab Asset Management serves as the adviser to the fund. Gross Expense: Does not reflect the effect of contractual fee waivers. For actual expense ratios during the period, not including AFFE, refer to the financial highlights section in the financial statements. |
Schwab Monthly Income Funds | Annual Report
Schwab Monthly Income Fund – Maximum Payout
Performance and Fund Facts as of December 31, 2021 (continued)
| Number of Holdings | 6 |
| Portfolio Turnover Rate | 25% |
| 12-Month Distribution Yield | 2.45% 1 |
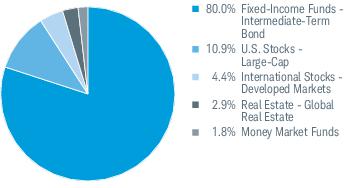
Asset Class Weightings % of Investments2,3
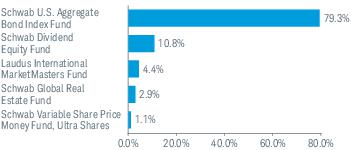
Top Holdings % of Net Assets2,4,5
Portfolio holdings may have changed since the report date.
| 1 | Calculation reflects the fund’s monthly ordinary income distributions for the last 12 months divided by the fund’s Net Asset Value as of the end of the reporting period. Distribution yield does not include capital gains distributions. Fund expenses may have been partially absorbed by the investment adviser and its affiliates. Without these reductions, the total return/yield may have been lower. |
| 2 | The fund intends to primarily invest in a combination of Schwab Funds, Laudus Funds, and Schwab ETFs. The fund may also invest directly in equity and fixed-income securities, as well as other unaffiliated mutual funds or ETFs, and cash and cash equivalents (including money market securities). |
| 3 | The percentage may differ from the Portfolio Holdings because the above calculation is based on a percentage of total investments, whereas the calculation in the Portfolio Holdings is based on a percentage of net assets. |
| 4 | This list is not a recommendation of any security by the investment adviser. |
| 5 | The holdings listed exclude any temporary liquidity investments. |
Schwab Monthly Income Funds | Annual Report
Schwab Monthly Income Funds
Fund Expenses (Unaudited)
Examples for a $1,000 Investment
As a fund shareholder, you may incur two types of costs: (1) transaction costs; and (2) ongoing costs, including transfer agent fees and other fund expenses.
The expense examples below are intended to help you understand your ongoing cost (in dollars) of investing in a fund and to compare this cost with the ongoing cost of investing in other mutual funds. These examples are based on an investment of $1,000 invested for six months beginning July 1, 2021 and held through December 31, 2021.
Actual Return lines in the table below provide information about actual account values and actual expenses. You may use this information, together with the amount you invested, to estimate the expenses that you paid over the period. To do so, simply divide your account value by $1,000 (for example, an $8,600 account value ÷ $1,000 = 8.6), then multiply the result by the number given for your fund under the heading entitled “Expenses Paid During Period.”
Hypothetical Return lines in the table below provide information about hypothetical account values and hypothetical expenses based on a fund’s actual expense ratio and an assumed return of 5% per year before expenses. Because the return used is not an actual return, it may not be used to estimate the actual ending account value or expenses you paid for the period.
You may use this information to compare the ongoing costs of investing in a fund and other funds. To do so, compare this 5% hypothetical example with the 5% hypothetical examples that appear in the shareholder reports of the other funds.
Please note that the expenses shown in the table are meant to highlight your ongoing costs only, and do not reflect any transactional costs. Therefore, the hypothetical return lines of the table are useful in comparing ongoing costs only, and will not help you determine the relative total costs of owning different funds. In addition, if these transactional costs were included, your costs would have been higher.
| | EXPENSE RATIO
(ANNUALIZED)1,2 | EFFECTIVE
EXPENSE RATIO
(ANNUALIZED)3,4 | BEGINNING
ACCOUNT VALUE
AT 7/1/21 | ENDING
ACCOUNT VALUE
(NET OF EXPENSES)
AT 12/31/212 | EXPENSES PAID
DURING PERIOD
7/1/21-12/31/212,5 | EFFECTIVE
EXPENSES PAID
DURING PERIOD
7/1/21-12/31/214,5 |
| Schwab Monthly Income Fund – Moderate Payout | | | | | | |
| Actual Return | 0.00% | 0.51% | $1,000.00 | $1,030.40 | $0.00 | $2.61 |
| Hypothetical 5% Return | 0.00% | 0.51% | $1,000.00 | $1,025.21 | $0.00 | $2.60 |
| Schwab Monthly Income Fund – Enhanced Payout | | | | | | |
| Actual Return | 0.00% | 0.36% | $1,000.00 | $1,020.90 | $0.00 | $1.83 |
| Hypothetical 5% Return | 0.00% | 0.36% | $1,000.00 | $1,025.21 | $0.00 | $1.84 |
| Schwab Monthly Income Fund – Maximum Payout | | | | | | |
| Actual Return | 0.00% | 0.22% | $1,000.00 | $1,011.70 | $0.00 | $1.12 |
| Hypothetical 5% Return | 0.00% | 0.22% | $1,000.00 | $1,025.21 | $0.00 | $1.12 |
| 1 | Based on the most recent six-month expense ratio. |
| 2 | Excludes acquired fund fees and expenses, which are indirect expenses incurred by the fund through its investments in underlying funds. |
| 3 | Based on the most recent six-month acquired fund fees and expenses and the expense ratio; may differ from the acquired fund fees and expenses and the expense ratio in the prospectus. |
| 4 | Includes acquired fund fees and expenses, which are indirect expenses incurred by the fund through its investments in underlying funds. |
| 5 | Expenses for each fund are equal to its annualized expense ratio, multiplied by the average account value over the period, multiplied by the 184 days of the period, and divided by the 365 days of the fiscal year. |
Schwab Monthly Income Funds | Annual Report
Schwab Monthly Income Fund – Moderate Payout
Financial Statements
FINANCIAL HIGHLIGHTS
| | 1/1/21–
12/31/21 | 1/1/20–
12/31/20 | 1/1/19–
12/31/19 | 1/1/18–
12/31/18 | 1/1/17–
12/31/17 | |
| Per-Share Data |
| Net asset value at beginning of period | $11.38 | $11.09 | $10.05 | $11.09 | $10.31 | |
| Income (loss) from investment operations: | | | | | | |
| Net investment income (loss)1 | 0.24 | 0.21 | 0.29 | 0.23 | 0.23 | |
| Net realized and unrealized gains (losses) | 0.81 | 0.36 | 1.34 | (0.92) | 0.87 | |
| Total from investment operations | 1.05 | 0.57 | 1.63 | (0.69) | 1.10 | |
| Less distributions: | | | | | | |
| Distributions from net investment income | (0.37) | (0.21) | (0.29) | (0.24) | (0.32) | |
| Distributions from net realized gains | (0.07) | (0.07) | (0.30) | (0.11) | — | |
| Total distributions | (0.44) | (0.28) | (0.59) | (0.35) | (0.32) | |
| Net asset value at end of period | $11.99 | $11.38 | $11.09 | $10.05 | $11.09 | |
| Total return | 9.23% | 5.32% | 16.41% | (6.31%) | 10.80% | |
| Ratios/Supplemental Data |
| Ratios to average net assets: | | | | | | |
| Net operating expenses2 | 0.00% | 0.00% | 0.00% | 0.00% | 0.00% | |
| Gross operating expenses2 | 0.18% | 0.21% | 0.24% | 0.19% | 0.20% | |
| Net investment income (loss) | 1.99% | 1.93% | 2.68% | 2.17% | 2.11% | |
| Portfolio turnover rate | 11% | 30% | 30% | 20% | 41% 3 | |
| Net assets, end of period (x 1,000,000) | $53 | $45 | $47 | $41 | $49 | |
| 1 | Calculated based on the average shares outstanding during the period. |
| 2 | Ratio excludes acquired fund fees and expenses, which are indirect expenses incurred by the fund through its investments in underlying funds. |
| 3 | The portfolio turnover rate increased due to the in-kind transactions relating to Schwab Total Bond Market Fund and Schwab U.S. Aggregate Bond Index Fund. There were no transaction costs associated with these transactions. For comparison purposes, portfolio turnover rate would have been 14% without including these transactions. |
Schwab Monthly Income Funds | Annual Report
Schwab Monthly Income Fund – Moderate Payout
Portfolio Holdings as of December 31, 2021
This section shows all the securities in the fund’s portfolio and their values as of the report date.
The fund files its complete schedule of portfolio holdings with the U.S. Securities and Exchange Commission (SEC) for the first and third quarters of each fiscal year on Form N-PORT Part F. The fund’s Form N-PORT Part F is available on the SEC’s website at www.sec.gov. You can also obtain this information at no cost on the fund’s website at www.schwabassetmanagement.com/schwabfunds_prospectus, by calling 1-866-414-6349, or by sending an email request to orders@mysummaryprospectus.com.The fund also makes available its complete schedule of portfolio holdings 15 to 20 days after the end of the month on the fund’s website.
| SECURITY | NUMBER
OF SHARES | VALUE ($) |
| AFFILIATED UNDERLYING FUNDS 98.6% OF NET ASSETS |
| |
| U.S. Stocks 28.7% |
| Large-Cap 28.7% |
| Schwab Dividend Equity Fund | 995,993 | 15,338,285 |
| |
| International Stocks 12.0% |
| Developed Markets 12.0% |
| Laudus International MarketMasters Fund | 255,785 | 6,399,734 |
| |
| Real Estate 7.4% |
| Global Real Estate 7.4% |
| Schwab Global Real Estate Fund | 476,661 | 3,989,654 |
| |
| Fixed Income 49.7% |
| Intermediate-Term Bond 49.7% |
| Schwab U.S. Aggregate Bond Index Fund | 2,550,372 | 26,523,871 |
| |
| Money Market Funds 0.8% |
| Schwab Variable Share Price Money Fund, Ultra Shares 0.03% (a) | 425,215 | 425,343 |
Total Affiliated Underlying Funds
(Cost $47,092,748) | 52,676,887 |
| SECURITY | NUMBER
OF SHARES | VALUE ($) |
| UNAFFILIATED UNDERLYING FUNDS 1.1% OF NET ASSETS |
| |
| Money Market Funds 1.1% |
| State Street Institutional U.S. Government Money Market Fund, Premier Class 0.03% (a) | 573,321 | 573,321 |
Total Unaffiliated Underlying Funds
(Cost $573,321) | 573,321 |
Total Investments in Securities
(Cost $47,666,069) | 53,250,208 |
| (a) | The rate shown is the 7-day yield. |
Schwab Monthly Income Funds | Annual Report
Schwab Monthly Income Fund – Moderate Payout
Portfolio Holdings as of December 31, 2021 (continued)
Below is a summary of the fund’s transactions with its affiliated underlying funds during the period ended December 31, 2021:
| | VALUE AT
12/31/20 | PURCHASES | SALES | REALIZED
GAINS (LOSSES) | NET CHANGE IN
UNREALIZED
APPRECIATION
(DEPRECIATION) | VALUE AT
12/31/21 | BALANCE
OF SHARES
HELD AT
12/31/21 | DISTRIBUTIONS
RECEIVED* |
| AFFILIATED UNDERLYING FUNDS 98.6% OF NET ASSETS |
| |
| U.S. Stocks 28.7% |
| Large-Cap 28.7% |
| Schwab Dividend Equity Fund | $12,821,811 | $4,188,013 | ($2,898,718) | ($66,630) | $1,293,809 | $15,338,285 | 995,993 | $2,240,068 |
| |
| International Stocks 12.0% |
| Developed Markets 12.0% |
| Laudus International MarketMasters Fund | 5,541,114 | 1,957,530 | (502,125) | 14,862 | (611,647) | 6,399,734 | 255,785 | 914,344 |
| |
| Real Estate 7.4% |
| Global Real Estate 7.4% |
| Schwab Global Real Estate Fund | 3,296,631 | 660,993 | (650,416) | 20,697 | 661,749 | 3,989,654 | 476,661 | 149,299 |
| |
| Fixed Income 49.7% |
| Intermediate-Term Bond 49.7% |
| Schwab U.S. Aggregate Bond Index Fund | 22,129,723 | 6,677,976 | (1,396,156) | (41,627) | (846,045) | 26,523,871 | 2,550,372 | 500,300 |
| |
| Money Market Funds 0.8% |
| Schwab Variable Share Price Money Fund, Ultra Shares | 425,207 | 136 | — | — | — | 425,343 | 425,215 | 152 |
| Total Affiliated Underlying Funds | $44,214,486 | $13,484,648 | ($5,447,415) | ($72,698) | $497,866 | $52,676,887 | | $3,804,163 |
| * | Distributions received include distributions from net investment income and capital gains, if any, from the underlying funds. |
At December 31, 2021, all of the fund’s investment securities were classified as Level 1. Fund investments in mutual funds are classified as Level 1, without consideration to the classification level of the underlying securities held by the mutual funds, which could be Level 1, Level 2 or Level 3. (See financial note 2(a) for additional information).
Schwab Monthly Income Funds | Annual Report
Schwab Monthly Income Fund – Moderate Payout
Statement of Assets and Liabilities
As of December 31, 2021
| Assets |
| Investments in securities, at value - affiliated (cost $47,092,748) | | $52,676,887 |
| Investments in securities, at value - unaffiliated (cost $573,321) | | 573,321 |
| Receivables: | | |
| Fund shares sold | | 259,642 |
| Investments sold | | 74,000 |
| Dividends | | 46,588 |
| Due from investment adviser | | 7,521 |
| Prepaid expenses | + | 6,084 |
| Total assets | | 53,644,043 |
| Liabilities |
| Payables: | | |
| Fund shares redeemed | | 160,124 |
| Investments bought | | 46,384 |
| Independent trustees’ fees | | 41 |
| Accrued expenses | + | 40,547 |
| Total liabilities | | 247,096 |
| Net assets | | $53,396,947 |
| Net Assets by Source |
| Capital received from investors | | $46,887,555 |
| Total distributable earnings | + | 6,509,392 |
| Net assets | | $53,396,947 |
| Net Asset Value (NAV) |
| Net Assets | ÷ | Shares
Outstanding | = | NAV |
| $53,396,947 | | 4,454,808 | | $11.99 |
| | | | | |
| | | | | |
Schwab Monthly Income Funds | Annual Report
Schwab Monthly Income Fund – Moderate Payout
Statement of Operations
| For the period January 1, 2021 through December 31, 2021 |
| Investment Income |
| Dividends received from securities - affiliated | | $986,553 |
| Dividends received from securities - unaffiliated | + | 206 |
| Total investment income | | 986,759 |
| Expenses |
| Professional fees | | 25,615 |
| Registration fees | | 22,105 |
| Portfolio accounting fees | | 17,413 |
| Shareholder reports | | 11,244 |
| Independent trustees’ fees | | 7,133 |
| Transfer agent fees | | 1,341 |
| Custodian fees | | 776 |
| Other expenses | + | 3,748 |
| Total expenses | | 89,375 |
| Expense reduction by investment adviser | – | 89,375 |
| Net expenses | – | — |
| Net investment income | | 986,759 |
| REALIZED AND UNREALIZED GAINS (LOSSES) |
| Realized capital gain distributions received from underlying funds - affiliated | | 2,817,610 |
| Net realized losses on sales of securities - affiliated | + | (72,698) |
| Net realized gains | | 2,744,912 |
| Net change in unrealized appreciation (depreciation) on securities - affiliated | + | 497,866 |
| Net realized and unrealized gains | | 3,242,778 |
| Increase in net assets resulting from operations | | $4,229,537 |
Schwab Monthly Income Funds | Annual Report
Schwab Monthly Income Fund – Moderate Payout
Statement of Changes in Net Assets
For the current and prior report periods
| OPERATIONS |
| | 1/1/21-12/31/21 | 1/1/20-12/31/20 |
| Net investment income | | $986,759 | $857,657 |
| Net realized gains (losses) | | 2,744,912 | (143,675) |
| Net change in unrealized appreciation (depreciation) | + | 497,866 | 1,285,818 |
| Increase in net assets from operations | | $4,229,537 | $1,999,800 |
| DISTRIBUTIONS TO SHAREHOLDERS |
| Total distributions | | ($1,862,595) | ($1,160,837) |
| TRANSACTIONS IN FUND SHARES |
| | 1/1/21-12/31/21 | 1/1/20-12/31/20 |
| | | SHARES | VALUE | SHARES | VALUE |
| Shares sold | | 1,345,116 | $16,044,571 | 1,473,250 | $15,784,151 |
| Shares reinvested | | 91,349 | 1,092,884 | 62,524 | 679,897 |
| Shares redeemed | + | (904,827) | (10,770,327) | (1,816,959) | (19,246,565) |
| Net transactions in fund shares | | 531,638 | $6,367,128 | (281,185) | ($2,782,517) |
| SHARES OUTSTANDING AND NET ASSETS |
| | 1/1/21-12/31/21 | 1/1/20-12/31/20 |
| | | SHARES | NET ASSETS | SHARES | NET ASSETS |
| Beginning of period | | 3,923,170 | $44,662,877 | 4,204,355 | $46,606,431 |
| Total increase (decrease) | + | 531,638 | 8,734,070 | (281,185) | (1,943,554) |
| End of period | | 4,454,808 | $53,396,947 | 3,923,170 | $44,662,877 |
Schwab Monthly Income Funds | Annual Report
Schwab Monthly Income Fund – Enhanced Payout
Financial Statements
FINANCIAL HIGHLIGHTS
| | 1/1/21–
12/31/21 | 1/1/20–
12/31/20 | 1/1/19–
12/31/19 | 1/1/18–
12/31/18 | 1/1/17–
12/31/17 | |
| Per-Share Data |
| Net asset value at beginning of period | $11.82 | $11.49 | $10.58 | $11.38 | $10.81 | |
| Income (loss) from investment operations: | | | | | | |
| Net investment income (loss)1 | 0.24 | 0.23 | 0.31 | 0.25 | 0.24 | |
| Net realized and unrealized gains (losses) | 0.44 | 0.45 | 1.13 | (0.72) | 0.64 | |
| Total from investment operations | 0.68 | 0.68 | 1.44 | (0.47) | 0.88 | |
| Less distributions: | | | | | | |
| Distributions from net investment income | (0.34) | (0.23) | (0.31) | (0.26) | (0.31) | |
| Distributions from net realized gains | (0.14) | (0.12) | (0.22) | (0.07) | — | |
| Total distributions | (0.48) | (0.35) | (0.53) | (0.33) | (0.31) | |
| Net asset value at end of period | $12.02 | $11.82 | $11.49 | $10.58 | $11.38 | |
| Total return | 5.73% | 6.11% | 13.79% | (4.20%) | 8.19% | |
| Ratios/Supplemental Data |
| Ratios to average net assets: | | | | | | |
| Net operating expenses2 | 0.00% | 0.00% | 0.00% | 0.00% | 0.00% | |
| Gross operating expenses2 | 0.10% | 0.12% | 0.14% | 0.12% | 0.11% | |
| Net investment income (loss) | 1.99% | 2.06% | 2.75% | 2.28% | 2.14% | |
| Portfolio turnover rate | 20% | 28% | 31% | 9% | 50% 3 | |
| Net assets, end of period (x 1,000,000) | $100 | $90 | $86 | $77 | $95 | |
| 1 | Calculated based on the average shares outstanding during the period. |
| 2 | Ratio excludes acquired fund fees and expenses, which are indirect expenses incurred by the fund through its investments in underlying funds. |
| 3 | The portfolio turnover rate increased due to the in-kind transactions relating to Schwab Total Bond Market Fund and Schwab U.S. Aggregate Bond Index Fund. There were no transaction costs associated with these transactions. For comparison purposes, portfolio turnover rate would have been 13% without including these transactions. |
Schwab Monthly Income Funds | Annual Report
Schwab Monthly Income Fund – Enhanced Payout
Portfolio Holdings as of December 31, 2021
This section shows all the securities in the fund’s portfolio and their values as of the report date.
The fund files its complete schedule of portfolio holdings with the U.S. Securities and Exchange Commission (SEC) for the first and third quarters of each fiscal year on Form N-PORT Part F. The fund’s Form N-PORT Part F is available on the SEC’s website at www.sec.gov. You can also obtain this information at no cost on the fund’s website at www.schwabassetmanagement.com/schwabfunds_prospectus, by calling 1-866-414-6349, or by sending an email request to orders@mysummaryprospectus.com.The fund also makes available its complete schedule of portfolio holdings 15 to 20 days after the end of the month on the fund’s website.
| SECURITY | NUMBER
OF SHARES | VALUE ($) |
| AFFILIATED UNDERLYING FUNDS 98.9% OF NET ASSETS |
| |
| U.S. Stocks 19.8% |
| Large-Cap 19.8% |
| Schwab Dividend Equity Fund | 1,284,603 | 19,782,883 |
| |
| International Stocks 8.2% |
| Developed Markets 8.2% |
| Laudus International MarketMasters Fund | 327,102 | 8,184,095 |
| |
| Real Estate 5.2% |
| Global Real Estate 5.2% |
| Schwab Global Real Estate Fund | 627,112 | 5,248,925 |
| |
| Fixed Income 64.8% |
| Intermediate-Term Bond 64.8% |
| Schwab U.S. Aggregate Bond Index Fund | 6,233,929 | 64,832,861 |
| |
| Money Market Funds 0.9% |
| Schwab Variable Share Price Money Fund, Ultra Shares 0.03% (a) | 927,627 | 927,905 |
Total Affiliated Underlying Funds
(Cost $88,989,218) | 98,976,669 |
| SECURITY | NUMBER
OF SHARES | VALUE ($) |
| UNAFFILIATED UNDERLYING FUNDS 1.1% OF NET ASSETS |
| |
| Money Market Funds 1.1% |
| State Street Institutional U.S. Government Money Market Fund, Premier Class 0.03% (a) | 1,095,220 | 1,095,220 |
Total Unaffiliated Underlying Funds
(Cost $1,095,220) | 1,095,220 |
Total Investments in Securities
(Cost $90,084,438) | 100,071,889 |
| (a) | The rate shown is the 7-day yield. |
Schwab Monthly Income Funds | Annual Report
Schwab Monthly Income Fund – Enhanced Payout
Portfolio Holdings as of December 31, 2021 (continued)
Below is a summary of the fund’s transactions with its affiliated underlying funds during the period ended December 31, 2021:
| | VALUE AT
12/31/20 | PURCHASES | SALES | REALIZED
GAINS (LOSSES) | NET CHANGE IN
UNREALIZED
APPRECIATION
(DEPRECIATION) | VALUE AT
12/31/21 | BALANCE
OF SHARES
HELD AT
12/31/21 | DISTRIBUTIONS
RECEIVED* |
| AFFILIATED UNDERLYING FUNDS 98.9% OF NET ASSETS |
| |
| U.S. Stocks 19.8% |
| Large-Cap 19.8% |
| Schwab Dividend Equity Fund | $17,682,401 | $6,947,060 | ($6,688,437) | $245,647 | $1,596,212 | $19,782,883 | 1,284,603 | $2,998,522 |
| |
| International Stocks 8.2% |
| Developed Markets 8.2% |
| Laudus International MarketMasters Fund | 7,778,377 | 3,505,372 | (2,358,315) | 120,046 | (861,385) | 8,184,095 | 327,102 | 1,212,941 |
| |
| Real Estate 5.2% |
| Global Real Estate 5.2% |
| Schwab Global Real Estate Fund | 4,569,701 | 1,131,080 | (1,418,713) | 66,433 | 900,424 | 5,248,925 | 627,112 | 205,338 |
| |
| Fixed Income 64.8% |
| Intermediate-Term Bond 64.8% |
| Schwab U.S. Aggregate Bond Index Fund | 57,885,337 | 17,770,409 | (8,409,228) | (235,486) | (2,178,171) | 64,832,861 | 6,233,929 | 1,297,827 |
| |
| Money Market Funds 0.9% |
| Schwab Variable Share Price Money Fund, Ultra Shares | 927,610 | 295 | — | — | — | 927,905 | 927,627 | 331 |
| Total Affiliated Underlying Funds | $88,843,426 | $29,354,216 | ($18,874,693) | $196,640 | ($542,920) | $98,976,669 | | $5,714,959 |
| * | Distributions received include distributions from net investment income and capital gains, if any, from the underlying funds. |
At December 31, 2021, all of the fund’s investment securities were classified as Level 1. Fund investments in mutual funds are classified as Level 1, without consideration to the classification level of the underlying securities held by the mutual funds, which could be Level 1, Level 2 or Level 3. (See financial note 2(a) for additional information).
Schwab Monthly Income Funds | Annual Report
Schwab Monthly Income Fund – Enhanced Payout
Statement of Assets and Liabilities
As of December 31, 2021
| Assets |
| Investments in securities, at value - affiliated (cost $88,989,218) | | $98,976,669 |
| Investments in securities, at value - unaffiliated (cost $1,095,220) | | 1,095,220 |
| Receivables: | | |
| Fund shares sold | | 255,381 |
| Dividends | | 115,974 |
| Due from investment adviser | | 8,120 |
| Prepaid expenses | + | 6,427 |
| Total assets | | 100,457,791 |
| Liabilities |
| Payables: | | |
| Fund shares redeemed | | 218,232 |
| Investments bought | | 115,553 |
| Independent trustees’ fees | | 42 |
| Accrued expenses | + | 43,224 |
| Total liabilities | | 377,051 |
| Net assets | | $100,080,740 |
| Net Assets by Source |
| Capital received from investors | | $88,381,129 |
| Total distributable earnings | + | 11,699,611 |
| Net assets | | $100,080,740 |
| Net Asset Value (NAV) |
| Net Assets | ÷ | Shares
Outstanding | = | NAV |
| $100,080,740 | | 8,327,197 | | $12.02 |
| | | | | |
| | | | | |
Schwab Monthly Income Funds | Annual Report
Schwab Monthly Income Fund – Enhanced Payout
Statement of Operations
| For the period January 1, 2021 through December 31, 2021 |
| Investment Income |
| Dividends received from securities - affiliated | | $1,959,233 |
| Dividends received from securities - unaffiliated | + | 392 |
| Total investment income | | 1,959,625 |
| Expenses |
| Professional fees | | 29,970 |
| Registration fees | | 24,716 |
| Portfolio accounting fees | | 17,993 |
| Shareholder reports | | 15,947 |
| Independent trustees’ fees | | 7,285 |
| Transfer agent fees | | 1,702 |
| Custodian fees | | 389 |
| Other expenses | + | 4,149 |
| Total expenses | | 102,151 |
| Expense reduction by investment adviser | – | 102,151 |
| Net expenses | – | — |
| Net investment income | | 1,959,625 |
| REALIZED AND UNREALIZED GAINS (LOSSES) |
| Realized capital gain distributions received from underlying funds - affiliated | | 3,755,726 |
| Net realized gains on sales of securities - affiliated | + | 196,640 |
| Net realized gains | | 3,952,366 |
| Net change in unrealized appreciation (depreciation) on securities - affiliated | + | (542,920) |
| Net realized and unrealized gains | | 3,409,446 |
| Increase in net assets resulting from operations | | $5,369,071 |
Schwab Monthly Income Funds | Annual Report
Schwab Monthly Income Fund – Enhanced Payout
Statement of Changes in Net Assets
For the current and prior report periods
| OPERATIONS |
| | 1/1/21-12/31/21 | 1/1/20-12/31/20 |
| Net investment income | | $1,959,625 | $1,743,661 |
| Net realized gains | | 3,952,366 | 317,497 |
| Net change in unrealized appreciation (depreciation) | + | (542,920) | 2,849,634 |
| Increase in net assets from operations | | $5,369,071 | $4,910,792 |
| DISTRIBUTIONS TO SHAREHOLDERS |
| Total distributions | | ($3,863,797) | ($2,674,802) |
| TRANSACTIONS IN FUND SHARES |
| | 1/1/21-12/31/21 | 1/1/20-12/31/20 |
| | | SHARES | VALUE | SHARES | VALUE |
| Shares sold | | 3,079,304 | $37,078,468 | 2,448,176 | $27,839,048 |
| Shares reinvested | | 199,243 | 2,401,008 | 147,131 | 1,693,229 |
| Shares redeemed | + | (2,536,848) | (30,595,287) | (2,461,385) | (27,672,110) |
| Net transactions in fund shares | | 741,699 | $8,884,189 | 133,922 | $1,860,167 |
| SHARES OUTSTANDING AND NET ASSETS |
| | 1/1/21-12/31/21 | 1/1/20-12/31/20 |
| | | SHARES | NET ASSETS | SHARES | NET ASSETS |
| Beginning of period | | 7,585,498 | $89,691,277 | 7,451,576 | $85,595,120 |
| Total increase | + | 741,699 | 10,389,463 | 133,922 | 4,096,157 |
| End of period | | 8,327,197 | $100,080,740 | 7,585,498 | $89,691,277 |
Schwab Monthly Income Funds | Annual Report
Schwab Monthly Income Fund – Maximum Payout
Financial Statements
FINANCIAL HIGHLIGHTS
| | 1/1/21–
12/31/21 | 1/1/20–
12/31/20 | 1/1/19–
12/31/19 | 1/1/18–
12/31/18 | 1/1/17–
12/31/17 | |
| Per-Share Data |
| Net asset value at beginning of period | $10.80 | $10.33 | $9.60 | $10.15 | $9.85 | |
| Income (loss) from investment operations: | | | | | | |
| Net investment income (loss)1 | 0.22 | 0.23 | 0.29 | 0.24 | 0.22 | |
| Net realized and unrealized gains (losses) | 0.03 | 0.47 | 0.77 | (0.48) | 0.33 | |
| Total from investment operations | 0.25 | 0.70 | 1.06 | (0.24) | 0.55 | |
| Less distributions: | | | | | | |
| Distributions from net investment income | (0.26) | (0.22) | (0.28) | (0.24) | (0.25) | |
| Distributions from net realized gains | (0.07) | (0.01) | (0.05) | (0.07) | — | |
| Total distributions | (0.33) | (0.23) | (0.33) | (0.31) | (0.25) | |
| Net asset value at end of period | $10.72 | $10.80 | $10.33 | $9.60 | $10.15 | |
| Total return | 2.33% | 6.93% | 11.18% | (2.31%) | 5.64% | |
| Ratios/Supplemental Data |
| Ratios to average net assets: | | | | | | |
| Net operating expenses2 | 0.00% | 0.00% | 0.00% | 0.00% | 0.00% 3,4 | |
| Gross operating expenses2 | 0.11% | 0.14% | 0.23% | 0.20% | 0.20% | |
| Net investment income (loss) | 1.99% | 2.17% | 2.85% | 2.42% | 2.17% | |
| Portfolio turnover rate | 25% | 23% | 31% | 11% | 63% 5 | |
| Net assets, end of period (x 1,000,000) | $113 | $112 | $63 | $40 | $48 | |
| 1 | Calculated based on the average shares outstanding during the period. |
| 2 | Ratio excludes acquired fund fees and expenses, which are indirect expenses incurred by the fund through its investments in underlying funds. |
| 3 | The ratio of net operating expenses would have been 0.00%, if certain non-routine expenses had not been incurred. |
| 4 | Less than 0.005%. |
| 5 | The portfolio turnover rate increased due to the in-kind transactions relating to Schwab Total Bond Market Fund and Schwab U.S. Aggregate Bond Index Fund. There were no transaction costs associated with these transactions. For comparison purposes, portfolio turnover rate would have been 16% without including these transactions. |
Schwab Monthly Income Funds | Annual Report
Schwab Monthly Income Fund – Maximum Payout
Portfolio Holdings as of December 31, 2021
This section shows all the securities in the fund’s portfolio and their values as of the report date.
The fund files its complete schedule of portfolio holdings with the U.S. Securities and Exchange Commission (SEC) for the first and third quarters of each fiscal year on Form N-PORT Part F. The fund’s Form N-PORT Part F is available on the SEC’s website at www.sec.gov. You can also obtain this information at no cost on the fund’s website at www.schwabassetmanagement.com/schwabfunds_prospectus, by calling 1-866-414-6349, or by sending an email request to orders@mysummaryprospectus.com.The fund also makes available its complete schedule of portfolio holdings 15 to 20 days after the end of the month on the fund’s website.
| SECURITY | NUMBER
OF SHARES | VALUE ($) |
| AFFILIATED UNDERLYING FUNDS 98.5% OF NET ASSETS |
| |
| U.S. Stocks 10.8% |
| Large-Cap 10.8% |
| Schwab Dividend Equity Fund | 787,374 | 12,125,554 |
| |
| International Stocks 4.4% |
| Developed Markets 4.4% |
| Laudus International MarketMasters Fund | 197,973 | 4,953,292 |
| |
| Real Estate 2.9% |
| Global Real Estate 2.9% |
| Schwab Global Real Estate Fund | 394,134 | 3,298,902 |
| |
| Fixed Income 79.3% |
| Intermediate-Term Bond 79.3% |
| Schwab U.S. Aggregate Bond Index Fund | 8,586,647 | 89,301,124 |
| |
| Money Market Funds 1.1% |
| Schwab Variable Share Price Money Fund, Ultra Shares 0.03% (a) | 1,175,491 | 1,175,843 |
Total Affiliated Underlying Funds
(Cost $106,375,217) | 110,854,715 |
| SECURITY | NUMBER
OF SHARES | VALUE ($) |
| UNAFFILIATED UNDERLYING FUNDS 0.7% OF NET ASSETS |
| |
| Money Market Funds 0.7% |
| State Street Institutional U.S. Government Money Market Fund, Premier Class 0.03% (a) | 821,551 | 821,551 |
Total Unaffiliated Underlying Funds
(Cost $821,551) | 821,551 |
Total Investments in Securities
(Cost $107,196,768) | 111,676,266 |
| (a) | The rate shown is the 7-day yield. |
Schwab Monthly Income Funds | Annual Report
Schwab Monthly Income Fund – Maximum Payout
Portfolio Holdings as of December 31, 2021 (continued)
Below is a summary of the fund’s transactions with its affiliated underlying funds during the period ended December 31, 2021:
| | VALUE AT
12/31/20 | PURCHASES | SALES | REALIZED
GAINS (LOSSES) | NET CHANGE IN
UNREALIZED
APPRECIATION
(DEPRECIATION) | VALUE AT
12/31/21 | BALANCE
OF SHARES
HELD AT
12/31/21 | DISTRIBUTIONS
RECEIVED* |
| AFFILIATED UNDERLYING FUNDS 98.5% OF NET ASSETS |
| |
| U.S. Stocks 10.8% |
| Large-Cap 10.8% |
| Schwab Dividend Equity Fund | $12,053,824 | $3,509,150 | ($4,720,191) | $244,309 | $1,038,462 | $12,125,554 | 787,374 | $1,734,816 |
| |
| International Stocks 4.4% |
| Developed Markets 4.4% |
| Laudus International MarketMasters Fund | 5,542,048 | 2,187,646 | (2,284,971) | 66,014 | (557,445) | 4,953,292 | 197,973 | 778,646 |
| |
| Real Estate 2.9% |
| Global Real Estate 2.9% |
| Schwab Global Real Estate Fund | 3,191,436 | 629,457 | (1,131,902) | (36,866) | 646,777 | 3,298,902 | 394,134 | 129,456 |
| |
| Fixed Income 79.3% |
| Intermediate-Term Bond 79.3% |
| Schwab U.S. Aggregate Bond Index Fund | 89,008,829 | 23,733,716 | (19,835,391) | (737,526) | (2,868,504) | 89,301,124 | 8,586,647 | 1,838,632 |
| |
| Money Market Funds 1.1% |
| Schwab Variable Share Price Money Fund, Ultra Shares | 975,521 | 200,322 | — | — | — | 1,175,843 | 1,175,491 | 368 |
| Total Affiliated Underlying Funds | $110,771,658 | $30,260,291 | ($27,972,455) | ($464,069) | ($1,740,710) | $110,854,715 | | $4,481,918 |
| * | Distributions received include distributions from net investment income and capital gains, if any, from the underlying funds. |
At December 31, 2021, all of the fund’s investment securities were classified as Level 1. Fund investments in mutual funds are classified as Level 1, without consideration to the classification level of the underlying securities held by the mutual funds, which could be Level 1, Level 2 or Level 3. (See financial note 2(a) for additional information).
Schwab Monthly Income Funds | Annual Report
Schwab Monthly Income Fund – Maximum Payout
Statement of Assets and Liabilities
As of December 31, 2021
| Assets |
| Investments in securities, at value - affiliated (cost $106,375,217) | | $110,854,715 |
| Investments in securities, at value - unaffiliated (cost $821,551) | | 821,551 |
| Receivables: | | |
| Fund shares sold | | 3,823,238 |
| Investments sold | | 260,000 |
| Dividends | | 156,671 |
| Due from investment adviser | | 10,158 |
| Prepaid expenses | + | 7,022 |
| Total assets | | 115,933,355 |
| Liabilities |
| Payables: | | |
| Investments bought | | 3,006,136 |
| Fund shares redeemed | | 265,397 |
| Independent trustees’ fees | | 42 |
| Accrued expenses | + | 42,966 |
| Total liabilities | | 3,314,541 |
| Net assets | | $112,618,814 |
| Net Assets by Source |
| Capital received from investors | | $107,577,517 |
| Total distributable earnings | + | 5,041,297 |
| Net assets | | $112,618,814 |
| Net Asset Value (NAV) |
| Net Assets | ÷ | Shares
Outstanding | = | NAV |
| $112,618,814 | | 10,510,063 | | $10.72 |
| | | | | |
| | | | | |
Schwab Monthly Income Funds | Annual Report
Schwab Monthly Income Fund – Maximum Payout
Statement of Operations
| For the period January 1, 2021 through December 31, 2021 |
| Investment Income |
| Dividends received from securities - affiliated | | $2,247,141 |
| Dividends received from securities - unaffiliated | + | 427 |
| Total investment income | | 2,247,568 |
| Expenses |
| Registration fees | | 39,453 |
| Professional fees | | 31,098 |
| Portfolio accounting fees | | 18,302 |
| Shareholder reports | | 16,862 |
| Independent trustees’ fees | | 7,333 |
| Transfer agent fees | | 1,795 |
| Custodian fees | | 796 |
| Other expenses | + | 4,251 |
| Total expenses | | 119,890 |
| Expense reduction by investment adviser | – | 119,890 |
| Net expenses | – | — |
| Net investment income | | 2,247,568 |
| REALIZED AND UNREALIZED GAINS (LOSSES) |
| Realized capital gain distributions received from underlying funds - affiliated | | 2,234,777 |
| Net realized losses on sales of securities - affiliated | + | (464,069) |
| Net realized gains | | 1,770,708 |
| Net change in unrealized appreciation (depreciation) on securities - affiliated | + | (1,740,710) |
| Net realized and unrealized gains | | 29,998 |
| Increase in net assets resulting from operations | | $2,277,566 |
Schwab Monthly Income Funds | Annual Report
Schwab Monthly Income Fund – Maximum Payout
Statement of Changes in Net Assets
For the current and prior report periods
| OPERATIONS |
| | 1/1/21-12/31/21 | 1/1/20-12/31/20 |
| Net investment income | | $2,247,568 | $1,689,567 |
| Net realized gains | | 1,770,708 | 192,821 |
| Net change in unrealized appreciation (depreciation) | + | (1,740,710) | 3,128,712 |
| Increase in net assets from operations | | $2,277,566 | $5,011,100 |
| DISTRIBUTIONS TO SHAREHOLDERS |
| Total distributions | | ($3,387,702) | ($1,822,117) |
| TRANSACTIONS IN FUND SHARES |
| | 1/1/21-12/31/21 | 1/1/20-12/31/20 |
| | | SHARES | VALUE | SHARES | VALUE |
| Shares sold | | 5,817,574 | $62,845,934 | 8,675,410 | $91,217,898 |
| Shares reinvested | | 194,332 | 2,091,664 | 105,564 | 1,111,251 |
| Shares redeemed | + | (5,871,515) | (63,251,350) | (4,462,298) | (46,001,366) |
| Net transactions in fund shares | | 140,391 | $1,686,248 | 4,318,676 | $46,327,783 |
| SHARES OUTSTANDING AND NET ASSETS |
| | 1/1/21-12/31/21 | 1/1/20-12/31/20 |
| | | SHARES | NET ASSETS | SHARES | NET ASSETS |
| Beginning of period | | 10,369,672 | $112,042,702 | 6,050,996 | $62,525,936 |
| Total increase | + | 140,391 | 576,112 | 4,318,676 | 49,516,766 |
| End of period | | 10,510,063 | $112,618,814 | 10,369,672 | $112,042,702 |
Schwab Monthly Income Funds | Annual Report
Schwab Monthly Income Funds
1. Business Structure of the Funds:
Each of the funds in this report is a series of Schwab Capital Trust (the trust), a no-load, open-end management investment company. The trust is organized as a Massachusetts business trust and is registered under the Investment Company Act of 1940, as amended (the 1940 Act). The list below shows all the funds in the trust as of the end of the period, including the funds discussed in this report, which are highlighted:
| SCHWAB CAPITAL TRUST (ORGANIZED MAY 7, 1993) |
| Schwab Monthly Income Fund - Moderate Payout | Schwab Balanced Fund |
| Schwab Monthly Income Fund - Enhanced Payout | Schwab Core Equity Fund |
| Schwab Monthly Income Fund - Maximum Payout | Schwab Dividend Equity Fund |
| Schwab Target 2010 Fund | Schwab Large-Cap Growth Fund |
| Schwab Target 2015 Fund | Schwab Small-Cap Equity Fund |
| Schwab Target 2020 Fund | Schwab Health Care Fund |
| Schwab Target 2025 Fund | Schwab International Core Equity Fund |
| Schwab Target 2030 Fund | Schwab Fundamental US Large Company Index Fund |
| Schwab Target 2035 Fund | Schwab Fundamental US Small Company Index Fund |
| Schwab Target 2040 Fund | Schwab Fundamental International Large Company Index Fund |
| Schwab Target 2045 Fund | Schwab Fundamental International Small Company Index Fund |
| Schwab Target 2050 Fund | Schwab Fundamental Emerging Markets Large Company Index Fund |
| Schwab Target 2055 Fund | Schwab Fundamental Global Real Estate Index Fund |
| Schwab Target 2060 Fund | Schwab Target 2010 Index Fund |
| Schwab Target 2065 Fund | Schwab Target 2015 Index Fund |
| Schwab S&P 500 Index Fund | Schwab Target 2020 Index Fund |
| Schwab Small-Cap Index Fund® | Schwab Target 2025 Index Fund |
| Schwab Total Stock Market Index Fund® | Schwab Target 2030 Index Fund |
| Schwab U.S. Large-Cap Growth Index Fund | Schwab Target 2035 Index Fund |
| Schwab U.S. Large-Cap Value Index Fund | Schwab Target 2040 Index Fund |
| Schwab U.S. Mid-Cap Index Fund | Schwab Target 2045 Index Fund |
| Schwab International Index Fund® | Schwab Target 2050 Index Fund |
| Schwab MarketTrack All Equity Portfolio™ | Schwab Target 2055 Index Fund |
| Schwab MarketTrack Growth Portfolio™ | Schwab Target 2060 Index Fund |
| Schwab MarketTrack Balanced Portfolio™ | Schwab Target 2065 Index Fund |
| Schwab MarketTrack Conservative Portfolio™ | |
| Laudus International MarketMasters Fund™ | |
The Schwab Monthly Income Funds are “fund of funds.” Each of the funds seeks to achieve its investment objective by investing primarily in a combination of Schwab Funds, Laudus Funds and Schwab Exchange-Traded Funds (ETFs) and may also invest in other unaffiliated, third-party mutual funds (all such mutual funds and ETFs referred to as “underlying funds”), in accordance with its target portfolio allocation. Each fund may also invest directly in equity and fixed income securities, cash and cash equivalents, including money market securities and ETFs.
Each fund in this report offers one share class. Shares are bought and sold at closing net asset value per share (NAV), which is the price for all outstanding shares of a fund. Each share has a par value of 1/1,000 of a cent, and the funds’ Board of Trustees (the Board) may authorize the issuance of as many shares as necessary.
Each fund maintains its own account for purposes of holding assets and accounting, and is considered a separate entity for tax purposes. Within its account, each fund may also keep certain assets in segregated accounts, as required by securities law.
2. Significant Accounting Policies:
The following is a summary of the significant accounting policies the funds use in their preparation of financial statements. The funds follow the investment company accounting and reporting guidance of the Financial Accounting Standards Board (FASB) Accounting Standard Codification Topic 946 Financial Services — Investment Companies. The accounting policies are in conformity with accounting principles generally accepted in the United States of America (GAAP).
The financial statements of the funds should be read in conjunction with the underlying funds’ financial statements. For more information about the underlying funds’ operations and policies, please refer to those funds’ semiannual and annual reports, which are filed with the U.S. Securities and Exchange Commission (SEC) and are available on the SEC’s website at www.sec.gov.
Schwab Monthly Income Funds | Annual Report
Schwab Monthly Income Funds
Financial Notes (continued)
2. Significant Accounting Policies (continued):
(a) Security Valuation:
Under procedures approved by the Board, the investment adviser has formed a Pricing Committee to administer the pricing and valuation of portfolio securities and other assets and to ensure that prices used for internal purposes or provided by third parties reasonably reflect fair value. Among other things, these procedures allow the funds to utilize independent pricing services, quotations from securities and financial instrument dealers and other market sources to determine fair value.
The funds value the securities in their portfolios every business day. The funds use the following policies to value various types of securities:
• Mutual funds: Mutual funds are valued at their respective NAVs.
• Securities for which no quoted value is available: The Board has adopted procedures to fair value each fund’s securities when market prices are not “readily available” or are unreliable. For example, a fund may fair value a security when it is de-listed or its trading is halted or suspended; when a security’s primary pricing source is unable or unwilling to provide a price; or when a security’s primary trading market is closed during regular market hours. Each fund makes fair value determinations in good faith in accordance with the fund’s valuation procedures. The Pricing Committee considers a number of factors, including unobservable market inputs when arriving at fair value. The Pricing Committee may employ techniques such as the review of related or comparable assets or liabilities, related market activities, recent transactions, market multiples, book values, transactional back-testing, disposition analysis and other relevant information. The Pricing Committee regularly reviews these inputs and assumptions to calibrate the valuations. Due to the subjective and variable nature of fair value pricing, there can be no assurance that a fund could obtain the fair value assigned to the security upon the sale of such security. The Board convenes on a regular basis to review fair value determinations made by the funds pursuant to the valuation procedures.
In accordance with the authoritative guidance on fair value measurements and disclosures under GAAP, the funds disclose the fair value of their investments in a hierarchy that prioritizes the significant inputs to valuation techniques used to measure the fair value. The hierarchy gives the highest priority to valuations based upon unadjusted quoted prices in active markets for identical assets or liabilities (Level 1 measurements) and the lowest priority to valuations based upon unobservable inputs that are significant to the valuation (Level 3 measurements). If inputs used to measure the financial instruments fall within different levels of the hierarchy, the categorization is based on the lowest level input that is significant to the valuation. If the funds determine that either the volume and/or level of activity for an asset or liability has significantly decreased (from normal conditions for that asset or liability) or price quotations or observable inputs are not associated with orderly transactions, increased analysis and management judgment will be required to estimate fair value.
The three levels of the fair value hierarchy are as follows:
• Level 1 — quoted prices in active markets for identical securities — Investments whose values are based on quoted market prices in active markets, and whose values are therefore classified as Level 1 prices, include active listed equities and mutual funds. Investments in mutual funds are valued daily at their NAVs, which are classified as Level 1 prices, without consideration to the classification level of the underlying securities held by an underlying fund.
• Level 2 — other significant observable inputs (including quoted prices for similar securities, interest rates, prepayment speeds, credit risk, etc.) — Investments that trade in markets that are not considered to be active, but whose values are based on quoted market prices, dealer quotations or valuations provided by alternative pricing sources supported by observable inputs are classified as Level 2 prices. These generally include U.S. government and sovereign obligations, most government agency securities, investment-grade corporate bonds, certain mortgage products, less liquid listed equities, and state, municipal and provincial obligations.
• Level 3 — significant unobservable inputs (including the funds’ own assumptions in determining the fair value of investments) — Investments whose values are classified as Level 3 prices have significant unobservable inputs, as they may trade infrequently or not at all. When observable prices are not available for these securities, the funds use one or more valuation techniques for which sufficient and reliable data is available. The inputs used by the funds in estimating the value of Level 3 prices may include the original transaction price, quoted prices for similar securities or assets in active markets, completed or pending third-party transactions in the underlying investment or comparable issuers, and changes in financial ratios or cash flows. Level 3 prices may also be adjusted to reflect illiquidity and/or non-transferability, with the amount of such discount estimated by the funds in the absence of market information. Assumptions used by the funds due to the lack of observable inputs may significantly impact the resulting fair value and therefore the funds’ results of operations.
Schwab Monthly Income Funds | Annual Report
Schwab Monthly Income Funds
Financial Notes (continued)
2. Significant Accounting Policies (continued):
The inputs or methodology used for valuing securities are not necessarily an indication of the risk associated with investing in those securities.
As disclosed in the Portfolio Holdings, as of December 31, 2021, all of the funds’ investments were classified as Level 1.
(b) Security Transactions:
Security transactions are recorded as of the date the order to buy or sell the security is executed. Realized gains and losses from security transactions are based on the identified costs of the securities involved.
(c) Investment Income:
Interest income is recorded as it accrues. Dividends and distributions from portfolio securities and underlying funds are recorded on the date they are effective (the ex-dividend date). Any distributions from underlying funds are recorded in accordance with the character of the distributions as designated by the underlying funds.
(d) Expenses:
Expenses that are specific to a fund are charged directly to the fund. Expenses that are common to more than one fund in the trusts generally are allocated among those funds in proportion to their average daily net assets. Each fund bears its share of the acquired fund fees and expenses of the underlying funds, which are indirect expenses incurred by the fund through its investments in the underlying funds. Such expenses are reflected in the net asset values of the underlying funds.
(e) Distributions to Shareholders:
The funds make distributions from net investment income monthly and from net realized capital gains, if any, once a year.
(f) Accounting Estimates:
The accounting policies described in this report conform to GAAP. Notwithstanding this, shareholders should understand that in order to follow these principles, fund management has to make estimates and assumptions that affect the information reported in the financial statements. It’s possible that once the results are known, they may turn out to be different from these estimates and these differences may be material.
(g) Federal Income Taxes:
The funds intend to meet federal income and excise tax requirements for regulated investment companies under subchapter M of the Internal Revenue Code, as amended. Accordingly, the funds distribute substantially all of their net investment income and net realized capital gains, if any, to their respective shareholders each year. As long as a fund meets the tax requirements, it is not required to pay federal income tax.
(h) Indemnification:
Under the funds’ organizational documents, the officers and trustees are indemnified against certain liabilities arising out of the performance of their duties to the funds. In addition, in the normal course of business the funds enter into contracts with their vendors and others that provide general indemnifications. The funds’ maximum exposure under these arrangements is unknown as this would involve future claims that may be made against the funds. However, based on experience, the funds expect the risk of loss attributable to these arrangements to be remote.
3. Risk Factors:
Investing in the funds may involve certain risks, as discussed in the funds’ prospectus, including, but not limited to, those described below. Any of these risks could cause an investor to lose money.
Asset Allocation Risk. The funds are subject to the risk that the selection of the underlying funds and the allocation of a fund’s assets among the various asset classes and market segments may cause a fund to underperform other funds with a similar investment objective.
Conflicts of Interest Risk. The investment adviser’s authority to select and substitute underlying funds from a variety of affiliated and unaffiliated mutual funds and ETFs may create a conflict of interest because the fees paid to it and its affiliates by some underlying funds are higher than the fees paid by other underlying funds. The investment adviser also may have an incentive to
Schwab Monthly Income Funds | Annual Report
Schwab Monthly Income Funds
Financial Notes (continued)
3. Risk Factors (continued):
select an affiliated underlying fund for other reasons, including to increase assets under management or to support new investment strategies. In addition, other conflicts of interest may exist where the best interests of the affiliated underlying fund may not be aligned with those of a fund. However, the investment adviser is a fiduciary to the fund and is legally obligated to act in the fund’s best interests when selecting underlying funds.
Market Risk. Financial markets rise and fall in response to a variety of factors, sometimes rapidly and unpredictably. Markets may be impacted by economic, political, regulatory and other conditions, including economic sanctions and other government actions. In addition, the occurrence of global events, such as war, terrorism, environmental disasters, natural disasters and epidemics may also negatively affect the financial markets. As with any investment whose performance is tied to these markets, the value of an investment in the fund will fluctuate, which means that an investor could lose money over short or long periods.
ETF Risk. When a fund invests in an ETF, it will bear a proportionate share of the ETF’s expenses. In addition, lack of liquidity in the market for an ETF’s shares can result in its value being more volatile than the underlying portfolio of securities.
Structural Risk. The funds’ monthly income payments will be made from fund assets and will reduce the amount of assets available for investment by the fund. Even if a fund’s capital grows over time, such growth may be insufficient to enable the fund to maintain the amount of its targeted annual payout and targeted monthly income payments. A fund’s investment losses may reduce the amount of future cash income payments an investor will receive from the fund. The dollar amount of a fund’s monthly income payments could vary substantially from one year to the next and over time depending on several factors, including the performance of the financial markets in which the fund invests, the allocation of fund assets across different asset classes and investments, the performance of the fund’s investment strategies, and the amount and timing of prior distributions by the fund. It is also possible for payments to go down substantially from one year to the next and over time depending on the timing of an investor’s investments in the fund. Any redemptions will proportionately reduce the amount of future cash income payments to be received from the fund. There is no guarantee that the fund will make monthly income payments to its shareholders or, if made, that the fund’s monthly income payments to shareholders will remain at a fixed amount.
Direct Investment Risk. The funds may invest directly in cash, cash equivalents and equity and fixed-income securities, including money market securities to maintain their allocations. A fund’s direct investment in these securities is subject to the same or similar risks as an underlying fund’s investment in the same securities.
Underlying Fund Investment Risk. Before investing in the funds, investors should assess the risks associated with the underlying funds in which a fund may invest, which include any combination of the risks described below.
• Investment Risk. The funds may experience losses with respect to their investment in an underlying fund. Further, there is no guarantee that an underlying fund will be able to achieve its objective.
• Management Risk. Certain underlying funds are actively managed mutual funds. An underlying fund’s adviser applies its own investment techniques and risk analyses in making investment decisions for the fund, but there can be no guarantee that they will produce the desired results or cause the underlying fund to meet its objectives.
• Equity Risk. The prices of equity securities rise and fall daily. These price movements may result from factors affecting individual companies, industries or the securities market as a whole. In addition, equity markets tend to move in cycles, which may cause stock prices to fall over short or extended periods of time.
• Market Capitalization Risk. Securities issued by companies of different market capitalizations tend to go in and out of favor based on market and economic conditions. During a period when securities of a particular market capitalization fall behind other types of investments, an underlying fund’s performance could be impacted.
• Concentration Risk. To the extent that an underlying fund’s or the index’s portfolio is concentrated in the securities of issuers in a particular market, industry, group of industries, sector, country or asset class, the underlying fund may be adversely affected by the performance of those securities, may be subject to increased price volatility and may be more vulnerable to adverse economic, market, political, or regulatory occurrences affecting that market, industry, group of industries, sector, country or asset class.
• Fixed-Income Risk. Interest rates rise and fall over time, which will affect an underlying fund’s yield and share price. A change in a central bank’s monetary policy or economic conditions, among other things, may result in a change in interest rates. A rise in interest rates could cause an underlying fund’s share price to fall. The credit quality of a portfolio investment could also cause an underlying fund’s share price to fall. An underlying fund could lose money if the issuer or guarantor of a portfolio investment or the counterparty to a derivatives contract fails to make timely principal or interest payments or otherwise honor its obligations. Fixed-income securities may be paid off earlier or later than expected. Either situation could cause an
Schwab Monthly Income Funds | Annual Report
Schwab Monthly Income Funds
Financial Notes (continued)
3. Risk Factors (continued):
underlying fund to hold securities paying lower-than-market rates of interest, which could hurt the fund’s yield or share price. Below investment-grade bonds (junk bonds) involve greater credit risk, are more volatile, involve greater risk of price declines and may be more susceptible to economic downturns than investment-grade securities.
• Foreign Investment Risk. An underlying fund’s investments in securities of foreign issuers involve certain risks that may be greater than those associated with investments in securities of U.S. issuers. These include risks of adverse changes in foreign economic, political, regulatory and other conditions; changes in currency exchange rates or exchange control regulations (including limitations on currency movements and exchanges); the imposition of economic sanctions or other government restrictions; differing accounting, auditing, financial reporting and legal standards and practices; differing securities market structures; and higher transaction costs. These risks may negatively impact the value or liquidity of an underlying fund’s investments, and could impair the underlying fund’s ability to meet its investment objective or invest in accordance with its investment strategy. There is a risk that investments in securities denominated in, and/or receiving revenues in, foreign currencies will decline in value relative to the U.S. dollar.
• Derivatives Risk. An underlying fund’s use of derivative instruments involves risks different from, or possibly greater than, the risks associated with investing directly in securities and other traditional investments. An underlying fund’s use of derivatives could reduce the underlying fund’s performance, increase volatility, and could cause the underlying fund to lose more than the initial amount invested. In addition, investments in derivatives may involve leverage, which means a small percentage of assets invested in derivatives can have a disproportionately large impact on an underlying fund.
• Leverage Risk. Certain underlying fund transactions, such as derivatives transactions, short sales, reverse repurchase agreements, and mortgage dollar rolls, may give rise to a form of leverage and may expose an underlying fund to greater risk. Leverage tends to magnify the effect of any decrease or increase in the value of an underlying fund’s portfolio securities, which means even a small amount of leverage can have a disproportionately large impact on the fund.
• Money Market Fund Risk. A fund may invest in underlying money market funds that either seek to maintain a stable $1.00 net asset value (“stable share price money market funds”) or that have a share price that fluctuates (“variable share price money market funds”). Although an underlying stable share price money market fund seeks to maintain a stable $1.00 net asset value, it is possible to lose money by investing in such a money market fund. Because the share price of an underlying variable share price money market fund will fluctuate, when a fund sells the shares it owns they may be worth more or less than what the fund originally paid for them. In addition, neither type of money market fund is designed to offer capital appreciation. Certain underlying money market funds may impose a fee upon the sale of shares or may temporarily suspend the ability to sell shares if such fund’s liquidity falls below required minimums.
• Tracking Error Risk. Each underlying index fund seeks to track the performance of its respective index, although it may not be successful in doing so. The divergence between the performance of an underlying fund and its index, positive or negative, is called “tracking error.” Tracking error can be caused by many factors and it may be significant. If an underlying fund utilizes a sampling approach, it may not track the return of the index as well as it would if the underlying fund purchased all of the securities in the index.
• Liquidity Risk. An underlying fund may be unable to sell certain securities, such as illiquid securities, readily at a favorable time or price, or the underlying fund may have to sell them at a loss.
• Securities Lending Risk. Certain underlying funds engage in securities lending, which involves the risk of loss of rights in, or delay in recovery of, the loaned securities if the borrower fails to return the security loaned or becomes insolvent.
• Real Estate Investment Risk. An underlying fund in which the fund may invest may have a policy of concentrating its investments in real estate companies and companies related to the real estate industry. As such, an underlying fund is subject to risks associated with the direct ownership of real estate securities and the fund’s investment in such an underlying fund is subject to risks associated with the direct ownership of real estate securities and an investment in the underlying fund will be closely linked to the performance of the real estate markets. These risks include, among others, declines in the value of real estate; risks related to general and local economic conditions;possible lack of availability of mortgage funds or other limits to accessing the credit or capital markets; defaults by borrowers or tenants, particularly during an economic downturn; and changes in interest rates.
Schwab Monthly Income Funds | Annual Report
Schwab Monthly Income Funds
Financial Notes (continued)
3. Risk Factors (continued):
• Real Estate Investment Trusts (REITs) Risk. An underlying fund’s investments in REITs will be subject to the risks associated with the direct ownership of real estate, including fluctuations in the value of underlying properties, defaults by borrowers or tenants, access to capital, changes in interest rates and risks related to general or local economic conditions. REITs are also subject to certain additional risks, for example, REITs may have their investments in relatively few properties, a small geographic area or a single property type. In addition, REITs have their own expenses, and an underlying fund will bear a proportionate share of those expenses.
• Portfolio Turnover Risk. Certain of the underlying funds may buy and sell portfolio securities actively. If they do, their portfolio turnover rate and transaction costs will rise, which may lower the underlying fund’s performance and may increase the likelihood of capital gains distributions.
Please refer to the funds’ prospectus for a more complete description of the principal risks of investing in the funds.
4. Affiliates and Affiliated Transactions:
Investment Adviser
Charles Schwab Investment Management, Inc. dba Schwab Asset Management, a wholly owned subsidiary of The Charles Schwab Corporation, serves as each fund’s investment adviser and administrator pursuant to an Investment Advisory and Administration Agreement between the investment adviser and the trust. The investment adviser does not receive a fee for the services it performs for the funds. However, the investment adviser is entitled to receive an annual management fee from each of the affiliated Schwab Funds and/or Laudus Funds that serve as underlying funds.
Shareholder Servicing
The Board has adopted a Shareholder Servicing Plan (the Plan) on behalf of the funds. The Plan enables each fund to bear expenses relating to the provision by financial intermediaries, including Charles Schwab & Co., Inc., a broker-dealer affiliate of the investment adviser (together, service providers), of certain shareholder services to the current shareholders of the funds. The funds are not subject to any fees under the Plan.
Expense Limitation
The investment adviser and its affiliates have agreed with the funds, for so long as the investment adviser serves as the investment adviser to the funds, which may only be amended or terminated with the approval of the Board, to limit the total annual fund operating expenses charged, excluding interest, taxes and certain non-routine expenses to 0.00%.
The agreement to limit the funds’ total expenses charged is limited to each fund’s direct operating expenses and, therefore, does not apply to acquired fund fees and expenses, which are indirect expenses incurred by a fund through its investments in the underlying funds.
Investments in Affiliates
The funds may engage in certain transactions involving related parties. Pursuant to an exemptive order issued by the SEC, the funds may invest in other related funds. As of December 31, 2021, each Schwab Monthly Income Fund’s ownership percentages of other related funds’ shares are:
| UNDERLYING FUNDS | SCHWAB
MONTHLY INCOME FUND –
MODERATE PAYOUT | SCHWAB
MONTHLY INCOME FUND –
ENHANCED PAYOUT | SCHWAB
MONTHLY INCOME FUND –
MAXIMUM PAYOUT |
| Laudus International MarketMasters Fund | 0.4% | 0.6% | 0.3% |
| Schwab Dividend Equity Fund | 2.3% | 2.9% | 1.8% |
| Schwab Global Real Estate Fund | 1.2% | 1.5% | 1.0% |
| Schwab U.S. Aggregate Bond Index Fund | 0.5% | 1.2% | 1.6% |
| Schwab Variable Share Price Money Fund, Ultra Shares | 0.0%* | 0.0%* | 0.0%* |
Schwab Monthly Income Funds | Annual Report
Schwab Monthly Income Funds
Financial Notes (continued)
4. Affiliates and Affiliated Transactions (continued):
Interfund Borrowing and Lending
Pursuant to an exemptive order issued by the SEC, the funds may enter into interfund borrowing and lending transactions with other funds in the Fund Complex (for definition refer to the Trustees and Officers section). All loans are for temporary or emergency purposes and the interest rate to be charged will be the average of the overnight repurchase agreement rate and the short-term bank loan rate. All loans are subject to numerous conditions designed to ensure fair and equitable treatment of all participating funds. The interfund lending facility is subject to the oversight and periodic review by the Board. The funds had no interfund borrowing or lending activity during the period.
5. Board of Trustees:
The Board may include people who are officers and/or directors of the investment adviser or its affiliates. Federal securities law limits the percentage of such “interested persons” who may serve on a trust’s board, and the trust was in compliance with these limitations throughout the report period. The trust did not pay any of these interested persons for their services as trustees, but it did pay non-interested persons (independent trustees), as noted on each fund’s Statement of Operations. For information regarding the trustees, please refer to the Trustees and Officers table at the end of this report.
6. Borrowing from Banks:
During the period, the funds were participants with other funds in the Fund Complex in a joint, syndicated, committed $850 million line of credit (the Syndicated Credit Facility), which matured on September 30, 2021. On September 30, 2021, the Syndicated Credit Facility was amended to run for a new 364 day period with the line of credit amount remaining unchanged, maturing on September 29, 2022. Under the terms of the Syndicated Credit Facility, in addition to the interest charged on any borrowings by a fund, each fund paid a commitment fee of 0.15% per annum on the funds’ proportionate share of the unused portion of the Syndicated Credit Facility.
During the period, the funds were participants with other funds in the Fund Complex in a joint, unsecured, uncommitted $400 million line of credit (the Uncommitted Credit Facility), with State Street Bank and Trust Company, which matured on September 30, 2021. On September 30, 2021, the Uncommitted Credit Facility was amended to run for a new 364 day period with the line of credit amount remaining unchanged, maturing on September 29, 2022. Under the terms of the Uncommitted Credit Facility, each fund pays interest on the amount a fund borrows. There were no borrowings from either line of credit during the period.
The funds also have access to custodian overdraft facilities. A fund may have utilized the overdraft facility and incurred an interest expense, which is disclosed on each fund’s Statement of Operations, if any. The interest expense is determined based on a negotiated rate above the current Federal Funds Rate.
7. Purchases and Sales of Investment Securities:
For the period ended December 31, 2021, purchases and sales of securities (excluding short-term obligations) were as follows:
| | PURCHASES
OF SECURITIES | SALES
OF SECURITIES |
| Schwab Monthly Income Fund – Moderate Payout | $13,484,648 | $5,447,415 |
| Schwab Monthly Income Fund – Enhanced Payout | 29,354,216 | 18,874,693 |
| Schwab Monthly Income Fund – Maximum Payout | 30,260,291 | 27,972,455 |
Schwab Monthly Income Funds | Annual Report
Schwab Monthly Income Funds
Financial Notes (continued)
As of December 31, 2021, the tax basis cost of the funds’ investments and gross unrealized appreciation and depreciation were as follows:
| | TAX COST | GROSS UNREALIZED
APPRECIATION | GROSS UNREALIZED
DEPRECIATION | NET UNREALIZED
APPRECIATION
(DEPRECIATION) |
| Schwab Monthly Income Fund – Moderate Payout | $48,952,299 | $5,584,296 | ($1,286,387) | $4,297,909 |
| Schwab Monthly Income Fund – Enhanced Payout | 91,371,996 | 9,987,539 | (1,287,646) | 8,699,893 |
| Schwab Monthly Income Fund – Maximum Payout | 108,216,937 | 4,479,498 | (1,020,169) | 3,459,329 |
As of December 31, 2021, the components of distributable earnings on a tax basis were as follows:
| | UNDISTRIBUTED
ORDINARY
INCOME | UNDISTRIBUTED
LONG-TERM
CAPITAL GAINS | NET UNREALIZED
APPRECIATION
(DEPRECIATION)
ON INVESTMENTS | TOTAL |
| Schwab Monthly Income Fund – Moderate Payout | $93,554 | $2,117,929 | $4,297,909 | $6,509,392 |
| Schwab Monthly Income Fund – Enhanced Payout | 147,368 | 2,852,350 | 8,699,893 | 11,699,611 |
| Schwab Monthly Income Fund – Maximum Payout | 13,549 | 1,568,419 | 3,459,329 | 5,041,297 |
The primary difference between book basis and tax basis unrealized appreciation or unrealized depreciation of investments is the tax deferral of losses on wash sales. The tax cost of the funds’ investments, disclosed above, have been adjusted from their book amounts to reflect these unrealized appreciation or depreciation differences, as applicable.
The tax basis components of distributions paid during the current and prior fiscal years were as follows:
| | CURRENT FISCAL YEAR END DISTRIBUTIONS | PRIOR FISCAL YEAR END DISTRIBUTIONS |
| | ORDINARY
INCOME | LONG-TERM
CAPITAL
GAINS | ORDINARY
INCOME | LONG-TERM
CAPITAL
GAINS |
| Schwab Monthly Income Fund – Moderate Payout | $1,564,456 | $298,139 | $868,732 | $292,105 |
| Schwab Monthly Income Fund – Enhanced Payout | 2,767,784 | 1,096,013 | 1,819,998 | 854,804 |
| Schwab Monthly Income Fund – Maximum Payout | 2,738,360 | 649,342 | 1,763,366 | 58,751 |
Distributions paid to shareholders are based on net investment income and net realized gains determined on a tax basis, which may differ from net investment income and net realized gains for financial reporting purposes. These differences reflect the differing character of certain income items and net realized gains and losses for financial statement and tax purposes, and may result in reclassification among certain capital accounts on the financial statements.
Permanent book and tax basis differences may result in reclassifications between components of net assets as required. The adjustments will have no impact on net assets or the results of operations.
As of December 31, 2021, management has reviewed the tax positions for open periods (for federal purposes, three years from the date of filing and for state purposes, four years from the date of filing) as applicable to the funds, and has determined that no provision for income tax is required in the funds’ financial statements. The funds recognize interest and penalties, if any, related to unrecognized tax benefits as income tax expense in the Statement of Operations. During the fiscal year ended December 31, 2021, the funds did not incur any interest or penalties.
9. Subsequent Events:
Management has determined there are no subsequent events or transactions through the date the financial statements were issued that would have materially impacted the financial statements as presented.
Schwab Monthly Income Funds | Annual Report
Schwab Monthly Income Funds
Report of Independent Registered Public Accounting Firm
To the Board of Trustees of Schwab Capital Trust and Shareholders of Schwab Monthly Income Fund - Moderate Payout, Schwab Monthly Income Fund - Enhanced Payout, and Schwab Monthly Income Fund - Maximum Payout
Opinion on the Financial Statements and Financial Highlights
We have audited the accompanying statements of assets and liabilities, including the portfolio holdings, of Schwab Monthly Income Fund - Moderate Payout, Schwab Monthly Income Fund - Enhanced Payout, and Schwab Monthly Income Fund - Maximum Payout (the “Funds”), three of the funds constituting Schwab Capital Trust, as of December 31, 2021, and the related statements of operations for the year then ended, the statements of changes in net assets and the financial highlights for each of the two years in the period then ended, and the related notes. In our opinion, the financial statements and financial highlights present fairly, in all material respects, the financial position of each of the Funds as of December 31, 2021, the results of their operations for the year then ended, and the changes in their net assets and the financial highlights for each of the two years in the period then ended in conformity with accounting principles generally accepted in the United States of America. The financial highlights for each of the three years in the period ended December 31, 2019 were audited by other auditors, whose report, dated February 18, 2020, expressed an unqualified opinion on such financial highlights.
Basis for Opinion
These financial statements and financial highlights are the responsibility of the Funds’ management. Our responsibility is to express an opinion on the Funds’ financial statements and financial highlights based on our audits. We are a public accounting firm registered with the Public Company Accounting Oversight Board (United States) (PCAOB) and are required to be independent with respect to the Funds in accordance with the U.S. federal securities laws and the applicable rules and regulations of the Securities and Exchange Commission and the PCAOB.
We conducted our audits in accordance with the standards of the PCAOB. Those standards require that we plan and perform the audit to obtain reasonable assurance about whether the financial statements and financial highlights are free of material misstatement, whether due to error or fraud. The Funds are not required to have, nor were we engaged to perform, an audit of their internal control over financial reporting. As part of our audits, we are required to obtain an understanding of internal control over financial reporting but not for the purpose of expressing an opinion on the effectiveness of the Funds’ internal control over financial reporting. Accordingly, we express no such opinion.
Our audits included performing procedures to assess the risks of material misstatement of the financial statements and financial highlights, whether due to error or fraud, and performing procedures that respond to those risks. Such procedures included examining, on a test basis, evidence regarding the amounts and disclosures in the financial statements and financial highlights. Our audits also included evaluating the accounting principles used and significant estimates made by management, as well as evaluating the overall presentation of the financial statements and financial highlights. Our procedures included confirmation of securities owned as of December 31, 2021, by correspondence with the custodian and transfer agent. We believe that our audits provide a reasonable basis for our opinion.
Deloitte & Touche LLP
Denver, Colorado
February 17, 2022
We have served as the auditor of one or more investment companies in the Schwab Funds Complex since 2020.
Schwab Monthly Income Funds | Annual Report
Schwab Monthly Income Funds
Other Federal Tax Information (unaudited)
The funds may elect to pass on the benefits of the foreign tax credit to their shareholders for the fiscal year ended December 31, 2021. The foreign tax credit and the foreign source income amounts are as follows:
| | FOREIGN TAX CREDIT | FOREIGN SOURCE INCOME |
| Schwab Monthly Income Fund – Moderate Payout | $26,428 | $166,933 |
| Schwab Monthly Income Fund – Enhanced Payout | 34,991 | 224,979 |
| Schwab Monthly Income Fund – Maximum Payout | 22,254 | 143,281 |
For corporate shareholders, the following percentage of the funds’ dividend distributions paid during the fiscal year ended December 31, 2021, qualify for the corporate dividends received deduction:
| | |
| Schwab Monthly Income Fund – Moderate Payout | 24.15% |
| Schwab Monthly Income Fund – Enhanced Payout | 18.36% |
| Schwab Monthly Income Fund – Maximum Payout | 10.89% |
For the fiscal year ended December 31, 2021, the funds designate the following amounts of the dividend distributions as qualified dividends for the purpose of the maximum rate under section 1(h)(11) of the Internal Revenue Code. Shareholders will be notified in January 2022 via IRS Form 1099 of the amounts for use in preparing their 2021 income tax return.
| Schwab Monthly Income Fund – Moderate Payout | $485,356 |
| Schwab Monthly Income Fund – Enhanced Payout | 651,481 |
| Schwab Monthly Income Fund – Maximum Payout | 387,572 |
Under section 852(b)(3)(C) of the Internal Revenue Code, the funds hereby designate the following amounts as long-term capital gain dividends for the fiscal year ended December 31, 2021:
| Schwab Monthly Income Fund – Moderate Payout | $298,139 |
| Schwab Monthly Income Fund – Enhanced Payout | 1,096,013 |
| Schwab Monthly Income Fund – Maximum Payout | 649,342 |
For the fiscal year ended December 31, 2021, the funds designate the following amounts as dividends eligible for the 20% qualified business income deduction under section 199A of the Internal Revenue Code. Shareholders will be notified in January 2022 via IRS Form 1099 of the amounts for use in preparing their 2021 income tax return.
| Schwab Monthly Income Fund – Moderate Payout | $91,368 |
| Schwab Monthly Income Fund – Enhanced Payout | 125,032 |
| Schwab Monthly Income Fund – Maximum Payout | 77,618 |
Schwab Monthly Income Funds | Annual Report
Schwab Monthly Income Funds
Liquidity Risk Management Program (Unaudited)
The Funds have adopted and implemented a liquidity risk management program (the “program”) as required by Rule 22e-4 under the Investment Company Act of 1940, as amended. The Funds’ Board of Trustees (the “Board”) has designated the Funds’ investment adviser, Charles Schwab Investment Management, Inc., dba Schwab Asset Management, as the administrator of the program. Personnel of the investment adviser or its affiliates conduct the day-to-day operation of the program.
Under the program, the investment adviser manages a Fund’s liquidity risk, which is the risk that the Fund could not meet shareholder redemption requests without significant dilution of remaining shareholders’ interests in the Fund. The program is reasonably designed to assess and manage a Fund’s liquidity risk, taking into consideration the Fund’s investment strategy and the liquidity of its portfolio investments during normal and reasonably foreseeable stressed conditions; its historical redemption history and shareholder concentrations; and its cash holdings and access to other funding sources, including the custodian overdraft facility and lines of credit. The investment adviser’s process of determining the degree of liquidity of each Fund’s investments is supported by third-party liquidity assessment vendors.
The Funds’ Board reviewed a report at its meeting held on September 20, 2021 prepared by the investment adviser regarding the operation and effectiveness of the program for the period June 1, 2020, through May 31, 2021, which included individual Fund liquidity risk metrics. No significant liquidity events impacting any of the Funds were noted in the report. In addition, the investment adviser provided its assessment that the program had been operating effectively in managing each Fund’s liquidity risk.
Schwab Monthly Income Funds | Annual Report
Schwab Monthly Income Funds
Trustees and Officers
The tables below give information about the trustees and officers of Schwab Capital Trust, which includes the funds covered in this report. The “Fund Complex” includes The Charles Schwab Family of Funds, Schwab Capital Trust, Schwab Investments, Schwab Annuity Portfolios, Schwab Strategic Trust and Laudus Trust. The Fund Complex includes 103 funds.
The address for all trustees and officers is 211 Main Street, San Francisco, CA 94105. You can find more information about the trustees and officers in the funds’ Statement of Additional Information, which is available free by calling 1-877-824-5615.
| Independent Trustees |
Name, Year of Birth, and
Position(s) with the trust
(Terms of office, and
length of Time Served1) | Principal Occupations
During the Past Five Years | Number of
Portfolios in
Fund Complex
Overseen by
the Trustee | Other Directorships |
Robert W. Burns
1959
Trustee
(Trustee of Schwab Strategic Trust since 2009; The Charles Schwab Family of Funds, Schwab Investments, Schwab Capital Trust, Schwab Annuity Portfolios and Laudus Trust since 2016) | Retired/Private Investor (Jan. 2009 – present). Formerly, Managing Director, Pacific Investment Management Company, LLC (PIMCO) (investment management firm) and President, PIMCO Funds. | 103 | None |
Nancy F. Heller
1956
Trustee
(Trustee of The Charles Schwab Family of Funds, Schwab Investments, Schwab Capital Trust, Schwab Annuity Portfolios, Schwab Strategic Trust and Laudus Trust since 2018) | Retired. President and Chairman (2014 – 2016), TIAA Charitable (financial services); Senior Managing Director (2003 – 2016), TIAA (financial services). | 103 | None |
David L. Mahoney
1954
Trustee
(Trustee of The Charles Schwab Family of Funds, Schwab Investments, Schwab Capital Trust, Schwab Annuity Portfolios and Laudus Trust since 2011; Schwab Strategic Trust since 2016) | Private Investor. | 103 | Director (2004 – present), Corcept Therapeutics Incorporated
Director (2009 – 2021), Adamas Pharmaceuticals, Inc.
Director (2003 – 2019), Symantec Corporation |
Jane P. Moncreiff
1961
Trustee
(Trustee of The Charles Schwab Family of Funds, Schwab Investments, Schwab Capital Trust, Schwab Annuity Portfolios, Schwab Strategic Trust and Laudus Trust since 2019) | Consultant (2018 – present), Fulham Advisers LLC (management consulting); Chief Investment Officer (2009 – 2017), CareGroup Healthcare System, Inc. (healthcare). | 103 | None |
Kiran M. Patel
1948
Trustee
(Trustee of The Charles Schwab Family of Funds, Schwab Investments, Schwab Capital Trust, Schwab Annuity Portfolios and Laudus Trust since 2011; Schwab Strategic Trust since 2016) | Retired. Executive Vice President and General Manager of Small Business Group (Dec. 2008 – Sept. 2013), Intuit, Inc. (financial software and services firm for consumers and small businesses). | 103 | Director (2008 – present), KLA-Tencor Corporation |
Schwab Monthly Income Funds | Annual Report
Schwab Monthly Income Funds
| Independent Trustees (continued) |
Name, Year of Birth, and
Position(s) with the trust
(Terms of office, and
length of Time Served1) | Principal Occupations
During the Past Five Years | Number of
Portfolios in
Fund Complex
Overseen by
the Trustee | Other Directorships |
Kimberly S. Patmore
1956
Trustee
(Trustee of The Charles Schwab Family of Funds, Schwab Investments, Schwab Capital Trust, Schwab Annuity Portfolios, Schwab Strategic Trust and Laudus Trust since 2016) | Consultant (2008 – present), Patmore Management Consulting (management consulting). | 103 | None |
J. Derek Penn
1957
Trustee
(Trustee of The Charles Schwab Family of Funds, Schwab Investments, Schwab Capital Trust, Schwab Annuity Portfolios, Schwab Strategic Trust and Laudus Trust since 2021) | Head of Equity Sales and Trading (2006 – 2018), BNY Mellon (financial services). | 103 | None |
| Interested Trustees |
Name, Year of Birth, and
Position(s) with the trust
(Terms of office, and
length of Time Served1) | Principal Occupations
During the Past Five Years | Number of
Portfolios in
Fund Complex
Overseen by
the Trustee | Other Directorships |
Walter W. Bettinger II2
1960
Chairman and Trustee
(Trustee of The Charles Schwab Family of Funds, Schwab Investments, Schwab Capital Trust and Schwab Annuity Portfolios since 2008; Schwab Strategic Trust since 2009; Laudus Trust since 2010) | Director and Chief Executive Officer (Oct. 2008 – present) and President (Oct. 2008 – Oct. 2021), The Charles Schwab Corporation; President and Chief Executive Officer (Oct. 2008 – Oct. 2021) and Director (May 2008 – Oct. 2021), Charles Schwab & Co., Inc.; Director (Apr. 2006 – present), Charles Schwab Bank, SSB; Director (Nov. 2017 – present), Charles Schwab Premier Bank, SSB; Director (July 2019 – present), Charles Schwab Trust Bank; Director (May 2008 – present) and President and Chief Executive Officer (Aug. 2017 – present), Schwab Holdings, Inc.; Director (Oct. 2020 – present), TD Ameritrade Holding Corporation; Director (July 2016 – Oct. 2021), Charles Schwab Investment Management, Inc. | 103 | Director (2008 – present), The Charles Schwab Corporation |
Joseph R. Martinetto2
1962
Trustee
(Trustee of The Charles Schwab Family of Funds, Schwab Investments, Schwab Capital Trust, Schwab Annuity Portfolios, Schwab Strategic Trust and Laudus Trust since 2016) | Chief Operating Officer (Feb. 2018 – present) and Senior Executive Vice President (July 2015 – Feb. 2018), The Charles Schwab Corporation; Senior Executive Vice President (July 2015 – present), Charles Schwab & Co., Inc.; Chief Financial Officer (July 2015 – Aug. 2017) and Executive Vice President and Chief Financial Officer (May 2007 – July 2015), The Charles Schwab Corporation and Charles Schwab & Co., Inc.; Director (May 2007 – present), Charles Schwab & Co., Inc.; Director (Apr. 2010 – present) and Chief Executive Officer (July 2013 – Apr. 2015), Charles Schwab Bank, SSB; Director (Nov. 2017 – present), Charles Schwab Premier Bank, SSB; Director (May 2007 – present), Chief Financial Officer (May 2007 – Aug. 2017), Senior Executive Vice President (Feb. 2016 – present), and Executive Vice President (May 2007 – Feb. 2016), Schwab Holdings, Inc.; Director (Oct. 2020 – present), TD Ameritrade Holding Corporation. | 103 | None |
Schwab Monthly Income Funds | Annual Report
Schwab Monthly Income Funds
| Officers of the Trust |
Name, Year of Birth, and Position(s) with the trust
(Terms of office, and length of Time Served3) | Principal Occupations During the Past Five Years |
Jonathan de St. Paer
1973
President and Chief Executive Officer
(Officer of The Charles Schwab Family of Funds, Schwab Investments, Schwab Capital Trust, Schwab Annuity Portfolios, Schwab Strategic Trust and Laudus Trust since 2018) | Director (Apr. 2019 – present), President (Oct. 2018 – present), Chief Operating Officer (Jan. 2020 – present), and Chief Executive Officer (Apr. 2019 – Nov. 2019), Charles Schwab Investment Management, Inc.; Senior Vice President (June 2020 – present) and Chief Operating Officer (Jan. 2020 – present), Charles Schwab Investment Advisory, Inc.; Chief Executive Officer (Apr. 2019 – present), President (Nov. 2018 – present) and Trustee (Apr. 2019 – Dec. 2020), Schwab Funds, Laudus Trust and Schwab ETFs; Director (Apr. 2019 – present), Charles Schwab Worldwide Funds plc and Charles Schwab Asset Management (Ireland) Limited; Senior Vice President (Apr. 2019 – present), Senior Vice President – Strategy and Product Development (CSIM) (Jan. 2014 – Mar. 2019), and Vice President (Jan. 2009 – Dec. 2013), Charles Schwab & Co., Inc. |
Mark Fischer
1970
Treasurer, Chief Financial Officer and Chief Operating Officer
(Officer of The Charles Schwab Family of Funds, Schwab Investments, Schwab Capital Trust, Schwab Annuity Portfolios, Schwab Strategic Trust and Laudus Trust since 2013) | Treasurer and Chief Financial Officer (Jan. 2016 – present) and Chief Operating Officer (Dec. 2020 – present), Schwab Funds, Laudus Trust and Schwab ETFs; Assistant Treasurer (Dec. 2013 – Dec. 2015), Schwab Funds and Laudus Trust; Assistant Treasurer (Nov. 2013 – Dec. 2015), Schwab ETFs; Chief Financial Officer (Mar. 2020 – present) and Vice President (Oct. 2013 – present), Charles Schwab Investment Management, Inc.; Executive Director (Apr. 2011 – Sept. 2013), J.P. Morgan Investor Services; Assistant Treasurer (May 2005 – Mar. 2011), Massachusetts Financial Service Investment Management. |
Omar Aguilar
1970
Vice President and Chief Investment Officer
(Officer of The Charles Schwab Family of Funds, Schwab Investments, Schwab Capital Trust, Schwab Annuity Portfolios, Schwab Strategic Trust and Laudus Trust since 2011) | Chief Executive Officer (Jan. 2022 – present) and Chief Investment Officer (Apr. 2011 – present), Senior Vice President (Apr. 2011 – Dec. 2021), Charles Schwab Investment Management, Inc.; Vice President and Chief Investment Officer (June 2011 – present), Schwab Funds, Laudus Trust and Schwab ETFs; Head of the Portfolio Management Group and Vice President of Portfolio Management (May 2009 – Apr. 2011), Financial Engines, Inc. (investment management firm); Head of Quantitative Equity (July 2004 – Jan. 2009), ING Investment Management. |
Brett Wander
1961
Vice President and Chief Investment Officer
(Officer of The Charles Schwab Family of Funds, Schwab Investments, Schwab Capital Trust, Schwab Annuity Portfolios, Schwab Strategic Trust and Laudus Trust since 2011) | Senior Vice President and Chief Investment Officer (Apr. 2011 – present), Charles Schwab Investment Management, Inc.; Vice President and Chief Investment Officer (June 2011 – present), Schwab Funds, Laudus Trust and Schwab ETFs; Senior Managing Director and Global Head of Active Fixed-Income Strategies (Jan. 2008 – Oct. 2010), State Street Global Advisors; Director of Alpha Strategies (Apr. 2006 – Jan. 2008), Loomis, Sayles & Company (investment management firm). |
William P. McMahon, Jr.
1972
Vice President and Chief Investment Officer
(Officer of The Charles Schwab Family of Funds, Schwab Investments, Schwab Capital Trust, Schwab Annuity Portfolios, Schwab Strategic Trust and Laudus Trust since 2021) | Senior Vice President and Chief Investment Officer (Jan. 2020 – present), Charles Schwab Investment Management, Inc.; Vice President and Chief Investment Officer (June 2021 – present), Schwab Funds, Laudus Trust and Schwab ETFs; Senior Vice President and Chief Investment Officer – ThomasPartners Strategies (Apr. 2018 – Dec. 2019), Charles Schwab Investment Advisory, Inc.; Senior Vice President and Chief Investment Officer (May 2001 – Apr. 2018), ThomasPartners, Inc. |
Catherine MacGregor
1964
Chief Legal Officer and Secretary, Schwab Funds and Schwab ETFs
Chief Legal Officer, Vice President and Clerk, Laudus Trust
(Officer of The Charles Schwab Family of Funds, Schwab Investments, Schwab Capital Trust, Schwab Annuity Portfolios and Laudus Trust since 2005; Schwab Strategic Trust since 2009) | Vice President (July 2005 – present), Charles Schwab & Co., Inc.; Vice President (Sept. 2005 – present), Charles Schwab Investment Management, Inc.; Vice President (Dec. 2005 – present) and Chief Legal Officer and Clerk (Mar. 2007 – present), Laudus Trust; Chief Legal Officer and Secretary (Oct. 2021 – present), Vice President (Nov. 2005 – Oct. 2021) and Assistant Secretary (June 2007 – Oct. 2021), Schwab Funds; Chief Legal Officer and Secretary (Oct. 2021 – present), Vice President and Assistant Secretary (Oct. 2009 – Oct. 2021), Schwab ETFs. |
| 1 | Each Trustee shall hold office until the election and qualification of his or her successor, or until he or she dies, resigns or is removed. The retirement policy requires that each independent trustee retire by December 31 of the year in which the Trustee turns 74 or the Trustee’s twentieth year of service as an independent trustee on any trust in the Fund Complex, whichever occurs first. |
| 2 | Mr. Bettinger and Mr. Martinetto are Interested Trustees. Mr. Bettinger is an Interested Trustee because he owns stock of The Charles Schwab Corporation (CSC), the parent company of Charles Schwab Investment Management, Inc., the investment adviser for the trusts in the Fund Complex, and is an employee of Charles Schwab & Co., Inc. (Schwab), the principal underwriter for The Charles Schwab Family of Funds, Schwab Investments, Schwab Capital Trust, Schwab Annuity Portfolios and Laudus Trust. Mr. Martinetto is an Interested Trustee because he owns stock of CSC and is an employee and director of Schwab. |
| 3 | The President, Treasurer and Secretary/Clerk hold office until their respective successors are chosen and qualified or until he or she sooner dies, resigns, is removed or becomes disqualified. Each of the other officers serves at the pleasure of the Board. |
Schwab Monthly Income Funds | Annual Report
Schwab Monthly Income Funds
asset allocation The practice of dividing a portfolio among different asset classes, with each asset class assigned a particular percentage.
asset class A group of securities with similar structure and basic characteristics. Stocks, bonds and cash are the three main examples of asset classes.
Bloomberg US Aggregate Bond Index An index that is a broad-based benchmark measuring the performance of the U.S. investment grade, taxable bond market, including U.S. Treasuries, government-related and corporate bonds, mortgage pass-through securities, commercial mortgage-backed securities, and asset-backed securities that are publicly available for sale in the United States. To be eligible for inclusion in the index, securities must be fixed rate, non-convertible, U.S. dollar-denominated with at least $300 million or more of outstanding face value and have one or more years remaining to maturity. The index excludes certain types of securities, including tax-exempt state and local government series bonds, structured notes embedded with swaps or other special features, private placements, floating rate securities, inflation-linked bonds and Eurobonds. The index is market capitalization weighted and the securities in the index are updated on the last business day of each month.
Bloomberg US Intermediate Aggregate Bond Index An index that represents securities that are SEC-registered, taxable, and dollar denominated. The index covers the U.S. investment grade fixed rate bond market, with index components for government and corporate securities, mortgage pass-through securities, and asset-backed securities.
Bloomberg US Treasury Bills 1–3 Month Index An index that includes all publicly issued zero-coupon U.S. Treasury Bills that have a remaining maturity of less than 3 months but more than 1 month, are rated investment grade and have $300 million or more of outstanding face value. It excludes zero-coupon STRIPS.
bond A security representing a loan from the investor to the issuer. A bond typically pays interest at a fixed rate (the coupon rate) until a specified date (the maturity date), at which time the issuer returns the money borrowed (principal or face value) to the bondholder. Because of their structure, bonds are sometimes called “fixed-income securities” or “debt securities.”
An individual bond is subject to the credit risk of the issuer. Changes in interest rates can affect a bond’s market value prior to call or maturity. There is no guarantee that a bond’s yield to call or maturity will provide a positive return over the rate of inflation.
bond fund A bond fund is subject to the same credit, interest rate, and inflation risks as bonds. In addition, a bond fund incurs ongoing fees and expenses. A bond fund’s net asset value will fluctuate with the price of the underlying bonds and the portfolio turnover activity; return of principal is not guaranteed.
cap, capitalization See “market cap.”
capital gain, capital loss The difference between the amount paid for an investment and its value at a later time. If the investment has been sold, the capital gain or loss is considered a realized gain or loss. If the investment is still held, the gain or loss is still “on paper” and is considered unrealized.
Enhanced Payout Composite Index A custom blended index developed by Schwab Asset Management based on a comparable portfolio asset allocation. Effective January 29, 2019, the Enhanced Payout Composite Index is composed of 19.5% S&P 500 Index, 8.1% MSCI EAFE Index (Net), 4.9% FTSE EPRA Nareit Global Index (Net),
65.5% Bloomberg US Aggregate Bond Index, and 2.0% Bloomberg US Treasury Bills 1-3 Month Index. From April 1, 2013 through January 28, 2019, the Enhanced Payout Composite Index was composed of 19.5% S&P 500 Index, 8.1% MSCI EAFE Index (Net), 4.9% FTSE EPRA Nareit Global Index (Net), 39.3% Bloomberg US Aggregate Bond Index, 26.2% Bloomberg US Intermediate Aggregate Bond Index, and 2.0% Bloomberg US Treasury Bills 1–3 Month Index. Prior to April 1, 2013, the Enhanced Payout Composite Index was composed of 25% S&P 500 Index and 75% Bloomberg US Aggregate Bond Index. Percentages listed may not total to 100% due to rounding.
expense ratio The amount that is taken from a mutual fund’s assets each year to cover the fund’s operating expenses. An expense ratio of 0.50% means that a fund’s expenses amount to half of one percent of its average net assets a year.
FTSE EPRA Nareit Global Index (Net) An index that provides a diverse representation of publicly traded equity real estate investment trusts (REITs) and listed property companies worldwide. The index constituents are free-float adjusted, and screened on liquidity, size and revenue. The index is comprised of countries in developed and emerging markets. The Net of Tax Index is calculated based on the maximum withholding tax rates applicable to dividends received by institutional investors who are not resident in the same country as the remitting company and who do not benefit from double taxation treaties.
FTSE non-US Dollar World Government Bond Index A market capitalization index that measures the total rate of return performance for the government bonds of 22 countries, excluding the U.S., with a remaining maturity of at least 1 year.
market cap, market capitalization The value of a company as determined by the total value of all shares of its stock outstanding.
Maximum Payout Composite Index A custom blended index developed by Schwab Asset Management based on a comparable portfolio asset allocation. Effective January 29, 2019, the Maximum Payout Composite Index is composed of 10.5% S&P 500 Index, 4.4% MSCI EAFE Index (Net), 2.6% FTSE EPRA Nareit Global Index (Net), 80.5% Bloomberg US Aggregate Bond Index, and 2.0% Bloomberg US Treasury Bills 1-3 Month Index. From April 1, 2013 through January 28, 2019, the Maximum Payout Composite Index was composed of 10.5% S&P 500 Index, 4.4% MSCI EAFE Index (Net), 2.6% FTSE EPRA Nareit Global Index (Net), 48.3% Bloomberg US Aggregate Bond Index, 32.2% Bloomberg US Intermediate Aggregate Bond Index, and 2.0% Bloomberg US Treasury Bills 1–3 Month Index. Prior to April 1, 2013, the Maximum Payout Composite Index was composed of 10% S&P 500 Index and 90% Bloomberg US Aggregate Bond Index. Percentages listed may not total to 100% due to rounding.
Moderate Payout Composite Index A custom blended index developed by Schwab Asset Management based on a comparable portfolio asset allocation. Effective January 29, 2019, the Moderate Payout Composite Index is composed of 28.5% S&P 500 Index, 11.9% MSCI EAFE Index (Net), 7.1% FTSE EPRA Nareit Global Index (Net), 50.5% Bloomberg US Aggregate Bond Index, and 2.0% Bloomberg US Treasury Bills 1-3 Month Index. From April 1, 2013 through January 28, 2019, the Moderate Payout Composite Index was composed of 28.5% S&P 500 Index, 11.9% MSCI EAFE Index (Net), 7.1% FTSE EPRA Nareit Global Index (Net), 30.3% Bloomberg US Aggregate Bond Index, 20.2% Bloomberg US Intermediate Aggregate Bond Index, and 2.0%
Schwab Monthly Income Funds | Annual Report
Schwab Monthly Income Funds
Bloomberg US Treasury Bills 1-3 Month Index. Prior to April 1, 2013, the Moderate Payout Composite Index was composed of 40% S&P 500 Index and 60% Bloomberg US Aggregate Bond Index. Percentages listed may not total to 100% due to rounding.
MSCI EAFE Index (Net) A free float-adjusted market capitalization index that is designed to measure the equity market performance of developed markets in Europe, Australasia, and the Far East. The Net version of the index reflects reinvested dividends net of withholding taxes, but reflects no deductions for expenses or other taxes; returns are calculated applying dividend withholding rates applicable to non-resident persons who do not benefit from double taxation treaties.
MSCI Emerging Markets Index (Net) A free float-adjusted market capitalization weighted index that is designed to measure equity market performance in the global emerging markets. This series approximates the minimum possible dividend reinvestment. The returns are calculated applying dividend withholding rates applicable to non-resident persons who do not benefit from double taxation treaties.
net asset value (NAV) The value of one share of a mutual fund. NAV is calculated by taking the fund’s total assets, subtracting liabilities, and dividing by the number of shares outstanding.
outstanding shares, shares outstanding When speaking of a company or mutual fund, indicates all shares currently held by investors.
price-to-book ratio (P/B) The market price of a company’s stock compared with its “book value.” A mutual fund’s P/B is the weighted average of the P/B of all stocks in the fund’s portfolio.
price-to-earnings ratio (P/E) The market price of a company’s stock compared with earnings over the past year. A mutual fund’s P/E is the weighted average of the P/E of all stocks in the fund’s portfolio.
return on equity (ROE) The average yearly rate of return for each dollar of investors’ money, measured over the past five years.
Russell 2000 Index An index that measures the performance of the 2,000 smallest companies in the Russell 3000 Index. The Russell 3000 Index measures the performance of the largest 3,000 U.S. companies representing approximately 98% of the investable U.S. equity market.
S&P 500 Index An index that is designed to measure the performance of 500 leading publicly traded companies from a broad range of industries.
stock A share of ownership, or equity, in the issuing company.
total return The percentage that an investor would have earned or lost on an investment in the fund assuming dividends and distributions were reinvested.
12-Month Distribution Yield reflects the fund’s monthly ordinary income distributions for the last 12 months divided by the fund’s Net Asset Value as of the end of the reporting period. Distribution yield does not include capital gains distributions.
weighted average For mutual funds, an average that gives the same weight to each security as the security represents in the fund’s portfolio.
yield The income paid out by an investment, expressed as a percentage of the investment’s market value.
Schwab Monthly Income Funds | Annual Report
Schwab Monthly Income Funds
Schwab Asset Management
With a straightforward lineup of core products and solutions for building the foundation of a portfolio, Schwab Asset Management advocates for investors of all sizes with a steadfast focus on lowering costs and reducing unnecessary complexity. The list below shows all currently available Schwab Funds®.
Investors should carefully consider information contained in the prospectus, or if available, the summary prospectus, including investment objectives, risks, charges and expenses before investing. Please call 1-877-824-5615 for a prospectus for any Schwab Fund. Please read the prospectus carefully before you invest. This report must be preceded or accompanied by a current prospectus.
Proxy Voting Policies, Procedures and Results
A description of the proxy voting policies and procedures used to determine how to vote proxies on behalf of the funds is available without charge, upon request, by visiting the Schwab Funds’ website at www.schwabassetmanagement.com/schwabfunds_prospectus, the SEC’s website at www.sec.gov, or by contacting Schwab Funds at 1-877-824-5615.
Information regarding how a fund voted proxies relating to portfolio securities during the most recent twelve-month period ended June 30 is available, without charge, by visiting the fund’s website at www.schwabassetmanagement.com/schwabfunds_prospectus or the SEC’s website at www.sec.gov.
Equity Funds
Schwab Core Equity Fund
Schwab Dividend Equity Fund
Schwab Large-Cap Growth Fund
Schwab Small-Cap Equity Fund
Schwab Health Care Fund
Schwab International Core Equity Fund
Schwab International Opportunities Fund
Schwab Select Large Cap Growth Fund
Schwab Fundamental US Large Company Index Fund
Schwab Fundamental US Small Company Index Fund
Schwab Fundamental International Large Company Index Fund
Schwab Fundamental International Small Company Index Fund
Schwab Fundamental Emerging Markets Large Company Index Fund
Schwab Fundamental Global Real Estate Index Fund
Schwab Global Real Estate Fund
Schwab S&P 500 Index Fund
Schwab 1000 Index® Fund
Schwab Small-Cap Index Fund®
Schwab Total Stock Market Index Fund®
Schwab U.S. Large-Cap Growth Index Fund
Schwab U.S. Large-Cap Value Index Fund
Schwab U.S. Mid-Cap Index Fund
Schwab International Index Fund®
Asset Allocation Funds
Schwab Balanced Fund
Schwab MarketTrack Portfolios®
Schwab Target Funds
Schwab Target Index Funds
Schwab Monthly Income Funds
Bond Funds
Schwab Treasury Inflation Protected Securities Index Fund
Schwab U.S. Aggregate Bond Index Fund
Schwab Short-Term Bond Index Fund
Schwab Tax-Free Bond Fund1
Schwab California Tax-Free Bond Fund1
Schwab Opportunistic Municipal Bond Fund
Schwab Money Funds2
Schwab provides a broad choice of taxable and tax-exempt money market funds for both retail and institutional client types.
Investment Adviser
Charles Schwab Investment Management, Inc., dba Schwab Asset Management
211 Main Street, San Francisco, CA 94105
Funds
Schwab Funds
1-877-824-5615
© 2022 Charles Schwab & Co., Inc. All rights reserved.
Member SIPC®
Printed on recycled paper.
| ¹ | State, local, and the Federal Alternative Minimum Tax may apply. Capital gains are not exempt from Federal Taxation. |
| ² | You could lose money by investing in the Schwab Money Funds. All Schwab Money Funds with the exception of Schwab Variable Share Price Money Fund seek to preserve the value of your investment at $1.00 per share, but cannot guarantee they will do so. Because the share price of Schwab Variable Share Price Money Fund will fluctuate, when you sell your shares they may be worth more or less than what you originally paid for them. All Schwab Money Funds with the exception of Schwab Government Money Fund, Schwab Retirement Government Money Fund, Schwab U.S. Treasury Money Fund, Schwab Treasury Obligations Money Fund and Schwab Government Money Market Portfolio may impose a fee upon the sale of your shares or may temporarily suspend your ability to sell shares if the Fund’s liquidity falls below required minimums because of market conditions or other factors. An investment in the Schwab Money Funds is not insured or guaranteed by the Federal Deposit Insurance Corporation or any other government agency. The Schwab Money Funds’ sponsor has no legal obligation to provide financial support to the Funds, and you should not expect that the sponsor will provide financial support to the Funds at any time. |
This page is intentionally left blank.
Item 2: Code of Ethics.
| (a) | Registrant has adopted a code of ethics that applies to its principal executive officer, principal financial officer, and any other persons who perform a similar function, regardless of whether these individuals are employed by Registrant or a third party. |
| (c) | During the period covered by the report, no amendments were made to the provisions of this code of ethics. |
| (d) | During the period covered by the report, Registrant did not grant any waivers, including implicit waivers, from the provisions of this code of ethics. |
(f)(1) Registrant has filed this code of ethics as an exhibit pursuant to Item 13(a)(1) of Form N-CSR.
Item 3: Audit Committee Financial Expert.
Registrant’s Board of Trustees has determined that Kiran M. Patel, Kimberly S. Patmore and J. Derek Penn, each currently serving on its audit, compliance and valuation committee, are each an “audit committee financial expert,” as such term is defined in Item 3 of Form N-CSR. Each member of Registrant’s audit, compliance and valuation committee is “independent” under the standards set forth in Item 3 of Form N-CSR.
The designation of each of Mr. Patel, Ms. Patmore and Mr. Penn as an “audit committee financial expert” pursuant to Item 3 of Form N-CSR does not (i) impose upon such individual any duties, obligations, or liability that are greater than the duties, obligations and liability imposed upon such individual as a member of Registrant’s audit, compliance and valuation committee or Board of Trustees in the absence of such designation; and (ii) affect the duties, obligations or liability of any other member of Registrant’s audit, compliance and valuation committee or Board of Trustees.
Item 4: Principal Accountant Fees and Services.
Registrant is composed of fifty-two operational series. Three series have a fiscal year-end of December 31, whose annual financial statements are reported in Item 1, one series has a fiscal year-end of the last day of February, twelve series have a fiscal year-end of March 31, and thirty-six series have a fiscal year-end of October 31. Principal accountant fees disclosed in Items 4(a)-(d) and 4(g) include fees billed for services rendered to the fifty-two operational series during 2021/2022 and the fifty-one operational series during 2020/2021, based on their respective 2021/2022 and 2020/2021 fiscal years, as applicable.
The following table presents fees billed by the principal accountant in each of the last two fiscal years for the services rendered to the funds:
| | | | | | | | | | | | | | |
(a) Audit Fees | | (b) Audit-Related Fees1 | | (c) Tax Fees2 | | (d) All Other Fees |
Fiscal Year
2021/2022 | | Fiscal Year 2020/2021 | | Fiscal Year
2021/2022 | | Fiscal Year
2020/2021 | | Fiscal Year
2021/2022 | | Fiscal Year
2020/2021 | | Fiscal Year
2021/2022 | | Fiscal Year
2020/2021 |
$1,187,075 | | $1,203,450 | | $96,000 | | $90,000 | | $161,200 | | $158,100 | | $0 | | $0 |
| 1 | The nature of the services includes assurance and related services reasonably related to the performance of the audit of financial statements not included in Audit Fees. |
| 2 | The nature of the services includes tax compliance, tax advice and tax planning. |
| | (e) (1) | Registrant’s audit, compliance and valuation committee does not have pre-approval policies and procedures as described in paragraph (c)(7) of Rule 2-01 of Regulation S-X. |
| | (2) | There were no services described in each of paragraphs (b) through (d) above (including services required to be approved by Registrant’s audit, compliance and valuation committee pursuant to paragraph (c)(7)(ii) of Rule 2-01 of Regulation S-X) that were approved by Registrant’s audit, compliance and valuation committee pursuant to paragraph (c)(7)(i)(C) of Rule 2-01 of Regulation S-X. |
| (g) | Below are the aggregate non-audit fees billed in each of the last two fiscal years by Registrant’s principal accountant for services rendered to Registrant, to Registrant’s investment adviser, and to any entity controlling, controlled by, or under common control with Registrant’s investment adviser that provides ongoing services to Registrant. |
| | | | |
2021: $3,088,431 | | 2020: $ | 3,577,864 | |
| (h) | During the past fiscal year, all non-audit services provided by Registrant’s principal accountant to either Registrant’s investment adviser or to any entity controlling, controlled by, or under common control with Registrant’s investment adviser that provides ongoing services to Registrant were pre-approved. Included in the audit, compliance and valuation committee’s pre-approval was the review and consideration as to whether the provision of these non-audit services is compatible with maintaining the principal accountant’s independence. |
Item 5: Audit Committee of Listed Registrants.
Not applicable.
Item 6: Schedule of Investments.
The schedules of investments are included as part of the report to shareholders filed under Item 1 of this Form.
Item 7: Disclosure of Proxy Voting Policies and Procedures for Closed-End Management Investment Companies.
Not applicable.
Item 8: Portfolio Managers of Closed-End Management Investment Companies.
Not applicable.
| Item 9: | Purchases of Equity Securities by Closed-End Management Investment Company and Affiliated Purchasers. |
Not applicable.
Item 10: Submission of Matters to a Vote of Security Holders.
Not applicable.
Item 11: Controls and Procedures.
| (a) | Based on their evaluation of Registrant’s disclosure controls and procedures, as of a date within 90 days of the filing date, Registrant’s Chief Executive Officer, Jonathan de St. Paer and Registrant’s Chief Financial Officer, Mark Fischer, have concluded that Registrant’s disclosure controls and procedures are: (i) reasonably designed to ensure that information required to be disclosed in this report is appropriately communicated to Registrant’s officers to allow timely decisions regarding disclosures required in this report; (ii) reasonably designed to ensure that information required to be disclosed in this report is recorded, processed, summarized and reported in a timely manner; and (iii) are effective in achieving the goals described in (i) and (ii) above. |
| (b) | During the period covered by this report, there have been no changes in Registrant’s internal control over financial reporting that the above officers believe to have materially affected, or to be reasonably likely to materially affect, Registrant’s internal control over financial reporting. |
Item 12: Disclosure of Securities Lending Activities for Closed-End Management Investment Companies.
Not applicable.
Item 13: Exhibits.
Pursuant to the requirements of the Securities Exchange Act of 1934 and the Investment Company Act of 1940, the registrant has duly caused this report to be signed on its behalf by the undersigned, thereunto duly authorized.
(Registrant) Schwab Capital Trust – Monthly Income Funds
| | |
| By: | | /s/ Jonathan de St. Paer |
| | Jonathan de St. Paer Chief Executive Officer |
| |
| Date: | | February 17, 2022 |
Pursuant to the requirements of the Securities Exchange Act of 1934 and the Investment Company Act of 1940, this report has been signed below by the following persons on behalf of the registrant and in the capacities and on the dates indicated.
| | |
| By: | | /s/ Jonathan de St. Paer |
| | Jonathan de St. Paer Chief Executive Officer |
| |
| Date: | | February 17, 2022 |
| |
| By: | | /s/ Mark Fischer |
| | Mark Fischer Chief Financial Officer |
| |
| Date: | | February 17, 2022 |