UNITED STATES
SECURITIES AND EXCHANGE COMMISSION
Washington, D.C. 20549
FORM N-CSR
CERTIFIED SHAREHOLDER REPORT OF REGISTERED
MANAGEMENT INVESTMENT COMPANIES
Investment Company Act file number: 811-07704
Schwab Capital Trust – Schwab Fundamental Global Real Estate Index Fund
(Exact name of registrant as specified in charter)
211 Main Street, San Francisco, California 94105
(Address of principal executive offices) (Zip code)
Jonathan de St. Paer
Schwab Capital Trust
211 Main Street, San Francisco, California 94105
(Name and address of agent for service)
Registrant’s telephone number, including area code: (415) 636-7000
Date of fiscal year end: February 28
Date of reporting period: February 28, 2022
Item 1: Report(s) to Shareholders.
Annual Report | February 28, 2022
Schwab Fundamental Global Real Estate Index Fund
This page is intentionally left blank.
Fund investment adviser: Charles Schwab Investment Management, Inc., dba Schwab Asset ManagementTM
Distributor: Charles Schwab & Co., Inc. (Schwab)
The Sector/Industry classifications in this report use the Global Industry Classification Standard (GICS) which was developed by and is the exclusive property of MSCI Inc. (MSCI) and Standard & Poor’s (S&P). GICS is a service mark of MSCI and S&P and has been licensed for use by Schwab.
Schwab Fundamental Global Real Estate Index Fund | Annual Report
Schwab Fundamental Global Real Estate Index Fund
The performance data quoted represents past performance. Past performance does not guarantee future results. Investment returns and principal value of an investment will fluctuate so that an investor’s shares may be worth more or less than their original cost. Current performance may be lower or higher than performance data quoted. To obtain performance information current to the most recent month end, please visit www.schwabassetmanagement.com/schwabfunds_prospectus.
| Total Returns for the 12 Months Ended February 28, 2022 |
| Schwab Fundamental Global Real Estate Index Fund (Ticker Symbol: SFREX) | 6.92% 1 |
| Russell RAFITM Global Select Real Estate Index (Net)2 | 6.87% |
| FTSE EPRA Nareit Global Index (Net)2 | 9.78% |
| Fund Category: Morningstar Global Real Estate3 | 10.62% |
| Performance Details | pages 7-9 |
All total returns on this page assume dividends and distributions were reinvested. Index figures do not include trading and management costs, which would lower performance. Indices are unmanaged and cannot be invested in directly. Performance results less than one year are not annualized.
The first index listed for the fund is the fund’s primary benchmark, as shown in the prospectus. Additional indices shown are provided for comparative purposes.
For index definitions, please see the Glossary.
Performance does not reflect the deduction of taxes that a shareholder would pay on fund distributions or on the redemption of fund shares.
Index ownership – The Schwab Fundamental Global Real Estate Index Fund is not in any way sponsored, endorsed, sold or promoted by Frank Russell Company (Russell), by the London Stock Exchange Group companies (LSEG), or by Research Affiliates LLC (RA) (collectively the Licensor Parties), and none of the Licensor Parties make any warranty or representation whatsoever, expressly or impliedly, either as to the results to be obtained from the use of the Russell RAFI™ Global Select Real Estate Index (the Index) or otherwise. The Index is compiled and calculated by Russell in conjunction with RA. None of the Licensor Parties shall be liable (whether in negligence or otherwise) to any person for any error in the Index and none of the Licensor Parties shall be under any obligation to advise any person of any error therein. “Russell®” is a trademark of Russell. The trade names “Research Affiliates®”, “Fundamental Index®” and “RAFI®” are registered trademarks of RA. Charles Schwab Investment Management, Inc. has obtained full license from Russell to use the Index. For full disclaimer please see the fund’s statement of additional information.
| 1 | Total return for the report period presented in the table differs from the return in the Financial Highlights. The total return presented in the above table is calculated based on the net asset value (NAV) at which shareholder transactions were processed. The total return presented in the Financial Highlights section of the report is calculated in the same manner, but also takes into account certain adjustments that are necessary under generally accepted accounting principles required in the annual and semiannual reports. |
| 2 | The net version of the index reflects reinvested dividends net of withholding taxes but reflects no deductions for expenses or other taxes. |
| 3 | Source for category information: Morningstar, Inc. The Morningstar Category return represents all active and index mutual funds within the category as of the report date. |
Schwab Fundamental Global Real Estate Index Fund | Annual Report
Schwab Fundamental Global Real Estate Index Fund
Jonathan de St. Paer
President of Schwab Asset
Management and the fund
covered in this report.
Dear Shareholder,
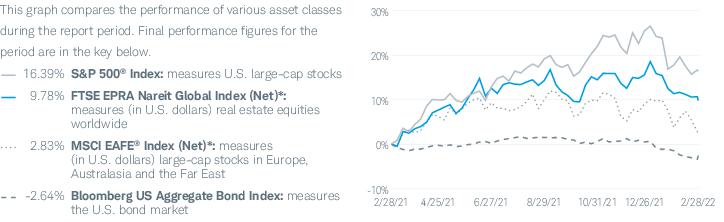
Before Russia’s invasion of Ukraine in late February 2022, financial markets were largely preoccupied with the prospects of continued economic growth in the face of multiple challenges related to the ongoing COVID-19 pandemic. Concerns included rising energy and commodity inflation, global supply chain disruptions, and the increasing likelihood that the U.S. Federal Reserve (Fed) would raise short-term interest rates. Despite these obstacles, the S&P 500® Index, a bellwether for the overall U.S. stock market, gained more than 20% between March and December 2021, bolstered by strong corporate earnings, robust consumer spending, and improving labor statistics. However, investor sentiment turned dramatically risk averse as tensions between Russia and Ukraine began escalating in 2022. Stock markets dipped sharply in January and February, with the S&P 500® Index losing roughly half of its previous gains. International stocks, which had posted milder gains than their U.S. counterparts until then, experienced even steeper losses. The real estate sector generated positive returns over the reporting period, with U.S. real estate investment trusts (REITs) outperforming the broader U.S. equity market led by strong returns from industrial and residential REITs. For the 12-month reporting period ended February 28, 2022, the S&P 500® Index returned 16.4% and the MSCI EAFE® Index (Net)*, a broad measure of developed international equity performance, returned 2.8%. During the same period, the FTSE EPRA Nareit Global Index (Net)*, representing general trends in eligible real estate securities worldwide, returned 9.8% while the Dow Jones Equity All REIT Capped Index, representing U.S. REITs, returned 21.6%.
While the tumultuous events beginning at the end of February have clearly unsettled markets and shaken investor confidence, at Schwab Asset Management we believe that when it comes to their investment plan, investors would do well to avoid getting caught up in the dramatic events as they unfold. Although markets may react abruptly in the short term, we believe that wealth creation is most reliably built on a foundation of diversification and a long-term investment plan. Since real estate securities tend to be influenced by a different combination of factors than other stocks and bonds, the Schwab Fundamental Global Real Estate Index Fund may add another layer of diversification when combined with more traditional asset classes in a portfolio. The fund offers a convenient and cost-effective way to invest in real estate companies in U.S. and non-U.S. markets, including developed and emerging markets. In addition, by weighting fund holdings based on objective financial measures of company size, Fundamental Index strategies tend to perform differently over time than traditional market-cap index strategies that use market capitalization to weight the same set of stocks. When the two approaches are combined, we believe a portfolio has the potential for better diversification and more attractive risk-adjusted returns.
Thank you for investing with Schwab Asset Management. For more information about the Schwab Fundamental Global Real Estate Index Fund, please continue reading this report. In addition, you can find further details about this fund by visiting our website at www.schwabassetmanagement.com. We are also happy to hear from you at 1-877-824-5615.
Sincerely,
“ The real estate sector generated positive returns over the reporting period, with U.S. real estate investment trusts (REITs) outperforming the broader U.S. equity market led by strong returns from industrial and residential REITs.”
Fundamental Index is a registered trademark of Research Affiliates LLC.
Past performance cannot guarantee future results.
Diversification and asset allocation strategies do not ensure a profit and cannot protect against losses in a declining market.
Management views may have changed since the report date.
Schwab Asset Management is the dba name for Charles Schwab Investment Management, Inc., the investment adviser for Schwab Funds and Schwab ETFs.
| * | The net version of the index reflects reinvested dividends net of withholding taxes but reflects no deductions for expenses or other taxes. |
Schwab Fundamental Global Real Estate Index Fund | Annual Report
Schwab Fundamental Global Real Estate Index Fund
The Investment Environment
For the 12-month reporting period ended February 28, 2022, U.S. equity markets generated positive returns, while global equity markets were mixed. Despite persisting COVID-19 pandemic-driven stresses on the global economy and the emergence and rapid spread of the Delta variant during the summer and the Omicron variant late in 2021, market tailwinds included strong corporate earnings, ongoing, albeit fading, fiscal stimulus measures, and optimism related to increased COVID-19 vaccination rates. As a result, for most of the reporting period, through early January 2022, U.S. equity markets posted steady gains, with several key market indices repeatedly exceeding previous record highs. Developed international equity markets were less robust, but for the most part still positive, while emerging markets were weaker. However, beginning in early 2022, equity markets declined in reaction to growing headwinds that included accelerating inflation, an increasing likelihood of rising interest rates, and, in the final week of the reporting period, Russia’s invasion of Ukraine, which drove oil prices above $100 per barrel for the first time since 2014 and roiled stock markets around the world. Despite exhibiting some volatility, the U.S. dollar rose over the reporting period against a basket of foreign currencies, generally reducing the returns on overseas investments in U.S. dollar terms. For the reporting period, the FTSE EPRA Nareit Global Index (Net)*, which represents general trends in eligible real estate securities worldwide, returned 9.78%, while the Dow Jones Equity All REIT Capped Index, which represents U.S. real estate investment trusts (REITs), returned 21.63%. During the same period, the S&P 500® Index, a bellwether for the overall U.S. stock market, returned 16.39%. Outside the U.S., the MSCI EAFE® Index (Net)*, a broad measure of developed international equity performance, and the MSCI Emerging Markets Index (Net)*, returned 2.83% and -10.69%, respectively.
After falling under severe pressure early in the COVID-19 pandemic as demand fell and funding waned, U.S. REITs continued their recovery over much of the reporting period. During the reporting period, the Dow Jones Equity All REIT Capped Index exceeded the return of the broader U.S. equity market, hitting a record high in early January 2022 before falling back in the first two months of 2022 on the growing likelihood of rising interest rates and inflation concerns. Among REIT sub-industries in the Dow Jones Equity All REIT Capped Index, all but one posted positive returns and all but two posted double-digit returns for the reporting period. The strongest performers were the industrial and residential REITs sub-industries, both up on strong demand and limited supply. The only sub-industry to post a negative return for the reporting period was the hotels & resort REITs sub-industry, which continued to suffer amid ongoing COVID-19 pandemic-driven constraints in leisure and business travel.
Asset Class Performance Comparison % returns during the 12 months ended February 28, 2022
Index figures assume dividends and distributions were reinvested. Index figures do not include trading and management costs, which would lower performance. Indices are unmanaged and cannot be invested in directly. Performance results less than one year are not annualized. Past performance is not an indication of future results.
For index definitions, please see the Glossary.
Data source: Index provider websites and Schwab Asset Management.
Nothing in this report represents a recommendation of a security by the investment adviser.
Management views may have changed since the report date.
| * | The net version of the index reflects reinvested dividends net of withholding taxes but reflects no deductions for expenses or other taxes. |
Schwab Fundamental Global Real Estate Index Fund | Annual Report
Schwab Fundamental Global Real Estate Index Fund
The Investment Environment (continued)
Real estate markets outside the United States were generally weaker and exhibited more variation in performance. Among real estate securities in countries included in the FTSE EPRA Nareit Global Index, the strongest performers for the reporting period were real estate securities in Israel and the United Arab Emirates. Real estate securities were also strong in India and Kuwait. Returns on real estate securities in Russia, Chile, Turkey, and China were negative for the reporting period.
The U.S. economy continued its recovery from the dramatic impact of the COVID-19 pandemic, although U.S. gross domestic product (GDP) growth fluctuated over the reporting period. GDP rose at an annualized rate of 6.3% and 6.7% in the first and second quarters of 2021, respectively, before falling back to 2.3% for the third quarter of 2021 amid fading government stimuli, ongoing supply chain disruptions, and persisting inflation. GDP rose at an annualized rate of 6.9% in the fourth quarter of 2021 on increasing inventories, exports, and personal consumption expenditures. The unemployment rate, which has fallen steadily after skyrocketing in April 2020, ended the reporting period at its lowest level since February 2020. Annual inflation, which had remained well below the U.S. Federal Reserve’s (Fed) traditional 2% target until it jumped in March 2021, continued to rise during the spring of 2021, leveled off during the summer of 2021, and rose again through the remainder of the reporting period. At the end of the reporting period, inflation was at its highest rate in 40 years due to imbalances in the labor market, supply chain bottlenecks, and soaring energy costs.
Outside the United States, global economies continued to wrestle with the fallout of the COVID-19 pandemic, including the emergence and spread of the Delta and Omicron variants, along with steepening energy costs and rising inflation. In the eurozone and the United Kingdom, after contracting in the first quarter of 2021, GDP growth was positive for the remainder of the reporting period, although it weakened in the final quarter of 2021. Japan’s economy contracted in both the first and third quarters of 2021 but expanded in the second and fourth quarters. Its rising fourth-quarter growth was attributed to increases in household consumption and business investment in the face of a decline in COVID-19 cases and easing restrictions. Among emerging markets, China’s GDP growth rate accelerated sharply in the first quarter of 2021 before easing sharply for the subsequent three quarters, albeit remaining positive, in part because of the political landscape and an emphasis on domestic consumption over globalization, as well as multiple headwinds including a property downturn, supply chain issues, and COVID-19 outbreaks. India, after plunging into one of the worst recessions of any major economy in 2020, posted positive gains in GDP in 2021 as COVID-19 cases fell rapidly.
Monetary policies around the world varied. In the United States, early in the reporting period, the Fed reiterated several times its intention to continue its support of the economy for as long as needed to achieve a full recovery and the Fed maintained the federal funds rate in a range of 0.00% to 0.25% throughout the reporting period. However, as inflation continued to rise and indicators of economic activity and employment continued to strengthen, the Fed began scaling back its bond-buying program in November 2021, citing significant progress on its twin goals of maximum employment and price stability. The Fed subsequently accelerated its wind-down in December 2021, with expectations to end it altogether by March 2022. Fed officials also issued successively strong signals that interest rates could begin to rise sooner in 2022 than previously anticipated. In developed international economies, most central banks were similarly accommodative while acknowledging economic improvements and rising inflation and, in some cases, changes in monetary policy. The European Central bank held its interest rate at 0.00%, unchanged since March 2016, but pledged to steadily reduce its asset purchase program. The Bank of Japan upheld its short-term interest rate target of -0.1%, also unchanged since 2016, and stressed that it would maintain its ultra-loose monetary policy despite growing inflation, even as its global counterparts sought to exit from crisis-mode policies. The Bank of England raised its key official bank rate twice during the reporting period, from 0.1% to 0.5%, its first back-to-back rate increase since 2004, citing inflationary pressures. Emerging market monetary policies were mixed. China cut its interest rate twice over the reporting period. Indonesia and India maintained low policy rates implemented in 2020 and early 2021. Central banks in Mexico, Brazil, and Pakistan raised their rates multiple times over the reporting period, citing a stronger-than-expected recovery or to counteract the impacts of inflation. Russia, notably, raised its interest rate to 20% in late February amid the broadening fallout of Western sanctions put in place in retaliation against Russia’s invasion of Ukraine.
Schwab Fundamental Global Real Estate Index Fund | Annual Report
Schwab Fundamental Global Real Estate Index Fund
 | Christopher Bliss, CFA, Managing Director and Head of Passive Equity Strategies for Schwab Asset Management, is responsible for overseeing the investment process, portfolio management and implementation, and development of investment strategies for passive equity Schwab Funds and Schwab ETFs. Before joining Schwab in 2016, Mr. Bliss spent 12 years at BlackRock (formerly Barclays Global Investors) managing and leading institutional index teams, most recently as a managing director and the head of the Americas institutional index team. In this role, Mr. Bliss was responsible for overseeing a team of portfolio managers managing domestic, developed international and emerging markets index strategies. Prior to BlackRock, he worked as an equity analyst and portfolio manager for Harris Bretall and before that, as a research analyst for JP Morgan. |
 | Chuck Craig, CFA, Senior Portfolio Manager, is responsible for the day-to-day co-management of the fund. Prior to joining Schwab in 2012, Mr. Craig worked at Guggenheim Funds (formerly Claymore Group), where he spent more than five years as a managing director of portfolio management and supervision, and three years as vice president of product research and development. Prior to that, he worked as an equity research analyst at First Trust Portfolios (formerly Niké Securities), and a trader and analyst at PMA Securities, Inc. |
 | Jane Qin, Portfolio Manager, is responsible for the day-to-day co-management of the fund. Prior to joining Schwab in 2012, Ms. Qin spent more than four years at The Bank of New York Mellon Corporation. During that time, Ms. Qin spent more than two years as an associate equity portfolio manager and nearly two years as a performance analyst. She also worked at Wells Fargo Funds Management as a mutual fund analyst and at CIGNA Reinsurance in the risk management group as a risk analyst. |
 | David Rios, Portfolio Manager, is responsible for the day-to-day co-management of the fund. Prior to this role, Mr. Rios was an associate portfolio manager on the equity index strategies team for four years. His first role with Schwab Asset Management was as a trade operations specialist. Prior to joining Schwab in 2008, Mr. Rios was a senior fund accountant at Investors Bank & Trust (subsequently acquired by State Street Corporation). |
Schwab Fundamental Global Real Estate Index Fund | Annual Report
Schwab Fundamental Global Real Estate Index Fund as of February 28, 2022
The Schwab Fundamental Global Real Estate Index Fund (the fund) seeks investment results that correspond generally (before fees and expenses) to the total return of the Russell RAFITM Global Select Real Estate Index (Net) (the index). The index measures the performance of real estate companies, including real estate investment trusts (REITs), in U.S. and non-U.S. markets, including developed and emerging markets. To pursue its investment objective, the fund invests in a representative sample of the securities included in the index which, when taken together, are expected to perform similarly to the index as a whole. Due to the use of sampling techniques, the fund may not hold all of the securities in the index. For more information concerning the fund’s investment objective, strategies, and risks, please see the fund’s prospectus.
Market Highlights. For the 12-month reporting period ended February 28, 2022, U.S. equity markets generated positive returns, while global equity markets were mixed. Despite persisting COVID-19 pandemic-driven stresses on the global economy and the emergence and rapid spread of the Delta variant during the summer and the Omicron variant late in 2021, market tailwinds included strong corporate earnings, ongoing, albeit fading, fiscal stimulus measures, and optimism related to increased COVID-19 vaccination rates. As a result, for most of the reporting period, through early January 2022, U.S. equity markets posted steady gains, with several key market indices repeatedly exceeding previous record highs. Developed international equity markets were less robust, but for the most part still positive, while emerging markets were weaker. However, beginning in early 2022, equity markets declined in reaction to growing headwinds that included accelerating inflation, an increasing likelihood of rising interest rates, and, in the final week of the reporting period, Russia’s invasion of Ukraine, which drove oil prices above $100 per barrel for the first time since 2014 and roiled stock markets around the world. Despite exhibiting some volatility, the U.S. dollar rose over the reporting period against a basket of foreign currencies, generally reducing the returns on overseas investments in U.S. dollar terms.
Performance. The fund tracked the index for the 12-month reporting period ended February 28, 2022. The fund returned 6.92%1, while the index returned 6.87%2 for the reporting period. Timing differences in foreign exchange calculations, fair valuation of the fund’s holdings, and income due to tax rate differences between the fund and the index contributed to the fund’s relative performance.3
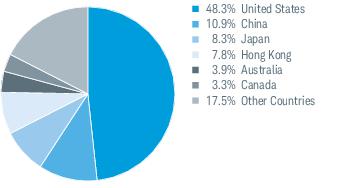
Contributors and Detractors. Real estate securities from the United States contributed the most to the total return of the fund. Securities from the United States represented an average weight of approximately 51% of the fund’s investments and returned approximately 18% for the reporting period. One example from this market is Simon Property Group, Inc. which owns, develops, and manages retail real estate properties including regional malls, outlet centers, community/lifestyle centers, and international properties. The fund’s holdings of Simon Property Group, Inc. represented an average weight of approximately 3% of the fund’s investments and returned approximately 27% for the reporting period.
Real estate securities from Canada also contributed to the total return of the fund. Canadian securities represented an average weight of approximately 3% of the fund’s investments and returned approximately 26% in U.S. dollar terms for the reporting period.
Real estate securities from China detracted the most from the total return of the fund. Chinese securities represented an average weight of approximately 9% of the fund’s investments and returned approximately -33% in U.S. dollar terms for the reporting period. One example from this market is China Evergrande Group which owns real estate development, new energy, property service, network, health, and other industries. The fund’s holdings of China Evergrande Group represented an average weight of less than 1% of the fund’s investments and returned approximately -90% in U.S. dollar terms for the reporting period.
Real estate securities from Hong Kong also detracted from the total return of the fund. Securities from Hong Kong represented an average weight of approximately 9% of the fund’s investments and returned approximately -5% in U.S. dollar terms for the reporting period.
Management views and portfolio holdings may have changed since the report date.
| 1 | Total return for the report period above differs from the return in the Financial Highlights. The total return presented above is calculated based on the net asset value (NAV) at which shareholder transactions were processed. The total return presented in the Financial Highlights section of the report is calculated in the same manner, but also takes into account certain adjustments that are necessary under generally accepted accounting principles required in the annual and semiannual reports. |
| 2 | The net version of the index reflects reinvested dividends net of withholding taxes but reflects no deductions for expenses or other taxes. |
| 3 | Typically, the securities in the index are valued using foreign exchange rates obtained at the close of the London foreign currency exchange (11:00 AM EST). Securities in the fund, however, are valued using foreign exchange rates obtained at the close of the New York foreign currency exchange (4:00 PM EST). This difference in closing times can result in different foreign currency exchange rates between the two exchanges, and thus different foreign currency exchange rates used in the valuation of the index’s and fund’s securities. |
Schwab Fundamental Global Real Estate Index Fund | Annual Report
Schwab Fundamental Global Real Estate Index Fund
Performance and Fund Facts as of February 28, 2022
The performance data quoted represents past performance. Past performance does not guarantee future results. Investment returns and principal value of an investment will fluctuate so that an investor’s shares may be worth more or less than their original cost. Current performance may be lower or higher than performance data quoted. To obtain performance information current to the most recent month end, please visit www.schwabassetmanagement.com/schwabfunds_prospectus.
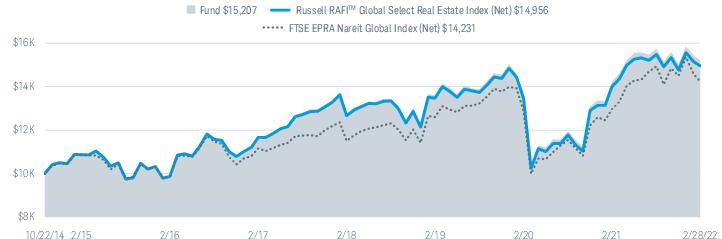
Performance of Hypothetical $10,000 Investment (October 22, 2014 – February 28, 2022)1
Average Annual Total Returns1
| Fund and Inception Date | 1 Year | 5 Years | Since Inception |
| Fund: Schwab Fundamental Global Real Estate Index Fund (10/22/14) | 6.92% 2 | 5.41% | 5.86% |
| Russell RAFITM Global Select Real Estate Index (Net)3 | 6.87% | 5.10% | 5.62% |
| FTSE EPRA Nareit Global Index (Net)3 | 9.78% | 4.98% | 4.91% |
| Fund Category: Morningstar Global Real Estate4 | 10.62% | 6.38% | N/A |
| Fund Expense Ratio5: 0.39% |
All total returns on this page assume dividends and distributions were reinvested. Index figures do not include trading and management costs, which would lower performance. Indices are unmanaged and cannot be invested in directly. Performance results less than one year are not annualized.
The first index listed for the fund is the fund’s primary benchmark, as shown in the prospectus. Additional indices shown are provided for comparative purposes.
For index definitions, please see the Glossary.
The fund’s performance relative to the index may be affected by fair value pricing, see financial note 2 for more information.
Small-company stocks are subject to greater volatility than many other asset classes.
International investing may involve risk of capital loss from unfavorable fluctuations in currency values, from differences in generally accepted accounting principles, or from economic or political instability in other nations. Investing in emerging markets may accentuate these risks.
The fund is subject to risks associated with the direct ownership of real estate securities and an investment in the fund will be closely linked to the performance of the real estate markets.
Index ownership – The Schwab Fundamental Global Real Estate Index Fund is not in any way sponsored, endorsed, sold or promoted by Frank Russell Company (Russell), by the London Stock Exchange Group companies (LSEG), or by Research Affiliates LLC (RA) (collectively the Licensor Parties), and none of the Licensor Parties make any warranty or representation whatsoever, expressly or impliedly, either as to the results to be obtained from the use of the Russell RAFITM Global Select Real Estate Index (the Index) or otherwise. The Index is compiled and calculated by Russell in conjunction with RA. None of the Licensor Parties shall be liable (whether in negligence or otherwise) to any person for any error in the Index and none of the Licensor Parties shall be under any obligation to advise any person of any error therein. “Russell®” is a trademark of Russell. The trade names “Research Affiliates®”, “Fundamental Index®” and “RAFI®” are registered trademarks of RA. Charles Schwab Investment Management, Inc. has obtained full license from Russell to use the Index. For full disclaimer please see the fund’s statement of additional information.
| 1 | Performance does not reflect the deduction of taxes that a shareholder would pay on fund distributions or on the redemption of fund shares. |
| 2 | Total return for the report period presented in the table differs from the return in the Financial Highlights. The total return presented in the above table is calculated based on the net asset value (NAV) at which shareholder transactions were processed. The total return presented in the Financial Highlights section of the report is calculated in the same manner, but also takes into account certain adjustments that are necessary under generally accepted accounting principles required in the annual and semiannual reports. |
| 3 | The net version of the index reflects reinvested dividends net of withholding taxes but reflects no deductions for expenses or other taxes. |
| 4 | Source for category information: Morningstar, Inc. The Morningstar Category return represents all active and index mutual funds within the category as of the report date. |
| 5 | As stated in the prospectus. |
Schwab Fundamental Global Real Estate Index Fund | Annual Report
Schwab Fundamental Global Real Estate Index Fund
Performance and Fund Facts as of February 28, 2022 (continued)
| Number of Holdings | 355 |
| Weighted Average Market Cap (millions) | $19,041 |
| Price/Earnings Ratio (P/E) | 10.5 |
| Price/Book Ratio (P/B) | 1.0 |
| Portfolio Turnover Rate | 32% |
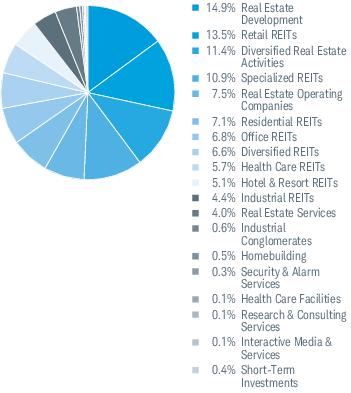
Industry Weightings % of Investments1
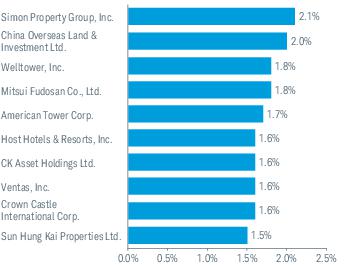
Top Holdings % of Net Assets2
Country Weightings % of Investments3
Portfolio holdings may have changed since the report date.
An index is a statistical composite of a specified financial market or sector. Unlike the fund, an index does not actually hold a portfolio of securities and its return is not inclusive of trading and management costs incurred by the fund.
Source of Industry Classification: S&P and MSCI.
| 1 | Excludes derivatives. |
| 2 | This list is not a recommendation of any security by the investment adviser. |
| 3 | The percentage may differ from the Portfolio Holdings because the above calculation is based on a percentage of total investments, excluding derivatives, whereas the calculation in the Portfolio Holdings is based on a percentage of net assets. |
Schwab Fundamental Global Real Estate Index Fund | Annual Report
Schwab Fundamental Global Real Estate Index Fund
Fund Expenses (Unaudited)
Examples for a $1,000 Investment
As a fund shareholder, you may incur two types of costs: (1) transaction costs; and (2) ongoing costs, including management fees.
The expense examples below are intended to help you understand your ongoing cost (in dollars) of investing in the fund and to compare this cost with the ongoing cost of investing in other mutual funds. These examples are based on an investment of $1,000 invested for six months beginning September 1, 2021 and held through February 28, 2022.
Actual Return line in the table below provides information about actual account values and actual expenses. You may use this information, together with the amount you invested, to estimate the expenses that you paid over the period. To do so, simply divide your account value by $1,000 (for example, an $8,600 account value ÷ $1,000 = 8.6), then multiply the result by the number given for your fund under the heading entitled “Expenses Paid During Period.”
Hypothetical Return line in the table below provides information about hypothetical account values and hypothetical expenses based on the fund’s actual expense ratio and an assumed return of 5% per year before expenses. Because the return used is not an actual return, it may not be used to estimate the actual ending account value or expenses you paid for the period.
You may use this information to compare the ongoing costs of investing in the fund and other funds. To do so, compare this 5% hypothetical example with the 5% hypothetical examples that appear in the shareholder reports of the other funds.
Please note that the expenses shown in the table are meant to highlight your ongoing costs only, and do not reflect any transactional costs. Therefore, the hypothetical return lines of the table are useful in comparing ongoing costs only, and will not help you determine the relative total costs of owning different funds. In addition, if these transactional costs were included, your costs would have been higher.
| | EXPENSE RATIO
(ANNUALIZED) 1 | BEGINNING
ACCOUNT VALUE
AT 9/1/21 | ENDING
ACCOUNT VALUE
(NET OF EXPENSES)
AT 2/28/22 | EXPENSES PAID
DURING PERIOD
9/1/21-2/28/222 |
| Schwab Fundamental Global Real Estate Index Fund | | | | |
| Actual Return | 0.39% | $1,000.00 | $ 966.20 | $1.90 |
| Hypothetical 5% Return | 0.39% | $1,000.00 | $1,022.86 | $1.96 |
| 1 | Based on the most recent six-month expense ratio. |
| 2 | Expenses for the fund are equal to its annualized expense ratio, multiplied by the average account value over the period, multiplied by the 181 days of the period, and divided by the 365 days of the fiscal year. |
Schwab Fundamental Global Real Estate Index Fund | Annual Report
Schwab Fundamental Global Real Estate Index Fund
Financial Statements
FINANCIAL HIGHLIGHTS
| | 3/1/21–
2/28/22 | 3/1/20–
2/28/21 | 3/1/19–
2/29/20 | 3/1/18–
2/28/19 | 3/1/17–
2/28/18 | |
| Per-Share Data |
| Net asset value at beginning of period | $11.05 | $11.06 | $11.43 | $11.24 | $10.73 | |
| Income (loss) from investment operations: | | | | | | |
| Net investment income (loss)1 | 0.34 | 0.30 | 0.37 | 0.37 | 0.34 | |
| Net realized and unrealized gains (losses) | 0.44 | 0.05 | (0.24) | 0.38 | 0.59 | |
| Total from investment operations | 0.78 | 0.35 | 0.13 | 0.75 | 0.93 | |
| Less distributions: | | | | | | |
| Distributions from net investment income | (0.35) | (0.34) | (0.47) | (0.44) | (0.39) | |
| Distributions from net realized gains | — | (0.02) | (0.03) | (0.12) | (0.03) | |
| Total distributions | (0.35) | (0.36) | (0.50) | (0.56) | (0.42) | |
| Net asset value at end of period | $11.48 | $11.05 | $11.06 | $11.43 | $11.24 | |
| Total return | 7.02% | 3.62% | 0.91% | 7.00% | 8.69% | |
| Ratios/Supplemental Data |
| Ratios to average net assets: | | | | | | |
| Total expenses | 0.39% | 0.39% | 0.39% | 0.39% | 0.43% 2 | |
| Net operating expenses | N/A | N/A | N/A | N/A 3 | 0.41% 2 | |
| Net investment income (loss) | 2.86% | 3.17% | 3.16% | 3.32% | 3.01% | |
| Portfolio turnover rate | 32% | 25% | 16% | 16% | 13% | |
| Net assets, end of period (x 1,000,000) | $134 | $157 | $196 | $190 | $158 | |
| 1 | Calculated based on the average shares outstanding during the period. |
| 2 | Effective June 1, 2017, the annual operating expense ratio was reduced. The ratio presented for the period ended 2/28/18 is a blended ratio. |
| 3 | Effective June 1, 2017, the fund instituted a new fee structure and the contractual expense limitation was terminated. |
Schwab Fundamental Global Real Estate Index Fund | Annual Report
Schwab Fundamental Global Real Estate Index Fund
Portfolio Holdings as of February 28, 2022
This section shows all the securities in the fund’s portfolio and their values as of the report date.
The fund files its complete schedule of portfolio holdings with the U.S. Securities and Exchange Commission (SEC) for the first and third quarters of each fiscal year on Form N-PORT Part F. The fund’s Form N-PORT Part F is available on the SEC’s website at www.sec.gov. You can also obtain this information at no cost on the fund’s website at www.schwabassetmanagement.com/schwabfunds_prospectus, by calling 1-866-414-6349, or by sending an email request to orders@mysummaryprospectus.com.The fund also makes available its complete schedule of portfolio holdings 15 to 20 days after the end of the month on the fund’s website.
| SECURITY | NUMBER
OF SHARES | VALUE ($) |
| COMMON STOCKS 99.5% OF NET ASSETS |
| |
| Australia 3.8% |
| Charter Hall Group | 12,304 | 150,471 |
| Charter Hall Retail REIT | 39,822 | 121,352 |
| Cromwell Property Group | 131,185 | 84,582 |
| Dexus | 55,261 | 437,445 |
| Goodman Group | 39,835 | 644,516 |
| Mirvac Group | 356,582 | 664,995 |
| REA Group Ltd. | 792 | 76,340 |
| Scentre Group | 543,267 | 1,206,923 |
| Shopping Centres Australasia Property Group | 56,936 | 120,042 |
| Stockland | 256,946 | 777,491 |
| The GPT Group | 97,428 | 347,630 |
| Vicinity Centres | 393,885 | 512,893 |
| | | 5,144,680 |
| |
| Austria 0.2% |
| CA Immobilien Anlagen AG | 2,237 | 76,535 |
| IMMOFINANZ AG * | 5,191 | 133,753 |
| S IMMO AG | 3,510 | 89,967 |
| | | 300,255 |
| |
| Belgium 0.4% |
| Befimmo S.A. | 3,705 | 196,881 |
| Cofinimmo S.A. | 1,546 | 202,164 |
| Warehouses De Pauw CVA | 4,076 | 160,248 |
| | | 559,293 |
| |
| Brazil 0.3% |
| BR Malls Participacoes S.A. * | 88,922 | 161,185 |
| Cyrela Brazil Realty S.A. Empreendimentos e Participacoes | 34,989 | 102,160 |
| Multiplan Empreendimentos Imobiliarios S.A. | 18,600 | 79,065 |
| | | 342,410 |
| |
| Canada 3.3% |
| Allied Properties Real Estate Investment Trust | 6,161 | 214,262 |
| Altus Group Ltd. | 1,933 | 74,910 |
| Artis Real Estate Investment Trust | 23,314 | 239,118 |
| Boardwalk Real Estate Investment Trust | 3,815 | 169,907 |
| Canadian Apartment Properties REIT | 6,826 | 284,134 |
| Chartwell Retirement Residences | 19,438 | 186,635 |
| Choice Properties Real Estate Investment Trust | 11,662 | 133,595 |
| Colliers International Group, Inc. | 1,150 | 157,915 |
| Cominar Real Estate Investment Trust | 36,012 | 332,418 |
| Crombie Real Estate Investment Trust | 6,727 | 92,241 |
| Dream Office Real Estate Investment Trust | 8,849 | 182,495 |
| SECURITY | NUMBER
OF SHARES | VALUE ($) |
| First Capital Real Estate Investment Trust | 21,308 | 305,120 |
| FirstService Corp. | 690 | 98,228 |
| Granite Real Estate Investment Trust | 2,242 | 166,041 |
| H&R Real Estate Investment Trust | 40,604 | 414,209 |
| Killam Apartment Real Estate Investment Trust | 8,416 | 141,628 |
| NorthWest Healthcare Properties Real Estate Investment Trust | 9,539 | 102,126 |
| Primaris REIT | 12,129 | 136,840 |
| RioCan Real Estate Investment Trust | 31,842 | 631,062 |
| SmartCentres Real Estate Investment Trust | 10,727 | 269,212 |
| Tricon Residential, Inc. | 6,291 | 93,509 |
| | | 4,425,605 |
| |
| China 10.9% |
| Agile Group Holdings Ltd. | 523,000 | 238,290 |
| Central China Management Co., Ltd. | 154,000 | 20,642 |
| Central China Real Estate Ltd. | 203,000 | 16,667 |
| China Aoyuan Group Ltd. | 411,000 | 68,508 |
| China Evergrande Group | 2,224,000 | 455,184 |
| China Jinmao Holdings Group Ltd. | 1,479,000 | 491,832 |
| China Merchants Shekou Industrial Zone Holdings Co., Ltd., A Shares | 76,800 | 164,742 |
| China Overseas Grand Oceans Group Ltd. | 198,000 | 114,225 |
| China Overseas Land & Investment Ltd. | 897,000 | 2,738,691 |
| China Resources Land Ltd. | 386,000 | 1,877,619 |
| China SCE Group Holdings Ltd. | 486,000 | 97,576 |
| China South City Holdings Ltd. | 1,158,000 | 96,666 |
| China Vanke Co., Ltd., A Shares | 115,100 | 350,329 |
| China Vanke Co., Ltd., H Shares | 309,900 | 736,069 |
| CIFI Holdings Group Co., Ltd. | 455,000 | 317,004 |
| Country Garden Holdings Co., Ltd. | 1,516,000 | 1,177,828 |
| Country Garden Services Holdings Co., Ltd. | 8,400 | 50,248 |
| Fantasia Holdings Group Co., Ltd. * | 1,791,000 | 65,580 |
| Gemdale Corp., A Shares | 53,100 | 106,842 |
| Gemdale Properties & Investment Corp., Ltd. | 940,000 | 103,447 |
| Greenland Holdings Corp., Ltd., A Shares | 113,240 | 77,625 |
| Greentown China Holdings Ltd. | 130,000 | 195,271 |
| Guangzhou R&F Properties Co., Ltd., H Shares | 1,155,800 | 492,024 |
| Hongkong Land Holdings Ltd. | 126,627 | 685,735 |
| Hopson Development Holdings Ltd. | 56,690 | 116,699 |
| Jinmao Property Services Co., Ltd. *(a) | 22,341 | 22,385 |
| Kaisa Group Holdings Ltd. * | 753,000 | 68,592 |
| KWG Group Holdings Ltd. | 169,000 | 79,130 |
| Logan Group Co., Ltd. | 169,000 | 56,228 |
| Longfor Group Holdings Ltd. | 159,500 | 852,930 |
| Midea Real Estate Holding Ltd. | 33,600 | 49,233 |
| Poly Developments and Holdings Group Co., Ltd., A Shares | 118,900 | 297,779 |
| Poly Property Group Co., Ltd | 892,000 | 241,988 |
| Red Star Macalline Group Corp. Ltd., A Shares * | 46,800 | 62,743 |
| Ronshine China Holdings Ltd. * | 244,000 | 78,140 |
| Seazen Group Ltd. * | 352,000 | 185,735 |
Schwab Fundamental Global Real Estate Index Fund | Annual Report
Schwab Fundamental Global Real Estate Index Fund
Portfolio Holdings as of February 28, 2022 (continued)
| SECURITY | NUMBER
OF SHARES | VALUE ($) |
| Seazen Holdings Co., Ltd., A Shares | 13,600 | 65,049 |
| Shanghai Lujiazui Finance & Trade Zone Development Co., Ltd., A Shares | 65,100 | 114,569 |
| Shenzhen Investment Ltd. | 869,563 | 196,028 |
| Shimao Group Holdings Ltd. | 430,000 | 258,042 |
| Sino-Ocean Group Holding Ltd. | 1,693,500 | 364,267 |
| Sunac China Holdings Ltd. | 333,000 | 272,194 |
| Times China Holdings Ltd. | 221,000 | 71,886 |
| Yuexiu Property Co., Ltd. | 273,000 | 273,074 |
| Yuzhou Group Holdings Co., Ltd. | 1,366,963 | 108,606 |
| Zhongliang Holdings Group Co. Ltd. | 164,000 | 64,218 |
| | | 14,638,159 |
| |
| France 1.6% |
| Covivio | 4,565 | 373,465 |
| Gecina S.A. | 2,690 | 341,848 |
| ICADE | 4,385 | 270,771 |
| Klepierre S.A. * | 23,816 | 680,769 |
| Mercialys S.A. | 17,281 | 176,790 |
| Nexity S.A. | 7,555 | 297,802 |
| | | 2,141,445 |
| |
| Germany 1.9% |
| Aroundtown S.A. | 35,265 | 217,449 |
| Deutsche Euroshop AG | 5,527 | 103,931 |
| Deutsche Wohnen SE | 4,719 | 195,041 |
| Grand City Properties S.A. | 6,445 | 140,749 |
| LEG Immobilien SE | 2,291 | 294,600 |
| TAG Immobilien AG | 7,073 | 182,306 |
| Vonovia SE | 25,495 | 1,353,352 |
| | | 2,487,428 |
| |
| Hong Kong 7.8% |
| Champion REIT | 229,000 | 103,736 |
| CK Asset Holdings Ltd. | 339,250 | 2,142,718 |
| Fortune Real Estate Investment Trust | 122,000 | 114,636 |
| Hang Lung Group Ltd. | 142,000 | 313,277 |
| Hang Lung Properties Ltd. | 145,000 | 303,931 |
| Henderson Land Development Co., Ltd. | 110,866 | 460,930 |
| Hysan Development Co., Ltd. | 46,500 | 136,859 |
| K Wah International Holdings Ltd. | 385,000 | 146,125 |
| Kerry Properties Ltd. | 131,500 | 360,334 |
| Link REIT | 85,100 | 687,676 |
| New World Development Co., Ltd. | 295,460 | 1,181,734 |
| Powerlong Real Estate Holdings Ltd. | 305,000 | 146,193 |
| Shui On Land Ltd. | 1,530,500 | 223,539 |
| Sino Land Co., Ltd. | 342,583 | 432,408 |
| Sun Hung Kai Properties Ltd. | 172,000 | 1,999,634 |
| Swire Properties Ltd. | 79,600 | 207,001 |
| The Wharf Holdings Ltd. | 253,000 | 915,352 |
| Wharf Real Estate Investment Co., Ltd. | 133,200 | 597,973 |
| | | 10,474,056 |
| |
| Japan 8.3% |
| Advance Residence Investment Corp. | 35 | 98,030 |
| Aeon Mall Co., Ltd. | 18,900 | 265,773 |
| Daito Trust Construction Co., Ltd. | 13,770 | 1,523,510 |
| Daiwa House REIT Investment Corp. | 39 | 105,769 |
| GLP J-REIT | 58 | 86,594 |
| Heiwa Real Estate Co., Ltd. | 2,400 | 85,816 |
| Hulic Co., Ltd. | 26,200 | 238,683 |
| Japan Metropolitan Fund Invest | 201 | 162,678 |
| Japan Prime Realty Investment Corp. | 26 | 84,655 |
| Japan Real Estate Investment Corp. | 29 | 154,911 |
| SECURITY | NUMBER
OF SHARES | VALUE ($) |
| Leopalace21 Corp. * | 112,400 | 200,002 |
| Mitsubishi Estate Co., Ltd. | 115,800 | 1,768,066 |
| Mitsui Fudosan Co., Ltd. | 107,800 | 2,399,202 |
| Nippon Building Fund, Inc. | 30 | 171,910 |
| Nippon Prologis REIT, Inc. | 30 | 88,201 |
| Nomura Real Estate Holdings, Inc. | 19,900 | 495,483 |
| Nomura Real Estate Master Fund, Inc. | 119 | 156,932 |
| Open House Group Co., Ltd. | 5,100 | 231,893 |
| Orix JREIT, Inc. | 76 | 106,325 |
| Relo Group, Inc. | 6,200 | 93,316 |
| SAMTY Co., Ltd. | 3,700 | 70,171 |
| Starts Corp., Inc. | 5,500 | 124,300 |
| Sumitomo Realty & Development Co., Ltd. | 36,800 | 1,082,595 |
| Takara Leben Co., Ltd. | 26,400 | 72,173 |
| Tokyo Tatemono Co., Ltd. | 26,000 | 398,568 |
| Tokyu Fudosan Holdings Corp. | 120,600 | 669,020 |
| United Urban Investment Corp. | 106 | 121,531 |
| | | 11,056,107 |
| |
| Mexico 0.5% |
| Fibra Uno Administracion S.A. de C.V. | 354,600 | 399,598 |
| Macquarie Mexico Real Estate Management S.A. de C.V. | 111,300 | 134,119 |
| PLA Administradora Industrial S. de R.L de C.V. | 125,000 | 164,665 |
| | | 698,382 |
| |
| Netherlands 1.6% |
| Eurocommercial Properties N.V. | 7,710 | 191,482 |
| Unibail-Rodamco-Westfield * | 23,116 | 1,762,036 |
| Wereldhave N.V. | 10,682 | 195,018 |
| | | 2,148,536 |
| |
| Philippines 1.2% |
| Ayala Corp. | 31,580 | 523,562 |
| Ayala Land, Inc. | 564,832 | 430,592 |
| GT Capital Holdings, Inc. | 23,300 | 263,866 |
| Robinsons Land Corp. | 299,600 | 112,797 |
| SM Prime Holdings, Inc. | 356,300 | 278,089 |
| | | 1,608,906 |
| |
| Singapore 2.3% |
| Ascendas Real Estate Investment Trust | 124,888 | 256,076 |
| Ascott Residence Trust | 165,200 | 125,711 |
| CapitaLand Integrated Commercial Trust | 185,005 | 289,536 |
| Capitaland Investment Ltd. * | 440,800 | 1,207,906 |
| City Developments Ltd. | 65,100 | 344,477 |
| Mapletree Commercial Trust | 93,827 | 125,824 |
| Mapletree Industrial Trust | 78,544 | 148,601 |
| Mapletree Logistics Trust | 98,431 | 127,973 |
| Mapletree North Asia Commercial Trust | 182,015 | 145,038 |
| Suntec Real Estate Investment Trust | 129,800 | 155,969 |
| UOL Group Ltd. | 40,780 | 211,341 |
| | | 3,138,452 |
| |
| South Africa 1.1% |
| Fortress REIT Ltd., Class A | 106,238 | 88,645 |
| Growthpoint Properties Ltd. | 451,667 | 393,616 |
| Hyprop Investments Ltd. | 63,586 | 142,503 |
| NEPI Rockcastle plc | 39,712 | 253,804 |
| Redefine Properties Ltd. | 1,109,426 | 304,481 |
| Resilient REIT Ltd. | 29,516 | 111,816 |
Schwab Fundamental Global Real Estate Index Fund | Annual Report
Schwab Fundamental Global Real Estate Index Fund
Portfolio Holdings as of February 28, 2022 (continued)
| SECURITY | NUMBER
OF SHARES | VALUE ($) |
| Vukile Property Fund Ltd. | 157,970 | 129,037 |
| | | 1,423,902 |
| |
| Sweden 0.8% |
| Castellum AB | 14,393 | 319,354 |
| Fabege AB | 7,440 | 110,843 |
| Fastighets AB Balder, B Shares * | 1,598 | 99,618 |
| JM AB | 9,539 | 295,395 |
| Pandox AB * | 6,357 | 92,805 |
| Wallenstam AB, B Shares | 4,410 | 64,552 |
| Wihlborgs Fastigheter AB | 4,817 | 95,139 |
| | | 1,077,706 |
| |
| Switzerland 0.9% |
| Allreal Holding AG | 1,213 | 263,050 |
| Mobimo Holding AG * | 460 | 154,396 |
| PSP Swiss Property AG | 1,637 | 211,641 |
| Swiss Prime Site AG | 5,516 | 540,532 |
| | | 1,169,619 |
| |
| Taiwan 0.4% |
| Chong Hong Construction Co., Ltd. | 25,000 | 68,306 |
| Farglory Land Development Co. Ltd | 37,000 | 80,949 |
| Highwealth Construction Corp. | 125,470 | 219,814 |
| Huaku Development Co., Ltd | 27,000 | 87,649 |
| Ruentex Development Co., Ltd | 54,388 | 140,431 |
| | | 597,149 |
| |
| Thailand 0.7% |
| AP Thailand PCL NVDR | 422,861 | 137,451 |
| Central Pattana PCL NVDR | 133,700 | 227,361 |
| Land & Houses PCL NVDR | 858,500 | 252,830 |
| Quality Houses PCL NVDR | 1,062,100 | 74,294 |
| Sansiri PCL NVDR | 3,190,983 | 120,861 |
| Supalai PCL NVDR | 215,282 | 144,985 |
| | | 957,782 |
| |
| United Arab Emirates 1.3% |
| Aldar Properties PJSC | 380,541 | 434,905 |
| Emaar Development PJSC * | 157,369 | 184,090 |
| Emaar Properties PJSC | 796,026 | 1,102,652 |
| | | 1,721,647 |
| |
| United Kingdom 2.2% |
| Big Yellow Group plc | 6,302 | 119,825 |
| Derwent London plc | 3,314 | 135,104 |
| Grainger plc | 30,078 | 112,289 |
| Great Portland Estates plc | 18,046 | 163,132 |
| Hammerson plc | 239,787 | 118,796 |
| Intu Properties plc *(a)(b) | 2,915,975 | 0 |
| Land Securities Group plc | 61,320 | 649,791 |
| NewRiver REIT plc | 78,765 | 93,723 |
| Rightmove plc | 15,539 | 139,190 |
| Safestore Holdings plc | 7,461 | 127,414 |
| Savills plc | 13,219 | 225,618 |
| Segro plc | 17,111 | 297,578 |
| The British Land Co., plc | 65,620 | 463,718 |
| The Unite Group plc | 7,913 | 113,188 |
| Tritax Big Box REIT plc | 28,274 | 89,088 |
| Workspace Group plc | 9,713 | 100,976 |
| | | 2,949,430 |
| |
| SECURITY | NUMBER
OF SHARES | VALUE ($) |
| United States 48.0% |
| Acadia Realty Trust | 5,430 | 116,419 |
| Alexander & Baldwin, Inc. | 11,183 | 250,835 |
| Alexandria Real Estate Equities, Inc. | 2,758 | 522,365 |
| American Assets Trust, Inc. | 2,956 | 108,071 |
| American Campus Communities, Inc. | 8,693 | 467,770 |
| American Homes 4 Rent, Class A | 7,788 | 296,022 |
| American Tower Corp. | 9,964 | 2,260,533 |
| Americold Realty Trust | 5,545 | 148,162 |
| Apartment Income REIT Corp. | 8,753 | 451,742 |
| Apple Hospitality REIT, Inc. | 34,168 | 604,432 |
| AvalonBay Communities, Inc. | 5,557 | 1,325,845 |
| Boston Properties, Inc. | 10,338 | 1,264,441 |
| Brandywine Realty Trust | 20,684 | 275,718 |
| Brixmor Property Group, Inc. | 28,358 | 712,353 |
| Camden Property Trust | 3,884 | 641,287 |
| CareTrust REIT, Inc. | 3,301 | 57,768 |
| CBRE Group, Inc., Class A | 20,158 | 1,952,302 |
| Centerspace | 1,064 | 100,005 |
| Chatham Lodging Trust * | 9,558 | 131,422 |
| Corporate Office Properties Trust | 9,300 | 243,753 |
| CoStar Group, Inc. * | 3,178 | 193,890 |
| Cousins Properties, Inc. | 5,423 | 209,490 |
| Crown Castle International Corp. | 12,634 | 2,104,698 |
| CubeSmart | 6,571 | 316,788 |
| Cushman & Wakefield plc * | 7,400 | 162,208 |
| CyrusOne, Inc. | 3,208 | 289,843 |
| DiamondRock Hospitality Co. * | 31,737 | 303,088 |
| Digital Realty Trust, Inc. | 7,857 | 1,060,066 |
| DigitalBridge Group, Inc. * | 94,887 | 687,931 |
| Diversified Healthcare Trust | 152,112 | 438,083 |
| Douglas Emmett, Inc. | 10,034 | 318,078 |
| Duke Realty Corp. | 10,072 | 533,816 |
| Easterly Government Properties, Inc. | 2,978 | 62,002 |
| EastGroup Properties, Inc. | 910 | 173,592 |
| Empire State Realty Trust, Inc., Class A | 18,155 | 171,746 |
| EPR Properties | 6,335 | 315,483 |
| Equinix, Inc. | 2,266 | 1,608,248 |
| Equity Commonwealth * | 6,114 | 162,449 |
| Equity LifeStyle Properties, Inc. | 4,545 | 339,148 |
| Equity Residential | 17,843 | 1,522,008 |
| Essex Property Trust, Inc. | 2,255 | 715,218 |
| Extra Space Storage, Inc. | 3,511 | 660,595 |
| Federal Realty Investment Trust | 3,472 | 408,238 |
| First Industrial Realty Trust, Inc. | 3,526 | 203,027 |
| Gaming & Leisure Properties, Inc. | 8,439 | 383,215 |
| Global Net Lease, Inc. | 6,210 | 88,244 |
| Healthcare Realty Trust, Inc. | 7,163 | 186,811 |
| Healthcare Trust of America, Inc., Class A | 8,638 | 253,871 |
| Healthpeak Properties, Inc. | 30,675 | 952,765 |
| Hersha Hospitality Trust * | 12,158 | 112,218 |
| Highwoods Properties, Inc. | 7,155 | 311,958 |
| Host Hotels & Resorts, Inc. * | 117,943 | 2,154,819 |
| Hudson Pacific Properties, Inc. | 11,443 | 302,095 |
| Independence Realty Trust, Inc. | 4,729 | 119,502 |
| Industrial Logistics Properties Trust | 3,525 | 78,854 |
| Invitation Homes, Inc. | 14,705 | 555,849 |
| Iron Mountain, Inc. | 26,582 | 1,307,303 |
| JBG SMITH Properties | 5,237 | 139,723 |
| Jones Lang LaSalle, Inc. * | 5,445 | 1,340,668 |
| Kennedy-Wilson Holdings, Inc. | 4,871 | 107,844 |
| Kilroy Realty Corp. | 5,618 | 402,361 |
| Kimco Realty Corp. | 39,287 | 924,423 |
| Kite Realty Group Trust | 23,481 | 514,938 |
| Lamar Advertising Co., Class A | 5,065 | 552,389 |
| Life Storage, Inc. | 2,642 | 334,451 |
| LTC Properties, Inc. | 2,485 | 84,068 |
Schwab Fundamental Global Real Estate Index Fund | Annual Report
Schwab Fundamental Global Real Estate Index Fund
Portfolio Holdings as of February 28, 2022 (continued)
| SECURITY | NUMBER
OF SHARES | VALUE ($) |
| LXP Industrial Trust | 16,184 | 250,205 |
| Marcus & Millichap, Inc. * | 1,964 | 97,670 |
| Medical Properties Trust, Inc. | 15,985 | 325,135 |
| Mid-America Apartment Communities, Inc. | 4,252 | 870,002 |
| National Health Investors, Inc. | 2,121 | 113,071 |
| National Retail Properties, Inc. | 5,381 | 229,284 |
| Newmark Group, Inc., Class A | 7,056 | 124,750 |
| Office Properties Income Trust | 6,957 | 174,273 |
| Omega Healthcare Investors, Inc. | 13,344 | 375,900 |
| Orion Office REIT, Inc. * | 1,897 | 32,306 |
| Outfront Media, Inc. | 17,363 | 463,592 |
| Paramount Group, Inc. | 27,328 | 305,800 |
| Park Hotels & Resorts, Inc. * | 44,831 | 844,616 |
| Pebblebrook Hotel Trust | 15,141 | 340,824 |
| Physicians Realty Trust | 7,129 | 115,918 |
| Piedmont Office Realty Trust, Inc., Class A | 16,806 | 286,374 |
| Preferred Apartment Communities, Inc. | 10,173 | 256,970 |
| Prologis, Inc. | 12,083 | 1,762,306 |
| PS Business Parks, Inc. | 872 | 138,901 |
| Public Storage | 4,281 | 1,519,841 |
| Realogy Holdings Corp. * | 41,523 | 754,888 |
| Realty Income Corp. | 19,267 | 1,273,356 |
| Regency Centers Corp. | 7,497 | 493,977 |
| Retail Opportunity Investments Corp. | 6,520 | 118,403 |
| Rexford Industrial Realty, Inc. | 1,569 | 110,034 |
| RLJ Lodging Trust | 36,047 | 504,298 |
| RPT Realty | 10,516 | 136,182 |
| Ryman Hospitality Properties, Inc. * | 3,599 | 317,108 |
| Sabra Health Care REIT, Inc. | 14,057 | 188,786 |
| SBA Communications Corp. | 1,223 | 371,046 |
| Seritage Growth Properties, Class A * | 4,809 | 49,004 |
| Service Properties Trust | 66,007 | 569,640 |
| Simon Property Group, Inc. | 20,344 | 2,798,521 |
| SITE Centers Corp. | 19,228 | 298,995 |
| SL Green Realty Corp. | 9,431 | 749,953 |
| Spirit Realty Capital, Inc. | 5,665 | 262,686 |
| STAG Industrial, Inc. | 4,213 | 164,138 |
| STORE Capital Corp. | 4,495 | 138,086 |
| Summit Hotel Properties, Inc. * | 16,727 | 165,430 |
| Sun Communities, Inc. | 2,465 | 446,165 |
| Sunstone Hotel Investors, Inc. * | 36,573 | 386,942 |
| Tanger Factory Outlet Centers, Inc. | 13,356 | 222,778 |
| Terreno Realty Corp. | 1,163 | 80,003 |
| The GEO Group, Inc. * | 58,989 | 351,574 |
| The Howard Hughes Corp. * | 953 | 91,088 |
| The Macerich Co. | 34,338 | 525,371 |
| The Necessity Retail REIT, Inc. | 10,352 | 72,878 |
| UDR, Inc. | 9,713 | 532,952 |
| Uniti Group, Inc. | 29,485 | 382,420 |
| Urban Edge Properties | 9,867 | 179,777 |
| Ventas, Inc. | 39,291 | 2,121,714 |
| Veris Residential, Inc. * | 9,893 | 167,192 |
| VICI Properties, Inc. | 11,354 | 317,458 |
| Vornado Realty Trust | 19,954 | 863,609 |
| Washington Real Estate Investment Trust | 7,067 | 165,085 |
| Welltower, Inc. | 29,609 | 2,466,134 |
| WP Carey, Inc. | 5,044 | 390,406 |
| Xenia Hotels & Resorts, Inc. * | 17,687 | 327,917 |
| Zillow Group, Inc., Class A * | 347 | 19,873 |
| Zillow Group, Inc., Class C * | 661 | 38,021 |
| | | 64,340,973 |
Total Common Stocks
(Cost $108,069,484) | 133,401,922 |
|
| SECURITY | NUMBER
OF SHARES | VALUE ($) |
| INVESTMENT COMPANIES 0.0% OF NET ASSETS |
| |
| United States 0.0% |
| iShares Core US REIT ETF | 275 | 16,764 |
Total Investment Companies
(Cost $16,775) | 16,764 |
| SECURITY | NUMBER OF SHARES/
FACE AMOUNT | VALUE ($) |
| SHORT-TERM INVESTMENTS 0.4% OF NET ASSETS |
| |
| Money Market Funds 0.1% |
| State Street Institutional U.S. Government Money Market Fund, Premier Class 0.03% (c)(d) | 81,958 | 81,958 |
| |
| Time Deposits 0.3% |
| Australia & New Zealand Banking Group Ltd. |
| AUD | | |
| (0.22%), 03/01/22 (e)(f) | 113,568 | 82,485 |
| Barclays Capital, Inc. |
| USD | | |
| 0.01%, 03/01/22 (e) | 320,870 | 320,870 |
| BNP Paribas SA |
| CHF | | |
| (1.45%), 03/01/22 (e)(f) | 124 | 135 |
| GBP | | |
| 0.09%, 03/01/22 (e) | 1,122 | 1,506 |
| Brown Brothers Harriman & Co. |
| HKD | | |
| 0.01%, 03/01/22 (e) | 1,051 | 135 |
| SEK | | |
| (0.30%), 03/01/22 (e)(f) | 1,235 | 130 |
| SGD | | |
| 0.07%, 03/01/22 (e) | 2,252 | 1,661 |
| ZAR | | |
| 3.70%, 03/01/22 (e) | 4,140 | 269 |
| Citibank NA |
| EUR | | |
| (0.78%), 03/01/22 (e)(f) | 120 | 135 |
| Royal Bank of Canada |
| CAD | | |
| 0.01%, 03/01/22 (e) | 10,968 | 8,653 |
| Sumitomo Mitsui Banking Corp. |
| JPY | | |
| (0.34%), 03/01/22 (e)(f) | 569,126 | 4,950 |
| | | 420,929 |
Total Short-Term Investments
(Cost $502,887) | 502,887 |
Total Investments in Securities
(Cost $108,589,146) | 133,921,573 |
Schwab Fundamental Global Real Estate Index Fund | Annual Report
Schwab Fundamental Global Real Estate Index Fund
Portfolio Holdings as of February 28, 2022 (continued)
| | NUMBER OF
CONTRACTS | NOTIONAL
AMOUNT
($) | CURRENT VALUE/
UNREALIZED
DEPRECIATION
($) |
| FUTURES CONTRACTS |
| Long | | | |
| Dow Jones U.S. Real Estate Index, expires 03/18/22 | 4 | 158,160 | (1,657) |
| MSCI EAFE Index, expires 03/18/22 | 2 | 215,980 | (7,564) |
| MSCI Emerging Markets Index, expires 03/18/22 | 2 | 117,550 | (5,846) |
| Net Unrealized Depreciation | (15,067) |
| * | Non-income producing security. |
| (a) | Fair valued by management using significant unobservable inputs in accordance with procedures approved by the fund’s Board of Trustees. |
| (b) | All or a portion of this security is on loan. Securities on loan were valued at $0. |
| (c) | The rate shown is the 7-day yield. |
| (d) | Security purchased with cash collateral received for securities on loan. |
| (e) | The rate shown is the current daily overnight rate. Face amount is disclosed in local currency. |
| (f) | Rate is negative due to the current daily overnight rate at the central bank of the denominated currency and therefore is non-income producing. |
| CVA — | Dutch Certificate |
| ETF — | Exchange traded fund |
| NVDR — | Non-Voting Depositary Receipt |
| REIT — | Real Estate Investment Trust |
| AUD — | Australian Dollar |
| CAD — | Canadian Dollar |
| CHF — | Swiss Franc |
| EUR — | Euro |
| GBP — | British Pound |
| HKD — | Hong Kong Dollar |
| JPY — | Japanese Yen |
| SEK — | Swedish Krona |
| SGD — | Singapore Dollar |
| USD — | U.S. Dollar |
| ZAR — | South African Rand |
Schwab Fundamental Global Real Estate Index Fund | Annual Report
Schwab Fundamental Global Real Estate Index Fund
Portfolio Holdings as of February 28, 2022 (continued)
The following is a summary of the inputs used to value the fund’s investments as of February 28, 2022 (see financial note 2(a) for additional information):
| DESCRIPTION | QUOTED PRICES IN
ACTIVE MARKETS FOR
IDENTICAL ASSETS
(LEVEL 1) | OTHER SIGNIFICANT
OBSERVABLE INPUTS
(LEVEL 2) | SIGNIFICANT
UNOBSERVABLE INPUTS
(LEVEL 3) | TOTAL |
| Assets | | | | |
| Common Stocks1 | $69,464,960 | $— | $— | $69,464,960 |
| Australia | — | 5,144,680 | — | 5,144,680 |
| Austria | 133,753 | 166,502 | — | 300,255 |
| Belgium | — | 559,293 | — | 559,293 |
| Brazil | — | 342,410 | — | 342,410 |
| China | 737,465 | 13,878,309 | 22,385 | 14,638,159 |
| France | — | 2,141,445 | — | 2,141,445 |
| Germany | — | 2,487,428 | — | 2,487,428 |
| Hong Kong | 544,526 | 9,929,530 | — | 10,474,056 |
| Japan | 98,030 | 10,958,077 | — | 11,056,107 |
| Netherlands | — | 2,148,536 | — | 2,148,536 |
| Philippines | 523,562 | 1,085,344 | — | 1,608,906 |
| Singapore | — | 3,138,452 | — | 3,138,452 |
| South Africa | 1,027,595 | 396,307 | — | 1,423,902 |
| Sweden | — | 1,077,706 | — | 1,077,706 |
| Switzerland | — | 1,169,619 | — | 1,169,619 |
| Taiwan | — | 597,149 | — | 597,149 |
| Thailand | — | 957,782 | — | 957,782 |
| United Arab Emirates | — | 1,721,647 | — | 1,721,647 |
| United Kingdom | 221,137 | 2,728,293 | 0* | 2,949,430 |
| Investment Companies1 | 16,764 | — | — | 16,764 |
| Short-Term Investments1 | 81,958 | — | — | 81,958 |
| Time Deposits | — | 420,929 | — | 420,929 |
| Liabilities | | | | |
| Futures Contracts2 | (15,067) | — | — | (15,067) |
| Total | $72,834,683 | $61,049,438 | $22,385 | $133,906,506 |
| * | Level 3 amount shown includes securities determined to have no value at February 28, 2022. |
| 1 | As categorized in the Portfolio Holdings. |
| 2 | Futures contracts are reported at cumulative unrealized appreciation or depreciation. |
Fund investments in mutual funds and ETFs are classified as Level 1, without consideration to the classification level of the underlying securities held by the mutual funds and ETFs, which could be Level 1, Level 2 or Level 3.
Schwab Fundamental Global Real Estate Index Fund | Annual Report
Schwab Fundamental Global Real Estate Index Fund
Statement of Assets and Liabilities
As of February 28, 2022
| Assets |
| Investments in securities, at value - unaffiliated (cost $108,589,146) including securities on loan of $0 | | $133,921,573 |
| Foreign currency, at value (cost $16,394) | | 16,396 |
| Deposit with broker for futures contracts | | 43,765 |
| Receivables: | | |
| Investments sold | | 2,548,847 |
| Fund shares sold | | 268,528 |
| Dividends | | 107,089 |
| Foreign tax reclaims | | 83,047 |
| Income from securities on loan | | 1,220 |
| Prepaid expenses | + | 16,151 |
| Total assets | | 137,006,616 |
| Liabilities |
| Collateral held for securities on loan | | 81,958 |
| Payables: | | |
| Investments bought | | 2,668,566 |
| Fund shares redeemed | | 156,365 |
| Investment adviser fees | | 40,667 |
| Variation margin on futures contracts | + | 8,738 |
| Total liabilities | | 2,956,294 |
| Net assets | | $134,050,322 |
| Net Assets by Source |
| Capital received from investors | | $128,910,626 |
| Total distributable earnings | + | 5,139,696 |
| Net assets | | $134,050,322 |
| Net Asset Value (NAV) |
| Net Assets | ÷ | Shares
Outstanding | = | NAV |
| $134,050,322 | | 11,681,566 | | $11.48 |
| | | | | |
| | | | | |
Schwab Fundamental Global Real Estate Index Fund | Annual Report
Schwab Fundamental Global Real Estate Index Fund
Statement of Operations
| For the period March 1, 2021 through February 28, 2022 |
| Investment Income |
| Dividends received from securities - unaffiliated (net of foreign withholding tax of $200,761) | | $4,635,182 |
| Securities on loan, net | + | 61,146 |
| Total investment income | | 4,696,328 |
| Expenses |
| Investment adviser fees | | 562,994 |
| Total expenses | – | 562,994 |
| Net investment income | | 4,133,334 |
| REALIZED AND UNREALIZED GAINS (LOSSES) |
| Net realized losses on sales of securities - unaffiliated | | (699,596) |
| Net realized gains on futures contracts | | 73,135 |
| Net realized losses on foreign currency transactions | + | (16,983) |
| Net realized losses | | (643,444) |
| Net change in unrealized appreciation (depreciation) on securities - unaffiliated | | 7,332,465 |
| Net change in unrealized appreciation (depreciation) on futures contracts | | (4,711) |
| Net change in unrealized appreciation (depreciation) on foreign currency translations | + | 3,823 |
| Net change in unrealized appreciation (depreciation) | + | 7,331,577 |
| Net realized and unrealized gains | | 6,688,133 |
| Increase in net assets resulting from operations | | $10,821,467 |
Schwab Fundamental Global Real Estate Index Fund | Annual Report
Schwab Fundamental Global Real Estate Index Fund
Statement of Changes in Net Assets
For the current and prior report periods
| OPERATIONS |
| | 3/1/21-2/28/22 | 3/1/20-2/28/21 |
| Net investment income | | $4,133,334 | $4,881,835 |
| Net realized losses | | (643,444) | (13,175,153) |
| Net change in unrealized appreciation (depreciation) | + | 7,331,577 | 9,707,498 |
| Increase in net assets resulting from operations | | $10,821,467 | $1,414,180 |
| DISTRIBUTIONS TO SHAREHOLDERS |
| Total distributions | | ($4,151,292) | ($5,517,992) |
| TRANSACTIONS IN FUND SHARES |
| | 3/1/21-2/28/22 | 3/1/20-2/28/21 |
| | | SHARES | VALUE | SHARES | VALUE |
| Shares sold | | 2,976,893 | $35,250,664 | 5,247,518 | $47,285,146 |
| Shares reinvested | | 252,264 | 2,954,749 | 427,872 | 4,177,814 |
| Shares redeemed | + | (5,736,493) | (67,586,304) | (9,188,770) | (86,314,753) |
| Net transactions in fund shares | | (2,507,336) | ($29,380,891) | (3,513,380) | ($34,851,793) |
| SHARES OUTSTANDING AND NET ASSETS |
| | 3/1/21-2/28/22 | 3/1/20-2/28/21 |
| | | SHARES | NET ASSETS | SHARES | NET ASSETS |
| Beginning of period | | 14,188,902 | $156,761,038 | 17,702,282 | $195,716,643 |
| Total decrease | + | (2,507,336) | (22,710,716) | (3,513,380) | (38,955,605) |
| End of period | | 11,681,566 | $134,050,322 | 14,188,902 | $156,761,038 |
Schwab Fundamental Global Real Estate Index Fund | Annual Report
Schwab Fundamental Global Real Estate Index Fund
1. Business Structure of the Fund:
Schwab Fundamental Global Real Estate Index Fund is a series of Schwab Capital Trust (the trust), a no-load, open-end management investment company. The trust is organized as a Massachusetts business trust and is registered under the Investment Company Act of 1940, as amended (the 1940 Act). The list below shows all the funds in the trust as of the end of the period, including the fund discussed in this report, which is highlighted:
| SCHWAB CAPITAL TRUST (ORGANIZED MAY 7, 1993) |
| Schwab Fundamental Global Real Estate Index Fund | Schwab Target 2015 Fund |
| Schwab Fundamental US Large Company Index Fund | Schwab Target 2020 Fund |
| Schwab Fundamental US Small Company Index Fund | Schwab Target 2025 Fund |
| Schwab Fundamental International Large Company Index Fund | Schwab Target 2030 Fund |
| Schwab Fundamental International Small Company Index Fund | Schwab Target 2035 Fund |
| Schwab Fundamental Emerging Markets Large Company Index Fund | Schwab Target 2040 Fund |
| Schwab S&P 500 Index Fund | Schwab Target 2045 Fund |
| Schwab Small-Cap Index Fund® | Schwab Target 2050 Fund |
| Schwab Total Stock Market Index Fund® | Schwab Target 2055 Fund |
| Schwab U.S. Large-Cap Growth Index Fund | Schwab Target 2060 Fund |
| Schwab U.S. Large-Cap Value Index Fund | Schwab Target 2065 Fund |
| Schwab U.S. Mid-Cap Index Fund | Schwab Monthly Income Fund — Moderate Payout |
| Schwab International Index Fund® | Schwab Monthly Income Fund — Enhanced Payout |
| Schwab MarketTrack All Equity Portfolio™ | Schwab Monthly Income Fund — Maximum Payout |
| Schwab MarketTrack Growth Portfolio™ | Schwab Target 2010 Index Fund |
| Schwab MarketTrack Balanced Portfolio™ | Schwab Target 2015 Index Fund |
| Schwab MarketTrack Conservative Portfolio™ | Schwab Target 2020 Index Fund |
| Schwab International Opportunities Fund™ | Schwab Target 2025 Index Fund |
| Schwab Balanced Fund | Schwab Target 2030 Index Fund |
| Schwab Core Equity Fund | Schwab Target 2035 Index Fund |
| Schwab Dividend Equity Fund | Schwab Target 2040 Index Fund |
| Schwab Large-Cap Growth Fund | Schwab Target 2045 Index Fund |
| Schwab Small-Cap Equity Fund | Schwab Target 2050 Index Fund |
| Schwab Health Care Fund | Schwab Target 2055 Index Fund |
| Schwab International Core Equity Fund | Schwab Target 2060 Index Fund |
| Schwab Target 2010 Fund | Schwab Target 2065 Index Fund |
Schwab Fundamental Global Real Estate Index Fund offers one share class. Shares are bought and sold at closing net asset value per share (NAV), which is the price for all outstanding shares of the fund. Each share has a par value of 1/1,000 of a cent, and the fund’s Board of Trustees (the Board) may authorize the issuance of as many shares as necessary.
The fund maintains its own account for purposes of holding assets and accounting, and is considered a separate entity for tax purposes. Within its account, the fund may also keep certain assets in segregated accounts, as required by securities law.
2. Significant Accounting Policies:
The following is a summary of the significant accounting policies the fund uses in its preparation of financial statements. The fund follows the investment company accounting and reporting guidance of the Financial Accounting Standards Board (FASB) Accounting Standard Codification Topic 946 Financial Services — Investment Companies. The accounting policies are in conformity with accounting principles generally accepted in the United States of America (GAAP).
The fund may invest in certain mutual funds and exchange-traded funds (ETFs), which are referred to as "underlying funds". For more information about the underlying funds’ operations and policies, please refer to those funds’ semiannual and annual reports, which are filed with the U.S. Securities and Exchange Commission (SEC) and are available on the SEC’s website at www.sec.gov.
(a) Security Valuation:
Under procedures approved by the Board, the investment adviser has formed a Pricing Committee to administer the pricing and valuation of portfolio securities and other assets and to ensure that prices used for internal purposes or provided by third parties reasonably reflect fair value. Among other things, these procedures allow the fund to utilize independent pricing services, quotations from securities and financial instrument dealers and other market sources to determine fair value.
Schwab Fundamental Global Real Estate Index Fund | Annual Report
Schwab Fundamental Global Real Estate Index Fund
Financial Notes (continued)
2. Significant Accounting Policies (continued):
The fund values the securities in its portfolio every business day. The fund uses the following policies to value various types of securities:
• Securities traded on an exchange or over-the-counter: Traded securities are valued at the closing value for the day, or, on days when no closing value has been reported, at the mean of the most recent bid and ask quotes. Securities that are primarily traded on foreign exchanges are valued at the official closing price or the last sales price on the exchange where the securities are principally traded with these values then translated into U.S. dollars at the current exchange rate, unless these securities are fair valued as discussed below.
• Foreign equity security fair valuation: The Board has adopted procedures to fair value foreign equity securities that are traded in markets that close prior to the fund valuing its holdings. By fair valuing securities whose prices may have been affected by events occurring after the close of trading, the fund seeks to establish prices that investors might expect to realize upon the current sales of these securities. This methodology is designed to deter “arbitrage” market timers, who seek to exploit delays between the change in the value of the fund’s portfolio holdings and the NAV of the fund’s shares, and seeks to help ensure that the prices at which the fund’s shares are purchased and redeemed are fair and do not result in dilution of shareholder interest or other harm to shareholders. When fair value pricing is used at the open or close of a reporting period, it may cause a temporary divergence between the return of the fund and that of its comparative index or benchmark. The Board regularly reviews fair value determinations made by the fund pursuant to these procedures.
• Futures contracts: Futures contracts are valued at their settlement prices as of the close of their exchanges.
• Mutual funds: Mutual funds are valued at their respective NAVs.
• Cash management sweep time deposits: Balances held in cash management sweep time deposits are accounted for on a cost basis, which approximates fair value.
• Securities for which no quoted value is available: The Board has adopted procedures to fair value the fund’s securities when market prices are not “readily available” or are unreliable. For example, the fund may fair value a security when it is de-listed or its trading is halted or suspended; when a security’s primary pricing source is unable or unwilling to provide a price; or when a security’s primary trading market is closed during regular market hours. The fund makes fair value determinations in good faith in accordance with the fund’s valuation procedures. The Pricing Committee considers a number of factors, including unobservable market inputs, when arriving at fair value. The Pricing Committee may employ techniques such as the review of related or comparable assets or liabilities, related market activities, recent transactions, market multiples, book values, transactional back-testing, disposition analysis and other relevant information. The Pricing Committee regularly reviews these inputs and assumptions to calibrate the valuations. Due to the subjective and variable nature of fair value pricing, there can be no assurance that the fund could obtain the fair value assigned to the security upon the sale of such security. The Board convenes on a regular basis to review fair value determinations made by the fund pursuant to the valuation procedures.
In accordance with the authoritative guidance on fair value measurements and disclosures under GAAP, the fund discloses the fair value of its investments in a hierarchy that prioritizes the significant inputs to valuation techniques used to measure the fair value. The hierarchy gives the highest priority to valuations based upon unadjusted quoted prices in active markets for identical assets or liabilities (Level 1 measurements) and the lowest priority to valuations based upon unobservable inputs that are significant to the valuation (Level 3 measurements). If inputs used to measure the financial instruments fall within different levels of the hierarchy, the categorization is based on the lowest level input that is significant to the valuation. If the fund determines that either the volume and/or level of activity for an asset or liability has significantly decreased (from normal conditions for that asset or liability) or price quotations or observable inputs are not associated with orderly transactions, increased analysis and management judgment will be required to estimate fair value.
The three levels of the fair value hierarchy are as follows:
• Level 1 — quoted prices in active markets for identical securities— Investments whose values are based on quoted market prices in active markets, and whose values are therefore classified as Level 1 prices, include active listed equities, mutual funds, ETFs and futures contracts. Investments in mutual funds are valued daily at their NAVs, and investment in ETFs are valued daily at the last reported sale price or the official closing price, which are classified as Level 1 prices, without consideration to the classification level of the underlying securities held by an underlying fund.
• Level 2 — other significant observable inputs (including quoted prices for similar securities, interest rates, prepayment speeds, credit risk, etc.)— Investments that trade in markets that are not considered to be active, but whose values are based on quoted market prices, dealer quotations or valuations provided by alternative pricing sources supported by observable inputs are classified as Level 2 prices. These generally include U.S. government and sovereign obligations, most government agency
Schwab Fundamental Global Real Estate Index Fund | Annual Report
Schwab Fundamental Global Real Estate Index Fund
Financial Notes (continued)
2. Significant Accounting Policies (continued):
securities, investment-grade corporate bonds, certain mortgage products, less liquid listed equities, and state, municipal and provincial obligations. In addition, international securities whose markets close hours before the fund values its holdings may require fair valuations due to significant movement in the U.S. markets occurring after the daily close of the foreign markets. The Board has approved a vendor that calculates fair valuations of international equity securities based on a number of factors that appear to correlate to the movements in the U.S. markets.
• Level 3 — significant unobservable inputs (including the fund’s own assumptions in determining the fair value of investments)— Investments whose values are classified as Level 3 prices have significant unobservable inputs, as they may trade infrequently or not at all. When observable prices are not available for these securities, the fund uses one or more valuation techniques for which sufficient and reliable data is available. The inputs used by the fund in estimating the value of Level 3 prices may include the original transaction price, quoted prices for similar securities or assets in active markets, completed or pending third-party transactions in the underlying investment or comparable issuers, and changes in financial ratios or cash flows. Level 3 prices may also be adjusted to reflect illiquidity and/or non-transferability, with the amount of such discount estimated by the fund in the absence of market information. Assumptions used by the fund due to the lack of observable inputs may significantly impact the resulting fair value and therefore the fund’s results of operations.
The inputs or methodology used for valuing securities are not necessarily an indication of the risk associated with investing in those securities.
The levels associated with valuing the fund’s investments as of February 28, 2022 are disclosed in the Portfolio Holdings.
(b) Accounting Policies for certain Portfolio Investments (if held):
Futures Contracts: Futures contracts are instruments that represent an agreement between two parties that obligates one party to buy, and the other party to sell, specific instruments at an agreed upon price on a stipulated future date. The fund must give the broker a deposit of cash and/or securities (initial margin) whenever it enters into a futures contract. The amount of the deposit may vary from one contract to another. Subsequent payments (variation margin) are made or received by the fund depending on the daily fluctuations in the value of the futures contract and are accounted for as unrealized appreciation or depreciation until the contract is closed, at which time the gains or losses are realized. Futures contracts are traded publicly on exchanges, and their value may change daily.
Securities Lending: Under the trust’s Securities Lending Program, the fund (lender) may make short-term loans of its securities to another party (borrower) to generate additional revenue for the fund. The borrower pledges collateral in the form of cash, securities issued or fully guaranteed by the U.S. government or foreign governments, or letters of credit issued by a bank. Collateral at the individual loan level is required to be maintained on a daily marked-to-market basis in an amount at least equal to the current value of the securities loaned. The lending agent provides the fund with indemnification against borrower default (the borrower fails to return the security on loan) reducing the risk of loss as a result of default. The cash collateral of securities loaned is currently invested in money market portfolios operating pursuant to Rule 2a-7 under the 1940 Act. The fund bears the risk of loss with respect to the investment of cash collateral. The terms of the securities lending agreement allow the fund or the lending agent to terminate any loan at any given time and the securities must be returned within the earlier of the standard trade settlement period or the specified time period under the relevant securities lending agreement. Securities lending income, as disclosed in the fund’s Statement of Operations, if applicable, represents the income earned from the investment of the cash collateral plus any fees paid by borrowers, less the fees paid to the lending agent and broker rebates which are subject to adjustments pursuant to the securities lending agreement. On loans not collateralized by cash, a fee is received from the borrower, and is allocated between the fund and the lending agent. The aggregate fair value of securities loaned will not at any time exceed one-third of the total assets of the fund, including collateral received from the loan. Securities lending fees paid to the unaffiliated lending agents start at 10% of gross lending revenue, with subsequent breakpoints to a low of 5%. In this context, the gross lending revenue equals the income received from the investment of cash collateral and fees paid by borrowers less any rebates paid to the borrowers. Any expenses charged by the cash collateral fund are in addition to these fees. All remaining revenue is retained by the fund, as applicable. No portion of lending revenue is paid to or retained by the investment adviser or any of its affiliates.
As of February 28, 2022, the fund had securities on loan, all of which were classified as common stocks. The value of the securities on loan and the related collateral as of February 28, 2022 are disclosed in the fund’s Portfolio Holdings and Statement of Assets and Liabilities.
Cash Management Transactions: The fund may subscribe to the Brown Brothers Harriman & Co. (BBH) Cash Management Service Sweep (CMS Sweep). The BBH CMS Sweep is an investment product that automatically sweeps the fund’s cash balances into overnight offshore time deposits with either the BBH Grand Cayman branch or a branch of a pre-approved commercial bank. This fully automated program allows the fund to earn interest on cash balances, however, interest rates may be negative due to overnight
Schwab Fundamental Global Real Estate Index Fund | Annual Report
Schwab Fundamental Global Real Estate Index Fund
Financial Notes (continued)
2. Significant Accounting Policies (continued):
rates at the central bank of the denominated currency. Excess cash invested with deposit institutions domiciled outside of the U.S., as with any offshore deposit, may be subject to sovereign actions in the jurisdiction of the deposit institution including, but not limited to, freeze, seizure or diminution. The fund bears the risk associated with the repayment of principal and payment of interest on such instruments by the institution with which the deposit is ultimately placed.
Passive Foreign Investment Companies: The fund may own shares in certain foreign corporations that meet the Internal Revenue Code definition of a Passive Foreign Investment Company (PFIC). The fund may elect for tax purposes to mark-to-market annually the shares of each PFIC lot held and would be required to distribute as ordinary income to shareholders any such marked-to-market gains (as well as any gains realized on sale).
Central Securities Depositories Regulation: Effective February 1, 2022, the Central Securities Depositories Regulation (CSDR) introduced new measures for the authorization and supervision of European Union Central Security Depositories and sets out to create a common set of prudential, organizational, and conduct of business standards at a European level. CSDR is designed to support securities settlement and operational aspects of securities settlement, including the provision of shorter settlement periods; mandatory buy-ins; and cash penalties, to prevent and address settlement fails. CSDR measures are aimed to prevent settlement fails by ensuring that all transaction details are provided to facilitate settlement, as well as further incentivizing timely settlement by imposing cash penalty fines and buy-ins. The Fund may be subject to pay cash penalties and may also receive cash penalties with certain counterparties in instances where there are settlement fails. At this time, management believes the adoption of CSDR will not have a material impact to the financial statements.
(c) Security Transactions:
Security transactions are recorded as of the date the order to buy or sell the security is executed. Realized gains and losses from security transactions are based on the identified costs of the securities involved.
Assets and liabilities denominated in foreign currencies are reported in U.S. dollars. For assets and liabilities held on a given date, the dollar value is based on market exchange rates in effect on that date. Transactions involving foreign currencies, including purchases, sales, income receipts and expense payments, are calculated using exchange rates in effect on the transaction date. Realized foreign exchange gains or losses arise from sales of foreign currencies, currency gains or losses realized between the trade and settlement dates on securities transactions and the differences between the recorded amounts of dividends, interest, and foreign withholding taxes and the U.S. dollar equivalent of the amounts actually received or paid. Net unrealized foreign exchange appreciation or depreciation arises from changes in foreign exchange rates on foreign denominated assets and liabilities other than investments in securities held at the end of the reporting period. These realized and unrealized foreign exchange gains or losses are reported in foreign currency transactions or translations in the Statement of Operations. The fund does not isolate the portion of the fluctuations on investments resulting from changes in foreign currency exchange rates from the fluctuations in market prices of investments held. Such fluctuations are included with the net realized and unrealized gain or loss from investments.
Gains realized by the fund on the sale of securities in certain foreign countries may be subject to non-U.S. taxes. In those instances, the fund records a liability based on unrealized appreciation to provide for potential non-U.S. taxes payable upon the sale of these securities.
When the fund closes out a futures contract position, it calculates the difference between the value of the position at the beginning and at the end of the contract, and records a realized gain or loss accordingly.
The fund invests in real estate investment trusts (REITs) which report information on the source of their distributions annually. The fund’s policy is to record all REIT distributions initially as dividend income on the ex-dividend date and then re-designate them as return of capital and/or capital gain distributions at the end of the reporting period based on information provided annually by each REIT, and management estimates such re-designations when actual information has not yet been reported.
(d) Investment Income:
Interest income is recorded as it accrues. Dividends and distributions from portfolio securities and underlying funds are recorded on the date they are effective (the ex-dividend date), although the fund records certain foreign security dividends on the date the ex-dividend date is confirmed. Any distributions from underlying funds are recorded in accordance with the character of the distributions as designated by the underlying funds.
Income received from foreign sources may result in withholding tax. Withholding taxes are accrued at the same time as the related income if the tax rate is fixed and known, unless a tax withheld is reclaimable from the local tax authorities in which case it is recorded as receivable. If the tax rate is not known or estimable, such expense or reclaim receivable is recorded when the net proceeds are received.
Schwab Fundamental Global Real Estate Index Fund | Annual Report
Schwab Fundamental Global Real Estate Index Fund
Financial Notes (continued)
2. Significant Accounting Policies (continued):
(e) Expenses:
Pursuant to an Amended and Restated Investment Advisory and Administration Agreement (Advisory Agreement) between the investment adviser and the fund, the investment adviser pays the operating expenses of the fund, excluding acquired fund fees and expenses, taxes, any brokerage expenses, and extraordinary or non-routine expenses. Taxes, any brokerage expenses and extraordinary or non-routine expenses that are specific to the fund are charged directly to the fund.
(f) Distributions to Shareholders:
The fund makes distributions from net investment income, if any, quarterly and from net realized capital gains, if any, once a year. To receive a distribution, you must be a registered shareholder on the record date. Distributions are paid to shareholders on the payable date.
(g) Accounting Estimates:
The accounting policies described in this report conform to GAAP. Notwithstanding this, shareholders should understand that in order to follow these principles, fund management has to make estimates and assumptions that affect the information reported in the financial statements. It’s possible that once the results are known, they may turn out to be different from these estimates and these differences may be material.
(h) Federal Income Taxes:
The fund intends to meet federal income and excise tax requirements for regulated investment companies under subchapter M of the Internal Revenue Code, as amended. Accordingly, the fund distributes substantially all of its net investment income and net realized capital gains, if any, to its shareholders each year. As long as the fund meets the tax requirements, it is not required to pay federal income tax.
(i) Foreign Taxes:
The fund may be subject to foreign taxes (a portion of which may be reclaimable) on income, corporate events, foreign currency exchanges and capital gains on investments. All foreign taxes are recorded in accordance with the applicable foreign tax regulations and rates that exist in foreign markets in which the fund invests. These foreign taxes, if any, are paid by the fund and are disclosed in the Statement of Operations. Foreign taxes accrued as of February 28, 2022, if any, are reflected in the fund’s Statement of Assets and Liabilities.
(j) Indemnification:
Under the fund’s organizational documents, the officers and trustees are indemnified against certain liabilities arising out of the performance of their duties to the fund. In addition, in the normal course of business the fund enters into contracts with its vendors and others that provide general indemnifications. The fund’s maximum exposure under these arrangements is unknown as this would involve future claims that may be made against the fund. However, based on experience, the fund expects the risk of loss attributable to these arrangements to be remote.
3. Risk Factors:
Investing in the fund may involve certain risks, as discussed in the fund’s prospectus, including, but not limited to, those described below. Any of these risks could cause an investor to lose money.
Market Risk. Financial markets rise and fall in response to a variety of factors, sometimes rapidly and unpredictably. Markets may be impacted by economic, political, regulatory and other conditions, including economic sanctions and other government actions. In addition, the occurrence of global events, such as war, terrorism, environmental disasters, natural disasters and epidemics, may also negatively affect the financial markets. As with any investment whose performance is tied to these markets, the value of an investment in the fund will fluctuate, which means that an investor could lose money over short or long periods.
Equity Risk. The prices of equity securities rise and fall daily. These price movements may result from factors affecting individual companies, industries or the securities market as a whole. In addition, equity markets tend to move in cycles, which may cause stock prices to fall over short or extended periods of time.
Schwab Fundamental Global Real Estate Index Fund | Annual Report
Schwab Fundamental Global Real Estate Index Fund
Financial Notes (continued)
3. Risk Factors (continued):
Investment Style Risk. The fund is an index fund. Therefore, the fund follows the securities included in the index during upturns as well as downturns. Because of its indexing strategy, the fund does not take steps to reduce market exposure or to lessen the effects of a declining market. In addition, because of the fund’s expenses, the fund’s performance may be below that of the index. Errors relating to the index may occur from time to time and may not be identified by the index provider for a period of time. In addition, market disruptions could cause delays in the index’s rebalancing schedule. Such errors and/or market disruptions may result in losses for the fund.
Market Capitalization Risk. Securities issued by companies of different market capitalizations tend to go in and out of favor based on market and economic conditions. During a period when securities of a particular market capitalization fall behind other types of investments, the fund’s performance could be impacted.
Large-Cap Company Risk. Large-cap companies are generally more mature and the securities issued by these companies may not be able to reach the same levels of growth as the securities issued by small- or mid-cap companies.
Mid-Cap Company Risk. Mid-cap companies may be more vulnerable to adverse business or economic events than larger, more established companies and the value of securities issued by these companies may move sharply.
Small-Cap Company Risk. Securities issued by small-cap companies may be riskier than those issued by larger companies, and their prices may move sharply, especially during market upturns and downturns.
Real Estate Investment Risk. Due to the composition of the index, the fund will concentrate its investments in real estate companies and companies related to the real estate industry. As such, the fund is subject to risks associated with the direct ownership of real estate securities and an investment in the fund will be closely linked to the performance of the real estate markets. These risks include, among others: declines in the value of real estate; risks related to general and local economic conditions; possible lack of availability of mortgage funds or other limits to accessing the credit or capital markets; defaults by borrowers or tenants, particularly during an economic downturn; and changes in interest rates.
REITs Risk. In addition to the risks associated with investing in securities of real estate companies and real estate related companies, REITs are subject to certain additional risks. Equity REITs may be affected by changes in the value of the underlying properties owned by the trusts. Further, REITs are dependent upon specialized management skills and cash flows, and may have their investments in relatively few properties, or in a small geographic area or a single property type. Failure of a company to qualify as a REIT under federal tax law may have adverse consequences to the fund. In addition, REITs have their own expenses, and the fund will bear a proportionate share of those expenses.
Foreign Investment Risk. The fund’s investments in securities of foreign issuers involve certain risks that may be greater than those associated with investments in securities of U.S. issuers. These include risks of adverse changes in foreign economic, political, regulatory and other conditions; changes in currency exchange rates or exchange control regulations (including limitations on currency movements and exchanges); the imposition of economic sanctions or other government restrictions; differing accounting, auditing, financial reporting and legal standards and practices; differing securities market structures; and higher transaction costs. These risks may negatively impact the value or liquidity of the fund’s investments, and could impair the fund’s ability to meet its investment objective or invest in accordance with its investment strategy. There is a risk that investments in securities denominated in, and/or receiving revenues in, foreign currencies will decline in value relative to the U.S. dollar. Foreign securities also include American Depositary receipts (ADRs), Global Depositary receipts (GDRs) and European Depositary receipts (EDRs), which may be less liquid than the underlying shares in their primary trading market and GDRs, many of which are issued by companies in emerging markets, may be more volatile. To the extent the fund’s investments in a single country or a limited number of countries represent a large percentage of the fund’s assets, the fund’s performance may be adversely affected by the economic, political, regulatory and social conditions in those countries, and the fund’s price may be more volatile than the price of a fund that is geographically diversified.
Emerging Markets Risk. Emerging market countries may be more likely to experience political turmoil or rapid changes in market or economic conditions than more developed countries. Emerging market countries often have less uniformity in accounting, auditing, financial reporting and record keeping requirements and greater risk associated with the custody of securities. In addition, the financial stability of issuers (including governments) in emerging market countries may be more precarious than in developed countries. As a result, there may be an increased risk of illiquidity and price volatility associated with the fund’s investments in emerging market countries, which may be magnified by currency fluctuations relative to the U.S. dollar, and, at times, it may be difficult to value such investments.
Schwab Fundamental Global Real Estate Index Fund | Annual Report
Schwab Fundamental Global Real Estate Index Fund
Financial Notes (continued)
3. Risk Factors (continued):
Sampling Index Tracking Risk. The fund may not fully replicate the index and may hold securities not included in the index. As a result, the fund is subject to the risk that the investment adviser’s investment management strategy, the implementation of which is subject to a number of constraints, may not produce the intended results. Because the fund utilizes a sampling approach it may not track the return of the index as well as it would if the fund purchased all of the securities in the index.
Tracking Error Risk. As an index fund, the fund seeks to track the performance of the index, although it may not be successful in doing so. The divergence between the performance of the fund and the index, positive or negative, is called “tracking error.” Tracking error can be caused by many factors and it may be significant.
Concentration Risk. To the extent that the fund’s or the index’s portfolio is concentrated in the securities of issuers in a particular market, industry, group of industries, sector, country, or asset class (including the real estate industry, as described above), the fund may be adversely affected by the performance of those securities, may be subject to increased price volatility and may be more vulnerable to adverse economic, market, political or regulatory occurrences affecting that market, industry, group of industries, sector, country, or asset class.
Derivatives Risk. The fund may use derivatives to enhance returns or hedge against market declines. Examples of derivatives are options, futures, options on futures and swaps. An option is the right, but not the obligation, to buy or sell an instrument at a specific price on or before a specific date. A future is an agreement to buy or sell a financial instrument at a specific price on a specific day. A swap is an agreement whereby two parties agree to exchange payment streams calculated in relation to a rate, index, instrument or certain securities and a predetermined amount. The fund’s use of derivatives that are subject to regulation by the Commodity Futures Trading Commission (CFTC) could cause the fund to become a commodity pool, which would require the fund to comply with certain CFTC rules.
The fund’s use of derivative instruments involves risks different from, or possibly greater than, the risks associated with investing directly in securities and other traditional investments. Certain of these risks, such as liquidity risk, leverage risk and market risk, are discussed elsewhere in this section. The fund’s use of derivatives is also subject to counterparty risk, lack of availability risk, valuation risk, correlation risk and tax risk. Counterparty risk is the risk that the counterparty to a derivatives transaction may not fulfill its contractual obligations either because the financial condition of the counterparty declines, or because the counterparty is otherwise unable or unwilling to perform under the contract. Lack of availability risk is the risk that suitable derivative transactions may not be available in all circumstances for risk management or other purposes. Valuation risk is the risk that a particular derivative may be valued incorrectly. Correlation risk is the risk that changes in the value of the derivative may not correlate perfectly with the underlying asset, rate or index. Tax risk is the risk that the use of derivatives may cause the fund to realize higher amounts of short-term capital gains. The fund’s use of derivatives could reduce the fund’s performance, increase the fund’s volatility, and could cause the fund to lose more than the initial amount invested.
Exchange-Traded Fund (ETF) Risk. The fund may purchase shares of ETFs to gain exposure to a particular portion of the market while awaiting an opportunity to purchase securities directly. When the fund invests in an ETF, in addition to directly bearing the expenses associated with its own operation, it will bear a proportionate share of the ETF’s expenses. Therefore, it may be more costly to own an ETF than to own the underlying securities directly. In addition, while the risks of owning shares of an ETF generally reflect the risks of owning the underlying securities the ETF holds, lack of liquidity in the market for an ETF’s shares can result in its value being more volatile than the underlying portfolio of securities.
Liquidity Risk. The fund may be unable to sell certain securities, such as illiquid securities, readily at a favorable time or price, or the fund may have to sell them at a loss.
Leverage Risk. Certain fund transactions, such as derivatives transactions, may give rise to a form of leverage and may expose the fund to greater risk. Leverage tends to magnify the effect of any decrease or increase in the value of the fund’s portfolio securities which means even a small amount of leverage can have a disproportionately large impact on the fund. The use of leverage may cause the fund to liquidate portfolio positions when it would not be advantageous to do so in order to satisfy its obligations.
Securities Lending Risk. Securities lending involves the risk of loss of rights in, or delay in recovery of, the loaned securities if the borrower fails to return the security loaned or becomes insolvent.
Please refer to the fund’s prospectus for a more complete description of the principal risks of investing in the fund.
Schwab Fundamental Global Real Estate Index Fund | Annual Report
Schwab Fundamental Global Real Estate Index Fund
Financial Notes (continued)
| | 4. Affiliates and Affiliated Transactions: |
Investment Adviser
Charles Schwab Investment Management, Inc., dba Schwab Asset Management, a wholly owned subsidiary of The Charles Schwab Corporation, serves as the fund’s investment adviser and administrator pursuant to the Advisory Agreement between the investment adviser and the trust.
For its advisory and administrative services to the fund, the investment adviser is entitled to receive an annual fee, payable monthly, equal to 0.39% of the fund’s average daily net assets.
Other Affiliated Transactions
The investment adviser has a licensing agreement with the Frank Russell Company to use certain Russell indices and trademarks in connection with the offering and operation of certain registered investment companies. The fund entered into a sublicense agreement with the investment adviser pursuant to which the investment adviser has agreed to sublicense certain Russell indices and trademarks to the fund. The investment adviser pays all applicable licensing fees for the fund.
Interfund Transactions
The fund may engage in transactions with certain other funds in the Fund Complex (for definition refer to the Trustees and Officers section) in accordance with procedures adopted by the Board pursuant to Rule 17a-7 under the 1940 Act. When one fund is seeking to sell a security that another is seeking to buy, an interfund transaction can allow both funds to benefit by reducing transaction costs. This practice is limited to funds that share the same investment adviser, trustees and/or officers. For the period ended February 28, 2022, the fund’s purchases and sales of securities with other funds in the Fund Complex was $4,182,640 and $4,417,294 respectively and includes realized gains of $66,512.
Interfund Borrowing and Lending
Pursuant to an exemptive order issued by the SEC, the fund may enter into interfund borrowing and lending transactions with other funds in the Fund Complex. All loans are for temporary or emergency purposes and the interest rate to be charged will be the average of the overnight repurchase agreement rate and the short-term bank loan rate. All loans are subject to numerous conditions designed to ensure fair and equitable treatment of all participating funds. The interfund lending facility is subject to the oversight and periodic review by the Board. The fund had no interfund borrowing or lending activity during the period.
5. Board of Trustees:
The Board may include people who are officers and/or directors of the investment adviser or its affiliates. Federal securities law limits the percentage of such “interested persons” who may serve on a trust’s board, and the trust was in compliance with these limitations throughout the report period. The fund does not pay any interested or non-interested (independent) trustees. The independent trustees are paid by the investment adviser. For information regarding the trustees, please refer to the Trustees and Officers table at the end of this report.
6. Borrowing from Banks:
During the period, the fund was a participant with other funds in the Fund Complex in a joint, syndicated, committed $850 million line of credit (the Syndicated Credit Facility), which matured on September 30, 2021. On September 30, 2021, the Syndicated Credit Facility was amended to run for a new 364 day period with the line of credit amount remaining unchanged, maturing on September 29, 2022. Under the terms of the Syndicated Credit Facility, in addition to the investment adviser paying the interest charged on any borrowings by the fund, the investment adviser paid a commitment fee of 0.15% per annum on the fund’s proportionate share of the unused portion of the Syndicated Credit Facility.
During the period, the fund was a participant with other funds in the Fund Complex in a joint, unsecured, uncommitted $400 million line of credit (the Uncommitted Credit Facility), with State Street Bank and Trust Company, which matured on September 30, 2021. On September 30, 2021, the Uncommitted Credit Facility was amended to run for a new 364 day period, maturing on September 29, 2022. Under the terms of the Uncommitted Credit Facility, the investment adviser pays interest on the amount the fund borrows. There were no borrowings from either line of credit during the period.
Schwab Fundamental Global Real Estate Index Fund | Annual Report
Schwab Fundamental Global Real Estate Index Fund
Financial Notes (continued)
6. Borrowing from Banks (continued):
The fund also has access to custodian overdraft facilities. The fund may have utilized the overdraft facility and incurred an interest expense, which is paid by the investment adviser. The interest expense is determined based on a negotiated rate above the current Federal Funds Rate.
7. Derivatives:
The fund entered into equity index futures contracts during the report period. The fund invested in futures contracts to equitize available cash. The net realized and net change in unrealized gains (losses) and net change in unrealized appreciation (depreciation) on futures contracts are presented in the Statement of Operations, if any. Refer to financial note 2(b) for the fund’s accounting policies with respect to futures contracts and financial note 3 for disclosures concerning the risks of investing in futures contracts. During the period ended February 28, 2022, the month-end average notional amounts of futures contracts held by the fund was $746,584 and the month-end average number of contracts held was 14.
8. Purchases and Sales of Investment Securities:
For the period ended February 28, 2022, purchases and sales of securities (excluding short-term obligations) were as follows:
PURCHASES
OF SECURITIES | SALES
OF SECURITIES |
| $45,222,009 | $73,533,536 |
9. Federal Income Taxes:
As of February 28, 2022, the tax basis cost of the fund’s investments and gross unrealized appreciation and depreciation were as follows:
| TAX COST | GROSS UNREALIZED
APPRECIATION | GROSS UNREALIZED
DEPRECIATION | NET UNREALIZED
APPRECIATION
(DEPRECIATION) |
| $122,264,834 | $33,298,714 | ($21,657,042) | $11,641,672 |
As of February 28, 2022, the components of distributable earnings on a tax basis were as follows:
UNDISTRIBUTED
ORDINARY
INCOME | NET UNREALIZED
APPRECIATION
(DEPRECIATION)
ON INVESTMENTS | NET OTHER UNREALIZED
APPRECIATION
(DEPRECIATION) | CAPITAL LOSS
CARRYFORWARDS | TOTAL |
| $177,043 | $11,641,672 | $4,964 | ($6,683,983) | $5,139,696 |
The primary differences between book basis and tax basis unrealized appreciation or unrealized depreciation of investments are the tax deferral of losses on wash sales, the realization for tax purposes of unrealized appreciation (depreciation) on futures contracts, the realization for tax purposes of unrealized appreciation on investments in PFICs and partnership investments. The tax cost of the fund’s investments, disclosed above, have been adjusted from its book amounts to reflect these unrealized appreciation or depreciation differences, as applicable.
Capital loss carryforwards have no expiration and may be used to offset future realized capital gains for federal income tax purposes. As of February 28, 2022, the fund had capital loss carryforwards of $6,683,983.
The tax basis components of distributions paid during the current and prior fiscal years were as follows:
| | CURRENT FISCAL YEAR END DISTRIBUTIONS | PRIOR FISCAL YEAR END DISTRIBUTIONS |
| | ORDINARY
INCOME | ORDINARY
INCOME | LONG-TERM
CAPITAL
GAINS |
| | $4,151,292 | $5,272,090 | $245,902 |
Distributions paid to shareholders are based on net investment income and net realized gains determined on a tax basis, which may differ from net investment income and net realized gains for financial reporting purposes. These differences reflect the differing character of certain income items and net realized gains and losses for financial statement and tax purposes, and may result in reclassification among certain capital accounts on the financial statements.
Schwab Fundamental Global Real Estate Index Fund | Annual Report
Schwab Fundamental Global Real Estate Index Fund
Financial Notes (continued)
9. Federal Income Taxes (continued):
Permanent book and tax basis differences may result in reclassifications between components of net assets as required. The adjustments will have no impact on net assets or the results of operations.
As of February 28, 2022, management has reviewed the tax positions for open periods (for federal purposes, three years from the date of filing and for state purposes, four years from the date of filing) as applicable to the fund, and has determined that no provision for income tax is required in the fund’s financial statements. The fund recognizes interest and penalties, if any, related to unrecognized tax benefits as income tax expense in the Statement of Operations. During the fiscal year ended February 28, 2022, the fund did not incur any interest or penalties.
10. Subsequent Events:
Management has determined there are no subsequent events or transactions through the date the financial statements were issued that would have materially impacted the financial statements as presented.
Schwab Fundamental Global Real Estate Index Fund | Annual Report
Schwab Fundamental Global Real Estate Index Fund
Report of Independent Registered Public Accounting Firm
To the Board of Trustees of Schwab Capital Trust and Shareholders of Schwab Fundamental Global Real Estate Index Fund:
Opinion on the Financial Statements and Financial Highlights
We have audited the accompanying statement of assets and liabilities, including the portfolio holdings, of Schwab Fundamental Global Real Estate Index Fund (the “Fund”), one of the funds constituting Schwab Capital Trust, as of February 28, 2022, the related statement of operations for the year then ended, the statement of changes in net assets and the financial highlights for each of the two years in the period then ended, and the related notes. In our opinion, the financial statements and financial highlights present fairly, in all material respects, the financial position of the Fund as of February 28, 2022, and the results of its operations for the year then ended, and the changes in its net assets and the financial highlights for each of the two years in the period then ended in conformity with accounting principles generally accepted in the United States of America. The financial highlights for each of the three years in the period ended February 29, 2020 were audited by other auditors, whose report, dated April 16, 2020, expressed an unqualified opinion on such financial highlights.
Basis for Opinion
These financial statements are the responsibility of the Fund’s management. Our responsibility is to express an opinion on the Fund’s financial statements and financial highlights based on our audits. We are a public accounting firm registered with the Public Company Accounting Oversight Board (United States) (PCAOB) and are required to be independent with respect to the Fund in accordance with the U.S. federal securities laws and the applicable rules and regulations of the Securities and Exchange Commission and the PCAOB.
We conducted our audits in accordance with the standards of the PCAOB. Those standards require that we plan and perform the audit to obtain reasonable assurance about whether the financial statements and financial highlights are free of material misstatement, whether due to error or fraud. The Fund is not required to have, nor were we engaged to perform, an audit of its internal control over financial reporting. As part of our audits, we are required to obtain an understanding of internal control over financial reporting but not for the purpose of expressing an opinion on the effectiveness of the Fund’s internal control over financial reporting. Accordingly, we express no such opinion.
Our audits included performing procedures to assess the risks of material misstatement of the financial statements and financial highlights, whether due to error or fraud, and performing procedures that respond to those risks. Such procedures included examining, on a test basis, evidence regarding the amounts and disclosures in the financial statements and financial highlights. Our audits also included evaluating the accounting principles used and significant estimates made by management, as well as evaluating the overall presentation of the financial statements and financial highlights. Our procedures included confirmation of securities owned as of February 28, 2022 by correspondence with the custodian and brokers; when replies were not received from brokers, we performed other auditing procedures. We believe that our audits provide a reasonable basis for our opinion.
Deloitte & Touche LLP
Denver, Colorado
April 18, 2022
We have served as the auditor of one or more investment companies in the Schwab Funds Complex since 2020.
Schwab Fundamental Global Real Estate Index Fund | Annual Report
Schwab Fundamental Global Real Estate Index Fund
Other Federal Tax Information (unaudited)
The fund may elect to pass through, under section 853(a) of the Internal Revenue Code, the foreign tax credit of $161,102 to its shareholders for the fiscal year ended February 28, 2022. The respective foreign source income of the fund is $3,546,831.
For the fiscal year ended February 28, 2022, the fund designates $1,335,670 of the dividend distributions as qualified dividends for the purpose of the maximum rate under section 1(h)(11) of the Internal Revenue Code. Shareholders will be notified in January 2023 via IRS Form 1099 of the amounts for use in preparing their 2022 income tax return.
For the fiscal year ended February 28, 2022, the fund designates $1,049,649 as dividends eligible for the 20% qualified business income deduction under section 199A of the Internal Revenue Code. Shareholders will be notified in January 2023 via IRS Form 1099 of the amounts for use in preparing their 2022 income tax return.
Schwab Fundamental Global Real Estate Index Fund | Annual Report
Schwab Fundamental Global Real Estate Index Fund
Liquidity Risk Management Program (Unaudited)
The Fund has adopted and implemented a liquidity risk management program (the “program”) as required by Rule 22e-4 under the Investment Company Act of 1940, as amended. The Fund’s Board of Trustees (the “Board”) has designated the Fund’s investment adviser, Charles Schwab Investment Management, Inc., dba Schwab Asset Management, as the administrator of the program. Personnel of the investment adviser or its affiliates conduct the day-to-day operation of the program.
Under the program, the investment adviser manages a Fund’s liquidity risk, which is the risk that the Fund could not meet shareholder redemption requests without significant dilution of remaining shareholders’ interests in the Fund. The program is reasonably designed to assess and manage a Fund’s liquidity risk, taking into consideration the Fund’s investment strategy and the liquidity of its portfolio investments during normal and reasonably foreseeable stressed conditions; its historical redemption history and shareholder concentrations; and its cash holdings and access to other funding sources, including the custodian overdraft facility and lines of credit. The investment adviser’s process of determining the degree of liquidity of each Fund’s investments is supported by third-party liquidity assessment vendors.
The Fund’s Board reviewed a report at its meeting held on September 20, 2021 prepared by the investment adviser regarding the operation and effectiveness of the program for the period June 1, 2020, through May 31, 2021, which included individual Fund liquidity metrics. No significant liquidity events impacting the Fund were noted in the report. In addition, the investment adviser provided its assessment that the program had been operating effectively in managing the Fund’s liquidity risk.
Schwab Fundamental Global Real Estate Index Fund | Annual Report
Schwab Fundamental Global Real Estate Index Fund
Trustees and Officers
The tables below give information about the trustees and officers of Schwab Capital Trust, which includes the fund covered in this report. The “Fund Complex” includes The Charles Schwab Family of Funds, Schwab Capital Trust, Schwab Investments, Schwab Annuity Portfolios, Schwab Strategic Trust and Laudus Trust. The Fund Complex includes 103 funds.
The address for all trustees and officers is 211 Main Street, San Francisco, CA 94105. You can find more information about the trustees and officers in the Statement of Additional Information, which is available free by calling 1-877-824-5615.
| Independent Trustees |
Name, Year of Birth, and
Position(s) with the trust
(Terms of office, and
length of Time Served1) | Principal Occupations
During the Past Five Years | Number of
Portfolios in
Fund Complex
Overseen by
the Trustee | Other Directorships |
Robert W. Burns
1959
Trustee
(Trustee of Schwab Strategic Trust since 2009; The Charles Schwab Family of Funds, Schwab Investments, Schwab Capital Trust, Schwab Annuity Portfolios and Laudus Trust since 2016) | Retired/Private Investor. | 103 | None |
Nancy F. Heller
1956
Trustee
(Trustee of The Charles Schwab Family of Funds, Schwab Investments, Schwab Capital Trust, Schwab Annuity Portfolios, Schwab Strategic Trust and Laudus Trust since 2018) | Retired. | 103 | None |
David L. Mahoney
1954
Trustee
(Trustee of The Charles Schwab Family of Funds, Schwab Investments, Schwab Capital Trust, Schwab Annuity Portfolios and Laudus Trust since 2011; Schwab Strategic Trust since 2016) | Private Investor. | 103 | Director (2004 – present), Corcept Therapeutics Incorporated
Director (2009 – 2021), Adamas Pharmaceuticals, Inc.
Director (2003 – 2019), Symantec Corporation |
Jane P. Moncreiff
1961
Trustee
(Trustee of The Charles Schwab Family of Funds, Schwab Investments, Schwab Capital Trust, Schwab Annuity Portfolios, Schwab Strategic Trust and Laudus Trust since 2019) | Consultant (2018 – present), Fulham Advisers LLC (management consulting); Chief Investment Officer (2009 – 2017), CareGroup Healthcare System, Inc. (healthcare). | 103 | None |
Kiran M. Patel
1948
Trustee
(Trustee of The Charles Schwab Family of Funds, Schwab Investments, Schwab Capital Trust, Schwab Annuity Portfolios and Laudus Trust since 2011; Schwab Strategic Trust since 2016) | Retired. | 103 | Director (2008 – present), KLA-Tencor Corporation |
Schwab Fundamental Global Real Estate Index Fund | Annual Report
Schwab Fundamental Global Real Estate Index Fund
| Independent Trustees (continued) |
Name, Year of Birth, and
Position(s) with the trust
(Terms of office, and
length of Time Served1) | Principal Occupations
During the Past Five Years | Number of
Portfolios in
Fund Complex
Overseen by
the Trustee | Other Directorships |
Kimberly S. Patmore
1956
Trustee
(Trustee of The Charles Schwab Family of Funds, Schwab Investments, Schwab Capital Trust, Schwab Annuity Portfolios, Schwab Strategic Trust and Laudus Trust since 2016) | Consultant (2008 – present), Patmore Management Consulting (management consulting). | 103 | None |
J. Derek Penn
1957
Trustee
(Trustee of The Charles Schwab Family of Funds, Schwab Investments, Schwab Capital Trust, Schwab Annuity Portfolios, Schwab Strategic Trust and Laudus Trust since 2021) | Head of Equity Sales and Trading (2006 – 2018), BNY Mellon (financial services). | 103 | None |
| Interested Trustees |
Name, Year of Birth, and
Position(s) with the trust
(Terms of office, and
length of Time Served1) | Principal Occupations
During the Past Five Years | Number of
Portfolios in
Fund Complex
Overseen by
the Trustee | Other Directorships |
Walter W. Bettinger II2
1960
Chairman and Trustee
(Trustee of The Charles Schwab Family of Funds, Schwab Investments, Schwab Capital Trust and Schwab Annuity Portfolios since 2008; Schwab Strategic Trust since 2009; Laudus Trust since 2010) | Director and Chief Executive Officer (Oct. 2008 – present) and President (Feb. 2007 – Oct. 2021), The Charles Schwab Corporation; President and Chief Executive Officer (Oct. 2008 – Oct. 2021) and Director (May 2008 – Oct. 2021), Charles Schwab & Co., Inc.; Director (Apr. 2006 – present), Charles Schwab Bank, SSB; Director (Nov. 2017 – present), Charles Schwab Premier Bank, SSB; Director (July 2019 – present), Charles Schwab Trust Bank; Director (May 2008 – present) and President and Chief Executive Officer (Aug. 2017 – present), Schwab Holdings, Inc.; Director (Oct. 2020 – present), TD Ameritrade Holding Corporation; Director (July 2016 – Oct. 2021), Charles Schwab Investment Management, Inc. | 103 | Director (2008 – present), The Charles Schwab Corporation |
Joseph R. Martinetto2
1962
Trustee
(Trustee of The Charles Schwab Family of Funds, Schwab Investments, Schwab Capital Trust, Schwab Annuity Portfolios, Schwab Strategic Trust and Laudus Trust since 2016) | Chief Operating Officer (Feb. 2018 – present), The Charles Schwab Corporation; Senior Executive Vice President (July 2015 – present), Charles Schwab & Co., Inc.; Director (May 2007 – present), Charles Schwab & Co., Inc.; Director (Apr. 2010 – Apr. 2020), Charles Schwab Bank, SSB; Director (Nov. 2017 – Apr. 2020), Charles Schwab Premier Bank, SSB; Director (May 2007 – Apr. 2020), and Senior Executive Vice President (Feb. 2016 – present), Schwab Holdings, Inc.; Director (Oct. 2020 – present), TD Ameritrade Holding Corporation. | 103 | None |
Schwab Fundamental Global Real Estate Index Fund | Annual Report
Schwab Fundamental Global Real Estate Index Fund
| Officers of the Trust |
Name, Year of Birth, and Position(s) with the trust
(Terms of office, and length of Time Served3) | Principal Occupations During the Past Five Years |
Jonathan de St. Paer
1973
President and Chief Executive Officer
(Officer of The Charles Schwab Family of Funds, Schwab Investments, Schwab Capital Trust, Schwab Annuity Portfolios, Schwab Strategic Trust and Laudus Trust since 2018) | Director (Apr. 2019 – present), President (Oct. 2018 – present), Chief Operating Officer (Jan. 2020 – present), and Chief Executive Officer (Apr. 2019 – Nov. 2019), Charles Schwab Investment Management, Inc.; Senior Vice President (June 2020 – Mar. 2022) and Chief Operating Officer (Jan. 2020 – Mar. 2022), Charles Schwab Investment Advisory, Inc.; Chief Executive Officer (Apr. 2019 – present), President (Nov. 2018 – present) and Trustee (Apr. 2019 – Dec. 2020), Schwab Funds, Laudus Trust and Schwab ETFs; Director (Apr. 2019 – Apr. 2022), Charles Schwab Worldwide Funds plc and Charles Schwab Asset Management (Ireland) Limited; Senior Vice President (Apr. 2019 – present), and Senior Vice President – Strategy and Product Development (CSIM) (Jan. 2014 – Mar. 2019), Charles Schwab & Co., Inc. |
Mark Fischer
1970
Treasurer, Chief Financial Officer and Chief Operating Officer
(Officer of The Charles Schwab Family of Funds, Schwab Investments, Schwab Capital Trust, Schwab Annuity Portfolios, Schwab Strategic Trust and Laudus Trust since 2013) | Treasurer and Chief Financial Officer (Jan. 2016 – present) and Chief Operating Officer (Dec. 2020 – present), Schwab Funds, Laudus Trust and Schwab ETFs; Chief Financial Officer (Mar. 2020 – present) and Vice President (Oct. 2013 – present), Charles Schwab Investment Management, Inc.; Director (July 2020 – Apr. 2022), Charles Schwab Worldwide Funds plc and Charles Schwab Asset Management (Ireland) Limited. |
Omar Aguilar
1970
Vice President and Chief Investment Officer
(Officer of The Charles Schwab Family of Funds, Schwab Investments, Schwab Capital Trust, Schwab Annuity Portfolios, Schwab Strategic Trust and Laudus Trust since 2011) | Chief Executive Officer (Jan. 2022 – present) and Chief Investment Officer (Apr. 2011 – present), Senior Vice President (Apr. 2011 – Dec. 2021), Charles Schwab Investment Management, Inc.; Vice President and Chief Investment Officer (June 2011 – present), Schwab Funds, Laudus Trust and Schwab ETFs. |
Brett Wander
1961
Vice President and Chief Investment Officer
(Officer of The Charles Schwab Family of Funds, Schwab Investments, Schwab Capital Trust, Schwab Annuity Portfolios, Schwab Strategic Trust and Laudus Trust since 2011) | Senior Vice President and Chief Investment Officer (Apr. 2011 – present), Charles Schwab Investment Management, Inc.; Vice President and Chief Investment Officer (June 2011 – present), Schwab Funds, Laudus Trust and Schwab ETFs. |
William P. McMahon, Jr.
1972
Vice President and Chief Investment Officer
(Officer of The Charles Schwab Family of Funds, Schwab Investments, Schwab Capital Trust, Schwab Annuity Portfolios, Schwab Strategic Trust and Laudus Trust since 2021) | Senior Vice President and Chief Investment Officer (Jan. 2020 – present), Charles Schwab Investment Management, Inc.; Vice President and Chief Investment Officer (June 2021 – present), Schwab Funds, Laudus Trust and Schwab ETFs; Senior Vice President and Chief Investment Officer – ThomasPartners Strategies (Apr. 2018 – Dec. 2019), Charles Schwab Investment Advisory, Inc.; Senior Vice President and Chief Investment Officer (May 2001 – Apr. 2018), ThomasPartners, Inc. |
Catherine MacGregor
1964
Chief Legal Officer and Secretary, Schwab Funds and Schwab ETFs
Chief Legal Officer, Vice President and Clerk, Laudus Trust
(Officer of The Charles Schwab Family of Funds, Schwab Investments, Schwab Capital Trust, Schwab Annuity Portfolios and Laudus Trust since 2005; Schwab Strategic Trust since 2009) | Chief Legal Officer (Mar. 2022 – present) and Vice President (Sept. 2005 – present), Charles Schwab Investment Management, Inc.; Vice President (July 2005 – present), Charles Schwab & Co., Inc.; Vice President (Dec. 2005 – present) and Chief Legal Officer and Clerk (Mar. 2007 – present), Laudus Trust; Chief Legal Officer and Secretary (Oct. 2021 – present), Vice President (Nov. 2005 – Oct. 2021) and Assistant Secretary (June 2007 – Oct. 2021), Schwab Funds; Chief Legal Officer and Secretary (Oct. 2021 – present), Vice President and Assistant Secretary (Oct. 2009 – Oct. 2021), Schwab ETFs. |
| 1 | Each Trustee shall hold office until the election and qualification of his or her successor, or until he or she dies, resigns or is removed. The retirement policy requires that each independent trustee retire by December 31 of the year in which the Trustee turns 74 or the Trustee’s twentieth year of service as an independent trustee on any trust in the Fund Complex, whichever occurs first. |
| 2 | Mr. Bettinger and Mr. Martinetto are Interested Trustees. Mr. Bettinger is an Interested Trustee because he owns stock of The Charles Schwab Corporation (CSC), the parent company of Charles Schwab Investment Management, Inc., the investment adviser for the trusts in the Fund Complex, and is an employee of Charles Schwab & Co., Inc. (Schwab), the principal underwriter for The Charles Schwab Family of Funds, Schwab Investments, Schwab Capital Trust, Schwab Annuity Portfolios and Laudus Trust. Mr. Martinetto is an Interested Trustee because he owns stock of CSC and is an employee and director of Schwab. |
| 3 | The President, Treasurer and Secretary/Clerk hold office until their respective successors are chosen and qualified or until he or she sooner dies, resigns, is removed or becomes disqualified. Each of the other officers serves at the pleasure of the Board. |
Schwab Fundamental Global Real Estate Index Fund | Annual Report
Schwab Fundamental Global Real Estate Index Fund
asset allocation The practice of dividing a portfolio among different asset classes, with each asset class assigned a particular percentage.
asset class A group of securities with similar structure and basic characteristics. Stocks, bonds and cash are the three main examples of asset classes.
beta A historical measure of an investment’s volatility relative to a market index (usually the S&P 500®). The index is defined as having a beta of 1.00. Investments with a beta higher than 1.00 have been more volatile than the index; those with a beta of less than 1.00 have been less volatile.
Bloomberg US Aggregate Bond Index An index that is a broad-based benchmark measuring the performance of the U.S. investment grade, taxable bond market, including U.S. Treasuries, government-related and corporate bonds, mortgage pass-through securities, commercial mortgage-backed securities, and asset-backed securities that are publicly available for sale in the United States. To be eligible for inclusion in the index, securities must be fixed rate, non-convertible, U.S. dollar-denominated with at least $300 million or more of outstanding face value and have one or more years remaining to maturity. The index excludes certain types of securities, including tax-exempt state and local government series bonds, structured notes embedded with swaps or other special features, private placements, floating rate securities, inflation-linked bonds and Eurobonds. The index is market capitalization weighted and the securities in the index are updated on the last business day of each month.
bond A security representing a loan from the investor to the issuer. A bond typically pays interest at a fixed rate (the coupon rate) until a specified date (the maturity date), at which time the issuer returns the money borrowed (principal or face value) to the bondholder. Because of their structure, bonds are sometimes called “fixed-income securities” or “debt securities.”
An individual bond is subject to the credit risk of the issuer. Changes in interest rates can affect a bond’s market value prior to call or maturity. There is no guarantee that a bond’s yield to call or maturity will provide a positive return over the rate of inflation.
cap, capitalization See “market cap.”
capital gain, capital loss The difference between the amount paid for an investment and its value at a later time. If the investment has been sold, the capital gain or loss is considered a realized gain or loss. If the investment is still held, the gain or loss is still “on paper” and is considered unrealized.
Dow Jones Equity All REIT Capped Index A float-adjusted market cap weighted index that is designed to measure all equity real estate investment trusts (REITs) in the Dow Jones U.S. Total Stock Market Index, as defined by the S&P Dow Jones Indices REIT/RESI Industry Classification Hierarchy, that meet the minimum float market capitalization (FMC) and liquidity thresholds. The aggregate weight of all companies weighing more than 4.5% cannot exceed 22.5%, and no single company’s weight can exceed 10%. The index is reviewed daily based on each company’s capped market capitalization weight. Daily capping is only performed when the sum of companies with weights great than 5% exceeds 25%.
earnings growth rate For a mutual fund, the average yearly rate at which the earnings of the companies in the fund’s portfolio have grown, measured over the past five years.
earnings per share (EPS) A company’s earnings, or net income, for the past 12 months, divided by the number of shares outstanding.
expense ratio The amount that is taken from a mutual fund’s assets each year to cover the fund’s operating expenses. An expense ratio of 0.50% means that a fund’s expenses amount to half of one percent of its average net assets a year.
FTSE EPRA Nareit Global Index (Net) An index that provides a diverse representation of publicly traded equity real estate investment trusts (REITs) and listed property companies worldwide. The index constituents are free-float adjusted, and screened on liquidity, size and revenue. The index is comprised of countries in developed and emerging markets. The Net of Tax Index is calculated based on the maximum withholding tax rates applicable to dividends received by institutional investors who are not resident in the same country as the remitting company and who do not benefit from double taxation treaties.
market cap, market capitalization The value of a company as determined by the total value of all shares of its stock outstanding.
median market cap The midpoint of the range of market caps of the stocks held by a fund. There are different ways of calculating median market cap. With a simple median, half of the stocks in the fund’s portfolio would be larger than the median, and half would be smaller. With a weighted median (the type that is calculated for these funds), half of the fund’s assets are invested in stocks that are larger than the median market cap, and half in stocks that are smaller.
MSCI EAFE Index (Net) A free float-adjusted market capitalization index that is designed to measure the equity market performance of developed markets in Europe, Australasia, and the Far East. The Net version of the index reflects reinvested dividends net of withholding taxes, but reflects no deductions for expenses or other taxes; returns are calculated applying dividend withholding rates applicable to non-resident persons who do not benefit from double taxation treaties.
MSCI Emerging Markets Index (Net) A free float-adjusted market capitalization weighted index that is designed to measure equity market performance in the global emerging markets. This series approximates the minimum possible dividend reinvestment. The returns are calculated applying dividend withholding rates applicable to non-resident persons who do not benefit from double taxation treaties.
net asset value (NAV) The value of one share of a mutual fund. NAV is calculated by taking the fund’s total assets, subtracting liabilities, and dividing by the number of shares outstanding.
outstanding shares, shares outstanding When speaking of a company or mutual fund, indicates all shares currently held by investors.
price-to-book ratio (P/B) The market price of a company’s stock compared with its “book value.” A mutual fund’s P/B is the weighted average of the P/B of all stocks in the fund’s portfolio.
price-to-earnings ratio (P/E) The market price of a company’s stock compared with earnings over the past year. A mutual fund’s P/E is the weighted average of the P/E of all stocks in the fund’s portfolio.
real estate investment trust (REIT) Real estate companies that own and commonly operate income producing commercial and/or residential real estate.
real estate operating companies (REOC) Real estate companies that engage in the development, management or financing of real estate.
return on equity (ROE) The average yearly rate of return for each dollar of investors’ money, measured over the past five years.
Schwab Fundamental Global Real Estate Index Fund | Annual Report
Schwab Fundamental Global Real Estate Index Fund
rights and warrants Rights and warrants are types of securities that entitle the holder to purchase a proportionate amount of common stock at a specified price for a specific period of time. Rights allow a shareholder to buy more shares directly from the company, usually at a price somewhat lower than the current market price of the outstanding shares. Warrants are usually issued with bonds and preferred stock. Rights and warrants can trade on the market separately from the company’s stock. The prices of rights and warrants do not necessarily move parallel to the prices of the underlying common stock. Rights usually expire within a few weeks of issuance, while warrants may not expire for several years. If a right or warrant is not exercised within the specified time period, it will become worthless and a fund will lose the purchase price it paid for the right or warrant and the right to purchase the underlying security.
Russell RAFI Global Select Real Estate Index (Net) An index that is derived from constituents of the Russell RAFI Global Index that are classified as real estate or real estate investment trusts (REITs) according to the Russell Global Sectors classification scheme. Fundamental methodology ranks and weights global real estate securities by three fundamental measures of company size adjusted sales, retained operating cash flow and dividends plus buybacks rather
than by market capitalization. Mortgage and timber REITs are excluded. Securities are ranked by each fundamental factor, and individual factor weights are averaged to determine overall fundamental weights. The index uses a partial quarterly reconstitution methodology in which the index is split into four equal segments at the annual reconstitution and each segment is then rebalanced on a rolling quarterly basis.
S&P 500 Index An index that is designed to measure the performance of 500 leading publicly traded companies from a broad range of industries.
stock A share of ownership, or equity, in the issuing company.
total return The percentage that an investor would have earned or lost on an investment in the fund assuming dividends and distributions were reinvested.
weighted average For mutual funds, an average that gives the same weight to each security as the security represents in the fund’s portfolio.
yield The income paid out by an investment, expressed as a percentage of the investment’s market value.
Schwab Fundamental Global Real Estate Index Fund | Annual Report
Schwab Fundamental Global Real Estate Index Fund
Schwab Asset Management
With a straightforward lineup of core products and solutions for building the foundation of a portfolio, Schwab Asset Management advocates for investors of all sizes with a steadfast focus on lowering costs and reducing unnecessary complexity. The list below shows all currently available Schwab Funds®.
Investors should carefully consider information contained in the prospectus, or if available, the summary prospectus, including investment objectives, risks, charges and expenses before investing. Please call 1-877-824-5615 for a prospectus for any Schwab Fund. Please read the prospectus carefully before you invest. This report must be preceded or accompanied by a current prospectus.
Proxy Voting Policies, Procedures and Results
A description of the proxy voting policies and procedures used to determine how to vote proxies on behalf of the funds is available without charge, upon request, by visiting the Schwab Funds’ website at www.schwabassetmanagement.com/schwabfunds_prospectus, the SEC’s website at www.sec.gov, or by contacting Schwab Funds at 1-877-824-5615.
Information regarding how a fund voted proxies relating to portfolio securities during the most recent twelve-month period ended June 30 is available, without charge, by visiting the fund’s website at www.schwabassetmanagement.com/schwabfunds_prospectus or the SEC’s website at www.sec.gov.
Equity Funds
Schwab Core Equity Fund
Schwab Dividend Equity Fund
Schwab Large-Cap Growth Fund
Schwab Small-Cap Equity Fund
Schwab Health Care Fund
Schwab International Core Equity Fund
Schwab International Opportunities Fund
Schwab Select Large Cap Growth Fund
Schwab Fundamental US Large Company Index Fund
Schwab Fundamental US Small Company Index Fund
Schwab Fundamental International Large Company Index Fund
Schwab Fundamental International Small Company Index Fund
Schwab Fundamental Emerging Markets Large Company Index Fund
Schwab Fundamental Global Real Estate Index Fund
Schwab Global Real Estate Fund
Schwab S&P 500 Index Fund
Schwab 1000 Index® Fund
Schwab Small-Cap Index Fund®
Schwab Total Stock Market Index Fund®
Schwab U.S. Large-Cap Growth Index Fund
Schwab U.S. Large-Cap Value Index Fund
Schwab U.S. Mid-Cap Index Fund
Schwab International Index Fund®
Asset Allocation Funds
Schwab Balanced Fund
Schwab MarketTrack Portfolios®
Schwab Target Funds
Schwab Target Index Funds
Schwab Monthly Income Funds
Bond Funds
Schwab Treasury Inflation Protected Securities Index Fund
Schwab U.S. Aggregate Bond Index Fund
Schwab Short-Term Bond Index Fund
Schwab Tax-Free Bond Fund1
Schwab California Tax-Free Bond Fund1
Schwab Opportunistic Municipal Bond Fund
Schwab Money Funds2
Schwab provides a broad choice of taxable and tax-exempt money market funds for both retail and institutional client types.
Investment Adviser
Charles Schwab Investment Management, Inc., dba Schwab Asset Management
211 Main Street, San Francisco, CA 94105
Funds
Schwab Funds
1-877-824-5615
© 2022 Charles Schwab & Co., Inc. All rights reserved.
Member SIPC®
Printed on recycled paper.
| ¹ | State, local, and the Federal Alternative Minimum Tax may apply. Capital gains are not exempt from Federal Taxation. |
| ² | You could lose money by investing in the Schwab Money Funds. All Schwab Money Funds with the exception of Schwab Variable Share Price Money Fund seek to preserve the value of your investment at $1.00 per share, but cannot guarantee they will do so. Because the share price of Schwab Variable Share Price Money Fund will fluctuate, when you sell your shares they may be worth more or less than what you originally paid for them. All Schwab Money Funds with the exception of Schwab Government Money Fund, Schwab Retirement Government Money Fund, Schwab U.S. Treasury Money Fund, Schwab Treasury Obligations Money Fund and Schwab Government Money Market Portfolio may impose a fee upon the sale of your shares or may temporarily suspend your ability to sell shares if the Fund’s liquidity falls below required minimums because of market conditions or other factors. An investment in the Schwab Money Funds is not insured or guaranteed by the Federal Deposit Insurance Corporation or any other government agency. The Schwab Money Funds’ sponsor has no legal obligation to provide financial support to the Funds, and you should not expect that the sponsor will provide financial support to the Funds at any time. |
This page is intentionally left blank.
Item 2: Code of Ethics.
| (a) | Registrant has adopted a code of ethics that applies to its principal executive officer, principal financial officer, and any other persons who perform a similar function, regardless of whether these individuals are employed by Registrant or a third party. |
| (c) | During the period covered by the report, no amendments were made to the provisions of this code of ethics. |
| (d) | During the period covered by the report, Registrant did not grant any waivers, including implicit waivers, from the provisions of this code of ethics. |
(f)(1) Registrant has filed this code of ethics as an exhibit pursuant to Item 13(a)(1) of Form N-CSR.
Item 3: Audit Committee Financial Expert.
Registrant’s Board of Trustees has determined that Kiran M. Patel, Kimberly S. Patmore and J. Derek Penn, each currently serving on its audit, compliance and valuation committee, are each an “audit committee financial expert,” as such term is defined in Item 3 of Form N-CSR. Each member of Registrant’s audit, compliance and valuation committee is “independent” under the standards set forth in Item 3 of Form N-CSR.
The designation of each of Mr. Patel, Ms. Patmore and Mr. Penn as an “audit committee financial expert” pursuant to Item 3 of Form N-CSR does not (i) impose upon such individual any duties, obligations, or liability that are
greater than the duties, obligations and liability imposed upon such individual as a member of Registrant’s audit, compliance and valuation committee or Board of Trustees in the absence of such designation; and (ii) affect the duties, obligations or liability of any other member of Registrant’s audit, compliance and valuation committee or Board of Trustees.
Item 4: Principal Accountant Fees and Services.
Registrant is composed of fifty-two operational series. One series has a fiscal year-end of the last day of February, whose annual financial statements are reported in Item 1, twelve series have a fiscal year-end of March 31, thirty-six series have a fiscal year-end of October 31, and three series have a fiscal year-end of December 31. Principal accountant fees disclosed in Items 4(a)-(d) and 4(g) include fees billed for services rendered to the fifty-two operational series during 2021/2022 and the fifty-three operational series during 2020/2021, based on their respective 2021/2022 and 2020/2021 fiscal years, as applicable.
The following table presents fees billed by the principal accountant in each of the last two fiscal years for the services rendered to the Funds:
| | | | | | | | | | | | | | | | | | | | | | | | | | | | | | |
| (a)Audit Fees1 | | | (b)Audit-Related Fees2 | | | (c) Tax Fees3 | | | (d) All Other Fees | |
Fiscal Year
2021/2022 | | | Fiscal Year
2020/2021 | | | Fiscal Year
2021/2022 | | | Fiscal Year
2020/2021 | | | Fiscal Year
2021/2022 | | | Fiscal Year
2020/2021 | | | Fiscal Year
2021/2022 | | | Fiscal Year
2020/2021 | |
| $ | 1,187,075 | | | $ | 1,211,700 | | | $ | 96,000 | | | $ | 93,000 | | | $ | 161,200 | | | $ | 161,200 | | | $ | 0 | | | $ | 0 | |
| 1 | The nature of the services includes audit of the registrant’s annual financial statements and normally provided services in connection with regulatory filings for those fiscal years. |
| 2 | The nature of the services includes assurance and related services reasonably related to the performance of the audit of financial statements not included in Audit Fees. |
| 3 | The nature of the services includes tax compliance, tax advice and tax planning. |
| | | | |
| (e) | | (1) | | Registrant’s audit, compliance and valuation committee does not have pre-approval policies and procedures as described in paragraph (c)(7) of Rule 2-01 of Regulation S-X. |
| | |
| | (2) | | There were no services described in each of paragraphs (b) through (d) above (including services required to be approved by Registrant’s audit, compliance and valuation committee pursuant to paragraph (c)(7)(ii) of Rule 2-01 of Regulation S-X) that were approved by Registrant’s audit, compliance and valuation committee pursuant to paragraph (c)(7)(i)(C) of Rule 2-01 of Regulation S-X. |
(f) Not applicable.
(g) Below are the aggregate non-audit fees billed in each of the last two fiscal years by Registrant’s principal accountant for services rendered to Registrant, to Registrant’s investment adviser, and to any entity controlling, controlled by, or under common control with Registrant’s investment adviser that provides ongoing services to Registrant.
| | | | |
| 2021/2022: $2,523,317 | | 2020/2021: $ | 4,326,956 | |
| (h) | During the past fiscal year, all non-audit services provided by Registrant’s principal accountant to either Registrant’s investment adviser or to any entity controlling, controlled by, or under common control with Registrant’s investment adviser that provides ongoing services to Registrant were pre-approved. Included in the audit, compliance and valuation committee’s pre-approval was the review and consideration as to whether the provision of these non-audit services is compatible with maintaining the principal accountant’s independence. |
Item 5: Audit Committee of Listed Registrants.
Not applicable.
Item 6: Schedule of Investments.
The schedule of investments is included as part of the report to shareholders filed under Item 1 of this Form.
Item 7: Disclosure of Proxy Voting Policies and Procedures for Closed-End Management Investment Companies.
Not applicable.
Item 8: Portfolio Managers of Closed-End Management Investment Companies.
Not applicable.
Item 9: Purchases of Equity Securities by Closed-End Management Investment Company and Affiliated Purchasers.
Not applicable.
Item 10: Submission of Matters to a Vote of Security Holders.
Not applicable.
Item 11: Controls and Procedures.
(a) Based on their evaluation of Registrant’s disclosure controls and procedures, as of a date within 90 days of the filing date, Registrant’s Chief Executive Officer, Jonathan de St. Paer and Registrant’s Chief Financial Officer, Mark Fischer, have concluded that Registrant’s disclosure controls and procedures are: (i) reasonably designed to ensure that information required to be disclosed in this report is appropriately communicated to Registrant’s officers to allow timely decisions regarding disclosures required in this report; (ii) reasonably designed to ensure that information required to be disclosed in this report is recorded, processed, summarized and reported in a timely manner; and (iii) are effective in achieving the goals described in (i) and (ii) above.
(b) During the period covered by this report, there have been no changes in Registrant’s internal control over financial reporting that the above officers believe to have materially affected, or to be reasonably likely to materially affect, Registrant’s internal control over financial reporting.
Item 12: Disclosure of Securities Lending Activities for Closed-End Management Investment Companies.
Not applicable.
Item 13: Exhibits.
Pursuant to the requirements of the Securities Exchange Act of 1934 and the Investment Company Act of 1940, the registrant has duly caused this report to be signed on its behalf by the undersigned, thereunto duly authorized.
(Registrant) Schwab Capital Trust – Schwab Fundamental Global Real Estate Index Fund
| | |
| By: | | /s/ Jonathan de St. Paer |
| | Jonathan de St. Paer Chief Executive Officer |
| |
| Date: | | April 18, 2022 |
Pursuant to the requirements of the Securities Exchange Act of 1934 and the Investment Company Act of 1940, this report has been signed below by the following persons on behalf of the registrant and in the capacities and on the dates indicated.
| | |
| By: | | /s/ Jonathan de St. Paer |
| | Jonathan de St. Paer Chief Executive Officer |
| |
| Date: | | April 18, 2022 |
| |
| By: | | /s/ Mark Fischer |
| | Mark Fischer Chief Financial Officer |
| |
| Date: | | April 18, 2022 |