UNITED STATES
SECURITIES AND EXCHANGE COMMISSION
Washington, D.C. 20549
FORM N-CSR
CERTIFIED SHAREHOLDER REPORT OF REGISTERED
MANAGEMENT INVESTMENT COMPANIES
|
| | | | | | |
| Investment Company Act file number | 811-07820 |
| | |
| AMERICAN CENTURY CAPITAL PORTFOLIOS, INC. |
| (Exact name of registrant as specified in charter) |
| | |
| 4500 MAIN STREET, KANSAS CITY, MISSOURI | 64111 |
| (Address of principal executive offices) | (Zip Code) |
| | |
CHARLES A. ETHERINGTON 4500 MAIN STREET, KANSAS CITY, MISSOURI 64111 |
| (Name and address of agent for service) |
| | |
| Registrant’s telephone number, including area code: | 816-531-5575 |
| | |
| Date of fiscal year end: | 03-31 |
| | |
| Date of reporting period: | 03-31-2019 |
ITEM 1. REPORTS TO STOCKHOLDERS.
|
| |
| ANNUAL REPORT | |
| MARCH 31, 2019 |
| |
|
| |
| | AC Alternatives® Market Neutral Value Fund |
| | Investor Class (ACVVX) |
| | I Class (ACVKX) |
| | A Class (ACVQX) |
| | C Class (ACVHX) |
| | R Class (ACVWX) |

Beginning on January 1, 2021, as permitted by regulations adopted by the Securities and Exchange Commission, paper copies of the fund’s shareholder reports like this one will no longer be sent by mail, unless you specifically request paper copies of the reports from the fund or from your financial intermediary, such as a broker-dealer or bank. Instead, the reports will be made available on a website, and you will be notified by mail each time a report is posted and provided with a website link to access the report.
If you already elected to receive shareholder reports electronically, you will not be affected by this change and you need not take any action. You may elect to receive shareholder reports and other communications from the fund or your financial intermediary electronically by calling or sending an email request to your appropriate contacts as listed on the back cover of this report.
You may elect to receive all future reports in paper free of charge. You can inform the fund or your financial intermediary that you wish to continue receiving paper copies of your shareholder reports by calling or sending an email request to your appropriate contacts as listed on the back cover of this report. Your election to receive reports in paper will apply to all funds held with the fund complex/your financial intermediary.
|
| | |
| President’s Letter | 2 |
|
| Performance | 3 |
|
| Portfolio Commentary | |
|
| Fund Characteristics | |
|
| Shareholder Fee Example | |
|
| Schedule of Investments | |
|
| Statement of Assets and Liabilities | |
|
| Statement of Operations | |
|
| Statement of Changes in Net Assets | |
|
| Notes to Financial Statements | |
|
| Financial Highlights | |
|
| Report of Independent Registered Public Accounting Firm | |
|
| Management | |
|
| Additional Information | |
|
Any opinions expressed in this report reflect those of the author as of the date of the report, and do not necessarily represent the opinions of American Century Investments® or any other person in the American Century Investments organization. Any such opinions are subject to change at any time based upon market or other conditions and American Century Investments disclaims any responsibility to update such opinions. These opinions may not be relied upon as investment advice and, because investment decisions made by American Century Investments funds are based on numerous factors, may not be relied upon as an indication of trading intent on behalf of any American Century Investments fund. Security examples are used for representational purposes only and are not intended as recommendations to purchase or sell securities. Performance information for comparative indices and securities is provided to American Century Investments by third party vendors. To the best of American Century Investments’ knowledge, such information is accurate at the time of printing.
 Jonathan Thomas
Dear Investor:
Thank you for reviewing this annual report for the period ended March 31, 2019. Annual reports help convey important information about fund returns, including market factors that affected performance during the reporting period. For additional, updated investment and market insights, we encourage you to visit our website, americancentury.com.
Markets Ended Roller-Coaster Period on Upswing
For the first half of the period, U.S. stocks climbed higher, while bond returns headed lower. Robust economic growth, bolstered by federal tax and regulatory reform, and record corporate earnings results fueled risk-on sentiment that drove stock prices higher. Meanwhile, the combination of strong economic data, the Federal Reserve’s (Fed’s) ongoing rate-hike campaign and an uptick in inflation pushed investment-grade bond returns lower.
Market trends began changing in late 2018. Mounting investor concerns about slowing global economic and earnings growth, U.S.-China trade tensions and rising interest rates triggered widespread volatility. Stock prices plunged as investors sought safe-haven investments, including U.S. Treasuries. Furthermore, the Fed issued another rate hike in December, its fourth of the year, and maintained its hawkish outlook. Investors feared the December rate increase and the Fed’s plans for two more rate hikes in 2019 were too aggressive, and risk-off investing remained in favor.
January brought a renewed sense of stability to the markets. Investors’ concerns about growth and trade eased, and the Fed changed course, pausing its rate-hike campaign amid moderating global growth and inflation. Valuations appeared attractive after the late-2018 sell-off, and risk-on investing resumed. In March, the Fed held rates steady again, hinting additional tightening was off the table for 2019. This news drove stock and bond returns higher and left both asset classes on an upward track to end the period. Overall, stocks (S&P 500 Index) overcame their late-2018 nosedive to gain 9.50% for the period. Bonds (Bloomberg Barclays U.S. Aggregate Bond Index) bounced back from losses early in the period to return 4.48%.
We expect volatility to remain a formidable factor as investors react to global growth trends, central bank policy and geopolitical developments. We believe this scenario underscores the importance of using professionally managed portfolios in pursuit of investment goals. We appreciate your continued trust and confidence in us.
Sincerely,
Jonathan Thomas
President and Chief Executive Officer
American Century Investments
|
| | | | | |
| Total Returns as of March 31, 2019 |
| | | | Average Annual Returns | |
| | Ticker Symbol | 1 year | 5 years | Since Inception | Inception Date |
| Investor Class | ACVVX | -3.04% | 1.17% | 1.80% | 10/31/11 |
| Bloomberg Barclays U.S. 1-3 Month Treasury Bill Index | — | 2.09% | 0.71% | 0.49% | — |
| I Class | ACVKX | -2.90% | 1.35% | 2.00% | 10/31/11 |
| A Class | ACVQX | | | | 10/31/11 |
| No sales charge | | -3.29% | 0.92% | 1.55% | |
| With sales charge | | -8.89% | -0.27% | 0.74% | |
| C Class | ACVHX | -4.00% | 0.15% | 0.78% | 10/31/11 |
| R Class | ACVWX | -3.45% | 0.66% | 1.30% | 10/31/11 |
Fund returns would have been lower if a portion of the fees had not been waived.
Sales charges include initial sales charges and contingent deferred sales charges (CDSCs), as applicable. A Class shares have a 5.75% maximum initial sales charge and may be subject to a maximum CDSC of 1.00%. C Class shares redeemed within 12 months of purchase are subject to a maximum CDSC of 1.00%. The SEC requires that mutual funds provide performance information net of maximum sales charges in all cases where charges could be applied.
Data presented reflect past performance. Past performance is no guarantee of future results. Current performance may be higher or lower than the performance shown. Total returns for periods less than one year are not annualized. Investment return and principal value will fluctuate, and redemption value may be more or less than original cost. Data assumes reinvestment of dividends and capital gains, and none of the charts reflect the deduction of taxes that a shareholder would pay on fund distributions or the redemption of fund shares. To obtain performance data current to the most recent month end, please call 1-800-345-2021 or visit americancentury.com. For additional information about the fund, please consult the prospectus.
|
|
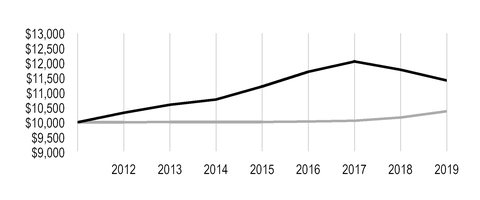
| Growth of $10,000 Over Life of Class |
$10,000 investment made October 31, 2011 |
Performance for other share classes will vary due to differences in fee structure.
|
|
| |
| Value on March 31, 2019 |
| | Investor Class — $11,413 |
| |
| | Bloomberg Barclays U.S. 1-3 Month Treasury Bill Index — $10,372 |
| |
Ending value of Investor Class would have been lower if a portion of the fees had not been waived.
|
| | | | |
| Total Annual Fund Operating Expenses |
| Investor Class | I Class | A Class | C Class | R Class |
| 3.84% | 3.64% | 4.09% | 4.84% | 4.34% |
The total annual fund operating expenses shown is as stated in the fund’s prospectus current as of the date of this report. The prospectus may vary from the expense ratio shown elsewhere in this report because it is based on a different time period, includes acquired fund fees and expenses, and, if applicable, does not include fee waivers or expense reimbursements.
Data presented reflect past performance. Past performance is no guarantee of future results. Current performance may be higher or lower than the performance shown. Total returns for periods less than one year are not annualized. Investment return and principal value will fluctuate, and redemption value may be more or less than original cost. Data assumes reinvestment of dividends and capital gains, and none of the charts reflect the deduction of taxes that a shareholder would pay on fund distributions or the redemption of fund shares. To obtain performance data current to the most recent month end, please call 1-800-345-2021 or visit americancentury.com. For additional information about the fund, please consult the prospectus.
Portfolio Managers: Phil Davidson, Michael Liss, Kevin Toney, Brian Woglom and Dan Gruemmer
Effective April 2019, portfolio manager Dan Gruemmer will leave the fund's management team, and Phil Sundell will join the team.
Performance Summary
AC Alternatives Market Neutral Value declined -3.04%* for the fiscal year ended March 31, 2019, compared with the 2.09% return for its benchmark, the Bloomberg Barclays U.S. 1-3 Month Treasury Bill Index. The fund's return reflects operating expenses, while the index's return does not.
The foundation of the strategy is to pair long positions in more undervalued companies with short positions in overvalued companies. We believe this helps reduce the risk inherent in long/short strategies. Over the past 12-month period, however, our portfolio produced negative returns as investors’ preference for growth and momentum pressured many of our pairs.
Key Detractors
Among the top detractors from performance was a pair consisting of a long position in L Brands and a short position in Lululemon Athletica. Lululemon’s stock rose significantly, causing our short position to detract from performance, as the company reported strong financial results. The long position in L Brands also negatively impacted returns; the stock declined due to weak sales results for the company’s Victoria’s Secret stores.
Our Cheesecake Factory (long position) and Chipotle Mexican Grill (short position) pair also weighed on returns. Chipotle’s stock rose significantly after the company reported strong quarterly earnings and on optimism that the company can continue its turnaround. As of March 31, 2019, we continued to hold this pair because our metrics showed a wide valuation spread between the two companies.
Another top detractor was a pair of industrial distributor stocks consisting of a long position in MSC Industrial Direct and a short position in Fastenal Company. MSC Industrial’s stock declined on concerns regarding European Union retaliatory tariff announcements and disappointing organic growth results. Fastenal’s stock rose, causing our short position to weigh on returns, as the company delivered strong sales growth. Additionally, better management of Fastenal’s internal freight network and a reduction in sales force hiring led to profit margins that exceeded expectations.
Key Contributors
Among the top contributors to performance was a pair consisting of a long position in the Consumer Discretionary Select Sector SPDR Fund and a short position in Avis Budget Group. Our short position in Avis positively affected the portfolio’s performance. The stock declined as investors failed to see anticipated pricing improvements and on concerns that fleet costs could rise. We significantly reduced our weight in this pair as the valuation disparity between the stocks compressed.
*All fund returns referenced in this commentary are for Investor Class shares. Fund returns would have been lower if a portion of the fees had not been waived. Performance for other share classes will vary due to differences in fee structure; when Investor Class performance exceeds that of the fund's benchmark, other share classes may not. See page 3 for returns for all share classes.
A long position in Southwest Airlines, paired with a short position in American Airlines, also buoyed returns. The stock of American Airlines declined over the reporting period as rising fuel prices
pressured the company’s profitability. Our short position was, therefore, beneficial to the portfolio’s
return. We eliminated this pair from the portfolio because the valuation discrepancy between the two stocks was no longer compelling. However, as of period-end, Southwest Airlines remained a long position within other pairs.
Our Consumer Discretionary Select Sector SPDR Fund (long) and MGM Resorts International (short) pair was another key contributor. The driver behind this pair’s strong performance was the short position in MGM Resorts. The company’s stock declined after recent quarterly results and guidance failed to meet lofty expectations.
Portfolio Positioning
AC Alternatives Market Neutral Value is designed to address several secular financial planning trends, including the need for an alternative to cash in a low interest rate environment, diversification resulting from not being correlated to equity markets, low volatility exposure, and a hedge against a rise in inflation and/or interest rates.
We continue to follow our disciplined, bottom-up process, selecting securities one at a time for the portfolio. We look for securities of companies that we believe are misvalued on both the long and short side of the market with consideration for both upside potential and downside risk. The portfolio’s current positioning reflects the individual opportunities identified by our team.
|
| |
| MARCH 31, 2019 | |
| Top Ten Long Holdings | % of net assets |
| Consumer Discretionary Select Sector SPDR Fund | 4.09% |
| Walmart, Inc. | 3.86% |
| Crane Co. | 3.62% |
| MSC Industrial Direct Co., Inc., Class A | 3.03% |
| Zimmer Biomet Holdings, Inc. | 2.85% |
| Atlas Copco AB, B Shares | 2.54% |
| iShares Russell 1000 Value ETF | 2.54% |
| iShares U.S. Real Estate ETF | 2.52% |
| Lear Corp. | 2.47% |
| L Brands, Inc. | 2.46% |
| | |
| Top Ten Short Holdings | % of net assets |
| Costco Wholesale Corp. | (4.81)% |
| Stryker Corp. | (3.96)% |
| VF Corp. | (3.50)% |
| Cree, Inc. | (3.13)% |
| Fastenal Co. | (3.06)% |
| Industrial Select Sector SPDR Fund | (3.03)% |
| Tesla, Inc. | (2.94)% |
| Invesco QQQ Trust Series 1 | (2.69)% |
| Lululemon Athletica, Inc. | (2.62)% |
| Gartner, Inc. | (2.50)% |
| | |
| Types of Investments in Portfolio | % of net assets |
| Domestic Common Stocks | 80.4% |
| Foreign Common Stocks* | 9.6% |
| Exchange-Traded Funds | 9.9% |
| Domestic Common Stocks Sold Short | (77.7)% |
| Foreign Common Stocks Sold Short* | (10.2)% |
| Exchange-Traded Funds Sold Short | (12.1)% |
| Temporary Cash Investments | —** |
| Other Assets and Liabilities | 100.1%*** |
*Includes depositary shares, dual listed securities and foreign ordinary shares.
**Category is less than 0.05% of total net assets.
***Amount relates primarily to deposits for securities sold short at period end.
Fund shareholders may incur two types of costs: (1) transaction costs, including sales charges (loads) on purchase payments and redemption/exchange fees; and (2) ongoing costs, including management fees; distribution and service (12b-1) fees; and other fund expenses. This example is intended to help you understand your ongoing costs (in dollars) of investing in your fund and to compare these costs with the ongoing cost of investing in other mutual funds.
The example is based on an investment of $1,000 made at the beginning of the period and held for the entire period from October 1, 2018 to March 31, 2019.
Actual Expenses
The table provides information about actual account values and actual expenses for each class. You may use the information, together with the amount you invested, to estimate the expenses that you paid over the period. First, identify the share class you own. Then simply divide your account value by $1,000 (for example, an $8,600 account value divided by $1,000 = 8.6), then multiply the result by the number under the heading “Expenses Paid During Period” to estimate the expenses you paid on your account during this period.
If you hold Investor Class shares of any American Century Investments fund, or I Class shares of the American Century Diversified Bond Fund, in an American Century Investments account (i.e., not a financial intermediary or retirement plan account), American Century Investments may charge you a $12.50 semiannual account maintenance fee if the value of those shares is less than $10,000. We will redeem shares automatically in one of your accounts to pay the $12.50 fee. In determining your total eligible investment amount, we will include your investments in all personal accounts (including American Century Investments Brokerage accounts) registered under your Social Security number. Personal accounts include individual accounts, joint accounts, UGMA/UTMA accounts, personal trusts, Coverdell Education Savings Accounts and IRAs (including traditional, Roth, Rollover, SEP-, SARSEP- and SIMPLE-IRAs), and certain other retirement accounts. If you have only business, business retirement, employer-sponsored or American Century Investments Brokerage accounts, you are currently not subject to this fee. If you are subject to the Account Maintenance Fee, your account value could be reduced by the fee amount.
Hypothetical Example for Comparison Purposes
The table also provides information about hypothetical account values and hypothetical expenses based on the actual expense ratio of each class of your fund and an assumed rate of return of 5% per year before expenses, which is not the actual return of a fund’s share class. The hypothetical account values and expenses may not be used to estimate the actual ending account balance or expenses you paid for the period. You may use this information to compare the ongoing costs of investing in your fund and other funds. To do so, compare this 5% hypothetical example with the 5% hypothetical examples that appear in the shareholder reports of the other funds.
Please note that the expenses shown in the table are meant to highlight your ongoing costs only and do not reflect any transactional costs, such as sales charges (loads) or redemption/exchange fees. Therefore, the table is useful in comparing ongoing costs only, and will not help you determine the relative total costs of owning different funds. In addition, if these transactional costs were included, your costs would have been higher.
|
| | | | |
| Beginning
Account Value
10/1/18 | Ending
Account Value
3/31/19 | Expenses Paid
During Period(1)
10/1/18 - 3/31/19 | Annualized
Expense Ratio(1) |
| Actual | | | | |
| Investor Class | $1,000 | $977.20 | $16.71 | 3.39% |
| I Class | $1,000 | $977.60 | $15.73 | 3.19% |
| A Class | $1,000 | $975.80 | $17.93 | 3.64% |
| C Class | $1,000 | $972.10 | $21.58 | 4.39% |
| R Class | $1,000 | $974.30 | $19.15 | 3.89% |
| Hypothetical | | | | |
| Investor Class | $1,000 | $1,008.03 | $16.97 | 3.39% |
| I Class | $1,000 | $1,009.03 | $15.98 | 3.19% |
| A Class | $1,000 | $1,006.78 | $18.21 | 3.64% |
| C Class | $1,000 | $1,003.04 | $21.92 | 4.39% |
| R Class | $1,000 | $1,005.54 | $19.45 | 3.89% |
| |
| (1) | Expenses are equal to the class's annualized expense ratio listed in the table above, multiplied by the average account value over the period, multiplied by 182, the number of days in the most recent fiscal half-year, divided by 365, to reflect the one-half year period. Annualized expense ratio reflects actual expenses, including any applicable fee waivers or expense reimbursements and excluding any acquired fund fees and expenses. |
MARCH 31, 2019
|
| | | | | |
| | Shares | Value |
| COMMON STOCKS — 90.0% | | |
| Aerospace and Defense — 2.4% | | |
| BAE Systems plc | 870,930 |
| $ | 5,472,068 |
|
HEICO Corp., Class A(1) | 15,063 |
| 1,266,196 |
|
| | | 6,738,264 |
|
| Airlines — 2.2% | | |
| Alaska Air Group, Inc. | 41,277 |
| 2,316,465 |
|
| Southwest Airlines Co. | 74,898 |
| 3,887,955 |
|
| | | 6,204,420 |
|
| Auto Components — 2.5% | | |
Lear Corp.(1) | 50,420 |
| 6,842,498 |
|
| Automobiles — 2.9% | | |
| Honda Motor Co. Ltd. ADR | 133,280 |
| 3,621,218 |
|
Thor Industries, Inc.(1) | 73,090 |
| 4,558,623 |
|
| | | 8,179,841 |
|
| Banks — 7.2% | | |
| BOK Financial Corp. | 19,430 |
| 1,584,517 |
|
| Comerica, Inc. | 18,550 |
| 1,360,086 |
|
| First Hawaiian, Inc. | 107,640 |
| 2,804,022 |
|
| PNC Financial Services Group, Inc. (The) | 31,980 |
| 3,922,667 |
|
| Prosperity Bancshares, Inc. | 51,540 |
| 3,559,352 |
|
| Toronto-Dominion Bank (The) | 45,340 |
| 2,460,476 |
|
| U.S. Bancorp | 89,560 |
| 4,315,896 |
|
| | | 20,007,016 |
|
| Beverages — 2.2% | | |
| Molson Coors Brewing Co., Class B | 54,570 |
| 3,255,100 |
|
| PepsiCo, Inc. | 23,074 |
| 2,827,719 |
|
| | | 6,082,819 |
|
| Biotechnology — 3.8% | | |
AbbVie, Inc.(1) | 35,010 |
| 2,821,456 |
|
Biogen, Inc.(2) | 9,110 |
| 2,153,422 |
|
Gilead Sciences, Inc.(1) | 84,700 |
| 5,506,347 |
|
| | | 10,481,225 |
|
| Communications Equipment — 2.7% | | |
F5 Networks, Inc.(1)(2) | 26,620 |
| 4,177,477 |
|
Juniper Networks, Inc.(1) | 124,600 |
| 3,298,162 |
|
| | | 7,475,639 |
|
| Containers and Packaging — 1.8% | | |
WestRock Co.(1) | 130,020 |
| 4,986,267 |
|
| Electrical Equipment — 5.5% | | |
| Acuity Brands, Inc. | 25,580 |
| 3,069,856 |
|
| Eaton Corp. plc | 55,230 |
| 4,449,329 |
|
Hubbell, Inc.(1) | 37,213 |
| 4,390,389 |
|
|
| | | | | |
| | Shares | Value |
| Legrand SA | 16,250 |
| $ | 1,087,509 |
|
| Rockwell Automation, Inc. | 12,970 |
| 2,275,716 |
|
| | | 15,272,799 |
|
| Electronic Equipment, Instruments and Components — 1.7% | | |
| Avnet, Inc. | 19,590 |
| 849,618 |
|
| TE Connectivity Ltd. | 47,850 |
| 3,863,888 |
|
| | | 4,713,506 |
|
| Equity Real Estate Investment Trusts (REITs) — 0.5% | | |
| American Tower Corp. | 7,060 |
| 1,391,244 |
|
| Food and Staples Retailing — 3.9% | | |
Walmart, Inc.(1) | 109,670 |
| 10,696,115 |
|
| Food Products — 1.1% | | |
| Conagra Brands, Inc. | 57,650 |
| 1,599,211 |
|
| J.M. Smucker Co. (The) | 12,438 |
| 1,449,027 |
|
| | | 3,048,238 |
|
| Gas Utilities — 0.5% | | |
| Atmos Energy Corp. | 12,520 |
| 1,288,684 |
|
| Health Care Equipment and Supplies — 5.7% | | |
Hologic, Inc.(2) | 54,570 |
| 2,641,188 |
|
| Medtronic plc | 57,580 |
| 5,244,386 |
|
Zimmer Biomet Holdings, Inc.(1) | 61,817 |
| 7,894,031 |
|
| | | 15,779,605 |
|
| Health Care Providers and Services — 1.0% | | |
Cigna Corp.(1)(2) | 16,470 |
| 2,648,705 |
|
| Hotels, Restaurants and Leisure — 4.1% | | |
| Carnival Corp. | 24,570 |
| 1,246,191 |
|
| Cedar Fair LP | 44,500 |
| 2,341,590 |
|
Cheesecake Factory, Inc. (The)(1) | 90,750 |
| 4,439,490 |
|
| Cracker Barrel Old Country Store, Inc. | 8,230 |
| 1,330,050 |
|
| Sodexo SA | 19,270 |
| 2,121,839 |
|
| | | 11,479,160 |
|
| Household Durables — 0.7% | | |
| PulteGroup, Inc. | 67,970 |
| 1,900,441 |
|
| Insurance — 2.1% | | |
| Chubb Ltd. | 23,225 |
| 3,253,358 |
|
| Marsh & McLennan Cos., Inc. | 8,820 |
| 828,198 |
|
| ProAssurance Corp. | 51,420 |
| 1,779,646 |
|
| | | 5,861,202 |
|
| Interactive Media and Services — 0.5% | | |
Alphabet, Inc., Class C(2) | 1,180 |
| 1,384,506 |
|
| IT Services — 1.2% | | |
International Business Machines Corp.(1) | 24,470 |
| 3,452,717 |
|
| Life Sciences Tools and Services — 0.5% | | |
Waters Corp.(2) | 5,870 |
| 1,477,538 |
|
| Machinery — 8.9% | | |
| Atlas Copco AB, B Shares | 284,170 |
| 7,032,958 |
|
Crane Co.(1) | 118,700 |
| 10,044,394 |
|
|
| | | | | |
| | Shares | Value |
| Cummins, Inc. | 11,700 |
| $ | 1,847,079 |
|
| Ingersoll-Rand plc | 16,360 |
| 1,766,062 |
|
Rexnord Corp.(2) | 157,513 |
| 3,959,877 |
|
| | | 24,650,370 |
|
| Multiline Retail — 1.0% | | |
| Target Corp. | 32,990 |
| 2,647,777 |
|
| Oil, Gas and Consumable Fuels — 3.6% | | |
| Anadarko Petroleum Corp. | 29,050 |
| 1,321,194 |
|
| Enterprise Products Partners LP | 71,230 |
| 2,072,793 |
|
| EQM Midstream Partners LP | 26,580 |
| 1,227,199 |
|
Equitrans Midstream Corp.(2) | 39,324 |
| 856,477 |
|
| Noble Energy, Inc. | 62,510 |
| 1,545,872 |
|
| Shell Midstream Partners LP | 77,321 |
| 1,581,214 |
|
| TOTAL SA ADR | 25,260 |
| 1,405,719 |
|
| | | 10,010,468 |
|
| Personal Products — 0.7% | | |
Edgewell Personal Care Co.(2) | 43,300 |
| 1,900,437 |
|
| Pharmaceuticals — 1.0% | | |
| Pfizer, Inc. | 66,556 |
| 2,826,633 |
|
| Road and Rail — 1.0% | | |
| Union Pacific Corp. | 15,930 |
| 2,663,496 |
|
| Semiconductors and Semiconductor Equipment — 2.3% | | |
Intel Corp.(1) | 55,940 |
| 3,003,978 |
|
| KLA-Tencor Corp. | 16,240 |
| 1,939,218 |
|
| Skyworks Solutions, Inc. | 17,162 |
| 1,415,522 |
|
| | | 6,358,718 |
|
| Software — 1.7% | | |
| Microsoft Corp. | 9,646 |
| 1,137,649 |
|
| Oracle Corp. (New York) | 64,265 |
| 3,451,673 |
|
| | | 4,589,322 |
|
| Specialty Retail — 3.9% | | |
| Advance Auto Parts, Inc. | 9,020 |
| 1,538,181 |
|
AutoZone, Inc.(1)(2) | 2,470 |
| 2,529,576 |
|
L Brands, Inc.(1) | 247,230 |
| 6,818,603 |
|
| | | 10,886,360 |
|
| Textiles, Apparel and Luxury Goods — 6.2% | | |
| Burberry Group plc | 113,810 |
| 2,897,191 |
|
| Capri Holdings Ltd. | 129,720 |
| 5,934,690 |
|
| Ralph Lauren Corp. | 28,843 |
| 3,740,360 |
|
Tapestry, Inc.(1) | 139,180 |
| 4,521,958 |
|
| | | 17,094,199 |
|
| Trading Companies and Distributors — 3.0% | | |
MSC Industrial Direct Co., Inc., Class A(1) | 101,650 |
| 8,407,472 |
|
TOTAL COMMON STOCKS
(Cost $227,225,509) | | 249,427,701 |
|
| EXCHANGE-TRADED FUNDS — 9.9% | | |
| Consumer Discretionary Select Sector SPDR Fund | 99,504 |
| 11,328,530 |
|
| iShares Russell 1000 Value ETF | 56,942 |
| 7,031,768 |
|
|
| | | | | |
| | Shares | Value |
| iShares TIPS Bond ETF | 18,290 |
| $ | 2,068,050 |
|
| iShares U.S. Real Estate ETF | 80,221 |
| 6,982,436 |
|
TOTAL EXCHANGE-TRADED FUNDS
(Cost $22,500,139) | | 27,410,784 |
|
TEMPORARY CASH INVESTMENTS† | | |
| Repurchase Agreement, BMO Capital Markets Corp., (collateralized by various U.S. Treasury obligations, 0.125% - 2.875%, 9/30/19 - 2/15/44, valued at $98,544), in a joint trading account at 2.35%, dated 3/29/19, due 4/1/19 (Delivery value $96,594) | | 96,575 |
|
| State Street Institutional U.S. Government Money Market Fund, Premier Class | 25,183 |
| 25,183 |
|
TOTAL TEMPORARY CASH INVESTMENTS
(Cost $121,758) | | 121,758 |
|
TOTAL INVESTMENT SECURITIES BEFORE SECURITIES SOLD SHORT — 99.9%
(Cost $249,847,406) | 276,960,243 |
|
| SECURITIES SOLD SHORT — (100.0)% | | |
| COMMON STOCKS SOLD SHORT — (87.9)% | | |
| Aerospace and Defense — (2.4)% | | |
| HEICO Corp. | (13,061 | ) | (1,239,097 | ) |
| Northrop Grumman Corp. | (11,122 | ) | (2,998,491 | ) |
| Rolls-Royce Holdings plc | (206,490 | ) | (2,429,092 | ) |
| | | (6,666,680 | ) |
| Airlines — (2.2)% | | |
| Spirit Airlines, Inc. | (116,170 | ) | (6,140,746 | ) |
| Automobiles — (3.8)% | | |
| Tesla, Inc. | (29,170 | ) | (8,163,516 | ) |
| Toyota Motor Corp. ADR | (20,290 | ) | (2,394,626 | ) |
| | | (10,558,142 | ) |
| Banks — (6.4)% | | |
| Bank of Hawaii Corp. | (35,210 | ) | (2,777,013 | ) |
| Cullen/Frost Bankers, Inc. | (16,510 | ) | (1,602,626 | ) |
| First Financial Bankshares, Inc. | (62,430 | ) | (3,607,205 | ) |
| M&T Bank Corp. | (12,020 | ) | (1,887,380 | ) |
| Regions Financial Corp. | (277,238 | ) | (3,922,918 | ) |
| Royal Bank of Canada | (32,710 | ) | (2,467,783 | ) |
| Zions Bancorp N.A. | (30,180 | ) | (1,370,474 | ) |
| | | (17,635,399 | ) |
| Beverages — (2.2)% | | |
| Anheuser-Busch InBev SA ADR | (39,390 | ) | (3,307,578 | ) |
| Coca-Cola Co. (The) | (60,040 | ) | (2,813,475 | ) |
| | | (6,121,053 | ) |
| Capital Markets — (1.1)% | | |
| FactSet Research Systems, Inc. | (12,020 | ) | (2,984,206 | ) |
| Containers and Packaging — (1.8)% | | |
| Avery Dennison Corp. | (22,590 | ) | (2,552,670 | ) |
| Sealed Air Corp. | (51,690 | ) | (2,380,841 | ) |
| | | (4,933,511 | ) |
| Distributors — (2.0)% | | |
| Pool Corp. | (34,020 | ) | (5,612,279 | ) |
|
| | | | | |
| | Shares | Value |
| Electronic Equipment, Instruments and Components — (2.5)% | | |
| Amphenol Corp., Class A | (41,660 | ) | $ | (3,934,370 | ) |
| Arrow Electronics, Inc. | (10,890 | ) | (839,184 | ) |
| Cognex Corp. | (44,070 | ) | (2,241,400 | ) |
| | | (7,014,954 | ) |
| Equity Real Estate Investment Trusts (REITs) — (3.0)% | | |
| AvalonBay Communities, Inc. | (13,170 | ) | (2,643,614 | ) |
| Crown Castle International Corp. | (10,868 | ) | (1,391,104 | ) |
| Equity Residential | (33,030 | ) | (2,487,820 | ) |
| Essex Property Trust, Inc. | (6,140 | ) | (1,775,933 | ) |
| | | (8,298,471 | ) |
| Food and Staples Retailing — (4.8)% | | |
| Costco Wholesale Corp. | (55,081 | ) | (13,337,313 | ) |
| Food Products — (1.1)% | | |
| Danone SA | (18,420 | ) | (1,419,317 | ) |
| General Mills, Inc. | (30,280 | ) | (1,566,990 | ) |
| | | (2,986,307 | ) |
| Health Care Equipment and Supplies — (7.2)% | | |
| Abbott Laboratories | (32,200 | ) | (2,574,068 | ) |
| Align Technology, Inc. | (14,500 | ) | (4,122,785 | ) |
| Becton Dickinson and Co. | (8,600 | ) | (2,147,678 | ) |
| Stryker Corp. | (55,570 | ) | (10,976,186 | ) |
| | | (19,820,717 | ) |
| Health Care Providers and Services — (1.0)% | | |
| UnitedHealth Group, Inc. | (11,100 | ) | (2,744,586 | ) |
| Hotels, Restaurants and Leisure — (5.3)% | | |
| Chipotle Mexican Grill, Inc. | (8,180 | ) | (5,810,336 | ) |
| Compass Group plc | (93,100 | ) | (2,188,102 | ) |
| MGM Resorts International | (114,360 | ) | (2,934,478 | ) |
| Royal Caribbean Cruises Ltd. | (11,010 | ) | (1,261,966 | ) |
| SeaWorld Entertainment, Inc. | (95,490 | ) | (2,459,822 | ) |
| | | (14,654,704 | ) |
| Household Durables — (0.7)% | | |
| Toll Brothers, Inc. | (53,350 | ) | (1,931,270 | ) |
| Insurance — (2.1)% | | |
| Aon plc | (4,970 | ) | (848,379 | ) |
| Travelers Cos., Inc. (The) | (23,670 | ) | (3,246,577 | ) |
| Zurich Insurance Group AG | (5,390 | ) | (1,784,127 | ) |
| | | (5,879,083 | ) |
| Internet and Direct Marketing Retail — (0.9)% | | |
| Amazon.com, Inc. | (1,460 | ) | (2,599,895 | ) |
| IT Services — (2.5)% | | |
| Gartner, Inc. | (45,710 | ) | (6,933,293 | ) |
| Leisure Products — (1.6)% | | |
| Polaris Industries, Inc. | (53,180 | ) | (4,489,987 | ) |
| Life Sciences Tools and Services — (0.5)% | | |
| PerkinElmer, Inc. | (15,400 | ) | (1,483,944 | ) |
|
| | | | | |
| | Shares | Value |
| Machinery — (7.1)% | | |
| Caterpillar, Inc. | (7,694 | ) | $ | (1,042,460 | ) |
| CNH Industrial NV | (75,983 | ) | (775,027 | ) |
| Donaldson Co., Inc. | (75,590 | ) | (3,784,035 | ) |
| ESCO Technologies, Inc. | (49,250 | ) | (3,301,228 | ) |
| Flowserve Corp. | (75,880 | ) | (3,425,223 | ) |
| RBC Bearings, Inc. | (31,114 | ) | (3,956,767 | ) |
| Xylem, Inc. | (42,770 | ) | (3,380,541 | ) |
| | | (19,665,281 | ) |
| Oil, Gas and Consumable Fuels — (1.0)% | | |
| Exxon Mobil Corp. | (17,470 | ) | (1,411,576 | ) |
| Occidental Petroleum Corp. | (19,590 | ) | (1,296,858 | ) |
| | | (2,708,434 | ) |
| Pharmaceuticals — (4.8)% | | |
| AstraZeneca plc ADR | (145,732 | ) | (5,891,945 | ) |
| Eli Lilly & Co. | (37,593 | ) | (4,878,068 | ) |
| Sanofi | (27,730 | ) | (2,449,297 | ) |
| | | (13,219,310 | ) |
| Road and Rail — (2.0)% | | |
| Avis Budget Group, Inc. | (80,094 | ) | (2,792,077 | ) |
| CSX Corp. | (35,154 | ) | (2,630,222 | ) |
| | | (5,422,299 | ) |
| Semiconductors and Semiconductor Equipment — (4.7)% | | |
| Analog Devices, Inc. | (28,636 | ) | (3,014,512 | ) |
| Cree, Inc. | (151,792 | ) | (8,685,538 | ) |
| Semtech Corp. | (27,750 | ) | (1,412,753 | ) |
| | | (13,112,803 | ) |
| Specialty Retail — (1.4)% | | |
| O'Reilly Automotive, Inc. | (10,320 | ) | (4,007,256 | ) |
| Textiles, Apparel and Luxury Goods — (8.7)% | | |
| Lululemon Athletica, Inc. | (44,402 | ) | (7,276,156 | ) |
| LVMH Moet Hennessy Louis Vuitton SE | (8,030 | ) | (2,953,610 | ) |
| PVH Corp. | (8,942 | ) | (1,090,477 | ) |
| Under Armour, Inc., Class C | (160,560 | ) | (3,029,767 | ) |
| VF Corp. | (111,580 | ) | (9,697,418 | ) |
| | | (24,047,428 | ) |
| Trading Companies and Distributors — (3.1)% | | |
| Fastenal Co. | (132,017 | ) | (8,490,013 | ) |
TOTAL COMMON STOCKS SOLD SHORT
(Proceeds $200,384,724) | | (243,499,364 | ) |
| EXCHANGE-TRADED FUNDS SOLD SHORT — (12.1)% | | |
| Alerian MLP ETF | (552,436 | ) | (5,540,933 | ) |
| Consumer Staples Select Sector SPDR Fund | (33,400 | ) | (1,874,074 | ) |
| Industrial Select Sector SPDR Fund | (111,890 | ) | (8,395,107 | ) |
| Invesco QQQ Trust Series 1 | (41,490 | ) | (7,454,093 | ) |
| iShares Preferred & Income Securities ETF | (55,740 | ) | (2,037,297 | ) |
| SPDR S&P Bank ETF | (59,190 | ) | (2,472,366 | ) |
| SPDR S&P Oil & Gas Exploration & Production ETF | (49,980 | ) | (1,536,385 | ) |
|
| | | | | |
| | Shares | Value |
| Technology Select Sector SPDR Fund | (40,560 | ) | $ | (3,001,440 | ) |
| Utilities Select Sector SPDR Fund | (22,250 | ) | (1,294,283 | ) |
TOTAL EXCHANGE-TRADED FUNDS SOLD SHORT
(Proceeds $32,255,757) | | (33,605,978 | ) |
TOTAL SECURITIES SOLD SHORT — (100.0)%
(Proceeds $232,640,481) | | (277,105,342 | ) |
OTHER ASSETS AND LIABILITIES(3) — 100.1% | | 277,349,472 |
|
| TOTAL NET ASSETS — 100.0% | | $ | 277,204,373 |
|
|
| | |
| NOTES TO SCHEDULE OF INVESTMENTS |
| ADR | - | American Depositary Receipt |
| |
| † | Category is less than 0.05% of total net assets. |
| |
| (1) | Security, or a portion thereof, has been pledged at the custodian bank or with a broker for collateral requirements on securities sold short. At the period end, the aggregate value of securities pledged was $92,542,554. |
| |
| (3) | Amount relates primarily to deposits for securities sold short at period end. |
See Notes to Financial Statements.
|
|
| Statement of Assets and Liabilities |
|
| | | |
| MARCH 31, 2019 | |
| Assets | |
| Investment securities, at value (cost of $249,847,406) | $ | 276,960,243 |
|
| Deposits for securities sold short | 279,299,269 |
|
| Receivable for investments sold | 25,256,833 |
|
| Receivable for capital shares sold | 82,142 |
|
| Dividends and interest receivable | 846,634 |
|
| | 582,445,121 |
|
| | |
| Liabilities | |
| Securities sold short, at value (proceeds of $232,640,481) | 277,105,342 |
|
| Payable for investments purchased | 26,614,104 |
|
| Payable for capital shares redeemed | 875,595 |
|
| Accrued management fees | 403,523 |
|
| Distribution and service fees payable | 10,390 |
|
| Dividend expense payable on securities sold short | 231,794 |
|
| | 305,240,748 |
|
| | |
| Net Assets | $ | 277,204,373 |
|
| | |
| Net Assets Consist of: | |
| Capital (par value and paid-in surplus) | $ | 323,918,454 |
|
| Distributable earnings | (46,714,081 | ) |
| | $ | 277,204,373 |
|
|
| | | | | | |
| | Net Assets | Shares Outstanding | Net Asset Value Per Share |
| Investor Class, $0.01 Par Value |
| $73,870,911 |
| 7,819,302 |
| $9.45 |
| I Class, $0.01 Par Value |
| $188,718,445 |
| 19,631,009 |
| $9.61 |
| A Class, $0.01 Par Value |
| $3,926,215 |
| 424,013 |
| $9.26* |
| C Class, $0.01 Par Value |
| $10,648,437 |
| 1,225,166 |
| $8.69 |
| R Class, $0.01 Par Value |
| $40,365 |
| 4,452 |
| $9.07 |
*Maximum offering price $9.82 (net asset value divided by 0.9425).
See Notes to Financial Statements.
|
| | | |
| YEAR ENDED MARCH 31, 2019 | |
| Investment Income (Loss) | |
| Income: | |
| Dividends (net of foreign taxes withheld of $149,837) | $ | 9,321,578 |
|
| Interest | 6,417,161 |
|
| | 15,738,739 |
|
| | |
| Expenses: | |
| Dividend expense on securities sold short | 7,659,068 |
|
| Management fees | 6,886,580 |
|
| Distribution and service fees: | |
| A Class | 19,421 |
|
| C Class | 160,003 |
|
| R Class | 256 |
|
| Directors' fees and expenses | 11,981 |
|
| Other expenses | 30,100 |
|
| | 14,767,409 |
|
Fees waived(1) | (411,003 | ) |
| | 14,356,406 |
|
| | |
| Net investment income (loss) | 1,382,333 |
|
| | |
| Realized and Unrealized Gain (Loss) | |
| Net realized gain (loss) on: | |
| Investment transactions | 40,598,862 |
|
| Securities sold short transactions | (20,013,106 | ) |
| Forward foreign currency exchange contract transactions | (17,370 | ) |
| Foreign currency translation transactions | (23,349 | ) |
| | 20,545,037 |
|
| | |
| Change in net unrealized appreciation (depreciation) on: | |
| Investments | (25,850,962 | ) |
| Securities sold short | (7,673,424 | ) |
| Translation of assets and liabilities in foreign currencies | (943 | ) |
| | (33,525,329 | ) |
| | |
| Net realized and unrealized gain (loss) | (12,980,292 | ) |
| | |
| Net Increase (Decrease) in Net Assets Resulting from Operations | $ | (11,597,959 | ) |
| |
| (1) | Amount consists of $171,523, $213,884, $9,208, $16,333 and $55 for Investor Class, I Class, A Class, C Class and R Class, respectively. |
See Notes to Financial Statements.
|
|
| Statement of Changes in Net Assets |
|
| | | | | | |
| YEARS ENDED MARCH 31, 2019 AND MARCH 31, 2018 |
| Increase (Decrease) in Net Assets | March 31, 2019 | March 31, 2018 |
| Operations | | |
| Net investment income (loss) | $ | 1,382,333 |
| $ | (6,819,922 | ) |
| Net realized gain (loss) | 20,545,037 |
| 8,077,339 |
|
| Change in net unrealized appreciation (depreciation) | (33,525,329 | ) | (17,218,668 | ) |
| Net increase (decrease) in net assets resulting from operations | (11,597,959 | ) | (15,961,251 | ) |
| | | |
| Distributions to Shareholders | | |
| From earnings: | | |
| Investor Class | (6,907,961 | ) | (6,698,830 | ) |
| I Class | (10,706,558 | ) | (5,587,919 | ) |
| A Class | (252,366 | ) | (365,770 | ) |
| C Class | (802,869 | ) | (638,486 | ) |
| R Class | (2,255 | ) | (1,837 | ) |
| Decrease in net assets from distributions | (18,672,009 | ) | (13,292,842 | ) |
| | | |
| Capital Share Transactions | | |
| Net increase (decrease) in net assets from capital share transactions (Note 5) | (221,823,229 | ) | (187,833,645 | ) |
| | | |
| Net increase (decrease) in net assets | (252,093,197 | ) | (217,087,738 | ) |
| | | |
| Net Assets | | |
| Beginning of period | 529,297,570 |
| 746,385,308 |
|
| End of period | $ | 277,204,373 |
| $ | 529,297,570 |
|
See Notes to Financial Statements.
|
|
| Notes to Financial Statements |
MARCH 31, 2019
1. Organization
American Century Capital Portfolios, Inc. (the corporation) is registered under the Investment Company Act of 1940, as amended (the 1940 Act), as an open-end management investment company and is organized as a Maryland corporation. AC Alternatives Market Neutral Value Fund (the fund) is one fund in a series issued by the corporation. The fund’s investment objective is to seek long-term capital growth, independent of equity market conditions.
The fund offers the Investor Class, I Class, A Class, C Class and R Class. The A Class may incur an initial sales charge. The A Class and C Class may be subject to a contingent deferred sales charge.
2. Significant Accounting Policies
The following is a summary of significant accounting policies consistently followed by the fund in preparation of its financial statements. The fund is an investment company and follows accounting and reporting guidance in accordance with accounting principles generally accepted in the United States of America. This may require management to make certain estimates and assumptions at the date of the financial statements. Actual results could differ from these estimates. Management evaluated the impact of events or transactions occurring through the date the financial statements were issued that would merit recognition or disclosure.
Investment Valuations — The fund determines the fair value of its investments and computes its net asset value per share at the close of regular trading (usually 4 p.m. Eastern time) on the New York Stock Exchange (NYSE) on each day the NYSE is open. The Board of Directors has adopted valuation policies and procedures to guide the investment advisor in the fund’s investment valuation process and to provide methodologies for the oversight of the fund’s pricing function.
Equity securities that are listed or traded on a domestic securities exchange are valued at the last reported sales price or at the official closing price as provided by the exchange. Equity securities traded on foreign securities exchanges are generally valued at the closing price of such securities on the exchange where primarily traded or at the close of the NYSE, if that is earlier. If no last sales price is reported, or if local convention or regulation so provides, the mean of the latest bid and asked prices may be used. Securities traded over-the-counter are valued at the mean of the latest bid and asked prices, the last sales price, or the official closing price. Equity securities initially expressed in local currencies are translated into U.S. dollars at the mean of the appropriate currency exchange rate at the close of the NYSE as provided by an independent pricing service.
Fixed income securities are valued at the evaluated mean as provided by independent pricing services or at the mean of the most recent bid and asked prices as provided by investment dealers. Corporate and convertible bonds are valued using market models that consider trade data, quotations from dealers and active market makers, relevant yield curve and spread data, creditworthiness, trade data or market information on comparable securities, and other relevant security specific information.
Open-end management investment companies are valued at the reported net asset value per share. Repurchase agreements are valued at cost, which approximates fair value. Forward foreign currency exchange contracts are valued at the mean of the appropriate forward exchange rate at the close of the NYSE as provided by an independent pricing service.
If the fund determines that the market price for an investment is not readily available or the valuation methods mentioned above do not reflect an investment’s fair value, such investment is valued as determined in good faith by the Board of Directors or its delegate, in accordance with policies and procedures adopted by the Board of Directors. In its determination of fair value, the fund may review several factors including, but not limited to, market information regarding the specific investment or comparable investments and correlation with other investment types, futures indices or general market indicators. Circumstances that may cause the fund to use these procedures to value an investment include, but are not limited to: an investment has been declared in default or is distressed; trading in a security has been suspended during the trading day or a security is not actively trading on its principal exchange; prices received from a regular pricing source are deemed unreliable; or there is a foreign market holiday and no trading occurred.
The fund monitors for significant events occurring after the close of an investment’s primary exchange but before the fund’s net asset value per share is determined. Significant events may include, but are not limited to: corporate announcements and transactions; governmental action and political unrest that could impact a specific investment or an investment sector; or armed conflicts, natural disasters and similar events that could affect investments in a specific country or region. The fund also monitors for significant fluctuations between domestic and foreign markets, as evidenced by the U.S. market or such other indicators that the Board of Directors, or its delegate, deems appropriate. If significant fluctuations in foreign markets are identified, the fund may apply a model-derived factor to the closing price of equity securities traded on foreign securities exchanges. The factor is based on observable market data as provided by an independent pricing service.
Security Transactions — Security transactions are accounted for as of the trade date. Net realized gains and losses are determined on the identified cost basis, which is also used for federal income tax purposes.
Investment Income — Dividend income less foreign taxes withheld, if any, is recorded as of the ex-dividend date. Distributions received on securities that represent a return of capital or long-term capital gain are recorded as a reduction of cost of investments and/or as a realized gain. The fund may estimate the components of distributions received that may be considered nontaxable distributions or long-term capital gain distributions for income tax purposes. Interest income is recorded on the accrual basis and includes accretion of discounts and amortization of premiums.
Securities Sold Short — The fund enters into short sales, which is selling securities it does not own, as part of its normal investment activities. Upon selling a security short, the fund will segregate cash, cash equivalents or other appropriate liquid securities in at least an amount equal to the current market value of the securities sold short until the fund replaces the borrowed security. Interest earned on segregated cash for securities sold short, if any, is reflected as interest income. The fund is required to pay any dividends or interest due on securities sold short. Such dividends and interest are recorded as an expense. The fund may pay fees or charges on the assets borrowed for securities sold short. These fees are calculated daily based upon the value of each security sold short and a rate that is dependent on the availability of such security. Liabilities for securities sold short are valued daily and changes in value are recorded as change in net unrealized appreciation (depreciation) on securities sold short. The fund records realized gain (loss) on a security sold short when it is terminated by the fund and includes as a component of net realized gain (loss) on securities sold short transactions.
Foreign Currency Translations — All assets and liabilities initially expressed in foreign currencies are translated into U.S. dollars at prevailing exchange rates at period end. The fund may enter into spot foreign currency exchange contracts to facilitate transactions denominated in a foreign currency. Purchases and sales of investment securities, dividend and interest income, spot foreign currency exchange contracts, and expenses are translated at the rates of exchange prevailing on the respective dates of such transactions. Net realized and unrealized foreign currency exchange gains or losses related to investment securities are a component of net realized gain (loss) on investment transactions and change in net unrealized appreciation (depreciation) on investments, respectively. Net realized and unrealized foreign currency exchange gains or losses related to securities sold short are a component of net realized gain (loss) on securities sold short transactions and change in net unrealized appreciation (depreciation) on securities sold short, respectively.
Segregated Assets — In accordance with the 1940 Act, the fund segregates assets on its books and records to cover certain types of investment securities and other financial instruments. American Century Investment Management, Inc. (ACIM) (the investment advisor) monitors, on a daily basis, the securities segregated to ensure the fund designates a sufficient amount of liquid assets, marked-to-market daily. The fund may also receive assets or be required to pledge assets at the custodian bank or with a broker for collateral requirements.
Repurchase Agreements — The fund may enter into repurchase agreements with institutions that ACIM has determined are creditworthy pursuant to criteria adopted by the Board of Directors. The fund requires that the collateral, represented by securities, received in a repurchase transaction be transferred to the custodian in a manner sufficient to enable the fund to obtain those securities in the event of a default under the repurchase agreement. ACIM monitors, on a daily basis, the securities transferred to ensure the value, including accrued interest, of the securities under each repurchase agreement is equal to or greater than amounts owed to the fund under each repurchase agreement.
Joint Trading Account — Pursuant to an Exemptive Order issued by the Securities and Exchange Commission, the fund, along with certain other funds in the American Century Investments family of funds, may transfer uninvested cash balances into a joint trading account. These balances are invested in one or more repurchase agreements that are collateralized by U.S. Treasury or Agency obligations.
Income Tax Status — It is the fund’s policy to distribute substantially all net investment income and net realized gains to shareholders and to otherwise qualify as a regulated investment company under provisions of the Internal Revenue Code. Accordingly, no provision has been made for income taxes. The fund files U.S. federal, state, local and non-U.S. tax returns as applicable. The fund's tax returns are subject to examination by the relevant taxing authority until expiration of the applicable statute of limitations, which is generally three years from the date of filing but can be longer in certain jurisdictions. At this time, management believes there are no uncertain tax positions which, based on their technical merit, would not be sustained upon examination and for which it is reasonably possible that the total amounts of unrecognized tax benefits will significantly change in the next twelve months.
Multiple Class — All shares of the fund represent an equal pro rata interest in the net assets of the class to which such shares belong, and have identical voting, dividend, liquidation and other rights and the same terms and conditions, except for class specific expenses and exclusive rights to vote on matters affecting only individual classes. Income, non-class specific expenses, and realized and unrealized capital gains and losses of the fund are allocated to each class of shares based on their relative net assets.
Distributions to Shareholders — Distributions from net investment income, if any, are generally declared and paid quarterly. Distributions from net realized gains, if any, are generally declared and paid annually.
Indemnifications — Under the corporation’s organizational documents, its officers and directors are indemnified against certain liabilities arising out of the performance of their duties to the fund. In addition, in the normal course of business, the fund enters into contracts that provide general indemnifications. The maximum exposure under these arrangements is unknown as this would involve future claims that may be made against a fund. The risk of material loss from such claims is considered by management to be remote.
3. Fees and Transactions with Related Parties
Certain officers and directors of the corporation are also officers and/or directors of American Century Companies, Inc. (ACC). The corporation’s investment advisor, ACIM, the corporation's distributor, American Century Investment Services, Inc. (ACIS), and the corporation’s transfer agent, American Century Services, LLC, are wholly owned, directly or indirectly, by ACC.
Management Fees — The corporation has entered into a management agreement with ACIM, under which ACIM provides the fund with investment advisory and management services in exchange for a single, unified management fee (the fee) per class. The agreement provides that all expenses of managing and operating the fund, except distribution and service fees, expenses on securities sold short, brokerage expenses, taxes, interest, fees and expenses of the independent directors (including legal counsel fees), and extraordinary expenses, will be paid by ACIM. The fee is computed and accrued daily based on each class's daily net assets and paid monthly in arrears. The difference in the fee among the classes is a result of their separate arrangements for non-Rule 12b-1 shareholder services. It is not the result of any difference in advisory or custodial fees or other expenses related to the management of the fund’s assets, which do not vary by class. From April 1, 2018 through July 31, 2018, the investment advisor agreed to waive 0.25% of the fund's management fee. Effective August 1, 2018, the investment advisor terminated the waiver and decreased the annual management fee by 0.25%.
The annual management fee and the effective annual management fee before and after waiver for each class for the period ended March 31, 2019 are as follows:
|
| | | |
| | | Effective Annual Management Fee |
| | Annual Management Fee* | Before Waiver | After Waiver |
| Investor Class | 1.65% | 1.75% | 1.65% |
| I Class | 1.45% | 1.55% | 1.45% |
| A Class | 1.65% | 1.75% | 1.65% |
| C Class | 1.65% | 1.75% | 1.65% |
| R Class | 1.65% | 1.75% | 1.65% |
*Prior to August 1, 2018, the annual management fee was 1.90% for the Investor Class, A Class, C Class and R Class and 1.70% for the I Class.
Distribution and Service Fees — The Board of Directors has adopted a separate Master Distribution and Individual Shareholder Services Plan for each of the A Class, C Class and R Class (collectively the plans), pursuant to Rule 12b-1 of the 1940 Act. The plans provide that the A Class will pay ACIS an annual distribution and service fee of 0.25%. The plans provide that the C Class will pay ACIS an annual distribution and service fee of 1.00%, of which 0.25% is paid for individual shareholder services and 0.75% is paid for distribution services. The plans provide that the R Class will pay ACIS an annual distribution and service fee of 0.50%. The fees are computed and accrued daily based on each class’s daily net assets and paid monthly in arrears. The fees are used to pay financial intermediaries for distribution and individual shareholder services. Fees incurred under the plans during the period ended March 31, 2019 are detailed in the Statement of Operations.
Directors' Fees and Expenses — The Board of Directors is responsible for overseeing the investment advisor’s management and operations of the fund. The directors receive detailed information about the fund and its investment advisor regularly throughout the year, and meet at least quarterly with management of the investment advisor to review reports about fund operations. The fund’s officers do not receive compensation from the fund.
Interfund Transactions — The fund may enter into security transactions with other American Century Investments funds and other client accounts of the investment advisor, in accordance with the 1940 Act rules and procedures adopted by the Board of Directors. The rules and procedures require, among other things, that these transactions be effected at the independent current market price of the security. During the period, the interfund purchases and sales were $8,665,064 and $12,460,349, respectively. The effect of interfund transactions on the Statement of Operations was $(73,950) in net realized gain (loss) on investment transactions.
4. Investment Transactions
Purchases and sales of investment securities and securities sold short, excluding short-term investments, for the period ended March 31, 2019 were $1,321,554,616 and $1,301,562,989, respectively.
5. Capital Share Transactions
Transactions in shares of the fund were as follows:
|
| | | | | | | | | | |
| | Year ended March 31, 2019 | Year ended March 31, 2018 |
| | Shares | Amount | Shares | Amount |
| Investor Class/Shares Authorized | 170,000,000 |
| | 240,000,000 |
| |
| Sold | 3,286,629 |
| $ | 33,034,441 |
| 14,653,809 |
| $ | 155,378,996 |
|
| Issued in reinvestment of distributions | 722,917 |
| 6,903,858 |
| 640,969 |
| 6,627,618 |
|
| Redeemed | (18,848,151 | ) | (187,412,531 | ) | (31,655,638 | ) | (333,048,836 | ) |
| | (14,838,605 | ) | (147,474,232 | ) | (16,360,860 | ) | (171,042,222 | ) |
| I Class/Shares Authorized | 220,000,000 |
| | 150,000,000 |
| |
| Sold | 15,751,101 |
| 161,495,339 |
| 22,670,745 |
| 241,153,307 |
|
| Issued in reinvestment of distributions | 1,062,405 |
| 10,315,952 |
| 515,071 |
| 5,403,092 |
|
| Redeemed | (22,323,814 | ) | (227,846,287 | ) | (15,002,218 | ) | (159,752,059 | ) |
| | (5,510,308 | ) | (56,034,996 | ) | 8,183,598 |
| 86,804,340 |
|
| A Class/Shares Authorized | 25,000,000 |
| | 70,000,000 |
| |
| Sold | 129,158 |
| 1,287,385 |
| 864,634 |
| 9,018,952 |
|
| Issued in reinvestment of distributions | 26,852 |
| 251,608 |
| 35,896 |
| 365,419 |
|
| Redeemed | (925,853 | ) | (9,237,455 | ) | (9,756,785 | ) | (102,303,722 | ) |
| | (769,843 | ) | (7,698,462 | ) | (8,856,255 | ) | (92,919,351 | ) |
| C Class/Shares Authorized | 25,000,000 |
| | 25,000,000 |
| |
| Sold | 60,650 |
| 567,849 |
| 282,807 |
| 2,814,310 |
|
| Issued in reinvestment of distributions | 91,016 |
| 801,847 |
| 65,910 |
| 638,013 |
|
| Redeemed | (1,288,401 | ) | (11,950,802 | ) | (1,427,910 | ) | (14,089,402 | ) |
| | (1,136,735 | ) | (10,581,106 | ) | (1,079,193 | ) | (10,637,079 | ) |
| R Class/Shares Authorized | 10,000,000 |
| | 10,000,000 |
| |
| Sold | 2,617 |
| 25,325 |
| 4,087 |
| 41,696 |
|
| Issued in reinvestment of distributions | 245 |
| 2,255 |
| 184 |
| 1,837 |
|
| Redeemed | (6,369 | ) | (62,013 | ) | (8,063 | ) | (82,866 | ) |
| | (3,507 | ) | (34,433 | ) | (3,792 | ) | (39,333 | ) |
| Net increase (decrease) | (22,258,998 | ) | $ | (221,823,229 | ) | (18,116,502 | ) | $ | (187,833,645 | ) |
6. Fair Value Measurements
The fund’s investments valuation process is based on several considerations and may use multiple inputs to determine the fair value of the investments held by the fund. In conformity with accounting principles generally accepted in the United States of America, the inputs used to determine a valuation are classified into three broad levels.
| |
| • | Level 1 valuation inputs consist of unadjusted quoted prices in an active market for identical investments. |
| |
| • | Level 2 valuation inputs consist of direct or indirect observable market data (including quoted prices for comparable investments, evaluations of subsequent market events, interest rates, prepayment speeds, credit risk, etc.). These inputs also consist of quoted prices for identical investments initially expressed in local currencies that are adjusted through translation into U.S. dollars. |
| |
| • | Level 3 valuation inputs consist of unobservable data (including a fund’s own assumptions). |
The level classification is based on the lowest level input that is significant to the fair valuation measurement. The valuation inputs are not necessarily an indication of the risks associated with investing in these securities or other financial instruments.
The following is a summary of the level classifications as of period end. The Schedule of Investments provides additional information on the fund’s portfolio holdings.
|
| | | | | | | | |
| | Level 1 | Level 2 | Level 3 |
| Assets | | | |
| Investment Securities | | | |
| Common Stocks | | | |
| Aerospace and Defense | $ | 1,266,196 |
| $ | 5,472,068 |
| — |
|
| Banks | 17,546,540 |
| 2,460,476 |
| — |
|
| Electrical Equipment | 14,185,290 |
| 1,087,509 |
| — |
|
| Hotels, Restaurants and Leisure | 9,357,321 |
| 2,121,839 |
| — |
|
| Machinery | 17,617,412 |
| 7,032,958 |
| — |
|
| Textiles, Apparel and Luxury Goods | 14,197,008 |
| 2,897,191 |
| — |
|
| Other Industries | 154,185,893 |
| — |
| — |
|
| Exchange-Traded Funds | 27,410,784 |
| — |
| — |
|
| Temporary Cash Investments | 25,183 |
| 96,575 |
| — |
|
| | $ | 255,791,627 |
| $ | 21,168,616 |
| — |
|
| | | | |
| Liabilities | | | |
| Securities Sold Short | | | |
| Common Stocks | | | |
| Aerospace and Defense | $ | 4,237,588 |
| $ | 2,429,092 |
| — |
|
| Banks | 15,167,616 |
| 2,467,783 |
| — |
|
| Food Products | 1,566,990 |
| 1,419,317 |
| — |
|
| Hotels, Restaurants and Leisure | 12,466,602 |
| 2,188,102 |
| — |
|
| Insurance | 4,094,956 |
| 1,784,127 |
| — |
|
| Pharmaceuticals | 10,770,013 |
| 2,449,297 |
| — |
|
| Textiles, Apparel and Luxury Goods | 21,093,818 |
| 2,953,610 |
| — |
|
| Other Industries | 158,410,453 |
| — |
| — |
|
| Exchange-Traded Funds | 33,605,978 |
| — |
| — |
|
| | $ | 261,414,014 |
| $ | 15,691,328 |
| — |
|
7. Derivative Instruments
Foreign Currency Risk — The fund is subject to foreign currency exchange rate risk in the normal course of pursuing its investment objectives. The value of foreign investments held by a fund may be significantly affected by changes in foreign currency exchange rates. The dollar value of a foreign security generally decreases when the value of the dollar rises against the foreign currency in which the security is denominated and tends to increase when the value of the dollar declines against such foreign currency. A fund may enter into forward foreign currency exchange contracts to reduce a fund's exposure to foreign currency exchange rate fluctuations. The net U.S. dollar value of foreign currency underlying all contractual commitments held by a fund and the resulting unrealized appreciation or depreciation are determined daily. Realized gain or loss is recorded upon the termination of the contract. Net realized and unrealized gains or losses occurring during the holding period of forward foreign currency exchange contracts are a component of net realized gain (loss) on forward foreign currency exchange contract transactions and change in net unrealized appreciation (depreciation) on forward foreign currency exchange contracts, respectively. A fund bears the risk of an unfavorable change in the foreign currency exchange rate underlying the forward contract. Additionally, losses, up to the fair value, may arise if the counterparties do not perform under the contract terms. The fund's average U.S. dollar exposure to foreign currency risk derivative instruments held during the period was $1,127,912.
At period end, the fund did not have any derivative instruments disclosed on the Statement of Assets and Liabilities. For the year ended March 31, 2019, the effect of foreign currency risk derivative instruments on the Statement of Operations was $(17,370) in net realized gain (loss) on forward foreign currency exchange contract transactions.
8. Risk Factors
The fund’s investment process may result in high portfolio turnover, which could mean high transaction costs, affecting both performance and capital gains tax liabilities to investors.
The fund is subject to short sales risk. If the market price of a security increases after the fund borrows the security, the fund may suffer a loss when it replaces the borrowed security at the higher price. Any loss will be increased by the amount of compensation, interest or dividends, and transaction costs the fund must pay to the lender of the borrowed security.
There are certain risks involved in investing in foreign securities. These risks include those resulting from political events (such as civil unrest, national elections and imposition of exchange controls), social and economic events (such as labor strikes and rising inflation), and natural disasters. Securities of foreign issuers may be less liquid and more volatile. Investing a significant portion of assets in one country or region may accentuate these risks.
9. Federal Tax Information
The tax character of distributions paid during the years ended March 31, 2019 and March 31, 2018 were as follows:
|
| | | | | | |
| | 2019 | 2018 |
| Distributions Paid From | | |
| Ordinary income | $ | 3,983,846 |
| $ | 6,768,945 |
|
| Long-term capital gains | $ | 14,688,163 |
| $ | 6,523,897 |
|
The book-basis character of distributions made during the year from net investment income or net realized gains may differ from their ultimate characterization for federal income tax purposes. These differences reflect the differing character of certain income items and net realized gains and losses for financial statement and tax purposes, and may result in reclassification among certain capital accounts on the financial statements.
As of period end, the federal tax cost of investments and the components of distributable earnings on a tax-basis were as follows:
|
| | | |
| Federal tax cost of investments | $ | 265,403,248 |
|
| Gross tax appreciation of investments | $ | 19,169,989 |
|
| Gross tax depreciation of investments | (7,612,994 | ) |
| Net tax appreciation (depreciation) of investments | 11,556,995 |
|
| Gross tax appreciation on securities sold short | — |
|
| Gross tax depreciation on securities sold short | (53,116,386 | ) |
| Net tax appreciation (depreciation) on derivatives and translation of assets and liabilities in foreign currencies | (657 | ) |
| Net tax appreciation (depreciation) | $ | (41,560,048 | ) |
| Other book-to-tax adjustments | $ | (1,079,685 | ) |
| Undistributed ordinary income | — |
|
| Late-year ordinary loss deferral | $ | (5,230 | ) |
| Post-October capital loss deferral | $ | (4,069,118 | ) |
The difference between book-basis and tax-basis unrealized appreciation (depreciation) is attributable primarily to the tax deferral of losses on wash sales. Other book-to-tax adjustments are attributable primarily to the tax deferral of losses on straddle positions.
Loss deferrals represent certain qualified losses that the fund has elected to treat as having been incurred in the following fiscal year for federal income tax purposes.
10. Recently Issued Accounting Standards
In March 2017, the Financial Accounting Standards Board (FASB) issued Accounting Standards Update No. 2017-08, “Receivables - Nonrefundable Fees and Other Costs (Subtopic 310-20), Premium Amortization on Purchased Callable Debt Securities” (ASU 2017-08). ASU 2017-08 amends the amortization period for certain purchased callable debt securities held at a premium, shortening such period to the earliest call date. The amendments are effective for fiscal years, and interim periods within those fiscal years, beginning after December 15, 2018. Management is currently evaluating the impact that adopting ASU 2017-08 will have on the financial statements.
|
| | | | | | | | | | | | | | | | |
For a Share Outstanding Throughout the Years Ended March 31 (except as noted)
|
| Per-Share Data | | | | | | Ratios and Supplemental Data | | |
| | | Income From Investment Operations: | | | | Ratio to Average Net Assets of: | | |
| | Net Asset
Value,
Beginning
of Period | Net
Investment
Income
(Loss)(1) | Net
Realized
and
Unrealized
Gain (Loss) | Total From
Investment
Operations | Distributions From Net
Realized
Gains | Net Asset
Value,
End
of Period | Total
Return(2) | Operating
Expenses | Operating
Expenses
(before
expense
waiver) | Operating
Expenses
(excluding
expenses on
securities
sold short) | Net
Investment
Income
(Loss) | Net
Investment
Income
(Loss)
(before
expense
waiver) | Portfolio
Turnover
Rate | Net
Assets,
End of
Period
(in thousands) |
| Investor Class | | | | | | | | | | | | | |
| 2019 | $10.27 | 0.02 | (0.33) | (0.31) | (0.51) | $9.45 | (3.04)% | 3.48% | 3.58% | 1.66% | 0.26% | 0.16% | 324% |
| $73,871 |
|
| 2018 | $10.76 | (0.12) | (0.13) | (0.25) | (0.24) | $10.27 | (2.36)% | 3.82% | 4.07% | 1.66% | (1.10)% | (1.35)% | 307% |
| $232,629 |
|
| 2017 | $10.73 | (0.18) | 0.49 | 0.31 | (0.28) | $10.76 | 2.97% | 3.68% | 3.94% | 1.64% | (1.65)% | (1.91)% | 374% |
| $419,925 |
|
| 2016 | $10.44 | (0.19) | 0.65 | 0.46 | (0.17) | $10.73 | 4.42% | 3.78% | 4.08% | 1.61% | (1.82)% | (2.12)% | 679% |
| $253,885 |
|
| 2015 | $10.22 | (0.20) | 0.62 | 0.42 | (0.20) | $10.44 | 4.10% | 3.88% | 4.18% | 1.60% | (1.95)% | (2.25)% | 447% |
| $49,465 |
|
| I Class | | | | | | | | | | | | | |
| 2019 | $10.42 | 0.05 | (0.35) | (0.30) | (0.51) | $9.61 | (2.90)% | 3.28% | 3.38% | 1.46% | 0.46% | 0.36% | 324% |
| $188,718 |
|
| 2018 | $10.89 | (0.09) | (0.14) | (0.23) | (0.24) | $10.42 | (2.15)% | 3.62% | 3.87% | 1.46% | (0.90)% | (1.15)% | 307% |
| $261,906 |
|
| 2017 | $10.83 | (0.16) | 0.50 | 0.34 | (0.28) | $10.89 | 3.23% | 3.48% | 3.74% | 1.44% | (1.45)% | (1.71)% | 374% |
| $184,717 |
|
| 2016 | $10.52 | (0.16) | 0.64 | 0.48 | (0.17) | $10.83 | 4.58% | 3.58% | 3.88% | 1.41% | (1.62)% | (1.92)% | 679% |
| $124,249 |
|
| 2015 | $10.28 | (0.18) | 0.62 | 0.44 | (0.20) | $10.52 | 4.28% | 3.68% | 3.98% | 1.40% | (1.75)% | (2.05)% | 447% |
| $6,013 |
|
| A Class | | | | | | | | | | | | | |
| 2019 | $10.10 | (0.01) | (0.32) | (0.33) | (0.51) | $9.26 | (3.29)% | 3.73% | 3.83% | 1.91% | 0.01% | (0.09)% | 324% |
| $3,926 |
|
| 2018 | $10.61 | (0.15) | (0.12) | (0.27) | (0.24) | $10.10 | (2.58)% | 4.07% | 4.32% | 1.91% | (1.35)% | (1.60)% | 307% |
| $12,055 |
|
| 2017 | $10.61 | (0.20) | 0.48 | 0.28 | (0.28) | $10.61 | 2.72% | 3.93% | 4.19% | 1.89% | (1.90)% | (2.16)% | 374% |
| $106,662 |
|
| 2016 | $10.36 | (0.22) | 0.64 | 0.42 | (0.17) | $10.61 | 4.07% | 4.03% | 4.33% | 1.86% | (2.07)% | (2.37)% | 679% |
| $76,630 |
|
| 2015 | $10.16 | (0.23) | 0.63 | 0.40 | (0.20) | $10.36 | 3.93% | 4.13% | 4.43% | 1.85% | (2.20)% | (2.50)% | 447% |
| $9,311 |
|
|
| | | | | | | | | | | | | | | | |
For a Share Outstanding Throughout the Years Ended March 31 (except as noted)
|
| Per-Share Data | | | | | | Ratios and Supplemental Data | | |
| | | Income From Investment Operations: | | | | Ratio to Average Net Assets of: | | |
| | Net Asset
Value,
Beginning
of Period | Net
Investment
Income
(Loss)(1) | Net
Realized
and
Unrealized
Gain (Loss) | Total From
Investment
Operations | Distributions From Net
Realized
Gains | Net Asset
Value,
End
of Period | Total
Return(2) | Operating
Expenses | Operating
Expenses
(before
expense
waiver) | Operating
Expenses
(excluding
expenses on
securities
sold short) | Net
Investment
Income
(Loss) | Net
Investment
Income
(Loss)
(before
expense
waiver) | Portfolio
Turnover
Rate | Net
Assets,
End of
Period
(in thousands) |
| C Class | | | | | | | | | | | | | |
| 2019 | $9.58 | (0.07) | (0.31) | (0.38) | (0.51) | $8.69 | (4.00)% | 4.48% | 4.58% | 2.66% | (0.74)% | (0.84)% | 324% |
| $10,648 |
|
| 2018 | $10.16 | (0.21) | (0.13) | (0.34) | (0.24) | $9.58 | (3.39)% | 4.82% | 5.07% | 2.66% | (2.10)% | (2.35)% | 307% |
| $22,629 |
|
| 2017 | $10.24 | (0.27) | 0.47 | 0.20 | (0.28) | $10.16 | 2.03% | 4.68% | 4.94% | 2.64% | (2.65)% | (2.91)% | 374% |
| $34,958 |
|
| 2016 | $10.08 | (0.29) | 0.62 | 0.33 | (0.17) | $10.24 | 3.28% | 4.78% | 5.08% | 2.61% | (2.82)% | (3.12)% | 679% |
| $20,902 |
|
| 2015 | $9.97 | (0.30) | 0.61 | 0.31 | (0.20) | $10.08 | 3.10% | 4.88% | 5.18% | 2.60% | (2.95)% | (3.25)% | 447% |
| $7,948 |
|
| R Class | | | | | | | | | | | | | |
| 2019 | $9.92 | (0.03) | (0.31) | (0.34) | (0.51) | $9.07 | (3.45)% | 3.98% | 4.08% | 2.16% | (0.24)% | (0.34)% | 324% |
| $40 |
|
| 2018 | $10.46 | (0.16) | (0.14) | (0.30) | (0.24) | $9.92 | (2.91)% | 4.32% | 4.57% | 2.16% | (1.60)% | (1.85)% | 307% |
| $79 |
|
| 2017 | $10.49 | (0.22) | 0.47 | 0.25 | (0.28) | $10.46 | 2.47% | 4.18% | 4.44% | 2.14% | (2.15)% | (2.41)% | 374% |
| $123 |
|
| 2016 | $10.26 | (0.21) | 0.61 | 0.40 | (0.17) | $10.49 | 3.91% | 4.28% | 4.58% | 2.11% | (2.32)% | (2.62)% | 679% |
| $76 |
|
| 2015 | $10.10 | (0.25) | 0.61 | 0.36 | (0.20) | $10.26 | 3.56% | 4.38% | 4.68% | 2.10% | (2.45)% | (2.75)% | 447% |
| $447 |
|
|
|
| Notes to Financial Highlights |
| |
| (1) | Computed using average shares outstanding throughout the period. |
| |
| (2) | Total returns are calculated based on the net asset value of the last business day and do not reflect applicable sales charges, if any. Total returns for periods less than one year are not annualized. |
See Notes to Financial Statements.
|
|
| Report of Independent Registered Public Accounting Firm |
To the shareholders and the Board of Directors of American Century Capital Portfolios, Inc.:
Opinion on the Financial Statements and Financial Highlights
We have audited the accompanying statement of assets and liabilities, including the schedule of investments, of AC Alternatives® Market Neutral Value Fund, one of the portfolios constituting the American Century Capital Portfolios, Inc. (the “Fund”), as of March 31, 2019, the related statement of operations for the year then ended, the statements of changes in net assets for each of the two years in the period then ended, the financial highlights for each of the five years in the period then ended, and the related notes. In our opinion, the financial statements and financial highlights present fairly, in all material respects, the financial position of AC Alternatives® Market Neutral Value Fund of the American Century Capital Portfolios, Inc. as of March 31, 2019, the results of its operations for the year then ended, the changes in its net assets for each of the two years in the period then ended, and the financial highlights for each of the five years in the period then ended, in conformity with accounting principles generally accepted in the United States of America.
Basis for Opinion
These financial statements and financial highlights are the responsibility of the Fund's management. Our responsibility is to express an opinion on the Fund’s financial statements and financial highlights based on our audits. We are a public accounting firm registered with the Public Company Accounting Oversight Board (United States) (PCAOB) and are required to be independent with respect to the Fund in accordance with the U.S. federal securities laws and the applicable rules and regulations of the Securities and Exchange Commission and the PCAOB.
We conducted our audits in accordance with the standards of the PCAOB. Those standards require that we plan and perform the audit to obtain reasonable assurance about whether the financial statements and financial highlights are free of material misstatement, whether due to error or fraud. The Fund is not required to have, nor were we engaged to perform, an audit of its internal control over financial reporting. As part of our audits we are required to obtain an understanding of internal control over financial reporting but not for the purpose of expressing an opinion on the effectiveness of the Fund’s internal control over financial reporting. Accordingly, we express no such opinion.
Our audits included performing procedures to assess the risks of material misstatement of the financial statements and financial highlights, whether due to error or fraud, and performing procedures that respond to those risks. Such procedures included examining, on a test basis, evidence regarding the amounts and disclosures in the financial statements and financial highlights. Our audits also included evaluating the accounting principles used and significant estimates made by management, as well as evaluating the overall presentation of the financial statements and financial highlights. Our procedures included confirmation of securities owned as of March 31, 2019, by correspondence with the custodian and brokers; when replies were not received from brokers, we performed other auditing procedures. We believe that our audits provide a reasonable basis for our opinion.
DELOITTE & TOUCHE LLP
Kansas City, Missouri
May 16, 2019
We have served as the auditor of one or more American Century investment companies since 1997.
The Board of Directors
The individuals listed below serve as directors of the funds. Each director will continue to serve in this capacity until death, retirement, resignation or removal from office. The board has adopted a mandatory retirement age for directors who are not “interested persons,” as that term is defined in the Investment Company Act (independent directors). Independent directors shall retire by December 31 of the year in which they reach their 75th birthday.
Mr. Thomas is an “interested person” because he currently serves as President and Chief Executive Officer of American Century Companies, Inc. (ACC), the parent company of American Century Investment Management, Inc. (ACIM or the advisor). The other directors (more than three-fourths of the total number) are independent. They are not employees, directors or officers of, and have no financial interest in, ACC or any of its wholly owned, direct or indirect, subsidiaries, including ACIM, American Century Investment Services, Inc. (ACIS) and American Century Services, LLC (ACS), and they do not have any other affiliations, positions or relationships that would cause them to be considered “interested persons” under the Investment Company Act. The directors serve in this capacity for seven (in the case of Jonathan S. Thomas, 16; and Stephen E. Yates, 8) registered investment companies in the American Century Investments family of funds.
The following table presents additional information about the directors. The mailing address for each director is 4500 Main Street, Kansas City, Missouri 64111.
|
| | | | | |
Name
(Year of Birth) | Position(s) Held with Funds | Length of Time Served | Principal Occupation(s) During Past 5 Years | Number of American Century Portfolios Overseen by Director | Other Directorships Held During Past 5 Years |
| Independent Directors |
|
|
| Thomas W. Bunn (1953) | Director | Since 2017 | Retired | 67 | SquareTwo Financial; Barings (formerly Babson Capital Funds Trust) (2013 to 2016) |
Chris H. Cheesman
(1962)
| Director | Since 2019
| Retired. Senior Vice President & Chief Audit Executive, AllianceBernstein (1999 to 2018)
| 67 | None |
Barry Fink
(1955) | Director | Since 2012 (independent since 2016) | Retired | 67 | None |
Rajesh K. Gupta
(1960)
| Director | Since 2019
| Partner Emeritus, SeaCrest Investment Management and SeaCrest Wealth Management (2019 to Present); Chief Executive Officer and Chief Investment Officer, SeaCrest Investment Management (2006 to 2019); Chief Executive Officer and Chief Investment Officer, SeaCrest Wealth Management (2008 to 2019)
| 67 | None |
|
| | | | | |
Name
(Year of Birth) | Position(s) Held with Funds | Length of Time Served | Principal Occupation(s) During Past 5 Years | Number of American Century Portfolios Overseen by Director | Other Directorships Held During Past 5 Years |
| Independent Directors |
|
|
Lynn Jenkins
(1963)
| Director | Since 2019
| United States Representative, U.S. House of Representatives (2009 to 2018) | 67 | MGP Ingredients, Inc. |
Jan M. Lewis
(1957) | Director | Since 2011 | Retired | 67 | None |
John R. Whitten
(1946) | Director | Since 2008 | Retired | 67 | Rudolph Technologies, Inc. |
Stephen E. Yates
(1948) | Director and Chairman of the Board | Since 2012 (Chairman since 2018) | Retired | 72 | None |
| Interested Director |
|
|
Jonathan S. Thomas
(1963) | Director and President | Since 2007 | President and Chief Executive Officer, ACC (2007 to present). Also serves as Chief Executive Officer, ACS; Executive Vice President, ACIM; Director, ACC, ACIM and other ACC subsidiaries | 117 | BioMed Valley Discoveries, Inc. |
The Statement of Additional Information has additional information about the fund's directors and is available without charge, upon request, by calling 1-800-345-2021.
Officers
The following table presents certain information about the executive officers of the funds. Each officer serves as an officer for 16 (in the case of Robert J. Leach, 15) investment companies in the American Century family of funds, unless otherwise noted. No officer is compensated for his or her service as an officer of the funds. The listed officers are interested persons of the funds and are appointed or re-appointed on an annual basis. The mailing address for each officer listed below is 4500 Main Street, Kansas City, Missouri 64111.
|
| | |
Name
(Year of Birth) | Offices with the Funds | Principal Occupation(s) During the Past Five Years |
Jonathan S. Thomas
(1963) | Director and President since 2007 | President and Chief Executive Officer, ACC (2007 to present). Also serves as Chief Executive Officer, ACS; Executive Vice President, ACIM; Director, ACC, ACIM and other ACC subsidiaries |
R. Wes Campbell
(1974)
| Chief Financial Officer and Treasurer since 2018 | Investment Operations and Investment Accounting, ACS (2000 to present) |
Amy D. Shelton
(1964) | Chief Compliance Officer and Vice President since 2014 | Chief Compliance Officer, American Century funds, (2014 to present); Chief Compliance Officer, ACIM (2014 to present); Chief Compliance Officer, ACIS (2009 to present); Vice President, Client Interactions and Marketing, ACIS (2013 to 2014). Also serves as Vice President, ACIS |
Charles A. Etherington
(1957) | General Counsel since 2007 and Senior Vice President since 2006 | Attorney, ACC (1994 to present); Vice President, ACC (2005 to present); General Counsel, ACC (2007 to present). Also serves as General Counsel, ACIM, ACS, ACIS and other ACC subsidiaries; and Senior Vice President, ACIM and ACS |
C. Jean Wade
(1964) | Vice President since 2012 | Senior Vice President, ACS (2017 to present); Vice President, ACS (2000 to 2017) |
Robert J. Leach
(1966) | Vice President since 2006 | Vice President, ACS (2000 to present) |
David H. Reinmiller
(1963) | Vice President since 2000 | Attorney, ACC (1994 to present). Also serves as Vice President, ACIM and ACS |
Ward D. Stauffer
(1960) | Secretary since 2005 | Attorney, ACC (2003 to present) |
Retirement Account Information
As required by law, distributions you receive from certain retirement accounts are subject to federal income tax withholding, unless you elect not to have withholding apply*. Tax will be withheld on the total amount withdrawn even though you may be receiving amounts that are not subject to withholding, such as nondeductible contributions. In such case, excess amounts of withholding could occur. You may adjust your withholding election so that a greater or lesser amount will be withheld.
If you don’t want us to withhold on this amount, you must notify us to not withhold the federal income tax. You may notify us in writing or in certain situations by telephone or through other electronic means. For systematic withdrawals, your withholding election will remain in effect until revoked or changed by filing a new election. You have the right to revoke your election at any time and change your withholding percentage for future distributions.
Remember, even if you elect not to have income tax withheld, you are liable for paying income tax on the taxable portion of your withdrawal. If you elect not to have income tax withheld or you don’t have enough income tax withheld, you may be responsible for payment of estimated tax. You may incur penalties under the estimated tax rules if your withholding and estimated tax payments are not sufficient. You can reduce or defer the income tax on a distribution by directly or indirectly rolling such distribution over to another IRA or eligible plan. You should consult your tax advisor for additional information.
State tax will be withheld if, at the time of your distribution, your address is within one of the mandatory withholding states and you have federal income tax withheld (or as otherwise required by state law). State taxes will be withheld from your distribution in accordance with the respective state rules.
*Some 403(b), 457 and qualified retirement plan distributions may be subject to 20% mandatory withholding, as they are subject to special tax and withholding rules. Your plan administrator or plan sponsor is required to provide you with a special tax notice explaining those rules at the time you request a distribution. If applicable, federal and/or state taxes may be withheld from your distribution amount.
Proxy Voting Policies
A description of the policies that the fund's investment advisor uses in exercising the voting rights associated with the securities purchased and/or held by the fund is available without charge, upon request, by calling 1-800-345-2021. It is also available on the "About Us" page of American Century Investments’ website at americancentury.com and on the Securities and Exchange Commission’s website at sec.gov. Information regarding how the investment advisor voted proxies relating to portfolio securities during the most recent 12-month period ended June 30 is available on the "About Us" page at americancentury.com. It is also available at sec.gov.
Quarterly Portfolio Disclosure
The fund files its complete schedule of portfolio holdings with the Securities and Exchange Commission (SEC) for the first and third quarters of each fiscal year on Form N-Q or as an exhibit to its reports on Form N-PORT. The fund’s Forms N-Q and Form N-PORT reports are available on the SEC’s website at sec.gov. The fund also makes its complete schedule of portfolio holdings for the most recent quarter of its fiscal year available on its website at americancentury.com and, upon request, by calling 1-800-345-2021.
Other Tax Information
The following information is provided pursuant to provisions of the Internal Revenue Code.
The fund hereby designates up to the maximum amount allowable as qualified dividend income for the fiscal year ended March 31, 2019.
For corporate taxpayers, the fund hereby designates $3,927,603, or up to the maximum amount allowable, of ordinary income distributions paid during the fiscal year ended March 31, 2019 as qualified for the corporate dividends received deduction.
The fund hereby designates $1,859,637 as qualified short-term capital gain distributions for purposes of Internal Revenue Code Section 871 for the fiscal year ended March 31, 2019.
The fund hereby designates $14,688,163, or up to the maximum amount allowable, as long-term capital gain distributions (20% rate gain distributions) for the fiscal year ended March 31, 2019.
|
| | |
| |
| | | |
| Contact Us | americancentury.com | |
| Automated Information Line | 1-800-345-8765 | |
| Investor Services Representative | 1-800-345-2021 or 816-531-5575 | |
| Investors Using Advisors | 1-800-378-9878 | |
| Business, Not-For-Profit, Employer-Sponsored Retirement Plans | 1-800-345-3533 | |
| Banks and Trust Companies, Broker-Dealers, Financial Professionals, Insurance Companies | 1-800-345-6488 | |
| Telecommunications Relay Service for the Deaf | 711 | |
| | | |
| American Century Capital Portfolios, Inc. | |
| | | |
Investment Advisor: American Century Investment Management, Inc. Kansas City, Missouri | |
| | | |
| This report and the statements it contains are submitted for the general information of our shareholders. The report is not authorized for distribution to prospective investors unless preceded or accompanied by an effective prospectus. | |
| | | |
©2019 American Century Proprietary Holdings, Inc. All rights reserved.
CL-ANN-92270 1905 | |

|
| |
| | |
| | Annual Report |
| | |
| | March 31, 2019 |
| | |
| | Equity Income Fund |
| | Investor Class (TWEIX) |
| | I Class (ACIIX) |
| | Y Class (AEIYX) |
| | A Class (TWEAX) |
| | C Class (AEYIX) |
| | R Class (AEURX) |
| | R5 Class (AEIUX) |
| | R6 Class (AEUDX) |
Beginning on January 1, 2021, as permitted by regulations adopted by the Securities and Exchange Commission, paper copies of the fund’s shareholder reports like this one will no longer be sent by mail, unless you specifically request paper copies of the reports from the fund or from your financial intermediary, such as a broker-dealer or bank. Instead, the reports will be made available on a website, and you will be notified by mail each time a report is posted and provided with a website link to access the report.
If you already elected to receive shareholder reports electronically, you will not be affected by this change and you need not take any action. You may elect to receive shareholder reports and other communications from the fund or your financial intermediary electronically by calling or sending an email request to your appropriate contacts as listed on the back cover of this report.
You may elect to receive all future reports in paper free of charge. You can inform the fund or your financial intermediary that you wish to continue receiving paper copies of your shareholder reports by calling or sending an email request to your appropriate contacts as listed on the back cover of this report. Your election to receive reports in paper will apply to all funds held with the fund complex/your financial intermediary.
|
| | |
| President’s Letter | 2 |
|
| Performance | 3 |
|
| Portfolio Commentary | |
|
| Fund Characteristics | |
|
| Shareholder Fee Example | |
|
| Schedule of Investments | |
|
| Statement of Assets and Liabilities | |
|
| Statement of Operations | |
|
| Statement of Changes in Net Assets | |
|
| Notes to Financial Statements | |
|
| Financial Highlights | |
|
| Report of Independent Registered Public Accounting Firm | |
|
| Management | |
|
| Additional Information | |
|
Any opinions expressed in this report reflect those of the author as of the date of the report, and do not necessarily represent the opinions of American Century Investments® or any other person in the American Century Investments organization. Any such opinions are subject to change at any time based upon market or other conditions and American Century Investments disclaims any responsibility to update such opinions. These opinions may not be relied upon as investment advice and, because investment decisions made by American Century Investments funds are based on numerous factors, may not be relied upon as an indication of trading intent on behalf of any American Century Investments fund. Security examples are used for representational purposes only and are not intended as recommendations to purchase or sell securities. Performance information for comparative indices and securities is provided to American Century Investments by third party vendors. To the best of American Century Investments’ knowledge, such information is accurate at the time of printing.
Jonathan Thomas
Dear Investor:
Thank you for reviewing this annual report for the period ended March 31, 2019. Annual reports help convey important information about fund returns, including market factors that affected performance during the reporting period. For additional, updated investment and market insights, we encourage you to visit our website, americancentury.com.
Markets Ended Roller-Coaster Period on Upswing
For the first half of the period, U.S. stocks climbed higher, while bond returns headed lower. Robust economic growth, bolstered by federal tax and regulatory reform, and record corporate earnings results fueled risk-on sentiment that drove stock prices higher. Meanwhile, the combination of strong economic data, the Federal Reserve’s (Fed’s) ongoing rate-hike campaign and an uptick in inflation pushed investment-grade bond returns lower.
Market trends began changing in late 2018. Mounting investor concerns about slowing global economic and earnings growth, U.S.-China trade tensions and rising interest rates triggered widespread volatility. Stock prices plunged as investors sought safe-haven investments, including U.S. Treasuries. Furthermore, the Fed issued another rate hike in December, its fourth of the year, and maintained its hawkish outlook. Investors feared the December rate increase and the Fed’s plans for two more rate hikes in 2019 were too aggressive, and risk-off investing remained in favor.
January brought a renewed sense of stability to the markets. Investors’ concerns about growth and trade eased, and the Fed changed course, pausing its rate-hike campaign amid moderating global growth and inflation. Valuations appeared attractive after the late-2018 sell-off, and risk-on investing resumed. In March, the Fed held rates steady again, hinting additional tightening was off the table for 2019. This news drove stock and bond returns higher and left both asset classes on an upward track to end the period. Overall, stocks (S&P 500 Index) overcame their late-2018 nosedive to gain 9.50% for the period. Bonds (Bloomberg Barclays U.S. Aggregate Bond Index) bounced back from losses early in the period to return 4.48%.
We expect volatility to remain a formidable factor as investors react to global growth trends, central bank policy and geopolitical developments. We believe this scenario underscores the importance of using professionally managed portfolios in pursuit of investment goals. We appreciate your continued trust and confidence in us.
Sincerely,
Jonathan Thomas
President and Chief Executive Officer
American Century Investments
|
| | | | | | |
| Total Returns as of March 31, 2019 |
| | | | Average Annual Returns | |
| | Ticker Symbol | 1 year | 5 years | 10 years | Since Inception | Inception Date |
| Investor Class | TWEIX | 9.07% | 9.35% | 12.08% | — | 8/1/94 |
| Russell 3000 Value Index | — | 5.30% | 7.56% | 14.49% | — | — |
| S&P 500 Index | — | 9.50% | 10.90% | 15.91% | — | — |
| I Class | ACIIX | 9.27% | 9.56% | 12.31% | — | 7/8/98 |
| Y Class | AEIYX | 9.43% | — | — | 7.72% | 4/10/17 |
| A Class | TWEAX | | | | | 3/7/97 |
| No sales charge | | 8.80% | 9.08% | 11.80% | — | |
| With sales charge | | 2.60% | 7.79% | 11.14% | — | |
| C Class | AEYIX | 8.00% | 8.27% | 10.97% | — | 7/13/01 |
| R Class | AEURX | 8.57% | 8.81% | 11.53% | — | 8/29/03 |
| R5 Class | AEIUX | 9.41% | — | — | 7.58% | 4/10/17 |
| R6 Class | AEUDX | 9.43% | 9.74% | — | 9.90% | 7/26/13 |
Average annual returns since inception are presented when ten years of performance history is not available.
Sales charges include initial sales charges and contingent deferred sales charges (CDSCs), as applicable. A Class shares have a 5.75% maximum initial sales charge and may be subject to a maximum CDSC of 1.00%. C Class shares redeemed within 12 months of purchase are subject to a maximum CDSC of 1.00%. The SEC requires that mutual funds provide performance information net of maximum sales charges in all cases where charges could be applied.
Data presented reflect past performance. Past performance is no guarantee of future results. Current performance may be higher or lower than the performance shown. Total returns for periods less than one year are not annualized. Investment return and principal value will fluctuate, and redemption value may be more or less than original cost. Data assumes reinvestment of dividends and capital gains, and none of the charts reflect the deduction of taxes that a shareholder would pay on fund distributions or the redemption of fund shares. To obtain performance data current to the most recent month end, please call 1-800-345-2021 or visit americancentury.com. For additional information about the fund, please consult the prospectus.
|
|
| Growth of $10,000 Over 10 Years |
| $10,000 investment made March 31, 2009 |
Performance for other share classes will vary due to differences in fee structure.
|
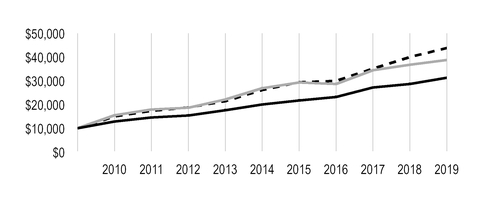
|
| |
| Value on March 31, 2019 |
| | Investor Class — $31,298 |
| |
| | Russell 3000 Value Index — $38,720 |
| |
| | S&P 500 Index — $43,809 |
| |
|
| | | | | | | |
| Total Annual Fund Operating Expenses | | | |
| Investor Class | I Class | Y Class | A Class | C Class | R Class | R5 Class | R6 Class |
| 0.92% | 0.72% | 0.57% | 1.17% | 1.92% | 1.42% | 0.72% | 0.57% |
The total annual fund operating expenses shown is as stated in the fund’s prospectus current as of the date of this report. The prospectus may vary from the expense ratio shown elsewhere in this report because it is based on a different time period, includes acquired fund fees and expenses, and, if applicable, does not include fee waivers or expense reimbursements.
Data presented reflect past performance. Past performance is no guarantee of future results. Current performance may be higher or lower than the performance shown. Total returns for periods less than one year are not annualized. Investment return and principal value will fluctuate, and redemption value may be more or less than original cost. Data assumes reinvestment of dividends and capital gains, and none of the charts reflect the deduction of taxes that a shareholder would pay on fund distributions or the redemption of fund shares. To obtain performance data current to the most recent month end, please call 1-800-345-2021 or visit americancentury.com. For additional information about the fund, please consult the prospectus.
Portfolio Managers: Phil Davidson, Kevin Toney, Michael Liss and Dan Gruemmer
Effective April 2019, portfolio manager Dan Gruemmer will leave the fund's management team, and Brian Woglom will join the fund as portfolio manager.
Performance Summary
Equity Income returned 9.07%* for the fiscal year ended March 31, 2019, outperforming the Russell 3000 Value Index, which returned 5.30%. The consumer staples sector drove outperformance relative to the benchmark due to security selection and an overweight allocation. Security selection in financials, industrials and consumer discretionary also benefited performance. Security selection and an underweight in real estate were major detractors. An underweight in health care and stock selection in the sector also hampered performance.
Consumer Staples Led Outperformance
Stock selection in the food products industry helped drive performance in the consumer staples sector. Nestle was a top contributor. The high-quality consumer staples company with leading market shares outperformed after reporting solid earnings. Investors were drawn to Nestle’s strong balance sheet and stable operations. The Procter & Gamble Co. was another top contributor in the sector. The large consumer packaged goods company posted its highest organic growth rate in nearly five years, benefiting from recent investments in product enhancements and product pricing. Importantly, P&G is stabilizing and improving market share in many key products.
Security selection in the financials and industrials sectors also was helpful. In industrials, waste disposal company Republic Services reported earnings that exceeded expectations. Additionally, the company expects better pricing on future contracts and continues to mitigate recycling headwinds stemming from China’s decision to suspend certain import licenses in 2017.
Other significant contributors included Automatic Data Processing. The stock of this human resources management company outperformed after it reported better-than-expected results across all metrics. Investors were particularly focused on the company’s operating margins, which exceeded expectations. Automatic Data Processing also raised its fiscal year guidance. ONE Gas was a key contributor as the gas utility stock outperformed after the company reported better-than-expected earnings. Enterprise Products Partners outperformed. We believe the pipeline master limited partnership (MLP) is one of the best positioned in the industry. Shares rallied after the company reported positive earnings. Following a pullback at the end of 2018, MLP valuations generally enjoyed a strong recovery in January alongside improving oil prices.
Real Estate Led Detractors
Real estate remains a modest underweight due to the lack of attractive investment opportunities. Both our underweight and stock selection weighed on performance. Weyerhaeuser was a key detractor in the sector. The company is one of the world’s largest owners of timberlands, and its stock underperformed due to declines in timber pricing, driven in part by a lower construction outlook and worries regarding export trade.
Health care detracted, largely due to stock selection in the health care equipment and supplies industry. Not owning Abbott Laboratories, a component of the fund’s benchmark, detracted.
* All fund returns referenced in this commentary are for Investor Class shares. Performance for other share classes will vary due to differences in fee structure; when Investor Class performance exceeds that of the fund's benchmark, other share classes may not. See page 3 for returns for all share classes.
Abbott’s stock rose throughout the year, and the company raised its dividend and guided to good results for 2019.
Elsewhere, Schlumberger was a significant detractor. The recovery in the oil field services markets has perpetually disappointed investor expectations. In particular, the non-U.S. oil field services markets (a historic stronghold for Schlumberger) have failed to stage a meaningful recovery. As a result, industry participants have been bidding contracts aggressively in an attempt to maintain operations, which has weighed on the revenue growth and profitability of Schlumberger and its peers. We still think Schlumberger is the best oil field services company, and we maintain an overweight position. The PNC Financial Services Group detracted from portfolio performance. PNC faced industry-wide headwinds in the form of slower loan growth, concerns about higher pricing on deposits and weaker-than-expected net interest margins.
A convertible preferred stock in Stanley Black & Decker, a hardware and tool maker, detracted even though the company beat earnings and revenue estimates. Commodity inflation caused margins to compress, and growth slowed. The convertible preferred stock position offers modestly lower volatility and a higher yield than the underlying common stock. Maxim Integrated Products underperformed as the semiconductor group pulled back amid concerns over storage pricing and slowing demand as 2019 capital spending appears weaker than expected.
Portfolio Positioning
The portfolio seeks to invest in companies where we believe the valuation does not reflect the quality and normal earnings power of the company. This is intended to result in a higher yielding, less volatile portfolio versus the benchmark. Our process is based on individual security selection, but broad themes have emerged.
The portfolio was modestly overweight in the financials sector at the end of the fiscal year. Using our bottom-up investment approach, we have identified securities that we believe offer attractive risk/reward profiles. Our analysis has led us to attractive companies within the fragmented industrials sector. The portfolio was overweight industrials, but we have avoided names in the sector that we believe are lower quality. When oil prices fell in the fourth quarter of 2018, we added to some of our energy holdings as their valuations became more attractive.
As bottom-up investors, we generally find securities in the communication services sector to have relatively volatile business models and more leveraged balance sheets. As a result, the sector represented our largest underweight at the end of the period. The consumer discretionary sector is a consistent underweight in the portfolio. We generally seek attractively valued, higher-quality companies with sustainable business models, and stocks in the consumer discretionary sector fit that profile less frequently. We have maintained an underweight in real estate because our metrics show that valuations in the sector generally remain inflated.
|
| |
| MARCH 31, 2019 |
| Top Ten Holdings | % of net assets |
| Medtronic plc | 4.5% |
| Johnson & Johnson | 3.7% |
| iShares Russell 1000 Value ETF | 3.1% |
| PNC Financial Services Group, Inc. (The) | 2.6% |
| TOTAL SA | 2.4% |
| Procter & Gamble Co. (The) | 2.3% |
| Verizon Communications, Inc. | 2.3% |
| Chevron Corp. | 2.3% |
| Bank of America Corp. (Convertible) | 2.0% |
| Nestle SA | 2.0% |
| | |
| Top Five Industries | % of net assets |
| Banks | 13.4% |
| Oil, Gas and Consumable Fuels | 8.4% |
| Pharmaceuticals | 7.5% |
| Gas Utilities | 4.8% |
| Health Care Equipment and Supplies | 4.5% |
| | |
| Types of Investments in Portfolio | % of net assets |
| Domestic Common Stocks | 67.6% |
| Foreign Common Stocks* | 8.6% |
| Convertible Bonds | 5.8% |
| Preferred Stocks | 5.8% |
| Convertible Preferred Stocks | 4.9% |
| Exchange-Traded Funds | 3.1% |
| Total Equity Exposure | 95.8% |
| Temporary Cash Investments | 3.1% |
| Other Assets and Liabilities | 1.1% |
*Includes depositary shares, dual listed securities and foreign ordinary shares.
Fund shareholders may incur two types of costs: (1) transaction costs, including sales charges (loads) on purchase payments and redemption/exchange fees; and (2) ongoing costs, including management fees; distribution and service (12b-1) fees; and other fund expenses. This example is intended to help you understand your ongoing costs (in dollars) of investing in your fund and to compare these costs with the ongoing cost of investing in other mutual funds.
The example is based on an investment of $1,000 made at the beginning of the period and held for the entire period from October 1, 2018 to March 31, 2019.
Actual Expenses
The table provides information about actual account values and actual expenses for each class. You may use the information, together with the amount you invested, to estimate the expenses that you paid over the period. First, identify the share class you own. Then simply divide your account value by $1,000 (for example, an $8,600 account value divided by $1,000 = 8.6), then multiply the result by the number under the heading “Expenses Paid During Period” to estimate the expenses you paid on your account during this period.
If you hold Investor Class shares of any American Century Investments fund, or I Class shares of the American Century Diversified Bond Fund, in an American Century Investments account (i.e., not a financial intermediary or retirement plan account), American Century Investments may charge you a $12.50 semiannual account maintenance fee if the value of those shares is less than $10,000. We will redeem shares automatically in one of your accounts to pay the $12.50 fee. In determining your total eligible investment amount, we will include your investments in all personal accounts (including American Century Investments Brokerage accounts) registered under your Social Security number. Personal accounts include individual accounts, joint accounts, UGMA/UTMA accounts, personal trusts, Coverdell Education Savings Accounts and IRAs (including traditional, Roth, Rollover, SEP-, SARSEP- and SIMPLE-IRAs), and certain other retirement accounts. If you have only business, business retirement, employer-sponsored or American Century Investments Brokerage accounts, you are currently not subject to this fee. If you are subject to the Account Maintenance Fee, your account value could be reduced by the fee amount.
Hypothetical Example for Comparison Purposes
The table also provides information about hypothetical account values and hypothetical expenses based on the actual expense ratio of each class of your fund and an assumed rate of return of 5% per year before expenses, which is not the actual return of a fund’s share class. The hypothetical account values and expenses may not be used to estimate the actual ending account balance or expenses you paid for the period. You may use this information to compare the ongoing costs of investing in your fund and other funds. To do so, compare this 5% hypothetical example with the 5% hypothetical examples that appear in the shareholder reports of the other funds.
Please note that the expenses shown in the table are meant to highlight your ongoing costs only and do not reflect any transactional costs, such as sales charges (loads) or redemption/exchange fees. Therefore, the table is useful in comparing ongoing costs only, and will not help you determine the relative total costs of owning different funds. In addition, if these transactional costs were included, your costs would have been higher.
|
| | | | |
| | Beginning
Account Value
10/1/18 | Ending
Account Value
3/31/19 | Expenses Paid
During Period(1)
10/1/18 - 3/31/19 |
Annualized
Expense Ratio(1) |
| Actual | | | | |
| Investor Class | $1,000 | $1,022.40 | $4.64 | 0.92% |
| I Class | $1,000 | $1,023.40 | $3.63 | 0.72% |
| Y Class | $1,000 | $1,024.10 | $2.88 | 0.57% |
| A Class | $1,000 | $1,021.10 | $5.90 | 1.17% |
| C Class | $1,000 | $1,017.40 | $9.66 | 1.92% |
| R Class | $1,000 | $1,021.10 | $7.16 | 1.42% |
| R5 Class | $1,000 | $1,024.60 | $3.63 | 0.72% |
| R6 Class | $1,000 | $1,025.20 | $2.88 | 0.57% |
| Hypothetical | | | | |
| Investor Class | $1,000 | $1,020.34 | $4.63 | 0.92% |
| I Class | $1,000 | $1,021.34 | $3.63 | 0.72% |
| Y Class | $1,000 | $1,022.09 | $2.87 | 0.57% |
| A Class | $1,000 | $1,019.10 | $5.89 | 1.17% |
| C Class | $1,000 | $1,015.36 | $9.65 | 1.92% |
| R Class | $1,000 | $1,017.85 | $7.14 | 1.42% |
| R5 Class | $1,000 | $1,021.34 | $3.63 | 0.72% |
| R6 Class | $1,000 | $1,022.09 | $2.87 | 0.57% |
| |
| (1) | Expenses are equal to the class's annualized expense ratio listed in the table above, multiplied by the average account value over the period, multiplied by 182, the number of days in the most recent fiscal half-year, divided by 365, to reflect the one-half year period. Annualized expense ratio reflects actual expenses, including any applicable fee waivers or expense reimbursements and excluding any acquired fund fees and expenses. |
MARCH 31, 2019
|
| | | | | | |
| | Shares/
Principal Amount | Value |
| COMMON STOCKS — 76.2% | | |
| Aerospace and Defense — 1.2% | | |
| BAE Systems plc | 2,190,000 |
| $ | 13,759,807 |
|
| Raytheon Co. | 686,300 |
| 124,961,504 |
|
| | | 138,721,311 |
|
| Air Freight and Logistics — 0.7% | | |
| United Parcel Service, Inc., Class B | 668,818 |
| 74,733,723 |
|
| Automobiles — 0.3% | | |
| Honda Motor Co. Ltd. | 846,100 |
| 22,864,473 |
|
| Toyota Motor Corp. | 149,800 |
| 8,767,956 |
|
| | | 31,632,429 |
|
| Banks — 6.3% | | |
| Comerica, Inc. | 999,400 |
| 73,276,008 |
|
| Commerce Bancshares, Inc. | 539,633 |
| 31,331,092 |
|
| JPMorgan Chase & Co. | 1,999,597 |
| 202,419,204 |
|
| PNC Financial Services Group, Inc. (The) | 2,398,518 |
| 294,202,218 |
|
| SunTrust Banks, Inc. | 1,199,110 |
| 71,047,268 |
|
| U.S. Bancorp | 574,238 |
| 27,672,529 |
|
| Wells Fargo & Co. | 482,700 |
| 23,324,064 |
|
| | | 723,272,383 |
|
| Capital Markets — 2.8% | | |
| AllianceBernstein Holding LP | 595,378 |
| 17,200,470 |
|
| Bank of New York Mellon Corp. (The) | 3,395,100 |
| 171,214,893 |
|
| BlackRock, Inc. | 109,900 |
| 46,967,963 |
|
| Janus Henderson Group plc | 998,321 |
| 24,938,059 |
|
| Northern Trust Corp. | 698,840 |
| 63,182,124 |
|
| | | 323,503,509 |
|
| Chemicals — 1.0% | | |
| Akzo Nobel NV | 299,400 |
| 26,528,952 |
|
Dow, Inc.(1)(2) | 87,255 |
| 4,504,993 |
|
| DowDuPont, Inc. | 2,299,266 |
| 82,934,525 |
|
| | | 113,968,470 |
|
| Commercial Services and Supplies — 2.2% | | |
| Republic Services, Inc. | 2,492,261 |
| 200,327,939 |
|
| Waste Management, Inc. | 436,669 |
| 45,374,276 |
|
| | | 245,702,215 |
|
| Communications Equipment — 1.7% | | |
| Cisco Systems, Inc. | 3,498,391 |
| 188,878,130 |
|
| Containers and Packaging — 0.2% | | |
| Bemis Co., Inc. | 405,802 |
| 22,513,895 |
|
| Distributors — 0.4% | | |
| Genuine Parts Co. | 357,441 |
| 40,044,115 |
|
|
| | | | | | |
| | Shares/
Principal Amount | Value |
| Diversified Telecommunication Services — 2.3% | | |
| Verizon Communications, Inc. | 4,498,237 |
| $ | 265,980,754 |
|
| Electric Utilities — 2.4% | | |
| Eversource Energy | 2,398,400 |
| 170,166,480 |
|
| Pinnacle West Capital Corp. | 1,099,817 |
| 105,120,509 |
|
| | | 275,286,989 |
|
| Electrical Equipment — 1.4% | | |
| ABB Ltd. | 1,595,900 |
| 29,986,733 |
|
| Hubbell, Inc. | 1,098,600 |
| 129,612,828 |
|
| | | 159,599,561 |
|
| Electronic Equipment, Instruments and Components — 0.3% | | |
| TE Connectivity Ltd. | 384,000 |
| 31,008,000 |
|
| Energy Equipment and Services — 1.5% | | |
| Baker Hughes a GE Co. | 996,837 |
| 27,632,321 |
|
| Schlumberger Ltd. | 3,299,931 |
| 143,777,994 |
|
| | | 171,410,315 |
|
| Equity Real Estate Investment Trusts (REITs) — 3.2% | | |
| Boston Properties, Inc. | 189,700 |
| 25,397,036 |
|
| Public Storage | 399,650 |
| 87,035,777 |
|
| Welltower, Inc. | 1,596,896 |
| 123,919,130 |
|
| Weyerhaeuser Co. | 5,092,684 |
| 134,141,296 |
|
| | | 370,493,239 |
|
| Food and Staples Retailing — 0.6% | | |
| Walmart, Inc. | 736,383 |
| 71,819,434 |
|
| Food Products — 3.5% | | |
| Hershey Co. (The) | 569,200 |
| 65,361,236 |
|
| Mondelez International, Inc., Class A | 2,199,000 |
| 109,774,080 |
|
| Nestle SA | 2,388,400 |
| 227,626,573 |
|
| | | 402,761,889 |
|
| Gas Utilities — 4.8% | | |
| Atmos Energy Corp. | 1,999,146 |
| 205,772,098 |
|
| ONE Gas, Inc. | 2,298,296 |
| 204,617,293 |
|
| Spire, Inc. | 1,699,258 |
| 139,831,941 |
|
| | | 550,221,332 |
|
| Health Care Equipment and Supplies — 4.5% | | |
| Medtronic plc | 5,597,979 |
| 509,863,927 |
|
| Health Care Providers and Services — 1.2% | | |
| Quest Diagnostics, Inc. | 1,498,158 |
| 134,714,367 |
|
| Hotels, Restaurants and Leisure — 1.0% | | |
| Carnival Corp. | 996,603 |
| 50,547,704 |
|
| Sodexo SA | 598,700 |
| 65,923,461 |
|
| | | 116,471,165 |
|
| Household Products — 3.5% | | |
| Kimberly-Clark Corp. | 1,098,404 |
| 136,092,256 |
|
| Procter & Gamble Co. (The) | 2,576,359 |
| 268,070,154 |
|
| | | 404,162,410 |
|
|
| | | | | | |
| | Shares/
Principal Amount | Value |
| Industrial Conglomerates — 0.7% | | |
| 3M Co. | 290,628 |
| $ | 60,386,686 |
|
| Smiths Group plc | 1,297,500 |
| 24,250,473 |
|
| | | 84,637,159 |
|
| Insurance — 4.3% | | |
| Aflac, Inc. | 3,695,900 |
| 184,795,000 |
|
| Chubb Ltd. | 1,491,528 |
| 208,933,242 |
|
| Marsh & McLennan Cos., Inc. | 1,068,605 |
| 100,342,010 |
|
| | | 494,070,252 |
|
| IT Services — 2.9% | | |
| Automatic Data Processing, Inc. | 1,399,751 |
| 223,596,225 |
|
| Paychex, Inc. | 1,299,700 |
| 104,235,940 |
|
| | | 327,832,165 |
|
| Machinery — 1.5% | | |
| Atlas Copco AB, B Shares | 2,297,800 |
| 56,868,530 |
|
| Deere & Co. | 697,823 |
| 111,540,028 |
|
| | | 168,408,558 |
|
| Oil, Gas and Consumable Fuels — 7.5% | | |
| Anadarko Petroleum Corp. | 397,900 |
| 18,096,492 |
|
| Chevron Corp. | 2,098,916 |
| 258,544,473 |
|
| Enterprise Products Partners LP | 7,196,400 |
| 209,415,240 |
|
| EQM Midstream Partners LP | 360,871 |
| 16,661,414 |
|
| Royal Dutch Shell plc, B Shares | 998,700 |
| 31,582,367 |
|
| Shell Midstream Partners LP | 2,398,136 |
| 49,041,881 |
|
| TOTAL SA | 4,980,358 |
| 276,654,277 |
|
| | | 859,996,144 |
|
| Personal Products — 0.4% | | |
| Unilever NV CVA | 797,200 |
| 46,304,748 |
|
| Pharmaceuticals — 7.5% | | |
| Johnson & Johnson | 2,992,887 |
| 418,375,673 |
|
| Merck & Co., Inc. | 1,595,222 |
| 132,674,614 |
|
| Novartis AG | 1,594,900 |
| 153,411,521 |
|
| Pfizer, Inc. | 3,497,400 |
| 148,534,578 |
|
| | | 852,996,386 |
|
| Road and Rail — 0.8% | | |
| Norfolk Southern Corp. | 467,692 |
| 87,406,958 |
|
| Semiconductors and Semiconductor Equipment — 1.7% | | |
| Applied Materials, Inc. | 1,199,761 |
| 47,582,521 |
|
| Intel Corp. | 229,600 |
| 12,329,520 |
|
| Maxim Integrated Products, Inc. | 2,597,800 |
| 138,125,026 |
|
| | | 198,037,067 |
|
| Software — 0.8% | | |
| Microsoft Corp. | 765,336 |
| 90,263,728 |
|
| Thrifts and Mortgage Finance — 1.1% | | |
Capitol Federal Financial, Inc.(3) | 9,199,479 |
| 122,813,045 |
|
TOTAL COMMON STOCKS
(Cost $6,983,315,751) | | 8,699,529,772 |
|
|
| | | | | | |
| | Shares/
Principal Amount | Value |
| PREFERRED STOCKS — 5.8% | | |
| Banks — 4.3% | | |
| Bank of America Corp., 5.875% | 116,802,000 |
| $ | 118,685,432 |
|
| Citigroup, Inc., 5.95% | 88,872,000 |
| 90,479,250 |
|
| U.S. Bancorp, 5.30% | 139,717,000 |
| 142,292,683 |
|
| Wells Fargo & Co., 6.38% | 139,958,000 |
| 141,007,685 |
|
| | | 492,465,050 |
|
| Capital Markets — 0.6% | | |
| Goldman Sachs Group, Inc. (The), 5.30% | 66,678,000 |
| 67,209,757 |
|
| Oil, Gas and Consumable Fuels — 0.9% | | |
| Plains All American Pipeline LP, 6.125% | 109,800,000 |
| 103,099,455 |
|
TOTAL PREFERRED STOCKS
(Cost $665,559,065) | | 662,774,262 |
|
| CONVERTIBLE BONDS — 5.8% | | |
| Airlines — 0.2% | | |
Citigroup Global Markets Holdings, Inc., (convertible into Southwest Airlines Co.), 6.35%, 9/17/19(4)(5) | $ | 399,000 |
| 20,411,351 |
|
| Biotechnology — 0.2% | | |
Credit Suisse AG, (convertible into Celgene Corp.), 9.10%, 9/19/19(4)(5) | 199,900 |
| 18,083,936 |
|
| Construction Materials — 1.5% | | |
Credit Suisse AG, (convertible into Martin Marietta Materials, Inc.), 3.60%, 4/4/19(4)(5) | 88,400 |
| 17,381,753 |
|
Credit Suisse AG, (convertible into Martin Marietta Materials, Inc.), 5.50%, 5/14/19(4)(5) | 99,000 |
| 19,146,481 |
|
Merrill Lynch International & Co. C.V., (convertible into Martin Marietta Materials, Inc.), 9.80%, 6/19/19(4)(5) | 111,800 |
| 20,391,577 |
|
Morgan Stanley B.V., (convertible into Martin Marietta Materials, Inc.), 4.54%, 5/10/19(4)(5) | 86,500 |
| 17,384,688 |
|
Royal Bank of Canada, (convertible into Martin Marietta Materials, Inc.), 7.45%, 7/26/19(4)(5) | 49,900 |
| 9,148,065 |
|
Royal Bank of Canada, (convertible into Martin Marietta Materials, Inc.), 5.60%, 8/12/19(4)(5) | 95,000 |
| 17,842,174 |
|
Royal Bank of Canada, (convertible into Martin Marietta Materials, Inc.), 5.12%, 5/9/19(4)(5) | 99,499 |
| 19,319,446 |
|
Royal Bank of Canada, (convertible into Martin Marietta Materials, Inc.), 6.65%, 8/2/19(4)(5) | 64,800 |
| 12,083,897 |
|
Wells Fargo Bank N.A., (convertible into Martin Marietta Materials, Inc.), 5.10%, 8/1/19(4)(5) | 199,900 |
| 37,352,211 |
|
| | | 170,050,292 |
|
| Diversified Financial Services — 1.2% | | |
Citigroup Global Markets Holdings, Inc., (convertible into Berkshire Hathaway, Inc., Class B), 1.63%, 8/13/19(4)(5) | 109,900 |
| 22,081,368 |
|
Goldman Sachs International, (convertible into Berkshire Hathaway, Inc., Class B), 2.75%, 7/10/19(4)(5) | 344,600 |
| 69,422,595 |
|
UBS AG, (convertible into Berkshire Hathaway, Inc., Class B), 5.50%, 7/1/19(4)(5) | 230,000 |
| 45,642,860 |
|
| | | 137,146,823 |
|
| Energy Equipment and Services — 0.4% | | |
Wells Fargo Bank N.A., (convertible into Schlumberger Ltd.), 8.93%, 7/22/19(4)(5) | 949,000 |
| 40,727,885 |
|
|
| | | | | | |
| | Shares/
Principal Amount | Value |
| Household Durables — 0.1% | | |
Morgan Stanley B.V., (convertible into Whirlpool Corp.), 7.91%, 4/11/19(4)(5) | $ | 129,900 |
| $ | 15,359,025 |
|
| Insurance — 0.1% | | |
AXA SA, 7.25%, 5/15/21(5) | 8,981,000 |
| 9,026,937 |
|
| Multiline Retail — 0.2% | | |
Merrill Lynch International & Co. C.V., (convertible into Target Corp.), 8.50%, 5/31/19(4)(5) | 398,800 |
| 28,694,915 |
|
| Semiconductors and Semiconductor Equipment — 1.7% | | |
| Microchip Technology, Inc., 1.625%, 2/15/27 | 45,920,000 |
| 50,525,776 |
|
| Teradyne, Inc., 1.25%, 12/15/23 | 103,950,000 |
| 145,509,970 |
|
| | | 196,035,746 |
|
| Specialty Retail — 0.2% | | |
Royal Bank of Canada, (convertible into Lowe’s Cos., Inc.), 8.12%, 6/17/19(4)(5) | 211,800 |
| 20,688,888 |
|
TOTAL CONVERTIBLE BONDS
(Cost $629,454,522) | | 656,225,798 |
|
| CONVERTIBLE PREFERRED STOCKS — 4.9% | | |
| Banks — 2.8% | | |
| Bank of America Corp., 7.25% | 177,164 |
| 230,644,497 |
|
| Wells Fargo & Co., 7.50% | 67,957 |
| 87,824,229 |
|
| | | 318,468,726 |
|
| Chemicals — 0.8% | | |
| International Flavors & Fragrances, Inc., 6.00%, 9/15/21 | 1,899,912 |
| 94,881,605 |
|
| Machinery — 1.3% | | |
| Stanley Black & Decker, Inc., 5.375%, 5/15/20 | 1,535,569 |
| 149,717,977 |
|
TOTAL CONVERTIBLE PREFERRED STOCKS
(Cost $535,864,886) | | 563,068,308 |
|
| EXCHANGE-TRADED FUNDS — 3.1% | | |
iShares Russell 1000 Value ETF
(Cost $324,129,040) | 2,856,530 |
| 352,752,890 |
|
| TEMPORARY CASH INVESTMENTS — 3.1% | | |
Federal Home Loan Bank Discount Notes, 2.30%, 4/1/19(6) | $ | 255,104,000 |
| 255,104,000 |
|
| Repurchase Agreement, BMO Capital Markets Corp., (collateralized by various U.S. Treasury obligations, 0.125% - 2.875%, 9/30/19 - 2/15/44, valued at $82,125,550), in a joint trading account at 2.35%, dated 3/29/19, due 4/1/19 (Delivery value $80,500,727) | | 80,484,965 |
|
| Repurchase Agreement, Fixed Income Clearing Corp., (collateralized by various U.S. Treasury obligations, 2.50%, 8/15/23, valued at $13,722,077), at 1.25%, dated 3/29/19, due 4/1/19 (Delivery value $13,454,401) | | 13,453,000 |
|
TOTAL TEMPORARY CASH INVESTMENTS
(Cost $349,041,965) | | 349,041,965 |
|
TOTAL INVESTMENT SECURITIES — 98.9%
(Cost $9,487,365,229) | | 11,283,392,995 |
|
| OTHER ASSETS AND LIABILITIES — 1.1% | | 129,641,305 |
|
| TOTAL NET ASSETS — 100.0% | | $ | 11,413,034,300 |
|
|
| | | | | | | | | | | | | | | | |
| WRITTEN OPTIONS CONTRACTS |
| Reference Entity | Contracts | Type | Exercise
Price | Expiration
Date | Underlying
Notional
Amount | Premiums
Received | Value |
| Carnival Corp. | 2,500 |
| Put | $ | 50.00 |
| 4/18/19 | $ | 12,680,000 |
| $ | (168,786 | ) | $ | (143,750 | ) |
| Comerica, Inc. | 1,852 |
| Put | $ | 70.00 |
| 4/18/19 | $ | 13,578,864 |
| (241,053 | ) | (132,418 | ) |
| Comerica, Inc. | 2,000 |
| Put | $ | 75.00 |
| 4/18/19 | $ | 14,664,000 |
| (650,955 | ) | (547,000 | ) |
| Cracker Barrel Old Country Store, Inc. | 15 |
| Put | $ | 140.00 |
| 4/18/19 | $ | 242,415 |
| (656 | ) | (188 | ) |
| Deere & Co. | 1,750 |
| Put | $ | 135.00 |
| 4/18/19 | $ | 27,972,000 |
| (124,656 | ) | (21,875 | ) |
| Johnson Controls International plc | 1,000 |
| Put | $ | 30.00 |
| 4/18/19 | $ | 3,694,000 |
| (24,311 | ) | (1,500 | ) |
| Medtronic plc | 3,016 |
| Put | $ | 89.00 |
| 4/18/19 | $ | 27,469,728 |
| (256,691 | ) | (182,468 | ) |
| PNC Financial Services Group, Inc. (The) | 404 |
| Put | $ | 113.00 |
| 4/18/19 | $ | 4,955,464 |
| (48,601 | ) | (20,604 | ) |
| Quest Diagnostics, Inc. | 1,000 |
| Put | $ | 80.00 |
| 4/18/19 | $ | 8,992,000 |
| (133,650 | ) | (12,500 | ) |
| United Parcel Service, Inc. | 681 |
| Put | $ | 99.00 |
| 4/18/19 | $ | 7,609,494 |
| (25,865 | ) | (4,086 | ) |
| | | | | | | $ | (1,675,224 | ) | $ | (1,066,389 | ) |
|
| | | | | | | | | | |
| FORWARD FOREIGN CURRENCY EXCHANGE CONTRACTS |
| Currency Purchased | Currency Sold | Counterparty | Settlement Date | Unrealized Appreciation (Depreciation) |
| USD | 315,944,443 |
| CHF | 310,841,940 |
| UBS AG | 6/28/19 | $ | 1,201,756 |
|
| USD | 8,959,170 |
| CHF | 8,847,897 |
| UBS AG | 6/28/19 | 241 |
|
| USD | 342,412,976 |
| EUR | 300,120,057 |
| Credit Suisse AG | 6/28/19 | 3,273,333 |
|
| USD | 54,817,839 |
| GBP | 41,354,819 |
| JPMorgan Chase Bank N.A. | 6/28/19 | 721,771 |
|
| JPY | 105,829,717 |
| USD | 964,893 |
| Bank of America N.A. | 6/28/19 | (3,499 | ) |
| USD | 28,161,247 |
| JPY | 3,078,066,580 |
| Bank of America N.A. | 6/28/19 | 199,026 |
|
| USD | 780,659 |
| JPY | 85,624,112 |
| Bank of America N.A. | 6/28/19 | 2,819 |
|
| USD | 45,495,929 |
| SEK | 417,188,568 |
| Goldman Sachs & Co. | 6/28/19 | 330,419 |
|
| | | | | | | $ | 5,725,866 |
|
|
| | |
| NOTES TO SCHEDULE OF INVESTMENTS |
| CHF | - | Swiss Franc |
| CVA | - | Certificaten Van Aandelen |
| EUR | - | Euro |
| GBP | - | British Pound |
| JPY | - | Japanese Yen |
| SEK | - | Swedish Krona |
| USD | - | United States Dollar |
| |
| (2) | When-issued security. The issue price and yield are fixed on the date of the commitment, but payment and delivery are scheduled for a future date. |
| |
| (3) | Affiliated Company: the fund’s holding represents ownership of 5% or more of the voting securities of the company; therefore, the company is affiliated as defined in the Investment Company Act of 1940. |
| |
| (4) | Equity-linked debt security. The aggregated value of these securities at the period end was $451,163,115, which represented 4.0% of total net assets. |
| |
| (5) | Security was purchased pursuant to Rule 144A under the Securities Act of 1933 and may be sold in transactions exempt from registration, normally to qualified institutional investors. The aggregate value of these securities at the period end was $460,190,052, which represented 4.0% of total net assets. |
| |
| (6) | The rate indicated is the yield to maturity at purchase. |
See Notes to Financial Statements.
|
|
| Statement of Assets and Liabilities |
|
| | | |
| MARCH 31, 2019 | |
| Assets | |
| Investment securities - unaffiliated, at value (cost of $9,381,418,194) | $ | 11,160,579,950 |
|
| Investment securities - affiliated, at value (cost of $105,947,035) | 122,813,045 |
|
| Total investment securities, at value (cost of $9,487,365,229) | 11,283,392,995 |
|
| Cash | 225,441 |
|
| Deposits with broker for options contracts | 33,241,830 |
|
| Receivable for investments sold | 121,510,560 |
|
| Receivable for capital shares sold | 9,828,749 |
|
| Unrealized appreciation on forward foreign currency exchange contracts | 5,729,365 |
|
| Dividends and interest receivable | 36,485,636 |
|
| | 11,490,414,576 |
|
| | |
| Liabilities | |
| Written options, at value (premiums received $1,675,224) | 1,066,389 |
|
| Payable for investments purchased | 56,581,182 |
|
| Payable for capital shares redeemed | 11,055,863 |
|
| Unrealized depreciation on forward foreign currency exchange contracts | 3,499 |
|
| Accrued management fees | 7,999,831 |
|
| Distribution and service fees payable | 673,512 |
|
| | 77,380,276 |
|
| | |
| Net Assets | $ | 11,413,034,300 |
|
| | |
| Net Assets Consist of: | |
| Capital (par value and paid-in surplus) | $ | 9,621,478,805 |
|
| Distributable earnings | 1,791,555,495 |
|
| | $ | 11,413,034,300 |
|
|
| | | | | | |
| | Net Assets | Shares Outstanding | Net Asset Value Per Share |
| Investor Class, $0.01 Par Value |
| $6,081,354,822 |
| 699,434,996 |
| $8.69 |
| I Class, $0.01 Par Value |
| $2,826,256,189 |
| 324,720,392 |
| $8.70 |
| Y Class, $0.01 Par Value |
| $230,772,949 |
| 26,485,930 |
| $8.71 |
| A Class, $0.01 Par Value |
| $850,116,627 |
| 97,792,148 |
| $8.69* |
| C Class, $0.01 Par Value |
| $538,725,870 |
| 61,985,131 |
| $8.69 |
| R Class, $0.01 Par Value |
| $88,499,139 |
| 10,219,619 |
| $8.66 |
| R5 Class, $0.01 Par Value |
| $891,854 |
| 102,544 |
| $8.70 |
| R6 Class, $0.01 Par Value |
| $796,416,850 |
| 91,417,089 |
| $8.71 |
*Maximum offering price $9.22 (net asset value divided by 0.9425).
See Notes to Financial Statements.
|
| | | |
| YEAR ENDED MARCH 31, 2019 |
| Investment Income (Loss) | |
| Income: | |
| Dividends (including $13,923,844 from affiliates and net of foreign taxes withheld of $3,755,783) | $ | 297,179,229 |
|
| Interest | 48,096,903 |
|
| | 345,276,132 |
|
| | |
| Expenses: | |
| Management fees | 94,798,428 |
|
| Distribution and service fees: | |
| A Class | 2,186,810 |
|
| C Class | 5,749,291 |
|
| R Class | 449,489 |
|
| Directors' fees and expenses | 313,803 |
|
| Other expenses | 30,381 |
|
| | 103,528,202 |
|
| | |
| Net investment income (loss) | 241,747,930 |
|
| | |
| Realized and Unrealized Gain (Loss) | |
| Net realized gain (loss) on: | |
| Investment transactions (including $27,451,804 from affiliates) | 384,215,158 |
|
| Forward foreign currency exchange contract transactions | 61,084,298 |
|
| Written options contract transactions | 4,867,472 |
|
| Foreign currency translation transactions | (188,647 | ) |
| | 449,978,281 |
|
| | |
| Change in net unrealized appreciation (depreciation) on: | |
| Investments (including $44,699,878 from affiliates) | 283,576,899 |
|
| Forward foreign currency exchange contracts | 5,879,117 |
|
| Written options contracts | 608,835 |
|
| Translation of assets and liabilities in foreign currencies | (93,772 | ) |
| | 289,971,079 |
|
| | |
| Net realized and unrealized gain (loss) | 739,949,360 |
|
| | |
| Net Increase (Decrease) in Net Assets Resulting from Operations | $ | 981,697,290 |
|
See Notes to Financial Statements.
|
|
| Statement of Changes in Net Assets |
|
| | | | | | |
| YEARS ENDED MARCH 31, 2019 AND MARCH 31, 2018 |
| Increase (Decrease) in Net Assets | March 31, 2019 | March 31, 2018 |
| Operations | | |
| Net investment income (loss) | $ | 241,747,930 |
| $ | 226,575,202 |
|
| Net realized gain (loss) | 449,978,281 |
| 886,224,657 |
|
| Change in net unrealized appreciation (depreciation) | 289,971,079 |
| (421,121,774 | ) |
| Net increase (decrease) in net assets resulting from operations | 981,697,290 |
| 691,678,085 |
|
| | | |
| Distributions to Shareholders | | |
From earnings:(1) | | |
| Investor Class | (446,677,737 | ) | (782,791,137 | ) |
| I Class | (208,964,964 | ) | (318,541,474 | ) |
| Y Class | (16,942,339 | ) | (25,404,372 | ) |
| A Class | (61,295,918 | ) | (110,731,127 | ) |
| C Class | (35,473,742 | ) | (69,035,895 | ) |
| R Class | (6,180,212 | ) | (11,263,849 | ) |
| R5 Class | (63,192 | ) | (3,854 | ) |
| R6 Class | (56,544,741 | ) | (66,334,026 | ) |
| Decrease in net assets from distributions | (832,142,845 | ) | (1,384,105,734 | ) |
| | | |
| Capital Share Transactions | | |
| Net increase (decrease) in net assets from capital share transactions (Note 5) | (415,119,291 | ) | 69,850,724 |
|
| | | |
| Net increase (decrease) in net assets | (265,564,846 | ) | (622,576,925 | ) |
| | | |
| Net Assets | | |
| Beginning of period | 11,678,599,146 |
| 12,301,176,071 |
|
| End of period | $ | 11,413,034,300 |
| $ | 11,678,599,146 |
|
| |
| (1) | Prior period presentation has been updated to reflect the current period combination of distributions to shareholders from net investment income and net realized gains. Distributions from net investment income were $(133,467,726), $(53,387,964), $(3,600,971), $(16,523,339), $(5,851,215), $(1,430,543), $(2,671) and $(12,767,970) for Investor Class, I Class, Y Class, A Class, C Class, R Class, R5 Class and R6 Class, respectively. Distributions from net realized gains were $(649,323,411), $(265,153,510), $(21,803,401), $(94,207,788), $(63,184,680), $(9,833,306), $(1,183) and $(53,566,056) for Investor Class, I Class, Y Class, A Class, C Class, R Class, R5 Class and R6 Class, respectively. |
See Notes to Financial Statements.
|
|
| Notes to Financial Statements |
MARCH 31, 2019
1. Organization
American Century Capital Portfolios, Inc. (the corporation) is registered under the Investment Company Act of 1940, as amended (the 1940 Act), as an open-end management investment company and is organized as a Maryland corporation. Equity Income Fund (the fund) is one fund in a series issued by the corporation. The fund’s investment objective is to seek current income. Capital appreciation is a secondary objective.
The fund offers the Investor Class, I Class, Y Class, A Class, C Class, R Class, R5 Class and R6 Class. The A Class may incur an initial sales charge. The A Class and C Class may be subject to a contingent deferred sales charge. Sale of the Y Class and R5 Class commenced on April 10, 2017.
2. Significant Accounting Policies
The following is a summary of significant accounting policies consistently followed by the fund in preparation of its financial statements. The fund is an investment company and follows accounting and reporting guidance in accordance with accounting principles generally accepted in the United States of America. This may require management to make certain estimates and assumptions at the date of the financial statements. Actual results could differ from these estimates. Management evaluated the impact of events or transactions occurring through the date the financial statements were issued that would merit recognition or disclosure.
Investment Valuations — The fund determines the fair value of its investments and computes its net asset value per share at the close of regular trading (usually 4 p.m. Eastern time) on the New York Stock Exchange (NYSE) on each day the NYSE is open. The Board of Directors has adopted valuation policies and procedures to guide the investment advisor in the fund’s investment valuation process and to provide methodologies for the oversight of the fund’s pricing function.
Equity securities that are listed or traded on a domestic securities exchange are valued at the last reported sales price or at the official closing price as provided by the exchange. Equity securities traded on foreign securities exchanges are generally valued at the closing price of such securities on the exchange where primarily traded or at the close of the NYSE, if that is earlier. If no last sales price is reported, or if local convention or regulation so provides, the mean of the latest bid and asked prices may be used. Securities traded over-the-counter are valued at the mean of the latest bid and asked prices, the last sales price, or the official closing price. Equity securities initially expressed in local currencies are translated into U.S. dollars at the mean of the appropriate currency exchange rate at the close of the NYSE as provided by an independent pricing service.
Fixed income securities are valued at the evaluated mean as provided by independent pricing services or at the mean of the most recent bid and asked prices as provided by investment dealers. Corporate bonds, U.S. Treasury and Government Agency securities and convertible bonds are valued using market models that consider trade data, quotations from dealers and active market makers, relevant yield curve and spread data, creditworthiness, trade data or market information on comparable securities, and other relevant security specific information.
Open-end management investment companies are valued at the reported net asset value per share. Repurchase agreements are valued at cost, which approximates fair value. Exchange-traded options contracts are valued at a mean as provided by independent pricing services. Forward foreign currency exchange contracts are valued at the mean of the appropriate forward exchange rate at the close of the NYSE as provided by an independent pricing service.
If the fund determines that the market price for an investment is not readily available or the valuation methods mentioned above do not reflect an investment’s fair value, such investment is valued as determined in good faith by the Board of Directors or its delegate, in accordance with policies and procedures adopted by the Board of Directors. In its determination of fair value, the fund may review several factors including, but not limited to, market information regarding the specific investment or comparable investments and correlation with other investment types, futures indices or general market indicators. Circumstances that may cause the fund to use these procedures to value an investment include, but are not limited to: an investment has been declared in default or is distressed; trading in a security has been suspended during the trading day or a security is not actively trading on its principal exchange; prices received from a regular pricing source are deemed unreliable; or there is a foreign market holiday and no trading occurred.
The fund monitors for significant events occurring after the close of an investment’s primary exchange but before the fund’s net asset value per share is determined. Significant events may include, but are not limited to: corporate announcements and transactions; governmental action and political unrest that could impact a specific investment or an investment sector; or armed conflicts, natural disasters and similar events that could affect investments in a specific country or region. The fund also monitors for significant fluctuations between domestic and foreign markets, as evidenced by the U.S. market or such other indicators that the Board of Directors, or its delegate, deems appropriate. If significant fluctuations in foreign markets are identified, the fund may apply a model-derived factor to the closing price of equity securities traded on foreign securities exchanges. The factor is based on observable market data as provided by an independent pricing service.
Security Transactions — Security transactions are accounted for as of the trade date. Net realized gains and losses are determined on the identified cost basis, which is also used for federal income tax purposes.
Investment Income — Dividend income less foreign taxes withheld, if any, is recorded as of the ex-dividend date. Distributions received on securities that represent a return of capital or long-term capital gain are recorded as a reduction of cost of investments and/or as a realized gain. The fund may estimate the components of distributions received that may be considered nontaxable distributions or long-term capital gain distributions for income tax purposes. Interest income is recorded on the accrual basis and includes accretion of discounts and amortization of premiums.
Equity-Linked Debt and Linked-Equity Securities — The fund may invest in hybrid equity securities, which usually convert into common stock at a date predetermined by the issuer. These securities generally offer a higher dividend yield than that of the common stock to which the security is linked. These instruments are issued by a company other than the one to which the security is linked and carry the credit of the issuer, not that of the underlying common stock. The securities’ appreciation is limited based on a predetermined final cap price at the date of the conversion. Risks of investing in these securities include, but are not limited to, a set time to capture the yield advantage, limited appreciation potential, decline in value of the underlying stock, and failure of the issuer to pay dividends or to deliver common stock at maturity.
Foreign Currency Translations — All assets and liabilities initially expressed in foreign currencies are translated into U.S. dollars at prevailing exchange rates at period end. The fund may enter into spot foreign currency exchange contracts to facilitate transactions denominated in a foreign currency. Purchases and sales of investment securities, dividend and interest income, spot foreign currency exchange contracts, and expenses are translated at the rates of exchange prevailing on the respective dates of such transactions. Net realized and unrealized foreign currency exchange gains or losses related to investment securities are a component of net realized gain (loss) on investment transactions and change in net unrealized appreciation (depreciation) on investments, respectively.
Repurchase Agreements — The fund may enter into repurchase agreements with institutions that American Century Investment Management, Inc. (ACIM) (the investment advisor) has determined are creditworthy pursuant to criteria adopted by the Board of Directors. The fund requires that the collateral, represented by securities, received in a repurchase transaction be transferred to the custodian in a manner sufficient to enable the fund to obtain those securities in the event of a default under the repurchase agreement. ACIM monitors, on a daily basis, the securities transferred to ensure the value, including accrued interest, of the securities under each repurchase agreement is equal to or greater than amounts owed to the fund under each repurchase agreement.
Joint Trading Account — Pursuant to an Exemptive Order issued by the Securities and Exchange Commission, the fund, along with certain other funds in the American Century Investments family of funds, may transfer uninvested cash balances into a joint trading account. These balances are invested in one or more repurchase agreements that are collateralized by U.S. Treasury or Agency obligations.
Segregated Assets — In accordance with the 1940 Act, the fund segregates assets on its books and records to cover certain types of investment securities and other financial instruments. ACIM monitors, on a daily basis, the securities segregated to ensure the fund designates a sufficient amount of liquid assets, marked-to-market daily. The fund may also receive assets or be required to pledge assets at the custodian bank or with a broker for collateral requirements.
Income Tax Status — It is the fund’s policy to distribute substantially all net investment income and net realized gains to shareholders and to otherwise qualify as a regulated investment company under provisions of the Internal Revenue Code. Accordingly, no provision has been made for income taxes. The fund files U.S. federal, state, local and non-U.S. tax returns as applicable. The fund's tax returns are subject to examination by the relevant taxing authority until expiration of the applicable statute of limitations, which is generally three years from the date of filing but can be longer in certain jurisdictions. At this time, management believes there are no uncertain tax positions which, based on their technical merit, would not be sustained upon examination and for which it is reasonably possible that the total amounts of unrecognized tax benefits will significantly change in the next twelve months.
Multiple Class — All shares of the fund represent an equal pro rata interest in the net assets of the class to which such shares belong, and have identical voting, dividend, liquidation and other rights and the same terms and conditions, except for class specific expenses and exclusive rights to vote on matters affecting only individual classes. Income, non-class specific expenses, and realized and unrealized capital gains and losses of the fund are allocated to each class of shares based on their relative net assets.
Distributions to Shareholders — Distributions from net investment income, if any, are generally declared and paid quarterly. Distributions from net realized gains, if any, are generally declared and paid annually. The fund may elect to treat a portion of its payment to a redeeming shareholder, which represents the pro rata share of undistributed net investment income and net realized gains, as a distribution for federal income tax purposes (tax equalization).
Indemnifications — Under the corporation’s organizational documents, its officers and directors are indemnified against certain liabilities arising out of the performance of their duties to the fund. In addition, in the normal course of business, the fund enters into contracts that provide general indemnifications. The maximum exposure under these arrangements is unknown as this would involve future claims that may be made against a fund. The risk of material loss from such claims is considered by management to be remote.
3. Fees and Transactions with Related Parties
Certain officers and directors of the corporation are also officers and/or directors of American Century Companies, Inc. (ACC). The corporation’s investment advisor, ACIM, the corporation's distributor, American Century Investment Services, Inc. (ACIS), and the corporation’s transfer agent, American Century Services, LLC, are wholly owned, directly or indirectly, by ACC.
Management Fees — The corporation has entered into a management agreement with ACIM, under which ACIM provides the fund with investment advisory and management services in exchange for a single, unified management fee (the fee) per class. The agreement provides that all expenses of managing and operating the fund, except distribution and service fees, brokerage expenses, taxes, interest, fees and expenses of the independent directors (including legal counsel fees), and extraordinary expenses, will be paid by ACIM. The fee is computed and accrued daily based on each class's daily net assets and paid monthly in arrears. The difference in the fee among the classes is a result of their separate arrangements for non-Rule 12b-1 shareholder services. It is not the result of any difference in advisory or custodial fees or other expenses related to the management of the fund’s assets, which do not vary by class. The rate of the fee is determined by applying a fee rate calculation formula. This formula takes into account the fund’s assets as well as certain assets, if any, of other clients of the investment advisor outside the American Century Investments family of funds (such as subadvised funds and separate accounts) that use very similar investment teams and strategies (strategy assets).
The management fee schedule range and the effective annual management fee for each class for the period ended March 31, 2019 are as follows:
|
| | |
| | Management Fee Schedule Range | Effective Annual Management Fee |
| Investor Class | 0.80% to 1.00% | 0.91% |
| I Class | 0.60% to 0.80% | 0.71% |
| Y Class | 0.45% to 0.65% | 0.56% |
| A Class | 0.80% to 1.00% | 0.91% |
| C Class | 0.80% to 1.00% | 0.91% |
| R Class | 0.80% to 1.00% | 0.91% |
| R5 Class | 0.60% to 0.80% | 0.71% |
| R6 Class | 0.45% to 0.65% | 0.56% |
Distribution and Service Fees — The Board of Directors has adopted a separate Master Distribution and Individual Shareholder Services Plan for each of the A Class, C Class and R Class (collectively the plans), pursuant to Rule 12b-1 of the 1940 Act. The plans provide that the A Class will pay ACIS an annual distribution and service fee of 0.25%. The plans provide that the C Class will pay ACIS an annual distribution and service fee of 1.00%, of which 0.25% is paid for individual shareholder services and 0.75% is paid for distribution services. The plans provide that the R Class will pay ACIS an annual distribution and service fee of 0.50%. The fees are computed and accrued daily based on each class’s daily net assets and paid monthly in arrears. The fees are used to pay financial intermediaries for distribution and individual shareholder services. Fees incurred under the plans during the period ended March 31, 2019 are detailed in the Statement of Operations.
Directors' Fees and Expenses — The Board of Directors is responsible for overseeing the investment advisor’s management and operations of the fund. The directors receive detailed information about the fund and its investment advisor regularly throughout the year, and meet at least quarterly with management of the investment advisor to review reports about fund operations. The fund’s officers do not receive compensation from the fund.
Interfund Transactions — The fund may enter into security transactions with other American Century Investments funds and other client accounts of the investment advisor, in accordance with the 1940 Act rules and procedures adopted by the Board of Directors. The rules and procedures require, among other things, that these transactions be effected at the independent current market price of the security. During the period, the interfund purchases and sales were $109,102,530 and $63,418,477, respectively. The effect of interfund transactions on the Statement of Operations was $3,316,295 in net realized gain (loss) on investment transactions.
4. Investment Transactions
Purchases and sales of investment securities, excluding short-term investments, for the period ended March 31, 2019 were $8,466,598,974 and $9,578,003,188, respectively.
5. Capital Share Transactions
Transactions in shares of the fund were as follows:
|
| | | | | | | | | | |
| | Year ended
March 31, 2019 | Year ended
March 31, 2018(1) |
| | Shares | Amount | Shares | Amount |
| Investor Class/Shares Authorized | 5,100,000,000 |
| | 4,650,000,000 |
| |
| Sold | 105,034,421 |
| $ | 904,564,870 |
| 220,034,394 |
| $ | 2,024,700,321 |
|
| Issued in reinvestment of distributions | 52,518,503 |
| 438,594,459 |
| 85,744,916 |
| 768,320,686 |
|
| Redeemed | (213,342,954 | ) | (1,849,710,287 | ) | (352,933,378 | ) | (3,256,891,415 | ) |
| | (55,790,030 | ) | (506,550,958 | ) | (47,154,068 | ) | (463,870,408 | ) |
| I Class/Shares Authorized | 2,200,000,000 |
| | 1,525,000,000 |
| |
| Sold | 116,496,183 |
| 1,011,040,819 |
| 189,466,471 |
| 1,756,767,174 |
|
| Issued in reinvestment of distributions | 22,330,282 |
| 186,839,532 |
| 31,636,282 |
| 283,692,561 |
|
| Redeemed | (118,643,000 | ) | (1,017,050,590 | ) | (82,436,401 | ) | (754,037,843 | ) |
| | 20,183,465 |
| 180,829,761 |
| 138,666,352 |
| 1,286,421,892 |
|
| Y Class/Shares Authorized | 200,000,000 |
| | 120,000,000 |
| |
| Sold | 6,966,057 |
| 60,695,249 |
| 27,242,901 |
| 253,718,677 |
|
| Issued in reinvestment of distributions | 1,947,186 |
| 16,329,263 |
| 2,809,370 |
| 25,172,515 |
|
| Redeemed | (7,493,667 | ) | (64,749,944 | ) | (4,985,917 | ) | (45,825,277 | ) |
| | 1,419,576 |
| 12,274,568 |
| 25,066,354 |
| 233,065,915 |
|
| A Class/Shares Authorized | 725,000,000 |
| | 700,000,000 |
| |
| Sold | 17,752,502 |
| 153,964,874 |
| 15,531,220 |
| 142,337,369 |
|
| Issued in reinvestment of distributions | 6,980,719 |
| 58,246,057 |
| 11,661,099 |
| 104,352,195 |
|
| Redeemed | (35,261,101 | ) | (305,057,790 | ) | (153,166,775 | ) | (1,408,340,462 | ) |
| | (10,527,880 | ) | (92,846,859 | ) | (125,974,456 | ) | (1,161,650,898 | ) |
| C Class/Shares Authorized | 500,000,000 |
| | 485,000,000 |
| |
| Sold | 8,279,818 |
| 70,756,974 |
| 7,910,258 |
| 72,726,799 |
|
| Issued in reinvestment of distributions | 3,837,636 |
| 31,864,627 |
| 6,930,065 |
| 61,865,508 |
|
| Redeemed | (23,123,153 | ) | (200,253,311 | ) | (19,731,607 | ) | (181,313,681 | ) |
| | (11,005,699 | ) | (97,631,710 | ) | (4,891,284 | ) | (46,721,374 | ) |
| R Class/Shares Authorized | 85,000,000 |
| | 90,000,000 |
| |
| Sold | 1,038,898 |
| 8,958,660 |
| 1,453,987 |
| 13,324,491 |
|
| Issued in reinvestment of distributions | 732,996 |
| 6,081,671 |
| 1,242,566 |
| 11,076,926 |
|
| Redeemed | (2,422,060 | ) | (20,768,459 | ) | (4,434,603 | ) | (40,627,431 | ) |
| | (650,166 | ) | (5,728,128 | ) | (1,738,050 | ) | (16,226,014 | ) |
| R5 Class/Shares Authorized | 30,000,000 |
| | 50,000,000 |
| |
| Sold | 62,000 |
| 543,095 |
| 81,148 |
| 738,366 |
|
| Issued in reinvestment of distributions | 7,548 |
| 63,192 |
| 437 |
| 3,854 |
|
| Redeemed | (42,901 | ) | (380,039 | ) | (5,688 | ) | (49,793 | ) |
| | 26,647 |
| 226,248 |
| 75,897 |
| 692,427 |
|
| R6 Class/Shares Authorized | 600,000,000 |
| | 400,000,000 |
| |
| Sold | 22,090,431 |
| 191,070,418 |
| 34,905,890 |
| 318,810,650 |
|
| Issued in reinvestment of distributions | 6,747,076 |
| 56,541,527 |
| 7,389,571 |
| 66,334,026 |
|
| Redeemed | (17,657,119 | ) | (153,304,158 | ) | (15,915,475 | ) | (147,005,492 | ) |
| | 11,180,388 |
| 94,307,787 |
| 26,379,986 |
| 238,139,184 |
|
| Net increase (decrease) | (45,163,699 | ) | $ | (415,119,291 | ) | 10,430,731 |
| $ | 69,850,724 |
|
| |
| (1) | April 10, 2017 (commencement of sale) through March 31, 2018 for the Y Class and R5 Class. |
6. Affiliated Company Transactions
If a fund's holding represents ownership of 5% or more of the voting securities of a company, the company is affiliated as defined in the 1940 Act. A summary of transactions for each company which is or was an affiliate at or during the period ended March 31, 2019 follows (amounts in thousands):
|
| | | | | | | | | | | | | | | | | | | | | | | |
| Company | Beginning Value | Purchase
Cost | Sales
Cost | Change in Net Unrealized Appreciation (Depreciation) | Ending
Value | Ending
Shares | Net Realized
Gain (Loss) | Income |
| Capitol Federal Financial, Inc. | $ | 113,551 |
| $ | 65 |
| — |
| $ | 9,197 |
| $ | 122,813 |
| 9,199 |
| — |
| $ | 9,016 |
|
| ONE Gas, Inc. | 200,615 |
| 2,471 |
| $ | 33,972 |
| 35,503 |
| (1) |
| (1) |
| $ | 27,452 |
| 4,908 |
|
| | $ | 314,166 |
| $ | 2,536 |
| $ | 33,972 |
| $ | 44,700 |
| $ | 122,813 |
| 9,199 |
| $ | 27,452 |
| $ | 13,924 |
|
(1) Company was not an affiliate at March 31, 2019.
7. Fair Value Measurements
The fund’s investments valuation process is based on several considerations and may use multiple inputs to determine the fair value of the investments held by the fund. In conformity with accounting principles generally accepted in the United States of America, the inputs used to determine a valuation are classified into three broad levels.
| |
| • | Level 1 valuation inputs consist of unadjusted quoted prices in an active market for identical investments. |
| |
| • | Level 2 valuation inputs consist of direct or indirect observable market data (including quoted prices for comparable investments, evaluations of subsequent market events, interest rates, prepayment speeds, credit risk, etc.). These inputs also consist of quoted prices for identical investments initially expressed in local currencies that are adjusted through translation into U.S. dollars. |
| |
| • | Level 3 valuation inputs consist of unobservable data (including a fund’s own assumptions). |
The level classification is based on the lowest level input that is significant to the fair valuation measurement. The valuation inputs are not necessarily an indication of the risks associated with investing in these securities or other financial instruments.
The following is a summary of the level classifications as of period end. The Schedule of Investments provides additional information on the fund’s portfolio holdings.
|
| | | | | | | | |
| | Level 1 | Level 2 | Level 3 |
| Assets | | | |
| Investment Securities | | | |
| Common Stocks | | | |
| Aerospace and Defense | $ | 124,961,504 |
| $ | 13,759,807 |
| — |
|
| Automobiles | — |
| 31,632,429 |
| — |
|
| Chemicals | 87,439,518 |
| 26,528,952 |
| — |
|
| Electrical Equipment | 129,612,828 |
| 29,986,733 |
| — |
|
| Food Products | 175,135,316 |
| 227,626,573 |
| — |
|
| Hotels, Restaurants and Leisure | 50,547,704 |
| 65,923,461 |
| — |
|
| Industrial Conglomerates | 60,386,686 |
| 24,250,473 |
| — |
|
| Machinery | 111,540,028 |
| 56,868,530 |
| — |
|
| Oil, Gas and Consumable Fuels | 551,759,500 |
| 308,236,644 |
| — |
|
| Personal Products | — |
| 46,304,748 |
| — |
|
| Pharmaceuticals | 699,584,865 |
| 153,411,521 |
| — |
|
| Other Industries | 5,724,031,952 |
| — |
| — |
|
| Preferred Stocks | — |
| 662,774,262 |
| — |
|
| Convertible Bonds | — |
| 656,225,798 |
| — |
|
| Convertible Preferred Stocks | 563,068,308 |
| — |
| — |
|
| Exchange-Traded Funds | 352,752,890 |
| — |
| — |
|
| Temporary Cash Investments | — |
| 349,041,965 |
| — |
|
| | $ | 8,630,821,099 |
| $ | 2,652,571,896 |
| — |
|
| Other Financial Instruments | | | |
| Forward Foreign Currency Exchange Contracts | — |
| $ | 5,729,365 |
| — |
|
| | | | |
| Liabilities | | | |
| Other Financial Instruments | | | |
| Forward Foreign Currency Exchange Contracts | — |
| $ | 3,499 |
| — |
|
| Written Options Contracts | $ | 1,066,389 |
| — |
| — |
|
| | $ | 1,066,389 |
| $ | 3,499 |
| — |
|
8. Derivative Instruments
Equity Price Risk — The fund is subject to equity price risk in the normal course of pursuing its investment objectives. A fund may enter into options contracts based on an equity index or specific security in order to manage its exposure to changes in market conditions. The risks of entering into equity price risk derivative instruments include the possible lack of liquidity, failure of the counterparty to meet its obligations, and that there may be unfavorable changes in the underlying investments or instruments. A fund may purchase or write an option contract to protect against declines in market value on the underlying index or security. A purchased option contract provides the fund a right, but not an obligation, to buy (call) or sell (put) an equity-related asset at a specified exercise price within a certain period or on a specific date. A written option contract holds the corresponding obligation to sell (call writing) or buy (put writing) the underlying equity-related asset if the purchaser exercises the option contract. The buyer pays the seller an initial purchase price (premium) for this right. Option contracts purchased by a fund are accounted for in the same manner as marketable portfolio securities. The premium received by a fund for option contracts written is recorded as a liability and valued daily. The proceeds from securities sold through the exercise of option contracts are decreased by the premium paid to purchase the option contracts. A fund may recognize a realized gain or loss when the option contract is closed, exercised or expires. Net realized and unrealized gains or losses occurring during the holding period of purchased options contracts are a component of net realized gain (loss) on investment transactions and change in net unrealized appreciation (depreciation) on investments, respectively. Net realized and unrealized gains or losses occurring during the holding period of written options contracts are a component of net realized gain (loss) on written options contract transactions and change in net unrealized appreciation (depreciation) on written options contracts, respectively. The fund’s average exposure to equity price risk derivative instruments held during the period was 5,257 written options contracts.
Foreign Currency Risk — The fund is subject to foreign currency exchange rate risk in the normal course of pursuing its investment objectives. The value of foreign investments held by a fund may be significantly affected by changes in foreign currency exchange rates. The dollar value of a foreign security generally decreases when the value of the dollar rises against the foreign currency in which the security is denominated and tends to increase when the value of the dollar declines against such foreign currency. A fund may enter into forward foreign currency exchange contracts to reduce a fund's exposure to foreign currency exchange rate fluctuations. The net U.S. dollar value of foreign currency underlying all contractual commitments held by a fund and the resulting unrealized appreciation or depreciation are determined daily. Realized gain or loss is recorded upon the termination of the contract. Net realized and unrealized gains or losses occurring during the holding period of forward foreign currency exchange contracts are a component of net realized gain (loss) on forward foreign currency exchange contract transactions and change in net unrealized appreciation (depreciation) on forward foreign currency exchange contracts, respectively. A fund bears the risk of an unfavorable change in the foreign currency exchange rate underlying the forward contract. Additionally, losses, up to the fair value, may arise if the counterparties do not perform under the contract terms. The fund's average U.S. dollar exposure to foreign currency risk derivative instruments held during the period was $831,822,154.
Value of Derivative Instruments as of March 31, 2019
|
| | | | | | | | |
| | Asset Derivatives | Liability Derivatives |
| Type of Risk Exposure | Location on Statement of Assets and Liabilities | Value | Location on Statement of Assets and Liabilities | Value |
| Equity Price Risk | Written Options | — |
| Written Options | $ | 1,066,389 |
|
| Foreign Currency Risk | Unrealized appreciation on forward foreign currency exchange contracts | $ | 5,729,365 |
| Unrealized depreciation on forward foreign currency exchange contracts | 3,499 |
|
| | | $ | 5,729,365 |
| | $ | 1,069,888 |
|
Effect of Derivative Instruments on the Statement of Operations for the Year Ended March 31, 2019
|
| | | | | | | | |
| | Net Realized Gain (Loss) | Change in Net Unrealized Appreciation (Depreciation) |
| Type of Risk Exposure | Location on Statement of Operations | Value | Location on Statement of Operations | Value |
| Equity Price Risk | Net realized gain (loss) on written options contract transactions | $ | 4,867,472 |
| Change in net unrealized appreciation (depreciation) on written options contracts | $ | 608,835 |
|
| Foreign Currency Risk | Net realized gain (loss) on forward foreign currency exchange contract transactions | 61,084,298 |
| Change in net unrealized appreciation (depreciation) on forward foreign currency exchange contracts | 5,879,117 |
|
| | | $ | 65,951,770 |
| | $ | 6,487,952 |
|
9. Risk Factors
There are certain risks involved in investing in foreign securities. These risks include those resulting from political events (such as civil unrest, national elections and imposition of exchange controls), social and economic events (such as labor strikes and rising inflation), and natural disasters. Securities of foreign issuers may be less liquid and more volatile. Investing a significant portion of assets in one country or region may accentuate these risks.
10. Federal Tax Information
The tax character of distributions paid during the years ended March 31, 2019 and March 31, 2018 were as follows:
|
| | | | | | |
| | 2019 | 2018 |
| Distributions Paid From | | |
| Ordinary income | $ | 305,404,421 |
| $ | 520,873,891 |
|
| Long-term capital gains | $ | 526,738,424 |
| $ | 863,231,843 |
|
The book-basis character of distributions made during the year from net investment income or net realized gains may differ from their ultimate characterization for federal income tax purposes. These differences reflect the differing character of certain income items and net realized gains and losses for financial statement and tax purposes, and may result in reclassification among certain capital accounts on the financial statements.
As of period end, the federal tax cost of investments and the components of distributable earnings on a tax-basis were as follows:
|
| | | |
| Federal tax cost of investments | $ | 9,622,432,017 |
|
| Gross tax appreciation of investments | $ | 1,839,961,116 |
|
| Gross tax depreciation of investments | (179,000,138 | ) |
| Net tax appreciation (depreciation) of investments | 1,660,960,978 |
|
| Net tax appreciation (depreciation) on derivatives and translation of assets and liabilities in foreign currencies | 517,799 |
|
| Net tax appreciation (depreciation) | $ | 1,661,478,777 |
|
| Undistributed ordinary income | $ | 27,155,898 |
|
| Accumulated long-term gains | $ | 102,920,820 |
|
The difference between book-basis and tax-basis unrealized appreciation (depreciation) is attributable primarily to the tax deferral of losses on wash sales.
11. Recently Issued Accounting Standards
In March 2017, the Financial Accounting Standards Board (FASB) issued Accounting Standards Update No. 2017-08, “Receivables - Nonrefundable Fees and Other Costs (Subtopic 310-20), Premium Amortization on Purchased Callable Debt Securities” (ASU 2017-08). ASU 2017-08 amends the amortization period for certain purchased callable debt securities held at a premium, shortening such period to the earliest call date. The amendments are effective for fiscal years, and interim periods within those fiscal years, beginning after December 15, 2018. Management is currently evaluating the impact that adopting ASU 2017-08 will have on the financial statements.
|
| | | | | | | | | | | | | | | |
| For a Share Outstanding Throughout the Years Ended March 31 (except as noted) | | | | |
| Per-Share Data | | | | | | | Ratios and Supplemental Data |
| | | Income From Investment Operations: | Distributions From: | | | Ratio to Average Net Assets of: | | |
| | Net Asset
Value,
Beginning
of Period | Net
Investment
Income
(Loss)(1) | Net
Realized
and
Unrealized
Gain (Loss) | Total From
Investment
Operations | Net
Investment
Income | Net
Realized
Gains | Total
Distributions | Net Asset
Value,
End
of Period | Total
Return(2) | Operating
Expenses | Net
Investment
Income
(Loss) | Portfolio
Turnover
Rate | Net
Assets,
End of
Period
(in thousands) |
| Investor Class | | | | | | | | | | | | |
| 2019 | $8.60 | 0.18 | 0.56 | 0.74 | (0.18) | (0.47) | (0.65) | $8.69 | 9.07% | 0.91% | 2.13% | 80% |
| $6,081,355 |
|
| 2018 | $9.13 | 0.17 | 0.37 | 0.54 | (0.17) | (0.90) | (1.07) | $8.60 | 5.61% | 0.91% | 1.86% | 75% |
| $6,496,269 |
|
| 2017 | $8.41 | 0.17 | 1.24 | 1.41 | (0.17) | (0.52) | (0.69) | $9.13 | 17.14% | 0.91% | 1.91% | 93% |
| $7,327,473 |
|
| 2016 | $8.71 | 0.21 | 0.32 | 0.53 | (0.20) | (0.63) | (0.83) | $8.41 | 6.78% | 0.94% | 2.44% | 88% |
| $5,399,702 |
|
| 2015 | $8.84 | 0.21 | 0.54 | 0.75 | (0.22) | (0.66) | (0.88) | $8.71 | 8.54% | 0.93% | 2.30% | 56% |
| $5,463,566 |
|
| I Class | | | | | | | | | | | | |
| 2019 | $8.61 | 0.20 | 0.56 | 0.76 | (0.20) | (0.47) | (0.67) | $8.70 | 9.27% | 0.71% | 2.33% | 80% |
| $2,826,256 |
|
| 2018 | $9.14 | 0.19 | 0.37 | 0.56 | (0.19) | (0.90) | (1.09) | $8.61 | 5.82% | 0.71% | 2.06% | 75% |
| $2,621,898 |
|
| 2017 | $8.42 | 0.19 | 1.24 | 1.43 | (0.19) | (0.52) | (0.71) | $9.14 | 17.36% | 0.71% | 2.11% | 93% |
| $1,515,758 |
|
| 2016 | $8.71 | 0.22 | 0.34 | 0.56 | (0.22) | (0.63) | (0.85) | $8.42 | 7.11% | 0.74% | 2.64% | 88% |
| $1,229,940 |
|
| 2015 | $8.85 | 0.22 | 0.54 | 0.76 | (0.24) | (0.66) | (0.90) | $8.71 | 8.63% | 0.73% | 2.50% | 56% |
| $1,318,193 |
|
| Y Class | | | | | | | | | | | | | |
| 2019 | $8.62 | 0.22 | 0.55 | 0.77 | (0.21) | (0.47) | (0.68) | $8.71 | 9.43% | 0.56% | 2.48% | 80% |
| $230,773 |
|
2018(3) | $9.16 | 0.20 | 0.36 | 0.56 | (0.20) | (0.90) | (1.10) | $8.62 | 5.83% | 0.56%(4) | 2.25%(4) | 75%(5) |
| $216,014 |
|
|
| | | | | | | | | | | | | | | |
| For a Share Outstanding Throughout the Years Ended March 31 (except as noted) | | | | |
| Per-Share Data | | | | | | | Ratios and Supplemental Data |
| | | Income From Investment Operations: | Distributions From: | | | Ratio to Average Net Assets of: | | |
| | Net Asset
Value,
Beginning
of Period | Net
Investment
Income
(Loss)(1) | Net
Realized
and
Unrealized
Gain (Loss) | Total From
Investment
Operations | Net
Investment
Income | Net
Realized
Gains | Total
Distributions | Net Asset
Value,
End
of Period | Total
Return(2) | Operating
Expenses | Net
Investment
Income
(Loss) | Portfolio
Turnover
Rate | Net
Assets,
End of
Period
(in thousands) |
| A Class | | | | | | | | | | | | | |
| 2019 | $8.60 | 0.16 | 0.56 | 0.72 | (0.16) | (0.47) | (0.63) | $8.69 | 8.80% | 1.16% | 1.88% | 80% |
| $850,117 |
|
| 2018 | $9.13 | 0.14 | 0.38 | 0.52 | (0.15) | (0.90) | (1.05) | $8.60 | 5.36% | 1.16% | 1.61% | 75% |
| $931,567 |
|
| 2017 | $8.41 | 0.15 | 1.24 | 1.39 | (0.15) | (0.52) | (0.67) | $9.13 | 16.85% | 1.16% | 1.66% | 93% |
| $2,139,411 |
|
| 2016 | $8.71 | 0.18 | 0.33 | 0.51 | (0.18) | (0.63) | (0.81) | $8.41 | 6.51% | 1.19% | 2.19% | 88% |
| $1,934,681 |
|
| 2015 | $8.84 | 0.18 | 0.55 | 0.73 | (0.20) | (0.66) | (0.86) | $8.71 | 8.27% | 1.18% | 2.05% | 56% |
| $2,172,105 |
|
| C Class | | | | | | | | | | | | | |
| 2019 | $8.60 | 0.10 | 0.55 | 0.65 | (0.09) | (0.47) | (0.56) | $8.69 | 8.00% | 1.91% | 1.13% | 80% |
| $538,726 |
|
| 2018 | $9.13 | 0.08 | 0.37 | 0.45 | (0.08) | (0.90) | (0.98) | $8.60 | 4.58% | 1.91% | 0.86% | 75% |
| $627,651 |
|
| 2017 | $8.41 | 0.08 | 1.24 | 1.32 | (0.08) | (0.52) | (0.60) | $9.13 | 15.97% | 1.91% | 0.91% | 93% |
| $711,149 |
|
| 2016 | $8.71 | 0.12 | 0.33 | 0.45 | (0.12) | (0.63) | (0.75) | $8.41 | 5.72% | 1.94% | 1.44% | 88% |
| $562,723 |
|
| 2015 | $8.84 | 0.12 | 0.54 | 0.66 | (0.13) | (0.66) | (0.79) | $8.71 | 7.47% | 1.93% | 1.30% | 56% |
| $549,088 |
|
| R Class | | | | | | | | | | | | | |
| 2019 | $8.57 | 0.14 | 0.56 | 0.70 | (0.14) | (0.47) | (0.61) | $8.66 | 8.57% | 1.41% | 1.63% | 80% |
| $88,499 |
|
| 2018 | $9.10 | 0.13 | 0.36 | 0.49 | (0.12) | (0.90) | (1.02) | $8.57 | 5.11% | 1.41% | 1.36% | 75% |
| $93,154 |
|
| 2017 | $8.39 | 0.13 | 1.22 | 1.35 | (0.12) | (0.52) | (0.64) | $9.10 | 16.48% | 1.41% | 1.41% | 93% |
| $114,762 |
|
| 2016 | $8.69 | 0.16 | 0.33 | 0.49 | (0.16) | (0.63) | (0.79) | $8.39 | 6.27% | 1.44% | 1.94% | 88% |
| $105,462 |
|
| 2015 | $8.82 | 0.16 | 0.54 | 0.70 | (0.17) | (0.66) | (0.83) | $8.69 | 8.03% | 1.43% | 1.80% | 56% |
| $127,897 |
|
| R5 Class | | | | | | | | | | | | | |
| 2019 | $8.60 | 0.20 | 0.57 | 0.77 | (0.20) | (0.47) | (0.67) | $8.70 | 9.41% | 0.71% | 2.33% | 80% |
| $892 |
|
2018(3) | $9.15 | 0.21 | 0.33 | 0.54 | (0.19) | (0.90) | (1.09) | $8.60 | 5.57% | 0.71%(4) | 2.51%(4) | 75%(5) |
| $653 |
|
|
| | | | | | | | | | | | | | | |
| For a Share Outstanding Throughout the Years Ended March 31 (except as noted) | | | | |
| Per-Share Data | | | | | | | Ratios and Supplemental Data |
| | | Income From Investment Operations: | Distributions From: | | | Ratio to Average Net Assets of: | | |
| | Net Asset
Value,
Beginning
of Period | Net
Investment
Income
(Loss)(1) | Net
Realized
and
Unrealized
Gain (Loss) | Total From
Investment
Operations | Net
Investment
Income | Net
Realized
Gains | Total
Distributions | Net Asset
Value,
End
of Period | Total
Return(2) | Operating
Expenses | Net
Investment
Income
(Loss) | Portfolio
Turnover
Rate | Net
Assets,
End of
Period
(in thousands) |
| R6 Class | | | | | | | | | | | | | |
| 2019 | $8.62 | 0.22 | 0.55 | 0.77 | (0.21) | (0.47) | (0.68) | $8.71 | 9.43% | 0.56% | 2.48% | 80% |
| $796,417 |
|
| 2018 | $9.15 | 0.21 | 0.36 | 0.57 | (0.20) | (0.90) | (1.10) | $8.62 | 5.97% | 0.56% | 2.21% | 75% |
| $691,393 |
|
| 2017 | $8.42 | 0.20 | 1.25 | 1.45 | (0.20) | (0.52) | (0.72) | $9.15 | 17.66% | 0.56% | 2.26% | 93% |
| $492,622 |
|
| 2016 | $8.72 | 0.24 | 0.32 | 0.56 | (0.23) | (0.63) | (0.86) | $8.42 | 7.14% | 0.59% | 2.79% | 88% |
| $246,151 |
|
| 2015 | $8.85 | 0.25 | 0.53 | 0.78 | (0.25) | (0.66) | (0.91) | $8.72 | 8.90% | 0.58% | 2.65% | 56% |
| $117,620 |
|
|
| | | | |
| Notes to Financial Highlights | | |
| |
| (1) | Computed using average shares outstanding throughout the period. |
| |
| (2) | Total returns are calculated based on the net asset value of the last business day and do not reflect applicable sales charges, if any. Total returns for periods less than one year are not annualized. |
| |
| (3) | April 10, 2017 (commencement of sale) through March 31, 2018. |
| |
| (5) | Portfolio turnover is calculated at the fund level. Percentage indicated was calculated for the year ended March 31, 2018. |
See Notes to Financial Statements.
|
|
| Report of Independent Registered Public Accounting Firm |
To the shareholders and the Board of Directors of American Century Capital Portfolios, Inc.:
Opinion on the Financial Statements and Financial Highlights
We have audited the accompanying statement of assets and liabilities, including the schedule of investments, of Equity Income Fund, one of the portfolios constituting the American Century Capital Portfolios, Inc. (the “Fund”), as of March 31, 2019, the related statement of operations for the year then ended, the statements of changes in net assets for each of the two years in the period then ended, the financial highlights for each of the five years in the period then ended, and the related notes. In our opinion, the financial statements and financial highlights present fairly, in all material respects, the financial position of Equity Income Fund of the American Century Capital Portfolios, Inc. as of March 31, 2019, the results of its operations for the year then ended, the changes in its net assets for each of the two years in the period then ended, and the financial highlights for each of the five years in the period then ended, in conformity with accounting principles generally accepted in the United States of America.
Basis for Opinion
These financial statements and financial highlights are the responsibility of the Fund's management. Our responsibility is to express an opinion on the Fund’s financial statements and financial highlights based on our audits. We are a public accounting firm registered with the Public Company Accounting Oversight Board (United States) (PCAOB) and are required to be independent with respect to the Fund in accordance with the U.S. federal securities laws and the applicable rules and regulations of the Securities and Exchange Commission and the PCAOB.
We conducted our audits in accordance with the standards of the PCAOB. Those standards require that we plan and perform the audit to obtain reasonable assurance about whether the financial statements and financial highlights are free of material misstatement, whether due to error or fraud. The Fund is not required to have, nor were we engaged to perform, an audit of its internal control over financial reporting. As part of our audits we are required to obtain an understanding of internal control over financial reporting but not for the purpose of expressing an opinion on the effectiveness of the Fund’s internal control over financial reporting. Accordingly, we express no such opinion.
Our audits included performing procedures to assess the risks of material misstatement of the financial statements and financial highlights, whether due to error or fraud, and performing procedures that respond to those risks. Such procedures included examining, on a test basis, evidence regarding the amounts and disclosures in the financial statements and financial highlights. Our audits also included evaluating the accounting principles used and significant estimates made by management, as well as evaluating the overall presentation of the financial statements and financial highlights. Our procedures included confirmation of securities owned as of March 31, 2019, by correspondence with the custodian and brokers; when replies were not received from brokers, we performed other auditing procedures. We believe that our audits provide a reasonable basis for our opinion.
DELOITTE & TOUCHE LLP
Kansas City, Missouri
May 16, 2019
We have served as the auditor of one or more American Century investment companies since 1997.
The Board of Directors
The individuals listed below serve as directors of the funds. Each director will continue to serve in this capacity until death, retirement, resignation or removal from office. The board has adopted a mandatory retirement age for directors who are not “interested persons,” as that term is defined in the Investment Company Act (independent directors). Independent directors shall retire by December 31 of the year in which they reach their 75th birthday.
Mr. Thomas is an “interested person” because he currently serves as President and Chief Executive Officer of American Century Companies, Inc. (ACC), the parent company of American Century Investment Management, Inc. (ACIM or the advisor). The other directors (more than three-fourths of the total number) are independent. They are not employees, directors or officers of, and have no financial interest in, ACC or any of its wholly owned, direct or indirect, subsidiaries, including ACIM, American Century Investment Services, Inc. (ACIS) and American Century Services, LLC (ACS), and they do not have any other affiliations, positions or relationships that would cause them to be considered “interested persons” under the Investment Company Act. The directors serve in this capacity for seven (in the case of Jonathan S. Thomas, 16; and Stephen E. Yates, 8) registered investment companies in the American Century Investments family of funds.
The following table presents additional information about the directors. The mailing address for each director is 4500 Main Street, Kansas City, Missouri 64111.
|
| | | | | |
Name
(Year of Birth) | Position(s) Held with Funds | Length of Time Served | Principal Occupation(s) During Past 5 Years | Number of American Century Portfolios Overseen by Director | Other Directorships Held During Past 5 Years |
| Independent Directors |
|
|
| Thomas W. Bunn (1953) | Director | Since 2017 | Retired | 67 | SquareTwo Financial; Barings (formerly Babson Capital Funds Trust) (2013 to 2016) |
Chris H. Cheesman
(1962)
| Director | Since 2019
| Retired. Senior Vice President & Chief Audit Executive, AllianceBernstein (1999 to 2018)
| 67 | None |
Barry Fink
(1955) | Director | Since 2012 (independent since 2016) | Retired | 67 | None |
Rajesh K. Gupta
(1960)
| Director | Since 2019
| Partner Emeritus, SeaCrest Investment Management and SeaCrest Wealth Management (2019 to Present); Chief Executive Officer and Chief Investment Officer, SeaCrest Investment Management (2006 to 2019); Chief Executive Officer and Chief Investment Officer, SeaCrest Wealth Management (2008 to 2019)
| 67 | None |
|
| | | | | |
Name
(Year of Birth) | Position(s) Held with Funds | Length of Time Served | Principal Occupation(s) During Past 5 Years | Number of American Century Portfolios Overseen by Director | Other Directorships Held During Past 5 Years |
| Independent Directors |
|
|
Lynn Jenkins
(1963)
| Director | Since 2019
| United States Representative, U.S. House of Representatives (2009 to 2018) | 67 | MGP Ingredients, Inc. |
Jan M. Lewis
(1957) | Director | Since 2011 | Retired | 67 | None |
John R. Whitten
(1946) | Director | Since 2008 | Retired | 67 | Rudolph Technologies, Inc. |
Stephen E. Yates
(1948) | Director and Chairman of the Board | Since 2012 (Chairman since 2018) | Retired | 72 | None |
| Interested Director |
|
|
Jonathan S. Thomas
(1963) | Director and President | Since 2007 | President and Chief Executive Officer, ACC (2007 to present). Also serves as Chief Executive Officer, ACS; Executive Vice President, ACIM; Director, ACC, ACIM and other ACC subsidiaries | 117 | BioMed Valley Discoveries, Inc. |
The Statement of Additional Information has additional information about the fund's directors and is available without charge, upon request, by calling 1-800-345-2021.
Officers
The following table presents certain information about the executive officers of the funds. Each officer serves as an officer for 16 (in the case of Robert J. Leach, 15) investment companies in the American Century family of funds, unless otherwise noted. No officer is compensated for his or her service as an officer of the funds. The listed officers are interested persons of the funds and are appointed or re-appointed on an annual basis. The mailing address for each officer listed below is 4500 Main Street, Kansas City, Missouri 64111.
|
| | |
Name
(Year of Birth) | Offices with the Funds | Principal Occupation(s) During the Past Five Years |
Jonathan S. Thomas
(1963) | Director and President since 2007 | President and Chief Executive Officer, ACC (2007 to present). Also serves as Chief Executive Officer, ACS; Executive Vice President, ACIM; Director, ACC, ACIM and other ACC subsidiaries |
R. Wes Campbell
(1974)
| Chief Financial Officer and Treasurer since 2018 | Investment Operations and Investment Accounting, ACS (2000 to present) |
Amy D. Shelton
(1964) | Chief Compliance Officer and Vice President since 2014 | Chief Compliance Officer, American Century funds, (2014 to present); Chief Compliance Officer, ACIM (2014 to present); Chief Compliance Officer, ACIS (2009 to present); Vice President, Client Interactions and Marketing, ACIS (2013 to 2014). Also serves as Vice President, ACIS |
Charles A. Etherington
(1957) | General Counsel since 2007 and Senior Vice President since 2006 | Attorney, ACC (1994 to present); Vice President, ACC (2005 to present); General Counsel, ACC (2007 to present). Also serves as General Counsel, ACIM, ACS, ACIS and other ACC subsidiaries; and Senior Vice President, ACIM and ACS |
C. Jean Wade
(1964) | Vice President since 2012 | Senior Vice President, ACS (2017 to present); Vice President, ACS (2000 to 2017) |
Robert J. Leach
(1966) | Vice President since 2006 | Vice President, ACS (2000 to present) |
David H. Reinmiller
(1963) | Vice President since 2000 | Attorney, ACC (1994 to present). Also serves as Vice President, ACIM and ACS |
Ward D. Stauffer
(1960) | Secretary since 2005 | Attorney, ACC (2003 to present) |
Retirement Account Information
As required by law, distributions you receive from certain retirement accounts are subject to federal income tax withholding, unless you elect not to have withholding apply*. Tax will be withheld on the total amount withdrawn even though you may be receiving amounts that are not subject to withholding, such as nondeductible contributions. In such case, excess amounts of withholding could occur. You may adjust your withholding election so that a greater or lesser amount will be withheld.
If you don’t want us to withhold on this amount, you must notify us to not withhold the federal income tax. You may notify us in writing or in certain situations by telephone or through other electronic means. For systematic withdrawals, your withholding election will remain in effect until revoked or changed by filing a new election. You have the right to revoke your election at any time and change your withholding percentage for future distributions.
Remember, even if you elect not to have income tax withheld, you are liable for paying income tax on the taxable portion of your withdrawal. If you elect not to have income tax withheld or you don’t have enough income tax withheld, you may be responsible for payment of estimated tax. You may incur penalties under the estimated tax rules if your withholding and estimated tax payments are not sufficient. You can reduce or defer the income tax on a distribution by directly or indirectly rolling such distribution over to another IRA or eligible plan. You should consult your tax advisor for additional information.
State tax will be withheld if, at the time of your distribution, your address is within one of the mandatory withholding states and you have federal income tax withheld (or as otherwise required by state law). State taxes will be withheld from your distribution in accordance with the respective state rules.
*Some 403(b), 457 and qualified retirement plan distributions may be subject to 20% mandatory withholding, as they are subject to special tax and withholding rules. Your plan administrator or plan sponsor is required to provide you with a special tax notice explaining those rules at the time you request a distribution. If applicable, federal and/or state taxes may be withheld from your distribution amount.
Proxy Voting Policies
A description of the policies that the fund's investment advisor uses in exercising the voting rights associated with the securities purchased and/or held by the fund is available without charge, upon request, by calling 1-800-345-2021. It is also available on the "About Us" page of American Century Investments’ website at americancentury.com and on the Securities and Exchange Commission’s website at sec.gov. Information regarding how the investment advisor voted proxies relating to portfolio securities during the most recent 12-month period ended June 30 is available on the "About Us" page at americancentury.com. It is also available at sec.gov.
Quarterly Portfolio Disclosure
The fund files its complete schedule of portfolio holdings with the Securities and Exchange Commission (SEC) for the first and third quarters of each fiscal year on Form N-Q or as an exhibit to its reports on Form N-PORT. The fund’s Forms N-Q and Form N-PORT reports are available on the SEC’s website at sec.gov. The fund also makes its complete schedule of portfolio holdings for the most recent quarter of its fiscal year available on its website at americancentury.com and, upon request, by calling 1-800-345-2021.
Other Tax Information
The following information is provided pursuant to provisions of the Internal Revenue Code.
The fund hereby designates up to the maximum amount allowable as qualified dividend income for the fiscal year ended March 31, 2019.
For corporate taxpayers, the fund hereby designates $218,389,820, or up to the maximum amount allowable, of ordinary income distributions paid during the fiscal year ended March 31, 2019 as qualified for the corporate dividends received deduction.
The fund hereby designates $66,771,022 as qualified short-term capital gain distributions for purposes of Internal Revenue Code Section 871 for the fiscal year ended March 31, 2019.
The fund hereby designates $538,403,020, or up to the maximum amount allowable, as long-term capital gain distributions (20% rate gain distributions) for the fiscal year ended March 31, 2019.
The fund utilized earnings and profits of $18,497,358 distributed to shareholders on redemption of shares as part of the dividends paid deduction (tax equalization).
|
| | |
| |
| | | |
| Contact Us | americancentury.com | |
| Automated Information Line | 1-800-345-8765 | |
| Investor Services Representative | 1-800-345-2021 or 816-531-5575 | |
| Investors Using Advisors | 1-800-378-9878 | |
| Business, Not-For-Profit, Employer-Sponsored Retirement Plans | 1-800-345-3533 | |
| Banks and Trust Companies, Broker-Dealers, Financial Professionals, Insurance Companies | 1-800-345-6488 | |
| Telecommunications Relay Service for the Deaf | 711 | |
| | | |
| American Century Capital Portfolios, Inc. | |
| | | |
Investment Advisor: American Century Investment Management, Inc. Kansas City, Missouri | |
| | | |
| This report and the statements it contains are submitted for the general information of our shareholders. The report is not authorized for distribution to prospective investors unless preceded or accompanied by an effective prospectus. | |
| | | |
©2019 American Century Proprietary Holdings, Inc. All rights reserved.
CL-ANN-92268 1905 | |
|
| |
| | |
| | Annual Report |
| | |
| | March 31, 2019 |
| | |
| | Large Company Value Fund |
| | Investor Class (ALVIX) |
| | I Class (ALVSX) |
| | A Class (ALPAX) |
| | C Class (ALPCX) |
| | R Class (ALVRX) |
| | R5 Class (ALVGX) |
| | R6 Class (ALVDX) |
Beginning on January 1, 2021, as permitted by regulations adopted by the Securities and Exchange Commission, paper copies of the fund’s shareholder reports like this one will no longer be sent by mail, unless you specifically request paper copies of the reports from the fund or from your financial intermediary, such as a broker-dealer or bank. Instead, the reports will be made available on a website, and you will be notified by mail each time a report is posted and provided with a website link to access the report.
If you already elected to receive shareholder reports electronically, you will not be affected by this change and you need not take any action. You may elect to receive shareholder reports and other communications from the fund or your financial intermediary electronically by calling or sending an email request to your appropriate contacts as listed on the back cover of this report.
You may elect to receive all future reports in paper free of charge. You can inform the fund or your financial intermediary that you wish to continue receiving paper copies of your shareholder reports by calling or sending an email request to your appropriate contacts as listed on the back cover of this report. Your election to receive reports in paper will apply to all funds held with the fund complex/your financial intermediary.
|
| |
| President’s Letter | 2 |
| Performance | 3 |
| Portfolio Commentary | |
| Fund Characteristics | |
| Shareholder Fee Example | |
| Schedule of Investments | |
| Statement of Assets and Liabilities | |
| Statement of Operations | |
| Statement of Changes in Net Assets | |
| Notes to Financial Statements | |
| Financial Highlights | |
| Report of Independent Registered Public Accounting Firm | |
| Management | |
| Additional Information | |
Any opinions expressed in this report reflect those of the author as of the date of the report, and do not necessarily represent the opinions of American Century Investments® or any other person in the American Century Investments organization. Any such opinions are subject to change at any time based upon market or other conditions and American Century Investments disclaims any responsibility to update such opinions. These opinions may not be relied upon as investment advice and, because investment decisions made by American Century Investments funds are based on numerous factors, may not be relied upon as an indication of trading intent on behalf of any American Century Investments fund. Security examples are used for representational purposes only and are not intended as recommendations to purchase or sell securities. Performance information for comparative indices and securities is provided to American Century Investments by third party vendors. To the best of American Century Investments’ knowledge, such information is accurate at the time of printing.
Jonathan Thomas
Dear Investor:
Thank you for reviewing this annual report for the period ended March 31, 2019. Annual reports help convey important information about fund returns, including market factors that affected performance during the reporting period. For additional, updated investment and market insights, we encourage you to visit our website, americancentury.com.
Markets Ended Roller-Coaster Period on Upswing
For the first half of the period, U.S. stocks climbed higher, while bond returns headed lower. Robust economic growth, bolstered by federal tax and regulatory reform, and record corporate earnings results fueled risk-on sentiment that drove stock prices higher. Meanwhile, the combination of strong economic data, the Federal Reserve’s (Fed’s) ongoing rate-hike campaign and an uptick in inflation pushed investment-grade bond returns lower.
Market trends began changing in late 2018. Mounting investor concerns about slowing global economic and earnings growth, U.S.-China trade tensions and rising interest rates triggered widespread volatility. Stock prices plunged as investors sought safe-haven investments, including U.S. Treasuries. Furthermore, the Fed issued another rate hike in December, its fourth of the year, and maintained its hawkish outlook. Investors feared the December rate increase and the Fed’s plans for two more rate hikes in 2019 were too aggressive, and risk-off investing remained in favor.
January brought a renewed sense of stability to the markets. Investors’ concerns about growth and trade eased, and the Fed changed course, pausing its rate-hike campaign amid moderating global growth and inflation. Valuations appeared attractive after the late-2018 sell-off, and risk-on investing resumed. In March, the Fed held rates steady again, hinting additional tightening was off the table for 2019. This news drove stock and bond returns higher and left both asset classes on an upward track to end the period. Overall, stocks (S&P 500 Index) overcame their late-2018 nosedive to gain 9.50% for the period. Bonds (Bloomberg Barclays U.S. Aggregate Bond Index) bounced back from losses early in the period to return 4.48%.
We expect volatility to remain a formidable factor as investors react to global growth trends, central bank policy and geopolitical developments. We believe this scenario underscores the importance of using professionally managed portfolios in pursuit of investment goals. We appreciate your continued trust and confidence in us.
Sincerely,
Jonathan Thomas
President and Chief Executive Officer
American Century Investments
|
| | | | | | |
| Total Returns as of March 31, 2019 |
| | | | Average Annual Returns | |
| | Ticker Symbol | 1 year | 5 years | 10 years | Since Inception | Inception Date |
| Investor Class | ALVIX | 6.20% | 6.94% | 13.25% | — | 7/30/99 |
| Russell 1000 Value Index | — | 5.67% | 7.72% | 14.51% | — | — |
| S&P 500 Index | — | 9.50% | 10.90% | 15.91% | — | — |
| I Class | ALVSX | 6.41% | 7.15% | 13.49% | — | 8/10/01 |
| A Class | ALPAX | | | |
| 10/26/00 |
| No sales charge | | 5.94% | 6.68% | 12.97% | — | |
| With sales charge | | -0.15% | 5.41% | 12.31% | — | |
| C Class | ALPCX | 5.15% | 5.89% | 12.13% | — | 11/7/01 |
| R Class | ALVRX | 5.67% | 6.43% | 12.69% | — | 8/29/03 |
| R5 Class | ALVGX | 6.40% | — | — | 5.29% | 4/10/17 |
| R6 Class | ALVDX | 6.57% | 7.31% | — | 8.19% | 7/26/13 |
Average annual returns since inception are presented when ten years of performance history is not available.
Sales charges include initial sales charges and contingent deferred sales charges (CDSCs), as applicable. A Class shares have a 5.75% maximum initial sales charge and may be subject to a maximum CDSC of 1.00%. C Class shares redeemed within 12 months of purchase are subject to a maximum CDSC of 1.00%. The SEC requires that mutual funds provide performance information net of maximum sales charges in all cases where charges could be applied.
Data presented reflect past performance. Past performance is no guarantee of future results. Current performance may be higher or lower than the performance shown. Total returns for periods less than one year are not annualized. Investment return and principal value will fluctuate, and redemption value may be more or less than original cost. Data assumes reinvestment of dividends and capital gains, and none of the charts reflect the deduction of taxes that a shareholder would pay on fund distributions or the redemption of fund shares. To obtain performance data current to the most recent month end, please call 1-800-345-2021 or visit americancentury.com. For additional information about the fund, please consult the prospectus.
|
|
| Growth of $10,000 Over 10 Years |
| $10,000 investment made March 31, 2009 |
Performance for other share classes will vary due to differences in fee structure.

|
| |
| Value on March 31, 2019 |
| | Investor Class — $34,724 |
| |
| | Russell 1000 Value Index — $38,803 |
| |
| | S&P 500 Index — $43,809 |
| |
|
| | | | | | |
| Total Annual Fund Operating Expenses |
| Investor Class | I Class | A Class | C Class | R Class | R5 Class | R6 Class |
| 0.84% | 0.64% | 1.09% | 1.84% | 1.34% | 0.64% | 0.49% |
The total annual fund operating expenses shown is as stated in the fund’s prospectus current as of the date of this report. The prospectus may vary from the expense ratio shown elsewhere in this report because it is based on a different time period, includes acquired fund fees and expenses, and, if applicable, does not include fee waivers or expense reimbursements.
Data presented reflect past performance. Past performance is no guarantee of future results. Current performance may be higher or lower than the performance shown. Total returns for periods less than one year are not annualized. Investment return and principal value will fluctuate, and redemption value may be more or less than original cost. Data assumes reinvestment of dividends and capital gains, and none of the charts reflect the deduction of taxes that a shareholder would pay on fund distributions or the redemption of fund shares. To obtain performance data current to the most recent month end, please call 1-800-345-2021 or visit americancentury.com. For additional information about the fund, please consult the prospectus.
Portfolio Managers: Brian Woglom and Phil Davidson
Effective April 2019, portfolio manager Phil Sundell will join the fund's management team.
Performance Summary
Large Company Value returned 6.20%* for the 12-month period ended March 31, 2019. The fund’s benchmark, the Russell 1000 Value Index, returned 5.67%. The fund’s return reflects operating expenses, while the index’s return does not.
The fund’s holdings in the consumer staples, health care and consumer discretionary sectors were among the key drivers of relative performance. The fund’s overweight to the health care sector was also beneficial. On the other hand, stock selection in energy, underweights to the real estate and utilities sectors and holdings in the materials and financials sectors detracted from relative results.
Consumer Staples, Health Care and Consumer Discretionary Contributed
Holdings in the consumer staples sector positively impacted relative performance, including Procter & Gamble. This large consumer packaged goods company posted its highest organic growth rate in nearly five years, benefiting from recent investments in product enhancements and product pricing. Importantly, Procter & Gamble is stabilizing and improving market share in many key products.
Our portfolio’s overweight in health care aided performance. Additionally, several of our health care holdings outperformed during the trailing 12-month period, including pharmaceutical companies Merck & Co. and Pfizer. Merck outperformed after it reported solid financial results, raised its dividend and announced a share buyback. Also, competitor AstraZeneca announced a lung cancer trial failure, which cemented Merck’s dominance in the lung cancer space with its drug, Keytruda. Pfizer’s stock was supported by solid data on Tafamidis, its cardiomyopathy drug, and by its generally strong drug pipeline.
Consumer discretionary holding Advance Auto Parts was another top individual contributor. This retailer of aftermarket replacement parts is a market share leader in a higher-quality industry. Extreme winter storms in the Northeastern U.S. helped drive better-than-expected results for the company. Advance Auto Parts also raised its full-year guidance due to margin improvement and stronger-than-expected same-store sales trends. This indicated to investors that the company’s turnaround plan is starting to show signs of effectiveness.
While overall stock selection in the energy sector weighed on performance, Occidental Petroleum was a notable contributor. The stock of this large integrated energy company appreciated meaningfully as its management team executed on its plans to restore profitability to Occidental’s upstream business. We exited the position on strength in the stock price.
Energy, Real Estate, Materials and Utilities Detracted
A few of our energy holdings were key detractors from relative performance, including Schlumberger. The recovery in the oil field services markets has perpetually disappointed investors. In particular, the non-U.S. oil field services markets, a historic stronghold for
*All fund returns referenced in this commentary are for Investor Class shares. Performance for other share classes will vary due to differences in fee structure; when Investor Class performance exceeds that of the fund's benchmark, other share classes may not. See page 3 for returns for all share classes.
Schlumberger, have failed to stage a meaningful recovery. As a result, industry participants have been bidding contracts aggressively in an attempt to maintain operations, which has weighed on the revenue growth and profitability of Schlumberger and its peers. We still think Schlumberger is the best oil field services company, and we continue to hold the stock as of period-end. Noble Energy was another detractor. Its stock fell significantly during the second half of 2018 as lower commodity prices weighed on the free cash flow and return on invested capital potential of the business.
Our underweights to the real estate and utilities sectors also negatively impacted relative results. These underweights were the result of our bottom-up investment approach; our metrics indicated that many stocks in these sectors remained overvalued throughout the trailing 12-month period. Despite these generally inflated valuations, investors favored the more defensive utilities sector as the market declined in the fourth quarter of 2018. Furthermore, a decline in interest rates in the first quarter of 2019 helped propel stocks in the real estate sector.
Within the materials sector, our position in WestRock, a paper and packaging company, weighed on the fund’s performance. The stock underperformed due to worries that containerboard pricing and demand have peaked. Also, the company’s decision to acquire a smaller competitor raised concerns about the company’s debt load.
Furthermore, asset manager Invesco was a top detractor from performance. Invesco underperformed due to weaker equity markets in 2018, an acceleration of net outflows and on news of its expensive acquisition of OppenheimerFunds.
Portfolio Positioning
The portfolio seeks to invest in companies where we believe the valuation does not reflect the quality and normal earnings power of the company. Our process is based on individual security selection, but broad themes have emerged.
As of March 31, 2019, our portfolio is overweight to the health care and consumer staples sectors. According to our analysis, the portfolio’s health care holdings offer compelling valuations and
risk/reward profiles, particularly in the pharmaceuticals and health care equipment and supplies industries. The consumer staples sector is comprised of companies with diverging strategies and fundamental outlooks. We believe we have identified some of the more diversified, stronger companies with better balance sheets to help navigate a tougher competitive environment.
Conversely, the portfolio is underweight in communication services and real estate. As of
period-end, our only position in the communication services sector is Verizon Communications. We believe Verizon offers relative stability and balance sheet strength. Our analysis shows that many other communication services stocks have volatile business models and higher levels of leverage. Additionally, because it has been difficult for us to find higher-quality real estate stocks selling at attractive valuations, Weyerhaeuser is our only real estate holding as of the end of the reporting period.
|
| |
| MARCH 31, 2019 |
| Top Ten Holdings | % of net assets |
| Johnson & Johnson | 3.7% |
| JPMorgan Chase & Co. | 3.6% |
| Medtronic plc | 3.3% |
| U.S. Bancorp | 3.2% |
| Verizon Communications, Inc. | 3.1% |
| TOTAL SA ADR | 3.0% |
| Chevron Corp. | 2.8% |
| iShares Russell 1000 Value ETF | 2.8% |
| Intel Corp. | 2.7% |
| Pfizer, Inc. | 2.6% |
| | |
| Top Five Industries | % of net assets |
| Banks | 13.9% |
| Pharmaceuticals | 8.6% |
| Oil, Gas and Consumable Fuels | 8.2% |
| Health Care Equipment and Supplies | 6.5% |
| Capital Markets | 4.8% |
| | |
| Types of Investments in Portfolio | % of net assets |
| Domestic Common Stocks | 86.5% |
| Foreign Common Stocks* | 7.8% |
| Exchange-Traded Funds | 2.8% |
| Total Equity Exposure | 97.1% |
| Temporary Cash Investments | 2.6% |
| Other Assets and Liabilities | 0.3% |
*Includes depositary shares, dual listed securities and foreign ordinary shares.
Fund shareholders may incur two types of costs: (1) transaction costs, including sales charges (loads) on purchase payments and redemption/exchange fees; and (2) ongoing costs, including management fees; distribution and service (12b-1) fees; and other fund expenses. This example is intended to help you understand your ongoing costs (in dollars) of investing in your fund and to compare these costs with the ongoing cost of investing in other mutual funds.
The example is based on an investment of $1,000 made at the beginning of the period and held for the entire period from October 1, 2018 to March 31, 2019.
Actual Expenses
The table provides information about actual account values and actual expenses for each class. You may use the information, together with the amount you invested, to estimate the expenses that you paid over the period. First, identify the share class you own. Then simply divide your account value by $1,000 (for example, an $8,600 account value divided by $1,000 = 8.6), then multiply the result by the number under the heading “Expenses Paid During Period” to estimate the expenses you paid on your account during this period.
If you hold Investor Class shares of any American Century Investments fund, or I Class shares of the American Century Diversified Bond Fund, in an American Century Investments account (i.e., not a financial intermediary or retirement plan account), American Century Investments may charge you a $12.50 semiannual account maintenance fee if the value of those shares is less than $10,000. We will redeem shares automatically in one of your accounts to pay the $12.50 fee. In determining your total eligible investment amount, we will include your investments in all personal accounts (including American Century Investments Brokerage accounts) registered under your Social Security number. Personal accounts include individual accounts, joint accounts, UGMA/UTMA accounts, personal trusts, Coverdell Education Savings Accounts and IRAs (including traditional, Roth, Rollover, SEP-, SARSEP- and SIMPLE-IRAs), and certain other retirement accounts. If you have only business, business retirement, employer-sponsored or American Century Investments Brokerage accounts, you are currently not subject to this fee. If you are subject to the Account Maintenance Fee, your account value could be reduced by the fee amount.
Hypothetical Example for Comparison Purposes
The table also provides information about hypothetical account values and hypothetical expenses based on the actual expense ratio of each class of your fund and an assumed rate of return of 5% per year before expenses, which is not the actual return of a fund’s share class. The hypothetical account values and expenses may not be used to estimate the actual ending account balance or expenses you paid for the period. You may use this information to compare the ongoing costs of investing in your fund and other funds. To do so, compare this 5% hypothetical example with the 5% hypothetical examples that appear in the shareholder reports of the other funds.
Please note that the expenses shown in the table are meant to highlight your ongoing costs only and do not reflect any transactional costs, such as sales charges (loads) or redemption/exchange fees. Therefore, the table is useful in comparing ongoing costs only, and will not help you determine the relative total costs of owning different funds. In addition, if these transactional costs were included, your costs would have been higher.
|
| | | | |
| | Beginning
Account Value
10/1/18 | Ending
Account Value
3/31/19 | Expenses Paid
During Period(1)
10/1/18 - 3/31/19 |
Annualized
Expense Ratio(1) |
| Actual | | | | |
| Investor Class | $1,000 | $987.20 | $4.11 | 0.83% |
| I Class | $1,000 | $988.30 | $3.12 | 0.63% |
| A Class | $1,000 | $986.00 | $5.35 | 1.08% |
| C Class | $1,000 | $982.40 | $9.04 | 1.83% |
| R Class | $1,000 | $984.80 | $6.58 | 1.33% |
| R5 Class | $1,000 | $988.30 | $3.12 | 0.63% |
| R6 Class | $1,000 | $989.00 | $2.38 | 0.48% |
| Hypothetical | | | | |
| Investor Class | $1,000 | $1,020.79 | $4.18 | 0.83% |
| I Class | $1,000 | $1,021.79 | $3.18 | 0.63% |
| A Class | $1,000 | $1,019.55 | $5.44 | 1.08% |
| C Class | $1,000 | $1,015.81 | $9.20 | 1.83% |
| R Class | $1,000 | $1,018.30 | $6.69 | 1.33% |
| R5 Class | $1,000 | $1,021.79 | $3.18 | 0.63% |
| R6 Class | $1,000 | $1,022.54 | $2.42 | 0.48% |
| |
| (1) | Expenses are equal to the class's annualized expense ratio listed in the table above, multiplied by the average account value over the period, multiplied by 182, the number of days in the most recent fiscal half-year, divided by 365, to reflect the one-half year period. Annualized expense ratio reflects actual expenses, including any applicable fee waivers or expense reimbursements and excluding any acquired fund fees and expenses. |
MARCH 31, 2019
|
| | | | | |
| | Shares | Value |
| COMMON STOCKS — 94.3% | | |
| Air Freight and Logistics — 1.0% | | |
| United Parcel Service, Inc., Class B | 78,700 |
| $ | 8,793,938 |
|
| Airlines — 1.2% | | |
| Southwest Airlines Co. | 198,200 |
| 10,288,562 |
|
| Auto Components — 0.7% | | |
| BorgWarner, Inc. | 170,900 |
| 6,564,269 |
|
| Automobiles — 1.0% | | |
| Honda Motor Co. Ltd. ADR | 313,700 |
| 8,523,229 |
|
| Banks — 13.9% | | |
| Bank of America Corp. | 372,100 |
| 10,266,239 |
|
| BB&T Corp. | 469,300 |
| 21,836,529 |
|
| JPMorgan Chase & Co. | 310,900 |
| 31,472,407 |
|
| PNC Financial Services Group, Inc. (The) | 169,000 |
| 20,729,540 |
|
| U.S. Bancorp | 579,300 |
| 27,916,467 |
|
| Wells Fargo & Co. | 219,100 |
| 10,586,912 |
|
| | | 122,808,094 |
|
| Beverages — 1.3% | | |
| PepsiCo, Inc. | 95,800 |
| 11,740,290 |
|
| Building Products — 1.3% | | |
| Johnson Controls International plc | 317,300 |
| 11,721,062 |
|
| Capital Markets — 4.8% | | |
| Ameriprise Financial, Inc. | 102,300 |
| 13,104,630 |
|
| Bank of New York Mellon Corp. (The) | 367,500 |
| 18,533,025 |
|
| Invesco Ltd. | 561,900 |
| 10,850,289 |
|
| | | 42,487,944 |
|
| Chemicals — 0.8% | | |
Dow, Inc.(1)(2) | 8,001 |
| 413,075 |
|
| DowDuPont, Inc. | 188,100 |
| 6,784,767 |
|
| | | 7,197,842 |
|
| Communications Equipment — 1.5% | | |
| Cisco Systems, Inc. | 244,500 |
| 13,200,555 |
|
| Containers and Packaging — 0.7% | | |
| WestRock Co. | 167,100 |
| 6,408,285 |
|
| Diversified Telecommunication Services — 3.1% | | |
| Verizon Communications, Inc. | 463,200 |
| 27,389,016 |
|
| Electric Utilities — 3.9% | | |
| Eversource Energy | 163,000 |
| 11,564,850 |
|
| Pinnacle West Capital Corp. | 96,900 |
| 9,261,702 |
|
| Xcel Energy, Inc. | 250,900 |
| 14,103,089 |
|
| | | 34,929,641 |
|
| Electrical Equipment — 1.9% | | |
| Eaton Corp. plc | 114,100 |
| 9,191,896 |
|
|
| | | | | |
| | Shares | Value |
| Emerson Electric Co. | 115,900 |
| $ | 7,935,673 |
|
| | | 17,127,569 |
|
| Electronic Equipment, Instruments and Components — 1.3% | | |
| TE Connectivity Ltd. | 141,000 |
| 11,385,750 |
|
| Energy Equipment and Services — 2.9% | | |
| Baker Hughes a GE Co. | 316,500 |
| 8,773,380 |
|
| Schlumberger Ltd. | 396,800 |
| 17,288,576 |
|
| | | 26,061,956 |
|
| Equity Real Estate Investment Trusts (REITs) — 1.4% | | |
| Weyerhaeuser Co. | 484,800 |
| 12,769,632 |
|
| Food and Staples Retailing — 1.5% | | |
| Sysco Corp. | 101,300 |
| 6,762,788 |
|
| Walmart, Inc. | 62,500 |
| 6,095,625 |
|
| | | 12,858,413 |
|
| Food Products — 3.2% | | |
| Conagra Brands, Inc. | 240,300 |
| 6,665,922 |
|
| Kellogg Co. | 70,900 |
| 4,068,242 |
|
| Mondelez International, Inc., Class A | 359,900 |
| 17,966,208 |
|
| | | 28,700,372 |
|
| Health Care Equipment and Supplies — 6.5% | | |
Hologic, Inc.(2) | 151,400 |
| 7,327,760 |
|
| Medtronic plc | 323,800 |
| 29,491,704 |
|
| Zimmer Biomet Holdings, Inc. | 163,800 |
| 20,917,260 |
|
| | | 57,736,724 |
|
| Health Care Providers and Services — 2.2% | | |
| McKesson Corp. | 64,500 |
| 7,550,370 |
|
| Quest Diagnostics, Inc. | 132,300 |
| 11,896,416 |
|
| | | 19,446,786 |
|
| Health Care Technology — 1.1% | | |
Cerner Corp.(2) | 170,800 |
| 9,771,468 |
|
| Hotels, Restaurants and Leisure — 0.6% | | |
| Carnival Corp. | 104,400 |
| 5,295,168 |
|
| Household Durables — 0.5% | | |
| PulteGroup, Inc. | 160,800 |
| 4,495,968 |
|
| Household Products — 3.7% | | |
| Colgate-Palmolive Co. | 140,800 |
| 9,650,432 |
|
| Procter & Gamble Co. (The) | 217,500 |
| 22,630,875 |
|
| | | 32,281,307 |
|
| Industrial Conglomerates — 1.1% | | |
| Siemens AG | 89,900 |
| 9,675,103 |
|
| Insurance — 3.5% | | |
| Aflac, Inc. | 185,100 |
| 9,255,000 |
|
| Chubb Ltd. | 155,400 |
| 21,768,432 |
|
| | | 31,023,432 |
|
| Machinery — 2.7% | | |
| Atlas Copco AB, B Shares | 498,900 |
| 12,347,336 |
|
|
| | | | | |
| | Shares | Value |
| Cummins, Inc. | 70,800 |
| $ | 11,177,196 |
|
| | | 23,524,532 |
|
| Multiline Retail — 0.5% | | |
| Target Corp. | 56,100 |
| 4,502,586 |
|
| Oil, Gas and Consumable Fuels — 8.2% | | |
| Anadarko Petroleum Corp. | 114,900 |
| 5,225,652 |
|
| Chevron Corp. | 200,500 |
| 24,697,590 |
|
| EQT Corp. | 166,000 |
| 3,442,840 |
|
Equitrans Midstream Corp.(2) | 132,800 |
| 2,892,384 |
|
| Noble Energy, Inc. | 172,600 |
| 4,268,398 |
|
| Royal Dutch Shell plc, Class B ADR | 88,900 |
| 5,685,155 |
|
| TOTAL SA ADR | 472,000 |
| 26,266,800 |
|
| | | 72,478,819 |
|
| Personal Products — 0.7% | | |
| Unilever NV CVA | 102,000 |
| 5,924,592 |
|
| Pharmaceuticals — 8.6% | | |
| Allergan plc | 46,500 |
| 6,808,065 |
|
| Johnson & Johnson | 233,700 |
| 32,668,923 |
|
| Merck & Co., Inc. | 159,200 |
| 13,240,664 |
|
| Pfizer, Inc. | 541,600 |
| 23,001,752 |
|
| | | 75,719,404 |
|
| Road and Rail — 0.5% | | |
| Union Pacific Corp. | 27,900 |
| 4,664,880 |
|
| Semiconductors and Semiconductor Equipment — 3.7% | | |
| Applied Materials, Inc. | 217,100 |
| 8,610,186 |
|
| Intel Corp. | 443,200 |
| 23,799,840 |
|
| | | 32,410,026 |
|
| Software — 1.5% | | |
| Oracle Corp. (New York) | 243,700 |
| 13,089,127 |
|
| Specialty Retail — 0.9% | | |
| Advance Auto Parts, Inc. | 47,300 |
| 8,066,069 |
|
| Technology Hardware, Storage and Peripherals — 0.4% | | |
| Apple, Inc. | 20,600 |
| 3,912,970 |
|
TOTAL COMMON STOCKS
(Cost $734,967,125) | | 834,975,380 |
|
| EXCHANGE-TRADED FUNDS — 2.8% | | |
iShares Russell 1000 Value ETF
(Cost $23,797,838) | 199,400 |
| 24,623,906 |
|
| TEMPORARY CASH INVESTMENTS — 2.6% | | |
| Repurchase Agreement, BMO Capital Markets Corp., (collateralized by various U.S. Treasury obligations, 0.125% - 2.875%, 9/30/19 - 2/15/44, valued at $20,165,513), in a joint trading account at 2.35%, dated 3/29/19, due 4/1/19 (Delivery value $19,766,546) | | 19,762,676 |
|
| Repurchase Agreement, Fixed Income Clearing Corp., (collateralized by various U.S. Treasury obligations, 2.875%, 10/31/23, valued at $3,372,140), at 1.25%, dated 3/29/19, due 4/1/19 (Delivery value $3,303,344) | | 3,303,000 |
|
|
| | | | | |
| | Shares | Value |
| State Street Institutional U.S. Government Money Market Fund, Premier Class | 10,771 |
| $ | 10,771 |
|
TOTAL TEMPORARY CASH INVESTMENTS
(Cost $23,076,447) | | 23,076,447 |
|
TOTAL INVESTMENT SECURITIES — 99.7%
(Cost $781,841,410) | | 882,675,733 |
|
| OTHER ASSETS AND LIABILITIES — 0.3% | | 2,779,938 |
|
| TOTAL NET ASSETS — 100.0% | | $ | 885,455,671 |
|
|
| | | | | | | | | | |
| FORWARD FOREIGN CURRENCY EXCHANGE CONTRACTS |
| Currency Purchased | Currency Sold | Counterparty | Settlement Date | Unrealized Appreciation
(Depreciation) |
| EUR | 745,492 |
| USD | 847,802 |
| Credit Suisse AG | 6/28/19 | $ | (5,386 | ) |
| USD | 36,110,260 |
| EUR | 31,650,124 |
| Credit Suisse AG | 6/28/19 | 345,200 |
|
| USD | 4,862,539 |
| GBP | 3,668,321 |
| JPMorgan Chase Bank N.A. | 6/28/19 | 64,024 |
|
| JPY | 22,652,609 |
| USD | 206,533 |
| Bank of America N.A. | 6/28/19 | (749 | ) |
| USD | 7,701,244 |
| JPY | 841,757,539 |
| Bank of America N.A. | 6/28/19 | 54,427 |
|
| SEK | 2,732,868 |
| USD | 296,195 |
| Goldman Sachs & Co. | 6/28/19 | (330 | ) |
| USD | 10,230,545 |
| SEK | 93,812,052 |
| Goldman Sachs & Co. | 6/28/19 | 74,300 |
|
| | | | | | | $ | 531,486 |
|
|
| | |
| NOTES TO SCHEDULE OF INVESTMENTS |
| ADR | - | American Depositary Receipt |
| CVA | - | Certificaten Van Aandelen |
| EUR | - | Euro |
| GBP | - | British Pound |
| JPY | - | Japanese Yen |
| SEK | - | Swedish Krona |
| USD | - | United States Dollar |
| |
| (1) | When-issued security. The issue price and yield are fixed on the date of the commitment, but payment and delivery are scheduled for a future date. |
See Notes to Financial Statements.
|
| | | | |
| Statement of Assets and Liabilities |
|
| | | |
| MARCH 31, 2019 | |
| Assets | |
| Investment securities, at value (cost of $781,841,410) | $ | 882,675,733 |
|
| Receivable for investments sold | 5,941,973 |
|
| Receivable for capital shares sold | 307,601 |
|
| Unrealized appreciation on forward foreign currency exchange contracts | 537,951 |
|
| Dividends and interest receivable | 1,589,431 |
|
| | 891,052,689 |
|
| | |
| Liabilities | |
| Payable for investments purchased | 4,767,195 |
|
| Payable for capital shares redeemed | 240,950 |
|
| Unrealized depreciation on forward foreign currency exchange contracts | 6,465 |
|
| Accrued management fees | 570,731 |
|
| Distribution and service fees payable | 11,677 |
|
| | 5,597,018 |
|
| | |
| Net Assets | $ | 885,455,671 |
|
| | |
| Net Assets Consist of: | |
| Capital (par value and paid-in surplus) | $ | 805,573,125 |
|
| Distributable earnings | 79,882,546 |
|
| | $ | 885,455,671 |
|
|
| | | | | | |
| | Net Assets | Shares Outstanding | Net Asset Value Per Share |
| Investor Class, $0.01 Par Value |
| $673,364,977 |
| 68,343,963 |
| $9.85 |
| I Class, $0.01 Par Value |
| $18,195,641 |
| 1,845,785 |
| $9.86 |
| A Class, $0.01 Par Value |
| $34,602,836 |
| 3,513,884 |
| $9.85* |
| C Class, $0.01 Par Value |
| $3,363,485 |
| 341,627 |
| $9.85 |
| R Class, $0.01 Par Value |
| $3,388,740 |
| 343,773 |
| $9.86 |
| R5 Class, $0.01 Par Value |
| $5,534 |
| 561 |
| $9.86 |
| R6 Class, $0.01 Par Value |
| $152,534,458 |
| 15,476,043 |
| $9.86 |
*Maximum offering price $10.45 (net asset value divided by 0.9425).
See Notes to Financial Statements.
|
| | | |
| YEAR ENDED MARCH 31, 2019 | |
| Investment Income (Loss) | |
| Income: | |
| Dividends (net of foreign taxes withheld of $272,463) | $ | 21,928,871 |
|
| Interest | 318,793 |
|
| | 22,247,664 |
|
| | |
| Expenses: | |
| Management fees | 6,406,176 |
|
| Distribution and service fees: | |
| A Class | 95,724 |
|
| C Class | 41,917 |
|
| R Class | 19,628 |
|
| Directors' fees and expenses | 22,984 |
|
| Other expenses | 17,756 |
|
| | 6,604,185 |
|
| | |
| Net investment income (loss) | 15,643,479 |
|
| | |
| Realized and Unrealized Gain (Loss) | |
| Net realized gain (loss) on: | |
| Investment transactions | 14,900,615 |
|
| Forward foreign currency exchange contract transactions | 5,787,544 |
|
| Foreign currency translation transactions | (14,475 | ) |
| | 20,673,684 |
|
| | |
| Change in net unrealized appreciation (depreciation) on: | |
| Investments | 15,823,396 |
|
| Forward foreign currency exchange contracts | 505,567 |
|
| Translation of assets and liabilities in foreign currencies | (2,876 | ) |
| | 16,326,087 |
|
| | |
| Net realized and unrealized gain (loss) | 36,999,771 |
|
| | |
| Net Increase (Decrease) in Net Assets Resulting from Operations | $ | 52,643,250 |
|
See Notes to Financial Statements.
|
| | | | |
| Statement of Changes in Net Assets |
|
| | | | | | |
| YEARS ENDED MARCH 31, 2019 AND MARCH 31, 2018 |
| Increase (Decrease) in Net Assets | March 31, 2019 | March 31, 2018 |
| Operations | | |
| Net investment income (loss) | $ | 15,643,479 |
| $ | 18,340,782 |
|
| Net realized gain (loss) | 20,673,684 |
| 23,064,070 |
|
| Change in net unrealized appreciation (depreciation) | 16,326,087 |
| (9,255,174 | ) |
| Net increase (decrease) in net assets resulting from operations | 52,643,250 |
| 32,149,678 |
|
| | | |
| Distributions to Shareholders | | |
From earnings:(1) | | |
| Investor Class | (37,495,148 | ) | (35,690,399 | ) |
| I Class | (1,124,543 | ) | (1,201,355 | ) |
| A Class | (2,062,133 | ) | (2,346,564 | ) |
| C Class | (162,466 | ) | (292,840 | ) |
| R Class | (185,656 | ) | (261,741 | ) |
| R5 Class | (321 | ) | (302 | ) |
| R6 Class | (8,415,889 | ) | (7,427,977 | ) |
| Decrease in net assets from distributions | (49,446,156 | ) | (47,221,178 | ) |
| | | |
| Capital Share Transactions | | |
| Net increase (decrease) in net assets from capital share transactions (Note 5) | 67,697,947 |
| (73,728,534 | ) |
| | | |
| Net increase (decrease) in net assets | 70,895,041 |
| (88,800,034 | ) |
| | | |
| Net Assets | | |
| Beginning of period | 814,560,630 |
| 903,360,664 |
|
| End of period | $ | 885,455,671 |
| $ | 814,560,630 |
|
| |
| (1) | Prior period presentation has been updated to reflect the current period combination of distributions to shareholders from net investment income and net realized gains. Distributions from net investment income were $(12,587,826), $(421,278), $(754,663), $(59,283), $(71,995), $(111) and $(2,988,543) for Investor Class, I Class, A Class, C Class, R Class, R5 Class and R6 Class, respectively. Distributions from net realized gains were $(23,102,573), $(780,077), $(1,591,901), $(233,557), $(189,746), $(191), and $(4,439,434) for Investor Class, I Class, A Class, C Class, R Class, R5 Class and R6 Class, respectively. |
See Notes to Financial Statements.
|
|
| Notes to Financial Statements |
MARCH 31, 2019
1. Organization
American Century Capital Portfolios, Inc. (the corporation) is registered under the Investment Company Act of 1940, as amended (the 1940 Act), as an open-end management investment company and is organized as a Maryland corporation. Large Company Value Fund (the fund) is one fund in a series issued by the corporation. The fund’s investment objective is to seek long-term capital growth. Income is a secondary objective.
The fund offers the Investor Class, I Class, A Class, C Class, R Class, R5 Class and R6 Class. The A Class may incur an initial sales charge. The A Class and C Class may be subject to a contingent deferred sales charge. Sale of the R5 Class commenced on April 10, 2017.
2. Significant Accounting Policies
The following is a summary of significant accounting policies consistently followed by the fund in preparation of its financial statements. The fund is an investment company and follows accounting and reporting guidance in accordance with accounting principles generally accepted in the United States of America. This may require management to make certain estimates and assumptions at the date of the financial statements. Actual results could differ from these estimates. Management evaluated the impact of events or transactions occurring through the date the financial statements were issued that would merit recognition or disclosure.
Investment Valuations — The fund determines the fair value of its investments and computes its net asset value per share at the close of regular trading (usually 4 p.m. Eastern time) on the New York Stock Exchange (NYSE) on each day the NYSE is open. The Board of Directors has adopted valuation policies and procedures to guide the investment advisor in the fund’s investment valuation process and to provide methodologies for the oversight of the fund’s pricing function.
Equity securities that are listed or traded on a domestic securities exchange are valued at the last reported sales price or at the official closing price as provided by the exchange. Equity securities traded on foreign securities exchanges are generally valued at the closing price of such securities on the exchange where primarily traded or at the close of the NYSE, if that is earlier. If no last sales price is reported, or if local convention or regulation so provides, the mean of the latest bid and asked prices may be used. Securities traded over-the-counter are valued at the mean of the latest bid and asked prices, the last sales price, or the official closing price. Equity securities initially expressed in local currencies are translated into U.S. dollars at the mean of the appropriate currency exchange rate at the close of the NYSE as provided by an independent pricing service.
Open-end management investment companies are valued at the reported net asset value per share. Repurchase agreements are valued at cost, which approximates fair value. Forward foreign currency exchange contracts are valued at the mean of the appropriate forward exchange rate at the close of the NYSE as provided by an independent pricing service.
If the fund determines that the market price for an investment is not readily available or the valuation methods mentioned above do not reflect an investment’s fair value, such investment is valued as determined in good faith by the Board of Directors or its delegate, in accordance with policies and procedures adopted by the Board of Directors. In its determination of fair value, the fund may review several factors including, but not limited to, market information regarding the specific investment or comparable investments and correlation with other investment types, futures indices or general market indicators. Circumstances that may cause the fund to use these procedures to value an investment include, but are not limited to: an investment has been declared in default or is distressed; trading in a security has been suspended during the trading day or a security is not actively trading on its principal exchange; prices received from a regular pricing source are deemed unreliable; or there is a foreign market holiday and no trading occurred.
The fund monitors for significant events occurring after the close of an investment’s primary exchange but before the fund’s net asset value per share is determined. Significant events may include, but are not limited to: corporate announcements and transactions; governmental action and political unrest that could impact a specific investment or an investment sector; or armed conflicts, natural disasters and similar events that could affect investments in a specific country or region. The fund also monitors for significant fluctuations between
domestic and foreign markets, as evidenced by the U.S. market or such other indicators that the Board of Directors, or its delegate, deems appropriate. If significant fluctuations in foreign markets are identified, the fund may apply a model-derived factor to the closing price of equity securities traded on foreign securities exchanges. The factor is based on observable market data as provided by an independent pricing service.
Security Transactions — Security transactions are accounted for as of the trade date. Net realized gains and losses are determined on the identified cost basis, which is also used for federal income tax purposes.
Investment Income — Dividend income less foreign taxes withheld, if any, is recorded as of the ex-dividend date. Distributions received on securities that represent a return of capital or long-term capital gain are recorded as a reduction of cost of investments and/or as a realized gain. The fund may estimate the components of distributions received that may be considered nontaxable distributions or long-term capital gain distributions for income tax purposes. Interest income is recorded on the accrual basis and includes accretion of discounts and amortization of premiums.
Foreign Currency Translations — All assets and liabilities initially expressed in foreign currencies are translated into U.S. dollars at prevailing exchange rates at period end. The fund may enter into spot foreign currency exchange contracts to facilitate transactions denominated in a foreign currency. Purchases and sales of investment securities, dividend and interest income, spot foreign currency exchange contracts, and expenses are translated at the rates of exchange prevailing on the respective dates of such transactions. Net realized and unrealized foreign currency exchange gains or losses related to investment securities are a component of net realized gain (loss) on investment transactions and change in net unrealized appreciation (depreciation) on investments, respectively.
Repurchase Agreements — The fund may enter into repurchase agreements with institutions that American Century Investment Management, Inc. (ACIM) (the investment advisor) has determined are creditworthy pursuant to criteria adopted by the Board of Directors. The fund requires that the collateral, represented by securities, received in a repurchase transaction be transferred to the custodian in a manner sufficient to enable the fund to obtain those securities in the event of a default under the repurchase agreement. ACIM monitors, on a daily basis, the securities transferred to ensure the value, including accrued interest, of the securities under each repurchase agreement is equal to or greater than amounts owed to the fund under each repurchase agreement.
Joint Trading Account — Pursuant to an Exemptive Order issued by the Securities and Exchange Commission, the fund, along with certain other funds in the American Century Investments family of funds, may transfer uninvested cash balances into a joint trading account. These balances are invested in one or more repurchase agreements that are collateralized by U.S. Treasury or Agency obligations.
Segregated Assets — In accordance with the 1940 Act, the fund segregates assets on its books and records to cover certain types of investment securities and other financial instruments. ACIM monitors, on a daily basis, the securities segregated to ensure the fund designates a sufficient amount of liquid assets, marked-to-market daily. The fund may also receive assets or be required to pledge assets at the custodian bank or with a broker for collateral requirements.
Income Tax Status — It is the fund’s policy to distribute substantially all net investment income and net realized gains to shareholders and to otherwise qualify as a regulated investment company under provisions of the Internal Revenue Code. Accordingly, no provision has been made for income taxes. The fund files U.S. federal, state, local and non-U.S. tax returns as applicable. The fund's tax returns are subject to examination by the relevant taxing authority until expiration of the applicable statute of limitations, which is generally three years from the date of filing but can be longer in certain jurisdictions. At this time, management believes there are no uncertain tax positions which, based on their technical merit, would not be sustained upon examination and for which it is reasonably possible that the total amounts of unrecognized tax benefits will significantly change in the next twelve months.
Multiple Class — All shares of the fund represent an equal pro rata interest in the net assets of the class to which such shares belong, and have identical voting, dividend, liquidation and other rights and the same terms and conditions, except for class specific expenses and exclusive rights to vote on matters affecting only individual classes. Income, non-class specific expenses, and realized and unrealized capital gains and losses of the fund are allocated to each class of shares based on their relative net assets.
Distributions to Shareholders — Distributions from net investment income, if any, are generally declared and paid quarterly. Distributions from net realized gains, if any, are generally declared and paid annually.
Indemnifications — Under the corporation’s organizational documents, its officers and directors are indemnified against certain liabilities arising out of the performance of their duties to the fund. In addition, in the normal course of business, the fund enters into contracts that provide general indemnifications. The maximum exposure under these arrangements is unknown as this would involve future claims that may be made against a fund. The risk of material loss from such claims is considered by management to be remote.
3. Fees and Transactions with Related Parties
Certain officers and directors of the corporation are also officers and/or directors of American Century Companies, Inc. (ACC). The corporation’s investment advisor, ACIM, the corporation's distributor, American Century Investment Services, Inc. (ACIS), and the corporation’s transfer agent, American Century Services, LLC, are wholly owned, directly or indirectly, by ACC. Various funds issued by American Century Asset Allocation Portfolios, Inc. own, in aggregate, 54% of the shares of the fund. Related parties do not invest in the fund for the purpose of exercising management or control.
Management Fees — The corporation has entered into a management agreement with ACIM, under which ACIM provides the fund with investment advisory and management services in exchange for a single, unified management fee (the fee) per class. The agreement provides that all expenses of managing and operating the fund, except distribution and service fees, brokerage expenses, taxes, interest, fees and expenses of the independent directors (including legal counsel fees), and extraordinary expenses, will be paid by ACIM. The fee is computed and accrued daily based on each class's daily net assets and paid monthly in arrears. The difference in the fee among the classes is a result of their separate arrangements for non-Rule 12b-1 shareholder services. It is not the result of any difference in advisory or custodial fees or other expenses related to the management of the fund’s assets, which do not vary by class. The rate of the fee is determined by applying a fee rate calculation formula. This formula takes into account the fund’s assets as well as certain assets, if any, of other clients of the investment advisor outside the American Century Investments family of funds (such as subadvised funds and separate accounts) that use very similar investment teams and strategies (strategy assets). The strategy assets of the fund also include the assets of NT Large Company Value Fund, one fund in a series issued by the corporation.
The management fee schedule range and the effective annual management fee for each class for the period ended March 31, 2019 are as follows:
|
| | |
| | Management Fee Schedule Range | Effective Annual Management Fee |
| Investor Class | 0.70% to 0.90% | 0.83% |
| I Class | 0.50% to 0.70% | 0.63% |
| A Class | 0.70% to 0.90% | 0.83% |
| C Class | 0.70% to 0.90% | 0.83% |
| R Class | 0.70% to 0.90% | 0.83% |
| R5 Class | 0.50% to 0.70% | 0.63% |
| R6 Class | 0.35% to 0.55% | 0.48% |
Distribution and Service Fees — The Board of Directors has adopted a separate Master Distribution and Individual Shareholder Services Plan for each of the A Class, C Class and R Class (collectively the plans), pursuant to Rule 12b-1 of the 1940 Act. The plans provide that the A Class will pay ACIS an annual distribution and service fee of 0.25%. The plans provide that the C Class will pay ACIS an annual distribution and service fee of 1.00%, of which 0.25% is paid for individual shareholder services and 0.75% is paid for distribution services. The plans provide that the R Class will pay ACIS an annual distribution and service fee of 0.50%. The fees are computed and accrued daily based on each class’s daily net assets and paid monthly in arrears. The fees are used to pay financial intermediaries for distribution and individual shareholder services. Fees incurred under the plans during the period ended March 31, 2019 are detailed in the Statement of Operations.
Directors' Fees and Expenses — The Board of Directors is responsible for overseeing the investment advisor’s management and operations of the fund. The directors receive detailed information about the fund and its investment advisor regularly throughout the year, and meet at least quarterly with management of the investment advisor to review reports about fund operations. The fund’s officers do not receive compensation from the fund.
Interfund Transactions — The fund may enter into security transactions with other American Century Investments funds and other client accounts of the investment advisor, in accordance with the 1940 Act rules and procedures adopted by the Board of Directors. The rules and procedures require, among other things, that these transactions be effected at the independent current market price of the security. During the period,
the interfund purchases and sales were $51,488,264 and $7,588,429, respectively. The effect of interfund transactions on the Statement of Operations was $49,926 in net realized gain (loss) on investment transactions.
4. Investment Transactions
Purchases and sales of investment securities, excluding short-term investments, for the period ended March 31, 2019 were $535,297,500 and $504,436,571, respectively.
5. Capital Share Transactions
Transactions in shares of the fund were as follows:
|
| | | | | | | | | | |
| | Year ended March 31, 2019 | Year ended
March 31, 2018(1) |
| | Shares | Amount | Shares | Amount |
| Investor Class/Shares Authorized | 500,000,000 |
| | 490,000,000 |
| |
| Sold | 8,388,545 |
| $ | 82,722,800 |
| 6,103,145 |
| $ | 61,859,119 |
|
| Issued in reinvestment of distributions | 3,923,361 |
| 37,145,768 |
| 3,467,863 |
| 35,365,778 |
|
| Redeemed | (7,088,755 | ) | (71,026,977 | ) | (11,912,905 | ) | (121,531,300 | ) |
| | 5,223,151 |
| 48,841,591 |
| (2,341,897 | ) | (24,306,403 | ) |
| I Class/Shares Authorized | 45,000,000 |
| | 50,000,000 |
| |
| Sold | 526,258 |
| 5,325,158 |
| 1,087,344 |
| 11,005,106 |
|
| Issued in reinvestment of distributions | 100,636 |
| 956,630 |
| 103,493 |
| 1,056,279 |
|
| Redeemed | (831,642 | ) | (8,420,060 | ) | (3,291,386 | ) | (33,238,442 | ) |
| | (204,748 | ) | (2,138,272 | ) | (2,100,549 | ) | (21,177,057 | ) |
| A Class/Shares Authorized | 45,000,000 |
| | 50,000,000 |
| |
| Sold | 501,785 |
| 5,098,258 |
| 555,637 |
| 5,621,916 |
|
| Issued in reinvestment of distributions | 199,627 |
| 1,888,582 |
| 210,315 |
| 2,144,020 |
|
| Redeemed | (1,268,941 | ) | (12,547,830 | ) | (2,280,536 | ) | (23,192,893 | ) |
| | (567,529 | ) | (5,560,990 | ) | (1,514,584 | ) | (15,426,957 | ) |
| C Class/Shares Authorized | 15,000,000 |
| | 15,000,000 |
| |
| Sold | 109,929 |
| 1,023,092 |
| 77,488 |
| 793,302 |
|
| Issued in reinvestment of distributions | 13,181 |
| 124,273 |
| 23,435 |
| 238,769 |
|
| Redeemed | (395,879 | ) | (4,024,495 | ) | (377,094 | ) | (3,792,393 | ) |
| | (272,769 | ) | (2,877,130 | ) | (276,171 | ) | (2,760,322 | ) |
| R Class/Shares Authorized | 10,000,000 |
| | 10,000,000 |
| |
| Sold | 85,077 |
| 844,848 |
| 92,370 |
| 939,476 |
|
| Issued in reinvestment of distributions | 17,752 |
| 168,221 |
| 24,340 |
| 248,316 |
|
| Redeemed | (194,424 | ) | (1,933,049 | ) | (258,680 | ) | (2,656,868 | ) |
| | (91,595 | ) | (919,980 | ) | (141,970 | ) | (1,469,076 | ) |
| R5 Class/Shares Authorized | 30,000,000 |
| | 50,000,000 |
| |
| Sold | — |
| — |
| 498 |
| 5,000 |
|
| Issued in reinvestment of distributions | 33 |
| 321 |
| 30 |
| 302 |
|
| | 33 |
| 321 |
| 528 |
| 5,302 |
|
| R6 Class/Shares Authorized | 95,000,000 |
| | 85,000,000 |
| |
| Sold | 4,564,464 |
| 45,052,955 |
| 5,952,240 |
| 60,232,389 |
|
| Issued in reinvestment of distributions | 886,317 |
| 8,415,354 |
| 728,213 |
| 7,427,977 |
|
| Redeemed | (2,346,697 | ) | (23,115,902 | ) | (7,495,218 | ) | (76,254,387 | ) |
| | 3,104,084 |
| 30,352,407 |
| (814,765 | ) | (8,594,021 | ) |
| Net increase (decrease) | 7,190,627 |
| $ | 67,697,947 |
| (7,189,408 | ) | $ | (73,728,534 | ) |
| |
| (1) | April 10, 2017 (commencement of sale) through March 31, 2018 for the R5 Class. |
6. Fair Value Measurements
The fund’s investments valuation process is based on several considerations and may use multiple inputs to determine the fair value of the investments held by the fund. In conformity with accounting principles generally accepted in the United States of America, the inputs used to determine a valuation are classified into three broad levels.
| |
| • | Level 1 valuation inputs consist of unadjusted quoted prices in an active market for identical investments. |
| |
| • | Level 2 valuation inputs consist of direct or indirect observable market data (including quoted prices for comparable investments, evaluations of subsequent market events, interest rates, prepayment speeds, credit risk, etc.). These inputs also consist of quoted prices for identical investments initially expressed in local currencies that are adjusted through translation into U.S. dollars. |
| |
| • | Level 3 valuation inputs consist of unobservable data (including a fund’s own assumptions). |
The level classification is based on the lowest level input that is significant to the fair valuation measurement. The valuation inputs are not necessarily an indication of the risks associated with investing in these securities or other financial instruments.
The following is a summary of the level classifications as of period end. The Schedule of Investments provides additional information on the fund’s portfolio holdings.
|
| | | | | | | | |
| | Level 1 | Level 2 | Level 3 |
| Assets | | | |
| Investment Securities | | | |
| Common Stocks | $ | 807,028,349 |
| $ | 27,947,031 |
| — |
|
| Exchange-Traded Funds | 24,623,906 |
| — |
| — |
|
| Temporary Cash Investments | 10,771 |
| 23,065,676 |
| — |
|
| | $ | 831,663,026 |
| $ | 51,012,707 |
| — |
|
| Other Financial Instruments | | | |
| Forward Foreign Currency Exchange Contracts | — |
| $ | 537,951 |
| — |
|
| | | | |
| Liabilities | | | |
| Other Financial Instruments | | | |
| Forward Foreign Currency Exchange Contracts | — |
| $ | 6,465 |
| — |
|
7. Derivative Instruments
Foreign Currency Risk — The fund is subject to foreign currency exchange rate risk in the normal course of pursuing its investment objectives. The value of foreign investments held by a fund may be significantly affected by changes in foreign currency exchange rates. The dollar value of a foreign security generally decreases when the value of the dollar rises against the foreign currency in which the security is denominated and tends to increase when the value of the dollar declines against such foreign currency. A fund may enter into forward foreign currency exchange contracts to reduce a fund's exposure to foreign currency exchange rate fluctuations. The net U.S. dollar value of foreign currency underlying all contractual commitments held by a fund and the resulting unrealized appreciation or depreciation are determined daily. Realized gain or loss is recorded upon the termination of the contract. Net realized and unrealized gains or losses occurring during the holding period of forward foreign currency exchange contracts are a component of net realized gain (loss) on forward foreign currency exchange contract transactions and change in net unrealized appreciation (depreciation) on forward foreign currency exchange contracts, respectively. A fund bears the risk of an unfavorable change in the foreign currency exchange rate underlying the forward contract. Additionally, losses, up to the fair value, may arise if the counterparties do not perform under the contract terms. The fund's average U.S. dollar exposure to foreign currency risk derivative instruments held during the period was $65,983,641.
The value of foreign currency risk derivative instruments as of March 31, 2019, is disclosed on the Statement of Assets and Liabilities as an asset of $537,951 in unrealized appreciation on forward foreign currency
exchange contracts and a liability of $6,465 in unrealized depreciation on forward foreign currency exchange contracts. For the year ended March 31, 2019, the effect of foreign currency risk derivative instruments on the Statement of Operations was $5,787,544 in net realized gain (loss) on forward foreign currency exchange contract transactions and $505,567 in change in net unrealized appreciation (depreciation) on forward foreign currency exchange contracts.
8. Risk Factors
There are certain risks involved in investing in foreign securities. These risks include those resulting from political events (such as civil unrest, national elections and imposition of exchange controls), social and economic events (such as labor strikes and rising inflation), and natural disasters. Securities of foreign issuers may be less liquid and more volatile. Investing a significant portion of assets in one country or region may accentuate these risks.
9. Federal Tax Information
The tax character of distributions paid during the years ended March 31, 2019 and March 31, 2018 were as follows:
|
| | | | | | |
| | 2019 | 2018 |
| Distributions Paid From | | |
| Ordinary income | $ | 15,696,058 |
| $ | 24,148,118 |
|
| Long-term capital gains | $ | 33,750,098 |
| $ | 23,073,060 |
|
The book-basis character of distributions made during the year from net investment income or net realized gains may differ from their ultimate characterization for federal income tax purposes. These differences reflect the differing character of certain income items and net realized gains and losses for financial statement and tax purposes, and may result in reclassification among certain capital accounts on the financial statements.
As of period end, the federal tax cost of investments and the components of distributable earnings on a tax-basis were as follows:
|
| | | |
| Federal tax cost of investments | $ | 797,505,298 |
|
| Gross tax appreciation of investments | $ | 114,142,312 |
|
| Gross tax depreciation of investments | (28,971,877 | ) |
| Net tax appreciation (depreciation) of investments | 85,170,435 |
|
| Net tax appreciation (depreciation) on derivatives and translation of assets and liabilities in foreign currencies | (3,234 | ) |
| Net tax appreciation (depreciation) | $ | 85,167,201 |
|
| Undistributed ordinary income | $ | 1,034,083 |
|
| Post-October capital loss deferral | $ | (6,318,738 | ) |
The difference between book-basis and tax-basis unrealized appreciation (depreciation) is attributable primarily to the tax deferral of losses on wash sales.
Loss deferrals represent certain qualified losses that the fund has elected to treat as having been incurred in the following fiscal year for federal income tax purposes.
|
| | | | | | | | | | | | | | | |
For a Share Outstanding Throughout the Years Ended March 31 (except as noted)
|
| Per-Share Data | Ratios and Supplemental Data |
| | | Income From Investment Operations: | Distributions From: | | | Ratio to Average Net Assets of: | | |
| | Net Asset
Value,
Beginning
of Period | Net
Investment
Income
(Loss)(1) | Net
Realized
and
Unrealized
Gain (Loss) | Total From
Investment
Operations | Net
Investment
Income | Net
Realized
Gains | Total
Distributions | Net Asset
Value,
End
of Period | Total
Return(2) | Operating
Expenses | Net
Investment
Income
(Loss) | Portfolio
Turnover
Rate | Net
Assets,
End of
Period
(in thousands) |
| Investor Class | | | | | | | | | | | |
| 2019 | $9.85 | 0.18 | 0.40 | 0.58 | (0.18) | (0.40) | (0.58) | $9.85 | 6.20% | 0.83% | 1.83% | 62% |
| $673,365 |
|
| 2018 | $10.05 | 0.21 | 0.17 | 0.38 | (0.20) | (0.38) | (0.58) | $9.85 | 3.65% | 0.83% | 2.09% | 53% |
| $621,874 |
|
| 2017 | $8.58 | 0.18 | 1.48 | 1.66 | (0.19) | — | (0.19) | $10.05 | 19.44% | 0.83% | 1.96% | 68% |
| $658,031 |
|
| 2016 | $9.07 | 0.12 | (0.49) | (0.37) | (0.12) | — | (0.12) | $8.58 | (4.06)% | 0.84% | 1.41% | 56% |
| $642,746 |
|
| 2015 | $8.28 | 0.12 | 0.78 | 0.90 | (0.11) | — | (0.11) | $9.07 | 10.92% | 0.84% | 1.36% | 56% |
| $588,608 |
|
| I Class | | | | | | | | | | | |
| 2019 | $9.86 | 0.20 | 0.40 | 0.60 | (0.20) | (0.40) | (0.60) | $9.86 | 6.41% | 0.63% | 2.03% | 62% |
| $18,196 |
|
| 2018 | $10.06 | 0.22 | 0.18 | 0.40 | (0.22) | (0.38) | (0.60) | $9.86 | 3.85% | 0.63% | 2.29% | 53% |
| $20,213 |
|
| 2017 | $8.58 | 0.19 | 1.49 | 1.68 | (0.20) | — | (0.20) | $10.06 | 19.80% | 0.63% | 2.16% | 68% |
| $41,746 |
|
| 2016 | $9.08 | 0.14 | (0.50) | (0.36) | (0.14) | — | (0.14) | $8.58 | (3.97)% | 0.64% | 1.61% | 56% |
| $48,495 |
|
| 2015 | $8.29 | 0.13 | 0.79 | 0.92 | (0.13) | — | (0.13) | $9.08 | 11.14% | 0.64% | 1.56% | 56% |
| $47,616 |
|
| A Class | | | | | | | | | | | |
| 2019 | $9.85 | 0.16 | 0.40 | 0.56 | (0.16) | (0.40) | (0.56) | $9.85 | 5.94% | 1.08% | 1.58% | 62% |
| $34,603 |
|
| 2018 | $10.05 | 0.18 | 0.17 | 0.35 | (0.17) | (0.38) | (0.55) | $9.85 | 3.39% | 1.08% | 1.84% | 53% |
| $40,192 |
|
| 2017 | $8.57 | 0.16 | 1.48 | 1.64 | (0.16) | — | (0.16) | $10.05 | 19.28% | 1.08% | 1.71% | 68% |
| $56,222 |
|
| 2016 | $9.07 | 0.10 | (0.50) | (0.40) | (0.10) | — | (0.10) | $8.57 | (4.41)% | 1.09% | 1.16% | 56% |
| $61,663 |
|
| 2015 | $8.28 | 0.10 | 0.78 | 0.88 | (0.09) | — | (0.09) | $9.07 | 10.65% | 1.09% | 1.11% | 56% |
| $70,462 |
|
|
| | | | | | | | | | | | | | | |
For a Share Outstanding Throughout the Years Ended March 31 (except as noted)
|
| Per-Share Data | Ratios and Supplemental Data |
| | | Income From Investment Operations: | Distributions From: | | | Ratio to Average Net Assets of: | | |
| | Net Asset
Value,
Beginning
of Period | Net
Investment
Income
(Loss)(1) | Net
Realized
and
Unrealized
Gain (Loss) | Total From
Investment
Operations | Net
Investment
Income | Net
Realized
Gains | Total
Distributions | Net Asset
Value,
End
of Period | Total
Return(2) | Operating
Expenses | Net
Investment
Income
(Loss) | Portfolio
Turnover
Rate | Net
Assets,
End of
Period
(in thousands) |
| C Class | | | | | | | | | | | |
| 2019 | $9.85 | 0.08 | 0.40 | 0.48 | (0.08) | (0.40) | (0.48) | $9.85 | 5.15% | 1.83% | 0.83% | 62% |
| $3,363 |
|
| 2018 | $10.05 | 0.11 | 0.17 | 0.28 | (0.10) | (0.38) | (0.48) | $9.85 | 2.63% | 1.83% | 1.09% | 53% |
| $6,050 |
|
| 2017 | $8.57 | 0.09 | 1.48 | 1.57 | (0.09) | — | (0.09) | $10.05 | 18.36% | 1.83% | 0.96% | 68% |
| $8,948 |
|
| 2016 | $9.06 | 0.03 | (0.49) | (0.46) | (0.03) | — | (0.03) | $8.57 | (5.03)% | 1.84% | 0.41% | 56% |
| $9,116 |
|
| 2015 | $8.28 | 0.03 | 0.78 | 0.81 | (0.03) | — | (0.03) | $9.06 | 9.77% | 1.84% | 0.36% | 56% |
| $11,505 |
|
| R Class | | | | | | | | | | | |
| 2019 | $9.86 | 0.13 | 0.40 | 0.53 | (0.13) | (0.40) | (0.53) | $9.86 | 5.67% | 1.33% | 1.33% | 62% |
| $3,389 |
|
| 2018 | $10.06 | 0.16 | 0.17 | 0.33 | (0.15) | (0.38) | (0.53) | $9.86 | 3.13% | 1.33% | 1.59% | 53% |
| $4,291 |
|
| 2017 | $8.58 | 0.14 | 1.48 | 1.62 | (0.14) | — | (0.14) | $10.06 | 18.95% | 1.33% | 1.46% | 68% |
| $5,806 |
|
| 2016 | $9.07 | 0.08 | (0.49) | (0.41) | (0.08) | — | (0.08) | $8.58 | (4.55)% | 1.34% | 0.91% | 56% |
| $4,820 |
|
| 2015 | $8.28 | 0.07 | 0.79 | 0.86 | (0.07) | — | (0.07) | $9.07 | 10.37% | 1.34% | 0.86% | 56% |
| $5,842 |
|
| R5 Class | | | | | | | | | | | |
| 2019 | $9.86 | 0.20 | 0.40 | 0.60 | (0.20) | (0.40) | (0.60) | $9.86 | 6.40% | 0.63% | 2.03% | 62% |
| $6 |
|
2018(3) | $10.04 | 0.23 | 0.19 | 0.42 | (0.22) | (0.38) | (0.60) | $9.86 | 4.05% | 0.63%(4) | 2.28%(4) | 53%(5) |
| $5 |
|
| R6 Class | | | | | | | | | | | |
| 2019 | $9.86 | 0.22 | 0.40 | 0.62 | (0.22) | (0.40) | (0.62) | $9.86 | 6.57% | 0.48% | 2.18% | 62% |
| $152,534 |
|
| 2018 | $10.06 | 0.25 | 0.16 | 0.41 | (0.23) | (0.38) | (0.61) | $9.86 | 4.01% | 0.48% | 2.44% | 53% |
| $121,935 |
|
| 2017 | $8.58 | 0.22 | 1.48 | 1.70 | (0.22) | — | (0.22) | $10.06 | 19.98% | 0.48% | 2.31% | 68% |
| $132,608 |
|
| 2016 | $9.08 | 0.16 | (0.51) | (0.35) | (0.15) | — | (0.15) | $8.58 | (3.83)% | 0.49% | 1.76% | 56% |
| $103,643 |
|
| 2015 | $8.29 | 0.17 | 0.76 | 0.93 | (0.14) | — | (0.14) | $9.08 | 11.30% | 0.49% | 1.71% | 56% |
| $38,170 |
|
|
|
| Notes to Financial Highlights |
| |
| (1) | Computed using average shares outstanding throughout the period. |
| |
| (2) | Total returns are calculated based on the net asset value of the last business day and do not reflect applicable sales charges, if any. Total returns for periods less than one year are not annualized. |
| |
| (3) | April 10, 2017 (commencement of sale) through March 31, 2018. |
| |
| (5) | Portfolio turnover is calculated at the fund level. Percentage indicated was calculated for the year ended March 31, 2018. |
See Notes to Financial Statements.
|
|
| Report of Independent Registered Public Accounting Firm |
To the shareholders and the Board of Directors of American Century Capital Portfolios, Inc.:
Opinion on the Financial Statements and Financial Highlights
We have audited the accompanying statement of assets and liabilities, including the schedule of investments, of Large Company Value Fund, one of the portfolios constituting the American Century Capital Portfolios, Inc. (the “Fund”), as of March 31, 2019, the related statement of operations for the year then ended, the statements of changes in net assets for each of the two years in the period then ended, the financial highlights for each of the five years in the period then ended, and the related notes. In our opinion, the financial statements and financial highlights present fairly, in all material respects, the financial position of Large Company Value Fund of the American Century Capital Portfolios, Inc. as of March 31, 2019, the results of its operations for the year then ended, the changes in its net assets for each of the two years in the period then ended, and the financial highlights for each of the five years in the period then ended, in conformity with accounting principles generally accepted in the United States of America.
Basis for Opinion
These financial statements and financial highlights are the responsibility of the Fund's management. Our responsibility is to express an opinion on the Fund’s financial statements and financial highlights based on our audits. We are a public accounting firm registered with the Public Company Accounting Oversight Board (United States) (PCAOB) and are required to be independent with respect to the Fund in accordance with the U.S. federal securities laws and the applicable rules and regulations of the Securities and Exchange Commission and the PCAOB.
We conducted our audits in accordance with the standards of the PCAOB. Those standards require that we plan and perform the audit to obtain reasonable assurance about whether the financial statements and financial highlights are free of material misstatement, whether due to error or fraud. The Fund is not required to have, nor were we engaged to perform, an audit of its internal control over financial reporting. As part of our audits we are required to obtain an understanding of internal control over financial reporting but not for the purpose of expressing an opinion on the effectiveness of the Fund’s internal control over financial reporting. Accordingly, we express no such opinion.
Our audits included performing procedures to assess the risks of material misstatement of the financial statements and financial highlights, whether due to error or fraud, and performing procedures that respond to those risks. Such procedures included examining, on a test basis, evidence regarding the amounts and disclosures in the financial statements and financial highlights. Our audits also included evaluating the accounting principles used and significant estimates made by management, as well as evaluating the overall presentation of the financial statements and financial highlights. Our procedures included confirmation of securities owned as of March 31, 2019, by correspondence with the custodian and brokers; when replies were not received from brokers, we performed other auditing procedures. We believe that our audits provide a reasonable basis for our opinion.
DELOITTE & TOUCHE LLP
Kansas City, Missouri
May 16, 2019
We have served as the auditor of one or more American Century investment companies since 1997.
The Board of Directors
The individuals listed below serve as directors of the funds. Each director will continue to serve in this capacity until death, retirement, resignation or removal from office. The board has adopted a mandatory retirement age for directors who are not “interested persons,” as that term is defined in the Investment Company Act (independent directors). Independent directors shall retire by December 31 of the year in which they reach their 75th birthday.
Mr. Thomas is an “interested person” because he currently serves as President and Chief Executive Officer of American Century Companies, Inc. (ACC), the parent company of American Century Investment Management, Inc. (ACIM or the advisor). The other directors (more than three-fourths of the total number) are independent. They are not employees, directors or officers of, and have no financial interest in, ACC or any of its wholly owned, direct or indirect, subsidiaries, including ACIM, American Century Investment Services, Inc. (ACIS) and American Century Services, LLC (ACS), and they do not have any other affiliations, positions or relationships that would cause them to be considered “interested persons” under the Investment Company Act. The directors serve in this capacity for seven (in the case of Jonathan S. Thomas, 16; and Stephen E. Yates, 8) registered investment companies in the American Century Investments family of funds.
The following table presents additional information about the directors. The mailing address for each director is 4500 Main Street, Kansas City, Missouri 64111.
|
| | | | | |
Name
(Year of Birth) | Position(s) Held with Funds | Length of Time Served | Principal Occupation(s) During Past 5 Years | Number of American Century Portfolios Overseen by Director | Other Directorships Held During Past 5 Years |
| Independent Directors |
|
|
| Thomas W. Bunn (1953) | Director | Since 2017 | Retired | 67 | SquareTwo Financial; Barings (formerly Babson Capital Funds Trust) (2013 to 2016) |
Chris H. Cheesman
(1962)
| Director | Since 2019
| Retired. Senior Vice President & Chief Audit Executive, AllianceBernstein (1999 to 2018)
| 67 | None |
Barry Fink
(1955) | Director | Since 2012 (independent since 2016) | Retired | 67 | None |
Rajesh K. Gupta
(1960)
| Director | Since 2019
| Partner Emeritus, SeaCrest Investment Management and SeaCrest Wealth Management (2019 to Present); Chief Executive Officer and Chief Investment Officer, SeaCrest Investment Management (2006 to 2019); Chief Executive Officer and Chief Investment Officer, SeaCrest Wealth Management (2008 to 2019)
| 67 | None |
|
| | | | | |
Name
(Year of Birth) | Position(s) Held with Funds | Length of Time Served | Principal Occupation(s) During Past 5 Years | Number of American Century Portfolios Overseen by Director | Other Directorships Held During Past 5 Years |
| Independent Directors |
|
|
Lynn Jenkins
(1963)
| Director | Since 2019
| United States Representative, U.S. House of Representatives (2009 to 2018) | 67 | MGP Ingredients, Inc. |
Jan M. Lewis
(1957) | Director | Since 2011 | Retired | 67 | None |
John R. Whitten
(1946) | Director | Since 2008 | Retired | 67 | Rudolph Technologies, Inc. |
Stephen E. Yates
(1948) | Director and Chairman of the Board | Since 2012 (Chairman since 2018) | Retired | 72 | None |
| Interested Director |
|
|
Jonathan S. Thomas
(1963) | Director and President | Since 2007 | President and Chief Executive Officer, ACC (2007 to present). Also serves as Chief Executive Officer, ACS; Executive Vice President, ACIM; Director, ACC, ACIM and other ACC subsidiaries | 117 | BioMed Valley Discoveries, Inc. |
The Statement of Additional Information has additional information about the fund's directors and is available without charge, upon request, by calling 1-800-345-2021.
Officers
The following table presents certain information about the executive officers of the funds. Each officer serves as an officer for 16 (in the case of Robert J. Leach, 15) investment companies in the American Century family of funds, unless otherwise noted. No officer is compensated for his or her service as an officer of the funds. The listed officers are interested persons of the funds and are appointed or re-appointed on an annual basis. The mailing address for each officer listed below is 4500 Main Street, Kansas City, Missouri 64111.
|
| | |
Name
(Year of Birth) | Offices with the Funds | Principal Occupation(s) During the Past Five Years |
Jonathan S. Thomas
(1963) | Director and President since 2007 | President and Chief Executive Officer, ACC (2007 to present). Also serves as Chief Executive Officer, ACS; Executive Vice President, ACIM; Director, ACC, ACIM and other ACC subsidiaries |
R. Wes Campbell
(1974)
| Chief Financial Officer and Treasurer since 2018 | Investment Operations and Investment Accounting, ACS (2000 to present) |
Amy D. Shelton
(1964) | Chief Compliance Officer and Vice President since 2014 | Chief Compliance Officer, American Century funds, (2014 to present); Chief Compliance Officer, ACIM (2014 to present); Chief Compliance Officer, ACIS (2009 to present); Vice President, Client Interactions and Marketing, ACIS (2013 to 2014). Also serves as Vice President, ACIS |
Charles A. Etherington
(1957) | General Counsel since 2007 and Senior Vice President since 2006 | Attorney, ACC (1994 to present); Vice President, ACC (2005 to present); General Counsel, ACC (2007 to present). Also serves as General Counsel, ACIM, ACS, ACIS and other ACC subsidiaries; and Senior Vice President, ACIM and ACS |
C. Jean Wade
(1964) | Vice President since 2012 | Senior Vice President, ACS (2017 to present); Vice President, ACS (2000 to 2017) |
Robert J. Leach
(1966) | Vice President since 2006 | Vice President, ACS (2000 to present) |
David H. Reinmiller
(1963) | Vice President since 2000 | Attorney, ACC (1994 to present). Also serves as Vice President, ACIM and ACS |
Ward D. Stauffer
(1960) | Secretary since 2005 | Attorney, ACC (2003 to present) |
Retirement Account Information
As required by law, distributions you receive from certain retirement accounts are subject to federal income tax withholding, unless you elect not to have withholding apply*. Tax will be withheld on the total amount withdrawn even though you may be receiving amounts that are not subject to withholding, such as nondeductible contributions. In such case, excess amounts of withholding could occur. You may adjust your withholding election so that a greater or lesser amount will be withheld.
If you don’t want us to withhold on this amount, you must notify us to not withhold the federal income tax. You may notify us in writing or in certain situations by telephone or through other electronic means. For systematic withdrawals, your withholding election will remain in effect until revoked or changed by filing a new election. You have the right to revoke your election at any time and change your withholding percentage for future distributions.
Remember, even if you elect not to have income tax withheld, you are liable for paying income tax on the taxable portion of your withdrawal. If you elect not to have income tax withheld or you don’t have enough income tax withheld, you may be responsible for payment of estimated tax. You may incur penalties under the estimated tax rules if your withholding and estimated tax payments are not sufficient. You can reduce or defer the income tax on a distribution by directly or indirectly rolling such distribution over to another IRA or eligible plan. You should consult your tax advisor for additional information.
State tax will be withheld if, at the time of your distribution, your address is within one of the mandatory withholding states and you have federal income tax withheld (or as otherwise required by state law). State taxes will be withheld from your distribution in accordance with the respective state rules.
*Some 403(b), 457 and qualified retirement plan distributions may be subject to 20% mandatory withholding, as they are subject to special tax and withholding rules. Your plan administrator or plan sponsor is required to provide you with a special tax notice explaining those rules at the time you request a distribution. If applicable, federal and/or state taxes may be withheld from your distribution amount.
Proxy Voting Policies
A description of the policies that the fund's investment advisor uses in exercising the voting rights associated with the securities purchased and/or held by the fund is available without charge, upon request, by calling 1-800-345-2021. It is also available on the "About Us" page of American Century Investments’ website at americancentury.com and on the Securities and Exchange Commission’s website at sec.gov. Information regarding how the investment advisor voted proxies relating to portfolio securities during the most recent 12-month period ended June 30 is available on the "About Us" page at americancentury.com. It is also available at sec.gov.
Quarterly Portfolio Disclosure
The fund files its complete schedule of portfolio holdings with the Securities and Exchange Commission (SEC) for the first and third quarters of each fiscal year on Form N-Q or as an exhibit to its reports on Form N-PORT. The fund’s Forms N-Q and Form N-PORT reports are available on the SEC’s website at sec.gov. The fund also makes its complete schedule of portfolio holdings for the most recent quarter of its fiscal year available on its website at americancentury.com and, upon request, by calling 1-800-345-2021.
Other Tax Information
The following information is provided pursuant to provisions of the Internal Revenue Code.
The fund hereby designates up to the maximum amount allowable as qualified dividend income for the fiscal year ended March 31, 2019.
For corporate taxpayers, the fund hereby designates $14,587,671, or up to the maximum amount allowable, of ordinary income distributions paid during the fiscal year ended March 31, 2019 as qualified for the corporate dividends received deduction.
The fund hereby designates $33,750,098, or up to the maximum amount allowable, as long-term capital gain distributions (20% rate gain distributions) for the fiscal year ended March 31, 2019.
|
| | |
| |
| | | |
| Contact Us | americancentury.com | |
| Automated Information Line | 1-800-345-8765 | |
| Investor Services Representative | 1-800-345-2021 or 816-531-5575 | |
| Investors Using Advisors | 1-800-378-9878 | |
| Business, Not-For-Profit, Employer-Sponsored Retirement Plans | 1-800-345-3533 | |
| Banks and Trust Companies, Broker-Dealers, Financial Professionals, Insurance Companies | 1-800-345-6488 | |
| Telecommunications Relay Service for the Deaf | 711 | |
| | | |
| American Century Capital Portfolios, Inc. | |
| | | |
Investment Advisor: American Century Investment Management, Inc. Kansas City, Missouri | |
| | | |
| This report and the statements it contains are submitted for the general information of our shareholders. The report is not authorized for distribution to prospective investors unless preceded or accompanied by an effective prospectus. | |
| | | |
©2019 American Century Proprietary Holdings, Inc. All rights reserved.
CL-ANN-92269 1905 | |
|
| |
| | |
| | Annual Report |
| | |
| | March 31, 2019 |
| | |
| | Mid Cap Value Fund |
| | Investor Class (ACMVX) |
| | I Class (AVUAX) |
| | Y Class (AMVYX) |
| | A Class (ACLAX) |
| | C Class (ACCLX) |
| | R Class (AMVRX) |
| | R5 Class (AMVGX) |
| | R6 Class (AMDVX) |
Beginning on January 1, 2021, as permitted by regulations adopted by the Securities and Exchange Commission, paper copies of the fund’s shareholder reports like this one will no longer be sent by mail, unless you specifically request paper copies of the reports from the fund or from your financial intermediary, such as a broker-dealer or bank. Instead, the reports will be made available on a website, and you will be notified by mail each time a report is posted and provided with a website link to access the report.
If you already elected to receive shareholder reports electronically, you will not be affected by this change and you need not take any action. You may elect to receive shareholder reports and other communications from the fund or your financial intermediary electronically by calling or sending an email request to your appropriate contacts as listed on the back cover of this report.
You may elect to receive all future reports in paper free of charge. You can inform the fund or your financial intermediary that you wish to continue receiving paper copies of your shareholder reports by calling or sending an email request to your appropriate contacts as listed on the back cover of this report. Your election to receive reports in paper will apply to all funds held with the fund complex/your financial intermediary.
|
| |
| President’s Letter | 2 |
| Performance | 3 |
| Portfolio Commentary | |
| Fund Characteristics | |
| Shareholder Fee Example | |
| Schedule of Investments | |
| Statement of Assets and Liabilities | |
| Statement of Operations | |
| Statement of Changes in Net Assets | |
| Notes to Financial Statements | |
| Financial Highlights | |
| Report of Independent Registered Public Accounting Firm | |
| Management | |
| Additional Information | |
Any opinions expressed in this report reflect those of the author as of the date of the report, and do not necessarily represent the opinions of American Century Investments® or any other person in the American Century Investments organization. Any such opinions are subject to change at any time based upon market or other conditions and American Century Investments disclaims any responsibility to update such opinions. These opinions may not be relied upon as investment advice and, because investment decisions made by American Century Investments funds are based on numerous factors, may not be relied upon as an indication of trading intent on behalf of any American Century Investments fund. Security examples are used for representational purposes only and are not intended as recommendations to purchase or sell securities. Performance information for comparative indices and securities is provided to American Century Investments by third party vendors. To the best of American Century Investments’ knowledge, such information is accurate at the time of printing.
Jonathan Thomas
Dear Investor:
Thank you for reviewing this annual report for the period ended March 31, 2019. Annual reports help convey important information about fund returns, including market factors that affected performance during the reporting period. For additional, updated investment and market insights, we encourage you to visit our website, americancentury.com.
Markets Ended Roller-Coaster Period on Upswing
For the first half of the period, U.S. stocks climbed higher, while bond returns headed lower. Robust economic growth, bolstered by federal tax and regulatory reform, and record corporate earnings results fueled risk-on sentiment that drove stock prices higher. Meanwhile, the combination of strong economic data, the Federal Reserve’s (Fed’s) ongoing rate-hike campaign and an uptick in inflation pushed investment-grade bond returns lower.
Market trends began changing in late 2018. Mounting investor concerns about slowing global economic and earnings growth, U.S.-China trade tensions and rising interest rates triggered widespread volatility. Stock prices plunged as investors sought safe-haven investments, including U.S. Treasuries. Furthermore, the Fed issued another rate hike in December, its fourth of the year, and maintained its hawkish outlook. Investors feared the December rate increase and the Fed’s plans for two more rate hikes in 2019 were too aggressive, and risk-off investing remained in favor.
January brought a renewed sense of stability to the markets. Investors’ concerns about growth and trade eased, and the Fed changed course, pausing its rate-hike campaign amid moderating global growth and inflation. Valuations appeared attractive after the late-2018 sell-off, and risk-on investing resumed. In March, the Fed held rates steady again, hinting additional tightening was off the table for 2019. This news drove stock and bond returns higher and left both asset classes on an upward track to end the period. Overall, stocks (S&P 500 Index) overcame their late-2018 nosedive to gain 9.50% for the period. Bonds (Bloomberg Barclays U.S. Aggregate Bond Index) bounced back from losses early in the period to return 4.48%.
We expect volatility to remain a formidable factor as investors react to global growth trends, central bank policy and geopolitical developments. We believe this scenario underscores the importance of using professionally managed portfolios in pursuit of investment goals. We appreciate your continued trust and confidence in us.
Sincerely,
Jonathan Thomas
President and Chief Executive Officer
American Century Investments
|
| | | | | | |
| Total Returns as of March 31, 2019 |
| | | | Average Annual Returns | |
| | Ticker Symbol | 1 year | 5 years | 10 years | Since Inception | Inception Date |
| Investor Class | ACMVX | 0.81% | 8.26% | 15.17% | — | 3/31/04 |
| Russell Midcap Value Index | — | 2.89% | 7.21% | 16.38% | — | — |
| I Class | AVUAX | 1.07% | 8.48% | 15.41% | — | 8/2/04 |
| Y Class | AMVYX | 1.16% | — | — | 3.59% | 4/10/17 |
| A Class | ACLAX | | | |
| 1/13/05 |
| No sales charge | | 0.57% | 8.00% | 14.89% | — | |
| With sales charge | | -5.21% | 6.72% | 14.20% | — | |
| C Class | ACCLX | -0.23% | 7.19% | — | 10.51% | 3/1/10 |
| R Class | AMVRX | 0.33% | 7.73% | 14.60% | — | 7/29/05 |
| R5 Class | AMVGX | 1.01% | — | — | 3.44% | 4/10/17 |
| R6 Class | AMDVX | 1.16% | 8.64% | — | 9.74% | 7/26/13 |
Average annual returns since inception are presented when ten years of performance history is not available. Fund returns would have been lower if a portion of the fees had not been waived. Prior to March 1, 2010, the A Class was referred to as the Advisor Class and did not have a front-end sales charge. Performance has been adjusted to reflect this charge.
Sales charges include initial sales charges and contingent deferred sales charges (CDSCs), as applicable. A Class shares have a 5.75% maximum initial sales charge and may be subject to a maximum CDSC of 1.00%. C Class shares redeemed within 12 months of purchase are subject to a maximum CDSC of 1.00%. The SEC requires that mutual funds provide performance information net of maximum sales charges in all cases where charges could be applied.
Data presented reflect past performance. Past performance is no guarantee of future results. Current performance may be higher or lower than the performance shown. Total returns for periods less than one year are not annualized. Investment return and principal value will fluctuate, and redemption value may be more or less than original cost. Data assumes reinvestment of dividends and capital gains, and none of the charts reflect the deduction of taxes that a shareholder would pay on fund distributions or the redemption of fund shares. To obtain performance data current to the most recent month end, please call 1-800-345-2021 or visit americancentury.com. For additional information about the fund, please consult the prospectus.
|
|
| Growth of $10,000 Over 10 Years |
| $10,000 investment made March 31, 2009 |
| Performance for other share classes will vary due to differences in fee structure. |
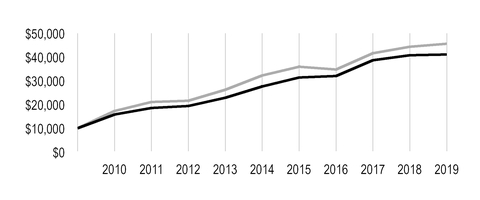
|
| |
| Value on March 31, 2019 |
| | Investor Class — $41,089 |
| |
| | Russell Midcap Value Index — $45,626 |
| |
Ending value of Investor Class would have been lower if a portion of the fees had not been waived.
|
| | | | | | | |
| Total Annual Fund Operating Expenses |
| Investor Class | I Class | Y Class | A Class | C Class | R Class | R5 Class | R6 Class |
| 1.01% | 0.81% | 0.66% | 1.26% | 2.01% | 1.51% | 0.81% | 0.66% |
The total annual fund operating expenses shown is as stated in the fund’s prospectus current as of the date of this report. The prospectus may vary from the expense ratio shown elsewhere in this report because it is based on a different time period, includes acquired fund fees and expenses, and, if applicable, does not include fee waivers or expense reimbursements.
Data presented reflect past performance. Past performance is no guarantee of future results. Current performance may be higher or lower than the performance shown. Total returns for periods less than one year are not annualized. Investment return and principal value will fluctuate, and redemption value may be more or less than original cost. Data assumes reinvestment of dividends and capital gains, and none of the charts reflect the deduction of taxes that a shareholder would pay on fund distributions or the redemption of fund shares. To obtain performance data current to the most recent month end, please call 1-800-345-2021 or visit americancentury.com. For additional information about the fund, please consult the prospectus.
Portfolio Managers: Kevin Toney, Michael Liss, Phil Davidson and Brian Woglom
Performance Summary
Mid Cap Value returned 0.81%* for the 12-month period ended March 31, 2019. The fund’s benchmark, the Russell Midcap Value Index, returned 2.89%. The fund’s return reflects operating expenses, while the index’s return does not.
The fund’s underweight and stock selection in the real estate sector detracted from relative performance. Information technology and energy were other areas of weakness. On the other hand, stock selection and our underweight in the consumer discretionary sector contributed positively to relative results. Holdings in the industrials, health care and utilities sectors were also beneficial to performance.
Real Estate, Information Technology and Energy Detracted
Throughout the year, we remained underweight in the real estate sector given our belief that valuations throughout the sector were generally extended. This sector underweight detracted from relative performance. Furthermore, our position in Weyerhaeuser, a large private owner of timberlands, negatively impacted results. The stock was pressured by a decline in timber pricing.
In the information technology sector, several holdings in the semiconductors and semiconductor equipment industry detracted from performance due to fears of capital spending declines in the memory chip market. Our underweight in the information technology sector, stemming largely from our lack of exposure to the software and information technology services industries, also weighed on performance.
A decline in the price of oil during the fourth quarter of 2018 pressured our energy holdings, including Cimarex Energy. Cimarex’s stock was also hurt by fiscal 2018 production guidance that came in below expectations. Furthermore, due to pipeline constraints, investors became concerned about the company’s ability to efficiently transport oil out of the Permian Basin. We believe those concerns were overstated and maintained a position in the company. EQT, a natural gas exploration and pipeline company, was another top detractor. The company provided disappointing guidance for cash flows in 2019 and faced challenges with the integration of assets from Rice Energy, a company that EQT acquired in late 2017.
Within the consumer staples sector, Orkla and Conagra Brands detracted from relative performance. Orkla’s stock was pressured by disappointing financial results, driven by higher food inflation and currency headwinds. However, we believe these issues are transitory and Orkla’s underlying business remains strong. Conagra underperformed due to lowered guidance on its recent acquisition of Pinnacle Foods. Conagra highlighted Pinnacle’s weak new product innovation and stated that improvement may not occur until the second half of 2019.
Financials stock Invesco was another top detractor. The asset manager underperformed due to weaker equity markets in 2018, an acceleration of net outflows and on news of its expensive acquisition of OppenheimerFunds. Paper and packaging company WestRock also underperformed due to worries that containerboard pricing and demand have peaked. Additionally, the company’s decision to acquire a smaller competitor raised concerns about the company’s debt load.
*All fund returns referenced in this commentary are for Investor Class shares. Fund returns would have been lower if a portion of the fees had not been waived. Performance for other share classes will vary due to differences in fee structure; when Investor Class performance exceeds that of the fund's benchmark, other share classes may not. See page 3 for returns for all share classes.
Consumer Discretionary, Industrials, Health Care and Utilities Contributed Positively
Consumer discretionary holding Advance Auto Parts was a key contributor. This retailer of aftermarket automotive replacement parts is a market share leader in a higher-quality industry. The company reported several quarters of strong results and raised its full-year guidance due to margin improvement and stronger-than-expected same-store sales trends. This news indicated to investors that the company’s turnaround plan is starting to show signs of effectiveness. Our underweight to the consumer discretionary sector was also beneficial, as many consumer discretionary stocks lagged due in part to trade tensions and investors’ concerns about a slowing global economy.
Industrials and health care were also areas of strength. Stock selection in industrials positively impacted performance, particularly within the building products industry. Our position in Johnson Controls International outperformed on speculation of a separation of the company’s buildings and battery businesses as well as better operating trends and execution. In the health care sector, hospital company LifePoint Health was a top contributor. The company outperformed on news that it would be acquired for a significant premium by Apollo Global Management, a private equity firm. We eliminated LifePoint following its strong performance.
In the utilities sector, NorthWestern was a top contributor. This utility stock benefited from better-than-expected regulatory developments in proceedings in Montana and from declining longer-term interest rates. Additionally, we believe the Montana Public Service Commission should be more agreeable as the makeup of the commission changed at the end of 2018. Xcel Energy also positively impacted relative returns as the company increased its long-term growth and capital spending outlook. Like other utilities, the stock also benefited from the decline in longer-term interest rates and economic uncertainty.
Portfolio Positioning
The portfolio seeks to invest in companies where we believe the valuation does not reflect the quality and normal earnings power of the company. Our process is based on individual security selection, but broad themes have emerged.
As of March 31, 2019, the portfolio is overweight in financials. Using our bottom-up investment approach, we have identified stocks that we believe offer attractive risk/reward profiles, particularly in the capital markets and banking industries. We are also overweight in industrials. Our analysis has led us to attractive companies within this fragmented sector, and we have avoided industrials that we believe are lower quality.
On the other hand, we ended the reporting period with a notable underweight in real estate. Our metrics show that valuations throughout the real estate sector are extended. As a result, we have only identified a few higher-quality real estate stocks with compelling valuations. The portfolio is also underweight in information technology. We believe valuations throughout the sector are generally less attractive following the sector’s strong performance during the first quarter of 2019.
|
| |
| MARCH 31, 2019 |
| Top Ten Holdings | % of net assets |
| iShares Russell Mid-Cap Value ETF | 3.0% |
| Northern Trust Corp. | 3.0% |
| Zimmer Biomet Holdings, Inc. | 3.0% |
| Hubbell, Inc. | 2.6% |
| BB&T Corp. | 2.1% |
| Xcel Energy, Inc. | 2.0% |
| Weyerhaeuser Co. | 1.9% |
| Johnson Controls International plc | 1.7% |
| Chubb Ltd. | 1.5% |
| Southwest Airlines Co. | 1.5% |
| | |
| Top Five Industries | % of net assets |
| Banks | 9.4% |
| Capital Markets | 6.7% |
| Electrical Equipment | 6.6% |
| Oil, Gas and Consumable Fuels | 5.2% |
| Insurance | 5.1% |
| | |
| Types of Investments in Portfolio | % of net assets |
| Domestic Common Stocks | 87.5% |
| Foreign Common Stocks* | 6.8% |
| Exchange-Traded Funds | 3.0% |
| Total Equity Exposure | 97.3% |
| Temporary Cash Investments | 2.6% |
| Other Assets and Liabilities | 0.1% |
*Includes depositary shares, dual listed securities and foreign ordinary shares.
Fund shareholders may incur two types of costs: (1) transaction costs, including sales charges (loads) on purchase payments and redemption/exchange fees; and (2) ongoing costs, including management fees; distribution and service (12b-1) fees; and other fund expenses. This example is intended to help you understand your ongoing costs (in dollars) of investing in your fund and to compare these costs with the ongoing cost of investing in other mutual funds.
The example is based on an investment of $1,000 made at the beginning of the period and held for the entire period from October 1, 2018 to March 31, 2019.
Actual Expenses
The table provides information about actual account values and actual expenses for each class. You may use the information, together with the amount you invested, to estimate the expenses that you paid over the period. First, identify the share class you own. Then simply divide your account value by $1,000 (for example, an $8,600 account value divided by $1,000 = 8.6), then multiply the result by the number under the heading “Expenses Paid During Period” to estimate the expenses you paid on your account during this period.
If you hold Investor Class shares of any American Century Investments fund, or I Class shares of the American Century Diversified Bond Fund, in an American Century Investments account (i.e., not a financial intermediary or retirement plan account), American Century Investments may charge you a $12.50 semiannual account maintenance fee if the value of those shares is less than $10,000. We will redeem shares automatically in one of your accounts to pay the $12.50 fee. In determining your total eligible investment amount, we will include your investments in all personal accounts (including American Century Investments Brokerage accounts) registered under your Social Security number. Personal accounts include individual accounts, joint accounts, UGMA/UTMA accounts, personal trusts, Coverdell Education Savings Accounts and IRAs (including traditional, Roth, Rollover, SEP-, SARSEP- and SIMPLE-IRAs), and certain other retirement accounts. If you have only business, business retirement, employer-sponsored or American Century Investments Brokerage accounts, you are currently not subject to this fee. If you are subject to the Account Maintenance Fee, your account value could be reduced by the fee amount.
Hypothetical Example for Comparison Purposes
The table also provides information about hypothetical account values and hypothetical expenses based on the actual expense ratio of each class of your fund and an assumed rate of return of 5% per year before expenses, which is not the actual return of a fund’s share class. The hypothetical account values and expenses may not be used to estimate the actual ending account balance or expenses you paid for the period. You may use this information to compare the ongoing costs of investing in your fund and other funds. To do so, compare this 5% hypothetical example with the 5% hypothetical examples that appear in the shareholder reports of the other funds.
Please note that the expenses shown in the table are meant to highlight your ongoing costs only and do not reflect any transactional costs, such as sales charges (loads) or redemption/exchange fees. Therefore, the table is useful in comparing ongoing costs only, and will not help you determine the relative total costs of owning different funds. In addition, if these transactional costs were included, your costs would have been higher.
|
| | | | |
| | Beginning
Account Value
10/1/18 | Ending
Account Value
3/31/19 | Expenses Paid
During Period(1)
10/1/18 - 3/31/19 | Annualized
Expense Ratio(1) |
| Actual | | | | |
| Investor Class | $1,000 | $962.70 | $4.75 | 0.97% |
| I Class | $1,000 | $964.30 | $3.77 | 0.77% |
| Y Class | $1,000 | $964.40 | $3.04 | 0.62% |
| A Class | $1,000 | $961.50 | $5.97 | 1.22% |
| C Class | $1,000 | $957.60 | $9.61 | 1.97% |
| R Class | $1,000 | $960.90 | $7.19 | 1.47% |
| R5 Class | $1,000 | $963.70 | $3.77 | 0.77% |
| R6 Class | $1,000 | $964.40 | $3.04 | 0.62% |
| Hypothetical | | | | |
| Investor Class | $1,000 | $1,020.10 | $4.89 | 0.97% |
| I Class | $1,000 | $1,021.09 | $3.88 | 0.77% |
| Y Class | $1,000 | $1,021.84 | $3.13 | 0.62% |
| A Class | $1,000 | $1,018.85 | $6.14 | 1.22% |
| C Class | $1,000 | $1,015.11 | $9.90 | 1.97% |
| R Class | $1,000 | $1,017.60 | $7.39 | 1.47% |
| R5 Class | $1,000 | $1,021.09 | $3.88 | 0.77% |
| R6 Class | $1,000 | $1,021.84 | $3.13 | 0.62% |
| |
| (1) | Expenses are equal to the class's annualized expense ratio listed in the table above, multiplied by the average account value over the period, multiplied by 182, the number of days in the most recent fiscal half-year, divided by 365, to reflect the one-half year period. Annualized expense ratio reflects actual expenses, including any applicable fee waivers or expense reimbursements and excluding any acquired fund fees and expenses. |
MARCH 31, 2019
|
| | | | | |
| | Shares | Value |
| COMMON STOCKS — 94.3% | | |
| Aerospace and Defense — 0.4% | | |
| Textron, Inc. | 573,517 |
| $ | 29,054,371 |
|
| Airlines — 1.5% | | |
| Southwest Airlines Co. | 2,196,844 |
| 114,038,172 |
|
| Auto Components — 1.2% | | |
| Aptiv plc | 237,516 |
| 18,880,147 |
|
| BorgWarner, Inc. | 1,793,067 |
| 68,871,703 |
|
| | | 87,751,850 |
|
| Automobiles — 1.7% | | |
| Honda Motor Co. Ltd. ADR | 2,617,442 |
| 71,115,899 |
|
| Thor Industries, Inc. | 954,078 |
| 59,505,845 |
|
| | | 130,621,744 |
|
| Banks — 9.4% | | |
| BB&T Corp. | 3,395,247 |
| 157,980,843 |
|
| Comerica, Inc. | 863,204 |
| 63,290,117 |
|
| Commerce Bancshares, Inc. | 1,273,058 |
| 73,913,747 |
|
| First Hawaiian, Inc. | 3,616,018 |
| 94,197,269 |
|
| M&T Bank Corp. | 556,923 |
| 87,448,049 |
|
| Prosperity Bancshares, Inc. | 610,416 |
| 42,155,329 |
|
| SunTrust Banks, Inc. | 590,067 |
| 34,961,470 |
|
| UMB Financial Corp. | 1,364,244 |
| 87,366,186 |
|
| Westamerica Bancorporation | 1,167,010 |
| 72,121,218 |
|
| | | 713,434,228 |
|
| Beverages — 0.5% | | |
| Molson Coors Brewing Co., Class B | 610,039 |
| 36,388,826 |
|
| Building Products — 1.9% | | |
| Johnson Controls International plc | 3,498,383 |
| 129,230,268 |
|
| Masco Corp. | 466,678 |
| 18,345,112 |
|
| | | 147,575,380 |
|
| Capital Markets — 6.7% | | |
| Ameriprise Financial, Inc. | 886,976 |
| 113,621,626 |
|
| Invesco Ltd. | 5,258,367 |
| 101,539,067 |
|
| Northern Trust Corp. | 2,529,810 |
| 228,720,122 |
|
| State Street Corp. | 1,060,563 |
| 69,795,651 |
|
| | | 513,676,466 |
|
| Commercial Services and Supplies — 0.5% | | |
| Republic Services, Inc. | 463,385 |
| 37,246,886 |
|
| Containers and Packaging — 3.5% | | |
| Graphic Packaging Holding Co. | 8,265,949 |
| 104,398,936 |
|
| Packaging Corp. of America | 510,572 |
| 50,740,645 |
|
| Sonoco Products Co. | 1,091,772 |
| 67,176,731 |
|
|
| | | | | |
| | Shares | Value |
| WestRock Co. | 1,096,782 |
| $ | 42,061,590 |
|
| | | 264,377,902 |
|
| Distributors — 0.7% | | |
| Genuine Parts Co. | 486,618 |
| 54,515,815 |
|
| Electric Utilities — 4.6% | | |
| Edison International | 834,122 |
| 51,648,834 |
|
| Eversource Energy | 738,556 |
| 52,400,548 |
|
| Pinnacle West Capital Corp. | 1,033,839 |
| 98,814,332 |
|
| Xcel Energy, Inc. | 2,655,732 |
| 149,278,696 |
|
| | | 352,142,410 |
|
| Electrical Equipment — 6.6% | | |
| Eaton Corp. plc | 949,663 |
| 76,504,851 |
|
| Emerson Electric Co. | 1,394,983 |
| 95,514,486 |
|
| Hubbell, Inc. | 1,680,090 |
| 198,217,018 |
|
| nVent Electric plc | 2,468,478 |
| 66,599,537 |
|
| Schneider Electric SE | 791,925 |
| 62,130,646 |
|
| | | 498,966,538 |
|
| Electronic Equipment, Instruments and Components — 1.0% | | |
| TE Connectivity Ltd. | 933,370 |
| 75,369,628 |
|
| Energy Equipment and Services — 2.0% | | |
| Baker Hughes a GE Co. | 3,050,289 |
| 84,554,011 |
|
| Halliburton Co. | 1,295,646 |
| 37,962,428 |
|
| National Oilwell Varco, Inc. | 1,258,896 |
| 33,536,989 |
|
| | | 156,053,428 |
|
| Equity Real Estate Investment Trusts (REITs) — 4.9% | | |
| American Tower Corp. | 172,783 |
| 34,048,618 |
|
| Empire State Realty Trust, Inc., Class A | 2,359,296 |
| 37,276,877 |
|
| MGM Growth Properties LLC, Class A | 2,565,939 |
| 82,751,533 |
|
| Piedmont Office Realty Trust, Inc., Class A | 3,307,115 |
| 68,953,348 |
|
| Weyerhaeuser Co. | 5,566,793 |
| 146,629,327 |
|
| | | 369,659,703 |
|
| Food and Staples Retailing — 0.9% | | |
| Sysco Corp. | 1,083,609 |
| 72,341,737 |
|
| Food Products — 4.7% | | |
| Conagra Brands, Inc. | 2,807,323 |
| 77,875,140 |
|
| J.M. Smucker Co. (The) | 361,865 |
| 42,157,273 |
|
| Kellogg Co. | 705,837 |
| 40,500,927 |
|
| Mondelez International, Inc., Class A | 1,986,098 |
| 99,146,012 |
|
| Orkla ASA | 13,216,116 |
| 101,439,067 |
|
| | | 361,118,419 |
|
| Gas Utilities — 1.6% | | |
| Atmos Energy Corp. | 563,020 |
| 57,951,648 |
|
| Spire, Inc. | 746,151 |
| 61,400,766 |
|
| | | 119,352,414 |
|
| Health Care Equipment and Supplies — 4.1% | | |
Hologic, Inc.(1) | 712,021 |
| 34,461,816 |
|
| Siemens Healthineers AG | 1,206,568 |
| 50,281,336 |
|
|
| | | | | |
| | Shares | Value |
| Zimmer Biomet Holdings, Inc. | 1,769,581 |
| $ | 225,975,494 |
|
| | | 310,718,646 |
|
| Health Care Providers and Services — 4.4% | | |
| Cardinal Health, Inc. | 2,107,969 |
| 101,498,707 |
|
Henry Schein, Inc.(1) | 928,105 |
| 55,788,392 |
|
| McKesson Corp. | 638,419 |
| 74,733,328 |
|
| Quest Diagnostics, Inc. | 1,138,460 |
| 102,370,323 |
|
| | | 334,390,750 |
|
| Health Care Technology — 1.0% | | |
Cerner Corp.(1) | 1,314,357 |
| 75,194,364 |
|
| Hotels, Restaurants and Leisure — 1.7% | | |
| Carnival Corp. | 1,218,192 |
| 61,786,698 |
|
| Sodexo SA | 624,283 |
| 68,740,431 |
|
| | | 130,527,129 |
|
| Household Durables — 1.0% | | |
| PulteGroup, Inc. | 2,772,579 |
| 77,521,309 |
|
| Household Products — 1.0% | | |
| Kimberly-Clark Corp. | 623,888 |
| 77,299,723 |
|
| Insurance — 5.1% | | |
| Aflac, Inc. | 945,622 |
| 47,281,100 |
|
| Arthur J. Gallagher & Co. | 294,187 |
| 22,976,005 |
|
| Brown & Brown, Inc. | 1,417,942 |
| 41,843,468 |
|
| Chubb Ltd. | 828,689 |
| 116,082,755 |
|
| ProAssurance Corp. | 982,715 |
| 34,011,766 |
|
| Reinsurance Group of America, Inc. | 519,801 |
| 73,801,346 |
|
| Torchmark Corp. | 312,526 |
| 25,611,506 |
|
| Travelers Cos., Inc. (The) | 199,600 |
| 27,377,136 |
|
| | | 388,985,082 |
|
| Machinery — 3.7% | | |
| Atlas Copco AB, B Shares | 2,416,635 |
| 59,809,591 |
|
| Cummins, Inc. | 629,385 |
| 99,361,010 |
|
| IMI plc | 6,026,961 |
| 75,201,211 |
|
| PACCAR, Inc. | 725,578 |
| 49,440,885 |
|
| | | 283,812,697 |
|
| Multi-Utilities — 3.2% | | |
| Ameren Corp. | 1,145,831 |
| 84,275,870 |
|
| NorthWestern Corp. | 1,538,815 |
| 108,347,964 |
|
| WEC Energy Group, Inc. | 657,275 |
| 51,977,307 |
|
| | | 244,601,141 |
|
| Multiline Retail — 0.7% | | |
| Target Corp. | 706,445 |
| 56,699,276 |
|
| Oil, Gas and Consumable Fuels — 5.2% | | |
| Anadarko Petroleum Corp. | 1,145,451 |
| 52,095,112 |
|
| Cimarex Energy Co. | 785,537 |
| 54,909,036 |
|
| Devon Energy Corp. | 2,426,484 |
| 76,579,835 |
|
| EQT Corp. | 2,702,862 |
| 56,057,358 |
|
| Equitrans Midstream Corp. | 2,162,289 |
| 47,094,654 |
|
|
| | | | | | |
| | Shares/Principal Amount | Value |
| Imperial Oil Ltd. | 1,191,609 |
| $ | 32,528,826 |
|
| Noble Energy, Inc. | 3,048,527 |
| 75,390,073 |
|
| | | 394,654,894 |
|
| Road and Rail — 1.0% | | |
| Heartland Express, Inc. | 3,967,411 |
| 76,491,684 |
|
| Semiconductors and Semiconductor Equipment — 3.7% | | |
| Applied Materials, Inc. | 2,173,864 |
| 86,215,446 |
|
| Maxim Integrated Products, Inc. | 1,741,805 |
| 92,611,772 |
|
| Microchip Technology, Inc. | 732,528 |
| 60,770,523 |
|
| Teradyne, Inc. | 1,007,390 |
| 40,134,418 |
|
| | | 279,732,159 |
|
| Specialty Retail — 1.1% | | |
| Advance Auto Parts, Inc. | 479,306 |
| 81,736,052 |
|
| Technology Hardware, Storage and Peripherals — 0.7% | | |
| HP, Inc. | 2,717,632 |
| 52,803,590 |
|
| Thrifts and Mortgage Finance — 1.0% | | |
| Capitol Federal Financial, Inc. | 5,644,927 |
| 75,359,775 |
|
| Trading Companies and Distributors — 1.4% | | |
| MSC Industrial Direct Co., Inc., Class A | 1,256,314 |
| 103,909,731 |
|
TOTAL COMMON STOCKS
(Cost $6,444,954,795) | | 7,178,123,919 |
|
| EXCHANGE-TRADED FUNDS — 3.0% | | |
iShares Russell Mid-Cap Value ETF
(Cost $221,384,420) | 2,642,457 |
| 229,523,815 |
|
| TEMPORARY CASH INVESTMENTS — 2.6% | | |
Federal Home Loan Bank Discount Notes, 2.30%, 4/1/19(2) | $ | 100,000,000 |
| 100,000,000 |
|
| Repurchase Agreement, BMO Capital Markets Corp., (collateralized by various U.S. Treasury obligations, 0.125% - 2.875%, 9/30/19 - 2/15/44, valued at $84,391,552), in a joint trading account at 2.35%, dated 3/29/19, due 4/1/19 (Delivery value $82,721,897) | | 82,705,700 |
|
| Repurchase Agreement, Fixed Income Clearing Corp., (collateralized by various U.S. Treasury obligations, 2.50%, 8/15/23, valued at $14,102,823), at 1.25%, dated 3/29/19, due 4/1/19 (Delivery value $13,825,440) | | 13,824,000 |
|
| State Street Institutional U.S. Government Money Market Fund, Premier Class | 43,869 |
| 43,869 |
|
TOTAL TEMPORARY CASH INVESTMENTS
(Cost $196,573,569) | | 196,573,569 |
|
TOTAL INVESTMENT SECURITIES — 99.9%
(Cost $6,862,912,784) | | 7,604,221,303 |
|
| OTHER ASSETS AND LIABILITIES — 0.1% | | 8,372,630 |
|
| TOTAL NET ASSETS — 100.0% | | $ | 7,612,593,933 |
|
|
| | | | | | | | |
| FORWARD FOREIGN CURRENCY EXCHANGE CONTRACTS |
| Currency Purchased | Currency Sold | Counterparty | Settlement Date | Unrealized Appreciation
(Depreciation) |
| CAD | 1,347,114 | USD | 1,008,464 | Morgan Stanley | 6/28/19 | $ | 1,778 |
|
| USD | 28,124,286 | CAD | 37,658,419 | Morgan Stanley | 6/28/19 | (116,918 | ) |
| EUR | 4,137,260 | USD | 4,676,792 | Credit Suisse AG | 6/28/19 | (1,633 | ) |
| USD | 159,226,531 | EUR | 139,559,768 | Credit Suisse AG | 6/28/19 | 1,522,143 |
|
| GBP | 1,408,802 | USD | 1,871,533 | JPMorgan Chase Bank N.A. | 6/28/19 | (28,685 | ) |
| USD | 65,597,943 | GBP | 49,487,377 | JPMorgan Chase Bank N.A. | 6/28/19 | 863,710 |
|
| USD | 44,038,582 | JPY | 4,813,483,066 | Bank of America N.A. | 6/28/19 | 311,237 |
|
| NOK | 17,475,543 | USD | 2,030,412 | Goldman Sachs & Co. | 6/28/19 | 2,520 |
|
| USD | 88,162,823 | NOK | 749,463,344 | Goldman Sachs & Co. | 6/28/19 | 977,637 |
|
| USD | 50,839,388 | SEK | 466,187,016 | Goldman Sachs & Co. | 6/28/19 | 369,226 |
|
| | | | | | | $ | 3,901,015 |
|
|
| | |
| NOTES TO SCHEDULE OF INVESTMENTS |
| ADR | - | American Depositary Receipt |
| CAD | - | Canadian Dollar |
| EUR | - | Euro |
| GBP | - | British Pound |
| JPY | - | Japanese Yen |
| NOK | - | Norwegian Krone |
| SEK | - | Swedish Krona |
| USD | - | United States Dollar |
| |
| (2) | The rate indicated is the yield to maturity at purchase. |
See Notes to Financial Statements.
|
|
| Statement of Assets and Liabilities |
|
| | | |
| MARCH 31, 2019 | |
| Assets | |
| Investment securities, at value (cost of $6,862,912,784) | $ | 7,604,221,303 |
|
| Receivable for investments sold | 17,459,774 |
|
| Receivable for capital shares sold | 6,364,488 |
|
| Unrealized appreciation on forward foreign currency exchange contracts | 4,048,251 |
|
| Dividends and interest receivable | 13,641,425 |
|
| | 7,645,735,241 |
|
| | |
| Liabilities | |
| Payable for investments purchased | 16,011,601 |
|
| Payable for capital shares redeemed | 11,374,011 |
|
| Unrealized depreciation on forward foreign currency exchange contracts | 147,236 |
|
| Accrued management fees | 5,409,025 |
|
| Distribution and service fees payable | 199,435 |
|
| | 33,141,308 |
|
| | |
| Net Assets | $ | 7,612,593,933 |
|
| | |
| Net Assets Consist of: | |
| Capital (par value and paid-in surplus) | $ | 7,009,260,768 |
|
| Distributable earnings | 603,333,165 |
|
| | $ | 7,612,593,933 |
|
|
| | | | | |
| | Net Assets | Shares Outstanding | Net Asset Value Per Share |
| Investor Class, $0.01 Par Value |
| $3,514,131,423 |
| 231,273,232 | $15.19 |
| I Class, $0.01 Par Value |
| $1,535,449,317 |
| 100,983,100 | $15.21 |
| Y Class, $0.01 Par Value |
| $16,061,280 |
| 1,055,880 | $15.21 |
| A Class, $0.01 Par Value |
| $358,500,377 |
| 23,644,306 | $15.16* |
| C Class, $0.01 Par Value |
| $94,909,532 |
| 6,334,232 | $14.98 |
| R Class, $0.01 Par Value |
| $96,701,205 |
| 6,397,609 | $15.12 |
| R5 Class, $0.01 Par Value |
| $58,526,051 |
| 3,847,926 | $15.21 |
| R6 Class, $0.01 Par Value |
| $1,938,314,748 |
| 127,491,274 | $15.20 |
* Maximum offering price $16.08 (net asset value divided by 0.9425).
See Notes to Financial Statements.
|
| | | |
| YEAR ENDED MARCH 31, 2019 | |
| Investment Income (Loss) | |
| Income: | |
| Dividends (including $2,289,573 from affiliates and net of foreign taxes withheld of $1,394,910) | $ | 182,318,264 |
|
| Interest | 3,820,384 |
|
| | 186,138,648 |
|
| | |
| Expenses: | |
| Management fees | 70,168,557 |
|
| Distribution and service fees: | |
| A Class | 1,115,724 |
|
| C Class | 1,181,295 |
|
| R Class | 528,497 |
|
| Directors' fees and expenses | 220,918 |
|
| Other expenses | 4,173 |
|
| | 73,219,164 |
|
Fees waived(1) | (2,950,612 | ) |
| | 70,268,552 |
|
| | |
| Net investment income (loss) | 115,870,096 |
|
| | |
| Realized and Unrealized Gain (Loss) | |
| Net realized gain (loss) on: | |
| Investment transactions (including $39,419,773 from affiliates) | 453,359,597 |
|
| Forward foreign currency exchange contract transactions | 27,393,784 |
|
| Foreign currency translation transactions | (28,585 | ) |
| | 480,724,796 |
|
| | |
| Change in net unrealized appreciation (depreciation) on: | |
| Investments (including $4,100,285 from affiliates) | (535,709,317 | ) |
| Forward foreign currency exchange contracts | 3,368,027 |
|
| Translation of assets and liabilities in foreign currencies | (2,441 | ) |
| | (532,343,731 | ) |
| | |
| Net realized and unrealized gain (loss) | (51,618,935 | ) |
| | |
| Net Increase (Decrease) in Net Assets Resulting from Operations | $ | 64,251,161 |
|
| |
| (1) | Amount consists of $1,425,370, $640,887, $2,537, $168,462, $44,347, $39,356, $14,993 and $614,660 for Investor Class, I Class, Y Class, A Class, C Class, R Class, R5 Class and R6 Class, respectively. |
See Notes to Financial Statements.
|
|
| Statement of Changes in Net Assets |
|
| | | | | | |
| YEARS ENDED MARCH 31, 2019 AND MARCH 31, 2018 |
| Increase (Decrease) in Net Assets | March 31, 2019 | March 31, 2018 |
| Operations | | |
| Net investment income (loss) | $ | 115,870,096 |
| $ | 142,330,750 |
|
| Net realized gain (loss) | 480,724,796 |
| 767,738,192 |
|
| Change in net unrealized appreciation (depreciation) | (532,343,731 | ) | (425,161,721 | ) |
| Net increase (decrease) in net assets resulting from operations | 64,251,161 |
| 484,907,221 |
|
| | | |
| Distributions to Shareholders | | |
From earnings:(1) | | |
| Investor Class | (421,857,048 | ) | (397,967,429 | ) |
| I Class | (199,006,704 | ) | (181,184,424 | ) |
| Y Class | (1,294,431 | ) | (1,501 | ) |
| A Class | (45,643,306 | ) | (54,304,797 | ) |
| C Class | (11,830,967 | ) | (12,007,752 | ) |
| R Class | (11,094,927 | ) | (11,490,512 | ) |
| R5 Class | (5,849,134 | ) | (11,797 | ) |
| R6 Class | (196,398,747 | ) | (135,258,598 | ) |
| Decrease in net assets from distributions | (892,975,264 | ) | (792,226,810 | ) |
| | | |
| Capital Share Transactions | | |
| Net increase (decrease) in net assets from capital share transactions (Note 5) | 50,729,211 |
| (240,542,398 | ) |
| | | |
| Net increase (decrease) in net assets | (777,994,892 | ) | (547,861,987 | ) |
| | | |
| Net Assets | | |
| Beginning of period | 8,390,588,825 |
| 8,938,450,812 |
|
| End of period | $ | 7,612,593,933 |
| $ | 8,390,588,825 |
|
| |
| (1) | Prior period presentation has been updated to reflect the current period combination of distributions to shareholders from net investment income and net realized gains. Distributions from net investment income were $(69,026,226), $(33,335,729), $(1,106), $(8,178,699), $(902,988), $(1,415,843), $(1,629) and $(26,678,396) for Investor Class, I Class, Y Class, A Class, C Class, R Class, R5 Class and R6 Class, respectively. Distributions from net realized gains were $(328,941,203), $(147,848,695), $(395), $(46,126,098), $(11,104,764), $(10,074,669), $(10,168) and $(108,580,202) for Investor Class, I Class, Y Class, A Class, C Class, R Class, R5 Class and R6 Class, respectively. |
See Notes to Financial Statements.
|
|
Notes to Financial Statements |
MARCH 31, 2019
1. Organization
American Century Capital Portfolios, Inc. (the corporation) is registered under the Investment Company Act of 1940, as amended (the 1940 Act), as an open-end management investment company and is organized as a Maryland corporation. Mid Cap Value Fund (the fund) is one fund in a series issued by the corporation. The fund’s investment objective is to seek long-term capital growth. Income is a secondary objective.
The fund offers the Investor Class, I Class, Y Class, A Class, C Class, R Class, R5 Class and R6 Class. The A Class may incur an initial sales charge. The A Class and C Class may be subject to a contingent deferred sales charge. Sale of the Y Class and R5 Class commenced on April 10, 2017.
2. Significant Accounting Policies
The following is a summary of significant accounting policies consistently followed by the fund in preparation of its financial statements. The fund is an investment company and follows accounting and reporting guidance in accordance with accounting principles generally accepted in the United States of America. This may require management to make certain estimates and assumptions at the date of the financial statements. Actual results could differ from these estimates. Management evaluated the impact of events or transactions occurring through the date the financial statements were issued that would merit recognition or disclosure.
Investment Valuations — The fund determines the fair value of its investments and computes its net asset value per share at the close of regular trading (usually 4 p.m. Eastern time) on the New York Stock Exchange (NYSE) on each day the NYSE is open. The Board of Directors has adopted valuation policies and procedures to guide the investment advisor in the fund’s investment valuation process and to provide methodologies for the oversight of the fund’s pricing function.
Equity securities that are listed or traded on a domestic securities exchange are valued at the last reported sales price or at the official closing price as provided by the exchange. Equity securities traded on foreign securities exchanges are generally valued at the closing price of such securities on the exchange where primarily traded or at the close of the NYSE, if that is earlier. If no last sales price is reported, or if local convention or regulation so provides, the mean of the latest bid and asked prices may be used. Securities traded over-the-counter are valued at the mean of the latest bid and asked prices, the last sales price, or the official closing price. Equity securities initially expressed in local currencies are translated into U.S. dollars at the mean of the appropriate currency exchange rate at the close of the NYSE as provided by an independent pricing service.
Fixed income securities are valued at the evaluated mean as provided by independent pricing services or at the mean of the most recent bid and asked prices as provided by investment dealers. U.S. Treasury and Government Agency securities are valued using market models that consider trade data, quotations from dealers and active market makers, relevant yield curve and spread data, creditworthiness, trade data or market information on comparable securities, and other relevant security specific information.
Open-end management investment companies are valued at the reported net asset value per share. Repurchase agreements are valued at cost, which approximates fair value. Forward foreign currency exchange contracts are valued at the mean of the appropriate forward exchange rate at the close of the NYSE as provided by an independent pricing service.
If the fund determines that the market price for an investment is not readily available or the valuation methods mentioned above do not reflect an investment’s fair value, such investment is valued as determined in good faith by the Board of Directors or its delegate, in accordance with policies and procedures adopted by the Board of Directors. In its determination of fair value, the fund may review several factors including, but not limited to, market information regarding the specific investment or comparable investments and correlation with other investment types, futures indices or general market indicators. Circumstances that may cause the fund to use these procedures to value an investment include, but are not limited to: an investment has been declared in default or is distressed; trading in a security has been suspended during the trading day or a security is not actively trading on its principal exchange; prices received from a regular pricing source are deemed unreliable; or there is a foreign market holiday and no trading occurred.
The fund monitors for significant events occurring after the close of an investment’s primary exchange but before the fund’s net asset value per share is determined. Significant events may include, but are not limited to: corporate announcements and transactions; governmental action and political unrest that could impact a specific investment or an investment sector; or armed conflicts, natural disasters and similar events that could affect investments in a specific country or region. The fund also monitors for significant fluctuations between domestic and foreign markets, as evidenced by the U.S. market or such other indicators that the Board of Directors, or its delegate, deems appropriate. If significant fluctuations in foreign markets are identified, the fund may apply a model-derived factor to the closing price of equity securities traded on foreign securities exchanges. The factor is based on observable market data as provided by an independent pricing service.
Security Transactions — Security transactions are accounted for as of the trade date. Net realized gains and losses are determined on the identified cost basis, which is also used for federal income tax purposes.
Investment Income — Dividend income less foreign taxes withheld, if any, is recorded as of the ex-dividend date. Distributions received on securities that represent a return of capital or long-term capital gain are recorded as a reduction of cost of investments and/or as a realized gain. The fund may estimate the components of distributions received that may be considered nontaxable distributions or long-term capital gain distributions for income tax purposes. Interest income is recorded on the accrual basis and includes accretion of discounts and amortization of premiums.
Foreign Currency Translations — All assets and liabilities initially expressed in foreign currencies are translated into U.S. dollars at prevailing exchange rates at period end. The fund may enter into spot foreign currency exchange contracts to facilitate transactions denominated in a foreign currency. Purchases and sales of investment securities, dividend and interest income, spot foreign currency exchange contracts, and expenses are translated at the rates of exchange prevailing on the respective dates of such transactions. Net realized and unrealized foreign currency exchange gains or losses related to investment securities are a component of net realized gain (loss) on investment transactions and change in net unrealized appreciation (depreciation) on investments, respectively.
Repurchase Agreements — The fund may enter into repurchase agreements with institutions that American Century Investment Management, Inc. (ACIM) (the investment advisor) has determined are creditworthy pursuant to criteria adopted by the Board of Directors. The fund requires that the collateral, represented by securities, received in a repurchase transaction be transferred to the custodian in a manner sufficient to enable the fund to obtain those securities in the event of a default under the repurchase agreement. ACIM monitors, on a daily basis, the securities transferred to ensure the value, including accrued interest, of the securities under each repurchase agreement is equal to or greater than amounts owed to the fund under each repurchase agreement.
Joint Trading Account — Pursuant to an Exemptive Order issued by the Securities and Exchange Commission, the fund, along with certain other funds in the American Century Investments family of funds, may transfer uninvested cash balances into a joint trading account. These balances are invested in one or more repurchase agreements that are collateralized by U.S. Treasury or Agency obligations.
Income Tax Status — It is the fund’s policy to distribute substantially all net investment income and net realized gains to shareholders and to otherwise qualify as a regulated investment company under provisions of the Internal Revenue Code. Accordingly, no provision has been made for income taxes. The fund files U.S. federal, state, local and non-U.S. tax returns as applicable. The fund's tax returns are subject to examination by the relevant taxing authority until expiration of the applicable statute of limitations, which is generally three years from the date of filing but can be longer in certain jurisdictions. At this time, management believes there are no uncertain tax positions which, based on their technical merit, would not be sustained upon examination and for which it is reasonably possible that the total amounts of unrecognized tax benefits will significantly change in the next twelve months.
Multiple Class — All shares of the fund represent an equal pro rata interest in the net assets of the class to which such shares belong, and have identical voting, dividend, liquidation and other rights and the same terms and conditions, except for class specific expenses and exclusive rights to vote on matters affecting only individual classes. Income, non-class specific expenses, and realized and unrealized capital gains and losses of the fund are allocated to each class of shares based on their relative net assets.
Distributions to Shareholders — Distributions from net investment income, if any, are generally declared and paid quarterly. Distributions from net realized gains, if any, are generally declared and paid annually.
Indemnifications — Under the corporation’s organizational documents, its officers and directors are indemnified against certain liabilities arising out of the performance of their duties to the fund. In addition, in the normal course of business, the fund enters into contracts that provide general indemnifications. The maximum exposure under these arrangements is unknown as this would involve future claims that may be made against a fund. The risk of material loss from such claims is considered by management to be remote.
3. Fees and Transactions with Related Parties
Certain officers and directors of the corporation are also officers and/or directors of American Century Companies, Inc. (ACC). The corporation’s investment advisor, ACIM, the corporation's distributor, American Century Investment Services, Inc. (ACIS), and the corporation’s transfer agent, American Century Services, LLC, are wholly owned, directly or indirectly, by ACC.
Management Fees — The corporation has entered into a management agreement with ACIM, under which ACIM provides the fund with investment advisory and management services in exchange for a single, unified management fee (the fee) per class. The agreement provides that all expenses of managing and operating the fund, except distribution and service fees, brokerage expenses, taxes, interest, fees and expenses of the independent directors (including legal counsel fees), and extraordinary expenses, will be paid by ACIM. The fee is computed and accrued daily based on each class's daily net assets and paid monthly in arrears. The difference in the fee among the classes is a result of their separate arrangements for non-Rule 12b-1 shareholder services. It is not the result of any difference in advisory or custodial fees or other expenses related to the management of the fund’s assets, which do not vary by class. From April 1, 2018 through July 31, 2018, the investment advisor agreed to waive 0.05% of the fund's management fee. Effective August 1, 2018, the investment advisor agreed to waive 0.03% of the fund's management fee. The investment advisor expects this waiver to continue until July 31, 2019 and cannot terminate it prior to such date without the approval of the Board of Directors.
The annual management fee and the effective annual management fee after waiver for each class for the period ended March 31, 2019 are as follows:
|
| | |
| | Annual Management Fee | Effective Annual Management Fee After Waiver |
| Investor Class | 1.00% | 0.96% |
| I Class | 0.80% | 0.76% |
| Y Class | 0.65% | 0.61% |
| A Class | 1.00% | 0.96% |
| C Class | 1.00% | 0.96% |
| R Class | 1.00% | 0.96% |
| R5 Class | 0.80% | 0.76% |
| R6 Class | 0.65% | 0.61% |
Distribution and Service Fees — The Board of Directors has adopted a separate Master Distribution and Individual Shareholder Services Plan for each of the A Class, C Class and R Class (collectively the plans), pursuant to Rule 12b-1 of the 1940 Act. The plans provide that the A Class will pay ACIS an annual distribution and service fee of 0.25%. The plans provide that the C Class will pay ACIS an annual distribution and service fee of 1.00%, of which 0.25% is paid for individual shareholder services and 0.75% is paid for distribution services. The plans provide that the R Class will pay ACIS an annual distribution and service fee of 0.50%. The fees are computed and accrued daily based on each class’s daily net assets and paid monthly in arrears. The fees are used to pay financial intermediaries for distribution and individual shareholder services. Fees incurred under the plans during the period ended March 31, 2019 are detailed in the Statement of Operations.
Directors' Fees and Expenses — The Board of Directors is responsible for overseeing the investment advisor’s management and operations of the fund. The directors receive detailed information about the fund and its investment advisor regularly throughout the year, and meet at least quarterly with management of the investment advisor to review reports about fund operations. The fund’s officers do not receive compensation from the fund.
Interfund Transactions — The fund may enter into security transactions with other American Century Investments funds and other client accounts of the investment advisor, in accordance with the 1940 Act rules and procedures adopted by the Board of Directors. The rules and procedures require, among other things, that these transactions be effected at the independent current market price of the security. During the period, the interfund purchases and sales were $45,475,359 and $78,960,237, respectively. The effect of interfund transactions on the Statement of Operations was $10,938,460 in net realized gain (loss) on investment transactions.
4. Investment Transactions
Purchases and sales of investment securities, excluding short-term investments, for the period ended March 31, 2019 were $4,117,512,964 and $4,816,954,440, respectively.
5. Capital Share Transactions
Transactions in shares of the fund were as follows:
|
| | | | | | | | | | |
| | Year ended
March 31, 2019 | Year ended
March 31, 2018(1) |
| | Shares | Amount | Shares | Amount |
| Investor Class/Shares Authorized | 1,600,000,000 |
| | 1,500,000,000 |
| |
| Sold | 29,281,089 |
| $ | 479,115,289 |
| 52,148,585 |
| $ | 926,733,097 |
|
| Issued in reinvestment of distributions | 28,900,782 |
| 417,721,419 |
| 22,618,241 |
| 394,404,052 |
|
| Redeemed | (73,978,700 | ) | (1,211,860,870 | ) | (92,664,226 | ) | (1,650,942,627 | ) |
| | (15,796,829 | ) | (315,024,162 | ) | (17,897,400 | ) | (329,805,478 | ) |
| I Class/Shares Authorized | 800,000,000 |
| | 800,000,000 |
| |
| Sold | 26,204,693 |
| 432,486,638 |
| 46,014,891 |
| 820,456,378 |
|
| Issued in reinvestment of distributions | 12,535,312 |
| 181,672,401 |
| 9,275,295 |
| 161,888,494 |
|
| Redeemed | (42,594,448 | ) | (674,728,415 | ) | (42,062,105 | ) | (753,279,422 | ) |
| | (3,854,443 | ) | (60,569,376 | ) | 13,228,081 |
| 229,065,450 |
|
| Y Class/Shares Authorized | 70,000,000 |
| | 50,000,000 |
| |
| Sold | 1,238,573 |
| 20,627,236 |
| 33,331 |
| 582,885 |
|
| Issued in reinvestment of distributions | 81,860 |
| 1,181,629 |
| 86 |
| 1,501 |
|
| Redeemed | (297,967 | ) | (4,892,427 | ) | (3 | ) | (58 | ) |
| | 1,022,466 |
| 16,916,438 |
| 33,414 |
| 584,328 |
|
| A Class/Shares Authorized | 225,000,000 |
| | 300,000,000 |
| |
| Sold | 4,440,855 |
| 71,286,193 |
| 6,291,603 |
| 111,898,706 |
|
| Issued in reinvestment of distributions | 2,919,299 |
| 42,024,485 |
| 2,914,841 |
| 50,699,575 |
|
| Redeemed | (15,370,108 | ) | (251,287,162 | ) | (33,324,071 | ) | (593,005,750 | ) |
| | (8,009,954 | ) | (137,976,484 | ) | (24,117,627 | ) | (430,407,469 | ) |
| C Class/Shares Authorized | 60,000,000 |
| | 60,000,000 |
| |
| Sold | 275,778 |
| 4,299,710 |
| 386,424 |
| 6,784,394 |
|
| Issued in reinvestment of distributions | 791,241 |
| 11,153,466 |
| 658,516 |
| 11,314,159 |
|
| Redeemed | (2,735,564 | ) | (42,650,699 | ) | (2,194,984 | ) | (38,644,638 | ) |
| | (1,668,545 | ) | (27,197,523 | ) | (1,150,044 | ) | (20,546,085 | ) |
| R Class/Shares Authorized | 60,000,000 |
| | 60,000,000 |
| |
| Sold | 1,151,992 |
| 18,427,617 |
| 907,607 |
| 16,056,712 |
|
| Issued in reinvestment of distributions | 771,057 |
| 11,028,708 |
| 657,132 |
| 11,386,397 |
|
| Redeemed | (2,578,965 | ) | (42,234,447 | ) | (3,086,353 | ) | (54,812,335 | ) |
| | (655,916 | ) | (12,778,122 | ) | (1,521,614 | ) | (27,369,226 | ) |
| R5 Class/Shares Authorized | 30,000,000 |
| | 50,000,000 |
| |
| Sold | 3,908,660 |
| 66,466,749 |
| 22,773 |
| 411,867 |
|
| Issued in reinvestment of distributions | 404,046 |
| 5,849,134 |
| 677 |
| 11,797 |
|
| Redeemed | (483,091 | ) | (7,788,943 | ) | (5,139 | ) | (91,450 | ) |
| | 3,829,615 |
| 64,526,940 |
| 18,311 |
| 332,214 |
|
| R6 Class/Shares Authorized | 700,000,000 |
| | 440,000,000 |
| |
| Sold | 45,719,202 |
| 718,717,319 |
| 37,989,352 |
| 680,475,487 |
|
| Issued in reinvestment of distributions | 13,543,023 |
| 196,398,747 |
| 7,747,040 |
| 135,258,598 |
|
| Redeemed | (24,053,371 | ) | (392,284,566 | ) | (26,731,710 | ) | (478,130,217 | ) |
| | 35,208,854 |
| 522,831,500 |
| 19,004,682 |
| 337,603,868 |
|
| Net increase (decrease) | 10,075,248 |
| $ | 50,729,211 |
| (12,402,197 | ) | $ | (240,542,398 | ) |
| |
| (1) | April 10, 2017 (commencement of sale) through March 31, 2018 for the Y Class and R5 Class. |
6. Fair Value Measurements
The fund’s investments valuation process is based on several considerations and may use multiple inputs to determine the fair value of the investments held by the fund. In conformity with accounting principles generally accepted in the United States of America, the inputs used to determine a valuation are classified into three broad levels.
| |
| • | Level 1 valuation inputs consist of unadjusted quoted prices in an active market for identical investments. |
| |
| • | Level 2 valuation inputs consist of direct or indirect observable market data (including quoted prices for comparable investments, evaluations of subsequent market events, interest rates, prepayment speeds, credit risk, etc.). These inputs also consist of quoted prices for identical investments initially expressed in local currencies that are adjusted through translation into U.S. dollars. |
| |
| • | Level 3 valuation inputs consist of unobservable data (including a fund’s own assumptions). |
The level classification is based on the lowest level input that is significant to the fair valuation measurement. The valuation inputs are not necessarily an indication of the risks associated with investing in these securities or other financial instruments.
The following is a summary of the level classifications as of period end. The Schedule of Investments provides additional information on the fund’s portfolio holdings.
|
| | | | | | | | |
| | Level 1 | Level 2 | Level 3 |
| Assets | | | |
| Investment Securities | | | |
| Common Stocks | | | |
| Electrical Equipment | $ | 436,835,892 |
| $ | 62,130,646 |
| — |
|
| Food Products | 259,679,352 |
| 101,439,067 |
| — |
|
| Health Care Equipment and Supplies | 260,437,310 |
| 50,281,336 |
| — |
|
| Hotels, Restaurants and Leisure | 61,786,698 |
| 68,740,431 |
| — |
|
| Machinery | 148,801,895 |
| 135,010,802 |
| — |
|
| Oil, Gas and Consumable Fuels | 362,126,068 |
| 32,528,826 |
| — |
|
| Other Industries | 5,198,325,596 |
| — |
| — |
|
| Exchange-Traded Funds | 229,523,815 |
| — |
| — |
|
| Temporary Cash Investments | 43,869 |
| 196,529,700 |
| — |
|
| | $ | 6,957,560,495 |
| $ | 646,660,808 |
| — |
|
| Other Financial Instruments | | | |
| Forward Foreign Currency Exchange Contracts | — |
| $ | 4,048,251 |
| — |
|
| | | | |
| Liabilities | | | |
| Other Financial Instruments | | | |
| Forward Foreign Currency Exchange Contracts | — |
| $ | 147,236 |
| — |
|
7. Affiliated Company Transactions
If a fund's holding represents ownership of 5% or more of the voting securities of a company, the company is affiliated as defined in the 1940 Act. A summary of transactions for each company which is or was an affiliate at or during the period ended March 31, 2019 follows (amounts in thousands):
|
| | | | | | | | | | | | | | | | | | | | | | |
| Company | Beginning
Value | Purchase
Cost | Sales Cost | Change in Net
Unrealized
Appreciation
(Depreciation) | Ending
Value | Ending
Shares | Net Realized
Gain (Loss) | Income |
LifePoint Health, Inc.(1)(2) | $ | 101,555 |
| $ | 1,662 |
| $ | 105,152 |
| $ | 1,935 |
| — |
| — |
| $ | 36,316 |
| — |
|
Westamerica Bancorporation(1) | 87,018 |
| 4,968 |
| 22,030 |
| 2,165 |
| (1 | ) | (1 | ) | 3,104 |
| $ | 2,290 |
|
| | $ | 188,573 |
| $ | 6,630 |
| $ | 127,182 |
| $ | 4,100 |
| — |
| — |
| $ | 39,420 |
| $ | 2,290 |
|
| |
| (1) | Company was not an affiliate at March 31, 2019. |
8. Derivative Instruments
Foreign Currency Risk — The fund is subject to foreign currency exchange rate risk in the normal course of pursuing its investment objectives. The value of foreign investments held by a fund may be significantly affected by changes in foreign currency exchange rates. The dollar value of a foreign security generally decreases when the value of the dollar rises against the foreign currency in which the security is denominated and tends to increase when the value of the dollar declines against such foreign currency. A fund may enter into forward foreign currency exchange contracts to reduce a fund's exposure to foreign currency exchange rate fluctuations. The net U.S. dollar value of foreign currency underlying all contractual commitments held by a fund and the resulting unrealized appreciation or depreciation are determined daily. Realized gain or loss is recorded upon the termination of the contract. Net realized and unrealized gains or losses occurring during the holding period of forward foreign currency exchange contracts are a component of net realized gain (loss) on forward foreign currency exchange contract transactions and change in net unrealized appreciation (depreciation) on forward foreign currency exchange contracts, respectively. A fund bears the risk of an unfavorable change in the foreign currency exchange rate underlying the forward contract. Additionally, losses, up to the fair value, may arise if the counterparties do not perform under the contract terms. The fund's average U.S. dollar exposure to foreign currency risk derivative instruments held during the period was $425,608,367.
The value of foreign currency risk derivative instruments as of March 31, 2019, is disclosed on the Statement of Assets and Liabilities as an asset of $4,048,251 in unrealized appreciation on forward foreign currency exchange contracts and a liability of $147,236 in unrealized depreciation on forward foreign currency exchange contracts. For the year ended March 31, 2019, the effect of foreign currency risk derivative instruments on the Statement of Operations was $27,393,784 in net realized gain (loss) on forward foreign currency exchange contract transactions and $3,368,027 in change in net unrealized appreciation (depreciation) on forward foreign currency exchange contracts.
9. Risk Factors
There are certain risks involved in investing in foreign securities. These risks include those resulting from political events (such as civil unrest, national elections and imposition of exchange controls), social and economic events (such as labor strikes and rising inflation), and natural disasters. Securities of foreign issuers may be less liquid and more volatile. Investing a significant portion of assets in one country or region may accentuate these risks.
10. Federal Tax Information
The tax character of distributions paid during the years ended March 31, 2019 and March 31, 2018 were as follows:
|
| | | | | | |
| | 2019 | 2018 |
| Distributions Paid From | | |
| Ordinary income | $ | 172,249,185 |
| $ | 220,320,242 |
|
| Long-term capital gains | $ | 720,726,079 |
| $ | 571,906,568 |
|
The book-basis character of distributions made during the year from net investment income or net realized gains may differ from their ultimate characterization for federal income tax purposes. These differences reflect the differing character of certain income items and net realized gains and losses for financial statement and tax purposes, and may result in reclassification among certain capital accounts on the financial statements.
As of period end, the federal tax cost of investments and the components of distributable earnings on a tax-basis were as follows:
|
| | | |
| Federal tax cost of investments | $ | 6,984,967,528 |
|
| Gross tax appreciation of investments | $ | 1,048,047,890 |
|
| Gross tax depreciation of investments | (428,794,115 | ) |
| Net tax appreciation (depreciation) of investments | 619,253,775 |
|
| Net tax appreciation (depreciation) on derivatives and translation of assets and liabilities in foreign currencies | (1,660 | ) |
| Net tax appreciation (depreciation) | $ | 619,252,115 |
|
| Undistributed ordinary income | $ | 7,823,419 |
|
| Post-October capital loss deferral | $ | (23,742,369 | ) |
The difference between book-basis and tax-basis unrealized appreciation (depreciation) is attributable primarily to the tax deferral of losses on wash sales.
Loss deferrals represent certain qualified losses that the fund has elected to treat as having been incurred in the following fiscal year for federal income tax purposes.
|
| | | | | | | | | | | | | | | | | |
| For a Share Outstanding Throughout the Years Ended March 31 (except as noted) | | |
| Per-Share Data | | | | | | | | Ratios and Supplemental Data | | |
| | | Income From Investment Operations: | Distributions From: | | | Ratio to Average Net Assets of: | | |
| | Net Asset
Value,
Beginning
of Period | Net
Investment
Income
(Loss)(1) | Net
Realized
and
Unrealized
Gain (Loss) | Total From
Investment
Operations | Net
Investment
Income | Net
Realized
Gains | Total
Distributions | Net Asset
Value,
End
of Period | Total
Return(2) | Operating
Expenses | Operating
Expenses
(before
expense
waiver) | Net
Investment
Income
(Loss) | Net
Investment
Income (Loss)
(before
expense
waiver) | Portfolio
Turnover
Rate | Net
Assets,
End of
Period (in thousands) |
| Investor Class |
| 2019 | $17.09 | 0.23 | (0.21) | 0.02 | (0.21) | (1.71) | (1.92) | $15.19 | 0.81% | 0.96% | 1.00% | 1.38% | 1.34% | 53% |
| $3,514,131 |
|
| 2018 | $17.76 | 0.28 | 0.71 | 0.99 | (0.27) | (1.39) | (1.66) | $17.09 | 5.51% | 0.96% | 1.00% | 1.57% | 1.53% | 47% |
| $4,223,276 |
|
| 2017 | $15.32 | 0.22 | 2.93 | 3.15 | (0.23) | (0.48) | (0.71) | $17.76 | 20.71% | 0.98% | 1.00% | 1.32% | 1.30% | 49% |
| $4,706,704 |
|
| 2016 | $16.70 | 0.19 | 0.06 | 0.25 | (0.19) | (1.44) | (1.63) | $15.32 | 1.94% | 1.00% | 1.01% | 1.19% | 1.18% | 66% |
| $3,554,131 |
|
| 2015 | $16.35 | 0.20 | 1.98 | 2.18 | (0.18) | (1.65) | (1.83) | $16.70 | 13.62% | 1.00% | 1.00% | 1.16% | 1.16% | 66% |
| $3,771,117 |
|
| I Class |
| 2019 | $17.10 | 0.26 | (0.20) | 0.06 | (0.24) | (1.71) | (1.95) | $15.21 | 1.07% | 0.76% | 0.80% | 1.58% | 1.54% | 53% |
| $1,535,449 |
|
| 2018 | $17.77 | 0.32 | 0.71 | 1.03 | (0.31) | (1.39) | (1.70) | $17.10 | 5.72% | 0.76% | 0.80% | 1.77% | 1.73% | 47% |
| $1,793,037 |
|
| 2017 | $15.33 | 0.26 | 2.93 | 3.19 | (0.27) | (0.48) | (0.75) | $17.77 | 20.95% | 0.78% | 0.80% | 1.52% | 1.50% | 49% |
| $1,628,060 |
|
| 2016 | $16.71 | 0.22 | 0.06 | 0.28 | (0.22) | (1.44) | (1.66) | $15.33 | 2.14% | 0.80% | 0.81% | 1.39% | 1.38% | 66% |
| $1,153,899 |
|
| 2015 | $16.36 | 0.23 | 1.99 | 2.22 | (0.22) | (1.65) | (1.87) | $16.71 | 13.83% | 0.80% | 0.80% | 1.36% | 1.36% | 66% |
| $1,017,915 |
|
| Y Class |
| 2019 | $17.11 | 0.31 | (0.24) | 0.07 | (0.26) | (1.71) | (1.97) | $15.21 | 1.16% | 0.61% | 0.65% | 1.73% | 1.69% | 53% |
| $16,061 |
|
2018(3) | $17.76 | 0.32 | 0.75 | 1.07 | (0.33) | (1.39) | (1.72) | $17.11 | 5.97% | 0.61%(4) | 0.65%(4) | 1.89%(4) | 1.85%(4) | 47%(5) |
| $572 |
|
|
| | | | | | | | | | | | | | | | | |
| For a Share Outstanding Throughout the Years Ended March 31 (except as noted) | | |
| Per-Share Data | | | | | | | | Ratios and Supplemental Data | | |
| | | Income From Investment Operations: | Distributions From: | | | Ratio to Average Net Assets of: | | |
| | Net Asset
Value,
Beginning
of Period | Net
Investment
Income
(Loss)(1) | Net
Realized
and
Unrealized
Gain (Loss) | Total From
Investment
Operations | Net
Investment
Income | Net
Realized
Gains | Total
Distributions | Net Asset
Value,
End
of Period | Total
Return(2) | Operating
Expenses | Operating
Expenses
(before
expense
waiver) | Net
Investment
Income
(Loss) | Net
Investment
Income (Loss)
(before
expense
waiver) | Portfolio
Turnover
Rate | Net
Assets,
End of
Period (in thousands) |
| A Class |
| 2019 | $17.06 | 0.18 | (0.20) | (0.02) | (0.17) | (1.71) | (1.88) | $15.16 | 0.57% | 1.21% | 1.25% | 1.13% | 1.09% | 53% |
| $358,500 |
|
| 2018 | $17.73 | 0.22 | 0.73 | 0.95 | (0.23) | (1.39) | (1.62) | $17.06 | 5.26% | 1.21% | 1.25% | 1.32% | 1.28% | 47% |
| $540,108 |
|
| 2017 | $15.30 | 0.18 | 2.92 | 3.10 | (0.19) | (0.48) | (0.67) | $17.73 | 20.37% | 1.23% | 1.25% | 1.07% | 1.05% | 49% |
| $989,014 |
|
| 2016 | $16.68 | 0.15 | 0.06 | 0.21 | (0.15) | (1.44) | (1.59) | $15.30 | 1.69% | 1.25% | 1.26% | 0.94% | 0.93% | 66% |
| $1,360,886 |
|
| 2015 | $16.33 | 0.15 | 2.00 | 2.15 | (0.15) | (1.65) | (1.80) | $16.68 | 13.40% | 1.25% | 1.25% | 0.91% | 0.91% | 66% |
| $1,464,424 |
|
| C Class |
| 2019 | $16.89 | 0.06 | (0.21) | (0.15) | (0.05) | (1.71) | (1.76) | $14.98 | (0.23)% | 1.96% | 2.00% | 0.38% | 0.34% | 53% |
| $94,910 |
|
| 2018 | $17.58 | 0.10 | 0.71 | 0.81 | (0.11) | (1.39) | (1.50) | $16.89 | 4.48% | 1.96% | 2.00% | 0.57% | 0.53% | 47% |
| $135,133 |
|
| 2017 | $15.17 | 0.06 | 2.90 | 2.96 | (0.07) | (0.48) | (0.55) | $17.58 | 19.56% | 1.98% | 2.00% | 0.32% | 0.30% | 49% |
| $160,893 |
|
| 2016 | $16.57 | 0.03 | 0.06 | 0.09 | (0.05) | (1.44) | (1.49) | $15.17 | 0.90% | 2.00% | 2.01% | 0.19% | 0.18% | 66% |
| $102,906 |
|
| 2015 | $16.26 | 0.03 | 1.97 | 2.00 | (0.04) | (1.65) | (1.69) | $16.57 | 12.53% | 2.00% | 2.00% | 0.16% | 0.16% | 66% |
| $79,490 |
|
| R Class |
| 2019 | $17.02 | 0.14 | (0.20) | (0.06) | (0.13) | (1.71) | (1.84) | $15.12 | 0.33% | 1.46% | 1.50% | 0.88% | 0.84% | 53% |
| $96,701 |
|
| 2018 | $17.69 | 0.19 | 0.71 | 0.90 | (0.18) | (1.39) | (1.57) | $17.02 | 5.02% | 1.46% | 1.50% | 1.07% | 1.03% | 47% |
| $120,024 |
|
| 2017 | $15.26 | 0.14 | 2.92 | 3.06 | (0.15) | (0.48) | (0.63) | $17.69 | 20.12% | 1.48% | 1.50% | 0.82% | 0.80% | 49% |
| $151,705 |
|
| 2016 | $16.64 | 0.11 | 0.06 | 0.17 | (0.11) | (1.44) | (1.55) | $15.26 | 1.43% | 1.50% | 1.51% | 0.69% | 0.68% | 66% |
| $127,581 |
|
| 2015 | $16.31 | 0.11 | 1.98 | 2.09 | (0.11) | (1.65) | (1.76) | $16.64 | 13.07% | 1.50% | 1.50% | 0.66% | 0.66% | 66% |
| $130,669 |
|
|
| | | | | | | | | | | | | | | | | |
| For a Share Outstanding Throughout the Years Ended March 31 (except as noted) | | |
| Per-Share Data | | | | | | | | Ratios and Supplemental Data | | |
| | | Income From Investment Operations: | Distributions From: | | | Ratio to Average Net Assets of: | | |
| | Net Asset
Value,
Beginning
of Period | Net
Investment
Income
(Loss)(1) | Net
Realized
and
Unrealized
Gain (Loss) | Total From
Investment
Operations | Net
Investment
Income | Net
Realized
Gains | Total
Distributions | Net Asset
Value,
End
of Period | Total
Return(2) | Operating
Expenses | Operating
Expenses
(before
expense
waiver) | Net
Investment
Income
(Loss) | Net
Investment
Income (Loss)
(before
expense
waiver) | Portfolio
Turnover
Rate | Net
Assets,
End of
Period (in thousands) |
| R5 Class |
| 2019 | $17.11 | 0.28 | (0.23) | 0.05 | (0.24) | (1.71) | (1.95) | $15.21 | 1.01% | 0.76% | 0.80% | 1.58% | 1.54% | 53% |
| $58,526 |
|
2018(3) | $17.76 | 0.29 | 0.76 | 1.05 | (0.31) | (1.39) | (1.70) | $17.11 | 5.83% | 0.76%(4) | 0.80%(4) | 1.70%(4) | 1.66%(4) | 47%(5) |
| $313 |
|
| R6 Class |
| 2019 | $17.10 | 0.29 | (0.22) | 0.07 | (0.26) | (1.71) | (1.97) | $15.20 | 1.16% | 0.61% | 0.65% | 1.73% | 1.69% | 53% |
| $1,938,315 |
|
| 2018 | $17.77 | 0.34 | 0.72 | 1.06 | (0.34) | (1.39) | (1.73) | $17.10 | 5.88% | 0.61% | 0.65% | 1.92% | 1.88% | 47% |
| $1,578,125 |
|
| 2017 | $15.33 | 0.29 | 2.92 | 3.21 | (0.29) | (0.48) | (0.77) | $17.77 | 21.13% | 0.63% | 0.65% | 1.67% | 1.65% | 49% |
| $1,302,074 |
|
| 2016 | $16.71 | 0.25 | 0.05 | 0.30 | (0.24) | (1.44) | (1.68) | $15.33 | 2.29% | 0.65% | 0.66% | 1.54% | 1.53% | 66% |
| $544,182 |
|
| 2015 | $16.35 | 0.26 | 1.99 | 2.25 | (0.24) | (1.65) | (1.89) | $16.71 | 14.07% | 0.65% | 0.65% | 1.51% | 1.51% | 66% |
| $219,661 |
|
|
| | | | |
| Notes to Financial Highlights |
| |
| (1) | Computed using average shares outstanding throughout the period. |
| |
| (2) | Total returns are calculated based on the net asset value of the last business day and do not reflect applicable sales charges, if any. Total returns for periods less than one year are not annualized. |
| |
| (3) | April 10, 2017 (commencement of sale) through March 31, 2018. |
| |
| (5) | Portfolio turnover is calculated at the fund level. Percentage indicated was calculated for the year ended March 31, 2018. |
See Notes to Financial Statements.
|
|
| Report of Independent Registered Public Accounting Firm |
To the shareholders and the Board of Directors of American Century Capital Portfolios, Inc.:
Opinion on the Financial Statements and Financial Highlights
We have audited the accompanying statement of assets and liabilities, including the schedule of investments, of Mid Cap Value Fund, one of the portfolios constituting the American Century Capital Portfolios, Inc. (the “Fund”), as of March 31, 2019, the related statement of operations for the year then ended, the statements of changes in net assets for each of the two years in the period then ended, the financial highlights for each of the five years in the period then ended, and the related notes. In our opinion, the financial statements and financial highlights present fairly, in all material respects, the financial position of Mid Cap Value Fund of the American Century Capital Portfolios, Inc. as of March 31, 2019, the results of its operations for the year then ended, the changes in its net assets for each of the two years in the period then ended, and the financial highlights for each of the five years in the period then ended, in conformity with accounting principles generally accepted in the United States of America.
Basis for Opinion
These financial statements and financial highlights are the responsibility of the Fund's management. Our responsibility is to express an opinion on the Fund’s financial statements and financial highlights based on our audits. We are a public accounting firm registered with the Public Company Accounting Oversight Board (United States) (PCAOB) and are required to be independent with respect to the Fund in accordance with the U.S. federal securities laws and the applicable rules and regulations of the Securities and Exchange Commission and the PCAOB.
We conducted our audits in accordance with the standards of the PCAOB. Those standards require that we plan and perform the audit to obtain reasonable assurance about whether the financial statements and financial highlights are free of material misstatement, whether due to error or fraud. The Fund is not required to have, nor were we engaged to perform, an audit of its internal control over financial reporting. As part of our audits we are required to obtain an understanding of internal control over financial reporting but not for the purpose of expressing an opinion on the effectiveness of the Fund’s internal control over financial reporting. Accordingly, we express no such opinion.
Our audits included performing procedures to assess the risks of material misstatement of the financial statements and financial highlights, whether due to error or fraud, and performing procedures that respond to those risks. Such procedures included examining, on a test basis, evidence regarding the amounts and disclosures in the financial statements and financial highlights. Our audits also included evaluating the accounting principles used and significant estimates made by management, as well as evaluating the overall presentation of the financial statements and financial highlights. Our procedures included confirmation of securities owned as of March 31, 2019, by correspondence with the custodian and brokers; when replies were not received from brokers, we performed other auditing procedures. We believe that our audits provide a reasonable basis for our opinion.
DELOITTE & TOUCHE LLP
Kansas City, Missouri
May 16, 2019
We have served as the auditor of one or more American Century investment companies since 1997.
The Board of Directors
The individuals listed below serve as directors of the funds. Each director will continue to serve in this capacity until death, retirement, resignation or removal from office. The board has adopted a mandatory retirement age for directors who are not “interested persons,” as that term is defined in the Investment Company Act (independent directors). Independent directors shall retire by December 31 of the year in which they reach their 75th birthday.
Mr. Thomas is an “interested person” because he currently serves as President and Chief Executive Officer of American Century Companies, Inc. (ACC), the parent company of American Century Investment Management, Inc. (ACIM or the advisor). The other directors (more than three-fourths of the total number) are independent. They are not employees, directors or officers of, and have no financial interest in, ACC or any of its wholly owned, direct or indirect, subsidiaries, including ACIM, American Century Investment Services, Inc. (ACIS) and American Century Services, LLC (ACS), and they do not have any other affiliations, positions or relationships that would cause them to be considered “interested persons” under the Investment Company Act. The directors serve in this capacity for seven (in the case of Jonathan S. Thomas, 16; and Stephen E. Yates, 8) registered investment companies in the American Century Investments family of funds.
The following table presents additional information about the directors. The mailing address for each director is 4500 Main Street, Kansas City, Missouri 64111.
|
| | | | | |
Name
(Year of Birth) | Position(s) Held with Funds | Length of Time Served | Principal Occupation(s) During Past 5 Years | Number of American Century Portfolios Overseen by Director | Other Directorships Held During Past 5 Years |
| Independent Directors |
|
|
| Thomas W. Bunn (1953) | Director | Since 2017 | Retired | 67 | SquareTwo Financial; Barings (formerly Babson Capital Funds Trust) (2013 to 2016) |
Chris H. Cheesman
(1962)
| Director | Since 2019
| Retired. Senior Vice President & Chief Audit Executive, AllianceBernstein (1999 to 2018)
| 67 | None |
Barry Fink
(1955) | Director | Since 2012 (independent since 2016) | Retired | 67 | None |
Rajesh K. Gupta
(1960)
| Director | Since 2019
| Partner Emeritus, SeaCrest Investment Management and SeaCrest Wealth Management (2019 to Present); Chief Executive Officer and Chief Investment Officer, SeaCrest Investment Management (2006 to 2019); Chief Executive Officer and Chief Investment Officer, SeaCrest Wealth Management (2008 to 2019)
| 67 | None |
|
| | | | | |
Name
(Year of Birth) | Position(s) Held with Funds | Length of Time Served | Principal Occupation(s) During Past 5 Years | Number of American Century Portfolios Overseen by Director | Other Directorships Held During Past 5 Years |
| Independent Directors |
|
|
Lynn Jenkins
(1963)
| Director | Since 2019
| United States Representative, U.S. House of Representatives (2009 to 2018) | 67 | MGP Ingredients, Inc. |
Jan M. Lewis
(1957) | Director | Since 2011 | Retired | 67 | None |
John R. Whitten
(1946) | Director | Since 2008 | Retired | 67 | Rudolph Technologies, Inc. |
Stephen E. Yates
(1948) | Director and Chairman of the Board | Since 2012 (Chairman since 2018) | Retired | 72 | None |
| Interested Director |
|
|
Jonathan S. Thomas
(1963) | Director and President | Since 2007 | President and Chief Executive Officer, ACC (2007 to present). Also serves as Chief Executive Officer, ACS; Executive Vice President, ACIM; Director, ACC, ACIM and other ACC subsidiaries | 117 | BioMed Valley Discoveries, Inc. |
The Statement of Additional Information has additional information about the fund's directors and is available without charge, upon request, by calling 1-800-345-2021.
Officers
The following table presents certain information about the executive officers of the funds. Each officer serves as an officer for 16 (in the case of Robert J. Leach, 15) investment companies in the American Century family of funds, unless otherwise noted. No officer is compensated for his or her service as an officer of the funds. The listed officers are interested persons of the funds and are appointed or re-appointed on an annual basis. The mailing address for each officer listed below is 4500 Main Street, Kansas City, Missouri 64111.
|
| | |
Name
(Year of Birth) | Offices with the Funds | Principal Occupation(s) During the Past Five Years |
Jonathan S. Thomas
(1963) | Director and President since 2007 | President and Chief Executive Officer, ACC (2007 to present). Also serves as Chief Executive Officer, ACS; Executive Vice President, ACIM; Director, ACC, ACIM and other ACC subsidiaries |
R. Wes Campbell
(1974)
| Chief Financial Officer and Treasurer since 2018 | Investment Operations and Investment Accounting, ACS (2000 to present) |
Amy D. Shelton
(1964) | Chief Compliance Officer and Vice President since 2014 | Chief Compliance Officer, American Century funds, (2014 to present); Chief Compliance Officer, ACIM (2014 to present); Chief Compliance Officer, ACIS (2009 to present); Vice President, Client Interactions and Marketing, ACIS (2013 to 2014). Also serves as Vice President, ACIS |
Charles A. Etherington
(1957) | General Counsel since 2007 and Senior Vice President since 2006 | Attorney, ACC (1994 to present); Vice President, ACC (2005 to present); General Counsel, ACC (2007 to present). Also serves as General Counsel, ACIM, ACS, ACIS and other ACC subsidiaries; and Senior Vice President, ACIM and ACS |
C. Jean Wade
(1964) | Vice President since 2012 | Senior Vice President, ACS (2017 to present); Vice President, ACS (2000 to 2017) |
Robert J. Leach
(1966) | Vice President since 2006 | Vice President, ACS (2000 to present) |
David H. Reinmiller
(1963) | Vice President since 2000 | Attorney, ACC (1994 to present). Also serves as Vice President, ACIM and ACS |
Ward D. Stauffer
(1960) | Secretary since 2005 | Attorney, ACC (2003 to present) |
Retirement Account Information
As required by law, distributions you receive from certain retirement accounts are subject to federal income tax withholding, unless you elect not to have withholding apply*. Tax will be withheld on the total amount withdrawn even though you may be receiving amounts that are not subject to withholding, such as nondeductible contributions. In such case, excess amounts of withholding could occur. You may adjust your withholding election so that a greater or lesser amount will be withheld.
If you don’t want us to withhold on this amount, you must notify us to not withhold the federal income tax. You may notify us in writing or in certain situations by telephone or through other electronic means. For systematic withdrawals, your withholding election will remain in effect until revoked or changed by filing a new election. You have the right to revoke your election at any time and change your withholding percentage for future distributions.
Remember, even if you elect not to have income tax withheld, you are liable for paying income tax on the taxable portion of your withdrawal. If you elect not to have income tax withheld or you don’t have enough income tax withheld, you may be responsible for payment of estimated tax. You may incur penalties under the estimated tax rules if your withholding and estimated tax payments are not sufficient. You can reduce or defer the income tax on a distribution by directly or indirectly rolling such distribution over to another IRA or eligible plan. You should consult your tax advisor for additional information.
State tax will be withheld if, at the time of your distribution, your address is within one of the mandatory withholding states and you have federal income tax withheld (or as otherwise required by state law). State taxes will be withheld from your distribution in accordance with the respective state rules.
*Some 403(b), 457 and qualified retirement plan distributions may be subject to 20% mandatory withholding, as they are subject to special tax and withholding rules. Your plan administrator or plan sponsor is required to provide you with a special tax notice explaining those rules at the time you request a distribution. If applicable, federal and/or state taxes may be withheld from your distribution amount.
Proxy Voting Policies
A description of the policies that the fund's investment advisor uses in exercising the voting rights associated with the securities purchased and/or held by the fund is available without charge, upon request, by calling 1-800-345-2021. It is also available on the "About Us" page of American Century Investments’ website at americancentury.com and on the Securities and Exchange Commission’s website at sec.gov. Information regarding how the investment advisor voted proxies relating to portfolio securities during the most recent 12-month period ended June 30 is available on the "About Us" page at americancentury.com. It is also available at sec.gov.
Quarterly Portfolio Disclosure
The fund files its complete schedule of portfolio holdings with the Securities and Exchange Commission (SEC) for the first and third quarters of each fiscal year on Form N-Q or as an exhibit to its reports on Form N-PORT. The fund’s Forms N-Q and Form N-PORT reports are available on the SEC’s website at sec.gov. The fund also makes its complete schedule of portfolio holdings for the most recent quarter of its fiscal year available on its website at americancentury.com and, upon request, by calling 1-800-345-2021.
Other Tax Information
The following information is provided pursuant to provisions of the Internal Revenue Code.
The fund hereby designates up to the maximum amount allowable as qualified dividend income for the fiscal year ended March 31, 2019.
For corporate taxpayers, the fund hereby designates $147,630,756, or up to the maximum amount allowable, of ordinary income distributions paid during the fiscal year ended March 31, 2019 as qualified for the corporate dividends received deduction.
The fund hereby designates $63,977,583 as qualified short-term capital gain distributions for purposes of Internal Revenue Code Section 871 for the fiscal year ended March 31, 2019.
The fund hereby designates $720,726,079, or up to the maximum amount allowable, as long-term capital gain distributions (20% rate gain distributions) for the fiscal year ended March 31, 2019.
|
| | |
| |
| | | |
| Contact Us | americancentury.com | |
| Automated Information Line | 1-800-345-8765 | |
| Investor Services Representative | 1-800-345-2021 or 816-531-5575 | |
| Investors Using Advisors | 1-800-378-9878 | |
| Business, Not-For-Profit, Employer-Sponsored Retirement Plans | 1-800-345-3533 | |
| Banks and Trust Companies, Broker-Dealers, Financial Professionals, Insurance Companies | 1-800-345-6488 | |
| Telecommunications Relay Service for the Deaf | 711 | |
| | | |
| American Century Capital Portfolios, Inc. | |
| | | |
Investment Advisor: American Century Investment Management, Inc. Kansas City, Missouri | |
| | | |
| This report and the statements it contains are submitted for the general information of our shareholders. The report is not authorized for distribution to prospective investors unless preceded or accompanied by an effective prospectus. | |
| | | |
©2019 American Century Proprietary Holdings, Inc. All rights reserved.
CL-ANN-92271 1905 | |
|
| |
| | |
| | Annual Report |
| | |
| | March 31, 2019 |
| | |
| | NT Large Company Value Fund |
| | G Class (ACLLX) |
Beginning on January 1, 2021, as permitted by regulations adopted by the Securities and Exchange Commission, paper copies of the fund’s shareholder reports like this one will no longer be sent by mail, unless you specifically request paper copies of the reports from the fund or from your financial intermediary, such as a broker-dealer or bank. Instead, the reports will be made available on a website, and you will be notified by mail each time a report is posted and provided with a website link to access the report.
If you already elected to receive shareholder reports electronically, you will not be affected by this change and you need not take any action. You may elect to receive shareholder reports and other communications from the fund or your financial intermediary electronically by calling or sending an email request to your appropriate contacts as listed on the back cover of this report.
You may elect to receive all future reports in paper free of charge. You can inform the fund or your financial intermediary that you wish to continue receiving paper copies of your shareholder reports by calling or sending an email request to your appropriate contacts as listed on the back cover of this report. Your election to receive reports in paper will apply to all funds held with the fund complex/your financial intermediary.
|
| | |
| Performance | 2 |
|
| Portfolio Commentary | |
|
| Fund Characteristics | |
|
| Shareholder Fee Example | |
|
| Schedule of Investments | |
|
| Statement of Assets and Liabilities | |
|
| Statement of Operations | |
|
| Statement of Changes in Net Assets | |
|
| Notes to Financial Statements | |
|
| Financial Highlights | |
|
| Report of Independent Registered Public Accounting Firm | |
|
| Management | |
|
| Additional Information | |
|
Any opinions expressed in this report reflect those of the author as of the date of the report, and do not necessarily represent the opinions of American Century Investments® or any other person in the American Century Investments organization. Any such opinions are subject to change at any time based upon market or other conditions and American Century Investments disclaims any responsibility to update such opinions. These opinions may not be relied upon as investment advice and, because investment decisions made by American Century Investments funds are based on numerous factors, may not be relied upon as an indication of trading intent on behalf of any American Century Investments fund. Security examples are used for representational purposes only and are not intended as recommendations to purchase or sell securities. Performance information for comparative indices and securities is provided to American Century Investments by third party vendors. To the best of American Century Investments’ knowledge, such information is accurate at the time of printing.
|
| | | | | |
| Total Returns as of March 31, 2019 |
| | | | Average Annual Returns | |
| | Ticker Symbol | 1 year | 5 years | 10 years | Inception Date |
| G Class | ACLLX | 7.02% | 7.10% | 13.40% | 5/12/06 |
| Russell 1000 Value Index | — | 5.67% | 7.72% | 14.51% | — |
| S&P 500 Index | — | 9.50% | 10.90% | 15.91% | — |
Fund returns would have been lower if a portion of the fees had not been waived.
|
|
| Growth of $10,000 Over 10 Years |
| $10,000 investment made March 31, 2009 |
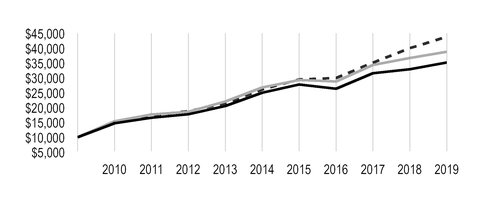
|
| |
| Value on March 31, 2019 |
| | G Class — $35,186 |
| |
| | Russell 1000 Value Index — $38,803 |
| |
| | S&P 500 Index — $43,809 |
| |
Ending value of G Class would have been lower if a portion of the fees had not been waived.
|
| |
Total Annual Fund Operating Expenses |
| G Class | 0.49% |
The total annual fund operating expenses shown is as stated in the fund’s prospectus current as of the date of this report. The prospectus may vary from the expense ratio shown elsewhere in this report because it is based on a different time period, includes acquired fund fees and expenses, and, if applicable, does not include fee waivers or expense reimbursements.
Data presented reflect past performance. Past performance is no guarantee of future results. Current performance may be higher or lower than the performance shown. Total returns for periods less than one year are not annualized. Investment return and principal value will fluctuate, and redemption value may be more or less than original cost. Data assumes reinvestment of dividends and capital gains, and none of the charts reflect the deduction of taxes that a shareholder would pay on fund distributions or the redemption of fund shares. To obtain performance data current to the most recent month end, please call 1-800-345-2021 or visit americancentury.com. For additional information about the fund, please consult the prospectus.
Portfolio Managers: Brian Woglom and Phil Davidson
Effective April 2019, portfolio manager Phil Sundell will join the fund's management team.
Performance Summary
NT Large Company Value returned 7.02%* for the 12-month period ended March 31, 2019. The fund’s benchmark, the Russell 1000 Value Index, returned 5.67%. The fund’s return reflects operating expenses, while the index’s return does not.
The fund’s holdings in the consumer staples, health care and consumer discretionary sectors were among the key drivers of relative performance. The fund’s overweight to the health care sector was also beneficial. On the other hand, stock selection in energy, underweights to the real estate and utilities sectors and holdings in the materials and financials sectors detracted from relative results.
Consumer Staples, Health Care and Consumer Discretionary Contributed
Holdings in the consumer staples sector positively impacted relative performance, including Procter & Gamble. This large consumer packaged goods company posted its highest organic growth rate in nearly five years, benefiting from recent investments in product enhancements and product pricing. Importantly, Procter & Gamble is stabilizing and improving market share in many key products.
Our portfolio’s overweight in health care aided performance. Additionally, several of our health care holdings outperformed during the trailing 12-month period, including pharmaceutical companies Merck & Co. and Pfizer. Merck outperformed after it reported solid financial results, raised its dividend and announced a share buyback. Also, competitor AstraZeneca announced a lung cancer trial failure, which cemented Merck’s dominance in the lung cancer space with its drug, Keytruda. Pfizer’s stock was supported by solid data on Tafamidis, its cardiomyopathy drug, and by its generally strong drug pipeline.
Consumer discretionary holding Advance Auto Parts was another top individual contributor. This retailer of aftermarket replacement parts is a market share leader in a higher-quality industry. Extreme winter storms in the Northeastern U.S. helped drive better-than-expected results for the company. Advance Auto Parts also raised its full-year guidance due to margin improvement and stronger-than-expected same-store sales trends. This indicated to investors that the company’s turnaround plan is starting to show signs of effectiveness.
While overall stock selection in the energy sector weighed on performance, Occidental Petroleum was a notable contributor. The stock of this large integrated energy company appreciated meaningfully as its management team executed on its plans to restore profitability to Occidental’s upstream business. We exited the position on strength in the stock price.
Energy, Real Estate, Materials and Utilities Detracted
A few of our energy holdings were key detractors from relative performance, including Schlumberger. The recovery in the oil field services markets has perpetually disappointed investors. In particular, the non-U.S. oil field services markets, a historic stronghold for Schlumberger, have failed to stage a meaningful recovery. As a result, industry participants have been bidding contracts aggressively in an attempt to maintain operations, which has weighed on the revenue growth and profitability of Schlumberger and its peers. We still think Schlumberger is
*Fund returns would have been lower if a portion of the fees had not been waived.
the best oil field services company, and we continue to hold the stock as of period-end. Noble Energy was another detractor. Its stock fell significantly during the second half of 2018 as lower commodity prices weighed on the free cash flow and return on invested capital potential of the business.
Our underweights to the real estate and utilities sectors also negatively impacted relative results. These underweights were the result of our bottom-up investment approach; our metrics indicated that many stocks in these sectors remained overvalued throughout the trailing 12-month period. Despite these generally inflated valuations, investors favored the more defensive utilities sector as the market declined in the fourth quarter of 2018. Furthermore, a decline in interest rates in the first quarter of 2019 helped propel stocks in the real estate sector.
Within the materials sector, our position in WestRock, a paper and packaging company, weighed on the fund’s performance. The stock underperformed due to worries that containerboard pricing and demand have peaked. Also, the company’s decision to acquire a smaller competitor raised concerns about the company’s debt load.
Furthermore, asset manager Invesco was a top detractor from performance. Invesco underperformed due to weaker equity markets in 2018, an acceleration of net outflows and on news of its expensive acquisition of OppenheimerFunds.
Portfolio Positioning
The portfolio seeks to invest in companies where we believe the valuation does not reflect the quality and normal earnings power of the company. Our process is based on individual security selection, but broad themes have emerged.
As of March 31, 2019, our portfolio is overweight in the health care and consumer staples sectors. According to our analysis, the portfolio’s health care holdings offer compelling valuations and
risk/reward profiles, particularly in the pharmaceuticals and health care equipment and supplies industries. The consumer staples sector is comprised of companies with diverging strategies and fundamental outlooks. We believe we have identified some of the more diversified, stronger companies with better balance sheets to help navigate a tougher competitive environment.
Conversely, the portfolio is underweight in communication services and real estate. As of
period-end, our only position in the communication services sector is Verizon Communications. We believe Verizon offers relative stability and balance sheet strength. Our analysis shows that many other communication services stocks have volatile business models and higher levels of leverage. Additionally, because it has been difficult for us to find higher-quality real estate stocks selling at attractive valuations, Weyerhaeuser is our only real estate holding as of the end of the reporting period.
|
| |
| MARCH 31, 2019 |
| Top Ten Holdings | % of net assets |
| Johnson & Johnson | 3.7% |
| JPMorgan Chase & Co. | 3.6% |
| Medtronic plc | 3.3% |
| U.S. Bancorp | 3.1% |
| Verizon Communications, Inc. | 3.1% |
| TOTAL SA ADR | 3.0% |
| Chevron Corp. | 2.8% |
| iShares Russell 1000 Value ETF | 2.8% |
| Intel Corp. | 2.7% |
| Pfizer, Inc. | 2.6% |
| | |
| Top Five Industries | % of net assets |
| Banks | 13.9% |
| Pharmaceuticals | 8.5% |
| Oil, Gas and Consumable Fuels | 8.2% |
| Health Care Equipment and Supplies | 6.5% |
| Capital Markets | 4.8% |
| | |
| Types of Investments in Portfolio | % of net assets |
| Domestic Common Stocks | 86.3% |
| Foreign Common Stocks* | 7.8% |
| Exchange-Traded Funds | 2.8% |
| Total Equity Exposure | 96.9% |
| Temporary Cash Investments | 2.8% |
| Other Assets and Liabilities | 0.3% |
*Includes depositary shares, dual listed securities and foreign ordinary shares.
Fund shareholders may incur two types of costs: (1) transaction costs, including sales charges (loads) on purchase payments and redemption/exchange fees; and (2) ongoing costs, including management fees; distribution and service (12b-1) fees; and other fund expenses. This example is intended to help you understand your ongoing costs (in dollars) of investing in your fund and to compare these costs with the ongoing cost of investing in other mutual funds.
The example is based on an investment of $1,000 made at the beginning of the period and held for the entire period from October 1, 2018 to March 31, 2019.
Actual Expenses
The table provides information about actual account values and actual expenses for each class. You may use the information, together with the amount you invested, to estimate the expenses that you paid over the period. First, identify the share class you own. Then simply divide your account value by $1,000 (for example, an $8,600 account value divided by $1,000 = 8.6), then multiply the result by the number under the heading “Expenses Paid During Period” to estimate the expenses you paid on your account during this period.
Hypothetical Example for Comparison Purposes
The table also provides information about hypothetical account values and hypothetical expenses based on the actual expense ratio of each class of your fund and an assumed rate of return of 5% per year before expenses, which is not the actual return of a fund’s share class. The hypothetical account values and expenses may not be used to estimate the actual ending account balance or expenses you paid for the period. You may use this information to compare the ongoing costs of investing in your fund and other funds. To do so, compare this 5% hypothetical example with the 5% hypothetical examples that appear in the shareholder reports of the other funds.
Please note that the expenses shown in the table are meant to highlight your ongoing costs only and do not reflect any transactional costs, such as sales charges (loads) or redemption/exchange fees. Therefore, the table is useful in comparing ongoing costs only, and will not help you determine the relative total costs of owning different funds. In addition, if these transactional costs were included, your costs would have been higher.
|
| | | | |
| | Beginning
Account Value
10/1/18 | Ending
Account Value
3/31/19 | Expenses Paid
During Period(1)
10/1/18 - 3/31/19 |
Annualized
Expense Ratio(1)(2) |
| Actual | | | | |
| G Class | $1,000 | $990.30 | $0.00 | 0.00% |
| Hypothetical | | | | |
| G Class | $1,000 | $1,024.93 | $0.00 | 0.00% |
| |
| (1) | Expenses are equal to the class's annualized expense ratio listed in the table above, multiplied by the average account value over the period, multiplied by 182, the number of days in the most recent fiscal half-year, divided by 365, to reflect the one-half year period. Annualized expense ratio reflects actual expenses, including any applicable fee waivers or expense reimbursements and excluding any underlying fund fees and expenses. |
| |
| (2) | Other expenses, which include directors' fees and expenses, did not exceed 0.005%. |
MARCH 31, 2019
|
| | | | | |
| | Shares | Value |
| COMMON STOCKS — 94.1% | | |
| Air Freight and Logistics — 1.0% | | |
| United Parcel Service, Inc., Class B | 144,000 |
| $ | 16,090,560 |
|
| Airlines — 1.2% | | |
| Southwest Airlines Co. | 361,700 |
| 18,775,847 |
|
| Auto Components — 0.7% | | |
| BorgWarner, Inc. | 313,200 |
| 12,030,012 |
|
| Automobiles — 1.0% | | |
| Honda Motor Co. Ltd. ADR | 573,500 |
| 15,581,995 |
|
| Banks — 13.9% | | |
| Bank of America Corp. | 681,900 |
| 18,813,621 |
|
| BB&T Corp. | 860,100 |
| 40,020,453 |
|
| JPMorgan Chase & Co. | 569,800 |
| 57,680,854 |
|
| PNC Financial Services Group, Inc. (The) | 310,100 |
| 38,036,866 |
|
| U.S. Bancorp | 1,058,000 |
| 50,985,020 |
|
| Wells Fargo & Co. | 402,000 |
| 19,424,640 |
|
| | | 224,961,454 |
|
| Beverages — 1.3% | | |
| PepsiCo, Inc. | 176,300 |
| 21,605,565 |
|
| Building Products — 1.3% | | |
| Johnson Controls International plc | 588,500 |
| 21,739,190 |
|
| Capital Markets — 4.8% | | |
| Ameriprise Financial, Inc. | 186,900 |
| 23,941,890 |
|
| Bank of New York Mellon Corp. (The) | 673,500 |
| 33,964,605 |
|
| Invesco Ltd. | 1,029,700 |
| 19,883,507 |
|
| | | 77,790,002 |
|
| Chemicals — 0.8% | | |
Dow, Inc.(1)(2) | 14,701 |
| 758,995 |
|
| DowDuPont, Inc. | 345,100 |
| 12,447,757 |
|
| | | 13,206,752 |
|
| Communications Equipment — 1.5% | | |
| Cisco Systems, Inc. | 449,200 |
| 24,252,308 |
|
| Containers and Packaging — 0.7% | | |
| WestRock Co. | 305,400 |
| 11,712,090 |
|
| Diversified Telecommunication Services — 3.1% | | |
| Verizon Communications, Inc. | 846,800 |
| 50,071,284 |
|
| Electric Utilities — 3.9% | | |
| Eversource Energy | 297,300 |
| 21,093,435 |
|
| Pinnacle West Capital Corp. | 177,600 |
| 16,975,008 |
|
| Xcel Energy, Inc. | 457,700 |
| 25,727,317 |
|
| | | 63,795,760 |
|
| Electrical Equipment — 1.9% | | |
| Eaton Corp. plc | 208,400 |
| 16,788,704 |
|
|
| | | | | |
| | Shares | Value |
| Emerson Electric Co. | 212,400 |
| $ | 14,543,028 |
|
| | | 31,331,732 |
|
| Electronic Equipment, Instruments and Components — 1.3% |
| TE Connectivity Ltd. | 258,000 |
| 20,833,500 |
|
| Energy Equipment and Services — 2.9% | | |
| Baker Hughes a GE Co. | 577,600 |
| 16,011,072 |
|
| Schlumberger Ltd. | 727,200 |
| 31,684,104 |
|
| | | 47,695,176 |
|
| Equity Real Estate Investment Trusts (REITs) — 1.4% |
| Weyerhaeuser Co. | 884,300 |
| 23,292,462 |
|
| Food and Staples Retailing — 1.5% | | |
| Sysco Corp. | 185,000 |
| 12,350,600 |
|
| Walmart, Inc. | 114,000 |
| 11,118,420 |
|
| | | 23,469,020 |
|
| Food Products — 3.3% | | |
| Conagra Brands, Inc. | 440,400 |
| 12,216,696 |
|
| Kellogg Co. | 137,400 |
| 7,884,012 |
|
| Mondelez International, Inc., Class A | 658,000 |
| 32,847,360 |
|
| | | 52,948,068 |
|
| Health Care Equipment and Supplies — 6.5% | | |
Hologic, Inc.(2) | 276,700 |
| 13,392,280 |
|
| Medtronic plc | 591,000 |
| 53,828,280 |
|
| Zimmer Biomet Holdings, Inc. | 299,000 |
| 38,182,300 |
|
| | | 105,402,860 |
|
| Health Care Providers and Services — 2.2% | | |
| McKesson Corp. | 117,700 |
| 13,777,962 |
|
| Quest Diagnostics, Inc. | 241,800 |
| 21,742,656 |
|
| | | 35,520,618 |
|
| Health Care Technology — 1.1% | | |
Cerner Corp.(2) | 313,200 |
| 17,918,172 |
|
| Hotels, Restaurants and Leisure — 0.6% | | |
| Carnival Corp. | 191,300 |
| 9,702,736 |
|
| Household Durables — 0.5% | | |
| PulteGroup, Inc. | 294,000 |
| 8,220,240 |
|
| Household Products — 3.6% | | |
| Colgate-Palmolive Co. | 261,600 |
| 17,930,064 |
|
| Procter & Gamble Co. (The) | 396,700 |
| 41,276,635 |
|
| | | 59,206,699 |
|
| Industrial Conglomerates — 1.1% | | |
| Siemens AG | 164,100 |
| 17,660,561 |
|
| Insurance — 3.5% | | |
| Aflac, Inc. | 337,600 |
| 16,880,000 |
|
| Chubb Ltd. | 284,800 |
| 39,894,784 |
|
| | | 56,774,784 |
|
| Machinery — 2.7% | | |
| Atlas Copco AB, B Shares | 914,000 |
| 22,620,696 |
|
|
| | | | | |
| | Shares | Value |
| Cummins, Inc. | 129,200 |
| $ | 20,396,804 |
|
| | | 43,017,500 |
|
| Multiline Retail — 0.5% | | |
| Target Corp. | 102,400 |
| 8,218,624 |
|
| Oil, Gas and Consumable Fuels — 8.2% | | |
| Anadarko Petroleum Corp. | 210,600 |
| 9,578,088 |
|
| Chevron Corp. | 367,400 |
| 45,256,332 |
|
| EQT Corp. | 321,700 |
| 6,672,058 |
|
| Equitrans Midstream Corp. | 249,800 |
| 5,440,644 |
|
| Noble Energy, Inc. | 321,400 |
| 7,948,222 |
|
| Royal Dutch Shell plc, Class B ADR | 169,200 |
| 10,820,340 |
|
| TOTAL SA ADR | 865,000 |
| 48,137,250 |
|
| | | 133,852,934 |
|
| Personal Products — 0.7% | | |
| Unilever NV CVA | 186,400 |
| 10,826,901 |
|
| Pharmaceuticals — 8.5% | | |
| Allergan plc | 85,000 |
| 12,444,850 |
|
| Johnson & Johnson | 426,500 |
| 59,620,434 |
|
| Merck & Co., Inc. | 291,700 |
| 24,260,689 |
|
| Pfizer, Inc. | 992,300 |
| 42,142,981 |
|
| | | 138,468,954 |
|
| Road and Rail — 0.5% | | |
| Union Pacific Corp. | 51,000 |
| 8,527,200 |
|
| Semiconductors and Semiconductor Equipment — 3.6% |
| Applied Materials, Inc. | 397,900 |
| 15,780,714 |
|
| Intel Corp. | 808,400 |
| 43,411,080 |
|
| | | 59,191,794 |
|
| Software — 1.5% | | |
| Oracle Corp. (New York) | 444,800 |
| 23,890,208 |
|
| Specialty Retail — 0.9% | | |
| Advance Auto Parts, Inc. | 86,600 |
| 14,767,898 |
|
| Technology Hardware, Storage and Peripherals — 0.4% |
| Apple, Inc. | 37,700 |
| 7,161,115 |
|
TOTAL COMMON STOCKS
(Cost $1,266,507,640) | | 1,529,512,575 |
|
| EXCHANGE-TRADED FUNDS — 2.8% | | |
iShares Russell 1000 Value ETF
(Cost $43,249,477) | 364,200 |
| 44,975,058 |
|
| TEMPORARY CASH INVESTMENTS — 2.8% | | |
| Repurchase Agreement, BMO Capital Markets Corp., (collateralized by various U.S. Treasury obligations, 0.125% - 2.875%, 9/30/19 - 2/15/44, valued at $40,204,776), in a joint trading account at 2.35%, dated 3/29/19, due 4/1/19 (Delivery value $39,409,339) | | 39,401,623 |
|
| Repurchase Agreement, Fixed Income Clearing Corp., (collateralized by various U.S. Treasury obligations, 2.50%, 8/15/23, valued at $6,721,432), at 1.25%, dated 3/29/19, due 4/1/19 (Delivery value $6,586,686) | | 6,586,000 |
|
|
| | | | | |
| | Shares | Value |
| State Street Institutional U.S. Government Money Market Fund, Premier Class | 20,780 |
| $ | 20,780 |
|
TOTAL TEMPORARY CASH INVESTMENTS
(Cost $46,008,403) | | 46,008,403 |
|
TOTAL INVESTMENT SECURITIES — 99.7%
(Cost $1,355,765,520) | | 1,620,496,036 |
|
| OTHER ASSETS AND LIABILITIES — 0.3% | | 4,151,844 |
|
| TOTAL NET ASSETS — 100.0% | | $ | 1,624,647,880 |
|
|
| | | | | | | | | | |
| FORWARD FOREIGN CURRENCY EXCHANGE CONTRACTS |
| Currency Purchased | Currency Sold | Counterparty | Settlement Date | Unrealized Appreciation
(Depreciation) |
| EUR | 1,484,964 |
| USD | 1,688,758 |
| Credit Suisse AG | 6/28/19 | $ | (10,728 | ) |
| USD | 66,005,801 |
| EUR | 57,853,137 |
| Credit Suisse AG | 6/28/19 | 630,989 |
|
| USD | 1,706,830 |
| EUR | 1,509,924 |
| Credit Suisse AG | 6/28/19 | 596 |
|
| USD | 9,254,686 |
| GBP | 6,981,776 |
| JPMorgan Chase Bank N.A. | 6/28/19 | 121,854 |
|
| JPY | 41,484,211 |
| USD | 378,228 |
| Bank of America N.A. | 6/28/19 | (1,371 | ) |
| JPY | 36,713,312 |
| USD | 333,688 |
| Bank of America N.A. | 6/28/19 | (172 | ) |
| USD | 14,103,455 |
| JPY | 1,541,528,740 |
| Bank of America N.A. | 6/28/19 | 99,674 |
|
| SEK | 4,405,708 |
| USD | 477,502 |
| Goldman Sachs & Co. | 6/28/19 | (533 | ) |
| USD | 18,677,130 |
| SEK | 171,265,548 |
| Goldman Sachs & Co. | 6/28/19 | 135,645 |
|
| | | | | | | $ | 975,954 |
|
|
| | |
| NOTES TO SCHEDULE OF INVESTMENTS |
| ADR | - | American Depositary Receipt |
| CVA | - | Certificaten Van Aandelen |
| EUR | - | Euro |
| GBP | - | British Pound |
| JPY | - | Japanese Yen |
| SEK | - | Swedish Krona |
| USD | - | United States Dollar |
| |
| (1) | When-issued security. The issue price and yield are fixed on the date of the commitment, but payment and delivery are scheduled for a future date. |
See Notes to Financial Statements.
|
|
| Statement of Assets and Liabilities |
|
| | | |
| MARCH 31, 2019 | |
| Assets | |
| Investment securities, at value (cost of $1,355,765,520) | $ | 1,620,496,036 |
|
| Receivable for investments sold | 9,971,303 |
|
| Unrealized appreciation on forward foreign currency exchange contracts | 988,758 |
|
| Dividends and interest receivable | 2,959,610 |
|
| | 1,634,415,707 |
|
| | |
| Liabilities | |
| Payable for investments purchased | 9,741,755 |
|
| Payable for capital shares redeemed | 13,268 |
|
| Unrealized depreciation on forward foreign currency exchange contracts | 12,804 |
|
| | 9,767,827 |
|
| | |
| Net Assets | $ | 1,624,647,880 |
|
| | |
| G Class Capital Shares, $0.01 Par Value | |
| Shares authorized | 1,200,000,000 |
|
| Shares outstanding | 150,987,511 |
|
| | |
| Net Asset Value Per Share | $ | 10.76 |
|
| | |
| Net Assets Consist of: | |
| Capital (par value and paid-in surplus) | $ | 1,401,496,111 |
|
| Distributable earnings | 223,151,769 |
|
| | $ | 1,624,647,880 |
|
See Notes to Financial Statements.
|
| | | |
| YEAR ENDED MARCH 31, 2019 | |
| Investment Income (Loss) | |
| Income: | |
| Dividends (net of foreign taxes withheld of $550,398) | $ | 46,081,029 |
|
| Interest | 517,358 |
|
| | 46,598,387 |
|
| | |
| Expenses: | |
| Management fees | 8,412,918 |
|
| Directors' fees and expenses | 49,249 |
|
| Other expenses | 27,035 |
|
| | 8,489,202 |
|
| Fees waived | (8,412,918 | ) |
| | 76,284 |
|
| | |
| Net investment income (loss) | 46,522,103 |
|
| | |
| Realized and Unrealized Gain (Loss) | |
| Net realized gain (loss) on: | |
| Investment transactions | 68,241,025 |
|
| Forward foreign currency exchange contract transactions | 12,818,231 |
|
| Foreign currency translation transactions | (29,599 | ) |
| | 81,029,657 |
|
| | |
| Change in net unrealized appreciation (depreciation) on: | |
| Investments | (2,944,465 | ) |
| Forward foreign currency exchange contracts | 915,665 |
|
| Translation of assets and liabilities in foreign currencies | (6,616 | ) |
| | (2,035,416 | ) |
| | |
| Net realized and unrealized gain (loss) | 78,994,241 |
|
| | |
| Net Increase (Decrease) in Net Assets Resulting from Operations | $ | 125,516,344 |
|
See Notes to Financial Statements.
|
|
| Statement of Changes in Net Assets |
|
| | | | | | |
| YEARS ENDED MARCH 31, 2019 AND MARCH 31, 2018 |
| Increase (Decrease) in Net Assets | March 31, 2019 | March 31, 2018 |
| Operations | | |
| Net investment income (loss) | $ | 46,522,103 |
| $ | 52,692,019 |
|
| Net realized gain (loss) | 81,029,657 |
| 96,409,995 |
|
| Change in net unrealized appreciation (depreciation) | (2,035,416 | ) | (62,140,801 | ) |
| Net increase (decrease) in net assets resulting from operations | 125,516,344 |
| 86,961,213 |
|
| | | |
| Distributions to Shareholders | | |
From earnings:(1) | | |
| G Class | (163,394,016 | ) | (195,765,168 | ) |
| R6 Class | — |
| (1,038,414 | ) |
| Decrease in net assets from distributions | (163,394,016 | ) | (196,803,582 | ) |
| | | |
| Capital Share Transactions | | |
| Net increase (decrease) in net assets from capital share transactions (Note 5) | (223,801,927 | ) | 89,662,460 |
|
| | | |
| Net increase (decrease) in net assets | (261,679,599 | ) | (20,179,909 | ) |
| | | |
| Net Assets | | |
| Beginning of period | 1,886,327,479 |
| 1,906,507,388 |
|
| End of period | $ | 1,624,647,880 |
| $ | 1,886,327,479 |
|
| |
| (1) | Prior period presentation has been updated to reflect the current period combination of distributions to shareholders from net investment income and net realized gains. Distributions from net investment income were $(49,067,307) and $(1,038,414) for G Class and R6 Class, respectively. Distributions from net realized gains were $(146,697,861) for G Class. |
See Notes to Financial Statements.
|
|
| Notes to Financial Statements |
MARCH 31, 2019
1. Organization
American Century Capital Portfolios, Inc. (the corporation) is registered under the Investment Company Act of 1940, as amended (the 1940 Act), as an open-end management investment company and is organized as a Maryland corporation. NT Large Company Value Fund (the fund) is one fund in a series issued by the corporation. The fund’s investment objective is to seek long-term capital growth. Income is a secondary objective. The fund is not permitted to invest in securities issued by companies assigned the Global Industry Classification Standard or the Bloomberg Industry Classification Standard for the tobacco industry. The fund offers the G Class. On July 31, 2017, all outstanding R6 Class shares were converted to G Class shares and the fund discontinued offering the R6 Class.
2. Significant Accounting Policies
The following is a summary of significant accounting policies consistently followed by the fund in preparation of its financial statements. The fund is an investment company and follows accounting and reporting guidance in accordance with accounting principles generally accepted in the United States of America. This may require management to make certain estimates and assumptions at the date of the financial statements. Actual results could differ from these estimates. Management evaluated the impact of events or transactions occurring through the date the financial statements were issued that would merit recognition or disclosure.
Investment Valuations — The fund determines the fair value of its investments and computes its net asset value per share at the close of regular trading (usually 4 p.m. Eastern time) on the New York Stock Exchange (NYSE) on each day the NYSE is open. The Board of Directors has adopted valuation policies and procedures to guide the investment advisor in the fund’s investment valuation process and to provide methodologies for the oversight of the fund’s pricing function.
Equity securities that are listed or traded on a domestic securities exchange are valued at the last reported sales price or at the official closing price as provided by the exchange. Equity securities traded on foreign securities exchanges are generally valued at the closing price of such securities on the exchange where primarily traded or at the close of the NYSE, if that is earlier. If no last sales price is reported, or if local convention or regulation so provides, the mean of the latest bid and asked prices may be used. Securities traded over-the-counter are valued at the mean of the latest bid and asked prices, the last sales price, or the official closing price. Equity securities initially expressed in local currencies are translated into U.S. dollars at the mean of the appropriate currency exchange rate at the close of the NYSE as provided by an independent pricing service.
Open-end management investment companies are valued at the reported net asset value per share. Repurchase agreements are valued at cost, which approximates fair value. Forward foreign currency exchange contracts are valued at the mean of the appropriate forward exchange rate at the close of the NYSE as provided by an independent pricing service.
If the fund determines that the market price for an investment is not readily available or the valuation methods mentioned above do not reflect an investment’s fair value, such investment is valued as determined in good faith by the Board of Directors or its delegate, in accordance with policies and procedures adopted by the Board of Directors. In its determination of fair value, the fund may review several factors including, but not limited to, market information regarding the specific investment or comparable investments and correlation with other investment types, futures indices or general market indicators. Circumstances that may cause the fund to use these procedures to value an investment include, but are not limited to: an investment has been declared in default or is distressed; trading in a security has been suspended during the trading day or a security is not actively trading on its principal exchange; prices received from a regular pricing source are deemed unreliable; or there is a foreign market holiday and no trading occurred.
The fund monitors for significant events occurring after the close of an investment’s primary exchange but before the fund’s net asset value per share is determined. Significant events may include, but are not limited to: corporate announcements and transactions; governmental action and political unrest that could impact a specific investment or an investment sector; or armed conflicts, natural disasters and similar events that could affect investments in a specific country or region. The fund also monitors for significant fluctuations between
domestic and foreign markets, as evidenced by the U.S. market or such other indicators that the Board of Directors, or its delegate, deems appropriate. If significant fluctuations in foreign markets are identified, the fund may apply a model-derived factor to the closing price of equity securities traded on foreign securities exchanges. The factor is based on observable market data as provided by an independent pricing service.
Security Transactions — Security transactions are accounted for as of the trade date. Net realized gains and losses are determined on the identified cost basis, which is also used for federal income tax purposes.
Investment Income — Dividend income less foreign taxes withheld, if any, is recorded as of the ex-dividend date. Distributions received on securities that represent a return of capital or long-term capital gain are recorded as a reduction of cost of investments and/or as a realized gain. The fund may estimate the components of distributions received that may be considered nontaxable distributions or long-term capital gain distributions for income tax purposes. Interest income is recorded on the accrual basis and includes accretion of discounts and amortization of premiums.
Foreign Currency Translations — All assets and liabilities initially expressed in foreign currencies are translated into U.S. dollars at prevailing exchange rates at period end. The fund may enter into spot foreign currency exchange contracts to facilitate transactions denominated in a foreign currency. Purchases and sales of investment securities, dividend and interest income, spot foreign currency exchange contracts, and expenses are translated at the rates of exchange prevailing on the respective dates of such transactions. Net realized and unrealized foreign currency exchange gains or losses related to investment securities are a component of net realized gain (loss) on investment transactions and change in net unrealized appreciation (depreciation) on investments, respectively.
Repurchase Agreements — The fund may enter into repurchase agreements with institutions that American Century Investment Management, Inc. (ACIM) (the investment advisor) has determined are creditworthy pursuant to criteria adopted by the Board of Directors. The fund requires that the collateral, represented by securities, received in a repurchase transaction be transferred to the custodian in a manner sufficient to enable the fund to obtain those securities in the event of a default under the repurchase agreement. ACIM monitors, on a daily basis, the securities transferred to ensure the value, including accrued interest, of the securities under each repurchase agreement is equal to or greater than amounts owed to the fund under each repurchase agreement.
Joint Trading Account — Pursuant to an Exemptive Order issued by the Securities and Exchange Commission, the fund, along with certain other funds in the American Century Investments family of funds, may transfer uninvested cash balances into a joint trading account. These balances are invested in one or more repurchase agreements that are collateralized by U.S. Treasury or Agency obligations.
Segregated Assets — In accordance with the 1940 Act, the fund segregates assets on its books and records to cover certain types of investment securities and other financial instruments. ACIM monitors, on a daily basis, the securities segregated to ensure the fund designates a sufficient amount of liquid assets, marked-to-market daily. The fund may also receive assets or be required to pledge assets at the custodian bank or with a broker for collateral requirements.
Income Tax Status — It is the fund’s policy to distribute substantially all net investment income and net realized gains to shareholders and to otherwise qualify as a regulated investment company under provisions of the Internal Revenue Code. Accordingly, no provision has been made for income taxes. The fund files U.S. federal, state, local and non-U.S. tax returns as applicable. The fund's tax returns are subject to examination by the relevant taxing authority until expiration of the applicable statute of limitations, which is generally three years from the date of filing but can be longer in certain jurisdictions. At this time, management believes there are no uncertain tax positions which, based on their technical merit, would not be sustained upon examination and for which it is reasonably possible that the total amounts of unrecognized tax benefits will significantly change in the next twelve months.
Distributions to Shareholders — Distributions from net investment income, if any, are generally declared and paid quarterly. Distributions from net realized gains, if any, are generally declared and paid annually.
Indemnifications — Under the corporation’s organizational documents, its officers and directors are indemnified against certain liabilities arising out of the performance of their duties to the fund. In addition, in the normal course of business, the fund enters into contracts that provide general indemnifications. The maximum exposure under these arrangements is unknown as this would involve future claims that may be made against a fund. The risk of material loss from such claims is considered by management to be remote.
3. Fees and Transactions with Related Parties
Certain officers and directors of the corporation are also officers and/or directors of American Century Companies, Inc. (ACC). The corporation’s investment advisor, ACIM, the corporation's distributor, American Century Investment Services, Inc., and the corporation’s transfer agent, American Century Services, LLC, are wholly owned, directly or indirectly, by ACC. Various funds issued by American Century Asset Allocation Portfolios, Inc. own, in aggregate, 100% of the shares of the fund. Related parties do not invest in the fund for the purpose of exercising management or control.
Management Fees —The corporation has entered into a management agreement with ACIM, under which ACIM provides the fund with investment advisory and management services in exchange for a single, unified management fee (the fee). The agreement provides that all expenses of managing and operating the fund, except brokerage expenses, taxes, interest, fees and expenses of the independent directors (including legal counsel fees), and extraordinary expenses, will be paid by ACIM. The fee is computed and accrued daily based on the daily net assets of the fund and paid monthly in arrears. The rate of the fee is determined by applying a fee rate calculation formula. This formula takes into account the fund’s assets as well as certain assets, if any, of other clients of the investment advisor outside the American Century Investments family of funds (such as subadvised funds and separate accounts) that use very similar investment teams and strategies (strategy assets). The strategy assets of the fund also include the assets of Large Company Value Fund, one fund in a series issued by the corporation. The management fee schedule ranges from 0.35% to 0.55%. The investment advisor agreed to waive the fund's management fee in its entirety. The investment advisor expects this waiver to remain in effect permanently and cannot terminate it without the approval of the Board of Directors. The effective annual management fee for the period ended March 31, 2019 was 0.48% before waiver and 0.00% after waiver.
Directors' Fees and Expenses — The Board of Directors is responsible for overseeing the investment advisor’s management and operations of the fund. The directors receive detailed information about the fund and its investment advisor regularly throughout the year, and meet at least quarterly with management of the investment advisor to review reports about fund operations. The fund’s officers do not receive compensation from the fund.
Interfund Transactions — The fund may enter into security transactions with other American Century Investments funds and other client accounts of the investment advisor, in accordance with the 1940 Act rules and procedures adopted by the Board of Directors. The rules and procedures require, among other things, that these transactions be effected at the independent current market price of the security. During the period, the interfund purchases and sales were $18,573,655 and $64,198,752, respectively. The effect of interfund transactions on the Statement of Operations was $(2,665,314) in net realized gain (loss) on investment transactions.
4. Investment Transactions
Purchases and sales of investment securities, excluding short-term investments, for the period ended March 31, 2019 were $967,160,218 and $1,309,700,674, respectively.
5. Capital Share Transactions
Transactions in shares of the fund were as follows: |
| | | | | | | | | | |
| | Year ended
March 31, 2019 | Year ended
March 31, 2018 |
| | Shares | Amount | Shares | Amount |
| G Class/Shares Authorized | 1,200,000,000 |
| | 920,000,000 |
| |
| Sold | 9,170,897 |
| $ | 96,025,056 |
| 36,358,869 |
| $ | 431,890,150 |
|
| Issued in reinvestment of distributions | 15,707,058 |
| 163,394,016 |
| 16,806,758 |
| 195,765,168 |
|
| Redeemed | (42,728,213 | ) | (483,220,999 | ) | (27,835,044 | ) | (332,586,166 | ) |
| | (17,850,258 | ) | (223,801,927 | ) | 25,330,583 |
| 295,069,152 |
|
| R6 Class/Shares Authorized | N/A |
| | N/A |
| |
| Sold | | | 2,076,788 |
| 24,637,192 |
|
| Issued in reinvestment of distributions | | | 87,042 |
| 1,038,414 |
|
| Redeemed | | | (19,287,096 | ) | (231,082,298 | ) |
| | | | (17,123,266 | ) | (205,406,692 | ) |
| Net increase (decrease) | (17,850,258 | ) | $ | (223,801,927 | ) | 8,207,317 |
| $ | 89,662,460 |
|
6. Fair Value Measurements
The fund’s investments valuation process is based on several considerations and may use multiple inputs to determine the fair value of the investments held by the fund. In conformity with accounting principles generally accepted in the United States of America, the inputs used to determine a valuation are classified into three broad levels.
| |
| • | Level 1 valuation inputs consist of unadjusted quoted prices in an active market for identical investments. |
| |
| • | Level 2 valuation inputs consist of direct or indirect observable market data (including quoted prices for comparable investments, evaluations of subsequent market events, interest rates, prepayment speeds, credit risk, etc.). These inputs also consist of quoted prices for identical investments initially expressed in local currencies that are adjusted through translation into U.S. dollars. |
| |
| • | Level 3 valuation inputs consist of unobservable data (including a fund’s own assumptions). |
The level classification is based on the lowest level input that is significant to the fair valuation measurement. The valuation inputs are not necessarily an indication of the risks associated with investing in these securities or other financial instruments.
The following is a summary of the level classifications as of period end. The Schedule of Investments provides additional information on the fund’s portfolio holdings.
|
| | | | | | | | |
| | Level 1 | Level 2 | Level 3 |
| Assets | | | |
| Investment Securities | | | |
| Common Stocks | $ | 1,478,404,417 |
| $ | 51,108,158 |
| — |
|
| Exchange-Traded Funds | 44,975,058 |
| — |
| — |
|
| Temporary Cash Investments | 20,780 |
| 45,987,623 |
| — |
|
| | $ | 1,523,400,255 |
| $ | 97,095,781 |
| — |
|
| Other Financial Instruments | | | |
| Forward Foreign Currency Exchange Contracts | — |
| $ | 988,758 |
| — |
|
| | | | |
| Liabilities | | | |
| Other Financial Instruments | | | |
| Forward Foreign Currency Exchange Contracts | — |
| $ | 12,804 |
| — |
|
7. Derivative Instruments
Foreign Currency Risk — The fund is subject to foreign currency exchange rate risk in the normal course of pursuing its investment objectives. The value of foreign investments held by a fund may be significantly affected by changes in foreign currency exchange rates. The dollar value of a foreign security generally decreases when the value of the dollar rises against the foreign currency in which the security is denominated and tends to increase when the value of the dollar declines against such foreign currency. A fund may enter into forward foreign currency exchange contracts to reduce a fund's exposure to foreign currency exchange rate fluctuations. The net U.S. dollar value of foreign currency underlying all contractual commitments held by a fund and the resulting unrealized appreciation or depreciation are determined daily. Realized gain or loss is recorded upon the termination of the contract. Net realized and unrealized gains or losses occurring during the holding period of forward foreign currency exchange contracts are a component of net realized gain (loss) on forward foreign currency exchange contract transactions and change in net unrealized appreciation (depreciation) on forward foreign currency exchange contracts, respectively. A fund bears the risk of an unfavorable change in the foreign currency exchange rate underlying the forward contract. Additionally, losses, up to the fair value, may arise if the counterparties do not perform under the contract terms. The fund's average U.S. dollar exposure to foreign currency risk derivative instruments held during the period was $140,434,096.
The value of foreign currency risk derivative instruments as of March 31, 2019, is disclosed on the Statement of Assets and Liabilities as an asset of $988,758 in unrealized appreciation on forward foreign currency
exchange contracts and a liability of $12,804 in unrealized depreciation on forward foreign currency exchange contracts. For the year ended March 31, 2019, the effect of foreign currency risk derivative instruments on the Statement of Operations was $12,818,231 in net realized gain (loss) on forward foreign currency exchange contract transactions and $915,665 in change in net unrealized appreciation (depreciation) on forward foreign currency exchange contracts.
8. Risk Factors
There are certain risks involved in investing in foreign securities. These risks include those resulting from political events (such as civil unrest, national elections and imposition of exchange controls), social and economic events (such as labor strikes and rising inflation), and natural disasters. Securities of foreign issuers may be less liquid and more volatile. Investing a significant portion of assets in one country or region may accentuate these risks.
9. Federal Tax Information
The tax character of distributions paid during the years ended March 31, 2019 and March 31, 2018 were as follows:
|
| | | | | | |
| | 2019 | 2018 |
| Distributions Paid From | | |
| Ordinary income | $ | 47,275,451 |
| $ | 71,510,035 |
|
| Long-term capital gains | $ | 116,118,565 |
| $ | 125,293,547 |
|
The book-basis character of distributions made during the year from net investment income or net realized gains may differ from their ultimate characterization for federal income tax purposes. These differences reflect the differing character of certain income items and net realized gains and losses for financial statement and tax purposes, and may result in reclassification among certain capital accounts on the financial statements.
As of period end, the federal tax cost of investments and the components of distributable earnings on a tax-basis were as follows:
|
| | | |
| Federal tax cost of investments | $ | 1,397,617,028 |
|
| Gross tax appreciation of investments | $ | 269,834,829 |
|
| Gross tax depreciation of investments | (46,955,821 | ) |
| Net tax appreciation (depreciation) of investments | 222,879,008 |
|
| Net tax appreciation (depreciation) on derivatives and translation of assets and liabilities in foreign currencies | (7,453 | ) |
| Net tax appreciation (depreciation) | $ | 222,871,555 |
|
| Undistributed ordinary income | $ | 2,545,458 |
|
| Post-October capital loss deferral | $ | (2,265,244 | ) |
The difference between book-basis and tax-basis unrealized appreciation (depreciation) is attributable primarily to the tax deferral of losses on wash sales.
Loss deferrals represent certain qualified losses that the fund has elected to treat as having been incurred in the following fiscal year for federal income tax purposes.
|
| | | | | | | | | | | | | | | | | |
| For a Share Outstanding Throughout the Years Ended March 31 (except as noted) |
| Per-Share Data | Ratios and Supplemental Data |
| | | Income From Investment Operations: | Distributions From: | | | Ratio to Average Net Assets of: | | |
| | Net Asset
Value,
Beginning
of Period | Net
Investment
Income
(Loss)(1) | Net
Realized
and
Unrealized
Gain (Loss) | Total From
Investment
Operations | Net
Investment
Income | Net
Realized
Gains | Total
Distributions | Net Asset
Value,
End of Period | Total
Return(2) | Operating
Expenses | Operating
Expenses
(before
expense
waiver) | Net
Investment
Income
(Loss) | Net
Investment
Income
(Loss)
(before
expense
waiver) | Portfolio
Turnover
Rate | Net
Assets,
End of
Period (in thousands) |
| G Class | | | | | | | | | | | | | |
| 2019 | $11.17 | 0.30 | 0.41 | 0.71 | (0.30) | (0.82) | (1.12) | $10.76 | 7.02% | 0.00%(3) | 0.48% | 2.64% | 2.16% | 56% |
| $1,624,648 |
|
| 2018 | $11.87 | 0.32 | 0.21 | 0.53 | (0.30) | (0.93) | (1.23) | $11.17 | 4.23% | 0.20% | 0.53% | 2.68% | 2.35% | 57% |
| $1,886,327 |
|
| 2017 | $10.58 | 0.25 | 1.80 | 2.05 | (0.24) | (0.52) | (0.76) | $11.87 | 19.67% | 0.63% | 0.63% | 2.17% | 2.17% | 79% |
| $1,703,216 |
|
| 2016 | $12.38 | 0.18 | (0.78) | (0.60) | (0.18) | (1.02) | (1.20) | $10.58 | (4.92)% | 0.64% | 0.64% | 1.57% | 1.57% | 61% |
| $1,531,294 |
|
| 2015 | $12.18 | 0.19 | 1.14 | 1.33 | (0.18) | (0.95) | (1.13) | $12.38 | 11.01% | 0.64% | 0.64% | 1.52% | 1.52% | 68% |
| $1,391,730 |
|
|
|
| Notes to Financial Highlights |
| |
| (1) | Computed using average shares outstanding throughout the period. |
| |
| (2) | Total returns are calculated based on the net asset value of the last business day. Total returns for periods less than one year are not annualized. |
| |
| (3) | Ratio was less than 0.005%. |
See Notes to Financial Statements.
|
|
| Report of Independent Registered Public Accounting Firm |
To the shareholders and the Board of Directors of American Century Capital Portfolios, Inc.:
Opinion on the Financial Statements and Financial Highlights
We have audited the accompanying statement of assets and liabilities, including the schedule of investments, of NT Large Company Value Fund, one of the portfolios constituting the American Century Capital Portfolios, Inc. (the “Fund”), as of March 31, 2019, the related statement of operations for the year then ended, the statements of changes in net assets for each of the two years in the period then ended, the financial highlights for each of the five years in the period then ended, and the related notes. In our opinion, the financial statements and financial highlights present fairly, in all material respects, the financial position of NT Large Company Value Fund of the American Century Capital Portfolios, Inc. as of March 31, 2019, the results of its operations for the year then ended, the changes in its net assets for each of the two years in the period then ended, and the financial highlights for each of the five years in the period then ended, in conformity with accounting principles generally accepted in the United States of America.
Basis for Opinion
These financial statements and financial highlights are the responsibility of the Fund's management. Our responsibility is to express an opinion on the Fund’s financial statements and financial highlights based on our audits. We are a public accounting firm registered with the Public Company Accounting Oversight Board (United States) (PCAOB) and are required to be independent with respect to the Fund in accordance with the U.S. federal securities laws and the applicable rules and regulations of the Securities and Exchange Commission and the PCAOB.
We conducted our audits in accordance with the standards of the PCAOB. Those standards require that we plan and perform the audit to obtain reasonable assurance about whether the financial statements and financial highlights are free of material misstatement, whether due to error or fraud. The Fund is not required to have, nor were we engaged to perform, an audit of its internal control over financial reporting. As part of our audits we are required to obtain an understanding of internal control over financial reporting but not for the purpose of expressing an opinion on the effectiveness of the Fund’s internal control over financial reporting. Accordingly, we express no such opinion.
Our audits included performing procedures to assess the risks of material misstatement of the financial statements and financial highlights, whether due to error or fraud, and performing procedures that respond to those risks. Such procedures included examining, on a test basis, evidence regarding the amounts and disclosures in the financial statements and financial highlights. Our audits also included evaluating the accounting principles used and significant estimates made by management, as well as evaluating the overall presentation of the financial statements and financial highlights. Our procedures included confirmation of securities owned as of March 31, 2019, by correspondence with the custodian and brokers; when replies were not received from brokers, we performed other auditing procedures. We believe that our audits provide a reasonable basis for our opinion.
DELOITTE & TOUCHE LLP
Kansas City, Missouri
May 16, 2019
We have served as the auditor of one or more American Century investment companies since 1997.
The Board of Directors
The individuals listed below serve as directors of the funds. Each director will continue to serve in this capacity until death, retirement, resignation or removal from office. The board has adopted a mandatory retirement age for directors who are not “interested persons,” as that term is defined in the Investment Company Act (independent directors). Independent directors shall retire by December 31 of the year in which they reach their 75th birthday.
Mr. Thomas is an “interested person” because he currently serves as President and Chief Executive Officer of American Century Companies, Inc. (ACC), the parent company of American Century Investment Management, Inc. (ACIM or the advisor). The other directors (more than three-fourths of the total number) are independent. They are not employees, directors or officers of, and have no financial interest in, ACC or any of its wholly owned, direct or indirect, subsidiaries, including ACIM, American Century Investment Services, Inc. (ACIS) and American Century Services, LLC (ACS), and they do not have any other affiliations, positions or relationships that would cause them to be considered “interested persons” under the Investment Company Act. The directors serve in this capacity for seven (in the case of Jonathan S. Thomas, 16; and Stephen E. Yates, 8) registered investment companies in the American Century Investments family of funds.
The following table presents additional information about the directors. The mailing address for each director is 4500 Main Street, Kansas City, Missouri 64111.
|
| | | | | |
Name
(Year of Birth) | Position(s) Held with Funds | Length of Time Served | Principal Occupation(s) During Past 5 Years | Number of American Century Portfolios Overseen by Director | Other Directorships Held During Past 5 Years |
| Independent Directors |
|
|
| Thomas W. Bunn (1953) | Director | Since 2017 | Retired | 67 | SquareTwo Financial; Barings (formerly Babson Capital Funds Trust) (2013 to 2016) |
Chris H. Cheesman
(1962)
| Director | Since 2019
| Retired. Senior Vice President & Chief Audit Executive, AllianceBernstein (1999 to 2018)
| 67 | None |
Barry Fink
(1955) | Director | Since 2012 (independent since 2016) | Retired | 67 | None |
Rajesh K. Gupta
(1960)
| Director | Since 2019
| Partner Emeritus, SeaCrest Investment Management and SeaCrest Wealth Management (2019 to Present); Chief Executive Officer and Chief Investment Officer, SeaCrest Investment Management (2006 to 2019); Chief Executive Officer and Chief Investment Officer, SeaCrest Wealth Management (2008 to 2019)
| 67 | None |
|
| | | | | |
Name
(Year of Birth) | Position(s) Held with Funds | Length of Time Served | Principal Occupation(s) During Past 5 Years | Number of American Century Portfolios Overseen by Director | Other Directorships Held During Past 5 Years |
| Independent Directors |
|
|
Lynn Jenkins
(1963)
| Director | Since 2019
| United States Representative, U.S. House of Representatives (2009 to 2018) | 67 | MGP Ingredients, Inc. |
Jan M. Lewis
(1957) | Director | Since 2011 | Retired | 67 | None |
John R. Whitten
(1946) | Director | Since 2008 | Retired | 67 | Rudolph Technologies, Inc. |
Stephen E. Yates
(1948) | Director and Chairman of the Board | Since 2012 (Chairman since 2018) | Retired | 72 | None |
| Interested Director |
|
|
Jonathan S. Thomas
(1963) | Director and President | Since 2007 | President and Chief Executive Officer, ACC (2007 to present). Also serves as Chief Executive Officer, ACS; Executive Vice President, ACIM; Director, ACC, ACIM and other ACC subsidiaries | 117 | BioMed Valley Discoveries, Inc. |
The Statement of Additional Information has additional information about the fund's directors and is available without charge, upon request, by calling 1-800-345-2021.
Officers
The following table presents certain information about the executive officers of the funds. Each officer serves as an officer for 16 (in the case of Robert J. Leach, 15) investment companies in the American Century family of funds, unless otherwise noted. No officer is compensated for his or her service as an officer of the funds. The listed officers are interested persons of the funds and are appointed or re-appointed on an annual basis. The mailing address for each officer listed below is 4500 Main Street, Kansas City, Missouri 64111.
|
| | |
Name
(Year of Birth) | Offices with the Funds | Principal Occupation(s) During the Past Five Years |
Jonathan S. Thomas
(1963) | Director and President since 2007 | President and Chief Executive Officer, ACC (2007 to present). Also serves as Chief Executive Officer, ACS; Executive Vice President, ACIM; Director, ACC, ACIM and other ACC subsidiaries |
R. Wes Campbell
(1974)
| Chief Financial Officer and Treasurer since 2018 | Investment Operations and Investment Accounting, ACS (2000 to present) |
Amy D. Shelton
(1964) | Chief Compliance Officer and Vice President since 2014 | Chief Compliance Officer, American Century funds, (2014 to present); Chief Compliance Officer, ACIM (2014 to present); Chief Compliance Officer, ACIS (2009 to present); Vice President, Client Interactions and Marketing, ACIS (2013 to 2014). Also serves as Vice President, ACIS |
Charles A. Etherington
(1957) | General Counsel since 2007 and Senior Vice President since 2006 | Attorney, ACC (1994 to present); Vice President, ACC (2005 to present); General Counsel, ACC (2007 to present). Also serves as General Counsel, ACIM, ACS, ACIS and other ACC subsidiaries; and Senior Vice President, ACIM and ACS |
C. Jean Wade
(1964) | Vice President since 2012 | Senior Vice President, ACS (2017 to present); Vice President, ACS (2000 to 2017) |
Robert J. Leach
(1966) | Vice President since 2006 | Vice President, ACS (2000 to present) |
David H. Reinmiller
(1963) | Vice President since 2000 | Attorney, ACC (1994 to present). Also serves as Vice President, ACIM and ACS |
Ward D. Stauffer
(1960) | Secretary since 2005 | Attorney, ACC (2003 to present) |
Retirement Account Information
As required by law, distributions you receive from certain retirement accounts are subject to federal income tax withholding, unless you elect not to have withholding apply*. Tax will be withheld on the total amount withdrawn even though you may be receiving amounts that are not subject to withholding, such as nondeductible contributions. In such case, excess amounts of withholding could occur. You may adjust your withholding election so that a greater or lesser amount will be withheld.
If you don’t want us to withhold on this amount, you must notify us to not withhold the federal income tax. You may notify us in writing or in certain situations by telephone or through other electronic means. For systematic withdrawals, your withholding election will remain in effect until revoked or changed by filing a new election. You have the right to revoke your election at any time and change your withholding percentage for future distributions.
Remember, even if you elect not to have income tax withheld, you are liable for paying income tax on the taxable portion of your withdrawal. If you elect not to have income tax withheld or you don’t have enough income tax withheld, you may be responsible for payment of estimated tax. You may incur penalties under the estimated tax rules if your withholding and estimated tax payments are not sufficient. You can reduce or defer the income tax on a distribution by directly or indirectly rolling such distribution over to another IRA or eligible plan. You should consult your tax advisor for additional information.
State tax will be withheld if, at the time of your distribution, your address is within one of the mandatory withholding states and you have federal income tax withheld (or as otherwise required by state law). State taxes will be withheld from your distribution in accordance with the respective state rules.
*Some 403(b), 457 and qualified retirement plan distributions may be subject to 20% mandatory withholding, as they are subject to special tax and withholding rules. Your plan administrator or plan sponsor is required to provide you with a special tax notice explaining those rules at the time you request a distribution. If applicable, federal and/or state taxes may be withheld from your distribution amount.
Proxy Voting Policies
A description of the policies that the fund's investment advisor uses in exercising the voting rights associated with the securities purchased and/or held by the fund is available without charge, upon request, by calling 1-800-345-2021. It is also available on the "About Us" page of American Century Investments’ website at americancentury.com and on the Securities and Exchange Commission’s website at sec.gov. Information regarding how the investment advisor voted proxies relating to portfolio securities during the most recent 12-month period ended June 30 is available on the "About Us" page at americancentury.com. It is also available at sec.gov.
Quarterly Portfolio Disclosure
The fund files its complete schedule of portfolio holdings with the Securities and Exchange Commission (SEC) for the first and third quarters of each fiscal year on Form N-Q or as an exhibit to its reports on Form N-PORT. The fund’s Forms N-Q and Form N-PORT reports are available on the SEC’s website at sec.gov. The fund also makes its complete schedule of portfolio holdings for the most recent quarter of its fiscal year available on its website at americancentury.com and, upon request, by calling 1-800-345-2021.
Other Tax Information
The following information is provided pursuant to provisions of the Internal Revenue Code.
The fund hereby designates up to the maximum amount allowable as qualified dividend income for the fiscal year ended March 31, 2019.
For corporate taxpayers, the fund hereby designates $33,081,092, or up to the maximum amount allowable, of ordinary income distributions paid during the fiscal year ended March 31, 2019 as qualified for the corporate dividends received deduction.
The fund hereby designates $116,118,565, or up to the maximum amount allowable, as long-term capital gain distributions (20% rate gain distributions) for the fiscal year ended March 31, 2019.
The fund hereby designates $5,907 as qualified short-term capital gain distributions for purposes of Internal Revenue Code Section 871 for the fiscal year ended March 31, 2019.
|
| | |
| |
| | | |
| Contact Us | americancentury.com | |
| Automated Information Line | 1-800-345-8765 | |
| Investor Services Representative | 1-800-345-2021 or 816-531-5575 | |
| Investors Using Advisors | 1-800-378-9878 | |
| Business, Not-For-Profit, Employer-Sponsored Retirement Plans | 1-800-345-3533 | |
| Banks and Trust Companies, Broker-Dealers, Financial Professionals, Insurance Companies | 1-800-345-6488 | |
| Telecommunications Relay Service for the Deaf | 711 | |
| | | |
| American Century Capital Portfolios, Inc. | |
| | | |
Investment Advisor: American Century Investment Management, Inc. Kansas City, Missouri | |
| | | |
| This report and the statements it contains are submitted for the general information of our shareholders. The report is not authorized for distribution to prospective investors unless preceded or accompanied by an effective prospectus. | |
| | | |
©2019 American Century Proprietary Holdings, Inc. All rights reserved.
CL-ANN-92290 1905 | |
|
| |
| | |
| | Annual Report |
| | |
| | March 31, 2019 |
| | |
| | NT Mid Cap Value Fund |
| | G Class (ACLMX) |
Beginning on January 1, 2021, as permitted by regulations adopted by the Securities and Exchange Commission, paper copies of the fund’s shareholder reports like this one will no longer be sent by mail, unless you specifically request paper copies of the reports from the fund or from your financial intermediary, such as a broker-dealer or bank. Instead, the reports will be made available on a website, and you will be notified by mail each time a report is posted and provided with a website link to access the report.
If you already elected to receive shareholder reports electronically, you will not be affected by this change and you need not take any action. You may elect to receive shareholder reports and other communications from the fund or your financial intermediary electronically by calling or sending an email request to your appropriate contacts as listed on the back cover of this report.
You may elect to receive all future reports in paper free of charge. You can inform the fund or your financial intermediary that you wish to continue receiving paper copies of your shareholder reports by calling or sending an email request to your appropriate contacts as listed on the back cover of this report. Your election to receive reports in paper will apply to all funds held with the fund complex/your financial intermediary.
|
| | |
| Performance | 2 |
|
| Portfolio Commentary | |
|
| Fund Characteristics | |
|
| Shareholder Fee Example | |
|
| Schedule of Investments | |
|
| Statement of Assets and Liabilities | |
|
| Statement of Operations | |
|
| Statement of Changes in Net Assets | |
|
| Notes to Financial Statements | |
|
| Financial Highlights | |
|
| Report of Independent Registered Public Accounting Firm | |
|
| Management | |
|
| Additional Information | |
|
Any opinions expressed in this report reflect those of the author as of the date of the report, and do not necessarily represent the opinions of American Century Investments® or any other person in the American Century Investments organization. Any such opinions are subject to change at any time based upon market or other conditions and American Century Investments disclaims any responsibility to update such opinions. These opinions may not be relied upon as investment advice and, because investment decisions made by American Century Investments funds are based on numerous factors, may not be relied upon as an indication of trading intent on behalf of any American Century Investments fund. Security examples are used for representational purposes only and are not intended as recommendations to purchase or sell securities. Performance information for comparative indices and securities is provided to American Century Investments by third party vendors. To the best of American Century Investments’ knowledge, such information is accurate at the time of printing.
|
| | | | | |
| Total Returns as of March 31, 2019 |
| | | | Average Annual Returns | |
| | Ticker Symbol | 1 year | 5 years | 10 years | Inception Date |
| G Class | ACLMX | 1.87% | 8.82% | 15.65% | 5/12/06 |
| Russell Midcap Value Index | — | 2.89% | 7.21% | 16.38% | — |
Fund returns would have been lower if a portion of the fees had not been waived.
|
|
| Growth of $10,000 Over 10 Years |
| $10,000 investment made March 31, 2009 |
| |
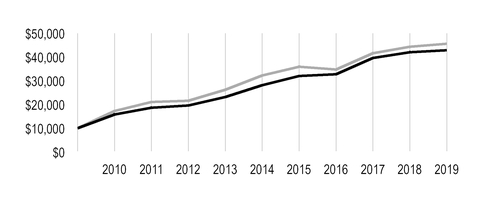
|
| |
| Value on March 31, 2019 |
| | G Class — $42,852 |
| |
| | Russell Midcap Value Index — $45,626 |
| |
Ending value of G Class would have been lower if a portion of the fees had not been waived.
|
| |
| Total Annual Fund Operating Expenses |
| G Class | 0.66% |
The total annual fund operating expenses shown is as stated in the fund’s prospectus current as of the date of this report. The prospectus may vary from the expense ratio shown elsewhere in this report because it is based on a different time period, includes acquired fund fees and expenses, and, if applicable, does not include fee waivers or expense reimbursements.
Data presented reflect past performance. Past performance is no guarantee of future results. Current performance may be higher or lower than the performance shown. Total returns for periods less than one year are not annualized. Investment return and principal value will fluctuate, and redemption value may be more or less than original cost. Data assumes reinvestment of dividends and capital gains, and none of the charts reflect the deduction of taxes that a shareholder would pay on fund distributions or the redemption of fund shares. To obtain performance data current to the most recent month end, please call 1-800-345-2021 or visit americancentury.com. For additional information about the fund, please consult the prospectus.
Portfolio Managers: Kevin Toney, Michael Liss, Phil Davidson and Brian Woglom
Performance Summary
NT Mid Cap Value returned 1.87%* for the 12-month period ended March 31, 2019. The fund’s benchmark, the Russell Midcap Value Index, returned 2.89%. The fund’s return reflects operating expenses, while the index’s return does not.
The fund’s underweight and stock selection in the real estate sector detracted from relative performance. Information technology and energy were other areas of weakness. On the other hand, stock selection and our underweight in the consumer discretionary sector contributed positively to relative results. Holdings in the industrials, health care and utilities sectors were also beneficial to performance.
Real Estate, Information Technology and Energy Detracted
Throughout the year, we remained underweight in the real estate sector given our belief that valuations throughout the sector were generally extended. This sector underweight detracted from relative performance. Furthermore, our position in Weyerhaeuser, a large private owner of timberlands, negatively impacted results. The stock was pressured by a decline in timber pricing.
In the information technology sector, several holdings in the semiconductors and semiconductor equipment industry detracted from performance due to fears of capital spending declines in the memory chip market. Our underweight in the information technology sector, stemming largely from our lack of exposure to the software and information technology services industries, also weighed on performance.
A decline in the price of oil during the fourth quarter of 2018 pressured our energy holdings, including Cimarex Energy. Cimarex’s stock was also hurt by fiscal 2018 production guidance that came in below expectations. Furthermore, due to pipeline constraints, investors became concerned about the company’s ability to efficiently transport oil out of the Permian Basin. We believe those concerns were overstated and maintained a position in the company. EQT, a natural gas exploration and pipeline company, was another top detractor. The company provided disappointing guidance for cash flows in 2019 and faced challenges with the integration of assets from Rice Energy, a company that EQT acquired in late 2017.
Within the consumer staples sector, Orkla and Conagra Brands detracted from relative performance. Orkla’s stock was pressured by disappointing financial results, driven by higher food inflation and currency headwinds. However, we believe these issues are transitory and Orkla’s underlying business remains strong. Conagra underperformed due to lowered guidance on its recent acquisition of Pinnacle Foods. Conagra highlighted Pinnacle’s weak new product innovation and stated that improvement may not occur until the second half of 2019.
Financials stock Invesco was another top detractor. The asset manager underperformed due to weaker equity markets in 2018, an acceleration of net outflows and on news of its expensive acquisition of OppenheimerFunds. Paper and packaging company WestRock also underperformed due to worries that containerboard pricing and demand have peaked. Additionally, the company’s decision to acquire a smaller competitor raised concerns about the company’s debt load.
*Fund returns would have been lower if a portion of the fees had not been waived.
Consumer Discretionary, Industrials, Health Care and Utilities Contributed Positively
Consumer discretionary holding Advance Auto Parts was a key contributor. This retailer of aftermarket automotive replacement parts is a market share leader in a higher-quality industry. The company reported several quarters of strong results and raised its full-year guidance due to margin improvement and stronger-than-expected same-store sales trends. This news indicated to investors that the company’s turnaround plan is starting to show signs of effectiveness. Our underweight to the consumer discretionary sector was also beneficial, as many consumer discretionary stocks lagged due in part to trade tensions and investors’ concerns about a slowing global economy.
Industrials and health care were also areas of strength. Stock selection in industrials positively impacted performance, particularly within the building products industry. Our position in Johnson Controls International outperformed on speculation of a separation of the company’s buildings and battery businesses as well as better operating trends and execution. In the health care sector, hospital company LifePoint Health was a top contributor. The company outperformed on news that it would be acquired for a significant premium by Apollo Global Management, a private equity firm. We eliminated LifePoint following its strong performance.
In the utilities sector, NorthWestern was a top contributor. This utility stock benefited from better-than-expected regulatory developments in proceedings in Montana and from declining longer-term interest rates. Additionally, we believe the Montana Public Service Commission should be more agreeable as the makeup of the commission changed at the end of 2018. Xcel Energy also positively impacted relative returns as the company increased its long-term growth and capital spending outlook. Like other utilities, the stock also benefited from the decline in longer-term interest rates and economic uncertainty.
Portfolio Positioning
The portfolio seeks to invest in companies where we believe the valuation does not reflect the quality and normal earnings power of the company. Our process is based on individual security selection, but broad themes have emerged.
As of March 31, 2019, the portfolio is overweight in financials. Using our bottom-up investment approach, we have identified stocks that we believe offer attractive risk/reward profiles, particularly in the capital markets and banking industries. We are also overweight in industrials. Our analysis has led us to attractive companies within this fragmented sector, and we have avoided industrials that we believe are lower quality.
On the other hand, we ended the reporting period with a notable underweight in real estate. Our metrics show that valuations throughout the real estate sector are extended. As a result, we have only identified a few higher-quality real estate stocks with compelling valuations. The portfolio is also underweight in information technology. We believe valuations throughout the sector are generally less attractive following the sector’s strong performance during the first quarter of 2019.
|
| |
| MARCH 31, 2019 |
| Top Ten Holdings | % of net assets |
| iShares Russell Mid-Cap Value ETF | 3.0% |
| Northern Trust Corp. | 3.0% |
| Zimmer Biomet Holdings, Inc. | 3.0% |
| Hubbell, Inc. | 2.6% |
| BB&T Corp. | 2.1% |
| Xcel Energy, Inc. | 1.9% |
| Weyerhaeuser Co. | 1.9% |
| Johnson Controls International plc | 1.7% |
| Chubb Ltd. | 1.5% |
| Southwest Airlines Co. | 1.5% |
| | |
| Top Five Industries | % of net assets |
| Banks | 9.3% |
| Capital Markets | 6.7% |
| Electrical Equipment | 6.6% |
| Oil, Gas and Consumable Fuels | 5.2% |
| Insurance | 5.1% |
| | |
| Types of Investments in Portfolio | % of net assets |
| Domestic Common Stocks | 87.1% |
| Foreign Common Stocks* | 6.9% |
| Exchange-Traded Funds | 3.0% |
| Total Equity Exposure | 97.0% |
| Temporary Cash Investments | 2.8% |
| Other Assets and Liabilities | 0.2% |
*Includes depositary shares, dual listed securities and foreign ordinary shares.
Fund shareholders may incur two types of costs: (1) transaction costs, including sales charges (loads) on purchase payments and redemption/exchange fees; and (2) ongoing costs, including management fees; distribution and service (12b-1) fees; and other fund expenses. This example is intended to help you understand your ongoing costs (in dollars) of investing in your fund and to compare these costs with the ongoing cost of investing in other mutual funds.
The example is based on an investment of $1,000 made at the beginning of the period and held for the entire period from October 1, 2018 to March 31, 2019.
Actual Expenses
The table provides information about actual account values and actual expenses for each class. You may use the information, together with the amount you invested, to estimate the expenses that you paid over the period. First, identify the share class you own. Then simply divide your account value by $1,000 (for example, an $8,600 account value divided by $1,000 = 8.6), then multiply the result by the number under the heading “Expenses Paid During Period” to estimate the expenses you paid on your account during this period.
Hypothetical Example for Comparison Purposes
The table also provides information about hypothetical account values and hypothetical expenses based on the actual expense ratio of each class of your fund and an assumed rate of return of 5% per year before expenses, which is not the actual return of a fund’s share class. The hypothetical account values and expenses may not be used to estimate the actual ending account balance or expenses you paid for the period. You may use this information to compare the ongoing costs of investing in your fund and other funds. To do so, compare this 5% hypothetical example with the 5% hypothetical examples that appear in the shareholder reports of the other funds.
Please note that the expenses shown in the table are meant to highlight your ongoing costs only and do not reflect any transactional costs, such as sales charges (loads) or redemption/exchange fees. Therefore, the table is useful in comparing ongoing costs only, and will not help you determine the relative total costs of owning different funds. In addition, if these transactional costs were included, your costs would have been higher.
|
| | | | |
| | Beginning
Account Value
10/1/18 | Ending
Account Value
3/31/19 | Expenses Paid
During Period(1)
10/1/18 - 3/31/19 | Annualized
Expense Ratio(1)(2) |
| Actual | | | | |
| G Class | $1,000 | $968.30 | $0.00 | 0.00% |
| Hypothetical | | | | |
| G Class | $1,000 | $1,024.93 | $0.00 | 0.00% |
| |
| (1) | Expenses are equal to the class's annualized expense ratio listed in the table above, multiplied by the average account value over the period, multiplied by 182, the number of days in the most recent fiscal half-year, divided by 365, to reflect the one-half year period. Annualized expense ratio reflects actual expenses, including any applicable fee waivers or expense reimbursements and excluding any acquired fund fees and expenses. |
| |
| (2) | Other expenses, which include directors' fees and expenses, did not exceed 0.005%. |
MARCH 31, 2019
|
| | | | | |
| | Shares | Value |
| COMMON STOCKS — 94.0% | | |
| Aerospace and Defense — 0.4% | | |
| Textron, Inc. | 71,916 |
| $ | 3,643,265 |
|
| Airlines — 1.5% | | |
| Southwest Airlines Co. | 267,506 |
| 13,886,236 |
|
| Auto Components — 1.1% | | |
| Aptiv plc | 28,892 |
| 2,296,625 |
|
| BorgWarner, Inc. | 216,933 |
| 8,332,397 |
|
| | | 10,629,022 |
|
| Automobiles — 1.7% | | |
| Honda Motor Co. Ltd. ADR | 315,668 |
| 8,576,699 |
|
| Thor Industries, Inc. | 116,264 |
| 7,251,386 |
|
| | | 15,828,085 |
|
| Banks — 9.3% | | |
| BB&T Corp. | 412,813 |
| 19,208,189 |
|
| Comerica, Inc. | 105,397 |
| 7,727,708 |
|
| Commerce Bancshares, Inc. | 153,275 |
| 8,899,147 |
|
| First Hawaiian, Inc. | 435,366 |
| 11,341,284 |
|
| M&T Bank Corp. | 68,423 |
| 10,743,779 |
|
| Prosperity Bancshares, Inc. | 76,587 |
| 5,289,098 |
|
| SunTrust Banks, Inc. | 71,163 |
| 4,216,408 |
|
| UMB Financial Corp. | 166,915 |
| 10,689,237 |
|
| Westamerica Bancorporation | 143,685 |
| 8,879,733 |
|
| | | 86,994,583 |
|
| Beverages — 0.5% | | |
| Molson Coors Brewing Co., Class B | 75,705 |
| 4,515,803 |
|
| Building Products — 1.9% | | |
| Johnson Controls International plc | 429,152 |
| 15,852,875 |
|
| Masco Corp. | 56,981 |
| 2,239,923 |
|
| | | 18,092,798 |
|
| Capital Markets — 6.7% | | |
| Ameriprise Financial, Inc. | 107,844 |
| 13,814,816 |
|
| Invesco Ltd. | 638,086 |
| 12,321,441 |
|
| Northern Trust Corp. | 308,531 |
| 27,894,288 |
|
| State Street Corp. | 129,240 |
| 8,505,284 |
|
| | | 62,535,829 |
|
| Commercial Services and Supplies — 0.5% | | |
| Republic Services, Inc. | 56,484 |
| 4,540,184 |
|
| Containers and Packaging — 3.5% | | |
| Graphic Packaging Holding Co. | 1,011,248 |
| 12,772,062 |
|
| Packaging Corp. of America | 61,956 |
| 6,157,187 |
|
| Sonoco Products Co. | 133,199 |
| 8,195,735 |
|
|
| | | | | |
| | Shares | Value |
| WestRock Co. | 133,091 |
| $ | 5,104,040 |
|
| | | 32,229,024 |
|
| Distributors — 0.7% | | |
| Genuine Parts Co. | 59,347 |
| 6,648,644 |
|
| Electric Utilities — 4.6% | | |
| Edison International | 102,477 |
| 6,345,376 |
|
| Eversource Energy | 89,005 |
| 6,314,905 |
|
| Pinnacle West Capital Corp. | 124,473 |
| 11,897,129 |
|
| Xcel Energy, Inc. | 319,748 |
| 17,973,035 |
|
| | | 42,530,445 |
|
| Electrical Equipment — 6.6% | | |
| Eaton Corp. plc | 116,487 |
| 9,384,193 |
|
| Emerson Electric Co. | 170,327 |
| 11,662,290 |
|
| Hubbell, Inc. | 204,275 |
| 24,100,364 |
|
| nVent Electric plc | 305,794 |
| 8,250,322 |
|
| Schneider Electric SE | 96,694 |
| 7,586,149 |
|
| | | 60,983,318 |
|
| Electronic Equipment, Instruments and Components — 1.0% | | |
| TE Connectivity Ltd. | 112,377 |
| 9,074,443 |
|
| Energy Equipment and Services — 2.1% | | |
| Baker Hughes a GE Co. | 374,042 |
| 10,368,444 |
|
| Halliburton Co. | 161,179 |
| 4,722,545 |
|
| National Oilwell Varco, Inc. | 152,718 |
| 4,068,407 |
|
| | | 19,159,396 |
|
| Equity Real Estate Investment Trusts (REITs) — 4.8% | | |
| American Tower Corp. | 22,057 |
| 4,346,553 |
|
| Empire State Realty Trust, Inc., Class A | 288,068 |
| 4,551,474 |
|
| MGM Growth Properties LLC, Class A | 308,937 |
| 9,963,218 |
|
| Piedmont Office Realty Trust, Inc., Class A | 398,174 |
| 8,301,928 |
|
| Weyerhaeuser Co. | 670,238 |
| 17,654,069 |
|
| | | 44,817,242 |
|
| Food and Staples Retailing — 0.9% | | |
| Sysco Corp. | 130,466 |
| 8,709,910 |
|
| Food Products — 4.7% | | |
| Conagra Brands, Inc. | 342,376 |
| 9,497,510 |
|
| J.M. Smucker Co. (The) | 43,998 |
| 5,125,767 |
|
| Kellogg Co. | 84,982 |
| 4,876,267 |
|
| Mondelez International, Inc., Class A | 242,501 |
| 12,105,650 |
|
| Orkla ASA | 1,611,497 |
| 12,368,895 |
|
| | | 43,974,089 |
|
| Gas Utilities — 1.6% | | |
| Atmos Energy Corp. | 68,914 |
| 7,093,318 |
|
| Spire, Inc. | 91,533 |
| 7,532,251 |
|
| | | 14,625,569 |
|
| Health Care Equipment and Supplies — 4.1% | | |
Hologic, Inc.(1) | 85,871 |
| 4,156,156 |
|
| Siemens Healthineers AG | 145,328 |
| 6,056,257 |
|
|
| | | | | |
| | Shares | Value |
| Zimmer Biomet Holdings, Inc. | 215,641 |
| $ | 27,537,356 |
|
| | | 37,749,769 |
|
| Health Care Providers and Services — 4.4% | | |
| Cardinal Health, Inc. | 258,101 |
| 12,427,563 |
|
Henry Schein, Inc.(1) | 113,231 |
| 6,806,315 |
|
| McKesson Corp. | 76,865 |
| 8,997,817 |
|
| Quest Diagnostics, Inc. | 137,431 |
| 12,357,796 |
|
| | | 40,589,491 |
|
| Health Care Technology — 1.0% | | |
Cerner Corp.(1) | 159,657 |
| 9,133,977 |
|
| Hotels, Restaurants and Leisure — 1.7% | | |
| Carnival Corp. | 148,740 |
| 7,544,093 |
|
| Sodexo SA | 75,163 |
| 8,276,274 |
|
| | | 15,820,367 |
|
| Household Durables — 1.0% | | |
| PulteGroup, Inc. | 337,037 |
| 9,423,555 |
|
| Household Products — 1.0% | | |
| Kimberly-Clark Corp. | 76,049 |
| 9,422,471 |
|
| Insurance — 5.1% | | |
| Aflac, Inc. | 118,462 |
| 5,923,100 |
|
| Arthur J. Gallagher & Co. | 35,447 |
| 2,768,411 |
|
| Brown & Brown, Inc. | 170,719 |
| 5,037,917 |
|
| Chubb Ltd. | 101,102 |
| 14,162,368 |
|
| ProAssurance Corp. | 120,292 |
| 4,163,306 |
|
| Reinsurance Group of America, Inc. | 63,012 |
| 8,946,444 |
|
| Torchmark Corp. | 39,897 |
| 3,269,559 |
|
| Travelers Cos., Inc. (The) | 24,330 |
| 3,337,103 |
|
| | | 47,608,208 |
|
| Machinery — 3.7% | | |
| Atlas Copco AB, B Shares | 295,649 |
| 7,317,053 |
|
| Cummins, Inc. | 76,921 |
| 12,143,518 |
|
| IMI plc | 725,642 |
| 9,054,175 |
|
| PACCAR, Inc. | 87,359 |
| 5,952,642 |
|
| | | 34,467,388 |
|
| Multi-Utilities — 3.2% | | |
| Ameren Corp. | 137,957 |
| 10,146,738 |
|
| NorthWestern Corp. | 187,888 |
| 13,229,194 |
|
| WEC Energy Group, Inc. | 80,253 |
| 6,346,407 |
|
| | | 29,722,339 |
|
| Multiline Retail — 0.7% | | |
| Target Corp. | 86,112 |
| 6,911,349 |
|
| Oil, Gas and Consumable Fuels — 5.2% | | |
| Anadarko Petroleum Corp. | 140,229 |
| 6,377,615 |
|
| Cimarex Energy Co. | 94,666 |
| 6,617,153 |
|
| Devon Energy Corp. | 294,965 |
| 9,309,095 |
|
| EQT Corp. | 325,423 |
| 6,749,273 |
|
Equitrans Midstream Corp.(1) | 260,338 |
| 5,670,162 |
|
|
| | | | | |
| | Shares | Value |
| Imperial Oil Ltd. | 152,119 |
| $ | 4,152,581 |
|
| Noble Energy, Inc. | 370,581 |
| 9,164,468 |
|
| | | 48,040,347 |
|
| Road and Rail — 1.0% | | |
| Heartland Express, Inc. | 477,673 |
| 9,209,535 |
|
| Semiconductors and Semiconductor Equipment — 3.7% | | |
| Applied Materials, Inc. | 262,822 |
| 10,423,520 |
|
| Maxim Integrated Products, Inc. | 213,053 |
| 11,328,028 |
|
| Microchip Technology, Inc. | 88,484 |
| 7,340,633 |
|
| Teradyne, Inc. | 124,624 |
| 4,965,020 |
|
| | | 34,057,201 |
|
| Specialty Retail — 1.1% | | |
| Advance Auto Parts, Inc. | 58,523 |
| 9,979,927 |
|
| Technology Hardware, Storage and Peripherals — 0.7% | | |
| HP, Inc. | 333,589 |
| 6,481,634 |
|
| Thrifts and Mortgage Finance — 1.0% | | |
| Capitol Federal Financial, Inc. | 698,722 |
| 9,327,939 |
|
| Trading Companies and Distributors — 1.3% | | |
| MSC Industrial Direct Co., Inc., Class A | 152,057 |
| 12,576,635 |
|
TOTAL COMMON STOCKS
(Cost $771,525,992) | | 873,940,017 |
|
| EXCHANGE-TRADED FUNDS — 3.0% | | |
iShares Russell Mid-Cap Value ETF
(Cost $26,960,579) | 322,102 |
| 27,977,779 |
|
| TEMPORARY CASH INVESTMENTS — 2.8% | | |
| Repurchase Agreement, BMO Capital Markets Corp., (collateralized by various U.S. Treasury obligations, 0.125% - 2.875%, 9/30/19 - 2/15/44, valued at $23,030,021), in a joint trading account at 2.35%, dated 3/29/19, due 4/1/19 (Delivery value $22,574,381) | | 22,569,961 |
|
| Repurchase Agreement, Fixed Income Clearing Corp., (collateralized by various U.S. Treasury obligations, 2.50%, 8/15/23, valued at $3,848,070), at 1.25%, dated 3/29/19, due 4/1/19 (Delivery value $3,772,393) | | 3,772,000 |
|
| State Street Institutional U.S. Government Money Market Fund, Premier Class | 12,483 |
| 12,483 |
|
TOTAL TEMPORARY CASH INVESTMENTS
(Cost $26,354,444) | | 26,354,444 |
|
TOTAL INVESTMENT SECURITIES — 99.8%
(Cost $824,841,015) | | 928,272,240 |
|
| OTHER ASSETS AND LIABILITIES — 0.2% | | 1,853,854 |
|
| TOTAL NET ASSETS — 100.0% | | $ | 930,126,094 |
|
|
| | | | | | | | |
| FORWARD FOREIGN CURRENCY EXCHANGE CONTRACTS |
| Currency Purchased | Currency Sold | Counterparty | Settlement Date | Unrealized Appreciation
(Depreciation) |
| CAD | 171,971 | USD | 128,739 | Morgan Stanley | 6/28/19 | $ | 227 |
|
| USD | 3,590,304 | CAD | 4,807,417 | Morgan Stanley | 6/28/19 | (14,926 | ) |
| EUR | 513,428 | USD | 580,383 | Credit Suisse AG | 6/28/19 | (203 | ) |
| USD | 19,279,969 | EUR | 16,898,616 | Credit Suisse AG | 6/28/19 | 184,309 |
|
| GBP | 169,619 | USD | 225,331 | JPMorgan Chase Bank N.A. | 6/28/19 | (3,454 | ) |
| USD | 7,897,948 | GBP | 5,958,246 | JPMorgan Chase Bank N.A. | 6/28/19 | 103,990 |
|
| USD | 5,311,129 | JPY | 580,514,324 | Bank of America N.A. | 6/28/19 | 37,536 |
|
| NOK | 2,821,731 | USD | 327,845 | Goldman Sachs & Co. | 6/28/19 | 407 |
|
| USD | 10,831,336 | NOK | 92,076,104 | Goldman Sachs & Co. | 6/28/19 | 120,109 |
|
| USD | 6,219,646 | SEK | 57,032,909 | Goldman Sachs & Co. | 6/28/19 | 45,171 |
|
| | | | | | | $ | 473,166 |
|
|
| | |
| NOTES TO SCHEDULE OF INVESTMENTS |
| ADR | - | American Depositary Receipt |
| CAD | - | Canadian Dollar |
| EUR | - | Euro |
| GBP | - | British Pound |
| JPY | - | Japanese Yen |
| NOK | - | Norwegian Krone |
| SEK | - | Swedish Krona |
| USD | - | United States Dollar |
See Notes to Financial Statements.
|
|
| Statement of Assets and Liabilities |
|
| | | |
| MARCH 31, 2019 | |
| Assets | |
| Investment securities, at value (cost of $824,841,015) | $ | 928,272,240 |
|
| Receivable for investments sold | 1,742,450 |
|
| Unrealized appreciation on forward foreign currency exchange contracts | 491,749 |
|
| Dividends and interest receivable | 1,663,443 |
|
| | 932,169,882 |
|
| | |
| Liabilities | |
| Payable for investments purchased | 2,004,261 |
|
| Payable for capital shares redeemed | 20,944 |
|
| Unrealized depreciation on forward foreign currency exchange contracts | 18,583 |
|
| | 2,043,788 |
|
| | |
| Net Assets | $ | 930,126,094 |
|
| | |
| G Class Capital Shares, $0.01 Par Value | |
| Shares authorized | 550,000,000 |
|
| Shares outstanding | 80,260,543 |
|
| | |
| Net Asset Value Per Share | $ | 11.59 |
|
| | |
| Net Assets Consist of: | |
| Capital (par value and paid-in surplus) | $ | 848,672,329 |
|
| Distributable earnings | 81,453,765 |
|
| | $ | 930,126,094 |
|
See Notes to Financial Statements.
|
| | | |
| YEAR ENDED MARCH 31, 2019 | |
| Investment Income (Loss) | |
| Income: | |
| Dividends (net of foreign taxes withheld of $171,866) | $ | 22,244,104 |
|
| Interest | 370,006 |
|
| | 22,614,110 |
|
| | |
| Expenses: | |
| Management fees | 6,317,379 |
|
| Directors' fees and expenses | 26,996 |
|
| Other expenses | 5,227 |
|
| | 6,349,602 |
|
| Fees waived | (6,317,379 | ) |
| | 32,223 |
|
| | |
| Net investment income (loss) | 22,581,887 |
|
| | |
| Realized and Unrealized Gain (Loss) | |
| Net realized gain (loss) on: | |
| Investment transactions | 54,213,989 |
|
| Forward foreign currency exchange contract transactions | 3,342,573 |
|
| Foreign currency translation transactions | (3,037 | ) |
| | 57,553,525 |
|
| | |
| Change in net unrealized appreciation (depreciation) on: | |
| Investments | (58,980,918 | ) |
| Forward foreign currency exchange contracts | 407,663 |
|
| Translation of assets and liabilities in foreign currencies | (412 | ) |
| | (58,573,667 | ) |
| | |
| Net realized and unrealized gain (loss) | (1,020,142 | ) |
| | |
| Net Increase (Decrease) in Net Assets Resulting from Operations | $ | 21,561,745 |
|
See Notes to Financial Statements.
|
|
| Statement of Changes in Net Assets |
|
| | | | | | |
| YEARS ENDED MARCH 31, 2019 AND MARCH 31, 2018 |
| Increase (Decrease) in Net Assets | March 31, 2019 | March 31, 2018 |
| Operations | | |
| Net investment income (loss) | $ | 22,581,887 |
| $ | 24,318,094 |
|
| Net realized gain (loss) | 57,553,525 |
| 91,802,235 |
|
| Change in net unrealized appreciation (depreciation) | (58,573,667 | ) | (48,186,284 | ) |
| Net increase (decrease) in net assets resulting from operations | 21,561,745 |
| 67,934,045 |
|
| | | |
| Distributions to Shareholders | | |
From earnings:(1) | | |
| G Class | (129,362,542 | ) | (104,759,403 | ) |
| R6 Class | — |
| (365,288 | ) |
| Decrease in net assets from distributions | (129,362,542 | ) | (105,124,691 | ) |
| | | |
| Capital Share Transactions | | |
| Net increase (decrease) in net assets from capital share transactions (Note 5) | 16,296,954 |
| 11,132,295 |
|
| | | |
| Net increase (decrease) in net assets | (91,503,843 | ) | (26,058,351 | ) |
| | | |
| Net Assets | | |
| Beginning of period | 1,021,629,937 |
| 1,047,688,288 |
|
| End of period | $ | 930,126,094 |
| $ | 1,021,629,937 |
|
| |
| (1) | Prior period presentation has been updated to reflect the current period combination of distributions to shareholders from net investment income and net realized gains. Distributions from net investment income were $(23,096,584) and $(365,288) for G Class and R6 Class, respectively. Distributions from net realized gains were $(81,662,819) for G Class. |
See Notes to Financial Statements.
|
|
| Notes to Financial Statements |
MARCH 31, 2019
1. Organization
American Century Capital Portfolios, Inc. (the corporation) is registered under the Investment Company Act of 1940, as amended (the 1940 Act), as an open-end management investment company and is organized as a Maryland corporation. NT Mid Cap Value Fund (the fund) is one fund in a series issued by the corporation. The fund’s investment objective is to seek long-term capital growth. Income is a secondary objective. The fund is not permitted to invest in securities issued by companies assigned the Global Industry Classification Standard or the Bloomberg Industry Classification Standard for the tobacco industry. The fund offers the G Class. On July 31, 2017, all outstanding R6 Class shares were converted to G Class shares and the fund discontinued offering the R6 Class.
2. Significant Accounting Policies
The following is a summary of significant accounting policies consistently followed by the fund in preparation of its financial statements. The fund is an investment company and follows accounting and reporting guidance in accordance with accounting principles generally accepted in the United States of America. This may require management to make certain estimates and assumptions at the date of the financial statements. Actual results could differ from these estimates. Management evaluated the impact of events or transactions occurring through the date the financial statements were issued that would merit recognition or disclosure.
Investment Valuations — The fund determines the fair value of its investments and computes its net asset value per share at the close of regular trading (usually 4 p.m. Eastern time) on the New York Stock Exchange (NYSE) on each day the NYSE is open. The Board of Directors has adopted valuation policies and procedures to guide the investment advisor in the fund’s investment valuation process and to provide methodologies for the oversight of the fund’s pricing function.
Equity securities that are listed or traded on a domestic securities exchange are valued at the last reported sales price or at the official closing price as provided by the exchange. Equity securities traded on foreign securities exchanges are generally valued at the closing price of such securities on the exchange where primarily traded or at the close of the NYSE, if that is earlier. If no last sales price is reported, or if local convention or regulation so provides, the mean of the latest bid and asked prices may be used. Securities traded over-the-counter are valued at the mean of the latest bid and asked prices, the last sales price, or the official closing price. Equity securities initially expressed in local currencies are translated into U.S. dollars at the mean of the appropriate currency exchange rate at the close of the NYSE as provided by an independent pricing service.
Open-end management investment companies are valued at the reported net asset value per share. Repurchase agreements are valued at cost, which approximates fair value. Forward foreign currency exchange contracts are valued at the mean of the appropriate forward exchange rate at the close of the NYSE as provided by an independent pricing service.
If the fund determines that the market price for an investment is not readily available or the valuation methods mentioned above do not reflect an investment’s fair value, such investment is valued as determined in good faith by the Board of Directors or its delegate, in accordance with policies and procedures adopted by the Board of Directors. In its determination of fair value, the fund may review several factors including, but not limited to, market information regarding the specific investment or comparable investments and correlation with other investment types, futures indices or general market indicators. Circumstances that may cause the fund to use these procedures to value an investment include, but are not limited to: an investment has been declared in default or is distressed; trading in a security has been suspended during the trading day or a security is not actively trading on its principal exchange; prices received from a regular pricing source are deemed unreliable; or there is a foreign market holiday and no trading occurred.
The fund monitors for significant events occurring after the close of an investment’s primary exchange but before the fund’s net asset value per share is determined. Significant events may include, but are not limited to: corporate announcements and transactions; governmental action and political unrest that could impact a specific investment or an investment sector; or armed conflicts, natural disasters and similar events that could affect investments in a specific country or region. The fund also monitors for significant fluctuations between domestic and foreign markets, as evidenced by the U.S. market or such other indicators that the Board of Directors, or its delegate, deems appropriate. If significant fluctuations in foreign markets are identified, the fund may apply a model-derived factor to the closing price of equity securities traded on foreign securities exchanges. The factor is based on observable market data as provided by an independent pricing service.
Security Transactions — Security transactions are accounted for as of the trade date. Net realized gains and losses are determined on the identified cost basis, which is also used for federal income tax purposes.
Investment Income — Dividend income less foreign taxes withheld, if any, is recorded as of the ex-dividend date. Distributions received on securities that represent a return of capital or long-term capital gain are recorded as a reduction of cost of investments and/or as a realized gain. The fund may estimate the components of distributions received that may be considered nontaxable distributions or long-term capital gain distributions for income tax purposes. Interest income is recorded on the accrual basis and includes accretion of discounts and amortization of premiums.
Foreign Currency Translations — All assets and liabilities initially expressed in foreign currencies are translated into U.S. dollars at prevailing exchange rates at period end. The fund may enter into spot foreign currency exchange contracts to facilitate transactions denominated in a foreign currency. Purchases and sales of investment securities, dividend and interest income, spot foreign currency exchange contracts, and expenses are translated at the rates of exchange prevailing on the respective dates of such transactions. Net realized and unrealized foreign currency exchange gains or losses related to investment securities are a component of net realized gain (loss) on investment transactions and change in net unrealized appreciation (depreciation) on investments, respectively.
Repurchase Agreements — The fund may enter into repurchase agreements with institutions that American Century Investment Management, Inc. (ACIM) (the investment advisor) has determined are creditworthy pursuant to criteria adopted by the Board of Directors. The fund requires that the collateral, represented by securities, received in a repurchase transaction be transferred to the custodian in a manner sufficient to enable the fund to obtain those securities in the event of a default under the repurchase agreement. ACIM monitors, on a daily basis, the securities transferred to ensure the value, including accrued interest, of the securities under each repurchase agreement is equal to or greater than amounts owed to the fund under each repurchase agreement.
Joint Trading Account — Pursuant to an Exemptive Order issued by the Securities and Exchange Commission, the fund, along with certain other funds in the American Century Investments family of funds, may transfer uninvested cash balances into a joint trading account. These balances are invested in one or more repurchase agreements that are collateralized by U.S. Treasury or Agency obligations.
Income Tax Status — It is the fund’s policy to distribute substantially all net investment income and net realized gains to shareholders and to otherwise qualify as a regulated investment company under provisions of the Internal Revenue Code. Accordingly, no provision has been made for income taxes. The fund files U.S. federal, state, local and non-U.S. tax returns as applicable. The fund's tax returns are subject to examination by the relevant taxing authority until expiration of the applicable statute of limitations, which is generally three years from the date of filing but can be longer in certain jurisdictions. At this time, management believes there are no uncertain tax positions which, based on their technical merit, would not be sustained upon examination and for which it is reasonably possible that the total amounts of unrecognized tax benefits will significantly change in the next twelve months.
Distributions to Shareholders — Distributions from net investment income, if any, are generally declared and paid quarterly. Distributions from net realized gains, if any, are generally declared and paid annually.
Indemnifications — Under the corporation’s organizational documents, its officers and directors are indemnified against certain liabilities arising out of the performance of their duties to the fund. In addition, in the normal course of business, the fund enters into contracts that provide general indemnifications. The maximum exposure under these arrangements is unknown as this would involve future claims that may be made against a fund. The risk of material loss from such claims is considered by management to be remote.
3. Fees and Transactions with Related Parties
Certain officers and directors of the corporation are also officers and/or directors of American Century Companies, Inc. (ACC). The corporation’s investment advisor, ACIM, the corporation's distributor, American Century Investment Services, Inc., and the corporation’s transfer agent, American Century Services, LLC, are wholly owned, directly or indirectly, by ACC. Various funds issued by American Century Asset Allocation Portfolios, Inc. own, in aggregate, 100% of the shares of the fund. Related parties do not invest in the fund for the purpose of exercising management or control.
Management Fees — The corporation has entered into a management agreement with ACIM, under which ACIM provides the fund with investment advisory and management services in exchange for a single, unified management fee (the fee). The agreement provides that all expenses of managing and operating the fund, except brokerage expenses, taxes, interest, fees and expenses of the independent directors (including legal counsel fees), and extraordinary expenses, will be paid by ACIM. The fee is computed and accrued daily based on the daily net assets of the fund and paid monthly in arrears. The annual management fee is 0.65%. The investment advisor agreed to waive the management fee in its entirety. The investment advisor expects this waiver to remain in effect permanently and cannot terminate it without the approval of the Board of Directors. The effective annual management fee for the period ended March 31, 2019 was 0.65% before waiver and 0.00% after waiver.
Directors' Fees and Expenses — The Board of Directors is responsible for overseeing the investment advisor’s management and operations of the fund. The directors receive detailed information about the fund and its investment advisor regularly throughout the year, and meet at least quarterly with management of the investment advisor to review reports about fund operations. The fund’s officers do not receive compensation from the fund.
Interfund Transactions — The fund may enter into security transactions with other American Century Investments funds and other client accounts of the investment advisor, in accordance with the 1940 Act rules and procedures adopted by the Board of Directors. The rules and procedures require, among other things, that these transactions be effected at the independent current market price of the security. During the period, the interfund purchases and sales were $6,909,089 and $9,842,750, respectively. The effect of interfund transactions on the Statement of Operations was $1,283,372 in net realized gain (loss) on investment transactions.
4. Investment Transactions
Purchases and sales of investment securities, excluding short-term investments, for the period ended March 31, 2019 were $550,414,058 and $642,581,812, respectively.
5. Capital Share Transactions
Transactions in shares of the fund were as follows:
|
| | | | | | | | | | |
| | Year ended
March 31, 2019 | Year ended
March 31, 2018 |
| | Shares | Amount | Shares | Amount |
| G Class/Shares Authorized | 550,000,000 |
| | 550,000,000 |
| |
| Sold | 8,947,578 |
| $ | 108,253,911 |
| 14,251,886 |
| $ | 197,749,634 |
|
| Issued in reinvestment of distributions | 11,645,404 |
| 129,362,542 |
| 7,743,905 |
| 104,759,403 |
|
| Redeemed | (17,472,830 | ) | (221,319,499 | ) | (12,739,594 | ) | (178,048,521 | ) |
| | 3,120,152 |
| 16,296,954 |
| 9,256,197 |
| 124,460,516 |
|
| R6 Class/Shares Authorized | N/A |
| | N/A |
| |
| Sold | | | 855,387 |
| 11,802,674 |
|
| Issued in reinvestment of distributions | | | 26,318 |
| 365,288 |
|
| Redeemed | | | (8,999,664 | ) | (125,496,183 | ) |
| | | | (8,117,959 | ) | (113,328,221 | ) |
| Net increase (decrease) | 3,120,152 |
| $ | 16,296,954 |
| 1,138,238 |
| $ | 11,132,295 |
|
6. Fair Value Measurements
The fund’s investments valuation process is based on several considerations and may use multiple inputs to determine the fair value of the investments held by the fund. In conformity with accounting principles generally accepted in the United States of America, the inputs used to determine a valuation are classified into three broad levels.
| |
| • | Level 1 valuation inputs consist of unadjusted quoted prices in an active market for identical investments. |
| |
| • | Level 2 valuation inputs consist of direct or indirect observable market data (including quoted prices for comparable investments, evaluations of subsequent market events, interest rates, prepayment speeds, credit risk, etc.). These inputs also consist of quoted prices for identical investments initially expressed in local currencies that are adjusted through translation into U.S. dollars. |
| |
| • | Level 3 valuation inputs consist of unobservable data (including a fund’s own assumptions). |
The level classification is based on the lowest level input that is significant to the fair valuation measurement. The valuation inputs are not necessarily an indication of the risks associated with investing in these securities or other financial instruments.
The following is a summary of the level classifications as of period end. The Schedule of Investments provides additional information on the fund’s portfolio holdings.
|
| | | | | | | | |
| | Level 1 | Level 2 | Level 3 |
| Assets | | | |
| Investment Securities | | | |
| Common Stocks | | | |
| Electrical Equipment | $ | 53,397,169 |
| $ | 7,586,149 |
| — |
|
| Food Products | 31,605,194 |
| 12,368,895 |
| — |
|
| Health Care Equipment and Supplies | 31,693,512 |
| 6,056,257 |
| — |
|
| Hotels, Restaurants and Leisure | 7,544,093 |
| 8,276,274 |
| — |
|
| Machinery | 18,096,160 |
| 16,371,228 |
| — |
|
| Oil, Gas and Consumable Fuels | 43,887,766 |
| 4,152,581 |
| — |
|
| Other Industries | 632,904,739 |
| — |
| — |
|
| Exchange-Traded Funds | 27,977,779 |
| — |
| — |
|
| Temporary Cash Investments | 12,483 |
| 26,341,961 |
| — |
|
| | $ | 847,118,895 |
| $ | 81,153,345 |
| — |
|
| Other Financial Instruments | | | |
| Forward Foreign Currency Exchange Contracts | — |
| $ | 491,749 |
| — |
|
| | | | |
| Liabilities | | | |
| Other Financial Instruments | | | |
| Forward Foreign Currency Exchange Contracts | — |
| $ | 18,583 |
| — |
|
7. Derivative Instruments
Foreign Currency Risk — The fund is subject to foreign currency exchange rate risk in the normal course of pursuing its investment objectives. The value of foreign investments held by a fund may be significantly affected by changes in foreign currency exchange rates. The dollar value of a foreign security generally decreases when the value of the dollar rises against the foreign currency in which the security is denominated and tends to increase when the value of the dollar declines against such foreign currency. A fund may enter into forward foreign currency exchange contracts to reduce a fund's exposure to foreign currency exchange rate fluctuations. The net U.S. dollar value of foreign currency underlying all contractual commitments held by a fund and the resulting unrealized appreciation or depreciation are determined daily. Realized gain or loss is recorded upon the termination of the contract. Net realized and unrealized gains or losses occurring during the holding period of forward foreign currency exchange contracts are a component of net realized gain (loss) on forward foreign currency exchange contract transactions and change in net unrealized appreciation (depreciation) on forward foreign currency exchange contracts, respectively. A fund bears the risk of an
unfavorable change in the foreign currency exchange rate underlying the forward contract. Additionally, losses, up to the fair value, may arise if the counterparties do not perform under the contract terms. The fund's average U.S. dollar exposure to foreign currency risk derivative instruments held during the period was $52,437,787.
The value of foreign currency risk derivative instruments as of March 31, 2019, is disclosed on the Statement of Assets and Liabilities as an asset of $491,749 in unrealized appreciation on forward foreign currency exchange contracts and a liability of $18,583 in unrealized depreciation on forward foreign currency exchange contracts. For the year ended March 31, 2019, the effect of foreign currency risk derivative instruments on the Statement of Operations was $3,342,573 in net realized gain (loss) on forward foreign currency exchange contract transactions and $407,663 in change in net unrealized appreciation (depreciation) on forward foreign currency exchange contracts.
8. Risk Factors
There are certain risks involved in investing in foreign securities. These risks include those resulting from political events (such as civil unrest, national elections and imposition of exchange controls), social and economic events (such as labor strikes and rising inflation), and natural disasters. Securities of foreign issuers may be less liquid and more volatile. Investing a significant portion of assets in one country or region may accentuate these risks.
9. Federal Tax Information
The tax character of distributions paid during the years ended March 31, 2019 and March 31, 2018 were as follows:
|
| | | | | | |
| | 2019 | 2018 |
| Distributions Paid From | | |
| Ordinary income | $ | 30,009,207 |
| $ | 33,534,916 |
|
| Long-term capital gains | $ | 99,353,335 |
| $ | 71,589,775 |
|
The book-basis character of distributions made during the year from net investment income or net realized gains may differ from their ultimate characterization for federal income tax purposes. These differences reflect the differing character of certain income items and net realized gains and losses for financial statement and tax purposes, and may result in reclassification among certain capital accounts on the financial statements.
As of period end, the federal tax cost of investments and the components of distributable earnings on a tax-basis were as follows:
|
| | | |
| Federal tax cost of investments | $ | 845,750,772 |
|
| Gross tax appreciation of investments | $ | 127,452,712 |
|
| Gross tax depreciation of investments | (44,931,244 | ) |
| Net tax appreciation (depreciation) of investments | 82,521,468 |
|
| Net tax appreciation (depreciation) on derivatives and translation of assets and liabilities in foreign currencies | (206 | ) |
| Net tax appreciation (depreciation) | $ | 82,521,262 |
|
| Undistributed ordinary income | $ | 1,362,150 |
|
| Post-October capital loss deferral | $ | (2,429,647 | ) |
The difference between book-basis and tax-basis unrealized appreciation (depreciation) is attributable primarily to the tax deferral of losses on wash sales.
Loss deferrals represent certain qualified losses that the fund has elected to treat as having been incurred in the following fiscal year for federal income tax purposes.
|
| | | | | | | | | | | | | | | | | |
| For a Share Outstanding Throughout the Years Ended March 31 (except as noted) |
| Per-Share Data | | | | | | | Ratios and Supplemental Data |
| | | Income From Investment Operations: | Distributions From: | | | Ratio to Average Net Assets of: | |
| | Net Asset
Value,
Beginning
of Period | Net
Investment
Income
(Loss)(1) | Net
Realized
and
Unrealized
Gain (Loss) | Total From
Investment
Operations | Net
Investment
Income | Net
Realized
Gains | Total
Distributions | Net Asset
Value,
End
of Period | Total
Return(2) | Operating
Expenses | Operating
Expenses
(before
expense
waiver) | Net
Investment
Income
(Loss) | Net Investment Income (Loss) (before expense waiver) | Portfolio
Turnover
Rate | Net
Assets,
End of
Period (in thousands) |
| G Class | | | | | | | | | | | | | | |
| 2019 | $13.24 | 0.30 | (0.17) | 0.13 | (0.29) | (1.49) | (1.78) | $11.59 | 1.87% | 0.00%(3) | 0.65% | 2.32% | 1.67% | 58% |
| $930,126 |
|
| 2018 | $13.79 | 0.31 | 0.55 | 0.86 | (0.30) | (1.11) | (1.41) | $13.24 | 6.30% | 0.24% | 0.70% | 2.27% | 1.81% | 51% |
| $1,021,630 |
|
| 2017 | $11.97 | 0.20 | 2.30 | 2.50 | (0.22) | (0.46) | (0.68) | $13.79 | 20.98% | 0.78% | 0.80% | 1.55% | 1.53% | 60% |
| $935,804 |
|
| 2016 | $12.82 | 0.17 | 0.05 | 0.22 | (0.17) | (0.90) | (1.07) | $11.97 | 2.13% | 0.80% | 0.81% | 1.39% | 1.38% | 67% |
| $842,671 |
|
| 2015 | $12.62 | 0.18 | 1.56 | 1.74 | (0.17) | (1.37) | (1.54) | $12.82 | 14.05% | 0.80% | 0.80% | 1.37% | 1.37% | 67% |
| $762,209 |
|
|
|
| Notes to Financial Highlights |
| |
| (1) | Computed using average shares outstanding throughout the period. |
| |
| (2) | Total returns are calculated based on the net asset value of the last business day. Total returns for periods less than one year are not annualized. |
| |
| (3) | Ratio was less than 0.005%. |
See Notes to Financial Statements.
|
|
| Report of Independent Registered Public Accounting Firm |
To the shareholders and the Board of Directors of American Century Capital Portfolios, Inc.:
Opinion on the Financial Statements and Financial Highlights
We have audited the accompanying statement of assets and liabilities, including the schedule of investments, of NT Mid Cap Value Fund, one of the portfolios constituting the American Century Capital Portfolios, Inc. (the “Fund”), as of March 31, 2019, the related statement of operations for the year then ended, the statements of changes in net assets for each of the two years in the period then ended, the financial highlights for each of the five years in the period then ended, and the related notes. In our opinion, the financial statements and financial highlights present fairly, in all material respects, the financial position of NT Mid Cap Value Fund of the American Century Capital Portfolios, Inc. as of March 31, 2019, the results of its operations for the year then ended, the changes in its net assets for each of the two years in the period then ended, and the financial highlights for each of the five years in the period then ended, in conformity with accounting principles generally accepted in the United States of America.
Basis for Opinion
These financial statements and financial highlights are the responsibility of the Fund's management. Our responsibility is to express an opinion on the Fund’s financial statements and financial highlights based on our audits. We are a public accounting firm registered with the Public Company Accounting Oversight Board (United States) (PCAOB) and are required to be independent with respect to the Fund in accordance with the U.S. federal securities laws and the applicable rules and regulations of the Securities and Exchange Commission and the PCAOB.
We conducted our audits in accordance with the standards of the PCAOB. Those standards require that we plan and perform the audit to obtain reasonable assurance about whether the financial statements and financial highlights are free of material misstatement, whether due to error or fraud. The Fund is not required to have, nor were we engaged to perform, an audit of its internal control over financial reporting. As part of our audits we are required to obtain an understanding of internal control over financial reporting but not for the purpose of expressing an opinion on the effectiveness of the Fund’s internal control over financial reporting. Accordingly, we express no such opinion.
Our audits included performing procedures to assess the risks of material misstatement of the financial statements and financial highlights, whether due to error or fraud, and performing procedures that respond to those risks. Such procedures included examining, on a test basis, evidence regarding the amounts and disclosures in the financial statements and financial highlights. Our audits also included evaluating the accounting principles used and significant estimates made by management, as well as evaluating the overall presentation of the financial statements and financial highlights. Our procedures included confirmation of securities owned as of March 31, 2019, by correspondence with the custodian and brokers; when replies were not received from brokers, we performed other auditing procedures. We believe that our audits provide a reasonable basis for our opinion.
DELOITTE & TOUCHE LLP
Kansas City, Missouri
May 16, 2019
We have served as the auditor of one or more American Century investment companies since 1997.
The Board of Directors
The individuals listed below serve as directors of the funds. Each director will continue to serve in this capacity until death, retirement, resignation or removal from office. The board has adopted a mandatory retirement age for directors who are not “interested persons,” as that term is defined in the Investment Company Act (independent directors). Independent directors shall retire by December 31 of the year in which they reach their 75th birthday.
Mr. Thomas is an “interested person” because he currently serves as President and Chief Executive Officer of American Century Companies, Inc. (ACC), the parent company of American Century Investment Management, Inc. (ACIM or the advisor). The other directors (more than three-fourths of the total number) are independent. They are not employees, directors or officers of, and have no financial interest in, ACC or any of its wholly owned, direct or indirect, subsidiaries, including ACIM, American Century Investment Services, Inc. (ACIS) and American Century Services, LLC (ACS), and they do not have any other affiliations, positions or relationships that would cause them to be considered “interested persons” under the Investment Company Act. The directors serve in this capacity for seven (in the case of Jonathan S. Thomas, 16; and Stephen E. Yates, 8) registered investment companies in the American Century Investments family of funds.
The following table presents additional information about the directors. The mailing address for each director is 4500 Main Street, Kansas City, Missouri 64111.
|
| | | | | |
Name
(Year of Birth) | Position(s) Held with Funds | Length of Time Served | Principal Occupation(s) During Past 5 Years | Number of American Century Portfolios Overseen by Director | Other Directorships Held During Past 5 Years |
| Independent Directors |
|
|
| Thomas W. Bunn (1953) | Director | Since 2017 | Retired | 67 | SquareTwo Financial; Barings (formerly Babson Capital Funds Trust) (2013 to 2016) |
Chris H. Cheesman
(1962)
| Director | Since 2019
| Retired. Senior Vice President & Chief Audit Executive, AllianceBernstein (1999 to 2018)
| 67 | None |
Barry Fink
(1955) | Director | Since 2012 (independent since 2016) | Retired | 67 | None |
Rajesh K. Gupta
(1960)
| Director | Since 2019
| Partner Emeritus, SeaCrest Investment Management and SeaCrest Wealth Management (2019 to Present); Chief Executive Officer and Chief Investment Officer, SeaCrest Investment Management (2006 to 2019); Chief Executive Officer and Chief Investment Officer, SeaCrest Wealth Management (2008 to 2019)
| 67 | None |
|
| | | | | |
Name
(Year of Birth) | Position(s) Held with Funds | Length of Time Served | Principal Occupation(s) During Past 5 Years | Number of American Century Portfolios Overseen by Director | Other Directorships Held During Past 5 Years |
| Independent Directors |
|
|
Lynn Jenkins
(1963)
| Director | Since 2019
| United States Representative, U.S. House of Representatives (2009 to 2018) | 67 | MGP Ingredients, Inc. |
Jan M. Lewis
(1957) | Director | Since 2011 | Retired | 67 | None |
John R. Whitten
(1946) | Director | Since 2008 | Retired | 67 | Rudolph Technologies, Inc. |
Stephen E. Yates
(1948) | Director and Chairman of the Board | Since 2012 (Chairman since 2018) | Retired | 72 | None |
| Interested Director |
|
|
Jonathan S. Thomas
(1963) | Director and President | Since 2007 | President and Chief Executive Officer, ACC (2007 to present). Also serves as Chief Executive Officer, ACS; Executive Vice President, ACIM; Director, ACC, ACIM and other ACC subsidiaries | 117 | BioMed Valley Discoveries, Inc. |
The Statement of Additional Information has additional information about the fund's directors and is available without charge, upon request, by calling 1-800-345-2021.
Officers
The following table presents certain information about the executive officers of the funds. Each officer serves as an officer for 16 (in the case of Robert J. Leach, 15) investment companies in the American Century family of funds, unless otherwise noted. No officer is compensated for his or her service as an officer of the funds. The listed officers are interested persons of the funds and are appointed or re-appointed on an annual basis. The mailing address for each officer listed below is 4500 Main Street, Kansas City, Missouri 64111.
|
| | |
Name
(Year of Birth) | Offices with the Funds | Principal Occupation(s) During the Past Five Years |
Jonathan S. Thomas
(1963) | Director and President since 2007 | President and Chief Executive Officer, ACC (2007 to present). Also serves as Chief Executive Officer, ACS; Executive Vice President, ACIM; Director, ACC, ACIM and other ACC subsidiaries |
R. Wes Campbell
(1974)
| Chief Financial Officer and Treasurer since 2018 | Investment Operations and Investment Accounting, ACS (2000 to present) |
Amy D. Shelton
(1964) | Chief Compliance Officer and Vice President since 2014 | Chief Compliance Officer, American Century funds, (2014 to present); Chief Compliance Officer, ACIM (2014 to present); Chief Compliance Officer, ACIS (2009 to present); Vice President, Client Interactions and Marketing, ACIS (2013 to 2014). Also serves as Vice President, ACIS |
Charles A. Etherington
(1957) | General Counsel since 2007 and Senior Vice President since 2006 | Attorney, ACC (1994 to present); Vice President, ACC (2005 to present); General Counsel, ACC (2007 to present). Also serves as General Counsel, ACIM, ACS, ACIS and other ACC subsidiaries; and Senior Vice President, ACIM and ACS |
C. Jean Wade
(1964) | Vice President since 2012 | Senior Vice President, ACS (2017 to present); Vice President, ACS (2000 to 2017) |
Robert J. Leach
(1966) | Vice President since 2006 | Vice President, ACS (2000 to present) |
David H. Reinmiller
(1963) | Vice President since 2000 | Attorney, ACC (1994 to present). Also serves as Vice President, ACIM and ACS |
Ward D. Stauffer
(1960) | Secretary since 2005 | Attorney, ACC (2003 to present) |
Retirement Account Information
As required by law, distributions you receive from certain retirement accounts are subject to federal income tax withholding, unless you elect not to have withholding apply*. Tax will be withheld on the total amount withdrawn even though you may be receiving amounts that are not subject to withholding, such as nondeductible contributions. In such case, excess amounts of withholding could occur. You may adjust your withholding election so that a greater or lesser amount will be withheld.
If you don’t want us to withhold on this amount, you must notify us to not withhold the federal income tax. You may notify us in writing or in certain situations by telephone or through other electronic means. For systematic withdrawals, your withholding election will remain in effect until revoked or changed by filing a new election. You have the right to revoke your election at any time and change your withholding percentage for future distributions.
Remember, even if you elect not to have income tax withheld, you are liable for paying income tax on the taxable portion of your withdrawal. If you elect not to have income tax withheld or you don’t have enough income tax withheld, you may be responsible for payment of estimated tax. You may incur penalties under the estimated tax rules if your withholding and estimated tax payments are not sufficient. You can reduce or defer the income tax on a distribution by directly or indirectly rolling such distribution over to another IRA or eligible plan. You should consult your tax advisor for additional information.
State tax will be withheld if, at the time of your distribution, your address is within one of the mandatory withholding states and you have federal income tax withheld (or as otherwise required by state law). State taxes will be withheld from your distribution in accordance with the respective state rules.
*Some 403(b), 457 and qualified retirement plan distributions may be subject to 20% mandatory withholding, as they are subject to special tax and withholding rules. Your plan administrator or plan sponsor is required to provide you with a special tax notice explaining those rules at the time you request a distribution. If applicable, federal and/or state taxes may be withheld from your distribution amount.
Proxy Voting Policies
A description of the policies that the fund's investment advisor uses in exercising the voting rights associated with the securities purchased and/or held by the fund is available without charge, upon request, by calling 1-800-345-2021. It is also available on the "About Us" page of American Century Investments’ website at americancentury.com and on the Securities and Exchange Commission’s website at sec.gov. Information regarding how the investment advisor voted proxies relating to portfolio securities during the most recent 12-month period ended June 30 is available on the "About Us" page at americancentury.com. It is also available at sec.gov.
Quarterly Portfolio Disclosure
The fund files its complete schedule of portfolio holdings with the Securities and Exchange Commission (SEC) for the first and third quarters of each fiscal year on Form N-Q or as an exhibit to its reports on Form N-PORT. The fund’s Forms N-Q and Form N-PORT reports are available on the SEC’s website at sec.gov. The fund also makes its complete schedule of portfolio holdings for the most recent quarter of its fiscal year available on its website at americancentury.com and, upon request, by calling 1-800-345-2021.
Other Tax Information
The following information is provided pursuant to provisions of the Internal Revenue Code.
The fund hereby designates up to the maximum amount allowable as qualified dividend income for the fiscal year ended March 31, 2019.
For corporate taxpayers, the fund hereby designates $17,200,710, or up to the maximum amount allowable, of ordinary income distributions paid during the fiscal year ended March 31, 2019 as qualified for the corporate dividends received deduction.
The fund hereby designates $7,800,258 as qualified short-term capital gain distributions for purposes of Internal Revenue Code Section 871 for the fiscal year ended March 31, 2019.
The fund hereby designates $99,353,335, or up to the maximum amount allowable, as long-term capital gain distributions (20% rate gain distributions) for the fiscal year ended March 31, 2019.
|
| | |
| |
| | | |
| Contact Us | americancentury.com | |
| Automated Information Line | 1-800-345-8765 | |
| Investor Services Representative | 1-800-345-2021 or 816-531-5575 | |
| Investors Using Advisors | 1-800-378-9878 | |
| Business, Not-For-Profit, Employer-Sponsored Retirement Plans | 1-800-345-3533 | |
| Banks and Trust Companies, Broker-Dealers, Financial Professionals, Insurance Companies | 1-800-345-6488 | |
| Telecommunications Relay Service for the Deaf | 711 | |
| | | |
| American Century Capital Portfolios, Inc. | |
| | | |
Investment Advisor: American Century Investment Management, Inc. Kansas City, Missouri | |
| | | |
| This report and the statements it contains are submitted for the general information of our shareholders. The report is not authorized for distribution to prospective investors unless preceded or accompanied by an effective prospectus. | |
| | | |
©2019 American Century Proprietary Holdings, Inc. All rights reserved.
CL-ANN-92291 1905 | |
|
| |
| | |
| | Annual Report |
| | |
| | March 31, 2019 |
| | |
| | Small Cap Value Fund |
| | Investor Class (ASVIX) |
| | I Class (ACVIX) |
| | Y Class (ASVYX) |
| | A Class (ACSCX) |
| | C Class (ASVNX) |
| | R Class (ASVRX) |
| | R5 Class (ASVGX) |
| | R6 Class (ASVDX) |
Beginning on January 1, 2021, as permitted by regulations adopted by the Securities and Exchange Commission, paper copies of the fund’s shareholder reports like this one will no longer be sent by mail, unless you specifically request paper copies of the reports from the fund or from your financial intermediary, such as a broker-dealer or bank. Instead, the reports will be made available on a website, and you will be notified by mail each time a report is posted and provided with a website link to access the report.
If you already elected to receive shareholder reports electronically, you will not be affected by this change and you need not take any action. You may elect to receive shareholder reports and other communications from the fund or your financial intermediary electronically by calling or sending an email request to your appropriate contacts as listed on the back cover of this report.
You may elect to receive all future reports in paper free of charge. You can inform the fund or your financial intermediary that you wish to continue receiving paper copies of your shareholder reports by calling or sending an email request to your appropriate contacts as listed on the back cover of this report. Your election to receive reports in paper will apply to all funds held with the fund complex/your financial intermediary.
|
| | |
| President’s Letter | 2 |
|
| Performance | 3 |
|
| Portfolio Commentary | |
|
| Fund Characteristics | |
|
| Shareholder Fee Example | |
|
| Schedule of Investments | |
|
| Statement of Assets and Liabilities | |
|
| Statement of Operations | |
|
| Statement of Changes in Net Assets | |
|
| Notes to Financial Statements | |
|
| Financial Highlights | |
|
| Report of Independent Registered Public Accounting Firm | |
|
| Management | |
|
| Additional Information | |
|
Any opinions expressed in this report reflect those of the author as of the date of the report, and do not necessarily represent the opinions of American Century Investments® or any other person in the American Century Investments organization. Any such opinions are subject to change at any time based upon market or other conditions and American Century Investments disclaims any responsibility to update such opinions. These opinions may not be relied upon as investment advice and, because investment decisions made by American Century Investments funds are based on numerous factors, may not be relied upon as an indication of trading intent on behalf of any American Century Investments fund. Security examples are used for representational purposes only and are not intended as recommendations to purchase or sell securities. Performance information for comparative indices and securities is provided to American Century Investments by third party vendors. To the best of American Century Investments’ knowledge, such information is accurate at the time of printing.
Jonathan Thomas
Dear Investor:
Thank you for reviewing this annual report for the period ended March 31, 2019. Annual reports help convey important information about fund returns, including market factors that affected performance during the reporting period. For additional, updated investment and market insights, we encourage you to visit our website, americancentury.com.
Markets Ended Roller-Coaster Period on Upswing
For the first half of the period, U.S. stocks climbed higher, while bond returns headed lower. Robust economic growth, bolstered by federal tax and regulatory reform, and record corporate earnings results fueled risk-on sentiment that drove stock prices higher. Meanwhile, the combination of strong economic data, the Federal Reserve’s (Fed’s) ongoing rate-hike campaign and an uptick in inflation pushed investment-grade bond returns lower.
Market trends began changing in late 2018. Mounting investor concerns about slowing global economic and earnings growth, U.S.-China trade tensions and rising interest rates triggered widespread volatility. Stock prices plunged as investors sought safe-haven investments, including U.S. Treasuries. Furthermore, the Fed issued another rate hike in December, its fourth of the year, and maintained its hawkish outlook. Investors feared the December rate increase and the Fed’s plans for two more rate hikes in 2019 were too aggressive, and risk-off investing remained in favor.
January brought a renewed sense of stability to the markets. Investors’ concerns about growth and trade eased, and the Fed changed course, pausing its rate-hike campaign amid moderating global growth and inflation. Valuations appeared attractive after the late-2018 sell-off, and risk-on investing resumed. In March, the Fed held rates steady again, hinting additional tightening was off the table for 2019. This news drove stock and bond returns higher and left both asset classes on an upward track to end the period. Overall, stocks (S&P 500 Index) overcame their late-2018 nosedive to gain 9.50% for the period. Bonds (Bloomberg Barclays U.S. Aggregate Bond Index) bounced back from losses early in the period to return 4.48%.
We expect volatility to remain a formidable factor as investors react to global growth trends, central bank policy and geopolitical developments. We believe this scenario underscores the importance of using professionally managed portfolios in pursuit of investment goals. We appreciate your continued trust and confidence in us.
Sincerely,
Jonathan Thomas
President and Chief Executive Officer
American Century Investments
|
| | | | | | |
| Total Returns as of March 31, 2019 | |
| | | | Average Annual Returns | |
| | Ticker Symbol | 1 year | 5 years | 10 years | Since
Inception | Inception
Date |
| Investor Class | ASVIX | -3.15% | 5.91% | 14.60% | — | 7/31/98 |
| Russell 2000 Value Index | — | 0.17% | 5.59% | 14.11% | — | — |
| I Class | ACVIX | -2.95% | 6.12% | 14.84% | — | 10/26/98 |
| Y Class | ASVYX | -2.80% | — | — | 2.22% | 4/10/17 |
| A Class | ACSCX | | | |
| 12/31/99 |
| No sales charge | | -3.32% | 5.66% | 14.31% | — | |
| With sales charge | | -8.87% | 4.41% | 13.63% | — | |
| C Class | ASVNX | -4.19% | 4.85% | — | 8.86% | 3/1/10 |
| R Class | ASVRX | -3.58% | 5.38% | — | 9.43% | 3/1/10 |
| R5 Class | ASVGX | -2.92% | — | — | 2.10% | 4/10/17 |
| R6 Class | ASVDX | -2.80% | 6.28% | — | 7.71% | 7/26/13 |
Average annual returns since inception are presented when ten years of performance history is not available.
Prior to March 1, 2010, the A Class was referred to as the Advisor Class and did not have a front-end sales charge. Performance prior to that date has been adjusted to reflect this charge.
Sales charges include initial sales charges and contingent deferred sales charges (CDSCs), as applicable. A Class shares have a 5.75% maximum initial sales charge and may be subject to a maximum CDSC of 1.00%. C Class shares redeemed within 12 months of purchase are subject to a maximum CDSC of 1.00%. The SEC requires that mutual funds provide performance information net of maximum sales charges in all cases where charges could be applied.
Data presented reflect past performance. Past performance is no guarantee of future results. Current performance may be higher or lower than the performance shown. Total returns for periods less than one year are not annualized. Investment return and principal value will fluctuate, and redemption value may be more or less than original cost. Data assumes reinvestment of dividends and capital gains, and none of the charts reflect the deduction of taxes that a shareholder would pay on fund distributions or the redemption of fund shares. To obtain performance data current to the most recent month end, please call 1-800-345-2021 or visit americancentury.com. For additional information about the fund, please consult the prospectus.
|
|
| Growth of $10,000 Over 10 Years |
| $10,000 investment made March 31, 2009 |
| Performance for other share classes will vary due to differences in fee structure. |
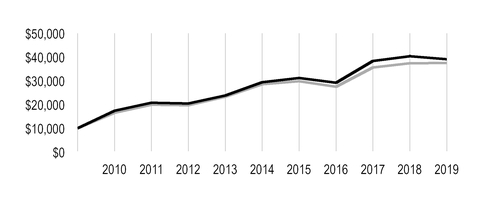
|
| |
| Value on March 31, 2019 |
| | Investor Class — $39,108 |
| |
| | Russell 2000 Value Index — $37,457 |
| |
|
| | | | | | | |
| Total Annual Fund Operating Expenses |
| Investor Class | I Class | Y Class | A Class | C Class | R Class | R5 Class | R6 Class |
| 1.26% | 1.06% | 0.91% | 1.51% | 2.26% | 1.76% | 1.06% | 0.91% |
The total annual fund operating expenses shown is as stated in the fund’s prospectus current as of the date of this report. The prospectus may vary from the expense ratio shown elsewhere in this report because it is based on a different time period, includes acquired fund fees and expenses, and, if applicable, does not include fee waivers or expense reimbursements.
Data presented reflect past performance. Past performance is no guarantee of future results. Current performance may be higher or lower than the performance shown. Total returns for periods less than one year are not annualized. Investment return and principal value will fluctuate, and redemption value may be more or less than original cost. Data assumes reinvestment of dividends and capital gains, and none of the charts reflect the deduction of taxes that a shareholder would pay on fund distributions or the redemption of fund shares. To obtain performance data current to the most recent month end, please call 1-800-345-2021 or visit americancentury.com. For additional information about the fund, please consult the prospectus.
Portfolio Managers: Jeff John and Miles Lewis
Performance Summary
Small Cap Value returned -3.15%* for the fiscal year ended March 31, 2019, compared with the 0.17% return of its benchmark, the Russell 2000 Value Index.
Small Cap Value declined during the fiscal year, trailing its benchmark, the Russell 2000 Value Index, which posted a modest gain. Stock selection in the industrials and financials sectors weighed on relative performance, as did the fund’s lack of exposure to the utilities sector. Conversely, stock choices and an overweight position in the information technology sector boosted fund returns. Stock selection in real estate and an underweight in energy also helped performance.
Industrials Holdings Weighed on Performance
Stock selection in the industrials sector was a key detractor from the fund’s relative performance. Dycom Industries was a top individual detractor. The provider of construction services for cable and telecommunications networks underperformed after announcing a change in the expected timing for revenues related to orders for some of its largest customers. InnerWorkings was another laggard in the sector. Lower-than-expected earnings from the outsourced print and marketing service provider drove concerns that the company was taking longer than anticipated to gain traction as a disruptive new service model for enterprises. We think the value proposition is intact but will take time to materialize.
Avoidance of the utilities sector, where the fund does not hold any positions, also weighed on relative returns. Amid market volatility at the end of 2018, the utilities sector was a top performer. Our lack of exposure, therefore, weighed on relative performance.
Stock choices in the financials sector, particularly among banks, hurt relative returns. Bank OZK weighed on results. The Arkansas-based regional bank lagged after reporting declines in loan growth and net interest margins, but more significant pressure came from its disclosure of two large credit losses. We remain invested after fully reevaluating the stock but expect markets to continue testing the stock until a downturn proves its loan quality.
Information Technology Positioning Boosted Returns
Positioning in the information technology sector contributed to returns, boosted by stock choices in the sector and by overweight exposure relative to the benchmark. EVERTEC was a top contributor. The Puerto Rico-based credit card processing company outperformed as it continued to recover from 2017’s Hurricane Maria. The island’s economy has made progress in recent months, and EVERTEC’s transaction-based recurring revenue structure continues to be attractive. Aerospace and defense specialty components maker Esterline Technologies boosted results. The stock outperformed after management announced the company would be acquired by TransDigm Group for $122.50 per share in cash. The deal is expected to close mid-2019. We exited our position following the announcement.
Selection in the real estate sector also helped performance, with strong performance from senior housing and health care property REIT CareTrust REIT and health care operator REIT MedEquities Realty Trust, which announced it would be acquired by Omega Healthcare Investors. Elsewhere in
| |
| * | All fund returns referenced in this commentary are for Investor Class shares. Performance for other share classes will vary due to differences in fee structure; when Investor Class performance exceeds that of the fund's benchmark, other share classes may not. See page 3 for returns for all share classes. |
the portfolio, TreeHouse Foods was a top individual contributor. Shares of the private-label food manufacturer rallied after the firm hired a new CEO with strong operational experience. Also, earnings reports over the period showed signs that the company is stabilizing after facing issues with an acquisition and pricing pressure from some of its largest buyers. We exited our position in the stock.
Portfolio Positioning
The portfolio seeks to invest in companies where we believe the valuation does not reflect the quality and normal earnings power of the company. Our process is based on individual security selection, but broad themes have emerged.
We continue to be overweight in financials. We increased our overweight in recent months, increasing our exposure to banks in particular. Banks have been pressured by the continued flattening of the interest rate curve, which can dampen their ability to generate earnings. Banks in general enjoy a higher level of capitalization than they held in the last business cycle, and we think the valuation pressure creates an opportunity.
We also continue to be overweight in the materials sector, where we favor specialized containers and packaging as well as specialty chemical companies. Both niches tend to have attractive free cash flow and virtually no commodity exposure, creating consumer staples-like businesses at attractive valuations. We also maintain an overweight in the industrials sector, where we have identified several attractively valued, higher-quality stocks.
In terms of underweight exposure, we have continued to avoid the utilities sector. Our metrics show that valuations remain too rich for our investment process. Additionally, it has been difficult for us to find higher-quality utilities stocks. The consumer discretionary sector is another key underweight in the portfolio.
|
| |
| MARCH 31, 2019 |
| Top Ten Holdings | % of net assets |
| Compass Diversified Holdings | 2.8% |
| Graphic Packaging Holding Co. | 2.7% |
| Home BancShares, Inc. | 2.6% |
| BankUnited, Inc. | 2.5% |
| Valley National Bancorp | 2.5% |
| Texas Capital Bancshares, Inc. | 2.2% |
| First Hawaiian, Inc. | 2.0% |
| EnPro Industries, Inc. | 1.9% |
| Silgan Holdings, Inc. | 1.9% |
| Ares Management Corp., Class A | 1.9% |
| | |
| Top Five Industries | % of net assets |
| Banks | 21.3% |
| Equity Real Estate Investment Trusts (REITs) | 8.9% |
| Insurance | 7.4% |
| Machinery | 6.4% |
| Electronic Equipment, Instruments and Components | 5.5% |
| | |
| Types of Investments in Portfolio | % of net assets |
| Common Stocks | 97.6% |
| Temporary Cash Investments | 2.6% |
| Other Assets and Liabilities | (0.2)% |
Fund shareholders may incur two types of costs: (1) transaction costs, including sales charges (loads) on purchase payments and redemption/exchange fees; and (2) ongoing costs, including management fees; distribution and service (12b-1) fees; and other fund expenses. This example is intended to help you understand your ongoing costs (in dollars) of investing in your fund and to compare these costs with the ongoing cost of investing in other mutual funds.
The example is based on an investment of $1,000 made at the beginning of the period and held for the entire period from October 1, 2018 to March 31, 2019.
Actual Expenses
The table provides information about actual account values and actual expenses for each class. You may use the information, together with the amount you invested, to estimate the expenses that you paid over the period. First, identify the share class you own. Then simply divide your account value by $1,000 (for example, an $8,600 account value divided by $1,000 = 8.6), then multiply the result by the number under the heading “Expenses Paid During Period” to estimate the expenses you paid on your account during this period.
If you hold Investor Class shares of any American Century Investments fund, or I Class shares of the American Century Diversified Bond Fund, in an American Century Investments account (i.e., not a financial intermediary or retirement plan account), American Century Investments may charge you a $12.50 semiannual account maintenance fee if the value of those shares is less than $10,000. We will redeem shares automatically in one of your accounts to pay the $12.50 fee. In determining your total eligible investment amount, we will include your investments in all personal accounts (including American Century Investments Brokerage accounts) registered under your Social Security number. Personal accounts include individual accounts, joint accounts, UGMA/UTMA accounts, personal trusts, Coverdell Education Savings Accounts and IRAs (including traditional, Roth, Rollover, SEP-, SARSEP- and SIMPLE-IRAs), and certain other retirement accounts. If you have only business, business retirement, employer-sponsored or American Century Investments Brokerage accounts, you are currently not subject to this fee. If you are subject to the Account Maintenance Fee, your account value could be reduced by the fee amount.
Hypothetical Example for Comparison Purposes
The table also provides information about hypothetical account values and hypothetical expenses based on the actual expense ratio of each class of your fund and an assumed rate of return of 5% per year before expenses, which is not the actual return of a fund’s share class. The hypothetical account values and expenses may not be used to estimate the actual ending account balance or expenses you paid for the period. You may use this information to compare the ongoing costs of investing in your fund and other funds. To do so, compare this 5% hypothetical example with the 5% hypothetical examples that appear in the shareholder reports of the other funds.
Please note that the expenses shown in the table are meant to highlight your ongoing costs only and do not reflect any transactional costs, such as sales charges (loads) or redemption/exchange fees. Therefore, the table is useful in comparing ongoing costs only, and will not help you determine the relative total costs of owning different funds. In addition, if these transactional costs were included, your costs would have been higher.
|
| | | | |
| | Beginning
Account Value
10/1/18 | Ending
Account Value
3/31/19 | Expenses Paid
During Period(1)
10/1/18 - 3/31/19 |
Annualized
Expense Ratio(1) |
| Actual | | | | |
| Investor Class | $1,000 | $918.90 | $5.98 | 1.25% |
| I Class | $1,000 | $919.00 | $5.02 | 1.05% |
| Y Class | $1,000 | $920.50 | $4.31 | 0.90% |
| A Class | $1,000 | $917.40 | $7.17 | 1.50% |
| C Class | $1,000 | $913.40 | $10.73 | 2.25% |
| R Class | $1,000 | $916.40 | $8.36 | 1.75% |
| R5 Class | $1,000 | $920.30 | $5.03 | 1.05% |
| R6 Class | $1,000 | $919.40 | $4.31 | 0.90% |
| Hypothetical | | | | |
| Investor Class | $1,000 | $1,018.70 | $6.29 | 1.25% |
| I Class | $1,000 | $1,019.70 | $5.29 | 1.05% |
| Y Class | $1,000 | $1,020.44 | $4.53 | 0.90% |
| A Class | $1,000 | $1,017.45 | $7.54 | 1.50% |
| C Class | $1,000 | $1,013.71 | $11.30 | 2.25% |
| R Class | $1,000 | $1,016.21 | $8.80 | 1.75% |
| R5 Class | $1,000 | $1,019.70 | $5.29 | 1.05% |
| R6 Class | $1,000 | $1,020.44 | $4.53 | 0.90% |
| |
| (1) | Expenses are equal to the class's annualized expense ratio listed in the table above, multiplied by the average account value over the period, multiplied by 182, the number of days in the most recent fiscal half-year, divided by 365, to reflect the one-half year period. Annualized expense ratio reflects actual expenses, including any applicable fee waivers or expense reimbursements and excluding any acquired fund fees and expenses. |
MARCH 31, 2019
|
| | | | | |
| | Shares | Value |
| COMMON STOCKS — 97.6% | | |
| Banks — 21.3% | | |
| Ameris Bancorp | 130,000 |
| $ | 4,465,500 |
|
| Bank OZK | 310,000 |
| 8,983,800 |
|
| BankUnited, Inc. | 1,020,000 |
| 34,068,000 |
|
| First Hawaiian, Inc. | 1,030,000 |
| 26,831,500 |
|
| Hilltop Holdings, Inc. | 1,015,000 |
| 18,523,750 |
|
| Home BancShares, Inc. | 2,039,930 |
| 35,841,570 |
|
| LegacyTexas Financial Group, Inc. | 600,000 |
| 22,434,000 |
|
| Origin Bancorp, Inc. | 456,525 |
| 15,544,676 |
|
| Signature Bank | 125,000 |
| 16,008,750 |
|
| South State Corp. | 275,000 |
| 18,793,500 |
|
Texas Capital Bancshares, Inc.(1) | 545,000 |
| 29,751,550 |
|
| UMB Financial Corp. | 375,000 |
| 24,015,000 |
|
| Valley National Bancorp | 3,540,000 |
| 33,913,200 |
|
| | | 289,174,796 |
|
| Building Products — 1.6% | | |
| CSW Industrials, Inc. | 140,000 |
| 8,020,600 |
|
Gibraltar Industries, Inc.(1) | 240,000 |
| 9,746,400 |
|
PGT Innovations, Inc.(1) | 281,000 |
| 3,891,850 |
|
| | | 21,658,850 |
|
| Capital Markets — 3.5% | | |
| Ares Management Corp., Class A | 1,090,000 |
| 25,298,900 |
|
Donnelley Financial Solutions, Inc.(1) | 1,525,000 |
| 22,692,000 |
|
| | | 47,990,900 |
|
| Chemicals — 3.9% | | |
| Innophos Holdings, Inc. | 572,467 |
| 17,254,155 |
|
| Minerals Technologies, Inc. | 430,000 |
| 25,279,700 |
|
| PolyOne Corp. | 275,000 |
| 8,060,250 |
|
| WR Grace & Co. | 35,000 |
| 2,731,400 |
|
| | | 53,325,505 |
|
| Commercial Services and Supplies — 3.6% | | |
| Brink's Co. (The) | 245,000 |
| 18,475,450 |
|
CECO Environmental Corp.(1) | 850,000 |
| 6,120,000 |
|
Charah Solutions, Inc.(1) | 1,383,572 |
| 8,854,861 |
|
| Deluxe Corp. | 330,000 |
| 14,427,600 |
|
| Emerald Expositions Events, Inc. | 100,030 |
| 1,270,381 |
|
| | | 49,148,292 |
|
| Communications Equipment — 0.8% | | |
Casa Systems, Inc.(1) | 1,365,000 |
| 11,329,500 |
|
| Construction and Engineering — 1.4% | | |
Dycom Industries, Inc.(1) | 305,000 |
| 14,011,700 |
|
| Valmont Industries, Inc. | 35,000 |
| 4,553,500 |
|
| | | 18,565,200 |
|
|
| | | | | |
| | Shares | Value |
| Construction Materials — 0.5% | | |
| Tecnoglass, Inc. | 906,901 |
| $ | 6,602,239 |
|
| Containers and Packaging — 4.8% | | |
| Graphic Packaging Holding Co. | 2,875,000 |
| 36,311,250 |
|
| RPC Group plc | 265,000 |
| 2,726,678 |
|
| Silgan Holdings, Inc. | 865,000 |
| 25,629,950 |
|
| | | 64,667,878 |
|
| Diversified Financial Services — 2.8% | | |
| Compass Diversified Holdings | 2,440,000 |
| 38,283,600 |
|
| Electrical Equipment — 0.1% | | |
| AZZ, Inc. | 45,362 |
| 1,856,667 |
|
| Electronic Equipment, Instruments and Components — 5.5% | | |
| Avnet, Inc. | 445,000 |
| 19,299,650 |
|
| Belden, Inc. | 400,000 |
| 21,480,000 |
|
Coherent, Inc.(1) | 160,000 |
| 22,675,200 |
|
Tech Data Corp.(1) | 110,000 |
| 11,265,100 |
|
| | | 74,719,950 |
|
| Energy Equipment and Services — 1.1% | | |
C&J Energy Services, Inc.(1) | 130,000 |
| 2,017,600 |
|
Dril-Quip, Inc.(1) | 165,000 |
| 7,565,250 |
|
| Liberty Oilfield Services, Inc., Class A | 125,000 |
| 1,923,750 |
|
NCS Multistage Holdings, Inc.(1) | 710,000 |
| 3,677,800 |
|
| | | 15,184,400 |
|
| Equity Real Estate Investment Trusts (REITs) — 8.9% | | |
| Brandywine Realty Trust | 1,010,000 |
| 16,018,600 |
|
| CareTrust REIT, Inc. | 355,000 |
| 8,328,300 |
|
| Community Healthcare Trust, Inc. | 200,000 |
| 7,178,000 |
|
| Highwoods Properties, Inc. | 135,000 |
| 6,315,300 |
|
| Kite Realty Group Trust | 1,340,000 |
| 21,426,600 |
|
| Lexington Realty Trust | 750,000 |
| 6,795,000 |
|
| MedEquities Realty Trust, Inc. | 507,388 |
| 5,647,229 |
|
| National Health Investors, Inc. | 105,000 |
| 8,247,750 |
|
| RLJ Lodging Trust | 310,000 |
| 5,446,700 |
|
| Sabra Health Care REIT, Inc. | 615,000 |
| 11,974,050 |
|
| Summit Hotel Properties, Inc. | 640,000 |
| 7,302,400 |
|
| Urstadt Biddle Properties, Inc., Class A | 190,000 |
| 3,921,600 |
|
| Weingarten Realty Investors | 415,000 |
| 12,188,550 |
|
| | | 120,790,079 |
|
| Food and Staples Retailing — 0.1% | | |
| Weis Markets, Inc. | 24,329 |
| 992,867 |
|
| Food Products — 1.8% | | |
Hain Celestial Group, Inc. (The)(1) | 895,000 |
| 20,692,400 |
|
Hostess Brands, Inc.(1) | 265,000 |
| 3,312,500 |
|
| | | 24,004,900 |
|
| Health Care Providers and Services — 2.2% | | |
Premier, Inc., Class A(1) | 225,000 |
| 7,760,250 |
|
|
| | | | | |
| | Shares | Value |
Providence Service Corp. (The)(1) | 330,000 |
| $ | 21,984,600 |
|
| | | 29,744,850 |
|
| Hotels, Restaurants and Leisure — 0.8% | | |
Red Robin Gourmet Burgers, Inc.(1) | 365,000 |
| 10,515,650 |
|
| Household Products — 1.7% | | |
| Spectrum Brands Holdings, Inc. | 420,000 |
| 23,007,600 |
|
| Insurance — 7.4% | | |
| AMERISAFE, Inc. | 315,000 |
| 18,711,000 |
|
| Axis Capital Holdings Ltd. | 380,000 |
| 20,816,400 |
|
| Hanover Insurance Group, Inc. (The) | 105,000 |
| 11,987,850 |
|
| James River Group Holdings Ltd. | 399,374 |
| 16,006,910 |
|
| RenaissanceRe Holdings Ltd. | 165,000 |
| 23,677,500 |
|
| White Mountains Insurance Group Ltd. | 10,000 |
| 9,254,800 |
|
| | | 100,454,460 |
|
| Internet and Direct Marketing Retail — 0.4% | | |
Shutterfly, Inc.(1) | 150,000 |
| 6,096,000 |
|
| IT Services — 1.4% | | |
| EVERTEC, Inc. | 315,000 |
| 8,760,150 |
|
| Presidio, Inc. | 700,000 |
| 10,360,000 |
|
| | | 19,120,150 |
|
| Machinery — 6.4% | | |
| EnPro Industries, Inc. | 399,118 |
| 25,723,155 |
|
Gardner Denver Holdings, Inc.(1) | 295,000 |
| 8,203,950 |
|
| Global Brass & Copper Holdings, Inc. | 518,427 |
| 17,854,626 |
|
| Graham Corp. | 55,048 |
| 1,080,592 |
|
| Hurco Cos., Inc. | 100,000 |
| 4,033,000 |
|
Milacron Holdings Corp.(1) | 910,000 |
| 10,301,200 |
|
| Timken Co. (The) | 450,000 |
| 19,629,000 |
|
| | | 86,825,523 |
|
| Media — 1.0% | | |
| Entravision Communications Corp., Class A | 3,748,208 |
| 12,144,194 |
|
| Townsquare Media, Inc., Class A | 243,696 |
| 1,393,941 |
|
| | | 13,538,135 |
|
| Mortgage Real Estate Investment Trusts (REITs) — 0.2% | | |
| Granite Point Mortgage Trust, Inc. | 140,000 |
| 2,599,800 |
|
| Oil, Gas and Consumable Fuels — 0.7% | | |
Earthstone Energy, Inc., Class A(1) | 669,962 |
| 4,743,331 |
|
Extraction Oil & Gas, Inc.(1) | 1,030,000 |
| 4,356,900 |
|
| | | 9,100,231 |
|
| Personal Products — 0.5% | | |
Edgewell Personal Care Co.(1) | 140,000 |
| 6,144,600 |
|
| Professional Services — 1.5% | | |
InnerWorkings, Inc.(1) | 2,433,005 |
| 8,807,478 |
|
| Korn Ferry | 265,000 |
| 11,866,700 |
|
| | | 20,674,178 |
|
| Road and Rail — 0.1% | | |
| Heartland Express, Inc. | 65,000 |
| 1,253,200 |
|
|
| | | | | |
| | Shares | Value |
| Semiconductors and Semiconductor Equipment — 2.7% | | |
Advanced Energy Industries, Inc.(1) | 200,000 |
| $ | 9,936,000 |
|
| Cypress Semiconductor Corp. | 675,000 |
| 10,071,000 |
|
| Kulicke & Soffa Industries, Inc. | 770,000 |
| 17,024,700 |
|
| | | 37,031,700 |
|
| Software — 2.8% | | |
| LogMeIn, Inc. | 175,000 |
| 14,017,500 |
|
| Sapiens International Corp. NV | 430,306 |
| 6,575,076 |
|
Teradata Corp.(1) | 385,000 |
| 16,805,250 |
|
| | | 37,397,826 |
|
| Specialty Retail — 3.0% | | |
| Camping World Holdings, Inc., Class A | 1,420,000 |
| 19,752,200 |
|
| Penske Automotive Group, Inc. | 455,000 |
| 20,315,750 |
|
| | | 40,067,950 |
|
| Technology Hardware, Storage and Peripherals — 1.1% | | |
Cray, Inc.(1) | 590,000 |
| 15,369,500 |
|
| Trading Companies and Distributors — 2.0% | | |
Foundation Building Materials, Inc.(1) | 1,770,000 |
| 17,416,800 |
|
GMS, Inc.(1) | 615,000 |
| 9,298,800 |
|
| | | 26,715,600 |
|
TOTAL COMMON STOCKS
(Cost $1,329,983,738) | | 1,323,952,576 |
|
| TEMPORARY CASH INVESTMENTS — 2.6% | | |
| Repurchase Agreement, BMO Capital Markets Corp., (collateralized by various U.S. Treasury obligations, 0.125% - 2.875%, 9/30/19 - 2/15/44, valued at $30,932,692), in a joint trading account at 2.35%, dated 3/29/19, due 4/1/19 (Delivery value $30,320,700) | | 30,314,764 |
|
| Repurchase Agreement, Fixed Income Clearing Corp., (collateralized by various U.S. Treasury obligations, 2.50%, 8/15/23, valued at $5,173,066), at 1.25%, dated 3/29/19, due 4/1/19 (Delivery value $5,067,528) | | 5,067,000 |
|
| State Street Institutional U.S. Government Money Market Fund, Premier Class | 16,307 |
| 16,307 |
|
TOTAL TEMPORARY CASH INVESTMENTS
(Cost $35,398,071) | | 35,398,071 |
|
TOTAL INVESTMENT SECURITIES — 100.2%
(Cost $1,365,381,809) | | 1,359,350,647 |
|
| OTHER ASSETS AND LIABILITIES — (0.2)% | | (3,360,491 | ) |
| TOTAL NET ASSETS — 100.0% | | $ | 1,355,990,156 |
|
|
| | | | | | | | | | |
| FORWARD FOREIGN CURRENCY EXCHANGE CONTRACTS |
| Currency Purchased | Currency Sold | Counterparty | Settlement Date | Unrealized Appreciation
(Depreciation) |
| USD | 2,383,862 |
| GBP | 1,798,396 |
| JPMorgan Chase Bank N.A. | 6/28/19 | $ | 31,388 |
|
|
| | |
| NOTES TO SCHEDULE OF INVESTMENTS |
| GBP | - | British Pound |
| USD | - | United States Dollar |
See Notes to Financial Statements.
|
|
| Statement of Assets and Liabilities |
|
| | | |
| MARCH 31, 2019 | |
| Assets | |
| Investment securities, at value (cost of $1,365,381,809) | $ | 1,359,350,647 |
|
| Receivable for investments sold | 4,484,919 |
|
| Receivable for capital shares sold | 983,935 |
|
| Unrealized appreciation on forward foreign currency exchange contracts | 31,388 |
|
| Dividends and interest receivable | 1,701,772 |
|
| | 1,366,552,661 |
|
| | |
| Liabilities | |
| Payable for investments purchased | 8,069,142 |
|
| Payable for capital shares redeemed | 1,170,633 |
|
| Accrued management fees | 1,301,144 |
|
| Distribution and service fees payable | 21,586 |
|
| | 10,562,505 |
|
| | |
| Net Assets | $ | 1,355,990,156 |
|
| | |
| Net Assets Consist of: | |
| Capital (par value and paid-in surplus) | $ | 1,410,688,992 |
|
| Distributable earnings | (54,698,836 | ) |
| | $ | 1,355,990,156 |
|
|
| | | | |
| | Net Assets | Shares Outstanding | Net Asset Value Per Share |
| Investor Class, $0.01 Par Value | $594,649,569 | 84,355,820 |
| $7.05 |
| I Class, $0.01 Par Value | $352,298,412 | 49,406,760 |
| $7.13 |
| Y Class, $0.01 Par Value | $3,320,156 | 464,932 |
| $7.14 |
| A Class, $0.01 Par Value | $82,754,841 | 11,891,553 |
| $6.96* |
| C Class, $0.01 Par Value | $2,536,384 | 385,826 |
| $6.57 |
| R Class, $0.01 Par Value | $3,437,313 | 496,768 |
| $6.92 |
| R5 Class, $0.01 Par Value | $491,261 | 68,852 |
| $7.14 |
| R6 Class, $0.01 Par Value | $316,502,220 | 44,369,400 |
| $7.13 |
*Maximum offering price $7.38 (net asset value divided by 0.9425).
See Notes to Financial Statements.
|
| | | |
| YEAR ENDED MARCH 31, 2019 | |
| Investment Income (Loss) | |
| Income: | |
| Dividends (including $468,300 from affiliates and net of foreign taxes withheld of $24,842) | $ | 27,854,628 |
|
| Interest | 482,515 |
|
| | 28,337,143 |
|
| | |
| Expenses: | |
| Management fees | 16,478,922 |
|
| Distribution and service fees: | |
| A Class | 255,973 |
|
| C Class | 27,288 |
|
| R Class | 16,899 |
|
| Directors' fees and expenses | 40,720 |
|
| Other expenses | 3,563 |
|
| | 16,823,365 |
|
| | |
| Net investment income (loss) | 11,513,778 |
|
| | |
| Realized and Unrealized Gain (Loss) | |
| Net realized gain (loss) on: | |
| Investment transactions (including $(3,880,567) from affiliates) | 82,737,566 |
|
| Forward foreign currency exchange contract transactions | 202,579 |
|
| Foreign currency translation transactions | 20,928 |
|
| | 82,961,073 |
|
| | |
| Change in net unrealized appreciation (depreciation) on: | |
| Investments (including $(6,842,621) from affiliates) | (148,182,735 | ) |
| Forward foreign currency exchange contracts | 31,388 |
|
| | (148,151,347 | ) |
| | |
| Net realized and unrealized gain (loss) | (65,190,274 | ) |
| | |
| Net Increase (Decrease) in Net Assets Resulting from Operations | $ | (53,676,496 | ) |
See Notes to Financial Statements.
|
|
| Statement of Changes in Net Assets |
|
| | | | | | |
| YEARS ENDED MARCH 31, 2019 AND MARCH 31, 2018 |
| Increase (Decrease) in Net Assets | March 31, 2019 | March 31, 2018 |
| Operations | | |
| Net investment income (loss) | $ | 11,513,778 |
| $ | 8,121,008 |
|
| Net realized gain (loss) | 82,961,073 |
| 202,921,565 |
|
| Change in net unrealized appreciation (depreciation) | (148,151,347 | ) | (124,365,244 | ) |
| Net increase (decrease) in net assets resulting from operations | (53,676,496 | ) | 86,677,329 |
|
| | | |
| Distributions to Shareholders | | |
From earnings:(1) | | |
| Investor Class | (89,060,366 | ) | (93,490,053 | ) |
| I Class | (54,894,046 | ) | (65,682,719 | ) |
| Y Class | (313,187 | ) | (690 | ) |
| A Class | (13,505,350 | ) | (15,640,921 | ) |
| C Class | (401,065 | ) | (317,339 | ) |
| R Class | (477,398 | ) | (414,021 | ) |
| R5 Class | (760 | ) | (684 | ) |
| R6 Class | (45,390,786 | ) | (32,586,147 | ) |
| Decrease in net assets from distributions | (204,042,958 | ) | (208,132,574 | ) |
| | | |
| Capital Share Transactions | | |
| Net increase (decrease) in net assets from capital share transactions (Note 5) | 112,624,110 |
| 66,977,658 |
|
| | | |
| Net increase (decrease) in net assets | (145,095,344 | ) | (54,477,587 | ) |
| | | |
| Net Assets | | |
| Beginning of period | 1,501,085,500 |
| 1,555,563,087 |
|
| End of period | $ | 1,355,990,156 |
| $ | 1,501,085,500 |
|
| |
| (1) | Prior period presentation has been updated to reflect the current period combination of distributions to shareholders from net investment income and net realized gains. Distributions from net investment income were $(2,152,827), $(2,385,206), $(28), $(109,194), $(22) and $(1,453,277) for Investor Class, I Class, Y Class, A Class, R5 Class and R6 Class, respectively. Distributions from net realized gains were $(91,337,226), $(63,297,513), $(662), $(15,531,727), $(317,339), $(414,021), $(662) and $(31,132,870) for Investor Class, I Class, Y Class, A Class, C Class, R Class, R5 Class and R6 Class, respectively. |
See Notes to Financial Statements.
|
|
| Notes to Financial Statements |
MARCH 31, 2019
1. Organization
American Century Capital Portfolios, Inc. (the corporation) is registered under the Investment Company Act of 1940, as amended (the 1940 Act), as an open-end management investment company and is organized as a Maryland corporation. Small Cap Value Fund (the fund) is one fund in a series issued by the corporation. The fund’s investment objective is to seek long-term capital growth. Income is a secondary objective.
The fund offers the Investor Class, I Class, Y Class, A Class, C Class, R Class, R5 Class and R6 Class. The A Class may incur an initial sales charge. The A Class and C Class may be subject to a contingent deferred sales charge. Sale of the Y Class and R5 Class commenced on April 10, 2017.
2. Significant Accounting Policies
The following is a summary of significant accounting policies consistently followed by the fund in preparation of its financial statements. The fund is an investment company and follows accounting and reporting guidance in accordance with accounting principles generally accepted in the United States of America. This may require management to make certain estimates and assumptions at the date of the financial statements. Actual results could differ from these estimates. Management evaluated the impact of events or transactions occurring through the date the financial statements were issued that would merit recognition or disclosure.
Investment Valuations — The fund determines the fair value of its investments and computes its net asset value per share at the close of regular trading (usually 4 p.m. Eastern time) on the New York Stock Exchange (NYSE) on each day the NYSE is open. The Board of Directors has adopted valuation policies and procedures to guide the investment advisor in the fund’s investment valuation process and to provide methodologies for the oversight of the fund’s pricing function.
Equity securities that are listed or traded on a domestic securities exchange are valued at the last reported sales price or at the official closing price as provided by the exchange. Equity securities traded on foreign securities exchanges are generally valued at the closing price of such securities on the exchange where primarily traded or at the close of the NYSE, if that is earlier. If no last sales price is reported, or if local convention or regulation so provides, the mean of the latest bid and asked prices may be used. Securities traded over-the-counter are valued at the mean of the latest bid and asked prices, the last sales price, or the official closing price. Equity securities initially expressed in local currencies are translated into U.S. dollars at the mean of the appropriate currency exchange rate at the close of the NYSE as provided by an independent pricing service.
Open-end management investment companies are valued at the reported net asset value per share. Repurchase agreements are valued at cost, which approximates fair value. Forward foreign currency exchange contracts are valued at the mean of the appropriate forward exchange rate at the close of the NYSE as provided by an independent pricing service.
If the fund determines that the market price for an investment is not readily available or the valuation methods mentioned above do not reflect an investment’s fair value, such investment is valued as determined in good faith by the Board of Directors or its delegate, in accordance with policies and procedures adopted by the Board of Directors. In its determination of fair value, the fund may review several factors including, but not limited to, market information regarding the specific investment or comparable investments and correlation with other investment types, futures indices or general market indicators. Circumstances that may cause the fund to use these procedures to value an investment include, but are not limited to: an investment has been declared in default or is distressed; trading in a security has been suspended during the trading day or a security is not actively trading on its principal exchange; prices received from a regular pricing source are deemed unreliable; or there is a foreign market holiday and no trading occurred.
The fund monitors for significant events occurring after the close of an investment’s primary exchange but before the fund’s net asset value per share is determined. Significant events may include, but are not limited to: corporate announcements and transactions; governmental action and political unrest that could impact a specific investment or an investment sector; or armed conflicts, natural disasters and similar events that could affect investments in a specific country or region. The fund also monitors for significant fluctuations between domestic and foreign markets, as evidenced by the U.S. market or such other indicators that the Board of Directors, or its delegate, deems appropriate. If significant fluctuations in foreign markets are identified, the fund may apply a model-derived factor to the closing price of equity securities traded on foreign securities exchanges. The factor is based on observable market data as provided by an independent pricing service.
Security Transactions — Security transactions are accounted for as of the trade date. Net realized gains and losses are determined on the identified cost basis, which is also used for federal income tax purposes.
Investment Income — Dividend income less foreign taxes withheld, if any, is recorded as of the ex-dividend date. Distributions received on securities that represent a return of capital or long-term capital gain are recorded as a reduction of cost of investments and/or as a realized gain. The fund may estimate the components of distributions received that may be considered nontaxable distributions or long-term capital gain distributions for income tax purposes. Interest income is recorded on the accrual basis and includes accretion of discounts and amortization of premiums.
Foreign Currency Translations — All assets and liabilities initially expressed in foreign currencies are translated into U.S. dollars at prevailing exchange rates at period end. The fund may enter into spot foreign currency exchange contracts to facilitate transactions denominated in a foreign currency. Purchases and sales of investment securities, dividend and interest income, spot foreign currency exchange contracts, and expenses are translated at the rates of exchange prevailing on the respective dates of such transactions. Net realized and unrealized foreign currency exchange gains or losses related to investment securities are a component of net realized gain (loss) on investment transactions and change in net unrealized appreciation (depreciation) on investments, respectively.
Repurchase Agreements — The fund may enter into repurchase agreements with institutions that American Century Investment Management, Inc. (ACIM) (the investment advisor) has determined are creditworthy pursuant to criteria adopted by the Board of Directors. The fund requires that the collateral, represented by securities, received in a repurchase transaction be transferred to the custodian in a manner sufficient to enable the fund to obtain those securities in the event of a default under the repurchase agreement. ACIM monitors, on a daily basis, the securities transferred to ensure the value, including accrued interest, of the securities under each repurchase agreement is equal to or greater than amounts owed to the fund under each repurchase agreement.
Joint Trading Account — Pursuant to an Exemptive Order issued by the Securities and Exchange Commission, the fund, along with certain other funds in the American Century Investments family of funds, may transfer uninvested cash balances into a joint trading account. These balances are invested in one or more repurchase agreements that are collateralized by U.S. Treasury or Agency obligations.
Income Tax Status — It is the fund’s policy to distribute substantially all net investment income and net realized gains to shareholders and to otherwise qualify as a regulated investment company under provisions of the Internal Revenue Code. Accordingly, no provision has been made for income taxes. The fund files U.S. federal, state, local and non-U.S. tax returns as applicable. The fund's tax returns are subject to examination by the relevant taxing authority until expiration of the applicable statute of limitations, which is generally three years from the date of filing but can be longer in certain jurisdictions. At this time, management believes there are no uncertain tax positions which, based on their technical merit, would not be sustained upon examination and for which it is reasonably possible that the total amounts of unrecognized tax benefits will significantly change in the next twelve months.
Multiple Class — All shares of the fund represent an equal pro rata interest in the net assets of the class to which such shares belong, and have identical voting, dividend, liquidation and other rights and the same terms and conditions, except for class specific expenses and exclusive rights to vote on matters affecting only individual classes. Income, non-class specific expenses, and realized and unrealized capital gains and losses of the fund are allocated to each class of shares based on their relative net assets.
Distributions to Shareholders — Distributions from net investment income, if any, are generally declared and paid quarterly. Distributions from net realized gains, if any, are generally declared and paid annually. The fund may elect to treat a portion of its payment to a redeeming shareholder, which represents the pro rata share of undistributed net investment income and net realized gains, as a distribution for federal income tax purposes (tax equalization).
Indemnifications — Under the corporation’s organizational documents, its officers and directors are indemnified against certain liabilities arising out of the performance of their duties to the fund. In addition, in the normal course of business, the fund enters into contracts that provide general indemnifications. The maximum exposure under these arrangements is unknown as this would involve future claims that may be made against a fund. The risk of material loss from such claims is considered by management to be remote.
3. Fees and Transactions with Related Parties
Certain officers and directors of the corporation are also officers and/or directors of American Century Companies, Inc. (ACC). The corporation’s investment advisor, ACIM, the corporation's distributor, American Century Investment Services, Inc. (ACIS), and the corporation’s transfer agent, American Century Services, LLC, are wholly owned, directly or indirectly, by ACC.
Management Fees — The corporation has entered into a management agreement with ACIM, under which ACIM provides the fund with investment advisory and management services in exchange for a single, unified management fee (the fee) per class. The agreement provides that all expenses of managing and operating the fund, except distribution and service fees, brokerage expenses, taxes, interest, fees and expenses of the independent directors (including legal counsel fees), and extraordinary expenses, will be paid by ACIM. The fee is computed and accrued daily based on each class’s daily net assets and paid monthly in arrears. The difference in the fee among the classes is a result of their separate arrangements for non-Rule 12b-1 shareholder services. It is not the result of any difference in advisory or custodial fees or other expenses related to the management of the fund’s assets, which do not vary by class. The rate of the fee is determined by applying a fee rate calculation formula. This formula takes into account the fund’s assets as well as certain assets, if any, of other clients of the investment advisor outside the American Century Investments family of funds (such as subadvised funds and separate accounts) that use very similar investment teams and strategies (strategy assets).
The management fee schedule range and the effective annual management fee for each class for the period ended March 31, 2019 are as follows: |
| | |
| | Management Fee Schedule Range | Effective Annual Management Fee |
| Investor Class | 1.00% to 1.25% | 1.25% |
| I Class | 0.80% to 1.05% | 1.05% |
| Y Class | 0.65% to 0.90% | 0.90% |
| A Class | 1.00% to 1.25% | 1.25% |
| C Class | 1.00% to 1.25% | 1.25% |
| R Class | 1.00% to 1.25% | 1.25% |
| R5 Class | 0.80% to 1.05% | 1.05% |
| R6 Class | 0.65% to 0.90% | 0.90% |
Distribution and Service Fees — The Board of Directors has adopted a separate Master Distribution and Individual Shareholder Services Plan for each of the A Class, C Class and R Class (collectively the plans), pursuant to Rule 12b-1 of the 1940 Act. The plans provide that the A Class will pay ACIS an annual distribution and service fee of 0.25%. The plans provide that the C Class will pay ACIS an annual distribution and service fee of 1.00%, of which 0.25% is paid for individual shareholder services and 0.75% is paid for distribution services. The plans provide that the R Class will pay ACIS an annual distribution and service fee of 0.50%. The fees are computed and accrued daily based on each class’s daily net assets and paid monthly in arrears. The fees are used to pay financial intermediaries for distribution and individual shareholder services. Fees incurred under the plans during the period ended March 31, 2019 are detailed in the Statement of Operations.
Directors' Fees and Expenses — The Board of Directors is responsible for overseeing the investment advisor’s management and operations of the fund. The directors receive detailed information about the fund and its investment advisor regularly throughout the year, and meet at least quarterly with management of the investment advisor to review reports about fund operations. The fund’s officers do not receive compensation from the fund.
Interfund Transactions — The fund may enter into security transactions with other American Century Investments funds and other client accounts of the investment advisor, in accordance with the 1940 Act rules and procedures adopted by the Board of Directors. The rules and procedures require, among other things, that these transactions be effected at the independent current market price of the security. During the period, the interfund purchases and sales were $14,370,503 and $17,412,810, respectively. The effect of interfund transactions on the Statement of Operations was $684 in net realized gain (loss) on investment transactions.
4. Investment Transactions
Purchases and sales of investment securities, excluding short-term investments, for the period ended March 31, 2019 were $1,294,593,571 and $1,344,002,957, respectively.
5. Capital Share Transactions
Transactions in shares of the fund were as follows:
|
| | | | | | | | | | |
| | Year ended
March 31, 2019 | Year ended March 31, 2018(1) |
| | Shares | Amount | Shares | Amount |
| Investor Class/Shares Authorized | 560,000,000 |
| | 530,000,000 |
| |
| Sold | 12,960,930 |
| $ | 100,472,856 |
| 13,655,808 |
| $ | 126,053,160 |
|
| Issued in reinvestment of distributions | 13,390,594 |
| 87,258,443 |
| 10,565,708 |
| 91,480,014 |
|
| Redeemed | (21,626,746 | ) | (169,911,632 | ) | (26,621,472 | ) | (243,195,829 | ) |
| | 4,724,778 |
| 17,819,667 |
| (2,399,956 | ) | (25,662,655 | ) |
| I Class/Shares Authorized | 380,000,000 |
| | 380,000,000 |
| |
| Sold | 16,376,077 |
| 131,475,018 |
| 21,037,259 |
| 195,108,451 |
|
| Issued in reinvestment of distributions | 6,588,560 |
| 43,572,942 |
| 6,236,884 |
| 54,538,296 |
|
| Redeemed | (20,796,591 | ) | (161,888,831 | ) | (28,934,108 | ) | (265,355,798 | ) |
| | 2,168,046 |
| 13,159,129 |
| (1,659,965 | ) | (15,709,051 | ) |
| Y Class/Shares Authorized | 70,000,000 |
| | 50,000,000 |
| |
| Sold | 410,456 |
| 3,366,503 |
| 14,955 |
| 132,166 |
|
| Issued in reinvestment of distributions | 47,604 |
| 313,187 |
| 79 |
| 690 |
|
| Redeemed | (8,162 | ) | (62,476 | ) | — |
| — |
|
| | 449,898 |
| 3,617,214 |
| 15,034 |
| 132,856 |
|
| A Class/Shares Authorized | 95,000,000 |
| | 90,000,000 |
| |
| Sold | 1,783,250 |
| 14,726,695 |
| 2,274,718 |
| 20,516,603 |
|
| Issued in reinvestment of distributions | 2,092,454 |
| 13,420,518 |
| 1,820,578 |
| 15,570,340 |
|
| Redeemed | (5,649,426 | ) | (45,125,429 | ) | (5,633,747 | ) | (51,264,045 | ) |
| | (1,773,722 | ) | (16,978,216 | ) | (1,538,451 | ) | (15,177,102 | ) |
| C Class/Shares Authorized | 10,000,000 |
| | 10,000,000 |
| |
| Sold | 93,544 |
| 759,030 |
| 212,947 |
| 1,862,168 |
|
| Issued in reinvestment of distributions | 66,512 |
| 401,065 |
| 38,700 |
| 317,339 |
|
| Redeemed | (102,899 | ) | (754,791 | ) | (59,921 | ) | (520,640 | ) |
| | 57,157 |
| 405,304 |
| 191,726 |
| 1,658,867 |
|
| R Class/Shares Authorized | 10,000,000 |
| | 10,000,000 |
| |
| Sold | 107,250 |
| 839,924 |
| 111,097 |
| 1,011,895 |
|
| Issued in reinvestment of distributions | 75,253 |
| 477,398 |
| 48,594 |
| 414,021 |
|
| Redeemed | (71,943 | ) | (545,740 | ) | (126,291 | ) | (1,137,625 | ) |
| | 110,560 |
| 771,582 |
| 33,400 |
| 288,291 |
|
| R5 Class/Shares Authorized | 30,000,000 |
| | 50,000,000 |
| |
| Sold | 70,749 |
| 525,409 |
| 537 |
| 5,000 |
|
| Issued in reinvestment of distributions | 115 |
| 760 |
| 78 |
| 684 |
|
| Redeemed | (2,627 | ) | (18,978 | ) | — |
| — |
|
| | 68,237 |
| 507,191 |
| 615 |
| 5,684 |
|
| R6 Class/Shares Authorized | 250,000,000 |
| | 150,000,000 |
| |
| Sold | 12,059,717 |
| 98,464,833 |
| 14,365,364 |
| 132,796,610 |
|
| Issued in reinvestment of distributions | 6,859,222 |
| 45,390,116 |
| 3,725,552 |
| 32,586,147 |
|
| Redeemed | (6,453,444 | ) | (50,532,710 | ) | (4,765,877 | ) | (43,941,989 | ) |
| | 12,465,495 |
| 93,322,239 |
| 13,325,039 |
| 121,440,768 |
|
| Net increase (decrease) | 18,270,449 |
| $ | 112,624,110 |
| 7,967,442 |
| $ | 66,977,658 |
|
| |
| (1) | April 10, 2017 (commencement of sale) through March 31, 2018 for the Y Class and R5 Class. |
6. Affiliated Company Transactions
If a fund's holding represents ownership of 5% or more of the voting securities of a company, the company is affiliated as defined in the 1940 Act. A summary of transactions for each company which is or was an affiliate at or during the period ended March 31, 2019 follows (amounts in thousands):
|
| | | | | | | | | | | | | | | | | | | | | | |
| Company | Beginning Value | Purchase
Cost | Sales
Cost | Change in Net Unrealized Appreciation (Depreciation) | Ending
Value | Ending
Shares | Net Realized
Gain (Loss) | Income |
InnerWorkings, Inc.(1)(2) | $ | 17,331 |
| $ | 10,103 |
| $ | 9,623 |
| $ | (9,004 | ) | (2 | ) | (2 | ) | $ | (2,833 | ) | — |
|
MedEquities Realty Trust, Inc.(2) | 11,403 |
| 4,854 |
| 12,771 |
| 2,161 |
| (2) |
| (2) |
| (1,048 | ) | $ | 468 |
|
| | $ | 28,734 |
| $ | 14,957 |
| $ | 22,394 |
| $ | (6,843 | ) | — |
| — |
| $ | (3,881 | ) | $ | 468 |
|
| |
| (2) | Company was not an affiliate at March 31, 2019. |
7. Fair Value Measurements
The fund’s investments valuation process is based on several considerations and may use multiple inputs to determine the fair value of the investments held by the fund. In conformity with accounting principles generally accepted in the United States of America, the inputs used to determine a valuation are classified into three broad levels.
| |
| • | Level 1 valuation inputs consist of unadjusted quoted prices in an active market for identical investments. |
| |
| • | Level 2 valuation inputs consist of direct or indirect observable market data (including quoted prices for comparable investments, evaluations of subsequent market events, interest rates, prepayment speeds, credit risk, etc.). These inputs also consist of quoted prices for identical investments initially expressed in local currencies that are adjusted through translation into U.S. dollars. |
| |
| • | Level 3 valuation inputs consist of unobservable data (including a fund’s own assumptions). |
The level classification is based on the lowest level input that is significant to the fair valuation measurement. The valuation inputs are not necessarily an indication of the risks associated with investing in these securities or other financial instruments.
The following is a summary of the level classifications as of period end. The Schedule of Investments provides additional information on the fund’s portfolio holdings.
|
| | | | | | | | |
| | Level 1 | Level 2 | Level 3 |
| Assets | | | |
| Investment Securities | | | |
| Common Stocks | $ | 1,321,225,898 |
| $ | 2,726,678 |
| — |
|
| Temporary Cash Investments | 16,307 |
| 35,381,764 |
| — |
|
| | $ | 1,321,242,205 |
| $ | 38,108,442 |
| — |
|
| Other Financial Instruments | | | |
| Forward Foreign Currency Exchange Contracts | — |
| $ | 31,388 |
| — |
|
8. Derivative Instruments
Foreign Currency Risk — The fund is subject to foreign currency exchange rate risk in the normal course of pursuing its investment objectives. The value of foreign investments held by a fund may be significantly affected by changes in foreign currency exchange rates. The dollar value of a foreign security generally decreases when the value of the dollar rises against the foreign currency in which the security is denominated and tends to increase when the value of the dollar declines against such foreign currency. A fund may enter into forward foreign currency exchange contracts to reduce a fund's exposure to foreign currency exchange rate fluctuations. The net U.S. dollar value of foreign currency underlying all contractual commitments held by a fund and the resulting unrealized appreciation or depreciation are determined daily. Realized gain or loss is recorded upon the termination of the contract. Net realized and unrealized gains or losses occurring during the holding period of forward foreign currency exchange contracts are a component of net realized gain (loss) on forward foreign currency exchange contract transactions and change in net unrealized appreciation (depreciation) on forward foreign currency exchange contracts, respectively. A fund bears the risk of an unfavorable change in the foreign currency exchange rate underlying the forward contract. Additionally, losses, up to the fair value, may arise if the counterparties do not perform under the contract terms. The fund's average U.S. dollar exposure to foreign currency risk derivative instruments held during the period was $25,843,019.
The value of foreign currency risk derivative instruments as of March 31, 2019, is disclosed on the Statement of Assets and Liabilities as an asset of $31,388 in unrealized appreciation on forward foreign currency exchange contracts. For the year ended March 31, 2019, the effect of foreign currency risk derivative instruments on the Statement of Operations was $202,579 in net realized gain (loss) on forward foreign currency exchange contract transactions and $31,388 in change in net unrealized appreciation (depreciation) on forward foreign currency exchange contracts.
9. Risk Factors
The fund invests in common stocks of small companies. Because of this, the fund may be subject to greater risk and market fluctuations than a fund investing in larger, more established companies.
10. Federal Tax Information
The tax character of distributions paid during the years ended March 31, 2019 and March 31, 2018 were as follows:
|
| | | | | | |
| | 2019 | 2018 |
| Distributions Paid From | | |
| Ordinary income | $ | 77,222,824 |
| $ | 83,250,525 |
|
| Long-term capital gains | $ | 126,820,134 |
| $ | 124,882,049 |
|
The book-basis character of distributions made during the year from net investment income or net realized gains may differ from their ultimate characterization for federal income tax purposes. These differences reflect the differing character of certain income items and net realized gains and losses for financial statement and tax purposes, and may result in reclassification among certain capital accounts on the financial statements.
As of period end, the federal tax cost of investments and the components of distributable earnings on a tax-basis were as follows:
|
| | | |
| Federal tax cost of investments | $ | 1,414,371,508 |
|
| Gross tax appreciation of investments | $ | 87,099,629 |
|
| Gross tax depreciation of investments | (142,120,490 | ) |
| Net tax appreciation (depreciation) of investments | $ | (55,020,861 | ) |
| Undistributed ordinary income | $ | 2,442,909 |
|
| Accumulated long-term gains | $ | 3,522,003 |
|
| Post-October capital loss deferral | $ | (5,642,887 | ) |
The difference between book-basis and tax-basis unrealized appreciation (depreciation) is attributable primarily to the tax deferral of losses on wash sales.
Loss deferrals represent certain qualified losses that the fund has elected to treat as having been incurred in the following fiscal year for federal income tax purposes.
|
| | | | | | | | | | | | | | | |
| For a Share Outstanding Throughout the Years Ended March 31 (except as noted) |
| Per-Share Data | Ratios and Supplemental Data |
| | | Income From Investment Operations: | Distributions From: | | | Ratio to Average Net Assets of: | | |
| | Net Asset Value, Beginning of Period | Net Investment Income (Loss)(1) | Net Realized and Unrealized Gain (Loss) | Total From Investment Operations | Net Investment Income | Net Realized Gains | Total Distributions | Net Asset Value, End of Period | Total Return(2) | Operating Expenses | Net Investment Income (Loss) | Portfolio Turnover Rate | Net Assets, End of Period (in thousands) |
| Investor Class | | | | | | | | | | | |
| 2019 | $8.64 | 0.06 | (0.44) | (0.38) | (0.05) | (1.16) | (1.21) | $7.05 | (3.15)% | 1.25% | 0.68% | 90% |
| $594,650 |
|
| 2018 | $9.39 | 0.04 | 0.47 | 0.51 | (0.03) | (1.23) | (1.26) | $8.64 | 5.41% | 1.26% | 0.42% | 90% |
| $687,877 |
|
| 2017 | $7.55 | 0.04 | 2.28 | 2.32 | (0.06) | (0.42) | (0.48) | $9.39 | 31.15% | 1.25% | 0.47% | 90% |
| $770,415 |
|
| 2016 | $9.16 | 0.04 | (0.59) | (0.55) | (0.03) | (1.03) | (1.06) | $7.55 | (6.25)% | 1.26% | 0.43% | 95% |
| $656,974 |
|
| 2015 | $9.88 | 0.06 | 0.48 | 0.54 | (0.05) | (1.21) | (1.26) | $9.16 | 6.18% | 1.24% | 0.66% | 78% |
| $815,048 |
|
| I Class | | | | | | | | | | | |
| 2019 | $8.72 | 0.07 | (0.44) | (0.37) | (0.06) | (1.16) | (1.22) | $7.13 | (2.95)% | 1.05% | 0.88% | 90% |
| $352,298 |
|
| 2018 | $9.47 | 0.06 | 0.46 | 0.52 | (0.04) | (1.23) | (1.27) | $8.72 | 5.57% | 1.06% | 0.62% | 90% |
| $411,986 |
|
| 2017 | $7.61 | 0.06 | 2.29 | 2.35 | (0.07) | (0.42) | (0.49) | $9.47 | 31.43% | 1.05% | 0.67% | 90% |
| $463,119 |
|
| 2016 | $9.22 | 0.05 | (0.58) | (0.53) | (0.05) | (1.03) | (1.08) | $7.61 | (6.02)% | 1.06% | 0.63% | 95% |
| $517,247 |
|
| 2015 | $9.94 | 0.08 | 0.48 | 0.56 | (0.07) | (1.21) | (1.28) | $9.22 | 6.35% | 1.04% | 0.86% | 78% |
| $599,932 |
|
| Y Class | | | | | | | | | | | | |
| 2019 | $8.73 | 0.10 | (0.45) | (0.35) | (0.08) | (1.16) | (1.24) | $7.14 | (2.80)% | 0.90% | 1.03% | 90% |
| $3,320 |
|
2018(3) | $9.32 | 0.08 | 0.61 | 0.69 | (0.05) | (1.23) | (1.28) | $8.73 | 7.43% | 0.91%(4) | 0.95%(4) | 90%(5) |
| $131 |
|
|
| | | | | | | | | | | | | | | |
| For a Share Outstanding Throughout the Years Ended March 31 (except as noted) |
| Per-Share Data | Ratios and Supplemental Data |
| | | Income From Investment Operations: | Distributions From: | | | Ratio to Average Net Assets of: | | |
| | Net Asset Value, Beginning of Period | Net Investment Income (Loss)(1) | Net Realized and Unrealized Gain (Loss) | Total From Investment Operations | Net Investment Income | Net Realized Gains | Total Distributions | Net Asset Value, End of Period | Total Return(2) | Operating Expenses | Net Investment Income (Loss) | Portfolio Turnover Rate | Net Assets, End of Period (in thousands) |
| A Class | | | | | | | | | | | | |
| 2019 | $8.54 | 0.03 | (0.42) | (0.39) | (0.03) | (1.16) | (1.19) | $6.96 | (3.32)% | 1.50% | 0.43% | 90% |
| $82,755 |
|
| 2018 | $9.31 | 0.01 | 0.46 | 0.47 | (0.01) | (1.23) | (1.24) | $8.54 | 5.02% | 1.51% | 0.17% | 90% |
| $116,763 |
|
| 2017 | $7.49 | 0.02 | 2.26 | 2.28 | (0.04) | (0.42) | (0.46) | $9.31 | 30.82% | 1.50% | 0.22% | 90% |
| $141,505 |
|
| 2016 | $9.09 | 0.01 | (0.57) | (0.56) | (0.01) | (1.03) | (1.04) | $7.49 | (6.41)% | 1.51% | 0.18% | 95% |
| $142,568 |
|
| 2015 | $9.81 | 0.04 | 0.48 | 0.52 | (0.03) | (1.21) | (1.24) | $9.09 | 5.96% | 1.49% | 0.41% | 78% |
| $384,891 |
|
| C Class |
| 2019 | $8.18 | (0.02) | (0.43) | (0.45) | — | (1.16) | (1.16) | $6.57 | (4.19)% | 2.25% | (0.32)% | 90% |
| $2,536 |
|
| 2018 | $9.01 | (0.05) | 0.45 | 0.40 | — | (1.23) | (1.23) | $8.18 | 4.41% | 2.26% | (0.58)% | 90% |
| $2,688 |
|
| 2017 | $7.29 | (0.05) | 2.20 | 2.15 | (0.01) | (0.42) | (0.43) | $9.01 | 29.78% | 2.25% | (0.53)% | 90% |
| $1,234 |
|
| 2016 | $8.93 | (0.04) | (0.57) | (0.61) | — | (1.03) | (1.03) | $7.29 | (7.13)% | 2.26% | (0.57)% | 95% |
| $265 |
|
| 2015 | $9.71 | (0.03) | 0.47 | 0.44 | (0.01) | (1.21) | (1.22) | $8.93 | 5.14% | 2.24% | (0.34)% | 78% |
| $138 |
|
| R Class |
| 2019 | $8.50 | 0.02 | (0.43) | (0.41) | (0.01) | (1.16) | (1.17) | $6.92 | (3.58)% | 1.75% | 0.18% | 90% |
| $3,437 |
|
| 2018 | $9.28 | (0.01) | 0.46 | 0.45 | — | (1.23) | (1.23) | $8.50 | 4.82% | 1.76% | (0.08)% | 90% |
| $3,284 |
|
| 2017 | $7.48 | —(6) | 2.25 | 2.25 | (0.03) | (0.42) | (0.45) | $9.28 | 30.41% | 1.75% | (0.03)% | 90% |
| $3,275 |
|
| 2016 | $9.09 | —(6) | (0.58) | (0.58) | — | (1.03) | (1.03) | $7.48 | (6.65)% | 1.76% | (0.07)% | 95% |
| $2,346 |
|
| 2015 | $9.83 | 0.02 | 0.47 | 0.49 | (0.02) | (1.21) | (1.23) | $9.09 | 5.65% | 1.74% | 0.16% | 78% |
| $2,138 |
|
| R5 Class |
| 2019 | $8.73 | 0.11 | (0.48) | (0.37) | (0.06) | (1.16) | (1.22) | $7.14 | (2.92)% | 1.05% | 0.88% | 90% |
| $491 |
|
2018(3) | $9.32 | 0.06 | 0.62 | 0.68 | (0.04) | (1.23) | (1.27) | $8.73 | 7.32% | 1.06%(4) | 0.65%(4) | 90%(5) |
| $5 |
|
|
| | | | | | | | | | | | | | | |
| For a Share Outstanding Throughout the Years Ended March 31 (except as noted) |
| Per-Share Data | Ratios and Supplemental Data |
| | | Income From Investment Operations: | Distributions From: | | | Ratio to Average Net Assets of: | | |
| | Net Asset Value, Beginning of Period | Net Investment Income (Loss)(1) | Net Realized and Unrealized Gain (Loss) | Total From Investment Operations | Net Investment Income | Net Realized Gains | Total Distributions | Net Asset Value, End of Period | Total Return(2) | Operating Expenses | Net Investment Income (Loss) | Portfolio Turnover Rate | Net Assets, End of Period (in thousands) |
| R6 Class |
| 2019 | $8.72 | 0.09 | (0.44) | (0.35) | (0.08) | (1.16) | (1.24) | $7.13 | (2.80)% | 0.90% | 1.03% | 90% |
| $316,502 |
|
| 2018 | $9.47 | 0.07 | 0.47 | 0.54 | (0.06) | (1.23) | (1.29) | $8.72 | 5.73% | 0.91% | 0.77% | 90% |
| $278,351 |
|
| 2017 | $7.62 | 0.07 | 2.28 | 2.35 | (0.08) | (0.42) | (0.50) | $9.47 | 31.45% | 0.90% | 0.82% | 90% |
| $176,015 |
|
| 2016 | $9.23 | 0.07 | (0.59) | (0.52) | (0.06) | (1.03) | (1.09) | $7.62 | (5.86)% | 0.91% | 0.78% | 95% |
| $67,173 |
|
| 2015 | $9.94 | 0.11 | 0.48 | 0.59 | (0.09) | (1.21) | (1.30) | $9.23 | 6.62% | 0.89% | 1.01% | 78% |
| $39,898 |
|
|
| | | | |
| Notes to Financial Highlights | | |
| |
| (1) | Computed using average shares outstanding throughout the period. |
| |
| (2) | Total returns are calculated based on the net asset value of the last business day and do not reflect applicable sales charges, if any. Total returns for periods less than one year are not annualized. |
| |
| (3) | April 10, 2017 (commencement of sale) through March 31, 2018. |
| |
| (5) | Portfolio turnover is calculated at the fund level. Percentage indicated was calculated for the year ended March 31, 2018. |
| |
| (6) | Per-share amount was less than $0.005. |
See Notes to Financial Statements.
|
|
| Report of Independent Registered Public Accounting Firm |
To the shareholders and the Board of Directors of American Century Capital Portfolios, Inc.:
Opinion on the Financial Statements and Financial Highlights
We have audited the accompanying statement of assets and liabilities, including the schedule of investments, of Small Cap Value Fund, one of the portfolios constituting the American Century Capital Portfolios, Inc. (the “Fund”), as of March 31, 2019, the related statement of operations for the year then ended, the statements of changes in net assets for each of the two years in the period then ended, the financial highlights for each of the five years in the period then ended, and the related notes. In our opinion, the financial statements and financial highlights present fairly, in all material respects, the financial position of Small Cap Value Fund of the American Century Capital Portfolios, Inc. as of March 31, 2019, the results of its operations for the year then ended, the changes in its net assets for each of the two years in the period then ended, and the financial highlights for each of the five years in the period then ended, in conformity with accounting principles generally accepted in the United States of America.
Basis for Opinion
These financial statements and financial highlights are the responsibility of the Fund's management. Our responsibility is to express an opinion on the Fund’s financial statements and financial highlights based on our audits. We are a public accounting firm registered with the Public Company Accounting Oversight Board (United States) (PCAOB) and are required to be independent with respect to the Fund in accordance with the U.S. federal securities laws and the applicable rules and regulations of the Securities and Exchange Commission and the PCAOB.
We conducted our audits in accordance with the standards of the PCAOB. Those standards require that we plan and perform the audit to obtain reasonable assurance about whether the financial statements and financial highlights are free of material misstatement, whether due to error or fraud. The Fund is not required to have, nor were we engaged to perform, an audit of its internal control over financial reporting. As part of our audits we are required to obtain an understanding of internal control over financial reporting but not for the purpose of expressing an opinion on the effectiveness of the Fund’s internal control over financial reporting. Accordingly, we express no such opinion.
Our audits included performing procedures to assess the risks of material misstatement of the financial statements and financial highlights, whether due to error or fraud, and performing procedures that respond to those risks. Such procedures included examining, on a test basis, evidence regarding the amounts and disclosures in the financial statements and financial highlights. Our audits also included evaluating the accounting principles used and significant estimates made by management, as well as evaluating the overall presentation of the financial statements and financial highlights. Our procedures included confirmation of securities owned as of March 31, 2019, by correspondence with the custodian and brokers; when replies were not received from brokers, we performed other auditing procedures. We believe that our audits provide a reasonable basis for our opinion.
DELOITTE & TOUCHE LLP
Kansas City, Missouri
May 16, 2019
We have served as the auditor of one or more American Century investment companies since 1997.
The Board of Directors
The individuals listed below serve as directors of the funds. Each director will continue to serve in this capacity until death, retirement, resignation or removal from office. The board has adopted a mandatory retirement age for directors who are not “interested persons,” as that term is defined in the Investment Company Act (independent directors). Independent directors shall retire by December 31 of the year in which they reach their 75th birthday.
Mr. Thomas is an “interested person” because he currently serves as President and Chief Executive Officer of American Century Companies, Inc. (ACC), the parent company of American Century Investment Management, Inc. (ACIM or the advisor). The other directors (more than three-fourths of the total number) are independent. They are not employees, directors or officers of, and have no financial interest in, ACC or any of its wholly owned, direct or indirect, subsidiaries, including ACIM, American Century Investment Services, Inc. (ACIS) and American Century Services, LLC (ACS), and they do not have any other affiliations, positions or relationships that would cause them to be considered “interested persons” under the Investment Company Act. The directors serve in this capacity for seven (in the case of Jonathan S. Thomas, 16; and Stephen E. Yates, 8) registered investment companies in the American Century Investments family of funds.
The following table presents additional information about the directors. The mailing address for each director is 4500 Main Street, Kansas City, Missouri 64111.
|
| | | | | |
Name
(Year of Birth) | Position(s) Held with Funds | Length of Time Served | Principal Occupation(s) During Past 5 Years | Number of American Century Portfolios Overseen by Director | Other Directorships Held During Past 5 Years |
| Independent Directors |
|
|
| Thomas W. Bunn (1953) | Director | Since 2017 | Retired | 67 | SquareTwo Financial; Barings (formerly Babson Capital Funds Trust) (2013 to 2016) |
Chris H. Cheesman
(1962)
| Director | Since 2019
| Retired. Senior Vice President & Chief Audit Executive, AllianceBernstein (1999 to 2018)
| 67 | None |
Barry Fink
(1955) | Director | Since 2012 (independent since 2016) | Retired | 67 | None |
Rajesh K. Gupta
(1960)
| Director | Since 2019
| Partner Emeritus, SeaCrest Investment Management and SeaCrest Wealth Management (2019 to Present); Chief Executive Officer and Chief Investment Officer, SeaCrest Investment Management (2006 to 2019); Chief Executive Officer and Chief Investment Officer, SeaCrest Wealth Management (2008 to 2019)
| 67 | None |
|
| | | | | |
Name
(Year of Birth) | Position(s) Held with Funds | Length of Time Served | Principal Occupation(s) During Past 5 Years | Number of American Century Portfolios Overseen by Director | Other Directorships Held During Past 5 Years |
| Independent Directors |
|
|
Lynn Jenkins
(1963)
| Director | Since 2019
| United States Representative, U.S. House of Representatives (2009 to 2018) | 67 | MGP Ingredients, Inc. |
Jan M. Lewis
(1957) | Director | Since 2011 | Retired | 67 | None |
John R. Whitten
(1946) | Director | Since 2008 | Retired | 67 | Rudolph Technologies, Inc. |
Stephen E. Yates
(1948) | Director and Chairman of the Board | Since 2012 (Chairman since 2018) | Retired | 72 | None |
| Interested Director |
|
|
Jonathan S. Thomas
(1963) | Director and President | Since 2007 | President and Chief Executive Officer, ACC (2007 to present). Also serves as Chief Executive Officer, ACS; Executive Vice President, ACIM; Director, ACC, ACIM and other ACC subsidiaries | 117 | BioMed Valley Discoveries, Inc. |
The Statement of Additional Information has additional information about the fund's directors and is available without charge, upon request, by calling 1-800-345-2021.
Officers
The following table presents certain information about the executive officers of the funds. Each officer serves as an officer for 16 (in the case of Robert J. Leach, 15) investment companies in the American Century family of funds, unless otherwise noted. No officer is compensated for his or her service as an officer of the funds. The listed officers are interested persons of the funds and are appointed or re-appointed on an annual basis. The mailing address for each officer listed below is 4500 Main Street, Kansas City, Missouri 64111.
|
| | |
Name
(Year of Birth) | Offices with the Funds | Principal Occupation(s) During the Past Five Years |
Jonathan S. Thomas
(1963) | Director and President since 2007 | President and Chief Executive Officer, ACC (2007 to present). Also serves as Chief Executive Officer, ACS; Executive Vice President, ACIM; Director, ACC, ACIM and other ACC subsidiaries |
R. Wes Campbell
(1974)
| Chief Financial Officer and Treasurer since 2018 | Investment Operations and Investment Accounting, ACS (2000 to present) |
Amy D. Shelton
(1964) | Chief Compliance Officer and Vice President since 2014 | Chief Compliance Officer, American Century funds, (2014 to present); Chief Compliance Officer, ACIM (2014 to present); Chief Compliance Officer, ACIS (2009 to present); Vice President, Client Interactions and Marketing, ACIS (2013 to 2014). Also serves as Vice President, ACIS |
Charles A. Etherington
(1957) | General Counsel since 2007 and Senior Vice President since 2006 | Attorney, ACC (1994 to present); Vice President, ACC (2005 to present); General Counsel, ACC (2007 to present). Also serves as General Counsel, ACIM, ACS, ACIS and other ACC subsidiaries; and Senior Vice President, ACIM and ACS |
C. Jean Wade
(1964) | Vice President since 2012 | Senior Vice President, ACS (2017 to present); Vice President, ACS (2000 to 2017) |
Robert J. Leach
(1966) | Vice President since 2006 | Vice President, ACS (2000 to present) |
David H. Reinmiller
(1963) | Vice President since 2000 | Attorney, ACC (1994 to present). Also serves as Vice President, ACIM and ACS |
Ward D. Stauffer
(1960) | Secretary since 2005 | Attorney, ACC (2003 to present) |
Retirement Account Information
As required by law, distributions you receive from certain retirement accounts are subject to federal income tax withholding, unless you elect not to have withholding apply*. Tax will be withheld on the total amount withdrawn even though you may be receiving amounts that are not subject to withholding, such as nondeductible contributions. In such case, excess amounts of withholding could occur. You may adjust your withholding election so that a greater or lesser amount will be withheld.
If you don’t want us to withhold on this amount, you must notify us to not withhold the federal income tax. You may notify us in writing or in certain situations by telephone or through other electronic means. For systematic withdrawals, your withholding election will remain in effect until revoked or changed by filing a new election. You have the right to revoke your election at any time and change your withholding percentage for future distributions.
Remember, even if you elect not to have income tax withheld, you are liable for paying income tax on the taxable portion of your withdrawal. If you elect not to have income tax withheld or you don’t have enough income tax withheld, you may be responsible for payment of estimated tax. You may incur penalties under the estimated tax rules if your withholding and estimated tax payments are not sufficient. You can reduce or defer the income tax on a distribution by directly or indirectly rolling such distribution over to another IRA or eligible plan. You should consult your tax advisor for additional information.
State tax will be withheld if, at the time of your distribution, your address is within one of the mandatory withholding states and you have federal income tax withheld (or as otherwise required by state law). State taxes will be withheld from your distribution in accordance with the respective state rules.
*Some 403(b), 457 and qualified retirement plan distributions may be subject to 20% mandatory withholding, as they are subject to special tax and withholding rules. Your plan administrator or plan sponsor is required to provide you with a special tax notice explaining those rules at the time you request a distribution. If applicable, federal and/or state taxes may be withheld from your distribution amount.
Proxy Voting Policies
A description of the policies that the fund's investment advisor uses in exercising the voting rights associated with the securities purchased and/or held by the fund is available without charge, upon request, by calling 1-800-345-2021. It is also available on the "About Us" page of American Century Investments’ website at americancentury.com and on the Securities and Exchange Commission’s website at sec.gov. Information regarding how the investment advisor voted proxies relating to portfolio securities during the most recent 12-month period ended June 30 is available on the "About Us" page at americancentury.com. It is also available at sec.gov.
Quarterly Portfolio Disclosure
The fund files its complete schedule of portfolio holdings with the Securities and Exchange Commission (SEC) for the first and third quarters of each fiscal year on Form N-Q or as an exhibit to its reports on Form N-PORT. The fund’s Forms N-Q and Form N-PORT reports are available on the SEC’s website at sec.gov. The fund also makes its complete schedule of portfolio holdings for the most recent quarter of its fiscal year available on its website at americancentury.com and, upon request, by calling 1-800-345-2021.
Other Tax Information
The following information is provided pursuant to provisions of the Internal Revenue Code.
The fund hereby designates up to the maximum amount allowable as qualified dividend income for the fiscal year ended March 31, 2019.
For corporate taxpayers, the fund hereby designates $18,363,209, or up to the maximum amount allowable, of ordinary income distributions paid during the fiscal year ended March 31, 2019 as qualified for the corporate dividends received deduction.
The fund hereby designates $67,389,949 as qualified short-term capital gain distributions for purposes of Internal Revenue Code Section 871 for the fiscal year ended March 31, 2019.
The fund hereby designates $130,507,825, or up to the maximum amount allowable, as long-term capital gain distributions (20% rate gain distributions) for the fiscal year ended March 31, 2019.
The fund utilized earnings and profits of $6,451,018 distributed to shareholders on redemption of shares as part of the dividends paid deduction (tax equalization).
|
| | |
| |
| | | |
| Contact Us | americancentury.com | |
| Automated Information Line | 1-800-345-8765 | |
| Investor Services Representative | 1-800-345-2021 or 816-531-5575 | |
| Investors Using Advisors | 1-800-378-9878 | |
| Business, Not-For-Profit, Employer-Sponsored Retirement Plans | 1-800-345-3533 | |
| Banks and Trust Companies, Broker-Dealers, Financial Professionals, Insurance Companies | 1-800-345-6488 | |
| Telecommunications Relay Service for the Deaf | 711 | |
| | | |
| American Century Capital Portfolios, Inc. | |
| | | |
Investment Advisor: American Century Investment Management, Inc. Kansas City, Missouri | |
| | | |
| This report and the statements it contains are submitted for the general information of our shareholders. The report is not authorized for distribution to prospective investors unless preceded or accompanied by an effective prospectus. | |
| | | |
©2019 American Century Proprietary Holdings, Inc. All rights reserved.
CL-ANN-92272 1905 | |
|
| |
| | |
| | Annual Report |
| | |
| | March 31, 2019 |
| | |
| | Value Fund |
| | Investor Class (TWVLX) |
| | I Class (AVLIX) |
| | Y Class (AVUYX) |
| | A Class (TWADX) |
| | C Class (ACLCX) |
| | R Class (AVURX) |
| | R5 Class (AVUGX) |
| | R6 Class (AVUDX) |
Beginning on January 1, 2021, as permitted by regulations adopted by the Securities and Exchange Commission, paper copies of the fund’s shareholder reports like this one will no longer be sent by mail, unless you specifically request paper copies of the reports from the fund or from your financial intermediary, such as a broker-dealer or bank. Instead, the reports will be made available on a website, and you will be notified by mail each time a report is posted and provided with a website link to access the report.
If you already elected to receive shareholder reports electronically, you will not be affected by this change and you need not take any action. You may elect to receive shareholder reports and other communications from the fund or your financial intermediary electronically by calling or sending an email request to your appropriate contacts as listed on the back cover of this report.
You may elect to receive all future reports in paper free of charge. You can inform the fund or your financial intermediary that you wish to continue receiving paper copies of your shareholder reports by calling or sending an email request to your appropriate contacts as listed on the back cover of this report. Your election to receive reports in paper will apply to all funds held with the fund complex/your financial intermediary.
|
| | |
| President’s Letter | 2 |
|
| Performance | 3 |
|
| Portfolio Commentary | |
|
| Fund Characteristics | |
|
| Shareholder Fee Example | |
|
| Schedule of Investments | |
|
| Statement of Assets and Liabilities | |
|
| Statement of Operations | |
|
| Statement of Changes in Net Assets | |
|
| Notes to Financial Statements | |
|
| Financial Highlights | |
|
| Report of Independent Registered Public Accounting Firm | |
|
| Management | |
|
| Additional Information | |
|
Any opinions expressed in this report reflect those of the author as of the date of the report, and do not necessarily represent the opinions of American Century Investments® or any other person in the American Century Investments organization. Any such opinions are subject to change at any time based upon market or other conditions and American Century Investments disclaims any responsibility to update such opinions. These opinions may not be relied upon as investment advice and, because investment decisions made by American Century Investments funds are based on numerous factors, may not be relied upon as an indication of trading intent on behalf of any American Century Investments fund. Security examples are used for representational purposes only and are not intended as recommendations to purchase or sell securities. Performance information for comparative indices and securities is provided to American Century Investments by third party vendors. To the best of American Century Investments’ knowledge, such information is accurate at the time of printing.
Jonathan Thomas
Dear Investor:
Thank you for reviewing this annual report for the period ended March 31, 2019. Annual reports help convey important information about fund returns, including market factors that affected performance during the reporting period. For additional, updated investment and market insights, we encourage you to visit our website, americancentury.com.
Markets Ended Roller-Coaster Period on Upswing
For the first half of the period, U.S. stocks climbed higher, while bond returns headed lower. Robust economic growth, bolstered by federal tax and regulatory reform, and record corporate earnings results fueled risk-on sentiment that drove stock prices higher. Meanwhile, the combination of strong economic data, the Federal Reserve’s (Fed’s) ongoing rate-hike campaign and an uptick in inflation pushed investment-grade bond returns lower.
Market trends began changing in late 2018. Mounting investor concerns about slowing global economic and earnings growth, U.S.-China trade tensions and rising interest rates triggered widespread volatility. Stock prices plunged as investors sought safe-haven investments, including U.S. Treasuries. Furthermore, the Fed issued another rate hike in December, its fourth of the year, and maintained its hawkish outlook. Investors feared the December rate increase and the Fed’s plans for two more rate hikes in 2019 were too aggressive, and risk-off investing remained in favor.
January brought a renewed sense of stability to the markets. Investors’ concerns about growth and trade eased, and the Fed changed course, pausing its rate-hike campaign amid moderating global growth and inflation. Valuations appeared attractive after the late-2018 sell-off, and risk-on investing resumed. In March, the Fed held rates steady again, hinting additional tightening was off the table for 2019. This news drove stock and bond returns higher and left both asset classes on an upward track to end the period. Overall, stocks (S&P 500 Index) overcame their late-2018 nosedive to gain 9.50% for the period. Bonds (Bloomberg Barclays U.S. Aggregate Bond Index) bounced back from losses early in the period to return 4.48%.
We expect volatility to remain a formidable factor as investors react to global growth trends, central bank policy and geopolitical developments. We believe this scenario underscores the importance of using professionally managed portfolios in pursuit of investment goals. We appreciate your continued trust and confidence in us.
Sincerely,
Jonathan Thomas
President and Chief Executive Officer
American Century Investments
|
| | | | | | |
| Total Returns as of March 31, 2019 | | | |
| | | | Average Annual Returns | |
| | Ticker Symbol | 1 year | 5 years | 10 years | Since Inception | Inception Date |
| Investor Class | TWVLX | 4.01% | 6.67% | 12.89% | — | 9/1/93 |
| Russell 1000 Value Index | — | 5.67% | 7.72% | 14.51% | — | — |
| S&P 500 Index | — | 9.50% | 10.90% | 15.91% | — | — |
| I Class | AVLIX | 4.21% | 6.89% | 13.10% | — | 7/31/97 |
| Y Class | AVUYX | 4.36% | — | — | 4.21% | 4/10/17 |
| A Class | TWADX | | | |
| 10/2/96 |
| No sales charge | | 3.63% | 6.41% | 12.60% | — | |
| With sales charge | | -2.35% | 5.15% | 11.94% | — | |
| C Class | ACLCX | 2.92% | 5.59% | 11.76% | — | 6/4/01 |
| R Class | AVURX | 3.50% | 6.14% | 12.33% | — | 7/29/05 |
| R5 Class | AVUGX | 4.21% | — | — | 4.06% | 4/10/17 |
| R6 Class | AVUDX | 4.36% | 7.06% | — | 8.05% | 7/26/13 |
Average annual returns since inception are presented when ten years of performance history is not available.
Sales charges include initial sales charges and contingent deferred sales charges (CDSCs), as applicable. A Class shares have a 5.75% maximum initial sales charge and may be subject to a maximum CDSC of 1.00%. C Class shares redeemed within 12 months of purchase are subject to a maximum CDSC of 1.00%. The SEC requires that mutual funds provide performance information net of maximum sales charges in all cases where charges could be applied.
Data presented reflect past performance. Past performance is no guarantee of future results. Current performance may be higher or lower than the performance shown. Total returns for periods less than one year are not annualized. Investment return and principal value will fluctuate, and redemption value may be more or less than original cost. Data assumes reinvestment of dividends and capital gains, and none of the charts reflect the deduction of taxes that a shareholder would pay on fund distributions or the redemption of fund shares. To obtain performance data current to the most recent month end, please call 1-800-345-2021 or visit americancentury.com. For additional information about the fund, please consult the prospectus.
|
|
| Growth of $10,000 Over 10 Years |
| $10,000 investment made March 31, 2009 |
Performance for other share classes will vary due to differences in fee structure.
|
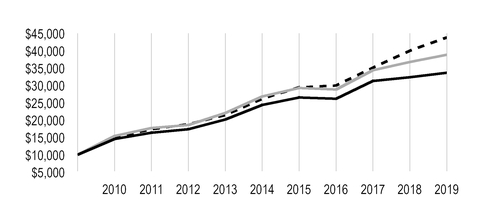
|
| |
| Value on March 31, 2019 |
| | Investor Class — $33,634 |
| |
| | Russell 1000 Value Index — $38,803 |
| |
| | S&P 500 Index — $43,809 |
| |
|
| | | | | | | |
| Total Annual Fund Operating Expenses |
| Investor Class | I Class | Y Class | A Class | C Class | R Class | R5 Class | R6 Class |
| 0.98% | 0.78% | 0.63% | 1.23% | 1.98% | 1.48% | 0.78% | 0.63% |
The total annual fund operating expenses shown is as stated in the fund’s prospectus current as of the date of this report. The prospectus may vary from the expense ratio shown elsewhere in this report because it is based on a different time period, includes acquired fund fees and expenses, and, if applicable, does not include fee waivers or expense reimbursements.
Data presented reflect past performance. Past performance is no guarantee of future results. Current performance may be higher or lower than the performance shown. Total returns for periods less than one year are not annualized. Investment return and principal value will fluctuate, and redemption value may be more or less than original cost. Data assumes reinvestment of dividends and capital gains, and none of the charts reflect the deduction of taxes that a shareholder would pay on fund distributions or the redemption of fund shares. To obtain performance data current to the most recent month end, please call 1-800-345-2021 or visit americancentury.com. For additional information about the fund, please consult the prospectus.
Portfolio Managers: Michael Liss, Kevin Toney, Phil Davidson, Brian Woglom and Philip Sundell
Effective April 2019, portfolio manager Dan Gruemmer will leave the fund's management team.
Performance Summary
Value returned 4.01%* for the fiscal year ended March 31, 2019, compared with the 5.67% return of its benchmark, the Russell 1000 Value Index.
Value stocks underperformed growth stocks across the capitalization spectrum during the
12-month period. Within the Russell 1000 Value Index, utilities, real estate and health care led sector performance. The weakest sectors were financials and materials. The fund recorded positive absolute contributions from most sectors, led by health care. Financials, energy and utilities were the largest absolute detractors.
The fund’s underperformance relative to the benchmark was headed by stock selection in the energy sector. An underweight allocation in utilities relative to the benchmark and stock decisions in the sector also hampered performance. Stock selection in the consumer staples sector was the top contributor. Overweighting health care and stock choices in the sector were also beneficial.
Energy Holdings Led Detractors
Stock decisions in the energy equipment and services industry drove underperformance in the energy sector. Schlumberger was a significant detractor. The recovery in the oil field services markets has perpetually disappointed investor expectations. In particular, the non-U.S. oil field services markets (a historic stronghold for Schlumberger) have failed to stage a meaningful recovery. As a result, industry participants have been bidding contracts aggressively in an attempt to maintain operations, which has weighed on revenue growth and profitability of Schlumberger and its peers. We still think Schlumberger is the best oil field services company, and we maintain an overweight position. Our position in Anadarko Petroleum, a global exploration and production company, detracted from relative performance. Anadarko’s stock was negatively affected by lower commodity prices in 2018, which weighed on the free cash flow and return on invested capital of the business. We purchased additional shares as the stock price fell. Due to pipeline constraints, investors became concerned over Cimarex Energy’s ability to efficiently transport oil out of the Permian Basin. We believe those concerns were overstated and maintained our position.
Positioning in the utilities sector was a major source of weakness versus the benchmark. The stock of electric utility PG&E declined significantly. PG&E filed for bankruptcy protection due to the company’s potential liability stemming from wildfires in California. We exited our position on news of the bankruptcy.
Other significant detractors included Invesco. Asset management stocks underperformed late in 2018 due to weaker markets and continued valuation multiple compression. In addition, Invesco experienced an acceleration of net outflows and announced an expensive acquisition of OppenheimerFunds. The stock of General Electric declined due to significant losses in the company’s power business, a dividend cut and additional litigation risks. The stock regained some of its lost ground in the first quarter of 2019, and we remained invested given its high-quality assets in aviation and health care. We also believe General Electric's new CEO can lead a faster-than-expected turnaround.
*All fund returns referenced in this commentary are for Investor Class shares. Performance for other share classes will vary due to differences in fee structure; when Investor Class performance exceeds that of the index, other share classes may not. See page 3 for returns for all share classes.
Consumer Staples Benefited Performance
Holdings in household products industry led performance in the consumer staples sector. Household and personal care giant The Procter & Gamble Co. rose after the company reported higher organic growth. It stabilized and improved market share in many key products.
An overweight allocation among pharmaceutical stocks relative to the benchmark benefited performance. The stock of Merck & Co. rose as the pharmaceutical company reported solid quarterly results, raised its dividend and announced a share buyback. Competitor AstraZeneca announced a lung cancer trial failure, which cemented Merck’s dominance in the lung cancer space with its drug, Keytruda. Pharmaceutical company Pfizer has been supported by solid data on Tafamidis, its cardiomyopathy drug, and by its generally strong drug pipeline. Hospital company LifePoint Health outperformed on the announcement that it would be acquired for a significant premium by private equity firm Apollo Global Management. We eliminated the position after the stock price rose.
Other major contributors included Advance Auto Parts. The company reported better-than-expected quarterly results and raised its full-year guidance due to margin improvement and stronger-than-expected same-store sales trends. The company’s turnaround plan is starting to show signs of effectiveness. The stock of Occidental Petroleum, a large integrated energy company with upstream, midstream and chemical operations, appreciated meaningfully. Logistical constraints in the Permian Basin benefited the profitability of the company’s midstream segment. Additionally, infrastructure investments in 2017 and early 2018 wound down, providing higher levels of free cash flows and improving Occidental’s ability to organically cover dividends.
Portfolio Positioning
The portfolio seeks to invest in companies where we believe the valuation does not reflect the quality and normal earnings power of the company. Our process is based on individual security selection, but broad themes have emerged.
Energy remained a top overweight at the end of the period. When oil prices fell in the fourth quarter of 2018, we added to our energy holdings as their valuations became more attractive. The portfolio was overweight the financials sector, with strong risks/rewards in the banking and capital markets industries. We also had a modest overweight to the capital markets industry, where we have taken advantage of attractive value opportunities as asset managers underperformed. We have identified stocks with compelling risk/reward profiles within the health care sector, particularly in the pharmaceuticals and health care equipment and supplies industries.
The portfolio ended the period underweight in utilities and real estate. It remains difficult for us to find higher-quality utilities and real estate stocks selling at attractive valuations.
|
| |
| MARCH 31, 2019 |
| Top Ten Holdings | % of net assets |
| JPMorgan Chase & Co. | 3.3% |
| U.S. Bancorp | 2.7% |
| AT&T, Inc. | 2.6% |
| Pfizer, Inc. | 2.6% |
| Bank of America Corp. | 2.5% |
| Wells Fargo & Co. | 2.5% |
| Procter & Gamble Co. (The) | 2.5% |
| Johnson & Johnson | 2.5% |
| General Electric Co. | 2.4% |
| Berkshire Hathaway, Inc.* | 2.4% |
| *Includes all classes of the issuer held by the fund. | |
| | |
| Top Five Industries | % of net assets |
| Banks | 15.1% |
| Oil, Gas and Consumable Fuels | 10.4% |
| Pharmaceuticals | 9.1% |
| Capital Markets | 5.1% |
| Diversified Telecommunication Services | 4.8% |
| | |
| Types of Investments in Portfolio | % of net assets |
| Domestic Common Stocks | 90.0% |
| Foreign Common Stocks* | 7.4% |
| Total Common Stocks | 97.4% |
| Temporary Cash Investments | 2.4% |
| Other Assets and Liabilities | 0.2% |
*Includes depositary shares, dual listed securities and foreign ordinary shares.
Fund shareholders may incur two types of costs: (1) transaction costs, including sales charges (loads) on purchase payments and redemption/exchange fees; and (2) ongoing costs, including management fees; distribution and service (12b-1) fees; and other fund expenses. This example is intended to help you understand your ongoing costs (in dollars) of investing in your fund and to compare these costs with the ongoing cost of investing in other mutual funds.
The example is based on an investment of $1,000 made at the beginning of the period and held for the entire period from October 1, 2018 to March 31, 2019.
Actual Expenses
The table provides information about actual account values and actual expenses for each class. You may use the information, together with the amount you invested, to estimate the expenses that you paid over the period. First, identify the share class you own. Then simply divide your account value by $1,000 (for example, an $8,600 account value divided by $1,000 = 8.6), then multiply the result by the number under the heading “Expenses Paid During Period” to estimate the expenses you paid on your account during this period.
If you hold Investor Class shares of any American Century Investments fund, or I Class shares of the American Century Diversified Bond Fund, in an American Century Investments account (i.e., not a financial intermediary or retirement plan account), American Century Investments may charge you a $12.50 semiannual account maintenance fee if the value of those shares is less than $10,000. We will redeem shares automatically in one of your accounts to pay the $12.50 fee. In determining your total eligible investment amount, we will include your investments in all personal accounts (including American Century Investments Brokerage accounts) registered under your Social Security number. Personal accounts include individual accounts, joint accounts, UGMA/UTMA accounts, personal trusts, Coverdell Education Savings Accounts and IRAs (including traditional, Roth, Rollover, SEP-, SARSEP- and SIMPLE-IRAs), and certain other retirement accounts. If you have only business, business retirement, employer-sponsored or American Century Investments Brokerage accounts, you are currently not subject to this fee. If you are subject to the Account Maintenance Fee, your account value could be reduced by the fee amount.
Hypothetical Example for Comparison Purposes
The table also provides information about hypothetical account values and hypothetical expenses based on the actual expense ratio of each class of your fund and an assumed rate of return of 5% per year before expenses, which is not the actual return of a fund’s share class. The hypothetical account values and expenses may not be used to estimate the actual ending account balance or expenses you paid for the period. You may use this information to compare the ongoing costs of investing in your fund and other funds. To do so, compare this 5% hypothetical example with the 5% hypothetical examples that appear in the shareholder reports of the other funds.
Please note that the expenses shown in the table are meant to highlight your ongoing costs only and do not reflect any transactional costs, such as sales charges (loads) or redemption/exchange fees. Therefore, the table is useful in comparing ongoing costs only, and will not help you determine the relative total costs of owning different funds. In addition, if these transactional costs were included, your costs would have been higher.
|
| | | | |
| Beginning
Account Value
10/1/18 | Ending
Account Value
3/31/19 | Expenses Paid
During Period(1)
10/1/18 - 3/31/19 |
Annualized
Expense Ratio(1) |
| Actual | | | | |
| Investor Class | $1,000 | $961.20 | $4.79 | 0.98% |
| I Class | $1,000 | $962.20 | $3.82 | 0.78% |
| Y Class | $1,000 | $962.90 | $3.08 | 0.63% |
| A Class | $1,000 | $959.90 | $6.01 | 1.23% |
| C Class | $1,000 | $955.80 | $9.65 | 1.98% |
| R Class | $1,000 | $958.90 | $7.23 | 1.48% |
| R5 Class | $1,000 | $962.20 | $3.82 | 0.78% |
| R6 Class | $1,000 | $962.90 | $3.08 | 0.63% |
| Hypothetical | | | | |
| Investor Class | $1,000 | $1,020.05 | $4.94 | 0.98% |
| I Class | $1,000 | $1,021.04 | $3.93 | 0.78% |
| Y Class | $1,000 | $1,021.79 | $3.18 | 0.63% |
| A Class | $1,000 | $1,018.80 | $6.19 | 1.23% |
| C Class | $1,000 | $1,015.06 | $9.95 | 1.98% |
| R Class | $1,000 | $1,017.55 | $7.44 | 1.48% |
| R5 Class | $1,000 | $1,021.04 | $3.93 | 0.78% |
| R6 Class | $1,000 | $1,021.79 | $3.18 | 0.63% |
| |
| (1) | Expenses are equal to the class's annualized expense ratio listed in the table above, multiplied by the average account value over the period, multiplied by 182, the number of days in the most recent fiscal half-year, divided by 365, to reflect the one-half year period. Annualized expense ratio reflects actual expenses, including any applicable fee waivers or expense reimbursements and excluding any acquired fund fees and expenses. |
MARCH 31, 2019
|
| | | | | |
| | Shares | Value |
| COMMON STOCKS — 97.4% | | |
| Air Freight and Logistics — 0.3% | | |
| United Parcel Service, Inc., Class B | 87,540 |
| $ | 9,781,720 |
|
| Airlines — 0.4% | | |
| Southwest Airlines Co. | 213,100 |
| 11,062,021 |
|
| Auto Components — 0.8% | | |
| BorgWarner, Inc. | 331,210 |
| 12,721,776 |
|
| Delphi Technologies plc | 612,332 |
| 11,793,514 |
|
| | | 24,515,290 |
|
| Automobiles — 1.2% | | |
| General Motors Co. | 562,319 |
| 20,862,035 |
|
| Honda Motor Co. Ltd. | 558,800 |
| 15,100,659 |
|
| | | 35,962,694 |
|
| Banks — 15.1% | | |
| Bank of America Corp. | 2,724,520 |
| 75,169,507 |
|
| BB&T Corp. | 662,390 |
| 30,821,007 |
|
| BOK Financial Corp. | 71,686 |
| 5,845,993 |
|
| Comerica, Inc. | 205,067 |
| 15,035,512 |
|
| JPMorgan Chase & Co. | 985,421 |
| 99,754,168 |
|
| M&T Bank Corp. | 122,720 |
| 19,269,494 |
|
| PNC Financial Services Group, Inc. (The) | 330,773 |
| 40,572,616 |
|
| U.S. Bancorp | 1,647,582 |
| 79,396,977 |
|
| UMB Financial Corp. | 171,656 |
| 10,992,850 |
|
| Wells Fargo & Co. | 1,539,058 |
| 74,367,283 |
|
| | | 451,225,407 |
|
| Beverages — 0.5% | | |
| PepsiCo, Inc. | 121,440 |
| 14,882,472 |
|
| Building Products — 1.0% | | |
| Johnson Controls International plc | 772,269 |
| 28,527,617 |
|
| Capital Markets — 5.1% | | |
| Ameriprise Financial, Inc. | 154,390 |
| 19,777,359 |
|
| Bank of New York Mellon Corp. (The) | 274,580 |
| 13,847,069 |
|
| BlackRock, Inc. | 72,360 |
| 30,924,493 |
|
| Franklin Resources, Inc. | 401,897 |
| 13,318,867 |
|
| Invesco Ltd. | 1,112,911 |
| 21,490,311 |
|
| Northern Trust Corp. | 283,287 |
| 25,611,978 |
|
| State Street Corp. | 408,555 |
| 26,887,005 |
|
| | | 151,857,082 |
|
| Communications Equipment — 2.3% | | |
| Cisco Systems, Inc. | 1,269,349 |
| 68,532,153 |
|
| Containers and Packaging — 1.1% | | |
| Packaging Corp. of America | 79,170 |
| 7,867,915 |
|
| Sonoco Products Co. | 216,889 |
| 13,345,180 |
|
|
| | | | | |
| | Shares | Value |
| WestRock Co. | 272,110 |
| $ | 10,435,418 |
|
| | | 31,648,513 |
|
| Diversified Financial Services — 2.4% | | |
Berkshire Hathaway, Inc., Class A(1) | 159 |
| 47,893,185 |
|
Berkshire Hathaway, Inc., Class B(1) | 115,620 |
| 23,226,902 |
|
| | | 71,120,087 |
|
| Diversified Telecommunication Services — 4.8% | | |
| AT&T, Inc. | 2,478,450 |
| 77,724,192 |
|
| Verizon Communications, Inc. | 1,091,300 |
| 64,528,569 |
|
| | | 142,252,761 |
|
| Electric Utilities — 0.4% | | |
| Edison International | 189,776 |
| 11,750,930 |
|
| Electrical Equipment — 1.6% | | |
| Hubbell, Inc. | 233,481 |
| 27,546,088 |
|
| nVent Electric plc | 747,280 |
| 20,161,615 |
|
| | | 47,707,703 |
|
| Electronic Equipment, Instruments and Components — 1.1% | | |
Keysight Technologies, Inc.(1) | 84,067 |
| 7,330,643 |
|
| TE Connectivity Ltd. | 315,199 |
| 25,452,319 |
|
| | | 32,782,962 |
|
| Energy Equipment and Services — 4.4% | | |
| Baker Hughes a GE Co. | 990,919 |
| 27,468,274 |
|
| Halliburton Co. | 944,850 |
| 27,684,105 |
|
| National Oilwell Varco, Inc. | 509,723 |
| 13,579,021 |
|
| Schlumberger Ltd. | 1,412,591 |
| 61,546,590 |
|
| | | 130,277,990 |
|
| Equity Real Estate Investment Trusts (REITs) — 0.6% | | |
| Weyerhaeuser Co. | 676,430 |
| 17,817,166 |
|
| Food and Staples Retailing — 1.1% | | |
| Walmart, Inc. | 350,281 |
| 34,162,906 |
|
| Food Products — 3.6% | | |
| Conagra Brands, Inc. | 430,133 |
| 11,931,889 |
|
| Kellogg Co. | 443,204 |
| 25,431,046 |
|
| Mondelez International, Inc., Class A | 929,096 |
| 46,380,472 |
|
| Orkla ASA | 2,933,510 |
| 22,515,883 |
|
| | | 106,259,290 |
|
| Health Care Equipment and Supplies — 4.3% | | |
| Abbott Laboratories | 234,110 |
| 18,714,753 |
|
| Medtronic plc | 541,800 |
| 49,347,144 |
|
| Siemens Healthineers AG | 412,688 |
| 17,197,957 |
|
| Zimmer Biomet Holdings, Inc. | 328,373 |
| 41,933,232 |
|
| | | 127,193,086 |
|
| Health Care Providers and Services — 3.3% | | |
| Cardinal Health, Inc. | 773,460 |
| 37,242,099 |
|
Laboratory Corp. of America Holdings(1) | 53,850 |
| 8,237,973 |
|
| McKesson Corp. | 319,460 |
| 37,395,988 |
|
|
| | | | | |
| | Shares | Value |
| Quest Diagnostics, Inc. | 160,820 |
| $ | 14,460,934 |
|
| | | 97,336,994 |
|
| Health Care Technology — 0.3% | | |
Cerner Corp.(1) | 176,930 |
| 10,122,165 |
|
| Hotels, Restaurants and Leisure — 0.5% | | |
| Carnival Corp. | 220,387 |
| 11,178,029 |
|
| Sodexo SA | 47,160 |
| 5,192,835 |
|
| | | 16,370,864 |
|
| Household Products — 2.7% | | |
| Kimberly-Clark Corp. | 47,640 |
| 5,902,596 |
|
| Procter & Gamble Co. (The) | 713,494 |
| 74,239,051 |
|
| | | 80,141,647 |
|
| Industrial Conglomerates — 3.3% | | |
| General Electric Co. | 7,121,394 |
| 71,142,726 |
|
| Siemens AG | 247,270 |
| 26,611,376 |
|
| | | 97,754,102 |
|
| Insurance — 2.8% | | |
| Chubb Ltd. | 287,493 |
| 40,272,020 |
|
| MetLife, Inc. | 424,528 |
| 18,072,157 |
|
| Reinsurance Group of America, Inc. | 137,529 |
| 19,526,367 |
|
| Unum Group | 207,080 |
| 7,005,516 |
|
| | | 84,876,060 |
|
| Leisure Products — 0.2% | | |
Mattel, Inc.(1) | 566,922 |
| 7,369,986 |
|
| Machinery — 1.6% | | |
| Atlas Copco AB, B Shares | 599,180 |
| 14,829,178 |
|
| Cummins, Inc. | 55,710 |
| 8,794,938 |
|
| IMI plc | 2,063,520 |
| 25,747,504 |
|
| | | 49,371,620 |
|
| Metals and Mining — 0.6% | | |
| BHP Group Ltd. | 615,870 |
| 16,831,613 |
|
| Multiline Retail — 0.5% | | |
| Target Corp. | 176,594 |
| 14,173,434 |
|
| Oil, Gas and Consumable Fuels — 10.4% | | |
| Anadarko Petroleum Corp. | 772,520 |
| 35,134,209 |
|
| Apache Corp. | 335,345 |
| 11,623,058 |
|
| Chevron Corp. | 475,867 |
| 58,617,297 |
|
| Cimarex Energy Co. | 373,603 |
| 26,114,850 |
|
| ConocoPhillips | 123,773 |
| 8,260,610 |
|
| Devon Energy Corp. | 1,065,655 |
| 33,632,072 |
|
| EQT Corp. | 771,841 |
| 16,007,982 |
|
| Equitrans Midstream Corp. | 469,856 |
| 10,233,464 |
|
| Noble Energy, Inc. | 1,360,360 |
| 33,641,703 |
|
| Occidental Petroleum Corp. | 338,783 |
| 22,427,434 |
|
| Royal Dutch Shell plc, B Shares | 768,650 |
| 24,307,386 |
|
| TOTAL SA | 539,244 |
| 29,954,505 |
|
| | | 309,954,570 |
|
|
| | | | | | |
| | Shares/Principal Amount | Value |
| Pharmaceuticals — 9.1% | | |
| Allergan plc | 218,800 |
| $ | 32,034,508 |
|
| Johnson & Johnson | 526,189 |
| 73,555,960 |
|
| Merck & Co., Inc. | 772,577 |
| 64,255,229 |
|
| Pfizer, Inc. | 1,809,123 |
| 76,833,454 |
|
| Roche Holding AG | 21,380 |
| 5,890,638 |
|
Teva Pharmaceutical Industries Ltd. ADR(1) | 1,180,692 |
| 18,513,251 |
|
| | | 271,083,040 |
|
| Road and Rail — 1.0% | | |
| Heartland Express, Inc. | 1,594,856 |
| 30,748,824 |
|
| Semiconductors and Semiconductor Equipment — 3.6% | | |
| Applied Materials, Inc. | 237,294 |
| 9,411,080 |
|
| Intel Corp. | 1,146,287 |
| 61,555,612 |
|
| QUALCOMM, Inc. | 394,814 |
| 22,516,242 |
|
| Teradyne, Inc. | 314,069 |
| 12,512,509 |
|
| | | 105,995,443 |
|
| Software — 1.7% | | |
| Microsoft Corp. | 50,392 |
| 5,943,232 |
|
| Oracle Corp. (New York) | 836,259 |
| 44,915,471 |
|
| | | 50,858,703 |
|
| Specialty Retail — 1.0% | | |
| Advance Auto Parts, Inc. | 176,116 |
| 30,033,062 |
|
| Technology Hardware, Storage and Peripherals — 0.5% | | |
| HP, Inc. | 705,735 |
| 13,712,431 |
|
| Textiles, Apparel and Luxury Goods — 1.2% | | |
| Ralph Lauren Corp. | 95,400 |
| 12,371,472 |
|
| Tapestry, Inc. | 726,047 |
| 23,589,267 |
|
| | | 35,960,739 |
|
| Trading Companies and Distributors — 1.0% | | |
| MSC Industrial Direct Co., Inc., Class A | 362,009 |
| 29,941,764 |
|
TOTAL COMMON STOCKS
(Cost $2,290,849,670) | | 2,901,956,911 |
|
| TEMPORARY CASH INVESTMENTS — 2.4% | | |
Federal Home Loan Bank Discount Notes, 2.30%, 4/1/19(2) | $ | 50,000,000 |
| 50,000,000 |
|
| Repurchase Agreement, BMO Capital Markets Corp., (collateralized by various U.S. Treasury obligations, 0.125% - 2.875%, 9/30/19 - 2/15/44, valued at $19,796,289), in a joint trading account at 2.35%, dated 3/29/19, due 4/1/19 (Delivery value $19,404,626) | | 19,400,827 |
|
| Repurchase Agreement, Fixed Income Clearing Corp., (collateralized by various U.S. Treasury obligations, 2.875%, 10/31/23, valued at $3,309,693), at 1.25%, dated 3/29/19, due 4/1/19 (Delivery value $3,242,338) | | 3,242,000 |
|
| State Street Institutional U.S. Government Money Market Fund, Premier Class | 10,896 |
| 10,896 |
|
TOTAL TEMPORARY CASH INVESTMENTS
(Cost $72,653,723) | | 72,653,723 |
|
TOTAL INVESTMENT SECURITIES — 99.8%
(Cost $2,363,503,393) | | 2,974,610,634 |
|
| OTHER ASSETS AND LIABILITIES — 0.2% | | 5,358,038 |
|
| TOTAL NET ASSETS — 100.0% | | $ | 2,979,968,672 |
|
|
| | | | | | | | | | |
| FORWARD FOREIGN CURRENCY EXCHANGE CONTRACTS |
| Currency Purchased | Currency Sold | Counterparty | Settlement Date | Unrealized Appreciation (Depreciation) |
| USD | 12,381,261 |
| AUD | 17,404,486 |
| Morgan Stanley | 6/28/19 | $ | 3,363 |
|
| USD | 4,411,112 |
| CHF | 4,339,873 |
| UBS AG | 6/28/19 | 16,779 |
|
| EUR | 1,488,634 |
| USD | 1,692,931 |
| Credit Suisse AG | 6/28/19 | (10,755 | ) |
| USD | 61,585,835 |
| EUR | 53,979,100 |
| Credit Suisse AG | 6/28/19 | 588,736 |
|
| USD | 37,293,513 |
| GBP | 28,134,390 |
| JPMorgan Chase Bank N.A. | 6/28/19 | 491,033 |
|
| JPY | 53,435,250 |
| USD | 487,191 |
| Bank of America N.A. | 6/28/19 | (1,767 | ) |
| USD | 11,848,136 |
| JPY | 1,295,019,000 |
| Bank of America N.A. | 6/28/19 | 83,735 |
|
| USD | 353,447 |
| JPY | 38,766,750 |
| Bank of America N.A. | 6/28/19 | 1,277 |
|
| USD | 17,166,388 |
| NOK | 145,929,747 |
| Goldman Sachs & Co. | 6/28/19 | 190,358 |
|
| USD | 11,403,944 |
| SEK | 104,571,890 |
| Goldman Sachs & Co. | 6/28/19 | 82,822 |
|
| | | | | | | $ | 1,445,581 |
|
|
| | |
| NOTES TO SCHEDULE OF INVESTMENTS |
| ADR | - | American Depositary Receipt |
| AUD | - | Australian Dollar |
| CHF | - | Swiss Franc |
| EUR | - | Euro |
| GBP | - | British Pound |
| JPY | - | Japanese Yen |
| NOK | - | Norwegian Krone |
| SEK | - | Swedish Krona |
| USD | - | United States Dollar |
| |
| (2) | The rate indicated is the yield to maturity at purchase. |
See Notes to Financial Statements.
|
|
| Statement of Assets and Liabilities |
|
| | | |
| MARCH 31, 2019 | |
| Assets | |
| Investment securities, at value (cost of $2,363,503,393) | $ | 2,974,610,634 |
|
| Foreign currency holdings, at value (cost of $506) | 505 |
|
| Receivable for investments sold | 3,805,308 |
|
| Receivable for capital shares sold | 2,352,187 |
|
| Unrealized appreciation on forward foreign currency exchange contracts | 1,458,103 |
|
| Dividends and interest receivable | 5,860,661 |
|
| | 2,988,087,398 |
|
| | |
| Liabilities | |
| Payable for investments purchased | 3,538,759 |
|
| Payable for capital shares redeemed | 2,192,814 |
|
| Unrealized depreciation on forward foreign currency exchange contracts | 12,522 |
|
| Accrued management fees | 2,265,666 |
|
| Distribution and service fees payable | 108,965 |
|
| | 8,118,726 |
|
| | |
| Net Assets | $ | 2,979,968,672 |
|
| | |
| Net Assets Consist of: | |
| Capital (par value and paid-in surplus) | $ | 2,501,855,717 |
|
| Distributable earnings | 478,112,955 |
|
| | $ | 2,979,968,672 |
|
|
| | | | | | |
| | Net Assets | Shares Outstanding | Net Asset Value Per Share |
| Investor Class, $0.01 Par Value |
| $1,845,966,609 |
| 227,855,284 |
| $8.10 |
| I Class, $0.01 Par Value |
| $313,183,143 |
| 38,576,962 |
| $8.12 |
| Y Class, $0.01 Par Value |
| $307,791,739 |
| 37,907,177 |
| $8.12 |
| A Class, $0.01 Par Value |
| $80,120,124 |
| 9,897,729 |
| $8.09* |
| C Class, $0.01 Par Value |
| $20,368,783 |
| 2,560,566 |
| $7.95 |
| R Class, $0.01 Par Value |
| $175,855,376 |
| 21,711,004 |
| $8.10 |
| R5 Class, $0.01 Par Value |
| $1,692,372 |
| 208,474 |
| $8.12 |
| R6 Class, $0.01 Par Value |
| $234,990,526 |
| 28,942,619 |
| $8.12 |
*Maximum offering price $8.58 (net asset value divided by 0.9425).
See Notes to Financial Statements.
|
| | | |
| YEAR ENDED MARCH 31, 2019 |
| Investment Income (Loss) | |
| Income: | |
| Dividends (net of foreign taxes withheld of $476,181) | $ | 82,398,897 |
|
| Interest | 1,444,202 |
|
| | 83,843,099 |
|
| | |
| Expenses: | |
| Management fees | 28,135,345 |
|
| Distribution and service fees: | |
| A Class | 256,377 |
|
| C Class | 243,377 |
|
| R Class | 853,403 |
|
| Directors' fees and expenses | 86,766 |
|
| Other expenses | 10,947 |
|
| | 29,586,215 |
|
| | |
| Net investment income (loss) | 54,256,884 |
|
| | |
| Realized and Unrealized Gain (Loss) | |
| Net realized gain (loss) on: | |
| Investment transactions | 141,148,971 |
|
| Forward foreign currency exchange contract transactions | 12,357,633 |
|
| Foreign currency translation transactions | (47,352 | ) |
| | 153,459,252 |
|
| | |
| Change in net unrealized appreciation (depreciation) on: | |
| Investments | (82,989,216 | ) |
| Forward foreign currency exchange contracts | 1,340,098 |
|
| Translation of assets and liabilities in foreign currencies | (14,658 | ) |
| | (81,663,776 | ) |
| | |
| Net realized and unrealized gain (loss) | 71,795,476 |
|
| | |
| Net Increase (Decrease) in Net Assets Resulting from Operations | $ | 126,052,360 |
|
See Notes to Financial Statements.
|
|
| Statement of Changes in Net Assets |
|
| | | | | | |
| YEARS ENDED MARCH 31, 2019 AND MARCH 31, 2018 |
| Increase (Decrease) in Net Assets | March 31, 2019 | March 31, 2018 |
| Operations | | |
| Net investment income (loss) | $ | 54,256,884 |
| $ | 53,522,139 |
|
| Net realized gain (loss) | 153,459,252 |
| 195,236,802 |
|
| Change in net unrealized appreciation (depreciation) | (81,663,776 | ) | (136,942,380 | ) |
| Net increase (decrease) in net assets resulting from operations | 126,052,360 |
| 111,816,561 |
|
| | | |
| Distributions to Shareholders | | |
From earnings:(1) | | |
| Investor Class | (184,255,327 | ) | (150,352,905 | ) |
| I Class | (34,298,731 | ) | (46,584,400 | ) |
| Y Class | (28,797,263 | ) | (2,837 | ) |
| A Class | (8,568,476 | ) | (8,342,338 | ) |
| C Class | (1,947,808 | ) | (1,919,923 | ) |
| R Class | (15,653,975 | ) | (9,787,008 | ) |
| R5 Class | (145,494 | ) | (372 | ) |
| R6 Class | (22,421,758 | ) | (13,685,630 | ) |
| Decrease in net assets from distributions | (296,088,832 | ) | (230,675,413 | ) |
| | | |
| Capital Share Transactions | | |
| Net increase (decrease) in net assets from capital share transactions (Note 5) | (46,554,546 | ) | (70,448,871 | ) |
| | | |
| Net increase (decrease) in net assets | (216,591,018 | ) | (189,307,723 | ) |
| | | |
| Net Assets | | |
| Beginning of period | 3,196,559,690 |
| 3,385,867,413 |
|
| End of period | $ | 2,979,968,672 |
| $ | 3,196,559,690 |
|
| |
| (1) | Prior period presentation has been updated to reflect the current period combination of distributions to shareholders from net investment income and net realized gains. Distributions from net investment income were $(31,929,403), $(10,054,845), $(2,549), $(1,515,298), $(148,441), $(1,371,454), $(84) and $(3,527,513) for Investor Class, I Class, Y Class, A Class, C Class, R Class, R5 Class and R6 Class, respectively. Distributions from net realized gains were $(118,423,502), $(36,529,555), $(288), $(6,827,040), $(1,771,482), $(8,415,554), $(288) and $(10,158,117) for Investor Class, I Class, Y Class, A Class, C Class, R Class, R5 Class and R6 Class, respectively. |
See Notes to Financial Statements.
|
|
| Notes to Financial Statements |
MARCH 31, 2019
1. Organization
American Century Capital Portfolios, Inc. (the corporation) is registered under the Investment Company Act of 1940, as amended (the 1940 Act), as an open-end management investment company and is organized as a Maryland corporation. Value Fund (the fund) is one fund in a series issued by the corporation. The fund’s investment objective is to seek long-term capital growth. Income is a secondary objective.
The fund offers the Investor Class, I Class, Y Class, A Class, C Class, R Class, R5 Class and R6 Class. The A Class may incur an initial sales charge. The A Class and C Class may be subject to a contingent deferred sales charge. Sale of the Y Class and R5 Class commenced on April 10, 2017.
2. Significant Accounting Policies
The following is a summary of significant accounting policies consistently followed by the fund in preparation of its financial statements. The fund is an investment company and follows accounting and reporting guidance in accordance with accounting principles generally accepted in the United States of America. This may require management to make certain estimates and assumptions at the date of the financial statements. Actual results could differ from these estimates. Management evaluated the impact of events or transactions occurring through the date the financial statements were issued that would merit recognition or disclosure.
Investment Valuations — The fund determines the fair value of its investments and computes its net asset value per share at the close of regular trading (usually 4 p.m. Eastern time) on the New York Stock Exchange (NYSE) on each day the NYSE is open. The Board of Directors has adopted valuation policies and procedures to guide the investment advisor in the fund’s investment valuation process and to provide methodologies for the oversight of the fund’s pricing function.
Equity securities that are listed or traded on a domestic securities exchange are valued at the last reported sales price or at the official closing price as provided by the exchange. Equity securities traded on foreign securities exchanges are generally valued at the closing price of such securities on the exchange where primarily traded or at the close of the NYSE, if that is earlier. If no last sales price is reported, or if local convention or regulation so provides, the mean of the latest bid and asked prices may be used. Securities traded over-the-counter are valued at the mean of the latest bid and asked prices, the last sales price, or the official closing price. Equity securities initially expressed in local currencies are translated into U.S. dollars at the mean of the appropriate currency exchange rate at the close of the NYSE as provided by an independent pricing service.
Fixed income securities are valued at the evaluated mean as provided by independent pricing services or at the mean of the most recent bid and asked prices as provided by investment dealers. U.S. Treasury and Government Agency securities are valued using market models that consider trade data, quotations from dealers and active market makers, relevant yield curve and spread data, creditworthiness, trade data or market information on comparable securities, and other relevant security specific information.
Open-end management investment companies are valued at the reported net asset value per share. Repurchase agreements are valued at cost, which approximates fair value. Forward foreign currency exchange contracts are valued at the mean of the appropriate forward exchange rate at the close of the NYSE as provided by an independent pricing service.
If the fund determines that the market price for an investment is not readily available or the valuation methods mentioned above do not reflect an investment’s fair value, such investment is valued as determined in good faith by the Board of Directors or its delegate, in accordance with policies and procedures adopted by the Board of Directors. In its determination of fair value, the fund may review several factors including, but not limited to, market information regarding the specific investment or comparable investments and correlation with other investment types, futures indices or general market indicators. Circumstances that may cause the fund to use these procedures to value an investment include, but are not limited to: an investment has been declared in default or is distressed; trading in a security has been suspended during the trading day or a security is not actively trading on its principal exchange; prices received from a regular pricing source are deemed unreliable; or there is a foreign market holiday and no trading occurred.
The fund monitors for significant events occurring after the close of an investment’s primary exchange but before the fund’s net asset value per share is determined. Significant events may include, but are not limited to: corporate announcements and transactions; governmental action and political unrest that could impact a specific investment or an investment sector; or armed conflicts, natural disasters and similar events that could affect investments in a specific country or region. The fund also monitors for significant fluctuations between domestic and foreign markets, as evidenced by the U.S. market or such other indicators that the Board of Directors, or its delegate, deems appropriate. If significant fluctuations in foreign markets are identified, the fund may apply a model-derived factor to the closing price of equity securities traded on foreign securities exchanges. The factor is based on observable market data as provided by an independent pricing service.
Security Transactions — Security transactions are accounted for as of the trade date. Net realized gains and losses are determined on the identified cost basis, which is also used for federal income tax purposes.
Investment Income — Dividend income less foreign taxes withheld, if any, is recorded as of the ex-dividend date. Distributions received on securities that represent a return of capital or long-term capital gain are recorded as a reduction of cost of investments and/or as a realized gain. The fund may estimate the components of distributions received that may be considered nontaxable distributions or long-term capital gain distributions for income tax purposes. Interest income is recorded on the accrual basis and includes accretion of discounts and amortization of premiums.
Foreign Currency Translations — All assets and liabilities initially expressed in foreign currencies are translated into U.S. dollars at prevailing exchange rates at period end. The fund may enter into spot foreign currency exchange contracts to facilitate transactions denominated in a foreign currency. Purchases and sales of investment securities, dividend and interest income, spot foreign currency exchange contracts, and expenses are translated at the rates of exchange prevailing on the respective dates of such transactions. Net realized and unrealized foreign currency exchange gains or losses related to investment securities are a component of net realized gain (loss) on investment transactions and change in net unrealized appreciation (depreciation) on investments, respectively.
Repurchase Agreements — The fund may enter into repurchase agreements with institutions that American Century Investment Management, Inc. (ACIM) (the investment advisor) has determined are creditworthy pursuant to criteria adopted by the Board of Directors. The fund requires that the collateral, represented by securities, received in a repurchase transaction be transferred to the custodian in a manner sufficient to enable the fund to obtain those securities in the event of a default under the repurchase agreement. ACIM monitors, on a daily basis, the securities transferred to ensure the value, including accrued interest, of the securities under each repurchase agreement is equal to or greater than amounts owed to the fund under each repurchase agreement.
Joint Trading Account — Pursuant to an Exemptive Order issued by the Securities and Exchange Commission, the fund, along with certain other funds in the American Century Investments family of funds, may transfer uninvested cash balances into a joint trading account. These balances are invested in one or more repurchase agreements that are collateralized by U.S. Treasury or Agency obligations.
Income Tax Status — It is the fund’s policy to distribute substantially all net investment income and net realized gains to shareholders and to otherwise qualify as a regulated investment company under provisions of the Internal Revenue Code. Accordingly, no provision has been made for income taxes. The fund files U.S. federal, state, local and non-U.S. tax returns as applicable. The fund's tax returns are subject to examination by the relevant taxing authority until expiration of the applicable statute of limitations, which is generally three years from the date of filing but can be longer in certain jurisdictions. At this time, management believes there are no uncertain tax positions which, based on their technical merit, would not be sustained upon examination and for which it is reasonably possible that the total amounts of unrecognized tax benefits will significantly change in the next twelve months.
Multiple Class — All shares of the fund represent an equal pro rata interest in the net assets of the class to which such shares belong, and have identical voting, dividend, liquidation and other rights and the same terms and conditions, except for class specific expenses and exclusive rights to vote on matters affecting only individual classes. Income, non-class specific expenses, and realized and unrealized capital gains and losses of the fund are allocated to each class of shares based on their relative net assets.
Distributions to Shareholders — Distributions from net investment income, if any, are generally declared and paid quarterly. Distributions from net realized gains, if any, are generally declared and paid annually. The fund may elect to treat a portion of its payment to a redeeming shareholder, which represents the pro rata share of undistributed net investment income and net realized gains, as a distribution for federal income tax purposes (tax equalization).
Indemnifications — Under the corporation’s organizational documents, its officers and directors are indemnified against certain liabilities arising out of the performance of their duties to the fund. In addition, in the normal course of business, the fund enters into contracts that provide general indemnifications. The maximum exposure under these arrangements is unknown as this would involve future claims that may be made against a fund. The risk of material loss from such claims is considered by management to be remote.
3. Fees and Transactions with Related Parties
Certain officers and directors of the corporation are also officers and/or directors of American Century Companies, Inc. (ACC). The corporation’s investment advisor, ACIM, the corporation's distributor, American Century Investment Services, Inc. (ACIS), and the corporation’s transfer agent, American Century Services, LLC, are wholly owned, directly or indirectly, by ACC.
Management Fees — The corporation has entered into a management agreement with ACIM, under which ACIM provides the fund with investment advisory and management services in exchange for a single, unified management fee (the fee) per class. The agreement provides that all expenses of managing and operating the fund, except distribution and service fees, brokerage expenses, taxes, interest, fees and expenses of the independent directors (including legal counsel fees), and extraordinary expenses, will be paid by ACIM. The fee is computed and accrued daily based on each class's daily net assets and paid monthly in arrears. The difference in the fee among the classes is a result of their separate arrangements for non-Rule 12b-1 shareholder services. It is not the result of any difference in advisory or custodial fees or other expenses related to the management of the fund’s assets, which do not vary by class. The rate of the fee is determined by applying a fee rate calculation formula. This formula takes into account the fund’s assets as well as certain assets, if any, of other clients of the investment advisor outside the American Century Investments family of funds (such as subadvised funds and separate accounts) that use very similar investment teams and strategies (strategy assets).
The management fee schedule range and the effective annual management fee for each class for the period ended March 31, 2019 are as follows:
|
| | |
| | Management Fee Schedule Range | Effective Annual Management Fee |
| Investor Class | 0.85% to 1.00% | 0.98% |
| I Class | 0.65% to 0.80% | 0.78% |
| Y Class | 0.50% to 0.65% | 0.63% |
| A Class | 0.85% to 1.00% | 0.98% |
| C Class | 0.85% to 1.00% | 0.98% |
| R Class | 0.85% to 1.00% | 0.98% |
| R5 Class | 0.65% to 0.80% | 0.78% |
| R6 Class | 0.50% to 0.65% | 0.63% |
Distribution and Service Fees — The Board of Directors has adopted a separate Master Distribution and Individual Shareholder Services Plan for each of the A Class, C Class and R Class (collectively the plans), pursuant to Rule 12b-1 of the 1940 Act. The plans provide that the A Class will pay ACIS an annual distribution and service fee of 0.25%. The plans provide that the C Class will pay ACIS an annual distribution and service fee of 1.00%, of which 0.25% is paid for individual shareholder services and 0.75% is paid for distribution services. The plans provide that the R Class will pay ACIS an annual distribution and service fee of 0.50%. The fees are computed and accrued daily based on each class’s daily net assets and paid monthly in arrears. The fees are used to pay financial intermediaries for distribution and individual shareholder services. Fees incurred under the plans during the period ended March 31, 2019 are detailed in the Statement of Operations.
Directors' Fees and Expenses — The Board of Directors is responsible for overseeing the investment advisor’s management and operations of the fund. The directors receive detailed information about the fund and its investment advisor regularly throughout the year, and meet at least quarterly with management of the investment advisor to review reports about fund operations. The fund’s officers do not receive compensation from the fund.
Interfund Transactions — The fund may enter into security transactions with other American Century Investments funds and other client accounts of the investment advisor, in accordance with the 1940 Act rules and procedures adopted by the Board of Directors. The rules and procedures require, among other things, that these transactions be effected at the independent current market price of the security. During the period, the interfund purchases and sales were $18,738,440 and $20,587,986, respectively. The effect of interfund transactions on the Statement of Operations was $1,558,692 in net realized gain (loss) on investment transactions.
4. Investment Transactions
Purchases and sales of investment securities, excluding short-term investments, for the period ended March 31, 2019 were $1,447,825,916 and $1,725,954,131, respectively.
5. Capital Share Transactions
Transactions in shares of the fund were as follows:
|
| | | | | | | | | | |
| | Year ended
March 31, 2019 | Year ended
March 31, 2018(1) |
| | Shares | Amount | Shares | Amount |
| Investor Class/Shares Authorized | 1,600,000,000 |
| | 1,520,000,000 |
| |
| Sold | 17,347,531 |
| $ | 148,195,629 |
| 38,239,252 |
| $ | 341,794,990 |
|
| Issued in reinvestment of distributions | 23,280,122 |
| 180,871,590 |
| 16,645,732 |
| 147,677,850 |
|
| Redeemed | (48,918,778 | ) | (421,662,491 | ) | (83,829,750 | ) | (752,701,212 | ) |
| | (8,291,125 | ) | (92,595,272 | ) | (28,944,766 | ) | (263,228,372 | ) |
| I Class/Shares Authorized | 380,000,000 |
| | 500,000,000 |
| |
| Sold | 11,616,653 |
| 101,550,349 |
| 28,587,515 |
| 257,956,737 |
|
| Issued in reinvestment of distributions | 4,252,832 |
| 33,312,977 |
| 5,152,094 |
| 45,809,199 |
|
| Redeemed | (52,059,590 | ) | (468,061,238 | ) | (17,258,883 | ) | (154,296,019 | ) |
| | (36,190,105 | ) | (333,197,912 | ) | 16,480,726 |
| 149,469,917 |
|
| Y Class/Shares Authorized | 250,000,000 |
| | 50,000,000 |
| |
| Sold | 42,484,368 |
| 382,459,514 |
| 119,399 |
| 1,065,642 |
|
| Issued in reinvestment of distributions | 3,310,435 |
| 25,710,716 |
| 322 |
| 2,837 |
|
| Redeemed | (8,007,332 | ) | (65,171,855 | ) | (15 | ) | (143 | ) |
| | 37,787,471 |
| 342,998,375 |
| 119,706 |
| 1,068,336 |
|
| A Class/Shares Authorized | 90,000,000 |
| | 90,000,000 |
| |
| Sold | 2,323,632 |
| 20,049,630 |
| 3,529,282 |
| 31,579,275 |
|
| Issued in reinvestment of distributions | 998,155 |
| 7,732,517 |
| 812,002 |
| 7,195,896 |
|
| Redeemed | (6,884,467 | ) | (59,025,775 | ) | (8,506,421 | ) | (76,208,050 | ) |
| | (3,562,680 | ) | (31,243,628 | ) | (4,165,137 | ) | (37,432,879 | ) |
| C Class/Shares Authorized | 30,000,000 |
| | 30,000,000 |
| |
| Sold | 349,377 |
| 2,739,079 |
| 533,342 |
| 4,686,329 |
|
| Issued in reinvestment of distributions | 243,224 |
| 1,836,053 |
| 207,225 |
| 1,804,521 |
|
| Redeemed | (1,433,100 | ) | (12,126,386 | ) | (1,310,789 | ) | (11,560,137 | ) |
| | (840,499 | ) | (7,551,254 | ) | (570,222 | ) | (5,069,287 | ) |
| R Class/Shares Authorized | 140,000,000 |
| | 100,000,000 |
| |
| Sold | 2,641,340 |
| 22,697,929 |
| 5,375,932 |
| 48,069,823 |
|
| Issued in reinvestment of distributions | 2,025,266 |
| 15,653,877 |
| 1,104,583 |
| 9,787,008 |
|
| Redeemed | (1,243,782 | ) | (10,829,203 | ) | (1,211,218 | ) | (10,903,868 | ) |
| | 3,422,824 |
| 27,522,603 |
| 5,269,297 |
| 46,952,963 |
|
| R5 Class/Shares Authorized | 30,000,000 |
| | 50,000,000 |
| |
| Sold | 213,196 |
| 1,964,484 |
| 557 |
| 5,001 |
|
| Issued in reinvestment of distributions | 18,889 |
| 145,494 |
| 42 |
| 372 |
|
| Redeemed | (24,210 | ) | (209,253 | ) | — |
| — |
|
| | 207,875 |
| 1,900,725 |
| 599 |
| 5,373 |
|
| R6 Class/Shares Authorized | 225,000,000 |
| | 130,000,000 |
| |
| Sold | 12,030,143 |
| 103,530,775 |
| 12,243,329 |
| 110,457,423 |
|
| Issued in reinvestment of distributions | 2,722,520 |
| 21,263,710 |
| 1,539,010 |
| 13,685,630 |
|
| Redeemed | (8,941,778 | ) | (79,182,668 | ) | (9,594,882 | ) | (86,357,975 | ) |
| | 5,810,885 |
| 45,611,817 |
| 4,187,457 |
| 37,785,078 |
|
| Net increase (decrease) | (1,655,354 | ) | $ | (46,554,546 | ) | (7,622,340 | ) | $ | (70,448,871 | ) |
| |
| (1) | April 10, 2017 (commencement of sale) through March 31, 2018 for the Y Class and R5 Class. |
6. Fair Value Measurements
The fund’s investments valuation process is based on several considerations and may use multiple inputs to determine the fair value of the investments held by the fund. In conformity with accounting principles generally accepted in the United States of America, the inputs used to determine a valuation are classified into three broad levels.
| |
| • | Level 1 valuation inputs consist of unadjusted quoted prices in an active market for identical investments. |
| |
| • | Level 2 valuation inputs consist of direct or indirect observable market data (including quoted prices for comparable investments, evaluations of subsequent market events, interest rates, prepayment speeds, credit risk, etc.). These inputs also consist of quoted prices for identical investments initially expressed in local currencies that are adjusted through translation into U.S. dollars. |
| |
| • | Level 3 valuation inputs consist of unobservable data (including a fund’s own assumptions). |
The level classification is based on the lowest level input that is significant to the fair valuation measurement. The valuation inputs are not necessarily an indication of the risks associated with investing in these securities or other financial instruments.
The following is a summary of the level classifications as of period end. The Schedule of Investments provides additional information on the fund’s portfolio holdings.
|
| | | | | | | | |
| | Level 1 | Level 2 | Level 3 |
| Assets | | | |
| Investment Securities | | | |
| Common Stocks | | | |
| Automobiles | $ | 20,862,035 |
| $ | 15,100,659 |
| — |
|
| Food Products | 83,743,407 |
| 22,515,883 |
| — |
|
| Health Care Equipment and Supplies | 109,995,129 |
| 17,197,957 |
| — |
|
| Hotels, Restaurants and Leisure | 11,178,029 |
| 5,192,835 |
| — |
|
| Industrial Conglomerates | 71,142,726 |
| 26,611,376 |
| — |
|
| Machinery | 8,794,938 |
| 40,576,682 |
| — |
|
| Metals and Mining | — |
| 16,831,613 |
| — |
|
| Oil, Gas and Consumable Fuels | 255,692,679 |
| 54,261,891 |
| — |
|
| Pharmaceuticals | 265,192,402 |
| 5,890,638 |
| — |
|
| Other Industries | 1,871,176,032 |
| — |
| — |
|
| Temporary Cash Investments | 10,896 |
| 72,642,827 |
| — |
|
| | $ | 2,697,788,273 |
| $ | 276,822,361 |
| — |
|
| Other Financial Instruments | | | |
| Forward Foreign Currency Exchange Contracts | — |
| $ | 1,458,103 |
| — |
|
| | | | |
| Liabilities | | | |
| Other Financial Instruments | | | |
| Forward Foreign Currency Exchange Contracts | — |
| $ | 12,522 |
| — |
|
7. Derivative Instruments
Foreign Currency Risk — The fund is subject to foreign currency exchange rate risk in the normal course of pursuing its investment objectives. The value of foreign investments held by a fund may be significantly affected by changes in foreign currency exchange rates. The dollar value of a foreign security generally decreases when the value of the dollar rises against the foreign currency in which the security is denominated and tends to increase when the value of the dollar declines against such foreign currency. A fund may enter into forward foreign currency exchange contracts to reduce a fund's exposure to foreign currency exchange rate fluctuations. The net U.S. dollar value of foreign currency underlying all contractual commitments held by a fund and the resulting unrealized appreciation or depreciation are determined daily. Realized gain or loss is recorded upon the termination of the contract. Net realized and unrealized gains or losses occurring during the holding period of forward foreign currency exchange contracts are a component of net realized gain (loss) on forward foreign currency exchange contract transactions and change in net unrealized appreciation (depreciation) on forward foreign currency exchange contracts, respectively. A fund bears the risk of an unfavorable change in the foreign currency exchange rate underlying the forward contract. Additionally, losses, up to the fair value, may arise if the counterparties do not perform under the contract terms. The fund's average U.S. dollar exposure to foreign currency risk derivative instruments held during the period was $162,662,875.
The value of foreign currency risk derivative instruments as of March 31, 2019, is disclosed on the Statement of Assets and Liabilities as an asset of $1,458,103 in unrealized appreciation on forward foreign currency exchange contracts and a liability of $12,522 in unrealized depreciation on forward foreign currency exchange contracts. For the year ended March 31, 2019, the effect of foreign currency risk derivative instruments on the Statement of Operations was $12,357,633 in net realized gain (loss) on forward foreign currency exchange contract transactions and $1,340,098 in change in net unrealized appreciation (depreciation) on forward foreign currency exchange contracts.
8. Risk Factors
There are certain risks involved in investing in foreign securities. These risks include those resulting from political events (such as civil unrest, national elections and imposition of exchange controls), social and economic events (such as labor strikes and rising inflation), and natural disasters. Securities of foreign issuers may be less liquid and more volatile. Investing a significant portion of assets in one country or region may accentuate these risks.
9. Federal Tax Information
The tax character of distributions paid during the years ended March 31, 2019 and March 31, 2018 were as follows:
|
| | | | | | |
| | 2019 | 2018 |
| Distributions Paid From | | |
| Ordinary income | $ | 75,346,441 |
| $ | 69,911,340 |
|
| Long-term capital gains | $ | 220,742,391 |
| $ | 160,764,073 |
|
The book-basis character of distributions made during the year from net investment income or net realized gains may differ from their ultimate characterization for federal income tax purposes. These differences reflect the differing character of certain income items and net realized gains and losses for financial statement and tax purposes, and may result in reclassification among certain capital accounts on the financial statements.
As of period end, the federal tax cost of investments and the components of distributable earnings on a tax-basis were as follows:
|
| | | |
| Federal tax cost of investments | $ | 2,506,256,347 |
|
| Gross tax appreciation of investments | $ | 608,186,642 |
|
| Gross tax depreciation of investments | (139,832,355 | ) |
| Net tax appreciation (depreciation) of investments | 468,354,287 |
|
| Net tax appreciation (depreciation) on derivatives and translation of assets and liabilities in foreign currencies | (14,970 | ) |
| Net tax appreciation (depreciation) | $ | 468,339,317 |
|
| Undistributed ordinary income | — |
|
| Accumulated long-term gains | $ | 9,773,638 |
|
The difference between book-basis and tax-basis unrealized appreciation (depreciation) is attributable primarily to the tax deferral of losses on wash sales.
|
| | | | | | | | | | | | | | | |
For a Share Outstanding Throughout the Years Ended March 31 (except as noted)
|
| Per-Share Data | | | | | | | | | Ratios and Supplemental Data |
| | | Income From Investment Operations: | Distributions From: | | | Ratio to Average Net Assets of: | |
| | Net Asset
Value,
Beginning
of Period | Net
Investment
Income
(Loss)(1) | Net Realized and Unrealized
Gain (Loss) | Total From
Investment
Operations | Net
Investment
Income | Net
Realized
Gains | Total
Distributions | Net Asset
Value,
End
of Period | Total
Return(2) | Operating
Expenses | Net
Investment
Income
(Loss) | Portfolio
Turnover
Rate | Net Assets,
End of
Period
(in thousands) |
| Investor Class | | | | | | | | | | | | |
| 2019 | $8.65 | 0.15 | 0.15 | 0.30 | (0.14) | (0.71) | (0.85) | $8.10 | 4.01% | 0.98% | 1.70% | 48% |
| $1,845,967 |
|
| 2018 | $8.98 | 0.14 | 0.17 | 0.31 | (0.13) | (0.51) | (0.64) | $8.65 | 3.38% | 0.98% | 1.59% | 35% |
| $2,043,212 |
|
| 2017 | $7.73 | 0.13 | 1.39 | 1.52 | (0.12) | (0.15) | (0.27) | $8.98 | 19.79% | 0.98% | 1.48% | 46% |
| $2,380,747 |
|
| 2016 | $8.55 | 0.13 | (0.28) | (0.15) | (0.15) | (0.52) | (0.67) | $7.73 | (1.53)% | 0.98% | 1.65% | 48% |
| $2,009,044 |
|
| 2015 | $8.46 | 0.13 | 0.62 | 0.75 | (0.13) | (0.53) | (0.66) | $8.55 | 8.91% | 0.97% | 1.54% | 45% |
| $2,003,967 |
|
| I Class | | | | | | | | | | | | |
| 2019 | $8.67 | 0.16 | 0.15 | 0.31 | (0.15) | (0.71) | (0.86) | $8.12 | 4.21% | 0.78% | 1.90% | 48% |
| $313,183 |
|
| 2018 | $9.00 | 0.16 | 0.17 | 0.33 | (0.15) | (0.51) | (0.66) | $8.67 | 3.58% | 0.78% | 1.79% | 35% |
| $648,241 |
|
| 2017 | $7.75 | 0.14 | 1.40 | 1.54 | (0.14) | (0.15) | (0.29) | $9.00 | 19.98% | 0.78% | 1.68% | 46% |
| $524,448 |
|
| 2016 | $8.56 | 0.15 | (0.27) | (0.12) | (0.17) | (0.52) | (0.69) | $7.75 | (1.21)% | 0.78% | 1.85% | 48% |
| $546,782 |
|
| 2015 | $8.47 | 0.15 | 0.62 | 0.77 | (0.15) | (0.53) | (0.68) | $8.56 | 9.10% | 0.77% | 1.74% | 45% |
| $1,215,076 |
|
| Y Class | | | | | | | | | | | | | |
| 2019 | $8.67 | 0.19 | 0.14 | 0.33 | (0.17) | (0.71) | (0.88) | $8.12 | 4.36% | 0.63% | 2.05% | 48% |
| $307,792 |
|
2018(3) | $8.98 | 0.19 | 0.17 | 0.36 | (0.16) | (0.51) | (0.67) | $8.67 | 3.94% | 0.63%(4) | 2.15%(4) | 35%(5) |
| $1,038 |
|
|
| | | | | | | | | | | | | | | |
For a Share Outstanding Throughout the Years Ended March 31 (except as noted)
|
| Per-Share Data | | | | | | | | | Ratios and Supplemental Data |
| | | Income From Investment Operations: | Distributions From: | | | Ratio to Average Net Assets of: | |
| | Net Asset
Value,
Beginning
of Period | Net
Investment
Income
(Loss)(1) | Net Realized and Unrealized
Gain (Loss) | Total From
Investment
Operations | Net
Investment
Income | Net
Realized
Gains | Total
Distributions | Net Asset
Value,
End
of Period | Total
Return(2) | Operating
Expenses | Net
Investment
Income
(Loss) | Portfolio
Turnover
Rate | Net Assets,
End of
Period
(in thousands) |
| A Class | | | | | | | | | | | | | |
| 2019 | $8.65 | 0.12 | 0.15 | 0.27 | (0.12) | (0.71) | (0.83) | $8.09 | 3.63% | 1.23% | 1.45% | 48% |
| $80,120 |
|
| 2018 | $8.98 | 0.12 | 0.17 | 0.29 | (0.11) | (0.51) | (0.62) | $8.65 | 3.13% | 1.23% | 1.34% | 35% |
| $116,377 |
|
| 2017 | $7.73 | 0.11 | 1.39 | 1.50 | (0.10) | (0.15) | (0.25) | $8.98 | 19.49% | 1.23% | 1.23% | 46% |
| $158,200 |
|
| 2016 | $8.54 | 0.11 | (0.27) | (0.16) | (0.13) | (0.52) | (0.65) | $7.73 | (1.65)% | 1.23% | 1.40% | 48% |
| $138,798 |
|
| 2015 | $8.45 | 0.11 | 0.62 | 0.73 | (0.11) | (0.53) | (0.64) | $8.54 | 8.64% | 1.22% | 1.29% | 45% |
| $365,063 |
|
| C Class | | | | | | | | | | | | |
| 2019 | $8.51 | 0.06 | 0.14 | 0.20 | (0.05) | (0.71) | (0.76) | $7.95 | 2.92% | 1.98% | 0.70% | 48% |
| $20,369 |
|
| 2018 | $8.84 | 0.05 | 0.17 | 0.22 | (0.04) | (0.51) | (0.55) | $8.51 | 2.40% | 1.98% | 0.59% | 35% |
| $28,948 |
|
| 2017 | $7.62 | 0.04 | 1.36 | 1.40 | (0.03) | (0.15) | (0.18) | $8.84 | 18.45% | 1.98% | 0.48% | 46% |
| $35,124 |
|
| 2016 | $8.43 | 0.05 | (0.27) | (0.22) | (0.07) | (0.52) | (0.59) | $7.62 | (2.42)% | 1.98% | 0.65% | 48% |
| $26,542 |
|
| 2015 | $8.36 | 0.05 | 0.60 | 0.65 | (0.05) | (0.53) | (0.58) | $8.43 | 7.77% | 1.97% | 0.54% | 45% |
| $29,473 |
|
| R Class | | | | | | | | | | | | | |
| 2019 | $8.65 | 0.10 | 0.15 | 0.25 | (0.09) | (0.71) | (0.80) | $8.10 | 3.50% | 1.48% | 1.20% | 48% |
| $175,855 |
|
| 2018 | $8.98 | 0.10 | 0.16 | 0.26 | (0.08) | (0.51) | (0.59) | $8.65 | 2.87% | 1.48% | 1.09% | 35% |
| $158,220 |
|
| 2017 | $7.73 | 0.08 | 1.40 | 1.48 | (0.08) | (0.15) | (0.23) | $8.98 | 19.18% | 1.48% | 0.98% | 46% |
| $116,917 |
|
| 2016 | $8.55 | 0.09 | (0.28) | (0.19) | (0.11) | (0.52) | (0.63) | $7.73 | (2.02)% | 1.48% | 1.15% | 48% |
| $68,477 |
|
| 2015 | $8.46 | 0.09 | 0.62 | 0.71 | (0.09) | (0.53) | (0.62) | $8.55 | 8.37% | 1.47% | 1.04% | 45% |
| $52,623 |
|
| R5 Class | | | | | | | | | | | | | |
| 2019 | $8.67 | 0.18 | 0.13 | 0.31 | (0.15) | (0.71) | (0.86) | $8.12 | 4.21% | 0.78% | 1.90% | 48% |
| $1,692 |
|
2018(3) | $8.98 | 0.16 | 0.19 | 0.35 | (0.15) | (0.51) | (0.66) | $8.67 | 3.80% | 0.78%(4) | 1.78%(4) | 35%(5) |
| $5 |
|
|
| | | | | | | | | | | | | | | |
For a Share Outstanding Throughout the Years Ended March 31 (except as noted)
|
| Per-Share Data | | | | | | | | | Ratios and Supplemental Data |
| | | Income From Investment Operations: | Distributions From: | | | Ratio to Average Net Assets of: | |
| | Net Asset
Value,
Beginning
of Period | Net
Investment
Income
(Loss)(1) | Net Realized and Unrealized
Gain (Loss) | Total From
Investment
Operations | Net
Investment
Income | Net
Realized
Gains | Total
Distributions | Net Asset
Value,
End
of Period | Total
Return(2) | Operating
Expenses | Net
Investment
Income
(Loss) | Portfolio
Turnover
Rate | Net Assets,
End of
Period
(in thousands) |
| R6 Class | | | | | | | | | | | | | |
| 2019 | $8.67 | 0.18 | 0.15 | 0.33 | (0.17) | (0.71) | (0.88) | $8.12 | 4.36% | 0.63% | 2.05% | 48% |
| $234,991 |
|
| 2018 | $9.00 | 0.17 | 0.17 | 0.34 | (0.16) | (0.51) | (0.67) | $8.67 | 3.74% | 0.63% | 1.94% | 35% |
| $200,518 |
|
| 2017 | $7.75 | 0.16 | 1.39 | 1.55 | (0.15) | (0.15) | (0.30) | $9.00 | 20.16% | 0.63% | 1.83% | 46% |
| $170,432 |
|
| 2016 | $8.56 | 0.16 | (0.27) | (0.11) | (0.18) | (0.52) | (0.70) | $7.75 | (1.06)% | 0.63% | 2.00% | 48% |
| $45,959 |
|
| 2015 | $8.47 | 0.17 | 0.61 | 0.78 | (0.16) | (0.53) | (0.69) | $8.56 | 9.27% | 0.62% | 1.89% | 45% |
| $34,116 |
|
|
|
| Notes to Financial Highlights |
| |
| (1) | Computed using average shares outstanding throughout the period. |
| |
| (2) | Total returns are calculated based on the net asset value of the last business day and do not reflect applicable sales charges, if any. Total returns for periods less than one year are not annualized. |
| |
| (3) | April 10, 2017 (commencement of sale) through March 31, 2018. |
| |
| (5) | Portfolio turnover is calculated at the fund level. Percentage indicated was calculated for the year ended March 31, 2018. |
See Notes to Financial Statements.
|
|
| Report of Independent Registered Public Accounting Firm |
To the shareholders and the Board of Directors of American Century Capital Portfolios, Inc.:
Opinion on the Financial Statements and Financial Highlights
We have audited the accompanying statement of assets and liabilities, including the schedule of investments, of Value Fund, one of the portfolios constituting the American Century Capital Portfolios, Inc. (the “Fund”), as of March 31, 2019, the related statement of operations for the year then ended, the statements of changes in net assets for each of the two years in the period then ended, the financial highlights for each of the five years in the period then ended, and the related notes. In our opinion, the financial statements and financial highlights present fairly, in all material respects, the financial position of Value Fund of the American Century Capital Portfolios, Inc. as of March 31, 2019, the results of its operations for the year then ended, the changes in its net assets for each of the two years in the period then ended, and the financial highlights for each of the five years in the period then ended, in conformity with accounting principles generally accepted in the United States of America.
Basis for Opinion
These financial statements and financial highlights are the responsibility of the Fund's management. Our responsibility is to express an opinion on the Fund’s financial statements and financial highlights based on our audits. We are a public accounting firm registered with the Public Company Accounting Oversight Board (United States) (PCAOB) and are required to be independent with respect to the Fund in accordance with the U.S. federal securities laws and the applicable rules and regulations of the Securities and Exchange Commission and the PCAOB.
We conducted our audits in accordance with the standards of the PCAOB. Those standards require that we plan and perform the audit to obtain reasonable assurance about whether the financial statements and financial highlights are free of material misstatement, whether due to error or fraud. The Fund is not required to have, nor were we engaged to perform, an audit of its internal control over financial reporting. As part of our audits we are required to obtain an understanding of internal control over financial reporting but not for the purpose of expressing an opinion on the effectiveness of the Fund’s internal control over financial reporting. Accordingly, we express no such opinion.
Our audits included performing procedures to assess the risks of material misstatement of the financial statements and financial highlights, whether due to error or fraud, and performing procedures that respond to those risks. Such procedures included examining, on a test basis, evidence regarding the amounts and disclosures in the financial statements and financial highlights. Our audits also included evaluating the accounting principles used and significant estimates made by management, as well as evaluating the overall presentation of the financial statements and financial highlights. Our procedures included confirmation of securities owned as of March 31, 2019, by correspondence with the custodian and brokers; when replies were not received from brokers, we performed other auditing procedures. We believe that our audits provide a reasonable basis for our opinion.
DELOITTE & TOUCHE LLP
Kansas City, Missouri
May 16, 2019
We have served as the auditor of one or more American Century investment companies since 1997.
The Board of Directors
The individuals listed below serve as directors of the funds. Each director will continue to serve in this capacity until death, retirement, resignation or removal from office. The board has adopted a mandatory retirement age for directors who are not “interested persons,” as that term is defined in the Investment Company Act (independent directors). Independent directors shall retire by December 31 of the year in which they reach their 75th birthday.
Mr. Thomas is an “interested person” because he currently serves as President and Chief Executive Officer of American Century Companies, Inc. (ACC), the parent company of American Century Investment Management, Inc. (ACIM or the advisor). The other directors (more than three-fourths of the total number) are independent. They are not employees, directors or officers of, and have no financial interest in, ACC or any of its wholly owned, direct or indirect, subsidiaries, including ACIM, American Century Investment Services, Inc. (ACIS) and American Century Services, LLC (ACS), and they do not have any other affiliations, positions or relationships that would cause them to be considered “interested persons” under the Investment Company Act. The directors serve in this capacity for seven (in the case of Jonathan S. Thomas, 16; and Stephen E. Yates, 8) registered investment companies in the American Century Investments family of funds.
The following table presents additional information about the directors. The mailing address for each director is 4500 Main Street, Kansas City, Missouri 64111.
|
| | | | | |
Name
(Year of Birth) | Position(s) Held with Funds | Length of Time Served | Principal Occupation(s) During Past 5 Years | Number of American Century Portfolios Overseen by Director | Other Directorships Held During Past 5 Years |
| Independent Directors |
|
|
| Thomas W. Bunn (1953) | Director | Since 2017 | Retired | 67 | SquareTwo Financial; Barings (formerly Babson Capital Funds Trust) (2013 to 2016) |
Chris H. Cheesman
(1962)
| Director | Since 2019
| Retired. Senior Vice President & Chief Audit Executive, AllianceBernstein (1999 to 2018)
| 67 | None |
Barry Fink
(1955) | Director | Since 2012 (independent since 2016) | Retired | 67 | None |
Rajesh K. Gupta
(1960)
| Director | Since 2019
| Partner Emeritus, SeaCrest Investment Management and SeaCrest Wealth Management (2019 to Present); Chief Executive Officer and Chief Investment Officer, SeaCrest Investment Management (2006 to 2019); Chief Executive Officer and Chief Investment Officer, SeaCrest Wealth Management (2008 to 2019)
| 67 | None |
|
| | | | | |
Name
(Year of Birth) | Position(s) Held with Funds | Length of Time Served | Principal Occupation(s) During Past 5 Years | Number of American Century Portfolios Overseen by Director | Other Directorships Held During Past 5 Years |
| Independent Directors |
|
|
Lynn Jenkins
(1963)
| Director | Since 2019
| United States Representative, U.S. House of Representatives (2009 to 2018) | 67 | MGP Ingredients, Inc. |
Jan M. Lewis
(1957) | Director | Since 2011 | Retired | 67 | None |
John R. Whitten
(1946) | Director | Since 2008 | Retired | 67 | Rudolph Technologies, Inc. |
Stephen E. Yates
(1948) | Director and Chairman of the Board | Since 2012 (Chairman since 2018) | Retired | 72 | None |
| Interested Director |
|
|
Jonathan S. Thomas
(1963) | Director and President | Since 2007 | President and Chief Executive Officer, ACC (2007 to present). Also serves as Chief Executive Officer, ACS; Executive Vice President, ACIM; Director, ACC, ACIM and other ACC subsidiaries | 117 | BioMed Valley Discoveries, Inc. |
The Statement of Additional Information has additional information about the fund's directors and is available without charge, upon request, by calling 1-800-345-2021.
Officers
The following table presents certain information about the executive officers of the funds. Each officer serves as an officer for 16 (in the case of Robert J. Leach, 15) investment companies in the American Century family of funds, unless otherwise noted. No officer is compensated for his or her service as an officer of the funds. The listed officers are interested persons of the funds and are appointed or re-appointed on an annual basis. The mailing address for each officer listed below is 4500 Main Street, Kansas City, Missouri 64111.
|
| | |
Name
(Year of Birth) | Offices with the Funds | Principal Occupation(s) During the Past Five Years |
Jonathan S. Thomas
(1963) | Director and President since 2007 | President and Chief Executive Officer, ACC (2007 to present). Also serves as Chief Executive Officer, ACS; Executive Vice President, ACIM; Director, ACC, ACIM and other ACC subsidiaries |
R. Wes Campbell
(1974)
| Chief Financial Officer and Treasurer since 2018 | Investment Operations and Investment Accounting, ACS (2000 to present) |
Amy D. Shelton
(1964) | Chief Compliance Officer and Vice President since 2014 | Chief Compliance Officer, American Century funds, (2014 to present); Chief Compliance Officer, ACIM (2014 to present); Chief Compliance Officer, ACIS (2009 to present); Vice President, Client Interactions and Marketing, ACIS (2013 to 2014). Also serves as Vice President, ACIS |
Charles A. Etherington
(1957) | General Counsel since 2007 and Senior Vice President since 2006 | Attorney, ACC (1994 to present); Vice President, ACC (2005 to present); General Counsel, ACC (2007 to present). Also serves as General Counsel, ACIM, ACS, ACIS and other ACC subsidiaries; and Senior Vice President, ACIM and ACS |
C. Jean Wade
(1964) | Vice President since 2012 | Senior Vice President, ACS (2017 to present); Vice President, ACS (2000 to 2017) |
Robert J. Leach
(1966) | Vice President since 2006 | Vice President, ACS (2000 to present) |
David H. Reinmiller
(1963) | Vice President since 2000 | Attorney, ACC (1994 to present). Also serves as Vice President, ACIM and ACS |
Ward D. Stauffer
(1960) | Secretary since 2005 | Attorney, ACC (2003 to present) |
Retirement Account Information
As required by law, distributions you receive from certain retirement accounts are subject to federal income tax withholding, unless you elect not to have withholding apply*. Tax will be withheld on the total amount withdrawn even though you may be receiving amounts that are not subject to withholding, such as nondeductible contributions. In such case, excess amounts of withholding could occur. You may adjust your withholding election so that a greater or lesser amount will be withheld.
If you don’t want us to withhold on this amount, you must notify us to not withhold the federal income tax. You may notify us in writing or in certain situations by telephone or through other electronic means. For systematic withdrawals, your withholding election will remain in effect until revoked or changed by filing a new election. You have the right to revoke your election at any time and change your withholding percentage for future distributions.
Remember, even if you elect not to have income tax withheld, you are liable for paying income tax on the taxable portion of your withdrawal. If you elect not to have income tax withheld or you don’t have enough income tax withheld, you may be responsible for payment of estimated tax. You may incur penalties under the estimated tax rules if your withholding and estimated tax payments are not sufficient. You can reduce or defer the income tax on a distribution by directly or indirectly rolling such distribution over to another IRA or eligible plan. You should consult your tax advisor for additional information.
State tax will be withheld if, at the time of your distribution, your address is within one of the mandatory withholding states and you have federal income tax withheld (or as otherwise required by state law). State taxes will be withheld from your distribution in accordance with the respective state rules.
*Some 403(b), 457 and qualified retirement plan distributions may be subject to 20% mandatory withholding, as they are subject to special tax and withholding rules. Your plan administrator or plan sponsor is required to provide you with a special tax notice explaining those rules at the time you request a distribution. If applicable, federal and/or state taxes may be withheld from your distribution amount.
Proxy Voting Policies
A description of the policies that the fund's investment advisor uses in exercising the voting rights associated with the securities purchased and/or held by the fund is available without charge, upon request, by calling 1-800-345-2021. It is also available on the "About Us" page of American Century Investments’ website at americancentury.com and on the Securities and Exchange Commission’s website at sec.gov. Information regarding how the investment advisor voted proxies relating to portfolio securities during the most recent 12-month period ended June 30 is available on the "About Us" page at americancentury.com. It is also available at sec.gov.
Quarterly Portfolio Disclosure
The fund files its complete schedule of portfolio holdings with the Securities and Exchange Commission (SEC) for the first and third quarters of each fiscal year on Form N-Q or as an exhibit to its reports on Form N-PORT. The fund’s Forms N-Q and Form N-PORT reports are available on the SEC’s website at sec.gov. The fund also makes its complete schedule of portfolio holdings for the most recent quarter of its fiscal year available on its website at americancentury.com and, upon request, by calling 1-800-345-2021.
Other Tax Information
The following information is provided pursuant to provisions of the Internal Revenue Code.
The fund hereby designates up to the maximum amount allowable as qualified dividend income for
the fiscal year ended March 31, 2019.
For corporate taxpayers, the fund hereby designates $66,472,238, or up to the maximum amount
allowable, of ordinary income distributions paid during the fiscal year ended March 31, 2019 as
qualified for the corporate dividends received deduction.
The fund hereby designates $26,408,847 as qualified short-term capital gain distributions for
purposes of Internal Revenue Code Section 871 for the fiscal year ended March 31, 2019.
The fund hereby designates $230,150,951, or up to the maximum amount allowable, as long-term
capital gain distributions (20% rate gain distributions) for the fiscal year ended March 31, 2019.
The fund utilized earnings and profits of $13,993,328 distributed to shareholders on redemption of
shares as part of the dividends paid deduction (tax equalization).
|
| | |
| |
| | | |
| Contact Us | americancentury.com | |
| Automated Information Line | 1-800-345-8765 | |
| Investor Services Representative | 1-800-345-2021 or 816-531-5575 | |
| Investors Using Advisors | 1-800-378-9878 | |
| Business, Not-For-Profit, Employer-Sponsored Retirement Plans | 1-800-345-3533 | |
| Banks and Trust Companies, Broker-Dealers, Financial Professionals, Insurance Companies | 1-800-345-6488 | |
| Telecommunications Relay Service for the Deaf | 711 | |
| | | |
| American Century Capital Portfolios, Inc. | |
| | | |
Investment Advisor: American Century Investment Management, Inc. Kansas City, Missouri | |
| | | |
| This report and the statements it contains are submitted for the general information of our shareholders. The report is not authorized for distribution to prospective investors unless preceded or accompanied by an effective prospectus. | |
| | | |
©2019 American Century Proprietary Holdings, Inc. All rights reserved.
CL-ANN-92273 1905 | |
ITEM 2. CODE OF ETHICS.
| |
| (a) | The registrant has adopted a Code of Ethics for Senior Financial Officers that applies to the registrant’s principal executive officer, principal financial officer, principal accounting officer, and persons performing similar functions. |
| |
| (f) | The registrant’s Code of Ethics for Senior Financial Officers was filed as Exhibit 12 (a)(1) to American Century Asset Allocation Portfolios, Inc.’s Annual Certified Shareholder Report on Form N-CSR, File No. 811-21591, on September 29, 2005, and is incorporated herein by reference. |
ITEM 3. AUDIT COMMITTEE FINANCIAL EXPERT.
| |
| (a)(1) | The registrant’s board has determined that the registrant has at least one audit committee financial expert serving on its audit committee. |
| |
| (a)(2) | John R. Whitten and Jan M. Lewis are the registrant’s designated audit committee financial experts. They are “independent” as defined in Item 3 of Form N-CSR. |
ITEM 4. PRINCIPAL ACCOUNTANT FEES AND SERVICES.
The aggregate fees billed for each of the last two fiscal years for professional services rendered by the principal accountant for the audit of the registrant’s annual financial statements or services that are normally provided by the accountant in connection with statutory and regulatory filings or engagements for those fiscal years were as follows:
FY 2018: $180,600
FY 2019: $188,500
The aggregate fees billed in each of the last two fiscal years for assurance and related services by the principal accountant that are reasonably related to the performance of the audit of the registrant’s financial statements and are not reported under paragraph (a) of this Item were as follows:
For services rendered to the registrant:
FY 2018:$0
FY 2019:$0
Fees required to be approved pursuant to paragraph (c)(7)(ii) of Rule 2-01 of Regulation S-X (relating to certain engagements for non-audit services with the registrant’s investment adviser and its affiliates):
FY 2018:$0
FY 2019:$0
The aggregate fees billed in each of the last two fiscal years for professional services rendered by the principal accountant for tax compliance, tax advice, and tax planning were as follows:
For services rendered to the registrant:
FY 2018: $0
FY 2019: $0
Fees required to be approved pursuant to paragraph (c)(7)(ii) of Rule 2-01 of Regulation S-X (relating to certain engagements for non-audit services with the registrant’s investment adviser and its affiliates):
FY 2018: $0
FY 2019: $0
The aggregate fees billed in each of the last two fiscal years for products and services provided by the principal accountant, other than the services reported in paragraphs (a) through (c) of this Item were as follows:
For services rendered to the registrant:
FY 2018:$0
FY 2019:$0
Fees required to be approved pursuant to paragraph (c)(7)(ii) of Rule 2-01 of Regulation S-X (relating to certain engagements for non-audit services with the registrant’s investment adviser and its affiliates):
FY 2018:$0
FY 2019:$0
| |
| (e)(1) | In accordance with paragraph (c)(7)(i)(A) of Rule 2-01 of Regulation S-X, before the accountant is engaged by the registrant to render audit or non-audit services, the engagement is approved by the registrant’s audit committee. Pursuant to paragraph (c)(7)(ii) of Rule 2-01 of Regulation S-X, the registrant’s audit committee also pre-approves its accountant’s engagements for non-audit services with the registrant’s investment adviser, its parent company, and any entity controlled by, or under common control with the investment adviser that provides ongoing services to the registrant, if the engagement relates directly to the operations and financial reporting of the registrant. |
| |
| (e)(2) | All services described in each of paragraphs (b) through (d) of this Item were pre-approved before the engagement by the registrant’s audit committee pursuant to paragraph (c)(7)(i)(A) of Rule 2-01 of Regulation S-X. Consequently, none of such services were required to be approved by the audit committee pursuant to paragraph (c)(7)(i)(C). |
| |
| (f) | The percentage of hours expended on the principal accountant’s engagement to audit the registrant’s financial statements for the most recent fiscal year that were attributed to work performed by persons other than the principal accountant’s full-time, permanent employees was less than 50%. |
| |
| (g) | The aggregate non-audit fees billed by the registrant’s accountant for services rendered to the registrant, and rendered to the registrant’s investment adviser (not including any sub-adviser whose role is primarily portfolio management and is subcontracted with or overseen by another investment adviser), and any entity controlling, controlled by, or under common control with the adviser that provides ongoing services to the registrant for each of the last two fiscal years of the registrant were as follows: |
FY 2018: $104,750
FY 2019: $175,750
| |
| (h) | The registrant’s investment adviser and accountant have notified the registrant’s audit committee of all non-audit services that were rendered by the registrant’s accountant to the registrant’s investment adviser, its parent company, and any entity controlled by, or under common control with the investment adviser that provides services to the registrant, which services were not required to be pre-approved pursuant to paragraph (c)(7)(ii) of Rule 2-01 of Regulation S-X. The notification provided to the registrant’s audit committee included sufficient details regarding such services to allow the registrant’s audit committee to consider the continuing independence of its principal accountant. |
ITEM 5. AUDIT COMMITTEE OF LISTED REGISTRANTS.
Not applicable.
ITEM 6. INVESTMENTS.
| |
| (a) | The schedule of investments is included as part of the report to stockholders filed under Item 1 of this Form. |
ITEM 7. DISCLOSURE OF PROXY VOTING POLICIES AND PROCEDURES FOR CLOSED-END MANAGEMENT INVESTMENT COMPANIES.
Not applicable.
ITEM 8. PORTFOLIO MANAGERS OF CLOSED-END MANAGEMENT INVESTMENT COMPANIES.
Not applicable.
ITEM 9. PURCHASES OF EQUITY SECURITIES BY CLOSED-END MANAGEMENT INVESTMENT COMPANY AND AFFILIATED PURCHASERS.
Not applicable.
ITEM 10. SUBMISSION OF MATTERS TO A VOTE OF SECURITY HOLDERS.
During the reporting period, there were no material changes to the procedures by which shareholders may recommend nominees to the registrant’s board.
ITEM 11. CONTROLS AND PROCEDURES.
| |
| (a) | The registrant's principal executive officer and principal financial officer have concluded that the registrant's disclosure controls and procedures (as defined in Rule 30a-3(c) under the Investment Company Act of 1940) are effective based on their evaluation of these controls and procedures as of a date within 90 days of the filing date of this report. |
| |
| (b) | There were no changes in the registrant's internal control over financial reporting (as defined in Rule 30a-3(d) under the Investment Company Act of 1940) that occurred during the period covered by this report that have materially affected, or are reasonably likely to materially affect, the registrant's internal control over financial reporting. |
ITEM 12. DISCLOSURE OF SECURITIES LENDING ACTIVITIES FOR CLOSED-END MANAGEMENT INVESTMENT COMPANIES.
Not applicable.
ITEM 13. EXHIBITS.
| |
| (a)(1) | Registrant’s Code of Ethics for Senior Financial Officers, which is the subject of the disclosure required by Item 2 of Form N-CSR, was filed as Exhibit 12(a)(1) to American Century Asset Allocation Portfolios, Inc.’s Certified Shareholder Report on Form N-CSR, File No. 811-21591, on September 29, 2005. |
| |
| (a)(2) | Separate certifications by the registrant’s principal executive officer and principal financial officer, pursuant to Section 302 of the Sarbanes-Oxley Act of 2002 and Rule 30a-2(a) under the Investment Company Act of 1940, are filed and attached hereto as EX-99.CERT. |
| |
| (b) | A certification by the registrant’s chief executive officer and chief financial officer, pursuant to Section 906 of the Sarbanes-Oxley Act of 2002, is furnished and attached hereto as EX-99.906CERT. |
SIGNATURES
Pursuant to the requirements of the Securities Exchange Act of 1934 and the Investment Company Act of 1940, the registrant has duly caused this report to be signed on its behalf by the undersigned, thereunto duly authorized.
|
| | | |
| Registrant: | American Century Capital Portfolios, Inc. |
| | | |
| By: | /s/ Jonathan S. Thomas |
| | Name: | Jonathan S. Thomas |
| | Title: | President |
| | | |
| Date: | May 24, 2019 |
Pursuant to the requirements of the Securities Exchange Act of 1934 and the Investment Company Act of 1940, this report has been signed below by the following persons on behalf of the registrant and in the capacities and on the dates indicated.
|
| | |
| By: | /s/ Jonathan S. Thomas |
| | Name: | Jonathan S. Thomas |
| | Title: | President |
| | | (principal executive officer) |
| | | |
| Date: | May 24, 2019 |
|
| | |
| By: | /s/ R. Wes Campbell |
| | Name: | R. Wes Campbell |
| | Title: | Treasurer and |
| | | Chief Financial Officer |
| | | (principal financial officer) |
| | | |
| Date: | May 24, 2019 |