UNITED STATES
SECURITIES AND EXCHANGE COMMISSION
Washington, D.C. 20549
FORM N-CSR
CERTIFIED SHAREHOLDER REPORT OF REGISTERED
MANAGEMENT INVESTMENT COMPANIES
Investment Company Act file number 811-08004
Aston Funds
(Exact name of registrant as specified in charter)
120 North LaSalle Street, 25th Floor
Chicago, IL 60602
(Address of principal executive offices) (Zip code)
Kenneth C. Anderson, President
Aston Funds
120 North LaSalle Street, 25th Floor
Chicago, IL 60602
(Name and address of agent for service)
Registrant’s telephone number, including area code: (312) 268-1400
Date of fiscal year end: October 31
Date of reporting period: April 30, 2012
Form N-CSR is to be used by management investment companies to file reports with the Commission not later than 10 days after the transmission to stockholders of any report that is required to be transmitted to stockholders under Rule 30e-1 under the Investment Company Act of 1940 (17 CFR 270.30e-1). The Commission may use the information provided on Form N-CSR in its regulatory, disclosure review, inspection, and policymaking roles.
A registrant is required to disclose the information specified by Form N-CSR, and the Commission will make this information public. A registrant is not required to respond to the collection of information contained in Form N-CSR unless the Form displays a currently valid Office of Management and Budget (“OMB”) control number. Please direct comments concerning the accuracy of the information collection burden estimate and any suggestions for reducing the burden to Secretary, Securities and Exchange Commission, 100 F Street, NE, Washington, DC 20549. The OMB has reviewed this collection of information under the clearance requirements of 44 U.S.C. § 3507.
Item 1. Reports to Stockholders.
This Privacy Statement is not part of the Semi Annual Report
PRIVACY STATEMENT
At Aston Funds, we appreciate the privacy concerns and expectations of our customers and we have established the following policies to maintain the privacy of information you share with us.
INFORMATION WE COLLECT
We collect and retain nonpublic personal information about you that may include:
| | • | | Information we receive on your account applications or other forms such as your name, address, financial information and/or social security number; |
| | • | | Information we receive about your mutual fund transactions, such as purchases, sales, exchanges and account balances; and |
| | • | | Information we collect through the use of Internet “cookies” when you access our website. Cookies are software files we use to track which of our sites you visit. |
INFORMATION WE MAY SHARE
We do not sell any of your nonpublic personal information to third parties. We may share the information we collect with affiliates or with non-affiliated third parties only when those parties are acting on our behalf in servicing your account, or as required by law. These third parties may include:
| | • | | Administrative service providers who, for example, process transactions for your account, print checks or prepare account statements; |
| | • | | Companies that provide services for us to help market our products to you; and |
| | • | | Governmental or other legal agencies, as required by law |
When information is shared with third parties, they are legally obligated to maintain the confidentiality of the information and to limit their use of it to servicing your account, except as permitted or required by law.
CONFIDENTIALITY AND SECURITY
We restrict access to your nonpublic personal information to authorized employees who need to access such information in order to provide services or products to you. We maintain physical, electronic and procedural safeguards to protect your nonpublic personal information.
As previously mentioned, we may collect information through the use of Internet “cookies” on our Web site. In addition, in order to provide you with access to your account via the web, it is necessary for us to collect certain nonpublic personal information such as your name, social security number and account information. Special measures such as data encryption and authentication apply to all nonpublic personal information and communications on our Web site.
APPLICABILITY
Our privacy policies apply only to those individual investors who have a direct customer relationship with us. If you are an individual shareholder of record of any of the Funds, the Funds consider you to be their customer. Shareholders purchasing or owning shares of any of the Funds through their bank, broker, or other financial institution should also consult that financial institution’s privacy policies.
Aston Funds values your business. We understand the importance of maintaining the integrity of your personal information and are committed to keeping your trust. Please contact us at 800-992-8151 if you have any questions concerning our policy, or visit us at www.astonfunds.com for additional copies of this policy.
This page intentionally left blank.
Large Cap Funds
ASTON/Montag & Caldwell Growth Fund
ASTON/Veredus Select Growth Fund
ASTON/TAMRO Diversified Equity Fund
ASTON/Herndon Large Cap Value Fund
ASTON/Cornerstone Large Cap Value Fund
Equity Income Fund
ASTON/River Road Dividend All Cap Value Fund
Mid Cap Funds
ASTON/Fairpointe Mid Cap Fund
ASTON/Montag & Caldwell Mid Cap Growth Fund
ASTON/Cardinal Mid Cap Value Fund
Table of Contents
Small Cap Funds
ASTON/Veredus Small Cap Growth Fund
(formerly the ASTON/Veredus Aggressive Growth Fund)
ASTON Small Cap Growth Fund
(formerly the ASTON/Crosswind Small Cap Growth Fund)
ASTON/Silvercrest Small Cap Fund
ASTON/TAMRO Small Cap Fund
ASTON/River Road Select Value Fund
ASTON/River Road Small Cap Value Fund
ASTON/River Road Independent Value Fund
Fixed Income Funds
ASTON/DoubleLine Core Plus Fixed Income Fund
ASTON/TCH Fixed Income Fund
Alternative Funds
ASTON/Lake Partners LASSO Alternatives Fund
ASTON Dynamic Allocation Fund
ASTON/M.D. Sass Enhanced Equity Fund
ASTON/River Road Long-Short Fund
International Funds
ASTON/Neptune International Fund
ASTON/Barings International Fund
Sector Fund
ASTON/Harrison Street Real Estate Fund
Balanced Fund
ASTON/Montag & Caldwell Balanced Fund
This report is submitted for general information to the shareholders of the funds. It is not authorized for distribution to prospective investors in the funds unless preceded or accompanied by an effective prospectus which includes details regarding the funds’ objectives, policies, expenses and other information.
Aston Funds are distributed by Foreside Funds Distributors LLC, 400 Berwyn Park, 899 Cassatt Road, Berwyn, PA 19312
Shareholder Services 800-992-8151 • www.astonfunds.com
NOT FDIC INSURED • NO BANK GUARANTEE • MAY LOSE VALUE
| | |
| Aston Funds | | |
| Performance Summary (unaudited) | | As of April 30, 2012 |
| | | | | | | | | | | | | | | | | | | | | | | | | | | | | | | | | | | | |
| | | | | | | | | Average Annual Total Returns | | | | | | | | | | | | | |
| | | Class | | | Six Month
Total
Return (a) | | | One
Year | | | Five
Year | | | Ten
Year | | | Since
Inception | | | Total
Expense
Ratio (b) | | | Net
Expense
Ratio (b) | | | Inception
Date | |
Equity Funds | | | | | | | | | | | | | | | | | | | | | | | | | | | | | | | | | | | | |
ASTON/Montag & Caldwell Growth Fund | | | N | | | | 11.27 | % | | | 6.94 | % | | | 4.74 | % | | | 3.96 | % | | | 8.70 | % | | | 1.07 | % | | | 1.07 | % | | | 11/02/94 | |
| | | I | | | | 11.45 | | | | 7.22 | | | | 5.01 | | | | 4.24 | | | | 6.90 | | | | 0.82 | | | | 0.82 | | | | 06/28/96 | |
| | | R | | | | 11.15 | | | | 6.70 | | | | 4.49 | | | | N/A | | | | 6.35 | | | | 1.32 | | | | 1.32 | | | | 12/31/02 | |
ASTON/Veredus Select Growth Fund (c) | | | N | | | | 4.92 | | | | -15.23 | | | | -1.17 | | | | 3.94 | | | | 2.79 | | | | 1.31 | | | | 1.31 | | | | 12/31/01 | |
| | | I | | | | 4.93 | | | | -15.12 | | | | -0.94 | | | | N/A | | | | 2.10 | | | | 1.06 | | | | 1.06 | | | | 09/11/06 | |
ASTON/TAMRO Diversified Equity Fund (c) | | | N | | | | 11.28 | | | | -0.57 | | | | 2.76 | | | | 5.66 | | | | 5.15 | | | | 1.63 | | | | 1.21 | | | | 11/30/00 | |
| | | I | | | | N/A | | | | N/A | | | | N/A | | | | N/A | | | | 1.28 | (d) | | | 1.38 | | | | 0.96 | | | | 03/02/12 | |
ASTON/Herndon Large Cap Value Fund (c) | | | N | | | | 11.71 | | | | 4.25 | | | | N/A | | | | N/A | | | | 11.98 | | | | 2.39 | | | | 1.31 | | | | 03/31/10 | |
| | | I | | | | 11.91 | | | | 4.53 | | | | N/A | | | | N/A | | | | 8.91 | | | | 2.14 | | | | 1.06 | | | | 03/02/11 | |
ASTON/Cornerstone Large Cap Value Fund(c) (e) | | | N | | | | 9.13 | | | | 3.60 | | | | 0.21 | | | | 5.45 | | | | 7.27 | | | | 1.61 | | | | 1.30 | | | | 01/04/93 | |
| | | I | | | | 9.16 | | | | 3.88 | | | | 0.47 | | | | N/A | | | | 4.47 | | | | 1.36 | | | | 1.05 | | | | 09/20/05 | |
ASTON/River Road Dividend All Cap Value Fund (c) | | | N | | | | 8.87 | | | | 3.85 | | | | 1.84 | | | | N/A | | | | 6.05 | | | | 1.15 | | | | 1.15 | | | | 06/28/05 | |
| | | I | | | | 9.01 | | | | 4.11 | | | | N/A | | | | N/A | | | | 1.62 | | | | 0.90 | | | | 0.90 | | | | 06/28/07 | |
ASTON/Fairpointe Mid Cap Fund | | | N | | | | 8.91 | | | | -5.50 | | | | 4.80 | | | | 8.73 | | | | 11.93 | | | | 1.14 | | | | 1.14 | | | | 09/19/94 | |
| | | I | | | | 9.08 | | | | -5.26 | | | | 5.06 | | | | N/A | | | | 7.70 | | | | 0.89 | | | | 0.89 | | | | 07/06/04 | |
ASTON/Montag & Caldwell Mid Cap Growth Fund (c)(f) | | | N | | | | 11.23 | | | | 3.45 | | | | N/A | | | | N/A | | | | 1.77 | | | | 3.08 | | | | 1.26 | | | | 11/02/07 | |
ASTON/Cardinal Mid Cap Value Fund (c) | | | N | | | | 9.46 | | | | -2.45 | | | | N/A | | | | N/A | | | | 0.53 | | | | 6.23 | | | | 1.58 | | | | 11/02/07 | |
ASTON/Veredus Small Cap Growth Fund (c) | | | N | | | | 7.12 | | | | -15.72 | | | | -0.76 | | | | 1.86 | | | | 7.15 | | | | 1.66 | | | | 1.50 | | | | 06/30/98 | |
| | | I | | | | 7.18 | | | | -15.56 | | | | -0.52 | | | | 2.13 | | | | 1.28 | | | | 1.41 | | | | 1.25 | | | | 10/05/01 | |
ASTON Small Cap Growth Fund (c) | | | N | | | | 11.76 | | | | -11.75 | | | | N/A | | | | N/A | | | | 7.38 | | | | 8.28 | | | | 1.36 | | | | 11/03/10 | |
| | | I | | | | 11.84 | | | | N/A | | | | N/A | | | | N/A | | | | -10.08 | (d) | | | 8.03 | | | | 1.11 | | | | 06/01/11 | |
ASTON/Silvercrest Small Cap Fund (c) | | | N | | | | N/A | | | | N/A | | | | N/A | | | | N/A | | | | 10.10 | (d) | | | 3.34 | | | | 1.41 | | | | 12/27/11 | |
| | | I | | | | N/A | | | | N/A | | | | N/A | | | | N/A | | | | 10.20 | (d) | | | 3.09 | | | | 1.16 | | | | 12/27/11 | |
ASTON/TAMRO Small Cap Fund (c) | | | N | | | | 10.70 | | | | -3.35 | | | | 3.85 | | | | 8.58 | | | | 10.64 | | | | 1.30 | | | | 1.30 | | | | 11/30/00 | |
| | | I | | | | 10.88 | | | | -3.12 | | | | 4.11 | | | | N/A | | | | 7.72 | | | | 1.05 | | | | 1.05 | | | | 01/04/05 | |
ASTON/River Road Select Value Fund (c) | | | N | | | | 9.94 | | | | 1.73 | | | | 0.89 | | | | N/A | | | | 1.21 | | | | 1.43 | | | | 1.43 | | | | 03/29/07 | |
| | | I | | | | 10.14 | | | | 2.16 | | | | N/A | | | | N/A | | | | 0.51 | | | | 1.18 | | | | 1.18 | | | | 06/28/07 | |
ASTON/River Road Small Cap Value Fund | | | N | | | | 9.02 | | | | -0.08 | | | | -0.94 | | | | N/A | | | | 5.16 | | | | 1.52 | | | | 1.52 | | | | 06/28/05 | |
| | | I | | | | 9.17 | | | | 0.15 | | | | -0.70 | | | | N/A | | | | 0.34 | | | | 1.27 | | | | 1.27 | | | | 12/13/06 | |
ASTON/River Road Independent Value Fund(c) | | | N | | | | 2.33 | | | | 1.20 | | | | N/A | | | | N/A | | | | 7.42 | | | | 1.64 | | | | 1.47 | | | | 12/31/10 | |
| | | I | | | | 2.52 | | | | N/A | | | | N/A | | | | N/A | | | | 1.01 | (d) | | | 1.39 | | | | 1.22 | | | | 06/01/11 | |
Fixed Income Funds | | | | | | | | | | | | | | | | | | | | | | | | | | | | | | | | | | | | |
ASTON/DoubleLine Core Plus Fixed Income Fund (c) | | | N | | | | 5.34 | | | | N/A | | | | N/A | | | | N/A | | | | 10.95 | (d) | | | 3.18 | | | | 0.96 | | | | 07/18/11 | |
| | | I | | | | 5.48 | | | | N/A | | | | N/A | | | | N/A | | | | 11.16 | (d) | | | 2.93 | | | | 0.71 | | | | 07/18/11 | |
ASTON/TCH Fixed Income Fund (c) | | | N | | | | 3.74 | | | | 6.90 | | | | 7.01 | | | | 5.81 | | | | 6.06 | | | | 1.15 | | | | 0.95 | | | | 12/13/93 | |
| | | I | | | | 3.94 | | | | 7.23 | | | | 7.24 | | | | 6.05 | | | | 6.47 | | | | 0.90 | | | | 0.70 | | | | 07/31/00 | |
| | | | |
| Aston Funds | | | |
| Performance Summary (unaudited) | | | As of April 30, 2012 | |
| | | | | | | | | | | | | | | | | | | | | | | | | | | | | | | | | | | | |
| | | | | | | | | Average Annual Total Returns | | | | | | | | | | | | | |
| | | Class | | | Six Month
Total
Return (a) | | | One
Year | | | Five
Year | | | Ten
Year | | | Since
Inception | | | Total
Expense
Ratio (b) | | | Net
Expense
Ratio (b) | | | Inception
Date | |
Alternative Funds | | | | | | | | | | | | | | | | | | | | | | | | | | | | | | | | | | | | |
ASTON/Lake Partners LASSO Alternatives Fund (c) | | | N | | | | 4.74 | | | | -1.61 | | | | N/A | | | | N/A | | | | 4.60 | | | | 3.07 | | | | 2.99 | | | | 03/03/10 | |
| | | I | | | | 4.88 | | | | -1.38 | | | | N/A | | | | N/A | | | | 8.54 | | | | 2.82 | | | | 2.74 | | | | 04/01/09 | |
ASTON/Dynamic Allocation Fund (c) | | | N | | | | -2.33 | | | | -5.69 | | | | N/A | | | | N/A | | | | 1.28 | | | | 1.85 | | | | 1.57 | | | | 01/10/08 | |
| | | I | | | | -2.29 | | | | -5.46 | | | | N/A | | | | N/A | | | | 2.95 | | | | 1.60 | | | | 1.32 | | | | 11/02/10 | |
ASTON/M.D. Sass Enhanced Equity Fund (c) | | | N | | | | 4.61 | | | | 5.00 | | | | N/A | | | | N/A | | | | 4.13 | | | | 1.24 | | | | 1.24 | | | | 01/15/08 | |
| | | I | | | | 4.84 | | | | 5.26 | | | | N/A | | | | N/A | | | | 8.36 | | | | 0.99 | | | | 0.99 | | | | 03/03/10 | |
ASTON/River Road Long-Short Fund (c) | | | N | | | | 5.04 | | | | N/A | | | | N/A | | | | N/A | | | | 4.20 | (d) | | | 8.70 | | | | 2.75 | | | | 05/04/11 | |
International Funds | | | | | | | | | | | | | | | | | | | | | | | | | | | | | | | | | | | | |
ASTON/Neptune International Fund (c) | | | N | | | | 3.44 | | | | -11.74 | | | | N/A | | | | N/A | | | | -6.16 | | | | 7.74 | | | | 1.28 | | | | 06/17/08 | |
| | | I | | | | 3.49 | | | | -11.57 | | | | N/A | | | | N/A | | | | -2.43 | | | | 7.49 | | | | 1.03 | | | | 08/06/07 | |
ASTON/Barings International Fund (c) | | | N | | | | 5.19 | | | | -8.28 | | | | N/A | | | | N/A | | | | 5.63 | | | | 1.69 | | | | 1.41 | | | | 03/03/10 | |
| | | I | | | | 5.33 | | | | -8.02 | | | | N/A | | | | N/A | | | | -6.58 | | | | 1.44 | | | | 1.16 | | | | 11/02/07 | |
Sector Fund | | | | | | | | | | | | | | | | | | | | | | | | | | | | | | | | | | | | |
ASTON/Harrison Street Real Estate Fund (c) | | | N | | | | 15.38 | | | | 9.52 | | | | -0.79 | | | | 10.35 | | | | 8.80 | | | | 1.69 | | | | 1.37 | | | | 12/30/97 | |
| | | I | | | | 15.56 | | | | 9.77 | | | | -0.55 | | | | N/A | | | | 5.17 | | | | 1.44 | | | | 1.12 | | | | 09/20/05 | |
Balanced Fund | | | | | | | | | | | | | | | | | | | | | | | | | | | | | | | | | | | | |
ASTON/Montag & Caldwell Balanced
Fund (c) | | | N | | | | 7.25 | | | | 6.14 | | | | 5.15 | | | | 4.22 | | | | 7.62 | | | | 1.58 | | | | 1.36 | | | | 11/02/94 | |
| | | I | | | | 7.31 | | | | 6.39 | | | | 5.35 | | | | 4.43 | | | | 3.55 | | | | 1.33 | | | | 1.11 | | | | 12/31/98 | |
The performance data quoted represents past performance. Past performance does not guarantee future results. Investment return and principal value will fluctuate so that an investor’s shares, upon redemption may be worth more or less than their original cost. Current performance may be higher or lower than the performance data quoted. For performance data current as of the most recent month-end, please visit our website at www.astonfunds.com
Performance figures do not reflect the deduction of taxes that a shareholder would pay on Fund distributions or redemptions of fund shares.
| (b) | The expense ratios presented above may vary from the expense ratios presented in other sections of this report that are based on expenses incurred during the period covered by this report. |
| (c) | Certain expenses were subsidized. If these subsidies were not in effect, the returns would have been lower. The Adviser is contractually obligated to waive management fees and/or reimburse expenses through February 28, 2013. |
| (d) | Returns are cumulative since inception and are not annualized. |
| (e) | Effective February 29, 2012, the voluntary expense limitations were removed and replaced with contractual expense limitations of 1.30% for Class N and 1.05% for Class I. |
| (f) | Effective February 29, 2012, the voluntary expense limitation was removed and replaced with a contractual expense limitation of 1.25%. |
Mid and small company stocks may be subject to a higher degree of market risk because they tend to be more volatile and less liquid. Bond and balanced funds have the same interest rate, high yield, and credit risks associated with the underlying bonds in the portfolio, all of which could reduce a fund’s value. Exchange-Traded funds (ETFs) are securities of other investment companies. An ETF seeks to track the performance of an index by holding all or a sampling, of the securities of that index. ETFs invest in many different areas of the market, each of which may involve its own element of risk. By selling covered call options, a Fund limits its opportunity to profit from an increase in the price of the underlying stock above the exercise price, but continues to bear the risk of a decline in the stock. Sector funds may be subject to a higher degree of market risk because of concentration in a specific industry sector. International investing may include the risk of social and political instability, market illiquidity and currency volatility. Hedged mutual funds use derivative instruments, short selling, leveraging and investing in commodities, commodity-linked instruments and non-U.S. companies that involve significant risks. Real estate funds are non-diversified and may be more susceptible to risk than funds that invest more broadly and may be subject to a higher degree of market risk because of changes in property values of the underlying property and defaults by borrowers.
| | | | |
Aston Funds | | | | |
| ASTON/Montag & Caldwell Growth Fund | | | April 30, 2012 | |
Schedule of Investments (unaudited) | | | | |
| | |
| | | | | | | | |
| Shares | | | | | Market
Value | |
| COMMON STOCKS—91.20% | | | | |
| | | | Consumer Discretionary – 15.82% | |
| | 300,250 | | | Amazon.com * | | $ | 69,627,975 | |
| | 1,438,600 | | | Bed Bath & Beyond * | | | 101,263,054 | |
| | 1,243,000 | | | Las Vegas Sands | | | 68,974,070 | |
| | 1,143,100 | | | McDonald’s | | | 111,395,095 | |
| | 480,000 | | | NIKE, Class B | | | 53,697,600 | |
| | 1,559,800 | | | Omnicom Group | | | 80,033,338 | |
| | 2,855,100 | | | TJX | | | 119,086,221 | |
| | | | | | | | |
| | | | | | | 604,077,353 | |
| | | | | | | | |
| | | | Consumer Staples – 21.79% | |
| | 2,317,900 | | | Coca-Cola | | | 176,902,128 | |
| | 1,233,300 | | | Colgate-Palmolive | | | 122,022,702 | |
| | 1,323,400 | | | Costco Wholesale | | | 116,684,178 | |
| | 3,887,000 | | | Kraft Foods, Class A | | | 154,974,690 | |
| | 1,574,600 | | | PepsiCo | | | 103,923,600 | |
| | 1,293,500 | | | Procter & Gamble | | | 82,318,340 | |
| | 2,200,000 | | | Unilever (Netherlands) | | | 75,570,000 | |
| | | | | | | | |
| | | | | | | 832,395,638 | |
| | | | | | | | |
| | | | Energy – 6.48% | | | | |
| | 1,474,300 | | | Cameron International * | | | 75,557,875 | |
| | 974,100 | | | Occidental Petroleum | | | 88,857,402 | |
| | 1,119,000 | | | Schlumberger | | | 82,962,660 | |
| | | | | | | | |
| | | | | | | 247,377,937 | |
| | | | | | | | |
| | | | Healthcare – 14.91% | | | | |
| | 2,797,500 | | | Abbott Laboratories | | | 173,612,850 | |
| | 1,574,500 | | | Allergan | | | 151,152,000 | |
| | 1,825,600 | | | AmerisourceBergen | | | 67,930,576 | |
| | 1,225,854 | | | Express Scripts * | | | 68,390,395 | |
| | 1,988,000 | | | Stryker | | | 108,485,160 | |
| | | | | | | | |
| | | | | | | 569,570,981 | |
| | | | | | | | |
| | | | | | | | |
| Shares | | | | | Market
Value | |
| | | | Industrials – 6.08% | | | | |
| | 5,588,300 | | | General Electric | | $ | 109,418,914 | |
| | 1,572,500 | | | United Parcel Service, Class B | | | 122,875,150 | |
| | | | | | | | |
| | | | | | | 232,294,064 | |
| | | | | | | | |
| | | | Information Technology – 23.39% | |
| | 1,476,100 | | | Accenture, Class A (Ireland) | | | 95,872,695 | |
| | 272,000 | | | Apple * | | | 158,913,280 | |
| | 3,445,500 | | | Cisco Systems | | | 69,426,825 | |
| | 1,983,600 | | | eBay * | | | 81,426,780 | |
| | 1,344,100 | | | EMC * | | | 37,917,061 | |
| | 113,100 | | | Google, Class A * | | | 68,451,513 | |
| | 1,807,600 | | | Juniper Networks * | | | 38,736,868 | |
| | 1,927,700 | | | Oracle | | | 56,655,103 | |
| | 2,380,000 | | | Qualcomm | | | 151,939,200 | |
| | 1,089,800 | | | Visa, Class A | | | 134,023,604 | |
| | | | | | | | |
| | | | | | | 893,362,929 | |
| | | | | | | | |
| | | | Materials – 2.73% | | | | |
| | 1,368,000 | | | Monsanto | | | 104,214,240 | |
| | | | | | | | |
| | | | Total Common Stocks
(Cost $2,863,206,610) | | | 3,483,293,142 | |
| | | | | | | | |
| INVESTMENT COMPANY – 5.67% | |
| | 216,621,763 | | | BlackRock Liquidity Funds TempCash Portfolio | | | 216,621,763 | |
| | | | | | | | |
| | | | Total Investment Company
(Cost $216,621,763) | | | 216,621,763 | |
| | | | | | | | |
| Total Investments – 96.87%
(Cost $3,079,828,373)** | | | 3,699,914,905 | |
| | | | | | | | |
| Net Other Assets and Liabilities –
3.13% | | | 119,396,477 | |
| | | | | | | | |
| Net Assets – 100.00% | | $ | 3,819,311,382 | |
| | | | | | | | |
| * | Non-income producing security. |
| ** | At April 30, 2012, cost is identical for book and Federal income tax purposes. |
| | | | |
Gross unrealized appreciation | | $ | 624,612,750 | |
Gross unrealized depreciation | | | (4,526,218 | ) |
| | | | |
Net unrealized appreciation | | $ | 620,086,532 | |
| | | | |
|
See accompanying Notes to Financial Statements. |
| 4 |
| |
| | | | |
Aston Funds | | | | |
| ASTON/Veredus Select Growth Fund | | | April 30, 2012 | |
Schedule of Investments (unaudited) | | | | |
| | |
| | | | | | | | |
| Shares | | | | | Market
Value | |
| COMMON STOCKS – 95.74% | | | | |
| | | | Consumer Discretionary – 19.94% | |
| | 54,425 | | | CBS, Class B | | $ | 1,815,073 | |
| | 44,250 | | | D.R. Horton | | | 723,488 | |
| | 67,975 | | | Dish Network, Class A | | | 2,173,161 | |
| | 46,300 | | | Lennar, Class A | | | 1,284,362 | |
| | 37,900 | | | Lowe’s | | | 1,192,713 | |
| | 42,025 | | | Mattel | | | 1,412,040 | |
| | 5,525 | | | Ralph Lauren | | | 951,792 | |
| | | | | | | | |
| | | | | | | 9,552,629 | |
| | | | | | | | |
| | | | Consumer Staples – 4.41% | | | | |
| | 17,225 | | | Estee Lauder, Class A | | | 1,125,653 | |
| | 14,050 | | | Herbalife (Cayman) | | | 987,996 | |
| | | | | | | | |
| | | | | | | 2,113,649 | |
| | | | | | | | |
| | | | Financials – 14.54% | | | | |
| | 27,975 | | | American Express | | | 1,684,374 | |
| | 100,000 | | | Blackstone Group | | | 1,356,000 | |
| | 32,550 | | | Comerica | | | 1,042,251 | |
| | 114,525 | | | Fifth Third Bancorp | | | 1,629,691 | |
| | 10,900 | | | Goldman Sachs Group | | | 1,255,135 | |
| | | | | | | | |
| | | | | | | 6,967,451 | |
| | | | | | | | |
| | | | Healthcare – 17.37% | | | | |
| | 9,925 | | | Biogen Idec * | | | 1,330,049 | |
| | 61,625 | | | HCA Holdings | | | 1,658,945 | |
| | 45,025 | | | Hologic * | | | 860,878 | |
| | 14,225 | | | Humana | | | 1,147,673 | |
| | 23,225 | | | Illumina * | | | 1,034,209 | |
| | 1,850 | | | Intuitive Surgical * | | | 1,069,670 | |
| | 19,400 | | | Zimmer Holdings | | | 1,220,842 | |
| | | | | | | | |
| | | | | | | 8,322,266 | |
| | | | | | | | |
| | | | | | | | |
| Shares | | | | | Market
Value | |
| | | | Industrials – 10.20% | | | | |
| | 15,875 | | | BE Aerospace * | | $ | 746,601 | |
| | 13,950 | | | Fluor | | | 805,613 | |
| | 7,875 | | | Hubbell, Class B | | | 631,890 | |
| | 58,450 | | | Quanta Services * | | | 1,292,914 | |
| | 64,425 | | | United Continental Holdings * | | | 1,412,196 | |
| | | | | | | | |
| | | | | | | 4,889,214 | |
| | | | | | | | |
| | | | Information Technology – 28.53% | |
| | 19,025 | | | Accenture, Class A (Ireland) | | | 1,235,674 | |
| | 2,100 | | | Apple * | | | 1,226,904 | |
| | 27,275 | | | eBay * | | | 1,119,639 | |
| | 37,475 | | | Intel | | | 1,064,290 | |
| | 76,700 | | | Microsoft | | | 2,455,934 | |
| | 40,400 | | | Qualcomm | | | 2,579,136 | |
| | 20,625 | | | Rackspace Hosting * | | | 1,198,106 | |
| | 17,325 | | | Teradata * | | | 1,208,939 | |
| | 12,850 | | | Visa, Class A | | | 1,580,293 | |
| | | | | | | | |
| | | | | | | 13,668,915 | |
| | | | | | | | |
| | | | Materials – 0.75% | | | | |
| | 8,450 | | | Vulcan Materials | | | 361,745 | |
| | | | | | | | |
| | | | Total Common Stocks
(Cost $41,020,514) | | | 45,875,869 | |
| | | | | | | | |
| INVESTMENT COMPANY – 6.57% | |
| | 3,149,909 | | | BlackRock Liquidity Funds TempCash Portfolio | | | 3,149,909 | |
| | | | | | | | |
| | | | Total Investment Company
(Cost $3,149,909) | | | 3,149,909 | |
| | | | | | | | |
| Total Investments – 102.31%
(Cost $44,170,423)** | | | 49,025,778 | |
| | | | | | | | |
| Net Other Assets and Liabilities – (2.31)% | | | (1,107,163 | ) |
| | | | | | | | |
| Net Assets – 100.00% | | $ | 47,918,615 | |
| | | | | | | | |
| * | Non-income producing security. |
| ** | At April 30, 2012, cost is identical for book and Federal income tax purposes. |
| | | | |
Gross unrealized appreciation | | $ | 5,504,218 | |
Gross unrealized depreciation | | | (648,863 | ) |
| | | | |
Net unrealized appreciation | | $ | 4,855,355 | |
| | | | |
| | | | |
See accompanying Notes to Financial Statements. | | | | |
| | | 5 | |
| | | | |
| | | | |
Aston Funds | | | | |
| ASTON/TAMRO Diversified Equity Fund | | | April 30, 2012 | |
Schedule of Investments (unaudited) | | | | |
| | |

| | | | | | | | |
| Shares | | | | | Market
Value | |
| COMMON STOCKS – 98.06% | | | | |
| | | | Consumer Discretionary – 16.72% | |
| | 3,108 | | | Amazon.com * | | $ | 720,745 | |
| | 17,836 | | | Arcos Dorados Holdings, Class A (Argentina) | | | 318,728 | |
| | 14,668 | | | CarMax * | | | 452,801 | |
| | 11,118 | | | GNC Holdings, Class A | | | 434,269 | |
| | 9,985 | | | Home Depot | | | 517,123 | |
| | 13,234 | | | Johnson Controls | | | 423,091 | |
| | 10,748 | | | Macy’s | | | 440,883 | |
| | 15,535 | | | Toll Brothers * | | | 394,589 | |
| | | | | | | | |
| | | | | | | 3,702,229 | |
| | | | | | | | |
| | | | Consumer Staples – 8.72% | | | | |
| | 11,373 | | | Kraft Foods, Class A | | | 453,442 | |
| | 8,052 | | | McCormick & Co (Non-Voting Shares) | | | 450,187 | |
| | 6,163 | | | Philip Morris International | | | 551,650 | |
| | 9,668 | | | United Natural Foods * | | | 476,536 | |
| | | | | | | | |
| | | | | | | 1,931,815 | |
| | | | | | | | |
| | | | Energy – 9.14% | | | | |
| | 4,860 | | | EOG Resources | | | 533,677 | |
| | 6,552 | | | Exxon Mobil | | | 565,700 | |
| | 7,497 | | | Range Resources | | | 499,750 | |
| | 13,472 | | | Southwestern Energy * | | | 425,446 | |
| | | | | | | | |
| | | | | | | 2,024,573 | |
| | | | | | | | |
| | | | Financials – 19.62% | | | | |
| | 10,360 | | | American Express | | | 623,776 | |
| | 5,420 | | | Berkshire Hathaway, Class B * | | | 436,039 | |
| | 3,530 | | | Franklin Resources | | | 443,050 | |
| | 3,809 | | | Goldman Sachs Group | | | 438,606 | |
| | 7,772 | | | Iberiabank | | | 396,916 | |
| | 13,260 | | | JPMorgan Chase | | | 569,915 | |
| | | | | | | | |
| Shares | | | | | Market
Value | |
| | | | Financials (continued) | | | | |
| | 11,404 | | | MetLife | | $ | 410,886 | |
| | 14,758 | | | Raymond James Financial | | | 540,438 | |
| | 6,813 | | | T. Rowe Price Group | | | 430,003 | |
| | 2,975 | | | Western Union | | | 54,681 | |
| | | | | | | | |
| | | | | | | 4,344,310 | |
| | | | | | | | |
| | | | Healthcare – 13.66% | | | | |
| | 6,273 | | | Advisory Board * | | | 571,847 | |
| | 5,542 | | | Allergan | | | 532,032 | |
| | 6,551 | | | Athenahealth * | | | 474,620 | |
| | 5,945 | | | DaVita * | | | 526,608 | |
| | 6,638 | | | Johnson & Johnson | | | 432,067 | |
| | 10,691 | | | Teva Pharmaceutical, SP ADR (Israel) | | | 489,006 | |
| | | | | | | | |
| | | | | | | 3,026,180 | |
| | | | | | | | |
| | | | Industrials – 13.46% | | | | |
| | 5,986 | | | AGCO * | | | 278,828 | |
| | 5,179 | | | Boeing | | | 397,747 | |
| | 13,859 | | | Cintas | | | 542,857 | |
| | 12,213 | | | Colfax * | | | 413,899 | |
| | 10,112 | | | Danaher | | | 548,273 | |
| | 6,249 | | | Fluor | | | 360,880 | |
| | 7,597 | | | Morningstar | | | 438,499 | |
| | | | | | | | |
| | | | | | | 2,980,983 | |
| | | | | | | | |
| | | | Information Technology – 13.25% | |
| | 1,655 | | | Apple * | | | 966,917 | |
| | 8,304 | | | BMC Software * | | | 342,623 | |
| | 21,323 | | | Cisco Systems | | | 429,658 | |
| | 1,754 | | | F5 Networks * | | | 234,913 | |
| | 3,917 | | | Factset Research Systems | | | 410,737 | |
| | 910 | | | Google, Class A * | | | 550,759 | |
| | | | | | | | |
| | | | | | | 2,935,607 | |
| | | | | | | | |
| | | | Materials – 3.49% | | | | |
| | 5,767 | | | Monsanto | | | 439,330 | |
| | 6,295 | | | Mosaic | | | 332,502 | |
| | | | | | | | |
| | | | | | | 771,832 | |
| | | | | | | | |
| | | | Total Common Stocks
(Cost $17,280,430) | | | 21,717,529 | |
| | | | | | | | |
| | | | | | | | |
Number of
Contracts | | | | | | |
| PURCHASED OPTIONS – 0.43% | |
| | 29 | | | Boeing - Call Strike @ $80
Exp 01/13 | | | 10,730 | |
| | 439 | | | Cisco - Call Strike @ $20
Exp 01/13 | | | 77,703 | |
| | 63 | | | Johnson & Johnson - Call Strike @ $70 Exp 01/13 | | | 3,780 | |
| | 50 | | | JPMorgan Chase - Call Strike @ $55 Exp 01/13 | | | 1,950 | |
| | | | | | | | |
| | | | Total Purchased Options
(Premiums Paid $111,357) | | | 94,163 | |
| | | | | | | | |
|
See accompanying Notes to Financial Statements. |
| 6 |
| |
| | | | |
Aston Funds | | | | |
ASTON/TAMRO Diversified Equity Fund | | | April 30, 2012 | |
Schedule of Investments (unaudited) – continued | | | | |
| | |
| | | | | | | | |
Shares | | | | | Market
Value | |
| INVESTMENT COMPANY – 1.41% | | | | |
| | 313,373 | | | BlackRock Liquidity Funds
TempCash Portfolio | | $ | 313,373 | |
| | | | | | | | |
| | | | Total Investment Company
(Cost $313,373) | | | 313,373 | |
| | | | | | | | |
| Total Investments – 99.90%
(Cost $17,705,160)** | | | 22,125,065 | |
| | | | | | | | |
| Net Other Assets and Liabilities – 0.10% | | | 23,204 | |
| | | | | | | | |
| Net Assets – 100.00% | | $ | 22,148,269 | |
| | | | | | | | |
| * | Non-income producing security. |
| ** | At April 30, 2012, cost is identical for book and Federal income tax purposes. |
| | | | |
| Gross unrealized appreciation | | $ | 4,692,198 | |
| Gross unrealized depreciation | | | (272,293 | ) |
| | | | |
| Net unrealized appreciation | | $ | 4,419,905 | |
| | | | |
| SP ADR | Sponsored American Depositary Receipt |
| | | | |
See accompanying Notes to Financial Statements. | | | | |
| | | 7 | |
| | | | |
| | | | |
Aston Funds | | | | |
ASTON/Herndon Large Cap Value Fund | | | April 30, 2012 | |
Schedule of Investments (unaudited) | | | | |
| | |
| | | | | | | | |
| Shares | | | | | Market
Value | |
| COMMON STOCKS – 96.22% | | | | |
| | | | Consumer Discretionary – 10.86% | |
| | 20,433 | | | Coach | | $ | 1,494,878 | |
| | 19,810 | | | Ross Stores | | | 1,220,098 | |
| | 42,957 | | | TJX | | | 1,791,737 | |
| | 9,568 | | | Yum! Brands | | | 695,881 | |
| | | | | | | | |
| | | | | | | 5,202,594 | |
| | | | | | | | |
| | | | Consumer Staples – 13.43% | | | | |
| | 38,150 | | | Altria Group | | | 1,228,812 | |
| | 14,155 | | | Campbell Soup | | | 478,864 | |
| | 8,128 | | | Colgate-Palmolive | | | 804,184 | |
| | 22,182 | | | Herbalife (Cayman) | | | 1,559,838 | |
| | 21,874 | | | Kellogg | | | 1,106,168 | |
| | 13,993 | | | Philip Morris International | | | 1,252,513 | |
| | | | | | | | |
| | | | | | | 6,430,379 | |
| | | | | | | | |
| | | | Energy – 20.67% | | | | |
| | 8,869 | | | Apache | | | 850,892 | |
| | 8,725 | | | Chevron | | | 929,736 | |
| | 9,177 | | | Core Laboratories (Netherlands) | | | 1,257,065 | |
| | 13,416 | | | Diamond Offshore Drilling | | | 919,667 | |
| | 19,116 | | | Exxon Mobil | | | 1,650,475 | |
| | 36,785 | | | Halliburton | | | 1,258,783 | |
| | 28,109 | | | HollyFrontier | | | 866,319 | |
| | 33,767 | | | Marathon Oil | | | 990,724 | |
| | 28,087 | | | RPC | | | 290,420 | |
| | 35,949 | | | Valero Energy | | | 887,940 | |
| | | | | | | | |
| | | | | | | 9,902,021 | |
| | | | | | | | |
| | | | Financials – 18.36% | | | | |
| | 16,853 | | | Aflac | | | 759,059 | |
| | 36,566 | | | American Capital Agency, REIT | | | 1,142,322 | |
| | 47,636 | | | Annaly Capital Management, REIT | | | 777,420 | |
| | 34,817 | | | Apartment Investment & Management, Class A, REIT | | | 945,282 | |
| | 16,920 | | | CBOE Holdings | | | 447,365 | |
| | 369,671 | | | Chimera Investment, REIT | | | 1,068,349 | |
| | 14,792 | | | Discover Financial Services | | | 501,449 | |
| | | | | | | | |
| Shares | | | | | Market
Value | |
| | | | Financials (continued) | | | | |
| | 31,072 | | | Eaton Vance | | $ | 817,194 | |
| | 65,065 | | | Federated Investors, Class B | | | 1,436,635 | |
| | 28,109 | | | Waddell & Reed Financial, Class A | | | 898,926 | |
| | | | | | | | |
| | | | | | | 8,794,001 | |
| | | | | | | | |
| | | | Healthcare – 8.42% | | | | |
| | 29,981 | | | Endo Pharmaceuticals Holdings * | | | 1,053,532 | |
| | 20,289 | | | Express Scripts * | | | 1,131,923 | |
| | 21,606 | | | Gilead Sciences * | | | 1,123,728 | |
| | 8,574 | | | Waters * | | | 721,159 | |
| | | | | | | | |
| | | | | | | 4,030,342 | �� |
| | | | | | | | |
| | | | Industrials – 8.92% | | | | |
| | 4,174 | | | Caterpillar | | | 428,962 | |
| | 21,688 | | | Copa Holdings SA, Class A (Panama) | | | 1,763,451 | |
| | 8,972 | | | Cummins | | | 1,039,227 | |
| | 11,482 | | | Lockheed Martin | | | 1,039,580 | |
| | | | | | | | |
| | | | | | | 4,271,220 | |
| | | | | | | | |
| | | | Information Technology – 10.54% | |
| | 2,696 | | | Apple * | | | 1,575,111 | |
| | 5,391 | | | International Business Machines | | | 1,116,368 | |
| | 40,928 | | | Microsoft | | | 1,310,515 | |
| | 26,977 | | | Western Digital * | | | 1,046,977 | |
| | | | | | | | |
| | | | | | | 5,048,971 | |
| | | | | | | | |
| | | | Materials – 5.02% | | | | |
| | 5,062 | | | CF Industries Holdings | | | 977,270 | |
| | 16,071 | | | Cliffs Natural Resources | | | 1,000,580 | |
| | 11,154 | | | Freeport-McMoRan Copper & Gold | | | 427,198 | |
| | | | | | | | |
| | | | | | | 2,405,048 | |
| | | | | | | | |
| | | | Total Common Stocks
(Cost $43,535,833) | | | 46,084,576 | |
| | | | | | | | |
| INVESTMENT COMPANY – 3.57% | | | | |
| | 1,709,736 | | | BlackRock Liquidity Funds TempCash Portfolio | | | 1,709,736 | |
| | | | | | | | |
| | | | Total Investment Company
(Cost $1,709,736) | | | 1,709,736 | |
| | | | | | | | |
| Total Investments – 99.79%
(Cost $45,245,569)** | | | 47,794,312 | |
| | | | | | | | |
| Net Other Assets and Liabilities – 0.21% | | | 102,977 | |
| | | | | | | | |
| | Net Assets – 100.00% | | $ | 47,897,289 | |
| | | | | | | | |
| * | Non-income producing security. |
| ** | At April 30, 2012, cost is identical for book and Federal income tax purposes. |
| | | | |
| Gross unrealized appreciation | | $ | 3,317,743 | |
| Gross unrealized depreciation | | | (769,000 | ) |
| | | | |
| Net unrealized appreciation | | $ | 2,548,743 | |
| | | | |
| REIT | Real Estate Investment Trust |
|
See accompanying Notes to Financial Statements. |
| 8 |
| |
| | | | |
Aston Funds | | | | |
ASTON/Cornerstone Large Cap Value Fund | | | April 30, 2012 | |
Schedule of Investments (unaudited) | | | | |
| | |
| | | | | | | | |
| Shares | | | | | Market
Value | |
| COMMON STOCKS – 97.13% | | | | |
| | | | Consumer Discretionary – 7.12% | |
| | 16,850 | | | GameStop, Class A | | $ | 383,506 | |
| | 27,875 | | | Mattel | | | 936,600 | |
| | 3,520 | | | VF | | | 535,216 | |
| | | | | | | | |
| | | | | | | 1,855,322 | |
| | | | | | | | |
| | | | Consumer Staples – 3.39% | |
| | 14,975 | | | Wal-Mart Stores | | | 882,177 | |
| | | | | | | | |
| | | | Energy – 11.17% | | | | |
| | 10,375 | | | Chevron | | | 1,105,560 | |
| | 18,012 | | | Hess | | | 939,146 | |
| | 12,100 | | | Royal Dutch Shell PLC, ADR
(United Kingdom) | | | 865,634 | |
| | | | | | | | |
| | | | | | | 2,910,340 | |
| | | | | | | | |
| | | | Financials – 14.39% | | | | |
| | 10,925 | | | ACE (Switzerland) | | | 829,972 | |
| | 17,400 | | | Capital One Financial | | | 965,352 | |
| | 30,350 | | | Citigroup | | | 1,002,764 | |
| | 54,950 | | | Morgan Stanley | | | 949,536 | |
| | | | | | | | |
| | | | | | | 3,747,624 | |
| | | | | | | | |
| | | | Healthcare – 17.30% | | | | |
| | 18,475 | | | Bristol-Myers Squibb | | | 616,511 | |
| | 21,200 | | | Eli Lilly | | | 877,468 | |
| | 26,200 | | | Merck | | | 1,028,088 | |
| | 22,550 | | | Sanofi, ADR (France) | | | 860,959 | |
| | 24,550 | | | Teva Pharmaceutical, SP ADR
(Israel) | | | 1,122,917 | |
| | | | | | | | |
| | | | | | | 4,505,943 | |
| | | | | | | | |
| | | | Industrials – 8.74% | | | | |
| | 12,425 | | | General Dynamics | | | 838,687 | |
| | 7,700 | | | Lockheed Martin | | | 697,158 | |
| | 8,450 | | | Parker Hannifin | | | 740,981 | |
| | | | | | | | |
| | | | | | | 2,276,826 | |
| | | | | | | | |
| | | | | | | | |
| Shares | | | | | Market
Value | |
| | | | Information Technology – 30.34% | |
| | 1,950 | | | Apple * | | $ | 1,139,268 | |
| | 14,550 | | | eBay * | | | 597,277 | |
| | 1,725 | | | Google, Class A * | | | 1,044,022 | |
| | 29,375 | | | Hewlett-Packard | | | 727,325 | |
| | 23,200 | | | Intel | | | 658,880 | |
| | 3,455 | | | International Business Machines | | | 715,461 | |
| | 33,000 | | | Microsoft | | | 1,056,660 | |
| | 30,550 | | | Oracle | | | 897,865 | |
| | 27,500 | | | Western Digital * | | | 1,067,275 | |
| | | | | | | | |
| | | | | | | 7,904,033 | |
| | | | | | | | |
| | | | Materials – 2.37% | | | | |
| | 27,850 | | | Vale SA, SP ADR (Brazil) | | | 618,270 | |
| | | | | | | | |
| | | | Telecommunication Services – 2.31% | |
| | 18,325 | | | AT&T | | | 603,076 | |
| | | | | | | | |
| | | | Total Common Stocks
(Cost $23,573,733) | | | 25,303,611 | |
| | | | | | | | |
| INVESTMENT COMPANY – 2.91% | | | | |
| | 757,761 | | | BlackRock Liquidity Funds TempCash Portfolio | | | 757,761 | |
| | | | | | | | |
| | | | Total Investment Company
(Cost $757,761) | | | 757,761 | |
| | | | | | | | |
| Total Investments – 100.04%
(Cost $24,331,494)** | | | 26,061,372 | |
| | | | | | | | |
| Net Other Assets and Liabilities – (0.04)% | | | (11,220 | ) |
| | | | | | | | |
| Net Assets – 100.00% | | $ | 26,050,152 | |
| | | | | | | | |
| * | Non-income producing security. |
| ** | At April 30, 2012, cost is identical for book and Federal income tax purposes. |
| | | | |
Gross unrealized appreciation | | $ | 2,151,665 | |
Gross unrealized depreciation | | | (421,787 | ) |
| | | | |
Net unrealized appreciation | | $ | 1,729,878 | |
| | | | |
| ADR | American Depositary Receipt |
| SP ADR | Sponsored American Depositary Receipt |
| | | | |
See accompanying Notes to Financial Statements. | | | | |
| | | 9 | |
| | | | |
| | | | |
Aston Funds | | | | |
ASTON/River Road Dividend All Cap Value Fund | | | April 30, 2012 | |
Schedule of Investments (unaudited) | | | | |
| | |
| | | | | | | | |
| Shares | | | | | Market
Value | |
| COMMON STOCKS – 95.25% | | | | |
| | | | Consumer Discretionary – 13.55% | |
| | 459,225 | | | American Greetings, Class A | | $ | 7,347,600 | |
| | 331,960 | | | Bob Evans Farms | | | 12,694,150 | |
| | 75,455 | | | Cracker Barrel Old Country Store | | | 4,340,172 | |
| | 227,770 | | | Darden Restaurants | | | 11,406,722 | |
| | 198,805 | | | Genuine Parts | | | 12,878,588 | |
| | 242,275 | | | Hasbro | | | 8,901,184 | |
| | 544,030 | | | Hillenbrand | | | 11,391,988 | |
| | 141,160 | | | Meredith | | | 4,069,643 | |
| | 450,175 | | | National CineMedia | | | 6,433,001 | |
| | 643,270 | | | Regal Entertainment Group, Class A | | | 8,754,905 | |
| | 254,580 | | | Target | | | 14,750,365 | |
| | 437,790 | | | Thomson Reuters | | | 13,054,898 | |
| | | | | | | | |
| | | | | | | 116,023,216 | |
| | | | | | | | |
| | | | Consumer Staples – 17.69% | |
| | 270,615 | | | Dr Pepper Snapple Group | | | 10,981,557 | |
| | 512,510 | | | General Mills | | | 19,931,514 | |
| | 240,170 | | | Kimberly-Clark | | | 18,846,140 | |
| | 169,195 | | | McCormick & Co (Non-Voting Shares) | | | 9,459,692 | |
| | 156,580 | | | Molson Coors Brewing, Class B | | | 6,510,596 | |
| | 276,410 | | | PepsiCo | | | 18,243,060 | |
| | 170,790 | | | Procter & Gamble | | | 10,869,076 | |
| | 630,350 | | | Sara Lee | | | 13,892,914 | |
| | 106,940 | | | Smucker (J.M.) | | | 8,515,632 | |
| | 552,155 | | | Sysco | | | 15,957,280 | |
| | 166,735 | | | Wal-Mart Stores | | | 9,822,359 | |
| | 242,155 | | | Walgreen | | | 8,489,954 | |
| | | | | | | | |
| | | | | | | 151,519,774 | |
| | | | | | | | |
| | | | Energy – 5.79% | | | | |
| | 852,980 | | | BreitBurn Energy Partners LP | | | 16,232,209 | |
| | 152,215 | | | Chevron | | | 16,220,030 | |
| | 186,020 | | | ConocoPhillips | | | 13,324,613 | |
| | 259,870 | | | Nordic American Tankers (Bermuda) | | | 3,773,312 | |
| | | | | | | | |
| | | | | | | 49,550,164 | |
| | | | | | | | |
| | | | | | | | |
| Shares | | | | | Market
Value | |
| | | | Financials – 12.27% | | | | |
| | 61,900 | | | BlackRock | | $ | 11,858,802 | |
| | 237,395 | | | Chubb | | | 17,346,453 | |
| | 14,450 | | | CME Group | | | 3,841,099 | |
| | 196,959 | | | Commerce Bancshares | | | 7,898,056 | |
| | 368,815 | | | Compass Diversified Holdings | | | 5,414,204 | |
| | 327,575 | | | OneBeacon Insurance Group, Class A (Bermuda) | | | 4,661,392 | |
| | 175,890 | | | PartnerRe (Bermuda) | | | 12,245,462 | |
| | 180,870 | | | PNC Financial Services Group | | | 11,995,298 | |
| | 670,545 | | | Sabra Health Care, REIT | | | 11,224,923 | |
| | 186,865 | | | Safety Insurance Group | | | 7,446,570 | |
| | 245,935 | | | Tower Group | | | 5,307,277 | |
| | 179,975 | | | U.S. Bancorp | | | 5,789,796 | |
| | | | | | | | |
| | | | | | | 105,029,332 | |
| | | | | | | | |
| | | | Healthcare – 7.94% | | | | |
| | 239,475 | | | AstraZeneca PLC, SP ADR (United Kingdom) | | | 10,512,953 | |
| | 90,905 | | | Becton, Dickinson | | | 7,131,497 | |
| | 190,450 | | | Johnson & Johnson | | | 12,396,391 | |
| | 110,491 | | | Landauer | | | 5,825,086 | |
| | 281,270 | | | Medtronic | | | 10,744,514 | |
| | 276,927 | | | Owens & Minor | | | 8,097,345 | |
| | 579,580 | | | Pfizer | | | 13,289,769 | |
| | | | | | | | |
| | | | | | | 67,997,555 | |
| | | | | | | | |
| | | | Industrials – 15.49% | | | | |
| | 83,990 | | | 3M | | | 7,505,346 | |
| | 391,345 | | | ABM Industries | | | 9,110,512 | |
| | 101,250 | | | General Dynamics | | | 6,834,375 | |
| | 58,145 | | | Grupo Aeroportuario del Sureste SAB de CV, ADR (Mexico) | | | 4,762,657 | |
| | 250,540 | | | Iron Mountain | | | 7,608,900 | |
| | 157,365 | | | Lockheed Martin | | | 14,247,827 | |
| | 260,765 | | | Norfolk Southern | | | 19,017,591 | |
| | 203,185 | | | Raytheon | | | 11,000,436 | |
| | 288,055 | | | Republic Services | | | 7,884,065 | |
| | 230,750 | | | United Parcel Service, Class B | | | 18,030,805 | |
| | 126,530 | | | United Technologies | | | 10,329,909 | |
| | 475,895 | | | Waste Management | | | 16,275,609 | |
| | | | | | | | |
| | | | | | | 132,608,032 | |
| | | | | | | | |
| | | | Information Technology – 8.28% | |
| | 371,745 | | | Automatic Data Processing | | | 20,676,456 | |
| | 156,430 | | | CA | | | 4,132,881 | |
| | 863,540 | | | Intel | | | 24,524,536 | |
| | 58,380 | | | j2 Global | | | 1,508,066 | |
| | 367,730 | | | Microsoft | | | 11,774,715 | |
| | 267,800 | | | Paychex | | | 8,296,444 | |
| | | | | | | | |
| | | | | | | 70,913,098 | |
| | | | | | | | |
| | | | Materials – 2.50% | | | | |
| | 236,920 | | | Bemis | | | 7,673,839 | |
| | 55,500 | | | Newmont Mining | | | 2,644,575 | |
| | 282,255 | | | Nucor | | | 11,067,219 | |
| | | | | | | | |
| | | | | | | 21,385,633 | |
| | | | | | | | |
| | | | Telecommunication Services – 5.80% | |
| | 120,715 | | | Atlantic Tele-Network | | | 4,111,552 | |
| | 456,802 | | | Telefonica Brasil SA ADR (Brazil) | | | 13,005,153 | |
| | 355,365 | | | Verizon Communications | | | 14,349,639 | |
| | 654,455 | | | Vodafone Group, SP ADR
(United Kingdom) | | | 18,213,483 | |
| | | | | | | | |
| | | | | | | 49,679,827 | |
| | | | | | | | |
|
See accompanying Notes to Financial Statements. |
| 10 |
| |
| | | | |
Aston Funds | | | | |
ASTON/River Road Dividend All Cap Value Fund | | | April 30, 2012 | |
Schedule of Investments (unaudited) – continued | | | | |
| | |
| | | | | | | | |
| Shares | | | | | Market
Value | |
| | | | Utilities – 5.94% | | | | |
| | 401,720 | | | Avista | | $ | 10,621,477 | |
| | 572,120 | | | Duke Energy | | | 12,260,532 | |
| | 113,390 | | | Entergy | | | 7,433,848 | |
| | 219,695 | | | Southern | | | 10,092,788 | |
| | 288,025 | | | Unisource Energy | | | 10,484,110 | |
| | | | | | | | |
| | | | | | | 50,892,755 | |
| | | | | | | | |
| | | | Total Common Stocks
(Cost $723,694,616) | | | 815,599,386 | |
| | | | | | | | |
| INVESTMENT COMPANY – 4.37% | | | | |
| | 37,398,099 | | | BlackRock Liquidity Funds TempCash Portfolio | | | 37,398,099 | |
| | | | | | | | |
| | | | Total Investment Company
(Cost $37,398,099) | | | 37,398,099 | |
| | | | | | | | |
| Total Investments – 99.62%
(Cost $761,092,715)* | | | 852,997,485 | |
| | | | | | | | |
| | Net Other Assets and Liabilities – 0.38% | | | 3,230,381 | |
| | | | | | | | |
| | Net Assets – 100.00% | | $ | 856,227,866 | |
| | | | | | | | |
| * | At April 30, 2012, cost is identical for book and Federal income tax purposes. |
| | | | |
Gross unrealized appreciation | | $ | 96,768,745 | |
Gross unrealized depreciation | | | (4,863,975 | ) |
| | | | |
Net unrealized appreciation | | $ | 91,904,770 | |
| | | | |
| ADR | American Depositary Receipt |
| REIT | Real Estate Investment Trust |
| SP | ADR Sponsored American Depositary Receipt |
| | | | |
See accompanying Notes to Financial Statements. | | | | |
| | | 11 | |
| | | | |
| | | | |
Aston Funds | | | | |
ASTON/Fairpointe Mid Cap Fund | | | April 30, 2012 | |
Schedule of Investments (unaudited) | | | | |
| | |
| | | | | | | | |
| Shares | | | | | Market
Value | |
| COMMON STOCKS – 99.21% | | | | |
| | | | Consumer Discretionary – 23.16% | |
| | 7,610,078 | | | Belo, Class A | | $ | 51,291,927 | |
| | 782,300 | | | BorgWarner * | | | 61,832,993 | |
| | 6,875,800 | | | Gannett | | | 95,023,556 | |
| | 7,725,464 | | | H&R Block | | | 113,564,321 | |
| | 8,315,468 | | | Interpublic Group | | | 98,205,677 | |
| | 1,792,600 | | | Mattel | | | 60,231,360 | |
| | 1,590,655 | | | McGraw-Hill | | | 78,212,506 | |
| | 13,417,354 | | | New York Times, Class A * | | | 84,663,504 | |
| | 1,458,297 | | | Scholastic | | | 44,550,973 | |
| | | | | | | | |
| | | | | | | 687,576,817 | |
| | | | | | | | |
| | | | Consumer Staples – 4.23% | |
| | 763,360 | | | Bunge | | | 49,236,720 | |
| | 1,838,186 | | | Molson Coors Brewing, Class B | | | 76,431,774 | |
| | | | | | | | |
| | | | | | | 125,668,494 | |
| | | | | | | | |
| | | | Energy – 4.95% | | | | |
| | 1,436,299 | | | Compagnie Generale de | | | | |
| | | | Geophysique-Veritas, SP ADR (France) * | | | 41,307,959 | |
| | 1,501,829 | | | Denbury Resources * | | | 28,594,824 | |
| | 1,638,092 | | | FMC Technologies * | | | 76,990,324 | |
| | | | | | | | |
| | | | | | | 146,893,107 | |
| | | | | | | | |
| | | | Financials – 6.79% | | | | |
| | 1,941,528 | | | Cincinnati Financial | | | 69,157,227 | |
| | 2,294,585 | | | Eaton Vance | | | 60,347,586 | |
| | 1,515,688 | | | Northern Trust | | | 72,131,592 | |
| | | | | | | | |
| | | | | | | 201,636,405 | |
| | | | | | | | |
| | | | Healthcare – 16.76% | | | | |
| | 20,813,236 | | | Boston Scientific * | | | 130,290,857 | |
| | 2,040,919 | | | Charles River Laboratories * | | | 72,513,852 | |
| | 2,553,268 | | | Forest Laboratories * | | | 88,930,324 | |
| | 2,316,081 | | | Hospira * | | | 81,340,765 | |
| | | | | | | | |
| Shares | | | | | Market
Value | |
| | | | Healthcare (continued) | | | | |
| | 1,933,345 | | | Lincare Holdings | | $ | 47,173,618 | |
| | 1,218,853 | | | Varian Medical Systems * | | | 77,299,657 | |
| | | | | | | | |
| | | | | | | 497,549,073 | |
| | | | | | | | |
| | | | Industrials – 11.65% | | | | |
| | 1,599,200 | | | Chicago Bridge & Iron (Netherlands) | | | 71,036,464 | |
| | 1,886,300 | | | Con-way | | | 61,304,750 | |
| | 1,382,444 | | | Manpower | | | 58,892,114 | |
| | 10,435,200 | | | Southwest Airlines | | | 86,403,456 | |
| | 2,897,500 | | | Werner Enterprises | | | 68,438,950 | |
| | | | | | | | |
| | | | | | | 346,075,734 | |
| | | | | | | | |
| | | | Information Technology – 27.29% | |
| | 2,987,464 | | | Akamai Technologies * | | | 97,391,326 | |
| | 2,063,951 | | | CA | | | 54,529,585 | |
| | 868,400 | | | Cree * | | | 26,833,560 | |
| | 1,366,900 | | | Harris | | | 62,248,626 | |
| | 2,288,398 | | | Itron * | | | 93,366,638 | |
| | 2,571,100 | | | Jabil Circuit | | | 60,292,295 | |
| | 2,682,350 | | | Lexmark International Group, Class A | | | 80,738,735 | |
| | 928,804 | | | Mentor Graphics * | | | 13,421,218 | |
| | 1,883,786 | | | Molex | | | 51,973,656 | |
| | 1,819,864 | | | Molex, Class A | | | 41,674,886 | |
| | 3,210,500 | | | Nuance Communications * | | | 78,464,620 | |
| | 4,333,108 | | | Unisys * | | | 80,855,795 | |
| | 1,763,759 | | | Zebra Technologies, Class A * | | | 68,416,212 | |
| | | | | | | | |
| | | | | | | 810,207,152 | |
| | | | | | | | |
| | | | Materials – 4.38% | | | | |
| | 528,400 | | | FMC | | | 58,361,780 | |
| | 1,009,800 | | | Sigma-Aldrich | | | 71,594,820 | |
| | | | | | | | |
| | | | | | | 129,956,600 | |
| | | | | | | | |
| | | | Total Common Stocks
(Cost $2,5 07,724,478) | | | 2,945,563,382 | |
| | | | | | | | |
| | INVESTMENT COMPANY – 1.16% | |
| | 34,447,522 | | | BlackRock Liquidity Funds TempCash Portfolio | | | 34,447,522 | |
| | | | | | | | |
| | | | Total Investment Company
(Cost $34,447,522) | | | 34,447,522 | |
| | | | | | | | |
| Total Investments – 100.37%
(Cost $2,542,172,000)** | | | 2,980,010,904 | |
| | | | | | | | |
| | Net Other Assets and Liabilities – (0.37)% | | | (11,020,298 | ) |
| | | | | | | | |
| | Net Assets – 100.00% | | $ | 2,968,990,606 | |
| | | | | | | | |
| * | Non-income producing security. |
| ** | At April 30,2012, cost is identical for book and Federal income tax purposes. |
| | | | |
Gross unrealized appreciation | | $ | 588,500,574 | |
Gross unrealized depreciation | | | (150,661,670 | ) |
| | | | |
Net unrealized appreciation | | $ | 437,838,904 | |
| | | | |
| SP ADR | Sponsored American Depositary Recceipt |
|
See accompanying Notes to Financial Statements. |
| 12 |
| |
| | | | |
Aston Funds | | | | |
ASTON/Montag & Caldwell Mid Cap Growth Fund | | | April 30, 2012 | |
Schedule of Investments (unaudited) | | | | |
| | |
| | | | | | | | |
| Shares | | | | | Market
Value | |
| COMMON STOCKS – 96.13% | | | | |
| | | | Consumer Discretionary – 21.51% | |
| | 1,410 | | | Bed Bath & Beyond * | | $ | 99,250 | |
| | 1,220 | | | BorgWarner * | | | 96,429 | |
| | 1,740 | | | Dick’s Sporting Goods | | | 88,044 | |
| | 1,550 | | | Harman International Industries | | | 76,849 | |
| | 5,120 | | | LKQ * | | | 171,264 | |
| | 1,770 | | | O’Reilly Automotive * | | | 186,664 | |
| | 3,570 | | | Omnicom Group | | | 183,177 | |
| | 530 | | | Panera Bread, Class A * | | | 83,698 | |
| | 1,320 | | | PVH | | | 117,216 | |
| | 530 | | | Ralph Lauren | | | 91,303 | |
| | 1,750 | | | TJX | | | 72,992 | |
| | 850 | | | Tractor Supply | | | 83,649 | |
| | 1,820 | | | Warnaco Group (The) * | | | 96,387 | |
| | | | | | | | |
| | | | | | | 1,446,922 | |
| | | | | | | | |
| | | | Consumer Staples – 5.87% | | | | |
| | 2,950 | | | Church & Dwight | | | 149,860 | |
| | 2,450 | | | McCormick & Co (Non Voting Shares) | | | 136,979 | |
| | 1,260 | | | Mead Johnson Nutrition | | | 107,806 | |
| | | | | | | | |
| | | | | | | 394,645 | |
| | | | | | | | |
| | | | Energy – 7.23% | | | | |
| | 2,470 | | | Cameron International * | | | 126,587 | |
| | 840 | | | Core Laboratories (Netherlands) | | | 115,063 | |
| | 2,660 | | | Oceaneering International | | | 137,336 | |
| | 1,620 | | | SM Energy | | | 107,098 | |
| | | | | | | | |
| | | | | | | 486,084 | |
| | | | | | | | |
| | | | Financials – 4.73% | | | | |
| | 1,180 | | | IntercontinentalExchange * | | | 156,987 | |
| | 4,410 | | | MSCI, Class A * | | | 161,362 | |
| | | | | | | | |
| | | | | | | 318,349 | |
| | | | | | | | |
| | | | | | |
Shares | | | | Market
Value | |
| | Healthcare – 12.37% | | | | |
| 3,810 | | Dentsply International | | $ | 156,439 | |
| 1,410 | | Edwards Lifesciences * | | | 116,988 | |
| 1,480 | | Henry Schein * | | | 113,575 | |
| 800 | | Perrigo | | | 83,920 | |
| 2,830 | | Quality Systems | | | 105,842 | |
| 2,030 | | Varian Medical Systems * | | | 128,743 | |
| 1,500 | | Waters * | | | 126,165 | |
| | | | | | |
| | | | | 831,672 | |
| | | | | | |
| | Industrials – 21.01% | | | | |
| 2,800 | | AMETEK | | | 140,924 | |
| 3,610 | | Donaldson | | | 125,123 | |
| 3,450 | | Expeditors International Washington | | | 138,000 | |
| 1,650 | | Fastenal | | | 77,253 | |
| 1,750 | | J.B. Hunt Transport Services | | | 96,827 | |
| 3,500 | | Jacobs Engineering Group * | | | 153,405 | |
| 1,310 | | Joy Global | | | 92,709 | |
| 5,770 | | Robert Half International | | | 171,946 | |
| 1,290 | | Roper Industries | | | 131,451 | |
| 1,500 | | Stericycle * | | | 129,900 | |
| 3,180 | | Verisk Analytics, Class A * | | | 155,661 | |
| | | | | | |
| | | | | 1,413,199 | |
| | | | | | |
| | Information Technology – 19.94% | | | | |
| 3,940 | | Altera | | | 140,146 | |
| 2,470 | | Amphenol, Class A | | | 143,606 | |
| 2,330 | | ANSYS * | | | 156,273 | |
| 1,360 | | F5 Networks * | | | 182,145 | |
| 1,150 | | FactSet Research Systems | | | 120,589 | |
| 2,220 | | Fiserv * | | | 156,044 | |
| 7,870 | | Juniper Networks * | | | 168,654 | |
| 5,410 | | NVIDIA * | | | 70,330 | |
| 7,190 | | Sapient | | | 86,064 | |
| 1,680 | | Teradata * | | | 117,230 | |
| | | | | | |
| | | | | 1,341,081 | |
| | | | | | |
| | Materials – 3.47% | | | | |
| 3,660 | | Ecolab | | | 233,105 | |
| | | | | | |
| | Total Common Stocks
(Cost $5,148,106) | | | 6,465,057 | |
| | | | | | |
| |
INVESTMENT COMPANY – 4.81% | | | | |
| 323,290 | | BlackRock Liquidity Funds TempCash Portfolio | | | 323,290 | |
| | | | | | |
| | Total Investment Company
(Cost $323,290) | | | 323,290 | |
| | | | | | |
Total Investments – 100.94%
(Cost $5,471,396)** | | | 6,788,347 | |
Net Other Assets and Liabilities – (0.94)% | | | (63,180 | ) |
| | | | | | |
Net Assets – 100.00% | | $ | 6,725,167 | |
| | | | | | |
| * | Non-income producing security. |
| ** | At April 30, 2012, cost is identical for book and Federal income tax purposes. |
| | | | |
Gross unrealized appreciation. | | $ | 1,378,686 | |
Gross unrealized depreciation. | | | (61,735 | ) |
| | | | |
Net unrealized appreciation | | $ | 1,316,951 | |
| | | | |
| | | | |
See accompanying Notes to Financial Statements. | | | | |
| | | 13 | |
| | | | |
| | | | |
Aston Funds | | | | |
ASTON/Cardinal Mid Cap Value Fund | | | April 30, 2012 | |
Schedule of Investments (unaudited) | | | | |
| | |
| | | | | | | | |
| | | | | | Market | |
| Shares | | | | | Value | |
| COMMON STOCKS – 94.81% | | | | |
| | | | Consumer Discretionary – 12.28% | | | | |
| | 750 | | | HSN | | $ | 29,025 | |
| | 410 | | | John Wiley & Sons, Class A | | | 18,528 | |
| | 1,500 | | | Six Flags Entertainment | | | 71,865 | |
| | 935 | | | Stanley Black & Decker | | | 68,405 | |
| | 1,874 | | | Virgin Media | | | 46,025 | |
| | | | | | | | |
| | | | | | | 233,848 | |
| | | | | | | | |
| | | | Consumer Staples – 3.60% | | | | |
| | 860 | | | Smucker (J.M.) | | | 68,482 | |
| | | | | | | | |
| | | | Energy – 6.77% | | | | |
| | 1,820 | | | Chesapeake Energy | | | 33,561 | |
| | 440 | | | Concho Resources * | | | 47,159 | |
| | 1,095 | | | World Fuel Services | | | 48,246 | |
| | | | | | | | |
| | | | | | | 128,966 | |
| | | | | | | | |
| | | | Financials – 18.23% | | | | |
| | 1,780 | | | Ares Capital | | | 28,551 | |
| | 6,450 | | | CapitalSource | | | 41,602 | |
| | 1,035 | | | Cash America International | | | 48,386 | |
| | 3,330 | | | CYS Investments, REIT | | | 45,721 | |
| | 650 | | | Entertainment Properties Trust, REIT | | | 31,193 | |
| | 1,430 | | | Hatteras Financial, REIT | | | 41,656 | |
| | 2,020 | | | Nelnet, Class A | | | 52,156 | |
| | 1,260 | | | Starwood Property Trust, REIT | | | 26,296 | |
| | 500 | | | T. Rowe Price Group | | | 31,558 | |
| | | | | | | | |
| | | | | | | 347,119 | |
| | | | | | | | |
| | | | Healthcare – 3.33% | | | | |
| | 311 | | | Henry Schein * | | | 23,866 | |
| | 630 | | | Teleflex | | | 39,482 | |
| | | | | | | | |
| | | | | | | 63,348 | |
| | | | | | | | |
| | | | | | |
| | | | | Market | |
Shares | | | | Value | |
| | Industrials – 12.81% | | | | |
| 1,480 | | Atlas Air Worldwide Holdings * | | $ | 68,154 | |
| 1,001 | | Equifax | | | 45,866 | |
| 3,000 | | KAR Auction Services * | | | 55,200 | |
| 1,156 | | Teledyne Technologies * | | | 74,701 | |
| | | | | | |
| | | | | 243,921 | |
| | | | | | |
| | Information Technology – 27.63% | | | | |
| 1,250 | | Atmel * | | | 11,087 | |
| 1,220 | | Broadridge Financial Solutions | | | 28,316 | |
| 3,640 | | Convergys * | | | 48,667 | |
| 760 | | Fiserv * | | | 53,420 | |
| 860 | | Global Payments | | | 39,930 | |
| 380 | | Harris | | | 17,305 | |
| 1,270 | | IAC/InterActiveCorp | | | 61,151 | |
| 1,000 | | InterDigital | | | 27,720 | |
| 555 | | Intuit | | | 32,173 | |
| 2,085 | | j2 Global | | | 53,856 | |
| 1,150 | | Skyworks Solutions * | | | 31,211 | |
| 2,100 | | ValueClick * | | | 44,478 | |
| 3,130 | | Western Union | | | 57,529 | |
| 1,240 | | Yahoo! * | | | 19,270 | |
| | | | | | |
| | | | | 526,113 | |
| | | | | | |
| | Materials – 8.87% | | | | |
| 300 | | Albemarle | | | 19,590 | |
| 610 | | FMC | | | 67,375 | |
| 1,870 | | Silgan Holdings | | | 82,037 | |
| | | | | | |
| | | | | 169,002 | |
| | | | | | |
| | Telecommunication Services – 1.29% | |
| 2,183 | | Windstream | | | 24,537 | |
| | | | | | |
| | Total Common Stocks
(Cost $1,445,921) | | | 1,805,336 | |
| | | | | | |
INVESTMENT COMPANY – 5.09% | | | | |
| 96,914 | | BlackRock Liquidity Funds
TempCash Portfolio | | | 96,914 | |
| | | | | | |
| | Total Investment Company
(Cost $96,914) | | | 96,914 | |
| | | | | | |
Total Investments – 99.90%
(Cost $1,542,835)** | | | 1,902,250 | |
| | | | | | |
Net Other Assets and Liabilities – 0.10% | | | 1,840 | |
| | | | | | |
Net Assets – 100.00% | | $ | 1,904,090 | |
| | | | | | |
| * | Non-income producing security. |
| ** | At April 30, 2012, cost is identical for book and Federal income tax purposes. |
| | | | |
Gross unrealized appreciation | | $ | 400,352 | |
Gross unrealized depreciation | | | (40,937 | ) |
| | | | |
Net unrealized appreciation | | $ | 359,415 | |
| | | | |
| REIT | Real Estate Investment Trust |
|
See accompanying Notes to Financial Statements. |
| 14 |
| |
| | | | |
Aston Funds | | | | |
ASTON/Veredus Small Cap Growth Fund (formerly the ASTON/Veredus Aggressive Growth Fund) | | | April 30, 2012 | |
Schedule of Investments (unaudited) | | | | |
| | |
| | | | | | | | |
| | | | | | Market | |
| Shares | | | | | Value | |
| COMMON STOCKS – 96.81% | | | | |
| | | | Consumer Discretionary – 22.78% | |
| | 34,708 | | | Amerigon * | | $ | 496,324 | |
| | 13,651 | | | Caribou Coffee * | | | 224,013 | |
| | 3,874 | | | DSW, Class A | | | 217,951 | |
| | 21,294 | | | Francesca’s Holdings * | | | 667,567 | |
| | 7,924 | | | Genesco * | | | 594,300 | |
| | 21,350 | | | MDC Holdings | | | 600,149 | |
| | 14,945 | | | Monro Muffler Brake | | | 616,631 | |
| | 29,673 | | | Pier 1 Imports | | | 509,782 | |
| | 11,915 | | | Select Comfort * | | | 344,105 | |
| | 34,275 | | | Sinclair Broadcast Group, Class A | | | 352,347 | |
| | 30,092 | | | Sonic Automotive, Class A | | | 506,147 | |
| | 9,832 | | | Steven Madden * | | | 424,841 | |
| | 7,090 | | | Ulta Salon Cosmetics & Fragrance | | | 625,196 | |
| | | | | | | | |
| | | | | | | 6,179,353 | |
| | | | | | | | |
| | | | Consumer Staples – 4.02% | | | | |
| | 7,760 | | | Elizabeth Arden * | | | 302,485 | |
| | 11,932 | | | Hain Celestial Group * | | | 564,384 | |
| | 13,550 | | | Schiff Nutrition International * | | | 222,898 | |
| | | | | | | | |
| | | | | | | 1,089,767 | |
| | | | | | | | |
| | | | Energy – 1.02% | | | | |
| | 20,325 | | | Matrix Service * | | | 277,436 | |
| | | | | | | | |
| | | | Financials – 8.92% | | | | |
| | 23,950 | | | Apollo Global Management LLC, Class A | | | 307,518 | |
| | 9,000 | | | Banner | | | 197,550 | |
| | 17,999 | | | Calamos Asset Management, Class A | | | 232,547 | |
| | 21,200 | | | Old National Bancorp | | | 271,784 | |
| | 12,750 | | | Piper Jaffray * | | | 309,188 | |
| | 6,692 | | | Portfolio Recovery Associates * | | | 460,543 | |
| | 9,005 | | | Post Properties, REIT | | | 438,544 | |
| | 29,666 | | | Strategic Hotels & Resorts, REIT * | | | 202,025 | |
| | | | | | | | |
| | | | | | | 2,419,699 | |
| | | | | | | | |
| | | | | | | | |
| | | | | | Market | |
| Shares | | | | | Value | |
| | | | Healthcare – 15.34% | | | | |
| | 7,075 | | | ABIOMED * | | $ | 172,134 | |
| | 57,376 | | | Akorn * | | | 695,970 | |
| | 12,892 | | | Cepheid * | | | 495,182 | |
| | 8,575 | | | Cynosure * | | | 177,245 | |
| | 22,521 | | | Exact Sciences * | | | 242,551 | |
| | 55,925 | | | Health Management Associates, Class A * | | | 402,660 | |
| | 21,642 | | | Healthstream * | | | 496,035 | |
| | 10,225 | | | PerkinElmer | | | 282,210 | |
| | 13,280 | | | Questcor Pharmaceuticals * | | | 596,272 | |
| | 24,785 | | | Vivus * | | | 600,293 | |
| | | | | | | | |
| | | | | | | 4,160,552 | |
| | | | | | | | |
| | | | Industrials – 16.34% | | | | |
| | 9,350 | | | Acacia Research - Acacia Technologies * | �� | | 383,350 | |
| | 6,575 | | | Azz | | | 339,993 | |
| | 70,225 | | | Builders FirstSource * | | | 292,838 | |
| | 30,869 | | | Dycom Industries * | | | 722,026 | |
| | 14,950 | | | Granite Construction | | | 416,208 | |
| | 11,200 | | | Hexcel * | | | 306,656 | |
| | 29,465 | | | MasTec * | | | 512,396 | |
| | 19,828 | | | Mistras Group * | | | 465,363 | |
| | 10,675 | | | Team * | | | 316,300 | |
| | 65,900 | | | US Airways Group * | | | 676,134 | |
| | | | | | | | |
| | | | | | | 4,431,264 | |
| | | | | | | | |
| | | | Information Technology – 21.48% | |
| | 16,185 | | | ACI Worldwide * | | | 645,134 | |
| | 21,950 | | | Allot Communications * | | | 538,653 | |
| | 14,900 | | | Anaren * | | | 268,796 | |
| | 11,494 | | | Cadence Design Systems * | | | 134,134 | |
| | 32,575 | | | Callidus Software * | | | 257,994 | |
| | 9,150 | | | Cirrus Logic * | | | 250,527 | |
| | 25,550 | | | Emulex * | | | 221,774 | |
| | 18,512 | | | Heartland Payment Systems | | | 564,061 | |
| | 9,950 | | | JDS Uniphase * | | | 120,893 | |
| | 25,802 | | | LivePerson * | | | 409,736 | |
| | 13,519 | | | Manhattan Associates * | | | 677,978 | |
| | 29,100 | | | Move * | | | 253,170 | |
| | 18,125 | | | Sanmina-SCI * | | | 161,313 | |
| | 33,150 | | | ServiceSource International * | | | 549,627 | |
| | 77,772 | | | Silicon Image * | | | 466,632 | |
| | 6,400 | | | Tangoe Inc * | | | 131,072 | |
| | 25,760 | | | TeleNav * | | | 174,395 | |
| | | | | | | | |
| | | | | | | 5,825,889 | |
| | | | | | | | |
| | | | Materials – 6.91% | | | | |
| | 12,800 | | | Cabot | | | 552,064 | |
| | 16,225 | | | Eagle Materials | | | 571,445 | |
| | 11,325 | | | Kronos Worldwide | | | 268,856 | |
| | 36,950 | | | Zagg * | | | 481,459 | |
| | | | | | | | |
| | | | | | | 1,873,824 | |
| | | | | | | | |
| | | | Total Common Stocks
(Cost $22,726,111) | | | 26,257,784 | |
| | | | | | | | |
| WARRANTS – 0% | | | | |
| | | | Energy – 0.00% | | | | |
| | 4,906 | | | Magnum Hunter Resources, Expiration 10/14/13 | | | 0 | |
| | | | | | | | |
| | | | Total Warrants
(Cost $0) | | | 0 | |
| | | | | | | | |
| | | | |
See accompanying Notes to Financial Statements. | | | | |
| | | 15 | |
| | | | |
| | | | |
Aston Funds | | | | |
ASTON/Veredus Small Cap Growth Fund (formerly the ASTON/Veredus Aggressive Growth Fund) | | | April 30, 2012 | |
Schedule of Investments (unaudited) – continued | | | | |
| | |
| | | | | | |
Shares | | | | Market
Value | |
INVESTMENT COMPANY – 4.30% | | | | |
1,167,274 | | BlackRock Liquidity Funds TempCash Portfolio | | $ | 1,167,274 | |
| | | | | | |
| | Total Investment Company
(Cost $1,167,274) | | | 1,167,274 | |
| | | | | | |
Total Investments – 101.11%
(Cost $23,893,385)** | | | 27,425,058 | |
| | | | | | |
Net Other Assets and Liabilities – (1.11)% | | | (300,163 | ) |
| | | | | | |
Net Assets – 100.00% | | $ | 27,124,895 | |
| | | | | | |
| * | Non-income producing security. |
| ** | At April 30, 2012, cost is identical for book and Federal income tax purposes. |
| | | | |
Gross unrealized appreciation | | $ | 4,166,223 | |
Gross unrealized depreciation | | | (634,550 | ) |
| | | | |
Net unrealized appreciation | | $ | 3,531,673 | |
| | | | |
| REIT | Real Estate Investment Trust |
|
See accompanying Notes to Financial Statements. |
| 16 |
| |
| | | | |
Aston Funds | | | | |
ASTON Small Cap Growth Fund (formerly the ASTON/Crosswind Small Cap Growth Fund) | | | April 30, 2012 | |
Schedule of Investments (unaudited) | | | | |
| | |
| | | | | | | | |
| | | | | | Market | |
| Shares | | | | | Value | |
| COMMON STOCKS – 95.94% | | | | |
| | | | Consumer Discretionary – 11.08% | | | | |
| | 2,422 | | | G-III Apparel Group * | | $ | 65,031 | |
| | 1,180 | | | GNC Holdings, Class A | | | 46,091 | |
| | 3,438 | | | Jarden | | | 144,155 | |
| | 9,182 | | | Knology * | | | 178,590 | |
| | 55,008 | | | Office Depot * | | | 167,224 | |
| | 15,139 | | | OfficeMax * | | | 70,396 | |
| | 6,339 | | | Shutterfly * | | | 197,270 | |
| | 2,549 | | | Wolverine World Wide | | | 106,931 | |
| | | | | | | | |
| | | | | | | 975,688 | |
| | | | | | | | |
| | | | Energy – 4.03% | | | | |
| | 594 | | | CARBO Ceramics | | | 49,949 | |
| | 2,177 | | | Carrizo Oil & Gas * | | | 61,043 | |
| | 927 | | | Dril-Quip * | | | 62,471 | |
| | 18,273 | | | Magnum Hunter Resources * | | | 113,475 | |
| | 2,046 | | | Oasis Petroleum * | | | 67,661 | |
| | | | | | | | |
| | | | | | | 354,599 | |
| | | | | | | | |
| | | | Financials – 3.70% | | | | |
| | 11,136 | | | DFC Global * | | | 194,657 | |
| | 3,308 | | | Ezcorp, Class A * | | | 88,621 | |
| | 2,116 | | | Walter Investment Management REIT * | | | 42,807 | |
| | | | | | | | |
| | | | | | | 326,085 | |
| | | | | | | | |
| | | | Healthcare – 22.90% | | | | |
| | 16,075 | | | Allscripts Healthcare Solutions * | | | 178,111 | |
| | 10,090 | | | DexCom * | | | 98,781 | |
| | 7,467 | | | Hanger Orthopedic Group * | | | 175,848 | |
| | 48,068 | | | Health Management Associates, Class A * | | | 346,090 | |
| | 21,912 | | | HealthSouth * | | | 490,610 | |
| | 1,902 | | | HeartWare International * | | | 148,280 | |
| | 2,402 | | | Incyte * | | | 54,477 | |
| | 1,427 | | | Onyx Pharmaceuticals * | | | 64,943 | |
| | 35,541 | | | Tenet Healthcare * | | | 184,458 | |
| | | | | | | | |
| | | | | | Market | |
| Shares | | | | | Value | |
| | | | Health Care (continued) | | | | |
| | 7,758 | | | Threshold Pharmaceuticals * | | $ | 56,478 | |
| | 13,541 | | | Vanguard Health Systems * | | | 120,244 | |
| | 3,644 | | | Volcano * | | | 98,935 | |
| | | | | | | | |
| | | | | | | 2,017,255 | |
| | | | | | | | |
| | | | Industrials – 22.19% | | | | |
| | 5,300 | | | ACCO Brands * | | | 55,650 | |
| | 5,793 | | | DigitalGlobe * | | | 71,080 | |
| | 6,082 | | | Encore Capital Group * | | | 144,143 | |
| | 1,059 | | | Genesee & Wyoming, Class A * | | | 57,091 | |
| | 21,269 | | | Geo Group * | | | 440,481 | |
| | 8,714 | | | Hexcel * | | | 238,589 | |
| | 11,069 | | | Kelly Services, Class A | | | 154,855 | |
| | 1,496 | | | Navistar International * | | | 50,789 | |
| | 2,413 | | | Portfolio Recovery Associates * | | | 166,063 | |
| | 8,325 | | | RailAmerica * | | | 192,974 | |
| | 3,870 | | | Triumph Group | | | 243,114 | |
| | 3,174 | | | TrueBlue * | | | 54,783 | |
| | 2,051 | | | Woodward | | | 85,301 | |
| | | | | | | | |
| | | | | | | 1,954,913 | |
| | | | | | | | |
| | | | Information Technology – 27.80% | | | | |
| | 4,826 | | | ADTRAN | | | 147,290 | |
| | 4,908 | | | Ariba * | | | 187,486 | |
| | 2,118 | | | Aruba Networks * | | | 44,732 | |
| | 5,024 | | | Aspen Technology * | | | 99,375 | |
| | 14,242 | | | AVG Technologies (Netherlands) * | | | 197,252 | |
| | 7,131 | | | Fairchild Semiconductor International * | | | 101,046 | |
| | 3,044 | | | Finisar * | | | 50,287 | |
| | 2,341 | | | Fusion-io * | | | 60,047 | |
| | 1,981 | | | Infoblox * | | | 40,412 | |
| | 19,143 | | | Internap Network Services * | | | 134,767 | |
| | 8,079 | | | Kenexa * | | | 263,941 | |
| | 9,875 | | | Microsemi * | | | 212,510 | |
| | 2,988 | | | Millennial Media * | | | 56,682 | |
| | 13,182 | | | OCZ Technology Group * | | | 77,774 | |
| | 2,957 | | | Polycom * | | | 39,239 | |
| | 4,207 | | | Riverbed Technology * | | | 83,004 | |
| | 1,705 | | | Semtech * | | | 46,478 | |
| | 697 | | | Sourcefire * | | | 35,540 | |
| | 2,859 | | | Vantiv, Class A * | | | 64,385 | |
| | 4,719 | | | VeriFone Systems * | | | 224,813 | |
| | 7,704 | | | Virtusa * | | | 116,253 | |
| | 6,275 | | | Vocus * | | | 81,136 | |
| | 1,327 | | | Wright Express * | | | 84,689 | |
| | | | | | | | |
| | | | | | | 2,449,138 | |
| | | | | | | | |
| | | | Materials – 1.48% | | | | |
| | 2,486 | | | Kaiser Aluminum | | | 130,689 | |
| | | | | | | | |
| | | | Telecommunication Services – 2.76% | | | | |
| | 11,167 | | | tw telecom * | | | 243,217 | |
| | | | | | | | |
| | | | Total Common Stocks
(Cost $8,070,208) | | | 8,451,584 | |
| | | | | | | | |
| WARRANTS – 0% | | | | |
| | | | Energy – 0.00% | | | | |
| | 1,517 | | | Magnum Hunter Resources, Expiration 10/14/13 | | | 0 | |
| | | | | | | | |
| | | | Total Warrants
(Cost $0) | | | 0 | |
| | | | | | | | |
| | | | |
See accompanying Notes to Financial Statements. | | | | |
| | | 17 | |
| | | | |
| | | | |
Aston Funds | | | | |
ASTON Small Cap Growth Fund (formerly the ASTON/Crosswind Small Cap Growth Fund) | | | April 30, 2012 | |
Schedule of Investments (unaudited) – continued | | | | |
| | |
| | | | | | | | |
| Shares | | | | | Market
Value | |
| INVESTMENT COMPANY – 3.85% | | | | |
| | 339,107 | | | BlackRock Liquidity Funds TempCash Portfolio | | $ | 339,107 | |
| | | | | | | | |
| | | | Total Investment Company
(Cost $339,107) | | | 339,107 | |
| | | | | | | | |
| Total Investments – 99.79%
(Cost $8,409,315)** | | | 8,790,691 | |
| | | | | | | | |
| Net Other Assets and Liabilities – 0.21% | | | 18,190 | |
| | | | | | | | |
| Net Assets – 100.00% | | $ | 8,808,881 | |
| | | | | | | | |
| * | Non-income producing security. |
| ** | At April 30, 2012, cost is identical for book and Federal income tax purposes. |
| | | | |
Gross unrealized appreciation | | $ | 824,795 | |
Gross unrealized depreciation | | | (443,419 | ) |
| | | | |
Net unrealized appreciation | | $ | 381,376 | |
| | | | |
| REIT | Real Estate Investment Trust |
|
See accompanying Notes to Financial Statements. |
| 18 |
| |
| | | | |
Aston Funds | | | | |
Silvercrest Small Cap Fund | | | April 30, 2012 | |
Schedule of Investments (unaudited) | | | | |
| | |
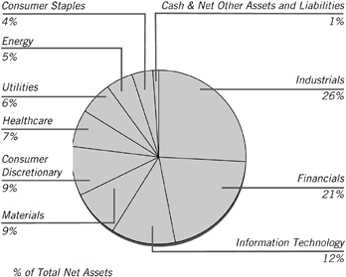
| | | | | | | | |
Shares | | Market
Value | |
| COMMON STOCKS – 98.77% | | | | |
| | | | Consumer Discretionary – 8.95% | | | |
| | 4,742 | | | AFC Enterprises * | | $ | 80,993 | |
| | 1,747 | | | Core-Mark Holding | | | 67,434 | |
| | 2,665 | | | Drew Industries * | | | 79,364 | |
| | 2,725 | | | Maidenform Brands * | | | 62,212 | |
| | 2,053 | | | Matthews International , Class A | | | 61,590 | |
| | | | | | | | |
| | | | | | | 351,593 | |
| | | | | | | | |
| | | | Consumer Staples – 4.03% | | | | |
| | 1,434 | | | J & J Snack Foods | | | 80,390 | |
| | 1,194 | | | Lancaster Colony | | | 77,861 | |
| | | | | | | | |
| | | | | | | 158,251 | |
| | | | | | | | |
| | | | Energy – 5.08% | | | | |
| | 2,239 | | | Rosetta Resources * | | | 112,555 | |
| | 2,875 | | | Swift Energy * | | | 86,969 | |
| | | | | | | | |
| | | | | | | 199,524 | |
| | | | | | | | |
| | | | Financials – 21.09% | | | | |
| | 4,910 | | | Duff & Phelps, Class A | | | 78,069 | |
| | 1,998 | | | EastGroup Properties, REIT | | | 100,499 | |
| | 5,408 | | | FirstMerit | | | 90,854 | |
| | 4,994 | | | Horace Mann Educators | | | 87,645 | |
| | 1,699 | | | Iberiabank | | | 86,768 | |
| | 2,983 | | | Independent Bank/Rockland MA | | | 83,733 | |
| | 1,524 | | | Mid-America Apartment Communities, REIT | | | 103,739 | |
| | 1,872 | | | Prosperity Bancshares | | | 87,329 | |
| | 3,758 | | | Protective Life | | | 109,959 | |
| | | | | | | | |
| | | | | | | 828,595 | |
| | | | | | | | |
| | | | Healthcare – 6.66% | | | | |
| | 1,237 | | | Analogic | | | 84,376 | |
| | 1,524 | | | ICU Medical * | | | 79,995 | |
| | 2,233 | | | Invacare | | | 35,393 | |
| | 1,379 | | | West Pharmaceutical Services | | | 61,917 | |
| | | | | | | | |
| | | | | | | 261,681 | |
| | | | | | | | |
| | | | | | | | |
Shares | | Market
Value | |
| | | | Industrials – 25.92% | | | | |
| | 2,263 | | | Albany International, Class A | | $ | 54,493 | |
| | 3,775 | | | Altra Holdings * | | | 69,007 | |
| | 2,023 | | | Applied Industrial Technologies | | | 79,484 | |
| | 2,358 | | | Astec Industries * | | | 73,782 | |
| | 1,123 | | | Cubic | | | 51,916 | |
| | 2,936 | | | EMCOR Group | | | 86,084 | |
| | 2,767 | | | Hexcel * | | | 75,760 | |
| | 2,329 | | | Mine Safety Appliances | | | 98,889 | |
| | 2,491 | | | Mistras Group * | | | 58,464 | |
| | 1,230 | | | TAL International Group | | | 50,811 | |
| | 1,410 | | | Teledyne Technologies * | | | 91,114 | |
| | 1,356 | | | Tennant | | | 60,071 | |
| | 3,277 | | | Thermon Group Holdings * | | | 72,815 | |
| | 4,429 | | | US Ecology | | | 96,021 | |
| | | | | | | | |
| | | | | | | 1,018,711 | |
| | | | | | | | |
| | | | Information Technology – 11.69% | | | | |
| | 2,449 | | | ACI Worldwide * | | | 97,617 | |
| | 2,587 | | | FEI * | | | 129,790 | |
| | 1,645 | | | Littelfuse | | | 103,092 | |
| | 2,395 | | | MKS Instruments | | | 66,222 | |
| | 673 | | | Plexus * | | | 21,785 | |
| | 1,237 | | | Scansource * | | | 40,771 | |
| | | | | | | | |
| | | | | | | 459,277 | |
| | | | | | | | |
| | | | Materials – 9.48% | | | | |
| | 2,064 | | | A Schulman | | | 50,795 | |
| | 1,872 | | | HB Fuller | | | 61,589 | |
| | 1,567 | | | Innophos Holdings | | | 77,049 | |
| | 4,543 | | | PH Glatfelter | | | 70,780 | |
| | 1,483 | | | Schnitzer Steel Industries, Class A | | | 59,127 | |
| | 1,429 | | | Sensient Technologies | | | 53,087 | |
| | | | | | | | |
| | | | | | | 372,427 | |
| | | | | | | | |
| | | | Utilities – 5.87% | | | | |
| | 1,692 | | | MGE Energy | | | 77,392 | |
| | 3,169 | | | Portland General Electric | | | 81,855 | |
| | 2,083 | | | UIL Holdings | | | 71,593 | |
| | | | | | | | |
| | | | | | | 230,840 | |
| | | | | | | | |
| | | | Total Common Stocks
(Cost $3,787,344) | | | 3,880,899 | |
| | | | | | | | |
| INVESTMENT COMPANY – 1.52% | | | | |
| | 59,880 | | | BlackRock Liquidity Funds TempCash Portfolio | | | 59,880 | |
| | | | | | | | |
| | | | Total Investment Company
(Cost $59,880) | | | 59,880 | |
| | | | | | | | |
| Total Investments – 100.29%
(Cost $3,847,224)** | | | 3,940,779 | |
| | | | | | | | |
| Net Other Assets and Liabilities – (0.29)% | | | (11,308 | ) |
| | | | | | | | |
| Net Assets – 100.00% | | $ | 3,929,471 | |
| | | | | | | | |
| * | Non-income producing security. |
| ** | At April 30, 2012, cost is identical for book and Federal income tax purposes. |
| | | | |
| Gross unrealized appreciation | | $181,795 |
| Gross unrealized depreciation | | (88,240) |
| | | | |
| Net unrealized appreciation | | $93,555 |
| | | | |
| REIT | Real Estate Investment Trust |
| | | | |
See accompanying Notes to Financial Statements. | | | | |
| | | 19 | |
| | | | |
| | | | |
Aston Funds | | | | |
ASTON/TAMRO Small Cap Fund | | | April 30, 2012 | |
Schedule of Investments (unaudited) | | | | |
| | |
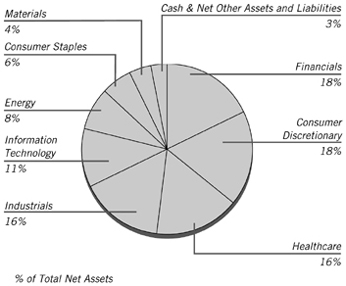
| | | | | | | | |
Shares | | | | | Market
Value | |
| COMMON STOCKS – 96.71% | | | | |
| | | | Consumer Discretionary – 17.91% | |
| | 423,002 | | | BJ’s Restaurants * | | $ | 18,269,456 | |
| | 1,320,620 | | | Chico’s FAS | | | 20,284,723 | |
| | 467,275 | | | Coinstar * | | | 29,340,197 | |
| | 1,882,857 | | | EW Scripps (The),
Class A *(a) | | | 17,246,970 | |
| | 1,123,893 | | | Grand Canyon Education * | | | 19,544,499 | |
| | 487,006 | | | Harman International Industries | | | 24,145,757 | |
| | 772,320 | | | MDC Holdings | | | 21,709,915 | |
| | 564,610 | | | Red Robin Gourmet Burgers * | | | 20,133,993 | |
| | 1,236,174 | | | Texas Roadhouse | | | 21,324,002 | |
| | | | | | | | |
| | | | | | | 191,999,512 | |
| | | | | | | | |
| | | | Consumer Staples – 5.72% | | | | |
| | 325,481 | | | Fresh Market * | | | 16,654,863 | |
| | 352,729 | | | TreeHouse Foods * | | | 20,285,445 | |
| | 494,941 | | | United Natural Foods * | | | 24,395,642 | |
| | | | | | | | |
| | | | | | | 61,335,950 | |
| | | | | | | | |
| | | | Energy – 7.57% | | | | |
| | 359,816 | | | Atwood Oceanics * | | | 15,950,643 | |
| | 1,481,992 | | | Comstock Resources * | | | 26,038,599 | |
| | 308,212 | | | Contango Oil & Gas * | | | 16,723,583 | |
| | 843,446 | | | Global Geophysical Services * | | | 8,071,778 | |
| | 1,561,353 | | | Precision Drilling (Canada) * | | | 14,411,288 | |
| | | | | | | | |
| | | | | | | 81,195,891 | |
| | | | | | | | |
| | | | Financials – 18.49% | | | | |
| | 720,475 | | | Bank of the Ozarks | | | 22,262,678 | |
| | 1,046,315 | | | East West Bancorp | | | 23,824,593 | |
| | 1,612,707 | | | Glacier Bancorp | | | 24,029,334 | |
| | 454,571 | | | Iberiabank | | | 23,214,941 | |
| | 940,903 | | | LaSalle Hotel Properties, REIT | | | 27,671,957 | |
| | 637,268 | | | Stifel Financial * | | | 23,209,301 | |
| | 565,736 | | | UMB Financial | | | 27,183,615 | |
| | 836,941 | | | Waddell & Reed Financial, Class A | | | 26,765,373 | |
| | | | | | | | |
| | | | | | | 198,161,792 | |
| | | | | | | | |
| | | | | | | | |
Shares | | | | | Market
Value | |
| | | | Healthcare – 16.16% | | | | |
| | 324,795 | | | Advisory Board * | | $ | 29,608,312 | |
| | 332,548 | | | AMERIGROUP * | | | 20,538,165 | |
| | 396,810 | | | Analogic | | | 27,066,410 | |
| | 379,657 | | | Athenahealth * | | | 27,506,150 | |
| | 1,373,293 | | | DexCom * | | | 13,444,539 | |
| | 2,730,719 | | | Health Management Associates, Class A * | | | 19,661,177 | |
| | 345,947 | | | Teleflex | | | 21,680,498 | |
| | 313,743 | | | United Therapeutics * | | | 13,726,256 | |
| | | | | | | | |
| | | | | | | 173,231,507 | |
| | | | | | | | |
| | | | Industrials – 16.14% | | | | |
| | 788,207 | | | Aerovironment * | | | 19,169,194 | |
| | 356,077 | | | Chicago Bridge & Iron | | | | |
| | | | (Netherlands) | | | 15,816,940 | |
| | 962,709 | | | Colfax * | | | 32,626,208 | |
| | 588,087 | | | Corporate Executive Board | | | 24,329,159 | |
| | 393,767 | | | Forward Air | | | 13,301,449 | |
| | 313,671 | | | Franklin Electric | | | 15,730,601 | |
| | 373,177 | | | Morningstar | | | 21,539,776 | |
| | 701,331 | | | Terex * | | | 15,878,134 | |
| | 188,115 | | | Wabtec | | | 14,631,585 | |
| | | | | | | | |
| | | | | | | 173,023,046 | |
| | | | | | | | |
| | | | Information Technology – 11.03% | |
| | 680,263 | | | Acme Packet * | | | 19,094,983 | |
| | 1,344,614 | | | Ceragon Networks (Israel) *(a) | | | 12,437,680 | |
| | 424,671 | | | CommVault Systems * | | | 22,112,619 | |
| | 1,555,344 | | | Ixia * | | | 19,597,334 | |
| | 623,367 | | | Netgear * | | | 23,999,630 | |
| | 476,106 | | | SeaChange International * | | | 3,913,591 | |
| | 71,609 | | | VASCO Data Security International * | | | 557,834 | |
| | 795,913 | | | Websense * | | | 16,507,236 | |
| | | | | | | | |
| | | | | | | 118,220,907 | |
| | | | | | | | |
| | | | Materials – 3.69% | | | | |
| | 201,590 | | | Royal Gold | | | 12,490,516 | |
| | 423,779 | | | Westlake Chemical | | | 27,100,667 | |
| | | | | | | | |
| | | | | | | 39,591,183 | |
| | | | | | | | |
| | | | Total Common Stocks
(Cost $780,834,525) | | | 1,036,759,788 | |
| | | | | | | | |
| INVESTMENT COMPANY – 2.92% | |
| | 31,299,969 | | | BlackRock Liquidity Funds TempCash Portfolio | | | 31,299,969 | |
| | | | | | | | |
| | | | Total Investment Company
(Cost $31,299,969) | | | 31,299,969 | |
| | | | | | | | |
| Total Investments – 99.63%
(Cost $812,134,494)** | | | 1,068,059,757 | |
| | | | | | | | |
| Net Other Assets and Liabilities – 0.37% | | | 3,980,649 | |
| | | | | | | | |
| Net Assets – 100.00% | | $ | 1,072,040,406 | |
| | | | | | | | |
| * | Non-income producing security. |
| ** | At April 30, 2012, cost is identical for book and Federal income tax purposes. |
| | | | |
Gross unrealized appreciation | | $ | 284,300,938 | |
Gross unrealized depreciation | | | (28,375,675 | ) |
| | | | |
Net unrealized appreciation | | $ | 255,925,263 | |
| | | | |
|
See accompanying Notes to Financial Statements. |
| 20 |
| |
| | | | |
Aston Funds | | | | |
ASTON/TAMRO Small Cap Fund | | | April 30, 2012 | |
Schedule of Investments (unaudited) – continued | | | | |
| | |
| (a) | These securities have been determined by the Subadviser to be illiquid securities. At April 30, 2012, these securities amounted to $29,684,650 or 2.77% of net assets. |
| REIT | Real Estate Investment Trust |
| | | | |
See accompanying Notes to Financial Statements. | | | | |
| | | 21 | |
| | | | |
| | | | |
Aston Funds | | | | |
ASTON/River Road Select Value Fund | | | April 30, 2012 | |
Schedule of Investments (unaudited) | | | | |
| | |
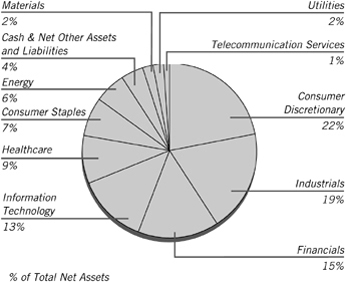
| | | | | | | | |
| Shares | | | | | Market
Value | |
| COMMON STOCKS – 96.31% | | | | |
| | | | Consumer Discretionary – 22.09% | |
| | 23,940 | | | Abercrombie & Fitch, Class A | | $ | 1,201,070 | |
| | 148,680 | | | Ascena Retail Group * | | | 3,044,966 | |
| | 23,930 | | | Ascent Capital Group, Class A * | | | 1,232,395 | |
| | 142,880 | | | Big Lots * | | | 5,235,123 | |
| | 73,940 | | | Bob Evans Farms | | | 2,827,466 | |
| | 47,020 | | | Cracker Barrel Old Country Store | | | 2,704,590 | |
| | 108,050 | | | DreamWorks Animation SKG, Class A * | | | 1,945,980 | |
| | 95,610 | | | Fred’s, Class A | | | 1,369,135 | |
| | 49,080 | | | Iconix Brand Group * | | | 752,887 | |
| | 151,320 | | | Madison Square Garden, Class A * | | | 5,442,980 | |
| | 113,820 | | | Rent-A-Center | | | 3,893,782 | |
| | 75,100 | | | Service Corp International | | | 869,658 | |
| | 50,460 | | | True Religion Apparel | | | 1,370,494 | |
| | 37,960 | | | WMS Industries * | | | 930,400 | |
| | | | | | | | |
| | | | | | | 32,820,926 | |
| | | | | | | | |
| | | | Consumer Staples – 7.43% | | | | |
| | 56,310 | | | Constellation Brands, Class A * | | | 1,216,296 | |
| | 147,420 | | | Harris Teeter Supermarkets | | | 5,597,537 | |
| | 39,400 | | | Industrias Bachoco, SP ADR (Mexico) | | | 813,610 | |
| | 33,396 | | | J & J Snack Foods | | | 1,872,180 | |
| | 55,770 | | | Village Super Market, Class A | | | 1,539,252 | |
| | | | | | | | |
| | | | | | | 11,038,875 | |
| | | | | | | | |
| | | | Energy – 6.08% | | | | |
| | 41,160 | | | Cloud Peak Energy * | | | 633,452 | |
| | 66,500 | | | Endeavour International * | | | 829,920 | |
| | 35,900 | | | Energen | | | 1,880,442 | |
| | 136,209 | | | Miller Energy Resources * | | | 739,615 | |
| | 78,670 | | | Nordic American Tankers (Bermuda) | | | 1,142,288 | |
| | 46,570 | | | Patterson-UTI Energy | | | 753,037 | |
| | 22,200 | | | Resolute Energy * | | | 235,542 | |
| | 58,350 | | | Rex Energy * | | | 613,259 | |
| | | | | | | | |
| Shares | | | | | Market
Value | |
| | | | Energy (continued) | | | | |
| | 139,980 | | | Tetra Technologies * | | $ | 1,219,226 | |
| | 108,940 | | | Vaalco Energy * | | | 988,086 | |
| | | | | | | | |
| | | | | | | 9,034,867 | |
| | | | | | | | |
| | | | Financials – 15.33% | | | | |
| | 7,765 | | | Alleghany * | | | 2,662,618 | |
| | 122,185 | | | Alterra Capital Holdings (Bahamas) | | | 2,923,887 | |
| | 46,100 | | | BGC Partners, Class A | | | 321,317 | |
| | 11,373 | | | Capital Southwest | | | 1,088,624 | |
| | 19,449 | | | Commerce Bancshares | | | 779,905 | |
| | 13,560 | | | FirstService (Canada) * | | | 370,730 | |
| | 80,700 | | | Hilltop Holdings * | | | 639,951 | |
| | 21,760 | | | Navigators Group * | | | 1,033,600 | |
| | 24,090 | | | Oppenheimer Holdings, Class A | | | 410,975 | |
| | 35,760 | | | PartnerRe (Bermuda) | | | 2,489,611 | |
| | 27,670 | | | SEI Investments | | | 558,657 | |
| | 32,270 | | | Tower Group | | | 696,387 | |
| | 76,320 | | | W. R. Berkley | | | 2,874,211 | |
| | 11,346 | | | White Mountains Insurance Group | | | 5,933,958 | |
| | | | | | | | |
| | | | | | | 22,784,431 | |
| | | | | | | | |
| | | | Healthcare – 8.62% | | | | |
| | 20,190 | | | Chemed | | | 1,218,265 | |
| | 58,740 | | | Ensign Group | | | 1,568,945 | |
| | 38,710 | | | Hanger Orthopedic Group * | | | 911,620 | |
| | 43,610 | | | Hill-Rom Holdings | | | 1,415,145 | |
| | 71,160 | | | ICU Medical * | | | 3,735,188 | |
| | 26,630 | | | Owens & Minor | | | 778,661 | |
| | 101,250 | | | STERIS | | | 3,180,263 | |
| | | | | | | | |
| | | | | | | 12,808,087 | |
| | | | | | | | |
| | | | Industrials – 18.60% | | | | |
| | 67,340 | | | ABM Industries | | | 1,567,675 | |
| | 112,900 | | | Aircastle (Bermuda) | | | 1,371,735 | |
| | 16,970 | | | Allegiant Travel * | | | 997,157 | |
| | 87,950 | | | Brink’s | | | 2,233,930 | |
| | 23,500 | | | Cubic | | | 1,086,405 | |
| | 122,290 | | | Dolan * | | | 979,543 | |
| | 101,680 | | | Equifax | | | 4,658,978 | |
| | 57,700 | | | G & K Services, Class A | | | 1,896,022 | |
| | 242,080 | | | Geo Group * | | | 5,013,477 | |
| | 53,910 | | | Insperity | | | 1,470,126 | |
| | 48,050 | | | John Bean Technologies | | | 768,320 | |
| | 80,160 | | | Korn/Ferry International * | | | 1,294,584 | |
| | 38,289 | | | Standard Parking * | | | 729,788 | |
| | 58,820 | | | Unifirst | | | 3,573,903 | |
| | | | | | | | |
| | | | | | | 27,641,643 | |
| | | | | | | | |
| | | | Information Technology – 13.20% | |
| | 124,160 | | | Convergys | | | 1,660,019 | |
| | 48,840 | | | CSG Systems International * | | | 703,296 | |
| | 89,990 | | | Daktronics | | | 732,519 | |
| | 83,860 | | | DST Systems | | | 4,694,483 | |
| | 178,490 | | | Ingram Micro, Class A * | | | 3,473,415 | |
| | 40,990 | | | Ituran Location and Control (Israel) | | | 550,906 | |
| | 25,630 | | | j2 Global | | | 662,023 | |
| | 41,190 | | | Mantech International, Class A | | | 1,294,190 | |
| | 128,590 | | | NeuStar, Class A * | | | 4,674,247 | |
| | 110,310 | | | Smart Technologies, Class A (Canada) * | | | 279,084 | |
| | 37,730 | | | Total System Services | | | 887,410 | |
| | | | | | | | |
| | | | | | | 19,611,592 | |
| | | | | | | | |
|
See accompanying Notes to Financial Statements. |
| 22 |
| |
| | | | |
Aston Funds | | | | |
ASTON/River Road Select Value Fund | | | April 30, 2012 | |
Schedule of Investments (unaudited) – continued | | | | |
| | |
| | | | | | | | |
| Shares | | | | | Market
Value | |
| | | | Materials – 2.30% | | | | |
| | 24,070 | | | Aptargroup | | $ | 1,312,056 | |
| | 23,130 | | | Stepan | | | 2,101,592 | |
| | | | | | | | |
| | | | | | | 3,413,648 | |
| | | | | | | | |
| | | | Telecommunication Services – 0.76% | | | | |
| | 32,970 | | | Atlantic Tele-Network | | | 1,122,958 | |
| | | | | | | | |
| | | | Utilities – 1.90% | | | | |
| | 59,330 | | | Avista | | | 1,568,685 | |
| | 27,890 | | | UGI | | | 813,830 | |
| | 11,960 | | | Unisource Energy | | | 435,344 | |
| | | | | | | | |
| | | | | | | 2,817,859 | |
| | | | | | | | |
| | | | Total Common Stocks
(Cost $122,328,373) | | | 143,094,886 | |
| | | | | | | | |
| | INVESTMENT COMPANY – 3.87% | | | | |
| | 5,757,114 | | | BlackRock Liquidity Funds TempCash Portfolio | | | 5,757,114 | |
| | | | | | | | |
| | | | Total Investment Company
(Cost $5,757,114) | | | 5,757,114 | |
| | | | | | | | |
| Total Investments – 100.18%
(Cost $128,085,487)** | | | 148,852,000 | |
| | | | | | | | |
| Net Other Assets and Liabilities – (0.18)% | | | (271,796 | ) |
| | | | | | | | |
| Net Assets – 100.00% | | $ | 148,580,204 | |
| | | | | | | | |
| * | Non-income producing security. |
| ** | At April 30, 2012, cost is identical for book and Federal income tax purposes. |
| | | | |
Gross unrealized appreciation | | $ | 23,806,237 | |
Gross unrealized depreciation | | | (3,039,724 | ) |
| | | | |
Net unrealized appreciation | | $ | 20,766,513 | |
| | | | |
| ADR | American Depositary Receipt |
| SP ADR | Sponsored American Depositary Receipt |
| | | | |
See accompanying Notes to Financial Statements. | | | | |
| | | 23 | |
| | | | |
| | | | |
Aston Funds | | | | |
ASTON/River Road Small Cap Value Fund | | | April 30, 2012 | |
Schedule of Investments (unaudited) | | | | |
| | |
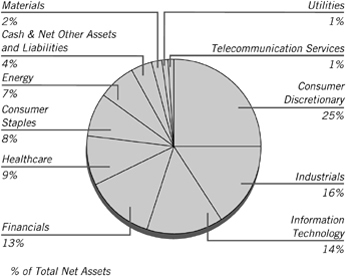
| | | | | | | | |
| Shares | | | | | Market
Value | |
| COMMON STOCKS – 96.34% | | | | |
| | | | Consumer Discretionary – 25.22% | |
| | 312,338 | | | Ascena Retail Group * | | $ | 6,396,682 | |
| | 49,091 | | | Ascent Capital Group, Class A * | | | 2,528,186 | |
| | 296,520 | | | Big Lots * | | | 10,864,493 | |
| | 150,040 | | | Bob Evans Farms | | | 5,737,530 | |
| | 97,349 | | | Cracker Barrel Old Country Store | | | 5,599,514 | |
| | 220,970 | | | DreamWorks Animation SKG, Class A * | | | 3,979,670 | |
| | 199,288 | | | Fred’s, Class A | | | 2,853,804 | |
| | 36,940 | | | Frisch’s Restaurants | | | 981,126 | |
| | 101,725 | | | Iconix Brand Group * | | | 1,560,462 | |
| | 429,521 | | | Mac-Gray (a) | | | 6,399,863 | |
| | 306,720 | | | Madison Square Garden, Class A * | | | 11,032,718 | |
| | 169,629 | | | Monarch Casino & Resort * | | | 1,642,009 | |
| | 192,690 | | | Motorcar Parts of America * | | | 1,456,736 | |
| | 228,865 | | | Rent-A-Center | | | 7,829,472 | |
| | 157,112 | | | Service Corp International | | | 1,819,357 | |
| | 104,640 | | | True Religion Apparel * | | | 2,842,022 | |
| | 73,000 | | | WMS Industries * | | | 1,789,230 | |
| | | | | | | | |
| | | | | | | 75,312,874 | |
| | | | | | | | |
| | | | Consumer Staples – 7.88% | | | | |
| | 133,995 | | | Harbinger Group * | | | 691,414 | |
| | 301,389 | | | Harris Teeter Supermarkets | | | 11,443,740 | |
| | 134,640 | | | Industrias Bachoco, SP ADR (Mexico) | | | 2,780,316 | |
| | 68,844 | | | J & J Snack Foods | | | 3,859,395 | |
| | 171,796 | | | Village Super Market, Class A (a) | | | 4,741,570 | |
| | | | | | | | |
| | | | | | | 23,516,435 | |
| | | | | | | | |
| | | | Energy – 6.39% | | | | |
| | 83,530 | | | Cloud Peak Energy * | | | 1,285,527 | |
| | 137,583 | | | Endeavour International * | | | 1,717,036 | |
| | 538,313 | | | Evolution Petroleum * | | | 4,758,687 | |
| | 537,508 | | | Miller Energy Resources * | | | 2,918,668 | |
| | 159,040 | | | Nordic American Tankers (Bermuda) | | | 2,309,261 | |
| | 46,090 | | | Resolute Energy * | | | 489,015 | |
| | 90,630 | | | Rex Energy * | | | 952,521 | |
| | | | | | | | |
| Shares | | | | | Market
Value | |
| | | | Energy (continued) | | | | |
| | 303,749 | | | Tetra Technologies * | | $ | 2,645,654 | |
| | 221,555 | | | Vaalco Energy * | | | 2,009,504 | |
| | | | | | | | |
| | | | | | | 19,085,873 | |
| | | | | | | | |
| | | | Financials – 13.34% | | | | |
| | 241,751 | | | Alterra Capital Holdings (Bahamas) | | | 5,785,101 | |
| | 95,210 | | | BGC Partners, Class A | | | 663,614 | |
| | 25,984 | | | Capital Southwest | | | 2,487,188 | |
| | 218,212 | | | Dime Community Bancshares | | | 3,024,418 | |
| | 24,065 | | | First Citizens BancShares, Class A | | | 4,170,465 | |
| | 28,680 | | | FirstService (Canada) * | | | 784,111 | |
| | 172,650 | | | Hilltop Holdings * | | | 1,369,115 | |
| | 133,579 | | | Medallion Financial | | | 1,460,018 | |
| | 47,637 | | | Navigators Group * | | | 2,262,758 | |
| | 83,709 | | | Oppenheimer Holdings, Class A | | | 1,428,076 | |
| | 301,600 | | | SWS Group | | | 1,701,024 | |
| | 37,668 | | | Tompkins Financial | | | 1,425,734 | |
| | 65,715 | | | Tower Group | | | 1,418,130 | |
| | 22,640 | | | White Mountains Insurance Group | | | 11,840,720 | |
| | | | | | | | |
| | | | | | | 39,820,472 | |
| | | | | | | | |
| | | | Healthcare – 8.95% | | | | |
| | 41,875 | | | Chemed | | | 2,526,738 | |
| | 120,603 | | | Ensign Group | | | 3,221,306 | |
| | 76,100 | | | Hanger Orthopedic Group * | | | 1,792,155 | |
| | 87,430 | | | Hill-Rom Holdings | | | 2,837,104 | |
| | 152,280 | | | ICU Medical * | | | 7,993,177 | |
| | 58,980 | | | Owens & Minor | | | 1,724,575 | |
| | 210,590 | | | STERIS | | | 6,614,632 | |
| | | | | | | | |
| | | | | | | 26,709,687 | |
| | | | | | | | |
| | | | Industrials – 16.25% | | | | |
| | 138,420 | | | ABM Industries | | | 3,222,417 | |
| | 227,560 | | | Aircastle (Bermuda) | | | 2,764,854 | |
| | 33,890 | | | Allegiant Travel * | | | 1,991,376 | |
| | 179,560 | | | Brink’s | | | 4,560,824 | |
| | 47,676 | | | Cubic | | | 2,204,061 | |
| | 248,410 | | | Dolan * | | | 1,989,764 | |
| | 116,035 | | | G & K Services, Class A | | | 3,812,910 | |
| | 493,960 | | | Geo Group * | | | 10,229,912 | |
| | 105,059 | | | Insperity | | | 2,864,959 | |
| | 98,020 | | | John Bean Technologies | | | 1,567,340 | |
| | 161,710 | | | Korn/Ferry International * | | | 2,611,617 | |
| | 190,519 | | | Standard Parking * | | | 3,631,292 | |
| | 116,503 | | | Unifirst | | | 7,078,722 | |
| | | | | | | | |
| | | | | | | 48,530,048 | |
| | | | | | | | |
| | | | Information Technology – 13.96% | |
| | 32,461 | | | Computer Services | | | 1,087,444 | |
| | 251,340 | | | Convergys * | | | 3,360,416 | |
| | 101,930 | | | CSG Systems International * | | | 1,467,792 | |
| | 178,700 | | | Daktronics | | | 1,454,618 | |
| | 171,210 | | | DST Systems | | | 9,584,336 | |
| | 196,559 | | | Electro Rent | | | 3,062,389 | |
| | 326,303 | | | Ingram Micro, Class A * | | | 6,349,856 | |
| | 100,060 | | | Ituran Location and Control (Israel) | | | 1,344,806 | |
| | 41,710 | | | j2 Global | | | 1,077,369 | |
| | 83,750 | | | Mantech International, Class A | | | 2,631,425 | |
| | 267,070 | | | NeuStar, Class A * | | | 9,707,995 | |
| | 218,950 | | | Smart Technologies, Class A (Canada) * | | | 553,944 | |
| | | | | | | | |
| | | | | | | 41,682,390 | |
| | | | | | | | |
|
See accompanying Notes to Financial Statements. |
| 24 |
| |
| | | | |
Aston Funds | | | | |
ASTON/River Road Small Cap Value Fund | | | April 30, 2012 | |
Schedule of Investments (unaudited) – continued | | | | |
| | |
| | | | | | | | |
| Shares | | | | | Market
Value | |
| | | | Materials – 2.26% | | | | |
| | 48,333 | | | Aptargroup | | $ | 2,634,631 | |
| | 45,296 | | | Stepan | | | 4,115,595 | |
| | | | | | | | |
| | | | | | | 6,750,226 | |
| | | | | | | | |
| | | | Telecommunication Services – 0.77% | | | | |
| | 67,530 | | | Atlantic Tele-Network | | | 2,300,072 | |
| | | | | | | | |
| | | | Utilities – 1.32% | | | | |
| | 115,210 | | | Avista | | | 3,046,152 | |
| | 24,580 | | | Unisource Energy | | | 894,712 | |
| | | | | | | | |
| | | | | | | 3,940,864 | |
| | | | | | | | |
| | | | Total Common Stocks
(Cost $216,035,940) | | | 287,648,941 | |
| | | | | | | | |
| Total Investments – 96.34%
(Cost $216,035,940)** | | | 287,648,941 | |
| | | | | | | | |
| Net Other Assets and Liabilities – 3.66% | | | 10,933,183 | |
| | | | | | | | |
| Net Assets – 100.00% | | $ | 298,582,124 | |
| | | | | | | | |
| * | Non-income producing security. |
| ** | At April 30, 2012, cost is identical for book and Federal income tax purposes. |
| | | | |
Gross unrealized appreciation | | $ | 76,602,887 | |
Gross unrealized depreciation | | | (4,989,886 | ) |
| | | | |
Net unrealized appreciation | | $ | 71,613,001 | |
| | | | |
| (a) | These securities have been determined by the Subadviser to be illiquid securities. At April 30, 2012, these securities amounted to $11,141,433 or 3.73% of net assets. |
| SP ADR | Sponsored American Depositary Receipt |
| | | | |
See accompanying Notes to Financial Statements. | | | | |
| | | 25 | |
| | | | |
| | | | |
Aston Funds | | | | |
ASTON/River Road Independent Value Fund | | | April 30, 2012 | |
Schedule of Investments (unaudited) | | | | |
| | |
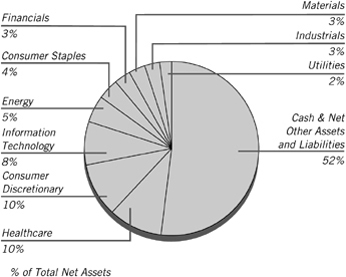
| | | | | | | | |
| Shares | | | | �� | Market
Value | |
| | COMMON STOCKS – 47.60% | | | | |
| | | | Consumer Discretionary – 9.85% | | | | |
| | 200,974 | | | Aaron’s * | | $ | 5,460,464 | |
| | 721,022 | | | American Greetings, Class A | | | 11,536,352 | |
| | 176,197 | | | Big Lots * | | | 6,455,858 | |
| | 469,400 | | | Core-Mark Holding (a) | | | 18,118,840 | |
| | 85,514 | | | Papa John’s International * | | | 3,444,504 | |
| | 729,203 | | | Valassis Communications * | | | 14,584,060 | |
| | | | | | | | |
| | | | | | | 59,600,078 | |
| | | | | | | | |
| | | | Consumer Staples – 3.56% | | | | |
| | 307,867 | | | Central Garden & Pet * | | | 3,257,233 | |
| | 1,244,206 | | | Cott (Canada) * | | | 8,149,549 | |
| | 105,899 | | | Harris Teeter Supermarkets | | | 4,020,985 | |
| | 157,241 | | | Oil-Dri Corporation of America (a) | | | 3,327,220 | |
| | 62,590 | | | Weis Markets | | | 2,791,514 | |
| | | | | | | | |
| | | | | | | 21,546,501 | |
| | | | | | | | |
| | | | Energy – 5.31% | | | | |
| | 681,759 | | | Bill Barrett * | | | 16,348,581 | |
| | 95,896 | | | Contango Oil & Gas * | | | 5,203,317 | |
| | 654,334 | | | Patterson-UTI Energy | | | 10,580,581 | |
| | | | | | | | |
| | | | | | | 32,132,479 | |
| | | | | | | | |
| | | | Financials – 3.32% | | | | |
| | 173,592 | | | Baldwin & Lyons, Class B (a) | | | 3,779,098 | |
| | 519,574 | | | Potlatch, REIT | | | 16,262,666 | |
| | | | | | | | |
| | | | | | | 20,041,764 | |
| | | | | | | | |
| | | | Healthcare – 10.24% | | | | |
| | 28,683 | | | Bio - Rad Laboratories, Class A * | | | 3,097,477 | |
| | 323,691 | | | Covance * | | | 15,135,791 | |
| | 301,267 | | | ICU Medical * | | | 15,813,505 | |
| | 649,984 | | | Owens & Minor | | | 19,005,532 | |
| | 260,910 | | | Patterson Cos | | | 8,894,422 | |
| | | | | | | | |
| | | | | | | 61,946,727 | |
| | | | | | | | |
| | | | | | | | |
| Shares | | | | | Market
Value | |
| | | | Industrials – 2.62% | | | | |
| | 173,800 | | | Alamo Group | | $ | 5,853,584 | |
| | 322,971 | | | Sykes Enterprises * | | | 5,119,090 | |
| | 80,264 | | | Unifirst | | | 4,876,841 | |
| | | | | | | | |
| | | | | | | 15,849,515 | |
| | | | | | | | |
| | | | Information Technology – 7.57% | | | | |
| | 959,465 | | | CSG Systems International * | | | 13,816,296 | |
| | 1,217,046 | | | EPIQ Systems | | | 13,825,642 | |
| | 452,049 | | | FLIR Systems | | | 10,153,020 | |
| | 253,985 | | | Mantech International, Class A | | | 7,980,209 | |
| | | | | | | | |
| | | | | | | 45,775,167 | |
| | | | | | | | |
| | | | Materials – 2.92% | | | | |
| | 904,425 | | | Pan American Silver (Canada) | | | 17,645,332 | |
| | | | | | | | |
| | | | Utilities – 2.21% | | | | |
| | 252,298 | | | Artesian Resources, Class A (a) | | | 4,816,369 | |
| | 91,133 | | | Avista | | | 2,409,556 | |
| | 339,155 | | | California Water Service Group | | | 6,142,097 | |
| | | | | | | | |
| | | | | | | 13,368,022 | |
| | | | | | | | |
| | | | Total Common Stocks
(Cost $295,631,474) | | | 287,905,585 | |
| | | | | | | | |
| | INVESTMENT COMPANY – 51.83% | | | | |
| | 313,543,869 | | | BlackRock Liquidity Funds Treasury Trust Fund Portfolio | | | 313,543,869 | |
| | | | | | | | |
| | | | Total Investment Company
(Cost $313,543,869) | | | 313,543,869 | |
| | | | | | | | |
| Total Investments – 99.43%
(Cost $609,175,343)** | | | 601,449,454 | |
| | | | | | | | |
| | Net Other Assets and Liabilities – 0.57% | | | 3,472,995 | |
| | | | | | | | |
| | Net Assets – 100.00% | | $ | 604,922,449 | |
| | | | | | | | |
| * | Non-income producing security. |
| ** | At April 30, 2012, cost is identical for book and Federal income tax purposes. |
| | | | |
Gross unrealized appreciation | | $ | 13,270,713 | |
Gross unrealized depreciation | | | (20,996,602 | ) |
| | | | |
Net unrealized depreciation | | $ | (7,725,889 | ) |
| | | | |
| (a) | These securities have been determined by the Subadviser to be illiquid securities. At April 30, 2012, these securities amounted to $30,041,527 or 4.97% of net assets. |
| REIT | Real Estate Investment Trust |
|
See accompanying Notes to Financial Statements. |
| 26 |
| |
| | | | |
Aston Funds | | | | |
ASTON/DoubleLine Core Plus Fixed Income Fund | | | April 30, 2012 | |
Schedule of Investments (unaudited) | | | | |
| | |
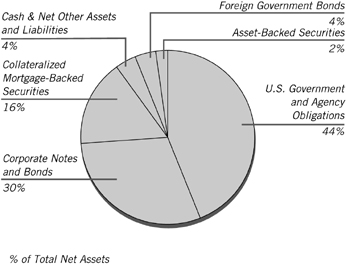
| | | | | | | | |
| Par Value | | | | | Market
Value | |
| AGENCY COLLATERALIZED MORTGAGE
OBLIGATIONS – 19.24% |
|
| | | | Fannie Mae – 7.12% | | | | |
| | $924,601 | | | 5.000%, 09/25/33
Series 2003-92, Class PZ, REMIC | | $ | 1,077,394 | |
| | 1,326,118 | | | 5.561%, 09/25/36 (a) (b)
Series 2009-86, Class CI, REMIC | | | 187,906 | |
| | 905,127 | | | 6.381%, 10/25/36 (a) (b)
Series 2007-57, Class SX, REMIC | | | 148,629 | |
| | 188,534 | | | 5.500%, 03/25/38
Series 2008-14, Class ZA, REMIC | | | 216,477 | |
| | 278,352 | | | 4.000%, 01/25/41
Series 2010-156, Class ZC, REMIC | | | 282,735 | |
| | 419,077 | | | 4.000%, 03/25/41 (c)
Series 2011-18, Class UZ, REMIC | | | 424,446 | |
| | 103,040 | | | 4.000%, 08/25/41
Series 2011-77, Class CZ, REMIC | | | 103,963 | |
| | 239,314 | | | 8.812%, 09/25/41 (a)
Series 2011-88, Class SB, REMIC | | | 251,659 | |
| | 288,422 | | | 13.226%, 09/25/41 (a)
Series 2011-87, Class US, REMIC | | | 292,405 | |
| | 1,005,842 | | | 3.500%, 03/25/42
Series 2012-20, Class ZT, REMIC | | | 955,600 | |
| | 1,500,000 | | | 4.000%, 04/25/42
Series 2012-31, Class Z, REMIC | | | 1,559,945 | |
| | | | | | | | |
| | | | | | | 5,501,159 | |
| | | | | | | | |
| | | | Freddie Mac – 8.40% | | | | |
| | 720,909 | | | 5.000%, 12/15/34
Series 2909, Class Z, REMIC | | | 818,920 | |
| | 565,706 | | | 5.500%, 08/15/36
Series 3626, Class AZ, REMIC | | | 642,090 | |
| | 620,434 | | | 5.860%, 04/15/37 (a) (b)
Series 3301, Class MS, REMIC | | | 81,531 | |
| | 607,829 | | | 5.760%, 11/15/37 (a) (b)
Series 3382, Class SB, REMIC | | | 78,855 | |
| | 523,421 | | | 6.150%, 11/15/37 (a) (b)
Series 3384, Class S, REMIC | | | 75,430 | |
| | | | | | | | |
| Par Value | | | | | Market
Value | |
| | $1,500,000 | | | 4.000%, 12/15/38
Series 3738, Class BP, REMIC | | $ | 1,623,309 | |
| | 1,591,974 | | | 5.280%, 01/15/39 (a) (b)
Series 3500, Class SA, REMIC | | | 183,179 | |
| | 81,650 | | | 14.279%, 10/15/40 (a)
Series 3747, Class KS, REMIC | | | 86,533 | |
| | 105,118 | | | 4.000%, 01/15/41
Series 3795, Class VZ, REMIC | | | 110,373 | |
| | 262,894 | | | 9.419%, 01/15/41 (a)
Series 3796, Class SK, REMIC | | | 269,024 | |
| | 40,902 | | | 13.076%, 04/15/41 (a)
Series 3864, Class MS, REMIC | | | 41,095 | |
| | 389,383 | | | 4.000%, 06/15/41
Series 3872, Class BA, REMIC | | | 412,702 | |
| | 206,081 | | | 4.000%, 07/15/41
Series 3888, Class ZG, REMIC | | | 217,648 | |
| | 361,943 | | | 4.500%, 07/15/41
Series 3894, Class ZA, REMIC | | | 381,102 | |
| | 76,616 | | | 12.779%, 07/15/41 (a)
Series 3899, Class SD, REMIC | | | 78,200 | |
| | 417,832 | | | 9.078%, 09/15/41
Series 3924, Class US, REMIC | | | 428,171 | |
| | 507,334 | | | 3.500%, 11/15/41
Series 3957, Class DZ, REMIC | | | 496,376 | |
| | 457,550 | | | 4.000%, 11/15/41
Series 3957, Class HZ, REMIC | | | 466,460 | |
| | | | | | | | |
| | | | | | | 6,490,998 | |
| | | | | | | | |
| | | | Government National Mortgage Association – 3.72% | |
| | 53,019 | | | 30.942%, 03/20/34 (a)
Series 2004-35, Class SA | | | 95,676 | |
| | 1,658,662 | | | 5.951%, 03/20/39 (b)
Series 2010-98, Class IA | | | 233,978 | |
| | 1,139,973 | | | 4.500%, 05/16/39
Series 2009-32, Class ZE | | | 1,278,677 | |
| | 567,857 | | | 4.500%, 05/20/39
Series 2009-35, Class DZ | | | 638,191 | |
| | 559,418 | | | 4.500%, 09/20/39
Series 2009-75, Class GZ | | | 628,588 | |
| | | | | | | | |
| | | | | | | 2,875,110 | |
| | | | | | | | |
| | | | Total Agency Collateralized
Mortgage Obligations (Cost $14,021,523) | | | 14,867,267 | |
| | | | | | | | |
|
| U.S. GOVERNMENT OBLIGATIONS – 18.95% | |
| | | | U.S. Treasury Bonds – 1.86% | |
| | 1,170,000 | | | 4.250%, 11/15/40 (g) | | | 1,435,810 | |
| | | | | | | | |
| | | | U.S. Treasury Notes – 17.09% | |
| | 1,480,000 | | | 0.500%, 05/31/13 | | | 1,484,856 | |
| | 450,000 | | | 0.750%, 09/15/13 | | | 453,235 | |
| | 3,780,000 | | | 1.875%, 04/30/14 | | | 3,900,193 | |
| | 1,380,000 | | | 1.250%, 10/31/15 | | | 1,415,687 | |
| | 1,030,000 | | | 2.750%, 11/30/16 | | | 1,123,424 | |
| | 440,000 | | | 1.875%, 09/30/17 | | | 461,691 | |
| | 1,325,000 | | | 2.375%, 05/31/18 | | | 1,425,825 | |
| | 1,145,000 | | | 3.625%, 08/15/19 | | | 1,325,427 | |
| | 1,450,000 | | | 3.125%, 05/15/21 | | | 1,615,618 | |
| | | | | | | | |
| | | | | | | 13,205,956 | |
| | | | | | | | |
| | | | Total U.S. Government Obligations
(Cost $14,596,645) | | | 14,641,766 | |
| | | | | | | | |
| | | | |
See accompanying Notes to Financial Statements. | | | | |
| | | 27 | |
| | | | |
| | | | |
Aston Funds | | | | |
ASTON/DoubleLine Core Plus Fixed Income Fund | | | April 30, 2012 | |
Schedule of Investments (unaudited) – continued | | | | |
| | |
| | | | | | | | |
Par Value | | | | | Market
Value | |
| U.S. GOVERNMENT MORTGAGE-BACKED SECURITIES – 5.61% | |
| | | | Fannie Mae – 3.74% | | | | |
| | $667,367 | | | 4.000%, 09/01/31
Pool # MA3894 | | $ | 715,347 | |
| | 209,276 | | | 5.500%, 07/01/36
Pool # 995112 | | | 230,474 | |
| | 814,684 | | | 6.000%, 01/01/39
Pool # 995581 | | | 901,802 | |
| | 996,811 | | | 4.000%, 02/01/42
Pool # AK4039 | | | 1,043,711 | |
| | | | | | | | |
| | | | | | | 2,891,334 | |
| | | | | | | | |
| | | | Freddie Mac – 1.87% | | | | |
| | 143,869 | | | 5.000%, 07/01/35
Gold Pool # G01840 | | | 155,859 | |
| | 261,273 | | | 5.500%, 08/01/38
Gold Pool # G04587 | | | 284,757 | |
| | 63,707 | | | 5.500%, 12/01/38
Gold Pool # G06172 | | | 69,473 | |
| | 897,579 | | | 4.000%, 10/01/41
Gold Pool # T60392 | | | 937,848 | |
| | | | | | | | |
| | | | | | | 1,447,937 | |
| | | | | | | | |
| | | | Total U.S. Government Mortgage- Backed Securities
(Cost $4,306,388) | | | 4,339,271 | |
| | | | | | | | |
|
| CORPORATE NOTES AND BONDS – 30.47% | |
| | | | Consumer Discretionary – 2.14% | |
| | 125,000 | | | Comcast
5.850%, 11/15/15 | | | 144,096 | |
| | 180,000 | | | Daimler Finance North America
1.950%, 03/28/14 (d) | | | 182,405 | |
| | 150,000 | | | DIRECTV Holdings
5.000%, 03/01/21 | | | 164,233 | |
| | 100,000 | | | Mattel Senior Unsecured Notes
2.500%, 11/01/16 | | | 103,180 | |
| | 175,000 | | | News America
6.650%, 11/15/37 | | | 203,979 | |
| | 150,000 | | | Omnicom Group
Senior Unsecured Notes
4.450%, 08/15/20 | | | 162,883 | |
| | 150,000 | | | Target Senior Unsecured Notes
3.875%, 07/15/20 | | | 165,811 | |
| | 300,000 | | | Time Warner Cable
5.000%, 02/01/20 | | | 334,849 | |
| | 175,000 | | | Wynn Las Vegas
7.750%, 08/15/20 | | | 194,250 | |
| | | | | | | | |
| | | | | | | 1,655,686 | |
| | | | | | | | |
| | | | Consumer Staples – 3.44% | | | | |
| | 225,000 | | | Altria Group
9.250%, 08/06/19 | | | 307,307 | |
| | 200,000 | | | CCL Finance
9.500%, 08/15/14 | | | 227,000 | |
| | 325,000 | | | Coca-Cola
Senior Unsecured Notes
1.800%, 09/01/16 | | | 334,017 | |
| | 250,000 | | | Coca-Cola Femsa SAB de CV
Senior Unsecured Notes
4.625%, 02/15/20 | | | 275,739 | |
| | | | | | | | |
Par Value | | | | | Market
Value | |
| | | | Consumer Staples (continued) | | | | |
| | $100,000 | | | Corp Lindley
Senior Unsecured Notes
6.750%, 11/23/21 (d) | | $ | 107,250 | |
| | 100,000 | | | Corp Pesquera Inca
9.000%, 02/10/17 | | | 108,000 | |
| | 150,000 | | | General Mills
Senior Unsecured Notes
3.150%, 12/15/21 | | | 152,710 | |
| | 120,000 | | | Gruma Senior Unsecured Notes
7.750%, 12/29/49 | | | 121,500 | |
| | 120,000 | | | Kellogg Senior Unsecured Notes
7.450%, 04/01/31 | | | 161,186 | |
| | 90,000 | | | Kraft Foods
Senior Unsecured Notes
5.375%, 02/10/20 | | | 105,542 | |
| | 200,000 | | | Kroger
7.500%, 01/15/14 | | | 222,010 | |
| | 200,000 | | | Virgolino de Oliveira Finance
11.750%, 02/09/22 (d) | | | 190,500 | |
| | 325,000 | | | Wal-Mart Stores
Senior Unsecured Notes
3.250%, 10/25/20 | | | 346,384 | |
| | | | | | | | |
| | | | | | | 2,659,145 | |
| | | | | | | | |
| | | | Energy – 4.89% | | | | |
| | 125,000 | | | BP Capital Markets
4.750%, 03/10/19 | | | 142,035 | |
| | 200,000 | | | CNOOC Finance 212
3.875%, 05/02/22 (d) (e) | | | 200,444 | |
| | 200,000 | | | CNPC General Capital Ltd
3.950%, 04/19/22 (d) | | | 201,672 | |
| | 125,000 | | | ConocoPhillips
6.500%, 02/01/39
| | | 169,379 | |
| | 200,000 | | | Devon Energy
Senior Unsecured Notes
6.300%, 01/15/19 | | | 247,331 | |
| | 75,000 | | | 4.000%, 07/15/21 | | | 81,044 | |
| | 168,580 | | | Dolphin Energy
Senior Secured Notes
5.888%, 06/15/19 | | | 183,963 | |
| | 200,000 | | | Gazprom OAO Via Gaz Capital
Senior Unsecured Notes
5.092%, 11/29/15 | | | 212,250 | |
| | 150,000 | | | Halliburton Senior Unsecured Notes
6.150%, 09/15/19 | | | 184,942 | |
| | 225,000 | | | Kinder Morgan Energy Partners
Senior Unsecured Notes
6.950%, 01/15/38 | | | 266,028 | |
| | 175,000 | | | Marathon Petroleum
Senior Secured Notes
5.125%, 03/01/21 | | | 194,350 | |
| | 166,000 | | | ONEOK Partners
6.125%, 02/01/41
| | | 190,894 | |
| | 215,000 | | | Pacific Rubiales Energy
7.250%, 12/12/21 (d) | | | 235,425 | |
| | 100,000 | | | 7.250%, 12/12/21 | | | 109,500 | |
| | 300,000 | | | Pemex Project Funding Master Trust
6.625%, 06/15/35 | | | 354,750 | |
| | 50,000 | | | Petrobras International Finance
5.375%, 01/27/21 | | | 54,991 | |
| | 150,000 | | | Phillips
66 5.875%, 05/01/42 (d) | | | 158,827 | |
|
See accompanying Notes to Financial Statements. |
| 28 |
| |
| | | | |
Aston Funds | | | | |
ASTON/DoubleLine Core Plus Fixed Income Fund | | | April 30, 2012 | |
Schedule of Investments (unaudited) – continued | | | | |
| | |
| | | | | | | | |
Par Value | | | | | Market
Value | |
| | | | Energy (continued) | | | | |
| | $ 25,000 | | | Plains All American Pipeline
LP/PAA Finance
Senior Unsecured Notes
5.150%, 06/01/42 | | $ | 25,555 | |
| | 250,000 | | | Reliance Holdings USA
5.400%, 02/14/22 (d) | | | 250,958 | |
| | 100,000 | | | Transocean
6.000%, 03/15/18 | | | 112,019 | |
| | 175,000 | | | Valero Energy
6.125%, 02/01/20 | | | 203,748 | |
| | | | | | | | |
| | | | | | | 3,780,105 | |
| | | | | | | | |
| | | | Financials – 7.63% | | | | |
| | 275,000 | | | American Express Credit
Senior Unsecured Notes
2.750%, 09/15/15 | | | 285,570 | |
| | 300,000 | | | Australia & New Zealand Banking Group Senior Unsecured Notes
4.875%, 01/12/21 (d) | | | 332,957 | |
| | 200,000 | | | Banco Bradesco SA/Cayman Islands
Subordinated Notes
5.750%, 03/01/22 (d) | | | 203,800 | |
| | 200,000 | | | Banco de Bogota
Senior Unsecured Notes
5.000%, 01/15/17 (d) | | | 208,200 | |
| | 300,000 | | | Banco do Brasil SA/Cayman
8.500%, 10/29/49 (a) (c) | | | 346,140 | |
| | 200,000 | | | Banco Internacional del Peru
Senior Unsecured Notes
5.750%, 10/07/20 | | | 204,500 | |
| | 300,000 | | | Banco Mercantil del Norte
Subordinated Notes
6.862%, 10/13/21 (a) | | | 319,500 | |
| | 175,000 | | | Boston Properties
Senior Unsecured Notes, REIT
4.125%, 05/15/21 | | | 183,780 | |
| | 175,000 | | | Citigroup Senior Unsecured Notes
6.000%, 12/13/13 | | | 184,844 | |
| | 100,000 | | | Controladora Comercial Mexicana
Senior Secured Notes
7.000%, 06/30/18 (c) | | | 102,000 | |
| | 100,000 | | | DBS Bank
5.000%, 11/15/19 (a) | | | 104,628 | |
| | 300,000 | | | General Electric Capital
Senior Unsecured Notes
2.900%, 01/09/17 | | | 311,177 | |
| | 175,000 | | | Goldman Sachs Group
Senior Unsecured Notes
5.750%, 01/24/22 | | | 182,965 | |
| | 105,162 | | | Iirsa Norte Finance
Senior Secured Notes
8.750%, 05/30/24
| | | 126,721 | |
| | | | JPMorgan Chase
Senior Unsecured Notes | | | | |
| | 250,000 | | | 4.950%, 03/25/20 | | | 274,844 | |
| | 75,000 | | | 4.500%, 01/24/22 | | | 79,998 | |
| | 300,000 | | | Korea Development Bank
4.375%, 08/10/15 | | | 318,928 | |
| | 135,000 | | | MetLife Senior Unsecured Notes
6.375%, 06/15/34 | | | 166,053 | |
| | | | | | | | |
Par Value | | | | | Market
Value | |
| | | | Financials (continued) | | | | |
| | $225,000 | | | National Rural Utilities Cooperative
Finance Collateral Trust
10.375%, 11/01/18 | | $ | 330,423 | |
| | 200,000 | | | Oversea-Chinese Banking
4.250%, 11/18/19 (a)
| | | 205,694 | |
| | 100,000 | | | PNC Funding
6.700%, 06/10/19 | | | 123,738 | |
| | 150,000 | | | 4.375%, 08/11/20 | | | 165,490 | |
| | 250,000 | | | Pttep Australia International
Finance Property
4.152%, 07/19/15 | | | 260,614 | |
| | 200,000 | | | Royal Bank of Canada
Senior Notes
2.300%, 07/20/16
| | | 205,673 | |
| | | | Simon Property Group
Senior Unsecured Notes | | | | |
| | 100,000 | | | 5.650%, 02/01/20
| | | 116,698 | |
| | 35,000 | | | 4.375%, 03/01/21 | | | 38,033 | |
| | 200,000 | | | VTB Bank OJSC Via VTB Capital
Senior Unsecured Notes
6.875%, 05/29/18 | | | 212,042 | |
| | 275,000 | | | Wells Fargo
Senior Unsecured Notes
4.600%, 04/01/21 | | | 302,444 | |
| | | | | | | | |
| | | | | | | 5,897,454 | |
| | | | | | | | |
| | | | Healthcare – 1.40% | | | | |
| | 100,000 | | | Amgen Senior Unsecured Notes
3.875%, 11/15/21 | | | 105,272 | |
| | 255,000 | | | Becton Dickinson
Senior Unsecured Notes
3.125%, 11/08/21 | | | 264,734 | |
| | 200,000 | | | Biogen Idec Senior Unsecured Notes
6.875%, 03/01/18 | | | 245,452 | |
| | 150,000 | | | Express Scripts Holding
2.100%, 02/12/15 (d)
| | | 152,341 | |
| | | | WellPoint Senior Unsecured Notes | | | | |
| | 125,000 | | | 5.250%, 01/15/16 | | | 140,888 | |
| | 150,000 | | | 5.875%, 06/15/17 | | | 176,606 | |
| | | | | | | | |
| | | | | | | 1,085,293 | |
| | | | | | | | |
| | | | Industrials – 4.09% | | | | |
| | 125,000 | | | 3M Senior Unsecured Notes
5.700%, 03/15/37 | | | 164,871 | |
| | 100,000 | | | Anheuser-Busch InBev Worldwide
5.375%, 11/15/14 | | | 111,138 | |
| | 100,000 | | | Boeing Senior Unsecured Notes
6.875%, 03/15/39 | | | 143,834 | |
| | | | Covidien International Finance | | | | |
| | 185,000 | | | 2.800%, 06/15/15 | | | 193,141 | |
| | 50,000 | | | 6.000%, 10/15/17 | | | 60,218 | |
| | 125,000 | | | Daimler Finance North America
6.500%, 11/15/13 | | | 135,501 | |
| | 150,000 | | | Embraer Overseas
6.375%, 01/15/20 | | | 168,000 | |
| | 200,000 | | | Empresas ICA
8.900%, 02/04/21 | | | 200,000 | |
| | 100,000 | | | Grupo KUO SAB de CV
9.750%, 10/17/17 | | | 108,750 | |
| | | | |
See accompanying Notes to Financial Statements. | | | | |
| | | 29 | |
| | | | |
| | | | |
Aston Funds | | | | |
ASTON/DoubleLine Core Plus Fixed Income Fund | | | April 30, 2012 | |
Schedule of Investments (unaudited) – continued | | | | |
| | |
| | | | | | | | |
Par Value | | | | | Market
Value | |
| | | | Industrials (continued) | | | | |
| | $200,000 | | | Hutchison Whampoa International 11
4.625%, 01/13/22 (d) | | $ | 208,589 | |
| | 150,000 | | | Illinois Tool Works
Senior Unsecured Notes
3.375%, 09/15/21 (d) | | | 156,676 | |
| | 100,000 | | | Novartis Capital
4.400%, 04/24/20 | | | 114,423 | |
| | 150,000 | | | Penerbangan Malaysia
5.625%, 03/15/16 | | | 169,032 | |
| | | | Southwest Airlines
Senior Unsecured Notes | | | | |
| | 75,000 | | | 5.750%, 12/15/16 | | | 83,516 | |
| | 125,000 | | | 5.125%, 03/01/17 | | | 137,198 | |
| | 250,000 | | | United Parcel Service
Senior Unsecured Notes
3.125%, 01/15/21 | | | 266,214 | |
| | 100,000 | | | Volcan Cia Minera
Senior Unsecured Notes
5.375%, 02/02/22 | | | 104,100 | |
| | 200,000 | | | Votorantim Cimentos
7.250%, 04/05/41 (d) | | | 205,500 | |
| | 200,000 | | | Waste Management
6.125%, 11/30/39 | | | 249,861 | |
| | 200,000 | | | WPE International Cooperatief
10.375%, 09/30/20 | | | 178,000 | |
| | | | | | | | |
| | | | | | | 3,158,562 | |
| | | | | | | | |
| | | | Information Technology – 1.19% | |
| | 100,000 | | | Arrow Electronics
Senior Unsecured Notes
3.375%, 11/01/15 | | | 103,750 | |
| | 100,000 | | | IBM
Senior Unsecured Notes
1.950%, 07/22/16 | | | 103,323 | |
| | 200,000 | | | Intel
Senior Unsecured Notes
3.300%, 10/01/21 | | | 211,652 | |
| | 200,000 | | | Motorola Solutions
Senior Unsecured Notes
6.000%, 11/15/17 | | | 233,699 | |
| | 250,000 | | | Xerox
Senior Unsecured Notes
4.250%, 02/15/15 | | | 266,599 | |
| | | | | | | | |
| | | | | | | 919,023 | |
| | | | | | | | |
| | | | Materials – 1.21% | | | | |
| | 100,000 | | | Alcoa
Senior Unsecured Notes
6.150%, 08/15/20 | | | 109,143 | |
| | 250,000 | | | Celulosa Arauco y Constitucion
Senior Unsecured Notes
4.750%, 01/11/22 | | | 255,804 | |
| | 200,000 | | | Corp Nacional del Cobre de Chile
Senior Unsecured Notes
3.875%, 11/03/21 | | | 209,086 | |
| | 150,000 | | | Ecolab
Senior Unsecured Notes
2.375%, 12/08/14 | | | 155,364 | |
| | 100,000 | | | Inversiones CMPC
4.750%, 01/19/18 | | | 105,012 | |
| | 100,000 | | | POSCO
Senior Unsecured Notes
4.250%, 10/28/20 (d) | | | 100,649 | |
| | | | | | | | |
| | | | | | | 935,058 | |
| | | | | | | | |
| | | | | | | | |
Par Value | | | | | Market
Value | |
| | | | Telecommunications – 1.74% | |
| | $50,000 | | | AT&T
Senior Unsecured Notes
5.350%, 09/01/40 | | $ | 54,791 | |
| | 150,000 | | | Axiata SPV1 Labuan
5.375%, 04/28/20 | | | 161,508 | |
| | 296,000 | | | British Telecom
Senior Unsecured Notes
5.950%, 01/15/18 | | | 345,966 | |
| | 25,000 | | | Comcast
5.900%, 03/15/16 | | | 29,024 | |
| | 125,000 | | | Deutsche Telekom International
Finance BV
8.750%, 06/15/30 | | | 172,245 | |
| | 100,000 | | | France Telecom
Senior Unsecured Notes
2.750%, 09/14/16 | | | 102,734 | |
| | 300,000 | | | Globo Comunicacao e Participacoes
6.250%, 07/20/15 (e) | | | 323,250 | |
| | 150,000 | | | NII Capital
8.875%, 12/15/19 | | | 151,875 | |
| | | | | | | | |
| | | | | | | 1,341,393 | |
| | | | | | | | |
| | | | Utilities – 2.74% | | | | |
| | 200,000 | | | Abu Dhabi National Energy
Senior Unsecured Notes
5.875%, 12/13/21 | | | 216,250 | |
| | 150,000 | | | AES Gener
Senior Unsecured Notes
7.500%, 03/25/14 | | | 161,250 | |
| | 200,000 | | | Duke Energy
Senior Unsecured Notes
3.550%, 09/15/21 | | | 208,953 | |
| | 350,000 | | | EGE Haina Finance
Senior Secured Notes
9.500%, 04/26/17 | | | 366,625 | |
| | 200,000 | | | Hongkong Electric Finance
4.250%, 12/14/20 | | | 209,345 | |
| | 100,000 | | | Hydro Quebec
2.000%, 06/30/16 | | | 103,357 | |
| | 200,000 | | | Instituto Costarricense de Electricidad
Senior Unsecured Notes
6.950%, 11/10/21 (d)
| | | 212,000 | |
| | | | Midamerican Energy Holdings
Senior Unsecured Notes | | | | |
| | 50,000 | | | 5.950%, 05/15/37 | | | 60,463 | |
| | 150,000 | | | 6.500%, 09/15/37 | | | 192,613 | |
| | 97,024 | | | Nakilat
6.267%, 12/31/33 | | | 106,903 | |
| | 250,000 | | | Southern Power
Senior Unsecured Notes
4.875%, 07/15/15 | | | 276,236 | |
| | | | | | | | |
| | | | | | | 2,113,995 | |
| | | | | | | | |
| | | | Total Corporate Notes and Bonds
(Cost $23,161,006) | | | 23,545,714 | |
| | | | | | | | |
| COLLATERALIZED MORTGAGE-BACKED
SECURITIES – 15.64% |
|
| | 500,000 | | | American General Mortgage Loan Trust
Series 2010-1A, Class A3
5.650%, 03/25/58 (a) (d) | | | 526,120 | |
| | 839,210 | | | Banc of America Funding
Series 2010-R9, Class 3A3
5.500%, 12/26/35 (d) | | | 374,805 | |
|
See accompanying Notes to Financial Statements. |
| 30 |
| |
| | | | |
Aston Funds | | | | |
ASTON/DoubleLine Core Plus Fixed Income Fund | | | April 30, 2012 | |
Schedule of Investments (unaudited) – continued | | | | |
| | |
| | | | | | | | |
Par Value | | | | | Market
Value | |
| $ | 50,000 | | | Banc of America Merrill Lynch
Commercial Mortgage
Series 2007-1, Class A4
5.451%, 01/15/49 | | $ | 56,648 | |
| | 25,000 | | | Bear Stearns Commercial Mortgage
Securities Series 2006-PW14,
Class AM
5.243%, 12/11/38 | | | 26,012 | |
| | 25,000 | | | Bear Stearns Commercial
Mortgage Securities
Series 2006-PW13, Class AM
5.582%, 09/11/41 (a) | | | 26,599 | |
| | 437,246 | | | Citicorp Mortgage Securities
Series 2007-2, Class 3A1
5.500%, 02/25/37 | | | 390,009 | |
| | 50,000 | | | Citigroup Commercial Mortgage Trust
Series 2005-C3, Class AM
4.830%, 05/15/43 (a) | | | 51,604 | |
| | 100,000 | | | Citigroup Commercial Mortgage Trust
Series 2008-C7, Class A4,
6.276%, 12/10/49 (a) | | | 116,373 | |
| | 7,630,374 | | | Citigroup/Deutsche Bank
Commercial Mortgage Trust
Series 2007-CD5, Class XP
0.323%, 11/15/44 (a) (b) (d) | | | 37,061 | |
| | 60,000 | | | Citigroup/Deutsche Bank
Commercial Mortgage Trust
Series 2007-CD4, Class A4
5.322%, 12/11/49 | | | 66,759 | |
| | 1,288,503 | | | Citimortgage Alternative Loan Trust
Series 2007-A4, Class 1A13
5.750%, 04/25/37 | | | 907,065 | |
| | 50,000 | | | Commercial Mortgage Pass
Through Certificates
Series 2006-C7, Class AM
5.965%, 06/10/46 (a) | | | 51,256 | |
| | 193,165 | | | Commercial Mortgage Pass
Through Certificates
Series 2010-C1, Class XPA
2.586%, 07/10/46 (a) (b) (d) | | | 13,096 | |
| | 642,568 | | | Countrywide Alternative Loan Trust
Series 2006-J1, Class 2A1
7.000%, 02/25/36 | | | 265,187 | |
| | 156,828 | | | Countrywide Alternative Loan Trust
Series 2007-18CB, Class 2A17
6.000%, 08/25/37 | | | 113,507 | |
| | 597,856 | | | Countrywide Alternative Loan Trust
Series 2007-23CB, Class A3
0.739%, 09/25/37 (a) | | | 306,813 | |
| | 575,632 | | | Countrywide Alternative Loan Trust
Series 2007-23CB, Class A4
6.261%, 09/25/37 (a) (b) | | | 119,513 | |
| | 383,249 | | | Countrywide Home Loan Mortgage
Pass Through Trust
Series 2005-16, Class A8
1.139%, 09/25/35 (a) | | | 334,935 | |
| | 300,000 | | | Countrywide Home Loan Mortgage
Pass Through Trust
Series 2007-7, Class A4
5.750%, 06/25/37 | | | 265,278 | |
| | 100,000 | | | Credit Suisse First Boston
Mortgage Securities
Series 1998 -C2 Class F
6.750%, 11/15/30 (a) (d) | | | 107,067 | |
| | | | | | | | |
Par Value | | | | | Market
Value | |
| $ | 5,723,550 | | | Credit Suisse First Boston
Mortgage Securities
Series 1997-C2, Class AX
0.269%, 01/17/35 (a) (b) | | $ | 17,514 | |
| | 183,519 | | | Credit Suisse First Boston
Mortgage Securities
Series 2005-8, Class 9A4
5.500%, 09/25/35 | | | 166,232 | |
| | 821,046 | | | Credit Suisse Mortgage
Capital Certificates
Series 2006-7, Class 1A3
5.000%, 08/25/36 | | | 635,716 | |
| | 100,000 | | | Fontainebleau Miami Beach Trust
Series 2001-FBLU, Class C
4.270%, 05/05/27 (d) | | | 101,265 | |
| | 50,000 | | | GE Capital Commercial Mortgage
Series 2005-C4, Class AM
5.437%, 11/10/45 (a) | | | 51,381 | |
| | 50,000 | | | GMAC Commercial Mortgage Securities
Series 2006-C1, Class AM
5.290%, 11/10/45 (a) | | | 50,655 | |
| | 100,000 | | | GMAC Commercial Mortgage Securities
Series 2006 -C1 Class AJ
5.349%, 11/10/45 (a) (e) | | | 75,635 | |
| | 50,000 | | | Greenwich Capital Commercial Funding
Series 2007-GG9, Class A4
5.444%, 03/10/39 | | | 55,532 | |
| | 219,965 | | | HSBC Asset Loan Obligation
Series 2007-2, Class 1A1
5.500%, 09/25/37 | | | 213,806 | |
| | 58,790 | | | JPMorgan Chase Commercial
Mortgage Securities
Series 2003 -CB6 Class A1
4.393%, 07/12/37 | | | 59,262 | |
| | 40,000 | | | JPMorgan Chase Commercial
Mortgage Securities
Series 2006-CB16, Class A4
5.552%, 05/12/45 | | | 45,236 | |
| | 2,635,149 | | | JPMorgan Chase Commercial
Mortgage Securities
Series 2006-LDP8, Class X
0.735%, 05/15/45 (a) (b) | | | 50,107 | |
| | 1,286,883 | | | JPMorgan Chase Commercial
Mortgage Securities
Series 2011-C4, Class XA
1.793%, 07/15/46 (a) (b) (d) | | | 98,467 | |
| | 25,000 | | | JPMorgan Chase Commercial
Mortgage Securities
Series 2011-C5, Class AS
5.491%, 08/15/46 (a) (d) | | | 27,986 | |
| | 50,000 | | | JPMorgan Chase Commercial
Mortgage Securities
Series 2007-CB19, Class A4
5.925%, 02/12/49 (a) | | | 57,278 | |
| | 100,000 | | | JPMorgan Chase Commercial
Mortgage Securities
Series 2007 -CB17 Class AM
5.925%, 02/12/49 (a) | | | 97,512 | |
| | 50,000 | | | JPMorgan Chase Commercial
Mortgage Securities
Series 2007-CB20, Class A4
5.794%, 02/12/51 (a) | | | 57,770 | |
| | 50,000 | | | JPMorgan Chase Commercial
Mortgage Securities
Series 2007-C1, Class A4
5.716%, 02/15/51 | | | 55,507 | |
| | | | |
See accompanying Notes to Financial Statements. | | | | |
| | | 31 | |
| | | | |
| | | | |
Aston Funds | | | | |
ASTON/DoubleLine Core Plus Fixed Income Fund | | | April 30, 2012 | |
Schedule of Investments (unaudited) – continued | | | | |
| | |
| | | | | | | | |
Par Value | | | | | Market
Value | |
| | $100,000 | | | LB-UBS Commercial Mortgage Trust
Series 2006 -C7 Class AJ
5.407%, 11/15/38 (e) | | $ | 57,147 | |
| | 8,153,346 | | | LB-UBS Commercial Mortgage Trust
Series 2007-C7, Class XCL
0.121%, 09/15/45 (a) (b) (d) | | | 69,727 | |
| | 36,289 | | | Morgan Stanley Capital I
Series 2006-HQ9, Class AAB
5.685%, 07/12/44 | | | 37,598 | |
| | 50,000 | | | Morgan Stanley Capital I
Series 2006-HQ9, Class AM
5.773%, 07/12/44 (a) | | | 54,347 | |
| | 1,479,308 | | | Morgan Stanley Capital I
Series 2011-C1, Class XA
1.148%, 09/15/47 (a) (b) (d) | | | 56,806 | |
| | 7,244,413 | | | Morgan Stanley Capital I
Series 2007-1Q16, Class X2
0.368%, 12/12/49 (a) (b) (d) | | | 58,796 | |
| | 300,000 | | | Nomura Asset Acceptance
Series 2005-AP3, Class A3
5.318%, 08/25/35 (a) | | | 188,603 | |
| | 63,102 | | | Prudential Commercial Mortgage Trust
Series 2003 -PWR1 Class A1
3.669%, 02/11/36 | | | 63,542 | |
| | 320,400 | | | Residential Asset Securitization Trust
Series 2006-A6, Class 1A1
6.500%, 07/25/36 | | | 171,901 | |
| | 824,081 | | | Residential Asset Securitization Trust
Series 2007-A1, Class A8
6.000%, 03/25/37 | | | 535,767 | |
| | 100,000 | | | Rialto Real Estate Fund LP
Series 2012-LT1A, Class A
4.750%, 02/15/25 (d) | | | 100,511 | |
| | 601,888 | | | Structured Adjustable Rate Mortgage Loan Trust
Series 2006-1, Class 2A2
5.326%, 02/25/36 (a) | | | 419,152 | |
| | 245,259 | | | Structured Asset Securities
Series 2005-10, Class 1A1
5.750%, 06/25/35 | | | 226,768 | |
| | 100,000 | | | TIAA Seasoned Commercial
Mortgage Trust
Series 2007-C4 Class AJ
5.656%, 08/15/39 (a) | | | 104,508 | |
| | 25,000 | | | Wachovia Bank Commercial
Mortgage Trust
Series 2005-C22, Class AM
5.493%, 12/15/44 (a) | | | 26,404 | |
| | 602,890 | | | Wells Fargo Alternative Loan Trust
Series 2007-PA2, Class 1A1
6.000%, 06/25/37 | | | 501,198 | |
| | 1,000,000 | | | Wells Fargo Mortgage Backed
Securities Trust
Series 2007-8, Class 2A2
6.000%, 07/25/37 | | | 981,961 | |
| | 1,021,898 | | | Wells Fargo Mortgage Backed
Securities Trust
Series 2007-8, Class 1A16
6.000%, 07/25/37 | | | 949,275 | |
| | 983,626 | | | Wells Fargo Mortgage Backed
Securities Trust
Series 2007-13, Class A6
6.000%, 09/25/37 | | | 936,255 | |
| | | | | | | | |
Par Value | | | | | Market
Value | |
| | $474,573 | | | Wells Fargo Mortgage Loan Trust
Series 2012-RR1 Class A1
2.847%, 08/27/37 (a) (c) (d)
| | $ | 477,017 | |
| | | | | | | | |
| | | | Total Collateralized Mortgage-
Backed Securities
(Cost $11,902,364) | | | 12,089,851 | |
| | | | | | | | |
| | ASSET-BACKED SECURITIES – 2.24% | |
| | 100,000 | | | Credit-Based Asset Servicing and
Securitization
Series 2007-MX1, Class A4
6.231%, 12/25/36 (d) (f) | | | 68,011 | |
| | 757,000 | | | GSAA Trust
Series 2006-15, Class AF3B
5.933%, 09/25/36 (a) | | | 134,436 | |
| | 565,042 | | | Residential Asset Mortgage Products
Series 2006-RS5, Class A3
0.409%, 09/25/36 (a)
| | | 410,652 | |
| | 500,000 | | | Residential Asset Securities
Series 2004-KS6, Class A15
5.850%, 07/25/34 (a) | | | 395,762 | |
| | 756,701 | | | Series 2005-KS4, Class M1
0.649%, 05/25/35 (a)
| | | 721,579 | |
| | | | | | | | |
| | | | Total Asset-Backed Securities
(Cost $1,763,054) | | | 1,730,440 | |
| | | | | | | | |
| | FOREIGN GOVERNMENT BONDS – 3.70% | |
| | 300,000 | | | Banco Latinoamericano de Comercio Exterior
Senior Unsecured Notes
3.750%, 04/04/17 (d) | | | 300,750 | |
| | 325,000 | | | Corp Andina de Fomento
Senior Unsecured Notes
3.750%, 01/15/16 | | | 341,286 | |
| | 226,000 | | | Mexico Government International Bond
Senior Unsecured Notes
5.625%, 01/15/17 | | | 264,985 | |
| | 50,000 | | | Province of Ontario Canada
2.300%, 05/10/16 | | | 52,068 | |
| | 400,000 | | | Qatar Government International Bond
4.500%, 01/20/22 | | | 424,000 | |
| | 250,000 | | | Qatar Government International Bond
6.400%, 01/20/40 | | | 300,313 | |
| | 250,000 | | | Ras Laffan Liquefied Natural Gas III
5.838%, 09/30/27 | | | 270,685 | |
| | 200,000 | | | Russian Foreign Bond
4.500%, 04/04/22 (c) (d) | | | 207,600 | |
| | 400,000 | | | South Africa Government
International Bond
Senior Unsecured Notes
4.665%, 01/17/24 | | | 421,000 | |
| | 250,000 | | | Wakala Global Sukuk
4.646%, 07/06/21
| | | 273,930 | |
| | | | | | | | |
| | | | Total Foreign Government Bonds
(Cost $2,808,042) | | | 2,856,617 | |
| | | | | | | | |
| Total Investments – 95.85%
(Cost $72,559,022)* 74,070,926 |
|
| Net Other Assets and Liabilities – 4.15% | | | 3,204,500 | |
| | | | | | | | |
| | Net Assets – 100.00% | | $ | 77,275,426 | |
| | | | | | | | |
|
See accompanying Notes to Financial Statements. |
| 32 |
| |
| | | | |
Aston Funds | | | | |
ASTON/DoubleLine Core Plus Fixed Income Fund | | | April 30, 2012 | |
Schedule of Investments (unaudited) – continued | | | | |
| | |
| * | At April 30, 2012, cost is identical for book and Federal income tax purposes. |
| | | | |
| Gross unrealized appreciation | | $ | 1,736,879 | |
| Gross unrealized depreciation | | | (224,975 | ) |
| | | | |
| Net unrealized appreciation | | $ | 1,511,904 | |
| | | | |
| (a) | Variable rate bond. The interest rate shown reflects the rate in effect at April 30, 2012. |
| (b) | Interest only security. These securities represent the right to receive the monthly interest payments on an underlying pool of mortgages. Payments of principal on the pool reduce the value the “interest only” holding. |
| (c) | Securities with a total aggregate market value of $1,557,203 or 2.02% of the net assets were valued under the fair valuation procedures established by the Fund’s Board of Trustees. |
| (d) | Securities exempt from registration under Rule 144A of the Securities Act of 1933, as amended. These securities are purchased in accordance with guidelines approved by the Fund’s Board of Trustees and may only be resold, in transactions exempt from registration, to qualified institutional buyers. At April 30, 2012, these securities amounted to $5,933,278 or 7.68% of net assets. These securities have been determined by the Subadviser to be liquid securities. |
| (e) | Delayed delivery security. See Note B-3 in the Notes to Financial Statements. |
| (f) | Step Coupon. Security becomes interest bearing at a future date. |
| (g) | Security with a market value of $441,844 has been pledged as collateral for delayed delivery securities. |
| REIT | Real Estate Investment Trust |
| REMIC | Real Estate Mortgage Investment Conduit |
Portfolio Composition
| | | | |
U.S. Government Obligations | | | 19 | % |
U.S. Government Agency Obligations | | | 30 | % |
Corporate Notes and Bonds (S&P Ratings) | | | | |
AAA | | | 2 | % |
AA | | | 4 | % |
A | | | 11 | % |
BBB | | | 17 | % |
BB | | | 3 | % |
B | | | 2 | % |
Lower than B | | | 11 | % |
Not Rated | | | 1 | % |
| | | | |
| | | 100 | % |
| | | | |
| | | | |
See accompanying Notes to Financial Statements. | | | | |
| | | 33 | |
| | | | |
| | | | |
Aston Funds | | | | |
| ASTON/TCH Fixed Income Fund | | | April 30, 2012 | |
Schedule of Investments (unaudited) | | | | |
| | |
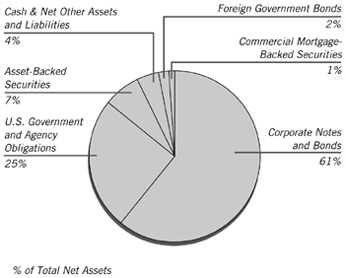
| | | | | | | | |
| Par Value | | | | | Market
Value | |
| CORPORATE NOTES AND BONDS – 60.69% | |
| | | | Consumer Discretionary – 5.60% | |
| | | | JC Penney
Senior Unsecured Notes | | | | |
| | $300,000 | | | 6.375%, 10/15/36 | | $ | 258,750 | |
| | 250,000 | | | 7.400%, 04/01/37 | | | 241,250 | |
| | 1,000,000 | | | Limited Brands
Senior Unsecured Notes
7.600%, 07/15/37 | | | 1,015,000 | |
| | | | Macy’s Retail Holdings | | | | |
| | 100,000 | | | 7.875%, 07/15/15 (a) | | | 117,597 | |
| | 500,000 | | | 6.375%, 03/15/37 | | | 587,499 | |
| | 250,000 | | | Mattel
Senior Unsecured Notes
6.200%, 10/01/40 | | | 285,171 | |
| | 500,000 | | | O’Reilly Automotive
4.625%, 09/15/21 | | | 540,741 | |
| | 250,000 | | | Staples
9.750%, 01/15/14 | | | 283,402 | |
| | 450,000 | | | Whirlpool, MTN
Unsecured Notes
8.600%, 05/01/14 | | | 505,548 | |
| | 250,000 | | | Wyndham Worldwide
Senior Unsecured Notes
7.375%, 03/01/20 | | | 299,183 | |
| | | | | | | | |
| | | | | | | 4,134,141 | |
| | | | | | | | |
| | | | Consumer Staples – 2.84% | | | | |
| | | | Altria Group | | | | |
| | 500,000 | | | 8.500%, 11/10/13 | | | 556,512 | |
| | 200,000 | | | 10.200%, 02/06/39 | | | 321,104 | |
| | 250,000 | | | Corn Products International
Senior Unsecured Notes 6.625%, 04/15/37 | | | 294,691 | |
| | 200,000 | | | Kellogg
Senior Unsecured Notes
5.125%, 12/03/12 | | | 205,515 | |
| | | | | | | | |
| Par Value | | | | | Market
Value | |
| | | | Consumer Staples (continued) | | | | |
| | $150,000 | | | PepsiCo
Senior Unsecured Notes
7.900%, 11/01/18 | | $ | 203,747 | |
| | 250,000 | | | Ralcorp Holdings
6.625%, 08/15/39 | | | 260,759 | |
| | 200,000 | | | Reynolds American
7.750%, 06/01/18 | | | 251,138 | |
| | | | | | | | |
| | | | | | | 2,093,466 | |
| | | | | | | | |
| | | | Energy – 9.79% | | | | |
| | | | Chesapeake Energy | | | | |
| | 500,000 | | | 6.775%, 03/15/19 | | | 486,875 | |
| | 250,000 | | | 6.625%, 08/15/20 | | | 245,000 | |
| | 250,000 | | | 6.125%, 02/15/21 | | | 237,500 | |
| | 250,000 | | | CNOOC Finance 212
3.875%, 05/02/22 (b) (e) | | | 250,556 | |
| | 500,000 | | | Dolphin Energy
5.500%, 12/15/21 (b) | | | 535,000 | |
| | 500,000 | | | Ecopetrol SA
Senior Unsecured Notes
7.625%, 07/23/19 | | | 630,250 | |
| | 250,000 | | | El Paso Pipeline Partners Operating
7.500%, 11/15/40 | | | 301,506 | |
| | 250,000 | | | Energy Transfer Partners
Senior Unsecured Notes
9.000%, 04/15/19 | | | 312,797 | |
| | 500,000 | | | 6.500%, 02/01/42 | | | 531,176 | |
| | 400,000 | | | Hess
Senior Unsecured Notes
8.125%, 02/15/19 | | | 520,432 | |
| | 400,000 | | | Kinder Morgan Energy Partners
Senior Unsecured Notes
9.000%, 02/01/19 | | | 515,301 | |
| | 450,000 | | | Nabors Industries
9.250%, 01/15/19 | | | 587,050 | |
| | 250,000 | | | Pride International
Senior Unsecured Notes
6.875%, 08/15/20 | | | 308,215 | |
| | 750,000 | | | Rockies Express Pipeline
Senior Unsecured Notes
6.875%, 04/15/40 (b) | | | 633,750 | |
| | 250,000 | | | Rowan
Senior Unsecured Notes
5.000%, 09/01/17 | | | 270,078 | |
| | 250,000 | | | Valero Energy
9.375%, 03/15/19 | | | 330,888 | |
| | 400,000 | | | Weatherford International
9.625%, 03/01/19 | | | 529,628 | |
| | | | | | | | |
| | | | | | | 7,226,002 | |
| | | | | | | | |
| | | | Financials – 20.95% | | | | |
| | 250,000 | | | AFLAC
Senior Unsecured Notes
8.500%, 05/15/19 | | | 330,668 | |
| | 450,000 | | | American Financial Group
Senior Unsecured Notes
9.875%, 06/15/19 | | | 556,581 | |
| | 250,000 | | | Banco Bradesco SA/Cayman
Islands Subordinated Notes
5.750%, 03/01/22 (b) | | | 254,750 | |
| | 250,000 | | | Bancolombia SA
Senior Unsecured Notes
5.950%, 06/03/21 | | | 266,875 | |
|
See accompanying Notes to Financial Statements. |
| 34 |
| |
| | | | |
Aston Funds | | | | |
| ASTON/TCH Fixed Income Fund | | | April 30, 2012 | |
Schedule of Investments (unaudited) – continued | | | | |
| | |
| | | | | | | | |
| Par Value | | | | | Market
Value | |
| | | | Financials (continued) | | | | |
| | $250,000 | | | Berkshire Hathaway Finance
Senior Unsecured Notes
0.940%, 02/11/13 (c) | | $ | 251,275 | |
| | 150,000 | | | Blackstone Holdings Finance
6.625%, 08/15/19 (b) (d) | | | 162,543 | |
| | 250,000 | | | Bunge Ltd Finance
8.500%, 06/15/19 | | | 311,371 | |
| | 500,000 | | | Daimler Finance
1.249%, 04/10/14 (b) (c) | | | 500,186 | |
| | 250,000 | | | Discover Bank
Subordinated Notes
7.000%, 04/15/20
| | | 291,050 | |
| | 250,000 | | | Export-Import Bank of Korea
4.375%, 09/15/21 | | | 255,860 | |
| | 500,000 | | | 5.000%, 04/11/22 | | | 539,215 | |
| | 1,000,000 | | | General Electric Capital, MTN
Senior Unsecured Notes
1.166%, 04/24/14 (c) | | | 1,002,354 | |
| | 800,000 | | | Goldman Sachs Capital
I 6.345%, 02/15/34 | | | 747,503 | |
| | 250,000 | | | Goldman Sachs Group
Subordinated Notes
6.750%, 10/01/37 | | | 247,821 | |
| | 450,000 | | | Harley-Davidson Funding
5.750%, 12/15/14 (b) | | | 490,068 | |
| | 500,000 | | | HCP
Senior Unsecured Notes
5.375%, 02/01/21 | | | 551,830 | |
| | 500,000 | | | IPIC, GMTN
5.000%, 11/15/20 (b) | | | 521,250 | |
| | 500,000 | | | 6.875%, 11/01/41 (b) | | | 536,250 | |
| | 200,000 | | | Jefferies Group
Senior Unsecured Notes
8.500%, 07/15/19 | | | 222,000 | |
| | 750,000 | | | JPMorgan Chase Capital XXVII
7.000%, 11/01/39 | | | 759,375 | |
| | 250,000 | | | Korea Finance
Senior Unsecured Notes
4.625%, 11/16/21 | | | 260,660 | |
| | 250,000 | | | Lincoln National
Senior Unsecured Notes
| | | | |
| | | | 6.300%, 10/09/37 | | | 273,856 | |
| | 750,000 | | | 7.000%, 06/15/40 | | | 886,712 | |
| | 300,000 | | | Marsh & McLennan
Senior Unsecured Notes
9.250%, 04/15/19 | | | 399,077 | |
| | 750,000 | | | Merrill Lynch, MTN
6.875%, 04/25/18 | | | 836,584 | |
| | 500,000 | | | Morgan Stanley
Senior Unsecured Notes
5.500%, 07/28/21 | | | 489,410 | |
| | 250,000 | | | NASDAQ OMX Group
Senior Unsecured Notes
5.550%, 01/15/20 | | | 261,966 | |
| | 1,000,000 | | | NB Capital Trust II
7.830%, 12/15/26 | | | 1,008,750 | |
| | 125,000 | | | Prudential Financial
Senior Unsecured Notes
5.625%, 05/12/41 | | | 131,289 | |
| | 500,000 | | | Prudential Financial, MTN
5.800%, 11/16/41 | | | 540,085 | |
| | 250,000 | | | Royal Bank of Canada
Senior Unsecured Notes
1.253%, 10/30/14 (c) | | | 252,404 | |
| | | | | | | | |
| Par Value | | | | | Market
Value | |
| | | | Financials (continued) | | | | |
| | $1,000,000 | | | SLM, MTN
Senior Unsecured Notes
5.625%, 08/01/33 | | $ | 835,000 | |
| | 500,000 | | | Wells Fargo
Senior Unsecured Notes
0.666%, 10/28/15 (c) | | | 490,522 | |
| | | | | | | | |
| | | | | | | 15,465,140 | |
| | | | | | | | |
| | | | Healthcare – 2.92% | | | | |
| | | | Davita | | | | |
| | 125,000 | | | 6.375%, 11/01/18 | | | 131,563 | |
| | 375,000 | | | 6.625%, 11/01/20 | | | 394,219 | |
| | 200,000 | | | Hospira, GMTN
Senior Unsecured Notes
6.400%, 05/15/15 | | | 224,184 | |
| | 250,000 | | | Humana
Senior Unsecured Notes
8.150%, 06/15/38 | | | 333,006 | |
| | 500,000 | | | Lorillard Tobacco
8.125%, 05/01/40 | | | 618,397 | |
| | 450,000 | | | WellPoint
Senior Unsecured Notes
6.800%, 08/01/12 | | | 456,904 | |
| | | | | | | | |
| | | | | | | 2,158,273 | |
| | | | | | | | |
| | | | Industrials – 2.75% | | | | |
| | 750,000 | | | Ball 5.750%, 05/15/21 | | | 810,000 | |
| | 250,000 | | | FedEx
Senior Notes
8.000%, 01/15/19 | | | 328,936 | |
| | 250,000 | | | Mattel
Senior Unsecured Notes
5.450%, 11/01/41 | | | 265,454 | |
| | 250,000 | | | Transocean
7.350%, 12/15/41 | | | 306,892 | |
| | 250,000 | | | Waste Management
7.375%, 03/11/19 | | | 318,231 | |
| | | | | | | | |
| | | | | | | 2,029,513 | |
| | | | | | | | |
| | | | Information Technology – 1.69% | |
| | 250,000 | | | KLA Instruments
Senior Unsecured Notes
6.900%, 05/01/18 | | | 302,808 | |
| | 200,000 | | | Motorola
Senior Unsecured Notes
6.625%, 11/15/37 | | | 223,503 | |
| | 500,000 | | | Telecom Italia Capital SA
7.721%, 06/04/38 | | | 471,875 | |
| | 250,000 | | | Xerox
Senior Unsecured Notes
1.874%, 09/13/13 (c) | | | 251,922 | |
| | | | | | | | |
| | | | | | | 1,250,108 | |
| | | | | | | | |
| | | | Materials – 5.62% | | | | |
| | 750,000 | | | ArcelorMittal
Senior Unsecured Notes
5.500%, 03/01/21 | | | 739,596 | |
| | 400,000 | | | 7.000%, 10/15/39 | | | 390,834 | |
| | 700,000 | | | Bemis
Senior Unsecured Notes 6.800%, 08/01/19 | | | 835,369 | |
| | | | |
See accompanying Notes to Financial Statements. | | | | |
| | | 35 | |
| | | | |
| | | | |
Aston Funds | | | | |
| ASTON/TCH Fixed Income Fund | | | April 30, 2012 | |
Schedule of Investments (unaudited) – continued | | | | |
| | |
| | | | | | | | |
| Par Value | | | | | Market
Value | |
| | | | Materials (continued) | | | | |
| | $250,000 | | | Dow Chemical (The)
Senior Unsecured Notes
8.550%, 05/15/19 | | $ | 331,816 | |
| | 250,000 | | | Hyundai Steel
Senior Unsecured Notes
4.625%, 04/21/16 (b) | | | 259,784 | |
| | 500,000 | | | International Paper
Senior Unsecured Notes
8.700%, 06/15/38 | | | 682,567 | |
| | 550,000 | | | Rio Tinto Finance
8.950%, 05/01/14 | | | 634,027 | |
| | 250,000 | | | Sonoco Products
Senior Unsecured Notes
5.750%, 11/01/40 | | | 275,922 | |
| | | | | | | | |
| | | | | | | 4,149,915 | |
| | | | | | | | |
| | | | Telecommunication Services – 4.84% | |
| | 250,000 | | | CBS
8.875%, 05/15/19 | | | 333,536 | |
| | 500,000 | | | CenturyLink
Senior Unsecured Notes
7.600%, 09/15/39 | | | 475,623 | |
| | 500,000 | | | 7.650%, 03/15/42 | | | 475,161 | |
| | 400,000 | | | Expedia
5.950%, 08/15/20 | | | 418,631 | |
| | 350,000 | | | Frontier Communications
Senior Unsecured Notes
9.000%, 08/15/31 | | | 335,125 | |
| | 250,000 | | | Telefonica Emisiones SAU
5.877%, 07/15/19 | | | 246,792 | |
| | 250,000 | | | Telefonica Europe BV
8.250%, 09/15/30 | | | 256,118 | |
| | 450,000 | | | Time Warner Cable
8.250%, 02/14/14 | | | 506,677 | |
| | 500,000 | | | Windstream
7.500%, 06/01/22 | | | 526,250 | |
| | | | | | | | |
| | | | | | | 3,573,913 | |
| | | | | | | | |
| | | | Utilities – 3.69% | | | | |
| | 200,000 | | | Allegheny Energy Supply
Senior Unsecured Notes
6.750%, 10/15/39 (b) | | | 223,789 | |
| | 250,000 | | | CMS Energy
Senior Unsecured Notes
5.050%, 03/15/22 | | | 255,571 | |
| | 500,000 | | | Dubai Electricity & Water Authority
Senior Unsecured Notes
8.500%, 04/22/15 (b) | | | 559,000 | |
| | 450,000 | | | FPL Group Capital
7.875%, 12/15/15 | | | 541,729 | |
| | 250,000 | | | Oncor Electric Delivery
7.500%, 09/01/38 | | | 317,354 | |
| | 150,000 | | | Pacific Gas & Electric
Senior Unsecured Notes
8.250%, 10/15/18 | | | 202,240 | |
| | 450,000 | | | Sempra Energy
Senior Unsecured Notes
9.800%, 02/15/19 | | | 624,839 | |
| | | | | | | | |
| | | | | | | 2,724,522 | |
| | | | | | | | |
| | | | Total Corporate Notes and Bonds
(Cost $40,721,270) | | | 44,804,993 | |
| | | | | | | | |
| | | | | | | | |
| Par Value | | | | | Market
Value | |
| U.S. GOVERNMENT AND AGENCY
OBLIGATIONS – 24.82% | | | | |
| | | | Fannie Mae – 7.57% | | | | |
| | $332,756 | | | 6.000%, 11/01/17,
Pool # 662854 | | $ | 364,408 | |
| | 144,183 | | | 6.000%, 04/01/18,
Pool # 725175 | | | 157,898 | |
| | 293,660 | | | 5.500%, 11/01/18,
Pool # 748886 | | | 321,818 | |
| | 136,414 | | | 4.500%, 06/01/19,
Pool # 747860 | | | 148,170 | |
| | 594,060 | | | 6.000%, 01/01/21,
Pool # 850787 | | | 651,496 | |
| | 272,720 | | | 6.000%, 09/01/32,
Pool # 847899 | | | 305,755 | |
| | 132,236 | | | 6.000%, 02/01/34,
Pool # 771952 | | | 148,254 | |
| | 108,763 | | | 7.500%, 02/01/35,
Pool # 787557 | | | 133,425 | |
| | 59,183 | | | 7.500%, 04/01/35,
Pool # 819231 | | | 72,658 | |
| | 198,710 | | | 6.000%, 11/01/35,
Pool # 844078 | | | 221,227 | |
| | 314,556 | | | 5.000%, 05/01/36,
Pool # 745581 | | | 342,098 | |
| | 211,877 | | | 6.000%, 12/01/36,
Pool # 888029 | | | 234,960 | |
| | 279,404 | | | 5.500%, 06/01/37,
Pool # 918778 | | | 305,783 | |
| | 265,099 | | | 6.500%, 10/01/37,
Pool # 888890 | | | 299,619 | |
| | 866,762 | | | 5.500%, 03/01/38,
Pool # 962344 | | | 948,596 | |
| | 438,449 | | | 4.000%, 02/01/41,
Pool # AE0949 | | | 464,422 | |
| | 441,942 | | | 4.000%, 02/01/41,
Pool # AH5695 | | | 468,053 | |
| | | | | | | | |
| | | | | | | 5,588,640 | |
| | | | | | | | |
| | | | Freddie Mac – 7.68% | | | | |
| | 625,708 | | | 5.500%, 11/01/20,
Gold Pool # G18083 | | | 680,901 | |
| | 117,410 | | | 5.500%, 12/01/20,
Gold Pool # G11820 | | | 127,766 | |
| | 126,362 | | | 6.000%, 10/01/35,
Gold Pool # A47772 | | | 140,168 | |
| | 332,777 | | | 5.500%, 05/01/37,
Gold Pool # A60048 | | | 362,897 | |
| | 608,509 | | | 5.500%, 09/01/37,
Gold Pool # G03202 | | | 663,584 | |
| | 709,322 | | | 5.000%, 02/01/38,
Gold Pool # A73409 | | | 767,106 | |
| | 1,033,244 | | | 5.000%, 04/01/38,
Gold Pool # G04334 | | | 1,139,858 | |
| | 482,495 | | | 4.000%, 12/01/39,
Gold Pool # G06935 | | | 509,795 | |
| | 217,902 | | | 4.000%, 05/01/41,
Gold Pool # Q00870 | | | 230,470 | |
| | 990,089 | | | 4.000%, 11/01/41,
Gold Pool # Q04550 | | | 1,047,193 | |
| | | | | | | | |
| | | | | | | 5,669,738 | |
| | | | | | | | |
|
See accompanying Notes to Financial Statements. |
| 36 |
| |
| | | | |
Aston Funds | | | | |
| ASTON/TCH Fixed Income Fund | | | April 30, 2012 | |
Schedule of Investments (unaudited) – continued | | | | |
| | |
| | | | | | | | |
| Par Value | | | | | Market
Value | |
| | | | Government National Mortgage Association – 3.93% | |
| | $337,532 | | | 5.000%, 05/01/37,
Pool # 782156 | | $ | 373,992 | |
| | 798,949 | | | 5.000%, 08/20/37,
Pool # 4015 | | | 888,487 | |
| | 574,723 | | | 6.000%, 07/20/38,
Pool # 4195 | | | 648,112 | |
| | 680,437 | | | 5.500%, 08/20/38,
Pool # 4215 | | | 740,069 | |
| | 220,856 | | | 6.000%, 01/15/39,
Pool # 698036 | | | 249,529 | |
| | | | | | | | |
| | | | | | | 2,900,189 | |
| | | | | | | | |
| | | | U.S. Treasury Bill – 1.35% | | | | |
| | 1,000,000 | | | 0.075%, 06/07/12 | | | 999,933 | |
| | | | | | | | |
| | | | U.S. Treasury Inflation Index Bonds – 4.29% | |
| | 1,580,850 | | | 1.375%, 07/15/18 | | | 1,832,798 | |
| | 1,084,810 | | | 1.750%, 01/15/28 | | | 1,336,944 | |
| | | | | | | | |
| | | | | | | 3,169,742 | |
| | | | | | | | |
| | | | Total U.S. Government and Agency Obligations
(Cost $16,830,088) | | | 18,328,242 | |
| | | | | | | | |
| COMMERCIAL MORTGAGE-BACKED
SECURITIES – 1.51% |
|
| | 275,000 | | | Bear Stearns Commercial
Mortgage Securities
Series 2007-T28, Class A4
5.742%, 09/11/42 (c) | | | 322,219 | |
| | 793,038 | | | JP Morgan Chase Commercial
Mortgage Securities
Series 2005-CB13, Class A2
5.247%, 01/12/43 | | | 795,622 | |
| | | | | | | | |
| | | | Total Commercial Mortgage-Backed Securities
(Cost $935,636) | | | 1,117,841 | |
| | | | | | | | |
| | ASSET-BACKED SECURITIES – 6.90% | |
| | 293,744 | | | Capital Auto Receivables Asset Trust
Series 2008-2, Class A4
5.420%, 12/15/14 | | | 296,990 | |
| | 453,339 | | | CarMax Auto Owner Trust
Series 2009-1, Class A4
5.810%, 12/16/13 | | | 461,362 | |
| | 38,786 | | | Ford Credit Auto Owner Trust Series 2008-B, Class A4A
4.950%, 03/15/13 | | | 38,882 | |
| | 372,852 | | | Series 2008-C, Class A4A
5.160%, 04/15/13 | | | 374,653 | |
| | 819,694 | | | 6.070%, 05/15/14 | | | 839,192 | |
| | 300,000 | | | Series 2009-B, Class A4
4.500%, 07/15/14 | | | 307,552 | |
| | 112,242 | | | Harley-Davidson Motorcycle Trust Series 2008-1, Class A4
4.900%, 12/15/13 | | | 113,000 | |
| | 881,793 | | | 4.550%, 01/15/17 | | | 889,483 | |
| | | | Nissan Auto Receivables Owner Trust | | | | |
| | 42,611 | | | Series 2009-1, Class A3
5.000%, 09/15/14 | | | 42,886 | |
| | 664,372 | | | Series 2008-B, Class A4
5.050%, 11/17/14 | | | 671,609 | |
| | | | | | |
| Par Value | | | | Market
Value | |
| $1,042,329 | | USAA Auto Owner Trust Series 2009-1, Class A4
4.770%, 09/15/14 | | $ | 1,055,837 | |
| | | | | | |
| | Total Asset-Backed Securities
(Cost $5,118,306) | | | 5,091,446 | |
| | | | | | |
FOREIGN GOVERNMENT BONDS – 1.67% | |
| 500,000 | | Republic of Latvia
5.250%, 02/22/17 (b) | | | 515,000 | |
| 500,000 | | Republic of Poland
5.000%, 03/23/22 | | | 537,500 | |
| 150,000 | | State of Qatar Senior Notes
6.400%, 01/20/40 (b) | | | 180,188 | |
| | | | | | |
| | Total Foreign Government Bonds
(Cost $1,140,391) | | | 1,232,688 | |
| | | | | | |
| | | | | | |
Shares | | | | | |
INVESTMENT COMPANY – 2.36% | | | | |
| 1,741,634 | | BlackRock Liquidity Funds TempCash Portfolio (f) | | | 1,741,634 | |
| | | | | | |
| | Total Investment Company
(Cost $1,741,634) | | | 1,741,634 | |
| | | | | | |
Total Investments – 97.95%
(Cost $66,487,325)* | | | 72,316,844 | |
| | | | | | |
Net Other Assets and Liabilities – 2.05% | | | 1,510,594 | |
| | | | | | |
Net Assets – 100.00% | | $ | 73,827,438 | |
| | | | | | |
| * | At April 30, 2012, cost is identical for book and Federal income tax purposes. |
| | | | |
Gross unrealized appreciation | | $ | 6,292,279 | |
Gross unrealized depreciation | | | (462,760 | ) |
Net unrealized appreciation | | $ | 5,829,519 | |
| | | | |
| (a) | Step Coupon. A bond that pays an initial coupon rate for the first period and then a higher coupon rate for the following periods until maturity. The coupon rate will be 7.875% untill maturity. |
| (b) | Securities exempt from registration under Rule 144A of the Securities Act of 1933, as amended. These securities are purchased in accordance with guidelines approved by the Fund’s Board of Trustees and may only be resold, in transactions exempt from registration, to qualified institutional buyers. At April 30, 2012, these securities amounted to $5,622,114 or 7.62% of net assets. These securities have been determined by the Subadviser to be liquid securities. |
| (c) | Variable rate bond. The interest rate shown reflects the rate in effect at April 30, 2012. |
| (d) | Standard & Poor’s (S&P) credit ratings are used in the absence of a rating by Moody’s Investors, Inc. |
| (e) | Delayed delivery security. See Note B-3 in the Notes to Financial Statements. |
| (f) | Security with a market value of $556,928 has been pledged as collateral for delayed delivery security. |
| GMTN | Global Medium Term Note |
| NASDAQ | MTN Medium Term Note Automated Quotations |
| | | | |
See accompanying Notes to Financial Statements. | | | | |
| | | 37 | |
| | | | |
| | | | |
Aston Funds | | | | |
ASTON/TCH Fixed Income Fund | | | April 30, 2012 | |
Schedule of Investments (unaudited) – continued | | | | |
| | | XXXXXX | |
Portfolio Composition | | | | |
Investment Company | | | 2 | % |
U.S. Government Obligations | | | 6 | % |
U.S. Government Agency Obligations | | | 19 | % |
Corporate Notes and Bonds | | | | |
(Moody’s Ratings (d) unaudited) | | | | |
Aaa | | | 9 | % |
Aa | | | 3 | % |
A | | | 11 | % |
Baa | | | 37 | % |
Ba | | | 12 | % |
B | | | 1 | % |
| | | | |
| | | 100 | % |
| | | | |
|
See accompanying Notes to Financial Statements. |
| 38 |
| |
| | | | |
Aston Funds | | | | |
ASTON/Lake Partners LASSO Alternatives Fund | | | April 30, 2012 | |
Schedule of Investments (unaudited) | | | | |
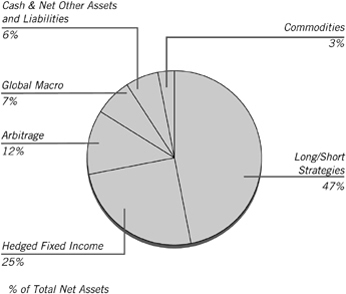
| | | | | | | | |
| Shares | | | | | Market
Value | |
| INVESTMENT COMPANIES – 101.20% | | | | |
| | | | Arbitrage – 11.46% | |
| | 8,086 | | | Arbitrage Fund-I | | $ | 106,166 | |
| | 348,167 | | | Dunham Monthly Distribution Fund-N | | | 12,927,447 | |
| | 818,039 | | | Merger Fund | | | 12,933,193 | |
| | 362,865 | | | Touchstone Merger Arbitrage Fund | | | 3,846,371 | |
| | | | | | | | |
| | | | | | | 29,813,177 | |
| | | | | | | | |
| | | | Hedged Fixed Income – 25.19% | |
| | 615,659 | | | Driehaus Active Income Fund . | | | 6,470,573 | |
| | 643,519 | | | Driehaus Select Credit Fund | | | 6,505,979 | |
| | 11,912 | | | Eaton Vance Global Macro Absolute Return Fund-I | | | 118,409 | |
| | 1,200,988 | | | John Hancock Funds II - Strategic Income Opportunities Fund . | | | 13,018,714 | |
| | 2,602,473 | | | Metropolitan West High Yield Bond Fund-I | | | 26,337,029 | |
| | 1,000,048 | | | Templeton Global Total Return Fund-AD | | | 13,070,631 | |
| | | | | | | | |
| | | | | | | 65,521,335 | |
| | | | | | | | |
| | | | Commodities – 2.87% | |
| | 97,523 | | | Forward Commodity Long/Short Strategy Fund-I | | | 2,534,628 | |
| | 192,259 | | | Guggenheim - Long/Short Commodities Strategy Fund-Y | | | 4,921,820 | |
| | | | | | | | |
| | | | | | | 7,456,448 | |
| | | | | | | | |
| | | | Global Macro – 7.46% | |
| | 1,812,858 | | | John Hancock Funds II - Global Absolute Return Strategies Fund * | | | 19,397,578 | |
| | | | | | | | |
| | | | Long/Short Strategies – 47.16% | |
| | 1,140,367 | | | FPA Crescent Fund-I | | | 32,432,027 | |
| | 2,508,348 | | | Robeco Boston Partners Long/Short Equity Fund-IS | | | 50,618,463 | |
| | 377,343 | | | Royce Global Select Fund-INV | | | 6,629,922 | |
| | | | | | | | |
| Shares | | | | | Market
Value | |
| | | | Long/Short Strategies (continued) | | | | |
| | 2,543,350 | | | The Weitz Funds - Partners III Opportunity Fund | | $ | 32,885,520 | |
| | 9,990 | | | Turner Medical Sciences Long/Short Fund * | | | 101,503 | |
| | | | | | | | |
| | | | | | | 122,667,435 | |
| | | | | | | | |
| | | | Cash Equivalents – 7.06% | |
| | 18,352,297 | | | Blackrock Liquidity Funds Treasury Trust Fund Portfolio | | | 18,352,297 | |
| | | | | | | | |
| | | | Total Investment Companies
(Cost $257,948,143) | | | 263,208,270 | |
| | | | | | | | |
| Total Investments – 101.20%
(Cost $257,948,143)** | | | 263,208,270 | |
| | | | | | | | |
| Net Other Assets and Liabilities – (1.20)% | | | (3,121,875 | ) |
| | | | | | | | |
| Net Assets – 100.00% | | $ | 260,086,395 | |
| | | | | | | | |
| * | Non-income producing security. |
| ** | At April 30, 2012, cost is identical for book and Federal income tax purposes. |
| | | | |
Gross unrealized appreciation | | $ | 6,131,121 | |
Gross unrealized depreciation | | | (870,994 | ) |
| | | | |
Net unrealized appreciation | | $ | 5,260,127 | |
| | | | |
| | | | |
See accompanying Notes to Financial Statements. | | | | |
| | | 39 | |
| | | | |
| | | | |
Aston Funds | | | | |
ASTON Dynamic Allocation Fund | | | April 30, 2012 | |
Schedule of Investments (unaudited) | | | | |
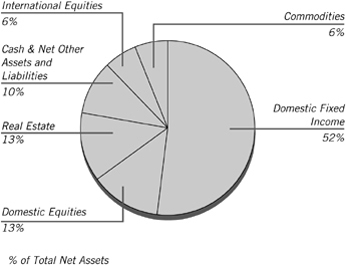
| | | | | | | | |
| Shares | | | | | Market
Value | |
| EXCHANGE TRADED FUNDS – 89.59% | | | | |
| | | | Commodities – 6.03% | | | | |
| | 36,470 | | | iShares Silver Trust * | | $ | 1,098,111 | |
| | 6,995 | | | SPDR Gold Shares * | | | 1,132,351 | |
| | | | | | | | |
| | | | | | | 2,230,462 | |
| | | | | | | | |
| | | | Domestic Equities – 12.91% | | | | |
| | 133,324 | | | Financial Select Sector SPDR Fund | | | 2,055,856 | |
| | 30,820 | | | Health Care Select Sector SPDR Fund | | | 1,156,058 | |
| | 43,928 | | | Utilities Select Sector SPDR Fund | | | 1,566,472 | |
| | | | | | | | |
| | | | | | | 4,778,386 | |
| | | | | | | | |
| | | | Domestic Fixed Income – 51.96% | |
| | 174,698 | | | iShares Barclays 1-3 Year Treasury Bond Fund | | | 14,754,993 | |
| | 20,391 | | | iShares Barclays Aggregate Bond Fund | | | 2,255,041 | |
| | 19,044 | | | iShares iBoxx Investment Grade Corporate Bond Fund | | | 2,218,245 | |
| | | | | | | | |
| | | | | | | 19,228,279 | |
| | | | | | | | |
| | | | International Equities – 6.07% | |
| | 94,177 | | | iShares MSCI Australia Index Fund | | | 2,245,180 | |
| | | | | | | | |
| | | | Real Estate – 12.62% | |
| | 30,226 | | | iShares Cohen & Steers Realty Majors Index Fund | | | 2,379,995 | |
| | 34,959 | | | Vanguard REIT | | | 2,288,766 | |
| | | | | | | | |
| | | | | | | 4,668,761 | |
| | | | | | | | |
| | | | Total Exchange Traded Funds
(Cost $32,935,383) | | | 33,151,068 | |
| | | | | | | | |
| | | | | | | | |
| Shares | | | | | Market
Value | |
| INVESTMENT COMPANY – 10.51% | | | | |
| | 3,890,174 | | | BlackRock Liquidity Funds TempCash Portfolio | | $ | 3,890,174 | |
| | | | | | | | |
| | | | Total Investment Company
(Cost $3,890,174) | | | 3,890,174 | |
| | | | | | | | |
| Total Investments – 100.10%
(Cost $36,825,557)** | | | 37,041,242 | |
| | | | | | | | |
| Net Other Assets and Liabilities – (0.10)% | | | (38,514 | ) |
| | | | | | | | |
| Net Assets – 100.00% | | $ | 37,002,728 | |
| | | | | | | | |
| * | Non-income producing security. |
| ** | At April 30, 2012, cost is identical for book and Federal income tax purposes. |
| | | | |
Gross unrealized appreciation | | $ | 290,440 | |
Gross unrealized depreciation | | | (74,755 | ) |
| | | | |
Net unrealized appreciation | | $ | 215,685 | |
| | | | |
| MSCI | Morgan Stanley Capital International |
| REIT | Real Estate Investment Trust |
| SPDR | Standard & Poor’s Depositary Receipt |
|
See accompanying Notes to Financial Statements. |
| 40 |
| |
| | | | |
Aston Funds | | | | |
ASTON/M.D. Sass Enhanced Equity Fund | | | April 30, 2012 | |
Schedule of Investments (unaudited) | | | | |
| | |
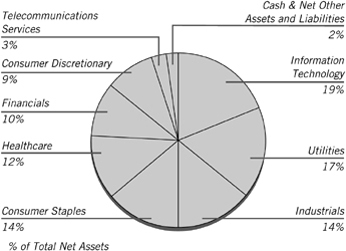
| | | | | | | | |
| Shares | | | | | Market
Value | |
| COMMON STOCKS – 97.36% | | | | |
| | | | Consumer Discretionary – 8.77% | |
| | 135,000 | | | Carnival (a) | | $ | 4,386,150 | |
| | 87,000 | | | Kohl’s (a) | | | 4,361,310 | |
| | 280,000 | | | Staples (a) | | | 4,312,000 | |
| | | | | | | | |
| | | | | | | 13,059,460 | |
| | | | | | | | |
| | | | Consumer Staples – 13.74% | |
| | 170,000 | | | ConAgra Foods (a) | | | 4,389,400 | |
| | 68,000 | | | PepsiCo (a) | | | 4,488,000 | |
| | 40,000 | | | Procter & Gamble | | | 2,545,600 | |
| | 155,000 | | | Sysco (a) | | | 4,479,500 | |
| | 130,000 | | | Walgreen (a) | | | 4,557,800 | |
| | | | | | | | |
| | | | | | | 20,460,300 | |
| | | | | | | | |
| | | | Financials – 10.34% | |
| | 240,000 | | | Bank of America (a) | | | 1,946,400 | |
| | 125,000 | | | MetLife (a) | | | 4,503,750 | |
| | 63,000 | | | PartnerRe (Bahamas) (a) | | | 4,386,060 | |
| | 50,000 | | | SunTrust Banks (a) | | | 1,214,000 | |
| | 100,000 | | | Wells Fargo (a) | | | 3,343,000 | |
| | | | | | | | |
| | | | | | | 15,393,210 | |
| | | | | | | | |
| | | | Healthcare – 11.96% | | | | |
| | 55,000 | | | Becton Dickinson (a) | | | 4,314,750 | |
| | 110,000 | | | Eli Lilly (a) | | | 4,552,900 | |
| | 67,000 | | | Johnson & Johnson (a) | | | 4,361,030 | |
| | 120,000 | | | Medtronic (a) | | | 4,584,000 | |
| | | | | | | | |
| | | | | | | 17,812,680 | |
| | | | | | | | |
| | | | Industrials – 13.88% | | | | |
| | 90,000 | | | Eaton (a) | | | 4,336,200 | |
| | 90,000 | | | Emerson Electric (a) | | | 4,728,600 | |
| | 200,000 | | | General Electric (a) | | | 3,916,000 | |
| | 5,000 | | | Illinois Tool Works (a) | | | 286,900 | |
| | 25,000 | | | Lockheed Martin (a) | | | 2,263,500 | |
| | 15,100 | | | Raytheon (a) | | | 817,514 | |
| | 53,000 | | | United Technologies (a) | | | 4,326,920 | |
| | | | | | | | |
| | | | | | | 20,675,634 | |
| | | | | | | | |
| | | | | | | | |
| Shares | | | | | Market
Value | |
| | | | Information Technology – 18.69% | |
| | 370,000 | | | Applied Materials (a) | | $ | 4,436,300 | |
| | 225,000 | | | Cisco Systems (a) | | | 4,533,750 | |
| | 310,000 | | | Corning (a) | | | 4,448,500 | |
| | 95,000 | | | Harris (a) | | | 4,326,300 | |
| | 145,000 | | | Intel (a) | | | 4,118,000 | |
| | 4,000 | | | Microsoft (a) | | | 128,080 | |
| | 725,000 | | | Nokia OYJ, SP ADR (Finland) (a) | | | 2,646,250 | |
| | 410,000 | | | Xerox (a) | | | 3,189,800 | |
| | | | | | | | |
| | | | | | | 27,826,980 | |
| | | | | | | | |
| | | | Telecommunication Services – 3.09% | |
| | 140,000 | | | AT&T (a) | | | 4,607,400 | |
| | | | | | | | |
| | |
| | | | Utilities – 16.89% | | | | |
| | 69,000 | | | Entergy (a) | | | 4,523,640 | |
| | 174,096 | | | Exelon | | | 6,791,485 | |
| | 95,000 | | | FirstEnergy (a) | | | 4,447,900 | |
| | 6,000 | | | NextEra Energy (a) | | | 386,100 | |
| | 164,000 | | | PPL (a) | | | 4,485,400 | |
| | 145,000 | | | Public Service Enterprise Group (a) | | | 4,516,750 | |
| | | | | | | | |
| | | | | | | 25,151,275 | |
| | | | | | | | |
| | | | Total Common Stocks
(Cost $148,695,874) | | | 144,986,939 | |
| | | | | | | | |
| | | | | | | | |
Number of
Contracts | | | | | | |
| PURCHASED OPTIONS – 0.55% | | | | |
| | | | SPDR S&P 500 ETF Trust | | | | |
| | 300 | | | Strike @ $120 Exp 05/19/12 | | | 1,200 | |
| | 500 | | | Strike @ $121 Exp 05/19/12 | | | 2,000 | |
| | 500 | | | Strike @ $122 Exp 05/19/12 | | | 2,500 | |
| | 500 | | | Strike @ $123 Exp 05/19/12 | | | 3,500 | |
| | 1,867 | | | Strike @ $124 Exp 05/19/12 | | | 13,069 | |
| | 1,900 | | | Strike @ $125 Exp 05/19/12 | | | 15,200 | |
| | 1,468 | | | Strike @ $126 Exp 05/19/12 | | | 13,212 | |
| | 1,200 | | | Strike @ $123 Exp 06/16/12 | | | 48,000 | |
| | 1,200 | | | Strike @ $124 Exp 06/16/12 | | | 52,800 | |
| | 1,200 | | | Strike @ $125 Exp 06/16/12 | | | 60,000 | |
| | 500 | | | Strike @ $126 Exp 06/16/12 | | | 27,500 | |
| | 2,500 | | | Strike @ $124 Exp 06/29/12 | | | 172,500 | |
| | 2,500 | | | Strike @ $125 Exp 06/29/12 | | | 192,500 | |
| | 2,500 | | | Strike @ $126 Exp 06/29/12 | | | 220,000 | |
| | | | | | | | |
| | | | Total Purchased Options
(Premiums Paid $1,977,426) | | | 823,981 | |
| | | | | | | | |
| | | | | | | | |
| Shares | | | | | | |
| INVESTMENT COMPANY – 4.35% | | | | |
| | 6,475,318 | | | BlackRock Liquidity Funds FedFund Portfolio | | | 6,475,318 | |
| | | | | | | | |
| | | | Total Investment Company
(Cost $6,475,318) | | | 6,475,318 | |
| | | | | | | | |
| Total Investments – 102.26%
(Cost $157,148,618)** | | | 152,286,238 | |
| | | | | | | | |
| | Net Other Assets and Liabilities – (2.26)% | | | (3,372,746 | ) |
| | | | | | | | |
| | Net Assets – 100.00% | | $ | 148,913,492 | |
| | | | | | | | |
| | | | |
See accompanying Notes to Financial Statements. | | | | |
| | | 41 | |
| | | | |
| | | | |
Aston Funds | | | | |
ASTON/M.D. Sass Enhanced Equity Fund | | | April 30, 2012 | |
Schedule of Investments (unaudited) – continued | | | | |
| | |
| * | Non-income producing security. |
| ** | At April 30, 2012, cost is identical for book and Federal income tax purposes. |
| | | | |
Gross unrealized appreciation | | $ | 5,591,024 | |
Gross unrealized depreciation | | | (10,453,404 | ) |
| | | | |
Net unrealized depreciation | | $ | (4,862,380 | ) |
| | | | |
| (a) | These securities are pledged as collateral for call options written. |
| SP ADR | Sponsored American Depositary Receipt |
| SPDR | Standard & Poor’s Depositary Receipt |
Transactions in written call options for the period ended April 30, 2012 were as follows:
| | | | | | | | |
| | | Number of
Contracts | | | Premium | |
Outstanding October 31, 2011 | | | 37,160 | | | $ | 3,231,770 | |
Call Options Written | | | 59,461 | | | | 4,318,238 | |
Call Options Closed or Expired | | | (44,129 | ) | | | (3,509,819 | ) |
Call Options Exercised | | | (7,474 | ) | | | (795,059 | ) |
| | | | | | | | |
Outstanding, April 30, 2012 | | | 45,018 | | | $ | 3,245,130 | |
| | | | | | | | |
Premiums received and value of written call equity options outstanding as of April 30, 2012.
| | | | | | | | | | | | |
Number of
Contracts | | | Description | | Premium
Received | | | Market
Value | |
| | | | Applied Materials | | | | | | | | |
| | 1,500 | | | Strike @ $13 Exp 10/12 | | $ | 54,222 | | | $ | 57,000 | |
| | | |
| | | | AT&T | | | | | | | | |
| | 100 | | | Strike @ $31 Exp 05/12 | | | 3,597 | | | | 18,800 | |
| | 713 | | | Strike @ $32 Exp 07/12 | | | 25,751 | | | | 93,403 | |
| | 300 | | | Strike @ $32 Exp 10/12 | | | 25,192 | | | | 48,000 | |
| | 287 | | | Strike @ $33 Exp 10/12 | | | 14,199 | | | | 29,274 | |
| | | |
| | | | Bank of America | | | | | | | | |
| | 600 | | | Strike @ $10 Exp 08/12 | | | 11,400 | | | | 10,200 | |
| | 1,800 | | | Strike @ $9 Exp 08/12 | | | 51,555 | | | | 63,000 | |
| | | |
| | | | Becton Dickinson | | | | | | | | |
| | 550 | | | Strike @ $80 Exp 09/12 | | | 105,721 | | | | 104,500 | |
| | | |
| | | | Carnival | | | | | | | | |
| | 110 | | | Strike @ $35 Exp 07/12 | | | 7,587 | | | | 7,150 | |
| | 1,028 | | | Strike @ $36 Exp 07/12 | | | 97,244 | | | | 41,120 | |
| | 212 | | | Strike @ $35 Exp 10/12 | | | 23,950 | | | | 28,620 | |
| | | |
| | | | Cisco Systems | | | | | | | | |
| | 2,150 | | | Strike @ $22 Exp 01/13 | | | 189,014 | | | | 202,100 | |
| | | |
| | | | ConAgra Foods | | | | | | | | |
| | 240 | | | Strike @ $26 Exp 06/12 | | | 9,354 | | | | 9,600 | |
| | 340 | | | Strike @ $27 Exp 09/12 | | | 14,951 | | | | 11,900 | |
| | 820 | | | Strike @ $28 Exp 09/12 | | | 23,759 | | | | 10,250 | |
| | | |
| | | | Corning | | | | | | | | |
| | 174 | | | Strike @ $16 Exp 08/12 | | | 8,348 | | | | 4,524 | |
| | 1,312 | | | Strike @ $17 Exp 08/12 | | | 28,831 | | | | 14,432 | |
| | 150 | | | Strike @ $18 Exp 08/12 | | | 5,096 | | | | 900 | |
| | 464 | | | Strike @ $16 Exp 11/12 | | | 21,796 | | | | 25,984 | |
| | 1,000 | | | Strike @ $17 Exp 11/12 | | | 35,975 | | | | 35,000 | |
| | | |
| | | | Eaton | | | | | | | | |
| | 300 | | | Strike @ $55 Exp 10/12 | | | 26,983 | | | | 22,500 | |
| | 600 | | | Strike @ $52.5 Exp 01/13 | | | 130,968 | | | | 138,000 | |
| | | | | | | | | | | | |
Number of
Contracts | | | Description | | Premium
Received | | | Market
Value | |
| | | | Eli Lilly | | | | | | | | |
| | 150 | | | Strike @ $41 Exp 07/12 | | $ | 13,196 | | | $ | 18,300 | |
| | 950 | | | Strike @ $43 Exp 10/12 | | | 127,074 | | | | 159,600 | |
| | | |
| | | | Emerson Electric | | | | | | | | |
| | 900 | | | Strike @ $55 Exp 09/12 | | | 125,825 | | | | 135,000 | |
| | | |
| | | | Entergy | | | | | | | | |
| | 33 | | | Strike @ $70 Exp 01/13 | | | 4,883 | | | | 3,465 | |
| | | |
| | | | FirstEnergy | | | | | | | | |
| | 103 | | | Strike @ $44 Exp 07/12 | | | 8,649 | | | | 29,355 | |
| | 175 | | | Strike @ $46 Exp 07/12 | | | 12,070 | | | | 25,375 | |
| | 672 | | | Strike @ $47 Exp 07/12 | | | 39,631 | | | | 57,120 | |
| | | |
| | | | General Electric | | | | | | | | |
| | 400 | | | Strike @ $17 Exp 06/12 | | | 25,590 | | | | 101,600 | |
| | 1,150 | | | Strike @ $21 Exp 09/12 | | | 55,269 | | | | 40,250 | |
| | 450 | | | Strike @ $22 Exp 12/12 | | | 15,739 | | | | 18,450 | |
| | | |
| | | | Harris | | | | | | | | |
| | 298 | | | Strike @ $40 Exp 05/12 | | | 42,085 | | | | 157,940 | |
| | 50 | | | Strike @ $45 Exp 05/12 | | | 5,399 | | | | 6,750 | |
| | 602 | | | Strike @ $45 Exp 08/12 | | | 53,562 | | | | 144,480 | |
| | | |
| | | | Illinois Tool Works | | | | | | | | |
| | 50 | | | Strike @ $52.5 Exp 06/12 | | | 8,149 | | | | 26,500 | |
| | | |
| | | | Intel | | | | | | | | |
| | 700 | | | Strike @ $29 Exp 07/12 | | | 48,282 | | | | 53,900 | |
| | 750 | | | Strike @ $29 Exp 10/12 | | | 75,730 | | | | 92,250 | |
| | | |
| | | | Johnson & Johnson | | | | | | | | |
| | 270 | | | Strike @ $67.5 Exp 10/12 | | | 39,373 | | | | 20,790 | |
| | 400 | | | Strike @ $67.5 Exp 01/13 | | | 46,029 | | | | 49,600 | |
| | | |
| | | | Kohls | | | | | | | | |
| | 170 | | | Strike @ $52.5 Exp 07/12 | | | 34,505 | | | | 20,400 | |
| | 700 | | | Strike @ $55 Exp 10/12 | | | 130,180 | | | | 91,000 | |
| | | |
| | | | Lockheed Martin | | | | | | | | |
| | 250 | | | Strike @ $85 Exp 06/12 | | | 56,993 | | | | 147,500 | |
| | | |
| | | | Medtronic | | | | | | | | |
| | 200 | | | Strike @ $42 Exp 08/12 | | | 16,395 | | | | 7,200 | |
| | 800 | | | Strike @ $43 Exp 08/12 | | | 110,378 | | | | 18,400 | |
| | 200 | | | Strike @ $41 Exp 11/12 | | | 24,045 | | | | 23,600 | |
| | | |
| | | | MetLife | | | | | | | | |
| | 50 | | | Strike @ $42 Exp 06/12 | | | 4,199 | | | | 250 | |
| | 1,100 | | | Strike @ $41 Exp 09/12 | | | 136,630 | | | | 89,100 | |
| | 50 | | | Strike @ $42 Exp 01/13 | | | 8,099 | | | | 6,950 | |
| | | |
| | | | Microsoft | | | | | | | | |
| | 40 | | | Strike @ $29 Exp 07/12 | | | 3,319 | | | | 12,960 | |
| | | |
| | | | NextEra Energy | | | | | | | | |
| | 20 | | | Strike @ $60 Exp 06/12 | | | 2,559 | | | | 8,920 | |
| | 40 | | | Strike @ $62.5 Exp 09/12 | | | 5,719 | | | | 10,800 | |
| | | |
| | | | Nokia OYJ, SP ADR (Finland) | | | | | | | | |
| | 210 | | | Strike @ $6 Exp 10/12 | | | 3,355 | | | | 2,100 | |
| | 750 | | | Strike @ $10 Exp 01/13 | | | 7,481 | | | | 5,250 | |
| | 3,040 | | | Strike @ $7.5 Exp 01/13 | | | 43,490 | | | | 33,440 | |
| | | |
| | | | PartnerRe (Bahamas) | | | | | | | | |
| | 630 | | | Strike @ $70 Exp 08/12 | | | 68,219 | | | | 152,775 | |
| | | |
| | | | PepsiCo | | | | | | | | |
| | 100 | | | Strike @ $67.5 Exp 07/12 | | | 14,897 | | | | 6,700 | |
| | 580 | | | Strike @ $67.5 Exp 10/12 | | | 88,417 | | | | 75,980 | |
|
See accompanying Notes to Financial Statements. |
| 42 |
| |
| | | | |
Aston Funds | | | | |
ASTON/M.D. Sass Enhanced Equity Fund | | | April 30, 2012 | |
Schedule of Investments (unaudited) – continued | | | | |
| | |
| | | | | | | | | | | | |
Number of
Contracts | | | Description | | Premium
Received | | | Market
Value | |
| | | | PPL | | | | | | | | |
| | 204 | | | Strike @ $28 Exp 10/12 | | $ | 9,991 | | | $ | 9,690 | |
| | |
| | | | Public Service Enterprise Group | | | | | |
| | 1,200 | | | Strike @ $35 Exp 06/12 | | | 70,796 | | | | 3,000 | |
| | | |
| | | | Raytheon | | | | | | | | |
| | 1 | | | Strike @ $48 Exp 05/12 | | | 123 | | | | 585 | |
| | 50 | | | Strike @ $52.5 Exp 05/12 | | | 4,549 | | | | 9,250 | |
| | 100 | | | Strike @ $52.5 Exp 08/12 | | | 9,747 | | | | 28,100 | |
| | | |
| | | | Staples | | | | | | | | |
| | 250 | | | Strike @ $18 Exp 06/12 | | | 9,744 | | | | 1,250 | |
| | 2,550 | | | Strike @ $17 Exp 09/12 | | | 124,885 | | | | 102,000 | |
| | | |
| | | | SunTrust Banks | | | | | | | | |
| | 500 | | | Strike @ $26 Exp 07/12 | | | 33,987 | | | | 37,750 | |
| | | |
| | | | Sysco | | | | | | | | |
| | 400 | | | Strike @ $31 Exp 08/12 | | | 20,677 | | | | 8,000 | |
| | 150 | | | Strike @ $32 Exp 08/12 | | | 8,846 | | | | 1,125 | |
| | 850 | | | Strike @ $29 Exp 11/12 | | | 88,760 | | | | 102,000 | |
| | 50 | | | Strike @ $31 Exp 11/12 | | | 2,949 | | | | 2,000 | |
| | | |
| | | | United Technologies | | | | | | | | |
| | 470 | | | Strike @ $85 Exp 08/12 | | | 76,597 | | | | 85,070 | |
| | 60 | | | Strike @ $87.5 Exp 11/12 | | | 15,298 | | | | 13,860 | |
| | | |
| | | | Walgreen | | | | | | | | |
| | 150 | | | Strike @ $37 Exp 10/12 | | | 15,596 | | | | 22,650 | |
| | 1,150 | | | Strike @ $38 Exp 10/12 | | | 113,820 | | | | 139,150 | |
| | | |
| | | | Wells Fargo | | | | | | | | |
| | 1,000 | | | Strike @ $34 Exp 07/12 | | | 101,974 | | | | 109,000 | |
| | | |
| | | | Xerox | | | | | | | | |
| | 3,900 | | | Strike @ $9 Exp 07/12 | | | 111,488 | | | | 31,200 | |
| | 200 | | | Strike @ $9 Exp 10/12 | | | 4,395 | | | | 3,600 | |
| | | | | | | | | | | | |
| | | | Total Written Call Options | | $ | 3,245,130 | | | $ | 3,539,587 | |
| | | | | | | | | | | | |
| | | | |
See accompanying Notes to Financial Statements. | | | | |
| | | 43 | |
| | | | |
| | | | |
Aston Funds | | | | |
ASTON/River Road Long-Short Fund | | | April 30, 2012 | |
Schedule of Investments (unaudited) | | | | |
| | |
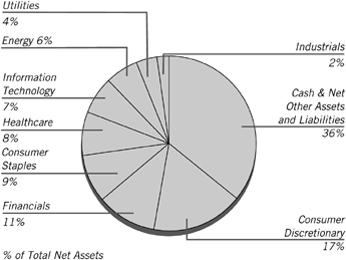
The chart represents total investments in the Fund. Exchange Traded Funds, Materials and Telecommunication Services are negative 4.22%, 0.96% and 1.20%, respectively and cannot be represented in the pie
| | | | | | | | |
| Shares | | | | | Market
Value | |
| COMMON STOCKS – 80.89% | | | | |
| | | | Consumer Discretionary – 25.01% | | | | |
| | 4,747 | | | Big Lots * | | $ | 173,930 | |
| | 9,471 | | | DreamWorks Animation SKG, Class A * (a) | | | 170,573 | |
| | 7,889 | | | General Motors * (a) | | | 181,447 | |
| | 9,286 | | | Iconix Brand Group * | | | 142,447 | |
| | 2,179 | | | Kohl’s (a) | | | 109,233 | |
| | 9,312 | | | Liberty Media, Class A * (a) | | | 175,438 | |
| | 5,249 | | | Madison Square Garden, Class A * (a) | | | 188,807 | |
| | 8,267 | | | Thomson Reuters (a) | | | 246,522 | |
| | | | | | | | |
| | | | | | | 1,388,397 | |
| | | | | | | | |
| | | | Consumer Staples – 9.30% | | | | |
| | 3,933 | | | Constellation Brands, Class A * (a) | | | 84,953 | |
| | 5,836 | | | Harris Teeter Supermarkets (a) | | | 221,593 | |
| | 5,039 | | | Molson Coors Brewing, Class B (a) | | | 209,522 | |
| | | | | | | | |
| | | | | | | 516,068 | |
| | | | | | | | |
| | | | Energy – 6.52% | | | | |
| | 2,328 | | | Devon Energy (a) | | | 162,611 | |
| | 6,452 | | | Nordic American Tankers (a) | | | 93,683 | |
| | 6,535 | | | Patterson-UTI Energy (a) | | | 105,671 | |
| | | | | | | | |
| | | | | | | 361,965 | |
| | | | | | | | |
| | | | Financials – 14.62% | | | | |
| | 2,123 | | | Berkshire Hathaway, Class B * (a) | | | 170,795 | |
| | 662 | | | CME Group (a) | | | 175,973 | |
| | 6,732 | | | Loews (a) | | | 276,887 | |
| | 359 | | | White Mountains Insurance Group (a) | | | 187,757 | |
| | | | | | | | |
| | | | | | | 811,412 | |
| | | | | | | | |
| | | | Healthcare – 8.37% | | | | |
| | 1,810 | | | Becton, Dickinson (a) | | | 141,994 | |
| | 6,141 | | | Hill-Rom Holdings (a) | | | 199,275 | |
| | 3,228 | | | Medtronic (a) | | | 123,310 | |
| | | | | | | | |
| | | | | | | 464,579 | |
| | | | | | | | |
| | | | | | | | |
| Shares | | | | | Market
Value | |
| | | | Industrials – 4.99% | | | | |
| | 3,443 | | | Expeditors International of Washington (a) | | $ | 137,720 | |
| | 6,714 | | | Geo Group * (a) | | | 139,047 | |
| | | | | | | | |
| | | | | | | 276,767 | |
| | | | | | | | |
| | | | Information Technology – 8.49% | |
| | 2,818 | | | DST Systems (a) | | | 157,752 | |
| | 2,508 | | | Global Payments (a) | | | 116,446 | |
| | 10,726 | | | Western Union (a) | | | 197,144 | |
| | | | | | | | |
| | | | | | | 471,342 | |
| | | | | | | | |
| | | | Utilities – 3.60% | | | | |
| | 4,227 | | | National Fuel Gas (a) | | | 200,022 | |
| | | | | | | | |
| | | | Total Common Stocks
(Cost $4,332,076) | | | 4,490,552 | |
| | | | | | | | |
| | INVESTMENT COMPANY – 18.81% | | | | |
| | 1,044,190 | | | BlackRock Liquidity Funds TempCash Portfolio | | | 1,044,190 | |
| | | | | | | | |
| | | | Total Investment Company
(Cost $1,044,190) | | | 1,044,190 | |
| | | | | | | | |
| Total Investments – 99.70%
(Cost $5,376,266)*** | | | 5,534,742 | |
| | | | | | | | |
$1,063,796 in cash and $4,062,211 in securities was segregated or on deposit with a prime broker to cover short sales as of April 30, 2012 and is included in “Net Other Assets and Liabilities”.
| | | | | | | | |
| SHORT SALES – (22.63)% | | | | |
| | | | Consumer Discretionary – (7.96)% | | | |
| | (372) | | | BJ’s Restaurants ** | | | (16,067 | ) |
| | (3,414) | | | Boyd Gaming ** | | | (26,254 | ) |
| | (900) | | | Charter Communications, Class A ** | | | (54,423 | ) |
| | (3,757) | | | Clear Channel Outdoor Holdings, Class A ** | | | (28,440 | ) |
| | (569) | | | DineEquity ** | | | (27,642 | ) |
| | (3,108) | | | Gannett | | | (42,953 | ) |
| | (1,144) | | | Hanesbrands ** | | | (32,284 | ) |
| | (1,721) | | | La-Z-Boy ** | | | (25,935 | ) |
| | (2,546) | | | Leggett & Platt | | | (55,426 | ) |
| | (1,034) | | | Life Time Fitness ** | | | (48,143 | ) |
| | (4,485) | | | Office Depot ** | | | (13,634 | ) |
| | (2,849) | | | Systemax ** | | | (48,917 | ) |
| | (375) | | | Tempur-Pedic International ** | | | (22,065 | ) |
| | | | | | | | |
| | | | | | | (442,183 | ) |
| | | | | | | | |
| | | | Exchange Traded Funds – (4.22)% | | | | |
| | (7,445) | | | United States Natural Gas Fund ** | | | (122,247 | ) |
| | (2,818) | | | United States Oil Fund ** | | | (111,818 | ) |
| | | | | | | | |
| | | | | | | (234,065 | ) |
| | | | | | | | |
| | | | Financials – (3.47)% | | | | |
| | (3,420) | | | CBL & Associates Properties, REIT | | | (63,715 | ) |
| | (3,145) | | | Equity One, REIT | | | (65,353 | ) |
| | (1,401) | | | Mercury General | | | (63,311 | ) |
| | | | | | | | |
| | | | | | | (192,379 | ) |
| | | | | | | | |
| | | | Healthcare – (0.34)% | | | | |
| | (1,073) | | | Insulet ** | | | (19,164 | ) |
| | | | | | | | |
| | | | | | | (19,164 | ) |
| | | | | | | | |
|
See accompanying Notes to Financial Statements. |
| 44 |
| |
| | | | |
Aston Funds | | | | |
ASTON/River Road Long-Short Fund | | | April 30, 2012 | |
Schedule of Investments (unaudited) – continued | | | | |
| | |
| | | | | | | | |
Shares | | | | | Market Value | |
| | | | Industrials – (3.25)% | | | | |
| | (2,619) | | | Delta Air Lines ** | | $ | (28,704 | ) |
| | (1,805) | | | Deluxe | | | (42,977 | ) |
| | (1,476) | | | Granite Construction | | | (41,092 | ) |
| | (1,100) | | | Masco | | | (14,498 | ) |
| | (946) | | | Mobile Mini ** | | | (17,842 | ) |
| | (4,269) | | | Mueller Water Products, Class A | | | (15,326 | ) |
| | (1,098) | | | USG ** | | | (19,819 | ) |
| | | | | | | | |
| | | | | | | (180,258 | ) |
| | | | | | | | |
| | | | Information Technology – (1.23)% | |
| | (8,388) | | | Earthlink | | | (68,110 | ) |
| | | | | | | | |
| | | | | | | (68,110 | ) |
| | | | | | | | |
| | | | Materials – (0.96)% | | | | |
| | (3,015) | | | Louisiana-Pacific ** | | | (27,286 | ) |
| | (700) | | | Molycorp ** | | | (18,942 | ) |
| | (428) | | | Seabridge Gold (Canada) ** | | | (7,173 | ) |
| | | | | | | | |
| | | | | | | (53,401 | ) |
| | | | | | | | |
| | | | Telecommunication Services – (1.20)% | |
| | (1,723) | | | CenturyLink | | | (66,439 | ) |
| | | | Total Short Sales – (22.63)%
(Proceeds $1,256,184) | | | (1,255,999 | ) |
| | Net Other Assets and Liabilities – 22.92% | | | 1,272,625 | |
| | | | | | | | |
| | Net Assets – 100.00% | | $ | 5,551,368 | |
| | | | | | | | |
| * | Non-income producing security. |
| ** | No dividend payable on security sold short. |
| *** | At April 30, 2012, cost is identical for book and Federal income tax purposes. |
| | | | |
Gross unrealized appreciation | | $ | 233,634 | |
Gross unrealized depreciation | | | (75,158 | ) |
| | | | |
Net unrealized appreciation | | $ | 158,476 | |
| | | | |
| (a) | Security position is either entirely or partially held in a segregated account as collateral for securities sold short. |
| REIT | Real Estate Investment Trust |
| | | | |
See accompanying Notes to Financial Statements. | | | | |
| | | 45 | |
| | | | |
| | | | |
Aston Funds | | | | |
ASTON/Neptune International Fund | | | April 30, 2012 | |
Schedule of Investments (unaudited) | | | | |
| | |
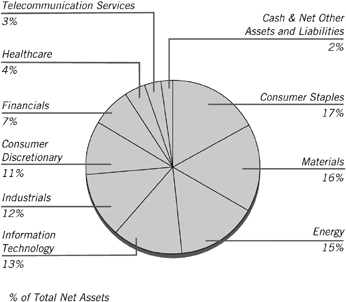
| | | | | | | | |
| Shares | | | | | Market
Value | |
| COMMON STOCKS – 98.17% | | | | |
| | | | Australia – 2.47% | | | | |
| | 1,500 | | | WorleyParsons | | $ | 44,153 | |
| | | | | | | | |
| | | | Brazil – 1.32% | | | | |
| | 1,000 | | | Petroleo Brasileiro, ADR | | | 23,540 | |
| | | | | | | | |
| | | | China – 24.33% | | | | |
| | 1,000 | | | Baidu, SP ADR * | | | 132,700 | |
| | 10,000 | | | China Life Insurance, Class H * | | | 27,067 | |
| | 5,000 | | | China Mobile | | | 55,390 | |
| | 7,000 | | | China Resources Enterprise | | | 25,443 | |
| | 35,000 | | | Mandarin Oriental International | | | 55,650 | |
| | 40,000 | | | PetroChina, Class H | | | 60,629 | |
| | 21,666 | | | Shangri-La Asia | | | 46,020 | |
| | 1,000 | | | Tencent Holdings | | | 31,423 | |
| | | | | | | | |
| | | | | | | 434,322 | |
| | | | | | | | |
| | | | France – 7.04% | | | | |
| | 100 | | | Hermes International | | | 35,376 | |
| | 300 | | | LVMH Moet Hennessy Louis Vuitton | | | 49,698 | |
| | 850 | | | Total | | | 40,584 | |
| | | | | | | | |
| | | | | | | 125,658 | |
| | | | | | | | |
| | | | India – 1.33% | | | | |
| | 500 | | | Infosys, SP ADR | | | 23,675 | |
| | | | | | | | |
| | | | Japan – 10.18% | | | | |
| | 300 | | | FANUC | | | 51,065 | |
| | 2,000 | | | Komatsu | | | 57,991 | |
| | 3,500 | | | Kubota | | | 34,018 | |
| | 5,000 | | | Toray Industries | | | 38,640 | |
| | | | | | | | |
| | | | | | | 181,714 | |
| | | | | | | | |
| | | | Netherlands – 3.00% | | | | |
| | 1,000 | | | Akzo Nobel | | | 53,590 | |
| | | | | | | | |
| | | | Norway – 2.75% | | | | |
| | 1,000 | | | Yara International | | | 49,048 | |
| | | | | | | | |
| | | | | | | | |
| Shares | | | | | Market
Value | |
| | | | Russia – 11.16% | | | | |
| | 4,000 | | | Gazprom, SP ADR | | $ | 45,880 | |
| | 1,781 | | | MMC Norilsk Nickel, ADR | | | 31,542 | |
| | 150 | | | NovaTek, SP GDR | | | 19,065 | |
| | 5,000 | | | Rosneft Oil, GDR * | | | 35,675 | |
| | 2,750 | | | Sberbank, SP ADR | | | 35,503 | |
| | 1,250 | | | X5 Retail Group, GDR * | | | 31,600 | |
| | | | | | | | |
| | | | | | | 199,265 | |
| | | | | | | | |
| | | | Switzerland – 2.47% | | | | |
| | 800 | | | Novartis AG | | | 44,114 | |
| | | | | | | | |
| | | | Taiwan – 2.62% | | | | |
| | 3,000 | | | Taiwan Semiconductor Manufacturing, SP ADR | | | 46,740 | |
| | | | | | | | |
| | | | United Kingdom – 29.50% | | | | |
| | 1,300 | | | Antofagasta PLC | | | 24,916 | |
| | 1,300 | | | BHP Billiton PLC | | | 41,657 | |
| | 1,000 | | | British American Tobacco PLC | | | 51,267 | |
| | 2,500 | | | Diageo PLC | | | 62,928 | |
| | 1,000 | | | GlaxoSmithKline PLC | | | 23,126 | |
| | 2,999 | | | HSBC Holdings PLC | | | 27,017 | |
| | 1,000 | | | Imperial Tobacco Group PLC | | | 39,988 | |
| | 17,140 | | | Polyus Gold International, SP GDR * | | | 52,791 | |
| | 5,000 | | | Rolls-Royce Holdings PLC * | | | 66,823 | |
| | 530,000 | | | Rolls-Royce Holdings PLC, C Shares * (a) (b) | | | 860 | |
| | 1,687 | | | Standard Chartered PLC | | | 41,232 | |
| | 5,000 | | | Tesco PLC | | | 25,751 | |
| | 2,000 | | | Unilever PLC | | | 68,259 | |
| | | | | | | | |
| | | | | | | 526,615 | |
| | | | | | | | |
| | | | Total Common Stocks
(Cost $1,716,191) | | | 1,752,434 | |
| | | | | | | | |
| INVESTMENT COMPANY – 0.68% | | | | |
| | 12,243 | | | BlackRock Liquidity Funds
TempCash Portfolio | | | 12,243 | |
| | | | | | | | |
| | | | Total Investment Company
(Cost $12,243) | | | 12,243 | |
| | | | | | | | |
| Total Investments – 98.85%
(Cost $1,728,434)** | | | 1,764,677 | |
| | | | | | | | |
| Net Other Assets and Liabilities – 1.15% | | | 20,466 | |
| | | | | | | | |
| Net Assets – 100.00% | | $ | 1,785,143 | |
| | | | | | | | |
|
See accompanying Notes to Financial Statements. |
| 46 |
| |
| | | | |
Aston Funds | | | | |
ASTON/Neptune International Fund | | | April 30, 2012 | |
Schedule of Investments (unaudited) – continued | | | | |
| | |
| * | Non-income producing security. |
| ** | At April 30, 2012, cost is identical for book and Federal income tax purposes. |
| | | | |
| Gross unrealized appreciation | | $ | 267,595 | |
| Gross unrealized depreciation | | | (231,352 | ) |
| | | | |
Net unrealized appreciation | | $ | 36,243 | |
| | | | |
| (a) | Security with a total aggregate market value of $860 or 0.05% of the net assets, were valued under the fair valuation procedures established by the Fund’s Board of Trustees. |
| (b) | This security has been determined by the Subadviser to be an illiquid security. At April 30, 2012, this security amounted to $860 or 0.05% of net assets. |
| ADR | American Depositary Receipt |
| GDR | Global Depositary Receipt |
| SP ADR | Sponsored American Depositary Receipt |
| SP GDR | Sponsored Global Depositary Receipt |
| | | | |
See accompanying Notes to Financial Statements. | | | | |
| | | 47 | |
| | | | |
| | | | |
Aston Funds | | | | |
ASTON/Barings International Fund | | | April 30, 2012 | |
Schedule of Investments (unaudited) | | | | |
| | |
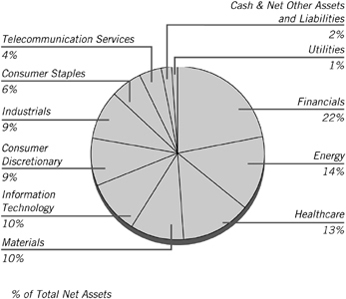
| | | | | | | | |
| Shares | | | | | Market
Value | |
| COMMON STOCKS – 97.91% | | | | |
| | | | Australia – 2.51% | | | |
| | 30,234 | | | Newcrest Mining | | $ | 828,510 | |
| | 470,059 | | | Paladin Energy * | | | 781,195 | |
| | | | | | | | |
| | | | | | | 1,609,705 | |
| | | | | | | | |
| | | | Belgium – 1.65% | | | | |
| | 14,736 | | | Anheuser-Busch InBev | | | 1,062,102 | |
| | | | | | | | |
| | | | China – 1.57% | | | | |
| | 7,600 | | | Baidu, SP ADR * | | | 1,008,520 | |
| | | | | | | | |
| | | | France – 6.06% | | | | |
| | 14,420 | | | Sanofi | | | 1,100,597 | |
| | 36,642 | | | SES | | | 877,417 | |
| | 66,216 | | | Suez Environnement | | | 933,910 | |
| | 20,411 | | | Total | | | 974,538 | |
| | | | | | | | |
| | | | | | | 3,886,462 | |
| | | | | | | | |
| | | | Germany – 9.64% | | | | |
| | 15,714 | | | Bayer | | | 1,106,798 | |
| | 10,227 | | | Bayerische Motoren Werke | | | 972,124 | |
| | 18,950 | | | Deutsche Boerse | | | 1,189,737 | |
| | 9,481 | | | Fresenius | | | 946,268 | |
| | 7,391 | | | Muenchener Rueckversicherungs- Gesellschaft | | | 1,072,755 | |
| | 13,558 | | | SAP | | | 898,949 | |
| | | | | | | | |
| | | | | | | 6,186,631 | |
| | | | | | | | |
| | | | Hong Kong – 1.22% | | | | |
| | 65,000 | | | Sun Hung Kai Properties | | | 784,157 | |
| | | | | | | | |
| | | | India – 1.30% | | | | |
| | 19,821 | | | Niko Resources | | | 835,096 | |
| | | | | | | | |
| | | | Israel – 3.31% | | | | |
| | 86,247 | | | Israel Chemicals | | | 989,444 | |
| | | | | | | | |
| Shares | | | | | Market
Value | |
| | | | Israel (continued) | | | | |
| | 24,811 | | | Teva Pharmaceutical Industries, SP ADR | | $ | 1,134,855 | |
| | | | | | | | |
| | | | | | | 2,124,299 | |
| | | | | | | | |
| | | | Japan – 20.59% | | | | |
| | 10,600 | | | Daito Trust Construction | | | 957,239 | |
| | 15,100 | | | East Japan Railway | | | 941,859 | |
| | 4,500 | | | FANUC | | | 765,969 | |
| | 74,000 | | | Hitachi Metals | | | 928,707 | |
| | 23,800 | | | Honda Motor | | | 863,287 | |
| | 761 | | | Jupiter Telecommunications | | | 806,370 | |
| | 4,390 | | | KEYENCE | | | 1,042,515 | |
| | 10,800 | | | Kyocera | | | 1,063,226 | |
| | 47,800 | | | Mitsubishi | | | 1,043,530 | |
| | 10,800 | | | Nidec | | | 973,948 | |
| | 864 | | | Rakuten | | | 963,126 | |
| | 22,700 | | | Sysmex | | | 918,349 | |
| | 39,000 | | | Tokio Marine Holdings | | | 1,005,774 | |
| | 16,900 | | | Tokyo Electron | | | 943,005 | |
| | | | | | | | |
| | | | | | | 13,216,904 | |
| | | | | | | | |
| | | | Mexico – 3.10% | | | | |
| | 41,883 | | | America Movil, Class L, ADR | | | 1,116,182 | |
| | 34,398 | | | Fresnillo | | | 870,863 | |
| | | | | | | | |
| | | | | | | 1,987,045 | |
| | | | | | | | |
| | | | Netherlands – 1.42% | | | | |
| | 25,709 | | | Royal Dutch Shell | | | 914,411 | |
| | | | | | | | |
| | | | Papua New Guinea – 1.73% | | | | |
| | 144,614 | | | Oil Search | | | 1,107,501 | |
| | | | | | | | |
| | | | Russia – 1.36% | | | | |
| | 76,318 | | | Gazprom, SP ADR | | | 875,367 | |
| | | | | | | | |
| | | | Singapore – 3.08% | | | | |
| | 89,000 | | | DBS Group Holdings | | | 1,003,992 | |
| | 108,700 | | | Keppel | | | 970,614 | |
| | | | | | | | |
| | | | | | | 1,974,606 | |
| | | | | | | | |
| | | | South Korea – 3.10% | | | | |
| | 62,604 | | | KT, SP ADR | | | 804,461 | |
| | 966 | | | Samsung Electronics | | | 1,188,134 | |
| | | | | | | | |
| | | | | | | 1,992,595 | |
| | | | | | | | |
| | | | Sweden – 1.36% | | | | |
| | 131,480 | | | TeliaSonera | | | 872,256 | |
| | | | | | | | |
| | | | Switzerland – 8.46% | | | | |
| | 27,795 | | | Julius Baer Group | | | 1,064,151 | |
| | 5,813 | | | Roche Holding | | | 1,061,858 | |
| | 3,507 | | | Syngenta | | | 1,231,401 | |
| | 81,085 | | | UBS * | | | 1,012,167 | |
| | 4,323 | | | Zurich Financial Services | | | 1,057,353 | |
| | | | | | | | |
| | | | | | | 5,426,930 | |
| | | | | | | | |
| | | | United Kingdom – 26.45% | | | | |
| | 52,251 | | | Admiral Group | | | 1,026,907 | |
| | 45,607 | | | BG Group | | | 1,073,598 | |
| | 165,262 | | | BP | | | 1,193,508 | |
| | 12,363 | | | British American Tobacco | | | 633,820 | |
| | 459,381 | | | Centamin * | | | 511,434 | |
|
See accompanying Notes to Financial Statements. |
| 48 |
| |
| | | | |
Aston Funds | | | | |
ASTON/Barings International Fund | | | April 30, 2012 | |
Schedule of Investments (unaudited) – continued | | | | |
| | |
| | | | | | | | |
| Shares | | | | | Market
Value | |
| | | | United Kingdom (continued) | | | | |
| | 42,357 | | | GlaxoSmithKline | | $ | 979,563 | |
| | 159,061 | | | ICAP | | | 980,159 | |
| | 27,648 | | | Imperial Tobacco Group | | | 1,105,597 | |
| | 94,035 | | | Prudential | | | 1,151,439 | |
| | 9,501 | | | Randgold Resources | | | 836,491 | |
| | 223,279 | | | Resolution | | | 810,962 | |
| | 77,249 | | | Rolls-Royce Holdings * | | | 1,032,402 | |
| | 8,188,394 | | | Rolls-Royce Holdings, C Shares * (a) (b) | | | 13,289 | |
| | 29,961 | | | SABMiller | | | 1,258,626 | |
| | 25,457 | | | Shire | | | 830,416 | |
| | 41,991 | | | Standard Chartered | | | 1,026,298 | |
| | 47,070 | | | Tullow Oil | | | 1,171,823 | |
| | 98,970 | | | WPP | | | 1,338,756 | |
| | | | | | | | |
| | | | | | | 16,975,088 | |
| | | | | | | | |
| | | | Total Common Stocks
(Cost $60,340,515) | | | 62,839,675 | |
| | | | | | | | |
| | INVESTMENT COMPANY – 2.51% | | | | |
| | 1,607,345 | | | BlackRock Liquidity Funds TempCash Portfolio | | | 1,607,345 | |
| | | | | | | | |
| | | | Total Investment Company
(Cost $1,607,345) | | | 1,607,345 | |
| | | | | | | | |
| Total Investments – 100.42%
(Cost $61,947,860)** | | | 64,447,020 | |
| | | | | | | | |
| Net Other Assets and Liabilities – (0.42)% | | | (267,396 | ) |
| | | | | | | | |
| | Net Assets – 100.00% | | $ | 64,179,624 | |
| | | | | | | | |
| * | Non-income producing security. |
| ** | At April 30, 2012, cost is identical for book and Federal income tax purposes. |
| | | | |
Gross unrealized appreciation | | $ | 5,630,069 | |
Gross unrealized depreciation | | | (3,130,909 | ) |
| | | | |
Net unrealized appreciation | | $ | 2,499,160 | |
| | | | |
| (a) | Security with a total aggregate market value of $13,289 or 0.02% of the net assets were valued under the fair valuation procedures established by the Fund’s Board of Trustees. |
| (b) | This security has been determined by the Subadviser to be an illiquid security. At April 30, 2012, this security amounted to $13,289 or 0.02% of net assets. |
| ADR | American Depositary Receipt |
| SP ADR | Sponsored American Depositary Receipt |
| | | | |
See accompanying Notes to Financial Statements. | | | | |
| | | 49 | |
| | | | |
| | | | |
Aston Funds | | | | |
ASTON/Harrison Street Real Estate Fund | | | April 30, 2012 | |
Schedule of Investments (unaudited) | | | | |
| | |
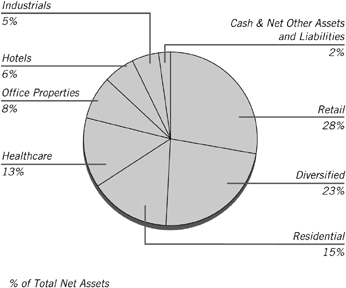
| | | | | | | | |
| Shares | | | | | Market
Value | |
| COMMON STOCKS – 98.83% | | | | |
| | | | Diversified – 23.28% | | | | |
| | 4,200 | | | Crown Castle International * | | $ | 237,762 | |
| | 5,100 | | | Digital Realty Trust | | | 382,959 | |
| | 5,600 | | | Dundee Real Estate Investment Trust (Canada) | | | 209,068 | |
| | 9,200 | | | Dupont Fabros Technology | | | 249,780 | |
| | 4,400 | | | Entertainment Properties Trust | | | 211,156 | |
| | 7,200 | | | Rayonier | | | 326,520 | |
| | 5,100 | | | Vornado Realty Trust | | | 437,784 | |
| | | | | | | | |
| | | | | | | 2,055,029 | |
| | | | | | | | |
| | | | Healthcare – 12.63% | | | | |
| | 22,200 | | | Medical Properties Trust | | | 208,236 | |
| | 10,300 | | | Sabra Health Care | | | 172,422 | |
| | 12,500 | | | Ventas | | | 734,875 | |
| | | | | | | | |
| | | | | | | 1,115,533 | |
| | | | | | | | |
| | | | Hotels – 6.46% | | | | |
| | 9,000 | | | RLJ Lodging Trust | | | 169,020 | |
| | 32,600 | | | Strategic Hotels & Resorts * | | | 222,006 | |
| | 1,346 | | | Wynn Resorts | | | 179,557 | |
| | | | | | | | |
| | | | | | | 570,583 | |
| | | | | | | | |
| | | | Industrial – 5.22% | | | | |
| | 17,200 | | | CubeSmart | | | 216,032 | |
| | 17,600 | | | STAG Industrial | | | 244,992 | |
| | | | | | | | |
| | | | | | | 461,024 | |
| | | | | | | | |
| | | | Office Properties – 8.14% | | | | |
| | 14,200 | | | BioMed Realty Trust | | | 281,444 | |
| | 5,300 | | | SL Green Realty | | | 436,932 | |
| | | | | | | | |
| | | | | | | 718,376 | |
| | | | | | | | |
| | | | Residential – 14.76% | | | | |
| | 4,500 | | | Camden Property Trust | | | 304,515 | |
| | 8,300 | | | Equity Residential | | | 509,952 | |
| | | | | | | | |
| Shares | | | | | Market
Value | |
| | | | Residential (continued) | | | | |
| | 3,000 | | | Mid-America Apartment | | | | |
| | | | Communities | | $ | 204,210 | |
| | 10,800 | | | UDR | | | 284,364 | |
| | | | | | | | |
| | | | | | | 1,303,041 | |
| | | | | | | | |
| | | | Retail – 28.34% | | | | |
| | 10,100 | | | CBL & Associates Properties | | | 188,163 | |
| | 17,500 | | | Inland Real Estate | | | 150,500 | |
| | 19,200 | | | Kimco Realty | | | 372,672 | |
| | 6,300 | | | Macerich | | | 387,891 | |
| | 8,200 | | | National Retail Properties | | | 224,516 | |
| | 4,400 | | | Regency Centers | | | 197,824 | |
| | 6,300 | | | Simon Property Group | | | 980,280 | |
| | | | | | | | |
| | | | | | | 2,501,846 | |
| | | | | | | | |
| | | | Total Common Stocks
(Cost $7,281,240) | | | 8,725,432 | |
| | | | | | | | |
| INVESTMENT COMPANY – 1.54% | | | | |
| | 136,051 | | | BlackRock Liquidity Funds TempCash Portfolio | | | 136,051 | |
| | | | | | | | |
| | | | Total Investment Company
(Cost $136,051) | | | 136,051 | |
| | | | | | | | |
| Total Investments – 100.37%
(Cost $7,417,291)** | | | 8,861,483 | |
| | | | | | | | |
| Net Other Assets and Liabilities – (0.37)% | | | (32,829 | ) |
| | | | | | | | |
| Net Assets – 100.00% | | $ | 8,828,654 | |
| | | | | | | | |
| * | Non-income producing security. |
| ** | At April 30, 2012, cost is identical for book and Federal income tax purposes. |
| | | | |
Gross unrealized appreciation. | | $ | 1,445,168 | |
Gross unrealized depreciation. | | | (976 | ) |
| | | | |
Net unrealized appreciation | | $ | 1,444,192 | |
| | | | |
|
See accompanying Notes to Financial Statements. |
| 50 |
| |
| | | | |
Aston Funds | | | | |
| ASTON/Montag & Caldwell Balanced Fund | | | April 30, 2012 | |
| Schedule of Investments (unaudited) | | | | |
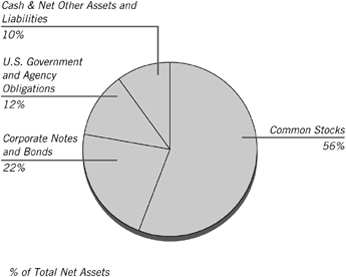
| | | | | | | | |
| Shares | | | | | Market
Value | |
| COMMON STOCKS – 55.94% | |
| | | | Consumer Discretionary – 9.70% | |
| | 1,490 | | | Amazon.com * | | $ | 345,531 | |
| | 7,300 | | | Bed Bath & Beyond * | | | 513,847 | |
| | 6,300 | | | Las Vegas Sands | | | 349,587 | |
| | 6,000 | | | McDonald’s | | | 584,700 | |
| | 2,450 | | | NIKE, Class B | | | 274,082 | |
| | 7,950 | | | Omnicom Group | | | 407,915 | |
| | 14,550 | | | TJX | | | 606,881 | |
| | | | | | | | |
| | | | | | | 3,082,543 | |
| | | | | | | | |
| | | | Consumer Staples – 13.33% | | | | |
| | 11,800 | | | Coca-Cola | | | 900,576 | |
| | 6,300 | | | Colgate-Palmolive | | | 623,322 | |
| | 6,700 | | | Costco Wholesale | | | 590,739 | |
| | 19,750 | | | Kraft Foods, Class A | | | 787,433 | |
| | 8,020 | | | PepsiCo | | | 529,320 | |
| | 6,550 | | | Procter & Gamble | | | 416,842 | |
| | 11,200 | | | Unilever (Netherlands) | | | 384,720 | |
| | | | | | | | |
| | | | | | | 4,232,952 | |
| | | | | | | | |
| | | | Energy – 4.05% | | | | |
| | 7,500 | | | Cameron International * | | | 384,375 | |
| | 5,300 | | | Occidental Petroleum | | | 483,466 | |
| | 5,650 | | | Schlumberger | | | 418,891 | |
| | | | | | | | |
| | | | | | | 1,286,732 | |
| | | | | | | | |
| | | | Healthcare – 9.15% | | | | |
| | 14,250 | | | Abbott Laboratories | | | 884,355 | |
| | 8,050 | | | Allergan | | | 772,800 | |
| | 9,250 | | | AmerisourceBergen | | | 344,192 | |
| | 6,265 | | | Express Scripts * | | | 349,524 | |
| | 10,150 | | | Stryker | | | 553,886 | |
| | | | | | | | |
| | | | | | | 2,904,757 | |
| | | | | | | | |
| | | | Industrials – 3.72% | | | | |
| | 28,400 | | | General Electric | | | 556,072 | |
| | 8,000 | | | United Parcel Service, Class B | | | 625,120 | |
| | | | | | | | |
| | | | | | | 1,181,192 | |
| | | | | | | | |
| | | | | | | | |
| Shares | | | | | Market
Value | |
| | | | Information Technology – 14.32% | |
| | 7,550 | | | Accenture, Class A (Ireland) | | $ | 490,373 | |
| | 1,380 | | | Apple * | | | 806,251 | |
| | 17,550 | | | Cisco Systems | | | 353,632 | |
| | 10,100 | | | eBay * | | | 414,605 | |
| | 6,800 | | | EMC * | | | 191,828 | |
| | 600 | | | Google, Class A * | | | 363,138 | |
| | 9,000 | | | Juniper Networks * | | | 192,870 | |
| | 9,800 | | | Oracle | | | 288,022 | |
| | 12,100 | | | Qualcomm | | | 772,464 | |
| | 5,500 | | | Visa, Class A | | | 676,390 | |
| | | | | | | | |
| | | | | | | 4,549,573 | |
| | | | | | | | |
| | | | Materials – 1.67% | | | | |
| | 6,950 | | | Monsanto | | | 529,451 | |
| | | | | | | | |
| | | | Total Common Stocks
(Cost $14,725,171) | | | 17,767,200 | |
| | | | | | | | |
| | | | | | | | |
| | Par Value | | | | | | | |
| | CORPORATE NOTES AND BONDS – 21.97% | |
| | | | Consumer Staples – 3.95% | | | | |
| | $350,000 | | | Coca-Cola
Senior Unsecured Notes
5.350%, 11/15/17 | | | 421,479 | |
| | 350,000 | | | PepsiCo
Senior Unsecured Notes
5.000%, 06/01/18 | | | 412,854 | |
| | 400,000 | | | Wal-Mart Stores
Senior Unsecured Notes
3.200%, 05/15/14 | | | 421,930 | |
| | | | | | | | |
| | | | | | | 1,256,263 | |
| | | | | | | | |
| | | | Energy – 1.35% | | | | |
| | 400,000 | | | ConocoPhillips
4.750%, 02/01/14 | | | 428,130 | |
| | | | | | | | |
| | | | Financials – 5.44% | | | | |
| | 425,000 | | | General Electric Capital
Senior Unsecured Notes, MTN
4.375%, 09/16/20 | | | 455,973 | |
| | 400,000 | | | JPMorgan Chase
Senior Unsecured Notes
4.350%, 08/15/21 | | | 419,354 | |
| | 400,000 | | | U.S. Bancorp
Senior Unsecured Notes
4.200%, 05/15/14 | | | 427,484 | |
| | 400,000 | | | Wells Fargo
Senior Unsecured Notes, MTN, Series 1
3.750%, 10/01/14 | | | 424,491 | |
| | | | | | | | |
| | | | | | | 1,727,302 | |
| | | | | | | | |
| | | | Healthcare – 3.95% | | | | |
| | 400,000 | | | Abbott Laboratories
Senior Unsecured Notes
4.350%, 03/15/14 | | | 428,676 | |
| | 300,000 | | | Johnson & Johnson
Senior Unsecured Notes
5.950%, 08/15/37 | | | 398,751 | |
| | 400,000 | | | Medtronic
Senior Unsecured Notes
3.000%, 03/15/15 | | | 426,617 | |
| | | | | | | | |
| | | | | | | 1,254,044 | |
| | | | | | | | |
| | | | |
See accompanying Notes to Financial Statements. | | | | |
| | | 51 | |
| | | | |
| | | | |
Aston Funds | | | | |
| ASTON/Montag & Caldwell Balanced Fund | | | April 30, 2012 | |
| Schedule of Investments (unaudited) – continued | | | | |
| | | | | | | | |
| Par Value | | | | | Market
Value | |
| | | | Information Technology – 4.71% | |
| | $350,000 | | | Cisco Systems
Senior Unsecured Notes
5.500%, 02/22/16 | | $ | 408,320 | |
| | 350,000 | | | Google
Senior Unsecured Notes
3.625%, 05/19/21 | | | 386,767 | |
| | 300,000 | | | Hewlett-Packard
Senior Unsecured Notes
4.500%, 03/01/13 | | | 308,916 | |
| | 375,000 | | | Oracle
Senior Unsecured Notes
4.950%, 04/15/13 | | | 391,656 | |
| | | | | | | | |
| | | | | | | 1,495,659 | |
| | | | | | | | |
| | | | Telecommunication Services – 2.57% | |
| | 400,000 | | | AT&T
Senior Unsecured Notes
4.950%, 01/15/13 | | | 412,385 | |
| | 350,000 | | | Verizon Communications
Senior Unsecured Notes
5.550%, 02/15/16 | | | 404,159 | |
| | | | | | | | |
| | | | | | | 816,544 | |
| | | | | | | | |
| | | | Total Corporate Notes and Bonds
(Cost $6,635,828) | | | 6,977,942 | |
| | | | | | | | |
| U.S. GOVERNMENT AND AGENCY
OBLIGATIONS –12.05% |
|
| | | | Fannie Mae – 0.23% | | | | |
| | 17,052 | | | 7.500%, 02/01/35, Pool # 787557 | | | 20,918 | |
| | 9,281 | | | 7.500%, 04/01/35, Pool # 819231 | | | 11,394 | |
| | 35,353 | | | 6.000%, 11/01/35, Pool # 844078 | | | 39,359 | |
| | | | | | | | |
| | | | | | | 71,671 | |
| | | | | | | | |
| | | | Freddie Mac – 0.72% | | | | |
| | 200,000 | | | 4.500%, 01/15/13 | | | 206,053 | |
| | 20,880 | | | 5.500%, 12/01/20, Gold Pool # G11820 | | | 22,722 | |
| | | | | | | | |
| | | | | | | 228,775 | |
| | | | | | | | |
| | | | Government National Mortgage Association – 0.11% | |
| | 32,784 | | | 5.500%, 02/15/39, Pool # 698060 | | | 36,677 | |
| | | | | | | | |
| | | | U.S. Treasury Bonds – 3.01% | |
| | 150,000 | | | 8.000%, 11/15/21 | | | 232,195 | |
| | 375,000 | | | 5.375%, 02/15/31 | | | 523,125 | |
| | 200,000 | | | 3.125%, 11/15/41 | | | 200,344 | |
| | | | | | | | |
| | | | | | | 955,664 | |
| | | | | | | | |
| | | | U.S. Treasury Notes – 7.98% | |
| | 350,000 | | | 4.000%, 02/15/15 | | | 385,082 | |
| | 250,000 | | | 4.500%, 02/15/16 | | | 286,758 | |
| | 425,000 | | | 2.625%, 04/30/16 | | | 458,701 | |
| | 350,000 | | | 4.625%, 02/15/17 | | | 413,273 | |
| | 450,000 | | | 3.125%, 05/15/19 | | | 505,195 | |
| | 475,000 | | | 2.125%, 08/15/21 | | | 486,949 | |
| | | | | | | | |
| | | | | | | 2,535,958 | |
| | | | | | | | |
| | | | Total U.S. Government and Agency Obligations
(Cost $3,580,083) | | | 3,828,745 | |
| | | | | | | | |
| | | | | | | | |
| Shares | | | | | Market
Value | |
| INVESTMENT COMPANY – 10.25% | | | | |
| | 3,254,277 | | | BlackRock Liquidity Funds TempCash Portfolio | | $ | 3,254,277 | |
| | | | | | | | |
| | | | Total Investment Company
(Cost $3,254,277) | | | 3,254,277 | |
| | | | | | | | |
| Total Investments – 100.21%
(Cost $28,195,359)** | | | 31,828,164 | |
| | | | | | | | |
| Net Other Assets and Liabilities – (0.21)% | | | (66,599 | ) |
| | | | | | | | |
| Net Assets – 100.00% | | $ | 31,761,565 | |
| | | | | | | | |
| * | Non-income producing security. |
| ** | At April 30, 2012, cost is identical for book and Federal income tax purposes. |
| | | | |
Gross unrealized appreciation | | $ | 3,660,775 | |
Gross unrealized depreciation | | | (27,970 | ) |
| | | | |
Net unrealized appreciation | | $ | 3,632,805 | |
| | | | |
| | | | |
Portfolio Composition | | | | |
Common Stocks | | | 56 | % |
Investment Company | | | 10 | % |
U.S. Government and Agency Obligations | | | 12 | % |
Corporate Notes and Bonds (Moody’s Ratings) | | | | |
Aaa | | | 1 | % |
Aa | | | 9 | % |
A | | | 12 | % |
| | | | |
| | | 100 | % |
| | | | |
|
See accompanying Notes to Financial Statements. |
| 52 |
| |
This page intentionally left blank.
| | | | |
Aston Funds | | | | |
| | | April 30, 2012 | |
| Statements of Assets and Liabilities (unaudited) | | | | |
| | | | | | | | |
| | | Montag & Caldwell
Growth Fund | | | Veredus Select
Growth Fund | |
ASSETS: | | | | | | | | |
Investments: | | | | | | | | |
Investments at cost | | $ | 3,079,828,373 | | | $ | 44,170,423 | |
Net unrealized appreciation | | | 620,086,532 | | | | 4,855,355 | |
| | | | | | | | |
Total investments at value | | | 3,699,914,905 | | | | 49,025,778 | |
Cash | | | 8,125,859 | | | | — | |
Receivables: | | | | | | | | |
Dividends and interest | | | 4,393,566 | | | | 12,999 | |
Dividend reclaims | | | — | | | | — | |
Fund shares sold | | | 85,786,706 | | | | 584 | |
Investments sold | | | 65,229,521 | | | | 3,197,045 | |
Due from Adviser, net (Note G) | | | — | | | | — | |
Other assets. | | | 104,548 | | | | 5,022 | |
| | | | | | | | |
Total assets | | | 3,863,555,105 | | | | 52,241,428 | |
| | | | | | | | |
| | |
LIABILITIES: | | | | | | | | |
Payables: | | | | | | | | |
Due to custodian | | | — | | | | 20,181 | |
Dividend distribution | | | — | | | | — | |
Investments purchased | | | 35,727,722 | | | | 4,170,717 | |
Fund shares redeemed | | | 5,433,473 | | | | 58,275 | |
Due to Adviser, net (Note G) | | | 1,951,237 | | | | 27,269 | |
Administration fees (Note G) | | | 170,860 | | | | 3,980 | |
Distribution fees (Note G) | | | 184,609 | | | | 1,315 | |
Audit and tax fees | | | 17,033 | | | | 10,362 | |
Transfer agent fees | | | 464,884 | | | | 22,079 | |
Registration fees | | | — | | | | — | |
Trustees fees and related expenses (Note G) | | | 86 | | | | 29 | |
Accrued expenses and other payables | | | 293,819 | | | | 8,606 | |
| | | | | | | | |
Total liabilities | | | 44,243,723 | | | | 4,322,813 | |
| | | | | | | | |
NET ASSETS | | $ | 3,819,311,382 | | | $ | 47,918,615 | |
| | | | | | | | |
| | |
NET ASSETS CONSIST OF: | | | | | | | | |
Paid in capital | | $ | 3,072,799,201 | | | $ | 63,252,498 | |
Accumulated undistributed (distribution in excess of) net investment income (loss) | | | 8,610,213 | | | | 172,235 | |
Accumulated net realized gain (loss) on investments and purchased options | | | 117,815,436 | | | | (20,361,473 | ) |
Net unrealized appreciation on investments and purchased options | | | 620,086,532 | | | | 4,855,355 | |
| | | | | | | | |
TOTAL NET ASSETS | | $ | 3,819,311,382 | | | $ | 47,918,615 | |
| | | | | | | | |
Class N: | | | | | | | | |
Net Assets | | $ | 1,801,757,475 | | | $ | 12,723,366 | |
Shares of beneficial interest outstanding (unlimited authorization) | | | 71,255,463 | | | | 1,125,742 | |
NET ASSET VALUE Offering and redemption price per share
(Net Assets/Shares Outstanding) | | $ | 25.29 | | | $ | 11.30 | |
| | | | | | | | |
Class I: | | | | | | | | |
Net Assets | | $ | 2,008,214,441 | | | $ | 35,195,249 | |
Shares of beneficial interest outstanding (unlimited authorization) | | | 79,051,228 | | | | 3,071,240 | |
NET ASSET VALUE Offering and redemption price per share
(Net Assets/Shares Outstanding) | | $ | 25.40 | | | $ | 11.46 | |
| | | | | | | | |
Class R: | | | | | | | | |
Net Assets | | $ | 9,339,466 | | | $ | — | |
Shares of beneficial interest outstanding (unlimited authorization) | | | 373,145 | | | | — | |
NET ASSET VALUE Offering and redemption price per share
(Net Assets/Shares Outstanding) | | $ | 25.03 | | | $ | — | |
| | | | | | | | |
|
See accompanying Notes to Financial Statements. |
| 54 |
| |
| | | | | | | | | | | | | | | | | | | | | | | | | | |
TAMRO
Diversified
Equity Fund | | | Herndon
Large Cap
Value Fund | | | Cornerstone
Large Cap
Value Fund | | | River Road
Dividend All
Cap Value
Fund | | | Fairpointe Mid
Cap Fund | | | Montag &
Caldwell
Mid Cap
Growth
Fund | | | Cardinal
Mid Cap
Value Fund | |
| | | | | | | | | | | | | | | | | | | | | | | | | | |
| | | | | | | | | | | | | | | | | | | | | | | | | | |
| $ | 17,705,160 | | | $ | 45,245,569 | | | $ | 24,331,494 | | | $ | 761,092,715 | | | $ | 2,542,172,000 | | | $ | 5,471,396 | | | $ | 1,542,835 | |
| | 4,419,905 | | | | 2,548,743 | | | | 1,729,878 | | | | 91,904,770 | | | | 437,838,904 | | | | 1,316,951 | | | | 359,415 | |
| | | | | | | | | | | | | | | | | | | | | | | | | | |
| | 22,125,065 | | | | 47,794,312 | | | | 26,061,372 | | | | 852,997,485 | | | | 2,980,010,904 | | | | 6,788,347 | | | | 1,902,250 | |
| | 30,316 | | | | 5,951 | | | | 2,827 | | | | 849,313 | | | | — | | | | — | | | | — | |
| | | | | | | | | | | | | | | | | | | | | | | | | | |
| | 3,216 | | | | 57,237 | | | | 44,019 | | | | 1,588,107 | | | | 767,831 | | | | 1,351 | | | | 11 | |
| | — | | | | — | | | | 1,827 | | | | 1,183 | | | | — | | | | — | | | | — | |
| | 5,438 | | | | 84,760 | | | | 29,604 | | | | 4,839,977 | | | | 4,310,140 | | | | 28,076 | | | | — | |
| | 84,366 | | | | — | | | | 244,979 | | | | 137,219 | | | | 12,694,690 | | | | 83,969 | | | | 23,701 | |
| | 8,345 | | | | — | | | | — | | | | — | | | | — | | | | 1,655 | | | | 4,555 | |
| | 2,709 | | | | 8,555 | | | | 1,114 | | | | 51,517 | | | | 51,342 | | | | 83 | | | | 30 | |
| | | | | | | | | | | | | | | | | | | | | | | | | | |
| | 22,259,455 | | | | 47,950,815 | | | | 26,385,742 | | | | 860,464,801 | | | | 2,997,834,907 | | | | 6,903,481 | | | | 1,930,547 | |
| | | | | | | | | | | | | | | | | | | | | | | | | | |
| | | | | | |
| | | | | | | | | | | | | | | | | | | | | | | | | | |
| | | | | | | | | | | | | | | | | | | | | | | | | | |
| | — | | | | — | | | | — | | | | — | | | | 1,308,065 | | | | 65,895 | | | | 5,561 | |
| | — | | | | — | | | | — | | | | 233,437 | | | | — | | | | — | | | | — | |
| | 67,695 | | | | — | | | | 253,748 | | | | 2,730,634 | | | | 15,772,624 | | | | 35,268 | | | | — | |
| | 602 | | | | 26 | | | | 26,176 | | | | 659,309 | | | | 9,130,622 | | | | 54,632 | | | | — | |
| | 14,325 | | | | 29,071 | | | | 11,624 | | | | 482,526 | | | | 1,754,707 | | | | — | | | | — | |
| | 2,740 | | | | 3,533 | | | | 3,962 | | | | 38,669 | | | | 140,051 | | | | 1,941 | | | | 1,738 | |
| | 2,188 | | | | 995 | | | | 2,331 | | | | 34,295 | | | | 163,478 | | | | 680 | | | | 191 | |
| | 10,361 | | | | 11,209 | | | | 11,909 | | | | 12,753 | | | | 19,509 | | | | 10,217 | | | | 10,360 | |
| | 6,937 | | | | 5,095 | | | | 9,520 | | | | — | | | | 346,006 | | | | 2,683 | | | | 2,801 | |
| | — | | | | — | | | | 4,554 | | | | — | | | | — | | | | 4,352 | | | | 4,402 | |
| | 42 | | | | 4 | | | | 178 | | | | 530 | | | | 864 | | | | 45 | | | | 19 | |
| | 6,296 | | | | 3,593 | | | | 11,588 | | | | 44,782 | | | | 208,375 | | | | 2,601 | | | | 1,385 | |
| | | | | | | | | | | | | | | | | | | | | | | | | | |
| | 111,186 | | | | 53,526 | | | | 335,590 | | | | 4,236,935 | | | | 28,844,301 | | | | 178,314 | | | | 26,457 | |
| | | | | | | | | | | | | | | | | | | | | | | | | | |
| $ | 22,148,269 | | | $ | 47,897,289 | | | $ | 26,050,152 | | | $ | 856,227,866 | | | $ | 2,968,990,606 | | | $ | 6,725,167 | | | $ | 1,904,090 | |
| | | | | | | | | | | | | | | | | | | | | | | | | | |
| | | | | | |
| | | | | | | | | | | | | | | | | | | | | | | | | | |
| $ | 18,048,602 | | | $ | 45,632,625 | | | $ | 52,885,691 | | | $ | 749,888,256 | | | $ | 2,462,679,401 | | | $ | 5,567,823 | | | $ | 1,762,147 | |
| | 12,246 | | | | 170,974 | | | | 213 | | | | 17,367 | | | | 1,429,514 | | | | (16,768 | ) | | | 1,135 | |
| | (332,484 | ) | | | (455,053 | ) | | | (28,565,630 | ) | | | 14,417,473 | | | | 67,042,787 | | | | (142,839 | ) | | | (218,607 | ) |
| | 4,419,905 | | | | 2,548,743 | | | | 1,729,878 | | | | 91,904,770 | | | | 437,838,904 | | | | 1,316,951 | | | | 359,415 | |
| | | | | | | | | | | | | | | | | | | | | | | | | | |
| $ | 22,148,269 | | | $ | 47,897,289 | | | $ | 26,050,152 | | | $ | 856,227,866 | | | $ | 2,968,990,606 | | | $ | 6,725,167 | | | $ | 1,904,090 | |
| | | | | | | | | | | | | | | | | | | | | | | | | | |
| | | | | | | | | | | | | | | | | | | | | | | | | | |
| $ | 21,759,952 | | | $ | 9,853,660 | | | $ | 22,690,883 | | | $ | 336,924,540 | | | $ | 1,589,446,710 | | | $ | 6,725,167 | | | $ | 1,904,090 | |
| | 1,619,519 | | | | 830,227 | | | | 2,079,737 | | | | 29,530,217 | | | | 49,465,219 | | | | 622,649 | | | | 190,459 | |
| | | | | | |
| $ | 13.44 | | | $ | 11.87 | | | $ | 10.91 | | | $ | 11.41 | | | $ | 32.13 | | | $ | 10.80 | | | $ | 10.00 | |
| | | | | | | | | | | | | | | | | | | | | | | | | | |
| | | | | | | | | | | | | | | | | | | | | | | | | | |
| $ | 388,317 | | | $ | 38,043,629 | | | $ | 3,359,269 | | | $ | 519,303,326 | | | $ | 1,379,543,896 | | | $ | — | | | $ | — | |
| | 28,884 | | | | 3,205,523 | | | | 307,534 | | | | 45,540,602 | | | | 42,353,312 | | | | — | | | | — | |
| | | | | | |
| $ | 13.44 | | | $ | 11.87 | | | $ | 10.92 | | | $ | 11.40 | | | $ | 32.57 | | | $ | — | | | $ | — | |
| | | | | | | | | | | | | | | | | | | | | | | | | | |
| | | | | | | | | | | | | | | | | | | | | | | | | | |
| $ | — | | | $ | — | | | $ | — | | | $ | — | | | $ | — | | | $ | — | | | $ | — | |
| | — | | | | — | | | | — | | | | — | | | | — | | | | — | | | | — | |
| | | | | | |
| $ | — | | | $ | — | | | $ | — | | | $ | — | | | $ | — | | | $ | — | | | $ | — | |
| | | | | | | | | | | | | | | | | | | | | | | | | | |
| | | | |
See accompanying Notes to Financial Statements. | | | | |
| | | 55 | |
| | | | |
| | | | |
Aston Funds | | | | |
| | | April 30, 2012 | |
| Statements of Assets and Liabilities (unaudited) – continued | | | | |
| | | | | | | | |
| | | Veredus Small
Cap Growth
Fund | | | Small Cap
Growth Fund | |
ASSETS: | | | | | | | | |
Investments: | | | | | | | | |
Investments at cost | | $ | 23,893,385 | | | $ | 8,409,315 | |
Net unrealized appreciation (depreciation) | | | 3,531,673 | | | | 381,376 | |
| | | | | | | | |
Total investments at value | | | 27,425,058 | | | | 8,790,691 | |
Cash | | | — | | | | — | |
Receivables: | | | | | | | | |
Dividends and interest | | | 11,878 | | | | 1,456 | |
Fund shares sold | | | 50 | | | | 5,978 | |
Investments sold | | | 914,603 | | | | 506,336 | |
Due from Adviser, net (Note G) | | | — | | | | 2,947 | |
Deferred offering costs (Note B-13) | | | — | | | | — | |
Other assets | | | 537 | | | | 10,098 | |
| | | | | | | | |
Total assets | | | 28,352,126 | | | | 9,317,506 | |
| | | | | | | | |
| | |
LIABILITIES: | | | | | | | | |
Payables: | | | | | | | | |
Due to custodian | | | 207,847 | | | | 14,662 | |
Dividend distribution | | | — | | | | — | |
Investments purchased | | | 948,387 | | | | 398,585 | |
Fund shares redeemed | | | 12,215 | | | | 71,680 | |
Due to Adviser, net (Note G) | | | 14,141 | | | | — | |
Administration fees (Note G) | | | 3,367 | | | | 2,120 | |
Distribution fees (Note G) | | | 2,528 | | | | 611 | |
Audit and tax fees | | | 10,425 | | | | 10,225 | |
Transfer agent fees | | | 18,927 | | | | 5,176 | |
Registration fees | | | 2,244 | | | | — | |
Trustees fees and related expenses (Note G) | | | 73 | | | | 60 | |
Offering costs | | | — | | | | — | |
Accrued expenses and other payables | | | 7,077 | | | | 5,506 | |
| | | | | | | | |
Total liabilities | | | 1,227,231 | | | | 508,625 | |
| | | | | | | | |
NET ASSETS | | $ | 27,124,895 | | | $ | 8,808,881 | |
| | | | | | | | |
| | |
NET ASSETS CONSIST OF: | | | | | | | | |
Paid in capital | | $ | 42,549,808 | | | $ | 8,221,179 | |
Accumulated undistributed (distribution in excess of) net investment income (loss) | | | (155,011 | ) | | | (52,451 | ) |
Accumulated net realized gain (loss) on investments | | | (18,801,575 | ) | | | 258,777 | |
Net unrealized appreciation (depreciation) on investments | | | 3,531,673 | | | | 381,376 | |
| | | | | | | | |
TOTAL NET ASSETS | | $ | 27,124,895 | | | $ | 8,808,881 | |
| | | | | | | | |
Class N: | | | | | | | | |
Net Assets | | $ | 24,743,920 | | | $ | 5,956,610 | |
Shares of beneficial interest outstanding (unlimited authorization) | | | 1,869,676 | | | | 535,852 | |
NET ASSET VALUE Offering and redemption price per share
(Net Assets/Shares Outstanding) | | $ | 13.23 | | | $ | 11.12 | |
| | | | | | | | |
Class I: | | | | | | | | |
Net Assets | | $ | 2,380,975 | | | $ | 2,852,271 | |
Shares of beneficial interest outstanding (unlimited authorization) | | | 173,428 | | | | 255,934 | |
NET ASSET VALUE Offering and redemption price per share
(Net Assets/Shares Outstanding) | | $ | 13.73 | | | $ | 11.14 | |
| | | | | | | | |
|
See accompanying Notes to Financial Statements. |
| 56 |
| |
| | | | | | | | | | | | | | | | | | | | | | | | | | |
Silvercrest
Small Cap
Fund | | | TAMRO Small
Cap Fund | | | River Road
Select Value
Fund | | | River Road
Small Cap
Value Fund | | | River Road
Independent
Value Fund | | | DoubleLine
Core Plus
Fixed Income
Fund | | | TCH Fixed
Income Fund | |
| | | | | | | | | | | | | | | | | | | | | | | | | | |
| | | | | | | | | | | | | | | | | | | | | | | | | | |
| $ | 3,847,224 | | | $ | 812,134,494 | | | $ | 128,085,487 | | | $ | 216,035,940 | | | $ | 609,175,343 | | | $ | 72,559,022 | | | $ | 66,487,325 | |
| | 93,555 | | | | 255,925,263 | | | | 20,766,513 | | | | 71,613,001 | | | | (7,725,889 | ) | | | 1,511,904 | | | | 5,829,519 | |
| | | | | | | | | | | | | | | | | | | | | | | | | | |
| | 3,940,779 | | | | 1,068,059,757 | | | | 148,852,000 | | | | 287,648,941 | | | | 601,449,454 | | | | 74,070,926 | | | | 72,316,844 | |
| | 2,493 | | | | 988,183 | | | | — | | | | 10,930,680 | | | | — | | | | 1,907,717 | | | | 486,337 | |
| | | | | | | | | | | | | | | | | | | | | | | | | | |
| | 2,280 | | | | 211,963 | | | | 27,497 | | | | 59,038 | | | | 60,381 | | | | 656,928 | | | | 839,846 | |
| | — | | | | 1,087,149 | | | | 175,643 | | | | 250,437 | | | | 1,818,973 | | | | 1,383,514 | | | | 65,210 | |
| | 11,489 | | | | 13,697,980 | | | | 211,337 | | | | 938,017 | | | | 6,040,632 | | | | 692,364 | | | | 524,222 | |
| | 10,301 | | | | — | | | | — | | | | — | | | | — | | | | 2,337 | | | | — | |
| | 52,459 | | | | — | | | | — | | | | — | | | | — | | | | 56,998 | | | | — | |
| | 27 | | | | 18,512 | | | | 6,577 | | | | 6,720 | | | | 8,333 | | | | 624 | | | | 1,286 | |
| | | | | | | | | | | | | | | | | | | | | | | | | | |
| | 4,019,828 | | | | 1,084,063,544 | | | | 149,273,054 | | | | 299,833,833 | | | | 609,377,773 | | | | 78,771,408 | | | | 74,233,745 | |
| | | | | | | | | | | | | | | | | | | | | | | | | | |
| | | | | | |
| | | | | | | | | | | | | | | | | | | | | | | | | | |
| | | | | | | | | | | | | | | | | | | | | | | | | | |
| | — | | | | — | | | | 426,502 | | | | — | | | | 231,493 | | | | — | | | | — | |
| | — | | | | — | | | | — | | | | — | | | | — | | | | 2,248 | | | | 18,402 | |
| | 7,461 | | | | 6,965,498 | | | | 37,767 | | | | 68,815 | | | | 2,891,680 | | | | 856,708 | | | | 249,673 | |
| | — | | | | 4,024,195 | | | | 51,689 | | | | 739,840 | | | | 735,129 | | | | 596,788 | | | | 67,930 | |
| | — | | | | 783,685 | | | | 121,626 | | | | 227,543 | | | | 468,949 | | | | — | | | | 23,941 | |
| | 1,924 | | | | 50,502 | | | | 8,722 | | | | 16,412 | | | | 27,782 | | | | 4,081 | | | | 7,555 | |
| | 56 | | | | 39,890 | | | | 734 | | | | 5,144 | | | | 36,190 | | | | 2,468 | | | | 3,902 | |
| | 7,587 | | | | 12,427 | | | | 11,893 | | | | 11,910 | | | | 10,246 | | | | 13,448 | | | | 13,038 | |
| | 4,196 | | | | 61,905 | | | | 15,220 | | | | 145,631 | | | | 18,903 | | | | 1,613 | | | | 11,368 | |
| | 5,507 | | | | 1,513 | | | | — | | | | 42 | | | | 3,397 | | | | 12,102 | | | | 3,014 | |
| | 34 | | | | 53 | | | | 332 | | | | 807 | | | | 162 | | | | 22 | | | | 121 | |
| | 61,496 | | | | — | | | | — | | | | — | | | | — | | | | — | | | | — | |
| | 2,096 | | | | 83,470 | | | | 18,365 | | | | 35,565 | | | | 31,393 | | | | 6,504 | | | | 7,363 | |
| | | | | | | | | | | | | | | | | | | | | | | | | | |
| | 90,357 | | | | 12,023,138 | | | | 692,850 | | | | 1,251,709 | | | | 4,455,324 | | | | 1,495,982 | | | | 406,307 | |
| | | | | | | | | | | | | | | | | | | | | | | | | | |
| $ | 3,929,471 | | | $ | 1,072,040,406 | | | $ | 148,580,204 | | | $ | 298,582,124 | | | $ | 604,922,449 | | | $ | 77,275,426 | | | $ | 73,827,438 | |
| | | | | | | | | | | | | | | | | | | | | | | | | | |
| | | | | | |
| | | | | | | | | | | | | | | | | | | | | | | | | | |
| $ | 3,601,290 | | | $ | 787,163,071 | | | $ | 122,310,165 | | | $ | 227,009,949 | | | $ | 593,758,075 | | | $ | 75,472,419 | | | $ | 75,109,328 | |
| | 6,947 | | | | (2,637,283 | ) | | | 383,269 | | | | 938,888 | | | | (1,371,145 | ) | | | 56,332 | | | | 136,564 | |
| | 227,679 | | | | 31,589,355 | | | | 5,120,257 | | | | (979,714 | ) | | | 20,261,408 | | | | 234,771 | | | | (7,247,973 | ) |
| | 93,555 | | | | 255,925,263 | | | | 20,766,513 | | | | 71,613,001 | | | | (7,725,889 | ) | | | 1,511,904 | | | | 5,829,519 | |
| | | | | | | | | | | | | | | | | | | | | | | | | | |
| $ | 3,929,471 | | | $ | 1,072,040,406 | | | $ | 148,580,204 | | | $ | 298,582,124 | | | $ | 604,922,449 | | | $ | 77,275,426 | | | $ | 73,827,438 | |
| | | | | | | | | | | | | | | | | | | | | | | | | | |
| | | | | | | | | | | | | | | | | | | | | | | | | | |
| $ | 565,286 | | | $ | 392,594,826 | | | $ | 7,193,261 | | | $ | 49,341,088 | | | $ | 353,939,571 | | | $ | 25,201,206 | | | $ | 63,744,626 | |
| | 51,358 | | | | 19,131,741 | | | | 868,243 | | | | 3,709,689 | | | | 32,517,783 | | | | 2,339,881 | | | | 5,932,517 | |
| | | | | | |
| $ | 11.01 | | | $ | 20.52 | | | $ | 8.28 | | | $ | 13.30 | | | $ | 10.88 | | | $ | 10.77 | | | $ | 10.74 | |
| | | | | | | | | | | | | | | | | | | | | | | | | | |
| | | | | | | | | | | | | | | | | | | | | | | | | | |
| $ | 3,364,185 | | | $ | 679,445,580 | | | $ | 141,386,943 | | | $ | 249,241,036 | | | $ | 250,982,878 | | | $ | 52,074,220 | | | $ | 10,082,812 | |
| | 305,311 | | | | 32,460,908 | | | | 16,937,741 | | | | 18,679,473 | | | | 23,013,432 | | | | 4,835,003 | | | | 938,351 | |
| | | | | | |
| $ | 11.02 | | | $ | 20.93 | | | $ | 8.35 | | | $ | 13.34 | | | $ | 10.91 | | | $ | 10.77 | | | $ | 10.75 | |
| | | | | | | | | | | | | | | | | | | | | | | | | | |
| | | | |
See accompanying Notes to Financial Statements. | | | | |
| | | 57 | |
| | | | |
| | | | |
Aston Funds | | | | |
| | | April 30, 2012 | |
| Statements of Assets and Liabilities (unaudited) – continued | | | | |
| | | | | | | | |
| | | Lake Partners
LASSO Alternatives
Fund | | | Dynamic
Allocation
Fund | |
ASSETS: | | | | | | | | |
Investments: | | | | | | | | |
Investments at cost | | $ | 257,948,143 | | | $ | 36,825,557 | |
Net unrealized appreciation (depreciation) | | | 5,260,127 | | | | 215,685 | |
| | | | | | | | |
Total investments at value | | | 263,208,270 | | | | 37,041,242 | |
Foreign currency (Cost $27,841, $717,576 and $1,803) | | | — | | | | — | |
Cash | | | — | | | | 19,734 | |
Segregated Cash (Note B-5) | | | — | | | | — | |
Receivables: | | | | | | | | |
Dividends and interest | | | 1 | | | | 416 | |
Dividend reclaims | | | — | | | | — | |
Fund shares sold | | | 1,200,298 | | | | 13,820 | |
Investments sold | | | — | | | | — | |
Due from Adviser, net (Note G) | | | — | | | | — | |
Deferred offering costs (Note B-13) | | | — | | | | — | |
Other assets | | | 3,512 | | | | 6,265 | |
| | | | | | | | |
Total assets | | | 264,412,081 | | | | 37,081,477 | |
| | | | | | | | |
| | |
LIABILITIES: | | | | | | | | |
Payables: | | | | | | | | |
Due to custodian | | | 3,830,900 | | | | — | |
Securities sold short, at value (proceeds $1,256,184) | | | — | | | | — | |
Interest and dividends on securities sold short | | | — | | | | — | |
Investments purchased | | | 35,035 | | | | — | |
Fund shares redeemed | | | 173,031 | | | | 21,563 | |
Due to Adviser, net (Note G) | | | 209,419 | | | | 15,426 | |
Administration fees (Note G) | | | 12,895 | | | | 4,630 | |
Distribution fees (Note G) | | | 2,307 | | | | 3,306 | |
Audit and tax fees | | | 11,923 | | | | 11,328 | |
Transfer agent fees | | | 21,683 | | | | 15,718 | |
Registration fees | | | 2,460 | | | | — | |
Trustees fees and related expenses (Note G) | | | 1,012 | | | | 19 | |
Accrued expenses and other payables | | | 25,021 | | | | 6,759 | |
Call options written, at value (premiums received $3,245,130) | | | — | | | | — | |
| | | | | | | | |
Total liabilities | | | 4,325,686 | | | | 78,749 | |
| | | | | | | | |
NET ASSETS | | $ | 260,086,395 | | | $ | 37,002,728 | |
| | | | | | | | |
| | |
NET ASSETS CONSIST OF: | | | | | | | | |
Paid in capital | | $ | 258,585,414 | | | $ | 37,841,346 | |
Accumulated undistributed (distribution in excess of) net investment income (loss) | | | (2,727,034 | ) | | | 27,646 | |
Accumulated net realized gain (loss) on investments, purchased and written options,securities sold short, foreign currency transactions and capital gain distributions received | | | (1,032,112 | ) | | | (1,081,949 | ) |
Net unrealized appreciation (depreciation) on investments, purchased and written options, securities sold short and translation of assets and liabilities in foreign currency | | | 5,260,127 | | | | 215,685 | |
| | | | | | | | |
TOTAL NET ASSETS | | $ | 260,086,395 | | | $ | 37,002,728 | |
| | | | | | | | |
Class N: | | | | | | | | |
Net Assets | | $ | 24,039,441 | | | $ | 32,266,784 | |
Shares of beneficial interest outstanding (unlimited authorization) | | | 1,951,493 | | | | 3,838,331 | |
NET ASSET VALUE Offering and redemption price per share
(Net Assets/Shares Outstanding) | | $ | 12.32 | | | $ | 8.41 | |
| | | | | | | | |
Class I: | | | | | | | | |
Net Assets | | $ | 236,046,954 | | | $ | 4,735,944 | |
Shares of beneficial interest outstanding (unlimited authorization) | | | 19,133,101 | | | | 562,519 | |
NET ASSET VALUE Offering and redemption price per share
(Net Assets/Shares Outstanding) | | $ | 12.34 | | | $ | 8.42 | |
| | | | | | | | |
|
See accompanying Notes to Financial Statements. |
| 58 |
| |
| | | | | | | | | | | | | | | | | | | | | | |
M.D. Sasst
Enhanced Equity
Fund | | | River Road
Long-Short
Fund | | | Neptune
International
Fund | | | Barings
International
Fund | | | Harrison
Street Real
Estate Fund | | | Montag &
Caldwell
Balanced Fund | |
| | | | | | | | | | | | | | | | | | | | | | |
| | | | | | | | | | | | | | | | | | | | | | |
| $ | 157,148,618 | | | $ | 5,376,266 | | | $ | 1,728,434 | | | $ | 61,947,860 | | | $ | 7,417,291 | | | $ | 28,195,359 | |
| | (4,862,380 | ) | | | 158,476 | | | | 36,243 | | | | 2,499,160 | | | | 1,444,192 | | | | 3,632,805 | |
| | | | | | | | | | | | | | | | | | | | | | |
| | 152,286,238 | | | | 5,534,742 | | | | 1,764,677 | | | | 64,447,020 | | | | 8,861,483 | | | | 31,828,164 | |
| | — | | | | — | | | | 28,230 | | | | 720,910 | | | | 1,807 | | | | — | |
| | 1,914,276 | | | | — | | | | — | | | | — | | | | 12,023 | | | | 55,338 | |
| | — | | | | 1,063,796 | | | | — | | | | — | | | | — | | | | — | |
| | | | | | | | | | | | | | | | | | | | | | |
| | 109,994 | | | | 92 | | | | 8,067 | | | | 311,006 | | | | 4,895 | | | | 129,892 | |
| | — | | | | — | | | | 846 | | | | 60,567 | | | | — | | | | — | |
| | 2,707,761 | | | | — | | | | — | | | | 5,541 | | | | 14,996 | | | | 237,516 | |
| | 30,285 | | | | 399,592 | | | | — | | | | — | | | | 48,936 | | | | 290,666 | |
| | — | | | | 6,607 | | | | 8,685 | | | | — | | | | 2,402 | | | | — | |
| | — | | | | 544 | | | | — | | | | — | | | | — | | | | — | |
| | 15,069 | | | | 73 | | | | 29 | | | | 1,011 | | | | 86 | | | | 485 | |
| | | | | | | | | | | | | | | | | | | | | | |
| | 157,063,623 | | | | 7,005,446 | | | | 1,810,534 | | | | 65,546,055 | | | | 8,946,628 | | | | 32,542,061 | |
| | | | | | | | | | | | | | | | | | | | | | |
| | | | | |
| | | | | | | | | | | | | | | | | | | | | | |
| | | | | | | | | | | | | | | | | | | | | | |
| | — | | | | 8,815 | | | | 10 | | | | 408 | | | | — | | | | — | |
| | — | | | | 1,255,999 | | | | — | | | | — | | | | — | | | | — | |
| | — | | | | 1,209 | | | | — | | | | — | | | | — | | | | — | |
| | 4,167,777 | | | | 160,301 | | | | — | | | | 1,260,258 | | | | 40,375 | | �� | | 685,960 | |
| | 301,404 | | | | — | | | | — | | | | 12,965 | | | | 43,882 | | | | 48,732 | |
| | 82,749 | | | | — | | | | — | | | | 41,558 | | | | — | | | | 12,384 | |
| | 9,096 | | | | 1,868 | | | | 3,706 | | | | 10,243 | | | | 1,995 | | | | 3,546 | |
| | 6,720 | | | | 566 | | | | 37 | | | | 45 | | | | 877 | | | | 1,150 | |
| | 11,358 | | | | 12,391 | | | | 11,902 | | | | 11,885 | | | | 11,150 | | | | 13,262 | |
| | 10,720 | | | | 2,793 | | | | 5,586 | | | | 5,419 | | | | 7,802 | | | | 10,049 | |
| | — | | | | 4,259 | | | | 2,291 | | | | 4,260 | | | | 3,207 | | | | 182 | |
| | 136 | | | | 37 | | | | 19 | | | | 44 | | | | 97 | | | | 94 | |
| | 20,584 | | | | 5,840 | | | | 1,840 | | | | 19,346 | | | | 8,589 | | | | 5,137 | |
| | 3,539,587 | | | | — | | | | — | | | | — | | | | — | | | | — | |
| | | | | | | | | | | | | | | | | | | | | | |
| | 8,150,131 | | | | 1,454,078 | | | | 25,391 | | | | 1,366,431 | | | | 117,974 | | | | 780,496 | |
| | | | | | | | | | | | | | | | | | | | | | |
| $ | 148,913,492 | | | $ | 5,551,368 | | | $ | 1,785,143 | | | $ | 64,179,624 | | | $ | 8,828,654 | | | $ | 31,761,565 | |
| | | | | | | | | | | | | | | | | | | | | | |
| | | | | |
| | | | | | | | | | | | | | | | | | | | | | |
| $ | 151,988,797 | | | $ | 5,356,407 | | | $ | 5,171,474 | | | $ | 61,129,145 | | | $ | 21,929,805 | | | $ | 30,939,027 | |
| | 54,267 | | | | (67,026 | ) | | | 7,994 | | | | 531,448 | | | | 218,620 | | | | (234,586 | ) |
| | | | | |
| | 2,027,265 | | | | 103,326 | | | | (3,431,063 | ) | | | 15,213 | | | | (14,763,963 | ) | | | (2,575,681 | ) |
| | | | | |
| | (5,156,837 | ) | | | 158,661 | | | | 36,738 | | | | 2,503,818 | | | | 1,444,192 | | | | 3,632,805 | |
| | | | | | | | | | | | | | | | | | | | | | |
| $ | 148,913,492 | | | $ | 5,551,368 | | | $ | 1,785,143 | | | $ | 64,179,624 | | | $ | 8,828,654 | | | $ | 31,761,565 | |
| | | | | | | | | | | | | | | | | | | | | | |
| | | | | | | | | | | | | | | | | | | | | | |
| $ | 69,488,148 | | | $ | 5,551,368 | | | $ | 362,470 | | | $ | 414,239 | | | $ | 8,734,814 | | | $ | 30,255,260 | |
| | 7,813,123 | | | | 533,075 | | | | 44,652 | | | | 59,763 | | | | 850,269 | | | | 1,412,286 | |
| | | | | |
| $ | 8.89 | | | $ | 10.41 | | | $ | 8.12 | | | $ | 6.93 | | | $ | 10.27 | | | $ | 21.42 | |
| | | | | | | | | | | | | | | | | | | | | | |
| | | | | | | | | | | | | | | | | | | | | | |
| $ | 79,425,344 | | | $ | — | | | $ | 1,422,673 | | | $ | 63,765,385 | | | $ | 93,840 | | | $ | 1,506,305 | |
| | 8,922,317 | | | | — | | | | 174,981 | | | | 9,194,890 | | | | 9,191 | | | | 70,475 | |
| | | | | |
| $ | 8.90 | | | $ | — | | | $ | 8.13 | | | $ | 6.93 | | | $ | 10.21 | | | $ | 21.37 | |
| | | | | | | | | | | | | | | | | | | | | | |
| | | | |
See accompanying Notes to Financial Statements. | | | | |
| | | 59 | |
| | | | |
| | |
Aston Funds | | |
| For the Year Ended April 30, 2012 | | |
| Statements of Operations (unaudited) | | |
| | | | | | | | |
| | |
| | | Montag & Caldwell
Growth Fund | | | Veredus Select
Growth Fund | |
INVESTMENT INCOME: | | | | | | | | |
Dividends | | $ | 29,535,664 | | | $ | 486,751 | |
Less: foreign taxes withheld | | | (95,105 | ) | | | — | |
| | | | | | | | |
Total investment income | | | 29,440,559 | | | | 486,751 | |
| | | | | | | | |
EXPENSES: | | | | | | | | |
Investment advisory fees (Note G) | | | 11,342,700 | | | | 224,407 | |
Distribution expenses (Note G)(a) | | | 2,149,520 | | | | 19,748 | |
Transfer agent fees | | | 1,369,590 | | | | 45,692 | |
Administration fees (Note G) | | | 909,814 | | | | 22,087 | |
Registration expenses | | | 51,229 | | | | 11,437 | |
Custodian fees | | | 65,694 | | | | 2,757 | |
Audit and tax fees | | | 15,657 | | | | 9,424 | |
Legal fees | | | 90,276 | | | | 1,489 | |
Reports to shareholder expense | | | 129,944 | | | | 3,560 | |
Trustees fees and related expenses (Note G) | | | 137,395 | | | | 2,473 | |
Interest expense (Note H) | | | — | | | | 70 | |
Other expenses | | | 107,987 | | | | 4,575 | |
| | | | | | | | |
Total expenses before waivers/reimbursements | | | 16,369,806 | | | | 347,719 | |
| | | | | | | | |
Less: Investment advisory fees waived (Note G) | | | — | | | | (33,366 | ) |
Less: Expenses reimbursed (Note G) | | | — | | | | — | |
| | | | | | | | |
Net expenses | | | 16,369,806 | | | | 314,353 | |
| | | | | | | | |
NET INVESTMENT INCOME (LOSS) | | | 13,070,753 | | | | 172,398 | |
| | | | | | | | |
NET REALIZED AND UNREALIZED GAIN (LOSS) ON INVESTMENTS: | | | | | | | | |
Net realized gain (loss) on investments | | | 139,113,306 | | | | (446,152 | ) |
Net realized loss on purchased options | | | — | | | | — | |
Net change in unrealized appreciation of investments | | | 231,194,371 | | | | 1,370,451 | |
Net change in unrealized appreciation on purchased options | | | — | | | | — | |
| | | | | | | | |
| | |
NET REALIZED AND UNREALIZED GAIN ON INVESTMENTS | | | 370,307,677 | | | | 924,299 | |
| | | | | | | | |
| | |
NET INCREASE IN NET ASSETS FROM OPERATIONS | | $ | 383,378,430 | | | $ | 1,096,697 | |
| | | | | | | | |
| (a) | Distribution expense is incurred at the Class N level for all funds except Montag & Caldwell Growth Fund. |
The distribution expense for Class N and R of the Montag & Caldwell Growth Fund is $2,127,251 and $22,269, respectively.
| (b) | On January 13, 2012, Fairpointe Mid Cap Fund had a redemption-in-kind transfer of securities in the amount of $38,179,960. |
The net realized gain on the transaction of $2,483,994 will not be realized by the Fund for tax purposes.
|
See accompanying Notes to Financial Statements. |
| 60 |
| |
| | | | | | | | | | | | | | | | | | | | | | | | | | |
TAMRO
Diversified
Equity Fund | | | Herndon
Large Cap
Value Fund | | | Cornerstone Large
Cap Value
Fund | | | River Road
Dividend All
Cap Value Fund | | | Fairpointe
Mid Cap
Fund | | | Montag & Caldwell
Mid Cap
Growth Fund | | | Cardinal
Mid Cap
Value Fund | |
| | | | | | | | | | | | | | | | | | | | | | | | | | |
| $ | 147,932 | | | $ | 427,510 | | | $ | 273,441 | | | $ | 13,542,841 | | | $ | 21,965,281 | | | $ | 17,328 | | | $ | 18,490 | |
| | (1,277 | ) | | | (559 | ) | | | (6,638 | ) | | | (30,980 | ) | | | (25,696 | ) | | | (75 | ) | | | — | |
| | | | | | | | | | | | | | | | | | | | | | | | | | |
| | 146,655 | | | | 426,951 | | | | 266,803 | | | | 13,511,861 | | | | 21,939,585 | | | | 17,253 | | | | 18,490 | |
| | | | | | | | | | | | | | | | | | | | | | | | | | |
| | | | | | | | | | | | | | | | | | | | | | | | | | |
| | 89,654 | | | | 113,930 | | | | 102,246 | | | | 2,584,325 | | | | 10,194,446 | | | | 23,134 | | | | 7,949 | |
| | 27,859 | | | | 9,512 | | | | 30,441 | | | | 407,483 | | | | 1,940,008 | | | | 6,804 | | | | 2,207 | |
| | 19,588 | | | | 17,589 | | | | 24,755 | | | | 224,123 | | | | 1,022,997 | | | | 9,488 | | | | 8,876 | |
| | 13,724 | | | | 14,856 | | | | 14,533 | | | | 196,823 | | | | 745,921 | | | | 9,261 | | | | 8,217 | |
| | 17,405 | | | | 16,708 | | | | 13,426 | | | | 36,949 | | | | 39,782 | | | | 8,951 | | | | 8,951 | |
| | 2,258 | | | | 3,183 | | | | 3,731 | | | | 19,400 | | | | 58,135 | | | | 1,525 | | | | 570 | |
| | 9,424 | | | | 9,319 | | | | 10,893 | | | | 11,517 | | | | 15,625 | | | | 9,319 | | | | 9,424 | |
| | 593 | | | | 524 | | | | 1,149 | | | | 18,753 | | | | 72,448 | | | | 130 | | | | 47 | |
| | 837 | | | | 413 | | | | 1,098 | | | | 17,796 | | | | 133,689 | | | | 122 | | | | 50 | |
| | 940 | | | | 776 | | | | 952 | | | | 28,057 | | | | 113,007 | | | | 247 | | | | 87 | |
| | 87 | | | | — | | | | — | | | | — | | | | 12,242 | | | | — | | | | — | |
| | 3,126 | | | | 2,966 | | | | 3,426 | | | | 20,992 | | | | 77,766 | | | | 2,266 | | | | 2,197 | |
| | | | | | | | | | | | | | | | | | | | | | | | | | |
| | 185,495 | | | | 189,776 | | | | 206,650 | | | | 3,566,218 | | | | 14,426,066 | | | | 71,247 | | | | 48,575 | |
| | | | | | | | | | | | | | | | | | | | | | | | | | |
| | (51,086 | ) | | | (30,732 | ) | | | (50,999 | ) | | | — | | | | — | | | | (23,134 | ) | | | (7,949 | ) |
| | — | | | | — | | | | — | | | | — | | | | — | | | | (14,092 | ) | | | (28,261 | ) |
| | | | | | | | | | | | | | | | | | | | | | | | | | |
| | 134,409 | | | | 159,044 | | | | 155,651 | | | | 3,566,218 | | | | 14,426,066 | | | | 34,021 | | | | 12,365 | |
| | | | | | | | | | | | | | | | | | | | | | | | | | |
| | 12,246 | | | | 267,907 | | | | 111,152 | | | | 9,945,643 | | | | 7,513,519 | | | | (16,768 | ) | | | 6,125 | |
| | | | | | | | | | | | | | | | | | | | | | | | | | |
| | | | | | | | | | | | | | | | | | | | | | | | | | |
| | (130,015 | ) | | | (158,754 | ) | | | 757,598 | | | | 15,982,437 | | | | 68,665,511 | (b) | | | 214,979 | | | | 4,728 | |
| | (135,373 | ) | | | — | | | | — | | | | — | | | | — | | | | — | | | | — | |
| | 2,469,881 | | | | 2,673,319 | | | | 1,296,977 | | | | 36,949,598 | | | | 158,537,461 | | | | 369,066 | | | | 149,186 | |
| | 132,322 | | | | — | | | | — | | | | — | | | | — | | | | — | | | | — | |
| | | | | | | | | | | | | | | | | | | | | | | | | | |
| | | | | | |
| | 2,336,815 | | | | 2,514,565 | | | | 2,054,575 | | | | 52,932,035 | | | | 227,202,972 | | | | 584,045 | | | | 153,914 | |
| | | | | | | | | | | | | | | | | | | | | | | | | | |
| | | | | | |
| $ | 2,349,061 | | | $ | 2,782,472 | | | $ | 2,165,727 | | | $ | 62,877,678 | | | $ | 234,716,491 | | | $ | 567,277 | | | $ | 160,039 | |
| | | | | | | | | | | | | | | | | | | | | | | | | | |
| | | | |
See accompanying Notes to Financial Statements. | | | | |
| | | 61 | |
| | | | |
| | |
Aston Funds | | |
| For the Year Ended April 30, 2012 | | |
| Statements of Operations (unaudited) – continued | | |
| | | | | | | | |
| | | Veredus
Small Cap
Growth Fund | | | Small Cap
Growth Fund | |
INVESTMENT INCOME: | | | | | | | | |
Dividends | | $ | 66,438 | | | $ | 5,216 | |
Less: foreign taxes withheld | | | — | | | | — | |
Interest | | | — | | | | — | |
| | | | | | | | |
Total investment income | | | 66,438 | | | | 5,216 | |
| | | | | | | | |
EXPENSES: | | | | | | | | |
Investment advisory fees (Note G) | | | 153,046 | | | | 41,047 | |
Distribution expenses (Note G) | | | 31,671 | | | | 6,943 | |
Transfer agent fees | | | 36,688 | | | | 19,118 | |
Administration fees (Note G) | | | 16,426 | | | | 10,189 | |
Registration expenses | | | 13,147 | | | | 17,065 | |
Custodian fees | | | 3,026 | | | | 4,963 | |
Audit and tax fees | | | 9,424 | | | | 9,319 | |
Legal fees | | | 788 | | | | 216 | |
Amortization of offering costs (Note B-13) | | | — | | | | — | |
Reports to shareholder expense | | | 2,646 | | | | 181 | |
Trustees fees and related expenses (Note G) | | | 1,405 | | | | 380 | |
Interest expense (Note H) | | | — | | | | — | |
Other expenses | | | 3,436 | | | | 2,631 | |
| | | | | | | | |
Total expenses before waivers/reimbursements | | | 271,703 | | | | 112,052 | |
| | | | | | | | |
Less: Investment advisory fees waived (Note G) | | | (50,254 | ) | | | (41,047 | ) |
Less: Expenses reimbursed (Note G) | | | — | | | | (18,911 | ) |
| | | | | | | | |
Net expenses | | | 221,449 | | | | 52,094 | |
| | | | | | | | |
NET INVESTMENT INCOME (LOSS) | | | (155,011 | ) | | | (46,878 | ) |
| | | | | | | | |
NET REALIZED AND UNREALIZED GAIN (LOSS) ON INVESTMENTS: | | | | | | | | |
Net realized gain on investments | | | 1,903,184 | (b) | | | 442,297 | |
Net change in unrealized appreciation (depreciation) on investments | | | (326,612 | ) | | | 522,931 | |
| | | | | | | | |
| | |
NET REALIZED AND UNREALIZED GAIN ON INVESTMENTS | | | 1,576,572 | | | | 965,228 | |
| | | | | | | | |
| | |
NET INCREASE IN NET ASSETS FROM OPERATIONS | | $ | 1,421,561 | | | $ | 918,350 | |
| | | | | | | | |
| (a) | Silvercrest Small Cap Fund began issuing shares on December 23, 2011. |
| (b) | On December 2, 2011, Veredus Small Cap Growth Fund had a redemption-in-kind transfer of securities in the amount of $13,225,479. The net realized gain on the transaction of $1,299,502 will not be realized by the Fund for tax purposes. |
| (c) | On April 26, 2012, Silvercrest Small Cap Fund had a redemption-in-kind transfer of securities in the amount of $2,597,146. The net realized gain on the transaction of $211,366 will not be realized by the Fund for tax purposes. |
|
See accompanying Notes to Financial Statements. |
| 62 |
| |
| | | | | | | | | | | | | | | | | | | | | | | | | | |
Silvercrest
Small Cap
Fund(a) | | | TAMRO
Small Cap
Fund | | | River Road
Select Value
Fund | | | River Road
Small Cap
Value Fund | | | River Road
Independent
Value Fund | | | DoubleLine Core
Plus Fixed Income
Fund | | | TCH
Fixed Income
Fund | |
| | | | | | | | | | | | | | | | | | | | | | | | | | |
| $ | 25,917 | | | $ | 3,164,127 | | | $ | 1,255,346 | | | $ | 2,885,841 | | | $ | 2,359,485 | | | $ | 1,202 | | | $ | 1,482 | |
| | — | | | | (8,853 | ) | | | (12,460 | ) | | | (32,211 | ) | | | (3,517 | ) | | | — | | | | — | |
| | — | | | | — | | | | — | | | | — | | | | — | | | | 1,287,612 | | | | 1,810,708 | |
| | | | | | | | | | | | | | | | | | | | | | | | | | |
| | 25,917 | | | | 3,155,274 | | | | 1,242,886 | | | | 2,853,630 | | | | 2,355,968 | | | | 1,288,814 | | | | 1,812,190 | |
| | | | | | | | | | | | | | | | | | | | | | | | | | |
| | | | | | | | | | | | | | | | | | | | | | | | | | |
| | 16,110 | | | | 4,608,076 | | | | 706,759 | | | | 1,444,163 | | | | 2,778,584 | | | | 137,606 | | | | 197,801 | |
| | 442 | | | | 474,242 | | | | 12,096 | | | | 87,906 | | | | 438,634 | | | | 30,651 | | | | 56,547 | |
| | 13,118 | | | | 240,126 | | | | 38,346 | | | | 207,233 | | | | 226,769 | | | | 31,047 | | | | 30,987 | |
| | 6,279 | | | | 270,999 | | | | 44,627 | | | | 91,072 | | | | 149,103 | | | | 31,144 | | | | 34,339 | |
| | 8,130 | | | | 22,874 | | | | 15,912 | | | | 15,415 | | | | 29,836 | | | | 19,891 | | | | 15,415 | |
| | 1,191 | | | | 22,251 | | | | 7,589 | | | | 10,805 | | | | 13,781 | | | | 9,019 | | | | 3,165 | |
| | 7,587 | | | | 11,256 | | | | 10,893 | | | | 10,893 | | | | 9,320 | | | | 11,959 | | | | 11,959 | |
| | 45 | | | | 26,161 | | | | 3,619 | | | | 8,363 | | | | 13,843 | | | | 1,890 | | | | 1,904 | |
| | 27,541 | | | | — | | | | — | | | | — | | | | 9,185 | | | | 132,993 | | | | — | |
| | 288 | | | | 38,911 | | | | 7,156 | | | | 12,629 | | | | 38,825 | | | | 2,636 | | | | 1,820 | |
| | 118 | | | | 42,593 | | | | 5,461 | | | | 12,562 | | | | 21,347 | | | | 1,618 | | | | 2,849 | |
| | — | | | | 2,905 | | | | 2 | | | | — | | | | — | | | | — | | | | — | |
| | 1,980 | | | | 32,163 | | | | 7,157 | | | | 13,701 | | | | 16,387 | | | | 3,173 | | | | 4,320 | |
| | | | | | | | | | | | | | | | | | | | | | | | | | |
| | 82,829 | | | | 5,792,557 | | | | 859,617 | | | | 1,914,742 | | | | 3,745,614 | | | | 413,627 | | | | 361,106 | |
| | | | | | | | | | | | | | | | | | | | | | | | | | |
| | (16,110 | ) | | | — | | | | — | | | | — | | | | (56,039 | ) | | | (137,606 | ) | | | (56,408 | ) |
| | (47,749 | ) | | | — | | | | — | | | | — | | | | — | | | | (72,736 | ) | | | — | |
| | | | | | | | | | | | | | | | | | | | | | | | | | |
| | 18,970 | | | | 5,792,557 | | | | 859,617 | | | | 1,914,742 | | | | 3,689,575 | | | | 203,285 | | | | 304,698 | |
| | | | | | | | | | | | | | | | | | | | | | | | | | |
| | 6,947 | | | | (2,637,283 | ) | | | 383,269 | | | | 938,888 | | | | (1,333,607 | ) | | | 1,085,529 | | | | 1,507,492 | |
| | | | | | | | | | | | | | | | | | | | | | | | | | |
| | | | | | | | | | | | | | | | | | | | | | | | | | |
| | 227,679 | (c) | | | 36,006,399 | | | | 6,632,303 | | | | 12,488,633 | | | | 21,620,532 | | | | 237,718 | | | | 376,538 | |
| | 93,555 | | | | 71,979,736 | | | | 6,411,264 | | | | 15,150,147 | | | | (7,151,566 | ) | | | 1,257,079 | | | | 806,643 | |
| | | | | | | | | | | | | | | | | | | | | | | | | | |
| | | | | | |
| | 321,234 | | | | 107,986,135 | | | | 13,043,567 | | | | 27,638,780 | | | | 14,468,966 | | | | 1,494,797 | | | | 1,183,181 | |
| | | | | | | | | | | | | | | | | | | | | | | | | | |
| | | | | | |
| $ | 328,181 | | | $ | 105,348,852 | | | $ | 13,426,836 | | | $ | 28,577,668 | | | $ | 13,135,359 | | | $ | 2,580,326 | | | $ | 2,690,673 | |
| | | | | | | | | | | | | | | | | | | | | | | | | | |
| | | | |
See accompanying Notes to Financial Statements. | | | | |
| | | 63 | |
| | | | |
| | |
Aston Funds | | |
| For the Year Ended April 30, 2012 | | |
| Statements of Operations (unaudited) – continued | | |
| | | | | | | | |
| | | Lake Partners
LASSO Alternatives
Fund | | | Dynamic
Allocation
Fund | |
INVESTMENT INCOME: | | | | | | | | |
Dividends | | $ | 2,288,166 | | | $ | 409,795 | |
Less: foreign taxes withheld | | | — | | | | — | |
Interest | | | — | | | | — | |
| | | | | | | | |
Total investment income | | | 2,288,166 | | | | 409,795 | |
| | | | | | | | |
EXPENSES: | | | | | | | | |
Investment advisory fees (Note G) | | | 1,148,072 | | | | 180,501 | |
Distribution expenses (Note G) | | | 24,441 | | | | 50,696 | |
Transfer agent fees | | | 82,396 | | | | 45,028 | |
Administration fees (Note G) | | | 65,948 | | | | 20,695 | |
Registration expenses | | | 29,836 | | | | 17,255 | |
Custodian fees | | | 6,964 | | | | 1,592 | |
Audit and tax fees | | | 10,373 | | | | 10,373 | |
Legal fees | | | 5,792 | | | | 1,284 | |
Interest and dividend expense on securities sold-short | | | — | | | | — | |
Amortization of offering costs (Note B-13) | | | — | | | | — | |
Reports to shareholder expense | | | 15,649 | | | | 2,928 | |
Trustees fees and related expenses (Note G) | | | 9,773 | | | | 1,917 | |
Interest expense (Note H) | | | — | | | | — | |
Other expenses | | | 7,648 | | | | 3,854 | |
| | | | | | | | |
Total expenses before waivers/reimbursements | | | 1,406,892 | | | | 336,123 | |
| | | | | | | | |
Less: Investment advisory fees waived (Note G) | | | (4,764 | ) | | | (48,520 | ) |
Less: Expenses reimbursed (Note G) | | | — | | | | — | |
Plus: Net expenses recouped (Note G) | | | — | | | | — | |
| | | | | | | | |
Net expenses | | | 1,402,128 | | | | 287,603 | |
| | | | | | | | |
NET INVESTMENT INCOME (LOSS) | | | 886,038 | | | | 122,192 | |
| | | | | | | | |
NET REALIZED AND UNREALIZED GAIN (LOSS) ON INVESTMENTS: | | | | | | | | |
Net realized gain (loss) on investments | | | (1,532,188 | ) | | | (1,059,467 | ) |
Net realized gain (loss) on purchased options | | | — | | | | — | |
Net realized gain on written option transactions | | | — | | | | — | |
Net realized loss on securities sold short | | | — | | | | — | |
Net realized gain (loss) on foreign currency transactions | | | — | | | | — | |
Capital gain distributions received | | | 4,642,875 | | | | — | |
Net change in unrealized appreciation (depreciation) on investments | | | 6,884,020 | | | | (133,956 | ) |
Net change in unrealized appreciation on purchased options | | | — | | | | — | |
Net change in unrealized appreciation (depreciation) on written options | | | — | | | | — | |
Net change in unrealized appreciation on securities sold short | | | — | | | | — | |
Net change in unrealized appreciation (depreciation) on translation of assets and liabilities denominated in foreign currency | | | — | | | | — | |
| | | | | | | | |
| | |
NET REALIZED AND UNREALIZED GAIN (LOSS) ON INVESTMENTS | | | 9,994,707 | | | | (1,193,423 | ) |
| | | | | | | | |
| | |
NET INCREASE (DECREASE) IN NET ASSETS FROM OPERATIONS | | $ | 10,880,745 | | | $ | (1,071,231 | ) |
| | | | | | | | |
| (a) | On December 2, 2011, Harrison Street Real Estate Fund had a redemption-in-kind transfer of securities in the amount of $30,913,574. The net realized gain on the transaction of $606,174 will not be realized by the Fund for tax purposes. |
|
See accompanying Notes to Financial Statements. |
| 64 |
| |
| | | | | | | | | | | | | | | | | | | | | | |
M.D. Sass Enhanced Equity Fund | | | River Road
Long-Short
Fund | | | Neptune
International
Fund | | | Barings
International
Fund | | | Harrison Street
Real Estate
Fund | | | Montag &
Caldwell
Balanced Fund | |
| | | | | | | | | | | | | | | | | | | | | | |
| $ | 1,871,597 | | | $ | 33,176 | | | $ | 18,318 | | | $ | 962,554 | | | $ | 198,585 | | | $ | 130,920 | |
| | — | | | | (289 | ) | | | (1,078 | ) | | | (69,475 | ) | | | (1,128 | ) | | | (414 | ) |
| | — | | | | — | | | | — | | | | — | | | | — | | | | 131,225 | |
| | | | | | | | | | | | | | | | | | | | | | |
| | 1,871,597 | | | | 32,887 | | | | 17,240 | | | | 893,079 | | | | 197,457 | | | | 261,731 | |
| | | | | | | | | | | | | | | | | | | | | | |
| | | | | | | | | | | | | | | | | | | | | | |
| | 439,761 | | | | 29,307 | | | | 8,616 | | | | 295,332 | | | | 64,292 | | | | 94,732 | |
| | 68,594 | | | | 6,106 | | | | 442 | | | | 492 | | | | 8,688 | | | | 17,758 | |
| | 53,489 | | | | 8,930 | | | | 16,870 | | | | 16,948 | | | | 21,693 | | | | 25,826 | |
| | 41,347 | | | | 9,101 | | | | 13,434 | | | | 35,594 | | | | 10,771 | | | | 15,824 | |
| | 18,349 | | | | 8,951 | | | | 14,719 | | | | 16,907 | | | | 14,769 | | | | 12,929 | |
| | — | | | | 5,377 | | | | 2,912 | | | | 21,499 | | | | 3,349 | | | | 1,302 | |
| | 10,373 | | | | 10,373 | | | | 10,893 | | | | 10,893 | | | | 9,943 | | | | 12,114 | |
| | — | | | | 122 | | | | 44 | | | | 1,491 | | | | 454 | | | | 676 | |
| | — | | | | 50,184 | | | | — | | | | — | | | | — | | | | — | |
| | — | | | | 33,046 | | | | — | | | | — | | | | — | | | | — | |
| | 4,400 | | | | 1,097 | | | | 39 | | | | 1,108 | | | | 342 | | | | 899 | |
| | 4,896 | | | | 221 | | | | 87 | | | | 2,343 | | | | 850 | | | | 969 | |
| | 690 | | | | — | | | | — | | | | — | | | | — | | | | — | |
| | 22,699 | | | | 2,284 | | | | 2,428 | | | | 3,930 | | | | 3,095 | | | | 3,107 | |
| | | | | | | | | | | | | | | | | | | | | | |
| | 664,598 | | | | 165,099 | | | | 70,484 | | | | 406,537 | | | | 138,246 | | | | 186,136 | |
| | | | | | | | | | | | | | | | | | | | | | |
| | — | | | | (29,307 | ) | | | (8,616 | ) | | | (66,413 | ) | | | (57,551 | ) | | | (29,439 | ) |
| | — | | | | (44,089 | ) | | | (52,638 | ) | | | — | | | | — | | | | — | |
| | 61,190 | | | | — | | | | — | | | | — | | | | — | | | | — | |
| | | | | | | | | | | | | | | | | | | | | | |
| | 725,788 | | | | 91,703 | | | | 9,230 | | | | 340,124 | | | | 80,695 | | | | 156,697 | |
| | | | | | | | | | | | | | | | | | | | | | |
| | 1,145,809 | | | | (58,816 | ) | | | 8,010 | | | | 552,955 | | | | 116,762 | | | | 105,034 | |
| | | | | | | | | | | | | | | | | | | | | | |
| | | | | | | | | | | | | | | | | | | | | | |
| | 2,598,870 | | | | 463,152 | | | | (70,051 | ) | | | 497,901 | | | | 1,035,558 | (a) | | | 637,008 | |
| | (3,036,741 | ) | | | — | | | | — | | | | — | | | | — | | | | — | |
| | 2,670,307 | | | | — | | | | — | | | | — | | | | — | | | | — | |
| | — | | | | (208,938 | ) | | | — | | | | — | | | | — | | | | — | |
| | — | | | | — | | | | (19,450 | ) | | | (13,862 | ) | | | 5 | | | | — | |
| | — | | | | — | | | | — | | | | — | | | | — | | | | — | |
| | 2,741,846 | | | | (17,647 | ) | | | 121,636 | | | | 2,185,976 | | | | (1,511,744 | ) | | | 1,074,836 | |
| | 509,568 | | | | — | | | | — | | | | — | | | | — | | | | — | |
| | (1,039,935 | ) | | | — | | | | — | | | | — | | | | — | | | | — | |
| | — | | | | 60,233 | | | | — | | | | — | | | | — | | | | — | |
| | | | | |
| | — | | | | — | | | | 19,793 | | | | (27,332 | ) | | | 9 | | | | — | |
| | | | | | | | | | | | | | | | | | | | | | |
| | | | | |
| | 4,443,915 | | | | 296,800 | | | | 51,928 | | | | 2,642,683 | | | | (476,172 | ) | | | 1,711,844 | |
| | | | | | | | | | | | | | | | | | | | | | |
| | | | | |
| $ | 5,589,724 | | | $ | 237,984 | | | $ | 59,938 | | | $ | 3,195,638 | | | $ | (359,410 | ) | | $ | 1,816,878 | |
| | | | | | | | | | | | | | | | | | | | | | |
| | | | |
See accompanying Notes to Financial Statements. | | | | |
| | | 65 | |
| | | | |
| | |
Aston Funds | | |
| | |
| Statements of Changes in Net Assets | | |
| | | | | | | | | | | | | | | | |
| | | Montag & Caldwell
Growth Fund | | | Veredus Select
Growth Fund | |
| | | Six Months Ended
April 30, 2012
(unaudited) | | | Year Ended
October 31,
2011 | | | Six Months Ended
April 30, 2012
(unaudited) | | | Year Ended
October 31,
2011 | |
NET ASSETS at Beginning of Period | | $ | 3,441,019,426 | | | $ | 3,042,348,287 | | | $ | 80,277,274 | | | $ | 104,506,310 | |
| | | | | | | | | | | | | | | | |
Increase (decrease) in net assets from operations: | | | | | | | | | | | | | | | | |
Net investment income (loss) | | | 13,070,753 | | | | 23,212,618 | | | | 172,398 | | | | 12,937 | |
Net realized gain (loss) on investments, purchase options, payments by affiliates, capital gain distributions and foreign currency transactions | | | 139,113,306 | | | | 276,464,229 | | | | (446,152 | ) | | | 2,087,190 | |
Net change in unrealized appreciation (depreciation)on investments, purchase options, translation of assets and liabilities denominated in foreign currency | | | 231,194,371 | | | | (24,507,953 | ) | | | 1,370,451 | | | | (6,313,915 | ) |
| | | | | | | | | | | | | | | | |
Net increase (decrease) in net assets from operations | | | 383,378,430 | | | | 275,168,894 | | | | 1,096,697 | | | | (4,213,788 | ) |
| | | | | | | | | | | | | | | | |
Distributions to shareholders from: | | | | | | | | | | | | | | | | |
Net investment income: | | | | | | | | | | | | | | | | |
Class N | | | (8,653,266 | ) | | | (8,322,107 | ) | | | — | | | | — | |
Class I | | | (13,404,437 | ) | | | (12,483,308 | ) | | | (27,060 | ) | | | — | |
Class R | | | (23,730 | ) | | | (29,409 | ) | | | — | | | | — | |
Net realized gain on investments: | | | | | | | | | | | | | | | | |
Class N | | | (125,020,421 | ) | | | (2,646,170 | ) | | | — | | | | — | |
Class I | | | (132,016,151 | ) | | | (2,724,240 | ) | | | — | | | | — | |
Class R | | | (653,567 | ) | | | (13,510 | ) | | | — | | | | — | |
| | | | | | | | | | | | | | | | |
Total distributions | | | (279,771,572 | ) | | | (26,218,744 | ) | | | (27,060 | ) | | | — | |
| | | | | | | | | | | | | | | | |
Capital share transactions: | | | | | | | | | | | | | | | | |
Proceeds from sales of shares: | | | | | | | | | | | | | | | | |
Class N | | | 173,915,063 | | | | 660,309,446 | | | | 352,644 | | | | 7,667,702 | |
Class I | | | 399,982,388 | | | | 621,098,679 | | | | 1,959,703 | | | | 11,926,061 | |
Class R | | | 1,555,849 | | | | 5,580,418 | | | | — | | | | — | |
Proceeds from reinvestment of distributions: | | | | | | | | | | | | | | | | |
Class N | | | 130,056,898 | | | | 10,562,918 | | | | — | | | | — | |
Class I | | | 100,607,628 | | | | 11,978,807 | | | | 26,847 | | | | — | |
Class R | | | 530,624 | | | | 21,213 | | | | — | | | | — | |
Cost of shares redeemed: | | | | | | | | | | | | | | | | |
Class N | | | (235,683,883 | ) | | | (618,544,121 | ) | | | (8,817,760 | ) | | | (28,127,415 | ) |
Class I | | | (294,601,441 | ) | | | (536,452,510 | ) | | | (26,949,730 | ) | | | (11,481,596 | ) |
Class R | | | (1,678,028 | ) | | | (4,833,861 | ) | | | — | | | | — | |
| | | | | | | | | | | | | | | | |
Net increase (decrease) from capital share transactions | | | 274,685,098 | | | | 149,720,989 | | | | (33,428,296 | ) | | | (20,015,248 | ) |
| | | | | | | | | | | | | | | | |
Total increase (decrease) in net assets | | | 378,291,956 | | | | 398,671,139 | | | | (32,358,659 | ) | | | (24,229,036 | ) |
| | | | | | | | | | | | | | | | |
NET ASSETS at End of Period | | $ | 3,819,311,382 | | | $ | 3,441,019,426 | | | $ | 47,918,615 | | | $ | 80,277,274 | |
| | | | | | | | | | | | | | | | |
Undistributed net investment income | | $ | 8,610,213 | | | $ | 17,620,893 | | | $ | 172,235 | | | $ | 26,897 | |
| | | | | | | | | | | | | | | | |
| (a) | Cornerstone Large Cap Value Fund had a redemption-in-kind on March 18, 2011, which resulted in a redemption out of the Fund of $222,180,158. The redemption was comprised of securities and cash in the amounts of $218,362,480 and $3,817,758, respectively. |
|
See accompanying Notes to Financial Statements. |
| 66 |
| |
| | | | | | | | | | | | | | | | | | | | | | |
TAMRO Diversified
Equity Fund | | | Herndon Large Cap
Value Fund | | | Cornerstone Large Cap
Value Fund | |
Six Months Ended
April 30, 2012
(unaudited) | | | Year Ended
October 31,
2011 | | | Six Months Ended
April 30, 2012
(unaudited) | | | Year Ended
October 31,
2011 | | | Six Months Ended
April 30, 2012
(unaudited) | | | Year Ended
October 31,
2011 | |
| $ | 24,353,652 | | | $ | 15,669,792 | | | $ | 17,969,968 | | | $ | 1,472,096 | | | $ | 24,756,738 | | | $ | 224,034,670 | |
| | | | | | | | | | | | | | | | | | | | | | |
| | | | | | | | | | | | | | | | | | | | | | |
| | 12,246 | | | | (44,914 | ) | | | 267,907 | | | | 136,661 | | | | 111,152 | | | | 1,616,818 | |
| | | | | |
| | (265,388 | ) | | | 656,066 | | | | (158,754 | ) | | | 677,342 | | | | 757,598 | | | | 34,986,939 | |
| | | | | |
| | 2,602,203 | | | | (699,407 | ) | | | 2,673,319 | | | | (196,751 | ) | | | 1,296,977 | | | | (15,657,682 | ) |
| | | | | | | | | | | | | | | | | | | | | | |
| | | | | |
| | 2,349,061 | | | | (88,255 | ) | | | 2,782,472 | | | | 617,252 | | | | 2,165,727 | | | | 20,946,075 | |
| | | | | | | | | | | | | | | | | | | | | | |
| | | | | | | | | | | | | | | | | | | | | | |
| | | | | | | | | | | | | | | | | | | | | | |
| | — | | | | — | | | | (69,391 | ) | | | (13,657 | ) | | | (110,362 | ) | | | (265,642 | ) |
| | — | | | | — | | | | (154,780 | ) | | | — | | | | (577 | ) | | | (1,541,502 | ) |
| | — | | | | — | | | | — | | | | — | | | | — | | | | — | |
| | | | | | | | | | | | | | | | | | | | | | |
| | (473,355 | ) | | | — | | | | (340,506 | ) | | | — | | | | — | | | | — | |
| | — | | | | — | | | | (604,334 | ) | | | — | | | | — | | | | — | |
| | — | | | | — | | | | — | | | | — | | | | — | | | | — | |
| | | | | | | | | | | | | | | | | | | | | | |
| | (473,355 | ) | | | — | | | | (1,169,011 | ) | | | (13,657 | ) | | | (110,939 | ) | | | (1,807,144 | ) |
| | | | | | | | | | | | | | | | | | | | | | |
| | | | | | | | | | | | | | | | | | | | | | |
| | | | | | | | | | | | | | | | | | | | | | |
| | 977,360 | | | | 13,791,809 | | | | 4,210,860 | | | | 14,353,866 | | | | 4,467,537 | | | | 9,241,468 | |
| | 383,293 | | | | — | | | | 25,988,442 | | | | 12,434,600 | | | | 3,188,291 | | | | 413 | |
| | — | | | | — | | | | — | | | | — | | | | — | | | | — | |
| | | | | | | | | | | | | | | | | | | | | | |
| | 461,380 | | | | — | | | | 409,897 | | | | 13,657 | | | | 106,567 | | | | 254,223 | |
| | — | | | | — | | | | 759,114 | | | | — | | | | 577 | | | | 964,424 | |
| | — | | | | — | | | | — | | | | — | | | | — | | | | — | |
| | | | | | | | | | | | | | | | | | | | | | |
| | (5,903,122 | ) | | | (5,019,694 | ) | | | (1,330,320 | ) | | | (10,907,846 | ) | | | (8,520,260 | ) | | | (6,696,820 | ) |
| | — | | | | — | | | | (1,724,133 | ) | | | — | | | | (4,086 | ) | | | (222,180,571 | )(a) |
| | — | | | | — | | | | — | | | | — | | | | — | | | | — | |
| | | | | | | | | | | | | | | | | | | | | | |
| | | | | |
| | (4,081,089 | ) | | | 8,772,115 | | | | 28,313,860 | | | | 15,894,277 | | | | (761,374 | ) | | | (218,416,863 | ) |
| | | | | | | | | | | | | | | | | | | | | | |
| | (2,205,383 | ) | | | 8,683,860 | | | | 29,927,321 | | | | 16,497,872 | | | | 1,293,414 | | | | (199,277,932 | ) |
| | | | | | | | | | | | | | | | | | | | | | |
| $ | 22,148,269 | | | $ | 24,353,652 | | | $ | 47,897,289 | | | $ | 17,969,968 | | | $ | 26,050,152 | | | $ | 24,756,738 | |
| | | | | | | | | | | | | | | | | | | | | | |
| $ | 12,246 | | | $ | — | | | $ | 170,974 | | | $ | 127,238 | | | $ | 213 | | | $ | — | |
| | | | | | | | | | | | | | | | | | | | | | |
| | | | |
See accompanying Notes to Financial Statements. | | | | |
| | | 67 | |
| | | | |
| | |
Aston Funds | | |
| | |
| Statements of Changes in Net Assets – continued | | |
| | | | | | | | | | | | | | | | |
| | | River Road Dividend
All Cap Value Fund | | | Fairpointe Mid Cap Fund | |
| | | Six Months Ended
April 30, 2012
(unaudited) | | | Year Ended
October 31,
2011 | | | Six Months Ended
April 30, 2012
(unaudited) | | | Year Ended
October 31,
2011 | |
NET ASSETS at Beginning of Period | | $ | 620,152,985 | | | $ | 273,172,565 | | | $ | 2,841,488,832 | | | $ | 1,969,004,161 | |
| | | | | | | | | | | | | | | | |
Increase (decrease) in net assets from operations: | | | | | | | | | | | | | | | | |
Net investment income (loss) | | | 9,945,643 | | | | 11,709,666 | | | | 7,513,519 | | | | 8,114,614 | |
Net realized gain on investments | | | 15,982,437 | | | | 4,466,315 | | | | 68,665,511 | | | | 18,380,917 | |
Net change in unrealized appreciation (depreciation) on investments | | | 36,949,598 | | | | 13,856,396 | | | | 158,537,461 | | | | (48,573,966 | ) |
| | | | | | | | | | | | | | | | |
Net increase (decrease) in net assets from operations | | | 62,877,678 | | | | 30,032,377 | | | | 234,716,491 | | | | (22,078,435 | ) |
| | | | | | | | | | | | | | | | |
Distributions to shareholders from: | | | | | | | | | | | | | | | | |
Net investment income: | | | | | | | | | | | | | | | | |
Class N | | | (4,109,948 | ) | | | (4,480,688 | ) | | | (2,661,253 | ) | | | (4,195,319 | ) |
Class I | | | (5,708,066 | ) | | | (6,151,388 | ) | | | (5,501,975 | ) | | | (1,840,072 | ) |
Net realized gain on investments: | | | | | | | | | | | | | | | | |
Class N | | | (2,301,513 | ) | | | — | | | | (10,321,076 | ) | | | (3,944,537 | ) |
Class I | | | (2,349,496 | ) | | | — | | | | (8,446,694 | ) | | | (1,492,202 | ) |
| | | | | | | | | | | | | | | | |
Total distributions | | | (14,469,023 | ) | | | (10,632,076 | ) | | | (26,930,998 | ) | | | (11,472,130 | ) |
| | | | | | | | | | | | | | | | |
Capital share transactions: | | | | | | | | | | | | | | | | |
Proceeds from sales of shares: | | | | | | | | | | | | | | | | |
Class N | | | 93,152,764 | | | | 200,005,589 | | | | 233,036,383 | | | | 723,036,262 | |
Class I | | | 188,262,252 | | | | 193,412,218 | | | | 362,461,382 | | | | 1,264,789,286 | |
Proceeds from reinvestment of distributions: | | | | | | | | | | | | | | | | |
Class N | | | 6,318,663 | | | | 4,324,529 | | | | 12,395,039 | | | | 7,690,209 | |
Class I | | | 5,762,025 | | | | 3,993,640 | | | | 9,858,507 | | | | 2,953,475 | |
Cost of shares redeemed: | | | | | | | | | | | | | | | | |
Class N | | | (85,872,994 | ) | | | (52,119,639 | ) | | | (276,597,077 | ) | | | (731,287,676 | ) |
Class I | | | (19,956,484 | ) | | | (22,036,218 | ) | | | (421,437,953 | )(a) | | | (361,146,320 | ) |
| | | | | | | | | | | | | | | | |
Net increase (decrease) from capital share transactions | | | 187,666,226 | | | | 327,580,119 | | | | (80,283,719 | ) | | | 906,035,236 | |
| | | | | | | | | | | | | | | | |
Total increase (decrease) in net assets | | | 236,074,881 | | | | 346,980,420 | | | | 127,501,774 | | | | 872,484,671 | |
| | | | | | | | | | | | | | | | |
NET ASSETS at End of Period | | $ | 856,227,866 | | | $ | 620,152,985 | | | $ | 2,968,990,606 | | | $ | 2,841,488,832 | |
| | | | | | | | | | | | | | | | |
Undistributed (distributions in excess of) net investment income (loss) | | $ | 17,367 | | | $ | (110,262 | ) | | $ | 1,429,514 | | | $ | 2,079,223 | |
| | | | | | | | | | | | | | | | |
| (a) | Fairpointe Mid Cap Fund had a redemption-in-kind on January 13, 2012, which resulted in a redemption out of the Fund of $38,722,763. The redemption was comprised of securities and cash in the amounts of $38,179,960 and $542,803, respectively. |
| (b) | Veredus Small Cap Growth Fund had a redemption-in-kind on December 2, 2011, which resulted in a redemption out of the Fund of $13,436,583. The redemption was comprised of securities and cash in the amount of $13,225,479 and $211,104, respectively. |
|
See accompanying Notes to Financial Statements. |
| 68 |
| |
| | | | | | | | | | | | | | | | | | | | | | |
Montag & Caldwell
Mid Cap Growth Fund | | | Cardinal Mid Cap
Value Fund | | | Veredus Small Cap
Growth Fund | |
Six Months Ended
April 30, 2012
(unaudited) | | | Year Ended
October 31,
2011 | | | Six Months Ended
April 30, 2012
(unaudited) | | | Year Ended
October 31,
2011 | | | Six Months Ended
April 30, 2012
(unaudited) | | | Year Ended
October 31,
2011 | |
| $ | 4,507,024 | | | $ | 3,399,072 | | | $ | 1,640,534 | | | $ | 1,408,743 | | | $ | 43,191,062 | | | $ | 49,784,390 | |
| | | | | | | | | | | | | | | | | | | | | | |
| | | | | | | | | | | | | | | | | | | | | | |
| | (16,768 | ) | | | (30,444 | ) | | | 6,125 | | | | 6,900 | | | | (155,011 | ) | | | (476,381 | ) |
| | 214,979 | | | | 299,123 | | | | 4,728 | | | | 91,525 | | | | 1,903,184 | | | | 6,542,782 | |
| | | | | |
| | 369,066 | | | | 240,447 | | | | 149,186 | | | | 15,411 | | | | (326,612 | ) | | | (2,611,145 | ) |
| | | | | | | | | | | | | | | | | | | | | | |
| | | | | |
| | 567,277 | | | | 509,126 | | | | 160,039 | | | | 113,836 | | | | 1,421,561 | | | | 3,455,256 | |
| | | | | | | | | | | | | | | | | | | | | | |
| | | | | | | | | | | | | | | | | | | | | | |
| | | | | | | | | | | | | | | | | | | | | | |
| | — | | | | — | | | | (6,507 | ) | | | (6,680 | ) | | | — | | | | — | |
| | — | | | | — | | | | — | | | | — | | | | — | | | | — | |
| | | | | | | | | | | | | | | | | | | | | | |
| | — | | | | — | | | | — | | | | — | | | | — | | | | — | |
| | — | | | | — | | | | — | | | | — | | | | — | | | | — | |
| | | | | | | | | | | | | | | | | | | | | | |
| | — | | | | — | | | | (6,507 | ) | | | (6,680 | ) | | | — | | | | — | |
| | | | | | | | | | | | | | | | | | | | | | |
| | | | | | | | | | | | | | | | | | | | | | |
| | | | | | | | | | | | | | | | | | | | | | |
| | 1,891,701 | | | | 738,840 | | | | 131,384 | | | | 141,784 | | | | 591,254 | | | | 3,538,598 | |
| | — | | | | — | | | | — | | | | — | | | | 132,806 | | | | 327,191 | |
| | | | | | | | | | | | | | | | | | | | | | |
| | — | | | | — | | | | 2,881 | | | | 2,608 | | | | — | | | | — | |
| | — | | | | — | | | | — | | | | — | | | | — | | | | — | |
| | | | | | | | | | | | | | | | | | | | | | |
| | (240,835 | ) | | | (140,014 | ) | | | (24,241 | ) | | | (19,757 | ) | | | (3,850,557 | ) | | | (13,481,571 | ) |
| | — | | | | — | | | | — | | | | — | | | | (14,361,231 | )(b) | | | (432,802 | ) |
| | | | | | | | | | | | | | | | | | | | | | |
| | | | | |
| | 1,650,866 | | | | 598,826 | | | | 110,024 | | | | 124,635 | | | | (17,487,728 | ) | | | (10,048,584 | ) |
| | | | | | | | | | | | | | | | | | | | | | |
| | 2,218,143 | | | | 1,107,952 | | | | 263,556 | | | | 231,791 | | | | (16,066,167 | ) | | | (6,593,328 | ) |
| | | | | | | | | | | | | | | | | | | | | | |
| $ | 6,725,167 | | | $ | 4,507,024 | | | $ | 1,904,090 | | | $ | 1,640,534 | | | $ | 27,124,895 | | | $ | 43,191,062 | |
| | | | | | | | | | | | | | | | | | | | | | |
| | | | | |
| $ | (16,768 | ) | | $ | — | | | $ | 1,135 | | | $ | 1,517 | | | $ | (155,011 | ) | | $ | — | |
| | | | | | | | | | | | | | | | | | | | | | |
| | | | |
See accompanying Notes to Financial Statements. | | | | |
| | | 69 | |
| | | | |
| | |
Aston Funds | | |
| | |
| Statements of Changes in Net Assets – continued | | |
| | | | | | | | | | | | |
| | | Small Cap
Growth Fund | | | Silvercrest
Small Cap
Fund | |
| | | Six Months Ended
April 30, 2012
(unaudited) | | | Period Ended
October 31,
2011(a) | | | Period Ended
April 30, 2012(b)
(unaudited) | |
NET ASSETS at Beginning of Period | | $ | 7,961,781 | | | $ | — | | | $ | — | |
| | | | | | | | | | | | |
Increase (decrease) in net assets from operations: | | | | | | | | | | | | |
Net investment income (loss) | | | (46,878 | ) | | | (34,103 | ) | | | 6,947 | |
Net realized gain (loss) on investments | | | 442,297 | | | | (183,520 | ) | | | 227,679 | |
Net change in unrealized appreciation (depreciation) on investments | | | 522,931 | | | | (141,555 | ) | | | 93,555 | |
| | | | | | | | | | | | |
Net increase (decrease) in net assets from operations | | | 918,350 | | | | (359,178 | ) | | | 328,181 | |
| | | | | | | | | | | | |
Distributions to shareholders from: | | | | | | | | | | | | |
Net investment income: | | | | | | | | | | | | |
Class N | | | — | | | | — | | | | — | |
Class I | | | — | | | | — | | | | — | |
Net realized gain on investments: | | | | | | | | | | | | |
Class N | | | — | | | | — | | | | — | |
Class I | | | — | | | | — | | | | — | |
| | | | | | | | | | | | |
Total distributions | | | — | | | | — | | | | — | |
| | | | | | | | | | | | |
Capital share transactions: | | | | | | | | | | | | |
Proceeds from sales of shares: | | | | | | | | | | | | |
Class N | | | 495,911 | | | | 6,238,604 | | | | 517,885 | |
Class I | | | — | | | | 2,963,841 | | | | 5,692,382 | |
Proceeds from reinvestment of distributions: | | | | | | | | | | | | |
Class N | | | — | | | | — | | | | — | |
Class I | | | — | | | | — | | | | — | |
Cost of shares redeemed: | | | | | | | | | | | | |
Class N | | | (567,161 | ) | | | (881,486 | ) | | | — | |
Class I | | | — | | | | — | | | | (2,608,977 | )(c) |
| | | | | | | | | | | | |
Net increase (decrease) from capital share transactions | | | (71,250 | ) | | | 8,320,959 | | | | 3,601,290 | |
| | | | | | | | | | | | |
Total increase (decrease) in net assets | | | 847,100 | | | | 7,961,781 | | | | 3,929,471 | |
| | | | | | | | | | | | |
NET ASSETS at End of Period | | $ | 8,808,881 | | | $ | 7,961,781 | | | $ | 3,929,471 | |
| | | | | | | | | | | | |
Undistributed (distributions in excess of) net investment income (loss) | | $ | (52,451 | ) | | $ | (5,573 | ) | | $ | 6,947 | |
| | | | | | | | | | | | |
| (a) | Small Cap Growth Fund began issuing shares on November 2, 2010. |
| (b) | Silvercrest Small Cap Fund began issuing shares on December 23, 2011. |
| (c) | Silvercrest Small Cap Fund had a redemption-in-kind on April 26, 2012, which resulted in a redemption out of the Fund of $2,608,977. The redemption was comprised of securities and cash in the amount of $2,579,146 and $29,831, respectively. |
|
See accompanying Notes to Financial Statements. |
| 70 |
| |
| | | | | | | | | | | | | | | | | | | | | | |
TAMRO
Small Cap Fund | | | River Road
Select Value Fund | | | River Road
Small Cap Value Fund | |
Six Months Ended
April 30, 2012
(unaudited) | | | Year Ended
October 31,
2011 | | | Six Months Ended
April 30, 2012
(unaudited) | | | Year Ended
October 31,
2011 | | | Six Months Ended
April 30, 2012
(unaudited) | | | Period Ended
October 31,
2011(a) | |
| $ | 1,001,284,211 | | | $ | 885,435,944 | | | $ | 143,687,434 | | | $ | 215,753,587 | | | $ | 337,488,064 | | | $ | 468,670,448 | |
| | | | | | | | | | | | | | | | | | | | | | |
| | | | | | | | | | | | | | | | | | | | | | |
| | (2,637,283 | ) | | | (5,328,724 | ) | | | 383,269 | | | | 42,145 | | | | 938,888 | | | | 83,034 | |
| | 36,006,399 | | | | 99,904,044 | | | | 6,632,303 | | | | 29,375,751 | | | | 12,488,633 | | | | 44,847,576 | |
| | 71,979,736 | | | | (22,100,977 | ) | | | 6,411,264 | | | | (13,992,847 | ) | | | 15,150,147 | | | | (11,965,485 | ) |
| | | | | | | | | | | | | | | | | | | | | | |
| | 105,348,852 | | | | 72,474,343 | | | | 13,426,836 | | | | 15,425,049 | | | | 28,577,668 | | | | 32,965,125 | |
| | | | | | | | | | | | | | | | | | | | | | |
| | | | | | | | | | | | | | | | | | | | | | |
| | | | | | | | | | | | | | | | | | | | | | |
| | — | | | | — | | | | — | | | | (176,001 | ) | | | — | | | | (643,153 | ) |
| | — | | | | — | | | | — | | | | (958,025 | ) | | | — | | | | (1,405,337 | ) |
| | | | | | | | | | | | | | | | | | | | | | |
| | (37,105,939 | ) | | | (7,598,056 | ) | | | (2,638,084 | ) | | | (475,433 | ) | | | — | | | | — | |
| | (60,086,992 | ) | | | (12,204,102 | ) | | | (26,691,130 | ) | | | (1,484,315 | ) | | | — | | | | — | |
| | | | | | | | | | | | | | | | | | | | | | |
| | (97,192,931 | ) | | | (19,802,158 | ) | | | (29,329,214 | ) | | | (3,093,774 | ) | | | — | | | | (2,048,490 | ) |
| | | | | | | | | | | | | | | | | | | | | | |
| | | | | | | | | | | | | | | | | | | | | | |
| | | | | | | | | | | | | | | | | | | | | | |
| | 58,992,376 | | | | 134,405,206 | | | | 1,001,842 | | | | 9,181,896 | | | | 5,554,947 | | | | 38,752,450 | |
| | 80,244,868 | | | | 203,159,987 | | | | 23,881,063 | | | | 40,104,315 | | | | 18,911,741 | | | | 51,580,650 | |
| | | | | | | | | | | | | | | | | | | | | | |
| | 36,431,124 | | | | 7,455,712 | | | | 2,564,966 | | | | 633,791 | | | | — | | | | 639,592 | |
| | 41,999,122 | | | | 8,709,830 | | | | 23,172,373 | | | | 2,107,208 | | | | — | | | | 1,383,335 | |
| | | | | | | | | | | | | | | | | | | | | | |
| | (81,119,949 | ) | | | (121,337,026 | ) | | | (7,857,721 | ) | | | (53,148,045 | ) | | | (54,295,024 | ) | | | (178,262,562 | ) |
| | (73,947,267 | ) | | | (169,217,627 | ) | | | (21,967,375 | ) | | | (83,276,593 | ) | | | (37,655,272 | ) | | | (76,192,484 | ) |
| | | | | | | | | | | | | | | | | | | | | | |
| | 62,600,274 | | | | 63,176,082 | | | | 20,795,148 | | | | (84,397,428 | ) | | | (67,483,608 | ) | | | (162,099,019 | ) |
| | | | | | | | | | | | | | | | | | | | | | |
| | 70,756,195 | | | | 115,848,267 | | | | 4,892,770 | | | | (72,066,153 | ) | | | (38,905,940 | ) | | | (131,182,384 | ) |
| | | | | | | | | | | | | | | | | | | | | | |
| $ | 1,072,040,406 | | | $ | 1,001,284,211 | | | $ | 148,580,204 | | | $ | 143,687,434 | | | $ | 298,582,124 | | | $ | 337,488,064 | |
| | | | | | | | | | | | | | | | | | | | | | |
| $ | (2,637,283 | ) | | $ | — | | | $ | 383,269 | | | $ | — | | | $ | 938,888 | | | $ | — | |
| | | | | | | | | | | | | | | | | | | | | | |
| | | | |
See accompanying Notes to Financial Statements. | | | | |
| | | 71 | |
| | | | |
| | |
Aston Funds | | |
| | |
| Statements of Changes in Net Assets – continued | | |
| | | | | | | | | | | | | | | | |
| | | River Road Independent
Value Fund | | | DoubleLine Core Plus
Fixed Income Fund | |
| | | |
| | | Six Months Ended
April 30, 2012
(unaudited) | | | Period Ended
October 31,
2011(a) | | | Six Months Ended
April 30, 2012
(unaudited) | | | Period Ended
October 31,
2011(b) | |
NET ASSETS at Beginning of Period | | $ | 391,700,125 | | | $ | — | | | $ | 27,143,189 | | | $ | — | |
| | | | | | | | | | | | | | | | |
Increase (decrease) in net assets from operations: | | | | | | | | | | | | | | | | |
Net investment income (loss) | | | (1,333,607 | ) | | | (1,085,446 | ) | | | 1,085,529 | | | | 186,165 | |
Net realized gain (loss) on investments and capital gain distributions | | | 21,620,532 | | | | 5,386,949 | | | | 237,718 | | | | 43,586 | |
Net change in unrealized appreciation (depreciation) on investments | | | (7,151,566 | ) | | | (574,323 | ) | | | 1,257,079 | | | | 254,825 | |
| | | | | | | | | | | | | | | | |
Net increase (decrease) in net assets from operations | | | 13,135,359 | | | | 3,727,180 | | | | 2,580,326 | | | | 484,576 | |
| | | | | | | | | | | | | | | | |
Distributions to shareholders from: | | | | | | | | | | | | | | | | |
Net investment income: | | | | | | | | | | | | | | | | |
Class N | | | — | | | | — | | | | (466,028 | ) | | | (148,691 | ) |
Class I | | | — | | | | — | | | | (553,666 | ) | | | (42,117 | ) |
Net realized gain on investments: | | | | | | | | | | | | | | | | |
Class N | | | (3,623,431 | ) | | | — | | | | (34,851 | ) | | | — | |
Class I | | | (2,074,734 | ) | | | — | | | | (24,248 | ) | | | — | |
| | | | | | | | | | | | | | | | |
Total distributions | | | (5,698,165 | ) | | | — | | | | (1,078,793 | ) | | | (190,808 | ) |
| | | | | | | | | | | | | | | | |
Capital share transactions: | | | | | | | | | | | | | | | | |
Proceeds from sales of shares: | | | | | | | | | | | | | | | | |
Class N | | | 134,456,823 | | | | 369,370,471 | | | | 18,637,423 | | | | 23,893,578 | |
Class I | | | 171,503,461 | | | | 87,929,924 | | | | 48,842,087 | | | | 5,325,160 | |
Proceeds from reinvestment of distributions: | | | | | | | | | | | | | | | | |
Class N | | | 3,615,800 | | | | — | | | | 498,859 | | | | 142,202 | |
Class I | | | 2,024,439 | | | | — | | | | 560,783 | | | | 42,117 | |
Cost of shares redeemed: | | | | | | | | | | | | | | | | |
Class N | | | (94,897,202 | ) | | | (65,670,819 | ) | | | (17,366,703 | ) | | | (1,531,005 | ) |
Class I | | | (10,918,191 | ) | | | (3,656,631 | ) | | | (2,541,745 | ) | | | (1,022,631 | ) |
| | | | | | | | | | | | | | | | |
Net increase (decrease) from capital share transactions | | | 205,785,130 | | | | 387,972,945 | | | | 48,630,704 | | | | 26,849,421 | |
| | | | | | | | | | | | | | | | |
Total increase (decrease) in net assets | | | 213,222,324 | | | | 391,700,125 | | | | 50,132,237 | | | | 27,143,189 | |
| | | | | | | | | | | | | | | | |
NET ASSETS at End of Period | | $ | 604,922,449 | | | $ | 391,700,125 | | | $ | 77,275,426 | | | $ | 27,143,189 | |
| | | | | | | | | | | | | | | | |
Undistributed (distributions in excess of) net investment income (loss) | | $ | (1,371,145 | ) | | $ | (37,538 | ) | | $ | 56,332 | | | $ | (9,503 | ) |
| | | | | | | | | | | | | | | | |
| (a) | River Road Independent Value Fund began issuing shares on December 30, 2010. |
| (b) | DoubleLine Core Plus Fixed Income Fund began issuing shares on July 15, 2011. |
|
See accompanying Notes to Financial Statements. |
| 72 |
| |
| | | | | | | | | | | | | | | | | | | | | | |
TCH Fixed
Income Fund | | | Lake Partners
LASSO Alternatives Fund | | | Dynamic
Allocation Fund | |
| | |
Six Months Ended
April 30, 2012
(unaudited) | | | Year Ended
October 31,
2011 | | | Six Months Ended
April 30, 2012
(unaudited) | | | Year Ended
October 31,
2011 | | | Six Months Ended
April 30, 2012
(unaudited) | | | Year Ended
October 31,
2011 | |
| $ | 72,769,324 | | | $ | 61,154,711 | | | $ | 207,625,322 | | | $ | 28,019,637 | | | $ | 49,240,524 | | | $ | 54,234,248 | |
| | | | | | | | | | | | | | | | | | | | | | |
| | | | | | | | | | | | | | | | | | | | | | |
| | 1,507,492 | | | | 2,777,397 | | | | 886,038 | | | | 141,372 | | | | 122,192 | | | | (167,249 | ) |
| | | | | |
| | 376,538 | | | | 350,010 | | | | 3,110,687 | | | | (4,044,043 | ) | | | (1,059,467 | ) | | | 5,957,161 | |
| | | | | |
| | 806,643 | | | | 153,269 | | | | 6,884,020 | | | | (2,659,656 | ) | | | (133,956 | ) | | | (2,211,531 | ) |
| | | | | | | | | | | | | | | | | | | | | | |
| | | | | |
| | 2,690,673 | | | | 3,280,676 | | | | 10,880,745 | | | | (6,562,327 | ) | | | (1,071,231 | ) | | | 3,578,381 | |
| | | | | | | | | | | | | | | | | | | | | | |
| | | | | | | | | | | | | | | | | | | | | | |
| | | | | | | | | | | | | | | | | | | | | | |
| | (1,407,245 | ) | | | (2,179,922 | ) | | | (255,933 | ) | | | (60,987 | ) | | | (84,100 | ) | | | (145,930 | ) |
| | (240,559 | ) | | | (630,662 | ) | | | (3,425,003 | ) | | | (200,883 | ) | | | (10,446 | ) | | | (916 | ) |
| | | | | | | | | | | | | | | | | | | | | | |
| | — | | | | — | | | | — | | | | (51,647 | ) | | | (4,208,287 | ) | | | (1,740,103 | ) |
| | — | | | | — | | | | — | | | | (141,825 | ) | | | (428,748 | ) | | | (5,816 | ) |
| | | | | | | | | | | | | | | | | | | | | | |
| | (1,647,804 | ) | | | (2,810,584 | ) | | | (3,680,936 | ) | | | (455,342 | ) | | | (4,731,581 | ) | | | (1,892,765 | ) |
| | | | | | | | | | | | | | | | | | | | | | |
| | | | | | | | | | | | | | | | | | | | | | |
| | | | | | | | | | | | | | | | | | | | | | |
| | 5,365,560 | | | | 26,608,188 | | | | 8,139,249 | | | | 13,063,407 | | | | 5,343,309 | | | | 19,238,553 | |
| | 1,540,050 | | | | 3,668,580 | | | | 65,950,999 | | | | 200,746,741 | | | | 699,939 | | | | 6,991,108 | |
| | | | | | | | | | | | | | | | | | | | | | |
| | 1,350,292 | | | | 2,084,931 | | | | 254,527 | | | | 112,282 | | | | 4,285,707 | | | | 1,882,196 | |
| | 185,009 | | | | 473,715 | | | | 1,747,717 | | | | 314,308 | | | | 439,194 | | | | 6,732 | |
| | | | | | | | | | | | | | | | | | | | | | |
| | (6,209,562 | ) | | | (12,995,724 | ) | | | (2,629,857 | ) | | | (3,488,899 | ) | | | (16,953,215 | ) | | | (32,146,225 | ) |
| | (2,216,104 | ) | | | (8,695,169 | ) | | | (28,201,371 | ) | | | (24,124,485 | ) | | | (249,918 | ) | | | (2,651,704 | ) |
| | | | | | | | | | | | | | | | | | | | | | |
| | | | | |
| | 15,245 | | | | 11,144,521 | | | | 45,261,264 | | | | 186,623,354 | | | | (6,434,984 | ) | | | (6,679,340 | ) |
| | | | | | | | | | | | | | | | | | | | | | |
| | 1,058,114 | | | | 11,614,613 | | | | 52,461,073 | | | | 179,605,685 | | | | (12,237,796 | ) | | | (4,993,724 | ) |
| | | | | | | | | | | | | | | | | | | | | | |
| $ | 73,827,438 | | | $ | 72,769,324 | | | $ | 260,086,395 | | | $ | 207,625,322 | | | $ | 37,002,728 | | | $ | 49,240,524 | |
| | | | | | | | | | | | | | | | | | | | | | |
| | | | | |
| $ | 136,564 | | | $ | 276,876 | | | $ | (2,727,034 | ) | | $ | 67,864 | | | $ | 27,646 | | | $ | — | |
| | | | | | | | | | | | | | | | | | | | | | |
| | | | |
See accompanying Notes to Financial Statements. | | | | |
| | | 73 | |
| | | | |
| | |
Aston Funds | | |
| | |
| Statements of Changes in Net Assets – continued | | |
| | | | | | | | | | | | | | | | |
| | | M.D. Sass Enhanced
Equity Fund | | | River Road
Long-Short Fund | |
| | | |
| | | Six Months Ended
April 30, 2012
(unaudited) | | | Year Ended
October 31,
2011 | | | Six Months Ended
April 30, 2012
(unaudited) | | | Period Ended
October 31,
2011(a) | |
NET ASSETS at Beginning of Period | | $ | 113,205,174 | | | $ | 92,563,052 | | | $ | 4,593,930 | | | $ | — | |
| | | | | | | | | | | | | | | | |
Increase (decrease) in net assets from operations: | | | | | | | | | | | | | | | | |
Net investment income (loss) | | | 1,145,809 | | | | 1,731,594 | | | | (58,816 | ) | | | (30,424 | ) |
Net realized gain (loss) on investments, purchased options, written options and securities sold short and foreign currency transactions | | | 2,232,436 | | | | 11,844,073 | | | | 254,214 | | | | (150,888 | ) |
Net change in unrealized appreciation (depreciation) on investments, purchased options, written options, securities sold short and translation of assets and liabilities denominated in foreign currency | | | 2,211,479 | | | | (5,531,012 | ) | | | 42,586 | | | | 116,075 | |
| | | | | | | | | | | | | | | | |
Net increase (decrease) in net assets from operations | | | 5,589,724 | | | | 8,044,655 | | | | 237,984 | | | | (65,237 | ) |
| | | | | | | | | | | | | | | | |
Distributions to shareholders from: | | | | | | | | | | | | | | | | |
Net investment income: | | | | | | | | | | | | | | | | |
Class N | | | (483,042 | ) | | | (652,123 | ) | | | — | | | | — | |
Class I | | | (689,020 | ) | | | (1,009,975 | ) | | | — | | | | — | |
Net realized gain on investments: | | | | | | | | | | | | | | | | |
Class N | | | (5,377,824 | ) | | | (1,928,441 | ) | | | — | | | | — | |
Class I | | | (6,563,185 | ) | | | (2,282,232 | ) | | | — | | | | — | |
| | | | | | | | | | | | | | | | |
Total distributions | | | (13,113,071 | ) | | | (5,872,771 | ) | | | — | | | | — | |
| | | | | | | | | | | | | | | | |
Capital share transactions: | | | | | | | | | | | | | | | | |
Proceeds from sales of shares: | | | | | | | | | | | | | | | | |
Class N | | | 29,228,769 | | | | 26,609,227 | | | | 1,035,157 | | | | 4,660,217 | |
Class I | | | 33,147,701 | | | | 25,630,704 | | | | — | | | | — | |
Proceeds from reinvestment of distributions: | | | | | | | | | | | | | | | | |
Class N | | | 5,793,693 | | | | 2,544,539 | | | | — | | | | — | |
Class I | | | 5,299,417 | | | | 2,663,560 | | | | — | | | | — | |
Cost of shares redeemed: | | | | | | | | | | | | | | | | |
Class N | | | (10,416,882 | ) | | | (28,044,291 | ) | | | (315,703 | ) | | | (1,050 | ) |
Class I | | | (19,821,033 | ) | | | (10,933,501 | ) | | | — | | | | — | |
| | | | | | | | | | | | | | | | |
Net increase (decrease) from capital share transactions | | | 43,231,665 | | | | 18,470,238 | | | | 719,454 | | | | 4,659,167 | |
| | | | | | | | | | | | | | | | |
Total increase (decrease) in net assets | | | 35,708,318 | | | | 20,642,122 | | | | 957,438 | | | | 4,593,930 | |
| | | | | | | | | | | | | | | | |
NET ASSETS at End of Period | | $ | 148,913,492 | | | $ | 113,205,174 | | | $ | 5,551,368 | | | $ | 4,593,930 | |
| | | | | | | | | | | | | | | | |
Undistributed (distributions in excess of) net investment income (loss) | | $ | 54,267 | | | $ | 80,520 | | | $ | (67,026 | ) | | $ | (8,210 | ) |
| | | | | | | | | | | | | | | | |
| (a) | River Road Long-Short Fund began issuing shares on May 3, 2011. |
| (b) | Harrison Street Real Estate Fund had a redemption-in-kind on December 2, 2011, which resulted in a redemption out of the Fund of $31,399,368. The redemption was comprised of securities and cash in the amounts of $30,913,574 and $485,794, respectively. |
|
See accompanying Notes to Financial Statements. |
| 74 |
| |
| | | | | | | | | | | | | | | | | | | | | | |
Neptune
International Fund | | | Barings
International Fund | | | Harrison Street
Real Estate Fund | |
| | |
Six Months Ended
April 30, 2012
(unaudited) | | | Year Ended
October 31,
2011 | | | Six Months Ended
April 30, 2012
(unaudited) | | | Year Ended
October 31,
2011 | | | Six Months Ended
April 30, 2012
(unaudited) | | | Year Ended
October 31,
2011 | |
| $ | 1,742,113 | | | $ | 1,874,755 | | | $ | 52,782,652 | | | $ | 48,168,829 | | | $ | 39,212,065 | | | $ | 35,582,298 | |
| | | | | | | | | | | | | | | | | | | | | | |
| | | | | | | | | | | | | | | | | | | | | | |
| | 8,010 | | | | 21,534 | | | | 552,955 | | | | 683,032 | | | | 116,762 | | | | 321,324 | |
| | | | | |
| | (89,501 | ) | | | 104,683 | | | | 484,039 | | | | 3,681,538 | | | | 1,035,563 | | | | 8,172,513 | |
| | | | | |
| | 141,429 | | | | (211,560 | ) | | | 2,158,644 | | | | (6,777,543 | ) | | | (1,511,735 | ) | | | (4,472,206 | ) |
| | | | | | | | | | | | | | | | | | | | | | |
| | | | | |
| | 59,938 | | | | (85,343 | ) | | | 3,195,638 | | | | (2,412,973 | ) | | | (359,410 | ) | | | 4,021,631 | |
| | | | | | | | | | | | | | | | | | | | | | |
| | | | | | | | | | | | | | | | | | | | | | |
| | | | | | | | | | | | | | | | | | | | | | |
| | — | | | | (4,729 | ) | | | (2,517 | ) | | | (3,391 | ) | | | (46,752 | ) | | | (95,034 | ) |
| | (2,340 | ) | | | (16,585 | ) | | | (507,253 | ) | | | (1,016,220 | ) | | | (823 | ) | | | (532,220 | ) |
| | | | | | | | | | | | | | | | | | | | | | |
| | — | | | | — | | | | (9,564 | ) | | | — | | | | — | | | | — | |
| | — | | | | — | | | | (1,371,156 | ) | | | — | | | | — | | | | — | |
| | | | | | | | | | | | | | | | | | | | | | |
| | (2,340 | ) | | | (21,314 | ) | | | (1,890,490 | ) | | | (1,019,611 | ) | | | (47,575 | ) | | | (627,254 | ) |
| | | | | | | | | | | | | | | | | | | | | | |
| | | | | | | | | | | | | | | | | | | | | | |
| | | | | | | | | | | | | | | | | | | | | | |
| | 18,556 | | | | 83,936 | | | | 950 | | | | 299,750 | | | | 2,356,334 | | | | 3,015,671 | |
| | — | | | | — | | | | 13,940,927 | | | | 15,930,055 | | | | 2,284 | | | | 37,683 | |
| | | | | | | | | | | | | | | | | | | | | | |
| | — | | | | 4,729 | | | | 12,081 | | | | 3,391 | | | | 44,264 | | | | 93,419 | |
| | 2,340 | | | | 12,301 | | | | 1,167,330 | | | | 816,360 | | | | 539 | | | | 532,220 | |
| | | | | | | | | | | | | | | | | | | | | | |
| | (33,775 | ) | | | (126,951 | ) | | | (275 | ) | | | (68,520 | ) | | | (963,237 | ) | | | (3,431,764 | ) |
| | (1,689 | ) | | | — | | | | (5,029,189 | ) | | | (8,934,629 | ) | | | (31,416,610 | )(b) | | | (11,839 | ) |
| | | | | | | | | | | | | | | | | | | | | | |
| | | | | |
| | (14,568 | ) | | | (25,985 | ) | | | 10,091,824 | | | | 8,046,407 | | | | (29,976,426 | ) | | | 235,390 | |
| | | | | | | | | | | | | | | | | | | | | | |
| | 43,030 | | | | (132,642 | ) | | | 11,396,972 | | | | 4,613,823 | | | | (30,383,411 | ) | | | 3,629,767 | |
| | | | | | | | | | | | | | | | | | | | | | |
| $ | 1,785,143 | | | $ | 1,742,113 | | | $ | 64,179,624 | | | $ | 52,782,652 | | | $ | 8,828,654 | | | $ | 39,212,065 | |
| | | | | | | | | | | | | | | | | | | | | | |
| | | | | |
| $ | 7,994 | | | $ | 2,324 | | | $ | 531,448 | | | $ | 488,263 | | | $ | 218,620 | | | $ | 149,433 | |
| | | | | | | | | | | | | | | | | | | | | | |
| | | | |
See accompanying Notes to Financial Statements. | | | | |
| | | 75 | |
| | | | |
| | |
Aston Funds | | |
| | |
| Statements of Changes in Net Assets – continued | | |
| | | | | | | | |
| | | Montag & Caldwell
Balanced Fund | |
| | | Six Months Ended
April 30, 2012
(unaudited) | | | Year Ended
October 31,
2011 | |
NET ASSETS at Beginning of Period | | $ | 24,729,716 | | | $ | 30,555,528 | |
| | | | | | | | |
Increase in net assets from operations: | | | | | | | | |
Net investment income | | | 105,034 | | | | 216,304 | |
Net realized gain on investments and foreign currency transactions | | | 637,008 | | | | 2,651,240 | |
Net change in unrealized appreciation (depreciation) on investments and translation of assets and liabilities denominated in foreign currency | | | 1,074,836 | | | | (947,217 | ) |
| | | | | | | | |
Net increase in net assets from operations | | | 1,816,878 | | | | 1,920,327 | |
| | | | | | | | |
Distributions to shareholders from: | | | | | | | | |
Net investment income: | | | | | | | | |
Class N | | | (139,226 | ) | | | (266,744 | ) |
Class I | | | (9,882 | ) | | | (45,549 | ) |
| | | | | | | | |
Total distributions | | | (149,108 | ) | | | (312,293 | ) |
| | | | | | | | |
Capital share transactions: | | | | | | | | |
Proceeds from sales of shares: | | | | | | | | |
Class N | | | 8,745,013 | | | | 1,639,927 | |
Class I | | | 30,307 | | | | 4,647,220 | |
Proceeds from reinvestment of distributions: | | | | | | | | |
Class N | | | 135,468 | | | | 258,918 | |
Class I | | | 2,964 | | | | 33,009 | |
Cost of shares redeemed: | | | | | | | | |
Class N | | | (3,513,717 | ) | | | (9,141,134 | ) |
Class I | | | (35,956 | ) | | | (4,871,786 | ) |
| | | | | | | | |
Net increase (decrease) from capital share transactions | | | 5,364,079 | | | | (7,433,846 | ) |
| | | | | | | | |
Total increase (decrease) in net assets | | | 7,031,849 | | | | (5,825,812 | ) |
| | | | | | | | |
NET ASSETS at End of Period | | $ | 31,761,565 | | | $ | 24,729,716 | |
| | | | | | | | |
Distributions in excess of net investment income | | $ | (234,586 | ) | | $ | (190,512 | ) |
| | | | | | | | |
|
See accompanying Notes to Financial Statements. |
| 76 |
| |
| | | | |
Aston Funds | | | | |
ASTON/Montag & Caldwell Growth Fund – Class N | | | April 30, 2012 | |
| Financial Highlights | | | | |
| | | | | | | | | | | | | | | | | | | | | | | | |
| | | Six Months
Ended
04/30/12
(unaudited) | | | Year
Ended
10/31/11 | | | Year
Ended
10/31/10 | | | Year
Ended
10/31/09 | | | Year
Ended
10/31/08 | | | Year
Ended
10/31/07 | |
Net Asset Value, Beginning of Period | | $ | 24.72 | | | $ | 22.92 | | | $ | 20.87 | | | $ | 18.84 | | | $ | 31.51 | | | $ | 25.15 | |
| | | | | | | | | | | | | | | | | | | | | | | | |
Income from Investment Operations: | | | | | | | | | | | | | | | | | | | | | | | | |
Net investment income (a) | | | 0.07 | | | | 0.14 | | | | 0.12 | | | | 0.08 | | | | 0.07 | | | | 0.06 | |
Net realized and unrealized gain (loss) on investments | | | 2.51 | | | | 1.83 | | | | 2.01 | (b) | | | 2.61 | | | | (8.66 | ) | | | 6.54 | |
| | | | | | | | | | | | | | | | | | | | | | | | |
Total from investment operations | | | 2.58 | | | | 1.97 | | | | 2.13 | | | | 2.69 | | | | (8.59 | ) | | | 6.60 | |
| | | | | | | | | | | | | | | | | | | | | | | | |
Less Distributions: | | | | | | | | | | | | | | | | | | | | | | | | |
Distributions from and in excess of net investment income | | | (0.13 | ) | | | (0.13 | ) | | | (0.08 | ) | | | (0.06 | ) | | | (0.05 | ) | | | (0.06 | ) |
Distributions from net realized gain on investments | | | (1.88 | ) | | | (0.04 | ) | | | — | | | | (0.60 | ) | | | (4.03 | ) | | | (0.18 | ) |
| | | | | | | | | | | | | | | | | | | | | | | | �� |
Total distributions | | | (2.01 | ) | | | (0.17 | ) | | | (0.08 | ) | | | (0.66 | ) | | | (4.08 | ) | | | (0.24 | ) |
| | | | | | | | | | | | | | | | | | | | | | | | |
Net increase (decrease) in net asset value | | | 0.57 | | | | 1.80 | | | | 2.05 | | | | 2.03 | | | | (12.67 | ) | | | 6.36 | |
| | | | | | | | | | | | | | | | | | | | | | | | |
Net Asset Value, End of Period | | $ | 25.29 | | | $ | 24.72 | | | $ | 22.92 | | | $ | 20.87 | | | $ | 18.84 | | | $ | 31.51 | |
| | | | | | | | | | | | | | | | | | | | | | | | |
Total Return (c) | | | 11.27 | %(d) | | | 8.56 | % | | | 10.20 | % | | | 15.08 | % | | | (31.13 | )% | | | 26.41 | % |
| | | | | | |
Ratios/Supplemental Data: | | | | | | | | | | | | | | | | | | | | | | | | |
Net Assets, End of Period (in 000’s) | | $ | 1,801,757 | | | $ | 1,683,183 | | | $ | 1,506,075 | | | $ | 1,277,346 | | | $ | 602,905 | | | $ | 759,567 | |
Ratios of expenses to average net assets: | | | | | | | | | | | | | | | | | | | | | | | | |
Before reimbursement and/or waiver of expenses by Adviser | | | 1.06 | %(e) | | | 1.06 | % | | | 1.08 | %(f) | | | 1.11 | % | | | 1.08 | %(f) | | | 1.07 | %(f) |
After reimbursement and/or waiver of expenses by Adviser | | | 1.06 | %(e) | | | 1.06 | % | | | 1.08 | %(f) | | | 1.11 | % | | | 1.08 | %(f) | | | 1.07 | %(f) |
Ratios of net investment income to average net assets: | | | | | | | | | | | | | | | | | | | | | | | | |
Before reimbursement and/or waiver of expenses by Adviser | | | 0.62 | %(e) | | | 0.59 | % | | | 0.56 | % | | | 0.41 | % | | | 0.26 | % | | | 0.23 | % |
After reimbursement and/or waiver of expenses by Adviser | | | 0.62 | %(e) | | | 0.59 | % | | | 0.56 | % | | | 0.41 | % | | | 0.26 | % | | | 0.23 | % |
Portfolio Turnover | | | 22.10 | %(d) | | | 63.48 | % | | | 57.39 | %(g) | | | 35.09 | %(h) | | | 52.32 | % | | | 69.02 | % |
| (a) | The selected per share data was calculated using the weighted average shares outstanding method for the period. |
| (b) | Includes payments by affiliates of less than $0.005 per share. |
| (c) | The total return is calculated using the Net Asset Values used for trading at the close of business at period end. |
| (f) | Ratios of expenses to average net assets include interest expenses of less than 0.005% for the years ended October 31, 2010, October 31, 2008 and October 31, 2007. The interest expenses are from utilizing the line of credit as discussed in Note H to Financial Statements. |
| (g) | Portfolio turnover rate excludes securities received from a reorganization. |
| (h) | Portfolio turnover rate excludes securities received from processing a subscription-in-kind. |
| | | | |
See accompanying Notes to Financial Statements. | | | | |
| | | 77 | |
| | | | |
| | | | |
Aston Funds | | | | |
ASTON/Montag & Caldwell Growth Fund – Class I | | | April 30, 2012 | |
| Financial Highlights | | | | |
| | | | | | | | | | | | | | | | | | | | | | | | |
| | | Six Months
Ended
04/30/12
(unaudited) | | | Year
Ended
10/31/11 | | | Year
Ended
10/31/10 | | | Year
Ended
10/31/09 | | | Year
Ended
10/31/08 | | | Year
Ended
10/31/07 | |
Net Asset Value, Beginning of Period | | $ | 24.85 | | | $ | 23.05 | | | $ | 20.97 | | | $ | 18.94 | | | $ | 31.61 | | | $ | 25.24 | |
| | | | | | | | | | | | | | | | | | | | | | | | |
Income from Investment Operations: | | | | | | | | | | | | | | | | | | | | | | | | |
Net investment income (a) | | | 0.11 | | | | 0.21 | | | | 0.18 | | | | 0.12 | | | | 0.13 | | | | 0.14 | |
Net realized and unrealized gain (loss) on investments | | | 2.51 | | | | 1.82 | | | | 2.02 | (b) | | | 2.62 | | | | (8.70 | ) | | | 6.55 | |
| | | | | | | | | | | | | | | | | | | | | | | | |
Total from investment operations | | | 2.62 | | | | 2.03 | | | | 2.20 | | | | 2.74 | | | | (8.57 | ) | | | 6.69 | |
| | | | | | | | | | | | | | | | | | | | | | | | |
Less Distributions: | | | | | | | | | | | | | | | | | | | | | | | | |
Distributions from and in excess of net investment income | | | (0.19 | ) | | | (0.19 | ) | | | (0.12 | ) | | | (0.11 | ) | | | (0.07 | ) | | | (0.14 | ) |
Distributions from net realized gain on investments | | | (1.88 | ) | | | (0.04 | ) | | | — | | | | (0.60 | ) | | | (4.03 | ) | | | (0.18 | ) |
| | | | | | | | | | | | | | | | | | | | | | | | |
Total distributions | | | (2.07 | ) | | | (0.23 | ) | | | (0.12 | ) | | | (0.71 | ) | | | (4.10 | ) | | | (0.32 | ) |
| | | | | | | | | | | | | | | | | | | | | | | | |
Net increase (decrease) in net asset value | | | 0.55 | | | | 1.80 | | | | 2.08 | | | | 2.03 | | | | (12.67 | ) | | | 6.37 | |
| | | | | | | | | | | | | | | | | | | | | | | | |
Net Asset Value, End of Period | | $ | 25.40 | | | $ | 24.85 | | | $ | 23.05 | | | $ | 20.97 | | | $ | 18.94 | | | $ | 31.61 | |
| | | | | | | | | | | | | | | | | | | | | | | | |
Total Return (c) | | | 11.45 | %(d) | | | 8.82 | % | | | 10.49 | % | | | 15.36 | % | | | (30.96 | )% | | | 26.72 | % |
| | | | | | |
Ratios/Supplemental Data: | | | | | | | | | | | | | | | | | | | | | | | | |
Net Assets, End of Period (in 000’s) | | $ | 2,008,214 | | | $ | 1,749,183 | | | $ | 1,528,981 | | | $ | 1,205,637 | | | $ | 754,671 | | | $ | 1,254,382 | |
Ratios of expenses to average net assets: | | | | | | | | | | | | | | | | | | | | | | | | |
Before reimbursement and/or waiver of expenses by Adviser | | | 0.81 | %(e) | | | 0.81 | % | | | 0.83 | %(f) | | | 0.86 | % | | | 0.83 | %(f) | | | 0.79 | %(f) |
After reimbursement and/or waiver of expenses by Adviser | | | 0.81 | %(e) | | | 0.81 | % | | | 0.83 | %(f) | | | 0.86 | % | | | 0.83 | %(f) | | | 0.79 | %(f) |
Ratios of net investment income to average net assets: | | | | | | | | | | | | | | | | | | | | | | | | |
Before reimbursement and/or waiver of expenses by Adviser | | | 0.87 | %(e) | | | 0.84 | % | | | 0.81 | % | | | 0.66 | % | | | 0.51 | % | | | 0.51 | % |
After reimbursement and/or waiver of expenses by Adviser | | | 0.87 | %(e) | | | 0.84 | % | | | 0.81 | % | | | 0.66 | % | | | 0.51 | % | | | 0.51 | % |
Portfolio Turnover | | | 22.10 | %(d) | | | 63.48 | % | | | 57.39 | %(g) | | | 35.09 | %(h) | | | 52.32 | % | | | 69.02 | % |
| (a) | The selected per share data was calculated using the weighted average shares outstanding method for the period. |
| (b) | Includes payments by affiliates of less than $0.005 per share. |
| (c) | The total return is calculated using the Net Asset Values used for trading at the close of business at period end. |
| (f) | Ratios of expenses to average net assets include interest expenses of less than 0.005% for the years ended October 31, 2010, October 31, 2008 and October 31, 2007. The interest expenses are from utilizing the line of credit as discussed in Note H to Financial Statements. |
| (g) | Portfolio turnover rate excludes securities received from a reorganization. |
| (h) | Portfolio turnover rate excludes securities received from processing a subscription-in-kind. |
|
See accompanying Notes to Financial Statements. |
| 78 |
| |
| | | | |
Aston Funds | | | | |
ASTON/Montag & Caldwell Growth Fund – Class R | | | April 30, 2012 | |
| Financial Highlights | | | | |
| | | | | | | | | | | | | | | | | | | | | | | | |
| | | Six Months
Ended
04/30/12
(unaudited) | | | Year
Ended
10/31/11 | | | Year
Ended
10/31/10 | | | Year
Ended
10/31/09 | | | Year
Ended
10/31/08 | | | Year
Ended
10/31/07 | |
Net Asset Value, Beginning of Period | | $ | 24.45 | | | $ | 22.70 | | | $ | 20.73 | | | $ | 18.69 | | | $ | 31.33 | | | $ | 25.04 | |
| | | | | | | | | | | | | | | | | | | | | | | | |
Income from Investment Operations: | | | | | | | | | | | | | | | | | | | | | | | | |
Net investment income (a) | | | 0.05 | | | | 0.08 | | | | 0.07 | | | | 0.03 | | | | — | (b) | | | — | (b) |
Net realized and unrealized gain (loss) on investments | | | 2.48 | | | | 1.80 | | | | 1.98 | (c) | | | 2.61 | | | | (8.58 | ) | | | 6.49 | |
| | | | | | | | | | | | | | | | | | | | | | | | |
Total from investment operations | | | 2.53 | | | | 1.88 | | | | 2.05 | | | | 2.64 | | | | (8.58 | ) | | | 6.49 | |
| | | | | | | | | | | | | | | | | | | | | | | | |
Less Distributions: | | | | | | | | | | | | | | | | | | | | | | | | |
Distributions from and in excess of net investment income | | | (0.07 | ) | | | (0.09 | ) | | | (0.08 | ) | | | — | | | | (0.03 | ) | | | (0.02 | ) |
Distributions from net realized gain on investments | | | (1.88 | ) | | | (0.04 | ) | | | — | | | | (0.60 | ) | | | (4.03 | ) | | | (0.18 | ) |
| | | | | | | | | | | | | | | | | | | | | | | | |
Total distributions | | | (1.95 | ) | | | (0.13 | ) | | | (0.08 | ) | | | (0.60 | ) | | | (4.06 | ) | | | (0.20 | ) |
| | | | | | | | | | | | | | | | | | | | | | | | |
Net increase (decrease) in net asset value | | | 0.58 | | | | 1.75 | | | | 1.97 | | | | 2.04 | | | | (12.64 | ) | | | 6.29 | |
| | | | | | | | | | | | | | | | | | | | | | | | |
Net Asset Value, End of Period | | $ | 25.03 | | | $ | 24.45 | | | $ | 22.70 | | | $ | 20.73 | | | $ | 18.69 | | | $ | 31.33 | |
| | | | | | | | | | | | | | | | | | | | | | | | |
Total Return (d) | | | 11.15 | %(e) | | | 8.29 | % | | | 9.90 | % | | | 14.87 | % | | | (31.28 | )% | | | 26.06 | % |
| | | | | | |
Ratios/Supplemental Data: | | | | | | | | | | | | | | | | | | | | | | | | |
Net Assets, End of Period (in 000’s) | | $ | 9,339 | | | $ | 8,654 | | | $ | 7,292 | | | $ | 3,840 | | | $ | 266 | | | $ | 4,062 | |
Ratios of expenses to average net assets: | | | | | | | | | | | | | | | | | | | | | | | | |
Before reimbursement and/or waiver of expenses by Adviser | | | 1.31 | %(f) | | | 1.31 | % | | | 1.33 | %(g) | | | 1.36 | % | | | 1.33 | %(g) | | | 1.29 | %(g) |
After reimbursement and/or waiver of expenses by Adviser | | | 1.31 | %(f) | | | 1.31 | % | | | 1.33 | %(g) | | | 1.36 | % | | | 1.33 | %(g) | | | 1.29 | %(g) |
Ratios of net investment income to average net assets: | | | | | | | | | | | | | | | | | | | | | | | | |
Before reimbursement and/or waiver of expenses by Adviser | | | 0.37 | %(f) | | | 0.34 | % | | | 0.31 | % | | | 0.16 | % | | | 0.01 | % | | | 0.01 | % |
After reimbursement and/or waiver of expenses by Adviser | | | 0.37 | %(f) | | | 0.34 | % | | | 0.31 | % | | | 0.16 | % | | | 0.01 | % | | | 0.01 | % |
Portfolio Turnover | | | 22.10 | %(e) | | | 63.48 | % | | | 57.39 | %(h) | | | 35.09 | %(i) | | | 52.32 | % | | | 69.02 | % |
| (a) | The selected per share data was calculated using the weighted average shares outstanding method for the period. |
| (b) | Represents less than $0.005 per share. |
| (c) | Includes payments by affiliates of less than $0.005 per share. |
| (d) | The total return is calculated using the Net Asset Values used for trading at the close of business at period end. |
| (g) | Ratios of expenses to average net assets include interest expenses of less than 0.005% for the years ended October 31, 2010, October 31, 2008 and October 31, 2007. The interest expenses are from utilizing the line of credit as discussed in Note H to Financial Statements. |
| (h) | Portfolio turnover rate excludes securities received from a reorganization. |
| (i) | Portfolio turnover rate excludes securities received from processing a subscription-in-kind. |
| | | | |
See accompanying Notes to Financial Statements. | | | | |
| | | 79 | |
| | | | |
| | | | |
Aston Funds | | | | |
ASTON/Veredus Select Growth Fund – Class N | | | April 30, 2012 | |
| Financial Highlights | | | | |
| | | | | | | | | | | | | | | | | | | | | | | | |
| | | Six Months
Ended
04/30/12
(unaudited) | | | Year
Ended
10/31/11 | | | Year
Ended
10/31/10 | | | Year
Ended
10/31/09 | | | Year
Ended
10/31/08 | | | Year
Ended
10/31/07 | |
Net Asset Value, Beginning of Period | | $ | 10.77 | | | $ | 11.35 | | | $ | 9.07 | | | $ | 8.69 | | | $ | 16.77 | | | $ | 13.08 | |
| | | | | | | | | | | | | | | | | | | | | | | | |
Income from Investment Operations: | | | | | | | | | | | | | | | | | | | | | | | | |
Net investment loss | | | 0.02 | (a) | | | (0.02 | )(a) | | | (0.04 | ) | | | (0.01 | ) | | | (0.06 | ) | | | (0.08 | ) |
Net realized and unrealized gain (loss) on investments | | | 0.51 | | | | (0.56 | ) | | | 2.32 | | | | 0.39 | | | | (5.60 | ) | | | 3.77 | |
| | | | | | | | | | | | | | | | | | | | | | | | |
Total from investment operations | | | 0.53 | | | | (0.58 | ) | | | 2.28 | | | | 0.38 | | | | (5.66 | ) | | | 3.69 | |
| | | | | | | | | | | | | | | | | | | | | | | | |
Less Distributions: | | | | | | | | | | | | | | | | | | | | | | | | |
Distributions from and in excess of net investment income | | | — | | | | — | | | | — | (b) | | | — | | | | — | | | | — | |
Distributions from net realized gain on investments | | | — | | | | — | | | | — | | | | — | | | | (2.42 | ) | | | — | |
| | | | | | | | | | | | | | | | | | | | | | | | |
Total distributions | | | — | | | | — | | | | — | | | | — | | | | (2.42 | ) | | | — | |
| | | | | | | | | | | | | | | | | | | | | | | | |
Net increase (decrease) in net asset value | | | 0.53 | | | | (0.58 | ) | | | 2.28 | | | | 0.38 | | | | (8.08 | ) | | | 3.69 | |
| | | | | | | | | | | | | | | | | | | | | | | | |
Net Asset Value, End of Period | | $ | 11.30 | | | $ | 10.77 | | | $ | 11.35 | | | $ | 9.07 | | | $ | 8.69 | | | $ | 16.77 | |
| | | | | | | | | | | | | | | | | | | | | | | | |
Total Return (c) | | | 4.92 | %(d) | | | (5.11 | )% | | | 25.15 | % | | | 4.37 | % | | | (39.09 | )% | | | 28.14 | % |
| | | | | | |
Ratios/Supplemental Data: | | | | | | | | | | | | | | | | | | | | | | | | |
Net Assets, End of Period (in 000’s) | | $ | 12,723 | | | $ | 20,733 | | | $ | 42,567 | | | $ | 39,437 | | | $ | 37,142 | | | $ | 50,783 | |
Ratios of expenses to average net assets: | | | | | | | | | | | | | | | | | | | | | | | | |
Before reimbursement and/or waiver of expenses by Adviser | | | 1.42 | %(e)(f) | | | 1.30 | % | | | 1.33 | % | | | 1.37 | % | | | 1.34 | % | | | 1.52 | % |
After reimbursement and/or waiver of expenses by Adviser | | | 1.30 | %(e)(f) | | | 1.30 | % | | | 1.30 | % | | | 1.30 | % | | | 1.30 | % | | | 1.30 | % |
Ratios of net investment income (loss) to average net assets: | | | | | | | | | | | | | | | | | | | | | | | | |
Before reimbursement and/or waiver of expenses by Adviser | | | 0.32 | %(e) | | | (0.15 | )% | | | (0.38 | )% | | | (0.24 | )% | | | (0.55 | )% | | | (0.81 | )% |
After reimbursement and/or waiver of expenses by Adviser | | | 0.44 | %(e) | | | (0.15 | )% | | | (0.35 | )% | | | (0.17 | )% | | | (0.51 | )% | | | (0.59 | )% |
Portfolio Turnover | | | 95.79 | %(d) | | | 312.62 | % | | | 325.01 | % | | | 331.55 | % | | | 387.57 | % | | | 283.38 | % |
| (a) | The selected per share data was calculated using the weighted average shares outstanding method for the period. |
| (b) | Represents less than $(0.005) per share. |
| (c) | The total return is calculated using the Net Asset Values used for trading at the close of business at period end. |
| (f) | Ratios of expenses to average net assets include interest expense of less than 0.005% for the six months ended April 30, 2012, which is not included in the contractual expense limitation. The interest expense is from utilizing the line of credit as discussed in Note H to Financial Statements. |
|
See accompanying Notes to Financial Statements. |
| 80 |
| |
| | | | |
Aston Funds | | | | |
ASTON/Veredus Select Growth Fund – Class I | | | April 30, 2012 | |
| Financial Highlights | | | | |
| | | | | | | | | | | | | | | | | | | | | | | | |
| | | Six Months
Ended
04/30/12
(unaudited) | | | Year
Ended
10/31/11 | | | Year
Ended
10/31/10 | | | Year
Ended
10/31/09 | | | Year
Ended
10/31/08 | | | Year
Ended
10/31/07 | |
Net Asset Value, Beginning of Period | | $ | 10.92 | | | $ | 11.48 | | | $ | 9.16 | | | $ | 8.74 | | | $ | 16.83 | | | $ | 13.08 | |
| | | | | | | | | | | | | | | | | | | | | | | | |
Income from Investment Operations: | | | | | | | | | | | | | | | | | | | | | | | | |
Net investment income (loss) | | | 0.04 | | | | 0.01 | (a) | | | (0.01 | ) | | | 0.01 | | | | (0.02 | ) | | | (0.02 | ) |
Net realized and unrealized gain (loss) on investments | | | 0.51 | | | | (0.57 | ) | | | 2.34 | | | | 0.41 | | | | (5.65 | ) | | | 3.77 | |
| | | | | | | | | | | | | | | | | | | | | | | | |
Total from investment operations | | | 0.55 | | | | (0.56 | ) | | | 2.33 | | | | 0.42 | | | | (5.67 | ) | | | 3.75 | |
| | | | | | | | | | | | | | | | | | | | | | | | |
Less Distributions: | | | | | | | | | | | | | | | | | | | | | | | | |
Distributions from and in excess of net investment income | | | (0.01 | ) | | | — | | | | (0.01 | ) | | | — | | | | — | | | | — | |
Distributions from net realized gain on investments | | | — | | | | — | | | | — | | | | — | | | | (2.42 | ) | | | — | |
| | | | | | | | | | | | | | | | | | | | | | | | |
Total distributions | | | (0.01 | ) | | | — | | | | (0.01 | ) | | | — | | | | (2.42 | ) | | | — | |
| | | | | | | | | | | | | | | | | | | | | | | | |
Net increase (decrease) in net asset value | | | 0.54 | | | | (0.56 | ) | | | 2.32 | | | | 0.42 | | | | (8.09 | ) | | | 3.75 | |
| | | | | | | | | | | | | | | | | | | | | | | | |
Net Asset Value, End of Period | | $ | 11.46 | | | $ | 10.92 | | | $ | 11.48 | | | $ | 9.16 | | | $ | 8.74 | | | $ | 16.83 | |
| | | | | | | | | | | | | | | | | | | | | | | | |
Total Return (b) | | | 4.93 | %(c) | | | (4.88 | )% | | | 25.39 | % | | | 4.81 | % | | | (38.96 | )% | | | 28.52 | % |
| | | | | | |
Ratios/Supplemental Data: | | | | | | | | | | | | | | | | | | | | | | | | |
Net Assets, End of Period (in 000’s) | | $ | 35,195 | | | $ | 59,544 | | | $ | 61,939 | | | $ | 47,699 | | | $ | 46,040 | | | $ | 3,216 | |
Ratios of expenses to average net assets: | | | | | | | | | | | | | | | | | | | | | | | | |
Before reimbursement and/or waiver of expenses by Adviser | | | 1.17 | %(d)(e) | | | 1.05 | % | | | 1.08 | % | | | 1.12 | % | | | 1.09 | % | | | 1.19 | % |
After reimbursement and/or waiver of expenses by Adviser | | | 1.05 | %(d)(e) | | | 1.05 | % | | | 1.05 | % | | | 1.05 | % | | | 1.05 | % | | | 0.97 | % |
Ratios of net investment income (loss) to average net assets: | | | | | | | | | | | | | | | | | | | | | | | | |
Before reimbursement and/or waiver of expenses by Adviser | | | 0.57 | %(d) | | | 0.10 | % | | | (0.13 | )% | | | 0.01 | % | | | (0.30 | )% | | | (0.48 | )% |
After reimbursement and/or waiver of expenses by Adviser | | | 0.69 | %(d) | | | 0.10 | % | | | (0.10 | )% | | | 0.08 | % | | | (0.26 | )% | | | (0.26 | )% |
Portfolio Turnover | | | 95.79 | %(c) | | | 312.62 | % | | | 325.01 | % | | | 331.55 | % | | | 387.57 | % | | | 283.38 | % |
| (a) | The selected per share data was calculated using the weighted average shares outstanding method for the period. |
| (b) | The total return is calculated using the Net Asset Values used for trading at the close of business at period end. |
| (e) | Ratios of expenses to average net assets include interest expense of less than 0.005% for the six months ended April 30, 2012, which is not included in the contractual expense limitation. The interest expense is from utilizing the line of credit as discussed in Note H to Financial Statements. |
| | | | |
See accompanying Notes to Financial Statements. | | | | |
| | | 81 | |
| | | | |
| | | | |
Aston Funds | | | | |
ASTON/TAMRO Diversified Equity Fund – Class N | | | April 30, 2012 | |
| Financial Highlights | | | | |
| | | | | | | | | | | | | | | | | | | | | | | | |
| | | Six Months
Ended
04/30/12
(unaudited) | | | Year
Ended
10/31/11 | | | Year
Ended
10/31/10 | | | Year
Ended
10/31/09 | | | Year
Ended
10/31/08 | | | Year
Ended
10/31/07 | |
Net Asset Value, Beginning of Period | | $ | 12.34 | | | $ | 11.83 | | | $ | 9.72 | | | $ | 8.34 | | | $ | 14.41 | | | $ | 13.91 | |
| | | | | | | | | | | | | | | | | | | | | | | | |
Income from Investment Operations: | | | | | | | | | | | | | | | | | | | | | | | | |
Net investment income (loss) | | | 0.01 | (a) | | | (0.02 | ) | | | — | (b) | | | — | (b) | | | 0.04 | | | | 0.03 | |
Net realized and unrealized gain (loss) on investments | | | 1.35 | | | | 0.53 | | | | 2.13 | | | | 1.42 | | | | (4.94 | ) | | | 2.13 | |
| | | | | | | | | | | | | | | | | | | | | | | | |
Total from investment operations | | | 1.36 | | | | 0.51 | | | | 2.13 | | | | 1.42 | | | | (4.90 | ) | | | 2.16 | |
| | | | | | | | | | | | | | | | | | | | | | | | |
Less Distributions: | | | | | | | | | | | | | | | | | | | | | | | | |
Distributions from and in excess of net investment income | | | — | | | | — | | | | (0.02 | ) | | | (0.04 | ) | | | (0.01 | ) | | | (0.03 | ) |
Distributions from net realized gain on investments | | | (0.26 | ) | | | — | | | | — | | | | — | | | | (1.16 | ) | | | (1.63 | ) |
| | | | | | | | | | | | | | | | | | | | | | | | |
Total distributions | | | (0.26 | ) | | | — | | | | (0.02 | ) | | | (0.04 | ) | | | (1.17 | ) | | | (1.66 | ) |
| | | | | | | | | | | | | | | | | | | | | | | | |
Net increase (decrease) in net asset value | | | 1.10 | | | | 0.51 | | | | 2.11 | | | | 1.38 | | | | (6.07 | ) | | | 0.50 | |
| | | | | | | | | | | | | | | | | | | | | | | | |
Net Asset Value, End of Period | | $ | 13.44 | | | $ | 12.34 | | | $ | 11.83 | | | $ | 9.72 | | | $ | 8.34 | | | $ | 14.41 | |
| | | | | | | | | | | | | | | | | | | | | | | | |
Total Return (c) | | | 11.28 | %(d) | | | 4.31 | % | | | 21.95 | % | | | 17.13 | % | | | (36.75 | )% | | | 16.98 | % |
| | | | | | |
Ratios/Supplemental Data: | | | | | | | | | | | | | | | | | | | | | | | | |
Net Assets, End of Period (in 000’s) | | $ | 21,760 | | | $ | 24,354 | | | $ | 15,670 | | | $ | 10,486 | | | $ | 8,562 | | | $ | 15,359 | |
Ratios of expenses to average net assets: | | | | | | | | | | | | | | | | | | | | | | | | |
Before reimbursement and/or waiver of expenses by Adviser | | | 1.66 | %(e)(f) | | | 1.62 | %(f) | | | 1.63 | % | | | 1.95 | % | | | 1.88 | % | | | 1.74 | %(f) |
After reimbursement and/or waiver of expenses by Adviser | | | 1.20 | %(e)(f) | | | 1.20 | %(f) | | | 1.20 | % | | | 1.20 | % | | | 1.20 | % | | | 1.20 | %(f) |
Ratios of net investment income (loss) to average net assets: | | | | | | | | | | | | | | | | | | | | | | | | |
Before reimbursement and/or waiver of expenses by Adviser | | | (0.35 | )%(e) | | | (0.63 | )% | | | (0.45 | )% | | | (0.77 | )% | | | (0.37 | )% | | | (0.30 | )% |
After reimbursement and/or waiver of expenses by Adviser | | | 0.11 | %(e) | | | (0.21 | )% | | | (0.02 | )% | | | (0.02 | )% | | | 0.31 | % | | | 0.24 | % |
Portfolio Turnover | | | 24.34 | %(d) | | | 65.96 | % | | | 81.75 | % | | | 85.49 | % | | | 93.82 | % | | | 37.87 | % |
| (a) | The selected per share data was calculated using the weighted average shares outstanding method for the period. |
| (b) | Represents less than $(0.005) per share. |
| (c) | The total return is calculated using the Net Asset Values used for trading at the close of business at period end. |
| (f) | Ratios of expenses to average net assets include interest expenses of less than 0.005% for the six months ended April 30, 2012 and the years ended October 31, 2011 and October 31, 2007, which are not included in the contractual expense limitation. The interest expenses are from utilizing the line of credit as discussed in Note H to Financial Statements. |
|
See accompanying Notes to Financial Statements. |
| 82 |
| |
| | | | |
Aston Funds | | | | |
ASTON/TAMRO Diversified Equity Fund – Class I | | | April 30, 2012 | |
| Financial Highlights | | | | |
| | | | |
| | | Period
Ended
04/30/12
(unaudited)(a) | |
Net Asset Value, Beginning of Period | | $ | 13.27 | |
| | | | |
Income from Investment Operations: | | | | |
Net investment income | | | 0.01 | (b) |
Net realized and unrealized gain on investments | | | 0.16 | |
| | | | |
Total from investment operations | | | 0.17 | |
| | | | |
Less Distributions: | | | | |
Distributions from and in excess of net investment income | | | — | |
| | | | |
Total distributions | | | — | |
| | | | |
Net increase in net asset value | | | 0.17 | |
| | | | |
Net Asset Value, End of Period | | $ | 13.44 | |
| | | | |
Total Return (c) | | | 1.28 | %(d) |
| |
Ratios/Supplemental Data: | | | | |
Net Assets, End of Period (in 000’s) | | $ | 388 | |
Ratios of expenses to average net assets: | | | | |
Before reimbursement and/or waiver of expenses by Adviser | | | 1.41 | %(e)(f) |
After reimbursement and/or waiver of expenses by Adviser | | | 0.95 | %(e)(f) |
Ratios of net investment income (loss) to average net assets: | | | | |
Before reimbursement and/or waiver of expenses by Adviser | | | (0.10 | )%(e) |
After reimbursement and/or waiver of expenses by Adviser | | | 0.36 | %(e) |
Portfolio Turnover | | | 24.34 | %(d) |
| (a) | TAMRO Diversified Equity Fund began issuing Class I shares on March 1, 2012. |
| (b) | The selected per share data was calculated using the weighted average shares outstanding method for the period. |
| (c) | The total return is calculated using the Net Asset Values used for trading at the close of business at period end. |
| (f) | Ratios of expenses to average net assets include interest expense of less than 0.005% for the period ended April 30, 2012, which is not included in the contractual expense limitation. The interest expense is from utilizing the line of credit as discussed in Note H to Financial Statements. |
| | | | |
See accompanying Notes to Financial Statements. | | | | |
| | | 83 | |
| | | | |
| | | | |
Aston Funds | | | | |
ASTON/Herndon Large Cap Value Fund – Class N | | | April 30, 2012 | |
| Financial Highlights | | | | |
| | | | | | | | | | | | |
| | | Six Months
Ended
04/30/12
(unaudited) | | | Year
Ended
10/31/11 | | | Period
Ended
10/31/10 (a) | |
Net Asset Value, Beginning of Period | | $ | 11.31 | | | $ | 10.39 | | | $ | 10.00 | |
| | | | | | | | | | | | |
Income from Investment Operations: | | | | | | | | | | | | |
Net investment income | | | 0.10 | (b) | | | 0.12 | (b) | | | 0.03 | |
Net realized and unrealized gain on investments | | | 1.13 | | | | 0.81 | | | | 0.36 | |
| | | | | | | | | | | | |
Total from investment operations | | | 1.23 | | | | 0.93 | | | | 0.39 | |
| | | | | | | | | | | | |
Less Distributions: | | | | | | | | | | | | |
Distributions from and in excess of net investment income | | | (0.11 | ) | | | (0.01 | ) | | | — | |
Distributions from net realized gain on investments | | | (0.56 | ) | | | — | | | | — | |
| | | | | | | | | | | | |
Total distributions | | | (0.67 | ) | | | (0.01 | ) | | | — | |
| | | | | | | | | | | | |
Net increase in net asset value | | | 0.56 | | | | 0.92 | | | | 0.39 | |
| | | | | | | | | | | | |
Net Asset Value, End of Period | | $ | 11.87 | | | $ | 11.31 | | | $ | 10.39 | |
| | | | | | | | | | | | |
Total Return (c) | | | 11.71 | %(d) | | | 9.09 | % | | | 3.90 | %(d) |
| | | |
Ratios/Supplemental Data: | | | | | | | | | | | | |
Net Assets, End of Period (in 000’s) | | $ | 9,854 | | | $ | 6,089 | | | $ | 1,472 | |
Ratios of expenses to average net assets: | | | | | | | | | | | | |
Before reimbursement and/or waiver of expenses by Adviser | | | 1.52 | %(e) | | | 2.38 | % | | | 13.84 | %(e) |
After reimbursement and/or waiver of expenses by Adviser | | | 1.30 | %(e) | | | 1.30 | % | | | 1.30 | %(e) |
Ratios of net investment income (loss) to average net assets: | | | | | | | | | | | | |
Before reimbursement and/or waiver of expenses by Adviser | | | 1.48 | %(e) | | | (0.05 | )% | | | (11.94 | )%(e) |
After reimbursement and/or waiver of expenses by Adviser | | | 1.70 | %(e) | | | 1.03 | % | | | 0.60 | %(e) |
Portfolio Turnover | | | 25.27 | %(d) | | | 189.70 | % | | | 38.64 | %(d) |
| (a) | Herndon Large Cap Value Fund began issuing Class N shares on March 30, 2010. |
| (b) | The selected per share data was calculated using the weighted average shares outstanding method for the period. |
| (c) | The total return is calculated using the Net Asset Values used for trading at the close of business at period end. |
|
See accompanying Notes to Financial Statements. |
| 84 |
| |
| | | | |
Aston Funds | | | | |
ASTON/Herndon Large Cap Value Fund – Class I | | | April 30, 2012 | |
Financial Highlights | | | | |
| | | | | | | | |
| | | Six Months
Ended
04/30/12
(unaudited) | | | Period
Ended
10/31/11(a) | |
Net Asset Value, Beginning of Period | | $ | 11.33 | | | $ | 11.48 | |
Income from Investment Operations: | | | | | | | | |
Net investment income | | | 0.11 | (b) | | | 0.10 | (b) |
Net realized and unrealized gain (loss) on investments | | | 1.13 | | | | (0.25 | ) |
| | | | | | | | |
Total from investment operations | | | 1.24 | | | | (0.15 | ) |
| | | | | | | | |
Less Distributions: | | | | | | | | |
Distributions from and in excess of net investment income | | | (0.14 | ) | | | — | |
Distributions from net realized gain on investments | | | (0.56 | ) | | | — | |
| | | | | | | | |
Total distributions | | | (0.70 | ) | | | — | |
| | | | | | | | |
Net increase (decrease) in net asset value | | | 0.54 | | | | (0.15 | ) |
| | | | | | | | |
Net Asset Value, End of Period | | $ | 11.87 | | | $ | 11.33 | |
| | | | | | | | |
Total Return (c) | | | 11.91 | %(d) | | | (1.31 | )%(d) |
| | |
Ratios/Supplemental Data: | | | | | | | | |
Net Assets, End of Period (in 000’s) | | $ | 38,044 | | | $ | 11,881 | |
Ratios of expenses to average net assets: | | | | | | | | |
Before reimbursement and/or waiver of expenses by Adviser | | | 1.27 | %(e) | | | 2.13 | %(e) |
After reimbursement and/or waiver of expenses by Adviser | | | 1.05 | %(e) | | | 1.05 | %(e) |
Ratios of net investment income to average net assets: | | | | | | | | |
Before reimbursement and/or waiver of expenses by Adviser | | | 1.73 | %(e) | | | 0.20 | %(e) |
After reimbursement and/or waiver of expenses by Adviser | | | 1.95 | %(e) | | | 1.28 | %(e) |
Portfolio Turnover | | | 25.27 | %(d) | | | 189.70 | % |
| (a) | Herndon Large Cap Value Fund began issuing Class I shares on March 1, 2011. |
| (b) | The selected per share data was calculated using the weighted average shares outstanding method for the period. |
| (c) | The total return is calculated using the Net Asset Values used for trading at the close of business at period end. |
| | | | |
See accompanying Notes to Financial Statements. | | | | |
| | | 85 | |
| | | | |
| | | | |
Aston Funds | | | | |
ASTON/Cornerstone Large Cap Value Fund – Class N | | | April 30, 2012 | |
| Financial Highlights | | | | |
| | | | | | | | | | | | | | | | | | | | | | | | |
| | | Six Months
Ended
04/30/12
(unaudited) | | | Year
Ended
10/31/11 | | | Year
Ended
10/31/10 | | | Year
Ended
10/31/09 | | | Year
Ended
10/31/08 | | | Year
Ended
10/31/07 | |
Net Asset Value, Beginning of Period | | $ | 10.04 | | | $ | 9.20 | | | $ | 8.31 | | | $ | 9.07 | | | $ | 15.57 | | | $ | 14.06 | |
| | | | | | | | | | | | | | | | | | | | | | | | |
Income from Investment Operations: | | | | | | | | | | | | | | | | | | | | | | | | |
Net investment income | | | 0.05 | (a) | | | 0.12 | (a) | | | 0.13 | | | | 0.15 | | | | 0.15 | | | | 0.19 | |
Net realized and unrealized gain (loss) on investments | | | 0.86 | | | | 0.83 | | | | 0.89 | | | | 0.41 | | | | (5.08 | ) | | | 2.09 | |
| | | | | | | | | | | | | | | | | | | | | | | | |
Total from investment operations | | | 0.91 | | | | 0.95 | | | | 1.02 | | | | 0.56 | | | | (4.93 | ) | | | 2.28 | |
| | | | | | | | | | | | | | | | | | | | | | | | |
Less Distributions: | | | | | | | | | | | | | | | | | | | | | | | | |
Distributions from and in excess of net investment income | | | (0.04 | ) | | | (0.11 | ) | | | (0.13 | ) | | | (0.15 | ) | | | (0.16 | ) | | | (0.20 | ) |
Distributions from net realized gain on investments | | | — | | | | — | | | | — | | | | (1.17 | ) | | | (1.41 | ) | | | (0.57 | ) |
| | | | | | | | | | | | | | | | | | | | | | | | |
Total distributions | | | (0.04 | ) | | | (0.11 | ) | | | (0.13 | ) | | | (1.32 | ) | | | (1.57 | ) | | | (0.77 | ) |
| | | | | | | | | | | | | | | | | | | | | | | | |
Net increase (decrease) in net asset value | | | 0.87 | | | | 0.84 | | | | 0.89 | | | | (0.76 | ) | | | (6.50 | ) | | | 1.51 | |
| | | | | | | | | | | | | | | | | | | | | | | | |
Net Asset Value, End of Period | | $ | 10.91 | | | $ | 10.04 | | | $ | 9.20 | | | $ | 8.31 | | | $ | 9.07 | | | $ | 15.57 | |
| | | | | | | | | | | | | | | | | | | | | | | | |
Total Return (b) | | | 9.13 | %(c) | | | 10.44 | % | | | 12.37 | % | | | 8.60 | % | | | (34.85 | )% | | | 16.77 | % |
| | | | | | |
Ratios/Supplemental Data: | | | | | | | | | | | | | | | | | | | | | | | | |
Net Assets, End of Period (in 000’s) | | $ | 22,691 | | | $ | 24,631 | | | $ | 19,984 | | | $ | 20,173 | | | $ | 19,704 | | | $ | 130,476 | |
Ratios of expenses to average net assets: | | | | | | | | | | | | | | | | | | | | | | | | |
Before reimbursement and/or waiver of expenses by Adviser | | | 1.63 | %(d) | | | 1.61 | % | | | 1.19 | %(e) | | | 1.21 | % | | | 1.18 | %(e) | | | 1.16 | % |
After reimbursement and/or waiver of expenses by Adviser | | | 1.23 | %(d)(f) | | | 1.14 | %(f) | | | 1.07 | %(e) | | | 1.07 | %(g) | | | 1.02 | %(e) | | | 0.94 | % |
Ratios of net investment income to average net assets: | | | | | | | | | | | | | | | | | | | | | | | | |
Before reimbursement and/or waiver of expenses by Adviser | | | 0.47 | %(d) | | | 0.80 | % | | | 1.32 | % | | | 1.77 | % | | | 1.22 | % | | | 1.06 | % |
After reimbursement and/or waiver of expenses by Adviser | | | 0.87 | %(d) | | | 1.27 | % | | | 1.44 | % | | | 1.91 | % | | | 1.38 | % | | | 1.28 | % |
Portfolio Turnover | | | 35.77 | %(c) | | | 59.07 | %(h) | | | 37.44 | % | | | 39.00 | % | | | 67.57 | % | | | 28.05 | % |
| (a) | The selected per share data was calculated using the weighted average shares outstanding method for the period. |
| (b) | The total return is calculated using the Net Asset Values used for trading at the close of business at period end. |
| (e) | Ratios of expenses to average net assets include interest expenses of less than 0.005% for the years ended October 31, 2010 and October 31, 2008, which are not included in the contractual expense limitation. The interest expenses are from utilizing the line of credit as discussed in Note H to Financial Statements. |
| (f) | Effective March 22, 2011, the Adviser changed the voluntary expense limitation from 1.07% to 1.19%. Subsequently on February 29, 2012, the Adviser removed the voluntary expense limitation and replaced it with a contractual expense limitation of 1.30%. |
| (g) | The contractual expense limitation of 1.07%, which excludes interest, brokerage commissions, other investment related costs, extraordinary expenses and acquired fund fees and expenses, was removed by the Adviser and replaced with a voluntary expense limitation of 1.07% effective March 1, 2009. Voluntary expense waivers can end at any time. |
| (h) | Portfolio turnover rate excludes securities delivered from processing a redemption-in-kind. |
|
See accompanying Notes to Financial Statements. |
| 86 |
| |
| | | | |
Aston Funds | | | | |
ASTON/Cornerstone Large Cap Value Fund – Class I | | | April 30, 2012 | |
| Financial Highlights | | | | |
| | | | | | | | | | | | | | | | | | | | | | | | |
| | | Six Months
Ended
04/30/12
(unaudited) | | | Year
Ended
10/31/11 | | | Year
Ended
10/31/10 | | | Year
Ended
10/31/09 | | | Year
Ended
10/31/08 | | | Year
Ended
10/31/07 | |
Net Asset Value, Beginning of Period | | $ | 10.05 | | | $ | 9.19 | | | $ | 8.31 | | | $ | 9.06 | | | $ | 15.57 | | | $ | 14.07 | |
| | | | | | | | | | | | | | | | | | | | | | | | |
Income from Investment Operations: | | | | | | | | | | | | | | | | | | | | | | | | |
Net investment income | | | 0.04 | (a) | | | 0.16 | (a) | | | 0.15 | | | | 0.17 | | | | 0.20 | | | | 0.23 | |
Net realized and unrealized gain (loss) on investments | | | 0.88 | | | | 0.84 | | | | 0.88 | | | | 0.42 | | | | (5.10 | ) | | | 2.07 | |
| | | | | | | | | | | | | | | | | | | | | | | | |
Total from investment operations | | | 0.92 | | | | 1.00 | | | | 1.03 | | | | 0.59 | | | | (4.90 | ) | | | 2.30 | |
| | | | | | | | | | | | | | | | | | | | | | | | |
Less Distributions: | | | | | | | | | | | | | | | | | | | | | | | | |
Distributions from and in excess of net investment income | | | (0.05 | ) | | | (0.14 | ) | | | (0.15 | ) | | | (0.17 | ) | | | (0.20 | ) | | | (0.23 | ) |
Distributions from net realized gain on investments | | | — | | | | — | | | | — | | | | (1.17 | ) | | | (1.41 | ) | | | (0.57 | ) |
| | | | | | | | | | | | | | | | | | | | | | | | |
Total distributions | | | (0.05 | ) | | | (0.14 | ) | | | (0.15 | ) | | | (1.34 | ) | | | (1.61 | ) | | | (0.80 | ) |
| | | | | | | | | | | | | | | | | | | | | | | | |
Net increase (decrease) in net asset value | | | 0.87 | | | | 0.86 | | | | 0.88 | | | | (0.75 | ) | | | (6.51 | ) | | | 1.50 | |
| | | | | | | | | | | | | | | | | | | | | | | | |
Net Asset Value, End of Period | | $ | 10.92 | | | $ | 10.05 | | | $ | 9.19 | | | $ | 8.31 | | | $ | 9.06 | | | $ | 15.57 | |
| | | | | | | | | | | | | | | | | | | | | | | | |
Total Return (b) | | | 9.16 | %(c) | | | 10.95 | % | | | 12.53 | % | | | 9.01 | % | | | (34.73 | )% | | | 16.98 | % |
| | | | | | |
Ratios/Supplemental Data: | | | | | | | | | | | | | | | | | | | | | | | | |
Net Assets, End of Period (in 000’s) | | $ | 3,359 | | | $ | 126 | | | $ | 204,051 | | | $ | 205,580 | | | $ | 188,688 | | | $ | 289,024 | |
Ratios of expenses to average net assets: | | | | | | | | | | | | | | | | | | | | | | | | |
Before reimbursement and/or waiver of expenses by Adviser | | | 1.38 | %(d) | | | 1.36 | % | | | 0.94 | %(e) | | | 0.96 | % | | | 0.93 | %(e) | | | 0.91 | % |
After reimbursement and/or waiver of expenses by Adviser | | | 0.98 | %(d)(f) | | | 0.89 | %(f) | | | 0.82 | %(e) | | | 0.82 | %(g) | | | 0.77 | %(e) | | | 0.69 | % |
Ratios of net investment income to average net assets: | | | | | | | | | | | | | | | | | | | | | | | | |
Before reimbursement and/or waiver of expenses by Adviser | | | 0.72 | %(d) | | | 1.05 | % | | | 1.57 | % | | | 2.02 | % | | | 1.47 | % | | | 1.31 | % |
After reimbursement and/or waiver of expenses by Adviser | | | 1.12 | %(d) | | | 1.52 | % | | | 1.69 | % | | | 2.16 | % | | | 1.63 | % | | | 1.53 | % |
Portfolio Turnover | | | 35.77 | %(c) | | | 59.07 | %(h) | | | 37.44 | % | | | 39.00 | % | | | 67.57 | % | | | 28.05 | % |
| (a) | The selected per share data was calculated using the weighted average shares outstanding method for the period. |
| (b) | The total return is calculated using the Net Asset Values used for trading at the close of business at period end. |
| (e) | Ratios of expense to average net assets included interest expenses of less than 0.005% for the years ended October 31, 2010 and October 31, 2008, which are not included in the contractual expense limitation. The interest expenses are from utilizing the line of credit as discussed in Note H to Financial Statements. |
| (f) | Effective March 22, 2011, the Adviser changed the voluntary expense limitation from 0.82% to 0.94%. Subsequently on February 29, 2012, the Adviser removed the voluntary expense limitation and replaced it with a contractual expense limitation of 1.05%. |
| (g) | The contractual expense limitation of 0.82%, which excludes interest, brokerage commissions, other investment related costs, extraordinary expenses and acquired fund fees and expenses, was removed by the Adviser and replaced with a voluntary expense limitation of 0.82% effective March 1, 2009. Voluntary expense waivers can end at any time. |
| (h) | Portfolio turnover rate excludes securities delivered from processing a redemption-in-kind. |
| | | | |
See accompanying Notes to Financial Statements. | | | | |
| | | 87 | |
| | | | |
| | | | |
Aston Funds | | | | |
ASTON/River Road Dividend All Cap Value Fund – Class N | | | April 30, 2012 | |
| Financial Highlights | | | | |
| | | | | | | | | | | | | | | | | | | | | | | | |
| | | Six Months
Ended
04/30/12
(unaudited) | | | Year
Ended
10/31/11 | | | Year
Ended
10/31/10 | | | Year
Ended
10/31/09 | | | Year
Ended
10/31/08 | | | Year
Ended
10/31/07 | |
Net Asset Value, Beginning of Period | | $ | 10.68 | | | $ | 10.23 | | | $ | 8.58 | | | $ | 8.43 | | | $ | 12.58 | | | $ | 11.81 | |
| | | | | | | | | | | | | | | | | | | | | | | | |
Income from Investment Operations: | | | | | | | | | | | | | | | | | | | | | | | | |
Net investment income | | | 0.14 | (a) | | | 0.29 | (a) | | | 0.26 | (a) | | | 0.26 | (a) | | | 0.38 | | | | 0.46 | (a) |
Net realized and unrealized gain (loss) on investments | | | 0.80 | | | | 0.42 | | | | 1.62 | | | | 0.08 | | | | (3.54 | ) | | | 0.81 | |
| | | | | | | | | | | | | | | | | | | | | | | | |
Total from investment operations | | | 0.94 | | | | 0.71 | | | | 1.88 | | | | 0.34 | | | | (3.16 | ) | | | 1.27 | |
| | | | | | | | | | | | | | | | | | | | | | | | |
Less Distributions: | | | | | | | | | | | | | | | | | | | | | | | | |
Distributions from and in excess of net investment income | | | (0.14 | ) | | | (0.26 | ) | | | (0.23 | ) | | | (0.19 | ) | | | (0.32 | ) | | | (0.37 | ) |
Return of capital | | | — | | | | — | | | | — | | | | — | | | | (0.01 | ) | | | — | |
Distributions from net realized gain on investments | | | (0.07 | ) | | | — | | | | — | | | | — | | | | (0.66 | ) | | | (0.13 | ) |
| | | | | | | | | | | | | | | | | | | | | | | | |
Total distributions | | | (0.21 | ) | | | (0.26 | ) | | | (0.23 | ) | | | (0.19 | ) | | | (0.99 | ) | | | (0.50 | ) |
| | | | | | | | | | | | | | | | | | | | | | | | |
Net increase (decrease) in net asset value | | | 0.73 | | | | 0.45 | | | | 1.65 | | | | 0.15 | | | | (4.15 | ) | | | 0.77 | |
| | | | | | | | | | | | | | | | | | | | | | | | |
Net Asset Value, End of Period | | $ | 11.41 | | | $ | 10.68 | | | $ | 10.23 | | | $ | 8.58 | | | $ | 8.43 | | | $ | 12.58 | |
| | | | | | | | | | | | | | | | | | | | | | | | |
Total Return (b) | | | 8.87 | %(c) | | | 6.94 | % | | | 22.20 | % | | | 4.33 | % | | | (26.82 | )% | | | 10.89 | % |
| | | | | | |
Ratios/Supplemental Data: | | | | | | | | | | | | | | | | | | | | | | | | |
Net Assets, End of Period (in 000’s) | | $ | 336,925 | | | $ | 301,290 | | | $ | 135,544 | | | $ | 81,842 | | | $ | 51,504 | | | $ | 32,313 | |
Ratios of expenses to average net assets: | | | | | | | | | | | | | | | | | | | | | | | | |
Before reimbursement and/or waiver of expenses by Adviser | | | 1.11 | %(d) | | | 1.12 | % | | | 1.14 | % | | | 1.21 | % | | | 1.35 | %(e) | | | 1.53 | % |
After reimbursement and/or waiver of expenses by Adviser | | | 1.11 | %(d) | | | 1.12 | % | | | 1.14 | % | | | 1.21 | % | | | 1.30 | %(e) | | | 1.30 | % |
Ratios of net investment income to average net assets: | | | | | | | | | | | | | | | | | | | | | | | | |
Before reimbursement and/or waiver of expenses by Adviser | | | 2.55 | %(d) | | | 2.70 | % | | | 2.69 | % | | | 3.36 | % | | | 3.81 | % | | | 3.48 | % |
After reimbursement and/or waiver of expenses by Adviser | | | 2.55 | %(d) | | | 2.70 | % | | | 2.69 | % | | | 3.36 | % | | | 3.86 | % | | | 3.71 | % |
Portfolio Turnover | | | 15.88 | %(c) | | | 24.65 | % | | | 29.92 | % | | | 47.34 | % | | | 48.95 | % | | | 114.56 | % |
| (a) | The selected per share data was calculated using the weighted average shares outstanding method for the period. |
| (b) | The total return is calculated using the Net Asset Values used for trading at the close of business at period end. |
| (e) | Ratios of expenses to average net assets include interest expense of less than 0.005% for the year ended October 31, 2008, which is not included in the contractual expense limitation. The interest expense is from utilizing the line of credit as discussed in Note H to Financial Statements. |
|
See accompanying Notes to Financial Statements. |
| 88 |
| |
| | | | |
Aston Funds | | | | |
ASTON/River Road Dividend All Cap Value Fund – Class I | | | April 30, 2012 | |
| Financial Highlights | | | | |
| | | | | | | | | | | | | | | | | | | | | | | | |
| | | Six Months
Ended
04/30/12
(unaudited) | | | Year
Ended
10/31/11 | | | Year
Ended
10/31/10 | | | Year
Ended
10/31/09 | | | Year
Ended
10/31/08 | | | Period
Ended
10/31/07(a) | |
Net Asset Value, Beginning of Period | | $ | 10.67 | | | $ | 10.22 | | | $ | 8.57 | | | $ | 8.42 | | | $ | 12.57 | | | $ | 12.94 | |
| | | | | | | | | | | | | | | | | | | | | | | | |
Income from Investment Operations: | | | | | | | | | | | | | | | | | | | | | | | | |
Net investment income | | | 0.15 | (b) | | | 0.32 | (b) | | | 0.28 | (b) | | | 0.29 | (b) | | | 0.41 | | | | 0.16 | (b) |
Net realized and unrealized gain (loss) on investments | | | 0.80 | | | | 0.42 | | | | 1.63 | | | | 0.07 | | | | (3.55 | ) | | | (0.37 | ) |
| | | | | | | | | | | | | | | | | | | | | | | | |
Total from investment operations | | | 0.95 | | | | 0.74 | | | | 1.91 | | | | 0.36 | | | | (3.14 | ) | | | (0.21 | ) |
| | | | | | | | | | | | | | | | | | | | | | | | |
Less Distributions: | | | | | | | | | | | | | | | | | | | | | | | | |
Distributions from and in excess of net investment income | | | (0.15 | ) | | | (0.29 | ) | | | (0.26 | ) | | | (0.21 | ) | | | (0.34 | ) | | | (0.16 | ) |
Return of capital | | | — | | | | — | | | | — | | | | — | | | | (0.01 | ) | | | — | |
Distributions from net realized gain on investments | | | (0.07 | ) | | | — | | | | — | | | | — | | | | (0.66 | ) | | | — | |
| | | | | | | | | | | | | | | | | | | | | | | | |
Total distributions | | | (0.22 | ) | | | (0.29 | ) | | | (0.26 | ) | | | (0.21 | ) | | | (1.01 | ) | | | (0.16 | ) |
| | | | | | | | | | | | | | | | | | | | | | | | |
Net increase (decrease) in net asset value | | | 0.73 | | | | 0.45 | | | | 1.65 | | | | 0.15 | | | | (4.15 | ) | | | (0.37 | ) |
| | | | | | | | | | | | | | | | | | | | | | | | |
Net Asset Value, End of Period | | $ | 11.40 | | | $ | 10.67 | | | $ | 10.22 | | | $ | 8.57 | | | $ | 8.42 | | | $ | 12.57 | |
| | | | | | | | | | | | | | | | | | | | | | | | |
Total Return (c) | | | 9.01 | %(d) | | | 7.21 | % | | | 22.53 | % | | | 4.59 | % | | | (26.66 | )% | | | (1.58 | )%(d) |
| | | | | | |
Ratios/Supplemental Data: | | | | | | | | | | | | | | | | | | | | | | | | |
Net Assets, End of Period (in 000’s) | | $ | 519,303 | | | $ | 318,863 | | | $ | 137,629 | | | $ | 77,185 | | | $ | 144 | | | $ | 197 | |
Ratios of expenses to average net assets: | | | | | | | | | | | | | | | | | | | | | | | | |
Before reimbursement and/or waiver of expenses by Adviser | | | 0.86 | %(e) | | | 0.87 | % | | | 0.89 | % | | | 0.96 | % | | | 1.10 | %(f) | | | 1.42 | %(e) |
After reimbursement and/or waiver of expenses by Adviser | | | 0.86 | %(e) | | | 0.87 | % | | | 0.89 | % | | | 0.96 | % | | | 1.05 | %(f) | | | 0.96 | %(e) |
Ratios of net investment income to average net assets: | | | | | | | | | | | | | | | | | | | | | | | | |
Before reimbursement and/or waiver of expenses by Adviser | | | 2.80 | %(e) | | | 2.95 | % | | | 2.94 | % | | | 3.61 | % | | | 4.06 | % | | | 2.86 | %(e) |
After reimbursement and/or waiver of expenses by Adviser | | | 2.80 | %(e) | | | 2.95 | % | | | 2.94 | % | | | 3.61 | % | | | 4.11 | % | | | 3.33 | %(e) |
Portfolio Turnover | | | 15.88 | %(d) | | | 24.65 | % | | | 29.92 | % | | | 47.34 | % | | | 48.95 | % | | | 114.56 | % |
| (a) | River Road Dividend All Cap Value Fund began issuing Class I shares on June 27, 2007. |
| (b) | The selected per share data was calculated using the weighted average shares outstanding method for the period. |
| (c) | The total return is calculated using the Net Asset Values used for trading at the close of business at period end. |
| (f) | Ratios of expenses to average net assets include interest expense of less than 0.005% for the year ended October 31, 2008, which is not included in the contractual expense limitation. The interest expense is from utilizing the line of credit as discussed in Note H to Financial Statements. |
| | | | |
See accompanying Notes to Financial Statements. | | | | |
| | | 89 | |
| | | | |
| | | | |
Aston Funds | | | | |
ASTON/Fairpointe Mid Cap Fund – Class N | | | April 30, 2012 | |
| Financial Highlights | | | | |
| | | | | | | | | | | | | | | | | | | | | | | | |
| | | Six Months
Ended
04/30/12
(unaudited) | | | Year
Ended
10/31/11 | | | Year
Ended
10/31/10 | | | Year
Ended
10/31/09 | | | Year
Ended
10/31/08 | | | Year
Ended
10/31/07 | |
Net Asset Value, Beginning of Period | | $ | 29.76 | | | $ | 29.04 | | | $ | 22.73 | | | $ | 17.25 | | | $ | 32.32 | | | $ | 27.16 | |
| | | | | | | | | | | | | | | | | | | | | | | | |
Income from Investment Operations: | | | | | | | | | | | | | | | | | | | | | | | | |
Net investment income (loss) | | | 0.06 | | | | 0.06 | (a) | | | 0.01 | | | | 0.09 | | | | 0.05 | | | | (0.02 | ) |
Net realized and unrealized
gain (loss) on investments | | | 2.57 | | | | 0.82 | | | | 6.35 | | | | 5.82 | | | | (12.93 | ) | | | 7.01 | |
| | | | | | | | | | | | | | | | | | | | | | | | |
Total from investment operations | | | 2.63 | | | | 0.88 | | | | 6.36 | | | | 5.91 | | | | (12.88 | ) | | | 6.99 | |
| | | | | | | | | | | | | | | | | | | | | | | | |
Less Distributions: | | | | | | | | | | | | | | | | | | | | | | | | |
Distributions from and in excess of net investment income | | | (0.05 | ) | | | (0.08 | ) | | | (0.05 | ) | | | (0.14 | ) | | | — | | | | — | |
Distributions from net realized gain on investments | | | (0.21 | ) | | | (0.08 | ) | | | — | | | | (0.29 | ) | | | (2.19 | ) | | | (1.83 | ) |
| | | | | | | | | | | | | | | | | | | | | | | | |
Total distributions | | | (0.26 | ) | | | (0.16 | ) | | | (0.05 | ) | | | (0.43 | ) | | | (2.19 | ) | | | (1.83 | ) |
| | | | | | | | | | | | | | | | | | | | | | | | |
Net increase (decrease) in net asset value | | | 2.37 | | | | 0.72 | | | | 6.31 | | | | 5.48 | | | | (15.07 | ) | | | 5.16 | |
| | | | | | | | | | | | | | | | | | | | | | | | |
Net Asset Value, End of Period | | $ | 32.13 | | | $ | 29.76 | | | $ | 29.04 | | | $ | 22.73 | | | $ | 17.25 | | | $ | 32.32 | |
| | | | | | | | | | | | | | | | | | | | | | | | |
Total Return (b) | | | 8.91 | %(c) | | | 2.98 | % | | | 28.01 | % | | | 35.60 | % | | | (42.50 | )% | | | 27.08 | % |
| | | | | | |
Ratios/Supplemental Data: | | | | | | | | | | | | | | | | | | | | | | | | |
Net Assets, End of Period (in 000’s) | | $ | 1,589,447 | | | $ | 1,502,266 | | | $ | 1,469,354 | | | $ | 842,233 | | | $ | 508,886 | | | $ | 823,036 | |
Ratios of expenses to average net assets: | | | | | | | | | | | | | | | | | | | | | | | | |
Before reimbursement and/or waiver of expenses by Adviser | | | 1.12 | %(d)(e) | | | 1.14 | %(e) | | | 1.14 | %(e) | | | 1.20 | %(e) | | | 1.16 | %(e) | | | 1.15 | %(e) |
After reimbursement and/or waiver of expenses by Adviser | | | 1.12 | %(d)(e) | | | 1.14 | %(e) | | | 1.14 | %(e) | | | 1.20 | %(e) | | | 1.16 | %(e) | | | 1.15 | %(e) |
Ratios of net investment income (loss) to average net assets: | | | | | | | | | | | | | | | | | | | | | | | | |
Before reimbursement and/or waiver of expenses by Adviser | | | 0.41 | %(d) | | | 0.21 | % | | | — | %(f) | | | 0.46 | % | | | 0.18 | % | | | (0.09 | )% |
After reimbursement and/or waiver of expenses by Adviser | | | 0.41 | %(d) | | | 0.21 | % | | | — | %(f) | | | 0.46 | % | | | 0.18 | % | | | (0.09 | )% |
Portfolio Turnover | | | 10.32 | %(c)(g) | | | 11.20 | % | | | 13.82 | % | | | 17.72 | % | | | 22.58 | % | | | 26.15 | % |
| (a) | The selected per share data was calculated using the weighted average shares outstanding method for the period. |
| (b) | The total return is calculated using the Net Asset Values used for trading at the close of business at period end. |
| (e) | Ratios of expenses to average net assets include interest expenses of less than 0.005% for the six months ended April 30, 2012 and the years ended October 31, 2011, October 31, 2010, October 31, 2009, October 31, 2008 and October 31, 2007, which are not included in the contractual expense limitation. The interest expenses are from utilizing the line of credit as discussed in Note H to Financial Statements. |
| (f) | Represents less than 0.005%. |
| (g) | Portfolio turnover rate excludes securities delivered from processing a redemption-in-kind. |
|
See accompanying Notes to Financial Statements. |
| 90 |
| |
| | | | |
Aston Funds | | | | |
ASTON/Fairpointe Mid Cap Fund – Class I | | | April 30, 2012 | |
| Financial Highlights | | | | |
| | | | | | | | | | | | | | | | | | | | | | | | |
| | | Six Months
Ended
04/30/12
(unaudited) | | | Year
Ended
10/31/11 | | | Year
Ended
10/31/10 | | | Year
Ended
10/31/09 | | | Year
Ended
10/31/08 | | | Year
Ended
10/31/07 | |
Net Asset Value, Beginning of Period | | $ | 30.20 | | | $ | 29.41 | | | $ | 23.00 | | | $ | 17.47 | | | $ | 32.64 | | | $ | 27.34 | |
| | | | | | | | | | | | | | | | | | | | | | | | |
Income from Investment Operations: | | | | | | | | | | | | | | | | | | | | | | | | |
Net investment income | | | 0.11 | | | | 0.14 | (a) | | | 0.07 | | | | 0.13 | | | | 0.11 | | | | 0.05 | |
Net realized and unrealized
gain (loss) on investments | | | 2.60 | | | | 0.82 | | | | 6.43 | | | | 5.89 | | | | (13.09 | ) | | | 7.08 | |
| | | | | | | | | | | | | | | | | | | | | | | | |
Total from investment operations | | | 2.71 | | | | 0.96 | | | | 6.50 | | | | 6.02 | | | | (12.98 | ) | | | 7.13 | |
| | | | | | | | | | | | | | | | | | | | | | | | |
Less Distributions: | | | | | | | | | | | | | | | | | | | | | | | | |
Distributions from and in excess of net investment income | | | (0.13 | ) | | | (0.09 | ) | | | (0.09 | ) | | | (0.20 | ) | | | — | | | | — | |
Distributions from net realized gain on investment | | | (0.21 | ) | | | (0.08 | ) | | | — | | | | (0.29 | ) | | | (2.19 | ) | | | (1.83 | ) |
| | | | | | | | | | | | | | | | | | | | | | | | |
Total distributions | | | (0.34 | ) | | | (0.17 | ) | | | (0.09 | ) | | | (0.49 | ) | | | (2.19 | ) | | | (1.83 | ) |
| | | | | | | | | | | | | | | | | | | | | | | | |
Net increase (decrease) in net asset value | | | 2.37 | | | | 0.79 | | | | 6.41 | | | | 5.53 | | | | (15.17 | ) | | | 5.30 | |
| | | | | | | | | | | | | | | | | | | | | | | | |
Net Asset Value, End of Period | | $ | 32.57 | | | $ | 30.20 | | | $ | 29.41 | | | $ | 23.00 | | | $ | 17.47 | | | $ | 32.64 | |
| | | | | | | | | | | | | | | | | | | | | | | | |
Total Return (b) | | | 9.08 | %(c) | | | 3.22 | % | | | 28.31 | % | | | 35.97 | % | | | (42.39 | )% | | | 27.43 | % |
| | | | | | |
Ratios/Supplemental Data: | | | | | | | | | | | | | | | | | | | | | | | | |
Net Assets, End of Period (in 000’s) | | $ | 1,379,544 | | | $ | 1,339,223 | | | $ | 499,651 | | | $ | 150,953 | | | $ | 93,176 | | | $ | 126,691 | |
Ratios of expenses to average net assets: | | | | | | | | | | | | | | | | | | | | | | | | |
Before reimbursement and/or waiver of expenses by Adviser | | | 0.87 | %(d)(e) | | | 0.89 | %(e) | | | 0.89 | %(e) | | | 0.95 | %(e) | | | 0.91 | %(e) | | | 0.87 | %(e) |
After reimbursement and/or waiver of expenses by Adviser | | | 0.87 | %(d)(e) | | | 0.89 | %(e) | | | 0.89 | %(e) | | | 0.95 | %(e) | | | 0.91 | %(e) | | | 0.87 | %(e) |
Ratios of net investment income to average net assets: | | | | | | | | | | | | | | | | | | | | | | | | |
Before reimbursement and/or waiver of expenses by Adviser | | | 0.66 | %(d) | | | 0.46 | % | | | 0.25 | % | | | 0.71 | % | | | 0.43 | % | | | 0.19 | % |
After reimbursement and/or waiver of expenses by Adviser | | | 0.66 | %(d) | | | 0.46 | % | | | 0.25 | % | | | 0.71 | % | | | 0.43 | % | | | 0.19 | % |
Portfolio Turnover | | | 10.32 | %(c)(f) | | | 11.20 | % | | | 13.82 | % | | | 17.72 | % | | | 22.58 | % | | | 26.15 | % |
| (a) | The selected per share data was calculated using the weighted average shares outstanding method for the period. |
| (b) | The total return is calculated using the Net Asset Values used for trading at the close of business at period end. |
| (e) | Ratios of expenses to average net assets include interest expenses of less than 0.005% for six months ended April 30, 2012 and the years ended October 31, 2011, October 31, 2010, October 31, 2009, October 31, 2008 and October 31, 2007, which are not included in the contractual expense limitation. The interest expenses are from utilizing the line of credit as discussed in Note H to Financial Statements. |
| (f) | Portfolio turnover rate excludes securities delivered from processing a redemption-in-kind. |
| | | | |
See accompanying Notes to Financial Statements. | | | | |
| | | 91 | |
| | | | |
| | | | |
Aston Funds | | | | |
ASTON/Montag & Caldwell Mid Cap Growth Fund – Class N | | | April 30, 2012 | |
| Financial Highlights | | | | |
| | | | | | | | | | | | | | | | | | | | |
| | | Six Months
Ended
04/30/12
(unaudited) | | | Year
Ended
10/31/11 | | | Year
Ended
10/31/10 | | | Year
Ended
10/31/09 | | | Period
Ended
10/31/08(a) | |
Net Asset Value, Beginning of Period | | $ | 9.71 | | | $ | 8.51 | | | $ | 6.83 | | | $ | 5.85 | | | $ | 10.00 | |
| | | | | | | | | | | | | | | | | | | | |
Income from Investment Operations: | | | | | | | | | | | | | | | | | | | | |
Net investment loss | | | (0.03 | ) | | | (0.07 | ) | | | (0.04 | ) | | | (0.04 | ) | | | (0.05 | ) |
Net realized and unrealized gain (loss) on investments | | | 1.12 | | | | 1.27 | | | | 1.74 | | | | 1.02 | | | | (4.10 | ) |
| | | | | | | | | | | | | | | | | | | | |
Total from investment operations | | | 1.09 | | | | 1.20 | | | | 1.70 | | | | 0.98 | | | | (4.15 | ) |
| | | | | | | | | | | | | | | | | | | | |
Less Distributions: | | | | | | | | | | | | | | | | | | | | |
Distributions from and in excess of net investment income | | | — | | | | — | | | | (0.02 | ) | | | — | | | | — | |
| | | | | | | | | | | | | | | | | | | | |
Total distributions | | | — | | | | — | | | | (0.02 | ) | | | — | | | | — | |
| | | | | | | | | | | | | | | | | | | | |
Net increase (decrease) in net asset value | | | 1.09 | | | | 1.20 | | | | 1.68 | | | | 0.98 | | | | (4.15 | ) |
| | | | | | | | | | | | | | | | | | | | |
Net Asset Value, End of Period | | $ | 10.80 | | | $ | 9.71 | | | $ | 8.51 | | | $ | 6.83 | | | $ | 5.85 | |
| | | | | | | | | | | | | | | | | | | | |
Total Return (b) | | | 11.23 | %(c) | | | 14.10 | % | | | 24.85 | % | | | 16.75 | % | | | (41.50 | )%(c) |
| | | | | |
Ratios/Supplemental Data: | | | | | | | | | | | | | | | | | | | | |
Net Assets, End of Period (in 000’s) | | $ | 6,725 | | | $ | 4,507 | | | $ | 3,399 | | | $ | 2,959 | | | $ | 1,815 | |
Ratios of expenses to average net assets: | | | | | | | | | | | | | | | | | | | | |
Before reimbursement and/or waiver of expenses by Adviser | | | 2.62 | %(d) | | | 3.07 | % | | | 3.55 | % | | | 5.02 | % | | | 5.80 | %(d) |
After reimbursement and/or waiver of expenses by Adviser | | | 1.25 | %(d)(e) | | | 1.39 | %(e) | | | 1.40 | % | | | 1.40 | % | | | 1.40 | %(d) |
Ratios of net investment loss to average net assets: | | | | | | | | | | | | | | | | | | | | |
Before reimbursement and/or waiver of expenses by Adviser | | | (1.98 | )%(d) | | | (2.39 | )% | | | (2.75 | )% | | | (4.13 | )% | | | (5.07 | )%(d) |
After reimbursement and/or waiver of expenses by Adviser | | | (0.62 | )%(d) | | | (0.71 | )% | | | (0.60 | )% | | | (0.51 | )% | | | (0.67 | )%(d) |
Portfolio Turnover | | | 18.06 | %(c) | | | 29.31 | % | | | 31.49 | % | | | 54.37 | % | | | 63.66 | %(c) |
| (a) | Montag & Caldwell Mid Cap Growth Fund began issuing Class N shares on November 1, 2007. |
| (b) | The total return is calculated using the Net Asset Values used for trading at the close of business at period end. |
| (e) | For the period November 1, 2010 through September 29, 2011 the Adviser contractually waived management fees and/or reimbursed expenses so that the net expense ratio is no more than 1.40%, excluding interest, brokerage commissions, other investment related costs, extraordinary expenses and acquired fund fees and expenses. Effective September 30, 2011, the Adviser implemented a voluntary expense limitation of 1.25%. Subsequently on February 29, 2012, the Adviser removed the voluntary expense limitation and replaced it with a contractual expense limitation of 1.25%. |
|
See accompanying Notes to Financial Statements. |
| 92 |
| |
| | | | |
Aston Funds | | | | |
ASTON/Cardinal Mid Cap Value Fund – Class N | | | April 30, 2012 | |
Financial Highlights | | | | |
| | | | | | | | | | | | | | | | | | | | |
| | | Six Months | | | | | | | | | | | | | |
| | | Ended | | | Year | | | Year | | | Year | | | Period | |
| | | 04/30/12 | | | Ended | | | Ended | | | Ended | | | Ended | |
| | | (unaudited) | | | 10/31/11 | | | 10/31/10 | | | 10/31/09 | | | 10/31/08(a) | |
Net Asset Value, Beginning of Period | | $ | 9.17 | | | $ | 8.51 | | | $ | 7.17 | | | $ | 6.23 | | | $ | 10.00 | |
| | | | | | | | | | | | | | | | | | | | |
Income from Investment Operations: | | | | | | | | | | | | | | | | | | | | |
Net investment income | | | 0.04 | | | | 0.04 | | | | 0.03 | | | | 0.02 | | | | 0.01 | |
Net realized and unrealized gain (loss) on investments | | | 0.83 | | | | 0.66 | | | | 1.34 | | | | 0.99 | | | | (3.78 | ) |
| | | | | | | | | | | | | | | | | | | | |
Total from investment operations | | | 0.87 | | | | 0.70 | | | | 1.37 | | | | 1.01 | | | | (3.77 | ) |
| | | | | | | | | | | | | | | | | | | | |
Less Distributions: | | | | | | | | | | | | | | | | | | | | |
Distributions from net investment income | | | (0.04 | ) | | | (0.04 | ) | | | (0.03 | ) | | | (0.07 | ) | | | — | |
| | | | | | | | | | | | | | | | | | | | |
Total distributions | | | (0.04 | ) | | | (0.04 | ) | | | (0.03 | ) | | | (0.07 | ) | | | — | |
| | | | | | | | | | | | | | | | | | | | |
Net increase (decrease) in net asset value | | | 0.83 | | | | 0.66 | | | | 1.34 | | | | 0.94 | | | | (3.77 | ) |
| | | | | | | | | | | | | | | | | | | | |
Net Asset Value, End of Period | | $ | 10.00 | | | $ | 9.17 | | | $ | 8.51 | | | $ | 7.17 | | | $ | 6.23 | |
| | | | | | | | | | | | | | | | | | | | |
Total Return (b) | | | 9.46 | %(c) | | | 8.22 | % | | | 19.14 | % | | | 16.45 | % | | | (37.70 | )%(c) |
| | | | | |
Ratios/Supplemental Data: | | | | | | | | | | | | | | | | | | | | |
Net Assets, End of Period (in 000’s) | | $ | 1,904 | | | $ | 1,641 | | | $ | 1,409 | | | $ | 916 | | | $ | 783 | |
Ratios of expenses to average net assets: | | | | | | | | | | | | | | | | | | | | |
Before reimbursement and/or waiver of expenses by Adviser | | | 5.50 | %(d) | | | 6.05 | % | | | 7.64 | % | | | 11.18 | % | | | 11.20 | %(d) |
After reimbursement and/or waiver of expenses by Adviser | | | 1.40 | %(d) | | | 1.40 | % | | | 1.40 | % | | | 1.40 | % | | | 1.40 | %(d) |
Ratios of net investment income (loss) to average net assets: | | | | | | | | | | | | | | | | | | | | |
Before reimbursement and/or waiver of expenses by Adviser | | | (3.41 | )%(d) | | | (4.23 | )% | | | (5.87 | )% | | | (9.48 | )% | | | (9.64 | )%(d) |
After reimbursement and/or waiver of expenses by Adviser | | | 0.69 | %(d) | | | 0.43 | % | | | 0.37 | % | | | 0.30 | % | | | 0.16 | %(d) |
Portfolio Turnover | | | 19.11 | %(c) | | | 36.96 | % | | | 39.23 | % | | | 65.55 | % | | | 50.79 | %(c) |
| (a) | Cardinal Mid Cap Value Fund began issuing Class N shares on November 1, 2007. |
| (b) | The total return is calculated using the Net Asset Values used for trading at the close of business at period end. |
| | | | |
See accompanying Notes to Financial Statements. | | | | |
| | | 93 | |
| | | | |
| | | | |
Aston Funds | | | | |
ASTON/Veredus Small Cap Growth Fund – Class N (formerly the ASTON/Veredus Aggressive Growth Fund) | | | April 30, 2012 | |
Financial Highlights | | | | |
| | | | | | | | | | | | | | | | | | | | | | | | |
| | | Six Months | | | | | | | | | | | | | | | | |
| | | Ended | | | Year | | | Year | | | Year | | | Year | | | Year | |
| | | 04/30/12 | | | Ended | | | Ended | | | Ended | | | Ended | | | Ended | |
| | | (unaudited) | | | 10/31/11 | | | 10/31/10 | | | 10/31/09 | | | 10/31/08 | | | 10/31/07 | |
Net Asset Value, Beginning of Period | | $ | 12.36 | | | $ | 11.80 | | | $ | 8.97 | | | $ | 8.38 | | | $ | 22.42 | | | $ | 18.44 | |
| | | | | | | | | | | | | | | | | | | | | | | | |
Income from Investment Operations: | | | | | | | | | | | | | | | | | | | | | | | | |
Net investment loss | | | (0.07 | )(a) | | | (0.14 | )(a) | | | (0.14 | )(a) | | | (0.10 | ) | | | (0.17 | ) | | | (0.24 | )(a) |
Net realized and unrealized
gain (loss) on investments | | | 0.94 | | | | 0.70 | | | | 2.97 | | | | 0.74 | | | | (8.31 | ) | | | 5.45 | |
| | | | | | | | | | | | | | | | | | | | | | | | |
Total from investment operations | | | 0.87 | | | | 0.56 | | | | 2.83 | | | | 0.64 | | | | (8.48 | ) | | | 5.21 | |
| | | | | | | | | | | | | | | | | | | | | | | | |
Less Distributions: | | | | | | | | | | | | | | | | | | | | | | | | |
Distributions from net realized gain on investments | | | — | | | | — | | | | — | | | | (0.05 | ) | | | (5.56 | ) | | | (1.23 | ) |
| | | | | | | | | | | | | | | | | | | | | | | | |
Total distributions | | | — | | | | — | | | | — | | | | (0.05 | ) | | | (5.56 | ) | | | (1.23 | ) |
| | | | | | | | | | | | | | | | | | | | | | | | |
Net increase (decrease) in net asset value | | | 0.87 | | | | 0.56 | | | | 2.83 | | | | 0.59 | | | | (14.04 | ) | | | 3.98 | |
| | | | | | | | | | | | | | | | | | | | | | | | |
Net Asset Value, End of Period | | $ | 13.23 | | | $ | 12.36 | | | $ | 11.80 | | | $ | 8.97 | | | $ | 8.38 | | | $ | 22.42 | |
| | | | | | | | | | | | | | | | | | | | | | | | |
Total Return (b) | | | 7.12 | %(c) | | | 4.75 | % | | | 31.55 | % | | | 7.79 | % | | | (47.87 | )% | | | 30.01 | % |
| | | | | | |
Ratios/Supplemental Data: | | | | | | | | | | | | | | | | | | | | | | | | |
Net Assets, End of Period (in 000’s) | | $ | 24,744 | | | $ | 26,300 | | | $ | 33,594 | | | $ | 32,140 | | | $ | 43,149 | | | $ | 114,803 | |
Ratios of expenses to average net assets: | | | | | | | | | | | | | | | | | | | | | | | | |
Before reimbursement and/or waiver of expenses by Adviser | | | 1.82 | %(d) | | | 1.65 | %(e) | | | 1.63 | % | | | 1.82 | %(e) | | | 1.55 | %(e) | | | 1.48 | %(e) |
After reimbursement and/or waiver of expenses by Adviser | | | 1.49 | %(d) | | | 1.49 | %(e) | | | 1.49 | % | | | 1.49 | %(e) | | | 1.49 | %(e) | | | 1.48 | %(e) |
Ratios of net investment loss to average net assets: | | | | | | | | | | | | | | | | | | | | | | | | |
Before reimbursement and/or waiver of expenses by Adviser | | | (1.38 | )%(d) | | | (1.19 | )% | | | (1.40 | )% | | | (1.48 | )% | | | (1.21 | )% | | | (1.27 | )% |
After reimbursement and/or waiver of expenses by Adviser | | | (1.06 | )%(d) | | | (1.03 | )% | | | (1.27 | )% | | | (1.15 | )% | | | (1.15 | )% | | | (1.27 | )% |
Portfolio Turnover | | | 77.74 | %(c)(f) | | | 197.43 | % | | | 187.83 | % | | | 264.98 | % | | | 166.19 | % | | | 126.54 | % |
| (a) | The selected per share data was calculated using the weighted average shares outstanding method for the period. |
| (b) | The total return is calculated using the Net Asset Values used for trading at the close of business at period end. |
| (e) | Ratios of expenses to average net assets include interest expenses of less than 0.005% for the years ended October 31, 2011, October 31, and October 31, 2008 and 0.02% for the year ended October 31, 2007, which are not included in the contractual expense limitation. The expenses are from utilizing the line of credit as discussed in Note H to Financial Statements. |
| (f) | Portfolio turnover rate excludes securities delivered from processing a redemption-in-kind. |
|
See accompanying Notes to Financial Statements. |
| 94 |
| |
| | | | |
Aston Funds | | | | |
ASTON/Veredus Small Cap Growth Fund – Class I (formerly the ASTON/Veredus Aggressive Growth Fund) | | | April 30, 2012 | |
Financial Highlights | | | | |
| | | | | | | | | | | | | | | | | | | | | | | | |
| | | Six Months | | | | | | | | | | | | | | | | |
| | | Ended | | | Year | | | Year | | | Year | | | Year | | | Year | |
| | | 04/30/12 | | | Ended | | | Ended | | | Ended | | | Ended | | | Ended | |
| | | (unaudited) | | | 10/31/11 | | | 10/31/10 | | | 10/31/09 | | | 10/31/08 | | | 10/31/07 | |
Net Asset Value, Beginning of Period | | $ | 12.80 | | | $ | 12.19 | | | $ | 9.25 | | | $ | 8.61 | | | $ | 22.83 | | | $ | 18.71 | |
| | | | | | | | | | | | | | | | | | | | | | | | |
Income from Investment Operations: | | | | | | | | | | | | | | | | | | | | | | | | |
Net investment loss | | | (0.05 | )(a) | | | (0.11 | )(a) | | | (0.11 | )(a) | | | (0.08 | ) | | | (0.21 | ) | | | (0.19 | )(a) |
Net realized and unrealized
gain (loss) on investments | | | 0.98 | | | | 0.72 | | | | 3.05 | | | | 0.77 | | | | (8.45 | ) | | | 5.54 | |
| | | | | | | | | | | | | | | | | | | | | | | | |
Total from investment operations | | | 0.93 | | | | 0.61 | | | | 2.94 | | | | 0.69 | | | | (8.66 | ) | | | 5.35 | |
| | | | | | | | | | | | | | | | | | | | | | | | |
Less Distributions: | | | | | | | | | | | | | | | | | | | | | | | | |
Distributions from net realized gain on investments | | | — | | | | — | | | | — | | | | (0.05 | ) | | | (5.56 | ) | | | (1.23 | ) |
| | | | | | | | | | | | | | | | | | | | | | | | |
Total distributions | | | — | | | | — | | | | — | | | | (0.05 | ) | | | (5.56 | ) | | | (1.23 | ) |
| | | | | | | | | | | | | | | | | | | | | | | | |
Net increase (decrease) in net asset value | | | 0.93 | | | | 0.61 | | | | 2.94 | | | | 0.64 | | | | (14.22 | ) | | | 4.12 | |
| | | | | | | | | | | | | | | | | | | | | | | | |
Net Asset Value, End of Period | | $ | 13.73 | | | $ | 12.80 | | | $ | 12.19 | | | $ | 9.25 | | | $ | 8.61 | | | $ | 22.83 | |
| | | | | | | | | | | | | | | | | | | | | | | | |
Total Return (b) | | | 7.18 | %(c) | | | 5.09 | % | | | 31.78 | % | | | 8.16 | % | | | (47.77 | )% | | | 30.34 | % |
| | | | | | |
Ratios/Supplemental Data: | | | | | | | | | | | | | | | | | | | | | | | | |
Net Assets, End of Period (in 000’s) | | $ | 2,381 | | | $ | 16,891 | | | $ | 16,190 | | | $ | 13,356 | | | $ | 16,719 | | | $ | 115,942 | |
Ratios of expenses to average net assets: | | | | | | | | | | | | | | | | | | | | | | | | |
Before reimbursement and/or waiver of expenses by Adviser | | | 1.57 | %(d) | | | 1.40 | %(e) | | | 1.38 | % | | | 1.57 | %(e) | | | 1.30 | %(e) | | | 1.19 | %(e) |
After reimbursement and/or waiver of expenses by Adviser | | | 1.24 | %(d) | | | 1.24 | %(e) | | | 1.24 | % | | | 1.24 | %(e) | | | 1.24 | %(e) | | | 1.19 | %(e) |
Ratios of net investment loss to average net assets: | | | | | | | | | | | | | | | | | | | | | | | | |
Before reimbursement and/or waiver of expenses by Adviser | | | (1.13 | )%(d) | | | (0.94 | )% | | | (1.15 | )% | | | (1.23 | )% | | | (0.96 | )% | | | (0.98 | )% |
After reimbursement and/or waiver of expenses by Adviser | | | (0.81 | )%(d) | | | (0.78 | )% | | | (1.02 | )% | | | (0.90 | )% | | | (0.90 | )% | | | (0.98 | )% |
Portfolio Turnover | | | 77.74 | %(c)(f) | | | 197.43 | % | | | 187.83 | % | | | 264.98 | % | | | 166.19 | % | | | 126.54 | % |
| (a) | The selected per share data was calculated using the weighted average shares outstanding method for the period. |
| (b) | The total return is calculated using the Net Asset Values used for trading at the close of business at period end. |
| (e) | Ratios of expenses to average net assets include interest expenses of less than 0.005% for the years ended October 31, 2011, October 31, 2009 and October 31, 2008 and 0.02% for the year ended October 31, 2007, which are not included in the contractual expense limitation. The interest expenses are from utilizing the line of credit as discussed in Note H to Financial Statements. |
| (f) | Portfolio turnover rate excludes securities delivered from processing a redemption-in-kind. |
| | | | |
See accompanying Notes to Financial Statements. | | | | |
| | | 95 | |
| | | | |
| | | | |
Aston Funds | | | | |
ASTON Small Cap Growth Fund – Class N (formerly the ASTON/Crosswind Small Cap Growth Fund) | | | April 30, 2012 | |
Financial Highlights | | | | |
| | | | | | | | |
| | | Six Months | | | | |
| | | Ended | | | Period | |
| | | 04/30/12 | | | Ended | |
| | | (unaudited) | | | 10/31/11 (a) | |
Net Asset Value, Beginning of Period | | $ | 9.95 | | | $ | 10.00 | |
| | | | | | | | |
Income from Investment Operations: | | | | | | | | |
Net investment loss | | | (0.06 | ) | | | (0.04 | ) |
Net realized and unrealized gain (loss) on investments | | | 1.23 | | | | (0.01 | ) |
| | | | | | | | |
Total from investment operations | | | 1.17 | | | | (0.05 | ) |
| | | | | | | | |
Less Distributions: | | | | | | | | |
Distributions from and in excess of net investment income | | | — | | | | — | |
| | | | | | | | |
Total distributions | | | — | | | | — | |
| | | | | | | | |
Net increase (decrease) in net asset value | | | 1.17 | | | | (0.05 | ) |
| | | | | | | | |
Net Asset Value, End of Period | | $ | 11.12 | | | $ | 9.95 | |
| | | | | | | | |
Total Return (b) | | | 11.76 | %(c) | | | (0.50 | )%(c) |
| | |
Ratios/Supplemental Data: | | | | | | | | |
Net Assets, End of Period (in 000’s) | | $ | 5,957 | | | $ | 5,411 | |
Ratios of expenses to average net assets: | | | | | | | | |
Before reimbursement and/or waiver of expenses by Adviser | | | 2.81 | %(d) | | | 8.27 | %(d) |
After reimbursement and/or waiver of expenses by Adviser | | | 1.35 | %(d) | | | 1.35 | %(d) |
Ratios of net investment loss to average net assets: | | | | | | | | |
Before reimbursement and/or waiver of expenses by Adviser | | | (2.68 | )%(d) | | | (8.14 | )%(d) |
After reimbursement and/or waiver of expenses by Adviser | | | (1.22 | )%(d) | | | (1.21 | )%(d) |
Portfolio Turnover | | | 76.00 | %(c) | | | 205.85 | %(c) |
| (a) | Small Cap Growth Fund began issuing Class N shares on November 2, 2010. |
| (b) | The total return is calculated using the Net Asset Values used for trading at the close of business at period end. |
|
See accompanying Notes to Financial Statements. |
| 96 |
| |
| | | | |
Aston Funds | | | | |
ASTON Small Cap Growth Fund – Class I (formerly the ASTON/Crosswind Small Cap Growth Fund) | | | April 30, 2012 | |
Financial Highlights | | | | |
| | | | | | | | |
| | | Six Months | | | | |
| | | Ended | | | Period | |
| | | 04/30/12 | | | Ended | |
| | | (unaudited) | | | 10/31/11 (a) | |
Net Asset Value, Beginning of Period | | $ | 9.97 | | | $ | 12.40 | |
| | | | | | | | |
Income from Investment Operations: | | | | | | | | |
Net investment loss | | | (0.05 | ) | | | (0.04 | ) |
Net realized and unrealized gain (loss) on investments | | | 1.22 | | | | (2.39 | ) |
| | | | | | | | |
Total from investment operations | | | 1.17 | | | | (2.43 | ) |
| | | | | | | | |
Less Distributions: | | | | | | | | |
Distributions from and in excess of net investment income | | | — | | | | — | |
| | | | | | | | |
Total distributions | | | — | | | | — | |
| | | | | | | | |
Net increase (decrease) in net asset value | | | 1.17 | | | | (2.43 | ) |
| | | | | | | | |
Net Asset Value, End of Period | | $ | 11.14 | | | $ | 9.97 | |
| | | | | | | | |
Total Return (b) | | | 11.84 | %(c) | | | (19.60 | )%(c) |
| | |
Ratios/Supplemental Data: | | | | | | | | |
Net Assets, End of Period (in 000’s) | | $ | 2,852 | | | $ | 2,551 | |
Ratios of expenses to average net assets: | | | | | | | | |
Before reimbursement and/or waiver of expenses by Adviser | | | 2.56 | %(d) | | | 6.25 | %(d) |
After reimbursement and/or waiver of expenses by Adviser | | | 1.10 | %(d) | | | 1.10 | %(d) |
Ratios of net investment loss to average net assets: | | | | | | | | |
Before reimbursement and/or waiver of expenses by Adviser | | | (2.43 | )%(d) | | | (6.11 | )%(d) |
After reimbursement and/or waiver of expenses by Adviser | | | (0.97 | )%(d) | | | (0.96 | )%(d) |
Portfolio Turnover | | | 76.00 | %(c) | | | 205.85 | %(c) |
| (a) | Small Cap Growth Fund began issuing Class I shares on May 31, 2011. |
| (b) | The total return is calculated using the Net Asset Values used for trading at the close of business at period end. |
| | | | |
See accompanying Notes to Financial Statements. | | | | |
| | | 97 | |
| | | | |
| | | | |
Aston Funds | | | | |
ASTON/Silvercrest Small Cap Fund – Class N | | | April 30, 2012 | |
Financial Highlights | | | | |
| | | | |
| | | Period | |
| | | Ended | |
| | | 04/30/12(a) | |
| | | (unaudited) | |
Net Asset Value, Beginning of Period | | $ | 10.00 | |
| | | | |
Income from Investment Operations: | | | | |
Net investment income | | | 0.01 | |
Net realized and unrealized gain on investments | | | 1.00 | |
| | | | |
Total from investment operations | | | 1.01 | |
| | | | |
Less Distributions: | | | | |
Distributions from and in excess of net investment income | | | — | |
| | | | |
Total distributions | | | — | |
| | | | |
Net increase in net asset value | | | 1.01 | |
| | | | |
Net Asset Value, End of Period | | $ | 11.01 | |
| | | | |
Total Return (b) | | | 10.10 | %(c) |
| |
Ratios/Supplemental Data: | | | | |
Net Assets, End of Period (in 000’s) | | $ | 565 | |
Ratios of expenses to average net assets: | | | | |
Before reimbursement and/or waiver of expenses by Adviser | | | 5.36 | %(c) |
After reimbursement and/or waiver of expenses by Adviser | | | 1.40 | %(d) |
Ratios of net investment income (loss) to average net assets: | | | | |
Before reimbursement and/or waiver of expenses by Adviser | | | (3.75 | )%(d) |
After reimbursement and/or waiver of expenses by Adviser | | | 0.21 | %(d) |
Portfolio Turnover | | | 134.55 | %(c)(e) |
| (a) | Silvercrest Small Cap Fund began issuing Class N shares on December 23, 2011. |
| (b) | The total return is calculated using the Net Asset Values used for trading at the close of business at period end. |
| (e) | Portfolio turnover rate excludes securities delivered from processing a redemption-in-kind. |
|
See accompanying Notes to Financial Statements. |
| 98 |
| |
| | | | |
Aston Funds | | | | |
ASTON/Silvercrest Small Cap Fund – Class I | | | April 30, 2012 | |
Financial Highlights | | | | |
| | | | |
| | | Period | |
| | | Ended | |
| | | 04/30/12(a) | |
| | | (unaudited) | |
Net Asset Value, Beginning of Period | | $ | 10.00 | |
| | | | |
Income from Investment Operations: | | | | |
Net investment income | | | 0.02 | |
Net realized and unrealized gain on investments | | | 1.00 | |
| | | | |
Total from investment operations | | | 1.02 | |
| | | | |
Less Distributions: | | | | |
Distributions from and in excess of net investment income | | | — | |
| | | | |
Total distributions | | | — | |
| | | | |
Net increase in net asset value | | | 1.02 | |
| | | | |
Net Asset Value, End of Period | | $ | 11.02 | |
| | | | |
Total Return (b) | | | 10.20 | %(c) |
| |
Ratios/Supplemental Data: | | | | |
Net Assets, End of Period (in 000’s) | | $ | 3,364 | |
Ratios of expenses to average net assets: | | | | |
Before reimbursement and/or waiver of expenses by Adviser | | | 5.11 | %(d) |
After reimbursement and/or waiver of expenses by Adviser | | | 1.15 | %(d) |
Ratios of net investment income (loss) to average net assets: | | | | |
Before reimbursement and/or waiver of expenses by Adviser | | | (3.51 | )%(d) |
After reimbursement and/or waiver of expenses by Adviser | | | 0.45 | %(d) |
Portfolio Turnover | | | 134.55 | %(c)(e) |
| (a) | Silvercrest Small Cap Fund began issuing Class I shares on December 23, 2011. |
| (b) | The total return is calculated using the Net Asset Values used for trading at the close of business at period end. |
| (e) | Portfolio turnover rate excludes securities delivered from processing a redemption-in-kind. |
| | | | |
See accompanying Notes to Financial Statements. | | | | |
| | | 99 | |
| | | | |
| | | | |
Aston Funds | | | | |
ASTON/TAMRO Small Cap Fund – Class N | | | April 30, 2012 | |
Financial Highlights | | | | |
| | | | | | | | | | | | | | | | | | | | | | | | |
| | | Six Months | | | | | | | | | | | | | | | | |
| | | Ended | | | Year | | | Year | | | Year | | | Year | | | Year | |
| | | 04/30/12 | | | Ended | | | Ended | | | Ended | | | Ended | | | Ended | |
| | | (unaudited) | | | 10/31/11 | | | 10/31/10 | | | 10/31/09 | | | 10/31/08 | | | 10/31/07 | |
Net Asset Value, Beginning of Period | | $ | 20.57 | | | $ | 19.42 | | | $ | 14.67 | | | $ | 13.64 | | | $ | 20.99 | | | $ | 19.73 | |
| | | | | | | | | | | | | | | | | | | | | | | | |
Income from Investment Operations: | | | | | | | | | | | | | | | | | | | | | | | | |
Net investment income (loss) | | | (0.07 | ) | | | (0.15 | )(a) | | | (0.08 | )(a) | | | (0.05 | )(a) | | | 0.05 | | | | (0.08 | )(a) |
Net realized and unrealized gain (loss)on investments | | | 2.04 | | | | 1.75 | | | | 4.83 | | | | 1.08 | | | | (6.43 | ) | | | 2.48 | |
| | | | | | | | | | | | | | | | | | | | | | | | |
Total from investment operations | | | 1.97 | | | | 1.60 | | | | 4.75 | | | | 1.03 | | | | (6.38 | ) | | | 2.40 | |
| | | | | | | | | | | | | | | | | | | | | | | | |
Less Distributions: | | | | | | | | | | | | | | | | | | | | | | | | |
Distributions from net realized gain on investments | | | (2.02 | ) | | | (0.45 | ) | | | — | | | | — | | | | (0.97 | ) | | | (1.14 | ) |
| | | | | | | | | | | | | | | | | | | | | | | | |
Total distributions | | | (2.02 | ) | | | (0.45 | ) | | | — | | | | — | | | | (0.97 | ) | | | (1.14 | ) |
| | | | | | | | | | | | | | | | | | | | | | | | |
Net increase (decrease) in net asset value | | | (0.05 | ) | | | 1.15 | | | | 4.75 | | | | 1.03 | | | | (7.35 | ) | | | 1.26 | |
| | | | | | | | | | | | | | | | | | | | | | | | |
Net Asset Value, End of Period | | $ | 20.52 | | | $ | 20.57 | | | $ | 19.42 | | | $ | 14.67 | | | $ | 13.64 | | | $ | 20.99 | |
| | | | | | | | | | | | | | | | | | | | | | | | |
Total Return (b) | | | 10.70 | %(c) | | | 8.16 | % | | | 32.29 | % | | | 7.63 | % | | | (31.58 | )% | | | 12.56 | % |
| | | | | | |
Ratios/Supplemental Data: | | | | | | | | | | | | | | | | | | | | | | | | |
Net Assets, End of Period (in 000’s) | | $ | 392,595 | | | $ | 375,969 | | | $ | 335,809 | | | $ | 241,524 | | | $ | 159,965 | | | $ | 235,242 | |
Ratios of expenses to average net assets: | | | | | | | | | | | | | | | | | | | | | | | | |
Before reimbursement and/or waiver of expenses by Adviser | | | 1.29 | %(d)(e) | | | 1.29 | % | | | 1.34 | % | | | 1.37 | % | | | 1.32 | % | | | 1.33 | %(e) |
After reimbursement and/or waiver of expenses by Adviser | | | 1.29 | %(d)(e) | | | 1.29 | % | | | 1.34 | % | | | 1.36 | %(f) | | | 1.30 | % | | | 1.30 | %(e) |
Ratios of net investment income (loss)to average net assets: | | | | | | | | | | | | | | | | | | | | | | | | |
Before reimbursement and/or waiver of expenses by Adviser | | | (0.67 | )%(d) | | | (0.69 | )% | | | (0.49 | )% | | | (0.41 | )% | | | 0.29 | % | | | (0.42 | )% |
After reimbursement and/or waiver of expenses by Adviser | | | (0.67 | )%(d) | | | (0.69 | )% | | | (0.49 | )% | | | (0.40 | )% | | | 0.31 | % | | | (0.39 | )% |
Portfolio Turnover | | | 19.47 | %(c) | | | 47.25 | % | | | 62.13 | % | | | 89.92 | % | | | 66.65 | % | | | 58.88 | % |
| (a) | The selected per share data was calculated using the weighted average shares outstanding method for the period. |
| (b) | The total return is calculated using the Net Asset Values used for trading at the close of business at period end. |
| (e) | Ratios of expenses to average net assets include interest expenses of less than 0.005% for the six months ended April 30, 2012 and the year ended October 31, 2007, which are not included in the contractual expense limitation. The interest expenses are from utilizing the line of credit as discussed in Note H to Financial Statements. |
| (f) | The Adviser removed the contractual expense limitation of 1.30%, excluding interest, brokerage commissions, other investment related costs, extraordinary expenses and acquired fund fees and expenses, effective March 1, 2009. |
|
See accompanying Notes to Financial Statements. |
| 100 |
| |
| | | | |
Aston Funds | | | | |
ASTON/TAMRO Small Cap Fund – Class I | | | April 30, 2012 | |
Financial Highlights | | | | |
| | | | | | | | | | | | | | | | | | | | | | | | |
| | | Six Months | | | | | | | | | | | | | | | | |
| | | Ended | | | Year | | | Year | | | Year | | | Year | | | Year | |
| | | 04/30/12 | | | Ended | | | Ended | | | Ended | | | Ended | | | Ended | |
| | | (unaudited) | | | 10/31/11 | | | 10/31/10 | | | 10/31/09 | | | 10/31/08 | | | 10/31/07 | |
Net Asset Value, Beginning of Period | | $ | 20.91 | | | $ | 19.69 | | | $ | 14.87 | | | $ | 13.79 | | | $ | 21.16 | | | $ | 19.83 | |
| | | | | | | | | | | | | | | | | | | | | | | | |
Income from Investment Operations: | | | | | | | | | | | | | | | | | | | | | | | | |
Net investment income (loss) | | | (0.04 | ) | | | (0.09 | )(a) | | | (0.04 | )(a) | | | (0.02 | )(a) | | | 0.02 | | | | (0.02 | )(a) |
Net realized and unrealized gain (loss)on investments | | | 2.08 | | | | 1.76 | | | | 4.87 | | | | 1.12 | | | | (6.42 | ) | | | 2.49 | |
| | | | | | | | | | | | | | | | | | | | | | | | |
Total from investment operations | | | 2.04 | | | | 1.67 | | | | 4.83 | | | | 1.10 | | | | (6.40 | ) | | | 2.47 | |
| | | | | | | | | | | | | | | | | | | | | | | | |
Less Distributions: | | | | | | | | | | | | | | | | | | | | | | | | |
Distributions from and in excess of net investment income | | | — | | | | — | | | | (0.01 | ) | | | (0.02 | ) | | | — | | | | — | |
Distributions from net realized gain on investments | | | (2.02 | ) | | | (0.45 | ) | | | — | | | | — | | | | (0.97 | ) | | | (1.14 | ) |
| | | | | | | | | | | | | | | | | | | | | | | | |
Total distributions | | | (2.02 | ) | | | (0.45 | ) | | | (0.01 | ) | | | (0.02 | ) | | | (0.97 | ) | | | (1.14 | ) |
| | | | | | | | | | | | | | | | | | | | | | | | |
Net increase (decrease) in net asset value | | | 0.02 | | | | 1.22 | | | | 4.82 | | | | 1.08 | | | | (7.37 | ) | | | 1.33 | |
| | | | | | | | | | | | | | | | | | | | | | | | |
Net Asset Value, End of Period | | $ | 20.93 | | | $ | 20.91 | | | $ | 19.69 | | | $ | 14.87 | | | $ | 13.79 | | | $ | 21.16 | |
| | | | | | | | | | | | | | | | | | | | | | | | |
Total Return (b) | | | 10.88 | %(c) | | | 8.40 | % | | | 32.62 | % | | | 7.94 | % | | | (31.42 | )% | | | 12.86 | % |
| | | | | | |
Ratios/Supplemental Data: | | | | | | | | | | | | | | | | | | | | | | | | |
Net Assets, End of Period (in 000’s) | | $ | 679,446 | | | $ | 625,315 | | | $ | 549,627 | | | $ | 515,592 | | | $ | 238,399 | | | $ | 137,059 | |
Ratios of expenses to average net assets: | | | | | | | | | | | | | | | | | | | | | | | | |
Before reimbursement and/or waiver of expenses by Adviser | | | 1.04 | %(d)(e) | | | 1.04 | % | | | 1.09 | % | | | 1.12 | % | | | 1.07 | % | | | 1.05 | %(e) |
After reimbursement and/or waiver of expenses by Adviser | | | 1.04 | %(d)(e) | | | 1.04 | % | | | 1.09 | % | | | 1.11 | %(f) | | | 1.05 | % | | | 1.02 | %(e) |
Ratios of net investment income (loss) to average net assets: | | | | | | | | | | | | | | | | | | | | | | | | |
Before reimbursement and/or waiver of expenses by Adviser | | | (0.42 | )%(d) | | | (0.44 | )% | | | (0.24 | )% | | | (0.16 | )% | | | 0.54 | % | | | (0.14 | )% |
After reimbursement and/or waiver of expenses by Adviser | | | (0.42 | )%(d) | | | (0.44 | )% | | | (0.24 | )% | | | (0.15 | )% | | | 0.56 | % | | | (0.11 | )% |
Portfolio Turnover | | | 19.47 | %(c) | | | 47.25 | % | | | 62.13 | % | | | 89.92 | % | | | 66.65 | % | | | 58.88 | % |
| (a) | The selected per share data was calculated using the weighted average shares outstanding method for the period. |
| (b) | The total return is calculated using the Net Asset Values used for trading at the close of business at period end. |
| (e) | Ratios of expenses to average net assets include interest expenses of less than 0.005% for the six months ended April 30, 2012 and the year ended October 31, 2007, which are not included in the contractual expense limitation. The interest expenses are from utilizing the line of credit as discussed in Note H to Financial Statements. |
| (f) | The Adviser removed the contractual expense limitation of 1.05%, excluding interest, brokerage commissions, other investment related costs, extraordinary expenses and acquired fund fees and expenses, effective March 1, 2009. |
| | | | |
See accompanying Notes to Financial Statements. | | | | |
| | | 101 | |
| | | | |
| | | | |
Aston Funds | | | | |
ASTON/River Road Select Value Fund – Class N | | | April 30, 2012 | |
Financial Highlights | | | | |
| | | | | | | | | | | | | | | | | | | | | | | | |
| | | Six Months | | | | | | | | | | | | | | | | |
| | | Ended | | | Year | | | Year | | | Year | | | Year | | | Period | |
| | | 04/30/12 | | | Ended | | | Ended | | | Ended | | | Ended | | | Ended | |
| | | (unaudited) | | | 10/31/11 | | | 10/31/10 | | | 10/31/09 | | | 10/31/08 | | | 10/31/07(a) | |
Net Asset Value, Beginning of Period | | $ | 9.54 | | | $ | 9.01 | | | $ | 7.71 | | | $ | 7.13 | | | $ | 10.13 | | | $ | 10.00 | |
| | | | | | | | | | | | | | | | | | | | | | | | |
Income from Investment Operations: | | | | | | | | | | | | | | | | | | | | | | | | |
Net investment income (loss) | | | 0.01 | (b) | | | (0.02 | )(b) | | | 0.02 | (b) | | | — | (b)(c) | | | — | (b)(c) | | | 0.01 | |
Net realized and unrealized gain (loss)on investments | | | 0.79 | | | | 0.66 | | | | 1.28 | | | | 0.59 | | | | (3.00 | ) | | | 0.12 | |
| | | | | | | | | | | | | | | | | | | | | | | | |
Total from investment operations | | | 0.80 | | | | 0.64 | | | | 1.30 | | | | 0.59 | | | | (3.00 | ) | | | 0.13 | |
| | | | | | | | | | | | | | | | | | | | | | | | |
Less Distributions: | | | | | | | | | | | | | | | | | | | | | | | | |
Distributions from net investment income | | | — | | | | (0.03 | ) | | | — | | | | (0.01 | ) | | | — | | | | — | |
Distributions from net realized gains on investments | | | (2.06 | ) | | | (0.08 | ) | | | — | | | | — | | | | — | | | | — | |
| | | | | | | | | | | | | | | | | | | | | | | | |
Total distributions | | | (2.06 | ) | | | (0.11 | ) | | | — | | | | (0.01 | ) | | | — | | | | — | |
| | | | | | | | | | | | | | | | | | | | | | | | |
Net increase (decrease) in net asset value | | | (1.26 | ) | | | 0.53 | | | | 1.30 | | | | 0.58 | | | | (3.00 | ) | | | 0.13 | |
| | | | | | | | | | | | | | | | | | | | | | | | |
Net Asset Value, End of Period | | $ | 8.28 | | | $ | 9.54 | | | $ | 9.01 | | | $ | 7.71 | | | $ | 7.13 | | | $ | 10.13 | |
| | | | | | | | | | | | | | | | | | | | | | | | |
Total Return (d) | | | 9.94 | %(e) | | | 7.12 | % | | | 16.86 | % | | | 8.33 | % | | | (29.62 | )% | | | 1.30 | %(e) |
| | | | | | |
Ratios/Supplemental Data: | | | | | | | | | | | | | | | | | | | | | | | | |
Net Assets, End of Period (in 000’s) | | $ | 7,193 | | | $ | 13,160 | | | $ | 52,522 | | | $ | 41,801 | | | $ | 26,714 | | | $ | 10,292 | |
Ratios of expenses to average net assets: | | | | | | | | | | | | | | | | | | | | | | | | |
Before recoupment and/or waiver of expenses by Adviser | | | 1.45 | %(f)(g) | | | 1.42 | %(g) | | | 1.41 | %(g) | | | 1.44 | % | | | 1.56 | % | | | 3.18 | %(f) |
After recoupment and/or waiver of expenses by Adviser | | | 1.45 | %(f)(g) | | | 1.42 | %(g) | | | 1.43 | %(g) | | | 1.50 | % | | | 1.50 | % | | | 1.50 | %(f) |
Ratios of net investment income (loss) to average net assets: | | | | | | | | | | | | | | | | | | | | | | | | |
Before recoupment and/or waiver of expenses by Adviser | | | 0.31 | %(f) | | | (0.18 | )% | | | 0.31 | % | | | 0.04 | % | | | (0.08 | )% | | | (1.43 | )%(f) |
After recoupment and/or waiver of expenses by Adviser | | | 0.31 | %(f) | | | (0.18 | )% | | | 0.29 | % | | | (0.02 | )% | | | (0.02 | )% | | | 0.25 | %(f) |
Portfolio Turnover | | | 19.71 | %(e) | | | 48.22 | % | | | 53.73 | % | | | 44.09 | % | | | 54.93 | % | | | 41.51 | %(e) |
| (a) | River Road Select Value Fund began issuing Class N shares on March 28, 2007. |
| (b) | The selected per share data was calculated using the weighted average shares outstanding method for the period. |
| (c) | Represents less than $(0.005) per share. |
| (d) | The total return is calculated using the Net Asset Values used for trading at the close of business at period end. |
| (g) | Ratios of expenses to average net assets include interest expenses of less than 0.005% for the six months ended April 30, 2012 and the years ended October 31, 2011 and October 31, 2010, which are not included in the contractual expense limitation. The interest expenses are from utilizing the line of credit as discussed in Note H to Financial Statements. |
|
See accompanying Notes to Financial Statements. |
| 102 |
| |
| | | | |
Aston Funds | | | | |
ASTON/River Road Select Value Fund – Class I | | | April 30, 2012 | |
Financial Highlights | | | | |
| | | | | | | | | | | | | | | | | | | | | | | | |
| | | Six Months | | | | | | | | | | | | | | | | |
| | | Ended | | | Year | | | Year | | | Year | | | Year | | | Period | |
| | | 04/30/12 | | | Ended | | | Ended | | | Ended | | | Ended | | | Ended | |
| | | (unaudited) | | | 10/31/11 | | | 10/31/10 | | | 10/31/09 | | | 10/31/08 | | | 10/31/07(a) | |
Net Asset Value, Beginning of Period | | $ | 9.59 | | | $ | 9.04 | | | $ | 7.73 | | | $ | 7.14 | | | $ | 10.13 | | | $ | 10.51 | |
| | | | | | | | | | | | | | | | | | | | | | | | |
Income from Investment Operations: | | | | | | | | | | | | | | | | | | | | | | | | |
Net investment income | | | 0.02 | (b) | | | 0.01 | (b) | | | 0.05 | (b) | | | 0.02 | (b) | | | 0.02 | (b) | | | 0.01 | |
Net realized and unrealized gain (loss) on investments | | | 0.80 | | | | 0.67 | | | | 1.28 | | | | 0.59 | | | | (3.00 | ) | | | (0.39 | ) |
| | | | | | | | | | | | | | | | | | | | | | | | |
Total from investment operations | | | 0.82 | | | | 0.68 | | | | 1.33 | | | | 0.61 | | | | (2.98 | ) | | | (0.38 | ) |
| | | | | | | | | | | | | | | | | | | | | | | | |
Less Distributions: | | | | | | | | | | | | | | | | | | | | | | | | |
Distributions from net investment income | | | — | | | | (0.05 | ) | | | (0.02 | ) | | | (0.02 | ) | | | (0.01 | ) | | | — | |
Distributions from net realized gains on investments | | | (2.06 | ) | | | (0.08 | ) | | | — | | | | — | | | | — | | | | — | |
| | | | | | | | | | | | | | | | | | | | | | | | |
Total distributions | | | (2.06 | ) | | | (0.13 | ) | | | (0.02 | ) | | | (0.02 | ) | | | (0.01 | ) | | | — | |
| | | | | | | | | | | | | | | | | | | | | | | | |
Net increase (decrease) in net asset value | | | (1.24 | ) | | | 0.55 | | | | 1.31 | | | | 0.59 | | | | (2.99 | ) | | | (0.38 | ) |
| | | | | | | | | | | | | | | | | | | | | | | | |
Net Asset Value, End of Period | | $ | 8.35 | | | $ | 9.59 | | | $ | 9.04 | | | $ | 7.73 | | | $ | 7.14 | | | $ | 10.13 | |
| | | | | | | | | | | | | | | | | | | | | | | | |
Total Return (c) | | | 10.14 | %(d) | | | 7.56 | % | | | 17.19 | % | | | 8.52 | % | | | (29.49 | )% | | | (3.52 | )%(d) |
| | | | | | |
Ratios/Supplemental Data: | | | | | | | | | | | | | | | | | | | | | | | | |
Net Assets, End of Period (in 000’s) | | $ | 141,387 | | | $ | 130,527 | | | $ | 163,232 | | | $ | 167,334 | | | $ | 84,002 | | | $ | 7,482 | |
Ratios of expenses to average net assets: | | | | | | | | | | | | | | | | | | | | | | | | |
Before recoupment and/or waiver of expenses by Adviser | | | 1.20 | %(e)(f) | | | 1.17 | %(f) | | | 1.16 | %(f) | | | 1.19 | % | | | 1.31 | % | | | 2.57 | %(e) |
After recoupment and/or waiver of expenses by Adviser | | | 1.20 | %(e)(f) | | | 1.17 | %(f) | | | 1.18 | %(f) | | | 1.25 | % | | | 1.25 | % | | | 1.24 | %(e) |
Ratios of net investment income (loss) to average net assets: | | | | | | | | | | | | | | | | | | | | | | | | |
Before recoupment and/or waiver of expenses by Adviser | | | 0.56 | %(e) | | | 0.07 | % | | | 0.56 | % | | | 0.29 | % | | | 0.17 | % | | | (0.91 | )%(e) |
After recoupment and/or waiver of expenses by Adviser | | | 0.56 | %(e) | | | 0.07 | % | | | 0.54 | % | | | 0.23 | % | | | 0.23 | % | | | 0.42 | %(e) |
Portfolio Turnover | | | 19.71 | %(d) | | | 48.22 | % | | | 53.73 | % | | | 44.09 | % | | | 54.93 | % | | | 41.51 | %(d) |
| (a) | River Road Select Value Fund began issuing Class I shares on June 27, 2007. |
| (b) | The selected per share data was calculated using the weighted average shares outstanding method for the period. |
| (c) | The total return is calculated using the Net Asset Values used for trading at the close of business at period end. |
| (f) | Ratios of expenses to average net assets include interest expenses of less than 0.005% for the six months ended April 30, 2012 and the years ended October 31, 2011 and October 31, 2010, which are not included in the contractual expense limitation. The interest expenses are from utilizing the line of credit as discussed in Note H to Financial Statements. |
| | | | |
See accompanying Notes to Financial Statements. | | | | |
| | | 103 | |
| | | | |
| | | | |
Aston Funds | | | | |
ASTON/River Road Small Cap Value Fund – Class N | | | April 30, 2012 | |
Financial Highlights | | | | |
| | | | | | | | | | | | | | | | | | | | | | | | |
| | | Six Months | | | | | | | | | | | | | | | | |
| | | Ended | | | Year | | | Year | | | Year | | | Year | | | Year | |
| | | 04/30/12 | | | Ended | | | Ended | | | Ended | | | Ended | | | Ended | |
| | | (unaudited) | | | 10/31/11 | | | 10/31/10 | | | 10/31/09 | | | 10/31/08 | | | 10/31/07 | |
Net Asset Value, Beginning of Period | | $ | 12.20 | | | $ | 11.60 | | | $ | 10.22 | | | $ | 9.30 | | | $ | 14.37 | | | $ | 13.46 | |
| | | | | | | | | | | | | | | | | | | | | | | | |
Income from Investment Operations: | | | | | | | | | | | | | | | | | | | | | | | | |
Net investment income (loss) | | | 0.02 | (a) | | | (0.03 | ) | | | 0.03 | | | | 0.01 | | | | 0.01 | (a) | | | 0.05 | (a) |
Net realized and unrealized gain (loss)on investments | | | 1.08 | | | | 0.67 | | | | 1.36 | | | | 0.92 | | | | (4.54 | ) | | | 1.04 | |
| | | | | | | | | | | | | | | | | | | | | | | | |
Total from investment operations | | | 1.10 | | | | 0.64 | | | | 1.39 | | | | 0.93 | | | | (4.53 | ) | | | 1.09 | |
| | | | | | | | | | | | | | | | | | | | | | | | |
Less Distributions: | | | | | | | | | | | | | | | | | | | | | | | | |
Distributions from and in excess of net investment income | | | — | | | | (0.04 | ) | | | (0.01 | ) | | | (0.01 | ) | | | — | | | | (0.05 | ) |
Distributions from net realized gain on investments | | | — | | | | — | | | | — | | | | — | | | | (0.54 | ) | | | (0.13 | ) |
| | | | | | | | | | | | | | | | | | | | | | | | |
Total distributions | | | — | | | | (0.04 | ) | | | (0.01 | ) | | | (0.01 | ) | | | (0.54 | ) | | | (0.18 | ) |
| | | | | | | | | | | | | | | | | | | | | | | | |
Net increase (decrease) in net asset value | | | 1.10 | | | | 0.60 | | | | 1.38 | | | | 0.92 | | | | (5.07 | ) | | | 0.91 | |
| | | | | | | | | | | | | | | | | | | | | | | | |
Net Asset Value, End of Period | | $ | 13.30 | | | $ | 12.20 | | | $ | 11.60 | | | $ | 10.22 | | | $ | 9.30 | | | $ | 14.37 | |
| | | | | | | | | | | | | | | | | | | | | | | | |
Total Return (b) | | | 9.02 | %(c) | | | 5.46 | % | | | 13.60 | % | | | 9.99 | % | | | (32.51 | )% | | | 8.12 | % |
| | | | | | |
Ratios/Supplemental Data: | | | | | | | | | | | | | | | | | | | | | | | | |
Net Assets, End of Period (in 000’s) | | $ | 49,341 | | | $ | 91,347 | | | $ | 213,326 | | | $ | 216,221 | | | $ | 160,245 | | | $ | 237,695 | |
Ratios of expenses to average net assets: | | | | | | | | | | | | | | | | | | | | | | | | |
Before reimbursement and/or waiver of expenses by Adviser | | | 1.39 | %(d) | | | 1.37 | %(e) | | | 1.39 | %(e) | | | 1.40 | % | | | 1.45 | %(e) | | | 1.44 | %(e) |
After reimbursement and/or waiver of expenses by Adviser | | | 1.39 | %(d) | | | 1.37 | %(e) | | | 1.39 | %(e) | | | 1.40 | %(f) | | | 1.45 | %(e) | | | 1.44 | %(e) |
Ratios of net investment income (loss)to average net assets: | | | | | | | | | | | | | | | | | | | | | | | | |
Before reimbursement and/or waiver of expenses by Adviser | | | 0.39 | %(d) | | | (0.13 | )% | | | 0.27 | % | | | 0.05 | % | | | 0.08 | % | | | 0.38 | % |
After reimbursement and/or waiver of expenses by Adviser | | | 0.39 | %(d) | | | (0.13 | )% | | | 0.27 | % | | | 0.05 | % | | | 0.08 | % | | | 0.38 | % |
Portfolio Turnover | | | 12.37 | %(c) | | | 42.29 | % | | | 51.05 | % | | | 35.83 | % | | | 57.32 | % | | | 74.18 | % |
| (a) | The selected per share data was calculated using the weighted average shares outstanding method for the period. |
| (b) | The total return is calculated using the Net Asset Values used for trading at the close of business at period end. |
| (e) | Ratios of expenses to average net assets include interest expenses of less than 0.005% for the years ended October 31, 2011, October 31, 2010, October 31, 2008 and October 31, 2007, which are not included in the contractual expense limitation. The interest expenses are from utilizing the line of credit as discussed in Note H to Financial Statements. |
| (f) | The Adviser removed the contractual expense limitation of 1.50%, excluding interest, brokerage commissions, other investment related costs, extraordinary expenses and acquired fund fees and expenses, effective March 1, 2009. |
|
See accompanying Notes to Financial Statements. |
104 |
| |
| | | | |
Aston Funds | | | | |
ASTON/River Road Small Cap Value Fund – Class I | | | April 30, 2012 | |
Financial Highlights | | | | |
| | | | | | | | | | | | | | | | | | | | | | | | |
| | | Six Months | | | | | | | | | | | | | | | | |
| | | Ended | | | Year | | | Year | | | Year | | | Year | | | Period | |
| | | 04/30/12 | | | Ended | | | Ended | | | Ended | | | Ended | | | Ended | |
| | | (unaudited) | | | 10/31/11 | | | 10/31/10 | | | 10/31/09 | | | 10/31/08 | | | 10/31/07(a) | |
Net Asset Value, Beginning of Period | | $ | 12.22 | | | $ | 11.62 | | | $ | 10.24 | | | $ | 9.32 | | | $ | 14.37 | | | $ | 14.04 | |
| | | | | | | | | | | | | | | | | | | | | | | | |
Income from Investment Operations: | | | | | | | | | | | | | | | | | | | | | | | | |
Net investment income | | | 0.04 | | | | 0.01 | | | | 0.06 | | | | 0.03 | | | | 0.04 | (b) | | | 0.09 | (b) |
Net realized and unrealized gain (loss)on investments | | | 1.08 | | | | 0.65 | | | | 1.35 | | | | 0.92 | | | | (4.54 | ) | | | 0.46 | |
| | | | | | | | | | | | | | | | | | | | | | | | |
Total from investment operations | | | 1.12 | | | | 0.66 | | | | 1.41 | | | | 0.95 | | | | (4.50 | ) | | | 0.55 | |
| | | | | | | | | | | | | | | | | | | | | | | | |
Less Distributions: | | | | | | | | | | | | | | | | | | | | | | | | |
Distributions from and in excess of net investment income | | | — | | | | (0.06 | ) | | | (0.03 | ) | | | (0.03 | ) | | | (0.01 | ) | | | (0.09 | ) |
Distributions from net realized gain on investments | | | — | | | | — | | | | — | | | | — | | | | (0.54 | ) | | | (0.13 | ) |
| | | | | | | | | | | | | | | | | | | | | | | | |
Total distributions | | | — | | | | (0.06 | ) | | | (0.03 | ) | | | (0.03 | ) | | | (0.55 | ) | | | (0.22 | ) |
| | | | | | | | | | | | | | | | | | | | | | | | |
Net increase (decrease) in net asset value | | | 1.12 | | | | 0.60 | | | | 1.38 | | | | 0.92 | | | | (5.05 | ) | | | 0.33 | |
| | | | | | | | | | | | | | | | | | | | | | | | |
Net Asset Value, End of Period | | $ | 13.34 | | | $ | 12.22 | | | $ | 11.62 | | | $ | 10.24 | | | $ | 9.32 | | | $ | 14.37 | |
| | | | | | | | | | | | | | | | | | | | | | | | |
Total Return (c) | | | 9.17 | %(d) | | | 5.70 | % | | | 13.80 | % | | | 10.31 | % | | | (32.34 | )% | | | 3.91 | %(d) |
| | | | | | |
Ratios/Supplemental Data: | | | | | | | | | | | | | | | | | | | | | | | | |
Net Assets, End of Period (in 000’s) | | $ | 249,241 | | | $ | 246,141 | | | $ | 255,344 | | | $ | 282,542 | | | $ | 114,666 | | | $ | 64,525 | |
Ratios of expenses to average net assets: | | | | | | | | | | | | | | | | | | | | | | | | |
Before reimbursement and/or waiver of expenses by Adviser | | | 1.14 | %(e) | | | 1.12 | %(f) | | | 1.14 | %(f) | | | 1.15 | % | | | 1.20 | %(f) | | | 1.16 | %(e)(f) |
After reimbursement and/or waiver of expenses by Adviser | | | 1.14 | %(e) | | | 1.12 | %(f) | | | 1.14 | %(f) | | | 1.15 | %(g) | | | 1.20 | %(f) | | | 1.16 | %(e)(f) |
Ratios of net investment income to average net assets: | | | | | | | | | | | | | | | | | | | | | | | | |
Before reimbursement and/or waiver of expenses by Adviser | | | 0.64 | %(e) | | | 0.12 | % | | | 0.52 | % | | | 0.30 | % | | | 0.33 | % | | | 0.31 | %(e) |
After reimbursement and/or waiver of expenses by Adviser | | | 0.64 | %(e) | | | 0.12 | % | | | 0.52 | % | | | 0.30 | % | | | 0.33 | % | | | 0.31 | %(e) |
Portfolio Turnover | | | 12.37 | %(d) | | | 42.29 | % | | | 51.05 | % | | | 35.83 | % | | | 57.32 | % | | | 74.18 | % |
| (a) | River Road Small Cap Value Fund began issuing Class I shares on December 12, 2006. |
| (b) | The selected per share data was calculated using the weighted average shares outstanding method for the period. |
| (c) | The total return is calculated using the Net Asset Values used for trading at the close of business at period end. |
| (f) | Ratios of expenses to average net assets include interest expenses of less than 0.005% for the years ended October 31, 2011, October 31, 2010, October 31, 2008 and the period ended October 31, 2007, which are not included in the contractual expense limitation. The interest expenses are from utilizing the line of credit as discussed in Note H to Financial Statements. |
| (g) | The Adviser removed the contractual expense limitation of 1.25%, excluding interest, brokerage commissions, other investment related costs, extraordinary expenses and acquired fund fees and expenses, effective March 1, 2009. |
| | | | |
See accompanying Notes to Financial Statements. | | | | |
| | | 105 | |
| | | | |
| | | | |
Aston Funds | | | | |
ASTON/River Road Independent Value Fund – Class N | | | April 30, 2012 | |
Financial Highlights | | | | |
| | | | | | | | |
| | | Six Months | | | | |
| | | Ended | | | Period | |
| | | 04/30/12 | | | Ended | |
| | | (unaudited) | | | 10/31/11(a) | |
Net Asset Value, Beginning of Period | | $ | 10.75 | | | $ | 10.00 | |
| | | | | | | | |
Income from Investment Operations: | | | | | | | | |
Net investment loss | | | (0.03 | ) | | | (0.07 | )(b) |
Net realized and unrealized gain on investments | | | 0.28 | | | | 0.82 | |
| | | | | | | | |
Total from investment operations | | | 0.25 | | | | 0.75 | |
| | | | | | | | |
Less Distributions: | | | | | | | | |
Distributions from net realized gain on investments | | | (0.12 | ) | | | — | |
| | | | | | | | |
Total distributions | | | (0.12 | ) | | | — | |
| | | | | | | | |
Net increase in net asset value | | | 0.13 | | | | 0.75 | |
| | | | | | | | |
Net Asset Value, End of Period | | $ | 10.88 | | | $ | 10.75 | |
| | | | | | | | |
Total Return (c) | | | 2.33 | %(d) | | | 7.50 | %(d) |
| | |
Ratios/Supplemental Data: | | | | | | | | |
Net Assets, End of Period (in 000’s) | | $ | 353,940 | | | $ | 306,223 | |
Ratios of expenses to average net assets: | | | | | | | | |
Before reimbursement and/or waiver of expenses by Adviser | | | 1.44 | %(e) | | | 1.59 | %(e) |
After reimbursement and/or waiver of expenses by Adviser | | | 1.42 | %(e) | | | 1.42 | %(e) |
Ratios of net investment loss to average net assets: | | | | | | | | |
Before reimbursement and/or waiver of expenses by Adviser | | | (0.59 | )%(e) | | | (0.98 | )%(e) |
After reimbursement and/or waiver of expenses by Adviser | | | (0.57 | )%(e) | | | (0.80 | )%(e) |
Portfolio Turnover | | | 72.20 | %(d) | | | 105.69 | %(d) |
| (a) | River Road Independent Value Fund began issuing Class N shares on December 30, 2010. |
| (b) | The selected per share data was calculated using the weighted average shares outstanding method for the period. |
| (c) | The total return is calculated using the Net Asset Values used for trading at the close of business at period end. |
|
See accompanying Notes to Financial Statements. |
| 106 |
| |
| | | | |
Aston Funds | | | | |
| ASTON/River Road Independent Value Fund – Class I | | | April 30, 2012 | |
Financial Highlights | | | | |
| | | | | | | | |
| | | Six Months
Ended
04/30/12
(unaudited) | | | Period
Ended
10/31/11(a) | |
Net Asset Value, Beginning of Period | | $ | 10.75 | | | $ | 10.92 | |
| | | | | | | | |
Income from Investment Operations: | | | | | | | | |
Net investment loss | | | (0.02 | ) | | | (0.02 | )(b) |
Net realized and unrealized gain (loss) on investments | | | 0.30 | | | | (0.15 | ) |
| | | | | | | | |
Total from investment operations | | | 0.28 | | | | (0.17 | ) |
| | | | | | | | |
Less Distributions: | | | | | | | | |
Distributions from net realized gain on investments | | | (0.12 | ) | | | — | |
| | | | | | | | |
Total distributions | | | (0.12 | ) | | | — | |
| | | | | | | | |
Net increase (decrease) in net asset value | | | 0.16 | | | | (0.17 | ) |
| | | | | | | | |
Net Asset Value, End of Period | | $ | 10.91 | | | $ | 10.75 | |
| | | | | | | | |
Total Return (c) | | | 2.52 | %(d) | | | (1.47 | )%(d) |
| | |
Ratios/Supplemental Data: | | | | | | | | |
Net Assets, End of Period (in 000’s) | | $ | 250,983 | | | $ | 85,478 | |
Ratios of expenses to average net assets: | | | | | | | | |
Before reimbursement and/or waiver of expenses by Adviser | | | 1.19 | %(e) | | | 1.34 | %(e) |
After reimbursement and/or waiver of expenses by Adviser | | | 1.17 | %(e) | | | 1.17 | %(e) |
Ratios of net investment loss to average net assets: | | | | | | | | |
Before reimbursement and/or waiver of expenses by Adviser | | | (0.34 | )%(e) | | | (0.73 | )%(e) |
After reimbursement and/or waiver of expenses by Adviser | | | (0.32 | )%(e) | | | (0.55 | )%(e) |
Portfolio Turnover | | | 72.20 | %(d) | | | 105.69 | %(d) |
| (a) | River Road Independent Value Fund began issuing Class I shares on May 31, 2011. |
| (b) | The selected per share data was calculated using the weighted average shares outstanding method for the period. |
| (c) | The total return is calculated using the Net Asset Values used for trading at the close of business at period end. |
| | | | |
See accompanying Notes to Financial Statements. | | | | |
| | | 107 | |
| | | | |
| | | | |
Aston Funds | | | | |
| ASTON/DoubleLine Core Plus Fixed Income Fund – Class N | | | April 30, 2012 | |
Financial Highlights | | | | |
| | | | | | | | |
| | | Six Months
Ended
04/30/12
(unaudited) | | | Period
Ended
10/31/11 (a) | |
Net Asset Value, Beginning of Period | | $ | 10.44 | | | $ | 10.00 | |
| | | | | | | | |
Income from Investment Operations: | | | | | | | | |
Net investment income | | | 0.22 | (b) | | | 0.12 | (b) |
Net realized and unrealized gain on investments | | | 0.34 | | | | 0.41 | |
| | | | | | | | |
Total from investment operations | | | 0.56 | | | | 0.53 | |
| | | | | | | | |
Less Distributions: | | | | | | | | |
Distributions from and in excess of net investment income | | | (0.21 | ) | | | (0.09 | ) |
Distributions from net realized gain on investments | | | (0.02 | ) | | | — | |
| | | | | | | | |
Total distributions | | | (0.23 | ) | | | (0.09 | ) |
| | | | | | | | |
Net increase in net asset value | | | 0.33 | | | | 0.44 | |
| | | | | | | | |
Net Asset Value, End of Period | | $ | 10.77 | | | $ | 10.44 | |
| | | | | | | | |
Total Return (c) | | | 5.34 | %(d) | | | 5.33 | %(d) |
| | |
Ratios/Supplemental Data: | | | | | | | | |
Net Assets, End of Period (in 000’s) | | $ | 25,201 | | | $ | 22,657 | |
Ratios of expenses to average net assets: | | | | | | | | |
Before reimbursement and/or waiver of expenses by Adviser | | | 1.78 | %(e) | | | 3.16 | %(e) |
After reimbursement and/or waiver of expenses by Adviser | | | 0.94 | %(e) | | | 0.94 | %(e) |
Ratios of net investment income to average net assets: | | | | | | | | |
Before reimbursement and/or waiver of expenses by Adviser | | | 3.37 | %(e) | | | 1.63 | %(e) |
After reimbursement and/or waiver of expenses by Adviser | | | 4.21 | %(e) | | | 3.85 | %(e) |
Portfolio Turnover | | | 70.46 | %(d) | | | 38.49 | %(d) |
| (a) | DoubleLine Core Plus Fixed Income Fund began issuing Class N shares on July 15, 2011. |
| (b) | The selected per share data was calculated using the weighted average shares outstanding method for the period. |
| (c) | The total return is calculated using the Net Asset Values used for trading at the close of business at period end. |
|
See accompanying Notes to Financial Statements. |
| 108 |
| |
| | | | |
Aston Funds | | | | |
| ASTON/DoubleLine Core Plus Fixed Income Fund – Class I | | | April 30, 2012 | |
Financial Highlights | | | | |
| | | | | | | | |
| | | Six Months
Ended
04/30/12
(unaudited) | | | Period
Ended
10/31/11 (a) | |
Net Asset Value, Beginning of Period | | $ | 10.44 | | | $ | 10.00 | |
| | | | | | | | |
Income from Investment Operations: | | | | | | | | |
Net investment income | | | 0.24 | (b) | | | 0.13 | (b) |
Net realized and unrealized gain on investments | | | 0.33 | | | | 0.41 | |
| | | | | | | | |
Total from investment operations | | | 0.57 | | | | 0.54 | |
| | | | | | | | |
Less Distributions: | | | | | | | | |
Distributions from and in excess of net investment income | | | (0.22 | ) | | | (0.10 | ) |
Distributions from net realized gain on investments | | | (0.02 | ) | | | — | |
| | | | | | | | |
Total distributions | | | (0.24 | ) | | | (0.10 | ) |
| | | | | | | | |
Net increase in net asset value | | | 0.33 | | | | 0.44 | |
| | | | | | | | |
Net Asset Value, End of Period | | $ | 10.77 | | | $ | 10.44 | |
| | | | | | | | |
Total Return (c) | | | 5.48 | %(d) | | | 5.38 | %(d) |
| | |
Ratios/Supplemental Data: | | | | | | | | |
Net Assets, End of Period (in 000’s) | | $ | 52,074 | | | $ | 4,486 | |
Ratios of expenses to average net assets: | | | | | | | | |
Before reimbursement and/or waiver of expenses by Adviser | | | 1.53 | %(e) | | | 2.91 | %(e) |
After reimbursement and/or waiver of expenses by Adviser | | | 0.69 | %(e) | | | 0.69 | %(e) |
Ratios of net investment income to average net assets: | | | | | | | | |
Before reimbursement and/or waiver of expenses by Adviser | | | 3.62 | %(e) | | | 1.88 | %(e) |
After reimbursement and/or waiver of expenses by Adviser | | | 4.46 | %(e) | | | 4.10 | %(e) |
Portfolio Turnover | | | 70.46 | %(d) | | | 38.49 | %(d) |
| (a) | DoubleLine Core Plus Fixed Income Fund began issuing Class I shares on July 15, 2011. |
| (b) | The selected per share data was calculated using the weighted average shares outstanding method for the period. |
| (c) | The total return is calculated using the Net Asset Values used for trading at the close of business at period end. |
| | | | |
See accompanying Notes to Financial Statements. | | | | |
| | | 109 | |
| | | | |
| | | | |
Aston Funds | | | | |
| ASTON/TCH Fixed Income Fund – Class N | | | April 30, 2012 | |
Financial Highlights | | | | |
| | | | | | | | | | | | | | | | | | | | | | | | |
| | | Six Months
Ended
04/30/12
(unaudited) | | | Year
Ended
10/31/11 | | | Year
Ended
10/31/10 | | | Year
Ended
10/31/09 | | | Year
Ended
10/31/08 | | | Year
Ended
10/31/07 | |
Net Asset Value, Beginning of Period | | $ | 10.59 | | | $ | 10.49 | | | $ | 10.02 | | | $ | 8.60 | | | $ | 9.73 | | | $ | 9.62 | |
| | | | | | | | | | | | | | | | | | | | | | | | |
Income from Investment Operations: | | | | | | | | | | | | | | | | | | | | | | | | |
Net investment income | | | 0.22 | | | | 0.47 | (a) | | | 0.50 | (a) | | | 0.49 | (a) | | | 0.47 | | | | 0.48 | (a) |
Net realized and unrealized gain (loss)on investments | | | 0.17 | | | | 0.10 | | | | 0.47 | | | | 1.44 | | | | (1.10 | ) | | | 0.14 | |
| | | | | | | | | | | | | | | | | | | | | | | | |
Total from investment operations | | | 0.39 | | | | 0.57 | | | | 0.97 | | | | 1.93 | | | | (0.63 | ) | | | 0.62 | |
| | | | | | | | | | | | | | | | | | | | | | | | |
Less Distributions: | | | | | | | | | | | | | | | | | | | | | | | | |
Distributions from and in excess of net investment income | | | (0.24 | ) | | | (0.47 | ) | | | (0.50 | ) | | | (0.51 | ) | | | (0.50 | ) | | | (0.51 | ) |
| | | | | | | | | | | | | | | | | | | | | | | | |
Total distributions | | | (0.24 | ) | | | (0.47 | ) | | | (0.50 | ) | | | (0.51 | ) | | | (0.50 | ) | | | (0.51 | ) |
| | | | | | | | | | | | | | | | | | | | | | | | |
Net increase (decrease) in net asset value | | | 0.15 | | | | 0.10 | | | | 0.47 | | | | 1.42 | | | | (1.13 | ) | | | 0.11 | |
| | | | | | | | | | | | | | | | | | | | | | | | |
Net Asset Value, End of Period | | $ | 10.74 | | | $ | 10.59 | | | $ | 10.49 | | | $ | 10.02 | | | $ | 8.60 | | | $ | 9.73 | |
| | | | | | | | | | | | | | | | | | | | | | | | |
Total Return (b) | | | 3.74 | %(c) | | | 5.62 | % | | | 9.98 | % | | | 22.99 | % | | | (6.89 | )% | | | 6.56 | % |
| | | | | | |
Ratios/Supplemental Data: | | | | | | | | | | | | | | | | | | | | | | | | |
Net Assets, End of Period (in 000’s) | | $ | 63,745 | | | $ | 62,346 | | | $ | 46,274 | | | $ | 47,008 | | | $ | 42,765 | | | $ | 52,662 | |
Ratios of expenses to average net assets: | | | | | | | | | | | | | | | | | | | | | | | | |
Before reimbursement and/or waiver of expenses by Adviser | | | 1.03 | %(d) | | | 1.14 | % | | | 0.98 | % | | | 0.96 | % | | | 1.06 | % | | | 1.04 | %(e) |
After reimbursement and/or waiver of expenses by Adviser | | | 0.87 | %(d) | | | 0.88 | %(f) | | | 0.62 | % | | | 0.61 | % | | | 0.65 | %(f) | | | 0.73 | %(e)(f) |
Ratios of net investment income to average net assets: | | | | | | | | | | | | | | | | | | | | | | | | |
Before reimbursement and/or waiver of expenses by Adviser | | | 4.01 | %(d) | | | 4.20 | % | | | 4.51 | % | | | 4.93 | % | | | 4.59 | % | | | 4.63 | % |
After reimbursement and/or waiver of expenses by Adviser | | | 4.17 | %(d) | | | 4.46 | % | | | 4.87 | % | | | 5.28 | % | | | 5.00 | % | | | 4.94 | % |
Portfolio Turnover | | | 29.87 | %(c) | | | 37.51 | % | | | 23.92 | % | | | 40.81 | % | | | 78.39 | % | | | 71.61 | % |
| (a) | The selected per share data was calculated using the weighted average shares outstanding method for the period. |
| (b) | The total return is calculated using the Net Asset Values used for trading at the close of business at period end. |
| (e) | Ratios of expenses to average net assets include interest expense of less than 0.005% for the year ended October 31, 2007, which is not included in the contractual or voluntary expense limitation. The interest expense is from utilizing the line of credit as discussed in Note H to Financial Statements. |
| (f) | The Adviser’s contractual expense limitation, which affects the net expense ratio, was changed from 0.74% to 0.64% on September 1, 2007. Subsequently, on October 1, 2008, the Adviser’s expense reimbursement level changed from 0.64% to 0.74%. Subsequently, on March 1, 2011, the Adviser’s expense reimbursement level changed from 0.74% to 0.94%. The contractual expense limitation excludes interest, brokerage commissions, other investment related costs, extraordinary expenses and acquired fund fees and expenses. |
|
See accompanying Notes to Financial Statements. |
| 110 |
| |
| | | | |
Aston Funds | | | | |
| ASTON/TCH Fixed Income Fund – Class I | | | April 30, 2012 | |
Financial Highlights | | | | |
| | | | | | | | | | | | | | | | | | | | | | | | |
| | | Six Months
Ended
04/30/12
(unaudited) | | | Year
Ended
10/31/11 | | | Year
Ended
10/31/10 | | | Year
Ended
10/31/09 | | | Year
Ended
10/31/08 | | | Year
Ended
10/31/07 | |
Net Asset Value, Beginning of Period | | $ | 10.59 | | | $ | 10.49 | | | $ | 10.02 | | | $ | 8.60 | | | $ | 9.73 | | | $ | 9.62 | |
| | | | | | | | | | | | | | | | | | | | | | | | |
Income from Investment Operations: | | | | | | | | | | | | | | | | | | | | | | | | |
Net investment income | | | 0.23 | | | | 0.49 | (a) | | | 0.51 | (a) | | | 0.50 | (a) | | | 0.48 | | | | 0.51 | (a) |
Net realized and unrealized gain (loss) on investments | | | 0.18 | | | | 0.11 | | | | 0.48 | | | | 1.44 | | | | (1.09 | ) | | | 0.13 | |
| | | | | | | | | | | | | | | | | | | | | | | | |
Total from investment operations | | | 0.41 | | | | 0.60 | | | | 0.99 | | | | 1.94 | | | | (0.61 | ) | | | 0.64 | |
| | | | | | | | | | | | | | | | | | | | | | | | |
Less Distributions: | | | | | | | | | | | | | | | | | | | | | | | | |
Distributions from and in excess of net investment income | | | (0.25 | ) | | | (0.50 | ) | | | (0.52 | ) | | | (0.52 | ) | | | (0.52 | ) | | | (0.53 | ) |
| | | | | | | | | | | | | | | | | | | | | | | | |
Total distributions | | | (0.25 | ) | | | (0.50 | ) | | | (0.52 | ) | | | (0.52 | ) | | | (0.52 | ) | | | (0.53 | ) |
| | | | | | | | | | | | | | | | | | | | | | | | |
Net increase (decrease) in net asset value | | | 0.16 | | | | 0.10 | | | | 0.47 | | | | 1.42 | | | | (1.13 | ) | | | 0.11 | |
| | | | | | | | | | | | | | | | | | | | | | | | |
Net Asset Value, End of Period | | $ | 10.75 | | | $ | 10.59 | | | $ | 10.49 | | | $ | 10.02 | | | $ | 8.60 | | | $ | 9.73 | |
| | | | | | | | | | | | | | | | | | | | | | | | |
Total Return (b) | | | 3.94 | %(c) | | | 5.89 | % | | | 10.11 | % | | | 23.14 | % | | | (6.65 | )% | | | 6.84 | % |
| | | | | | |
Ratios/Supplemental Data: | | | | | | | | | | | | | | | | | | | | | | | | |
Net Assets, End of Period (in 000’s) | | $ | 10,083 | | | $ | 10,423 | | | $ | 14,881 | | | $ | 20,276 | | | $ | 25,891 | | | $ | 39,318 | |
Ratios of expenses to average net assets: | | | | | | | | | | | | | | | | | | | | | | | | |
Before reimbursement and/or waiver of expenses by Adviser | | | 0.85 | %(d) | | | 0.89 | % | | | 0.85 | % | | | 0.84 | % | | | 0.81 | % | | | 0.78 | %(e) |
After reimbursement and/or waiver of expenses by Adviser | | | 0.69 | %(d) | | | 0.63 | %(f) | | | 0.49 | % | | | 0.49 | % | | | 0.40 | %(f) | | | 0.47 | %(e)(f) |
Ratios of net investment income to average net assets: | | | | | | | | | | | | | | | | | | | | | | | | |
Before reimbursement and/or waiver of expenses by Adviser | | | 4.19 | %(d) | | | 4.45 | % | | | 4.64 | % | | | 5.05 | % | | | 4.84 | % | | | 4.89 | % |
After reimbursement and/or waiver of expenses by Adviser | | | 4.35 | %(d) | | | 4.71 | % | | | 5.00 | % | | | 5.40 | % | | | 5.25 | % | | | 5.20 | % |
Portfolio Turnover | | | 29.87 | %(c) | | | 37.51 | % | | | 23.92 | % | | | 40.81 | % | | | 78.39 | % | | | 71.61 | % |
| (a) | The selected per share data was calculated using the weighted average shares outstanding method for the period. |
| (b) | The total return is calculated using the Net Asset Values used for trading at the close of business at period end. |
| (e) | Ratios of expenses to average net assets include interest expense of less than 0.005% for the year ended October 31, 2007, which is not included in the contractual or voluntary expense limitation. The interest expense is from utilizing the line of credit as discussed in Note H to Financial Statements. |
| (f) | The Adviser’s contractual expense limitation, which affects the net expense ratio, was changed from 0.49% to 0.39% on September 1, 2007. Subsequently, on October 1, 2008, the Adviser’s expense reimbursement level changed from 0.39% to 0.49%. Subsequently, on March 1, 2011, the Adviser’s expense reimbursement level changed from 0.49% to 0.69%. The contractual expense limitation excludes interest, brokerage commissions, other investment related costs, extraordinary expenses and acquired fund fees and expenses. |
| | | | |
See accompanying Notes to Financial Statements. | | | | |
| | | 111 | |
| | | | |
| | | | |
Aston Funds | | | | |
| ASTON/Lake Partners LASSO Alternatives Fund – Class N | | | April 30, 2012 | |
Financial Highlights | | | | |
| | | | | | | | | | | | |
| | | Six Months
Ended
04/30/12
(unaudited) | | | Year
Ended
10/31/11 | | | Period
Ended
10/31/10(a) | |
Net Asset Value, Beginning of Period | | $ | 11.94 | | | $ | 11.97 | | | $ | 11.48 | |
| | | | | | | | | | | | |
Income from Investment Operations: | | | | | | | | | | | | |
Net investment income (loss) | | | 0.03 | (b) | | | (0.01 | )(b) | | | 0.04 | (b) |
Net realized and unrealized gain on investments | | | 0.53 | | | | 0.13 | | | | 0.45 | |
| | | | | | | | | | | | |
Total from investment operations | | | 0.56 | | | | 0.12 | | | | 0.49 | |
| | | | | | | | | | | | |
Less Distributions: | | | | | | | | | | | | |
Distributions from and in excess of net investment income | | | (0.18 | ) | | | (0.08 | ) | | | — | |
Distributions from capital gains | | | — | | | | (0.07 | ) | | | — | |
| | | | | | | | | | | | |
Total distributions | | | (0.18 | ) | | | (0.15 | ) | | | — | |
| | | | | | | | | | | | |
Net increase (decrease) in net asset value | | | 0.38 | | | | (0.03 | ) | | | 0.49 | |
| | | | | | | | | | | | |
Net Asset Value, End of Period | | $ | 12.32 | | | $ | 11.94 | | | $ | 11.97 | |
| | | | | | | | | | | | |
Total Return (c) | | | 4.74 | %(d) | | | 0.92 | % | | | 4.27 | %(d) |
| | | |
Ratios/Supplemental Data: | | | | | | | | | | | | |
Net Assets, End of Period (in 000’s) | | $ | 24,039 | | | $ | 17,626 | | | $ | 8,296 | |
Ratios of expenses to average net assets: | | | | | | | | | | | | |
Before reimbursement and/or waiver of expenses by Adviser (e) | | | 1.45 | %(f)(g) | | | 1.53 | % | | | 2.19 | %(f) |
After reimbursement and/or waiver of expenses by Adviser (e) | | | 1.45 | %(f)(g) | | | 1.45 | % | | | 1.45 | %(f)(h) |
Ratios of net investment income (loss) to average net assets: | | | | | | | | | | | | |
Before reimbursement and/or waiver of expenses by Adviser | | | 0.54 | %(f)(g) | | | (0.17 | )% | | | (0.25 | )%(f) |
After reimbursement and/or waiver of expenses by Adviser | | | 0.54 | %(f)(g) | | | (0.10 | )% | | | 0.49 | %(f) |
Portfolio Turnover | | | 31.71 | %(d) | | | 79.77 | % | | | 116.68 | % |
| (a) | Lake Partners LASSO Alternatives Fund began issuing Class N shares on March 2, 2010. |
| (b) | The selected per share data was calculated using the weighted average shares outstanding method for the period. |
| (c) | The total return is calculated using the Net Asset Values used for trading at the close of business at period end. |
| (e) | Does not include expenses of the underlying funds in which the Fund invests. |
| (g) | Ratios of expenses and net investment income to average net assets include advisory fee waiver of less than 0.005% for the six months ended April 30, 2012. |
| (h) | Effective March 30, 2010, the contractual expense limitation was decreased from 1.60% to 1.45% excluding interest, brokerage commissions, other investment related costs, extraordinary expenses and acquired fund fees and expenses. |
|
See accompanying Notes to Financial Statements. |
| 112 |
| |
| | | | |
Aston Funds | | | | |
| ASTON/Lake Partners LASSO Alternatives Fund – Class I | | | April 30, 2012 | |
Financial Highlights | | | | |
| | | | | | | | | | | | | | | | |
| | | Six Months
Ended
04/30/12
(unaudited) | | | Year
Ended
10/31/11 | | | Year
Ended
10/31/10 | | | Period
Ended
10/31/09(a) | |
Net Asset Value, Beginning of Period | | $ | 11.97 | | | $ | 11.98 | | | $ | 11.15 | | | $ | 10.00 | |
| | | | | | | | | | | | | | | | |
Income from Investment Operations: | | | | | | | | | | | | | | | | |
Net investment income (loss) | | | 0.05 | (b) | | | 0.02 | (b) | | | 0.08 | (b) | | | (— | ) (c) |
Net realized and unrealized gain on investments | | | 0.53 | | | | 0.13 | | | | 0.89 | | | | 1.15 | |
| | | | | | | | | | | | | | | | |
Total from investment operations | | | 0.58 | | | | 0.15 | | | | 0.97 | | | | 1.15 | |
| | | | | | | | | | | | | | | | |
Less Distributions: | | | | | | | | | | | | | | | | |
Distributions from and in excess of net investment income | | | (0.21 | ) | | | (0.09 | ) | | | (0.07 | ) | | | — | |
Distributions from net realized gain on investments | | | — | | | | (0.07 | ) | | | (0.07 | ) | | | — | |
| | | | | | | | | | | | | | | | |
Total distributions | | | (0.21 | ) | | | (0.16 | ) | | | (0.14 | ) | | | — | |
| | | | | | | | | | | | | | | | |
Net increase (decrease) in net asset value | | | 0.37 | | | | (0.01 | ) | | | 0.83 | | | | 1.15 | |
| | | | | | | | | | | | | | | | |
Net Asset Value, End of Period | | $ | 12.34 | | | $ | 11.97 | | | $ | 11.98 | | | $ | 11.15 | |
| | | | | | | | | | | | | | | | |
Total Return (d) | | | 4.88 | %(e) | | | 1.22 | % | | | 8.74 | % | | | 11.50 | %(e) |
| | | | |
Ratios/Supplemental Data: | | | | | | | | | | | | | | | | |
Net Assets, End of Period (in 000’s) | | $ | 236,047 | | | $ | 189,999 | | | $ | 19,723 | | | $ | 1,845 | |
Ratios of expenses to average net assets: | | | | | | | | | | | | | | | | |
Before reimbursement and/or waiver of expenses by Adviser (f) | | | 1.20 | %(g)(h) | | | 1.28 | % | | | 2.32 | % | | | 18.16 | %(g) |
After reimbursement and/or waiver of expenses by Adviser (f) | | | 1.20 | %(g)(h) | | | 1.20 | % | | | 1.24 | %(i) | | | 1.35 | %(g) |
Ratios of net investment income (loss) to average net assets: | | | | | | | | | | | | | | | | |
Before reimbursement and/or waiver of expenses by Adviser | | | 0.79 | %(g)(h) | | | 0.08 | % | | | (0.41 | )% | | | (16.92 | )%(g) |
After reimbursement and/or waiver of expenses by Adviser | | | 0.79 | %(g)(h) | | | 0.15 | % | | | 0.67 | % | | | (0.11 | )%(g) |
Portfolio Turnover | | | 31.71 | %(e) | | | 79.77 | % | | | 116.68 | % | | | 65.93 | %(e) |
| (a) | Lake Partners LASSO Alternatives Fund began issuing Class I shares on March 31, 2009. |
| (b) | The selected per share data was calculated using the weighted average shares outstanding method for the period. |
| (c) | Represents less than $(0.005) per share. |
| (d) | The total return is calculated using the Net Asset Values used for trading at the close of business at period end. |
| (f) | Does not include expenses of the underlying funds in which the Fund invests. |
| (h) | Ratios of expenses and net investment income to average net assets include advisory fee waiver of less than 0.005% for the six months ended April 30, 2012. |
| (i) | Effective March 30, 2010, the contractual expense limitation was decreased from 1.35% to 1.20% excluding interest, brokerage commissions, other investment related costs, extraordinary expenses and acquired fund fees and expenses. |
| | | | |
See accompanying Notes to Financial Statements. | | | | |
| | | 113 | |
| | | | |
| | | | |
Aston Funds | | | | |
| ASTON Dynamic Allocation Fund – Class N | | | April 30, 2012 | |
Financial Highlights | | | | |
| | | | | | | | | | | | | | | | | | | | |
| | | Six Months
Ended
04/30/12
(unaudited) | | | Year
Ended
10/31/11 | | | Year
Ended
10/31/10 | | | Year
Ended
10/31/09 | | | Period
Ended
10/31/08(a) | |
Net Asset Value, Beginning of Period | | $ | 9.54 | | | $ | 9.25 | | | $ | 9.17 | | | $ | 8.24 | | | $ | 10.00 | |
| | | | | | | | | | | | | | | | | | | | |
Income from Investment Operations: | | | | | | | | | | | | | | | | | | | | |
Net investment income (loss) | | | 0.03 | | | | (0.03 | )(b) | | | 0.05 | | | | 0.06 | | | | 0.07 | |
Net realized and unrealized income (loss) on investments | | | (0.25 | ) | | | 0.66 | | | | 0.66 | | | | 0.99 | (c) | | | (1.76 | ) |
| | | | | | | | | | | | | | | | | | | | |
Total from investment operations | | | (0.22 | ) | | | 0.63 | | | | 0.71 | | | | 1.05 | | | | (1.69 | ) |
| | | | | | | | | | | | | | | | | | | | |
Less Distributions: | | | | | | | | | | | | | | | | | | | | |
Distributions from and in excess of net investment income | | | (0.02 | ) | | | (0.03 | ) | | | (0.05 | ) | | | (0.12 | ) | | | (0.07 | ) |
Distributions from net realized gains on investments | | | (0.89 | ) | | | (0.31 | ) | | | (0.58 | ) | | | — | | | | — | |
| | | | | | | | | | | | | | | | | | | | |
Total distributions | | | (0.91 | ) | | | (0.34 | ) | | | (0.63 | ) | | | (0.12 | ) | | | (0.07 | ) |
| | | | | | | | | | | | | | | | | | | | |
Net increase (decrease) in net asset value | | | (1.13 | ) | | | 0.29 | | | | 0.08 | | | | 0.93 | | | | (1.76 | ) |
| | | | | | | | | | | | | | | | | | | | |
Net Asset Value, End of Period | | $ | 8.41 | | | $ | 9.54 | | | $ | 9.25 | | | $ | 9.17 | | | $ | 8.24 | |
| | | | | | | | | | | | | | | | | | | | |
Total Return (d) | | | (2.33 | )%(e) | | | 6.86 | % | | | 7.92 | % | | | 12.98 | % | | | (16.98 | )%(e) |
| | | | | |
Ratios/Supplemental Data: | | | | | | | | | | | | | | | | | | | | |
Net Assets, End of Period (in 000’s) | | $ | 32,267 | | | $ | 44,847 | | | $ | 54,234 | | | $ | 39,191 | | | $ | 6,070 | |
Ratios of expenses to average net assets: | | | | | | | | | | | | | | | | | | | | |
Before reimbursement and/or waiver of expenses by Adviser (f) | | | 1.52 | %(g) | | | 1.58 | % | | | 1.45 | %(h) | | | 1.69 | % | | | 5.11 | %(g)(h) |
After reimbursement and/or waiver of expenses by Adviser (f) | | | 1.30 | %(g) | | | 1.30 | % | | | 1.30 | %(h) | | | 1.30 | % | | | 1.31 | %(g)(h) |
Ratios of net investment income (loss) to average net assets: | | | | | | | | | | | | | | | | | | | | |
Before reimbursement and/or waiver of expenses by Adviser | | | 0.30 | %(g) | | | (0.63 | )% | | | 0.38 | %(h) | | | 0.39 | % | | | (2.48 | )%(g) |
After reimbursement and/or waiver of expenses by Adviser | | | 0.52 | %(g) | | | (0.35 | )% | | | 0.53 | %(h) | | | 0.78 | % | | | 1.32 | %(g) |
Portfolio Turnover | | | 203.70 | %(e) | | | 387.35 | % | | | 519.43 | % | | | 365.93 | % | | | 498.68 | %(e) |
| (a) | Dynamic Allocation Fund began issuing Class N shares on January 9, 2008. |
| (b) | The selected per share data was calculated using the weighted average shares outstanding method for the period. |
| (c) | Includes payments by affiliates of less than $0.005 per share. |
| (d) | The total return is calculated using the Net Asset Values used for trading at the close of business at period end. |
| (f) | Does not include expenses of the underlying funds in which the Fund invests. |
| (h) | Ratios of expenses to average net assets include interest expenses of less than 0.005% for the year ended October 31, 2010 and 0.01% for the period ended October 31, 2008, which are not included in the contractual expense limitation. The interest expenses are from utilizing the line of credit as discussed in Note H to Financial Statements. |
|
See accompanying Notes to Financial Statements. |
| 114 |
| |
| | | | |
Aston Funds | | | | |
| ASTON Dynamic Allocation Fund – Class I | | | April 30, 2012 | |
Financial Highlights | | | | |
| | | | | | | | |
| | | Six Months
Ended
04/30/12
(unaudited) | | | Period
Ended
10/31/11(a) | |
Net Asset Value, Beginning of Period | | $ | 9.55 | | | $ | 9.28 | |
| | | | | | | | |
Income from Investment Operations: | | | | | | | | |
Net investment income (loss) | | | 0.03 | | | | (0.01 | )(b) |
Net realized and unrealized gain (loss) on investments | | | (0.25 | ) | | | 0.64 | |
| | | | | | | | |
Total from investment operations | | | (0.22 | ) | | | 0.63 | |
| | | | | | | | |
Less Distributions: | | | | | | | | |
Distributions from and in excess of net investment income | | | (0.02 | ) | | | (0.05 | ) |
Distributions from net realized gains on investments | | | (0.89 | ) | | | (0.31 | ) |
| | | | | | | | |
Total distributions | | | (0.91 | ) | | | (0.36 | ) |
| | | | | | | | |
Net increase (decrease) in net asset value | | | (1.13 | ) | | | 0.27 | |
| | | | | | | | |
Net Asset Value, End of Period | | $ | 8.42 | | | $ | 9.55 | |
| | | | | | | | |
Total Return (c) | | | (2.29 | )%(d) | | | 6.89 | (d) |
| | |
Ratios/Supplemental Data: | | | | | | | | |
Net Assets, End of Period (in 000’s) | | $ | 4,736 | | | $ | 4,393 | |
Ratios of expenses to average net assets: | | | | | | | | |
Before reimbursement and/or waiver of expenses by Adviser (e) | | | 1.27 | %(f) | | | 1.33 | %(f) |
After reimbursement and/or waiver of expenses by Adviser (e) | | | 1.05 | %(f) | | | 1.05 | %(f) |
Ratios of net investment income (loss) to average net assets: | | | | | | | | |
Before reimbursement and/or waiver of expenses by Adviser | | | 0.55 | %(f) | | | (0.38 | )%(f) |
After reimbursement and/or waiver of expenses by Adviser | | | 0.77 | %(f) | | | (0.10 | )%(f) |
Portfolio Turnover | | | 203.70 | %(d) | | | 387.35 | % |
| (a) | Dynamic Allocation Fund began issuing Class I shares on November 1, 2010. |
| (b) | The selected per share data was calculated using the weighted average shares outstanding method for the period. |
| (c) | The total return is calculated using the Net Asset Values used for trading at the close of business at period end. |
| (e) | Does not include expenses of the underlying funds in which the Fund invests. |
| | | | |
See accompanying Notes to Financial Statements. | | | | |
| | | 115 | |
| | | | |
| | | | |
Aston Funds | | | | |
| ASTON/M.D. Sass Enhanced Equity Fund – Class N | | | April 30, 2012 | |
Financial Highlights | | | | |
| | | | | | | | | | | | | | | | | | | | |
| | | Six Months
Ended
04/30/12
(unaudited) | | | Year
Ended
10/31/11 | | | Year
Ended
10/31/10 | | | Year
Ended
10/31/09 | | | Period
Ended
10/31/08(a) | |
Net Asset Value, Beginning of Period | | $ | 9.61 | | | $ | 9.41 | | | $ | 8.57 | | | $ | 8.09 | | | $ | 10.00 | |
| | | | | | | | | | | | | | | | | | | | |
Income from Investment Operations: | | | | | | | | | | | | | | | | | | | | |
Net investment income | | | 0.07 | | | | 0.14 | | | | 0.10 | | | | 0.11 | | | | 0.14 | |
Net realized and unrealized gain (loss) on investments | | | 0.33 | | | | 0.56 | | | | 0.84 | | | | 1.02 | | | | (1.91 | ) |
| | | | | | | | | | | | | | | | | | | | |
Total from investment operations | | | 0.40 | | | | 0.70 | | | | 0.94 | | | | 1.13 | | | | (1.77 | ) |
| | | | | | | | | | | | | | | | | | | | |
Less Distributions: | | | | | | | | | | | | | | | | | | | | |
Distributions from and in excess of net investment income | | | (0.08 | ) | | | (0.13 | ) | | | (0.10 | ) | | | (0.13 | ) | | | (0.14 | ) |
Distributions from net realized gain on investments | | | (1.04 | ) | | | (0.37 | ) | | | — | | | | (0.52 | ) | | | — | |
| | | | | | | | | | | | | | | | | | | | |
Total distributions | | | (1.12 | ) | | | (0.50 | ) | | | (0.10 | ) | | | (0.65 | ) | | | (0.14 | ) |
| | | | | | | | | | | | | | | | | | | | |
Net increase (decrease) in net asset value | | | (0.72 | ) | | | 0.20 | | | | 0.84 | | | | 0.48 | | | | (1.91 | ) |
| | | | | | | | | | | | | | | | | | | | |
Net Asset Value, End of Period | | $ | 8.89 | | | $ | 9.61 | | | $ | 9.41 | | | $ | 8.57 | | | $ | 8.09 | |
| | | | | | | | | | | | | | | | | | | | |
Total Return (b) | | | 4.61 | %(c) | | | 7.69 | % | | | 11.05 | % | | | 15.86 | % | | | (17.91 | )%(c) |
| | | | | |
Ratios/Supplemental Data: | | | | | | | | | | | | | | | | | | | | |
Net Assets, End of Period (in 000’s) | | $ | 69,488 | | | $ | 48,365 | | | $ | 46,423 | | | $ | 22,552 | | | $ | 14,389 | |
Ratios of expenses to average net assets: | | | | | | | | | | | | | | | | | | | | |
Before reimbursement, waiver and/or recoupment of expenses by Adviser | | | 1.20 | %(d)(e) | | | 1.24 | %(e) | | | 1.37 | % | | | 2.11 | % | | | 2.38 | %(d) |
After reimbursement, waiver and/or recoupment of expenses by Adviser | | | 1.30 | %(d)(e) | | | 1.33 | %(e) | | | 1.40 | % | | | 1.25 | %(f) | | | 1.10 | %(d) |
Ratios of net investment income to average net assets: | | | | | | | | | | | | | | | | | | | | |
Before reimbursement, waiver and/or recoupment of expenses by Adviser | | | 1.78 | %(d) | | | 1.51 | % | | | 1.20 | % | | | 0.55 | % | | | 0.86 | %(d) |
After reimbursement, waiver and/or recoupment of expenses by Adviser | | | 1.68 | %(d) | | | 1.41 | % | | | 1.17 | % | | | 1.41 | % | | | 2.14 | %(d) |
Portfolio Turnover | | | 31.11 | %(c) | | | 87.37 | % | | | 41.33 | % | | | 51.56 | % | | | 23.68 | %(c) |
| (a) | M.D. Sass Enhanced Equity Fund began issuing Class N shares on January 14, 2008. |
| (b) | The total return is calculated using the Net Asset Values used for trading at the close of business at period end. |
| (e) | Ratios of expenses to average net assets include interest expenses of less than 0.005% for the six months ended April 30, 2012 and the year ended October 31, 2011, which are not included in the contractual expense limitation. The interest expenses are from utilizing the line of credit as discussed in Note H to Financial Statements. |
| (f) | Effective June 1, 2009, due to the change in Subadviser, the contractual expense limitation was increased from 1.10% to 1.40% excluding interest, brokerage commissions, other investment related costs, extraordinary expenses and acquired fund fee’s and expenses. |
|
See accompanying Notes to Financial Statements. |
| 116 |
| |
| | | | |
Aston Funds | | | | |
ASTON/M.D. Sass Enhanced Equity Fund – Class I | | | April 30, 2012 | |
Financial Highlights | | | | |
| | | | | | | | | | | | |
| | | Six Months
Ended
04/30/12
(unaudited) | | | Year
Ended
10/31/11 | | | Period
Ended
10/31/10(a) | |
Net Asset Value, Beginning of Period | | $ | 9.62 | | | $ | 9.41 | | | $ | 9.04 | |
| | | | | | | | | | | | |
Income from Investment Operations: | | | | | | | | | | | | |
Net investment income | | | 0.09 | | | | 0.16 | | | | 0.09 | |
Net realized and unrealized gain on investments | | | 0.32 | | | | 0.57 | | | | 0.37 | |
| | | | | | | | | | | | |
Total from investment operations | | | 0.41 | | | | 0.73 | | | | 0.46 | |
| | | | | | | | | | | | |
Less Distributions: | | | | | | | | | | | | |
Distributions from and in excess of net investment income | | | (0.09 | ) | | | (0.15 | ) | | | (0.09 | ) |
Distributions from net realized gain on investments | | | (1.04 | ) | | | (0.37 | ) | | | — | |
| | | | | | | | | | | | |
Total distributions | | | (1.13 | ) | | | (0.52 | ) | | | (0.09 | ) |
| | | | | | | | | | | | |
Net increase (decrease) in net asset value | | | (0.72 | ) | | | 0.21 | | | | 0.37 | |
| | | | | | | | | | | | |
Net Asset Value, End of Period | | $ | 8.90 | | | $ | 9.62 | | | $ | 9.41 | |
| | | | | | | | | | | | |
Total Return (b) | | | 4.84 | %(c) | | | 7.97 | % | | | 5.10 | %(c) |
| | | |
Ratios/Supplemental Data: | | | | | | | | | | | | |
Net Assets, End of Period (in 000’s) | | $ | 79,425 | | | $ | 64,840 | | | $ | 46,140 | |
Ratios of expenses to average net assets: | | | | | | | | | | | | |
Before reimbursement, waiver and/or recoupment of expenses by Adviser | | | 0.95 | %(d)(e) | | | 0.99 | %(e) | | | 1.10 | %(d) |
After reimbursement, waiver and/or recoupment of expenses by Adviser | | | 1.05 | %(d)(e) | | | 1.08 | %(e) | | | 1.15 | %(d) |
Ratios of net investment income to average net assets: | | | | | | | | | | | | |
Before reimbursement, waiver and/or recoupment of expenses by Adviser | | | 2.03 | %(d) | | | 1.76 | % | | | 1.37 | %(d) |
After reimbursement, waiver and/or recoupment of expenses by Adviser | | | 1.93 | %(d) | | | 1.66 | % | | | 1.32 | %(d) |
Portfolio Turnover | | | 31.11 | %(c) | | | 87.37 | % | | | 41.33 | %(c) |
| (a) | M.D. Sass Enhanced Equity Fund began issuing Class I shares on March 2, 2010. |
| (b) | The total return is calculated using the Net Asset Values used for trading at the close of business at period end. |
| (e) | Ratios of expenses to average net assets include interest expenses of less than 0.005% for the six months ended April 30, 2012 and the year ended October 31, 2011, which are not included in the contractual expense limitation. The interest expenses are from utilizing the line of credit as discussed in Note H to Financial Statements. |
| | | | |
See accompanying Notes to Financial Statements. | | | | |
| | | 117 | |
| | | | |
| | | | |
Aston Funds | | | | |
ASTON/River Road Long-Short Fund – Class N | | | April 30, 2012 | |
Financial Highlights | | | | |
| | | | | | | | |
| | | Six Months
Ended
04/30/12
(unaudited) | | | Period
Ended
10/31/11(a) | |
Net Asset Value, Beginning of Period | | $ | 9.91 | | | $ | 10.00 | |
| | | | | | | | |
Income from Investment Operations: | | | | | | | | |
Net investment loss | | | (0.12 | ) | | | (0.04 | )(b) |
Net realized and unrealized gain (loss) on investments | | | 0.62 | | | | (0.05 | ) |
| | | | | | | | |
Total from investment operations | | | 0.50 | | | | (0.09 | ) |
| | | | | | | | |
Less Distributions: | | | | | | | | |
Distributions from and in excess of net investment income | | | — | | | | — | |
Distributions from net realized gains on investments | | | — | | | | — | |
| | | | | | | | |
Total distributions | | | — | | | | — | |
| | | | | | | | |
Net increase (decrease) in net asset value | | | 0.50 | | | | (0.09 | ) |
| | | | | | | | |
Net Asset Value, End of Period | | $ | 10.41 | | | $ | 9.91 | |
| | | | | | | | |
Total Return (c) | | | 5.04 | %(d) | | | (0.80 | )%(d) |
| | |
Ratios/Supplemental Data: | | | | | | | | |
Net Assets, End of Period (in 000’s) | | $ | 5,551 | | | $ | 4,594 | |
Ratios of expenses to average net assets: | | | | | | | | |
Before reimbursement and/or waiver of expenses by Adviser including interest and dividend expense for securities sold short | | | 6.76 | %(e) | | | 8.68 | %(e) |
After reimbursement and/or waiver of expenses by Adviser including interest and dividend expense for securities sold short | | | 3.75 | %(e) | | | 2.72 | %(e) |
After reimbursement and/or waiver of expenses by Adviser excluding interest and dividend expense for securities sold short | | | 1.70 | %(e) | | | 1.70 | %(e) |
Ratios of net investment loss to average net assets: | | | | | | | | |
Before reimbursement and/or waiver of expenses by Adviser | | | (5.41 | )%(e) | | | (6.80 | )%(e) |
After reimbursement and/or waiver of expenses by Adviser | | | (2.41 | )%(e) | | | (0.84 | )%(e) |
Portfolio Turnover | | | 149.63 | %(d) | | | 127.32 | %(d) |
| (a) | River Road Long-Short Fund began issuing Class N shares on May 3, 2011. |
| (b) | The selected per share data was calculated using the weighted average shares outstanding method for the period. |
| (c) | The total return is calculated using the Net Asset Values used for trading at the close of business at period end. |
|
See accompanying Notes to Financial Statements. |
| 118 |
| |
| | | | |
Aston Funds | | | | |
ASTON/Neptune International Fund – Class N | | | April 30, 2012 | |
Financial Highlights | | | | |
| | | | | | | | | | | | | | | | | | | | |
| | | Six Months
Ended
04/30/12
(unaudited) | | | Year
Ended
10/31/11 | | | Year
Ended
10/31/10 | | | Year
Ended
10/31/09 | | | Period
Ended
10/31/08(a) | |
Net Asset Value, Beginning of Period | | $ | 7.85 | | | $ | 8.31 | | | $ | 7.09 | | | $ | 5.85 | | | $ | 11.14 | |
| | | | | | | | | | | | | | | | | | | | |
Income from Investment Operations: | | | | | | | | | | | | | | | | | | | | |
Net investment income | | | 0.03 | | | | 0.08 | (b) | | | 0.07 | (b) | | | 0.09 | (b) | | | 0.02 | (b) |
Net realized and unrealized gain (loss) on investments | | | 0.24 | | | | (0.46 | ) | | | 1.55 | (c) | | | 1.18 | (c) | | | (5.31 | ) |
| | | | | | | | | | | | | | | | | | | | |
Total from investment operations | | | 0.27 | | | | (0.38 | ) | | | 1.62 | | | | 1.27 | | | | (5.29 | ) |
| | | | | | | | | | | | | | | | | | | | |
Less Distributions: | | | | | | | | | | | | | | | | | | | | |
Distributions from and in excess of net investment income | | | — | | | | (0.08 | ) | | | (0.40 | ) | | | (0.03 | ) | | | — | |
| | | | | | | | | | | | | | | | | | | | |
Total distributions | | | — | | | | (0.08 | ) | | | (0.40 | ) | | | (0.03 | ) | | | — | |
| | | | | | | | | | | | | | | | | | | | |
Net increase (decrease) in net asset value | | | 0.27 | | | | (0.46 | ) | | | 1.22 | | | | 1.24 | | | | (5.29 | ) |
| | | | | | | | | | | | | | | | | | | | |
Net Asset Value, End of Period | | $ | 8.12 | | | $ | 7.85 | | | $ | 8.31 | | | $ | 7.09 | | | $ | 5.85 | |
| | | | | | | | | | | | | | | | | | | | |
Total Return (d) | | | 3.44 | %(e) | | | (4.63 | )% | | | 23.76 | % | | | 21.94 | % | | | (47.49 | )%(e) |
| | | | | |
Ratios/Supplemental Data: | | | | | | | | | | | | | | | | | | | | |
Net Assets, End of Period (in 000’s) | | $ | 362 | | | $ | 366 | | | $ | 432 | | | $ | 293 | | | $ | 225 | |
Ratios of expenses to average net assets: | | | | | | | | | | | | | | | | | | | | |
Before reimbursement and/or waiver of expenses by Adviser | | | 8.38 | %(f) | | | 7.73 | % | | | 8.58 | %(g) | | | 2.64 | % | | | 3.15 | %(f) |
After reimbursement and/or waiver of expenses by Adviser | | | 1.27 | %(f) | | | 1.27 | % | | | 1.28 | %(g) | | | 1.27 | % | | | 1.27 | %(f) |
Ratios of net investment income (loss) to average net assets: | | | | | | | | | | | | | | | | | | | | |
Before reimbursement and/or waiver of expenses by Adviser | | | (6.38 | )%(f) | | | (5.55 | )% | | | (6.29 | )% | | | 0.07 | % | | | (1.24 | )%(f) |
After reimbursement and/or waiver of expenses by Adviser | | | 0.73 | %(f) | | | 0.92 | % | | | 1.01 | % | | | 1.44 | % | | | 0.64 | %(f) |
Portfolio Turnover | | | 8.28 | %(e) | | | 23.01 | % | | | 18.94 | % | | | 42.65 | % | | | 7.39 | % |
| (a) | Neptune International Fund began issuing Class N shares on June 16, 2008. |
| (b) | The selected per share data was calculated using the weighted average shares outstanding method for the period. |
| (c) | Includes payments by affiliates of $0.01 per share for the year ended October 31, 2010 and less than $0.005 per share for the year ended October 31, 2009. |
| (d) | The total return is calculated using the Net Asset Values used for trading at the close of business at period end. |
| (g) | Ratios of expenses to average net assets include interest expense of 0.01% for the year ended October 31, 2010, which is not included in the contractual expense limitation. The interest expense is from utilizing the line of credit as discussed in Note H to Financial Statements. |
| | | | |
See accompanying Notes to Financial Statements. | | | | |
| | | 119 | |
| | | | |
| | | | |
Aston Funds | | | | |
ASTON/Neptune International Fund – Class I | | | April 30, 2012 | |
Financial Highlights | | | | |
| | | | | | | | | | | | | | | | | | | | | | | | |
| | | Six Months
Ended
04/30/12
(unaudited) | | | Year
Ended
10/31/11 | | | Year
Ended
10/31/10 | | | Year
Ended
10/31/09 | | | Year
Ended
10/31/08 | | | Period
Ended
10/31/07(a) | |
Net Asset Value, Beginning of Period | | $ | 7.87 | | | $ | 8.32 | | | $ | 7.09 | | | $ | 5.85 | | | $ | 12.24 | | | $ | 10.00 | |
| | | | | | | | | | | | | | | | | | | | | | | | |
Income from Investment Operations: | | | | | | | | | | | | | | | | | | | | | | | | |
Net investment income | | | 0.04 | | | | 0.10 | (b) | | | 0.09 | (b) | | | 0.10 | (b) | | | 0.17 | (b) | | | 0.03 | |
Net realized and unrealized gain (loss) on investments | | | 0.23 | | | | (0.45 | ) | | | 1.55 | (c) | | | 1.19 | (c) | | | (6.42 | ) | | | 2.21 | |
| | | | | | | | | | | | | | | | | | | | | | | | |
Total from investment operations | | | 0.27 | | | | (0.35 | ) | | | 1.64 | | | | 1.29 | | | | (6.25 | ) | | | 2.24 | |
| | | | | | | | | | | | | | | | | | | | | | | | |
Less Distributions: | | | | | | | | | | | | | | | | | | | | | | | | |
Distributions from and in excess of net investment income | | | (0.01 | ) | | | (0.10 | ) | | | (0.41 | ) | | | (0.05 | ) | | | (0.14 | ) | | | — | |
| | | | | | | | | | | | | | | | | | | | | | | | |
Total distributions | | | (0.01 | ) | | | (0.10 | ) | | | (0.41 | ) | | | (0.05 | ) | | | (0.14 | ) | | | — | |
| | | | | | | | | | | | | | | | | | | | | | | | |
Net increase (decrease) in net asset value | | | 0.26 | | | | (0.45 | ) | | | 1.23 | | | | 1.24 | | | | (6.39 | ) | | | 2.24 | |
| | | | | | | | | | | | | | | | | | | | | | | | |
Net Asset Value, End of Period | | $ | 8.13 | | | $ | 7.87 | | | $ | 8.32 | | | $ | 7.09 | | | $ | 5.85 | | | $ | 12.24 | |
| | | | | | | | | | | | | | | | | | | | | | | | |
Total Return (d) | | | 3.49 | %(e) | | | (4.36 | )% | | | 24.16 | % | | | 22.23 | % | | | (51.55 | )% | | | 22.30 | %(e) |
| | | | | | |
Ratios/Supplemental Data: | | | | | | | | | | | | | | | | | | | | | | | | |
Net Assets, End of Period (in 000’s) | | $ | 1,423 | | | $ | 1,376 | | | $ | 1,443 | | | $ | 1,194 | | | $ | 8,378 | | | $ | 2,370 | |
Ratios of expenses to average net assets: | | | | | | | | | | | | | | | | | | | | | | | | |
Before reimbursement and/or waiver of expenses by Adviser | | | 8.13 | %(f) | | | 7.48 | % | | | 8.33 | %(g) | | | 2.39 | % | | | 3.02 | % | | | 11.72 | %(f) |
After reimbursement and/or waiver of expenses by Adviser | | | 1.02 | %(f) | | | 1.02 | % | | | 1.03 | %(g) | | | 1.02 | % | | | 1.04 | %(h) | | | 1.25 | %(f) |
Ratios of net investment income (loss) to average net assets: | | | | | | | | | | | | | | | | | | | | | | | | |
Before reimbursement and/or waiver of expenses by Adviser | | | (6.13 | )%(f) | | | (5.30 | )% | | | (6.04 | )% | | | 0.32 | % | | | (0.24 | )% | | | (9.21 | )%(f) |
After reimbursement and/or waiver of expenses by Adviser | | | 0.98 | %(f) | | | 1.17 | % | | | 1.26 | % | | | 1.69 | % | | | 1.74 | % | | | 1.26 | %(f) |
Portfolio Turnover | | | 8.28 | %(e) | | | 23.01 | % | | | 18.94 | % | | | 42.65 | % | | | 7.39 | % | | | 5.14 | %(e) |
| (a) | Neptune International Fund began issuing Class I shares on August 3, 2007. |
| (b) | The selected per share data was calculated using the weighted average shares outstanding method for the period. |
| (c) | Includes payments by affiliates of $0.01 per share for the year ended October 31, 2010 and less than $0.005 per share for the year ended October 31, 2009. |
| (d) | The total return is calculated using the Net Asset Values used for trading at the close of business at period end. |
| (g) | Ratios of expenses to average net assets include interest expense of 0.01% for the year ended October 31, 2010, which is not included in the contractual expense limitation. The interest expense is from utilizing the line of credit as discussed in Note H to Financial Statements. |
| (h) | Effective February 11, 2008, the contractual expense limitation of 1.40% was removed and the Adviser agreed to voluntarily waive management fees and/or reimburse expenses for the Fund so that the net expense ratio is no more than 1.02%, excluding interest, brokerage commissions, other investment related costs, extraordinary expenses and acquired fund fees and expenses, for Class I Shares. This voluntary waiver became the contractual expense limitation on February 29, 2008. For the period February 11, 2008 through February 29, 2008, the Adviser contractually waived management fees and/or reimbursed expenses of 1.40%, excluding interest, brokerage commissions, other investments related costs, extraordinary expenses and acquired fund fees and expenses. Effective February 29, 2008, the Adviser implemented a voluntary expense limitation of 1.02% for Class I Shares. Subsequently on February 29, 2008, the Adviser removed the voluntary expense limitation and replaced it with a contractual expense limitation of 1.02% |
|
See accompanying Notes to Financial Statements. |
| 120 |
| |
| | | | |
Aston Funds | | | | |
ASTON/Barings International Fund – Class N | | | April 30, 2012 | |
Financial Highlights | | | | |
| | | | | | | | | | | | |
| | | Six Months
Ended
04/30/12
(unaudited) | | | Year
Ended
10/31/11 | | | Period
Ended
10/31/10(a) | |
Net Asset Value, Beginning of Period | | $ | 6.81 | | | $ | 7.24 | | | $ | 6.48 | |
| | | | | | | | | | | | |
Income from Investment Operations: | | | | | | | | | | | | |
Net investment income | | | 0.05 | (b) | | | 0.07 | (b) | | | 0.06 | (b) |
Net realized and unrealized gain (loss) on investments | | | 0.28 | | | | (0.37 | ) | | | 0.70 | |
| | | | | | | | | | | | |
Total from investment operations | | | 0.33 | | | | (0.30 | ) | | | 0.76 | |
| | | | | | | | | | | | |
Less Distributions: | | | | | | | | | | | | |
Distributions from and in excess of net investment income | | | (0.04 | ) | | | (0.13 | ) | | | — | |
Distributions from net realized gain on investments | | | (0.17 | ) | | | — | | | | — | |
| | | | | | | | | | | | |
Total distributions | | | (0.21 | ) | | | (0.13 | ) | | | — | |
| | | | | | | | | | | | |
Net increase (decrease) in net asset value | | | 0.12 | | | | (0.43 | ) | | | 0.76 | |
| | | | | | | | | | | | |
Net Asset Value, End of Period | | $ | 6.93 | | | $ | 6.81 | | | $ | 7.24 | |
| | | | | | | | | | | | |
Total Return (c) | | | 5.19 | %(d) | | | (4.22 | )% | | | 11.73 | %(d) |
| | | |
Ratios/Supplemental Data: | | | | | | | | | | | | |
Net Assets, End of Period (in 000’s) | | $ | 414 | | | $ | 393 | | | $ | 184 | |
Ratios of expenses to average net assets: | | | | | | | | | | | | |
Before reimbursement and/or waiver of expenses by Adviser | | | 1.62 | %(e) | | | 1.68 | %(f) | | | 1.72 | %(e) |
After reimbursement and/or waiver of expenses by Adviser | | | 1.40 | %(e) | | | 1.40 | %(f) | | | 1.40 | %(e) |
Ratios of net investment income to average net assets: | | | | | | | | | | | | |
Before reimbursement and/or waiver of expenses by Adviser | | | 1.40 | %(e) | | | 0.76 | %(f) | | | 1.07 | %(e) |
After reimbursement and/or waiver of expenses by Adviser | | | 1.62 | %(e) | | | 1.04 | %(f) | | | 1.39 | %(e) |
Portfolio Turnover | | | 18.97 | %(d) | | | 58.96 | % | | | 65.32 | %(d) |
| (a) | Barings International Fund began issuing Class N shares on March 2, 2010. |
| (b) | The selected per share data was calculated using the weighted average shares outstanding method for the period. |
| (c) | The total return is calculated using the Net Asset Values used for trading at the close of business at period end. |
| (f) | For the period November 1, 2010 through February 28, 2011, the Adviser voluntarily waived management fees and/or reimbursed expenses at 1.40%. Effective March 1, 2011, the contractual expense limitation was decreased from 1.50% to 1.40% excluding interest, brokerage commissions, other investment related costs, extraordinary expenses and acquired fund fees and expenses. |
| | | | |
See accompanying Notes to Financial Statements. | | | | |
| | | 121 | |
| | | | |
| | | | |
Aston Funds | | | | |
ASTON/Barings International Fund – Class I | | | April 30, 2012 | |
Financial Highlights | | | | |
| | | | | | | | | | | | | | | | | | | | |
| | | Six Months
Ended
04/30/12
(unaudited) | | | Year
Ended
10/31/11 | | | Year
Ended
10/31/10 | | | Year
Ended
10/31/09 | | | Period
Ended
10/31/08(a) | |
Net Asset Value, Beginning of Period | | $ | 6.82 | | | $ | 7.26 | | | $ | 6.44 | | | $ | 5.08 | | | $ | 10.00 | |
| | | | | | | | | | | | | | | | | | | | |
Income from Investment Operations: | | | | | | | | | | | | | | | | | | | | |
Net investment income | | | 0.06 | (b) | | | 0.09 | (b) | | | 0.06 | (b) | | | 0.10 | (b) | | | 0.10 | |
Net realized and unrealized gain (loss) on investments | | | 0.28 | | | | (0.38 | ) | | | 0.78 | | | | 1.27 | (c) | | | (5.02 | ) |
| | | | | | | | | | | | | | | | | | | | |
Total from investment operations | | | 0.34 | | | | (0.29 | ) | | | 0.84 | | | | 1.37 | | | | (4.92 | ) |
| | | | | | | | | | | | | | | | | | | | |
Less Distributions: | | | | | | | | | | | | | | | | | | | | |
Distributions from and in excess of net investment income | | | (0.06 | ) | | | (0.15 | ) | | | (0.02 | ) | | | (0.01 | ) | | | — | |
Distributions from net realized gain on investments | | | (0.17 | ) | | | — | | | | — | | | | — | | | | — | |
| | | | | | | | | | | | | | | | | | | | |
Total distributions | | | (0.23 | ) | | | (0.15 | ) | | | (0.02 | ) | | | (0.01 | ) | | | — | |
| | | | | | | | | | | | | | | | | | | | |
Net increase (decrease) in net asset value | | | 0.11 | | | | (0.44 | ) | | | 0.82 | | | | 1.36 | | | | (4.92 | ) |
| | | | | | | | | | | | | | | | | | | | |
Net Asset Value, End of Period | | $ | 6.93 | | | $ | 6.82 | | | $ | 7.26 | | | $ | 6.44 | | | $ | 5.08 | |
| | | | | | | | | | | | | | | | | | | | |
Total Return (d) | | | 5.33 | %(e) | | | (4.09 | )% | | | 12.89 | % | | | 27.11 | % | | | (49.20 | )%(e) |
| | | | | |
Ratios/Supplemental Data: | | | | | | | | | | | | | | | | | | | | |
Net Assets, End of Period (in 000’s) | | $ | 63,765 | | | $ | 52,390 | | | $ | 47,985 | | | $ | 28,277 | | | $ | 5,517 | |
Ratios of expenses to average net assets: | | | | | | | | | | | | | | | | | | | | |
Before reimbursement and/or waiver of expenses by Adviser | | | 1.37 | %(f) | | | 1.43 | %(g) | | | 1.47 | % | | | 2.01 | % | | | 3.95 | %(f)(h) |
After reimbursement and/or waiver of expenses by Adviser | | | 1.15 | %(f) | | | 1.15 | %(g) | | | 1.15 | % | | | 1.15 | % | | | 1.18 | %(f)(h) |
Ratios of net investment income (loss)to average net assets: | | | | | | | | | | | | | | | | | | | | |
Before reimbursement and/or waiver of expenses by Adviser | | | 1.65 | %(f) | | | 1.01 | % | | | 0.63 | % | | | 0.80 | % | | | (1.11 | )%(f) |
After reimbursement and/or waiver of expenses by Adviser | | | 1.87 | %(f) | | | 1.29 | % | | | 0.95 | % | | | 1.66 | % | | | 1.66 | %(f) |
Portfolio Turnover | | | 18.97 | %(e) | | | 58.96 | % | | | 65.32 | % | | | 115.51 | % | | | 121.99 | %(e) |
| (a) | Barings International Fund began issuing Class I shares on November 1, 2007. |
| (b) | The selected per share data was calculated using the weighted average shares outstanding method for the period. |
| (c) | Includes payments by affiliates of less than $0.005 per share. |
| (d) | The total return is calculated using the Net Asset Values used for trading at the close of business at period end. |
| (g) | For the period November 1, 2010 through February 28, 2011, the Adviser voluntarily waived management fees and/or reimbursed expenses at 1.15%. Effective March 1, 2011, the contractual expense limitation was decreased from 1.25% to 1.15% excluding interest, brokerage commissions, other investment related costs, extraordinary expenses and acquired fund fees and expenses. |
| (h) | Ratios of expenses to average net assets include interest expense of less than 0.01% for the period ended October 31, 2008, which is not included in the contractual or voluntary expense limitations. The interest expense is from utilizing the line of credit as discussed in Note H to Financial Statements. |
|
See accompanying Notes to Financial Statements. |
| 122 |
| |
| | | | |
Aston Funds | | | | |
ASTON/Harrison Street Real Estate Fund – Class N | | | April 30, 2012 | |
Financial Highlights | | | | |
| | | | | | | | | | | | | | | | | | | | | | | | |
| | | Six Months
Ended
04/30/12
(unaudited) | | | Year
Ended
10/31/11 | | | Year
Ended
10/31/10 | | | Year
Ended
10/31/09 | | | Year
Ended
10/31/08 | | | Year
Ended
10/31/07 | |
Net Asset Value, Beginning of Period | | $ | 8.97 | | | $ | 8.16 | | | $ | 5.77 | | | $ | 6.08 | | | $ | 15.59 | | | $ | 19.99 | |
| | | | | | | | | | | | | | | | | | | | | | | | |
Income from Investment Operations: | | | | | | | | | | | | | | | | | | | | | | | | |
Net investment income | | | 0.08 | (a) | | | 0.15 | (a) | | | 0.14 | (a) | | | 0.15 | (a) | | | 0.07 | (a) | | | 0.30 | (a) |
Net realized and unrealized gain (loss) on investments | | | 1.29 | | | | 0.79 | | | | 2.36 | | | | (0.28 | ) | | | (5.50 | ) | | | (0.40 | ) |
| | | | | | | | | | | | | | | | | | | | | | | | |
Total from investment operations | | | 1.37 | | | | 0.94 | | | | 2.50 | | | | (0.13 | ) | | | (5.43 | ) | | | (0.10 | ) |
| | | | | | | | | | | | | | | | | | | | | | | | |
Less Distributions: | | | | | | | | | | | | | | | | | | | | | | | | |
Distributions from and in excess of net investment income | | | (0.07 | ) | | | (0.13 | ) | | | (0.11 | ) | | | (0.18 | ) | | | (0.09 | ) | | | (0.05 | ) |
Distributions from net realized gain on investments | | | — | | | | — | | | | — | | | | — | | | | (3.99 | ) | | | (4.25 | ) |
| | | | | | | | | | | | | | | | | | | | | | | | |
Total distributions | | | (0.07 | ) | | | (0.13 | ) | | | (0.11 | ) | | | (0.18 | ) | | | (4.08 | ) | | | (4.30 | ) |
| | | | | | | | | | | | | | | | | | | | | | | | |
Net increase (decrease) in net asset value | | | 1.30 | | | | 0.81 | | | | 2.39 | | | | (0.31 | ) | | | (9.51 | ) | | | (4.40 | ) |
| | | | | | | | | | | | | | | | | | | | | | | | |
Net Asset Value, End of Period | | $ | 10.27 | | | $ | 8.97 | | | $ | 8.16 | | | $ | 5.77 | | | $ | 6.08 | | | $ | 15.59 | |
| | | | | | | | | | | | | | | | | | | | | | | | |
Total Return (b) | | | 15.38 | %(c) | | | 11.66 | % | | | 43.77 | % | | | (1.44 | )% | | | (43.76 | )% | | | (1.41 | )% |
| | | | | | |
Ratios/Supplemental Data: | | | | | | | | | | | | | | | | | | | | | | | | |
| | | | | | |
Net Assets, End of Period (in 000’s) | | $ | 8,735 | | | $ | 6,287 | | | $ | 6,158 | | | $ | 4,011 | | | $ | 6,030 | | | $ | 49,123 | |
Ratios of expenses to average net assets: | | | | | | | | | | | | | | | | | | | | | | | | |
Before reimbursement and/or waiver of expenses by Adviser | | | 2.27 | %(d) | | | 1.61 | %(e) | | | 1.68 | %(e) | | | 1.94 | % | | | 1.57 | %(e) | | | 1.46 | %(e) |
After reimbursement and/or waiver of expenses by Adviser | | | 1.37 | %(d) | | | 1.29 | %(e) | | | 1.37 | %(e) | | | 1.37 | % | | | 1.37 | %(e) | | | 1.37 | %(e) |
Ratios of net investment income to average net assets: | | | | | | | | | | | | | | | | | | | | | | | | |
Before reimbursement and/or waiver of expenses by Adviser | | | 0.81 | %(d) | | | 1.36 | % | | | 1.65 | % | | | 2.55 | % | | | 0.49 | % | | | 1.73 | % |
After reimbursement and/or waiver of expenses by Adviser | | | 1.70 | %(d) | | | 1.68 | % | | | 1.96 | % | | | 3.12 | % | | | 0.69 | % | | | 1.82 | % |
Portfolio Turnover | | | 27.53 | %(c)(f) | | | 143.86 | % | | | 75.30 | % | | | 139.76 | % | | | 85.08 | % | | | 88.75 | % |
| (a) | The selected per share data was calculated using the weighted average shares outstanding method for the period. |
| (b) | The total return is calculated using the Net Asset Values used for trading at the close of business at period end. |
| (e) | Ratios of expenses to average net assets include interest expenses of less than 0.005% for the years ended October 31, 2011, October 31, 2010, October 31, 2008 and October 31, 2007, which are not included in the contractual expense limitation. The interest expenses are from utilizing the line of credit as discussed in Note H to Financial Statements. |
| (f) | Portfolio turnover rate excludes securities delivered from processing a redemption-in-kind. |
| | | | |
See accompanying Notes to Financial Statements. | | | | |
| | | 123 | |
| | | | |
| | | | |
Aston Funds | | | | |
ASTON/Harrison Street Real Estate Fund – Class I | | | April 30, 2012 | |
Financial Highlights | | | | |
| | | | | | | | | | | | | | | | | | | | | | | | |
| | | Six Months
Ended
04/30/12
(unaudited) | | | Year
Ended
10/31/11 | | | Year
Ended
10/31/10 | | | Year
Ended
10/31/09 | | | Year
Ended
10/31/08 | | | Year
Ended
10/31/07 | |
Net Asset Value, Beginning of Period | | $ | 8.92 | | | $ | 8.12 | | | $ | 5.74 | | | $ | 6.08 | | | $ | 15.62 | | | $ | 20.00 | |
| | | | | | | | | | | | | | | | | | | | | | | | |
Income from Investment Operations: | | | | | | | | | | | | | | | | | | | | | | | | |
Net investment income | | | 0.08 | (a) | | | 0.16 | (a) | | | 0.16 | (a) | | | 0.16 | (a) | | | 0.09 | (a) | | | 0.34 | (a) |
Net realized and unrealized gain (loss) on investments | | | 1.30 | | | | 0.79 | | | | 2.34 | | | | (0.28 | ) | | | (5.51 | ) | | | (0.40 | ) |
| | | | | | | | | | | | | | | | | | | | | | | | |
Total from investment operations | | | 1.38 | | | | 0.95 | | | | 2.50 | | | | (0.12 | ) | | | (5.42 | ) | | | (0.06 | ) |
| | | | | | | | | | | | | | | | | | | | | | | | |
Less Distributions: | | | | | | | | | | | | | | | | | | | | | | | | |
Distributions from and in excess of net investment income | | | (0.09 | ) | | | (0.15 | ) | | | (0.12 | ) | | | (0.22 | ) | | | (0.13 | ) | | | (0.07 | ) |
Distributions from net realized gain on investments | | | — | | | | — | | | | — | | | | — | | | | (3.99 | ) | | | (4.25 | ) |
| | | | | | | | | | | | | | | | | | | | | | | | |
Total distributions | | | (0.09 | ) | | | (0.15 | ) | | | (0.12 | ) | | | (0.22 | ) | | | (4.12 | ) | | | (4.32 | ) |
| | | | | | | | | | | | | | | | | | | | | | | | |
Net increase (decrease) in net asset value | | | 1.29 | | | | 0.80 | | | | 2.38 | | | | (0.34 | ) | | | (9.54 | ) | | | (4.38 | ) |
| | | | | | | | | | | | | | | | | | | | | | | | |
Net Asset Value, End of Period | | $ | 10.21 | | | $ | 8.92 | | | $ | 8.12 | | | $ | 5.74 | | | $ | 6.08 | | | $ | 15.62 | |
| | | | | | | | | | | | | | | | | | | | | | | | |
Total Return (b) | | | 15.56 | %(c) | | | 11.82 | % | | | 44.14 | % | | | (1.27 | )% | | | (43.58 | )% | | | (1.18 | )% |
| | | | | | |
Ratios/Supplemental Data: | | | | | | | | | | | | | | | | | | | | | | | | |
Net Assets, End of Period (in 000’s) | | $ | 94 | | | $ | 32,925 | | | $ | 29,425 | | | $ | 21,905 | | | $ | 23,411 | | | $ | 41,545 | |
Ratios of expenses to average net assets: | | | | | | | | | | | | | | | | | | | | | | | | |
Before reimbursement and/or waiver of expenses by Adviser | | | 2.02 | %(d) | | | 1.44 | %(e) | | | 1.43 | %(e) | | | 1.69 | % | | | 1.32 | %(e) | | | 1.20 | %(e) |
After reimbursement and/or waiver of expenses by Adviser | | | 1.12 | %(d) | | | 1.12 | %(e) | | | 1.12 | %(e) | | | 1.12 | % | | | 1.12 | %(e) | | | 1.11 | %(e) |
Ratios of net investment income to average net assets: | | | | | | | | | | | | | | | | | | | | | | | | |
Before reimbursement and/or waiver of expenses by Adviser | | | 1.06 | %(d) | | | 1.53 | % | | | 1.90 | % | | | 2.80 | % | | | 0.74 | % | | | 1.99 | % |
After reimbursement and/or waiver of expenses by Adviser | | | 1.95 | %(d) | | | 1.85 | % | | | 2.21 | % | | | 3.37 | % | | | 0.94 | % | | | 2.08 | % |
Portfolio Turnover | | | 27.53 | %(c)(f) | | | 143.86 | % | | | 75.30 | % | | | 139.76 | % | | | 85.08 | % | | | 88.75 | % |
| (a) | The selected per share data was calculated using the weighted average shares outstanding method for the period. |
| (b) | The total return is calculated using the Net Asset Values used for trading at the close of business at period end. |
| (e) | Ratios of expenses to average net assets include interest expenses of less than 0.005% for the years ended October 31, 2011, October 31, 2010, October 31, 2008 and October 31, 2007, which are not included in the contractual expense limitation. The interest expenses are from utilizing the line of credit as discussed in Note H to Financial Statements. |
| (f) | Portfolio turnover rate excludes securities delivered from processing a redemption-in-kind. |
|
See accompanying Notes to Financial Statements. |
| 124 |
| |
| | | | |
Aston Funds | | | | |
ASTON/Montag & Caldwell Balanced Fund – Class N | | | April 30, 2012 | |
Financial Highlights | | | | |
| | | | | | | | | | | | | | | | | | | | | | | | |
| | | Six Months
Ended
04/30/12
(unaudited) | | | Year
Ended
10/31/11 | | | Year
Ended
10/31/10 | | | Year
Ended
10/31/09 | | | Year
Ended
10/31/08 | | | Year
Ended
10/31/07 | |
Net Asset Value, Beginning of Period | | $ | 20.09 | | | $ | 19.13 | | | $ | 17.73 | | | $ | 15.61 | | | $ | 19.98 | | | $ | 17.21 | |
| | | | | | | | | | | | | | | | | | | | | | | | |
Income from Investment Operations: | | | | | | | | | | | | | | | | | | | | | | | | |
Net investment income | | | 0.08 | (a) | | | 0.15 | (a) | | | 0.21 | (a) | | | 0.21 | (a) | | | 0.29 | | | | 0.19 | (a) |
Net realized and unrealized gain (loss) on investments | | | 1.37 | | | | 1.03 | | | | 1.47 | | | | 2.15 | | | | (4.42 | ) | | | 2.82 | |
| | | | | | | | | �� | | | | | | | | | | | | | | | |
Total from investment operations | | | 1.45 | | | | 1.18 | | | | 1.68 | | | | 2.36 | | | | (4.13 | ) | | | 3.01 | |
| | | | | | | | | | | | | | | | | | | | | | | | |
Less Distributions: | | | | | | | | | | | | | | | | | | | | | | | | |
Distributions from and in excess of net investment income | | | (0.12 | ) | | | (0.22 | ) | | | (0.28 | ) | | | (0.24 | ) | | | (0.24 | ) | | | (0.24 | ) |
| | | | | | | | | | | | | | | | | | | | | | | | |
Total distributions | | | (0.12 | ) | | | (0.22 | ) | | | (0.28 | ) | | | (0.24 | ) | | | (0.24 | ) | | | (0.24 | ) |
| | | | | | | | | | | | | | | | | | | | | | | | |
Net increase (decrease) in net asset value . | | | 1.33 | | | | 0.96 | | | | 1.40 | | | | 2.12 | | | | (4.37 | ) | | | 2.77 | |
| | | | | | | | | | | | | | | | | | | | | | | | |
Net Asset Value, End of Period | | $ | 21.42 | | | $ | 20.09 | | | $ | 19.13 | | | $ | 17.73 | | | $ | 15.61 | | | $ | 19.98 | |
| | | | | | | | | | | | | | | | | | | | | | | | |
Total Return (b) | | | 7.25 | %(c) | | | 6.20 | % | | | 9.54 | % | | | 15.32 | % | | | (20.87 | )% | | | 17.63 | % |
| | | | | | |
Ratios/Supplemental Data: | | | | | | | | | | | | | | | | | | | | | | | | |
Net Assets, End of Period (in 000’s) | | $ | 30,255 | | | $ | 23,315 | | | $ | 29,194 | | | $ | 14,938 | | | $ | 16,586 | | | $ | 16,703 | |
Ratios of expenses to average net assets: | | | | | | | | | | | | | | | | | | | | | | | | |
Before reimbursement and/or waiver of expenses by Adviser | | | 1.48 | %(d) | | | 1.57 | %(e) | | | 1.38 | % | | | 1.73 | % | | | 1.74 | % | | | 1.72 | %(e) |
After reimbursement and/or waiver of expenses by Adviser | | | 1.25 | %(d) | | | 1.35 | %(e) | | | 1.13 | % | | | 1.26 | % | | | 1.35 | % | | | 1.36 | %(e) |
Ratios of net investment income to average net assets: | | | | | | | | | | | | | | | | | | | | | | | | |
Before reimbursement and/or waiver of expenses by Adviser | | | 0.59 | %(d) | | | 0.53 | % | | | 0.89 | % | | | 0.81 | % | | | 0.74 | % | | | 0.71 | % |
After reimbursement and/or waiver of expenses by Adviser | | | 0.82 | %(d) | | | 0.76 | % | | | 1.15 | % | | | 1.28 | % | | | 1.13 | % | | | 1.07 | % |
Portfolio Turnover | | | 18.31 | %(c) | | | 40.31 | % | | | 51.68 | %(f) | | | 38.72 | % | | | 43.65 | % | | | 36.25 | % |
| (a) | The selected per share data was calculated using the weighed average shares outstanding method for the period. |
| (b) | The total return is calculated using the Net Asset Values used for trading at the close of business at period end. |
| (e) | Ratios of expenses to average net assets include interest expenses of less than 0.005% for the year ended October 31, 2011 and 0.01% for the year ended October 31, 2007, which are not included in the voluntary expense limitation. The interest expenses are from utilizing the line of credit as discussed in Note H to Financial Statements. |
| (f) | Portfolio turnover rate excludes securities received from a reorganization. |
| | | | |
See accompanying Notes to Financial Statements. | | | | |
| | | 125 | |
| | | | |
| | | | |
Aston Funds | | | | |
ASTON/Montag & Caldwell Balanced Fund – Class I | | | April 30, 2012 | |
Financial Highlights | | | | |
| | | | | | | | | | | | | | | | | | | | | | | | |
| | | Six Months
Ended
04/30/12
(unaudited) | | | Year
Ended
10/31/11 | | | Year
Ended
10/31/10 | | | Year
Ended
10/31/09 | | | Year
Ended
10/31/08 | | | Year
Ended
10/31/07 | |
Net Asset Value, Beginning of Period | | $ | 20.05 | | | $ | 19.08 | | | $ | 17.68 | | | $ | 15.57 | | | $ | 19.94 | | | $ | 17.19 | |
| | | | | | | | | | | | | | | | | | | | | | | | |
Income from Investment Operations: | | | | | | | | | | | | | | | | | | | | | | | | |
Net investment income | | | 0.10 | (a) | | | 0.20 | (a) | | | 0.22 | (a) | | | 0.23 | (a) | | | 0.27 | | | | 0.24 | (a) |
Net realized and unrealized gain (loss) on investments | | | 1.36 | | | | 1.04 | | | | 1.46 | | | | 2.16 | | | | (4.35 | ) | | | 2.80 | |
| | | | | | | | | | | | | | | | | | | | | | | | |
Total from investment operations | | | 1.46 | | | | 1.24 | | | | 1.68 | | | | 2.39 | | | | (4.08 | ) | | | 3.04 | |
| | | | | | | | | | | | | | | | | | | | | | | | |
Less Distributions: | | | | | | | | | | | | | | | | | | | | | | | | |
Distributions from and in excess of net investment income | | | (0.14 | ) | | | (0.27 | ) | | | (0.28 | ) | | | (0.28 | ) | | | (0.29 | ) | | | (0.29 | ) |
| | | | | | | | | | | | | | | | | | | | | | | | |
Total distributions | | | (0.14 | ) | | | (0.27 | ) | | | (0.28 | ) | | | (0.28 | ) | | | (0.29 | ) | | | (0.29 | ) |
| | | | | | | | | | | | | | | | | | | | | | | | |
Net increase (decrease) in net asset value | | | 1.32 | | | | 0.97 | | | | 1.40 | | | | 2.11 | | | | (4.37 | ) | | | 2.75 | |
| | | | | | | | | | | | | | | | | | | | | | | | |
Net Asset Value, End of Period | | $ | 21.37 | | | $ | 20.05 | | | $ | 19.08 | | | $ | 17.68 | | | $ | 15.57 | | | $ | 19.94 | |
| | | | | | | | | | | | | | | | | | | | | | | | |
Total Return (b) | | | 7.31 | %(c) | | | 6.52 | % | | | 9.57 | % | | | 15.53 | % | | | (20.71 | )% | | | 17.87 | % |
| | | | | | |
Ratios/Supplemental Data: | | | | | | | | | | | | | | | | | | | | | | | | |
Net Assets, End of Period (in 000’s) | | $ | 1,506 | | | $ | 1,415 | | | $ | 1,362 | | | $ | 1,149 | | | $ | 919 | | | $ | 1,158 | |
Ratios of expenses to average net assets: | | | | | | | | | | | | | | | | | | | | | | | | |
Before reimbursement and/or waiver of expenses by Adviser | | | 1.33 | %(d) | | | 1.32 | %(e) | | | 1.35 | % | | | 1.57 | % | | | 1.49 | % | | | 1.44 | %(e) |
After reimbursement and/or waiver of expenses by Adviser | | | 1.10 | %(d) | | | 1.10 | %(e) | | | 1.10 | % | | | 1.10 | % | | | 1.10 | % | | | 1.08 | %(e) |
Ratios of net investment income to average net assets: | | | | | | | | | | | | | | | | | | | | | | | | |
Before reimbursement and/or waiver of expenses by Adviser | | | 0.74 | %(d) | | | 0.79 | % | | | 0.92 | % | | | 0.97 | % | | | 0.99 | % | | | 0.99 | % |
After reimbursement and/or waiver of expenses by Adviser | | | 0.97 | %(d) | | | 1.02 | % | | | 1.17 | % | | | 1.44 | % | | | 1.38 | % | | | 1.35 | % |
Portfolio Turnover | | | 18.31 | %(c) | | | 40.31 | % | | | 51.68 | %(f) | | | 38.72 | % | | | 43.65 | % | | | 36.25 | % |
| (a) | The selected per share data was calculated using the weighted average shares outstanding method for the period. |
| (b) | The total return is calculated using the Net Asset Values used for trading at the close of business at period end. |
| (e) | Ratios of expenses to average net assets include interest expenses of less than 0.01% for the years ended October 31, 2011 and October 31, 2007, which are not included in the voluntary expense limitation. The interest expenses are from utilizing the line of credit as discussed in Note H to Financial Statements. |
| (f) | Portfolio turnover rate includes securities received from a reorganization. |
|
See accompanying Notes to Financial Statements. |
| 126 |
| |
| | | | |
Aston Funds | | | | |
| | | April 30, 2012 | |
Notes to Financial Statements (unaudited) | | | | |
Note (A) Fund Organization: Aston Funds (the “Trust”) was organized as a Delaware statutory trust under a Declaration of Trust dated September 10, 1993. The Trust is registered under the Investment Company Act of 1940, as amended, (the “1940 Act”) as an open-end management investment company with 26 separate portfolios (each a “Fund” and collectively the “Funds”) as of April 30, 2012.
Aston Asset Management, LP (“Aston” or the “Adviser”) the investment adviser and the administrator, manages each Fund by retaining one or more subadvisers (each, a “Subadviser”) to manage each Fund. The following 26 portfolios of the Trust are included in these financial statements:
ASTON/Montag & Caldwell Growth Fund (the “M&C Growth Fund”)
ASTON/Veredus Select Growth Fund
(the “Veredus Select Growth Fund”)
ASTON/TAMRO Diversified Equity Fund
(the “TAMRO Diversified Equity Fund”)
ASTON/Herndon Large Cap Value Fund
(the “Herndon Large Cap Value Fund”)
ASTON/Cornerstone Large Cap Value Fund
(the “Cornerstone Large Cap Value Fund”)
ASTON/River Road Dividend All Cap Value Fund
(the “River Road Dividend All Cap Value Fund”)
ASTON/Fairpointe Mid Cap Fund
(the “Fairpointe Mid Cap Fund”)
ASTON/Montag & Caldwell Mid Cap Growth Fund
(the “M&C Mid Cap Growth Fund”)
ASTON/Cardinal Mid Cap Value Fund
(the “Cardinal Mid Cap Value Fund”)
ASTON/Veredus Small Cap Growth Fund, formerly the ASTON/Veredus Aggressive Growth Fund
(the “Veredus Small Cap Growth Fund”)
ASTON Small Cap Growth Fund, formerly the ASTON/Crosswind Small Cap Growth Fund
(the “Small Cap Growth Fund”)
ASTON/Silvercrest Small Cap Fund
(the “Silvercrest Small Cap Fund”)
ASTON/TAMRO Small Cap Fund
(the “TAMRO Small Cap Fund”)
ASTON/River Road Select Value Fund
(the “River Road Select Value Fund”)
ASTON/River Road Small Cap Value Fund
(the “River Road Small Cap Value Fund”)
ASTON/River Road Independent Value Fund
(the “River Road Independent Value Fund”)
ASTON/DoubleLine Core Plus Fixed Income Fund
(“the “DoubleLine Core Plus Fixed Income Fund”)
ASTON/TCH Fixed Income Fund
(the “TCH Fixed Income Fund”)
ASTON/Lake Partners LASSO Alternatives Fund
(the “Lake Partners LASSO Alternatives Fund”)
ASTON Dynamic Allocation Fund
(the “Dynamic Allocation Fund”)
ASTON/M.D. Sass Enhanced Equity Fund
(the “M.D. Sass Enhanced Equity Fund”)
ASTON/River Road Long-Short Fund
(the “River Road Long-Short Fund”)
ASTON/Neptune International Fund
(the “Neptune International Fund”)
ASTON/Barings International Fund
(the “Barings International Fund”)
ASTON/Harrison Street Real Estate Fund
(the “Harrison Street Real Estate Fund”)
ASTON/Montag & Caldwell Balanced Fund
(the “M&C Balanced Fund”)
M&C Growth Fund is authorized to issue three classes of shares (Class N Shares, Class I Shares and Class R Shares). The following funds are each authorized to issue two classes of shares (Class N Shares and Class I Shares): Veredus Select Growth Fund, TAMRO Diversified Equity Fund, Herndon Large Cap Value Fund, Cornerstone Large Cap Value Fund, River Road Dividend All Cap Value Fund, Fairpointe Mid Cap Fund, Veredus Small Cap Growth Fund, Small Cap Growth Fund, Silvercrest Small Cap Fund, TAMRO Small Cap Fund, River Road Select Value Fund, River Road Small Cap Value Fund, River Road Independent Value Fund, DoubleLine Core Plus Fixed Income Fund, TCH Fixed Income Fund, Lake Partners LASSO Alternatives Fund, Dynamic Allocation Fund, M.D. Sass Enhanced Equity Fund, Neptune International Fund, Barings International Fund, Harrison Street Real Estate Fund and M&C Balanced Fund. The following Funds are each authorized to issue one class of shares (Class N Shares): M&C Mid Cap Growth Fund, Cardinal Mid Cap Value Fund and River Road Long-Short Fund. Each class of shares is substantially the same except that certain classes of shares bear class specific expenses, which include distribution fees. TAMRO Small Cap Fund, River Road Independent Value Fund and River Road Dividend All Cap Value Fund are closed to new investors until further notice.
The investment objectives of the Funds are as follows:
| | |
| M&C Growth Fund | | Long-term capital appreciation and, secondarily, current income, by investing primarily in common stocks and convertible securities. |
| |
| Veredus Select | | Capital appreciation. |
| Growth Fund | | |
| |
| TAMRO Diversified | | Long-term capital appreciation. |
| Equity Fund | | |
| |
| Herndon Large | | Long-term capital appreciation. |
| Cap Value Fund | | |
| |
| Cornerstone Large Cap Value Fund | | Total return through long-term capital appreciation and current income. |
| |
River Road Dividend All Cap Value Fund | | High current income and, secondarily, long-term capital appreciation. |
| |
| Fairpointe Mid Cap Fund | | Long-term total return through capital appreciation by investing primarily in common and preferred stocks and convertible securities. |
| |
| M&C Mid Cap Growth Fund | | Long-term capital appreciation and secondarily, current income, by investing primarily in common stocks and convertible securities. |
| | | | |
Aston Funds | | | | |
| | | April 30, 2012 | |
Notes to Financial Statements (unaudited) – continued | | | | |
| | |
| Cardinal Mid Cap | | High level of total return. |
| Value Fund | | |
| |
| Veredus Small Cap Growth Fund | | Capital appreciation. |
| |
| Small Cap Growth Fund | | Long-term capital appreciation. |
| |
| Silvercrest Small Cap Fund | | Long-term capital appreciation. |
| |
| TAMRO Small Cap Fund | | Long-term capital appreciation. |
| |
| River Road Select Value Fund | | Long-term capital appreciation. |
| |
| River Road Small Cap Value Fund | | Long-term capital appreciation. |
| |
| River Road Independent Value Fund | | Long-term total return. |
| |
| DoubleLine Core Plus Fixed Income Fund | | Maximize total return. |
| |
| TCH Fixed Income Fund | | High current income consistent with prudent risk of capital. |
| |
| Lake Partners LASSO Alternatives Fund | | Long term total return with reduced correlation to the conventional stock and bond markets. |
| |
| Dynamic Allocation Fund | | Long-term capital appreciation. |
| |
| M.D. Sass Enhanced Equity Fund | | Total return through a combination of a high level of current income and capital appreciation. |
| |
| River Road Long- Short Fund | | Absolute return while minimizing volatility over a fund market cycle |
| |
| Neptune International Fund | | Long-term capital appreciation. |
| |
| Barings International Fund | | Total return. |
| |
| Harrison Street Real Estate Fund | | Total return through a combination of growth and income. |
| |
| M&C Balanced Fund | | Long-term total return. |
Note (B) Significant Accounting Policies: The following is a summary of the significant accounting policies consistently followed by each Fund in the preparation of its financial statements. These policies are in conformity with U.S. generally accepted accounting principles (“U.S. GAAP”).
(1) Security Valuation: Equity securities, closed-end funds, exchange traded funds, index options traded on a national securities exchange, and over-the-counter securities listed on the NASDAQ National Market System are valued at the last sale price or the NASDAQ Official Closing Price (“NOCP”), if applicable. If no last sale price or NOCP, if applicable, is reported, the mean of the last bid and asked prices may be used. Fixed income securities, except short-term investments, are valued on the basis of mean prices provided by a pricing service when such prices are believed by the Adviser to reflect the current market value of such securities in accordance with guidelines adopted by the Board of Trustees. The pricing service provider may employ methodologies that utilize actual market transactions,
broker-dealer supplied valuations, or other electronic data processing techniques. Such techniques generally consider such factors as security prices, yields, maturities, call features, ratings and developments relating to specific securities in arriving at valuations. If accurate market quotations are not available, securities are valued at fair value as determined by the Adviser in accordance with guidelines adopted by the Board of Trustees. Short-term investments, that is, those with maturities of 60 days or less, are valued at amortized cost, which approximates fair value. Repurchase agreements are valued at cost. Investments in money market funds and other mutual funds are valued at the underlying fund’s net asset value (“NAV”) at the date of valuation. Foreign securities are valued at the last sales price on the primary exchange where the security is traded. Under the fair value procedures adopted by the Board of Trustees, the Funds may utilize the services of an independent pricing service to determine fair value prices for foreign securities if certain market events occur.
Certain Funds invest in securities of other investment companies, including exchange traded funds (“ETFs”), open-end funds and closed-end funds. Open-end funds are investment companies that issue new shares continuously and redeem shares daily. Closed-end funds are investment companies that typically issue a fixed number of shares that trade on a securities exchange or over-the-counter. An ETF is an investment company that seeks to track the performance of an index by holding in its portfolio shares of all the companies, or a representative sample of the companies, that are components of a particular index. ETFs are traded on a securities exchange based on their market value. The risks of investment in other investment companies typically reflect the risks of the types of securities in which investment companies invest. Investments in ETFs and closed-end funds are subject to the additional risk that shares of the fund may trade at a premium or discount to their NAV per share. When a Fund invests in another investment company, shareholders of the Fund bear their proportionate share of the other investment company’s fees and expenses, including operating, registration, trustee, licensing and marketing, as well as their share of the Fund’s fees and expenses.
Fair Value Measurements—The inputs and valuation techniques used to measure fair value of the Funds’ net assets are summarized into three levels as described in the hierarchy below:
| | | | | | |
| | | |
| | • | | Level 1 – | | unadjusted quoted prices in active markets for identical assets or liabilities |
| | | |
| | • | | Level 2 – | | other significant observable inputs (including quoted prices for similar securities, interest rates, prepayment speeds, credit risk, etc.) |
| | | |
| | • | | Level 3 – | | significant unobservable inputs (including the Funds’ own assumptions in determining the fair value of investments) |
| | | | |
Aston Funds | | | | |
| | | April 30, 2012 | |
Notes to Financial Statements (unaudited) – continued | | | | |
The inputs or methodology used for valuing securities are not necessarily an indication of the risk associated with investing in those securities. Transfers in and out of the levels are recognized at the market value at the end of the period. The summary of each Fund’s investments that are measured at fair value by Level within the fair value hierarchy as of April 30, 2012 is as follows:
| | | | | | | | | | | | | | | | |
Funds | | Total Value at
04/30/12 | | | Level 1
Quoted Prices | | | Level 2
Significant
Observable
Inputs | | | Level 3
Significant
Unobservable
Inputs | |
Montag & Caldwell Growth Fund | | | | | | | | | | | | | | | | |
Assets | | | | | | | | | | | | | | | | |
Investments in Securities* | | $ | 3,699,914,905 | | | $ | 3,699,914,905 | | | $ | — | | | $ | — | |
| | | | | | | | | | | | | | | | |
Veredus Select Growth Fund | | | | | | | | | | | | | | | | |
Assets | | | | | | | | | | | | | | | | |
Investments in Securities* | | $ | 49,025,778 | | | $ | 49,025,778 | | | $ | — | | | $ | — | |
| | | | | | | | | | | | | | | | |
TAMRO Diversified Equity Fund | | | | | | | | | | | | | | | | |
Assets | | | | | | | | | | | | | | | | |
Common Stocks* | | $ | 21,717,529 | | | $ | 21,717,529 | | | $ | — | | | $ | — | |
Investment Company* | | | 313,373 | | | | 313,373 | | | | — | | | | — | |
Derivatives | | | | | | | | | | | | | | | | |
Equity Options Contracts | | | 94,163 | | | | 94,163 | | | | — | | | | — | |
| | | | | | | | | | | | | | | | |
Total | | $ | 22,125,065 | | | $ | 22,125,065 | | | $ | — | | | $ | — | |
| | | | | | | | | | | | | | | | |
Herndon Large Cap Value Fund | | | | | | | | | | | | | | | | |
Assets | | | | | | | | | | | | | | | | |
Investments in Securities* | | $ | 47,794,312 | | | $ | 47,794,312 | | | $ | — | | | $ | — | |
| | | | | | | | | | | | | | | | |
Cornerstone Large Cap Value Fund | | | | | | | | | | | | | | | | |
Assets | | | | | | | | | | | | | | | | |
Investments in Securities* | | $ | 26,061,372 | | | $ | 26,061,372 | | | $ | — | | | $ | — | |
| | | | | | | | | | | | | | | | |
River Road Dividend All Cap Value Fund | | | | | | | | | | | | | | | | |
Assets | | | | | | | | | | | | | | | | |
Investments in Securities* | | $ | 852,997,485 | | | $ | 852,997,485 | | | $ | — | | | $ | — | |
| | | | | | | | | | | | | | | | |
Fairpointe Mid Cap Fund | | | | | | | | | | | | | | | | |
Assets | | | | | | | | | | | | | | | | |
Investments in Securities* | | $ | 2,980,010,904 | | | $ | 2,980,010,904 | | | $ | — | | | $ | — | |
| | | | | | | | | | | | | | | | |
Montag & Caldwell Mid Cap Growth Fund | | | | | | | | | | | | | | | | |
Assets | | | | | | | | | | | | | | | | |
Investments in Securities* | | $ | 6,788,347 | | | $ | 6,788,347 | | | $ | — | | | $ | — | |
| | | | | | | | | | | | | | | | |
Cardinal Mid Cap Value Fund | | | | | | | | | | | | | | | | |
Assets | | | | | | | | | | | | | | | | |
Investments in Securities* | | $ | 1,902,250 | | | $ | 1,902,250 | | | $ | — | | | $ | — | |
| | | | | | | | | | | | | | | | |
Veredus Small Cap Growth Fund | | | | | | | | | | | | | | | | |
Assets | | | | | | | | | | | | | | | | |
Investment in Securities* | | $ | 27,425,058 | | | $ | 27,425,058 | | | $ | — | | | $ | — | |
| | | | | | | | | | | | | | | | |
Small Cap Growth Fund | | | | | | | | | | | | | | | | |
Assets | | | | | | | | | | | | | | | | |
Investment in Securities* | | $ | 8,790,691 | | | $ | 8,790,691 | | | $ | — | | | $ | — | |
| | | | | | | | | | | | | | | | |
Silvercrest Small Cap Fund | | | | | | | | | | | | | | | | |
Assets | | | | | | | | | | | | | | | | |
Investments in Securities* | | $ | 3,940,779 | | | $ | 3,940,779 | | | $ | — | | | $ | — | |
| | | | | | | | | | | | | | | | |
| | | | |
Aston Funds | | | | |
| | | April 30, 2012 | |
Notes to Financial Statements (unaudited) – continued | | | | |
| | | | | | | | | | | | | | | | |
Funds | | Total
Value at
04/30/12 | | | Level 1
Quoted
Prices | | | Level 2
Significant
Observable
Inputs | | | Level 3
Significant
Unobservable
Inputs | |
TAMRO Small Cap Fund | | | | | | | | | | | | | | | | |
Assets | | | | | | | | | | | | | | | | |
Common Stocks | | | | | | | | | | | | | | | | |
Consumer Discretionary | | $ | 191,999,512 | | | $ | 174,752,542 | | | $ | 17,246,970 | | | $ | — | |
Consumer Staples | | | 61,335,950 | | | | 61,335,950 | | | | — | | | | — | |
Energy | | | 81,195,891 | | | | 81,195,891 | | | | — | | | | — | |
Financials | | | 198,161,792 | | | | 198,161,792 | | | | — | | | | — | |
Healthcare | | | 173,231,507 | | | | 173,231,507 | | | | — | | | | — | |
Industrials | | | 173,023,046 | | | | 173,023,046 | | | | — | | | | — | |
Information Technology | | | 118,220,907 | | | | 105,783,227 | | | | 12,437,680 | | | | — | |
Materials | | | 39,591,183 | | | | 39,591,183 | | | | — | | | | — | |
| | | | | | | | | | | | | | | | |
Total Common Stocks | | | 1,036,759,788 | | | | 1,007,075,138 | | | | 29,684,650 | | | | — | |
| | | | | | | | | | | | | | | | |
Investment Company* | | | 31,299,969 | | | | 31,299,969 | | | | — | | | | — | |
| | | | | | | | | | | | | | | | |
Total | | $ | 1,068,059,757 | | | $ | 1,038,375,107 | | | $ | 29,684,650 | | | $ | — | |
| | | | | | | | | | | | | | | | |
River Road Select Value Fund | | | | | | | | | | | | | | | | |
Assets | | | | | | | | | | | | | | | | |
Investments in Securities* | | $ | 148,852,000 | | | $ | 148,852,000 | | | $ | — | | | $ | — | |
| | | | | | | | | | | | | | | | |
River Road Small Cap Value Fund | | | | | | | | | | | | | | | | |
Assets | | | | | | | | | | | | | | | | |
Common Stocks | | | | | | | | | | | | | | | | |
Consumer Discretionary | | $ | 75,312,874 | | | $ | 68,913,011 | | | $ | 6,399,863 | | | $ | — | |
Consumer Staples | | | 23,516,435 | | | | 18,774,865 | | | | 4,741,570 | | | | — | |
Energy | | | 19,085,873 | | | | 19,085,873 | | | | — | | | | — | |
Financials | | | 39,820,472 | | | | 39,820,472 | | | | — | | | | — | |
Healthcare | | | 26,709,687 | | | | 26,709,687 | | | | — | | | | — | |
Industrials | | | 48,530,048 | | | | 48,530,048 | | | | — | | | | — | |
Information Technology | | | 41,682,390 | | | | 41,682,390 | | | | — | | | | — | |
Materials | | | 6,750,226 | | | | 6,750,226 | | | | — | | | | — | |
Telecommunication Services | | | 2,300,072 | | | | 2,300,072 | | | | — | | | | — | |
Utilities | | | 3,940,864 | | | | 3,940,864 | | | | — | | | | — | |
| | | | | | | | | | | | | | | | |
Total Common Stocks | | $ | 287,648,941 | | | $ | 276,507,508 | | | $ | 11,141,433 | | | $ | — | |
| | | | | | | | | | | | | | | | |
River Road Independent Value Fund | | | | | | | | | | | | | | | | |
Assets | | | | | | | | | | | | | | | | |
Common Stocks | | | | | | | | | | | | | | | | |
Consumer Discretionary | | $ | 59,600,078 | | | $ | 41,481,238 | | | $ | 18,118,840 | | | $ | — | |
Consumer Staples | | | 21,546,501 | | | | 18,219,281 | | | | 3,327,220 | | | | — | |
Energy | | | 32,132,479 | | | | 32,132,479 | | | | — | | | | — | |
Financials | | | 20,041,764 | | | | 16,262,666 | | | | 3,779,098 | | | | — | |
Health Care | | | 61,946,727 | | | | 61,946,727 | | | | — | | | | — | |
Industrials | | | 15,849,515 | | | | 15,849,515 | | | | — | | | | — | |
Information Technology | | | 45,775,167 | | | | 45,775,167 | | | | — | | | | — | |
Materials | | | 17,645,332 | | | | 17,645,332 | | | | — | | | | — | |
Utilities | | | 13,368,022 | | | | 8,551,653 | | | | 4,816,369 | | | | — | |
| | | | | | | | | | | | | | | | |
Total Common Stocks | | | 287,905,585 | | | | 257,864,058 | | | | 30,041,527 | | | | — | |
| | | | | | | | | | | | | | | | |
Investment Company* | | | 313,543,869 | | | | 313,543,869 | | | | — | | | | — | |
| | | | | | | | | | | | | | | | |
Total | | $ | 601,449,454 | | | $ | 571,407,927 | | | $ | 30,041,527 | | | $ | — | |
| | | | | | | | | | | | | | | | |
DoubleLine Core Plus Fixed Income Fund | | | | | | | | | | | | | | | | |
Assets | | | | | | | | | | | | | | | | |
Agency Collateralized Mortgage Obligation | | $ | 14,867,267 | | | $ | — | | | $ | 14,867,267 | | | $ | — | |
U.S. Government Obligations | | | 14,641,766 | | | | — | | | | 14,641,766 | | | | — | |
U.S. Government Mortgage-Backed Securities | | | 4,339,271 | | | | — | | | | 4,339,271 | | | | — | |
Corporate Notes and Bonds | | | 23,545,714 | | | | — | | | | 23,545,714 | | | | — | |
Collateralized Mortgage-Backed Securities | | | 12,089,851 | | | | — | | | | 12,089,851 | | | | — | |
Asset-Backed Securities | | | 1,730,440 | | | | — | | | | 1,730,440 | | | | — | |
Foreign Government Bond | | | 2,856,617 | | | | — | | | | 2,856,617 | | | | — | |
| | | | | | | | | | | | | | | | |
Total | | $ | 74,070,926 | | | $ | — | | | $ | 74,070,926 | | | $ | — | |
| | | | | | | | | | | | | | | | |
| | | | |
Aston Funds | | | | |
| | | April 30, 2012 | |
Notes to Financial Statements (unaudited) – continued | | | | |
| | | | | | | | | | | | | | | | |
Funds | | Total
Value at
04/30/12 | | | Level 1
Quoted
Prices | | | Level 2
Significant
Observable
Inputs | | | Level 3
Significant
Unobservable
Inputs | |
TCH Fixed Income Fund | | | | | | | | | | | | | | | | |
Assets | | | | | | | | | | | | | | | | |
Corporate Notes and Bonds | | $ | 44,804,993 | | | $ | — | | | $ | 44,804,993 | | | $ | — | |
U.S. Government and Agency Obligations | | | 18,328,242 | | | | — | | | | 18,328,242 | | | | — | |
Commercial Mortgage-Backed Securities | | | 1,117,841 | | | | — | | | | 1,117,841 | | | | — | |
Asset-Backed Securities | | | 5,091,446 | | | | — | | | | 5,091,446 | | | | — | |
Foreign Government Bond | | | 1,232,688 | | | | — | | | | 1,232,688 | | | | — | |
Investment Company* | | | 1,741,634 | | | | 1,741,634 | | | | — | | | | — | |
| | | | | | | | | | | | | | | | |
Total | | $ | 72,316,844 | | | $ | 1,741,634 | | | $ | 70,575,210 | | | $ | — | |
| | | | | | | | | | | | | | | | |
Lake Partners LASSO Alternatives Fund | | | | | | | | | | | | | | | | |
Assets | | | | | | | | | | | | | | | | |
Investments in Securities* | | $ | 263,207,637 | | | $ | 263,207,637 | | | $ | — | | | $ | — | |
| | | | | | | | | | | | | | | | |
Dynamic Allocation Fund | | | | | | | | | | | | | | | | |
Assets | | | | | | | | | | | | | | | | |
Investments in Securities* | | $ | 37,041,242 | | | $ | 37,041,242 | | | $ | — | | | $ | — | |
| | | | | | | | | | | | | | | | |
M.D. Sass Enhanced Equity Fund | | | | | | | | | | | | | | | | |
Assets | | | | | | | | | | | | | | | | |
Common Stocks* | | $ | 144,986,939 | | | $ | 144,986,939 | | | $ | — | | | $ | — | |
Investment Company* | | | 6,475,318 | | | | 6,475,318 | | | | — | | | | — | |
Derivatives | | | | | | | | | | | | | | | | |
Equity Contracts | | | 823,981 | | | | 823,981 | | | | — | | | | — | |
| | | | | | | | | | | | | | | | |
Total Assets | | | 152,286,238 | | | | 152,286,238 | | | | — | | | | — | |
| | | | | | | | | | | | | | | | |
| | | | |
Liabilities | | | | | | | | | | | | | | | | |
Derivatives | | | | | | | | | | | | | | | | |
Equity Contracts | | | (3,539,587 | ) | | | (3,539,587 | ) | | | — | | | | — | |
| | | | | | | | | | | | | | | | |
Total Liabilities | | | (3,539,587 | ) | | | (3,539,587 | ) | | | — | | | | — | |
| | | | | | | | | | | | | | | | |
Total | | $ | 148,746,651 | | | $ | 148,746,651 | | | $ | — | | | $ | — | |
| | | | | | | | | | | | | | | | |
River Road Long-Short Fund | | | | | | | | | | | | | | | | |
Assets | | | | | | | | | | | | | | | | |
Investments in Securities* | | $ | 5,534,742 | | | $ | 5,534,742 | | | $ | — | | | $ | — | |
| | | | | | | | | | | | | | | | |
Total Assets | | | 5,534,742 | | | | 5,534,742 | | | | — | | | | — | |
| | | | | | | | | | | | | | | | |
| | | | |
Liabilities | | | | | | | | | | | | | | | | |
Short Sales* | | | (1,255,999 | ) | | | (1,255,999 | ) | | | — | | | | — | |
| | | | | | | | | | | | | | | | |
Total Liabilities | | | (1,255,999 | ) | | | (1,255,999 | ) | | | — | | | | — | |
| | | | | | | | | | | | | | | | |
Total | | $ | 4,278,743 | | | $ | 4,278,743 | | | $ | — | | | $ | — | |
| | | | | | | | | | | | | | | | |
Neptune International Fund | | | | | | | | | | | | | | | | |
Assets | | | | | | | | | | | | | | | | |
Common Stocks | | | | | | | | | | | | | | | | |
Australia | | $ | 44,153 | | | $ | 44,153 | | | $ | — | | | $ | — | |
Brazil | | | 23,540 | | | | 23,540 | | | | — | | | | — | |
China | | | 434,322 | | | | 434,322 | | | | — | | | | — | |
France | | | 125,658 | | | | 125,658 | | | | — | | | | — | |
India | | | 23,675 | | | | 23,675 | | | | — | | | | — | |
Japan | | | 181,714 | | | | 181,714 | | | | — | | | | — | |
Netherlands | | | 53,590 | | | | 53,590 | | | | — | | | | — | |
Norway | | | 49,048 | | | | 49,048 | | | | — | | | | — | |
Russia | | | 199,265 | | | | 199,265 | | | | — | | | | — | |
Switzerland | | | 44,114 | | | | 44,114 | | | | — | | | | — | |
Taiwan | | | 46,740 | | | | 46,740 | | | | — | | | | — | |
United Kingdom | | | 526,615 | | | | 525,755 | | | | — | | | | 860 | |
| | | | | | | | | | | | | | | | |
Total Common Stocks | | | 1,752,434 | | | | 1,751,574 | | | | — | | | | 860 | |
| | | | | | | | | | | | | | | | |
Investment Company* | | | 12,243 | | | | 12,243 | | | | — | | | | — | |
| | | | | | | | | | | | | | | | |
Total | | $ | 1,764,677 | | | $ | 1,763,817 | | | | | | | $ | 860 | |
| | | | | | | | | | | | | | | | |
| | | | |
Aston Funds | | | | |
| | | April 30, 2012 | |
Notes to Financial Statements (unaudited) – continued | | | | |
| | | | | | | | | | | | | | | | |
Funds | | Total
Value at
04/30/12 | | | Level 1 Quoted
Prices | | | Level 2
Significant
Observable
Inputs | | | Level 3
Significant
Unobservable
Inputs | |
Barings International Fund | | | | | | | | | | | | | | | | |
Assets | | | | | | | | | | | | | | | | |
Common Stocks | | | | | | | | | | | | | | | | |
Australia | | $ | 1,609,705 | | | $ | 1,609,705 | | | $ | — | | | $ | — | |
Belgium | | | 1,062,102 | | | | 1,062,102 | | | | — | | | | — | |
China | | | 1,008,520 | | | | 1,008,520 | | | | — | | | | — | |
France | | | 3,886,462 | | | | 3,886,462 | | | | — | | | | — | |
Germany | | | 6,186,631 | | | | 6,186,631 | | | | — | | | | — | |
Hong Kong | | | 784,157 | | | | 784,157 | | | | — | | | | — | |
India | | | 835,096 | | | | 835,096 | | | | — | | | | — | |
Israel | | | 2,124,299 | | | | 2,124,299 | | | | — | | | | | |
Japan | | | 13,216,904 | | | | 13,216,904 | | | | — | | | | — | |
Mexico | | | 1,987,045 | | | | 1,987,045 | | | | — | | | | — | |
Netherlands | | | 914,411 | | | | 914,411 | | | | — | | | | — | |
Papua New Guinea | | | 1,107,501 | | | | 1,107,501 | | | | — | | | | — | |
Russia | | | 875,367 | | | | 875,367 | | | | — | | | | — | |
Singapore | | | 1,974,606 | | | | 1,974,606 | | | | — | | | | — | |
South Korea | | | 1,992,595 | | | | 1,992,595 | | | | — | | | | — | |
Sweden | | | 872,256 | | | | 872,256 | | | | — | | | | — | |
Switzerland | | | 5,426,930 | | | | 5,426,930 | | | | — | | | | — | |
United Kingdom | | | 16,975,088 | | | | 16,961,799 | | | | — | | | | 13,289 | |
| | | | | | | | | | | | | | | | |
Total Common Stocks | | | 62,839,675 | | | | 62,826,386 | | | | — | | | | 13,289 | |
| | | | | | | | | | | | | | | | |
Investment Company* | | | 1,607,345 | | | | 1,607,345 | | | | — | | | | — | |
| | | | | | | | | | | | | | | | |
Total0 | | $ | 64,447,020 | | | $ | 64,433,731 | | | $ | — | | | $ | 13,289 | |
| | | | | | | | | | | | | | | | |
Harrison Street Real Estate Fund | | | | | | | | | | | | | | | | |
Assets | | | | | | | | | | | | | | | | |
Investments in Securities* | | $ | 8,861,483 | | | $ | 8,861,483 | | | $ | — | | | $ | — | |
| | | | | | | | | | | | | | | | |
Montag & Caldwell Balanced Fund | | | | | | | | | | | | | | | | |
Assets | | | | | | | | | | | | | | | | |
Common Stocks* | | $ | 17,767,200 | | | $ | 17,767,200 | | | $ | — | | | $ | — | |
Corporate Notes and Bonds | | | 6,977,942 | | | | — | | | | 6,977,942 | | | | — | |
U.S. Government and Agency Obligations | | | 3,828,745 | | | | — | | | | 3,828,745 | | | | — | |
Investment Company* | | | 3,254,277 | | | | 3,254,277 | | | | — | | | | — | |
| | | | | | | | | | | | | | | | |
Total | | $ | 31,828,164 | | | $ | 21,021,477 | | | $ | 10,806,687 | | | $ | — | |
| | | | | | | | | | | | | | | | |
| * | All Common Stocks and Investment Companies are Level 1. Please refer to the Schedule of Investments for industry, sector or country breakout. |
Barings International Fund and Neptune International Fund may utilize an external pricing service to fair value certain foreign securities in the event of any significant market movements between the time these Funds valued such foreign securities and the earlier closing of foreign markets. Such fair valuations are categorized as Level 2 in the hierarchy. Significant market movements were not deemed to have occurred at April 30, 2012, and therefore, the Barings International Fund and the Neptune International Fund did not utilize the external pricing service model adjustments. As a result, certain securities that were held in these Funds at April 30, 2012 and since the beginning of the six-month period, were transferred from Level 2 to Level 1.
At the end of each calendar quarter, management evaluates the Level 2 and 3 assets and liabilities for changes in liquidity, including but not limited to: whether a broker is willing to execute at the quoted price, the depth and consistency of prices from third party services, and the existence of contemporaneous, observable trades in the market. Additionally, management evaluates the Level 1 and 2 assets and liabilities on a quarterly basis for changes in listings or delistings on national exchanges. Due to the inherent
uncertainty of determining the fair value of investments that do not have a readily available market value, the fair value of the Funds’ investments may fluctuate from period to period. Additionally, the fair value of investments may differ significantly from the values that would have been used had a ready market existed for such investments and may differ materially from the values the Funds may ultimately realize. Further, such investments may be subject to legal and other restrictions on resale or otherwise less liquid than publicly-traded securities.
Certain securities that were held at April 30, 2012 and since the beginning of the six-month period in the TAMRO Small Cap Fund, the River Road Small Cap Value Fund and the River Road Independent Value Fund had significant changes in liquidity which resulted in a transfer between levels.
| | | | | | | | |
Funds | | Transfer from
Level 1 to Level 2 | | | Transfer from
Level 2 to Level 1 | |
TAMRO Small Cap Fund | | $ | 29,684,650 | | | $ | 3,913,591 | |
River Road Small Cap Value Fund | | | — | | | | 2,780,316 | |
River Road Independent Value Fund | | | 21,897,938 | | | | — | |
Neptune International Fund | | | — | | | | 1,210,912 | |
Barings International Fund | | | — | | | | 47,769,491 | |
| | | | |
Aston Funds | | | | |
| | | April 30, 2012 | |
Notes to Financial Statements (unaudited) – continued | | | | |
Level 3 holdings were valued using internal valuation techniques which took into consideration factors including previous experience with similar securities of the same issuer, conversion ratio and security terms.
The following is a reconciliation of Level 3 holdings for which significant unobservable inputs were used in determining fair value as of April 30, 2012:
| | | | |
| Neptune International Fund | | Common Stocks | |
Fair Value, beginning of period | | $ | 555 | |
Purchases | | | 854 | |
Sales | | | (534 | ) |
Net realized gains | | | 189 | |
Change in unrealized appreciation (depreciation) | | | (204 | ) |
| | | | |
Fair Value, end of period | | $ | 860 | |
| | | | |
Change in net unrealized appreciation (depreciation)on Level 3 holdings held at end of period | | $ | 305 | |
| | | | |
| | | | |
| Barings International Fund | | Common Stocks | |
Fair Value, beginning of period | | $ | 9,447 | |
Purchases | | | 13,194 | |
Sales | | | (9,094 | ) |
Net realized gains | | | 3,219 | |
Change in unrealized appreciation (depreciation) | | | (3,477 | ) |
| | | | |
Fair Value, end of period | | $ | 13,289 | |
| | | | |
Change in net unrealized appreciation (depreciation)on Level 3 holdings held at end of period | | $ | 3,842 | |
| | | | |
(2) Repurchase Agreements: Each Fund may enter into repurchase agreements with financial institutions deemed to be creditworthy by the Fund’s Adviser or Subadviser, subject to the seller’s agreement to repurchase and the Fund’s agreement to resell such securities at a mutually agreed upon price. Securities purchased subject to repurchase agreements are deposited with the Fund’s custodian and, pursuant to the terms of the repurchase agreement, must have an aggregate market value greater than or equal to the repurchase price plus accrued interest at all times. If the value of the underlying securities falls below the value of the repurchase price plus accrued interest, the Fund will require the seller to deposit additional collateral by the next business day. If the request for additional collateral is not met, or the seller defaults on its repurchase obligation, the Fund has the right to sell the underlying securities at market value and may claim any resulting loss against the seller. As of and during the period ended April 30, 2012, the Funds did not own any repurchase agreements.
(3) When Issued/Delayed Delivery Securities: Each Fund may purchase and sell securities on a “when issued” or “delayed delivery” basis, with settlement to occur at a later date. The value of the security so purchased is subject to market fluctuations during this period. The Funds segregate assets having an aggregate value at least equal to the amount of when issued or delayed delivery purchase commitments until payment is made. As of and during the six month period ended April 30, 2012, the DoubleLine Core Plus Fixed Income Fund and the TCH Fixed Income Fund owned delayed delivery securities.
(4) Mortgage-Backed Securities: M&C Balanced Fund, DoubleLine Core Plus Fixed Income Fund and TCH Fixed Income Fund may invest in mortgage-backed securities (“MBS”), representing interests in pools of mortgage loans. These securities provide shareholders with payments consisting of both principal and interest as the mortgages in the underlying mortgage pools are paid. The timely payment of principal and interest on MBS issued or guaranteed by Ginnie Mae (formerly known as the Government National Mortgage Association) is backed by Ginnie Mae and the full faith and credit of the U.S. government. MBS issued by U.S. government agencies or instrumentalities other than Ginnie Mae are not “full faith and credit” obligations. Certain obligations, such as those issued by the Federal Home Loan Banks, Fannie Mae (formerly known as the Federal National Mortgage Association) and Freddie Mac (formerly known as the Federal Home Loan Mortgage Corporation) are supported only by the credit of the issuer. MBS issued by private issuers are not government securities and are not directly guaranteed by any government agency. They are secured by the underlying collateral of the private issuer. Yields on privately issued MBS tend to be higher than those of government-backed issues. However, risk of loss due to default and sensitivity to interest rate fluctuations are also higher. M&C Balanced Fund, DoubleLine Core Plus Fixed Income Fund and TCH Fixed Income Fund may also invest in collateralized mortgage obligations (“CMO”) and real estate mortgage investment conduits (“REMIC”). A CMO is a bond that is collateralized by a pool of MBS, and a REMIC is similar in form to a CMO. These MBS pools are divided into classes with each class having its own characteristics. The different classes are retired in sequence as the underlying mortgages are repaid.
(5) Securities Sold Short: The River Road Long-Short Fund utilizes short sales as part of its overall portfolio management strategy. A short sale involves the sale of a security that is borrowed from a broker or other institution. A gain, limited to the price at which the Fund sold the security short, or a loss, unlimited in size, will be recognized upon closing a short sale. Short sales expose the Fund to the risk that it will be required to acquire, convert or exchange securities to replace the borrowed securities at a time when the securities sold short have appreciated in value, thus resulting in a loss to the Fund. The Fund making a short sale must segregate liquid assets, or otherwise cover its position in a permissible manner. The liquidity of the assets is determined by the Subadviser, in accordance with procedures established by the Board of Trustees. Cash segregated for short sales is shown in the Statement of Assets and Liabilities as cash held as collateral.
(6) Options Contracts: In the normal course of pursuing its investment objectives, certain Funds are subject to price volatility risk. Certain Funds may write and/or purchase call and put options on securities for hedging purposes, to seek capital appreciation, to mitigate risk and/or to increase exposure. Writing put options or purchasing call options tends to increase a Fund’s exposure to the underlying instrument. Writing call options or purchasing put options tends to decrease a Fund’s exposure to the underlying instrument. When a Fund writes or purchases a call or put option, an amount equal to the premium received or paid by the
| | | | |
Aston Funds | | | | |
| | | April 30, 2012 | |
Notes to Financial Statements (unaudited) – continued | | | | |
Fund is included in a Fund’s Statement of Assets and Liabilities as a liability or an investment and subsequently adjusted to the current market value based on the quoted daily settlement price of the option written or purchased. Premiums received or paid from writing or purchasing options, which expire unexercised, are treated by a Fund on the expiration date as realized gains or losses. The difference between the premium and the amount paid or received on a closing purchase or sale transaction, including brokerage commissions, is also treated as a realized gain or loss. If an option is exercised, the premium paid or received is added to the cost of the purchase or proceeds from the sale in determining whether the Fund has realized a gain or loss on investment transactions. If the Fund writes a covered call option, the Fund forgoes, in exchange for the premium, the opportunity to profit during the option period from an increase in the market value of the underlying security above the exercise price. If the Fund writes a put option it accepts the risk of a decline in the market value of the underlying security below the exercise price. There is the risk a Fund may not be able to enter into a closing transaction because of an illiquid market. The risk associated with purchasing put and call options is limited to the premium paid. Options were traded during the period in the TAMRO Diversified Equity and M.D. Sass Enhanced Equity Funds. See the Schedules of Investments for open options contracts held by TAMRO Diversified Equity and M.D. Sass Enhanced Equity Funds at April 30, 2012. For the six months ended April 30, 2012, the average* volume of derivative activities are as follows:
| | | | | | | | |
Funds | | Purchased
Options
(Cost) | | | Written Options
(Premiums Received) | |
TAMRO Diversified Equity Fund | | $ | 164,311 | | | $ | — | |
M.D. Sass Enhanced Equity Fund | | | 1,464,199 | | | | 2,966,001 | |
| * | estimate based on quarter-end holdings |
(7) Forward Foreign Currency Contracts: In the normal course of pursuing their investment objectives, certain Funds are subject to foreign investment and currency risk. Certain Funds may enter into forward foreign currency contracts (“forward contracts”) for purposes of hedging, duration management, as a substitute for securities, to increase returns, for currency hedging or risk management, or to otherwise help achieve a Fund’s investment goal. These contracts are marked-to-market daily at the applicable translation rates. A Fund records realized gains or losses at the time the forward contract is closed. A forward contract is extinguished through a closing transaction or upon delivery of the currency or entering an offsetting contract. Risks may arise upon entering these contracts from the potential inability of a counterparty to meet the terms of their contracts and from unanticipated movements
in the value of a foreign currency relative to the U.S. dollar or other currencies. During and at the six months ended April 30, 2012, the Neptune International Fund held forward foreign currency contracts. For the six months ended April 30, 2012, the average (estimate based on quarterly holdings) volume of derivative activity was $12,902 of unrealized depreciation.
(8) Disclosures about Derivative Instruments: The following is a table summarizing the fair value of derivatives held at April 30, 2012 by primary risk exposure:
| | | | | | | | |
| | | Asset Derivative
Investments Value | | | Liability Derivative
Investments Value | |
Fund | | Equity
Contracts (a) | | | Equity
Contracts (a) | |
TAMRO Diversified Equity Fund | | $ | 94,163 | | | $ | — | |
M.D. Sass Enhanced Equity Fund | | | 823,981 | | | | (3,539,587 | ) |
| (a) | Statement of Assets and Liabilities location: Total investments at value for purchased options and call options written, at value. |
The effect of derivative instruments on the statement of operations for the six months ended April 30, 2012:
| | | | | | | | | | | | | | | | |
| | | Amount of
Realized Gain (Loss)
on Derivatives | | | Change in Unrealized
Appreciation
(Depreciation) on
Derivatives | |
| | | Equity
Contracts (a) | | | Foreign
Currency
Contracts (a) | | | Equity
Contracts (b) | | | Foreign
Currency
Contracts (a) | |
TAMRO Diversified Equity Fund | | $ | (135,373 | ) | | $ | — | | | $ | 132,322 | | | $ | — | |
M.D. Sass Enhanced Equity Fund | | | (366,434 | ) | | | — | | | | (530,367 | ) | | | — | |
Neptune International Fund | | | — | | | | (38,744 | ) | | | — | | | | 19,353 | |
| (a) | Statement of Operations location: Net realized gain (loss) on purchased options and net realized gain (loss) on written option transactions or net realized gain loss on foreign currency. |
| (b) | Statement of Operations location: Net change in unrealized appreciation (depreciation) on purchased options and net change in unrealized appreciation (depreciation) on written options transactions or translation of of assets and liabilities in foreign currency. |
(9) Investment Income and Securities Transactions: Dividend income is recorded on the ex-dividend date, except for certain dividends from foreign securities where the ex-dividend date may have passed, which are recorded as soon as a Fund is informed of the ex-dividend date. Interest income is accrued daily. Dividend income and interest income are recorded on the Statement of Operations as investment income. Premiums and discounts are amortized or accreted on an effective yield method on fixed income securities. The Funds may be subject to foreign taxes on income, gains on investments or currency repatriation, a portion of which may be recoverable. The Funds will accrue such taxes and reclaims as applicable, based upon their current interpretation of tax rules and regulations that exist in the markets in which the Funds invest. Securities are accounted for on a trade date basis. The cost of securities sold is determined using the identified cost method for the Fairpointe Mid Cap Fund and first in first out (“FIFO”) method for all other Funds.
(10) Foreign Currency: Foreign currencies, investments and other assets and liabilities are translated into U.S. dollars at the exchange rates at the close of the regular trading session on the New York Stock Exchange. Fluctuations in the value of the foreign currencies and other assets and liabilities resulting from changes in exchange rates are recorded as unrealized foreign currency gains (losses). Realized gains (losses) and unrealized appreciation (depreciation) on investment securities and income and expenses are translated on the respective dates of such transactions. The effects of changes in foreign currency exchange rates on investments in securities are segregated on the Statement of Operations from the effects of changes on market prices of those securities, and are included with the net realized and change in unrealized gain or loss on investment securities.
| | | | |
Aston Funds | | | | |
| | | April 30, 2012 | |
Notes to Financial Statements (unaudited) – continued | | | | |
(11) Federal Income Taxes: The Funds have elected to be treated as “regulated investment companies” under Subchapter M of the Internal Revenue Code of 1986, as amended, and to distribute substantially all of their respective net taxable income. Accordingly, no provisions for federal income taxes have been made in the accompanying financial statements. The Funds intend to utilize provisions of the federal income tax laws, which allow them to carry a realized capital loss forward for eight years following the year of the loss and offset such losses against any future realized capital gains.
At October 31, 2011, the following Funds had available realized capital losses to offset future net capital gains through the fiscal year ended:
| | | | | | | | | | | | | | | | | | | | | | | | | | | | |
| | | Capital Loss Carryforward with Tax Year Expirations | |
Fund | | 2013 | | | 2014 | | | 2015 | | | 2016 | | | 2017 | | | 2018 | | | Total | |
Montag & Caldwell Growth Fund | | $ | — | | | $ | — | | | $ | — | | | $ | 15,287,295 | * $ | | | — | | | $ | — | | | $ | 15,287,295 | |
Veredus Select Growth Fund | | | — | | | | — | | | | 1,093,781 | | | | 18,622,365 | | | | — | | | | — | | | | 19,716,146 | |
Cornerstone Large Cap Value Fund | | | — | | | | — | | | | — | | | | 22,414,594 | | | | 6,819,813 | | | | — | | | | 29,234,407 | |
Montag & Caldwell Mid Cap Growth Fund | | | — | | | | — | | | | | | | | 327,840 | | | | — | | | | — | | | | 327,840 | |
Cardinal Mid Cap Value Fund | | | — | | | | — | | | | — | | | | 223,314 | | | | — | | | | — | | | | 223,314 | |
Veredus Small Cap Growth Fund | | | — | | | | — | | | | 4,228,025 | | | | 16,347,889 | | | | — | | | | — | | | | 20,575,914 | |
Small Cap Growth Fund | | | — | | | | — | | | | — | | | | — | | | | — | | | | 59,470 | | | | 59,470 | |
River Road Small Cap Value Fund | | | — | | | | — | | | | — | | | | 11,064,614 | | | | — | | | | — | | | | 11,064,614 | |
TCH Fixed Income Fund | | | 3,698,815 | | | | — | | | | 2,654,917 | | | | 1,270,780 | | | | — | | | | — | | | | 7,624,512 | |
Lake Partners LASSO Alternatives Fund | | | — | | | | — | | | | — | | | | — | | | | — | | | | 4,140,502 | | | | 4,140,502 | |
River Road Long-Short Fund | | | — | | | | — | | | | — | | | | — | | | | — | | | | 100,223 | ** | | | 100,223 | |
Neptune International Fund | | | — | | | | — | | | | 635,048 | | | | 2,673,799 | | | | 52,059 | | | | — | | | | 3,360,906 | |
Harrison Street Real Estate Fund | | | — | | | | — | | | | 3,095,957 | | | | 11,228,110 | | | | — | | | | — | | | | 14,324,067 | |
Montag & Caldwell Balanced Fund | | | — | | | | — | | | | 318,991 | * | | | 2,726,872 | *** | | | — | | | | — | | | | 3,045,863 | |
| * | These capital loss carryforward amounts were acquired in the reorganizations of the Growth Fund into the M&C Growth Fund and the Balanced Fund into the M&C Balanced Fund on March 29, 2010. The Funds’ ability to utilize the capital loss carryforwards is limited under Internal Revenue Service regulations. |
| ** | The Fund is subject to the Regulated Investment Company Modernization Act of 2010 and amount will carryforward as short-term with no expiration date. |
| *** | This capital loss carryforward amount includes $2,088,044 acquired in the reorganization of the Balanced Fund into the M&C Balanced Fund on March 29, 2010. The Fund’s ability to utilize the capital loss carryforwards is limited under Internal Revenue Service regulations. Capital loss carryforwards expire in the tax years indicated above. |
For the year ended October 31, 2011, the following Funds utilized capital losses as follows:
| | | | | | | | | | | | | | | | | | | | | | | | |
| | | Utilized Capital Losses (with Expiration Year) | |
Fund | | 2010 | | | 2013 | | | 2014 | | | 2015 | | | 2016 | | | 2017 | |
Montag & Caldwell Growth Fund | | $ | — | | | $ | — | | | $ | — | | | $ | — | | | $ | 3,189,231 | | | $ | — | |
Veredus Select Growth Fund | | | — | | | | — | | | | — | | | | 2,003,452 | | | | — | | | | — | |
TAMRO Diversified Equity Fund | | | — | | | | — | | | | — | | | | — | | | | 192,977 | | | | — | |
Herndon Large Cap Value Fund | | | — | | | | — | | | | — | | | | — | | | | — | | | | 23,092 | |
Cornerstone Large Cap Value Fund | | | — | | | | — | | | | — | | | | — | | | | 7,459,889 | | | | — | |
River Road Dividend All Cap Value Fund | | | — | | | | — | | | | — | | | | — | | | | 2,543,082 | | | | — | |
Montag & Caldwell Mid Cap Growth Fund | | | — | | | | — | | | | — | | | | 210,270 | | | | 85,761 | | | | — | |
Cardinal Mid Cap Value Fund | | | — | | | | — | | | | — | | | | 20,542 | | | | 70,966 | | | | — | |
Veredus Small Cap Growth Fund | | | — | | | | — | | | | — | | | | 6,557,027 | | | | — | | | | — | |
River Road Small Cap Value Fund | | | — | | | | — | | | | — | | | | 19,839,004 | | | | 25,160,124 | | | | — | |
Barings International Fund | | | — | | | | — | | | | — | | | | 894,769 | | | | 966,034 | | | | — | |
Neptune International Fund | | | — | | | | — | | | | 7,221 | | | | 97,317 | | | | — | | | | — | |
Harrison Street Real Estate Fund | | | — | | | | — | | | | — | | | | 6,954,887 | | | | — | | | | — | |
Montag & Caldwell Balanced Fund | | | 2,339,449 | | | | — | | | | — | | | | — | | | | — | | | | — | |
TCH Fixed Income Fund | | | — | | | | 331,126 | | | | — | | | | — | | | | — | | | | — | |
| | | | |
Aston Funds | | | | |
| | | April 30, 2012 | |
| Notes to Financial Statements (unaudited) – continued | | | | |
For the year ended October 31, 2011, the following Funds had capital losses that expired:
| | | | |
Fund | | Expired
Capital Losses | |
Cornerstone Large Cap Value Fund | | $ | 49,006 | |
River Road Small Cap Value Fund | | | 571,469 | |
Montag & Caldwell Balanced Fund | | | 638,779 | |
Under the recently enacted Regulated Investment Company Modernization Act of 2010, the Funds will be permitted to carry forward capital losses incurred in taxable years beginning after December 22, 2010 for an unlimited period. However, any losses incurred during those future taxable years will be required to be utilized prior to the losses incurred in pre-enactment taxable years. As a result of this ordering rule, pre-enactment capital loss carryforwards may be more likely to expire unused. Additionally, post enactment capital losses that are carried forward will retain their character as either short-term or long-term capital losses rather than being considered all short-term as under previous law. River Road Long-Short Fund, River Road Independent Value Fund, and DoubleLine Core Plus Fixed Income Fund began investment operations after the effective date and are currently subject to the Regulated Investment Company Modernization Act of 2010. The remaining Funds’ first fiscal year end subject to the Regulated Investment Company Modernization Act of 2010 is October 31, 2012.
Management has analyzed the Funds’ tax positions for all open tax years (current and prior three tax years), as well as potential exposure to foreign capital gains withholding taxes, and has concluded that no provision for federal, state, or international income tax is required in the Funds’ financial statements. The Funds’ federal income and excise tax returns for tax years for which the applicable statutes of limitations have not expired are subject to examination by the Internal Revenue Service.
(12) Multi-Class Operations: Each class offered by a Fund that is authorized to offer multiple classes of shares has equal rights as to the Fund’s net assets.
Income, fund and trust level expenses and realized and unrealized capital gains and losses, if any, are allocated to each class of shares based on the relative net assets of each class. Class specific expenses (distribution expenses) are allocated to each class.
(13) Offering Costs: Certain costs were incurred in connection with the offering of the following Funds as disclosed in the table below. The costs associated have been capitalized and are being amortized on a straight-line basis over twelve months based on the commencement date of the Funds, stated below.
| | | | | | | | |
Fund | | Commencement Date | | | Original
Offering Costs | |
River Road Independent Value Fund | | | December 30, 2010 | | | $ | 53,931 | |
River Road Long-Short Fund | | | May 4, 2011 | | | | 70,782 | |
DoubleLine Core Plus Fixed Income Fund | | | July 18, 2011 | | | | 246,370 | |
Silvercrest Small Cap Fund | | | December 27, 2011 | | | | 80,000 | |
(14) Use of Estimates: The preparation of financial statements in conformity with U.S. GAAP requires management to make estimates and assumptions that affect the reported amounts of assets and liabilities and disclosure of contingent assets and liabilities at the date of the financial statements and the reported amounts of revenues and expenses during the reporting period. Actual results could differ from those estimates.
(15) Commitments and Contingencies: In the normal course of business, the Trust enters into contracts on behalf of the Funds that contain a variety of provisions for general indemnifications. Each Fund’s maximum exposure under these arrangements is unknown, as this would involve future claims that may be made against each Fund that are not known at this time. However, based on experience, the Funds believe the risk of loss is remote.
(16) Recent Accounting Pronouncement: In May 2011, the Financial Accounting Standards Board (“FASB”) issued Accounting Standards Update (“ASU”) No. 2011-04 Amendments to Achieve Common Fair Value Measurement and Disclosure Requirements in U.S. GAAP and International Financial Reporting Standards (“IFRS”). ASU 2011-04 includes common requirements for measurement of and disclosure about fair value between U.S. GAAP and IFRS. ASU 2011-04 will require reporting entities to disclose the following information for fair value measurements categorized within Level 3 of the fair value hierarchy: quantitative information about the unobservable inputs used in the fair value measurement, the valuation processes used by the reporting entity and a narrative description of the sensitivity of the fair value measurement to changes in unobservable inputs and the interrelationships between those unobservable inputs. In addition, ASU 2011-04 will require reporting entities to make disclosures about amounts and reasons for all transfers in and out of Level 1 and Level 2 fair value measurements. The new and revised disclosures are effective for interim and annual reporting periods beginning after December 15, 2011. Management is currently evaluating the implications of ASU 2011-04 and its impact on the financial statements.
In December 2011, FASB issued ASU No. 2011-11, Disclosures about Offsetting Assets and Liabilities. ASU 2011-11 requires disclosures to make financial statements that are prepared under U.S. GAAP more comparable to those prepared under IFRS. The new disclosure requirements mandate that entities disclose both gross and net information about instruments and transactions eligible for offset in the statement of assets and liabilities as well as instruments and transactions subject to an agreement similar to a master netting arrangement. In addition, ASU 2011-11 requires disclosure of collateral received and posted in connection with master netting agreements or similar arrangements. New disclosures are required for annual reporting periods beginning on or after January 1, 2013, and interim periods within those annual periods. Management is evaluating the impact of ASU 2011-11 on the financial statements and disclosures.
| | | | |
Aston Funds | | | | |
| | | April 30, 2012 | |
| Notes to Financial Statements (unaudited) – continued | | | | |
Note (C) Dividends from Net Investment Income and Distributions of Capital Gains: Dividends and distributions to shareholders are recorded on the ex-dividend date. River Road Dividend All Cap Value Fund, DoubleLine Core Plus Fixed Income Fund and TCH Fixed Income Fund distribute dividends from net investment income to shareholders monthly and net realized gains from investment transactions, if any, are generally distributed annually, usually in December.
M.D. Sass Enhanced Equity Fund and M&C Balanced Fund distribute dividends from net investment income to shareholders quarterly and net realized gains from investment transactions, if any, are generally distributed annually, usually in December.
The following Funds distribute dividends from net investment income to shareholders annually and net realized gains from investment transactions, if any, are generally distributed annually, usually in December: M&C Growth Fund, Veredus Select Growth Fund, TAMRO Diversified Equity Fund, Herndon Large Cap Value Fund, Cornerstone Large Cap Value Fund, Fairpointe Mid Cap Fund, M&C Mid Cap Growth Fund, Cardinal Mid Cap Value Fund, Veredus Small Cap Growth Fund, Small Cap Growth Fund, Silvercrest Small Cap Fund, TAMRO Small Cap Fund, River Road Select Value Fund, River Road Small Cap Value Fund, River Road Independent Value Fund, Lake Partners LASSO Alternatives Fund, Dynamic Allocation Fund, River Road Long-Short Fund, Neptune International Fund, Barings International Fund and Harrison Street Real Estate Fund.
Dividends and distributions are automatically reinvested in additional Fund shares on ex-date at that day’s ending NAV for the respective Fund for those shareholders who have elected the reinvestment option.
Differences in dividends per share between classes of the following Funds are due to different class expenses: M&C Growth Fund, Veredus Select Growth Fund, TAMRO Diversified Equity Fund, Herndon Large Cap Value Fund, Cornerstone Large Cap Value Fund, River Road Dividend All Cap Value Fund, Fairpointe Mid Cap Fund, Veredus Small Cap Growth Fund, Small Cap Growth Fund, Silvercrest Small Cap Fund, TAMRO Small Cap Fund, River Road Select Value Fund, River Road Small Cap Value Fund, River Road Independent Value Fund, DoubleLine Core Plus Fixed Income Fund, TCH Fixed Income Fund, Lake Partners LASSO Alternatives Fund, Dynamic Allocation Fund, M.D. Sass Enhanced Equity Fund, Neptune International Fund, Barings International Fund, Harrison Street Real Estate Fund and M&C Balanced Fund. Net investment income and realized gains and losses for federal income tax purposes may differ from those reported on the financial statements because of temporary and permanent book and tax basis differences. Permanent differences, such as net operating losses, nondeductible expenses, premium amortization, mark to market on Passive Foreign Investment Companies and adjustment for Real Estate Investment Trusts, are reclassified among capital accounts in the financial statements to reflect their character. Temporary differences, such as deferrals on losses relating to wash sales transactions and capital loss carryovers, arise when income, expenses, gains or losses are recognized in different periods for financial statement and tax purposes; these differences will reverse at some time in the future.
Distributions from net realized gains for book purposes may include short-term capital gains, which are classified as ordinary income for tax purposes.
The tax character of distributions paid during the fiscal years ended 2011 and 2010 was as follows:
| | | | | | | | | | | | | | | | |
| | | Distributions Paid in 2011 | | | Distributions Paid in 2010 | |
| | | Ordinary Income | | | Long-Term
Capital Gains | | | Ordinary Income | | | Long-Term
Capital Gains | |
M&C Growth Fund | | $ | 20,834,824 | | | $ | 5,383,920 | | | $ | 11,497,319 | | | $ | — | |
Veredus Select Growth Fund | | | — | | | | — | | | | 30,200 | | | | — | |
TAMRO Diversified Equity Fund | | | — | | | | — | | | | 22,812 | | | | — | |
Herndon Large Cap Value Fund | | | 13,657 | | | | — | | | | — | | | | — | |
Cornerstone Large Cap Value Fund | | | 1,807,144 | | | | — | | | | 3,983,658 | | | | — | |
River Road Dividend All Cap Value Fund | | | 10,476,590 | | | | 118,593 | | | | 5,440,778 | | | | — | |
Fairpointe Mid Cap Fund | | | 6,035,391 | | | | 5,436,739 | | | | 856,138 | | | | 1,792,051 | |
M&C Mid Cap Growth Fund | | | — | | | | — | | | | 6,357 | | | | — | |
Cardinal Mid Cap Value Fund | | | 6,680 | | | | — | | | | 3,807 | | | | — | |
TAMRO Small Cap Fund | | | — | | | | 19,802,159 | | | | — | | | | 491,279 | |
River Road Select Value Fund | | | 1,134,027 | | | | 1,959,747 | | | | 374,080 | | | | — | |
River Road Small Cap Value Fund | | | 2,048,490 | | | | — | | | | 1,018,993 | | | | — | |
DoubleLine Core Plus Fixed Income Fund | | | 190,808 | | | | — | | | | — | | | | — | |
TCH Fixed Income Fund | | | 2,810,584 | | | | — | | | | 3,125,240 | | | | — | |
Lake Partners LASSO Alternatives Fund | | | 454,894 | | | | 448 | | | | 71,770 | | | | — | |
Dynamic Allocation Fund | | | 1,619,896 | | | | 272,869 | | | | 3,145,781 | | | | 3,008 | |
M.D. Sass Enhanced Equity Fund | | | 5,872,771 | | | | — | | | | 685,950 | | | | — | |
Neptune International Fund | | | 21,314 | | | | — | | | | 84,468 | | | | — | |
Barings International Fund | | | 1,019,611 | | | | — | | | | 114,624 | | | | — | |
Harrison Street Real Estate Fund | | | 627,254 | | | | — | | | | 546,063 | | | | — | |
M&C Balanced Fund | | | 312,292 | | | | — | | | | 344,428 | | | | — | |
| | | | |
Aston Funds | | | | |
| | | April 30, 2012 | |
| Notes to Financial Statements (unaudited) – continued | | | | |
As of October 31, 2011, the most recent fiscal year end, the components of distributable earnings on a tax basis were as follows:
| | | | | | | | | | | | | | | | | | | | |
| | | Capital Loss
Carryforward | | | Undistributed
Ordinary Income | | | Undistributed
Long- Term Gain | | | Unrealized
Appreciation/
(Depreciation) | | | Total | |
M&C Growth Fund | | $ | (15,287,295 | ) | | $ | 17,620,891 | | | $ | 257,686,119 | | | $ | 382,885,608 | | | $ | 642,905,323 | |
Veredus Select Growth Fund | | | (19,716,146 | ) | | | 26,897 | | | | — | | | | 3,285,729 | | | | (16,403,520 | ) |
TAMRO Diversified Equity Fund | | | — | | | | — | | | | 473,321 | | | | 1,750,640 | | | | 2,223,961 | |
Herndon Large Cap Value Fund | | | — | | | | 947,771 | | | | 124,149 | | | | (420,717 | ) | | | 651,203 | |
Cornerstone Large Cap Value Fund | | | (29,234,407 | ) | | | — | | | | — | | | | 344,080 | | | | (28,890,327 | ) |
River Road Dividend All Cap Value Fund | | | — | | | | — | | | | 4,647,585 | | | | 53,393,631 | | | | 58,041,216 | |
Fairpointe Mid Cap Fund | | | — | | | | 2,079,223 | | | | 18,759,386 | | | | 277,687,103 | | | | 298,525,712 | |
M&C Mid Cap Growth Fund | | | (327,840 | ) | | | — | | | | — | | | | 917,907 | | | | 590,067 | |
Cardinal Mid Cap Value Fund | | | (223,314 | ) | | | 1,517 | | | | — | | | | 210,209 | | | | (11,588 | ) |
Veredus Small Cap Growth Fund | | | (20,575,914 | ) | | | — | | | | — | | | | 3,729,440 | | | | (16,846,474 | ) |
Small Cap Growth Fund | | | (59,470 | ) | | | — | | | | — | | | | (265,605 | ) | | | (325,075 | ) |
TAMRO Small Cap Fund | | | — | | | | — | | | | 97,189,739 | | | | 179,531,675 | | | | 276,721,414 | |
River Road Select Value Fund | | | — | | | | 1,195,272 | | | | 28,131,898 | | | | 12,845,247 | | | | 42,172,417 | |
River Road Small Cap Value Fund | | | (11,064,614 | ) | | | — | | | | — | | | | 54,059,120 | | | | 42,994,506 | |
River Road Independent Value Fund | | | — | | | | 5,594,708 | | | | 100,643 | | | | (1,930,633 | ) | | | 3,764,718 | |
DoubleLine Core Plus Fixed Income Fund | | | — | | | | 88,759 | | | | — | | | | 236,854 | | | | 325,613 | |
TCH Fixed Income Fund | | | (7,624,512 | ) | | | 30,636 | | | | — | | | | 5,288,666 | | | | (2,305,210 | ) |
Lake Partners LASSO Alternatives Fund | | | (4,140,502 | ) | | | 67,864 | | | | — | | | | (1,626,190 | ) | | | (5,698,828 | ) |
Dynamic Allocation Fund | | | — | | | | 3,838,769 | | | | 797,701 | | | | 327,722 | | | | 4,964,192 | |
M.D. Sass Enhanced Equity Fund | | | — | | | | 9,611,622 | | | | 2,408,540 | | | | (8,317,598 | ) | | | 3,702,564 | |
River Road Long-Short Fund | | | (100,223 | ) | | | — | | | | — | | | | 125,458 | | | | 25,235 | |
Neptune International Fund | | | (3,360,906 | ) | | | 2,324 | | | | — | | | | (85,400 | ) | | | (3,443,982 | ) |
Barings International Fund | | | — | | | | 488,262 | | | | 1,380,287 | | | | (155,209 | ) | | | 1,713,340 | |
Harrison Street Real Estate Fund | | | (14,324,057 | ) | | | 149,431 | | | | — | | | | 1,480,467 | | | | (12,694,159 | ) |
M&C Balanced Fund | | | (3,045,863 | ) | | | 34,962 | | | | — | | | | 2,165,668 | | | | (845,233 | ) |
Note (D) Shares of Beneficial Interest: Each Fund is authorized to issue an unlimited number of shares of beneficial interest with no par value. Share transactions of the Funds were as follows:
Six Months Ended April 30, 2012
| | | | | | | | | | | | | | | | |
Class N | | Sold | | | Shares Issued From
Reinvestment
of Distributions | | | Redeemed | | | Net Increase
(Decrease) in
Shares Outstanding | |
M&C Growth Fund | | | 7,220,707 | | | | 5,664,499 | | | | (9,731,278 | ) | | | 3,153,928 | |
Veredus Select Growth Fund | | | 32,936 | | | | — | | | | (831,482 | ) | | | (798,546 | ) |
TAMRO Diversified Equity Fund | | | 77,110 | | | | 38,289 | | | | (470,130 | ) | | | (354,731 | ) |
Herndon Large Cap Value Fund | | | 369,527 | | | | 39,719 | | | | (117,196 | ) | | | 292,050 | |
Cornerstone Large Cap Value Fund | | | 436,477 | | | | 10,721 | | | | (820,916 | ) | | | (373,718 | ) |
River Road Dividend All Cap Value Fund | | | 8,464,236 | | | | 572,508 | | | | (7,718,621 | ) | | | 1,318,123 | |
Fairpointe Mid Cap Fund | | | 7,413,856 | | | | 417,341 | | | | (8,849,881 | ) | | | (1,018,684 | ) |
M&C Mid Cap Growth Fund | | | 181,146 | | | | — | | | | (22,519 | ) | | | 158,627 | |
Cardinal Mid Cap Value Fund | | | 13,615 | | | | 310 | | | | (2,437 | ) | | | 11,488 | |
Veredus Small Cap Growth Fund | | | 47,377 | | | | — | | | | (306,037 | ) | | | (258,660 | ) |
Small Cap Growth Fund | | | 46,907 | | | | — | | | | (54,712 | ) | | | (7,805 | ) |
Silvercrest Small Cap (a) | | | 51,358 | | | | — | | | | — | | | | 51,358 | |
TAMRO Small Cap Fund | | | 2,940,335 | | | | 1,982,107 | | | | (4,072,292 | ) | | | 850,150 | |
River Road Select Value Fund | | | 116,854 | | | | 332,250 | | | | (959,714 | ) | | | (510,610 | ) |
River Road Small Cap Value Fund | | | 434,533 | | | | — | | | | (4,213,040 | ) | | | (3,778,507 | ) |
River Road Independent Value Fund | | | 12,374,363 | | | | 339,193 | | | | (8,690,143 | ) | | | 4,023,413 | |
DoubleLine Core Plus Fixed Income Fund | | | 1,752,830 | | | | 47,173 | | | | (1,631,186 | ) | | | 168,817 | |
TCH Fixed Income Fund | | | 504,469 | | | | 127,068 | | | | (585,505 | ) | | | 46,032 | |
Lake Partners LASSO Alternatives Fund | | | 672,981 | | | | 21,588 | | | | (218,986 | ) | | | 475,583 | |
Dynamic Allocation Fund | | | 605,297 | | | | 508,991 | | | | (1,975,527 | ) | | | (861,239 | ) |
M.D. Sass Enhanced Equity Fund | | | 3,266,424 | | | | 674,043 | | | | (1,162,182 | ) | | | 2,778,285 | |
River Road Long-Short Fund | | | 100,489 | | | | — | | | | (31,135 | ) | | | 69,354 | |
Neptune International Fund | | | 2,357 | | | | — | | | | (4,400 | ) | | | (2,043 | ) |
Barings International Fund | | | 139 | | | | 1,946 | | | | (43 | ) | | | 2,042 | |
Harrison Street Real Estate Fund | | | 248,857 | | | | 4,957 | | | | (104,469 | ) | | | 149,345 | |
M&C Balanced Fund | | | 415,318 | | | | 6,573 | | | | (169,917 | ) | | | 251,974 | |
| (a) | Silvercrest Small Cap Fund began issuing Class N Shares on December 23, 2011. |
| | | | |
Aston Funds | | | | |
| | | April 30, 2012 | |
| Notes to Financial Statements (unaudited) – continued | | | | |
| | | | | | | | | | | | | | | | |
Class I | | Sold | | | Shares Issued From
Reinvestment
of Distributions | | | Redeemed | | | Net Increase
(Decrease) in
Shares Outstanding | |
M&C Growth Fund | | | 16,397,472 | | | | 4,364,756 | | | | (12,092,197 | ) | | | 8,670,031 | |
Veredus Select Growth Fund | | | 177,142 | | | | 2,609 | | | | (2,561,418 | ) | | | (2,381,667 | ) |
TAMRO Diversified Equity Fund (a) | | | 28,884 | | | | — | | | | — | | | | 28,884 | |
Herndon Large Cap Value Fund | | | 2,228,362 | | | | 73,629 | | | | (145,153 | ) | | | 2,156,838 | |
Cornerstone Large Cap Value Fund | | | 295,356 | | | | 58 | | | | (377 | ) | | | 295,037 | |
River Road Dividend All Cap Value Fund | | | 16,960,615 | | | | 520,634 | | | | (1,812,728 | ) | | | 15,668,521 | |
Fairpointe Mid Cap Fund (b) | | | 11,239,001 | | | | 327,743 | | | | (13,553,159 | ) | | | (1,986,415 | ) |
Veredus Small Cap Growth Fund (c) | | | 10,478 | | | | | | | | (1,156,181 | ) | | | (1,145,703 | ) |
Small Cap Growth Fund | | | — | | | | — | | | | — | | | | — | |
Silvercrest Small Cap Fund (d) (e) | | | 542,832 | | | | — | | | | (237,521 | ) | | | 305,311 | |
TAMRO Small Cap Fund | | | 3,931,669 | | | | 2,242,345 | | | | (3,614,933 | ) | | | 2,559,081 | |
River Road Select Value Fund | | | 2,880,984 | | | | 2,982,287 | | | | (2,535,485 | ) | | | 3,327,786 | |
River Road Small Cap Value Fund | | | 1,466,897 | | | | — | | | | (2,926,912 | ) | | | (1,460,015 | ) |
River Road Independent Value Fund | | | 15,878,369 | | | | 189,732 | | | | (1,003,532 | ) | | | 15,064,569 | |
DoubleLine Core Plus Fixed Income Fund | | | 4,592,786 | | | | 52,649 | | | | (240,093 | ) | | | 4,405,342 | |
TCH Fixed Income Fund | | | 146,128 | | | | 17,409 | | | | (209,266 | ) | | | (45,729 | ) |
Lake Partners LASSO Alternatives Fund | | | 5,465,624 | | | | 148,111 | | | | (2,350,135 | ) | | | 3,263,600 | |
Dynamic Allocation Fund | | | 78,675 | | | | 52,099 | | | | (28,366 | ) | | | 102,408 | |
M.D. Sass Enhanced Equity Fund | | | 3,688,810 | | | | 615,736 | | | | (2,125,528 | ) | | | 2,179,018 | |
Neptune International Fund | | | — | | | | 318 | | | | (239 | ) | | | 79 | |
Barings International Fund | | | 2,079,474 | | | | 187,976 | | | | (749,648 | ) | | | 1,517,802 | |
Harrison Street Real Estate Fund (f) | | | 241 | | | | 61 | | | | (3,683,661 | ) | | | (3,683,359 | ) |
M&C Balanced Fund | | | 1,474 | | | | 144 | | | | (1,722 | ) | | | (104 | ) |
| (a) | TAMRO Diversified Equity Fund began issuing Class I Shares on March 1, 2012. |
| (b) | Fairpointe Mid Cap Fund had a redemption-in-kind on January 13, 2012, which resulted in a redemption out of the Fund of $38,722,763 and is excluded from the shares sold above. The redemption was comprised of securities and cash in the amounts of $38,179,960 and $542,803, respectively. |
| (c) | Veredus Small Cap Growth Fund had a redemption-in-kind on December 2, 2011, which resulted in a redemption out of the Fund of $13,436,583 and is excluded from shares sold above. The redemption was comprised of securities and cash in the amounts of $13,225,479 and $211,104, respectively. |
| (d) | Silvercrest Small Cap Fund began issuing Class I Shares on December 23, 2011. |
| (e) | Silvercrest Small Cap Fund had a redemption-in-kind on April 26, 2012, which resulted in a redemption out of the Fund of $2,608,977 and is excluded from the shares sold above. The redemption was comprised of securities and cash in the amounts of $2,579,146 and $29,831, respectively. |
| (f) | Harrison Street Real Estate Fund had a redemption-in-kind on December 2, 2011, which resulted in a redemption out of the Fund of $31,399,368 and is excluded from shares sold above. The redemption was comprised of securities and cash in the amounts of $30,913,574 and $485,794, respectively |
| | | | | | | | | | | | | | | | |
Class R | | Sold | | | Shares Issued From
Reinvestment
of Distributions | | | Redeemed | | | Net Increase in
Shares Outstanding | |
M&C Growth Fund | | | 65,193 | | | | 23,324 | | | | (69,290 | ) | | | 19,227 | |
Year Ended October 31, 2011
| | | | | | | | | | | | | | | | |
Class N | | Sold | | | Shares Issued From
Reinvestment
of Distributions | | | Redeemed | | | Net Increase
(Decrease) in
Shares Outstanding | |
M&C Growth Fund | | | 27,529,579 | | | | 436,304 | | | | (25,563,135 | ) | | | 2,402,748 | |
Veredus Select Growth Fund | | | 600,195 | | | | — | | | | (2,424,886 | ) | | | (1,824,691 | ) |
TAMRO Diversified Equity Fund | | | 1,047,491 | | | | — | | | | (398,182 | ) | | | 649,309 | |
Herndon Large Cap Value Fund | | | 1,302,936 | | | | 1,239 | | | | (907,748 | ) | | | 396,427 | |
Cornerstone Large Cap Value Fund | | | 938,206 | | | | 26,444 | | | | (683,845 | ) | | | 280,805 | |
River Road Dividend All Cap Value Fund | | | 19,428,483 | | | | 401,663 | | | | (4,872,469 | ) | | | 14,957,677 | |
Fairpointe Mid Cap Fund | | | 23,004,145 | | | | 239,794 | | | | (23,365,775 | ) | | | (121,836 | ) |
M&C Mid Cap Growth Fund | | | 79,385 | | | | — | | | | (14,651 | ) | | | 64,734 | |
Cardinal Mid Cap Value Fund | | | 15,267 | | | | 283 | | | | (2,166 | ) | | | 13,384 | |
Veredus Small Cap Growth Fund | | | 261,170 | | | | — | | | | (980,739 | ) | | | (719,569 | ) |
Small Cap Growth Fund (a) | | | 622,572 | | | | — | | | | (78,915 | ) | | | 543,657 | |
TAMRO Small Cap Fund | | | 6,465,730 | | | | 349,541 | | | | (5,826,262 | ) | | | 989,009 | |
River Road Select Value Fund | | | 940,625 | | | | 64,739 | | | | (5,458,457 | ) | | | (4,453,093 | ) |
River Road Small Cap Value Fund | | | 3,083,624 | | | | 49,890 | | | | (14,038,695 | ) | | | (10,905,181 | ) |
River Road Independent Value Fund (b) | | | 34,714,694 | | | | — | | | | (6,220,324 | ) | | | 28,494,370 | |
DoubleLine Core Plus Fixed Income Fund (c) | | | 2,304,445 | | | | 13,647 | | | | (147,028 | ) | | | 2,171,064 | |
TCH Fixed Income Fund | | | 2,519,080 | | | | 199,342 | | | | (1,241,865 | ) | | | 1,476,557 | |
Lake Partners LASSO Alternatives Fund | | | 1,059,998 | | | | 9,203 | | | | (286,539 | ) | | | 782,662 | |
Dynamic Allocation Fund | | | 2,015,362 | | | | 199,385 | | | | (3,376,730 | ) | | | (1,161,983 | ) |
M.D. Sass Enhanced Equity Fund | | | 2,823,656 | | | | 274,141 | | | | (2,998,639 | ) | | | 99,158 | |
River Road Long-Short Fund (d) | | | 463,827 | | | | — | | | | (106 | ) | | | 463,721 | |
| | | | |
Aston Funds | | | | |
| | | April 30, 2012 | |
| Notes to Financial Statements (unaudited) – continued | | | | |
| | | | | | | | | | | | | | | | |
| | | | | | Shares Issued From | | | | | | Net Increase | |
| | | | | | Reinvestment | | | | | | (Decrease) in | |
Class N | | Sold | | | of Distributions | | | Redeemed | | | Shares Outstanding | |
Neptune International Fund | | | 9,866 | | | | 547 | | | | (15,709 | ) | | | (5,296 | ) |
Barings International Fund | | | 41,175 | | | | 470 | | | | (9,259 | ) | | | 32,386 | |
Harrison Street Real Estate Fund | | | 334,601 | | | | 11,310 | | | | (399,317 | ) | | | (53,406 | ) |
M&C Balanced Fund | | | 83,389 | | | | 13,236 | | | | (462,762 | ) | | | (366,137 | ) |
| (a) | Small Cap Growth Fund began issuing Class N Shares on November 2, 2010. |
| (b) | River Road Independent Value Fund began issuing Class N Shares on December 30, 2010. |
| (c) | DoubleLine Core Plus Fixed Income Fund began issuing Class N Shares on July 15, 2011. |
| (d) | River Road Long-Short Fund began issuing Class N Shares on May 3, 2011. |
| | | | | | | | | | | | | | | | |
| | | | | | Shares Issued From | | | | | | Net Increase | |
| | | | | | Reinvestment | | | | | | (Decrease) in | |
Class I | | Sold | | | of Distributions | | | Redeemed | | | Shares Outstanding | |
M&C Growth Fund | | | 25,367,654 | | | | 492,955 | | | | (21,812,016 | ) | | | 4,048,593 | |
Veredus Select Growth Fund | | | 1,022,514 | | | | — | | | | (965,498 | ) | | | 57,016 | |
Herndon Large Cap Value Fund (a) | | | 1,048,685 | | | | — | | | | — | | | | 1,048,685 | |
Cornerstone Large Cap Value Fund (b) | | | 41 | | | | 99,223 | | | | (22,281,046 | ) | | | (22,181,782 | ) |
River Road Dividend All Cap Value Fund | | | 18,128,321 | | | | 370,706 | | | | (2,092,580 | ) | | | 16,406,447 | |
Fairpointe Mid Cap Fund | | | 39,262,459 | | | | 90,932 | | | | (12,005,364 | ) | | | 27,348,027 | |
Veredus Small Cap Growth Fund | | | 23,685 | | | | — | | | | (32,239 | ) | | | (8,554 | ) |
Small Cap Growth Fund | | | 255,934 | | | | — | | | | — | | | | 255,934 | |
TAMRO Small Cap Fund | | | 9,479,673 | | | | 402,302 | | | | (7,890,124 | ) | | | 1,991,851 | |
River Road Select Value Fund | | | 4,193,249 | | | | 214,802 | | | | (8,853,662 | ) | | | (4,445,611 | ) |
River Road Small Cap Value Fund | | | 4,141,086 | | | | 107,904 | | | | (6,084,595 | ) | | | (1,835,605 | ) |
River Road Independent Value Fund (c) | | | 8,308,048 | | | | — | | | | (359,185 | ) | | | 7,948,863 | |
DoubleLine Core Plus Fixed Income Fund (d) | | | 523,751 | | | | 4,051 | | | | (98,141 | ) | | | 429,661 | |
TCH Fixed Income Fund | | | 347,836 | | | | 45,383 | | | | (827,447 | ) | | | (434,228 | ) |
Lake Partners LASSO Alternatives Fund | | | 16,212,425 | | | | 25,742 | | | | (2,014,816 | ) | | | 14,223,351 | |
Dynamic Allocation Fund (e) | | | 734,609 | | | | 715 | | | | (275,213 | ) | | | 460,111 | |
M.D. Sass Enhanced Equity Fund | | | 2,722,359 | | | | 287,142 | | | | (1,167,597 | ) | | | 1,841,904 | |
Harrison Street Real Estate Fund | | | 3,825 | | | | 64,984 | | | | (1,747 | ) | | | 67,062 | |
Neptune International Fund | | | — | | | | 1,424 | | | | — | | | | 1,424 | |
Barings International Fund | | | 2,212,819 | | | | 113,069 | | | | (1,257,377 | ) | | | 1,068,511 | |
M&C Balanced Fund | | | 236,989 | | | | 1,686 | | | | (239,470 | ) | | | (795 | ) |
| (a) | Herndon Large Cap Value Fund began issuing Class I Shares on March 1, 2011. |
| (b) | Cornerstone Large Cap Value Fund had a redemption-in-kind on March 18, 2011, which resulted in a redemption out of the Fund of $222,180,158 and is excluded from the shares sold above. The redemption was comprised of securities and cash in the amounts of $218,362,400 and $3,817,758, respectively. |
| (c) | River Road Independent Value Fund began issuing Class I Shares on May 31, 2011. |
| (d) | DoubleLine Core Plus Fixed Income Fund began issuing Class I Shares on July 15, 2011. |
| (e) | Dynamic Allocation Fund began issuing Class I Shares on November 1, 2010. |
| | | | | | | | | | | | | | | | |
| | | | | | Shares Issued From | | | | | | | |
| | | | | | Reinvestment | | | | | | Net Increase in | |
Class R | | Sold | | | of Distributions | | | Redeemed | | | Shares Outstanding | |
M&C Growth Fund | | | 231,098 | | | | 883 | | | | (199,315 | ) | | | 32,666 | |
Note (E) Investment Transactions: Aggregate purchases and proceeds from sales and maturities of investment securities (other than short-term investments) for the six months ended April 30, 2012 were as follows:
| | | | | | | | | | | | | | | | |
| | | Aggregate Purchases | | | Proceeds from Sales | |
| | | U.S. Government | | | Other | | | U.S. Government | | | Other | |
M&C Growth Fund | | $ | — | | | $ | 739,126,880 | | | $ | — | | | $ | 944,671,919 | |
Veredus Select Growth Fund | | | — | | | | 54,191,527 | | | | — | | | | 88,316,974 | |
TAMRO Diversified Equity Fund | | | — | | | | 5,389,707 | | | | — | | | | 9,433,499 | |
Herndon Large Cap Value Fund. | | | — | | | | 33,399,917 | | | | — | | | | 6,696,448 | |
Cornerstone Large Cap Value Fund | | | — | | | | 8,874,355 | | | | — | | | | 9,132,329 | |
River Road Dividend All Cap Value Fund. | | | — | | | | 275,042,458 | | | | — | | | | 114,126,151 | |
Fairpointe Mid Cap Fund (a) | | | — | | | | 293,938,245 | | | | — | | | | 346,270,285 | |
M&C Mid Cap Growth Fund | | | — | | | | 2,474,337 | | | | — | | | | 951,306 | |
Cardinal Mid Cap Value Fund | | | — | | | | 432,407 | | | | — | | | | 324,100 | |
Veredus Small Cap Growth Fund (b) | | | — | | | | 24,504,420 | | | | — | | | | 28,638,128 | |
Small Cap Growth Fund | | | — | | | | 6,072,333 | | | | — | | | | 6,215,542 | |
Silvercrest Small Cap Fund (c) | | | — | | | | 6,441,155 | | | | — | | | | 5,460,636 | |
TAMRO Small Cap Fund | | | — | | | | 197,691,532 | | | | — | | | | 261,275,101 | |
River Road Select Value Fund | | | — | | | | 27,074,331 | | | | — | | | | 35,971,338 | |
River Road Small Cap Value Fund | | | — | | | | 38,383,450 | | | | — | | | | 104,821,372 | |
River Road Independent Value Fund | | | — | | | | 267,428,848 | | | | — | | | | 195,330,428 | |
| | | | |
Aston Funds | | | | |
| | | April 30, 2012 | |
| Notes to Financial Statements (unaudited) – continued | | | | |
| | | | | | | | | | | | | | | | |
| | | Aggregate Purchases | | | Proceeds from Sales | |
| | | U.S. Government | | | Other | | | U.S. Government | | | Other | |
DoubleLine Core Plus Fixed Income Fund | | $ | 40,506,854 | | | $ | 39,899,027 | | | $ | 20,957,686 | | | $ | 12,757,644 | |
TCH Fixed Income Fund | | | 1,467,228 | | | | 19,165,517 | | | | 5,095,197 | | | | 17,721,316 | |
Lake Partners LASSO Alternatives Fund | | | — | | | | 112,884,521 | | | | — | | | | 68,088,243 | |
Dynamic Allocation Fund | | | — | | | | 80,305,433 | | | | — | | | | 88,243,873 | |
M.D. Sass Enhanced Equity Fund | | | — | | | | 68,041,831 | | | | — | | | | 39,234,245 | |
River Road Long-Short Fund | | | — | | | | 6,421,553 | | | | — | | | | 5,656,288 | |
Neptune International Fund | | | — | | | | 194,949 | | | | — | | | | 137,379 | |
Barings International Fund | | | — | | | | 19,546,237 | | | | — | | | | 10,927,609 | |
Harrison Street Real Estate Fund (d) | | | — | | | | 6,107,338 | | | | — | | | | 4,434,294 | |
M&C Balanced Fund | | | 1,031,213 | | | | 7,066,313 | | | | 424,832 | | | | 4,010,484 | |
| (a) | Fairpointe Mid Cap Fund had a redemption-in-kind on January 13, 2012, which resulted in a redemption out of the Fund of $38,722,763 and is excluded from the proceeds from sales above. The redemption was comprised of securities and cash in the amount of $38,179,960 and $542,803, respectively. |
| (b) | Veredus Small Cap Growth Fund had a redemption-in-kind on December 2, 2011, which resulted in a redemption out of the Fund of $13,436,583 and is excluded from proceeds from sales above. The redemption was comprised of securities and cash in the amounts of $13,225,479 and $211,104, respectively. |
| (c) | Silvercrest Small Cap Fund had a redemption-in-kind on April 26, 2012, which resulted in a redemption out of the Fund of $2,608,977 and is excluded from the proceeds from sales above. The redemption was comprised of securities and cash in the amount of $2,579,146 and $29,831, respectively. |
| (d) | Harrison Street Real Estate Fund had a redemption-in-kind on December 2, 2011, which resulted in a redemption out of the Fund of $31,399,368 and is excluded from proceeds from sales above. The redemption was comprised of securities and cash in the amounts of $30,913,574 and $485,794, respectively. |
Note (F) Redemption Fees: In accordance with the prospectus, certain Funds assessed a 2% redemption fee on Fund share redemptions and exchanges within specified time periods, as indicated in the following table for the six months ended April 30, 2012 and included in the Cost of Shares redeemed on the Statements of Changes in Net Assets:
| | | | | | | | |
Fund Name | | Time Period | | | Amount | |
Neptune International Fund | | | 2% Within 90 Days | | | $ | 6 | |
Barings International Fund | | | 2% Within 90 Days | | | | 5,312 | |
Harrison Street Real Estate Fund | | | 2% Within 90 Days | | | | 4,938 | |
Note (G) Advisory, Administration, Distribution Services and Trustee Agreements:
Advisory. Aston serves as investment adviser and administrator to the Funds. Under the terms of the investment advisory agreement for the Funds (the “Investment Advisory Agreement”), fees are accrued daily and paid monthly, based on specific annual rates of average daily net assets. The factors considered by the Board of Trustees in approving the current Investment Advisory Agreement are included in the Funds’ annual or semi-annual report to shareholders covering the period during which the approval occurred.
Certain Funds have an expense limitation agreement with the Adviser, which caps annual ordinary operating expenses for Class N and Class I shareholders at certain specified annual rates of average daily net assets (the “Expense Limitation Agreements”). There are no contractual expense limitations for Class R shareholders.
The Expense Limitation Agreements are effective through February 28, 2013, except as noted below. The advisory rates and contractual expense limitations for the six months ended April 30, 2012 were as follows:
| | | | | | |
| | | | | Contractual
Expense Limitations |
Fund Name | | Advisory Fees | | Class N | | Class I |
M&C Growth Fund | | 0.80% on first $800,000,000 | | | | |
| | 0.60% over $800,000,000 | | N/A | | N/A |
Veredus Select Growth Fund | | 0.80% | | 1.30% | | 1.05% |
TAMRO Diversified Equity Fund (a) | | 0.80% | | 1.20% | | 0.95%(b) |
Herndon Large Cap Value Fund | | 0.80% | | 1.30%(b) | | 1.05%(b) |
Cornerstone Large Cap Value Fund (c) | | 0.80% | | 1.30% | | 1.05% |
River Road Dividend All Cap Value Fund | | 0.70% | | 1.30% | | 1.05% |
Fairpointe Mid Cap Fund | | 0.80% on first $100,000,000 | | | | |
| | 0.75% next $300,000,000 | | | | |
| | 0.70% over $400,000,000 | | N/A | | N/A |
M&C Mid Cap Growth Fund (d) | | 0.85% | | 1.25%(b) | | N/A |
Cardinal Mid Cap Value Fund | | 0.90% | | 1.40%(b) | | N/A |
Veredus Small Cap Growth Fund | | 1.00% | | 1.49% | | 1.24% |
Small Cap Growth Fund | | 1.00% | | 1.35%(b) | | 1.10%(b) |
Silvercrest Small Cap Growth | | 1.00% | | 1.40%(b) | | 1.15%(b) |
TAMRO Small Cap Fund | | 0.90% | | N/A | | N/A |
River Road Select Value Fund | | 1.00% | | 1.50% | | 1.25% |
River Road Small Cap Value Fund | | 0.90% | | N/A | | N/A |
River Road Independent Value Fund | | 1.00% | | 1.42%(b) | | 1.17%(b) |
| | | | |
Aston Funds | | | | |
| | | April 30, 2012 | |
Notes to Financial Statements (unaudited) – continued | | | | |
| | | | | | |
| | | | | Contractual
Expense Limitations |
Fund Name | | Advisory Fees | | Class N | | Class I |
DoubleLine Core Plus Fixed Income Fund | | 0.55% | | 0.94%(b) | | 0.69%(b) |
TCH Fixed Income Fund | | 0.55% | | 0.94% | | 0.69% |
Lake Partners LASSO Alternatives Fund | | 1.00% | | 1.45%(b) | | 1.20%(b) |
Dynamic Allocation Fund | | 0.80% | | 1.30%(b) | | 1.05%(b) |
M.D. Sass Enhanced Equity Fund | | 0.70% | | 1.40% | | 1.15% |
River Road Long-Short Fund | | 1.20% | | 1.70%(b) | | N/A |
Harrison Street Real Estate Fund | | 1.00% | | 1.37% | | 1.12% |
Neptune International Fund | | 1.00% | | 1.27%(b) | | 1.02%(b) |
Barings International Fund | | 1.00% | | 1.40%(b) | | 1.15%(b) |
M&C Balanced Fund | | 0.75% | | 1.35% | | 1.10% |
| (a) | TAMRO Diversified Equity Fund began issuing Class I Shares on March 1, 2012. |
| (b) | Pursuant to a contractual expense reimbursement agreement between the Adviser and the Fund, from commencement of operations through the completion of the first three full fiscal years for a period up to three years from the fiscal year end during which such amount was waived or reduced, the Adviser is entitled to be reimbursed by the Fund for previously waived fees and reimbursed expenses to the extent that the Fund’s expense ratio (not including interest, brokerage commissions, other investment related costs, extraordinary expenses and acquired fund fees and expenses,) remains below the operating expense cap after such reimbursement. |
| (c) | Effective February 29, 2012, the voluntary expense limitation for the Cornerstone Large Cap Value Fund were replaced with a contractual expense limitation of 1.30% for Class N and 1.05% for Class I. |
| (d) | Effective February 29, 2012, the voluntary expense limitation for the M&C Mid Cap Growth Fund was removed and replaced with a contractual expense limitation of 1.25%. |
Pursuant to a contractual expense reimbursement agreement between the Adviser and the following Funds, from commencement of operations through the completion of the first three full fiscal years for a period of up to three years from the fiscal year end during which such amount was waived or reduced of each of the Herndon Large Cap Value Fund-Classes N and I, M&C Mid Cap Growth Fund-Class N, Silvercrest Small Cap Fund-Classes N and I, Cardinal Mid Cap Value Fund-Class N, Small Cap Growth Fund-Classes N and I, River Road Select Value Fund-Classes N and I, River Road Independent Value Fund-Classes N and I, Barings International Fund-Classes N and I, Lake Partners LASSO Alternatives Fund-Classes N and I, Neptune International Fund-Classes N and I, Dynamic Allocation Fund-Classes N and I, M.D. Sass Enhanced Equity Fund-Classes N and I, River Road Long-Short Fund Class N and DoubleLine Core Plus Fixed Income Fund-Classes N and I, the Adviser is entitled to be reimbursed by each Fund for previously waived fees and reimbursed expenses to the extent that each Fund’s expense ratio (not including interest, brokerage commissions, other investment related costs, extraordinary expenses and acquired fund fees and expenses,) remains below the operating expense cap after such reimbursement.
The cumulative reimbursement amounts as of April 30, 2012 that are entitled to be reimbursed for each Fund are as follows:
| | | | | | | | | | | | |
| | | | | | Expiration | | | | |
Funds | | 2012 | | | 2013 | | | 2014 | |
Herndon Large Cap Value Fund | | | N/A | | | $ | 74,284 | | | $ | 129,816 | |
Montag & Caldwell Mid Cap Growth Fund | | | 79,648 | | | | 67,970 | | | | 72,010 | |
Cardinal Mid Cap Value Fund | | | 77,563 | | | | 70,443 | | | | 75,297 | |
Small Cap Growth Fund | | | N/A | | | | N/A | | | | 190,704 | |
Silvercrest Small Cap Fund (1) | | | N/A | | | | N/A | | | | N/A | |
River Road Independent Value Fund | | | N/A | | | | N/A | | | | 244,471 | |
DoubleLine Core Plus Fixed Income Fund | | | N/A | | | | N/A | | | | 105,633 | |
Lake Partners LASSO Alternatives Fund | | | 94,071 | | | | 135,895 | | | | 87,814 | |
Dynamic Allocation Fund | | | 89,827 | | | | 74,415 | | | | 138,681 | |
M.D. Sass Enhanced Equity Fund | | | 80,783 | | | | — | | | | — | |
River Road Long-Short Fund | | | N/A | | | | N/A | | | | 97,108 | |
Neptune International Fund | | | 118,000 | | | | 116,483 | | | | — | |
Barings International Fund | | | 139,755 | | | | 134,828 | | | | 147,896 | |
| (1) | The Fund commenced operations in the current fiscal year. |
For the six months ended April 30, 2012, the Adviser was reimbursed $61,190 by the M.D. Sass Enhanced Equity Fund for recoupment of prior year fee waivers. No other Fund in the above table reimbursed the Adviser for the period.
The Adviser manages each Fund by retaining one or more Sub-advisers to manage each Fund as follows:
| | |
Fund | | Subadviser |
M&C Growth Fund | | Montag & Caldwell, LLC |
Veredus Select Growth Fund | | Todd-Veredus Asset Management LLC |
TAMRO Diversified Equity Fund | | TAMRO Capital Partners, LLC |
Herndon Large Cap Value Fund | | Herndon Capital Management, LLC |
Cornerstone Large Cap Value Fund | | Cornerstone Investment Partners, LLC |
River Road Dividend
All Cap Value Fund | | River Road Asset Management, LLC |
Fairpointe Mid Cap Fund | | Fairpointe Capital LLC |
M&C Mid Cap Growth Fund | | Montag & Caldwell, LLC |
Cardinal Mid Cap Value Fund | | Cardinal Capital Management, L.L.C. |
Veredus Small Cap Growth Fund | | Todd-Veredus Asset Management LLC |
Small Cap Growth Fund | | Lee Munder Capital Group, LLC(1) |
Silvercrest Small Cap Fund | | Silvercrest Asset Management Group, LLC |
TAMRO Small Cap Fund | | TAMRO Capital Partners LLC |
River Road Select Value Fund | | River Road Asset Management, LLC |
River Road Small Cap Value Fund | | River Road Asset Management, LLC |
River Road Independent Value Fund | | River Road Asset Management, LLC |
DoubleLine Core Plus Fixed Income Fund | | DoubleLine Capital LP |
TCH Fixed Income Fund | | Taplin, Canida & Habacht, LLC |
Lake Partners LASSO Alternatives Fund | | Lake Partners, Inc. |
Dynamic Allocation Fund | | Smart Portfolios, LLC |
M.D. Sass Enhanced Equity Fund | | M.D. Sass Investors Services, Inc. |
River Road Long-Short Fund | | River Road Asset Management, LLC |
Neptune International Fund | | Neptune Investment Management Limited |
Barings International Fund | | Baring International Investment Limited |
Harrison Street Real Estate Fund | | Harrison Street Securities, LLC |
Montag & Caldwell Balanced Fund | | Montag & Caldwell, LLC |
| (1) | Effective as of February 17, 2012, Lee Munder Capital Group, LLC became the Subadviser to the Fund. Prior to February 17, 2012 Crosswind Investments, LLC was the Subadviser. |
| | | | |
Aston Funds | | | | |
| | | April 30, 2012 | |
| Notes to Financial Statements (unaudited) – continued | | | | |
Subadvisory fees are paid monthly by Aston. The factors considered by the Board of Trustees in approving the current sub-investment advisory agreements for the Funds (each a “Sub-Investment Advisory Agreement”) are included in the additional information section of the Funds’ annual or semi-annual report to shareholders covering the period in which such approval occurred.
Administration. Under the terms of the administration agreement between the Funds and Aston, the Funds’ administrator, (the “Administration Agreement”), administration fees are accrued daily and paid monthly, based on a specified percentage of average daily net assets of the Trust, and base fees are fixed at an annual rate of $12,000 per Fund. The fee is allocated to each Fund based on the relative net assets of the Trust. Administration expenses also include pricing agent fees and compliance related expenses. The administration fee arrangement is as follows:
| | | | |
Administration Fees at Trust Level | | Annual Rate | |
First $7.4 billion | | | 0.0490 | % |
Over $7.4 billion | | | 0.0465 | % |
BNY Mellon Investment Servicing (US) Inc. (“BNY Mellon”) provides certain administrative services to the Funds pursuant to a Sub-administration and Accounting Services Agreement between Aston and BNY Mellon (the “Sub-Administration Agreement”). Under the terms of the Sub-Administration Agreement, sub-administration fees, which are paid by Aston, are accrued daily and paid monthly, at a rate of 0.022% of average daily net assets of the Trust and a base fee at an annual rate of $12,000 per Fund.
Distribution Services. On March 31, 2012, BNY Mellon Distributors LLC Inc. was sold to Foreside Funds Distributors LLC. Upon the closing of the transaction, BNY Mellon Distributors LLC became an indirect, wholly owned subsidiary of Foreside Financial Group, LLC and was renamed Foreside Funds Distributors LLC (the “Distributor”) effective April 1, 2012. The Distributor serves as principal underwriter and distributor of the Fund’s shares. Pursuant to Rule 12b-1 distribution plans (the “Plans”) adopted by the Funds, with respect to Class N shares and Class R shares, the Funds pay certain expenses associated with the distribution of their shares. Under the Plans, each Fund may pay actual expenses not exceeding, on an annual basis, 0.25% of each participating Fund’s Class N average daily net assets and 0.50% of each participating Fund’s Class R average daily net assets. The Class I shares do not have distribution plans. Effective January 1, 2012 the TCH Fixed Income Fund and M&C Balanced Fund reduced their 12b-1 fees to 0.10% and 0.15%, respectively.
Trustees. The Trustees of the Trust who are not affiliated with the Adviser or Subadviser receive an annual retainer and per meeting fees and are reimbursed for out-of-pocket expenses for each meeting of the Board of Trustees they attend. The Chairman of the Board and Committee Chairs receive an additional retainer. No officer or employee of the Adviser, Subadviser or their affiliates receives any compensation from
the Funds for acting as a Trustee of the Trust. The officers of the Trust receive no compensation directly from the Funds for performing the duties of their offices, except that the Funds compensate the Administrator for providing an officer to serve as the Funds’ Chief Compliance Officer. The aggregate remuneration paid to the Trustees during the six months ended April 30, 2012 was $359,250.
Note (H) Credit Agreement: Effective July 6, 2010 and as amended September 2, 2011, the Trust entered into a Credit Agreement with The Bank of New York Mellon which provides the Trust with a revolving line of credit facility up to $50 million. The facility is shared by each series of the Trust and is available for temporary, emergency purposes including liquidity needs in meeting redemptions. The interest rate on outstanding Alternate Base Rate Loans is equivalent to the greater of the Prime Rate plus 1.25% or 0.50% plus the Federal Funds Effective Rate plus 1.25%, as applicable. The interest rate on outstanding Overnight Loans is equivalent to the greater of the Federal Funds Effective Rate plus 1.25% or the One Month LIBOR Rate plus 1.25%, as applicable. The Trust pays a commitment fee on the unutilized commitment amount of 0.12% per annum. For the Funds that utilized the line of credit during the six months ended April 30, 2012, the average daily loan balance outstanding on the days where borrowings existed, the weighted average interest rate and the interest expense, which is included on the Statement of Operations, allocated to each Fund for use of the line of credit were as follows:
| | | | | | | | | | | | |
| | | Weighted
Average
Interest
Rate on
Days When
Borrowings
Existed | | | Average Daily
Loan Balance
on Days When
Borrowings
Existed | | | Interest
Expense | |
Veredus Select Growth Fund | | | 1.65 | % | | $ | 1,539,700 | | | $ | 70 | |
TAMRO Diversified Equity Fund | | | 1.64 | % | | | 270,343 | | | | 87 | |
Fairpointe Mid Cap Fund | | | 1.64 | % | | | 24,387,327 | | | | 12,242 | |
TAMRO Small Cap Fund | | | 1.65 | % | | | 10,549,933 | | | | 2,905 | |
River Road Select Value Fund | | | 1.65 | % | | | 37,000 | | | | 2 | |
M.D. Sass Enhanced Equity Fund | | | 1.65 | % | | | 2,504,567 | | | | 690 | |
Note (I) ReFlow Fund LLC: The Veredus Small Cap Growth Fund may participate in the ReFlow Fund LLC program (“ReFlow”), which is designed to provide an alternative liquidity source for mutual funds experiencing redemptions of their shares. In order to pay cash to shareholders who redeem their shares on a given day, a mutual fund typically must hold cash in its portfolio, liquidate portfolio securities, or borrow money, all of which impose certain costs on the fund. ReFlow provides participating mutual funds with another source of cash by standing ready to purchase shares from a fund equal to the amount of the fund’s net redemptions on a given day. ReFlow then generally redeems those shares when the fund experiences net sales or when the shares have been outstanding for the holding limit of 28 days, whichever comes first. In return for this service, the Veredus Small Cap Growth Fund will pay a fee to ReFlow at a rate determined by a daily auction with other participating mutual funds.
The costs to the Veredus Small Cap Growth Fund for participating in ReFlow are expected to be influenced by and comparable to the cost of other sources of liquidity, such as the
| | | | |
Aston Funds | | | | |
| | | April 30, 2012 | |
| Notes to Financial Statements (unaudited) – continued | | | | |
Fund’s short-term lending arrangements or the costs of selling portfolio securities to meet redemptions. ReFlow will be prohibited from acquiring more than 3% of the outstanding voting securities of the Fund.
As of April 30, 2012, the Veredus Small Cap Growth Fund had not utilized ReFlow.
Note (K) Subsequent Events: Management has evaluated the impact of all subsequent events on the Funds through the date the financial statements were issued, and has determined that there were subsequent events as follows:
The Trust filed a Post-Effective Amendment to its Registration Statement on April 9, 2012 for the purpose of adding a new series to the Trust, ASTON/River Road Dividend All Cap Fund II. This new fund is expected to commence operations on or about June 22, 2012.
| | | | |
Aston Funds | | | | |
| | | April 30, 2012 | |
Additional Information (unaudited) | | | | |
Form N-Q: The Trust files complete schedules of portfolio holdings for the Funds with the Securities and Exchange Commission (the “SEC”) for the Trust’s first and third quarters of each fiscal year on Form N-Q. The Trust’s Form N-Q are available on the SEC’s website at www.sec.gov and are available for review and copying at the SEC’s Public Reference Room in Washington, DC. Information on the operations of the Public Reference Room may be obtained by calling the SEC at 202-942-8090.
Proxy Voting: Aston Funds’ Proxy Voting Policies and Procedures, used to determine how to vote proxies relating to portfolio securities, are included in the Trust’s Statement of Additional Information, which is available (i) upon request, without charge, by calling 800-992-8151; (ii) on Aston Funds’ website at www.astonfunds.com; and (iii) on the SEC’s website at www.sec.gov. Aston Funds’ Proxy Voting Record for the most recent twelve-month period ended June 30 is available without charge (i) on the Funds’ website at www.astonfunds.com; and (ii) on the SEC’s website at www.sec.gov.
FACTORS CONSIDERED BY THE BOARD OF TRUSTEES IN APPROVING THE INVESTMENT ADVISORY AGREEMENT FOR ASTON/SILVERCREST SMALL CAP FUND
At an in-person meeting on December 15, 2011, the Board of Trustees (the “Board”) of Aston Funds (the “Trust”), including the Independent Trustees, determined that the terms of the Investment Advisory Agreement with Aston Asset Management, LP (“Aston”) with respect to the ASTON/Silvercrest Small Cap Fund (the “New Fund”) are fair and reasonable and approved the Investment Advisory Agreement for the New Fund as being in the best interests of the New Fund. In making such determinations, the Board, including the Independent Trustees, considered materials received and discussions held with respect to the approval of the Investment Advisory Agreement at the December meeting and prior meetings. The Independent Trustees met separately from the “interested” Trustees of the Trust and any officers of Aston or its affiliates to consider approval of the Investment Advisory Agreement with respect to the New Fund and were assisted by independent legal counsel in their deliberations.
In evaluating the Investment Advisory Agreement on behalf of the New Fund, the Board reviewed information regarding: (1) the nature, quality and extent of the services to be provided to the New Fund, including information regarding the personnel involved in the investment oversight process; (2) the advisory fees to be charged and estimated total expense ratio of the New Fund compared to a peer group of funds; (3) fee waivers or expenses to be reimbursed by the investment adviser and/or subadviser; and (4) potential benefits to be received by Aston or its affiliates from Aston’s relationship with the New Fund. In considering the Investment Advisory Agreement on behalf of the New Fund, the Board, including the Independent Trustees, did not identify any single factor or group of factors as all-important or controlling, but considered all factors together. The following summary does not detail all the matters considered.
Nature, Quality and Extent of Services. The Board considered that Aston intends to manage the New Fund by delegating the day-to-day investment responsibility for managing the New Fund to a subadviser. The Board considered Aston’s ability and procedures to monitor the performance of subadvisers, business practices and compliance policies and procedures. In this regard, the Board noted the responsibilities and experience of Aston personnel. The Board also noted the nature and quality of administration services currently provided by Aston to the Trust. The Board considered the nature and quantity of services provided by Aston with respect to other series of the Trust. On the basis of this evaluation, the Board concluded that the nature, quality and extent of services to be provided by Aston are expected to be satisfactory.
Expenses. The Board considered the New Fund’s proposed management fee rate and total net expense ratio after contractual expense reimbursements and fee waivers. As a part of this analysis, the Board compared the proposed advisory fees and total net expenses to those of a relevant peer group for the New Fund. The Board concluded that the proposed advisory fees were reasonable and appropriate in light of the nature, quality and extent of services to be provided by Aston.
Costs and Profitability. With respect to the costs of services to be provided and profits expected to be realized by the investment adviser, the Board considered the resources involved in managing the New Fund in light of Aston’s business model as well as fee waivers or expenses to be reimbursed under an Expense Reimbursement Agreement with Aston. The Board noted that, with respect to the New Fund, the adviser and subadviser each generally will bear 50% of any fee waivers or expense reimbursements. Because the New Fund has not yet commenced operations, profitability information was not available. However, based upon projected asset size and the impact of fee waivers or expenses to be reimbursed by the investment adviser, the Board concluded that profitability was not expected to be unreasonable.
Economies of Scale. The Board considered the extent to which economies of scale would be realized as the New Fund grows. The Board considered the potential asset size of the New Fund, as well as the terms of the Expense Reimbursement Agreement, and concluded that at this time the potential for economies of scale are limited.
Other Benefits to the Investment Adviser. The Board considered the nature and amount of fees to be paid by the New Fund for services to be provided by Aston for administration services. The Board noted that Aston currently does not intend to manage any of the Aston Funds directly, and therefore, will not benefit from the use of “soft” commission dollars to pay for research and brokerage services. The Board concluded that any other benefits to be received by the Adviser from its relationship with the New Fund was not expected to be unreasonable.
Conclusion. Based upon its evaluation of all material factors and assisted by the advice of independent legal counsel, the Board, including all of the Independent Trustees, concluded
| | | | |
Aston Funds | | | | |
| | | April 30, 2012 | |
Additional Information (unaudited) – continued | | | | |
that the terms of the Investment Advisory Agreement for the New Fund, including the proposed advisory fee, were fair and reasonable, and that the Investment Advisory Agreement on behalf of the New Fund should be approved.
FACTORS CONSIDERED BY THE BOARD OF TRUSTEES IN APPROVING THE SUB-INVESTMENT ADVISORY AGREEMENT FOR ASTON/SILVERCREST SMALL CAP FUND
The Board of Trustees (the “Board”) of Aston Funds (the “Trust”) considered the approval of a Sub-Investment Advisory Agreement (the “Sub-Investment Advisory Agreement”) between Aston Asset Management, LP (“Aston”) and Silvercrest Asset Management Group LLC (“Silvercrest”) with respect to the ASTON/Silvercrest Small Cap Fund (the “New Fund”), at an in-person meeting on December 15, 2011. The Board considered information provided and discussions held at the December meeting and at prior meetings. The Independent Trustees met separately from the “interested” Trustees of the Trust and any officers of Aston, Silvercrest or their affiliates to consider approval of the Sub-Investment Advisory Agreement and were assisted by independent legal counsel in their deliberations. Among the matters considered by the Board, including the Independent Trustees, in connection with its approval of the Sub-Investment Advisory Agreement were the following:
Nature, Quality and Extent of Services. The Board considered the nature, quality and extent of services expected to be provided under the Sub-Investment Advisory Agreement. The Board considered the reputation, qualifications and background of Silvercrest, and its operational and compliance infrastructure. The Board also considered Silvercrest’s investment approach, the experience and skills of investment personnel responsible for the day-to-day investment management of the New Fund and the resources made available to such personnel. On the basis of this evaluation, the Board concluded that the nature, quality and extent of services to be provided by Silvercrest are expected to be satisfactory.
Fees, Profitability and Economies of Scale. The Board considered the subadvisory fee rate under the Sub-Investment Advisory Agreement as well as the overall management fee structure of the New Fund. The Board considered that the sub-advisory fee rate was negotiated at arm’s length between Aston and Silvercrest, an unaffiliated third party, and that Aston would compensate the New Fund from the fees it receives from the Fund. As part of its review of the investment advisory agreement with Aston, the Board considered whether there will be economies of scale with respect to the overall fee structure of the New Fund and whether the New Fund will benefit from any economies of scale.
The Board concluded that the proposed subadvisory fee rate was reasonable in light of the nature, quality and extent of services to be provided and that economies of scale were limited at this time.
Other Benefits to the Subadviser. The Board also considered the character and amount of other incidental benefits expected
to be received by Silvercrest. The Board considered potential benefits to Silvercrest from the use of “soft dollars” to pay for research services generated by parties other than the executing broker dealer. The Board concluded that the subadvisory fees were reasonable taking into account any other benefits expected to be received by the Silvercrest from its relationship with the New Fund.
Conclusion. Based on all of the information considered and the conclusions reached, the Board determined that the terms of the Sub-Investment Advisory Agreement are fair and reasonable, and that the approval of the Sub-Investment Advisory Agreement is in the best interests of the New Fund. No single factor was determinative in the Board’s analysis.
FACTORS CONSIDERED BY THE BOARD OF TRUSTEES IN CONNECTION WITH RENEWAL OF THE INVESTMENT ADVISORY AGREEMENT WITH ASTON ASSET MANAGEMENT, LP
At an in-person meeting on December 15, 2011, the Board of Trustees (the “Board”) of Aston Funds (the “Trust”), including the trustees who are not “interested persons” as defined in Section 2(a)(9) of the Investment Company Act of 1940, as amended (the “Independent Trustees”), determined that the terms of the Investment Advisory Agreement (each, an “Investment Advisory Agreement” and collectively, the “Investment Advisory Agreements”) between the Trust and Aston Asset Management, LP (“Aston” or “Adviser”) with respect to each Renewal Fund (as defined below) continued to be fair and reasonable and approved the continuation of the Investment Advisory Agreement for each Renewal Fund as being in the best interests of such Fund. The Board considered the renewal of the Investment Advisory Agreements with respect to the following series of the Trust: ASTON/Barings International Fund, ASTON/Cardinal Mid Cap Value Fund, ASTON/Cornerstone Large Cap Value Fund, ASTON/Crosswind Small Cap Growth Fund, ASTON Dynamic Allocation Fund, ASTON/Fairpointe Mid Cap Fund, ASTON/Harrison Street Real Estate Fund, ASTON/Herndon Large Cap Value Fund, ASTON/Lake Partners LASSO Alternatives Fund, ASTON/M.D. Sass Enhanced Equity Fund, ASTON/Montag & Caldwell Balanced Fund, ASTON/Montag & Caldwell Growth Fund, ASTON/Montag & Caldwell Mid Cap Growth Fund, ASTON/Neptune International Fund, ASTON/River Road Dividend All Cap Value Fund, ASTON/River Road Select Value Fund, ASTON/River Road Small Cap Value Fund, ASTON/TAMRO Diversified Equity Fund, ASTON/TAMRO Small Cap Fund, ASTON/TCH Fixed Income Fund, ASTON/Veredus Aggressive Growth Fund and ASTON/Veredus Select Growth Fund (each, a “Renewal Fund” and collectively, the “Renewal Funds”). In making such determinations, the Board, including the Independent Trustees, considered materials received and discussions held with respect to the continuation of each Investment Advisory Agreement at meetings in September and December.
In evaluating the Investment Advisory Agreement on behalf of each Renewal Fund, the Board reviewed a broad range of information relating to the Renewal Funds and the Adviser
| | | | |
Aston Funds | | | | |
| | | April 30, 2012 | |
Additional Information (unaudited) – continued | | | | |
including: (1) the nature, extent and quality of the services provided by the Adviser; (2) comparative performance, fee and expense information (as described in more detail below); (3) the estimated profits realized by the Adviser and other information regarding the organization personnel and services provided by the Adviser; and (4) potential benefits to be received by the Adviser from its relationship with the Aston Funds. The Board also reviewed information provided by counsel to the Trust describing applicable law and its duties in reviewing the Investment Advisory Agreements. The Independent Trustees met separately from the “interested” Trustees of the Trust and any officers of Aston or its affiliates to consider the continuation of the Investment Advisory Agreements and were assisted by independent legal counsel in their deliberations. In considering the Investment Advisory Agreement on behalf of each Renewal Fund, the Board, including the Independent Trustees, did not identify any single factor or group of factors as all-important or controlling, but considered all factors together. The following summary does not detail all the matters considered.
Nature, Quality and Extent of Services. The Board considered the nature, quality and extent of services provided by Aston, including advisory services and administrative services. The Board reviewed materials outlining, among other things, Aston’s organization and personnel, the types of services provided, Aston’s business model and the performance record of the applicable Renewal Fund (as further described below). The Board considered that Aston is a manager-of-managers, and that in its role as adviser to each Renewal Fund it delegates the day-to-day investment responsibility for managing each Renewal Fund to a subadviser. Accordingly, the Board considered information provided regarding Aston’s capabilities and processes with respect to the selection of subadvisers and monitoring of subadvisers on an ongoing basis, as well as information regarding the composition, experience and role of its Investment Committee. In this regard, the Board noted the responsibilities and experience of Aston personnel, the resources made available to such personnel, the ability of Aston to attract and retain high quality personnel and the organizational depth and stability of Aston.
In addition to advisory services, the Board considered the quality of other services provided by Aston including oversight of service providers, regulatory administration and Board support, fund administration and operational support, compliance services, shareholder servicing and platform management, and distribution and marketing related services. Given the importance of compliance, the Board also considered the Adviser’s and Trust’s compliance program, including reports from the Chief Compliance Officer received throughout the year regarding the Adviser’s and Trust’s compliance policies and procedures.
The Board reviewed reports that contained performance data for each Renewal Fund on a comparative basis to a relevant peer group of mutual funds and an appropriate index compiled by Lipper (the “Lipper Report”). Each Lipper Report contained performance information for the one-, three-, five-year and since-inception periods ended June 30, 2011. In reviewing
peer group comparison information, the Board considered that with respect to certain Renewal Funds (ASTON/M.D. Sass Enhanced Equity Fund, ASTON Dynamic Allocation Fund and ASTON/Lake Partners LASSO Alternatives Fund), supplemental comparative performance information requested from Aston provided a more meaningful basis for comparison in light of the limited size of the Lipper peer group. With respect to each Renewal Fund, the Board reviewed the performance of each Fund relative to its peer group and its benchmark index over the periods presented. The Board considered whether the performance of each Fund was consistent with the Fund’s investment objectives and policies and the investment strategy of the subadviser. With respect to each Renewal Fund, the Board determined that the performance of each Renewal Fund was satisfactory over time or, as discussed in more detail below, underperformance was being satisfactorily addressed at this time.
With respect to certain Renewal Funds (ASTON/River Road Select Value Fund, ASTON/River Road Small Cap Value Fund and ASTON/Veredus Aggressive Growth Fund), the Board considered that the Fund had underperformed its peer group and/or benchmark indices over both short-term and long-term periods. For these Funds, the Board requested and considered additional information provided by, and discussions held with, the Adviser regarding the factors that contributed to underperformance and the Adviser’s heightened monitoring of the applicable subadviser. The Board was satisfied with the information provided, and action being taken, by the Adviser to monitor performance with respect to these Funds.
With respect to certain Renewal Funds (ASTON/Fairpointe Mid Cap Fund, ASTON/Cornerstone Large Cap Value Fund and ASTON/Harrison Street Real Estate Fund), the Board considered that each Fund had recently undergone a change of subadviser. With respect to the ASTON/Harrison Street Real Estate Fund, the Board considered that while the performance for the five-year period was in the fourth quintile, performance for the one-year period was in the first quintile and the performance for all periods presented in the Lipper Report reflected the performance of the previous subadviser. With respect to the ASTON/Cornerstone Large Cap Value Fund, the Board considered that the performance for all periods contained in the Lipper Report was in the third quintile; however, such performance reflected the performance of the previous subadviser. With respect to the ASTON/Fairpointe Mid Cap Fund, the Board considered that while the performance information reflected a previous subadviser, the portfolio management team had remained the same. The Board noted the fourth quintile performance in the one-year period, but gave greater weight to the top quintile performance of the Fund for the five-year period.
The Board considered that each of the ASTON Dynamic Allocation Fund and the ASTON/Lake Partners LASSO Alternatives Fund invests primarily in other investment companies (each, a “Fund-of-Funds”). The Board noted that each Fund-of-Funds historically has invested in underlying funds outside of the Aston Funds complex and that, with respect to the ASTON Dynamic Allocation Fund, Aston Funds do not offer
| | | | |
Aston Funds | | | | |
| | | April 30, 2012 | |
Additional Information (unaudited) – continued | | | | |
exchange-traded funds. Accordingly, the Board determined, with respect to each Fund-of-Funds, that the management fees charged are based on services provided that are in addition to, rather than duplicative of, services provided under the advisory contract of the underlying funds in which the Fund-of-Funds may invest.
On the basis of this evaluation and its ongoing review of operations, the Board concluded that the nature, quality and extent of services provided by Aston historically have been, and continue to be, satisfactory.
Fees and Expenses. The Board evaluated the management fees and expense of each Renewal Fund reviewing, among other things, each Fund’s gross management fees, net management fees and total expense ratio, both on an absolute basis and as compared to comparative fee and expense information of a relevant peer group compiled by Lipper. As a part of this analysis, the Board also considered advisory fees waived or expenses reimbursed by Aston pursuant to contractual expense limitation or reimbursement agreements. The Board considered modifications to the expense limitation and expense reimbursement agreements proposed at the meeting and the effect those agreements would have on expense ratios of the Renewal Funds, if any. Except as discussed below, the Board noted that the gross management fees, net management fees and total operating expenses were within a reasonable range of Lipper peer group averages. With respect to certain Renewal Funds (ASTON/M.D. Sass Enhanced Equity Fund, ASTON Dynamic Allocation Fund and ASTON/Lake Partners LASSO Alternatives Fund), the Board considered that supplemental comparative fee and expense information requested from the Adviser provided a more meaningful basis of comparison due to the limited size of the Lipper peer group. With respect to certain Renewal Funds (ASTON/Cardinal Mid Cap Value Fund, ASTON/Montag & Caldwell Mid Cap Growth Fund, ASTON/Crosswind Small Cap Growth Fund and ASTON/Neptune International Fund), the Board considered that while the gross management fee was higher than peer group averages, total expenses were within a reasonable range of peer group averages taking into account the impact of fee waivers and reimbursements. With respect to ASTON/Lake Partners LASSO Alternatives Fund, the Board considered that higher total operating expenses of the Fund were attributable to the inclusion of acquired fund fees and expenses in the expense ratio which do not reflect operating expenses.
The Board also considered the advisory fees charged by Aston to separate account clients. The Board considered that the fee rates charged to the Renewal Funds and other clients vary because of the different services involved and the additional regulatory and compliance requirements, among other things, associated with registered investment companies such as the Renewal Funds. Accordingly, the Board considered the differences in product types, including differences in the services provided, the structure and operations, product distribution and costs thereof, investor profiles, account sizes and regulatory requirements. The Board noted that the range of services provided to the Renewal Funds (as discussed above) is much more extensive than those provided to separate accounts.
On the basis of the information provided, the Board concluded that management fees were reasonable and appropriate in light of the nature, quality and extent of services provided by Aston.
Costs and Profitability. The Board considered certain financial information and statistics related to the costs of providing advisory services and profitability of Aston’s advisory agreements with each Renewal Fund in light of Aston’s business model, as well as fee waivers or expenses to be reimbursed, as applicable. The Board noted that for certain Renewal Funds, Aston and the subadviser will each bear 50% of any fee waivers or expense reimbursements and for other Renewal Funds, the subadviser is not responsible for contributing to expense reimbursements. The Board considered that the information was provided by Aston and was based on a number of estimates and allocation decisions. Because the Board recognized the inherently subjective nature of profitability analysis, this information was utilized as an approximate rather than a definitive measure of profitability. The Board considered that Aston must be able to compensate its employees at competitive rates in order to attract and retain high-quality personnel to provide high-quality services to the Funds. Based on the information provided, the Board concluded that the profits realized by Aston in connection with the management of the Funds were not unreasonable.
Economies of Scale. The Board considered whether there are economies of scale with respect to the management of the Funds and whether the Funds benefit from any economies of scale. The Board considered the size of the Funds, any breakpoints in fees, and the nature of the asset class and any capacity limits. The Board noted that the Investment Advisory Agreements with respect to the ASTON/Fairpointe Mid Cap Fund and the ASTON/Montag & Caldwell Growth Fund contain breakpoints in their management fee rates based on average daily net assets. The Board concluded that the management fee schedules for the ASTON/Fairpointe Mid Cap Fund and the ASTON/Montag & Caldwell Growth Fund reflect an appropriate level of sharing of economies of scale. The Board determined that economies of scale were limited for the other Renewal Funds at this time due to their asset size and/or capacity constraints with respect to the investment strategy of the applicable subadviser.
Other Benefits to the Investment Adviser. The Board considered the character and amount of other incidental benefits received by Aston as a result of its relationship with the Aston Funds. The Board considered the nature and amount of fees to be paid by the Aston Funds for services provided by Aston for administration services, and payments under the Rule 12b-1 distribution plans. The Board also took into account other businesses that the Adviser has, or may develop, with subadvisers to the Aston Funds with respect to separately managed accounts of certain subadvisers, including the compensation received by Aston for client solicitation or support services provided in connection with such products. The Board noted that Aston does not manage any of the Aston Funds directly and therefore will not benefit from the use of “soft” commission dollars to pay for research and brokerage services. The Board concluded that any incidental benefits to be received by Aston from its relationship
| | | | |
Aston Funds | | | | |
| | | April 30, 2012 | |
Additional Information (unaudited) – continued | | | | |
with the Aston Funds are expected to be reasonable and that the management fees were reasonable taking into account any other benefits to be received by the Adviser.
Conclusion. Based upon its evaluation of all material factors and assisted by the advice of independent legal counsel, the Board, including all of the Independent Trustees, concluded that the terms of the Investment Advisory Agreement for each Renewal Fund including the advisory fees were fair and reasonable, and that the continuation of the Investment Advisory Agreement on behalf of each Renewal Fund should be approved.
FACTORS CONSIDERED BY THE BOARD OF TRUSTEES IN CONNECTION WITH RENEWAL OF THE SUB-INVESTMENT ADVISORY AGREEMENTS
At an in-person meeting on December 15, 2011, the Board of Trustees (the “Board”) of Aston Funds (the “Trust”) determined that the terms of the Sub-Investment Advisory Agreements (each, a “Sub-Investment Advisory Agreement” and collectively, the “Sub-Investment Advisory Agreements”) listed below continued to be fair and reasonable and approved the continuation of the Sub-Investment Advisory Agreements as being in the best interest of the Renewal Fund (as defined below). The continuation of the Sub-Investment Advisory Agreements between Aston and each of the following subadvisers (each, a “Subadviser,” and collectively, the “Subadvisers”) with respect to the series of the Trust listed below (each, a “Renewal Fund” and collectively, the “Renewal Funds”) were considered:
| | |
| Baring International Investment Limited | | ASTON/Barings International Fund |
| |
| Cardinal Capital Management, L.L.C. | | ASTON/Cardinal Mid Cap Value Fund |
| |
| Crosswind Investments, LLC | | ASTON/Crosswind Small Cap Growth Fund |
| |
| Herndon Capital Management, LLC | | ASTON/Herndon Large Cap Value Fund |
| |
| Lake Partners, Inc. | | ASTON/Lake Partners LASSO Alternatives Fund |
| |
| M.D. Sass Investors Services, Inc. | | ASTON/M.D. Sass Enhanced Equity Fund |
| |
| Montag & Caldwell, LLC | | ASTON/Montag & Caldwell Balanced Fund, ASTON/Montag & Caldwell Growth Fund, and ASTON/Montag & Caldwell Mid Cap Growth Fund |
| |
| Neptune Investment Management Limited | | ASTON/Neptune International Fund |
| |
| River Road Asset Management, LLC | | ASTON/River Road Dividend All Cap Value Fund, ASTON/River Road Select Value Fund, and ASTON/River Road Small Cap Value Fund |
| | |
Smart Portfolios, LLC | | ASTON Dynamic Allocation Fund |
| |
| TAMRO Capital Partners, LLC | | ASTON/TAMRO Diversified Equity Fund and ASTON/TAMRO Small Cap Fund |
| |
| Taplin, Canida & Habacht, LLC | | ASTON/TCH Fixed Income Fund |
| |
| Todd-Veredus Asset Management LLC | | ASTON/Veredus Aggressive Growth Fund and ASTON/Veredus Select Growth Fund |
In making such determinations, the Board, including the Independent Trustees, reviewed a broad range of information relating to the Renewal Funds (as described in detail with respect to the consideration of the Investment Advisory Agreements with Aston) and each Subadviser at in-person meetings in September and December including (1) the nature and quality of services provided by each Subadviser; (2) comparative performance, fee and expense information; (3) information regarding each organization, its personnel and services provided; (4) information regarding other products offered by the Subadviser and fee information with respect to those products; and (5) potential benefits to be received by the Subadviser from its relationship with the Aston Funds including information regarding soft dollar benefits. The Board also took into account information provided throughout the year with respect to the performance of the Renewal Funds, and operations and compliance matters with respect to each Subadviser. The Independent Trustees met separately from the “interested” Trustees of the Trust and any officers of Aston, the Subadvisers or their affiliates to consider the continuation of the Sub-Investment Advisory Agreements and were assisted by independent legal counsel in their deliberations. Among the matters considered by the Board, including the Independent Trustees, in connection with its approval of the Sub-Investment Advisory Agreements were the following:
Nature, Quality and Extent of Services. The Board considered the nature, quality and extent of services provided by each Subadviser under the Sub-Investment Advisory Agreements. The Board considered information provided regarding the experience and skills of senior management and investment personnel of each Subadviser, the resources made available to such personnel, the ability of each Subadviser to attract and retain high-quality personnel, and the organizational depth and stability of each Subadviser, as well as information regarding changes in ownership or key personnel and the impact of such changes on the services provided. The Board noted that all of the information provided and discussions held with respect to the performance of each Renewal Fund (as discussed in detail with respect to the Board’s consideration of the Investment Advisory Agreements) applied equally to its consideration of the Sub-Investment Advisory Agreements. The Board also considered information provided on a regular basis with respect to organizational changes, investment strategy and portfolio updates, operational matters and compliance matters with respect to each Subadviser.
| | | | |
Aston Funds | | | | |
| | | April 30, 2012 | |
Additional Information (unaudited) – continued | | | | |
On the basis of this evaluation and its ongoing review of operations, the Board concluded that the nature, quality and extent of services provided by each Subadviser historically has been and continues to be satisfactory, and that the performance of each Renewal Fund over time was satisfactory or that adequate steps had been taken to monitor and address underperformance (as discussed in the previous section “FACTORS CONSIDERED BY THE BOARD OF TRUSTEES IN CONNECTION WITH THE RENEWAL OF THE INVESTMENT ADVISORY AGREEMENT WITH ASTON ASSET MANAGEMENT, LP”).
Fees, Profitability and Economies of Scale. The Board considered the fee structure under the Sub-Investment Advisory Agreements, noting that the subadvisory fee rate generally is fifty per percent (50%) of management fees less certain third party payments, fee waivers and expense reimbursement incurred by the Adviser. In light of this fee structure, the Board determined that all of the information provided and discussions held with respect to the comparative fee and expense information of each Renewal Fund (as described in detail with respect to its consideration of the Investment Advisory Agreements) applied equally to its consideration of the appropriateness of the subadvisory fees. The Board considered that the subadvisory fee rates were negotiated at arm’s length between Aston and each Subadviser, each an unaffiliated third party, and that Aston will compensate each Subadviser from its own fees. With respect to ASTON/River Road Select Value Fund, ASTON/River Road Small Cap Value Fund, ASTON/TAMRO Small Cap Fund and ASTON/Veredus Aggressive Growth Fund, the Board considered the capacity constraints and resulting limits on asset growth with respect to these strategies.
The Board also considered information provided by each Subadviser with respect to fees charged to other mutual funds and separate account clients, if applicable. The Board considered that the fee rates charged to the Renewal Funds and other clients vary because of the additional regulatory and compliance requirements, among other things, associated with registered investment companies such as the Renewal Funds and other differences in the products and services provided, including differences in fee structures. The Board determined that profitability information with respect to the Subadvisers was not material to its considerations in light of the fee model used by Aston and the unaffiliated status of all Subadvisers.
On the basis of the information provided, the Board concluded that subadvisory fees were reasonable and appropriate in light of the nature, quality and extent of services provided by each Subadviser.
Other Benefits to the Subadviser. The Board also considered the character and amount of other incidental benefits received by the Subadvisers and their affiliates as a result of their association with the Aston Funds. The Board considered information provided regarding potential benefits to certain Subadvisers from the use of “soft dollars” to pay for research services generated by parties other than the executing broker dealer. The Board also noted other business relationships with Aston and certain Subadvisers with respect to separately managed
accounts. The Board concluded that the subadvisory fees were reasonable taking into account any other benefits to be received by the Subadvisers from their relationship with the Renewal Funds.
Conclusion. Based on all of the information considered and the conclusions reached, the Board determined that the terms of each Sub-Investment Advisory Agreement are fair and reasonable, and that the continuance of each Sub-Investment Advisory Agreement is in the best interests of each Renewal Fund. No single factor was determinative in the Board’s analysis.
FACTORS CONSIDERED BY THE BOARD OF TRUSTEES IN APPROVING THE SUB-INVESTMENT ADVISORY AGREEMENT FOR ASTON SMALL CAP GROWTH FUND
The Board of Trustees (the “Board”) of Aston Funds (the “Trust”), including the trustees who are not interested persons of the Trust (the “Independent Trustees”), considered the approval of a Sub-Investment Advisory Agreement (the “Sub-Investment Advisory Agreement”) between Aston Asset Management, LP (“Aston”) and Lee Munder Capital Group, LLC (“LMCG”) with respect to the ASTON Small Cap Growth Fund (formerly, ASTON/Crosswind Small Cap Growth Fund) (the “Fund”), at an in-person meeting on February 15–17, 2012. The Board considered information provided and discussions held at the February 15–17, 2012 meeting.
The Independent Trustees met separately from the “interested” Trustees of the Trust and any officers of Aston, LMCG or their affiliates to consider approval of the Sub-Investment Advisory Agreement and were assisted by independent legal counsel in their deliberations. Among the matters considered by the Board, including the Independent Trustees, in connection with its approval of the Sub-Investment Advisory Agreement were the following:
Nature, Quality and Extent of Services. The Board considered the nature, quality and extent of services expected to be provided under the Sub-Investment Advisory Agreement. The Board considered the reputation, qualifications and background of LMCG and its operational and compliance infrastructure. The Board also considered information provided regarding the experience and skills of senior management and investment personnel of LMCG, the resources made available to such personnel, the ability of LMCG to attract and retain high-quality personnel, and the organizational depth of LMCG. The Board considered that Mr. Andrew Morey, the portfolio manager of the Fund since its inception, would continue to manage the Fund at LMCG, and that the investment objective and principal strategies of the Fund would not change. On the basis of this evaluation, the Board concluded that the nature, quality and extent of services to be provided by LMCG are expected to be satisfactory.
Fees, Profitability and Economies of Scale. The Board considered the subadvisory fee rate under the Sub-Investment Advisory Agreement as well as the overall management fee
| | | | |
Aston Funds | | | | |
| | | April 30, 2012 | |
Additional Information (unaudited) – continued | | | | |
structure of the Fund, noting that the subadvisory fee rate is fifty per percent (50%) of management fees less certain third party payments, fee waivers and expense reimbursement incurred by Aston. The Board considered that the subadvisory fee rate was negotiated at arm’s length between Aston and LMCG, an unaffiliated third party, and that Aston would compensate LMCG from the fees it receives from the Fund. As part of its review of the investment advisory agreement with Aston, the Board considered whether there will be economies of scale with respect to the overall fee structure of the Fund and whether the Fund will benefit from any economies of scale.
The Board also considered information provided by each Subadviser with respect to fees charged to other mutual funds and separate account clients, as applicable. The Board considered that the fee rates charged to the Fund and other clients vary because of the additional regulatory and compliance requirements, among other things, associated with registered investment companies such as the Fund and other differences in the products and services provided, including differences in fee structures. The Board determined that profitability information with respect to the LMCG was not material to its considerations in light of the fee model used by Aston and the unaffiliated status of LMCG.
The Board concluded that the proposed subadvisory fee rate was reasonable in light of the nature, quality and extent of services to be provided and that economies of scale were limited at this time.
Other Benefits to the Subadviser. The Board also considered the character and amount of other incidental benefits expected to be received by LMCG as a result of its association with the Fund. The Board considered potential benefits to LMCG from the use of “soft dollars” to pay for research services generated by parties other than the executing broker dealer. The Board concluded that the subadvisory fees were reasonable taking into account any other benefits expected to be received by LMCG from its relationship with the Fund.
Conclusion. Based on all of the information considered and the conclusions reached, the Board determined that the terms of the Sub-Investment Advisory Agreement are fair and reasonable, and that the approval of the Sub-Investment Advisory Agreement is in the best interests of the Fund. No single factor was determinative in the Board’s analysis.
Disclosure of Fund Expenses: We believe it is important for you to understand the impact of fees regarding your investment. All mutual funds have operating expenses. As a shareholder of a mutual fund, you incur ongoing costs, which include costs for portfolio management, administrative services, and shareholder reports (like this one), among others. Operating expenses, which are deducted from a fund’s gross income, directly reduce the investment return of the fund. A fund’s expenses are expressed as a percentage of its average daily net assets. This figure is known as the expense ratio. The following examples are intended to help you understand the ongoing fees (in dollars) of investing in your Fund and to compare these costs with those of other mutual funds. The examples are based
on an investment of $1,000 made at the beginning of the period shown and held for the entire period.
This table illustrates each Fund’s costs in two ways:
Actual Fund Return: This section helps you to estimate the actual expenses, after any applicable fee waivers, that you paid over the period. The “Ending Account Value” shown is derived from the Fund’s actual return for the past six-month period, the “Expense Ratio” column shows the period’s annualized expense ratio, and the “Expenses Paid During Period” column shows the dollar amount that would have been paid by an investor who started with $1,000 in the Fund at the beginning of the period. You may use the information here, together with your account value, to estimate the expenses that you paid over the period. To do so, simply divide your account value by $1,000 (for example, an $8,600 account value divided by $1,000 = 8.6), then multiply the result by the number given for your Fund in the first line under the heading entitled “Expenses Paid During Period.”
Hypothetical 5% Return: This section is intended to help you compare your Fund’s costs with those of other mutual funds. It assumes that the Fund had an annual return of 5% before expenses, but that the expense ratio is unchanged. In this case, because the return used is not the Fund’s actual return, the results do not apply to your investment. This example is useful in making comparisons to other mutual funds because the SEC requires all mutual funds to calculate expenses based on an assumed 5% annual return. You can assess your Fund’s costs by comparing this hypothetical example with the hypothetical examples that appear in shareholder reports of other funds.
Please note that the expenses shown in the table are meant to highlight and help you compare your ongoing costs only and do not reflect any transactional costs such as sales charges (loads) and redemption fees, which are described in the prospectus. If these costs were applied to your account, your costs would be higher.
| | | | | | | | | | | | | | | | |
| | | Beginning
Account
Value
11/01/11 | | | Ending
Account
Value
04/30/12 | | | Expense
Ratio(1) | | | Expenses
Paid During
Period(2) | |
M&C Growth Fund | | | | | | | | | | | | | | | | |
Actual Fund Return | | | | | | | | | | | | | | | | |
Class N | | $ | 1,000 | | | $ | 1,112.70 | | | | 1.06 | % | | $ | 5.57 | |
Class I | | | 1,000 | | | | 1,114.50 | | | | 0.81 | % | | | 4.26 | |
Class R | | | 1,000 | | | | 1,111.50 | | | | 1.31 | % | | | 6.88 | |
Hypothetical 5% Return | | | | | | | | | | | | | | | | |
Class N | | $ | 1,000 | | | $ | 1,019.59 | | | | 1.06 | % | | $ | 5.32 | |
Class I | | | 1,000 | | | | 1,020.84 | | | | 0.81 | % | | | 4.07 | |
Class R | | | 1,000 | | | | 1,018.35 | | | | 1.31 | % | | | 6.57 | |
Veredus Select Growth Fund | | | | | | | | | | | | | |
Actual Fund Return | | | | | | | | | | | | | | | | |
Class N | | $ | 1,000 | | | $ | 1,049.20 | | | | 1.30 | % | | $ | 6.62 | |
Class I | | | 1,000 | | | | 1,049.30 | | | | 1.05 | % | | | 5.35 | |
Hypothetical 5% Return | | | | | | | | | | | | | | | | |
Class N | | $ | 1,000 | | | $ | 1,018.40 | | | | 1.30 | % | | $ | 6.52 | |
Class I | | | 1,000 | | | | 1,019.64 | | | | 1.05 | % | | | 5.27 | |
| | | | |
Aston Funds | | | | |
| | | April 30, 2012 | |
Additional Information (unaudited) – continued | | | | |
| | | | | | | | | | | | | | | | |
| | | Beginning
Account
Value
11/01/11 | | | Ending
Account
Value
04/30/12 | | | Expense
Ratio(1) | | | Expenses
Paid During
Period(2) | |
TAMRO Diversified Equity Fund(3) | | | | | | | | | |
Actual Fund Return | | | | | | | | | | | | | | | | |
Class N | | $ | 1,000 | | | $ | 1,112.80 | | | | 1.20 | % | | $ | 6.30 | |
Class I | | | 1,000 | | | | 1,012.80 | | | | 0.95 | % | | | 1.57 | |
Hypothetical 5% Return | | | | | | | | | | | | | | | | |
Class N | | $ | 1,000 | | | $ | 1,018.90 | | | | 1.20 | % | | $ | 6.02 | |
Class I | | | 1,000 | | | | 1,020.14 | | | | 0.95 | % | | | 4.77 | |
Herndon Large Cap Value Fund | | | | | | | | | |
Actual Fund Return | | | | | | | | | | | | | | | | |
Class N | | $ | 1,000 | | | $ | 1,117.10 | | | | 1.30 | % | | $ | 6.84 | |
Class I | | | 1,000 | | | | 1,119.10 | | | | 1.05 | % | | | 5.53 | |
Hypothetical 5% Return | | | | | | | | | | | | | | | | |
Class N | | $ | 1,000 | | | $ | 1,018.40 | | | | 1.30 | % | | $ | 6.52 | |
Class I | | | 1,000 | | | | 1,019.64 | | | | 1.05 | % | | | 5.27 | |
Cornerstone Large Cap Value Fund | | | | | | | | | |
Actual Fund Return | | | | | | | | | | | | | | | | |
Class N | | $ | 1,000 | | | $ | 1,091.30 | | | | 1.23 | % | | $ | 6.40 | |
Class I | | | 1,000 | | | | 1,091.60 | | | | 0.98 | % | | | 5.10 | |
Hypothetical 5% Return | | | | | | | | | | | | | | | | |
Class N | | $ | 1,000 | | | $ | 1,018.75 | | | | 1.23 | % | | $ | 6.17 | |
Class I | | | 1,000 | | | | 1,019.99 | | | | 0.98 | % | | | 4.92 | |
River Road Dividend All Cap Value Fund | | | | | | | | | |
Actual Fund Return | | | | | | | | | | | | | | | | |
Class N | | $ | 1,000 | | | $ | 1,088.70 | | | | 1.11 | % | | $ | 5.76 | |
Class I | | | 1,000 | | | | 1,090.10 | | | | 0.86 | % | | | 4.47 | |
Hypothetical 5% Return | | | | | | | | | | | | | | | | |
Class N | | $ | 1,000 | | | $ | 1,019.34 | | | | 1.11 | % | | $ | 5.57 | |
Class I | | | 1,000 | | | | 1,020.59 | | | | 0.86 | % | | | 4.32 | |
Fairpointe Mid Cap Fund | | | | | | | | | |
Actual Fund Return | | | | | | | | | | | | | | | | |
Class N | | $ | 1,000 | | | $ | 1,089.10 | | | | 1.12 | % | | $ | 5.82 | |
Class I | | | 1,000 | | | | 1,090.80 | | | | 0.87 | % | | | 4.52 | |
Hypothetical 5% Return | | | | | | | | | | | | | | | | |
Class N | | $ | 1,000 | | | $ | 1,019.29 | | | | 1.12 | % | | $ | 5.62 | |
Class I | | | 1,000 | | | | 1,020.54 | | | | 0.87 | % | | | 4.37 | |
Montag & Caldwell Mid Cap Growth Fund | | | | | | | | | |
Actual Fund Return | | | | | | | | | | | | | | | | |
Class N | | $ | 1,000 | | | $ | 1,112.30 | | | | 1.25 | % | | $ | 6.56 | |
Hypothetical 5% Return | | | | | | | | | | | | | | | | |
Class N | | | 1,000 | | | $ | 1,018.65 | | | | 1.25 | % | | | 6.27 | |
Cardinal Mid Cap Value Fund | | | | | | | | | |
Actual Fund Return | | | | | | | | | | | | | | | | |
Class N | | $ | 1,000 | | | $ | 1,094.60 | | | | 1.40 | % | | $ | 7.29 | |
Hypothetical 5% Return | | | | | | | | | | | | | | | | |
Class N | | | 1,000 | | | | 1,017.90 | | | | 1.40 | % | | | 7.02 | |
Veredus Small Cap Growth Fund | | | | | | | | | |
Actual Fund Return | | | | | | | | | | | | | | | | |
Class N | | $ | 1,000 | | | $ | 1,071.20 | | | | 1.49 | % | | $ | 7.67 | |
Class I | | | 1,000 | | | | 1,071.80 | | | | 1.24 | % | | | 6.39 | |
Hypothetical 5% Return | | | | | | | | | | | | | | | | |
Class N | | $ | 1,000 | | | $ | 1,017.45 | | | | 1.49 | % | | $ | 7.47 | |
Class I | | | 1,000 | | | | 1,018.70 | | | | 1.24 | % | | | 6.22 | |
Small Cap Growth Fund | | | | | | | | | |
Actual Fund Return | | | | | | | | | | | | | | | | |
Class N | | $ | 1,000 | | | | 1,117.60 | | | | 1.35 | % | | $ | 7.11 | |
Class I | | | 1,000 | | | | 1,118.40 | | | | 1.10 | % | | | 5.79 | |
Hypothetical 5% Return | | | | | | | | | | | | | | | | |
Class N | | $ | 1,000 | | | | 1,018.15 | | | | 1.35 | % | | $ | 6.77 | |
Class I | | | 1,000 | | | | 1,019.39 | | | | 1.10 | % | | | 5.52 | |
| | | | | | | | | | | | | | | | |
| | | Beginning
Account
Value
11/01/11 | | | Ending
Account
Value
04/30/12 | | | Expense
Ratio(1) | | | Expenses
Paid During
Period(2) | |
Silvercrest Small Cap Fund (4) | |
Actual Fund Return | | | | | | | | | | | | | | | | |
Class N | | $ | 1,000 | | | $ | 1,101.00 | | | | 1.40 | % | | $ | 5.06 | |
Class I | | | 1,000 | | | | 1,102.00 | | | | 1.15 | % | | | 4.16 | |
Hypothetical 5% Return | | | | | | | | | | | | | | | | |
Class N | | $ | 1,000 | | | $ | 1,017.90 | | | | 1.40 | % | | $ | 7.02 | |
Class I | | | 1,000 | | | | 1,019.14 | | | | 1.15 | % | | | 5.77 | |
TAMRO Small Cap Fund | | | | | | | | | |
Actual Fund Return | | | | | | | | | | | | | | | | |
Class N | | $ | 1,000 | | | $ | 1,107.00 | | | | 1.29 | % | | $ | 6.76 | |
Class I | | | 1,000 | | | | 1,108.80 | | | | 1.04 | % | | | 5.45 | |
Hypothetical 5% Return | | | | | | | | | | | | | | | | |
Class N | | $ | 1,000 | | | $ | 1,018.45 | | | | 1.29 | % | | $ | 6.47 | |
Class I | | | 1,000 | | | | 1,019.69 | | | | 1.04 | % | | | 5.22 | |
River Road Select Value Fund | | | | | | | | | |
Actual Fund Return | | | | | | | | | | | | | | | | |
Class N | | $ | 1,000 | | | $ | 1,099.40 | | | | 1.45 | % | | $ | 7.57 | |
Class I | | | 1,000 | | | | 1,101.40 | | | | 1.20 | % | | | 6.27 | |
Hypothetical 5% Return | | | | | | | | | | | | | | | | |
Class N | | $ | 1,000 | | | $ | 1,017.65 | | | | 1.45 | % | | $ | 7.27 | |
Class I | | | 1,000 | | | | 1,018.90 | | | | 1.20 | % | | | 6.02 | |
River Road Small Cap Value Fund | | | | | | | | | |
Actual Fund Return | | | | | | | | | | | | | | | | |
Class N | | $ | 1,000 | | | $ | 1,090.20 | | | | 1.39 | % | | $ | 7.22 | |
Class I | | | 1,000 | | | | 1,091.70 | | | | 1.14 | % | | | 5.93 | |
Hypothetical 5% Return | | | | | | | | | | | | | | | | |
Class N | | $ | 1,000 | | | $ | 1,017.95 | | | | 1.39 | % | | $ | 6.97 | |
Class I | | | 1,000 | | | | 1,019.19 | | | | 1.14 | % | | | 5.72 | |
River Road Independent Value Fund | | | | | | | | | |
Actual Fund Return | | | | | | | | | | | | | | | | |
Class N | | $ | 1,000 | | | $ | 1,023.30 | | | | 1.42 | % | | $ | 7.14 | |
Class I | | | 1,000 | | | | 1,025.20 | | | | 1.17 | % | | | 5.89 | |
Hypothetical 5% Return | | | | | | | | | | | | | | | | |
Class N | | $ | 1,000 | | | $ | 1,017.80 | | | | 1.42 | % | | $ | 7.12 | |
Class I | | | 1,000 | | | | 1,019.05 | | | | 1.17 | % | | | 5.87 | |
Doubleline Core Plus Fixed Income Fund | | | | | | | | | |
Actual Fund Return | | | | | | | | | | | | | | | | |
Class N | | $ | 1,000 | | | $ | 1,053.40 | | | | 0.94 | % | | $ | 4.80 | |
Class I | | | 1,000 | | | | 1,054.80 | | | | 0.69 | % | | | 3.53 | |
Hypothetical 5% Return | | | | | | | | | | | | | | | | |
Class N | | $ | 1,000 | | | $ | 1,020.19 | | | | 0.94 | % | | $ | 4.72 | |
Class I | | | 1,000 | | | | 1,021.43 | | | | 0.69 | % | | | 3.47 | |
TCH Fixed Income Fund | | | | | | | | | |
Actual Fund Return | | | | | | | | | | | | | | | | |
Class N | | $ | 1,000 | | | $ | 1,037.40 | | | | 0.87 | % | | $ | 4.41 | |
Class I | | | 1,000 | | | | 1,039.40 | | | | 0.69 | % | | | 3.50 | |
Hypothetical 5% Return | | | | | | | | | | | | | | | | |
Class N | | $ | 1,000 | | | $ | 1,020.54 | | | | 0.87 | % | | $ | 4.37 | |
Class I | | | 1,000 | | | | 1,021.43 | | | | 0.69 | % | | | 3.47 | |
Lake Partners LASSO Alternatives Fund | | | | | |
Actual Fund Return | | | | | | | | | |
Class N | | $ | 1,000 | | | $ | 1,047.40 | | | | 1.45 | % | | $ | 7.38 | |
Class I | | | 1,000 | | | | 1,048.80 | | | | 1.20 | % | | | 6.11 | |
Hypothetical 5% Return | | | | | | | | | | | | | | | | |
Class N | | $ | 1,000 | | | $ | 1,017.65 | | | | 1.45 | % | | $ | 7.27 | |
Class I | | | 1,000 | | | | 1,018.90 | | | | 1.20 | % | | | 6.02 | |
| | | | |
Aston Funds | | | | |
| | | April 30, 2012 | |
Additional Information (unaudited) – continued | | | | |
| | | | | | | | | | | | | | | | |
| | | Beginning
Account
Value
11/01/11 | | | Ending
Account
Value
04/30/12 | | | Expense
Ratio(1) | | | Expenses
Paid During
Period(2) | |
Dynamic Allocation Fund | | | | | | | | | |
Actual Fund Return | | | | | | | | | | | | | | | | |
Class N | | $ | 1,000 | | | $ | 976.70 | | | | 1.30 | % | | $ | 6.39 | |
Class I | | | 1,000 | | | | 977.10 | | | | 1.05 | % | | | 5.16 | |
Hypothetical 5% Return | | | | | | | | | | | | | | | | |
Class N | | $ | 1,000 | | | $ | 1,018.40 | | | | 1.30 | % | | $ | 6.52 | |
Class I | | | 1,000 | | | | 1,019.64 | | | | 1.05 | % | | | 5.27 | |
M.D. Sass Enhanced Equity Fund | | | | | | | | | |
Actual Fund Return | | | | | | | | | | | | | | | | |
Class N | | $ | 1,000 | | | $ | 1,046.10 | | | | 1.30 | % | | $ | 6.61 | |
Class I | | | 1,000 | | | | 1,048.40 | | | | 1.05 | % | | | 5.35 | |
Hypothetical 5% Return | | | | | | | | | | | | | | | | |
Class N | | $ | 1,000 | | | | 1,018.40 | | | | 1.30 | % | | $ | 6.52 | |
Class I | | | 1,000 | | | | 1,019.64 | | | | 1.05 | % | | | 5.27 | |
River Road Long-Short Fund (5) | | | | | | | | | |
Actual Fund Return | | | | | | | | | | | | | | | | |
Class N | | $ | 1,000 | | | $ | 1,050.40 | | | | 1.70 | % | | $ | 8.67 | |
Hypothetical 5% Return | | | | | | | | | | | | | | | | |
Class N | | | 1,000 | | | $ | 1,016.41 | | | | 1.70 | % | | | 8.52 | |
Neptune International Fund | | | | | | | | | |
Actual Fund Return | | | | | | | | | | | | | | | | |
Class N | | $ | 1,000 | | | $ | 1,034.40 | | | | 1.27 | % | | $ | 6.42 | |
Class I | | | 1,000 | | | | 1,034.90 | | | | 1.02 | % | | | 5.16 | |
Hypothetical 5% Return | | | | | | | | | | | | | | | | |
Class N | | $ | 1,000 | | | $ | 1,018.55 | | | | 1.27 | % | | $ | 6.37 | |
Class I | | | 1,000 | | | | 1,019.79 | | | | 1.02 | % | | | 5.12 | |
Barings International Fund | | | | | | | | | |
Actual Fund Return | | | | | | | | | | | | | | | | |
Class N | | $ | 1,000 | | | $ | 1,051.90 | | | | 1.40 | % | | $ | 7.14 | |
Class I | | | 1,000 | | | | 1,053.30 | | | | 1.15 | % | | | 5.87 | |
Hypothetical 5% Return | | | | | | | | | | | | | | | | |
Class N | | $ | 1,000 | | | $ | 1,017.90 | | | | 1.40 | % | | $ | 7.02 | |
Class I | | | 1,000 | | | | 1,019.14 | | | | 1.15 | % | | | 5.77 | |
Harrison Street Real Estate Fund | | | | | | | | | |
Actual Fund Return | | | | | | | | | | | | | | | | |
Class N | | $ | 1,000 | | | $ | 1,153.80 | | | | 1.37 | % | | $ | 7.34 | |
Class I | | | 1,000 | | | | 1,155.60 | | | | 1.12 | % | | | 6.00 | |
Hypothetical 5% Return | | | | | | | | | | | | | | | | |
Class N | | $ | 1,000 | | | $ | 1,018.05 | | | | 1.37 | % | | $ | 6.87 | |
Class I | | | 1,000 | | | | 1,019.29 | | | | 1.12 | % | | | 5.62 | |
Montag & Caldwell Balanced Fund | | | | | | | | | |
Actual Fund Return | | | | | | | | | | | | | | | | |
Class N | | $ | 1,000 | | | $ | 1,072.50 | | | | 1.25 | % | | $ | 6.44 | |
Class I | | | 1,000 | | | | 1,073.10 | | | | 1.10 | % | | | 5.67 | |
Hypothetical 5% Return | | | | | | | | | | | | | | | | |
Class N | | $ | 1,000 | | | $ | 1,018.65 | | | | 1.25 | % | | $ | 6.27 | |
Class I | | | 1,000 | | | | 1,019.39 | | | | 1.10 | % | | | 5.52 | |
| (1) | Annualized, based on the Fund’s most recent fiscal half-year expenses. |
| (2) | Expenses are equal to the Fund’s annualized expense ratio multiplied by the average account value over the period, multiplied by the number of days in the most recent fiscal half-year (182) or partial year, if applicable, for the actual return and multiplied by the most recent fiscal half-year for the hypothetical 5% return, then divided by 366. Expense ratios do not include interest expense, if applicable. |
| (3) | Tamro Diversified Equity Fund began issuing Class I Shares on March 1, 2012. |
| (4) | Silvercrest Small Cap Fund began issuing shares on December 23, 2011. |
| (5) | Excludes interest expense and dividends on short positions. If included, your annualized expenses ratio is 3.75% and your actual and hypothetical expenses paid during the period are $19.12 and $18.71, respectively. |
ADVISER
Aston Asset Management, LP
120 N. LaSalle Street, 25th Floor Chicago, IL 60602
SUBADVISERS
Baring International Investment Limited
155 Bishopsgate
London, EC2M 3XY UK
Cardinal Capital Management, L.L.C. One Greenwich Office Park
Greenwich, CT 06831
Cornerstone Investment Partners, LLC Phipps Tower
3438 Peachtree Road NE, Suite 900 Atlanta, GA 30326
DoubleLine Capital LP
333 South Grand Avenue, 18th Floor Los Angeles, CA 90036
Fairpointe Capital LLC
One North Franklin, Suite 3300 Chicago, IL 60606
Harrison Street Securities LLC
71 South Wacker Drive, Suite 3575 Chicago, IL 60606
Herndon Capital Management, LLC
100 Auburn Avenue, Suite 300
Atlanta, GA 30303
Lake Partners, Inc.
24 Field Point Road
Greenwich, CT 06830
Lee Munder Capital Group, LLC
200 Clarendon Street, 28th Floor Boston, MA 02116
SUBADVISERS – continued
M.D. Sass Investors Services, Inc.
1185 Avenue of the Americas, 18th Floor New York, NY 10036
Montag & Caldwell, LLC
3455 Peachtree Road NE, Suite 1200 Atlanta, GA 30326
Neptune Investment Management Limited
3 Shortiands
London, W6 8DA
River Road Asset Management, LLC Meidinger Tower, Suite 1600
462 South Fourth Street
Louisville, KY 40202
Silvercrest Asset Management Group, LLC
1330 Avenue of the Americas, 38th Floor New York, NY 10019
Smart Portfolios, LLC
17865 Ballinger Way NE
Lake Forest Park, WA 98155
TAMRO Capital Partners, LLC
1701 Duke Street, Suite 250
Alexandria, VA 22314
Taplin, Canida & Habacht LLC
1001 Brickell Bay Drive, Suite
2100 Miami, FL 33131
Todd-Veredus Asset Management LLC National City Tower 101 South Fifth Street, Suite 3100
Louisville, KY 40202
SHAREHOLDER SERVICES
Aston Funds
P.O. Box 9765
Providence, RI 02940
DISTRIBUTOR
Foreside Funds Distributors LLC
400 Berwyn Park
899 Cassatt Road
Berwyn, PA 19312
OFFICERS
Stuart D. Bilton, Chief Executive Officer
Kenneth C. Anderson, President
Gerald F. Dillenburg, Senior Vice President and Secretary, Chief Operating Officer and Chief Compliance Officer
Christine C. Carsman, Chief Legal Officer
Laura M. Curylo, Treasurer and Chief Financial Officer
Juli A. Braun, Assistant Treasurer
James A. Dimmick, Assistant Secretary
Marc J. Peirce, Assistant Secretary
Diana R. Podgorny, Assistant Secretary
CUSTODIAN
The Bank of New York Mellon
One Wall Street
New York, New York 10286
LEGAL COUNSEL
Vedder Price P.C.
222 N. LaSalle Street
Chicago, IL 60601
INDEPENDENT REGISTERED PUBLIC ACCOUNTING FIRM
Ernst & Young LLP
155 N. Wacker Drive
Chicago, IL 60606
THE STATEMENT OF ADDITIONAL INFORMATION INCLUDES ADDITIONAL INFORMATION ABOUT FUND TRUSTEES AND IS AVAILABLE UPON REQUEST WITHOUT CHARGE BY CALLING 800-992-8151.

P.O. Box 9765
Providence, RI 02940
ATSEM 12
| | |
| | |
| | |
| | |
| | PRSRT STD |
| | U.S. POSTAGE |
| P.O. Box 9765 | | PAID |
| Providence, RI 02940 | | ASTON FUNDS |
ATSEM 12
Item 2. Code of Ethics.
Not applicable.
Item 3. Audit Committee Financial Expert.
Not applicable.
Item 4. Principal Accountant Fees and Services.
Not applicable.
Item 5. Audit Committee of Listed registrants.
Not applicable.
Item 6. Investments.
| (a) | Schedule of Investments in securities of unaffiliated issuers as of the close of the reporting period is included as part of the report to shareholders filed under Item 1 of this form. |
Item 7. Disclosure of Proxy Voting Policies and Procedures for Closed-End Management Investment Companies.
Not applicable.
Item 8. Portfolio Managers of Closed-End Management Investment Companies.
Not applicable.
Item 9. Purchases of Equity Securities by Closed-End Management Investment Company and Affiliated Purchasers.
Not applicable.
Item 10. Submission of Matters to a Vote of Security Holders.
There have been no material changes to the procedures by which the shareholders may recommend nominees to the registrant’s board of directors, where those changes were implemented after the registrant last provided disclosure in response to the requirements of Item 407(c)(2)(iv) of Regulation S-K (17 CFR 229.407) (as required by Item 22(b)(15) of Schedule 14A (17 CFR 240.14a-101)), or this Item.
Item 11. Controls and Procedures.
| | (a) | The registrant’s principal executive and principal financial officers, or persons performing similar functions, have concluded that the registrant’s disclosure controls and procedures (as defined in Rule 30a-3(c) under the Investment Company Act of 1940, as amended (the “1940 Act”) (17 CFR 270.30a-3(c))) are effective, as of a date within 90 days of the filing date of the report that includes the disclosure required by this paragraph, based on their evaluation of these controls and procedures required by Rule 30a-3(b) under the 1940 Act (17 CFR 270.30a-3(b)) and Rules 13a-15(b) or 15d-15(b) under the Securities Exchange Act of 1934, as amended (17 CFR 240.13a-15(b) or 240.15d-15(b)). |
| | (b) | There were no changes in the registrant’s internal control over financial reporting (as defined in Rule 30a-3(d) under the 1940 Act (17 CFR 270.30a-3(d)) that occurred during the registrant’s second fiscal quarter of the period covered by this report that has materially affected, or is reasonably likely to materially affect, the registrant’s internal control over financial reporting. |
Item 12. Exhibits.
| | (a)(2) | Certifications pursuant to Rule 30a-2(a) under the 1940 Act and Section 302 of the Sarbanes-Oxley Act of 2002 are attached hereto. |
| | (b) | Certifications pursuant to Rule 30a-2(b) under the 1940 Act and Section 906 of the Sarbanes- Oxley Act of 2002 are attached hereto. |
SIGNATURES
Pursuant to the requirements of the Securities Exchange Act of 1934 and the Investment Company Act of 1940, the registrant has duly caused this report to be signed on its behalf by the undersigned, thereunto duly authorized.
| | |
| |
| By (Signature and Title)* | | /s/ Stuart D. Bilton |
| | Stuart D. Bilton, Chief Executive Officer (principal executive officer) |
Pursuant to the requirements of the Securities Exchange Act of 1934 and the Investment Company Act of 1940, this report has been signed below by the following persons on behalf of the registrant and in the capacities and on the dates indicated.
| | |
| |
| By (Signature and Title)* | | /s/ Stuart D. Bilton |
| | Stuart D. Bilton, Chief Executive Officer (principal executive officer) |
| | |
| |
| By (Signature and Title)* | | /s/ Laura M. Curylo |
| | Laura M. Curylo, Treasurer and Chief Financial Officer (principal financial officer) |
| * | Print the name and title of each signing officer under his or her signature. |