UNITED STATES
SECURITIES AND EXCHANGE COMMISSION
Washington, D.C. 20549
FORM N-CSR
CERTIFIED SHAREHOLDER REPORT OF REGISTERED MANAGEMENT
INVESTMENT COMPANIES
Investment Company Act file number 811-08004
Aston Funds
(Exact name of registrant as specified in charter)
120 North LaSalle Street, 25th Floor
Chicago, IL 60602
(Address of principal executive offices) (Zip code)
Kenneth C. Anderson, President
Aston Funds
120 North LaSalle Street, 25th Floor
Chicago, IL 60602
(Name and address of agent for service)
Registrant’s telephone number, including area code: (312) 268-1400
Date of fiscal year end: October 31
Date of reporting period: April 30, 2013
Form N-CSR is to be used by management investment companies to file reports with the Commission not later than 10 days after the transmission to stockholders of any report that is required to be transmitted to stockholders under Rule 30e-1 under the Investment Company Act of 1940 (17 CFR 270.30e-1). The Commission may use the information provided on Form N-CSR in its regulatory, disclosure review, inspection, and policymaking roles.
A registrant is required to disclose the information specified by Form N-CSR, and the Commission will make this information public. A registrant is not required to respond to the collection of information contained in Form N-CSR unless the Form displays a currently valid Office of Management and Budget (“OMB”) control number. Please direct comments concerning the accuracy of the information collection burden estimate and any suggestions for reducing the burden to Secretary, Securities and Exchange Commission, 100 F Street, NE, Washington, DC 20549. The OMB has reviewed this collection of information under the clearance requirements of 44 U.S.C. § 3507.
Item 1. Reports to Stockholders.
The Report to Shareholders is attached herewith.

Semi Annual Report 2013
April 30, 2013
Class N, I & R Shares
Equity
Fixed Income
Alternative
International
Sector
Balanced
This Privacy Statement is not part of the Semi Annual Report
PRIVACY STATEMENT
At Aston Funds, we appreciate the privacy concerns and expectations of our customers and we have established the following policies to maintain the privacy of information you share with us.
INFORMATION WE COLLECT
We collect and retain nonpublic personal information about you that may include:
| | • | | Information we receive on your account applications or other forms such as your name, address, financial information and/or social security number; |
| | • | | Information we receive about your mutual fund transactions, such as purchases, sales, exchanges and account balances; and |
| | • | | Information we collect through the use of Internet “cookies” when you access our website. Cookies are software files we use to track which of our sites you visit. |
INFORMATION WE MAY SHARE
We do not sell any of your nonpublic personal information to third parties. We may share the information we collect with affiliates or with non-affiliated third parties only when those parties are acting on our behalf in servicing your account, or as required by law. These third parties may include:
| | • | | Administrative service providers who, for example, process transactions for your account, print checks or prepare account statements; |
| | • | | Companies that provide services for us to help market our products to you; and |
| | • | | Governmental or other legal agencies, as required by law |
When information is shared with third parties, they are legally obligated to maintain the confidentiality of the information and to limit their use of it to servicing your account, except as permitted or required by law.
CONFIDENTIALITY AND SECURITY
We restrict access to your nonpublic personal information to authorized employees who need to access such information in order to provide services or products to you. We maintain physical, electronic and procedural safeguards to protect your nonpublic personal information.
As previously mentioned, we may collect information through the use of Internet “cookies” on our Web site. In addition, in order to provide you with access to your account via the web, it is necessary for us to collect certain nonpublic personal information such as your name, social security number and account information. Special measures such as data encryption and authentication apply to all nonpublic personal information and communications on our Web site.
APPLICABILITY
Our privacy policies apply only to those individual investors who have a direct customer relationship with us. If you are an individual shareholder of record of any of the Funds, the Funds consider you to be their customer. Shareholders purchasing or owning shares of any of the Funds through their bank, broker, or other financial institution should also consult that financial institution’s privacy policies.
Aston Funds values your business. We understand the importance of maintaining the integrity of your personal information and are committed to keeping your trust. Please contact us at 800-992-8151 if you have any questions concerning our policy, or visit us at www.astonfunds.com for additional copies of this policy.
This page intentionally left blank.
Aston Funds
Large Cap
ASTON/Montag & Caldwell Growth Fund
ASTON/TAMRO Diversified Equity Fund
ASTON/Herndon Large Cap Value Fund
ASTON/Cornerstone Large Cap Value Fund
Equity Income
ASTON/River Road Dividend All Cap Value Fund
ASTON/River Road Dividend All Cap Value Fund II
Mid Cap
ASTON/Fairpointe Mid Cap Fund
ASTON/Montag & Caldwell Mid Cap Growth Fund
Table of Contents
Small Cap
ASTON/LMCG Small Cap Growth Fund
(formerly, ASTON Small Cap Growth Fund)
ASTON/Silvercrest Small Cap Fund
ASTON/TAMRO Small Cap Fund
ASTON/River Road Select Value Fund
ASTON/River Road Small Cap Value Fund
ASTON/River Road Independent Value Fund
Fixed Income
ASTON/DoubleLine Core Plus Fixed Income Fund ASTON/TCH Fixed Income Fund
Alternative
ASTON/Lake Partners LASSO Alternatives Fund
ASTON/Anchor Capital Enhanced Equity Fund
ASTON/River Road Long-Short Fund
International
ASTON/Barings International Fund
ASTON/LMCG Emerging Markets Fund
Sector
ASTON/Harrison Street Real Estate Fund
Balanced
ASTON/Montag & Caldwell Balanced Fund
This report is submitted for general information to the shareholders of the funds. It is not authorized for distribution to prospective investors in the funds unless preceded or accompanied by an effective prospectus which includes details regarding the funds’ objectives, policies, expenses and other information.
Aston Funds are distributed by Foreside Funds Distributors LLC, 400 Berwyn Park, 899 Cassatt Road, Berwyn, PA 19312
Shareholder Services 800-992-8151 • www.astonfunds.com
NOT FDIC INSURED • NO BANK GUARANTEE • MAY LOSE VALUE
| | |
| |
| | As of April 30, 2013 |
| |
| Performance Summary (unaudited) | | |
| | | | | | | | | | | | | | | | | | | | | | | | | | | | | | | | | | | | |
| | | | | | | | | Average Annual Total Returns | | | | | | | | | | | | | |
| | | Class | | | Six Month Total Return (a) | | | One Year | | | Five Year | | | Ten Year | | | Since Inception | | | Total Expense Ratio (b) | | | Net Expense Ratio (b) | | | Inception Date | |
| Equity | | | | | | | | | | | | | | | | | | | | | | | | | | | | | | | | | | | | |
ASTON/Montag & Caldwell Growth Fund | | | N | | | | 14.36 | % | | | 14.50 | % | | | 5.39 | % | | | 7.16 | % | | | 9.01 | % | | | 1.06 | % | | | 1.06 | % | | | 11/02/94 | |
| | | I | | | | 14.52 | | | | 14.75 | | | | 5.66 | | | | 7.44 | | | | 7.35 | | | | 0.81 | | | | 0.81 | | | | 06/28/96 | |
| | | R | | | | 14.22 | | | | 14.18 | | | | 5.14 | | | | 6.91 | | | | 7.08 | | | | 1.31 | | | | 1.31 | | | | 12/31/02 | |
| | | | | | | | | |
ASTON/TAMRO Diversified Equity Fund (c) | | | N | | | | 12.19 | | | | 12.86 | | | | 6.08 | | | | 8.29 | | | | 5.75 | | | | 1.68 | | | | 1.20 | | | | 11/30/00 | |
| | | I | | | | 12.38 | | | | 13.22 | | | | NA | | | | NA | | | | 12.47 | | | | 1.43 | | | | 0.95 | | | | 03/02/12 | |
| | | | | | | | | |
ASTON/Herndon Large Cap Value Fund (c) | | | N | | | | 12.66 | | | | 11.33 | | | | NA | | | | NA | | | | 11.77 | | | | 1.42 | | | | 1.31 | | | | 03/31/10 | |
| | | I | | | | 12.83 | | | | 11.60 | | | | NA | | | | NA | | | | 10.14 | | | | 1.17 | | | | 1.06 | | | | 03/02/11 | |
| | | | | | | | | |
ASTON/Cornerstone Large Cap Value Fund (c) | | | N | | | | 14.01 | | | | 15.37 | | | | 4.13 | | | | 8.57 | | | | 7.65 | | | | 1.59 | | | | 1.31 | | | | 01/04/93 | |
| | | I | | | | 14.09 | | | | 15.66 | | | | 4.41 | | | | NA | | | | 5.88 | | | | 1.34 | | | | 1.06 | | | | 09/20/05 | |
| | | | | | | | | |
ASTON/River Road Dividend All Cap Value Fund | | | N | | | | 16.80 | | | | 21.19 | | | | 6.72 | | | | NA | | | | 7.87 | | | | 1.13 | | | | 1.13 | | | | 06/28/05 | |
| | | I | | | | 17.02 | | | | 21.58 | | | | 7.00 | | | | NA | | | | 4.79 | | | | 0.88 | | | | 0.88 | | | | 06/28/07 | |
| | | | | | | | | |
ASTON/River Road Dividend All Cap Value Fund II (c) | | | N | | | | 15.92 | | | | NA | | | | NA | | | | NA | | | | NA | | | | 5.00 | | | | 1.31 | | | | 06/27/12 | |
| | | I | | | | 16.06 | | | | NA | | | | NA | | | | NA | | | | NA | | | | 4.75 | | | | 1.06 | | | | 06/27/12 | |
| | | | | | | | | |
ASTON/Fairpointe Mid Cap Fund | | | N | | | | 20.79 | | | | 23.27 | | | | 8.34 | | | | 12.58 | | | | 12.51 | | | | 1.11 | | | | 1.11 | | | | 09/19/94 | |
| | | I | | | | 20.96 | | | | 23.60 | | | | 8.62 | | | | NA | | | | 9.39 | | | | 0.86 | | | | 0.86 | | | | 07/06/04 | |
| | | | | | | | | |
ASTON/Montag & Caldwell Mid Cap Growth Fund (c) | | | N | | | | 10.37 | | | | 5.87 | | | | 4.10 | | | | NA | | | | 2.51 | | | | 2.51 | | | | 1.26 | | | | 11/02/07 | |
| | | | | | | | | |
ASTON/LMCG Small Cap Growth Fund (c) | | | N | | | | 18.19 | | | | 21.38 | | | | NA | | | | NA | | | | 12.80 | | | | 2.87 | | | | 1.36 | | | | 11/03/10 | |
| | | I | | | | 18.40 | | | | 21.69 | | | | NA | | | | NA | | | | 4.81 | | | | 2.62 | | | | 1.11 | | | | 06/01/11 | |
| | | | | | | | | |
ASTON/Silvercrest Small Cap Fund (c) | | | N | | | | 15.30 | | | | 14.15 | | | | NA | | | | NA | | | | 18.40 | | | | 5.11 | | | | 1.41 | | | | 12/27/11 | |
| | | I | | | | 15.44 | | | | 14.50 | | | | NA | | | | NA | | | | 18.74 | | | | 4.86 | | | | 1.16 | | | | 12/27/11 | |
| | | | | | | | | |
ASTON/TAMRO Small Cap Fund | | | N | | | | 14.34 | | | | 14.34 | | | | 9.50 | | | | 11.86 | | | | 10.94 | | | | 1.28 | | | | 1.28 | | | | 11/30/00 | |
| | | I | | | | 14.53 | | | | 14.64 | | | | 9.78 | | | | NA | | | | 8.53 | | | | 1.03 | | | | 1.03 | | | | 01/04/05 | |
| | | | | | | | | |
ASTON/River Road Select Value Fund | | | N | | | | 17.88 | | | | 21.01 | | | | 6.63 | | | | NA | | | | 4.22 | | | | 1.44 | | | | 1.44 | | | | 03/29/07 | |
| | | I | | | | 18.02 | | | | 21.27 | | | | 6.91 | | | | NA | | | | 3.79 | | | | 1.19 | | | | 1.19 | | | | 06/28/07 | |
| | | | | | | | | |
ASTON/River Road Small Cap Value Fund | | | N | | | | 17.12 | | | | 19.40 | | | | 5.37 | | | | NA | | | | 6.88 | | | | 1.46 | | | | 1.46 | | | | 06/28/05 | |
| | | I | | | | 17.29 | | | | 19.76 | | | | 5.64 | | | | NA | | | | 3.16 | | | | 1.21 | | | | 1.21 | | | | 12/13/06 | |
| | | | | | | | | |
ASTON/River Road Independent Value Fund (c) | | | N | | | | 2.10 | | | | 7.17 | | | | NA | | | | NA | | | | 7.31 | | | | 1.46 | | | | 1.44 | | | | 12/31/10 | |
| | | I | | | | 2.18 | | | | 7.34 | | | | NA | | | | NA | | | | 4.31 | | | | 1.21 | | | | 1.19 | | | | 06/01/11 | |
| | | | | | | | | |
| Fixed Income | | | | | | | | | | | | | | | | | | | | | | | | | | | | | | | | | | | | |
ASTON/DoubleLine Core Plus Fixed Income Fund (c) | | | N | | | | 2.12 | | | | 6.87 | | | | NA | | | | NA | | | | 9.99 | | | | 1.36 | | | | 0.95 | | | | 07/18/11 | |
| | | I | | | | 2.24 | | | | 7.13 | | | | NA | | | | NA | | | | 10.25 | | | | 1.11 | | | | 0.70 | | | | 07/18/11 | |
| | | | | | | | | |
ASTON/TCH Fixed Income Fund (c) | | | N | | | | 2.50 | | | | 8.43 | | | | 7.81 | | | | 5.91 | | | | 6.18 | | | | 1.11 | | | | 0.95 | | | | 12/13/93 | |
| | | I | | | | 2.58 | | | | 8.49 | | | | 7.99 | | | | 6.13 | | | | 6.63 | | | | 0.86 | | | | 0.70 | | | | 07/31/00 | |
| | |
| |
| | As of April 30, 2013 |
| |
| Performance Summary (unaudited) – continued | | |
| | | | | | | | | | | | | | | | | | | | | | | | | | | | | | | | | | | | |
| | | | | | | | | Average Annual Total Returns | | | | | | | | | | | | | |
| | | Class | | | Six Month Total Return (a) | | | One Year | | | Five Year | | | Ten Year | | | Since Inception | | | Total Expense Ratio (b) | | | Net Expense Ratio (b) | | | Inception Date | |
| Alternative | | | | | | | | | | | | | | | | | | | | | | | | | | | | | | | | | | | | |
ASTON/Lake Partners LASSO Alternatives Fund | | | N | | | | 7.09 | % | | | 7.70 | % | | | NA | | | | NA | | | | 5.57 | % | | | 3.31 | % | | | 3.31 | % | | | 03/03/10 | |
| | | I | | | | 7.26 | | | | 7.96 | | | | NA | | | | NA | | | | 8.40 | | | | 3.06 | | | | 3.06 | | | | 04/01/09 | |
| | | | | | | | | |
ASTON/Anchor Capital Enhanced Equity Fund | | | N | | | | 7.18 | | | | 5.65 | | | | 3.48 | % | | | NA | | | | 4.42 | | | | 1.22 | | | | 1.22 | | | | 01/15/08 | |
| | | I | | | | 7.32 | | | | 5.91 | | | | NA | | | | NA | | | | 7.58 | | | | 0.97 | | | | 0.97 | | | | 03/03/10 | |
| | | | | | | | | |
ASTON/River Road Long-Short Fund (c) | | | N | | | | 9.78 | | | | 13.05 | | | | NA | | | | NA | | | | 8.56 | | | | 5.08 | | | | 3.16 | | | | 05/04/11 | |
| | | I | | | | NA | | | | NA | | | | NA | | | | NA | | | | 1.72 | (d) | | | 4.83 | | | | 2.91 | | | | 03/04/13 | |
| | | | | | | | | |
| International | | | | | | | | | | | | | | | | | | | | | | | | | | | | | | | | | | | | |
ASTON/Barings International Fund (c) | | | N | | | | 8.27 | | | | 7.34 | | | | NA | | | | NA | | | | 6.17 | | | | 1.60 | | | | 1.40 | | | | 03/03/10 | |
| | | I | | | | 8.21 | | | | 7.59 | | | | -2.60 | | | | NA | | | | -4.15 | | | | 1.35 | | | | 1.15 | | | | 11/02/07 | |
| | | | | | | | | |
ASTON/LMCG Emerging Markets Fund (c) | | | N | | | | NA | | | | NA | | | | NA | | | | NA | | | | -0.20 | (d) | | | 5.99 | | | | 1.72 | | | | 03/28/13 | |
| | | I | | | | NA | | | | NA | | | | NA | | | | NA | | | | -0.20 | (d) | | | 5.74 | | | | 1.47 | | | | 03/28/13 | |
| | | | | | | | | |
| Sector | | | | | | | | | | | | | | | | | | | | | | | | | | | | | | | | | | | | |
ASTON/Harrison Street Real Estate Fund (c) | | | N | | | | 17.82 | | | | 20.35 | | | | 6.85 | | | | 12.11 | % | | | 9.52 | | | | 2.36 | | | | 1.37 | | | | 12/30/97 | |
| | | I | | | | 17.96 | | | | 20.62 | | | | 7.11 | | | | NA | | | | 7.08 | | | | 2.11 | | | | 1.12 | | | | 09/20/05 | |
| | | | | | | | | |
| Balanced | | | | | | | | | | | | | | | | | | | | | | | | | | | | | | | | | | | | |
ASTON/Montag & Caldwell Balanced Fund (c) | | | N | | | | 8.71 | | | | 9.51 | | | | 5.24 | | | | 5.89 | | | | 7.73 | | | | 1.56 | | | | 1.36 | | | | 11/02/94 | |
| | | I | | | | 8.77 | | | | 9.63 | | | | 5.39 | | | | 6.09 | | | | 3.96 | | | | 1.31 | | | | 1.11 | | | | 12/31/98 | |
The performance data quoted represents past performance. Past performance does not guarantee future results. Investment return and principal value will fluctuate so that an investor’s shares, upon redemption may be worth more or less than their original cost. Current performance may be lower or higher than the performance data quoted. For performance data current to the most recent month-end, please visit our website at www.astonfunds.com.
Performance figures do not reflect the deduction of taxes that a shareholder would pay on Fund distributions or redemptions of Fund shares.
| (b) | | The expense ratios presented above may vary from the expense ratios presented in other sections of this report that are based on expenses incurred during the period covered by this report. |
| (c) | | Certain expenses were subsidized. If these subsidies were not in effect, the returns would have been lower. The Adviser is contractually obligated to waive management fees and/or reimburse expenses through February 28, 2014 and through March 31, 2014 for LMCG Emerging Markets Fund. |
| (d) | | Returns are cumulative since inception and are not annualized. |
The stocks of small- and mid-cap companies may be subject to a higher degree of market risk because they tend to be more volatile and less liquid. Bond and balanced funds have the same interest rate, high yield, and credit risks associated with the underlying bonds in the portfolio, all of which could reduce a fund’s value. Exchange-traded funds (ETFs) are securities of other investment companies. An ETF seeks to track the performance of an index by holding all or a sampling of the securities of that index. ETFs invest in many different areas of the market, each of which may involve its own element of risk. By selling covered call options, a fund limits its opportunity to profit from an increase in the price of the underlying stock above the exercise price, but continues to bear the risk of a decline in the stock. Sector funds may be subject to a higher degree of market risk because of concentration in a specific industry sector. International investing may include the risk of social and political instability, market illiquidity and currency volatility. Emerging markets securities tend to be more volatile and less liquid than securities traded in developed countries. Hedged mutual funds may use derivative instruments, short selling, leveraging and investing in commodities, commodity-linked instruments and non-U.S. companies that involve significant risks. Real estate funds are non-diversified and may be more susceptible to risk than funds that invest more broadly and may be subject to a higher degree of market risk because of changes in property values of the underlying property and defaults by borrowers.
| | |
| |
| ASTON/Montag & Caldwell Growth Fund | | April 30, 2013 |
| |
| Schedule of Investments (unaudited) | | |
| | | | | | | | |
Shares | | | | | Market
Value | |
|
| | COMMON STOCKS – 97.21% | |
| | |
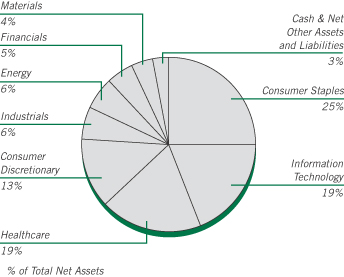
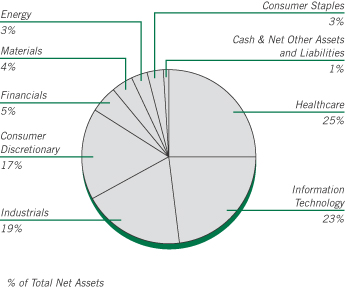
| | | | Consumer Discretionary – 12.98% | | | | |
| | 1,672,230 | | | Bed Bath & Beyond * | | $ | 115,049,424 | |
| | 2,784,442 | | | Johnson Controls | | | 97,483,314 | |
| | 724,000 | | | McDonald’s | | | 73,949,360 | |
| | 2,003,200 | | | NIKE, Class B | | | 127,403,520 | |
| | 1,881,000 | | | Starbucks | | | 114,440,040 | |
| | 2,264,900 | | | TJX | | | 110,459,173 | |
| | | | | | | | |
| | | | | | | 638,784,831 | |
| | | | | | | | |
| |
| | | | Consumer Staples – 25.29% | |
| | 5,400,000 | | | Coca-Cola | | | 228,582,000 | |
| | 1,209,500 | | | Colgate-Palmolive | | | 144,426,395 | |
| | 1,102,000 | | | Costco Wholesale | | | 119,489,860 | |
| | 537,400 | | | Estee Lauder, Class A | | | 37,268,690 | |
| | 5,709,000 | | | Mondelez International, Class A | | | 179,548,050 | |
| | 1,497,400 | | | PepsiCo | | | 123,490,578 | |
| | 1,831,200 | | | Philip Morris International | | | 175,044,408 | |
| | 1,700,000 | | | Procter & Gamble | | | 130,509,000 | |
| | 2,508,400 | | | Unilever (Netherlands) | | | 106,556,832 | |
| | | | | | | | |
| | | | | | | 1,244,915,813 | |
| | | | | | | | |
| |
| | | | Energy – 5.54% | |
| | 2,106,000 | | | Cameron International * | | | 129,624,300 | |
| | 1,600,300 | | | Occidental Petroleum | | | 142,842,778 | |
| | | | | | | | |
| | | | | | | 272,467,078 | |
| | | | | | | | |
| |
| | | | Financials – 5.51% | |
| | 1,442,600 | | | American Express | | | 98,688,266 | |
| | 4,540,000 | | | Wells Fargo | | | 172,429,200 | |
| | | | | | | | |
| | | | | | | 271,117,466 | |
| | | | | | | | |
| |
| | | | Healthcare – 18.87% | |
| | 4,850,000 | | | Abbott Laboratories | | | 179,062,000 | |
| | 1,365,500 | | | Allergan | | | 155,052,525 | |
| | | | | | | | |
Shares | | | | | Market
Value | |
| | |
| | | | Healthcare (continued) | | | | |
| | 2,300,000 | | | AmerisourceBergen | | $ | 124,476,000 | |
| | 787,380 | | | Biogen Idec * | | | 172,381,104 | |
| | 3,400,000 | | | Sanofi, ADR (France) | | | 181,390,000 | |
| | 1,775,000 | | | Stryker | | | 116,404,500 | |
| | | | | | | | |
| | | | | | | 928,766,129 | |
| | | | | | | | |
| |
| | | | Industrials – 5.79% | |
| | 5,638,600 | | | General Electric | | | 125,684,394 | |
| | 1,853,700 | | | United Parcel Service, Class B | | | 159,121,608 | |
| | | | | | | | |
| | | | | | | 284,806,002 | |
| | | | | | | | |
| |
| | | | Information Technology – 19.41% | |
| | 1,522,200 | | | Accenture, Class A (Ireland) | | | 123,967,968 | |
| | 2,215,200 | | | eBay * | | | 116,054,328 | |
| | 3,215,700 | | | EMC * | | | 72,128,151 | |
| | 198,000 | | | Google, Class A * | | | 163,264,860 | |
| | 5,049,000 | | | Juniper Networks * | | | 83,560,950 | |
| | 2,888,500 | | | Oracle | | | 94,685,030 | |
| | 2,631,200 | | | Qualcomm | | | 162,134,544 | |
| | 830,000 | | | Visa, Class A | | | 139,821,800 | |
| | | | | | | | |
| | | | | | | 955,617,631 | |
| | | | | | | | |
| |
| | | | Materials – 3.82% | |
| | 1,760,000 | | | Monsanto | | | 188,003,200 | |
| | | | | | | | |
| | |
| | | | Total Common Stocks
(Cost $3,854,701,176) | | | 4,784,478,150 | |
| | | | | | | | |
|
| | INVESTMENT COMPANY – 3.22% | |
| | |
| | 158,634,750 | | | BlackRock Liquidity Funds TempCash Portfolio | | | 158,634,750 | |
| | | | | | | | |
| | |
| | | | Total Investment Company
(Cost $158,634,750) | | | 158,634,750 | |
| | | | | | | | |
| Total Investments – 100.43%
(Cost $4,013,335,926)** | | | 4,943,112,900 | |
| | | | | | | | |
| Net Other Assets and Liabilities – (0.43)% | | | (21,080,201 | ) |
| | | | | | | | |
| Net Assets – 100.00% | | $ | 4,922,032,699 | |
| | | | | | | | |
| * | | Non-income producing security. |
| ** | | At April 30, 2013, cost is identical for book and Federal income tax purposes. |
| | | | |
Gross unrealized appreciation | | $ | 945,863,949 | |
Gross unrealized depreciation | | | (16,086,975 | ) |
| | | | |
Net unrealized appreciation | | $ | 929,776,974 | |
| | | | |
| ADR | | American Depositary Receipt |
See accompanying Notes to Financial Statements.
| | |
| |
| ASTON/TAMRO Diversified Equity Fund | | April 30, 2013 |
| |
| Schedule of Investments (unaudited) | | |
| | | | | | | | |
Shares | | | | | Market
Value | |
|
| | COMMON STOCKS – 98.11% | |
| | |
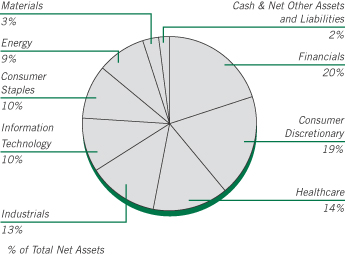
| | | | Consumer Discretionary – 18.69% | | | | |
| | 2,510 | | | Amazon.com * | | $ | 637,063 | |
| | 7,702 | | | Bed Bath & Beyond * | | | 529,898 | |
| | 12,618 | | | CarMax * | | | 580,933 | |
| | 8,953 | | | Coach | | | 526,974 | |
| | 10,239 | | | GNC Holdings, Class A | | | 464,134 | |
| | 7,377 | | | Home Depot | | | 541,103 | |
| | 12,016 | | | Macy’s | | | 535,914 | |
| | 6,820 | | | Tempur-Pedic International * | | | 330,770 | |
| | 18,240 | | | Toll Brothers * | | | 625,814 | |
| | | | | | | | |
| | | | | | | 4,772,603 | |
| | | | | | | | |
| |
| | | | Consumer Staples – 10.25% | |
| | 9,974 | | | Kraft Foods Group | | | 513,561 | |
| | 5,309 | | | McCormick & Co (Non-Voting Shares) | | | 381,929 | |
| | 12,618 | | | Mondelez International, Class A | | | 396,836 | |
| | 14,326 | | | Safeway | | | 322,622 | |
| | 9,088 | | | United Natural Foods * | | | 453,855 | |
| | 11,071 | | | Walgreen | | | 548,125 | |
| | | | | | | | |
| | | | | | | 2,616,928 | |
| | | | | | | | |
| |
| | | | Energy – 8.96% | |
| | 4,582 | | | Exxon Mobil | | | 407,752 | |
| | 9,904 | | | Kinder Morgan | | | 387,246 | |
| | 3,024 | | | Occidental Petroleum | | | 269,922 | |
| | 6,943 | | | Phillips 66 | | | 423,176 | |
| | 7,376 | | | Range Resources | | | 542,284 | |
| | 12,014 | | | Ultra Petroleum (Canada) * | | | 257,100 | |
| | | | | | | | |
| | | | | | | 2,287,480 | |
| | | | | | | | |
| |
| | | | Financials – 20.03% | |
| | 7,962 | | | American Express | | | 544,680 | |
| | 17,777 | | | American International Group * | | | 736,323 | |
| | 5,543 | | | American Tower, REIT | | | 465,557 | |
| | 8,297 | | | Bank of the Ozarks | | | 339,596 | |
| | 5,285 | | | Berkshire Hathaway, Class B * | | | 561,901 | |
| | | | | | | | |
Shares | | | | | Market
Value | |
| | |
| | | | Financials (continued) | | | | |
| | 2,829 | | | Franklin Resources | | $ | 437,533 | |
| | 9,400 | | | JPMorgan Chase | | | 460,694 | |
| | 2,225 | | | Portfolio Recovery Associates * | | | 273,119 | |
| | 12,225 | | | Raymond James Financial | | | 506,360 | |
| | 15,194 | | | Redwood Trust, REIT | | | 346,727 | |
| | 6,090 | | | T. Rowe Price Group | | | 441,525 | |
| | | | | | | | |
| | | | | | | 5,114,015 | |
| | | | | | | | |
| |
| | | | Healthcare – 13.43% | |
| | 9,614 | | | Advisory Board * | | | 472,528 | |
| | 4,221 | | | Allergan | | | 479,295 | |
| | 5,150 | | | Athenahealth * | | | 495,739 | |
| | 4,056 | | | DaVita * | | | 481,244 | |
| | 8,384 | | | Express Scripts * | | | 497,758 | |
| | 13,762 | | | HMS Holdings * | | | 346,940 | |
| | 7,674 | | | Johnson & Johnson | | | 654,055 | |
| | | | | | | | |
| | | | | | | 3,427,559 | |
| | | | | | | | |
| |
| | | | Industrials – 13.12% | |
| | 5,837 | | | Boeing | | | 533,560 | |
| | 7,122 | | | C.H. Robinson Worldwide | | | 422,976 | |
| | 8,689 | | | Chicago Bridge & Iron (Netherlands) | | | 467,381 | |
| | 9,444 | | | Cintas | | | 423,752 | |
| | 12,527 | | | Colfax * | | | 584,635 | |
| | 8,395 | | | Danaher | | | 511,591 | |
| | 23,962 | | | US Airways Group * | | | 404,958 | |
| | | | | | | | |
| | | | | | | 3,348,853 | |
| | | | | | | | |
| |
| | | | Information Technology – 10.26% | |
| | 2,234 | | | Apple | | | 989,103 | |
| | 364 | | | Google, Class A * | | | 300,143 | |
| | 10,157 | | | Microchip Technology | | | 369,918 | |
| | 8,263 | | | QUALCOMM | | | 509,166 | |
| | 6,507 | | | Seagate Technology (Ireland) | | | 238,807 | |
| | 8,556 | | | Yahoo! * | | | 211,590 | |
| | | | | | | | |
| | | | | | | 2,618,727 | |
| | | | | | | | |
| |
| | | | Materials – 3.37% | |
| | 1,225 | | | CF Industries Holdings | | | 228,475 | |
| | 4,697 | | | Monsanto | | | 501,734 | |
| | 2,359 | | | Royal Gold | | | 131,113 | |
| | | | | | | | |
| | | | | | | 861,322 | |
| | | | | | | | |
| | |
| | | | Total Common Stocks
(Cost $18,158,482 | | | 25,047,487 | |
| | | | | | | | |
|
| | INVESTMENT COMPANY – 3.26% | |
| | |
| | 833,371 | | | BlackRock Liquidity Funds TempCash Portfolio | | | 833,371 | |
| | | | | | | | |
| | |
| | | | Total Investment Company
(Cost $833,371) | | | 833,371 | |
| | | | | | | | |
| Total Investments – 101.37%
(Cost $18,991,853)** | | | 25,880,858 | |
| | | | | | | | |
| Net Other Assets and Liabilities – (1.37)% | | | (349,524 | ) |
| | | | | | | | |
| Net Assets – 100.00% | | $ | 25,531,334 | |
| | | | | | | | |
See accompanying Notes to Financial Statements.
| | |
| |
| ASTON/TAMRO Diversified Equity Fund | | April 30, 2013 |
| |
| Schedule of Investments (unaudited) – continued | | |
| * | | Non-income producing security. |
| ** | | At April 30, 2013, cost is identical for book and Federal income tax purposes. |
| | | | |
Gross unrealized appreciation | | $ | 6,961,979 | |
Gross unrealized depreciation | | | (72,974 | ) |
| | | | |
Net unrealized appreciation | | $ | 6,889,005 | |
| | | | |
| REIT | | Real Estate Investment Trust |
See accompanying Notes to Financial Statements.
| | |
| |
| ASTON/Herndon Large Cap Value Fund | | April 30, 2013 |
| |
| Schedule of Investments (unaudited) | | |
| | | | | | | | |
Shares | | | | | Market
Value | |
|
| | COMMON STOCKS – 96.31% | |
| | |
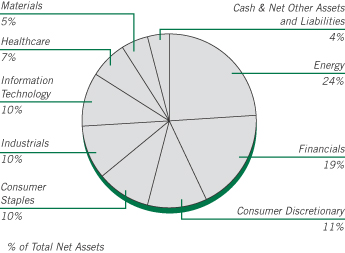
| | | | Consumer Discretionary – 10.87% | | | | |
| | 34,803 | | | Coach | | $ | 2,048,505 | |
| | 16,971 | | | Nordstrom | | | 960,389 | |
| | 37,427 | | | Ross Stores | | | 2,472,802 | |
| | 54,087 | | | TJX | | | 2,637,823 | |
| | 27,500 | | | Yum! Brands | | | 1,873,300 | |
| | | | | | | | |
| | | | | | | 9,992,819 | |
| | | | | | | | |
| | |
| | | | Consumer Staples – 9.95% | | | | |
| | 64,965 | | | Altria Group | | | 2,371,872 | |
| | 43,287 | | | Campbell Soup | | | 2,008,950 | |
| | 11,943 | | | Colgate-Palmolive | | | 1,426,114 | |
| | 11,980 | | | Hershey | | | 1,068,137 | |
| | 23,849 | | | Philip Morris International | | | 2,279,726 | |
| | | | | | | | |
| | | | | | | 9,154,799 | |
| | | | | | | | |
| | |
| | | | Energy – 24.56% | | | | |
| | 24,229 | | | Apache | | | 1,790,038 | |
| | 14,834 | | | Chevron | | | 1,809,896 | |
| | 29,059 | | | ConocoPhillips | | | 1,756,616 | |
| | 23,392 | | | Exxon Mobil | | | 2,081,654 | |
| | 47,887 | | | HollyFrontier | | | 2,368,012 | |
| | 35,145 | | | Marathon Petroleum | | | 2,753,962 | |
| | 56,293 | | | Newfield Exploration * | | | 1,226,624 | |
| | 98,246 | | | Patterson-UTI Energy | | | 2,072,008 | |
| | 142,824 | | | RPC | | | 1,890,990 | |
| | 69,129 | | | Superior Energy Services * | | | 1,907,269 | |
| | 136,852 | | | Ultra Petroleum * | | | 2,928,633 | |
| | | | | | | | |
| | | | | | | 22,585,702 | |
| | | | | | | | |
| | |
| | | | Financials – 18.45% | | | | |
| | 47,925 | | | Aflac | | | 2,609,037 | |
| | 62,264 | | | American Capital Agency, REIT | | | 2,074,014 | |
| | 73,388 | | | Apartment Investment & Management, Class A, REIT | | | 2,283,101 | |
| | | | | | | | |
Shares | | | | | Market
Value | |
| | |
| | | | Financials (continued) | | | | |
| | 58,461 | | | CBOE Holdings | | $ | 2,194,041 | |
| | 48,648 | | | Discover Financial Services | | | 2,127,863 | |
| | 52,945 | | | Eaton Vance | | | 2,111,447 | |
| | 29,398 | | | McGraw-Hill Financial | | | 1,590,726 | |
| | 46,062 | | | Waddell & Reed Financial, Class A | | | 1,974,678 | |
| | | | | | | | |
| | | | | | | 16,964,907 | |
| | | | | | | | |
| | |
| | | | Healthcare – 7.50% | | | | |
| | 12,801 | | | Baxter International | | | 894,406 | |
| | 58,015 | | | Endo Health Solutions * | | | 2,125,670 | |
| | 6,919 | | | Gilead Sciences * | | | 350,378 | |
| | 44,722 | | | Health Management Associates, Class A * | | | 513,856 | |
| | 31,237 | | | Mylan * | | | 909,309 | |
| | 7,679 | | | Salix Pharmaceuticals Ltd * | | | 401,535 | |
| | 20,657 | | | St. Jude Medical | | | 851,481 | |
| | 12,669 | | | United Therapeutics * | | | 846,036 | |
| | | | | | | | |
| | | | | | | 6,892,671 | |
| | | | | | | | |
| | |
| | | | Industrials – 9.84% | | | | |
| | 15,290 | | | Caterpillar | | | 1,294,604 | |
| | 19,208 | | | Copa Holdings SA, Class A (Panama) | | | 2,412,141 | |
| | 28,184 | | | Joy Global | | | 1,592,960 | |
| | 19,551 | | | Lockheed Martin | | | 1,937,308 | |
| | 21,143 | | | United Parcel Service, Class B | | | 1,814,915 | |
| | | | | | | | |
| | | | | | | 9,051,928 | |
| | | | | | | | |
| | |
| | | | Information Technology – 9.81% | | | | |
| | 12,647 | | | Accenture, Class A (Ireland) | | | 1,029,972 | |
| | 3,309 | | | Apple | | | 1,465,060 | |
| | 9,167 | | | International Business Machines | | | 1,856,684 | |
| | 64,395 | | | Microsoft | | | 2,131,475 | |
| | 45,947 | | | Western Digital | | | 2,539,950 | |
| | | | | | | | |
| | | | | | | 9,023,141 | |
| | | | | | | | |
| | |
| | | | Materials – 5.33% | | | | |
| | 8,634 | | | CF Industries Holdings | | | 1,610,327 | |
| | 6,276 | | | Newmarket | | | 1,686,361 | |
| | 48,150 | | | Southern Copper | | | 1,604,839 | |
| | | | | | | | |
| | | | | | | 4,901,527 | |
| | | | | | | | |
| | |
| | | | Total Common Stocks
(Cost $80,746,978) | | | 88,567,494 | |
| | | | | | | | |
|
| | INVESTMENT COMPANY – 3.22% | |
| | |
| | 2,960,448 | | | BlackRock Liquidity Funds TempCash Portfolio | | | 2,960,448 | |
| | | | | | | | |
| | |
| | | | Total Investment Company
(Cost $2,960,448) | | | 2,960,448 | |
| | | | | | | | |
| Total Investments – 99.53%
(Cost $83,707,426)** | | | 91,527,942 | |
| | | | | | | | |
| Net Other Assets and Liabilities – 0.47% | | | 429,508 | |
| | | | | | | | |
| Net Assets – 100.00% | | $ | 91,957,450 | |
| | | | | | | | |
See accompanying Notes to Financial Statements.
| | |
| |
| ASTON/Herndon Large Cap Value Fund | | April 30, 2013 |
| |
| Schedule of Investments (unaudited) – continued | | |
| * | | Non-income producing security. |
| ** | | At April 30, 2013, cost is identical for book and Federal income tax purposes. |
| | | | |
Gross unrealized appreciation | | $ | 9,330,467 | |
Gross unrealized depreciation | | | (1,509,951 | ) |
| | | | |
Net unrealized appreciation | | $ | 7,820,516 | |
| | | | |
| REIT | | Real Estate Investment Trust |
See accompanying Notes to Financial Statements.
| | |
| |
| ASTON/Cornerstone Large Cap Value Fund | | April 30, 2013 |
| |
| Schedule of Investments (unaudited) | | |
| | | | | | | | |
Shares | | | | | Market
Value | |
|
| | COMMON STOCKS – 95.11% | |
| | |
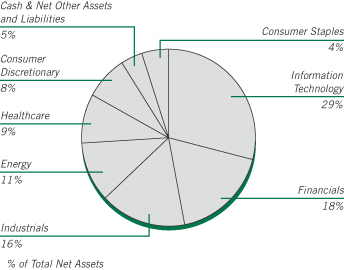
| | | | Consumer Discretionary – 7.94% | | | | |
| | 4,472 | | | Bed Bath & Beyond * | | $ | 307,673 | |
| | 28,200 | | | Hasbro | | | 1,335,834 | |
| | 39,025 | | | Mattel | | | 1,781,882 | |
| | | | | | | | |
| | | | | | | 3,425,389 | |
| | | | | | | | |
| | |
| | | | Consumer Staples – 4.21% | | | | |
| | 23,400 | | | Wal-Mart Stores | | | 1,818,647 | |
| | | | | | | | |
| | |
| | | | Energy – 10.88% | | | | |
| | 13,125 | | | Chevron | | | 1,601,380 | |
| | 20,012 | | | Hess | | | 1,444,466 | |
| | 24,275 | | | Royal Dutch Shell PLC, ADR | | | 1,649,972 | |
| | | | | | | | |
| | | | | | | 4,695,818 | |
| | | | | | | | |
| | |
| | | | Financials – 18.18% | | | | |
| | 15,300 | | | ACE (Switzerland) | | | 1,363,841 | |
| | 25,750 | | | Capital One Financial | | | 1,487,835 | |
| | 44,125 | | | Citigroup | | | 2,058,873 | |
| | 21,100 | | | JPMorgan Chase | | | 1,034,111 | |
| | 16,725 | | | State Street | | | 977,911 | |
| | 33,125 | | | Unum Group | | | 923,856 | |
| | | | | | | | |
| | | | | | | 7,846,427 | |
| | | | | | | | |
| | |
| | | | Healthcare – 9.12% | | | | |
| | 14,125 | | | Johnson & Johnson | | | 1,203,873 | |
| | 21,925 | | | Sanofi, ADR | | | 1,169,699 | |
| | 23,825 | | | Stryker | | | 1,562,444 | |
| | | | | | | | |
| | | | | | | 3,936,016 | |
| | | | | | | | |
| | |
| | | | Industrials – 16.19% | | | | |
| | 13,500 | | | 3M | | | 1,413,585 | |
| | 10,875 | | | Cummins | | | 1,156,991 | |
| | 18,755 | | | Eaton (Iran) | | | 1,151,745 | |
| | | | | | | | |
Shares | | | | | Market
Value | |
| | |
| | | | Industrials (continued) | | | | |
| | 19,025 | | | Emerson Electric | | $ | 1,056,078 | |
| | 15,125 | | | General Dynamics | | | 1,118,645 | |
| | 12,300 | | | Parker Hannifin | | | 1,089,411 | |
| | | | | | | | |
| | | | | | | 6,986,455 | |
| | | | | | | | |
| | |
| | | | Information Technology – 28.59% | | | | |
| | 3,390 | | | Apple | | | 1,500,923 | |
| | 6,081 | | | eBay * | | | 318,584 | |
| | 2,020 | | | Google, Class A * | | | 1,665,631 | |
| | 54,025 | | | Intel | | | 1,293,899 | |
| | 5,775 | | | International Business Machines | | | 1,169,669 | |
| | 54,225 | | | Microsoft | | | 1,794,848 | |
| | 44,725 | | | Oracle | | | 1,466,086 | |
| | 25,900 | | | QUALCOMM | | | 1,595,958 | |
| | 27,775 | | | Western Digital * | | | 1,535,402 | |
| | | | | | | | |
| | | | | | | 12,341,000 | |
| | | | | | | | |
| | |
| | | | Total Common Stocks
(Cost $36,066,806) | | | 41,049,752 | |
| | | | | | | | |
| |
| | INVESTMENT COMPANY – 5.62% | | | | |
| | |
| | 2,425,064 | | | BlackRock Liquidity Funds TempCash Portfolio | | | 2,425,064 | |
| | | | | | | | |
| | |
| | | | Total Investment Company
(Cost $2,425,064) | | | 2,425,064 | |
| | | | | | | | |
| Total Investments – 100.73%
(Cost $38,491,870)** | | | 43,474,816 | |
| | | | | | | | |
| Net Other Assets and Liabilities – (0.73)% | | | (315,903 | ) |
| | | | | | | | |
| Net Assets – 100.00% | | $ | 43,158,913 | |
| | | | | | | | |
| * | | Non-income producing security. |
| ** | | At April 30, 2013, cost is identical for book and Federal income tax purposes. |
| | | | |
Gross unrealized appreciation | | $ | 5,166,622 | |
Gross unrealized depreciation | | | (183,676 | ) |
| | | | |
Net unrealized appreciation | | $ | 4,982,946 | |
| | | | |
| ADR | | American Depositary Receipt |
See accompanying Notes to Financial Statements.
| | |
| |
| ASTON/River Road Dividend All Cap Value Fund | | April 30, 2013 |
| |
| Schedule of Investments (unaudited) | | |
| | | | | | | | |
Shares | | | | | Market
Value | |
|
| | COMMON STOCKS – 96.73% | |
| | |
| | | | Consumer Discretionary – 15.24% | | | | |
| | 425,670 | | | Bob Evans Farms | | $ | 18,448,538 | |
| | 209,005 | | | Coach | | | 12,302,034 | |
| | 319,575 | | | Darden Restaurants | | | 16,499,657 | |
| | 137,495 | | | Genuine Parts | | | 10,494,993 | |
| | 407,720 | | | Hasbro | | | 19,313,696 | |
| | 585,550 | | | Hillenbrand | | | 14,714,872 | |
| | 300,865 | | | Kohl’s | | | 14,158,707 | |
| | 653,110 | | | National CineMedia | | | 10,606,506 | |
| | 685,805 | | | Regal Entertainment Group, Class A | | | 12,303,342 | |
| | 274,010 | | | Target | | | 19,334,146 | |
| | 555,755 | | | Thomson Reuters | | | 18,612,235 | |
| | | | | | | | |
| | | | | | | 166,788,726 | |
| | | | | | | | |
| |
| | | | Consumer Staples – 15.52% | |
| | 407,585 | | | Dr Pepper Snapple Group | | | 19,902,376 | |
| | 434,880 | | | General Mills | | | 21,926,650 | |
| | 211,935 | | | Kimberly-Clark | | | 21,869,573 | |
| | 283,565 | | | Molson Coors Brewing, Class B | | | 14,631,954 | |
| | 251,605 | | | PepsiCo | | | 20,749,864 | |
| | 183,820 | | | Procter & Gamble | | | 14,111,861 | |
| | 594,285 | | | Sysco | | | 20,716,775 | |
| | 179,455 | | | Wal-Mart Stores | | | 13,947,243 | |
| | 443,410 | | | Walgreen | | | 21,953,229 | |
| | | | | | | | |
| | | | | | | 169,809,525 | |
| | | | | | | | |
| |
| | | | Energy – 7.81% | |
| | 918,065 | | | BreitBurn Energy Partners LP | | | 18,774,429 | |
| | 163,825 | | | Chevron | | | 19,988,288 | |
| | 274,585 | | | Occidental Petroleum | | | 24,509,457 | |
| | 144,550 | | | Transmontaigne Partners LP | | | 6,923,945 | |
| | 279,970 | | | Williams Partners LP | | | 15,300,361 | |
| | | | | | | | |
| | | | | | | 85,496,480 | |
| | | | | | | | |
| | | | | | | | |
Shares | | | | | Market
Value | |
| | |
| | | | Financials – 12.79% | | | | |
| | 62,145 | | | BlackRock | | $ | 16,561,643 | |
| | 262,230 | | | CME Group | | | 15,959,318 | |
| | 222,591 | | | Commerce Bancshares | | | 8,928,125 | |
| | 396,965 | | | Compass Diversified Holdings | | | 6,712,678 | |
| | 346,855 | | | OneBeacon Insurance Group, Class A (Bermuda) | | | 4,713,759 | |
| | 189,305 | | | PartnerRe (Bermuda) | | | 17,859,034 | |
| | 294,890 | | | PNC Financial Services Group | | | 20,017,133 | |
| | 733,535 | | | Sabra Health Care, REIT | | | 21,874,014 | |
| | 201,130 | | | Safety Insurance Group | | | 9,990,127 | |
| | 522,395 | | | U.S. Bancorp | | | 17,385,306 | |
| | | | | | | | |
| | | | | | | 140,001,137 | |
| | | | | | | | |
| |
| | | | Healthcare – 7.15% | |
| | 145,870 | | | Becton, Dickinson | | | 13,755,541 | |
| | 199,240 | | | Johnson & Johnson | | | 16,981,225 | |
| | 352,940 | | | Medtronic | | | 16,475,239 | |
| | 498,087 | | | Owens & Minor | | | 16,222,694 | |
| | 511,345 | | | Pfizer | | | 14,864,799 | |
| | | | | | | | |
| | | | | | | 78,299,498 | |
| | | | | | | | |
| |
| | | | Industrials – 14.45% | |
| | 90,405 | | | 3M | | | 9,466,308 | |
| | 421,200 | | | ABM Industries | | | 9,498,060 | |
| | 288,745 | | | Emerson Electric | | | 16,028,235 | |
| | 182,870 | | | General Dynamics | | | 13,525,065 | |
| | 265,125 | | | Geo Group | | | 9,928,931 | |
| | 468,729 | | | Iron Mountain | | | 17,746,080 | |
| | 114,000 | | | Lockheed Martin | | | 11,296,260 | |
| | 280,670 | | | Norfolk Southern | | | 21,729,471 | |
| | 218,685 | | | Raytheon | | | 13,422,885 | |
| | 416,115 | | | Republic Services | | | 14,181,199 | |
| | 248,355 | | | United Parcel Service, Class B | | | 21,318,793 | |
| | | | | | | | |
| | | | | | | 158,141,287 | |
| | | | | | | | |
| |
| | | | Information Technology – 11.06% | |
| | 264,375 | | | Automatic Data Processing | | | 17,803,012 | |
| | 557,145 | | | CA | | | 15,026,201 | |
| | 899,485 | | | Corning | | | 13,042,532 | |
| | 1,051,920 | | | Intel | | | 25,193,484 | |
| | 257,640 | | | j2 Global | | | 10,485,948 | |
| | 508,655 | | | Microsoft | | | 16,836,481 | |
| | 288,235 | | | Paychex | | | 10,494,636 | |
| | 821,315 | | | Western Union | | | 12,163,675 | |
| | | | | | | | |
| | | | | | | 121,045,969 | |
| | | | | | | | |
| |
| | | | Materials – 2.88% | |
| | 331,990 | | | Bemis | | | 13,063,806 | |
| | 101,385 | | | Innophos Holdings | | | 5,202,064 | |
| | 303,800 | | | Nucor | | | 13,251,756 | |
| | | | | | | | |
| | | | | | | 31,517,626 | |
| | | | | | | | |
| |
| | | | Telecommunication Services – 4.80% | |
| | 129,920 | | | Atlantic Tele-Network | | | 6,596,038 | |
| | 491,652 | | | Telefonica Brasil SA, ADR (Brazil) | | | 13,068,110 | |
| | 310,180 | | | Verizon Communications | | | 16,721,804 | |
See accompanying Notes to Financial Statements.
| | |
| |
| ASTON/River Road Dividend All Cap Value Fund | | April 30, 2013 |
| |
| Schedule of Investments (unaudited) – continued | | |
| | | | | | | | |
Shares | | | | | Market
Value | |
| |
| | | | Telecommunication Services (continued) | |
| | 529,340 | | | Vodafone Group, SP ADR (United Kingdom) | | $ | 16,192,511 | |
| | | | | | | | |
| | | | | | | 52,578,463 | |
| | | | | | | | |
| |
| | | | Utilities – 5.03% | |
| | 283,620 | | | AmeriGas Partners LP | | | 12,856,495 | |
| | 432,375 | | | Avista | | | 12,128,119 | |
| | 311,670 | | | National Fuel Gas | | | 19,547,942 | |
| | 206,310 | | | UNS Energy | | | 10,513,558 | |
| | | | | | | | |
| | | | | | | 55,046,114 | |
| | | | | | | | |
| | |
| | | | Total Common Stocks
(Cost $843,192,974) | | | 1,058,724,825 | |
| | | | | | | | |
|
| | INVESTMENT COMPANY – 3.81% | |
| | |
| | 41,627,627 | | | BlackRock Liquidity Funds TempCash Portfolio | | | 41,627,627 | |
| | | | | | | | |
| | |
| | | | Total Investment Company
(Cost $41,627,627) | | | 41,627,627 | |
| | | | | | | | |
| Total Investments – 100.54%
(Cost $884,820,601)* | | | 1,100,352,452 | |
| | | | | | | | |
| Net Other Assets and Liabilities – (0.54)% | | | (5,857,587 | ) |
| | | | | | | | |
| Net Assets – 100.00% | | $ | 1,094,494,865 | |
| | | | | | | | |
| * | | At April 30, 2013, cost is identical for book and Federal income tax purposes. |
| | | | |
Gross unrealized appreciation | | $ | 216,430,876 | |
Gross unrealized depreciation | | | (899,025 | ) |
| | | | |
Net unrealized appreciation | | $ | 215,531,851 | |
| | | | |
| ADR | | American Depositary Receipt |
| REIT | | Real Estate Investment Trust |
| SP ADR | | Sponsored American Depositary Receipt |
See accompanying Notes to Financial Statements.
| | |
| |
| ASTON/River Road Dividend All Cap Value Fund II | | April 30, 2013 |
| |
| Schedule of Investments (unaudited) | | |
| | | | | | | | |
Shares | | | | | Market
Value | |
|
| | COMMON STOCKS – 96.69% | |
| | |
| | | | Consumer Discretionary – 14.09% | | | | |
| | 10,015 | | | Bob Evans Farms | | $ | 434,050 | |
| | 11,945 | | | Coach | | | 703,083 | |
| | 18,220 | | | Darden Restaurants | | | 940,699 | |
| | 7,105 | | | Genuine Parts | | | 542,325 | |
| | 21,605 | | | Hasbro | | | 1,023,429 | |
| | 15,130 | | | Hillenbrand | | | 380,217 | |
| | 17,060 | | | Kohl’s | | | 802,844 | |
| | 39,800 | | | Regal Entertainment Group, Class A | | | 714,012 | |
| | 15,640 | | | Target | | | 1,103,558 | |
| | 32,915 | | | Thomson Reuters | | | 1,102,323 | |
| | | | | | | | |
| | | | | | | 7,746,540 | |
| | | | | | | | |
| | |
| | | | Consumer Staples – 17.63% | | | | |
| | 23,090 | | | Dr Pepper Snapple Group | | | 1,127,485 | |
| | 23,260 | | | General Mills | | | 1,172,769 | |
| | 11,675 | | | Kimberly-Clark | | | 1,204,743 | |
| | 16,830 | | | Molson Coors Brewing, Class B | | | 868,428 | |
| | 14,910 | | | PepsiCo | | | 1,229,628 | |
| | 10,915 | | | Procter & Gamble | | | 837,945 | |
| | 33,680 | | | Sysco | | | 1,174,085 | |
| | 10,690 | | | Wal-Mart Stores | | | 830,827 | |
| | 25,160 | | | Walgreen | | | 1,245,672 | |
| | | | | | | | |
| | | | | | | 9,691,582 | |
| | | | | | | | |
| | |
| | | | Energy – 7.69% | | | | |
| | 39,040 | | | BreitBurn Energy Partners LP | | | 798,368 | |
| | 9,790 | | | Chevron | | | 1,194,477 | |
| | 15,025 | | | Occidental Petroleum | | | 1,341,132 | |
| | 16,320 | | | Williams Partners LP | | | 891,888 | |
| | | | | | | | |
| | | | | | | 4,225,865 | |
| | | | | | | | |
| | | | | | | | |
Shares | | | | | Market
Value | |
| | |
| | | | Financials – 9.97% | | | | |
| | 3,305 | | | BlackRock | | $ | 880,782 | |
| | 14,910 | | | CME Group | | | 907,423 | |
| | 12,796 | | | Commerce Bancshares | | | 513,248 | |
| | 10,915 | | | PartnerRe (Bermuda) | | | 1,029,721 | |
| | 17,040 | | | PNC Financial Services Group | | | 1,156,675 | |
| | 29,895 | | | U.S. Bancorp | | | 994,906 | |
| | | | | | | | |
| | | | | | | 5,482,755 | |
| | | | | | | | |
| | |
| | | | Healthcare – 7.32% | | | | |
| | 8,885 | | | Becton, Dickinson | | | 837,855 | |
| | 6,450 | | | Johnson & Johnson | | | 549,734 | |
| | 20,750 | | | Medtronic | | | 968,610 | |
| | 27,730 | | | Owens & Minor | | | 903,166 | |
| | 26,275 | | | Pfizer | | | 763,814 | |
| | | | | | | | |
| | | | | | | 4,023,179 | |
| | | | | | | | |
| | |
| | | | Industrials – 16.05% | | | | |
| | 5,440 | | | 3M | | | 569,622 | |
| | 12,725 | | | ABM Industries | | | 286,948 | |
| | 15,820 | | | Emerson Electric | | | 878,168 | |
| | 10,500 | | | General Dynamics | | | 776,580 | |
| | 14,584 | | | Geo Group | | | 546,171 | |
| | 27,185 | | | Iron Mountain | | | 1,029,224 | |
| | 6,675 | | | Lockheed Martin | | | 661,426 | |
| | 16,830 | | | Norfolk Southern | | | 1,302,979 | |
| | 12,665 | | | Raytheon | | | 777,378 | |
| | 22,615 | | | Republic Services | | | 770,719 | |
| | 14,260 | | | United Parcel Service, Class B | | | 1,224,078 | |
| | | | | | | | |
| | | | | | | 8,823,293 | |
| | | | | | | | |
| | |
| | | | Information Technology – 11.87% | | | | |
| | 9,610 | | | Automatic Data Processing | | | 647,137 | |
| | 32,300 | | | CA | | | 871,131 | |
| | 52,795 | | | Corning | | | 765,528 | |
| | 57,660 | | | Intel | | | 1,380,957 | |
| | 14,910 | | | j2 Global | | | 606,837 | |
| | 29,095 | | | Microsoft | | | 963,045 | |
| | 17,150 | | | Paychex | | | 624,432 | |
| | 45,135 | | | Western Union | | | 668,449 | |
| | | | | | | | |
| | | | | | | 6,527,516 | |
| | | | | | | | |
| | |
| | | | Materials – 3.25% | | | | |
| | 17,905 | | | Bemis | | | 704,561 | |
| | 5,875 | | | Innophos Holdings | | | 301,446 | |
| | 17,885 | | | Nucor | | | 780,144 | |
| | | | | | | | |
| | | | | | | 1,786,151 | |
| | | | | | | | |
| | |
| | | | Telecommunication Services – 4.67% | | | | |
| | 29,601 | | | Telefonica Brasil SA, ADR (Brazil) | | | 786,795 | |
| | 16,630 | | | Verizon Communications | | | 896,523 | |
| | 28,900 | | | Vodafone Group, SP ADR (United Kingdom) | | | 884,051 | |
| | | | | | | | |
| | | | | | | 2,567,369 | |
| | | | | | | | |
| | |
| | | | Utilities – 4.15% | | | | |
| | 7,635 | | | AmeriGas Partners LP | | | 346,094 | |
See accompanying Notes to Financial Statements.
| | |
| |
| ASTON/River Road Dividend All Cap Value Fund II | | April 30, 2013 |
| |
| Schedule of Investments (unaudited) – continued | | |
| | | | | | | | |
Shares | | | | | Market
Value | |
| | |
| | | | Utilities (continued) | | | | |
| | 16,125 | | | Avista | | $ | 452,306 | |
| | 18,255 | | | National Fuel Gas | | | 1,144,954 | |
| | 6,620 | | | UNS Energy | | | 337,355 | |
| | | | | | | | |
| | | | | | | 2,280,709 | |
| | | | | | | | |
| | |
| | | | Total Common Stocks
(Cost $48,890,371) | | | 53,154,959 | |
| | | | | | | | |
|
| | INVESTMENT COMPANY – 4.93% | |
| | |
| | 2,712,327 | | | BlackRock Liquidity Funds TempCash Portfolio | | | 2,712,327 | |
| | | | | | | | |
| | |
| | | | Total Investment Company
(Cost $2,712,327) | | | 2,712,327 | |
| | | | | | | | |
| Total Investments – 101.62%
(Cost $51,602,698)* | | | 55,867,286 | |
| | | | | | | | |
| Net Other Assets and Liabilities – (1.62)% | | | (890,101 | ) |
| | | | | | | | |
| Net Assets – 100.00% | | $ | 54,977,185 | |
| | | | | | | | |
| * | | At April 30, 2013, cost is identical for book and Federal income tax purposes. |
| | | | |
Gross unrealized appreciation | | $ | 4,294,785 | |
Gross unrealized depreciation | | | (30,197 | ) |
| | | | |
Net unrealized appreciation | | $ | 4,264,588 | |
| | | | |
| ADR | | American Depositary Receipt |
| SP ADR | | Sponsored American Depositary Receipt |
See accompanying Notes to Financial Statements.
| | |
| |
| ASTON/Fairpointe Mid Cap Fund | | April 30, 2013 |
| |
| Schedule of Investments (unaudited) | | |
| | | | | | | | |
Shares | | | | | Market
Value | |
|
| | COMMON STOCKS – 97.32% | |
| | |
| | | | Consumer Discretionary – 23.52% | | | | |
| | 6,517,078 | | | Belo, Class A | | $ | 69,863,076 | |
| | 649,800 | | | BorgWarner * | | | 50,794,866 | |
| | 4,580,000 | | | DeVry | | | 128,285,800 | |
| | 4,614,200 | | | Gannett | | | 93,022,272 | |
| | 2,567,100 | | | H&R Block | | | 71,211,354 | |
| | 7,641,968 | | | Interpublic Group | | | 105,764,837 | |
| | 1,075,500 | | | Lear | | | 62,142,390 | |
| | 11,960,954 | | | New York Times, Class A * | | | 105,974,052 | |
| | 1,994,497 | | | Scholastic | | | 54,748,943 | |
| | 10,095,700 | | | Staples | | | 133,667,068 | |
| | | | | | | | |
| | | | | | | 875,474,658 | |
| | | | | | | | |
| | |
| | | | Consumer Staples – 3.53% | | | | |
| | 560,500 | | | Bunge | | | 40,473,705 | |
| | 1,762,286 | | | Molson Coors Brewing, Class B | | | 90,933,958 | |
| | | | | | | | |
| | | | | | | 131,407,663 | |
| | | | | | | | |
| | |
| | | | Energy – 6.16% | | | | |
| | 1,203,992 | | | Compagnie Generale de Geophysique-Veritas, SP ADR (France) | | | 25,705,229 | |
| | 1,207,900 | | | Denbury Resources * | | | 21,609,331 | |
| | 1,742,292 | | | FMC Technologies * | | | 94,606,456 | |
| | 8,169,600 | | | McDermott International * | | | 87,251,328 | |
| | | | | | | | |
| | | | | | | 229,172,344 | |
| | | | | | | | |
| | |
| | | | Financials – 7.16% | | | | |
| | 1,234,500 | | | Cincinnati Financial | | | 60,379,395 | |
| | 1,413,785 | | | Eaton Vance | | | 56,381,746 | |
| | 1,462,155 | | | McGraw-Hill | | | 79,117,207 | |
| | 1,314,300 | | | Northern Trust | | | 70,867,056 | |
| | | | | | | | |
| | | | | | | 266,745,404 | |
| | | | | | | | |
| | | | | | | | |
Shares | | | | | Market
Value | |
| | |
| | | | Healthcare – 15.05% | | | | |
| | 20,961,236 | | | Boston Scientific * | | $ | 156,999,658 | |
| | 1,758,919 | | | Charles River Laboratories * | | | 76,495,387 | |
| | 2,311,218 | | | Forest Laboratories * | | | 86,462,665 | |
| | 4,466,326 | | | Hospira * | | | 147,924,717 | |
| | 1,421,500 | | | Varian Medical Systems * | | | 92,596,510 | |
| | | | | | | | |
| | | | | | | 560,478,937 | |
| | | | | | | | |
| | |
| | | | Industrials – 9.20% | | | | |
| | 2,352,900 | | | Con-way | | | 79,528,020 | |
| | 1,418,644 | | | ManpowerGroup | | | 75,415,115 | |
| | 7,665,500 | | | Southwest Airlines | | | 105,017,350 | |
| | 3,592,500 | | | Werner Enterprises | | | 82,483,800 | |
| | | | | | | | |
| | | | | | | 342,444,285 | |
| | | | | | | | |
| |
| | | | Information Technology – 29.74% | |
| | 2,782,239 | | | Akamai Technologies * | | | 122,168,114 | |
| | 1,682,100 | | | Cree * | | | 95,156,397 | |
| | 2,148,000 | | | First Solar * | | | 100,010,880 | |
| | 1,234,300 | | | Harris | | | 57,024,660 | |
| | 2,569,598 | | | Itron * | | | 101,884,561 | |
| | 4,981,800 | | | Jabil Circuit | | | 88,676,040 | |
| | 3,328,700 | | | Lexmark International, Class A | | | 100,892,897 | |
| | 1,873,286 | | | Molex | | | 51,646,495 | |
| | 1,934,364 | | | Molex, Class A | | | 45,090,025 | |
| | 4,474,900 | | | Nuance Communications * | | | 85,202,096 | |
| | 7,864,400 | | | NVIDIA | | | 108,292,788 | |
| | 4,006,228 | | | Unisys * | | | 76,639,142 | |
| | 1,597,859 | | | Zebra Technologies, Class A * | | | 74,540,122 | |
| | | | | | | | |
| | | | | | | 1,107,224,217 | |
| | | | | | | | |
| | |
| | | | Materials – 2.96% | | | | |
| | 734,700 | | | FMC | | | 44,596,290 | |
| | 834,200 | | | Sigma-Aldrich | | | 65,643,198 | |
| | | | | | | | |
| | | | | | | 110,239,488 | |
| | | | | | | | |
| | |
| | | | Total Common Stocks
(Cost $2,703,959,622) | | | 3,623,186,996 | |
| | | | | | | | |
|
| | INVESTMENT COMPANY – 2.92% | |
| | |
| | 108,634,144 | | | BlackRock Liquidity Funds TempCash Portfolio | | | 108,634,144 | |
| | | | | | | | |
| | |
| | | | Total Investment Company
(Cost $108,634,144) | | | 108,634,144 | |
| | | | | | | | |
| Total Investments – 100.24%
(Cost $2,812,593,766)** | | | 3,731,821,140 | |
| | | | | | | | |
| Net Other Assets and Liabilities – (0.24)% | | | (9,088,094 | ) |
| | | | | | | | |
| Net Assets – 100.00% | | $ | 3,722,733,046 | |
| | | | | | | | |
See accompanying Notes to Financial Statements.
| | |
| |
| ASTON/Fairpointe Mid Cap Fund | | April 30, 2013 |
| |
| Schedule of Investments (unaudited) – continued | | |
| * | | Non-income producing security. |
| ** | | At April 30, 2013, cost is identical for book and Federal income tax purposes. |
| | | | |
Gross unrealized appreciation | | $ | 962,913,078 | |
Gross unrealized depreciation | | | (43,685,704 | ) |
| | | | |
Net unrealized appreciation | | $ | 919,227,374 | |
| | | | |
| ADR | | American Depositary Receipt |
| SP ADR | | Sponsored American Depositary Receipt |
See accompanying Notes to Financial Statements.
| | |
| |
| ASTON/Montag & Caldwell Mid Cap Growth Fund | | April 30, 2013 |
| |
| Schedule of Investments (unaudited) | | |
| | | | | | | | |
Shares | | | | | Market
Value | |
|
| | COMMON STOCKS – 96.83% | |
| | |
| | | | Consumer Discretionary – 23.03% | | | | |
| | 2,990 | | | BorgWarner * | | $ | 233,728 | |
| | 5,490 | | | Dick’s Sporting Goods | | | 264,069 | |
| | 6,730 | | | Dollar Tree * | | | 320,079 | |
| | 2,490 | | | Dunkin’ Brands Group | | | 96,624 | |
| | 15,850 | | | LKQ * | | | 381,668 | |
| | 3,310 | | | O’Reilly Automotive * | | | 355,229 | |
| | 1,350 | | | Panera Bread, Class A * | | | 239,261 | |
| | 2,790 | | | PVH | | | 321,994 | |
| | 1,330 | | | Ralph Lauren | | | 241,501 | |
| | 5,210 | | | Ross Stores | | | 344,225 | |
| | 1,510 | | | Tractor Supply | | | 161,827 | |
| | | | | | | | |
| | | | | | | 2,960,205 | |
| | | | | | | | |
| | |
| | | | Consumer Staples – 5.20% | | | | |
| | 4,270 | | | Church & Dwight | | | 272,810 | |
| | 3,660 | | | Mead Johnson Nutrition | | | 296,789 | |
| | 1,750 | | | Monster Beverage * | | | 98,700 | |
| | | | | | | | |
| | | | | | | 668,299 | |
| | | | | | | | |
| | |
| | | | Energy – 6.90% | | | | |
| | 5,300 | | | Cameron International * | | | 326,215 | |
| | 1,610 | | | Core Laboratories (Netherlands) | | | 233,096 | |
| | 4,670 | | | Oceaneering International | | | 327,694 | |
| | | | | | | | |
| | | | | | | 887,005 | |
| | | | | | | | |
| | |
| | | | Financials – 5.51% | | | | |
| | 7,300 | | | First Republic Bank | | | 277,254 | |
| | 1,200 | | | IntercontinentalExchange * | | | 195,516 | |
| | 5,670 | | | Raymond James Financial | | | 234,851 | |
| | | | | | | | |
| | | | | | | 707,621 | |
| | | | | | | | |
| | | | | | | | |
Shares | | | | | Market
Value | |
| | |
| | | | Healthcare – 15.88% | | | | |
| | 6,810 | | | Dentsply International | | $ | 288,403 | |
| | 2,740 | | | Edwards Lifesciences * | | | 174,785 | |
| | 2,640 | | | Henry Schein * | | | 238,656 | |
| | 2,660 | | | IDEXX Laboratories * | | | 233,974 | |
| | 1,890 | | | Perrigo | | | 225,685 | |
| | 8,220 | | | ResMed | | | 394,724 | |
| | 3,640 | | | Varian Medical Systems * | | | 237,110 | |
| | 2,680 | | | Waters * | | | 247,632 | |
| | | | | | | | |
| | | | | | | 2,040,969 | |
| | | | | | | | |
| | |
| | | | Industrials – 21.10% | | | | |
| | 7,495 | | | AMETEK | | | 305,121 | |
| | 6,560 | | | Donaldson | | | 238,653 | |
| | 7,340 | | | Expeditors International Washington | | | 263,726 | |
| | 2,940 | | | Fastenal | | | 144,207 | |
| | 2,540 | | | J.B. Hunt Transport Services | | | 180,518 | |
| | 5,200 | | | Jacobs Engineering Group * | | | 262,496 | |
| | 1,780 | | | Joy Global | | | 100,606 | |
| | 10,310 | | | Robert Half International | | | 338,374 | |
| | 1,510 | | | Roper Industries | | | 180,672 | |
| | 3,220 | | | Stericycle * | | | 348,790 | |
| | 5,680 | | | Verisk Analytics, Class A * | | | 348,127 | |
| | | | | | | | |
| | | | | | | 2,711,290 | |
| | | | | | | | |
| | |
| | | | Information Technology – 17.45% | | | | |
| | 4,950 | | | Altera | | | 158,450 | |
| | 4,420 | | | Amphenol, Class A | | | 333,798 | |
| | 4,170 | | | ANSYS * | | | 337,186 | |
| | 3,760 | | | F5 Networks * | | | 287,377 | |
| | 2,740 | | | FactSet Research Systems | | | 257,752 | |
| | 2,060 | | | Fiserv * | | | 187,687 | |
| | 16,550 | | | Juniper Networks * | | | 273,902 | |
| | 2,980 | | | Teradata * | | | 152,189 | |
| | 6,710 | | | Xilinx | | | 254,376 | |
| | | | | | | | |
| | | | | | | 2,242,717 | |
| | | | | | | | |
| | |
| | | | Materials – 1.76% | | | | |
| | 2,680 | | | Ecolab | | | 226,782 | |
| | | | | | | | |
| | |
| | | | Total Common Stocks
(Cost $10,792,234) | | | 12,444,888 | |
| | | | | | | | |
| |
| | INVESTMENT COMPANY – 2.60% | | | | |
| | |
| | 333,714 | | | BlackRock Liquidity Funds TempCash Portfolio | | | 333,714 | |
| | | | | | | | |
| | |
| | | | Total Investment Company
(Cost $333,714) | | | 333,714 | |
| | | | | | | | |
| Total Investments – 99.43%
(Cost $11,125,948)** | | | 12,778,602 | |
| | | | | | | | |
| Net Other Assets and Liabilities – 0.57% | | | 73,127 | |
| | | | | | | | |
| Net Assets – 100.00% | | $ | 12,851,729 | |
| | | | | | | | |
See accompanying Notes to Financial Statements.
| | |
| |
| ASTON/Montag & Caldwell Mid Cap Growth Fund | | April 30, 2013 |
| |
| Schedule of Investments (unaudited) – continued | | |
| * | | Non-income producing security. |
| ** | | At April 30, 2013, cost is identical for book and Federal income tax purposes. |
| | | | |
Gross unrealized appreciation | | $ | 1,916,123 | |
Gross unrealized depreciation | | | (263,469 | ) |
| | | | |
Net unrealized appreciation | | $ | 1,652,654 | |
| | | | |
See accompanying Notes to Financial Statements.
| | |
| |
| ASTON/LMCG Small Cap Growth Fund (formerly, ASTON Small Cap Growth Fund) | | April 30, 2013 |
| |
| Schedule of Investments (unaudited) | | |
| | | | | | | | |
Shares | | | | | Market
Value | |
|
| | COMMON STOCKS – 99.18% | |
| | |
| | | | Consumer Discretionary – 17.07% | | | | |
| | 2,838 | | | Arctic Cat * | | $ | 127,682 | |
| | 6,143 | | | BJ’s Restaurants * | | | 210,705 | |
| | 46,342 | | | Black Diamond * | | | 454,152 | |
| | 18,760 | | | Brunswick | | | 593,942 | |
| | 25,751 | | | Del Frisco’s Restaurant Group * | | | 435,449 | |
| | 12,616 | | | GNC Holdings, Class A | | | 571,883 | |
| | 7,620 | | | Hibbett Sports * | | | 417,957 | |
| | 7,214 | | | HSN | | | 379,312 | |
| | 9,752 | | | Life Time Fitness * | | | 450,347 | |
| | 10,240 | | | Monro Muffler Brake | | | 423,526 | |
| | 70,513 | | | OfficeMax | | | 811,605 | |
| | 2,988 | | | Papa John’s International * | | | 188,244 | |
| | 6,596 | | | Vitamin Shoppe * | | | 324,193 | |
| | | | | | | | |
| | | | | | | 5,388,997 | |
| | | | | | | | |
| |
| | | | Consumer Staples – 3.33% | |
| | 14,919 | | | Fresh Market * | | | 610,635 | |
| | 6,751 | | | Hain Celestial Group * | | | 440,503 | |
| | | | | | | | |
| | | | | | | 1,051,138 | |
| | | | | | | | |
| |
| | | | Energy – 3.42% | |
| | 12,963 | | | Carrizo Oil & Gas * | | | 313,964 | |
| | 7,595 | | | Gulfport Energy * | | | 396,383 | |
| | 136,090 | | | Magnum Hunter Resources * | | | 370,165 | |
| | | | | | | | |
| | | | | | | 1,080,512 | |
| | | | | | | | |
| |
| | | | Financials – 4.70% | |
| | 17,693 | | | Colony Financial, REIT | | | 394,554 | |
| | 38,255 | | | Encore Capital Group * | | | 1,089,885 | |
| | | | | | | | |
| | | | | | | 1,484,439 | |
| | | | | | | | |
| |
| | | | Healthcare – 25.23% | |
| | 16,023 | | | Akorn * | | | 241,146 | |
| | 5,938 | | | Cubist Pharmaceuticals * | | | 272,673 | |
| | | | | | | | |
Shares | | | | | Market
Value | |
| | |
| | | | Healthcare (continued) | | | | |
| | 6,238 | | | Cyberonics * | | $ | 270,854 | |
| | 146,228 | | | Health Management Associates, Class A * | | | 1,680,160 | |
| | 8,738 | | | HeartWare International * | | | 849,334 | |
| | 8,390 | | | Medicines * | | | 283,246 | |
| | 212,647 | | | Merge Healthcare * | | | 663,459 | |
| | 3,202 | | | Theravance Inc * | | | 108,067 | |
| | 29,758 | | | Threshold Pharmaceuticals * | | | 143,434 | |
| | 20,111 | | | Universal Health Services, Class B | | | 1,339,191 | |
| | 29,416 | | | Vanguard Health Systems * | | | 430,356 | |
| | 49,613 | | | Volcano * | | | 1,006,648 | |
| | 11,598 | | | WellCare Health Plans * | | | 676,279 | |
| | | | | | | | |
| | | | | | | 7,964,847 | |
| | | | | | | | |
| |
| | | | Industrials – 18.61% | |
| | 7,478 | | | Avis Budget Group * | | | 215,666 | |
| | 4,995 | | | Beacon Roofing Supply * | | | 190,459 | |
| | 42,805 | | | Builders FirstSource * | | | 264,963 | |
| | 13,081 | | | Corrections Corp of America | | | 473,532 | |
| | 17,685 | | | CyrusOne | | | 424,263 | |
| | 25,904 | | | Geo Group | | | 970,105 | |
| | 9,782 | | | Herman Miller | | | 245,430 | |
| | 21,772 | | | Hexcel * | | | 664,046 | |
| | 36,815 | | | Kelly Services, Class A | | | 626,591 | |
| | 24,215 | | | Steelcase, Class A | | | 307,530 | |
| | 14,713 | | | Triumph Group | | | 1,175,569 | |
| | 8,801 | | | Woodward | | | 316,748 | |
| | | | | | | | |
| | | | | | | 5,874,902 | |
| | | | | | | | |
| |
| | | | Information Technology – 23.05% | |
| | 3,469 | | | ACI Worldwide * | | | 163,078 | |
| | 48,156 | | | Brightcove * | | | 289,899 | |
| | 6,543 | | | Cardtronics * | | | 183,269 | |
| | 10,039 | | | Fortinet * | | | 180,300 | |
| | 9,570 | | | Fusion-io * | | | 179,725 | |
| | 101,588 | | | Internap Network Services * | | | 810,672 | |
| | 28,596 | | | Liquidity Services * | | | 940,808 | |
| | 37,012 | | | Microsemi * | | | 769,850 | |
| | 37,813 | | | Millennial Media * | | | 262,044 | |
| | 9,242 | | | Netscout Systems * | | | 210,810 | |
| | 6,693 | | | OSI Systems * | | | 383,509 | |
| | 7,290 | | | QLIK Technologies * | | | 189,613 | |
| | 17,985 | | | Riverbed Technology * | | | 267,257 | |
| | 14,695 | | | Skyworks Solutions * | | | 324,319 | |
| | 3,464 | | | Sourcefire * | | | 165,441 | |
| | 13,315 | | | Synchronoss Technologies * | | | 377,347 | |
| | 10,795 | | | TIBCO Software * | | | 209,531 | |
| | 38,759 | | | Vantiv, Class A * | | | 873,240 | |
| | 33,317 | | | WNS Holdings, ADR (Jersey) * | | | 497,756 | |
| | | | | | | | |
| | | | | | | 7,278,468 | |
| | | | | | | | |
| |
| | | | Materials – 3.77% | |
| | 22,052 | | | Boise Cascade * | | | 706,326 | |
| | 4,779 | | | Martin Marietta Materials | | | 482,631 | |
| | | | | | | | |
| | | | | | | 1,188,957 | |
| | | | | | | | |
| | |
| | | | Total Common Stocks
(Cost $30,159,955) | | | 31,312,260 | |
| | | | | | | | |
See accompanying Notes to Financial Statements.
| | |
| |
| ASTON/LMCG Small Cap Growth Fund (formerly, ASTON Small Cap Growth Fund) | | April 30, 2013 |
| |
| Schedule of Investments (unaudited) – continued | | |
| | | | | | | | |
Shares | | | | | Market
Value | |
|
| | WARRANTS – 0.00% | |
| |
| | | | Energy – 0.00% | |
| | 5,997 | | | Magnum Hunter Resources, Expiration 10/14/13 | | $ | 840 | |
| | | | | | | | |
| | |
| | | | Total Warrants
(Cost $—) | | | 840 | |
| | | | | | | | |
|
| | INVESTMENT COMPANY – 2.61% | |
| | |
| | 825,127 | | | BlackRock Liquidity Funds TempCash Portfolio | | | 825,127 | |
| | | | | | | | |
| | |
| | | | Total Investment Company
(Cost $825,127) | | | 825,127 | |
| | | | | | | | |
| Total Investments – 101.79%
(Cost $30,985,082)** | | | 32,138,227 | |
| | | | | | | | |
| Net Other Assets and Liabilities – (1.79)% | | | (564,978 | ) |
| | | | | | | | |
| Net Assets – 100.00% | | $ | 31,573,249 | |
| | | | | | | | |
| * | | Non-income producing security. |
| ** | | At April 30, 2013 cost is identical for book and Federal income tax purposes. |
| | | | |
Gross unrealized appreciation | | $ | 2,130,992 | |
Gross unrealized depreciation | | | (977,847 | ) |
| | | | |
Net unrealized appreciation | | $ | 1,153,145 | |
| | | | |
| ADR | | American Depositary Receipt |
| REIT | | Real Estate Investment Trust |
See accompanying Notes to Financial Statements.
| | |
| |
| ASTON/Silvercrest Small Cap Fund | | April 30, 2013 |
| |
| Schedule of Investments (unaudited) | | |
| | | | | | | | |
Shares | | | | | Market
Value | |
|
| | COMMON STOCKS – 99.07% | |
| | |
| | | | Consumer Discretionary – 11.64% | | | | |
| | 5,382 | | | AFC Enterprises * | | $ | 171,578 | |
| | 6,350 | | | Bob Evans Farms | | | 275,209 | |
| | 2,757 | | | Core-Mark Holding | | | 143,474 | |
| | 6,465 | | | Drew Industries | | | 233,387 | |
| | 12,260 | | | La-Z-Boy | | | 221,416 | |
| | 5,210 | | | Lithia Motors, Class A | | | 257,999 | |
| | 11,000 | | | ReachLocal * | | | 183,370 | |
| | | | | | | | |
| | | | | | | 1,486,433 | |
| | | | | | | | |
| |
| | | | Consumer Staples – 3.82% | |
| | 2,944 | | | J & J Snack Foods | | | 220,859 | |
| | 3,384 | | | Lancaster Colony | | | 267,099 | |
| | | | | | | | |
| | | | | | | 487,958 | |
| | | | | | | | |
| |
| | | | Energy – 5.96% | |
| | 6,750 | | | Bonanza Creek Energy * | | | 231,862 | |
| | 9,260 | | | Forum Energy Technologies * | | | 257,521 | |
| | 6,349 | | | Rosetta Resources * | | | 272,436 | |
| | | | | | | | |
| | | | | | | 761,819 | |
| | | | | | | | |
| |
| | | | Financials – 21.11% | |
| | 12,860 | | | BancorpSouth | | | 205,760 | |
| | 5,678 | | | EastGroup Properties, REIT | | | 358,111 | |
| | 16,398 | | | FirstMerit | | | 280,898 | |
| | 14,174 | | | Horace Mann Educators | | | 319,624 | |
| | 4,534 | | | Iberiabank | | | 206,841 | |
| | 9,873 | | | Independent Bank/Rockland MA | | | 306,458 | |
| | 4,334 | | | Mid-America Apartment Communities, REIT | | | 297,876 | |
| | 8,040 | | | PacWest Bancorp | | | 222,949 | |
| | 5,322 | | | Prosperity Bancshares | | | 244,493 | |
| | 6,668 | | | Protective Life | | | 253,784 | |
| | | | | | | | |
| | | | | | | 2,696,794 | |
| | | | | | | | |
| | | | | | | | |
Shares | | | | | Market
Value | |
| | |
| | | | Healthcare – 8.02% | | | | |
| | 2,867 | | | Analogic | | $ | 227,869 | |
| | 3,134 | | | ICU Medical * | | | 188,824 | |
| | 4,070 | | | Integra LifeSciences Holdings * | | | 142,572 | |
| | 5,680 | | | STERIS | | | 236,231 | |
| | 3,583 | | | West Pharmaceutical Services | | | 228,810 | |
| | | | | | | | |
| | | | | | | 1,024,306 | |
| | | | | | | | |
| |
| | | | Industrials – 21.94% | |
| | 10,305 | | | Altra Holdings | | | 274,628 | |
| | 6,513 | | | Applied Industrial Technologies | | | 275,174 | |
| | 3,388 | | | Astec Industries | | | 111,228 | |
| | 5,970 | | | Beacon Roofing Supply * | | | 227,636 | |
| | 5,606 | | | EMCOR Group | | | 209,664 | |
| | 7,847 | | | Hexcel * | | | 239,334 | |
| | 5,049 | | | Mine Safety Appliances | | | 242,352 | |
| | 5,810 | | | TAL International Group | | | 240,534 | |
| | 2,460 | | | Teledyne Technologies * | | | 184,648 | |
| | 2,706 | | | Tennant | | | 129,401 | |
| | 5,120 | | | United Stationers | | | 166,246 | |
| | 11,029 | | | US Ecology | | | 299,989 | |
| | 4,300 | | | Watts Water Technologies, Class A | | | 202,358 | |
| | | | | | | | |
| | | | | | | 2,803,192 | |
| | | | | | | | |
| |
| | | | Information Technology – 12.21% | |
| | 4,279 | | | ACI Worldwide * | | | 201,156 | |
| | 16,160 | | | Entegris * | | | 153,197 | |
| | 4,590 | | | Fair Isaac | | | 213,802 | |
| | 3,987 | | | FEI | | | 254,690 | |
| | 3,865 | | | Littelfuse | | | 269,854 | |
| | 10,280 | | | M/A-Com Technology Solutions Holdings * | | | 144,228 | |
| | 8,820 | | | Mentor Graphics | | | 161,053 | |
| | 6,005 | | | MKS Instruments | | | 161,354 | |
| | | | | | | | |
| | | | | | | 1,559,334 | |
| | | | | | | | |
| |
| | | | Materials – 8.47% | |
| | 8,780 | | | Chemtura * | | | 186,663 | |
| | 5,502 | | | HB Fuller | | | 208,526 | |
| | 3,137 | | | Innophos Holdings | | | 160,959 | |
| | 15,253 | | | PH Glatfelter | | | 366,072 | |
| | 4,059 | | | Sensient Technologies | | | 159,722 | |
| | | | | | | | |
| | | | | | | 1,081,942 | |
| | | | | | | | |
| |
| | | | Utilities – 5.90% | |
| | 3,902 | | | MGE Energy | | | 217,927 | |
| | 9,009 | | | Portland General Electric | | | 290,540 | |
| | 5,903 | | | UIL Holdings | | | 245,801 | |
| | | | | | | | |
| | | | | | | 754,268 | |
| | | | | | | | |
| | |
| | | | Total Common Stocks
(Cost $11,357,883) | | | 12,656,046 | |
| | | | | | | | |
See accompanying Notes to Financial Statements.
| | |
| |
| ASTON/Silvercrest Small Cap Fund | | April 30, 2013 |
| |
| Schedule of Investments (unaudited) – continued | | |
| | | | | | | | |
Shares | | | | | Market
Value | |
|
| | INVESTMENT COMPANY – 0.54% | |
| | |
| | 68,706 | | | BlackRock Liquidity Funds TempCash Portfolio | | $ | 68,706 | |
| | | | | | | | |
| | |
| | | | Total Investment Company
(Cost $68,706) | | | 68,706 | |
| | | | | | | | |
| Total Investments – 99.61%
(Cost $11,426,589)** | | | 12,724,752 | |
| | | | | | | | |
| Net Other Assets and Liabilities – 0.39% | | | 50,048 | |
| | | | | | | | |
| Net Assets – 100.00% | | $ | 12,774,800 | |
| | | | | | | | |
| * | | Non-income producing security. |
| ** | | At April 30, 2013, cost is identical for book and Federal income tax purposes. |
| | | | |
Gross unrealized appreciation | | $ | 1,422,845 | |
Gross unrealized depreciation | | | (124,682 | ) |
| | | | |
Net unrealized appreciation | | $ | 1,298,163 | |
| | | | |
| REIT | | Real Estate Investment Trust |
See accompanying Notes to Financial Statements.
| | |
| |
| ASTON/TAMRO Small Cap Fund | | April 30, 2013 |
| |
| Schedule of Investments (unaudited) | | |

| | | | | | | | |
Shares | | | | | Market
Value | |
|
| | COMMON STOCKS – 97.87% | |
| | |
| | | | Consumer Discretionary – 19.90% | | | | |
| | 361,053 | | | BJ’s Restaurants * | | $ | 12,384,118 | |
| | 1,158,012 | | | Chico’s FAS | | | 21,156,879 | |
| | 50,109 | | | Coinstar * | | | 2,646,256 | |
| | 1,166,656 | | | EW Scripps (The), Class A * | | | 16,204,852 | |
| | 876,224 | | | Grand Canyon Education * | | | 22,405,048 | |
| | 481,816 | | | Harman International Industries | | | 21,541,993 | |
| | 621,832 | | | MDC Holdings | | | 23,380,883 | |
| | 575,595 | | | Monro Muffler Brake | | | 23,806,609 | |
| | 385,230 | | | Red Robin Gourmet Burgers * | | | 18,633,575 | |
| | 470,563 | | | Tempur-Pedic International * | | | 22,822,306 | |
| | 956,877 | | | Texas Roadhouse | | | 22,486,610 | |
| | 423,378 | | | Zumiez * | | | 12,265,261 | |
| | | | | | | | |
| | | | | | | 219,734,390 | |
| | | | | | | | |
| | |
| | | | Consumer Staples – 8.60% | | | | |
| | 1,972,677 | | | Cott (Canada) | | | 21,600,813 | |
| | 351,312 | | | Sanderson Farms | | | 21,521,373 | |
| | 526,653 | | | Tootsie Roll Industries | | | 16,447,373 | |
| | 205,444 | | | TreeHouse Foods * | | | 13,088,837 | |
| | 446,760 | | | United Natural Foods * | | | 22,311,194 | |
| | | | | | | | |
| | | | | | | 94,969,590 | |
| | | | | | | | |
| | |
| | | | Energy – 5.55% | | | | |
| | 1,057,435 | | | Cloud Peak Energy * | | | 20,662,280 | |
| | 1,137,912 | | | Precision Drilling (Canada) | | | 9,217,087 | |
| | 215,372 | | | SEACOR Holdings | | | 15,530,475 | |
| | 376,311 | | | Unit * | | | 15,816,351 | |
| | | | | | | | |
| | | | | | | 61,226,193 | |
| | | | | | | | |
| | |
| | | | Financials – 21.46% | | | | |
| | 711,086 | | | Bank of the Ozarks | | | 29,104,750 | |
| | 737,976 | | | Colony Financial, REIT | | | 16,456,865 | |
| | 457,927 | | | First Cash Financial Services * | | | 23,569,503 | |
| | | | | | | | |
Shares | | | | | Market
Value | |
| | |
| | | | Financials (continued) | | | | |
| | 1,002,957 | | | FirstMerit | | $ | 17,180,653 | |
| | 1,369,872 | | | Glacier Bancorp | | | 25,274,138 | |
| | 420,905 | | | Greenhill | | | 19,441,602 | |
| | 816,825 | | | LaSalle Hotel Properties, REIT | | | 21,180,272 | |
| | 173,054 | | | Portfolio Recovery Associates * | | | 21,242,378 | |
| | 1,334,917 | | | Redwood Trust, REIT | | | 30,462,806 | |
| | 495,494 | | | Stifel Financial * | | | 15,964,817 | |
| | 397,614 | | | Waddell & Reed Financial, Class A | | | 17,045,712 | |
| | | | | | | | |
| | | | | | | 236,923,496 | |
| | | | | | | | |
| | |
| | | | Healthcare – 12.70% | | | | |
| | 285,244 | | | Analogic | | | 22,671,193 | |
| | 259,139 | | | Athenahealth * | | | 24,944,720 | |
| | 419,899 | | | Cepheid * | | | 16,010,749 | |
| | 1,222,780 | | | DexCom * | | | 20,065,820 | |
| | 1,337,376 | | | Health Management Associates, Class A * | | | 15,366,450 | |
| | 813,157 | | | HMS Holdings * | | | 20,499,688 | |
| | 264,254 | | | Teleflex | | | 20,646,165 | |
| | | | | | | | |
| | | | | | | 140,204,785 | |
| | | | | | | | |
| | |
| | | | Industrials – 17.80% | | | | |
| | 447,105 | | | Advisory Board * | | | 21,975,211 | |
| | 97,854 | | | Chart Industries * | | | 8,298,998 | |
| | 583,421 | | | Colfax * | | | 27,228,258 | |
| | 361,223 | | | Corporate Executive Board | | | 20,358,528 | |
| | 558,610 | | | Franklin Electric | | | 18,082,206 | |
| | 371,811 | | | Landstar System | | | 20,323,189 | |
| | 294,694 | | | Morningstar | | | 19,452,751 | |
| | 172,764 | | | Raven Industries | | | 5,796,232 | |
| | 956,331 | | | Titan International | | | 21,335,745 | |
| | 1,318,922 | | | US Airways Group * | | | 22,289,782 | |
| | 107,762 | | | Wabtec | | | 11,308,544 | |
| | | | | | | | |
| | | | | | | 196,449,444 | |
| | | | | | | | |
| | |
| | | | Information Technology – 8.92% | | | | |
| | 838,024 | | | Aruba Networks * | | | 18,847,160 | |
| | 606,646 | | | Cavium * | | | 19,079,017 | |
| | 310,670 | | | CommVault Systems * | | | 22,846,672 | |
| | 679,442 | | | Ixia * | | | 11,190,410 | |
| | 374,682 | | | Netgear * | | | 11,161,777 | |
| | 370,460 | | | Power Integrations | | | 15,340,749 | |
| | | | | | | | |
| | | | | | | 98,465,785 | |
| | | | | | | | |
| | |
| | | | Materials – 1.11% | | | | |
| | 374,039 | | | LSB Industries * | | | 12,216,114 | |
| | | | | | | | |
| | |
| | | | Utilities – 1.83% | | | | |
| | 453,402 | | | Northwest Natural Gas | | | 20,162,787 | |
| | | | | | | | |
| | |
| | | | Total Common Stocks
(Cost $768,355,024) | | | 1,080,352,584 | |
| | | | | | | | |
See accompanying Notes to Financial Statements.
| | |
| |
| ASTON/TAMRO Small Cap Fund | | April 30, 2013 |
| |
| Schedule of Investments (unaudited) – continued | | |
| | | | | | | | |
Shares | | | | | Market
Value | |
|
| | INVESTMENT COMPANY – 1.67% | |
| | |
| | 18,427,872 | | | BlackRock Liquidity Funds TempCash Portfolio | | $ | 18,427,872 | |
| | | | | | | | |
| | |
| | | | Total Investment Company
(Cost $18,427,872) | | | 18,427,872 | |
| | | | | | | | |
| Total Investments – 99.54%
(Cost $786,782,896)** | | | 1,098,780,456 | |
| | | | | | | | |
| Net Other Assets and Liabilities – 0.46% | | | 5,082,521 | |
| | | | | | | | |
| Net Assets – 100.00% | | $ | 1,103,862,977 | |
| | | | | | | | |
| * | | Non-income producing security. |
| ** | | At April 30, 2013, cost is identical for book and Federal income tax purposes. |
| | | | |
Gross unrealized appreciation | | $ | 319,747,494 | |
Gross unrealized depreciation | | | (7,749,934 | ) |
| | | | |
Net unrealized appreciation | | $ | 311,997,560 | |
| | | | |
| REIT | | Real Estate Investment Trust |
See accompanying Notes to Financial Statements.
| | |
| |
| ASTON/River Road Select Value Fund | | April 30, 2013 |
| |
| Schedule of Investments (unaudited) | | |
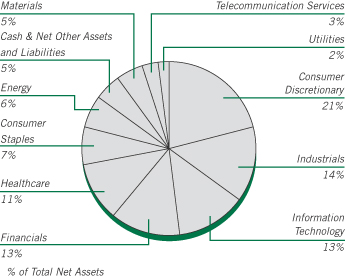
| | | | | | | | |
Shares | | | | | Market
Value | |
|
| | COMMON STOCKS – 94.79% | |
| | |
| | | | Consumer Discretionary – 20.99% | | | | |
| | 33,040 | | | Abercrombie & Fitch, Class A | | $ | 1,637,462 | |
| | 228,500 | | | Ascena Retail Group * | | | 4,227,250 | |
| | 2,780 | | | Ascent Capital Group, Class A * | | | 184,842 | |
| | 180,450 | | | Big Lots * | | | 6,571,989 | |
| | 104,210 | | | Bob Evans Farms | | | 4,516,461 | |
| | 111,600 | | | DreamWorks Animation SKG, Class A * | | | 2,151,648 | |
| | 93,930 | | | Fred’s, Class A | | | 1,336,624 | |
| | 82,390 | | | International Speedway, Class A | | | 2,708,159 | |
| | 47,890 | | | Jos A Bank Clothiers * | | | 2,091,835 | |
| | 46,850 | | | Madison Square Garden, Class A * | | | 2,823,650 | |
| | 175,160 | | | Pep Boys - Manny, Moe & Jack * | | | 2,031,856 | |
| | 82,950 | | | Regis | | | 1,555,313 | |
| | 141,630 | | | Rent-A-Center | | | 4,947,136 | |
| | 41,760 | | | Starz - Liberty Capital * | | | 976,349 | |
| | 78,320 | | | Texas Roadhouse | | | 1,840,520 | |
| | 77,260 | | | True Religion Apparel | | | 2,090,656 | |
| | | | | | | | |
| | | | | | | 41,691,750 | |
| | | | | | | | |
| |
| | | | Consumer Staples – 6.68% | |
| | 203,330 | | | Harris Teeter Supermarkets | | | 8,497,161 | |
| | 45,700 | | | Industrias Bachoco, SP ADR (Mexico) | | | 1,554,713 | |
| | 7,556 | | | J & J Snack Foods | | | 566,851 | |
| | 75,100 | | | Village Super Market, Class A | | | 2,643,520 | |
| | | | | | | | |
| | | | | | | 13,262,245 | |
| | | | | | | | |
| |
| | | | Energy – 6.34% | |
| | 119,900 | | | Cloud Peak Energy * | | | 2,342,846 | |
| | 53,910 | | | Energen | | | 2,556,412 | |
| | 231,209 | | | Miller Energy Resources * | | | 878,594 | |
| | 101,950 | | | Ocean Rig UDW * | | | 1,669,941 | |
| | 134,890 | | | Resolute Energy * | | | 1,243,686 | |
| | 157,520 | | | Tetra Technologies * | | | 1,438,158 | |
| | 146,230 | | | Vaalco Energy * | | | 982,666 | |
| | | | | | | | |
Shares | | | | | Market
Value | |
| | |
| | | | Energy (continued) | | | | |
| | 94,440 | | | WPX Energy * | | $ | 1,476,097 | |
| | | | | | | | |
| | | | | | | 12,588,400 | |
| | | | | | | | |
| |
| | | | Financials – 13.03% | |
| | 8,595 | | | Alleghany * | | | 3,384,195 | |
| | 18,196 | | | Capital Southwest | | | 2,141,487 | |
| | 21,978 | | | Commerce Bancshares | | | 881,538 | |
| | 103,800 | | | Dime Community Bancshares | | | 1,481,226 | |
| | 35,790 | | | FirstService (Canada) * | | | 1,180,712 | |
| | 139,280 | | | Hilltop Holdings * | | | 1,864,959 | |
| | 24,040 | | | Navigators Group * | | | 1,391,435 | |
| | 136,300 | | | PICO Holdings * | | | 2,957,710 | |
| | 158,106 | | | Tower Group | | | 2,991,366 | |
| | 13,155 | | | White Mountains Insurance Group | | | 7,607,668 | |
| | | | | | | | |
| | | | | | | 25,882,296 | |
| | | | | | | | |
| |
| | | | Healthcare – 10.90% | |
| | 96,517 | | | Ensign Group | | | 3,365,548 | |
| | 57,980 | | | Hill-Rom Holdings | | | 1,975,379 | |
| | 62,290 | | | ICU Medical * | | | 3,752,973 | |
| | 291,980 | | | Nordion (Canada) | | | 2,046,780 | |
| | 139,420 | | | Owens & Minor | | | 4,540,909 | |
| | 93,000 | | | Quality Systems | | | 1,661,910 | |
| | 103,470 | | | STERIS | | | 4,303,317 | |
| | | | | | | | |
| | | | | | | 21,646,816 | |
| | | | | | | | |
| |
| | | | Industrials – 13.95% | |
| | 131,900 | | | Aircastle (Bermuda) | | | 1,841,324 | |
| | 22,880 | | | Brink’s | | | 606,549 | |
| | 51,960 | | | Cubic | | | 2,232,721 | |
| | 41,090 | | | Forward Air | | | 1,515,810 | |
| | 125,584 | | | Geo Group | | | 4,703,121 | |
| | 166,790 | | | Heartland Express | | | 2,263,340 | |
| | 110,220 | | | Insperity | | | 3,045,379 | |
| | 69,660 | | | John Bean Technologies | | | 1,444,748 | |
| | 92,810 | | | Korn/Ferry International * | | | 1,536,005 | |
| | 72,840 | | | Layne Christensen * | | | 1,488,121 | |
| | 108,633 | | | Standard Parking * | | | 2,334,523 | |
| | 51,530 | | | Unifirst | | | 4,691,807 | |
| | | | | | | | |
| | | | | | | 27,703,448 | |
| | | | | | | | |
| |
| | | | Information Technology – 13.10% | |
| | 177,580 | | | Convergys | | | 3,022,412 | |
| | 138,870 | | | CSG Systems International * | | | 3,000,981 | |
| | 98,320 | | | Daktronics | | | 982,217 | |
| | 96,090 | | | DST Systems | | | 6,644,623 | |
| | 38,210 | | | Heartland Payment Systems | | | 1,256,727 | |
| | 47,060 | | | Ituran Location and Control (Israel) | | | 751,078 | |
| | 27,410 | | | j2 Global | | | 1,115,587 | |
| | 35,400 | | | Lexmark International, Class A | | | 1,072,974 | |
| | 118,930 | | | NeuStar, Class A * | | | 5,217,459 | |
| | 125,180 | | | Total System Services | | | 2,956,752 | |
| | | | | | | | |
| | | | | | | 26,020,810 | |
| | | | | | | | |
| |
| | | | Materials – 5.16% | |
| | 324,550 | | | AuRico Gold (Canada) | | | 1,677,923 | |
| | 26,410 | | | Buckeye Technologies | | | 992,752 | |
See accompanying Notes to Financial Statements.
| | |
| |
| ASTON/River Road Select Value Fund | | April 30, 2013 |
| |
| Schedule of Investments (unaudited) – continued | | |
| | | | | | | | |
Shares | | | | | Market
Value | |
| | |
| | | | Materials (continued) | | | | |
| | 31,070 | | | Innophos Holdings | | $ | 1,594,202 | |
| | 129,040 | | | Intrepid Potash | | | 2,375,626 | |
| | 87,790 | | | Kraton Performance Polymers * | | | 1,993,711 | |
| | 123,270 | | | Pan American Silver (Canada) | | | 1,627,164 | |
| | | | | | | | |
| | | | | | | 10,261,378 | |
| | | | | | | | |
| |
| | | | Telecommunication Services – 2.49% | |
| | 53,400 | | | Atlantic Tele-Network | | | 2,711,118 | |
| | 99,810 | | | Telephone & Data Systems | | | 2,239,736 | |
| | | | | | | | |
| | | | | | | 4,950,854 | |
| | | | | | | | |
| |
| | | | Utilities – 2.15% | |
| | 55,670 | | | Avista | | | 1,561,543 | |
| | 43,090 | | | National Fuel Gas | | | 2,702,605 | |
| | | | | | | | |
| | | | | | | 4,264,148 | |
| | | | | | | | |
| | |
| | | | Total Common Stocks
(Cost $157,306,686) | | | 188,272,145 | |
| | | | | | | | |
|
| | INVESTMENT COMPANY – 5.89% | |
| | |
| | 11,694,394 | | | BlackRock Liquidity Funds TempCash Portfolio | | | 11,694,394 | |
| | | | | | | | |
| | |
| | | | Total Investment Company
(Cost $11,694,394) | | | 11,694,394 | |
| | | | | | | | |
| Total Investments – 100.68%
(Cost $169,001,080)** | | | 199,966,539 | |
| | | | | | | | |
| Net Other Assets and Liabilities – (0.68)% | | | (1,358,304 | ) |
| | | | | | | | |
| Net Assets – 100.00% | | $ | 198,608,235 | |
| | | | | | | | |
| * | | Non-income producing security. |
| ** | | At April 30, 2013, cost is identical for book and Federal income tax purposes. |
| | | | |
Gross unrealized appreciation | | $ | 33,413,868 | |
Gross unrealized depreciation | | | (2,448,409 | ) |
| | | | |
Net unrealized appreciation | | $ | 30,965,459 | |
| | | | |
| SP ADR | | Sponsored American Depositary Receipt |
See accompanying Notes to Financial Statements.
| | |
| |
| ASTON/River Road Small Cap Value Fund | | April 30, 2013 |
| |
| Schedule of Investments (unaudited) | | |
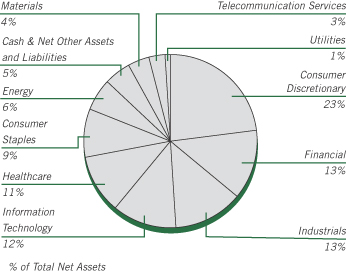
| | | | | | | | |
Shares | | | | | Market
Value | |
|
| | COMMON STOCKS – 94.75% | |
| | |
| | | | Consumer Discretionary – 23.32% | | | | |
| | 45,280 | | | Abercrombie & Fitch, Class A | | $ | 2,244,077 | |
| | 382,768 | | | Ascena Retail Group * | | | 7,081,208 | |
| | 4,580 | | | Ascent Capital Group, Class A * | | | 304,524 | |
| | 304,010 | | | Big Lots * | | | 11,072,044 | |
| | 179,500 | | | Bob Evans Farms | | | 7,779,530 | |
| | 185,390 | | | DreamWorks Animation SKG, Class A * | | | 3,574,319 | |
| | 176,798 | | | Fred’s, Class A | | | 2,515,836 | |
| | 136,850 | | | International Speedway, Class A | | | 4,498,260 | |
| | 79,110 | | | Jos A Bank Clothiers * | | | 3,455,525 | |
| | 422,521 | | | Mac-Gray (a) | | | 5,471,647 | |
| | 67,390 | | | Madison Square Garden, Class A * | | | 4,061,595 | |
| | 164,879 | | | Monarch Casino & Resort * | | | 2,121,993 | |
| | 301,380 | | | Motorcar Parts of America * (a) | | | 1,802,252 | |
| | 290,420 | | | Pep Boys - Manny, Moe & Jack * | | | 3,368,872 | |
| | 138,310 | | | Regis | | | 2,593,313 | |
| | 236,409 | | | Rent-A-Center | | | 8,257,766 | |
| | 128,530 | | | Texas Roadhouse | | | 3,020,455 | |
| | 126,730 | | | True Religion Apparel | | | 3,429,314 | |
| | | | | | | | |
| | | | | | | 76,652,530 | |
| | | | | | | | |
| | |
| | | | Consumer Staples – 8.51% | | | | |
| | 339,439 | | | Harris Teeter Supermarkets | | | 14,185,156 | |
| | 129,870 | | | Industrias Bachoco, SP ADR (Mexico) | | | 4,418,177 | |
| | 159,660 | | | Ingles Markets, Class A | | | 3,403,951 | |
| | 168,796 | | | Village Super Market, Class A | | | 5,941,619 | |
| | | | | | | | |
| | | | | | | 27,948,903 | |
| | | | | | | | |
| | |
| | | | Energy – 6.29% | | | | |
| | 199,290 | | | Cloud Peak Energy * | | | 3,894,127 | |
| | 558,393 | | | Evolution Petroleum * | | | 5,550,426 | |
| | 568,758 | | | Miller Energy Resources * | | | 2,161,280 | |
| | 168,810 | | | Ocean Rig UDW * | | | 2,765,108 | |
| | 250,350 | | | Resolute Energy * | | | 2,308,227 | |
| | | | | | | | |
Shares | | | | | Market
Value | |
| | |
| | | | Energy (continued) | | | | |
| | 258,289 | | | Tetra Technologies * | | $ | 2,358,179 | |
| | 244,795 | | | Vaalco Energy * | | | 1,645,022 | |
| | | | | | | | |
| | | | | | | 20,682,369 | |
| | | | | | | | |
| | |
| | | | Financials – 12.67% | | | | |
| | 33,577 | | | Capital Southwest | | | 3,951,677 | |
| | 229,952 | | | Dime Community Bancshares | | | 3,281,415 | |
| | 22,155 | | | First Citizens BancShares, Class A | | | 4,130,135 | |
| | 236,700 | | | Hilltop Holdings * | | | 3,169,413 | |
| | 44,597 | | | Navigators Group * | | | 2,581,274 | |
| | 223,370 | | | PICO Holdings * | | | 4,847,129 | |
| | 284,470 | | | SWS Group * | | | 1,618,634 | |
| | 35,578 | | | Tompkins Financial | | | 1,487,160 | |
| | 261,780 | | | Tower Group | | | 4,952,878 | |
| | 20,108 | | | White Mountains Insurance Group | | | 11,628,657 | |
| | | | | | | | |
| | | | | | | 41,648,372 | |
| | | | | | | | |
| | |
| | | | Healthcare – 10.86% | | | | |
| | 156,422 | | | Ensign Group | | | 5,454,435 | |
| | 86,990 | | | Hill-Rom Holdings | | | 2,963,749 | |
| | 104,743 | | | ICU Medical * | | | 6,310,766 | |
| | 459,620 | | | Nordion (Canada) * | | | 3,221,936 | |
| | 234,800 | | | Owens & Minor | | | 7,647,436 | |
| | 155,210 | | | Quality Systems | | | 2,773,603 | |
| | 176,080 | | | STERIS | | | 7,323,167 | |
| | | | | | | | |
| | | | | | | 35,695,092 | |
| | | | | | | | |
| | |
| | | | Industrials – 12.92% | | | | |
| | 215,420 | | | Aircastle (Bermuda) | | | 3,007,263 | |
| | 67,026 | | | Cubic | | | 2,880,107 | |
| | 65,690 | | | Forward Air | | | 2,423,304 | |
| | 222,785 | | | Geo Group | | | 8,343,298 | |
| | 278,430 | | | Heartland Express | | | 3,778,295 | |
| | 182,348 | | | Insperity | | | 5,038,275 | |
| | 153,670 | | | Korn/Ferry International * | | | 2,543,239 | |
| | 115,570 | | | Layne Christensen * | | | 2,361,095 | |
| | 193,369 | | | Standard Parking * | | | 4,155,500 | |
| | 87,033 | | | Unifirst | | | 7,924,355 | |
| | | | | | | | |
| | | | | | | 42,454,731 | |
| | | | | | | | |
| | |
| | | | Information Technology – 12.45% | | | | |
| | 79,331 | | | Computer Services | | | 2,340,265 | |
| | 297,110 | | | Convergys | | | 5,056,812 | |
| | 231,760 | | | CSG Systems International * | | | 5,008,334 | |
| | 169,670 | | | Daktronics | | | 1,695,003 | |
| | 146,807 | | | DST Systems | | | 10,151,704 | |
| | 178,973 | | | Electro Rent | | | 2,965,583 | |
| | 63,100 | | | Heartland Payment Systems | | | 2,075,359 | |
| | 89,570 | | | Ituran Location and Control (Israel) | | | 1,429,537 | |
| | 59,590 | | | Lexmark International, Class A | | | 1,806,173 | |
| | 190,920 | | | NeuStar, Class A * | | | 8,375,660 | |
| | | | | | | | |
| | | | | | | 40,904,430 | |
| | | | | | | | |
| | |
| | | | Materials – 4.24% | | | | |
| | 404,800 | | | AuRico Gold (Canada) | | | 2,092,817 | |
| | 50,880 | | | Innophos Holdings | | | 2,610,653 | |
See accompanying Notes to Financial Statements.
| | |
| |
| ASTON/River Road Small Cap Value Fund | | April 30, 2013 |
| |
| Schedule of Investments (unaudited) – continued | | |
| | | | | | | | |
Shares | | | | | Market
Value | |
| | |
| | | | Materials (continued) | | | | |
| | 211,530 | | | Intrepid Potash | | $ | 3,894,267 | |
| | 146,030 | | | Kraton Performance Polymers * | | | 3,316,341 | |
| | 153,820 | | | Pan American Silver (Canada) | | | 2,030,424 | |
| | | | | | | | |
| | | | | | | 13,944,502 | |
| | | | | | | | |
| |
| | | | Telecommunication Services – 2.73% | |
| | 88,260 | | | Atlantic Tele-Network | | | 4,480,961 | |
| | 72,700 | | | Starz - Liberty Capital * | | | 1,699,726 | |
| | 124,300 | | | Telephone & Data Systems | | | 2,789,292 | |
| | | | | | | | |
| | | | | | | 8,969,979 | |
| | | | | | | | |
| | |
| | | | Utilities – 0.76% | | | | |
| | 89,030 | | | Avista | | | 2,497,292 | |
| | | | | | | | |
| | |
| | | | Total Common Stocks
(Cost $227,015,149) | | | 311,398,200 | |
| | | | | | | | |
|
| | INVESTMENT COMPANY – 5.10% | |
| | |
| | 16,779,073 | | | BlackRock Liquidity Funds TempFund Portfolio | | | 16,779,073 | |
| | | | | | | | |
| | |
| | | | Total Investment Company
(Cost $16,779,073) | | | 16,779,073 | |
| | | | | | | | |
| Total Investments – 99.85%
(Cost $243,794,222)** | | | 328,177,273 | |
| | | | | | | | |
| Net Other Assets and Liabilities – 0.15% | | | 481,506 | |
| | | | | | | | |
| Net Assets – 100.00% | | $ | 328,658,779 | |
| | | | | | | | |
| * | | Non-income producing security. |
| ** | | At April 30, 2013, cost is identical for book and Federal income tax purposes. |
| | | | |
Gross unrealized appreciation | | $ | 87,982,529 | |
Gross unrealized depreciation | | | (3,599,478 | ) |
| | | | |
Net unrealized appreciation | | $ | 84,383,051 | |
| | | | |
| (a) | | These securities have been determined by the Subadviser to be illiquid securities. At April 30, 2013, these securities amounted to $7,273,899 or 2.21% of net assets. |
| ADR | | American Depositary Receipt |
| SP ADR | | Sponsored American Depositary Receipt |
See accompanying Notes to Financial Statements.
| | |
| |
| ASTON/River Road Independent Value Fund | | April 30, 2013 |
| |
| Schedule of Investments (unaudited) | | |
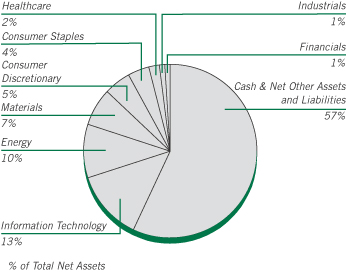
| | | | | | | | |
Shares | | | | | Market
Value | |
|
| | COMMON STOCKS – 43.08% | |
| | |
| | | | Consumer Discretionary – 4.70% | | | | |
| | 767,937 | | | Aaron’s * | | $ | 22,047,472 | |
| | 213,528 | | | American Greetings, Class A | | | 3,937,456 | |
| | 220,433 | | | Big Lots * | | | 8,028,170 | |
| | | | | | | | |
| | | | | | | 34,013,098 | |
| | | | | | | | |
| | |
| | | | Consumer Staples – 4.32% | | | | |
| | 376,317 | | | Harris Teeter Supermarkets | | | 15,726,287 | |
| | 80,857 | | | Oil-Dri Corporation of America | | | 2,224,376 | |
| | 317,700 | | | Weis Markets | | | 13,289,391 | |
| | | | | | | | |
| | | | | | | 31,240,054 | |
| | | | | | | | |
| | |
| | | | Energy – 9.81% | | | | |
| | 372,709 | | | Bill Barrett * | | | 7,402,001 | |
| | 191,612 | | | Contango Oil & Gas | | | 7,208,443 | |
| | 336,886 | | | QEP Resources | | | 9,671,997 | |
| | 79,591 | | | Tidewater | | | 4,174,548 | |
| | 193,201 | | | Unit * | | | 8,120,238 | |
| | 2,197,681 | | | WPX Energy * | | | 34,349,754 | |
| | | | | | | | |
| | | | | | | 70,926,981 | |
| | | | | | | | |
| | |
| | | | Financials – 0.79% | | | | |
| | 236,145 | | | Baldwin & Lyons, Class B (a) | | | 5,738,324 | |
| | | | | | | | |
| | |
| | | | Healthcare – 1.82% | | | | |
| | 404,513 | | | Owens & Minor | | | 13,174,988 | |
| | | | | | | | |
| | |
| | | | Industrials – 1.07% | | | | |
| | 430,628 | | | Orbital Sciences * | | | 7,759,917 | |
| | | | | | | | |
| | | | | | | | |
Shares | | | | | Market
Value | |
| | |
| | | | Information Technology – 13.10% | | | | |
| | 445,653 | | | Benchmark Electronics * | | $ | 7,950,450 | |
| | 1,051,100 | | | CSG Systems International * | | | 22,714,271 | |
| | 941,551 | | | EPIQ Systems | | | 13,153,467 | |
| | 671,099 | | | FLIR Systems | | | 16,314,417 | |
| | 444,118 | | | Mantech International, Class A | | | 11,853,509 | |
| | 1,480,074 | | | Sykes Enterprises * | | | 22,778,339 | |
| | | | | | | | |
| | | | | | | 94,764,453 | |
| | | | | | | | |
| | |
| | | | Materials – 6.92% | | | | |
| | 4,605,944 | | | AuRico Gold (Canada) | | | 23,812,730 | |
| | 1,647,974 | | | Pan American Silver (Canada) | | | 21,753,257 | |
| | 633,655 | | | Silver Standard Resources (Canada) * | | | 4,524,297 | |
| | | | | | | | |
| | | | | | | 50,090,284 | |
| | | | | | | | |
| | |
| | | | Utilities – 0.55% | | | | |
| | 167,487 | | | Artesian Resources, Class A | | | 3,947,669 | |
| | | | | | | | |
| | |
| | | | Total Common Stocks
(Cost $309,814,956) | | | 311,655,768 | |
| | | | | | | | |
|
| | INVESTMENT COMPANY – 57.59% | |
| | |
| | 416,693,043 | | | BlackRock Liquidity Funds Treasury Trust Fund Portfolio | | | 416,693,043 | |
| | | | | | | | |
| | |
| | | | Total Investment Company
(Cost $416,693,043) | | | 416,693,043 | |
| | | | | | | | |
| Total Investments – 100.67%
(Cost $726,507,999)** | | | 728,348,811 | |
| | | | | | | | |
| Net Other Assets and Liabilities – (0.67)% | | | (4,864,919 | ) |
| | | | | | | | |
| Net Assets – 100.00% | | $ | 723,483,892 | |
| | | | | | | | |
| * | | Non-income producing security. |
| ** | | At April 30, 2013, cost is identical for book and Federal income tax purposes. |
| | | | |
Gross unrealized appreciation | | $ | 23,658,245 | |
Gross unrealized depreciation | | | (21,817,433 | ) |
| | | | |
Net unrealized appreciation | | $ | 1,840,812 | |
| | | | |
| (a) | | This security has been determined by the Subadviser to be an illiquid security. At April 30, 2013, this security amounted to $5,738,324 or 0.79% of net assets. |
See accompanying Notes to Financial Statements.
| | |
| |
| ASTON/DoubleLine Core Plus Fixed Income Fund | | April 30, 2013 |
| |
| Schedule of Investments (unaudited) | | |
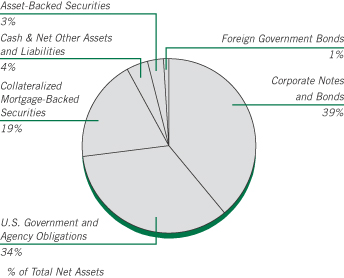
| | | | | | | | |
Par Value | | | | | Market
Value | |
|
| | CORPORATE NOTES AND BONDS – 38.89% | |
| | |
| | | | Consumer Discretionary – 2.20% | | | | |
| | $ 350,000 | | | ADT
Senior Unsecured Notes
3.500%, 07/15/22 | | $ | 352,511 | |
| | 700,000 | | | Cosan Luxembourg SA (Luxembourg)
5.000%, 03/14/23 (c) | | | 714,700 | |
| | 490,000 | | | Daimler Finance North America
1.950%, 03/28/14 (c) | | | 494,986 | |
| | 465,000 | | | DIRECTV Holdings
5.000%, 03/01/21 | | | 530,549 | |
| | 550,000 | | | Ford Motor
Senior Unsecured Notes
7.450%, 07/16/31 | | | 735,216 | |
| | 400,000 | | | Macy’s Retail Holdings
2.875%, 02/15/23 | | | 397,524 | |
| | 325,000 | | | Mattel
Senior Unsecured Notes
2.500%, 11/01/16 | | | 339,382 | |
| | 100,000 | | | Prime Holdings Labuan (Malaysia)
5.375%, 09/22/14 | | | 104,709 | |
| | 325,000 | | | Teva Pharmaceutical Finance Co BV (Cook Islands)
2.950%, 12/18/22 | | | 332,451 | |
| | 325,000 | | | Time Warner Cable
5.000%, 02/01/20 | | | 375,827 | |
| | 375,000 | | | 4.500%, 09/15/42 | | | 358,558 | |
| | 300,000 | | | Wynn Las Vegas
7.750%, 08/15/20 | | | 345,000 | |
| | | | | | | | |
| | | | | | | 5,081,413 | |
| | | | | | | | |
| | |
| | | | Consumer Staples – 2.57% | | | | |
| | 700,000 | | | Altria Group
2.850%, 08/09/22 | | | 700,095 | |
| | | | | | | | |
Par Value | | | | | Market
Value | |
| | |
| | | | Consumer Staples (continued) | | | | |
| | $ 400,000 | | | Anadolu Efes Biracilik Ve Malt Sanayii AS (Turkey)
Senior Unsecured Notes
3.375%, 11/01/22 (c) | | $ | 395,000 | |
| | 350,000 | | | Coca-Cola
Senior Unsecured Notes
1.800%, 09/01/16 | | | 362,840 | |
| | 275,000 | | | ConAgra Foods
Senior Unsecured Notes
3.200%, 01/25/23 | | | 281,838 | |
| | 100,000 | | | Corp Lindley (Peru)
Senior Unsecured Notes
6.750%, 11/23/21 (c) | | | 117,250 | |
| | 300,000 | | | Corp Lindley SA (Peru)
Senior Unsecured Notes
4.625%, 04/12/23 (c) | | | 305,250 | |
| | 100,000 | | | Corp Pesquera Inca (Peru)
9.000%, 02/10/17 (c) | | | 108,300 | |
| | 200,000 | | | 9.000%, 02/10/17 | | | 216,600 | |
| | 375,000 | | | Diageo Capital (United Kingdom)
1.500%, 05/11/17 | | | 382,657 | |
| | 120,000 | | | Gruma (Mexico)
Senior Unsecured Notes
7.750%, 12/29/49 | | | 121,200 | |
| | 400,000 | | | IOI Investment L Bhd (Malaysia)
4.375%, 06/27/22 | | | 419,135 | |
| | 70,000 | | | JBS USA
Senior Unsecured Notes
7.250%, 06/01/21 | | | 74,550 | |
| | 268,000 | | | Kellogg
Senior Unsecured Notes
7.450%, 04/01/31 | | | 375,224 | |
| | 290,000 | | | Kraft Foods
Senior Unsecured Notes
5.375%, 02/10/20 | | | 347,445 | |
| | 625,000 | | | Kroger
Senior Unsecured Notes
3.400%, 04/15/22 | | | 661,316 | |
| | 330,000 | | | Tyson Foods
4.500%, 06/15/22 | | | 366,070 | |
| | 650,000 | | | Wal-Mart Stores
Senior Unsecured Notes
3.250%, 10/25/20 | | | 712,419 | |
| | | | | | | | |
| | | | | | | 5,947,189 | |
| | | | | | | | |
| | |
| | | | Energy – 5.20% | | | | |
| | 220,000 | | | BP Capital Markets (United Kingdom)
4.750%, 03/10/19 | | | 256,812 | |
| | 100,000 | | | 2.500%, 11/06/22 | | | 99,849 | |
| | 200,000 | | | CNPC General Capital (Virgin Islands)
3.400%, 04/16/23 (c) | | | 202,565 | |
| | 275,000 | | | ConocoPhillips
6.500%, 02/01/39 | | | 382,685 | |
| | 200,000 | | | Devon Energy
Senior Unsecured Notes
6.300%, 01/15/19 | | | 241,894 | |
| | 425,000 | | | 4.000%, 07/15/21 | | | 462,133 | |
See accompanying Notes to Financial Statements.
| | |
| |
| ASTON/DoubleLine Core Plus Fixed Income Fund | | April 30, 2013 |
| |
| Schedule of Investments (unaudited) – continued | | |
| | | | | | | | |
Par Value | | | | | Market
Value | |
| | |
| | | | Energy (continued) | | | | |
| | $ 270,000 | | | Halliburton
Senior Unsecured Notes
6.150%, 09/15/19 | | $ | 341,813 | |
| | 225,000 | | | Kinder Morgan Energy Partners
Senior Unsecured Notes
6.950%, 01/15/38 | | | 297,739 | |
| | 75,000 | | | 6.500%, 09/01/39 | | | 95,545 | |
| | 325,000 | | | Marathon Petroleum
Senior Secured Notes
5.125%, 03/01/21 | | | 384,590 | |
| | 800,000 | | | Novatek OAO Via Novatek Finance (Iran)
Senior Unsecured Notes
5.326%, 02/03/16 | | | 865,000 | |
| | 326,000 | | | ONEOK Partners
6.125%, 02/01/41 | | | 400,553 | |
| | 215,000 | | | Pacific Rubiales Energy (Canada)
7.250%, 12/12/21 (c) | | | 246,175 | |
| | 1,200,000 | | | 7.250%, 12/12/21 | | | 1,374,000 | |
| | 580,000 | | | Pemex Project Funding Master Trust 6.625%, 06/15/35 | | | 733,154 | |
| | 400,000 | | | Petroleos Mexicanos (Mexico)
3.500%, 01/30/23 (c) | | | 408,000 | |
| | 200,000 | | | 6.625%, 09/28/99 | | | 214,700 | |
| | 325,000 | | | Phillips 66
5.875%, 05/01/42 | | | 402,546 | |
| | 250,000 | | | Reliance Holdings USA
5.400%, 02/14/22 (c) | | | 282,315 | |
| | | | Sibur Securities (Iran) | | | | |
| | 600,000 | | | 3.914%, 01/31/18 | | | 592,650 | |
| | 400,000 | | | 3.914%, 01/31/18 (c) | | | 395,100 | |
| | 325,000 | | | Transocean (Cayman Islands)
6.000%, 03/15/18 | | | 376,146 | |
| | 1,000,000 | | | Transportadora de Gas Internacional SA ESP (Colombia)
Senior Unsecured Notes
5.700%, 03/20/22 | | | 1,107,500 | |
| | 700,000 | | | Tupras Turkiye Petrol Rafinerileri
AS (Turkey)
Senior Unsecured Notes
4.125%, 05/02/18 (c) | | | 719,922 | |
| | 700,000 | | | 4.125%, 05/02/18 | | | 719,922 | |
| | 350,000 | | | Valero Energy
6.125%, 02/01/20 | | | 429,060 | |
| | | | | | | | |
| | | | | | | 12,032,368 | |
| | | | | | | | |
| | |
| | | | Financials – 12.02% | | | | |
| | 700,000 | | | American Express Credit
Senior Unsecured Notes
2.750%, 09/15/15 | | | 733,687 | |
| | 575,000 | | | Australia & New Zealand Banking Group (Australia)
Senior Unsecured Notes
4.875%, 01/12/21 (c) | | | 678,905 | |
| | 200,000 | | | Banco Bradesco SA/Cayman Islands (Brazil) Subordinated Notes
5.750%, 03/01/22 (c) | | | 218,500 | |
| | | | | | | | |
Par Value | | | | | Market
Value | |
| | |
| | | | Financials (continued) | | | | |
| | $ 600,000 | | | Banco Davivienda SA (Colombia)
Senior Unsecured Notes
2.950%, 01/29/18 (c) | | $ | 592,500 | |
| | 600,000 | | | 2.950%, 01/29/18 | | | 592,500 | |
| | 600,000 | | | Banco de Bogota SA (Colombia)
5.375%, 02/19/23 (c) | | | 631,200 | |
| | 400,000 | | | 5.375%, 02/19/23 | | | 420,800 | |
| | 500,000 | | | Banco de Chile (Chile)
6.250%, 06/15/16 | | | 552,585 | |
| | 1,000,000 | | | Banco de Credito del Peru (Peru)
4.250%, 04/01/23 (c) | | | 1,008,500 | |
| | 350,000 | | | 6.125%, 04/24/27 (a) (c) | | | 382,900 | |
| | 500,000 | | | Banco do Brasil SA/Cayman Islands (Belize)
5.875%, 01/19/23 | | | 547,500 | |
| | 400,000 | | | 8.500%, 10/20/49 (a) | | | 494,000 | |
| | 100,000 | | | Banco Inter del Peru
8.500%, 04/23/70 (d) | | | 115,000 | |
| | 300,000 | | | Banco Mercantil del Norte SA (Mexico) Subordinated Notes
6.862%, 10/13/21 (a) | | | 324,000 | |
| | 100,000 | | | Bancolombia SA (Colombia)
Senior Unsecured Notes
4.250%, 01/12/16 | | | 106,250 | |
| | 700,000 | | | Bank of Montreal (Canada)
Senior Unsecured Notes
1.400%, 09/11/17 | | | 703,515 | |
| | 340,000 | | | BB&T
Senior Unsecured Notes
1.600%, 08/15/17 | | | 344,976 | |
| | 275,000 | �� | | Boston Properties
Senior Unsecured Notes, REIT
4.125%, 05/15/21 | | | 305,795 | |
| | 50,000 | | | 3.850%, 02/01/23 | | | 54,185 | |
| | 1,000,000 | | | Cielo (Brazil)
Senior Unsecured Notes
3.750%, 11/16/22 | | | 976,000 | |
| | 1,400,000 | | | Corpbanca (Chile)
3.125%, 01/15/18 | | | 1,406,440 | |
| | 250,000 | | | CorpGroup Banking (Chile)
6.750%, 03/15/23 (c) | | | 265,938 | |
| | 250,000 | | | Corpgroup Banking SA
6.750%, 03/15/23 | | | 265,938 | |
| | 400,000 | | | DBS Bank (Singapore)
5.000%, 11/15/19 (a) | | | 421,760 | |
| | 675,000 | | | General Electric Capital
Senior Unsecured Notes
2.900%, 01/09/17 | | | 716,193 | |
| | 800,000 | | | Global Bank (Pitcairn Island)
4.750%, 10/05/17 | | | 818,000 | |
| | 300,000 | | | Goldman Sachs Group
Senior Unsecured Notes
5.750%, 01/24/22 | | | 358,882 | |
| | 600,000 | | | Grupo Aval (Cayman Islands)
5.250%, 02/01/17 | | | 648,720 | |
| | 200,000 | | | 4.750%, 09/26/22 (c) | | | 202,250 | |
| | 500,000 | | | 4.750%, 09/26/22 | | | 505,625 | |
See accompanying Notes to Financial Statements.
| | |
| |
| ASTON/DoubleLine Core Plus Fixed Income Fund | | April 30, 2013 |
| |
| Schedule of Investments (unaudited) – continued | | |
| | | | | | | | |
Par Value | | | | | Market
Value | |
| | |
| | | | Financials (continued) | | | | |
| | $ 99,766 | | | IIRSA Norte Finance (Cayman Islands)
Senior Secured Notes
8.750%, 05/30/24 | | $ | 125,206 | |
| | 300,000 | | | Industrial
Senior Trust (Cayman Islands)
5.500%, 11/01/22 (c) | | | 301,500 | |
| | 500,000 | | | 5.500%, 11/01/22 | | | 502,500 | |
| | 700,000 | | | Itau Unibanco Holding SA/Cayman Island (Belize)
5.500%, 08/06/22 | | | 746,900 | |
| | 125,000 | | | JPMorgan Chase
Senior Unsecured Notes
4.950%, 03/25/20 | | | 145,676 | |
| | 475,000 | | | 4.500%, 01/24/22 | | | 537,578 | |
| | 675,000 | | | Korea Development Bank (South Korea)
Senior Unsecured Notes
4.375%, 08/10/15 | | | 723,557 | |
| | 424,000 | | | Liberty Mutual
6.500%, 05/01/42 (c) | | | 501,129 | |
| | 400,000 | | | Malayan Banking Bhd (Malaysia)
3.250%, 09/20/22 (a) | | | 406,395 | |
| | 72,000 | | | MetLife
Senior Unsecured Notes
6.375%, 06/15/34 | | | 94,759 | |
| | 175,000 | | | 5.700%, 06/15/35 | | | 212,023 | |
| | 125,000 | | | 5.875%, 02/06/41 | | | 158,176 | |
| | 250,000 | | | 4.125%, 08/13/42 | | | 250,241 | |
| | 325,000 | | | Morgan Stanley
Senior Unsecured Notes
3.750%, 02/25/23 | | | 338,047 | |
| | 595,000 | | | National Rural Utilities Cooperative Finance Collateral Trust
10.375%, 11/01/18 | | | 866,580 | |
| | 300,000 | | | Oversea-Chinese Banking (Singapore)
4.250%, 11/18/19 (a) | | | 312,260 | |
| | 400,000 | | | Pesquera Exalmar S.A.A. (Peru)
Senior Unsecured Notes
7.375%, 01/31/20 | | | 399,400 | |
| | 336,000 | | | PNC Funding
4.375%, 08/11/20 | | | 385,146 | |
| | 300,000 | | | 3.300%, 03/08/22 | | | 315,918 | |
| | 350,000 | | | Pttep Australia International Finance Property (Australia)
4.152%, 07/19/15 | | | 369,248 | |
| | 800,000 | | | Scotiabank Peru SA (Peru)
4.500%, 12/13/27 (a) (c) | | | 796,000 | |
| | 600,000 | | | 4.500%, 12/13/27 (a) | | | 597,000 | |
| | 75,000 | | | Simon Property Group
Senior Unsecured Notes
5.650%, 02/01/20 | | | 91,828 | |
| | 160,000 | | | 4.375%, 03/01/21 | | | 182,449 | |
| | 1,000,000 | | | Tanner Servicios Financieros SA (Chile) 4.375%, 03/13/18 (c) | | | 1,017,726 | |
| | 200,000 | | | United Overseas Bank (Singapore)
5.375%, 09/03/19 (a) | | | 210,522 | |
| | | | | | | | |
Par Value | | | | | Market
Value | |
| | |
| | | | Financials (continued) | | | | |
| | $1,000,000 | | | VTB Bank OJSC Via VTB Capital (Luxembourg)
Senior Unsecured Notes
6.875%, 05/29/18 | | $ | 1,124,000 | |
| | 525,000 | | | Wells Fargo
Senior Unsecured Notes
4.600%, 04/01/21 | | | 608,254 | |
| �� | 75,000 | | | 3.500%, 03/08/22 | | | 80,622 | |
| | | | | | | | |
| | | | | | | 27,793,684 | |
| | | | | | | | |
| | |
| | | | Healthcare – 1.11% | | | | |
| | 50,000 | | | Becton Dickinson
Senior Unsecured Notes
3.250%, 11/12/20 | | | 53,989 | |
| | 380,000 | | | 3.125%, 11/08/21 | | | 402,966 | |
| | 350,000 | | | Biogen Idec
Senior Unsecured Notes
6.875%, 03/01/18 | | | 431,204 | |
| | 425,000 | | | Celgene
Senior Unsecured Notes
3.250%, 08/15/22 | | | 438,138 | |
| | 450,000 | | | Medtronic
Senior Unsecured Notes
1.375%, 04/01/18 | | | 452,648 | |
| | 75,000 | | | Novartis Capital
2.400%, 09/21/22 | | | 75,705 | |
| | 350,000 | | | WellPoint
Senior Unsecured Notes
5.250%, 01/15/16 | | | 389,195 | |
| | 100,000 | | | 2.375%, 02/15/17 | | | 104,102 | |
| | 175,000 | | | 5.875%, 06/15/17 | | | 206,672 | |
| | | | | | | | |
| | | | | | | 2,554,619 | |
| | | | | | | | |
| | |
| | | | Industrials – 7.88% | | | | |
| | 200,000 | | | Alpek SA de CV (Mexico)
Senior Unsecured Notes
4.500%, 11/20/22 (c) | | | 209,249 | |
| | 200,000 | | | Alrosa Finance (Luxemburg)
8.875%, 11/17/14 | | | 220,380 | |
| | 200,000 | | | Andrade Gutierrez International SA (Belize)
4.000%, 04/30/18 (c) | | | 201,000 | |
| | 300,000 | | | BFF International (Cayman Islands)
7.250%, 01/28/20 | | | 364,125 | |
| | 300,000 | | | Boeing
Senior Unsecured Notes
6.875%, 03/15/39 | | | 440,792 | |
| | 350,000 | | | Burlington Northern Santa Fe
Senior Unsecured Notes
3.000%, 03/15/23 | | | 360,398 | |
| | 600,000 | | | Cementos Pacasmayo SAA (Peru)
4.500%, 02/08/23 | | | 595,200 | |
| | 100,000 | | | Cemex Espana Luxembourg (Spain)
Senior Secured Notes
9.250%, 05/12/20 | | | 110,500 | |
See accompanying Notes to Financial Statements.
| | |
| |
| ASTON/DoubleLine Core Plus Fixed Income Fund | | April 30, 2013 |
| |
| Schedule of Investments (unaudited) – continued | | |
| | | | | | | | |
Par Value | | | | | Market
Value | |
| | |
| | | | Industrials (continued) | | | | |
| | $ 100,000 | | | Cemex Sab de CV (Mexico)
Senior Secured Notes
9.000%, 01/11/18 | | $ | 109,500 | |
| | 600,000 | | | 5.875%, 03/25/19 (c) | | | 612,000 | |
| | 1,000,000 | | | Cencosud SA (Colombia)
4.875%, 01/20/23 (c) | | | 1,040,259 | |
| | 200,000 | | | 4.875%, 01/20/23 | | | 208,052 | |
| | 600,000 | | | CFR International SPA (Colombia)
5.125%, 12/06/22 | | | 622,715 | |
| | 400,000 | | | 5.125%, 12/06/22 (c) | | | 415,144 | |
| | 800,000 | | | Corp GEO Sab de CV (Mexico)
8.875%, 03/27/22 | | | 372,000 | |
| | 100,000 | | | CSN Islands IX (Cayman Islands)
10.000%, 01/15/15 | | | 111,950 | |
| | 500,000 | | | Embraer Overseas (Cayman Islands)
6.375%, 01/24/17 | | | 569,500 | |
| | 600,000 | | | Empresas ICA (Mexico)
8.375%, 07/24/17 | | | 586,500 | |
| | 400,000 | | | 8.900%, 02/04/21 | | | 392,000 | |
| | 200,000 | | | ESAL GmbH (American Samoa)
6.250%, 02/05/23 | | | 199,800 | |
| | 800,000 | | | 6.250%, 02/05/23 (c) | | | 799,200 | |
| | 200,000 | | | Ferreycorp SAA (Peru)
4.875%, 04/26/20 (c) (d) | | | 202,250 | |
| | 200,000 | | | Freeport-McMoRan Copper & Gold
Senior Unsecured Notes
2.150%, 03/01/17 | | | 203,685 | |
| | 800,000 | | | 3.550%, 03/01/22 | | | 801,900 | |
| | 500,000 | | | Grupo KUO SAB de CV (Mexico)
6.250%, 12/04/22 (c) | | | 543,750 | |
| | 700,000 | | | 6.250%, 12/04/22 | | | 761,250 | |
| | 125,000 | | | Illinois Tool Works
Senior Unsecured Notes
6.250%, 04/01/19 | | | 156,847 | |
| | 325,000 | | | 3.375%, 09/15/21 | | | 357,355 | |
| | 600,000 | | | LPG International (Cayman Islands)
7.250%, 12/20/15 | | | 666,000 | |
| | 400,000 | | | NET Servicos de Comunicacao (Belize)
7.500%, 01/27/20 | | | 452,000 | |
| | 250,000 | | | Novartis Capital
4.400%, 04/24/20 | | | 292,858 | |
| | 400,000 | | | OAS Financial (Belize)
8.875%, 04/29/49 (a) (c) (d) | | | 406,500 | |
| | 300,000 | | | Penerbangan Malaysia (Malaysia)
5.625%, 03/15/16 | | | 335,780 | |
| | 200,000 | | | Pesquera Exalmar S.A.A. (Peru)
Senior Unsecured Notes
7.375%, 01/31/20 (c) | | | 199,700 | |
| | 600,000 | | | PTT PCL (Thailand)
Senior Unsecured Notes
3.375%, 10/25/22 | | | 606,352 | |
| | 400,000 | | | SACI Falabella (Colombia)
Senior Unsecured Notes
3.750%, 04/30/23 (c) | | | 401,800 | |
| | 600,000 | | | Samarco Mineracao (Belize)
Senior Unsecured Notes
4.125%, 11/01/22 (c) | | | 590,250 | |
| | | | | | | | |
Par Value | | | | | Market
Value | |
| | |
| | | | Industrials (continued) | | | | |
| | $ 400,000 | | | SMU SA (Colombia)
7.750%, 02/08/20 (c) | | $ | 427,500 | |
| | 200,000 | | | Southern Copper
Senior Unsecured Notes
5.250%, 11/08/42 | | | 193,910 | |
| | 337,000 | | | Southwest Airlines
Senior Unsecured Notes
5.750%, 12/15/16 | | | 380,457 | |
| | 225,000 | | | 5.125%, 03/01/17 | | | 251,211 | |
| | 200,000 | | | STATS ChipPAC (Singapore)
5.375%, 03/31/16 | | | 208,750 | |
| | 200,000 | | | Telefonica Celular del Paraguay (Paraguay)
Senior Unsecured Notes
6.750%, 12/13/22 (c) | | | 218,500 | |
| | 450,000 | | | United Technologies
Senior Unsecured Notes
3.100%, 06/01/22 | | | 479,794 | |
| | 425,000 | | | Waste Management
6.125%, 11/30/39 | | | 544,013 | |
| | | | | | | | |
| | | | | | | 18,222,676 | |
| | | | | | | | |
| | |
| | | | Information Technology – 0.89% | | | | |
| | 375,000 | | | Arrow Electronics
Senior Unsecured Notes
3.375%, 11/01/15 | | | 389,473 | |
| | 375,000 | | | Microsoft
Senior Unsecured Notes
2.125%, 11/15/22 | | | 370,424 | |
| | 450,000 | | | Motorola Solutions
Senior Unsecured Notes
6.000%, 11/15/17 | | | 527,614 | |
| | 300,000 | | | Oracle
Senior Unsecured Notes
1.200%, 10/15/17 | | | 302,199 | |
| | 450,000 | | | Xerox
Senior Unsecured Notes
4.250%, 02/15/15 | | | 474,827 | |
| | | | | | | | |
| | | | | | | 2,064,537 | |
| | | | | | | | |
| | |
| | | | Materials – 3.45% | | | | |
| | 400,000 | | | Alfa Bank OJSC Via Alfa Bond Issuance (Iran)
7.500%, 09/26/19 | | | 433,080 | |
| | 600,000 | | | Alfa MTN Invest (Cocos (Keeling Islands))
9.250%, 06/24/13 | | | 607,320 | |
| | 300,000 | | | Alfa MTN Issuance (Cocos (Keeling Islands))
8.000%, 03/18/15 | | | 326,250 | |
| | 300,000 | | | Celulosa Arauco y Constitucion SA (Chile)
Senior Unsecured Notes
5.000%, 01/21/21 | | | 318,923 | |
| | 600,000 | | | 4.750%, 01/11/22 | | | 625,675 | |
| | 800,000 | | | Cia Minera Milpo SAA (Peru)
Senior Unsecured Notes
4.625%, 03/28/23 (c) | | | 814,000 | |
See accompanying Notes to Financial Statements.
| | |
| |
| ASTON/DoubleLine Core Plus Fixed Income Fund | | April 30, 2013 |
| |
| Schedule of Investments (unaudited) – continued | | |
| | | | | | | | |
Par Value | | | | | Market
Value | |
| | |
| | | | Materials (continued) | | | | |
| | $ 350,000 | | | Dow Chemical
Senior Unsecured Notes
3.000%, 11/15/22 | | $ | 350,922 | |
| | 75,000 | | | Ecolab
Senior Unsecured Notes
2.375%, 12/08/14 | | | 77,009 | |
| | 275,000 | | | 1.000%, 08/09/15 | | | 276,072 | |
| | 250,000 | | | Inversiones CMPC (Chile)
4.750%, 01/19/18 | | | 266,285 | |
| | 550,000 | | | 4.500%, 04/25/22 | | | 563,207 | |
| | 150,000 | | | 4.500%, 04/25/22 (c) | | | 153,602 | |
| | 600,000 | | | Mexichem SAB de CV (Mexico)
Senior Unsecured Notes
4.875%, 09/19/22 (c) | | | 654,000 | |
| | 500,000 | | | OJSC Novolipetsk Steel via Steel Funding (Iran)
4.450%, 02/19/18 | | | 506,250 | |
| | 500,000 | | | 4.450%, 02/19/18 (c) | | | 506,250 | |
| | 200,000 | | | Phosagro OAO via Phosagro Bond Funding (Iran)
4.204%, 02/13/18 | | | 205,000 | |
| | 400,000 | | | 4.204%, 02/13/18 (c) | | | 410,000 | |
| | 500,000 | | | Polyus Gold International (Jersey)
5.625%, 04/29/20 (c) (d) | | | 511,875 | |
| | 375,000 | | | Teck Resources (Canada)
5.400%, 02/01/43 | | | 371,185 | |
| | | | | | | | |
| | | | | | | 7,976,905 | |
| | | | | | | | |
| | |
| | | | Telecommunications – 1.99% | | | | |
| | 275,000 | | | AT&T
Senior Unsecured Notes
5.350%, 09/01/40 | | | 312,049 | |
| | 150,000 | | | Axiata SPV1 Labuan (Malaysia)
5.375%, 04/28/20 | | | 172,728 | |
| | 621,000 | | | British Telecom (United Kingdom)
Senior Unsecured Notes
5.950%, 01/15/18 | | | 743,619 | |
| | 75,000 | | | Deutsche Telekom International Finance BV (Netherlands)
8.750%, 06/15/30 | | | 111,951 | |
| | 200,000 | | | Digicel (Bangladesh)
Senior Unsecured Notes
7.000%, 02/15/20 | | | 211,500 | |
| | 800,000 | | | 6.000%, 04/15/21 (c) | | | 804,000 | |
| | 350,000 | | | France Telecom (France)
Senior Unsecured Notes
2.750%, 09/14/16 | | | 366,849 | |
| | 300,000 | | | Globo Comunicacao e Participacoes (Belize)
6.250%, 07/20/15 (f) | | | 323,100 | |
| | 200,000 | | | 5.307%, 05/11/22 (c) (f) | | | 221,000 | |
| | | | Senior Unsecured Notes | | | | |
| | 200,000 | | | 5.307%, 05/11/22 (f) | | | 221,000 | |
| | 200,000 | | | Koninklijke KPN NV (Netherlands)
Senior Unsecured Notes
8.375%, 10/01/30 | | | 268,824 | |
| | 200,000 | | | TV Azteca SAB de CV (Mexico)
7.500%, 05/25/18 | | | 219,000 | |
| | | | | | | | |
Par Value | | | | | Market
Value | |
| | |
| | | | Telecommunications (continued) | | | | |
| | $ 300,000 | | | VimpelCom Holdings BV (Netherlands)
5.200%, 02/13/19 (c) | | $ | 307,500 | |
| | 300,000 | | | 5.950%, 02/13/23 (c) | | | 306,000 | |
| | | | | | | | |
| | | | | | | 4,589,120 | |
| | | | | | | | |
| | |
| | | | Transportation Non Rail – 0.36% | | | | |
| | 200,000 | | | Gazprombank OJSC Via GPB Eurobond Finance (Iran)
Senior Unsecured Notes
7.933%, 06/28/13 | | | 202,400 | |
| | 400,000 | | | 5.625%, 05/17/17 | | | 428,080 | |
| | 200,000 | | | Transnet SOC (South Africa)
Senior Unsecured Notes
4.500%, 02/10/16 | | | 212,105 | |
| | | | | | | | |
| | | | | | | 842,585 | |
| | | | | | | | |
| | |
| | | | Utilities – 1.22% | | | | |
| | 500,000 | | | AES Andres Dominicana (Cayman Islands)
Senior Secured Notes
9.500%, 11/12/20 | | | 546,250 | |
| | 150,000 | | | AES Gener (Chile)
Senior Unsecured Notes
7.500%, 03/25/14 | | | 157,665 | |
| | 400,000 | | | Duke Energy
Senior Unsecured Notes
3.550%, 09/15/21 | | | 431,586 | |
| | 350,000 | | | EGE Haina Finance (Cayman Islands)
Senior Secured Notes
9.500%, 04/26/17 | | | 364,000 | |
| | 200,000 | | | Instituto Costarricense de Electricidad (Costa Rica)
Senior Unsecured Notes
6.950%, 11/10/21 (c) | | | 229,500 | |
| | 425,000 | | | Midamerican Energy Holdings
Senior Unsecured Notes
6.500%, 09/15/37 | | | 575,654 | |
| | 475,000 | | | Southern Power
Senior Unsecured Notes
4.875%, 07/15/15 | | | 517,384 | |
| | | | | | | | |
| | | | | | | 2,822,039 | |
| | | | | | | | |
| | |
| | | | Total Corporate Notes and Bonds
(Cost $88,658,656) | | | 89,927,135 | |
| | | | | | | | |
|
| | COLLATERALIZED MORTGAGE-BACKED SECURITIES – 19.01% | |
| | |
| | 1,072,000 | | | American General Mortgage Loan Trust
Series 2010-1A, Class A3
5.650%, 03/25/58 (a) (c) | | | 1,131,706 | |
| | 250,000 | | | Banc of America Commercial Mortgage Trust
Series 2007-5, Class AM
5.772%, 02/10/51 (a) | | | 282,888 | |
| | 350,000 | | | Banc of America Commercial Mortgage Trust
Series 2007-4, Class AM
5.821%, 02/10/51 (a) | | | 406,162 | |
See accompanying Notes to Financial Statements.
| | |
| |
| ASTON/DoubleLine Core Plus Fixed Income Fund | | April 30, 2013 |
| |
| Schedule of Investments (unaudited) – continued | | |
| | | | | | | | |
Par Value | | | | | Market
Value | |
| | $ 793,391 | | | Banc of America Funding
Series 2010-R9, Class 3A3
5.500%, 12/26/35 (c) | | $ | 604,047 | |
| | 953,408 | | | Banc of America Funding
Series 2006-B, Class 7A1
5.640%, 03/20/36 (a) | | | 858,593 | |
| | 1,074,096 | | | Banc of America Funding
Series 2012-R4, Class A
0.464%, 03/04/39 (a) (c) | | | 1,055,376 | |
| | 83,609 | | | Banc of America Large Loan Trust
Series 2007-BMB1, Class A2
0.949%, 08/15/29 (a) (c) | | | 82,494 | |
| | 75,000 | | | Banc of America Merrill Lynch Commercial Mortgage
Series 2006-4, Class AM
5.675%, 07/10/46 | | | 85,437 | |
| | 100,000 | | | Banc of America Re-REMIC Trust
Series 2012-CLRN, Class B
1.799%, 08/15/29 (a) (c) | | | 101,236 | |
| | 100,000 | | | Banc of America Re-REMIC Trust
Series 2012-CLRN, Class D
2.899%, 08/15/29 (a) (c) | | | 102,224 | |
| | 535,422 | | | Bear Stearns Asset Backed Securities Trust
Series 2004-AC2, Class 2A
5.000%, 05/25/34 | | | 539,907 | |
| | 125,000 | | | Bear Stearns Commercial Mortgage Securities
Series 2006-PW14, Class AM
5.243%, 12/11/38 | | | 141,666 | |
| | 275,000 | | | Bear Stearns Commercial Mortgage Securities
Series 2007-PW16, Class AM
5.905%, 06/11/40 (a) | | | 321,555 | |
| | 100,000 | | | Bear Stearns Commercial Mortgage Securities
Series 2005-PWR8, Class A4
4.674%, 06/11/41 | | | 106,970 | |
| | 100,000 | | | Bear Stearns Commercial Mortgage Securities
Series 2005-T18, Class AJ
5.005%, 02/13/42 (a) | | | 107,497 | |
| | 294,687 | | | Citicorp Mortgage Securities
Series 2007-2, Class 3A1
5.500%, 02/25/37 | | | 300,505 | |
| | 350,000 | | | Citigroup Commercial Mortgage Trust
2.738%, 01/12/18 (c) | | | 362,711 | |
| | 350,000 | | | Citigroup Commercial Mortgage Trust
3.008%, 01/12/18 (c) | | | 355,082 | |
| | 50,000 | | | Citigroup Commercial Mortgage Trust
Series 2005-C3, Class AM
4.830%, 05/15/43 (a) | | | 53,693 | |
| | 992,665 | | | Citigroup Commercial Mortgage Trust
Series 2012-GC8, Class XA
2.419%, 09/10/45 (a) (b) (c) | | | 132,900 | |
| | 130,000 | | | Citigroup Commercial Mortgage Trust
Series 2006-C5, Class AM
5.462%, 10/15/49 | | | 148,471 | |
| | | | | | | | |
Par Value | | | | | Market
Value | |
| | $ 375,000 | | | Citigroup Commercial Mortgage Trust
Series 2007-C6, Class AM
5.885%, 12/10/49 (a) | | $ | 428,588 | |
| | 250,000 | | | Citigroup Commercial Mortgage Trust
Series 2008-C7, Class AM
6.340%, 12/10/49 (a) | | | 292,669 | |
| | 6,992,611 | | | Citigroup/Deutsche Bank Commercial Mortgage Trust
Series 2007-CD5, Class XP
0.308%, 11/15/44 (a) (b) (c) | | | 22,146 | |
| | 340,000 | | | Citigroup/Deutsche Bank Commercial Mortgage Trust
Series 2007-CD4, Class AMFX
5.366%, 12/11/49 (a) | | | 367,663 | |
| | 1,134,567 | | | Citimortgage Alternative Loan Trust
Series 2007-A4, Class 1A13
5.750%, 04/25/37 | | | 1,050,041 | |
| | 200,000 | | | Commercial Mortgage Pass Through Certificates
Series 2007-TFLA, Class B
0.349%, 02/15/22 (a) (c) | | | 194,376 | |
| | 150,000 | | | Commercial Mortgage Pass Through Certificates
Series 2012-FL2, Class GPI
3.700%, 09/17/29 (a) (c) (d) (e) | | | 150,000 | |
| | 300,000 | | | Commercial Mortgage Pass Through Certificates
Series 2006-C3, Class AM
5.989%, 06/15/38 (a) | | | 337,839 | |
| | 275,000 | | | Commercial Mortgage Pass Through Certificates
Series 2006-C4, Class AM
5.509%, 09/15/39 | | | 308,323 | |
| | 300,000 | | | Commercial Mortgage Pass Through Certificates
Series 2006-C5, Class AM
5.343%, 12/15/39 | | | 335,266 | |
| | 1,988,628 | | | Commercial Mortgage Pass Through Certificates
Series 2012-CR3, Class XA
2.374%, 11/15/45 (a) (b) | | | 285,991 | |
| | 350,000 | | | Commercial Mortgage Pass Through Certificates
Series 2006-C7, Class AM
5.965%, 06/10/46 (a) | | | 390,001 | |
| | 176,743 | | | Commercial Mortgage Pass Through Certificates
Series 2010-C1, Class XPA
2.510%, 07/10/46 (a) (b) (c) | | | 9,189 | |
| | 275,000 | | | Commercial Mortgage Trust
Series 2011-THL, Class B
4.554%, 06/09/28 (c) | | | 283,401 | |
| | 200,000 | | | Commercial Mortgage Trust
Series 2006-CD3, Class AM
5.648%, 10/15/48 | | | 227,769 | |
| | 1,690,689 | | | Countrywide Alternative Loan Trust
Series 2005-J8, Class 1A5
5.500%, 07/25/35 | | | 1,635,363 | |
See accompanying Notes to Financial Statements.
| | |
| |
| ASTON/DoubleLine Core Plus Fixed Income Fund | | April 30, 2013 |
| |
| Schedule of Investments (unaudited) – continued | | |
| | | | | | | | |
Par Value | | | | | Market
Value | |
| | $2,097,034 | | | Countrywide Alternative Loan Trust
Series 2005-86CB, Class A5
5.500%, 02/25/36 | | $ | 1,727,357 | |
| | 589,486 | | | Countrywide Alternative Loan Trust
Series 2006-J1, Class 2A1
7.000%, 02/25/36 | | | 290,827 | |
| | 128,381 | | | Countrywide Alternative Loan Trust
Series 2007-18CB, Class 2A17
6.000%, 08/25/37 | | | 112,875 | |
| | 491,255 | | | Countrywide Alternative Loan Trust
Series 2007-23CB, Class A3
0.704%, 09/25/37 (a) | | | 300,352 | |
| | 469,066 | | | Countrywide Alternative Loan Trust
Series 2007-23CB, Class A4
6.300%, 09/25/37 (a) (b) | | | 107,554 | |
| | 1,996,914 | | | Countrywide Home Loan Mortgage Pass Through Trust
Series 2007-12, Class A9
5.750%, 08/25/37 | | | 1,966,259 | |
| | 1,166,083 | | | Countrywide Home Loan Mortgage Pass Through Trust
Series 2005-HYB8, Class 4A1
4.611%, 12/20/35 (a) | | | 1,057,108 | |
| | 1,076,802 | | | Countrywide Home Loan Mortgage Pass Through Trust
Series 2007-2, Class A13
6.000%, 03/25/37 | | | 1,013,956 | |
| | 249,871 | | | Countrywide Home Loan Mortgage Pass Through Trust
Series 2007-7, Class A4
5.750%, 06/25/37 | | | 235,101 | |
| | 100,000 | | | Credit Suisse First Boston Mortgage Securities
Series 1998 -C2 Class F
6.750%, 11/15/30 (a) (c) | | | 105,356 | |
| | 3,112,446 | | | Credit Suisse First Boston Mortgage Securities
Series 1997-C2, Class AX
0.282%, 01/17/35 (a) (b) | | | 2,303 | |
| | 161,112 | | | Credit Suisse First Boston Mortgage Securities
Series 2005-8, Class 9A4
5.500%, 09/25/35 | | | 153,367 | |
| | 250,000 | | | Credit Suisse First Boston Mortgage Securities
Series 2005-C6, Class AJ
5.230%, 12/15/40 (a) | | | 270,085 | |
| | 197,115 | | | Credit Suisse Mortgage Capital Certificates
Series 2006-TF2A, Class A2
0.369%, 10/15/21 (a) (c) | | | 193,657 | |
| | 530,781 | | | Credit Suisse Mortgage Capital Certificates
Series 2006-7, Class 1A3
5.000%, 08/25/36 | | | 441,236 | |
| | 377,727 | | | Credit Suisse Mortgage Capital Certificates
Series 2009-13R, Class 2A1
6.000%, 01/26/37 (c) | | | 389,617 | |
| | | | | | | | |
Par Value | | | | | Market
Value | |
| | $1,659,996 | | | Credit Suisse Mortgage Capital Certificates
Series 2007-1, Class 5A4
6.000%, 02/25/37 | | $ | 1,541,105 | |
| | 150,000 | | | Credit Suisse Mortgage Capital Certificates
Series 2010-RR2, Class 3B
5.342%, 12/15/43 (a) (c) | | | 169,554 | |
| | 250,000 | | | Credit Suisse Mortgage Capital Certificates
Series 2009-RR2, Class IQB
5.695%, 04/16/49 (a) (c) | | | 277,848 | |
| | 150,000 | | | CW Capital Cobalt Commercial Mortgage Trust
Series 2007-C2, Class AMFX
5.526%, 04/15/47 (a) | | | 173,529 | |
| | 200,000 | | | DBRR Trust
Series 2012-EZ1, Class A
1.393%, 09/25/45 (c) (d) | | | 200,940 | |
| | 250,000 | | | DBRR Trust
Series 2011-C32, Class A3B
5.924%, 06/17/49 (a) (c) | | | 280,489 | |
| | 150,000 | | | Del Coronado Trust
2.149%, 03/15/26 (a) (c) | | | 150,252 | |
| | 150,000 | | | Del Coronado Trust
2.853%, 03/15/26 (a) (c) | | | 150,251 | |
| | 275,000 | | | Fontainebleau Miami Beach Trust
Series 2001-FBLU, Class C
4.270%, 05/05/27 (c) | | | 289,480 | |
| | 100,000 | | | Fontainebleau Miami Beach Trust
Series 2012-FBLU, Class E
5.253%, 05/05/27 (c) | | | 105,970 | |
| | 100,000 | | | GE Capital Commercial Mortgage
Series 2005-C2, Class B
5.113%, 05/10/43 (a) | | | 106,538 | |
| | 50,000 | | | GMAC Commercial Mortgage Securities
Series 2006-C1, Class AM
5.290%, 11/10/45 (a) | | | 54,476 | |
| | 100,000 | | | GMAC Commercial Mortgage Securities
Series 2006 -C1 Class AJ
5.349%, 11/10/45 (a) | | | 92,998 | |
| | 250,000 | | | Greenwich Capital Commercial Funding
Series 2007-GG9, Class AMFX
5.475%, 03/10/39 | | | 282,163 | |
| | 250,000 | | | Greenwich Capital Commercial Funding
Series 2007-GG11, Class AM
5.867%, 12/10/49 (a) | | | 288,214 | |
| | 100,000 | | | GS Mortgage Securities Corp II
Series 2006-GG6, Class AM
5.622%, 04/10/38 (a) | | | 111,361 | |
| | 350,000 | | | GS Mortgage Securities Trust
Series 2006-GG6, Class AJ
5.826%, 04/10/38 (a) | | | 357,014 | |
| | 974,016 | | | GSR Mortgage Loan Trust
Series 2006-AR1, Class 3A1
3.187%, 01/25/36 (a) | | | 872,721 | |
| | 145,222 | | | HSBC Asset Loan Obligation
Series 2007-2, Class 1A1
5.500%, 09/25/37 | | | 145,546 | |
See accompanying Notes to Financial Statements.
| | |
| |
| ASTON/DoubleLine Core Plus Fixed Income Fund | | April 30, 2013 |
| |
| Schedule of Investments (unaudited) – continued | | |
| | | | | | | | |
Par Value | | | | | Market
Value | |
| | $ 300,000 | | | JPMorgan Chase Commercial Mortgage Securities
1.865%, 10/15/25 (a) (c) | | $ | 304,919 | |
| | 2,524,911 | | | JPMorgan Chase Commercial Mortgage Securities Trust
Series 2006-LDP8, Class X
0.724%, 05/15/45 (a) (b) | | | 36,908 | |
| | 987,399 | | | JPMorgan Chase Commercial Mortgage Securities Trust
Series 2012-CBX, Class XA
2.212%, 06/15/45 (a) (b) | | | 113,623 | |
| | 2,482,968 | | | JPMorgan Chase Commercial Mortgage Securities Trust
Series 2012-C8, Class XA
2.369%, 10/15/45 (a) (b) | | | 331,343 | |
| | 1,266,992 | | | JPMorgan Chase Commercial Mortgage Securities Trust
Series 2011-C4, Class XA
1.761%, 07/15/46 (a) (b) (c) | | | 84,531 | |
| | 350,000 | | | JPMorgan Chase Commercial Mortgage Securities Trust
Series 2007-CB17 Class AM
5.910%, 02/12/49 (a) | | | 396,136 | |
| | 175,000 | | | JPMorgan Chase Commercial Mortgage Securities Trust
Series 2009-RR2, Class GEB
5.543%, 12/17/49 (c) | | | 196,831 | |
| | 250,000 | | | JPMorgan Chase Commercial Mortgage Securities Trust
Series 2007-CB20, Class AM
6.078%, 02/12/51 (a) | | | 297,476 | |
| | 88,526 | | | JPMorgan Chase Commercial Mortgage Securities Trust
Series 2007-C1, Class ASB
5.857%, 02/15/51 | | | 97,047 | |
| | 250,000 | | | JPMorgan Chase Commercial Mortgage Securities Trust
Series 2007-LD12, Class AM
6.198%, 02/15/51 (a) | | | 291,646 | |
| | 250,000 | | | LB Commercial Mortgage Trust
Series 2007-C3, Class AMFL
6.081%, 07/15/44 (a) (c) | | | 291,497 | |
| | 100,000 | | | LB-UBS Commercial Mortgage Trust
Series 2003-C7, Class D
5.675%, 07/15/37 (a) | | | 100,690 | |
| | 350,000 | | | LB-UBS Commercial Mortgage Trust
Series 2006-C6, Class AM
5.413%, 09/15/39 | | | 398,719 | |
| | 350,000 | | | LB-UBS Commercial Mortgage Trust
Series 2007-C1, Class AJ
5.484%, 02/15/40 | | | 353,382 | |
| | 50,000 | | | LB-UBS Commercial Mortgage Trust
Series 2005-C3, Class AM
4.794%, 07/15/40 | | | 53,884 | |
| | 250,000 | | | Merrill Lynch Mortgage Trust
Series 2005-CIP1, Class AM
5.107%, 07/12/38 (a) | | | 271,977 | |
| | 50,000 | | | Merrill Lynch Mortgage Trust
Series 2006-C1, Class AM
5.873%, 05/12/39 (a) | | | 56,655 | |
| | | | | | | | |
Par Value | | | | | Market
Value | |
| | $ 350,000 | | | Merrill Lynch Mortgage Trust
Series 2006-C2, Class AJ
5.802%, 08/12/43 (a) | | $ | 345,646 | |
| | 250,000 | | | ML-CFC Commercial Mortgage Trust
Series 2007-5, Class AM
5.419%, 08/12/48 | | | 276,141 | |
| | 990,969 | | | Morgan Stanley Bank of America Merrill Lynch Trust
Series 2012-C5, Class XA
2.085%, 08/15/45 (a) (b) (c) | | | 110,713 | |
| | 250,000 | | | Morgan Stanley Capital I
Series 2007-IQ13, Class AM
5.406%, 03/15/44 | | | 283,076 | |
| | 1,456,869 | | | Morgan Stanley Capital I
Series 2011-C1, Class XA
1.123%, 09/15/47 (a) (b) (c) | | | 45,059 | |
| | 300,000 | | | Morgan Stanley Capital I Trust
Series 2006-HQ8, Class AJ
5.677%, 03/12/44 (a) | | | 314,216 | |
| | 300,000 | | | Morgan Stanley Capital I Trust 2007-HQ11
Series 2007-HQ11, Class AJ
5.508%, 02/12/44 (a) | | | 317,112 | |
| | 1,359,686 | | | Morgan Stanley Mortgage Loan Trust
Series 2005-3AR, Class 2A2
2.599%, 07/25/35 (a) | | | 1,192,450 | |
| | 200,000 | | | Morgan Stanley Re-REMIC Trust
Series 2010-HQ4, Class AJ
4.970%, 04/15/40 (c) | | | 208,281 | |
| | 300,000 | | | Nomura Asset Acceptance
Series 2005-AP3, Class A3
5.318%, 08/25/35 (a) | | | 237,796 | |
| | 747,808 | | | Prime Mortgage Trust
Series 2006-DR1, Class 2A1
5.500%, 05/25/35 (c) | | | 755,724 | |
| | 277,492 | | | Residential Asset Securitization Trust
Series 2006-A6, Class 1A1
6.500%, 07/25/36 | | | 185,021 | |
| | 707,765 | | | Residential Asset Securitization Trust
Series 2007-A1, Class A8
6.000%, 03/25/37 | | | 555,706 | |
| | 188,722 | | | RREF
Series 2013-LT2, Class A
2.833%, 05/22/28 (c) | | | 188,888 | |
| | 167,865 | | | SMA Issuer I
Series 2012-LV1, Class A
3.500%, 08/20/25 (c) | | | 168,697 | |
| | 516,831 | | | Structured Adjustable Rate Mortgage Loan Trust
Series 2006-1, Class 2A2
2.771%, 02/25/36 (a) | | | 460,542 | |
| | 213,330 | | | Structured Asset Securities
Series 2005-10, Class 1A1
5.750%, 06/25/35 | | | 216,820 | |
| | 100,000 | | | TIAA Seasoned Commercial Mortgage Trust
Series 2007-C4 Class AJ
5.541%, 08/15/39 (a) | | | 110,515 | |
See accompanying Notes to Financial Statements.
| | |
| |
| ASTON/DoubleLine Core Plus Fixed Income Fund | | April 30, 2013 |
| |
| Schedule of Investments (unaudited) – continued | | |
| | | | | | | | |
Par Value | | | | | Market
Value | |
| | $1,981,452 | | | UBS-Barclays Commercial Mortgage Trust
Series 2012-C3, Class XA
2.359%, 08/10/49 (a) (b) (c) | | $ | 280,878 | |
| | 25,000 | | | Wachovia Bank Commercial Mortgage Trust
Series 2005-C22, Class AM
5.516%, 12/15/44 (a) | | | 27,583 | |
| | 300,000 | | | Wachovia Bank Commercial Mortgage Trust
Series 2006-C28, Class AJ
5.632%, 10/15/48 | | | 274,044 | |
| | 250,000 | | | Wachovia Bank Commercial Mortgage Trust
Series 2007-C33, Class AM
6.122%, 02/15/51 (a) | | | 289,768 | |
| | 350,000 | | | Wachovia Bank Commercial Mortgage Trust
Series 2007-C30, Class AMFL
0.399%, 12/15/43 (c) | | | 326,361 | |
| | 937,268 | | | Wachovia Mortgage Loan Trust
Series 2005-A, Class 2A1
2.636%, 08/20/35 (a) | | | 879,603 | |
| | 498,752 | | | Wells Fargo Alternative Loan Trust
Series 2007-PA2, Class 1A1
6.000%, 06/25/37 | | | 465,981 | |
| | 1,170,823 | | | Wells Fargo Mortgage Backed Securities Trust
Series 2006-AR2, Class 2A5
2.640%, 03/25/36 (a) | | | 1,133,884 | |
| | 804,943 | | | Wells Fargo Mortgage Backed Securities Trust
Series 2007-8, Class 1A16
6.000%, 07/25/37 | | | 805,681 | |
| | 766,887 | | | Wells Fargo Mortgage Backed Securities Trust
Series 2007-8, Class 2A2
6.000%, 07/25/37 | | | 761,034 | |
| | 733,285 | | | Wells Fargo Mortgage Backed Securities Trust
Series 2007-13, Class A6
6.000%, 09/25/37 | | | 758,211 | |
| | 347,350 | | | Wells Fargo Mortgage Loan Trust
Series 2012-RR1 Class A1
2.847%, 08/27/37 (a) (c) | | | 354,098 | |
| | 991,979 | | | WF-RBS Commercial Mortgage Trust
Series 2012-C8, Class XA
2.410%, 08/15/45 (a) (b) (c) | | | 134,398 | |
| | 1,487,332 | | | WF-RBS Commercial Mortgage Trust
Series 2012-C9, Class XA
2.437%, 11/15/45 (a) (b) (c) | | | 213,079 | |
| | | | | | | | |
| | |
| | | | Total Collateralized Mortgage-Backed Securities
(Cost $40,608,389) | | | 43,971,474 | |
| | | | | | | | |
|
| | U.S. GOVERNMENT OBLIGATIONS – 14.99% | |
| | |
| | | | U.S. Treasury Bonds – 2.44% | | | | |
| | 1,840,000 | | | 4.250%, 05/15/39 | | | 2,353,762 | |
| | 2,780,000 | | | 3.750%, 08/15/41 | | | 3,283,008 | |
| | | | | | | | |
| | | | | | | 5,636,770 | |
| | | | | | | | |
| | | | | | | | |
Par Value | | | | | Market
Value | |
| | |
| | | | U.S. Treasury Notes – 12.55% | | | | |
| | $3,710,000 | | | 0.375%, 07/31/13 | | $ | 3,713,479 | |
| | 3,420,000 | | | 0.125%, 08/31/13 | | | 3,420,804 | |
| | 3,070,000 | | | 0.125%, 09/30/13 | | | 3,070,961 | |
| | 3,240,000 | | | 2.375%, 05/31/18 | | | 3,515,147 | |
| | 1,050,000 | | | 1.500%, 08/31/18 | | | 1,091,918 | |
| | 2,870,000 | | | 1.250%, 04/30/19 | | | 2,932,334 | |
| | 3,710,000 | | | 1.000%, 08/31/19 | | | 3,718,986 | |
| | 2,850,000 | | | 2.625%, 11/15/20 | | | 3,142,570 | |
| | 1,670,000 | | | 1.750%, 05/15/22 | | | 1,700,399 | |
| | 2,710,000 | | | 1.625%, 08/15/22 | | | 2,718,892 | |
| | | | | | | | |
| | | | | | | 29,025,490 | |
| | | | | | | | |
| | |
| | | | Total U.S. Government Obligations
(Cost $34,416,573) | | | 34,662,260 | |
| | | | | | | | |
|
| | AGENCY COLLATERALIZED MORTGAGE OBLIGATIONS – 10.92% | |
| | |
| | | | Fannie Mae – 4.51% | | | | |
| | 971,906 | | | 5.000%, 09/25/33
Series 2003-92, Class PZ, REMIC | | | 1,092,836 | |
| | 879,512 | | | 5.600%, 09/25/36 (a) (b)
Series 2009-86, Class CI, REMIC | | | 142,474 | |
| | 537,780 | | | 6.420%, 10/25/36 (a) (b)
Series 2007-57, Class SX, REMIC | | | 90,389 | |
| | 199,169 | | | 5.500%, 03/25/38
Series 2008-14, Class ZA, REMIC | | | 226,895 | |
| | 289,693 | | | 4.000%, 01/25/41
Series 2010-156, Class ZC, REMIC | | | 322,332 | |
| | 436,150 | | | 4.000%, 03/25/41
Series 2011-18, Class UZ, REMIC | | | 488,602 | |
| | 13,745 | | | 4.000%, 08/25/41
Series 2011-77, Class CZ, REMIC | | | 13,719 | |
| | 152,584 | | | 8.893%, 09/25/41 (a)
Series 2011-88, Class SB, REMIC | | | 154,361 | |
| | 941,771 | | | 4.500%, 12/25/41
Series 2011-121, Class JP, REMIC | | | 977,701 | |
| | 1,041,617 | | | 3.500%, 03/25/42
Series 2012-20, Class ZT, REMIC | | | 1,099,666 | |
| | 1,566,316 | | | 4.000%, 04/25/42
Series 2012-31, Class Z, REMIC | | | 1,728,878 | |
| | 1,020,596 | | | 3.500%, 10/25/42
Series 2012-105, Class Z, REMIC | | | 1,062,896 | |
| | 1,223,177 | | | 1.500%, 02/25/43
Series 2013-6, Class ZH, REMIC | | | 1,219,814 | |
| | 1,691,826 | | | 4.431%, 11/25/49 (a)
Series 2012-144, Class PT, REMIC | | | 1,805,555 | |
| | | | | | | | |
| | | | | | | 10,426,118 | |
| | | | | | | | |
| | |
| | | | Freddie Mac – 4.97% | | | | |
| | 2,910,619 | | | 3.000%, 08/15/42
Series 269, Class 30, STRIP | | | 3,058,650 | |
| | 757,792 | | | 5.000%, 12/15/34
Series 2909, Class Z, REMIC | | | 856,148 | |
| | 1,675,999 | | | 5.000%, 03/15/35
Series 2945, Class CZ, REMIC | | | 1,836,284 | |
| | 597,617 | | | 5.500%, 08/15/36
Series 3626, Class AZ, REMIC | | | 681,635 | |
| | 380,013 | | | 5.901%, 04/15/37 (a) (b)
Series 3301, Class MS, REMIC | | | 47,236 | |
See accompanying Notes to Financial Statements.
| | |
| |
| ASTON/DoubleLine Core Plus Fixed Income Fund | | April 30, 2013 |
| |
| Schedule of Investments (unaudited) – continued | | |
| | | | | | | | |
Par Value | | | | | Market
Value | |
| | |
| | | | Freddie Mac (continued) | | | | |
| | $ 309,006 | | | 5.801%, 11/15/37 (a) (b)
Series 3382, Class SB, REMIC | | $ | 30,653 | |
| | 299,535 | | | 6.191%, 11/15/37 (a) (b)
Series 3384, Class S, REMIC | | | 41,185 | |
| | 1,500,000 | | | 4.000%, 12/15/38
Series 3738, Class BP, REMIC | | | 1,650,284 | |
| | 857,323 | | | 5.313%, 01/15/39 (a) (b)
Series 3500, Class SA, REMIC | | | 96,683 | |
| | 945,296 | | | 4.500%, 01/15/40
Series 3818, Class JA, REMIC | | | 978,778 | |
| | 109,401 | | | 4.000%, 01/15/41
Series 3795, Class VZ, REMIC | | | 120,481 | |
| | 223,579 | | | 4.000%, 06/15/41
Series 3872, Class BA, REMIC | | | 238,611 | |
| | 214,477 | | | 4.000%, 07/15/41
Series 3888, Class ZG, REMIC | | | 232,387 | |
| | 378,570 | | | 4.500%, 07/15/41
Series 3894, Class ZA, REMIC | | | 427,883 | |
| | 125,853 | | | 9.153%, 09/15/41 (a)
Series 3924, Class US, REMIC | | | 126,865 | |
| | 525,379 | | | 3.500%, 11/15/41
Series 3957, Class DZ, REMIC | | | 561,345 | |
| | 476,191 | | | 4.000%, 11/15/41
Series 3957, Class HZ, REMIC | | | 517,924 | |
| | | | | | | | |
| | | | | | | 11,503,032 | |
| | | | | | | | |
| |
| | | | Government National Mortgage Association – 1.44% | |
| | 53,019 | | | 31.205%, 03/20/34 (a)
Series 2004-35, Class SA | | | 96,431 | |
| | 1,024,608 | | | 7.431%, 08/20/38 (a) (b)
Series 2008-69, Class SB | | | 184,508 | |
| | 987,329 | | | 5.951%, 03/20/39 (b)
Series 2010-98, Class IA | | | 80,035 | |
| | 1,192,343 | | | 4.500%, 05/16/39
Series 2009-32, Class ZE | | | 1,300,214 | |
| | 596,172 | | | 4.500%, 05/20/39
Series 2009-35, Class DZ | | | 680,355 | |
| | 587,312 | | | 4.500%, 09/20/39
Series 2009-75, Class GZ | | | 669,394 | |
| | 2,326,008 | | | 5.251%, 06/20/41 (a) (b)
Series 2011-89, Class SA | | | 309,766 | |
| | | | | | | | |
| | | | | | | 3,320,703 | |
| | | | | | | | |
| | |
| | | | Total Agency Collateralized Mortgage Obligations
(Cost $23,868,065) | | | 25,249,853 | |
| | | | | | | | |
|
| | U.S. GOVERNMENT MORTGAGE-BACKED SECURITIES – 7.87% | |
| | |
| | | | Fannie Mae – 5.98% | | | | |
| | 476,736 | | | 4.000%, 09/01/31
Pool # MA3894 | | | 514,013 | |
| | 1,065,025 | | | 3.500%, 12/01/31
Pool # MA0919 | | | 1,136,664 | |
| | 926,323 | | | 3.500%, 01/01/32
Pool # MA0949 | | | 989,212 | |
| | 2,817,720 | | | 3.000%, 12/01/32
Pool # MA1275 | | | 2,969,833 | |
| | 1,985,615 | | | 3.000%, 03/01/33
Pool # MA1366 | | | 2,097,770 | |
| | | | | | | | |
Par Value | | | | | Market
Value | |
| | |
| | | | Fannie Mae (continued) | | | | |
| | $ 631,057 | | | 4.000%, 02/01/42
Pool # AK4039 | | $ | 660,089 | |
| | 429,422 | | | 4.500%, 03/01/42
Pool # MA1050 | | | 449,983 | |
| | 1,277,072 | | | 3.500%, 05/01/42
Pool # MA1068 | | | 1,338,232 | |
| | 1,112,418 | | | 4.000%, 06/01/42
Pool # AB5459 | | | 1,165,009 | |
| | 2,396,044 | | | 3.500%, 07/01/42
Pool # MA1117 | | | 2,510,793 | |
| | | | | | | | |
| | | | | | | 13,831,598 | |
| | | | | | | | |
| | |
| | | | Freddie Mac – 1.89% | | | | |
| | 1,964,720 | | | 3.000%, 12/01/32
Gold Pool # C91594 | | | 2,075,695 | |
| | 87,290 | | | 5.000%, 07/01/35
Gold Pool # G01840 | | | 94,146 | |
| | 35,884 | | | 5.500%, 12/01/38
Gold Pool # G06172 | | | 38,758 | |
| | 419,663 | | | 4.000%, 10/01/41
Gold Pool # T60392 | | | 439,744 | |
| | 1,636,356 | | | 3.500%, 10/01/42
Gold Pool # T65110 | | | 1,719,532 | |
| | | | | | | | |
| | | | | | | 4,367,875 | |
| | | | | | | | |
| | |
| | | | Total U.S. Government Mortgage-Backed Securities
(Cost $18,023,562) | | | 18,199,473 | |
| | | | | | | | |
|
| | ASSET-BACKED SECURITIES – 3.49% | |
| | |
| | 250,000 | | | Adirondack Park CLO
Series 2013-A1, Class X
1.280%, 04/15/16 (a) (c) (d) | | | 250,000 | |
| | 250,000 | | | ALM IV
Series 2011-A4, Class C
3.053%, 07/18/22 (a) (c) | | | 248,008 | |
| | 250,000 | | | ARES CLO
Series 2012-2A, Class D
5.378%, 10/12/23 (a) (c) | | | 248,445 | |
| | 500,000 | | | ARES XXVI CLO
Series 2013-1A, Class D
4.037%, 04/15/25 (a) (c) | | | 491,912 | |
| | 1,422,724 | | | Bayview Financial Acquisition Trust
Series 2007-A, Class 1A5
6.101%, 05/28/37 (f) | | | 1,464,389 | |
| | 250,000 | | | BlueMountain CLO
Series 2012-1A, Class E
5.802%, 07/20/23 (a) (c) | | | 237,693 | |
| | 250,000 | | | Brookside Mill CLO
Series 2013-1A, Class D
3.330%, 04/17/25 (a) (c) (d) (e) | | | 233,025 | |
| | | | Series 2013-1A, Class E | | | | |
| | 250,000 | | | 4.680%, 04/17/25 (a) (c) (d) (e) | | | 224,775 | |
| | 500,000 | | | Canyon Capital CLO
Series 2004-1A, Class C
2.804%, 10/15/16 (a) (c) | | | 498,795 | |
| | 100,000 | | | Credit-Based Asset Servicing and Securitization
Series 2007-MX1, Class A4
6.231%, 12/25/36 (c) (f) | | | 69,862 | |
See accompanying Notes to Financial Statements.
| | |
| |
| ASTON/DoubleLine Core Plus Fixed Income Fund | | April 30, 2013 |
| |
| Schedule of Investments (unaudited) – continued | | |
| | | | | | | | |
Par Value | | | | | Market
Value | |
| | $ 20,314 | | | Crest
Series 2003-2A, Class A1
0.764%, 12/28/18 (a) (c) (d) | | $ | 20,263 | |
| | 250,000 | | | Dryden XXIV Senior Loan Fund
Series 2012-24A, Class D
5.040%, 11/15/23 (a) (c) | | | 250,755 | |
| | 250,000 | | | GoldenTree Loan Opportunities VI
Series 2012-6A, Class D
4.478%, 04/17/22 (a) (c) (d) | | | 250,375 | |
| | 757,000 | | | GSAA Trust
Series 2006-15, Class AF3B
5.933%, 09/25/36 (a) | | | 148,470 | |
| | 500,000 | | | LCM XI
Series 10A, Class D
4.904%, 04/15/22 (a) (c) | | | 501,396 | |
| | | | Series 11A, Class D | | | | |
| | 250,000 | | | 4.252%, 04/19/22 (a) (c) | | | 245,583 | |
| | 250,000 | | | Nomad CLO
Series 2013-1A, Class B
3.242%, 01/15/25 (a) (c) | | | 250,025 | |
| | | | Series 2013-1A, Class C | | | | |
| | 250,000 | | | 3.792%, 01/15/25 (a) (c) | | | 241,655 | |
| | 250,000 | | | OHA Intrepid Leveraged Loan Fund
Series 2011-1AR, Class DR
3.429%, 04/20/21 (a) (c) (d) | | | 250,000 | |
| | 390,394 | | | Residential Asset Mortgage Products
Series 2006-RS5, Class A3
0.370%, 09/25/36 (a) | | | 361,149 | |
| | 500,000 | | | Residential Asset Securities
Series 2004-KS6, Class A15
5.850%, 07/25/34 (a) | | | 461,372 | |
| | | | Series 2005-KS4, Class M1 | | | | |
| | 516,316 | | | 0.610%, 05/25/35 (a) | | | 505,896 | |
| | 158,952 | | | Tricadia CDO
Series 2003-1AR, Class A3L
0.987%, 02/28/16 (a) (c) (d) | | | 158,603 | |
| | 250,000 | | | WhiteHorse III
Series 2006-1A, Class B1L
2.149%, 05/01/18 (a) (c) | | | 233,695 | |
| | 250,000 | | | Wind River CLO
Series 2013-1A, Class C
3.683%, 04/20/25 (a) (c) (d) | | | 230,765 | |
| | | | | | | | |
| | |
| | | | Total Asset-Backed Securities
(Cost $7,942,048) | | | 8,076,906 | |
| | | | | | | | |
| | FOREIGN GOVERNMENT BONDS – 1.00% | |
| | |
| | 700,000 | | | Corp Andina de Fomento
Senior Unsecured Notes
3.750%, 01/15/16 | | | 746,715 | |
| | 600,000 | | | Costa Rica Government International Bond
Senior Unsecured Notes
6.548%, 03/20/14 | | | 624,000 | |
| | 426,000 | | | Mexico Government International Bond
Senior Unsecured Notes
5.625%, 01/15/17 | | | 493,308 | |
| | 250,000 | | | Ras Laffan Liquefied Natural Gas III
5.838%, 09/30/27 | | | 298,750 | |
| | 145,425 | | | Ras Laffan Liquefied Natural Gas III
Senior Secured Notes
5.832%, 09/30/16 | | | 157,423 | |
| | | | | | | | |
| | | | Total Foreign Government Bonds
(Cost $2,248,182) | | | 2,320,196 | |
| | | | | | | | |
| | | | | | | | |
Shares | | | | | Market
Value | |
|
| | INVESTMENT COMPANY – 3.05% | |
| | |
| | 7,043,033 | | | BlackRock Liquidity Funds
TempCash Portfolio (g) | | $ | 7,043,033 | |
| | | | | | | | |
| | |
| | | | Total Investment Company
(Cost $7,043,033) | | | 7,043,033 | |
| | | | | | | | |
| Total Investments – 99.22%
(Cost $222,808,508)* | | | 229,450,330 | |
| | | | | | | | |
| Net Other Assets and Liabilities – 0.78% | | | 1,795,698 | |
| | | | | | | | |
| Net Assets – 100.00% | | $ | 231,246,028 | |
| | | | | | | | |
| * | | At April 30, 2013, cost is identical for book and Federal income tax purposes. |
| | | | |
Gross unrealized appreciation | | $ | 8,147,651 | |
Gross unrealized depreciation | | | (1,505,829 | ) |
| | | | |
Net unrealized appreciation | | $ | 6,641,822 | |
| | | | |
| (a) | | Variable rate bond. The interest rate shown reflects the rate in effect at April 30, 2013. |
| (b) | | Interest only security. This type of security represents the right to receive the monthly interest payments on an underlying pool of mortgages. Payments of principal on the pool reduce the value of the “interest only” holding. |
| (c) | | Securities exempt from registration under Rule 144A of the Securities Act of 1933, as amended. These securities are purchased in accordance with guidelines approved by the Funds’ Board of Trustees and may only be resold in transactions exempt from registration, to qualified institutional buyers. At April 30, 2013, these securities amounted to $37,871,327 or 16.38% of net assets. These securities have been determined by the Subadviser to be liquid securities. |
| (d) | | Securities with a total aggregate market value of $3,204,371 or 1.39% of the net assets were valued under the fair value procedures established by the Funds’ Board of Trustees. |
| (e) | | Delayed delivery security. See Note (B)(3) to Financial Statements. |
| (f) | | Step Coupon. A bond that pays an initial coupon rate for the first period and then a higher coupon rate for the following periods until maturity. The coupon rate shown will be accrual rate until maturity. |
| (g) | | Securities with an aggregate market value of $1,229,217 has been pledged as collateral for delayed delivery securities. |
| REIT | | Real Estate Investment Trust |
| REMIC | | Real Estate Mortgage Investment Conduit |
| STRIP | | Separate Trading of Registered Interest and Principal |
| | | | |
Portfolio Composition | | | | |
U.S. Government Obligations | | | 15 | % |
U.S. Government Agency Obligations | | | 19 | % |
Corporate Notes and Bonds
(S&P Ratings) | | | | |
AAA | | | 2 | % |
AA | | | 4 | % |
A | | | 9 | % |
BBB | | | 28 | % |
BB | | | 5 | % |
B | | | 4 | % |
Lower than B | | | 10 | % |
Not Rated | | | 4 | % |
| | | | |
| | | 100 | % |
| | | | |
See accompanying Notes to Financial Statements.
| | |
| |
| ASTON/TCH Fixed Income Fund | | April 30, 2013 |
| |
| Schedule of Investments (unaudited) | | |
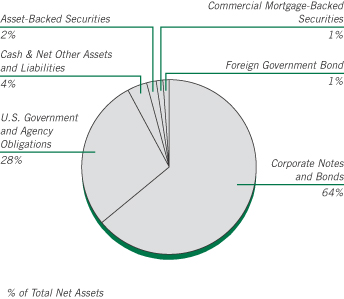
| | | | | | | | |
Par Value | | | | | Market
Value | |
|
| | CORPORATE NOTES AND BONDS – 64.02% | |
| | |
| | | | Consumer Discretionary – 3.96% | | | | |
| $ | 865,000 | | | Limited Brands
Senior Unsecured Notes
7.600%, 07/15/37 | | $ | 954,744 | |
| | 100,000 | | | Macy’s Retail Holdings
7.875%, 07/15/15 (a) | | | 114,717 | |
| | 200,000 | | | PVH
Senior Unsecured Notes
4.500%, 12/15/22 | | | 207,250 | |
| | 200,000 | | | QVC
5.125%, 07/02/22 | | | 215,550 | |
| | 500,000 | | | 5.950%, 03/15/43 (b) | | | 516,412 | |
| | 250,000 | | | Staples
Senior Unsecured Notes
9.750%, 01/15/14 | | | 265,700 | |
| | 450,000 | | | Whirlpool, MTN
Senior Unsecured Notes
8.600%, 05/01/14 | | | 485,234 | |
| | | | | | | | |
| | | | | | | 2,759,607 | |
| | | | | | | | |
| | |
| | | | Consumer Staples – 3.30% | | | | |
| | 500,000 | | | Altria Group
8.500%, 11/10/13 | | | 520,778 | |
| | 200,000 | | | 10.200%, 02/06/39 | | | 341,915 | |
| | 250,000 | | | Corn Products International
Senior Unsecured Notes
6.625%, 04/15/37 | | | 310,436 | |
| | 150,000 | | | PepsiCo
Senior Unsecured Notes
7.900%, 11/01/18 | | | 200,160 | |
| | 100,000 | | | Reynolds American
7.750%, 06/01/18 | | | 127,347 | |
| | | | | | | | |
Par Value | | | | | Market
Value | |
| | |
| | | | Consumer Staples (continued) | | | | |
| $ | 300,000 | | | Walgreen
Senior Unsecured Notes
4.875%, 08/01/13 | | $ | 303,180 | |
| | 500,000 | | | 0.780%, 03/13/14 (c) | | | 501,294 | |
| | | | | | | | |
| | | | | | | 2,305,110 | |
| | | | | | | | |
| | |
| | | | Energy – 10.08% | | | | |
| | 500,000 | | | Chesapeake Energy
6.775%, 03/15/19 | | | 548,125 | |
| | 250,000 | | | 6.625%, 08/15/20 | | | 284,063 | |
| | 250,000 | | | 6.125%, 02/15/21 | | | 276,250 | |
| | 500,000 | | | Dolphin Energy (United Arab Emirates)
5.500%, 12/15/21 (b) | | | 593,750 | |
| | 250,000 | | | El Paso Pipeline Partners Operating
7.500%, 11/15/40 | | | 342,088 | |
| | 250,000 | | | Energy Transfer Partners
Senior Unsecured Notes
9.000%, 04/15/19 | | | 334,224 | |
| | 250,000 | | | 5.150%, 02/01/43 | | | 262,076 | |
| | 250,000 | | | Hess
Senior Unsecured Notes
8.125%, 02/15/19 | | | 326,197 | |
| | 250,000 | | | KazMunayGas National (Kazakhstan)
Senior Unsecured Notes
5.750%, 04/30/43 (b) | | | 255,000 | |
| | 400,000 | | | Kinder Morgan Energy Partners
Senior Unsecured Notes
9.000%, 02/01/19 | | | 541,594 | |
| | 450,000 | | | Nabors Industries
9.250%, 01/15/19 | | | 578,558 | |
| | 250,000 | | | Pride International
Senior Unsecured Notes
6.875%, 08/15/20 | | | 318,238 | |
| | 250,000 | | | Puget Energy
5.625%, 07/15/22 | | | 281,449 | |
| | 750,000 | | | Rockies Express Pipeline
Senior Unsecured Notes
6.875%, 04/15/40 (b) | | | 682,500 | |
| | 250,000 | | | Rowan
5.000%, 09/01/17 | | | 278,728 | |
| | 250,000 | | | 5.400%, 12/01/42 | | | 258,629 | |
| | 250,000 | | | Valero Energy
9.375%, 03/15/19 | | | 344,040 | |
| | 400,000 | | | Weatherford International (Bermuda)
9.625%, 03/01/19 | | | 529,580 | |
| | | | | | | | |
| | | | | | | 7,035,089 | |
| | | | | | | | |
| | |
| | | | Financials – 21.29% | | | | |
| | 250,000 | | | AFLAC
Senior Unsecured Notes
8.500%, 05/15/19 | | | 339,865 | |
| | 450,000 | | | American Financial Group
Senior Unsecured Notes
9.875%, 06/15/19 | | | 613,808 | |
| | 250,000 | | | Banco Bradesco SA/Cayman Islands (Brazil)
Subordinated Notes
5.750%, 03/01/22 (b) | | | 273,125 | |
See accompanying Notes to Financial Statements.
| | |
| |
| ASTON/TCH Fixed Income Fund | | April 30, 2013 |
| |
| Schedule of Investments (unaudited) – continued | | |
| | | | | | | | |
Par Value | | | | | Market
Value | |
| | |
| | | | Financials (continued) | | | | |
| $ | 250,000 | | | Bancolombia SA (Colombia)
Senior Unsecured Notes
5.950%, 06/03/21 | | $ | 283,125 | |
| | 250,000 | | | Subordinated Notes 5.125%, 09/11/22 | | | 256,625 | |
| | 125,000 | | | Berkshire Hathaway Finance
Senior Unsecured Notes
5.000%, 08/15/13 | | | 126,686 | |
| | 150,000 | | | Blackstone Holdings Finance
6.625%, 08/15/19 (b) (d) | | | 182,347 | |
| | 250,000 | | | 6.250%, 08/15/42 (b) (d) | | | 294,346 | |
| | 250,000 | | | Bunge Ltd Finance
8.500%, 06/15/19 | | | 326,288 | |
| | 400,000 | | | CME Group
Senior Unsecured Notes
5.400%, 08/01/13 | | | 404,821 | |
| | 500,000 | | | Daimler Finance
1.059%, 04/10/14 (b) (c) | | | 502,201 | |
| | 250,000 | | | Discover Bank
Subordinated Notes
7.000%, 04/15/20 | | | 312,878 | |
| | 500,000 | | | Dun & Bradstreet
Senior Unsecured Notes
4.375%, 12/01/22 (d) | | | 516,530 | |
| | 500,000 | | | Entertainment Properties Trust
5.750%, 08/15/22 | | | 557,831 | |
| | 1,000,000 | | | General Electric Capital, MTN
Senior Unsecured Notes
0.975%, 04/24/14 (c) | | | 1,007,124 | |
| | 800,000 | | | Goldman Sachs Capital I
6.345%, 02/15/34 | | | 845,294 | |
| | 250,000 | | | Goldman Sachs Group
Subordinated Notes
6.750%, 10/01/37 | | | 288,026 | |
| | 250,000 | | | ING US
5.500%, 07/15/22 (b) | | | 284,847 | |
| | 250,000 | | | Intesa San Paolo SPA (Italy)
Unsecured Notes
3.875%, 01/16/18 | | | 250,458 | |
| | 500,000 | | | IPIC, GMTN (Cayman Islands)
5.000%, 11/15/20 (b) | | | 573,750 | |
| | 250,000 | | | 6.875%, 11/01/41 (b) | | | 342,500 | |
| | 250,000 | | | Itau Unibanco Holding SA (Brazil)
Subordinated Notes
5.500%, 08/06/22 (b) | | | 266,750 | |
| | 200,000 | | | Jefferies Group
Senior Unsecured Notes
8.500%, 07/15/19 | | | 254,909 | |
| | 250,000 | | | 6.500%, 01/20/43 | | | 276,185 | |
| | 250,000 | | | JPMorgan Chase, GMTN
Senior Unsecured Notes
0.908%, 02/26/16 (c) | | | 250,663 | |
| | 500,000 | | | JPMorgan Chase, MTN
Senior Unsecured Notes
1.075%, 01/24/14 (c) | | | 502,892 | |
| | 250,000 | | | KKR Group Finance
5.500%, 02/01/43 (b) | | | 250,013 | |
| | | | | | | | |
Par Value | | | | | Market
Value | |
| | |
| | | | Financials (continued) | | | | |
| $ | 250,000 | | | Lincoln National
Senior Unsecured Notes
7.000%, 06/15/40 | | $ | 345,887 | |
| | 300,000 | | | Marsh & McLennan
Senior Unsecured Notes
9.250%, 04/15/19 | | | 409,889 | |
| | 750,000 | | | Merrill Lynch, MTN
Senior Unsecured Notes
6.875%, 04/25/18 | | | 912,836 | |
| | 500,000 | | | Morgan Stanley,GMTN
Senior Unsecured Notes
5.500%, 07/28/21 | | | 587,883 | |
| | 250,000 | | | Nomura Holdings (Japan), MTN
Semior Unsecured Notes
1.730%, 09/13/16 (c) | | | 251,349 | |
| | 250,000 | | | Qtel International Finance (Bermuda)
4.500%, 01/31/43 (b) | | | 247,813 | |
| | 250,000 | | | Royal Bank of Canada (Canada), GMTN
Senior Unsecured Notes
0.976%, 10/30/14 (c) | | | 252,249 | |
| | 1,000,000 | | | SLM, MTN
Senior Unsecured Notes
5.625%, 08/01/33 | | | 955,000 | |
| | 500,000 | | | Wells Fargo
Senior Unsecured Notes
1.205%, 06/26/15 (c) | | | 506,489 | |
| | | | | | | | |
| | | | | | | 14,853,282 | |
| | | | | | | | |
| | |
| | | | Healthcare – 3.01% | | | | |
| | 125,000 | | | Davita
6.375%, 11/01/18 | | | 133,906 | |
| | 200,000 | | | Hospira, GMTN
Senior Unsecured Notes
6.400%, 05/15/15 | | | 218,977 | |
| | 250,000 | | | Humana
Senior Unsecured Notes
8.150%, 06/15/38 | | | 365,735 | |
| | 500,000 | | | Lorillard Tobacco
8.125%, 05/01/40 | | | 664,441 | |
| | 200,000 | | | Quest Diagnostics
1.134%, 03/24/14 (c) | | | 200,979 | |
| | 250,000 | | | St Jude Medical
Senior Unsecured Notes
4.750%, 04/15/43 | | | 268,719 | |
| | 250,000 | | | Watson Pharmaceuticals
Senior Unsecured Notes
4.625%, 10/01/42 | | | 248,241 | |
| | | | | | | | |
| | | | | | | 2,100,998 | |
| | | | | | | | |
| | |
| | | | Industrials – 3.14% | | | | |
| | 370,000 | | | Burlington Northern Santa Fe
Senior Unsecured Notes
7.000%, 02/01/14 | | | 387,598 | |
| | 250,000 | | | FedEx
Senior Notes
8.000%, 01/15/19 | | | 329,136 | |
See accompanying Notes to Financial Statements.
| | |
| |
| ASTON/TCH Fixed Income Fund | | April 30, 2013 |
| |
| Schedule of Investments (unaudited) – continued | | |
| | | | | | | | |
Par Value | | | | | Market
Value | |
| | |
| | | | Industrials (continued) | | | | |
| $ | 500,000 | | | Mexichem SAB de CV (Mexico)
6.750%, 09/19/42 (b) | | $ | 575,000 | |
| | 250,000 | | | Transocean (Cayman Islands)
7.350%, 12/15/41 | | | 320,212 | |
| | 250,000 | | | Vale SA (Brazil)
Senior Unsecured Notes
5.625%, 09/11/42 | | | 262,724 | |
| | 250,000 | | | Waste Management
7.375%, 03/11/19 | | | 316,445 | |
| | | | | | | | |
| | | | | | | 2,191,115 | |
| | | | | | | | |
| | |
| | | | Information Technology – 4.88% | | | | |
| | 250,000 | | | Apple Senior Unsecured Notes
3.850%, 05/04/43 | | | 248,545 | |
| | 250,000 | | | DIRECTV Holdings/DIRECTV Financing
5.150%, 03/15/42 | | | 256,495 | |
| | 250,000 | | | eBay
Senior Unsecured Notes
4.000%, 07/15/42 | | | 236,825 | |
| | 500,000 | | | Hewlett-Packard
Senior Unsecured Notes
6.000%, 09/15/41 | | | 508,955 | |
| | 500,000 | | | International Business Machines
Senior Unsecured Notes
6.500%, 10/15/13 | | | 514,038 | |
| | 100,000 | | | KLA Instruments
Senior Unsecured Notes
6.900%, 05/01/18 | | | 120,533 | |
| | 500,000 | | | Telecom Italia Capital SA (Luxembourg)
7.721%, 06/04/38 | | | 557,911 | |
| | 700,000 | | | Turner Broadcasting System
8.375%, 07/01/13 | | | 708,746 | |
| | 250,000 | | | Xerox
Senior Unsecured Notes
1.680%, 09/13/13 (c) | | | 250,781 | |
| | | | | | | | |
| | | | | | | 3,402,829 | |
| | | | | | | | |
| | |
| | | | Materials – 4.36% | | | | |
| | 750,000 | | | ArcelorMittal (Luxembourg)
Senior Unsecured Notes
6.000%, 03/01/21 (a) | | | 795,968 | |
| | 400,000 | | | 7.500%, 10/15/39 (a) | | | 422,468 | |
| | 200,000 | | | Bemis
Senior Unsecured Notes
6.800%, 08/01/19 | | | 242,960 | |
| | 250,000 | | | Braskem America Finance
7.125%, 07/22/41 (b) | | | 266,875 | |
| | 250,000 | | | Dow Chemical (The)
Senior Unsecured Notes
8.550%, 05/15/19 | | | 337,533 | |
| | 250,000 | | | International Paper
Senior Unsecured Notes
8.700%, 06/15/38 | | | 378,121 | |
| | 550,000 | | | Rio Tinto Finance (Australia)
8.950%, 05/01/14 | | | 594,876 | |
| | | | | | | | |
| | | | | | | 3,038,801 | |
| | | | | | | | |
| | | | | | | | |
Par Value | | | | | Market
Value | |
| | |
| | | | Telecommunication Services – 6.52% | | | | |
| $ | 500,000 | | | British Telecommunications (United Kingdom)
Senior Unsecured Notes
1.405%, 12/20/13 (c) | | $ | 503,316 | |
| | 500,000 | | | CenturyLink
Senior Unsecured Notes
7.600%, 09/15/39 | | | 516,964 | |
| | 500,000 | | | 7.650%, 03/15/42 | | | 517,012 | |
| | 400,000 | | | Expedia
5.950%, 08/15/20 | | | 448,888 | |
| | 350,000 | | | Frontier Communications
Senior Unsecured Notes
9.000%, 08/15/31 | | | 369,250 | |
| | 250,000 | | | Telefonica Emisiones SAU (Spain)
5.877%, 07/15/19 | | | 282,345 | |
| | 500,000 | | | Telefonica Europe BV (Netherlands)
8.250%, 09/15/30 | | | 629,424 | |
| | 450,000 | | | Time Warner Cable
8.250%, 02/14/14 | | | 476,445 | |
| | 250,000 | | | Vodafone Group (United Kingdom)
Senior Unsecured Notes
0.675%, 02/19/16 (c) | | | 250,348 | |
| | 500,000 | | | Windstream
7.500%, 06/01/22 | | | 553,750 | |
| | | | | | | | |
| | | | | | | 4,547,742 | |
| | | | | | | | |
| | |
| | | | Utilities – 3.48% | | | | |
| | 500,000 | | | Dubai Electricity & Water Authority (United Arab Emirates)
Senior Unsecured Notes
8.500%, 04/22/15 (b) | | | 563,750 | |
| | 450,000 | | | FPL Group Capital
7.875%, 12/15/15 | | | 527,957 | |
| | 500,000 | | | Georgia Power
Senior Unsecured Notes
0.600%, 03/15/16 (c) | | | 500,643 | |
| | 150,000 | | | Pacific Gas & Electric
Senior Unsecured Notes
8.250%, 10/15/18 | | | 201,851 | |
| | 450,000 | | | Sempra Energy
Senior Unsecured Notes
9.800%, 02/15/19 | | | 636,214 | |
| | | | | | | | |
| | | | | | | 2,430,415 | |
| | | | | | | | |
| | |
| | | | Total Corporate Notes and Bonds
(Cost $39,594,657) | | | 44,664,988 | |
| | | | | | | | |
|
| | U.S. GOVERNMENT AND AGENCY OBLIGATIONS – 28.18% | |
| | |
| | | | Fannie Mae – 5.30% | | | | |
| | 252,295 | | | 6.000%, 11/01/17,
Pool # 662854 | | | 270,555 | |
| | 93,773 | | | 6.000%, 04/01/18,
Pool # 725175 | | | 99,285 | |
| | 228,317 | | | 5.500%, 11/01/18,
Pool # 748886 | | | 248,629 | |
| | 86,621 | | | 4.500%, 06/01/19,
Pool # 747860 | | | 94,337 | |
See accompanying Notes to Financial Statements.
| | |
| |
| ASTON/TCH Fixed Income Fund | | April 30, 2013 |
| |
| Schedule of Investments (unaudited) – continued | | |
| | | | | | | | |
Par Value | | | | | Market
Value | |
| | |
| | | | Fannie Mae (continued) | | | | |
| $ | 441,808 | | | 6.000%, 01/01/21,
Pool # 850787 | | $ | 482,573 | |
| | 211,210 | | | 6.000%, 09/01/32,
Pool # 847899 | | | 236,186 | |
| | 107,645 | | | 6.000%, 02/01/34,
Pool # 771952 | | | 120,912 | |
| | 89,676 | | | 7.500%, 02/01/35,
Pool # 787557 | | | 106,558 | |
| | 19,216 | | | 7.500%, 04/01/35,
Pool # 819231 | | | 20,693 | |
| | 150,681 | | | 6.000%, 11/01/35,
Pool # 844078 | | | 166,051 | |
| | 185,789 | | | 5.000%, 05/01/36,
Pool # 745581 | | | 201,924 | |
| | 119,160 | | | 6.000%, 12/01/36,
Pool # 888029 | | | 130,570 | |
| | 156,986 | | | 5.500%, 06/01/37,
Pool # 918778 | | | 170,762 | |
| | 157,794 | | | 6.500%, 10/01/37,
Pool # 888890 | | | 178,399 | |
| | 493,190 | | | 5.500%, 03/01/38,
Pool # 962344 | | | 536,469 | |
| | 313,916 | | | 4.000%, 02/01/41,
Pool # AE0949 | | | 336,108 | |
| | 275,421 | | | 4.000%, 02/01/41,
Pool # AH5695 | | | 294,891 | |
| | | | | | | | |
| | | | | | | 3,694,902 | |
| | | | | | | | |
| | |
| | | | Freddie Mac – 5.18% | | | | |
| | 412,670 | | | 5.500%, 11/01/20,
Gold Pool # G18083 | | | 445,434 | |
| | 85,307 | | | 5.500%, 12/01/20,
Gold Pool # G11820 | | | 92,079 | |
| | 63,229 | | | 6.000%, 10/01/35,
Gold Pool # A47772 | | | 69,710 | |
| | 198,733 | | | 5.500%, 05/01/37,
Gold Pool # A60048 | | | 214,651 | |
| | 342,780 | | | 5.500%, 09/01/37,
Gold Pool # G03202 | | | 370,235 | |
| | 376,415 | | | 5.000%, 02/01/38,
Gold Pool # A73409 | | | 404,095 | |
| | 615,286 | | | 5.000%, 04/01/38,
Gold Pool # G04334 | | | 676,625 | |
| | 310,927 | | | 4.000%, 12/01/39,
Gold Pool # G06935 | | | 332,024 | |
| | 145,978 | | | 4.000%, 05/01/41,
Gold Pool # Q00870 | | | 155,882 | |
| | 797,834 | | | 4.000%, 11/01/41,
Gold Pool # Q04550 | | | 851,969 | |
| | | | | | | | |
| | | | | | | 3,612,704 | |
| | | | | | | | |
| |
| | | | Government National Mortgage Association – 2.21% | |
| | 209,418 | | | 5.000%, 05/20/37,
Pool # 782156 | | | 230,598 | |
| | 438,381 | | | 5.000%, 08/20/37,
Pool # 4015 | | | 482,170 | |
| | | | | | | | |
Par Value | | | | | Market
Value | |
| |
| | | | Government National Mortgage Association (continued) | |
| $ | 379,999 | | | 6.000%, 07/20/38,
Pool # 4195 | | $ | 429,939 | |
| | 251,960 | | | 5.500%, 08/20/38,
Pool # 4215 | | | 265,230 | |
| | 120,832 | | | 6.000%, 01/15/39,
Pool # 698036 | | | 136,593 | |
| | | | | | | | |
| | | | | | | 1,544,530 | |
| | | | | | | | |
| | |
| | | | U.S. Treasury Bill – 1.43% | | | | |
| | 1,000,000 | | | 0.00%, 05/02/13 | | | 999,999 | |
| | | | | | | | |
| |
| | | | U.S. Treasury Inflation Index Bonds – 8.23% | |
| | 1,612,335 | | | 1.375%, 07/15/18 | | | 1,868,798 | |
| | 1,062,840 | | | 1.250%, 07/15/20 | | | 1,263,368 | |
| | 1,028,420 | | | 0.625%, 07/15/21 | | | 1,175,773 | |
| | 1,106,410 | | | 1.750%, 01/15/28 | | | 1,432,023 | |
| | | | | | | | |
| | | | | | | 5,739,962 | |
| | | | | | | | |
| | |
| | | | U.S. Treasury Notes – 5.83% | | | | |
| | 1,000,000 | | | 3.625%, 05/15/13 | | | 1,001,485 | |
| | 1,000,000 | | | 4.250%, 08/15/13 | | | 1,012,344 | |
| | 1,000,000 | | | 4.250%, 11/15/13 | | | 1,022,500 | |
| | 1,000,000 | | | 4.000%, 02/15/14 | | | 1,030,781 | |
| | | | | | | | |
| | | | | | | 4,067,110 | |
| | | | | | | | |
| | |
| | | | Total U.S. Government and Agency Obligations
(Cost $18,527,658) | | | 19,659,207 | |
| | | | | | | | |
|
| | ASSET-BACKED SECURITIES – 1.79% | |
| | |
| | 73,064 | | | Ford Credit Auto Owner Trust
Series 2009-B, Class A4
4.500%, 07/15/14 | | | 73,190 | |
| | 244,207 | | | Series 2009-D, Class A4 2.980%, 08/15/14 | | | 245,305 | |
| | 325,017 | | | Series 2009-C, Class A4 4.430%, 11/15/14 | | | 327,263 | |
| | 601,892 | | | Series 2010-A, Class A4 2.150%, 06/15/15 | | | 606,823 | |
| | | | | | | | |
| | |
| | | | Total Asset-Backed Securities
(Cost $1,255,896) | | | 1,252,581 | |
| | | | | | | | |
|
| | COMMERCIAL MORTGAGE-BACKED SECURITIES – 1.27% | |
| | |
| | 275,000 | | | Bear Stearns Commercial Mortgage Securities
Series 2007-T28, Class A4
5.742%, 09/11/42 | | | 325,205 | |
| | 500,000 | | | Citigroup Commercial Mortgage
Series 2004-C1, Class A4
5.613%, 04/15/40 | | | 517,231 | |
| | 42,089 | | | JP Morgan Chase Commercial Mortgage Securities
Series 2005-CB13, Class A2
5.247%, 01/12/43 | | | 42,453 | |
| | | | | | | | |
| | |
| | | | Total Commercial Mortgage-Backed Securities
(Cost $747,279) | | | 884,889 | |
| | | | | | | | |
See accompanying Notes to Financial Statements.
| | |
| |
| ASTON/TCH Fixed Income Fund | | April 30, 2013 |
| |
| Schedule of Investments (unaudited) – continued | | |
| | | | | | | | |
Par Value | | | | | Market
Value | |
| |
| | FOREIGN GOVERNMENT BONDS – 1.13% | | | | |
| | |
| $ | 500,000 | | | Republic of Poland
Senior Unsecured Notes
5.000%, 03/23/22 | | $ | 585,025 | |
| | 150,000 | | | State of Qatar
Senior Unsecured Notes
6.400%, 01/20/40 (b) | | | 204,750 | |
| | | | | | | | |
| | |
| | | | Total Foreign Government Bonds
(Cost $643,548) | | | 789,775 | |
| | | | | | | | |
| | |
Shares | | | | | | |
|
| | INVESTMENT COMPANY – 2.80% | |
| | |
| | 1,951,600 | | | BlackRock Liquidity Funds
TempCash Portfolio | | | 1,951,600 | |
| | | | | | | | |
| | |
| | | | Total Investment Company
(Cost $1,951,600) | | | 1,951,600 | |
| | | | | | | | |
| | | | | | |
Total Investments – 99.19%
(Cost $62,720,638)* | | | 69,203,040 | |
| | | | | | |
Net Other Assets and Liabilities – 0.81% | | | 568,284 | |
| | | | | | |
Net Assets – 100.00% | | $ | 69,771,324 | |
| | | | | | |
| * | | At April 30, 2013, cost is identical for book and Federal income tax purposes. |
| | | | |
Gross unrealized appreciation | | $ | 6,553,757 | |
Gross unrealized depreciation | | | (71,355 | ) |
| | | | |
Net unrealized appreciation | | $ | 6,482,402 | |
| | | | |
| (a) | | Step Coupon. A bond that pays an initial coupon rate for the first period and then a higher coupon rate for the following periods until maturity. The coupon rate shown will be accrual rate until maturity. |
| (b) | | Securities exempt from registration under Rule 144A of the Securities Act of 1933, as amended. These securities are purchased in accordance with guidelines approved by the Funds’ Board of Trustees and may only be resold in transactions exempt from registration, to qualified institutional buyers. At April 30, 2013, these securities amounted to $6,875,729 or 9.85% of net assets. These securities have been determined by the Subadviser to be liquid securities. |
| (c) | | Variable rate bond. The interest rate shown reflects the rate in effect at April 30, 2013. |
| (d) | | Standard & Poor’s (S&P) credit ratings are used in the absence of a rating by Moody’s Investors, Inc. |
| GMTN | | Global Medium Term Note |
| SPA | | Stand by Purchase Agreement |
| | | | |
Portfolio Composition | | | | |
Investment Company | | | 3% | |
U.S. Government Obligations and Agency Obligations | | | 29% | |
Commercial Mortgage-Backed Securities | | | 1% | |
Asset-Backed Securities | | | 2% | |
Foreign Government Bonds | | | 1% | |
Corporate Notes and Bonds | | | | |
(Moody’s Ratings) (d) | | | | |
AA | | | 4% | |
A | | | 12% | |
BBB | | | 34% | |
BB | | | 11% | |
B | | | 3% | |
| | | | |
| | | 100% | |
| | | | |
See accompanying Notes to Financial Statements.
| | |
| |
| ASTON/Lake Partners LASSO Alternatives Fund | | April 30, 2013 |
| |
| Schedule of Investments (unaudited) | | |
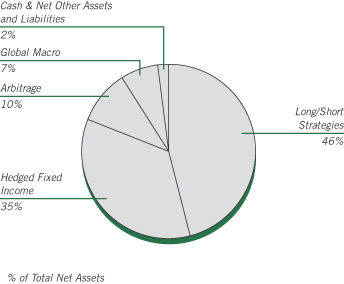
| | | | | | | | |
Shares | | | | | Market
Value | |
|
| | INVESTMENT COMPANIES – 99.81% | |
| | |
| | | | Convertible Arbitrage – 4.99% | | | | |
| | 1,449,251 | | | Calamos Market Neutral Income Fund | | $ | 18,492,443 | |
| | | | | | | | |
| | |
| | | | Merger Arbitrage – 4.98% | | | | |
| | 1,685,270 | | | Touchstone Merger Arbitrage Fund | | | 18,453,711 | |
| | | | | | | | |
| |
| | | | Hedged Credit and Strategic Fixed Income – 34.65% | |
| | 1,441,750 | | | BlackRock Global Long/Short Credit Fund-INS | | | 15,426,730 | |
| | 2,578 | | | Driehaus Active Income Fund | | | 27,812 | |
| | 740,843 | | | Driehaus Emerging Markets Small Cap Growth Fund | | | 9,282,768 | |
| | 466,301 | | | Guggenheim Macro Opportunities Fund | | | 12,949,176 | |
| | 1,625,964 | | | John Hancock Funds II - Strategic Income Opportunities Fund | | | 18,503,466 | |
| | 1,427,502 | | | Metropolitan West High Yield Bond Fund-I | | | 15,302,822 | |
| | 1,086,152 | | | Metropolitan West Unconstrained Bond Fund | | | 12,903,481 | |
| | 2,627,985 | | | PIMCO Income Fund | | | 33,480,524 | |
| | 654,582 | | | PIMCO Mortgage Opportunities Fund | | | 7,337,864 | |
| | 279,379 | | | Scout Unconstrained Bond Fund | | | 3,271,533 | |
| | | | | | | | |
| | | | | | | 128,486,176 | |
| | | | | | | | |
| | |
| | | | Global Macro – 7.48% | | | | |
| | 2,504,154 | | | John Hancock Funds II - Global Absolute Return Strategies Fund | | | 27,746,030 | |
| | | | | | | | |
| | | | | | | | |
Shares | | | | | Market
Value | |
| | |
| | | | Long/Short Strategies – 45.98% | | | | |
| | 1,430,517 | | | BlackRock Emerging Markets Long/Short Equity Fund-IS | | $ | 15,292,228 | |
| | 747,078 | | | Convergence Core Plus Fund | | | 11,318,239 | |
| | 908,768 | | | FPA Crescent Fund-I | | | 27,844,638 | |
| | 3,026,430 | | | Robeco Boston Partners Long/Short Equity Fund-IS | | | 64,584,006 | |
| | 295,628 | | | Royce Global Select Fund-INV | | | 4,981,323 | |
| | 3,234,319 | | | The Weitz Funds - Partners III Opportunity Fund | | | 46,477,164 | |
| | | | | | | | |
| | | | | | | 170,497,598 | |
| | | | | | | | |
| | |
| | | | Cash Equivalents – 1.73% | | | | |
| | 6,414,870 | | | BlackRock Liquidity Funds Treasury Trust Fund Portfolio | | | 6,414,870 | |
| | | | | | | | |
| | |
| | | | Total Investment Companies
(Cost $350,526,055) | | | 370,090,828 | |
| | | | | | | | |
| Total Investments – 99.81%
(Cost $350,526,055)* | | | 370,090,828 | |
| | | | | | | | |
| Net Other Assets and Liabilities – 0.19% | | | 707,807 | |
| | | | | | | | |
| Net Assets – 100.00% | | $ | 370,798,635 | |
| | | | | | | | |
| * | | At April 30, 2013, cost is identical for book and Federal income tax purposes. |
| | | | |
Gross unrealized appreciation | | $ | 20,281,480 | |
Gross unrealized depreciation | | | (716,707 | ) |
| | | | |
Net unrealized appreciation | | $ | 19,564,773 | |
| | | | |
See accompanying Notes to Financial Statements.
| | |
| |
| ASTON/Anchor Capital Enhanced Equity Fund | | April 30, 2013 |
| |
| Schedule of Investments (unaudited) | | |
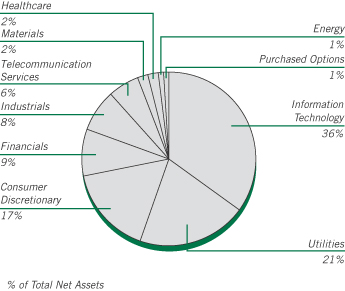
The chart represents total investments in the Fund. Net Other Assets and Liabilities are negative 4.43% and cannot be represented in the pie chart format.
| | | | | | | | |
Shares | | | | | Market
Value | |
|
| | COMMON STOCKS – 102.10% | |
| | |
| | | | Consumer Discretionary – 17.12% | | | | |
| | 129,000 | | | Carnival (a) | | $ | 4,451,790 | |
| | 460,000 | | | Ford Motor (a) | | | 6,306,600 | |
| | 115,000 | | | Kohl’s (a) | | | 5,411,900 | |
| | 500,000 | | | Staples (a) | | | 6,620,000 | |
| | | | | | | | |
| | | | | | | 22,790,290 | |
| | | | | | | | |
| | |
| | | | Energy – 0.67% | | | | |
| | 10,000 | | | Occidental Petroleum (a) | | | 892,600 | |
| | | | | | | | |
| | |
| | | | Financials – 9.11% | | | | |
| | 176,000 | | | MetLife (a) | | | 6,862,240 | |
| | 50,000 | | | SunTrust Banks (a) | | | 1,462,500 | |
| | 100,000 | | | Wells Fargo (a) | | | 3,798,000 | |
| | | | | | | | |
| | | | | | | 12,122,740 | |
| | | | | | | | |
| | |
| | | | Healthcare – 1.75% | | | | |
| | 700 | | | Medtronic (a) | | | 32,676 | |
| | 35,000 | | | Stryker (a) | | | 2,295,300 | |
| | | | | | | | |
| | | | | | | 2,327,976 | |
| | | | | | | | |
| | |
| | | | Industrials – 7.80% | | | | |
| | 45,000 | | | General Electric (a) | | | 1,003,050 | |
| | 30,000 | | | Lockheed Martin (a) | | | 2,972,700 | |
| | 7,500 | | | Norfolk Southern (a) | | | 580,650 | |
| | 95,000 | | | Raytheon (a) | | | 5,831,100 | |
| | | | | | | | |
| | | | | | | 10,387,500 | |
| | | | | | | | |
| | | | | | | | |
Shares | | | | | Market
Value | |
| | |
| | | | Information Technology – 36.07% | | | | |
| | 485,000 | | | Applied Materials (a) | | $ | 7,037,350 | |
| | 200,000 | | | Cisco Systems (a) | | | 4,184,000 | |
| | 475,000 | | | Corning (a) | | | 6,887,500 | |
| | 280,000 | | | Intel (a) | | | 6,706,000 | |
| | 73,000 | | | KLA-Tencor (a) | | | 3,960,250 | |
| | 215,000 | | | Microsoft (a) | | | 7,116,500 | |
| | 625,000 | | | Nokia OYJ, SP ADR (Finland) * (a) | | | 2,112,500 | |
| | 100,000 | | | Seagate Technology (Ireland) (a) | | | 3,670,000 | |
| | 740,000 | | | Xerox (a) | | | 6,349,200 | |
| | | | | | | | |
| | | | | | | 48,023,300 | |
| | | | | | | | |
| | |
| | | | Materials – 2.29% | | | | |
| | 90,000 | | | Dow Chemical (a) | | | 3,051,900 | |
| | | | | | | | |
| |
| | | | Telecommunication Services – 6.49% | |
| | 60,000 | | | AT&T (a) | | | 2,247,600 | |
| | 170,000 | | | CenturyLink (a) | | | 6,386,900 | |
| | | | | | | | |
| | | | | | | 8,634,500 | |
| | | | | | | | |
| | |
| | | | Utilities – 20.80% | | | | |
| | 69,000 | | | Entergy (a) | | | 4,914,870 | |
| | 150,000 | | | Exelon (a) | | | 5,626,500 | |
| | 130,000 | | | FirstEnergy (a) | | | 6,058,000 | |
| | 134,700 | | | PPL (a) | | | 4,496,286 | |
| | 180,000 | | | Public Service Enterprise Group (a) | | | 6,589,800 | |
| | | | | | | | |
| | | | | | | 27,685,456 | |
| | | | | | | | |
| | |
| | | | Total Common Stocks
(Cost $130,520,129) | | | 135,916,262 | |
| | | | | | | | |
Number of
Contracts | | | | | | |
|
| | PURCHASED OPTIONS – 0.34% | |
| | |
| | | | SPDR S&P 500 ETF Trust | | | | |
| | 1,000 | | | Strike @ $134 Exp 6/13 | | | 15,000 | |
| | 1,500 | | | Strike @ $135 Exp 6/13 | | | 24,000 | |
| | 1,500 | | | Strike @ $136 Exp 6/13 | | | 27,000 | |
| | 1,000 | | | Strike @ $137 Exp 6/13 | | | 20,000 | |
| | 1,000 | | | Strike @ $138 Exp 6/13 | | | 22,000 | |
| | 1,000 | | | Strike @ $139 Exp 6/13 | | | 25,000 | |
| | 2,000 | | | Strike @ $140 Exp 6/13 | | | 56,000 | |
| | 1,000 | | | Strike @ $141 Exp 6/13 | | | 31,000 | |
| | 1,000 | | | Strike @ $142 Exp 6/13 | | | 35,000 | |
| | 500 | | | Strike @ $136 Exp 6/13 | | | 11,250 | |
| | 1,000 | | | Strike @ $137 Exp 6/13 | | | 24,500 | |
| | 1,000 | | | Strike @ $138 Exp 6/13 | | | 32,000 | |
| | 1,000 | | | Strike @ $139 Exp 6/13 | | | 30,500 | |
| | 1,000 | | | Strike @ $140 Exp 6/13 | | | 37,000 | |
| | 500 | | | Strike @ $141 Exp 6/13 | | | 20,500 | |
| | 500 | | | Strike @ $142 Exp 6/13 | | | 22,000 | |
| | 300 | | | Strike @ $137 Exp 7/13 | | | 12,600 | |
| | 300 | | | Strike @ $138 Exp 7/13 | | | 13,650 | |
| | | | | | | | |
| | |
| | | | Total Purchased Options (Cost $1,250,547) | | | 459,000 | |
| | | | | | | | |
See accompanying Notes to Financial Statements.
| | |
| |
| ASTON/Anchor Capital Enhanced Equity Fund | | April 30, 2013 |
| |
| Schedule of Investments (unaudited) – continued | | |
| | | | | | | | |
Shares | | | | | Market
Value | |
|
| | INVESTMENT COMPANY – 1.99% | |
| | |
| | 2,649,663 | | | BlackRock Liquidity Funds TempCash Portfolio | | $ | 2,649,663 | |
| | | | | | | | |
| | |
| | | | Total Investment Company
(Cost $2,649,663) | | | 2,649,663 | |
| | | | | | | | |
| Total Investments – 104.43%
(Cost $134,420,339)** | | | 139,024,925 | |
| | | | | | | | |
| Net Other Assets and Liabilities – (4.43)% | | | (5,900,554 | ) |
| | | | | | | | |
| Net Assets – 100.00% | | $ | 133,124,371 | |
| | | | | | | | |
| * | | Non-income producing security. |
| ** | | At April 30, 2013, cost is identical for book and Federal income tax purposes. |
| | | | |
Gross unrealized appreciation | | $ | 10,358,704 | |
Gross unrealized depreciation | | | (5,754,118 | ) |
| | | | |
Net unrealized appreciation | | $ | 4,604,586 | |
| | | | |
| (a) | | These securities are pledged as collateral for written call options. |
| SP ADR | | Sponsored American Depositary Receipt |
| SPDR | | Standard & Poor’s Depositary Receipt |
Transactions in written call options for the period ended April 30, 2013 were as follows:
| | | | | | | | |
| Contracts | | Number of
Contracts | | | Premium | |
Outstanding, October 31, 2013 | | | 56,326 | | | $ | 3,939,696 | |
Call Options Written | | | 150,672 | | | | 10,318,447 | |
Call Options Closed or Expired | | | (146,917 | ) | | | (10,029,169 | ) |
Call Options Exercised | | | (932 | ) | | | (92,466 | ) |
| | | | | | | | |
Outstanding, April 30, 2013 | | | 59,149 | | | $ | 4,136,508 | |
| | | | | | | | |
Premiums received and value of written call equity options outstanding as of April 30, 2013.
| | | | | | | | | | | | |
Number of
Contracts | | | Description | | Premium
Received | | | Market
Value | |
| | | | Applied Materials | | | | | | | | |
| | 700 | | | Strike @ $13 Exp 10/13 | | | $ 86,063 | | | | $ 126,700 | |
| | 100 | | | Strike @ $14 Exp 10/13 | | | 8,100 | | | | 11,200 | |
| | 4,050 | | | Strike @ $15 Exp 1/14 | | | 249,846 | | | | 344,250 | |
| | | |
| | | | AT&T | | | | | | | | |
| | 600 | | | Strike @ $37 Exp 10/13 | | | 22,599 | | | | 97,200 | |
| | | |
| | | | Carnival | | | | | | | | |
| | 500 | | | Strike @ $35 Exp 10/13 | | | 128,997 | | | | 85,000 | |
| | 790 | | | Strike @ $34.50 Exp 1/14 | | | 157,857 | | | | 197,500 | |
| | | |
| | | | CenturyLink | | | | | | | | |
| | 493 | | | Strike @ $38 Exp 10/13 | | | 25,156 | | | | 61,625 | |
| | 1,207 | | | Strike @ $40 Exp 1/14 | | | 68,724 | | | | 108,630 | |
| | | | | | | | | | | | |
Number of
Contracts | | | Description | | Premium
Received | | | Market
Value | |
| | | | Cisco Systems | | | | | | | | |
| | 700 | | | Strike @ $20 Exp 1/14 | | | $ 138,597 | | | | $ 147,000 | |
| | 1,000 | | | Strike @ $21 Exp 1/14 | | | 126,997 | | | | 147,000 | |
| | 300 | | | Strike @ $23 Exp 1/14 | | | 21,600 | | | | 23,400 | |
| | | |
| | | | Corning | | | | | | | | |
| | 4,750 | | | Strike @ $17 Exp 1/14 | | | 73,229 | | | | 161,500 | |
| | | |
| | | | Dow Chemical | | | | | | | | |
| | 400 | | | Strike @ $35 Exp 1/14 | | | 41,099 | | | | 75,200 | |
| | 400 | | | Strike @ $37 Exp 1/14 | | | 34,615 | | | | 47,200 | |
| | | |
| | | | Entergy | | | | | | | | |
| | 532 | | | Strike @ $70 Exp 1/14 | | | 52,687 | | | | 170,240 | |
| | 158 | | | Strike @ $72.50 Exp 1/14 | | | 20,613 | | | | 38,315 | |
| | | |
| | | | Exelon | | | | | | | | |
| | 500 | | | Strike @ $35 Exp 10/13 | | | 22,000 | | | | 155,000 | |
| | 300 | | | Strike @ $36 Exp 10/13 | | | 15,000 | | | | 66,300 | |
| | 700 | | | Strike @ $35 Exp 1/14 | | | 52,799 | | | | 210,000 | |
| | | |
| | | | FirstEnergy | | | | | | | | |
| | 200 | | | Strike @ $47 Exp 7/13 | | | 5,812 | | | | 16,000 | |
| | 200 | | | Strike @ $44 Exp 10/13 | | | 9,800 | | | | 57,000 | |
| | 900 | | | Strike @ $50 Exp 1/14 | | | 28,808 | | | | 51,300 | |
| | | |
| | | | Ford Motor | | | | | | | | |
| | 485 | | | Strike @ $14 Exp 12/13 | | | 31,671 | | | | 40,255 | |
| | 2,000 | | | Strike @ $15 Exp 12/13 | | | 82,037 | | | | 102,000 | |
| | 315 | | | Strike @ $16 Exp 12/13 | | | 9,295 | | | | 9,135 | |
| | 800 | | | Strike @ $15 Exp 1/14 | | | 42,211 | | | | 46,400 | |
| | 1,000 | | | Strike @ $17 Exp 1/14 | | | 20,529 | | | | 21,000 | |
| | | |
| | | | General Electric | | | | | | | | |
| | 450 | | | Strike @ $22 Exp 1/14 | | | 47,249 | | | | 64,800 | |
| | | |
| | | | Intel | | | | | | | | |
| | 500 | | | Strike @ $25 Exp 1/14 | | | 19,500 | | | | 53,500 | |
| | 2,300 | | | Strike @ $27 Exp 1/14 | | | 41,874 | | | | 117,300 | |
| | | |
| | | | KLA-Tencor | | | | | | | | |
| | 730 | | | Strike @ $50 Exp 1/14 | | | 334,391 | | | | 501,510 | |
| | | |
| | | | Kohl’s | | | | | | | | |
| | 558 | | | Strike @ $50 Exp 10/13 | | | 83,433 | | | | 93,744 | |
| | 151 | | | Strike @ $52.50 Exp 1/14 | | | 22,403 | | | | 22,952 | |
| | 441 | | | Strike @ $55 Exp 1/14 | | | 40,699 | | | | 40,131 | |
| | | |
| | | | Lockheed Martin | | | | | | | | |
| | 100 | | | Strike @ $92.50 Exp 9/13 | | | 17,296 | | | | 75,000 | |
| | 200 | | | Strike @ $95 Exp 9/13 | | | 47,575 | | | | 112,000 | |
| | | |
| | | | Medtronic | | | | | | | | |
| | 7 | | | Strike @ $43 Exp 5/13 | | | 911 | | | | 2,625 | |
| | | |
| | | | MetLife | | | | | | | | |
| | 100 | | | Strike @ $36 Exp 6/13 | | | 12,530 | | | | 32,300 | |
| | 1,200 | | | Strike @ $37 Exp 9/13 | | | 223,450 | | | | 396,000 | |
| | 460 | | | Strike @ $40 Exp 1/14 | | | 87,436 | | | | 118,220 | |
| | | |
| | | | Microsoft | | | | | | | | |
| | 1,300 | | | Strike @ $32 Exp 1/14 | | | 123,947 | | | | 327,600 | |
| | 850 | | | Strike @ $35 Exp 1/14 | | | 19,023 | | | | 106,250 | |
See accompanying Notes to Financial Statements.
| | |
| |
| ASTON/Anchor Capital Enhanced Equity Fund | | April 30, 2013 |
| |
| Schedule of Investments (unaudited) – continued | | |
| | | | | | | | | | | | |
Number of
Contracts | | | Description | | Premium
Received | | | Market
Value | |
| | | | Nokia | | | | | | | | |
| | 1,163 | | | Strike @ $5 Exp 7/13 | | | $ 17,550 | | | | $ 3,489 | |
| | 1,000 | | | Strike @ $6 Exp 7/13 | | | 15,350 | | | | 1,000 | |
| | 47 | | | Strike @ $5.50 Exp 1/14 | | | 1,699 | | | | 611 | |
| | 4,040 | | | Strike @ $7 Exp 1/14 | | | 63,526 | | | | 20,200 | |
| | | |
| | | | Norfolk Southern | | | | | | | | |
| | 3 | | | Strike @ $65 Exp 6/13 | | | 354 | | | | 3,780 | |
| | 12 | | | Strike @ $67.50 Exp 6/13 | | | 1,536 | | | | 12,000 | |
| | 60 | | | Strike @ $70 Exp 6/13 | | | 8,580 | | | | 45,420 | |
| | | |
| | | | Occidental Petroleum | | | | | | | | |
| | 50 | | | Strike @ $90 Exp 1/14 | | | 9,650 | | | | 31,250 | |
| | 50 | | | Strike @ $95 Exp 1/14 | | | 9,500 | | | | 22,000 | |
| | | |
| | | | PPL | | | | | | | | |
| | 544 | | | Strike @ $30 Exp 7/13 | | | 26,638 | | | | 184,960 | |
| | 803 | | | Strike @ $31 Exp 7/13 | | | 24,006 | | | | 188,705 | |
| | | |
| | | | Public Service Enterprise | | | | | | | | |
| | 1,800 | | | Strike @ $35 Exp 9/13 | | | 52,333 | | | | 351,000 | |
| | | |
| | | | Raytheon | | | | | | | | |
| | 400 | | | Strike @ $57.50 Exp 8/13 | | | 43,184 | | | | 190,000 | |
| | 499 | | | Strike @ $57.50 Exp 1/14 | | | 83,811 | | | | 260,728 | |
| | 51 | | | Strike @ $60 Exp 1/14 | | | 6,169 | | | | 18,105 | |
| | | |
| | | | Seagate Technology | | | | | | | | |
| | 400 | | | Strike @ $42 Exp 9/13 | | | 40,484 | | | | 37,200 | |
| | 100 | | | Strike @ $44 Exp 9/13 | | | 10,296 | | | | 6,150 | |
| | 50 | | | Strike @ $43 Exp 12/13 | | | 6,748 | | | | 7,275 | |
| | 150 | | | Strike @ $40 Exp 1/14 | | | 27,594 | | | | 35,250 | |
| | 250 | | | Strike @ $43 Exp 1/14 | | | 38,340 | | | | 37,250 | |
| | | |
| | | | Staples | | | | | | | | |
| | 1,500 | | | Strike @ $15 Exp 1/14 | | | 90,733 | | | | 94,500 | |
| | 3,000 | | | Strike @ $17 Exp 1/14 | | | 144,776 | | | | 105,000 | |
| | 500 | | | Strike @ $20 Exp 1/14 | | | 7,000 | | | | 2,500 | |
| | | |
| | | | Stryker | | | | | | | | |
| | 200 | | | Strike @ $57.50 Exp 6/13 | | | 31,599 | | | | 166,000 | |
| | 150 | | | Strike @ $60 Exp 6/13 | | | 15,085 | | | | 85,500 | |
| | | |
| | | | SunTrust Banks | | | | | | | | |
| | 500 | | | Strike @ $30 Exp 1/14 | | | 72,480 | | | | 100,750 | |
| | | |
| | | | Wells Fargo | | | | | | | | |
| | 1,000 | | | Strike @ $36 Exp 10/13 | | | 157,996 | | | | 277,000 | |
| | | |
| | | | Xerox | | | | | | | | |
| | 2,056 | | | Strike @ $8 Exp 10/13 | | | 177,882 | | | | 192,236 | |
| | 150 | | | Strike @ $9 Exp 10/13 | | | 6,000 | | | | 6,300 | |
| | 4,194 | | | Strike @ $10 Exp 1/14 | | | 147,153 | | | | 117,432 | |
| | 1,000 | | | Strike @ $8 Exp 1/14 | | | 99,998 | | | | 110,000 | |
| | | | | | | | | | | | |
| | | |
| | | | Total Written Call Options | | | $4,136,508 | | | | $7,393,873 | |
| | | | | | | | | | | | |
See accompanying Notes to Financial Statements.
| | |
| |
| ASTON/River Road Long-Short Fund | | April 30, 2013 |
| |
| Schedule of Investments (unaudited) | | |
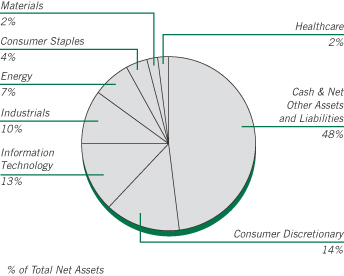
The chart represents total investments in the Fund. Exchange Traded Funds and Utilities are negative 3.28% and 0.66%, respectively, and cannot be represented in the pie chart format.
| | | | | | | | |
Shares | | | | | Market
Value | |
|
| | COMMON STOCKS – 72.10% | |
| | |
| | | | Consumer Discretionary – 21.38% | | | | |
| | 19,229 | | | Bob Evans Farms | | $ | 833,385 | |
| | 8,741 | | | Coach (a) | | | 514,495 | |
| | 21,111 | | | DIRECTV * (a) | | | 1,194,038 | |
| | 22,964 | | | General Motors * (a) | | | 708,210 | |
| | 13,128 | | | Kohl’s (a) | | | 617,804 | |
| | 34,891 | | | Regis (a) | | | 654,206 | |
| | 13,347 | | | Thomson Reuters (a) | | | 446,991 | |
| | 9,599 | | | Viacom, Class B (a) | | | 614,240 | |
| | | | | | | | |
| | | | | | | 5,583,369 | |
| | | | | | | | |
| | |
| | | | Consumer Staples – 4.48% | | | | |
| | 11,177 | | | Harris Teeter Supermarkets (a) | | | 467,087 | |
| | 13,633 | | | Molson Coors Brewing, Class B (a) | | | 703,463 | |
| | | | | | | | |
| | | | | | | 1,170,550 | |
| | | | | | | | |
| | |
| | | | Energy – 7.25% | | | | |
| | 23,455 | | | Cloud Peak Energy * | | | 458,311 | |
| | 7,092 | | | Devon Energy (a) | | | 390,486 | |
| | 5,954 | | | Occidental Petroleum (a) | | | 531,454 | |
| | 9,393 | | | Williams Partners LP (a) | | | 513,327 | |
| | | | | | | | |
| | | | | | | 1,893,578 | |
| | | | | | | | |
| | |
| | | | Financials – 4.90% | | | | |
| | 13,617 | | | American International Group * (a) | | | 564,016 | |
| | 1,236 | | | White Mountains Insurance Group (a) | | | 714,791 | |
| | | | | | | | |
| | | | | | | 1,278,807 | |
| | | | | | | | |
| | |
| | | | Healthcare – 2.42% | | | | |
| | 10,650 | | | Express Scripts * (a) | | | 632,290 | |
| | | | | | | | |
| | | | | | | | |
Shares | | | | | Market
Value | |
| | |
| | | | Industrials – 11.35% | | | | |
| | 17,071 | | | ADT (a) | | $ | 744,978 | |
| | 14,688 | | | Cubic | | | 631,143 | |
| | 26,488 | | | Expeditors International of
Washington (a) | | | 951,714 | |
| | 11,280 | | | Joy Global (a) | | | 637,546 | |
| | | | | | | | |
| | | | | | | 2,965,381 | |
| | | | | | | | |
| | |
| | | | Information Technology – 13.67% | | | | |
| | 1,214 | | | Apple | | | 537,498 | |
| | 18,805 | | | Global Payments | | | 872,552 | |
| | 20,377 | | | MICROS Systems * (a) | | | 864,189 | |
| | 23,809 | | | Oracle (a) | | | 780,459 | |
| | 17,833 | | | ScanSource * | | | 516,622 | |
| | | | | | | | |
| | | | | | | 3,571,320 | |
| | | | | | | | |
| | |
| | | | Materials – 2.72% | | | | |
| | 38,650 | | | Intrepid Potash (a) | | | 711,547 | |
| | | | | | | | |
| |
| | | | Telecommunication Services – 1.92% | |
| | 16,352 | | | Vodafone Group, SP ADR
(United Kingdom) (a) | | | 500,208 | |
| | | | | | | | |
| | |
| | | | Utilities – 2.01% | | | | |
| | 8,364 | | | National Fuel Gas (a) | | | 524,590 | |
| | | | | | | | |
| | |
| | | | Total Common Stocks
(Cost $17,984,208) | | | 18,831,640 | |
| | | | | | | | |
|
| | INVESTMENT COMPANY – 24.68% | |
| | |
| | 6,444,570 | | | BlackRock Liquidity Funds
TempCash Portfolio | | | 6,444,570 | |
| | | | | | | | |
| | |
| | | | Total Investment Company
(Cost $6,444,570) | | | 6,444,570 | |
| | | | | | | | |
| Total Investments – 96.78%
(Cost $24,428,778)** | | | 25,276,210 | |
| | | | | | | | |
| $5,455,267 in cash and $9,099,145 in securities was segregated or on
deposit with a prime broker to cover short sales as of April 30, 2013 and
are included in “Net Other Assets and Liabilities”. |
|
|
| | SHORT SALES – (24.08)% | |
| | |
| | | | Consumer Discretionary – (7.79)% | | | | |
| | (9,371) | | | American Axle & Manufacturing Holdings * | | | (125,290 | ) |
| | (2,138) | | | Bed Bath & Beyond * | | | (147,094 | ) |
| | (3,573) | | | BJ’s Restaurants * | | | (122,554 | ) |
| | (7,668) | | | Brown Shoe | | | (129,666 | ) |
| | (3,599) | | | Five Below * | | | (129,528 | ) |
| | (4,092) | | | GameStop, Class A | | | (142,811 | ) |
| | (14,183) | | | Goodyear Tire & Rubber * | | | (177,216 | ) |
| | (13,775) | | | LifeLock * | | | (123,975 | ) |
| | (4,062) | | | Mattress Firm Holding * | | | (155,656 | ) |
| | (7,186) | | | Monro Muffler Brake | | | (297,213 | ) |
| | (25,533) | | | Saks * | | | (294,906 | ) |
| | (5,509) | | | Toll Brothers * | | | (189,014 | ) |
| | | | | | | | |
| | | | | | | (2,034,923 | ) |
| | | | | | | | |
See accompanying Notes to Financial Statements.
| | |
| |
| ASTON/River Road Long-Short Fund | | April 30, 2013 |
| |
| Schedule of Investments (unaudited) – continued | | |
| | | | | | | | |
Shares | | | | | Market
Value | |
| | |
| | | | Exchange Traded Funds – (3.28)% | | | | |
| | (20,953) | | | United States Natural Gas Fund LP * | | $ | (491,767 | ) |
| | (11,022) | | �� | United States Oil Fund LP * | | | (365,490 | ) |
| | | | | | | | |
| | | | | | | (857,257 | ) |
| | | | | | | | |
| | |
| | | | Financials – (4.99)% | | | | |
| | (9,963) | | | Amtrust Financial Services | | | (315,428 | ) |
| | (8,752) | | | CBL & Associates Properties, REIT | | | (211,273 | ) |
| | (7,829) | | | Equity One, REIT | | | (199,561 | ) |
| | (9,712) | | | Mercury General | | | (443,936 | ) |
| | (1,626) | | | Toronto-Dominion Bank | | | (133,169 | ) |
| | | | | | | | |
| | | | | | | (1,303,367 | ) |
| | | | | | | | |
| | |
| | | | Healthcare – (0.49)% | | | | |
| | (6,403) | | | Masimo | | | (128,444 | ) |
| | | | | | | | |
| | |
| | | | Industrials – (1.38)% | | | | |
| | (7,504) | | | Albany International, Class A * | | | (217,991 | ) |
| | (6,350) | | | InnerWorkings * | | | (63,945 | ) |
| | (2,670) | | | Simpson Manufacturing | | | (76,736 | ) |
| | | | | | | | |
| | | | | | | (358,672 | ) |
| | | | | | | | |
| | |
| | | | Information Technology – (0.48)% | | | | |
| | (6,167) | | | RealPage * | | | (125,807 | ) |
| | | | | | | | |
| | |
| | | | Materials – (0.70)% | | | | |
| | (6,890) | | | Teck Resources, Class B | | | (183,067 | ) |
| | | | | | | | |
| | |
| | | | Telecommunication Services – (2.30)% | | | | |
| | (5,319) | | | CenturyLink | | | (199,835 | ) |
| | (21,691) | | | Consolidated Communications Holdings | | | (399,765 | ) |
| | | | | | | | |
| | | | | | | (599,600 | ) |
| | | | | | | | |
| | |
| | | | Utilities – (2.67)% | | | | |
| | (3,433) | | | DTE Energy | | | (250,197 | ) |
| | (3,379) | | | Duke Energy | | | (254,101 | ) |
| | (3,134) | | | South Jersey Industries | | | (193,368 | ) |
| | | | | | | | |
| | | | | | | (697,666) | |
| | | | | | | | |
| Total Short Sales – (24.08)%
(Proceeds $6,024,290) | | | (6,288,803 | ) |
| | | | | | | | |
| Net Other Assets and Liabilities – 27.30% | | | 7,129,489 | |
| | | | | | | | |
| Net Assets – 100.00% | | $ | 26,116,896 | |
| | | | | | | | |
| * | | Non-income producing security. |
| ** | | At April 30, 2013, cost is identical for book and Federal income tax purposes. |
| | | | |
Gross unrealized appreciation | | $ | 953,842 | |
Gross unrealized depreciation | | | (106,410 | ) |
| | | | |
Net unrealized appreciation | | $ | 847,432 | |
| | | | |
| (a) | | Security position is either entirely or partially held in a segregated account as collateral for securities sold short. |
| REIT | | Real Estate Investment Trust |
| SP ADR | | Sponsored American Depositary Receipt |
See accompanying Notes to Financial Statements.
| | |
| |
| ASTON/Barings International Fund | | April 30, 2013 |
| |
| Schedule of Investments (unaudited) | | |
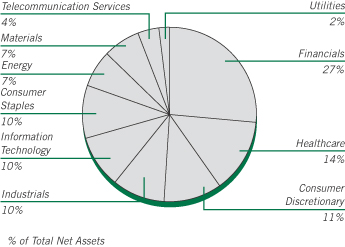
The chart represents total investments in the Fund. Net Other Assets and Liabilities are negative 2.31% and cannot be represented in the pie chart format.
| | | | | | | | |
Shares | | | | | Market
Value | |
|
| | COMMON STOCKS – 101.69% | |
| | |
| | | | Belgium – 1.65% | | | | |
| | 11,745 | | | Anheuser-Busch InBev | | $ | 1,117,533 | |
| | | | | | | | |
| | |
| | | | China – 1.56% | | | | |
| | 6,200 | | | Baidu, SP ADR * | | | 532,270 | |
| | 147,200 | | | China Pacific Insurance Group | | | 529,227 | |
| | | | | | | | |
| | | | | | | 1,061,497 | |
| | | | | | | | |
| | |
| | | | Denmark – 1.22% | | | | |
| | 4,737 | | | Novo Nordisk, Class B | | | 830,906 | |
| | | | | | | | |
| | |
| | | | France – 8.52% | | | | |
| | 7,100 | | | Air Liquide | | | 898,755 | |
| | 8,853 | | | Sanofi | | | 970,259 | |
| | 30,931 | | | Scor Se | | | 938,729 | |
| | 30,014 | | | SES | | | 937,184 | |
| | 68,763 | | | Suez Environnement | | | 987,529 | |
| | 20,999 | | | Total | | | 1,058,343 | |
| | | | | | | | |
| | | | | | | 5,790,799 | |
| | | | | | | | |
| | |
| | | | Germany – 9.69% | | | | |
| | 9,449 | | | Adidas | | | 986,798 | |
| | 11,559 | | | Bayer | | | 1,205,937 | |
| | 17,234 | | | Deutsche Boerse | | | 1,075,806 | |
| | 8,031 | | | Fresenius | | | 1,007,088 | |
| | 5,960 | | | Muenchener Rueckversicherungs-Gesellschaft | | | 1,191,874 | |
| | 14,080 | | | SAP | | | 1,118,308 | |
| | | | | | | | |
| | | | | | | 6,585,811 | |
| | | | | | | | |
| | |
| | | | Hong Kong – 0.92% | | | | |
| | 141,200 | | | AIA Group | | | 626,836 | |
| | | | | | | | |
| | | | | | | | |
Shares | | | | | Market
Value | |
| | |
| | | | Israel – 2.11% | | | | |
| | 58,896 | | | Israel Chemicals | | $ | 700,509 | |
| | 19,052 | | | Teva Pharmaceutical Industries, SP ADR | | | 729,501 | |
| | | | | | | | |
| | | | | | | 1,430,010 | |
| | | | | | | | |
| | |
| | | | Japan – 24.84% | | | | |
| | 11,800 | | | Astellas Pharma | | | 686,321 | |
| | 22,800 | | | Denso | | | 1,020,896 | |
| | 9,200 | | | East Japan Railway | | | 775,750 | |
| | 4,700 | | | FANUC | | | 708,724 | |
| | 59,000 | | | Hitachi Metals | | | 609,458 | |
| | 144,000 | | | Isuzu Motors | | | 958,671 | |
| | 35,100 | | | Japan Tobacco | | | 1,326,804 | |
| | 2,590 | | | KEYENCE | | | 820,957 | |
| | 37,200 | | | Komatsu | | | 1,014,667 | |
| | 11,300 | | | Kyocera | | | 1,148,720 | |
| | 37,500 | | | Mitsubishi | | | 672,411 | |
| | 106,000 | | | Mitsubishi Electric | | | 1,009,058 | |
| | 142,500 | | | Mitsubishi UFJ Financial Group | | | 969,149 | |
| | 89,700 | | | Rakuten | | | 956,027 | |
| | 167,000 | | | Sumitomo Mitsui Trust Holdings | | | 837,698 | |
| | 15,800 | | | Takeda Pharmaceutical | | | 867,108 | |
| | 30,000 | | | Tokio Marine Holdings | | | 950,916 | |
| | 7,900 | | | Tokyo Electron | | | 404,380 | |
| | 19,700 | | | Toyota Motor | | | 1,139,745 | |
| | | | | | | | |
| | | | | | | 16,877,460 | |
| | | | | | | | |
| | |
| | | | Mexico – 1.39% | | | | |
| | 18,648 | | | America Movil, Class L, ADR | | | 398,694 | |
| | 30,539 | | | Fresnillo | | | 546,483 | |
| | | | | | | | |
| | | | | | | 945,177 | |
| | | | | | | | |
| | |
| | | | Netherlands – 3.83% | | | | |
| | 12,018 | | | ASML Holding NV | | | 893,440 | |
| | 10,859 | | | Fugro | | | 628,161 | |
| | 31,715 | | | Royal Dutch Shell, Class A | | | 1,079,053 | |
| | | | | | | | |
| | | | | | | 2,600,654 | |
| | | | | | | | |
| | |
| | | | Norway – 2.27% | | | | |
| | 33,980 | | | Subsea 7 | | | 731,868 | |
| | 17,274 | | | Yara International | | | 808,806 | |
| | | | | | | | |
| | | | | | | 1,540,674 | |
| | | | | | | | |
| | |
| | | | Russia – 2.39% | | | | |
| | 35,302 | | | Mobile Telesystems, SP ADR | | | 730,751 | |
| | 69,471 | | | Sberbank of Russia, ADR * | | | 893,397 | |
| | | | | | | | |
| | | | | | | 1,624,148 | |
| | | | | | | | |
| | |
| | | | Singapore – 3.56% | | | | |
| | 66,000 | | | DBS Group Holdings | | | 898,076 | |
| | 1,610,000 | | | Golden Agri-Resources | | | 692,782 | |
| | 92,700 | | | Keppel | | | 806,054 | |
| | 18,540 | | | Keppel REIT (a) | | | 22,729 | |
| | | | | | | | |
| | | | | | | 2,419,641 | |
| | | | | | | | |
See accompanying Notes to Financial Statements.
| | |
| |
| ASTON/Barings International Fund | | April 30, 2013 |
| |
| Schedule of Investments (unaudited) – continued | | |
| | | | | | | | |
Shares | | | | | Market
Value | |
| | |
| | | | South Korea – 1.18% | | | | |
| | 580 | | | Samsung Electronics | | $ | 800,508 | |
| | | | | | | | |
| | |
| | | | Sweden – 2.20% | | | | |
| | 63,207 | | | Elekta AB, B Shares | | | 971,845 | |
| | 76,008 | | | TeliaSonera | | | 522,939 | |
| | | | | | | | |
| | | | | | | 1,494,784 | |
| | | | | | | | |
| | |
| | | | Switzerland – 9.60% | | | | |
| | 37,307 | | | Credit Suisse Group | | | 1,034,396 | |
| | 31,847 | | | Julius Baer Group | | | 1,268,674 | |
| | 4,630 | | | Roche Holding | | | 1,157,251 | |
| | 2,083 | | | Syngenta | | | 890,282 | |
| | 51,580 | | | UBS | | | 920,873 | |
| | 4,490 | | | Zurich Financial Services | | | 1,253,607 | |
| | | | | | | | |
| | | | | | | 6,525,083 | |
| | | | | | | | |
| | |
| | | | Taiwan – 1.29% | | | | |
| | 45,900 | | | Taiwan Semiconductor Manufacturing, SP ADR | | | 875,772 | |
| | | | | | | | |
| | |
| | | | United Kingdom – 23.47% | | | | |
| | 54,262 | | | Admiral Group | | | 1,079,728 | |
| | 51,523 | | | BG Group | | | 867,961 | |
| | 19,170 | | | British American Tobacco | | | 1,061,873 | |
| | 217,046 | | | BT Group | | | 931,204 | |
| | 49,023 | | | Experian | | | 862,017 | |
| | 43,987 | | | GlaxoSmithKline | | | 1,134,573 | |
| | 165,182 | | | ICAP | | | 738,453 | |
| | 19,397 | | | Imperial Tobacco Group | | | 692,998 | |
| | 70,818 | | | Prudential | | | 1,215,557 | |
| | 3,913 | | | Randgold Resources | | | 307,560 | |
| | 12,056 | | | Reckitt Benckiser Group | | | 879,429 | |
| | 210,014 | | | Resolution | | | 860,908 | |
| | 61,585 | | | Rolls-Royce Holdings | | | 1,080,993 | |
| | 7,328,615 | | | Rolls-Royce Holdings, C Shares (a) (b) | | | 11,384 | |
| | 22,972 | | | SABMiller | | | 1,237,684 | |
| | 37,811 | | | Standard Chartered | | | 949,724 | |
| | 42,994 | | | Tullow Oil | | | 668,515 | |
| | 82,868 | | | WPP | | | 1,369,613 | |
| | | | | | | | |
| | | | | | | 15,950,174 | |
| | | | | | | | |
| | |
| | | | Total Common Stocks
(Cost $61,984,677) | | | 69,097,467 | |
| | | | | | | | |
|
| | INVESTMENT COMPANY – 0.62% | |
| | |
| | 421,643 | | | BlackRock Liquidity Funds TempCash Portfolio | | | 421,643 | |
| | | | | | | | |
| | |
| | | | Total Investment Company
(Cost $421,643) | | | 421,643 | |
| | | | | | | | |
| Total Investments – 102.31%
(Cost $62,406,320)** | | | 69,519,110 | |
| | | | | | | | |
| Net Other Assets and Liabilities – (2.31)% | | | (1,568,741 | ) |
| | | | | | | | |
| Net Assets – 100.00% | | $ | 67,950,369 | |
| | | | | | | | |
| * | | Non-income producing security. |
| ** | | At April 30, 2013, cost is identical for book and Federal income tax purposes. |
| | | | |
Gross unrealized appreciation | | $ | 9,185,776 | |
Gross unrealized depreciation | | | (2,072,986 | ) |
| | | | |
Net unrealized appreciation | | $ | 7,112,790 | |
| | | | |
| (a) | | These securities have been determined by the Subadviser to be illiquid securities. At April 30, 2013, these securities amounted to $34,113 or 0.05% of net assets. |
| (b) | | Security with a total aggregate market value of $11,384 or 0.02% of the net assets was valued under the fair value procedures established by the Funds’ Board of Trustees. |
| ADR | | American Depositary Receipt |
| REIT | | Real Estate Investment Trust |
| SP ADR | | Sponsored American Depositary Receipt |
See accompanying Notes to Financial Statements.
| | |
| |
| ASTON/LMCG Emerging Markets Fund | | April 30, 2013 |
| |
| Schedule of Investments (unaudited) | | |
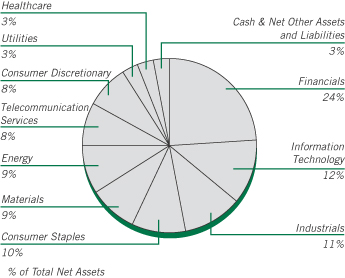
| | | | | | | | |
Shares | | | | | Market
Value | |
|
| | COMMON STOCKS – 92.43% | |
| | |
| | | | Bermuda – 0.68% | | | | |
| | 2,550 | | | VimpelCom, SP ADR | | $ | 27,923 | |
| | | | | | | | |
| | |
| | | | Brazil – 8.57% | | | | |
| | 3,413 | | | Banco Bradesco, ADR | | | 56,622 | |
| | 509 | | | Cia Brasileira de Distribuicao Grupo Pao de Acucar, SP ADR | | | 28,280 | |
| | 3,018 | | | Cia de Saneamento Basico do Estado de Sao Paulo, ADR | | | 43,157 | |
| | 2,800 | | | Cia Energetica de Minas Gerais | | | 35,323 | |
| | 2,000 | | | Grupo BTG Pactual | | | 32,958 | |
| | 9,600 | | | JBS | | | 30,277 | |
| | 2,600 | | | Sao Martinho | | | 36,568 | |
| | 10,100 | | | Suzano Papel e Celulose, Preference A * | | | 36,952 | |
| | 3,087 | | | Vale, SP ADR | | | 50,195 | |
| | | | | | | | |
| | | | | | | 350,332 | |
| | | | | | | | |
| | |
| | | | Chile – 0.69% | | | | |
| | 1,493 | | | Enersis, SP ADR | | | 28,188 | |
| | | | | | | | |
| | |
| | | | China – 10.88% | | | | |
| | 143,000 | | | Bank of China, Class H | | | 66,892 | |
| | 30,000 | | | China Communications Construction, Class H | | | 28,724 | |
| | 40,000 | | | China Communications Services, Class H | | | 29,278 | |
| | 51,000 | | | China Construction Bank, Class H | | | 42,718 | |
| | 30,500 | | | China Minsheng Banking, Class H | | | 39,185 | |
| | 64,000 | | | China Southern Airlines, Class H | | | 33,649 | |
| | 20,000 | | | CNOOC | | | 37,319 | |
| | 57,000 | | | Industrial and Commercial Bank of China, Class H | | | 40,105 | |
| | 84,000 | | | Sinopec Shanghai Petrochemical, Class H | | | 28,902 | |
| | 45,000 | | | Sunac China Holdings | | | 36,301 | |
| | 2,061 | | | WuXi PharmaTech Cayman, ADR * | | | 39,303 | |
| | 244,000 | | | Yuanda China Holdings | | | 22,324 | |
| | | | | | | | |
| | | | | | | 444,700 | |
| | | | | | | | |
| | | | | | | | |
Shares | | | | | Market
Value | |
| | |
| | | | Hong Kong – 4.31% | | | | |
| | 6,000 | | | China Mobile | | $ | 65,682 | |
| | 20,000 | | | China State Construction International Holdings | | | 29,123 | |
| | 20,000 | | | COSCO Pacific | | | 26,494 | |
| | 1,131 | | | Focus Media Holding, ADR | | | 30,842 | |
| | 80,000 | | | MMG * | | | 24,020 | |
| | | | | | | | |
| | | | | | | 176,161 | |
| | | | | | | | |
| | |
| | | | Hungary – 0.73% | | | | |
| | 417 | | | MOL Hungarian Oil and Gas | | | 29,615 | |
| | | | | | | | |
| | |
| | | | India – 1.49% | | | | |
| | 967 | | | ICICI Bank, SP ADR | | | 45,275 | |
| | 2,161 | | | Sterlite Industries India, ADR | | | 15,624 | |
| | | | | | | | |
| | | | | | | 60,899 | |
| | | | | | | | |
| | |
| | | | Indonesia – 3.06% | | | | |
| | 41,500 | | | Bank Mandiri Persero | | | 44,819 | |
| | 35,000 | | | Indofood CBP Sukses Makmur | | | 41,219 | |
| | 32,500 | | | Telekomunikasi Indonesia Persero | | | 39,110 | |
| | | | | | | | |
| | | | | | | 125,148 | |
| | | | | | | | |
| | |
| | | | Malaysia – 1.68% | | | | |
| | 39,600 | | | Malaysia Building Society | | | 35,793 | |
| | 15,800 | | | Top Glove | | | 32,820 | |
| | | | | | | | |
| | | | | | | 68,613 | |
| | | | | | | | |
| | |
| | | | Mexico – 3.21% | | | | |
| | 5,100 | | | Fomento Economico Mexicano | | | 57,837 | |
| | 6,100 | | | Grupo Aeroportuario del Pacifico | | | 35,332 | |
| | 10,000 | | | Grupo Comercial Chedraui | | | 38,115 | |
| | | | | | | | |
| | | | | | | 131,284 | |
| | | | | | | | |
| | |
| | | | Philippines – 1.97% | | | | |
| | 66,500 | | | Alliance Global Group | | | 38,291 | |
| | 36,700 | | | JG Summit Holdings | | | 42,353 | |
| | | | | | | | |
| | | | | | | 80,644 | |
| | | | | | | | |
| | |
| | | | Poland – 1.62% | | | | |
| | 613 | | | KGHM Polska Miedz | | | 28,711 | |
| | 2,413 | | | Polski Koncern Naftowy Orlen * | | | 37,419 | |
| | | | | | | | |
| | | | | | | 66,130 | |
| | | | | | | | |
| | |
| | | | Russia – 5.56% | | | | |
| | 1,026 | | | Gazprom Neft, SP ADR * | | | 20,930 | |
| | 6,858 | | | Gazprom, SP ADR | | | 54,521 | |
| | 593 | | | Lukoil, SP ADR | | | 37,744 | |
| | 4,761 | | | Sberbank, SP ADR * | | | 61,226 | |
| | 1,664 | | | Severstal, GDR | | | 14,069 | |
| | 1,031 | | | Tatneft, SP ADR | | | 38,961 | |
| | | | | | | | |
| | | | | | | 227,451 | |
| | | | | | | | |
| | |
| | | | South Africa – 8.90% | | | | |
| | 5,507 | | | African Bank Investments | | | 17,484 | |
| | 1,755 | | | Imperial Holdings | | | 38,861 | |
See accompanying Notes to Financial Statements.
| | |
| |
| ASTON/LMCG Emerging Markets Fund | | April 30, 2013 |
| |
| Schedule of Investments (unaudited) – continued | | |
| | | | | | | | |
Shares | | | | | Market
Value | |
| | |
| | | | South Africa (continued) | | | | |
| | 2,485 | | | Liberty Holdings | | $ | 33,093 | |
| | 5,023 | | | Mediclinic International | | | 36,412 | |
| | 2,746 | | | Mondi | | | 36,706 | |
| | 3,357 | | | MTN Group | | | 60,522 | |
| | 8,922 | | | Sappi * | | | 26,845 | |
| | 581 | | | Sasol | | | 25,111 | |
| | 8,825 | | | Steinhoff International Holdings * | | | 23,554 | |
| | 13,537 | | | Super Group * | | | 36,371 | |
| | 2,447 | | | Vodacom Group | | | 28,690 | |
| | | | | | | | |
| | | | | | | 363,649 | |
| | | | | | | | |
| | |
| | | | South Korea – 17.46% | | | | |
| | 5,590 | | | Asiana Airlines * | | | 26,547 | |
| | 97 | | | CJ CheilJedang | | | 28,713 | |
| | 930 | | | Hanwha | | | 26,347 | |
| | 184 | | | Hyundai Mobis | | | 41,769 | |
| | 295 | | | Hyundai Motor | | | 53,439 | |
| | 116 | | | KCC | | | 34,443 | |
| | 1,220 | | | Korea Electric Power * | | | 35,061 | |
| | 405 | | | KT&G | | | 29,162 | |
| | 1,310 | | | LG Display * | | | 35,626 | |
| | 521 | | | LG Electronics | | | 41,678 | |
| | 4,780 | | | LG Uplus * | | | 45,139 | |
| | 104 | | | Lotte Shopping | | | 38,812 | |
| | 3,070 | | | Meritz Fire & Marine Insurance | | | 33,312 | |
| | 930 | | | Samsung Card | | | 35,678 | |
| | 136 | | | Samsung Electronics | | | 187,705 | |
| | 142 | | | SK Holdings | | | 20,437 | |
| | | | | | | | |
| | | | | | | 713,868 | |
| | | | | | | | |
| | |
| | | | Taiwan – 8.80% | | | | |
| | 3,000 | | | Asustek Computer | | | 34,918 | |
| | 20,000 | | | Chipbond Technology | | | 50,827 | |
| | 10,000 | | | Chong Hong Construction | | | 34,562 | |
| | 51,000 | | | King Yuan Electronics | | | 36,290 | |
| | 20,000 | | | Pegatron * | | | 32,732 | |
| | 20,000 | | | Taiwan Semiconductor Manufacturing | | | 74,207 | |
| | 29,000 | | | Uni-President Enterprises | | | 57,092 | |
| | 36,000 | | | Vanguard International Semiconductor | | | 39,218 | |
| | | | | | | | |
| | | | | | | 359,846 | |
| | | | | | | | |
| | |
| | | | Thailand – 6.93% | | | | |
| | 34,500 | | | Bangchak Petroleum | | | 42,611 | |
| | 4,700 | | | Kasikornbank | | | 33,949 | |
| | 5,600 | | | PTT Exploration & Production | | | 29,383 | |
| | 14,500 | | | PTT Global Chemical | | | 36,065 | |
| | 260,700 | | | Quality Houses | | | 37,484 | |
| | 6,500 | | | Siam Commercial Bank Public, Foreign Registered | | | 41,193 | |
| | 32,600 | | | Thai Airways International | | | 32,767 | |
| | 38,300 | | | Thai Vegetable Oil | | | 30,014 | |
| | | | | | | | |
| | | | | | | 283,466 | |
| | | | | | | | |
| | |
| | | | Turkey – 4.02% | | | | |
| | 5,374 | | | Tav Havalimanlari Holding * | | | 37,920 | |
| | 12,598 | | | Turk Hava Yollari * | | | 52,423 | |
| | | | | | | | |
Shares | | | | | Market
Value | |
| | |
| | | | Turkey (continued) | | | | |
| | 5,310 | | | Turkcell Iletisim Hizmetleri * | | $ | 32,877 | |
| | 10,657 | | | Turkiye Is Bankasi | | | 41,136 | |
| | | | | | | | |
| | | | | | | 164,356 | |
| | | | | | | | |
| | |
| | | | United Kingdom – 1.11% | | | | |
| | 840 | | | SABMiller | | | 45,362 | |
| | | | | | | | |
| | |
| | | | United States – 0.76% | | | | |
| | 937 | | | Southern Copper | | | 31,230 | |
| | | | | | | | |
| | |
| | | | Total Common Stocks
(Cost $3,736,157) | | | 3,778,865 | |
| | | | | | | | |
|
| | EXCHANGE TRADED FUND – 4.67% | |
| | |
| | | | United States – 4.67% | | | | |
| | 3,147 | | | iPath MSCI India Index Fund * | | | 190,960 | |
| | | | | | | | |
| | |
| | | | Total Exchange Traded Fund
(Cost $183,969) | | | 190,960 | |
| | | | | | | | |
|
| | INVESTMENT COMPANY – 28.67% | |
| | |
| | 1,172,126 | | | BlackRock Liquidity Funds
TempCash Portfolio | | | 1,172,126 | |
| | | | | | | | |
| | |
| | | | Total Investment Company
(Cost $1,172,126) | | | 1,172,126 | |
| | | | | | | | |
| Total Investments – 125.77%
(Cost $5,092,252)** | | | 5,141,951 | |
| | | | | | | | |
| Net Other Assets and Liabilities – (25.77)% | | | (1,053,685 | ) |
| | | | | | | | |
| Net Assets – 100.00% | | $ | 4,088,266 | |
| | | | | | | | |
| * | | Non-income producing security. |
| ** | | At April 30, 2013, cost is identical for book and Federal income tax purposes. |
| | | | |
Gross unrealized appreciation | | $ | 87,706 | |
Gross unrealized depreciation | | | (38,007 | ) |
| | | | |
Net unrealized appreciation | | $ | 49,699 | |
| | | | |
| ADR | | American Depositary Receipt |
| GDR | | Global Depositary Receipt |
| SP ADR | | Sponsored American Depositary Receipt |
See accompanying Notes to Financial Statements.
| | |
| |
| ASTON/Harrison Street Real Estate Fund | | April 30, 2013 |
| |
| Schedule of Investments (unaudited) | | |
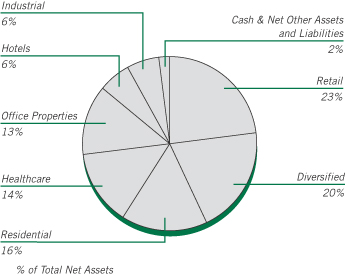
| | | | | | | | |
Shares | | | | | Market
Value | |
|
| | COMMON STOCKS – 98.31% | |
| | |
| | | | Diversified – 19.56% | | | | |
| | 12,700 | | | American Tower | | $ | 1,066,673 | |
| | 7,300 | | | Digital Realty Trust | | | 514,796 | |
| | 6,700 | | | Dundee Real Estate Investment
Trust, Class A (Canada) | | | 246,133 | |
| | 22,000 | | | Weyerhaeuser | | | 671,220 | |
| | | | | | | | |
| | | | | | | 2,498,822 | |
| | | | | | | | |
| | |
| | | | Healthcare – 14.34% | | | | |
| | 10,200 | | | Health Care, REIT | | | 764,694 | |
| | 22,300 | | | Medical Properties Trust | | | 358,807 | |
| | 11,400 | | | Omega Healthcare Investors | | | 374,718 | |
| | 11,159 | | | Sabra Health Care | | | 332,761 | |
| | | | | | | | |
| | | | | | | 1,830,980 | |
| | | | | | | | |
| | |
| | | | Hotels – 6.30% | | | | |
| | 14,600 | | | LaSalle Hotel Properties | | | 378,578 | |
| | 3,300 | | | Starwood Hotels & Resorts Worldwide | | | 212,916 | |
| | 1,550 | | | Wynn Resorts | | | 212,815 | |
| | | | | | | | |
| | | | | | | 804,309 | |
| | | | | | | | |
| | |
| | | | Industrial – 6.05% | | | | |
| | 16,400 | | | CubeSmart | | | 288,148 | |
| | 6,100 | | | Iron Mountain | | | 230,946 | |
| | 11,500 | | | STAG Industrial | | | 253,460 | |
| | | | | | | | |
| | | | | | | 772,554 | |
| | | | | | | | |
| | |
| | | | Office Properties – 13.24% | | | | |
| | 19,800 | | | BioMed Realty Trust | | | 445,698 | |
| | 19,400 | | | Brandywine Realty Trust | | | 289,642 | |
| | 9,800 | | | Corporate Office Properties Trust | | | 284,102 | |
| | 7,400 | | | SL Green Realty | | | 671,180 | |
| | | | | | | | |
| | | | | | | 1,690,622 | |
| | | | | | | | |
| | | | | | | | |
Shares | | | | | Market
Value | |
| | |
| | | | Residential – 16.18% | | | | |
| | 5,100 | | | AvalonBay Communities | | $ | 678,504 | |
| | 5,700 | | | Camden Property Trust | | | 412,338 | |
| | 2,750 | | | Essex Property Trust | | | 431,888 | |
| | 4,300 | | | Home Properties | | | 277,178 | |
| | 12,400 | | | Spirit Realty Capital | | | 266,972 | |
| | | | | | | | |
| | | | | | | 2,066,880 | |
| | | | | | | | |
| | |
| | | | Retail – 22.64% | | | | |
| | 11,000 | | | CBL & Associates Properties | | | 265,540 | |
| | 17,100 | | | General Growth Properties | | | 388,512 | |
| | 17,600 | | | Kimco Realty | | | 418,528 | |
| | 13,900 | | | Ramco-Gershenson Properties Trust | | | 242,833 | |
| | 20,500 | | | Retail Opportunity Investments | | | 303,605 | |
| | 7,150 | | | Simon Property Group | | | 1,273,201 | |
| | | | | | | | |
| | | | | | | 2,892,219 | |
| | | | | | | | |
| | |
| | | | Total Common Stocks
(Cost $10,994,493) | | | 12,556,386 | |
| | | | | | | | |
|
| | INVESTMENT COMPANY – 2.74% | |
| | |
| | 349,849 | | | BlackRock Liquidity Funds
TempCash Portfolio | | | 349,849 | |
| | | | | | | | |
| | |
| | | | Total Investment Company
(Cost $349,849) | | | 349,849 | |
| | | | | | | | |
| Total Investments – 101.05%
(Cost $11,344,342)* | | | 12,906,235 | |
| | | | | | | | |
| Net Other Assets and Liabilities – (1.05)% | | | (133,953 | ) |
| | | | | | | | |
| Net Assets – 100.00% | | $ | 12,772,282 | |
| | | | | | | | |
| * | | At April 30, 2013, cost is identical for book and Federal income tax purposes. |
| | | | |
Gross unrealized appreciation | | $ | 1,564,187 | |
Gross unrealized depreciation | | | (2,294 | ) |
| | | | |
Net unrealized appreciation | | $ | 1,561,893 | |
| | | | |
| REIT | | Real Estate Investment Trust |
See accompanying Notes to Financial Statements.
| | |
| |
| ASTON/Montag & Caldwell Balanced Fund | | April 30, 2013 |
| |
| Schedule of Investments (unaudited) | | |
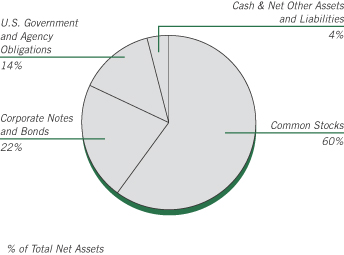
| | | | | | | | |
Shares | | | | | Market
Value | |
|
| | COMMON STOCKS – 60.06% | |
| | |
| | | | Consumer Discretionary – 7.99% | | | | |
| | 5,475 | | | Bed Bath & Beyond * | | $ | 376,680 | |
| | 9,064 | | | Johnson Controls | | | 317,331 | |
| | 2,500 | | | McDonald’s | | | 255,350 | |
| | 6,800 | | | NIKE, Class B | | | 432,480 | |
| | 6,600 | | | Starbucks | | | 401,544 | |
| | 7,650 | | | TJX | | | 373,091 | |
| | | | | | | | |
| | | | | | | 2,156,476 | |
| | | | | | | | |
| | |
| | | | Consumer Staples – 15.78% | | | | |
| | 18,600 | | | Coca-Cola | | | 787,338 | |
| | 4,100 | | | Colgate-Palmolive | | | 489,581 | |
| | 3,700 | | | Costco Wholesale | | | 401,191 | |
| | 1,800 | | | Estee Lauder, Class A | | | 124,830 | |
| | 20,150 | | | Mondelez International, Class A | | | 633,718 | |
| | 5,320 | | | PepsiCo | | | 438,740 | |
| | 6,000 | | | Philip Morris International | | | 573,540 | |
| | 5,650 | | | Procter & Gamble | | | 433,751 | |
| | 8,800 | | | Unilever (Netherlands) | | | 373,824 | |
| | | | | | | | |
| | | | | | | 4,256,513 | |
| | | | | | | | |
| | |
| | | | Energy – 3.44% | | | | |
| | 7,400 | | | Cameron International * | | | 455,470 | |
| | 5,300 | | | Occidental Petroleum | | | 473,078 | |
| | | | | | | | |
| | | | | | | 928,548 | |
| | | | | | | | |
| | |
| | | | Financials – 3.40% | | | | |
| | 4,800 | | | American Express | | | 328,368 | |
| | 15,500 | | | Wells Fargo | | | 588,690 | |
| | | | | | | | |
| | | | | | | 917,058 | |
| | | | | | | | |
| | |
| | | | Healthcare – 11.67% | | | | |
| | 15,950 | | | Abbott Laboratories | | | 588,874 | |
| | 4,850 | | | Allergan | | | 550,717 | |
| | 8,350 | | | AmerisourceBergen | | | 451,902 | |
| | | | | | | | |
Shares | | | | | Market
Value | |
| | |
| | | | Healthcare (continued) | | | | |
| | 2,651 | | | Biogen Idec * | | $ | 580,383 | |
| | 11,000 | | | Sanofi, ADR (France) | | | 586,850 | |
| | 5,950 | | | Stryker | | | 390,201 | |
| | | | | | | | |
| | | | | | | 3,148,927 | |
| | | | | | | | |
| | |
| | | | Industrials – 3.53% | | | | |
| | 18,400 | | | General Electric | | | 410,136 | |
| | 6,300 | | | United Parcel Service, Class B | | | 540,792 | |
| | | | | | | | |
| | | | | | | 950,928 | |
| | | | | | | | |
| | |
| | | | Information Technology – 11.81% | | | | |
| | 5,050 | | | Accenture, Class A (Ireland) | | | 411,272 | |
| | 7,300 | | | eBay * | | | 382,447 | |
| | 10,900 | | | EMC * | | | 244,487 | |
| | 635 | | | Google, Class A * | | | 523,602 | |
| | 17,800 | | | Juniper Networks * | | | 294,590 | |
| | 9,800 | | | Oracle | | | 321,244 | |
| | 8,700 | | | QUALCOMM | | | 536,094 | |
| | 2,800 | | | Visa, Class A | | | 471,688 | |
| | | | | | | | |
| | | | | | | 3,185,424 | |
| | | | | | | | |
| | |
| | | | Materials – 2.44% | | | | |
| | 6,150 | | | Monsanto | | | 656,943 | |
| | | | | | | | |
| | |
| | | | Total Common Stocks
(Cost $13,108,862) | | | 16,200,817 | |
| | | | | | | | |
Par Value | | | | | | |
|
| | CORPORATE NOTES AND BONDS – 21.97% | |
| | |
| | | | Consumer Staples – 4.68% | | | | |
| | $350,000 | | | Coca-Cola
Senior Unsecured Notes
5.350%, 11/15/17 | | | 415,585 | |
| | 325,000 | | | PepsiCo
Senior Unsecured Notes
5.000%, 06/01/18 | | | 382,657 | |
| | 450,000 | | | Wal-Mart Stores
Senior Unsecured Notes
3.200%, 05/15/14 | | | 463,852 | |
| | | | | | | | |
| | | | | | | 1,262,094 | |
| | | | | | | | |
| | |
| | | | Energy – 0.36% | | | | |
| | 95,000 | | | ConocoPhillips
4.750%, 02/01/14 | | | 98,128 | |
| | | | | | | | |
| | |
| | | | Financials – 6.22% | | | | |
| | 350,000 | | | General Electric Capital
Senior Unsecured Notes, MTN 4.375%, 09/16/20 | | | 397,744 | |
| | 350,000 | | | JPMorgan Chase
Senior Unsecured Notes
4.350%, 08/15/21 | | | 393,757 | |
| | 400,000 | | | U.S. Bancorp
Senior Unsecured Notes
4.200%, 05/15/14 | | | 416,037 | |
| | 450,000 | | | Wells Fargo
Senior Unsecured Notes, MTN,
Series 1
3.750%, 10/01/14 | | | 470,499 | |
| | | | | | | | |
| | | | | | | 1,678,037 | |
| | | | | | | | |
See accompanying Notes to Financial Statements.
| | |
| |
| ASTON/Montag & Caldwell Balanced Fund | | April 30, 2013 |
| |
| Schedule of Investments (unaudited) – continued | | |
| | | | | | | | |
Par Value | | | | | Market
Value | |
| | |
| | | | Healthcare – 2.74% | | | | |
| | $250,000 | | | Johnson & Johnson
Senior Unsecured Notes
5.950%, 08/15/37 | | $ | 346,122 | |
| | 375,000 | | | Medtronic
Senior Unsecured Notes
3.000%, 03/15/15 | | | 392,496 | |
| | | | | | | | |
| | | | | | | 738,618 | |
| | | | | | | | |
| | |
| | | | Industrials – 3.09% | | | | |
| | 375,000 | | | United Parcel Service
Senior Unsecured Notes
3.125%, 01/15/21 | | | 406,411 | |
| | 400,000 | | | United Technologies
Senior Unsecured Notes
3.100%, 06/01/22 | | | 426,483 | |
| | | | | | | | |
| | | | | | | 832,894 | |
| | | | | | | | |
| | |
| | | | Information Technology – 3.63% | | | | |
| | 300,000 | | | Cisco Systems
Senior Unsecured Notes
5.500%, 02/22/16 | | | 341,036 | |
| | 300,000 | | | Google
Senior Unsecured Notes
3.625%, 05/19/21 | | | 336,578 | |
| | 300,000 | | | Oracle
Senior Unsecured Notes
2.500%, 10/15/22 | | | 300,551 | |
| | | | | | | | |
| | | | | | | 978,165 | |
| | | | | | | | |
| | |
| | | | Telecommunication Services – 1.25% | | | | |
| | 300,000 | | | Verizon Communications
Senior Unsecured Notes
5.550%, 02/15/16 | | | 338,052 | |
| | | | | | | | |
| | |
| | | | Total Corporate Notes and Bonds
(Cost $5,623,122) | | | 5,925,988 | |
| | | | | | | | |
|
| | U.S. GOVERNMENT AND AGENCY OBLIGATIONS – 14.07% | |
| | |
| | | | Fannie Mae – 0.18% | | | | |
| | 14,059 | | | 7.500%, 02/01/35,
Pool # 787557 | | | 16,706 | |
| | 3,013 | | | 7.500%, 04/01/35,
Pool # 819231 | | | 3,245 | |
| | 26,808 | | | 6.000%, 11/01/35,
Pool # 844078 | | | 29,543 | |
| | | | | | | | |
| | | | | | | 49,494 | |
| | | | | | | | |
| | |
| | | | Freddie Mac – 1.47% | | | | |
| | 15,171 | | | 5.500%, 12/01/20,
Gold Pool # G11820 | | | 16,375 | |
| | 375,000 | | | 1.000%, 09/29/17 | | | 379,962 | |
| | | | | | | | |
| | | | | | | 396,337 | |
| | | | | | | | |
| |
| | | | Government National Mortgage Association – 0.07% | |
| | 15,704 | | | 5.500%, 02/15/39,
Pool # 698060 | | | 17,157 | |
| | | | | | | | |
| | | | | | | | |
Par Value | | | | | Market
Value | |
| | |
| | | | U.S. Treasury Bonds – 2.37% | | | | |
| | $300,000 | | | 5.375%, 02/15/31 | | $ | 429,000 | |
| | 200,000 | | | 3.125%, 11/15/41 | | | 210,563 | |
| | | | | | | | |
| | | | | | | 639,563 | |
| | | | | | | | |
| | |
| | | | U.S. Treasury Notes – 9.98% | | | | |
| | 325,000 | | | 4.000%, 02/15/15 | | | 347,027 | |
| | 275,000 | | | 0.250%, 02/15/15 | | | 275,247 | |
| | 300,000 | | | 4.500%, 02/15/16 | | | 335,156 | |
| | 375,000 | | | 2.625%, 04/30/16 | | | 400,752 | |
| | 325,000 | | | 4.625%, 02/15/17 | | | 375,934 | |
| | 425,000 | | | 3.125%, 05/15/19 | | | 481,811 | |
| | 450,000 | | | 2.125%, 08/15/21 | | | 476,367 | |
| | | | | | | | |
| | | | | | | 2,692,294 | |
| | | | | | | | |
| | |
| | | | Total U.S. Government and Agency Obligations
(Cost $3,605,224) | | | 3,794,845 | |
| | | | | | | | |
Shares | | | | | | |
|
| | INVESTMENT COMPANY – 3.56% | |
| | |
| | 960,968 | | | BlackRock Liquidity Funds TempCash Portfolio | | | 960,968 | |
| | | | | | | | |
| | |
| | | | Total Investment Company
(Cost $960,968) | | | 960,968 | |
| | | | | | | | |
| Total Investments – 99.66%
(Cost $23,298,176)** | | | 26,882,618 | |
| | | | | | | | |
| Net Other Assets and Liabilities – 0.34% | | | 91,776 | |
| | | | | | | | |
| Net Assets – 100.00% | | $ | 26,974,394 | |
| | | | | | | | |
| * | | Non-income producing security. |
| ** | | At April 30, 2013, cost is identical for book and Federal income tax purposes. |
| | | | |
Gross unrealized appreciation | | $ | 3,628,715 | |
Gross unrealized depreciation | | | (44,273 | ) |
| | | | |
Net unrealized appreciation | | $ | 3,584,442 | |
| | | | |
| ADR | | American Depositary Receipt |
| | | | |
Portfolio Composition | | | | |
Common Stocks | | | 60% | |
Investment Company | | | 4% | |
U.S. Government and Agency Obligations | | | 14% | |
Corporate Notes and Bonds | | | | |
(Moody’s Ratings) | | | | |
AAA | | | 1% | |
AA | | | 8% | |
A | | | 13% | |
| | | | |
| | | 100% | |
| | | | |
See accompanying Notes to Financial Statements.
| | |
| |
| | April 30, 2013 |
| |
| Statements of Assets and Liabilities (unaudited) | | |
| | | | | | | | |
| | |
| | | Montag & Caldwell
Growth Fund | | | TAMRO
Diversified
Equity Fund | |
| | | | | | | | |
| | |
ASSETS: | | | | | | | | |
Investments: | | | | | | | | |
Investments at cost | | $ | 4,013,335,926 | | | $ | 18,991,853 | |
Net unrealized appreciation | | | 929,776,974 | | | | 6,889,005 | |
| | | | | | | | |
Total investments at value | | | 4,943,112,900 | | | | 25,880,858 | |
Cash | | | — | | | | — | |
Receivables: | | | | | | | | |
Dividends and interest | | | 3,463,379 | | | | 5,389 | |
Dividend reclaims | | | — | | | | — | |
Fund shares sold | | | 15,993,366 | | | | 7,029 | |
Investments sold | | | 70,464,575 | | | | 132,249 | |
Due from Adviser, net (Note G) | | | — | | | | — | |
Deferred offering costs (Note B (13)) | | | — | | | | — | |
Other assets | | | 74,123 | | | | 379 | |
| | | | | | | | |
Total assets | | | 5,033,108,343 | | | | 26,025,904 | |
| | | | | | | | |
| | |
LIABILITIES: | | | | | | | | |
Payables: | | | | | | | | |
Due to custodian | | | 15,945,171 | | | | 319,866 | |
Dividend distribution | | | — | | | | — | |
Investments purchased | | | 79,919,581 | | | | 125,521 | |
Fund shares redeemed | | | 11,361,525 | | | | 6,466 | |
Due to Adviser, net (Note G) | | | 2,507,448 | | | | 8,464 | |
Administration fees (Note G) | | | 192,461 | | | | 2,730 | |
Distribution fees (Note G) | | | 104,036 | | | | 1,178 | |
Audit and tax fees | | | 15,448 | | | | 8,979 | |
Transfer agent fees | | | 811,925 | | | | 14,516 | |
Registration fees | | | 10,200 | | | | 2,220 | |
Trustees fees and related expenses (Note G) | | | 4,961 | | | | 24 | |
Accrued expenses and other payables | | | 202,888 | | | | 4,606 | |
| | | | | | | | |
Total liabilities | | | 111,075,644 | | | | 494,570 | |
| | | | | | | | |
NET ASSETS | | $ | 4,922,032,699 | | | $ | 25,531,334 | |
| | | | | | | | |
| | |
NET ASSETS CONSIST OF: | | | | | | | | |
Paid in capital | | $ | 3,882,344,173 | | | $ | 18,576,741 | |
Accumulated undistributed (distribution in excess of) net investment income (loss) | | | 8,487,357 | | | | (15,113 | ) |
Accumulated net realized gain (loss) on investments | | | 101,424,195 | | | | 80,701 | |
Net unrealized appreciation on investments | | | 929,776,974 | | | | 6,889,005 | |
| | | | | | | | |
TOTAL NET ASSETS | | $ | 4,922,032,699 | | | $ | 25,531,334 | |
| | | | | | | | |
Class N: | | | | | | | | |
Net Assets | | $ | 2,161,408,043 | | | $ | 24,698,155 | |
Shares of beneficial interest outstanding (unlimited authorization) | | | 80,812,005 | | | | 1,633,072 | |
NET ASSET VALUE Offering and redemption price per share
(Net Assets/Shares Outstanding) | | $ | 26.75 | | | $ | 15.12 | |
| | | | | | | | |
Class I: | | | | | | | | |
Net Assets | | $ | 2,750,683,904 | | | $ | 833,179 | |
Shares of beneficial interest outstanding (unlimited authorization) | | | 102,305,387 | | | | 55,065 | |
NET ASSET VALUE Offering and redemption price per share
(Net Assets/Shares Outstanding) | | $ | 26.89 | | | $ | 15.13 | |
| | | | | | | | |
Class R: | | | | | | | | |
Net Assets | | $ | 9,940,752 | | | $ | — | |
Shares of beneficial interest outstanding (unlimited authorization) | | | 375,730 | | | | — | |
NET ASSET VALUE Offering and redemption price per share
(Net Assets/Shares Outstanding) | | $ | 26.46 | | | $ | — | |
| | | | | | | | |
See accompanying Notes to Financial Statements.
| | | | | | | | | | | | | | | | | | | | | | | | | | |
| | | | | | |
Herndon
Large Cap
Value Fund | | | Cornerstone
Large Cap
Value Fund | | | River Road
Dividend All
Cap Value Fund | | | River Road
Dividend All
Cap Value Fund II | | | Fairpointe
Mid Cap
Fund | | | Montag & Caldwell
Mid Cap
Growth Fund | | | LMCG
Small Cap
Growth Fund | |
| | | | | | | | | | | | | | | | | | | | | | | | | | |
| | | | | | |
| | | | | | | | | | | | | | | | | | | | | | | | | | |
| | | | | | | | | | | | | | | | | | | | | | | | | | |
| $ | 83,707,426 | | | $ | 38,491,870 | | | $ | 884,820,601 | | | $ | 51,602,698 | | | $ | 2,812,593,766 | | | $ | 11,125,948 | | | $ | 30,985,082 | |
| | 7,820,516 | | | | 4,982,946 | | | | 215,531,851 | | | | 4,264,588 | | | | 919,227,374 | | | | 1,652,654 | | | | 1,153,145 | |
| | | | | | | | | | | | | | | | | | | | | | | | | | |
| | 91,527,942 | | | | 43,474,816 | | | | 1,100,352,452 | | | | 55,867,286 | | | | 3,731,821,140 | | | | 12,778,602 | | | | 32,138,227 | |
| | 42,703 | | | | — | | | | 324,306 | | | | 18,812 | | | | — | | | | 139,769 | | | | — | |
| | | | | | | | | | | | | | | | | | | | | | | | | | |
| | 73,724 | | | | 23,832 | | | | 1,714,291 | | | | 82,246 | | | | 713,441 | | | | 1,917 | | | | 119,420 | |
| | — | | | | 361 | | | | 1,183 | | | | — | | | | — | | | | — | | | | — | |
| | 120,826 | | | | 321,757 | | | | 1,859,786 | | | | 464,723 | | | | 8,768,559 | | | | 6,625 | | | | 29,613 | |
| | 2,178,073 | | | | 444,578 | | | | 603,606 | | | | 8,157 | | | | 12,186,900 | | | | 171,454 | | | | 743,706 | |
| | — | | | | — | | | | — | | | | — | | | | — | | | | — | | | | 21,126 | |
| | — | | | | — | | | | — | | | | 7,940 | | | | — | | | | — | | | | — | |
| | 7,027 | | | | 436 | | | | 15,599 | | | | 247 | | | | 53,035 | | | | 161 | | | | 105 | |
| | | | | | | | | | | | | | | | | | | | | | | | | | |
| | 93,950,295 | | | | 44,265,780 | | | | 1,104,871,223 | | | | 56,449,411 | | | | 3,753,543,075 | | | | 13,098,528 | | | | 33,052,197 | |
| | | | | | | | | | | | | | | | | | | | | | | | | | |
| | | | | | |
| | | | | | | | | | | | | | | | | | | | | | | | | | |
| | | | | | | | | | | | | | | | | | | | | | | | | | |
| | — | | | | 11,550 | | | | — | | | | — | | | | 9,125,899 | | | | — | | | | 819,924 | |
| | — | | | | — | | | | — | | | | 5,444 | | | | — | | | | — | | | | — | |
| | 1,820,477 | | | | 1,010,007 | | | | 8,585,365 | | | | 1,398,587 | | | | 9,428,183 | | | | 206,580 | | | | 520,964 | |
| | 72,014 | | | | 20,879 | | | | 918,331 | | | | 8,614 | | | | 9,020,621 | | | | 11,210 | | | | 56,725 | |
| | 66,325 | | | | 23,187 | | | | 609,243 | | | | 26,657 | | | | 2,119,589 | | | | 3,043 | | | | — | |
| | 5,203 | | | | 2,937 | | | | 43,897 | | | | 2,894 | | | | 146,143 | | | | 2,356 | | | | 4,821 | |
| | 1,609 | | | | 1,228 | | | | 18,975 | | | | 112 | | | | 88,630 | | | | 610 | | | | 1,295 | |
| | 9,132 | | | | 10,589 | | | | 11,041 | | | | 10,603 | | | | 15,447 | | | | 9,049 | | | | 14,242 | |
| | 11,665 | | | | 15,201 | | | | 138,056 | | | | 8,305 | | | | 657,982 | | | | 5,051 | | | | 25,860 | |
| | — | | | | 6,547 | | | | 8,404 | | | | 6,771 | | | | 8,066 | | | | 4,882 | | | | 6,411 | |
| | — | | | | — | | | | 632 | | | | — | | | | — | | | | — | | | | — | |
| | 6,420 | | | | 4,742 | | | | 42,414 | | | | 4,239 | | | | 199,469 | | | | 4,018 | | | | 28,706 | |
| | | | | | | | | | | | | | | | | | | | | | | | | | |
| | 1,992,845 | | | | 1,106,867 | | | | 10,376,358 | | | | 1,472,226 | | | | 30,810,029 | | | | 246,799 | | | | 1,478,948 | |
| | | | | | | | | | | | | | | | | | | | | | | | | | |
| $ | 91,957,450 | | | $ | 43,158,913 | | | $ | 1,094,494,865 | | | $ | 54,977,185 | | | $ | 3,722,733,046 | | | $ | 12,851,729 | | | $ | 31,573,249 | |
| | | | | | | | | | | | | | | | | | | | | | | | | | |
| | | | | | |
| | | | | | | | | | | | | | | | | | | | | | | | | | |
| $ | 83,690,167 | | | $ | 65,805,484 | | | $ | 859,225,553 | | | $ | 50,665,267 | | | $ | 2,627,854,391 | | | $ | 11,081,607 | | | $ | 29,417,520 | |
| | 162,825 | | | | (50,252 | ) | | | 2,273,812 | | | | (3,107 | ) | | | (1,101,531 | ) | | | (66,990 | ) | | | 49,136 | |
| | 283,942 | | | | (27,579,265 | ) | | | 17,463,649 | | | | 50,437 | | | | 176,752,812 | | | | 184,458 | | | | 953,448 | |
| | 7,820,516 | | | | 4,982,946 | | | | 215,531,851 | | | | 4,264,588 | | | | 919,227,374 | | | | 1,652,654 | | | | 1,153,145 | |
| | | | | | | | | | | | | | | | | | | | | | | | | | |
| $ | 91,957,450 | | | $ | 43,158,913 | | | $ | 1,094,494,865 | | | $ | 54,977,185 | | | $ | 3,722,733,046 | | | $ | 12,851,729 | | | $ | 31,573,249 | |
| | | | | | | | | | | | | | | | | | | | | | | | | | |
| | | | | | | | | | | | | | | | | | | | | | | | | | |
| $ | 34,181,849 | | | $ | 25,924,865 | | | $ | 399,981,821 | | | $ | 2,390,830 | | | $ | 1,869,670,755 | | | $ | 12,851,729 | | | $ | 27,131,623 | |
| | 2,686,430 | | | | 2,081,459 | | | | 30,882,470 | | | | 199,935 | | | | 48,710,162 | | | | 1,135,085 | | | | 2,173,652 | |
$ |
12.72 |
| | $ | 12.46 | | | $ | 12.95 | | | $ | 11.96 | | | $ | 38.38 | | | $ | 11.32 | | | $ | 12.48 | |
| | | | | | | | | | | | | | | | | | | | | | | | | | |
| | | | | | | | | | | | | | | | | | | | | | | | | | |
| $ | 57,775,601 | | | $ | 17,234,048 | | | $ | 694,513,044 | | | $ | 52,586,355 | | | $ | 1,853,062,291 | | | $ | — | | | $ | 4,441,626 | |
| | 4,537,279 | | | | 1,382,122 | | | | 53,642,697 | | | | 4,396,825 | | | | 47,602,677 | | | | — | | | | 353,911 | |
$ |
12.73 |
| | $ | 12.47 | | | $ | 12.95 | | | $ | 11.96 | | | $ | 38.93 | | | $ | — | | | $ | 12.55 | |
| | | | | | | | | | | | | | | | | | | | | | | | | | |
| | | | | | | | | | | | | | | | | | | | | | | | | | |
| $ | — | | | $ | — | | | $ | — | | | $ | — | | | $ | — | | | $ | — | | | $ | — | |
| | — | | | | — | | | | — | | | | — | | | | — | | | | — | | | | — | |
$ |
— |
| | $ | — | | | $ | — | | | $ | — | | | $ | — | | | $ | — | | | $ | — | |
| | | | | | | | | | | | | | | | | | | | | | | | | | |
See accompanying Notes to Financial Statements.
| | |
| |
| | April 30, 2013 |
| |
| Statements of Assets and Liabilities (unaudited) – continued | | |
| | | | | | | | |
| | |
| | | Silvercrest
Small Cap
Fund | | | TAMRO
Small Cap
Fund | |
| | | | | | | | |
| | |
ASSETS: | | | | | | | | |
Investments: | | | | | | | | |
Investments at cost | | $ | 11,426,589 | | | $ | 786,782,896 | |
Net unrealized appreciation | | | 1,298,163 | | | | 311,997,560 | |
| | | | | | | | |
Total investments at value | | | 12,724,752 | | | | 1,098,780,456 | |
Cash | | | 8,410 | | | | 4,256,508 | |
Receivables: | | | | | | | | |
Dividends and interest | | | 2,764 | | | | 352,685 | |
Fund shares sold | | | 54,200 | | | | 1,369,976 | |
Investments sold | | | 13,525 | | | | 9,901,481 | |
Other assets | | | 130 | | | | 16,626 | |
| | | | | | | | |
Total assets | | | 12,803,781 | | | | 1,114,677,732 | |
| | | | | | | | |
| | |
LIABILITIES: | | | | | | | | |
Payables: | | | | | | | | |
Due to custodian | | | — | | | | — | |
Dividend distribution | | | — | | | | — | |
Investments purchased | | | — | | | | 8,933,646 | |
Fund shares redeemed | | | — | | | | 704,908 | |
Due to Adviser, net (Note G) | | | 2,768 | | | | 801,976 | |
Administration fees (Note G) | | | 2,312 | | | | 45,526 | |
Distribution fees (Note G) | | | 65 | | | | 20,193 | |
Audit and tax fees | | | 8,979 | | | | 10,715 | |
Transfer agent fees | | | 8,311 | | | | 224,434 | |
Registration fees | | | 5,971 | | | | 7,477 | |
Trustees fees and related expenses (Note G) | | | — | | | | 2,688 | |
Accrued expenses and other payables | | | 575 | | | | 63,192 | |
Call options written, at value (premiums received $4,136,508) | | | — | | | | — | |
| | | | | | | | |
Total liabilities | | | 28,981 | | | | 10,814,755 | |
| | | | | | | | |
NET ASSETS | | $ | 12,774,800 | | | $ | 1,103,862,977 | |
| | | | | | | | |
| | |
NET ASSETS CONSIST OF: | | | | | | | | |
Paid in capital | | $ | 11,361,017 | | | $ | 778,029,409 | |
Accumulated undistributed (distribution in excess of) net investment income (loss) | | | (15,925 | ) | | | 1,358,154 | |
Accumulated net realized gain (loss) on investments, purchased options, written options and capital gain distributions received | | | 131,545 | | | | 12,477,854 | |
Net unrealized appreciation on investments, purchased options and written options | | | 1,298,163 | | | | 311,997,560 | |
| | | | | | | | |
TOTAL NET ASSETS | | $ | 12,774,800 | | | $ | 1,103,862,977 | |
| | | | | | | | |
Class N: | | | | | | | | |
Net Assets | | $ | 1,374,093 | | | $ | 426,613,808 | |
Shares of beneficial interest outstanding (unlimited authorization) | | | 110,693 | | | | 20,082,872 | |
NET ASSET VALUE Offering and redemption price per share
(Net Assets/Shares Outstanding) | | $ | 12.41 | | | $ | 21.24 | |
| | | | | | | | |
Class I: | | | | | | | | |
Net Assets | | $ | 11,400,707 | | | $ | 677,249,169 | |
Shares of beneficial interest outstanding (unlimited authorization) | | | 916,557 | | | | 31,108,743 | |
NET ASSET VALUE Offering and redemption price per share
(Net Assets/Shares Outstanding) | | $ | 12.44 | | | $ | 21.77 | |
| | | | | | | | |
See accompanying Notes to Financial Statements.
| | | | | | | | | | | | | | | | | | | | | | | | | | |
| | | | | | |
River Road
Select Value
Fund | | | River Road
Small Cap
Value Fund | | | River Road
Independent
Value Fund | | | DoubleLine
Core Plus Fixed
Income Fund | | | TCH
Fixed Income
Fund | | | Lake Partners
LASSO
Alternatives Fund | | | Anchor Capital
Enhanced Equity
Fund | |
| | | | | | | | | | | | | | | | | | | | | | | | | | |
| | | | | | |
| | | | | | | | | | | | | | | | | | | | | | | | | | |
| | | | | | | | | | | | | | | | | | | | | | | | | | |
| $ | 169,001,080 | | | $ | 243,794,222 | | | $ | 726,507,999 | | | $ | 222,808,508 | | | $ | 62,720,638 | | | $ | 350,526,055 | | | $ | 134,420,339 | |
| | 30,965,459 | | | | 84,383,051 | | | | 1,840,812 | | | | 6,641,822 | | | | 6,482,402 | | | | 19,564,773 | | | | 4,604,586 | |
| | | | | | | | | | | | | | | | | | | | | | | | | | |
| | 199,966,539 | | | | 328,177,273 | | | | 728,348,811 | | | | 229,450,330 | | | | 69,203,040 | | | | 370,090,828 | | | | 139,024,925 | |
| | 232,635 | | | | 1,037,285 | | | | — | | | | — | | | | 200,000 | | | | 22,552 | | | | 867,083 | |
| | | | | | | | | | | | | | | | | | | | | | | | | | |
| | 406 | | | | 489 | | | | 85,498 | | | | 1,655,125 | | | | 734,132 | | | | 395,997 | | | | 103,002 | |
| | 424,755 | | | | 328,449 | | | | 2,183,953 | | | | 1,531,988 | | | | 30,235 | | | | 1,603,546 | | | | 218,623 | |
| | 1,434,937 | | | | 1,640,157 | | | | 323,854 | | | | 250,000 | | | | 1,000,000 | | | | 158,000 | | | | 2,555,686 | |
| | 6,372 | | | | 4,845 | | | | 25,414 | | | | 3,477 | | | | 1,177 | | | | 34,393 | | | | 2,968 | |
| | | | | | | | | | | | | | | | | | | | | | | | | | |
| | 202,065,644 | | | | 331,188,498 | | | | 730,967,530 | | | | 232,890,920 | | | | 71,168,584 | | | | 372,305,316 | | | | 142,772,287 | |
| | | | | | | | | | | | | | | | | | | | | | | | | | |
| | | | | | |
| | | | | | | | | | | | | | | | | | | | | | | | | | |
| | | | | | | | | | | | | | | | | | | | | | | | | | |
| | — | | | | — | | | | 1,910,306 | | | | 491,901 | | | | 1,017,203 | | | | — | | | | — | |
| | — | | | | — | | | | — | | | | 61,912 | | | | 14,054 | | | | — | | | | — | |
| | 2,150,165 | | | | 1,931,411 | | | | 1,636,032 | | | | 457,800 | | | | 248,545 | | | | 610,032 | | | | 1,631,855 | |
| | 1,074,174 | | | | 199,616 | | | | 3,088,682 | | | | 446,311 | | | | 36,912 | | | | 486,999 | | | | 466,519 | |
| | 159,878 | | | | 238,962 | | | | 623,246 | | | | 86,274 | | | | 20,802 | | | | 327,901 | | | | 75,593 | |
| | 9,758 | | | | 14,917 | | | | 30,327 | | | | 22,989 | | | | 10,407 | | | | 14,946 | | | | 8,416 | |
| | 617 | | | | 2,534 | | | | 16,348 | | | | 4,574 | | | | 1,709 | | | | 2,000 | | | | 4,163 | |
| | 10,589 | | | | 10,589 | | | | 8,978 | | | | 11,711 | | | | 11,697 | | | | 10,061 | | | | 10,062 | |
| | 33,864 | | | | 108,978 | | | | 131,501 | | | | 34,596 | | | | 22,382 | | | | 42,890 | | | | 36,785 | |
| | — | | | | 5,200 | | | | 2,889 | | | | 10,761 | | | | 6,014 | | | | — | | | | 7,439 | |
| | — | | | | — | | | | — | | | | — | | | | 34 | | | | — | | | | 504 | |
| | 18,364 | | | | 17,512 | | | | 35,329 | | | | 16,063 | | | | 7,501 | | | | 11,852 | | | | 12,707 | |
| | — | | | | — | | | | — | | | | — | | | | — | | | | — | | | | 7,393,873 | |
| | | | | | | | | | | | | | | | | | | | | | | | | | |
| | 3,457,409 | | | | 2,529,719 | | | | 7,483,638 | | | | 1,644,892 | | | | 1,397,260 | | | | 1,506,681 | | | | 9,647,916 | |
| | | | | | | | | | | | | | | | | | | | | | | | | | |
| $ | 198,608,235 | | | $ | 328,658,779 | | | $ | 723,483,892 | | | $ | 231,246,028 | | | $ | 69,771,324 | | | $ | 370,798,635 | | | $ | 133,124,371 | |
| | | | | | | | | | | | | | | | | | | | | | | | | | |
| | | | | | |
| | | | | | | | | | | | | | | | | | | | | | | | | | |
| $ | 151,683,864 | | | $ | 217,812,566 | | | $ | 706,353,204 | | | $ | 225,226,708 | | | $ | 68,341,643 | | | $ | 349,372,843 | | | $ | 133,463,288 | |
| | (185,056 | ) | | | (214,865 | ) | | | (770,617 | ) | | | (1,081,922 | ) | | | 58,234 | | | | (2,447,886 | ) | | | 93,837 | |
| 16,143,968 | | | | 26,678,027 | | | | 16,060,493 | | | | 459,420 | | | | (5,110,955 | ) | | | 4,308,905 | | | | (1,779,975 | ) |
| | 30,965,459 | | | | 84,383,051 | | | | 1,840,812 | | | | 6,641,822 | | | | 6,482,402 | | | | 19,564,773 | | | | 1,347,221 | |
| | | | | | | | | | | | | | | | | | | | | | | | | | |
| $ | 198,608,235 | | | $ | 328,658,779 | | | $ | 723,483,892 | | | $ | 231,246,028 | | | $ | 69,771,324 | | | $ | 370,798,635 | | | $ | 133,124,371 | |
| | | | | | | | | | | | | | | | | | | | | | | | | | |
| | | | | | | | | | | | | | | | | | | | | | | | | | |
| $ | 13,093,818 | | | $ | 53,456,730 | | | $ | 340,369,434 | | | $ | 95,785,967 | | | $ | 59,536,926 | | | $ | 42,219,769 | | | $ | 87,673,267 | |
| | 1,408,854 | | | | 3,532,552 | | | | 30,910,691 | | | | 8,627,358 | | | | 5,334,649 | | | | 3,222,194 | | | | 9,704,896 | |
$ | 9.29 | | | $ | 15.13 | | | $ | 11.01 | | | $ | 11.10 | | | $ | 11.16 | | | $ | 13.10 | | | $ | 9.03 | |
| | | | | | | | | | | | | | | | | | | | | | | | | | |
| | | | | | | | | | | | | | | | | | | | | | | | | | |
| $ | 185,514,417 | | | $ | 275,202,049 | | | $ | 383,114,458 | | | $ | 135,460,061 | | | $ | 10,234,398 | | | $ | 328,578,866 | | | $ | 45,451,104 | |
| | 19,799,677 | | | | 18,130,091 | | | | 34,632,380 | | | | 12,200,474 | | | | 916,962 | | | | 25,020,965 | | | | 5,026,481 | |
$ | 9.37 | | | $ | 15.18 | | | $ | 11.06 | | | $ | 11.10 | | | $ | 11.16 | | | $ | 13.13 | | | $ | 9.04 | |
| | | | | | | | | | | | | | | | | | | | | | | | | | |
See accompanying Notes to Financial Statements.
| | |
| |
| | April 30, 2013 |
| |
| Statements of Assets and Liabilities (unaudited) – continued | | |
| | | | | | | | |
| | |
| | | River Road
Long-Short
Fund | | | Barings
International
Fund | |
| | | | | | | | |
| | |
ASSETS: | | | | | | | | |
Investments: | | | | | | | | |
Investments at cost | | $ | 24,428,778 | | | $ | 62,406,320 | |
Net unrealized appreciation | | | 847,432 | | | | 7,112,790 | |
| | | | | | | | |
Total investments at value | | | 25,276,210 | | | | 69,519,110 | |
Foreign currency (Cost $96,972, $629,997 and $3,489) | | | — | | | | 97,887 | |
Segregated Cash (Note B (5)) | | | 5,455,267 | | | | — | |
Receivables: | | | | | | | | |
Dividends and interest | | | 2,372 | | | | 365,444 | |
Dividend reclaims | | | — | | | | 84,555 | |
Fund shares sold | | | 520,904 | | | | 90,908 | |
Investments sold | | | 1,793,491 | | | | — | |
Due from Adviser, net (Note G) | | | — | | | | — | |
Deferred offering costs (Note B (13)) | | | — | | | | — | |
Other assets | | | 5,029 | | | | 1,072 | |
| | | | | | | | |
Total assets | | | 33,053,273 | | | | 70,158,976 | |
| | | | | | | | |
| | |
LIABILITIES: | | | | | | | | |
Payables: | | | | | | | | |
Due to custodian | | | 73,560 | | | | 21,420 | |
Interest and dividends on securities sold short | | | 14,678 | | | | — | |
Investments purchased | | | 515,130 | | | | 497,637 | |
Fund shares redeemed | | | 70 | | | | 1,585,587 | |
Due to Adviser, net (Note G) | | | 16,737 | | | | 46,394 | |
Administration fees (Note G) | | | 2,906 | | | | 10,662 | |
Distribution fees (Note G) | | | 887 | | | | 25 | |
Audit and tax fees | | | 11,453 | | | | 10,589 | |
Transfer agent fees | | | 6,557 | | | | 14,682 | |
Registration fees | | | — | | | | 2,420 | |
Trustees fees and related expenses (Note G) | | | — | | | | 14 | |
Offering costs | | | — | | | | — | |
Accrued expenses and other payables | | | 5,596 | | | | 19,177 | |
Securities sold short, at value (proceeds $6,024,290) | | | 6,288,803 | | | | — | |
| | | | | | | | |
Total liabilities | | | 6,936,377 | | | | 2,208,607 | |
| | | | | | | | |
NET ASSETS | | $ | 26,116,896 | | | $ | 67,950,369 | |
| | | | | | | | |
| | |
NET ASSETS CONSIST OF: | | | | | | | | |
Paid in capital | | $ | 25,072,571 | | | $ | 62,003,957 | |
Accumulated undistributed (distribution in excess of) net investment income (loss) | | | (111,808 | ) | | | 534,290 | |
Accumulated net realized gain (loss) on investments, securities sold short and foreign currency transactions | | | 573,214 | | | | (1,701,138 | ) |
Net unrealized appreciation on investments, securities sold short and translation of assets and liabilities denominated in foreign currency | | | 582,919 | | | | 7,113,260 | |
| | | | | | | | |
TOTAL NET ASSETS | | $ | 26,116,896 | | | $ | 67,950,369 | |
| | | | | | | | |
Class N: | | | | | | | | |
Net Assets | | $ | 19,060,724 | | | $ | 455,984 | |
Shares of beneficial interest outstanding (unlimited authorization) | | | 1,707,235 | | | | 62,923 | |
NET ASSET VALUE Offering and redemption price per share
(Net Assets/Shares Outstanding) | | $ | 11.16 | | | $ | 7.25 | |
| | | | | | | | |
Class I: | | | | | | | | |
Net Assets | | $ | 7,056,172 | | | $ | 67,494,385 | |
Shares of beneficial interest outstanding (unlimited authorization) | | | 631,655 | | | | 9,307,718 | |
NET ASSET VALUE Offering and redemption price per share
(Net Assets/Shares Outstanding) | | $ | 11.17 | | | $ | 7.25 | |
| | | | | | | | |
See accompanying Notes to Financial Statements.
| | | | | | | | | | |
| | |
LMCG
Emerging
Markets Fund
| | | Harrison Street
Real Estate
Fund | | | Montag & Caldwell
Balanced Fund | |
| | | | | | | | | | |
| | |
| | | | | | | | | | |
| | | | | | | | | | |
| $ | 5,092,252 | | | $ | 11,344,342 | | | $ | 23,298,176 | |
| | 49,699 | | | | 1,561,893 | | | | 3,584,442 | |
| | | | | | | | | | |
| | 5,141,951 | | | | 12,906,235 | | | | 26,882,618 | |
| | 629,014 | | | | 3,501 | | | | — | |
| | — | | | | — | | | | — | |
| | | | | | | | | | |
| | 6,979 | | | | 5,959 | | | | 102,802 | |
| | — | | | | 457 | | | | — | |
| | — | | | | 398,623 | | | | 1,123 | |
| | — | | | | — | | | | 283,993 | |
| | 19,817 | | | | — | | | | — | |
| | 88,871 | | | | — | | | | — | |
| | — | | | | 179 | | | | 560 | |
| | | | | | | | | | |
| | 5,886,632 | | | | 13,314,954 | | | | 27,271,096 | |
| | | | | | | | | | |
| | |
| | | | | | | | | | |
| | | | | | | | | | |
| | 360,603 | | | | 30,629 | | | | 40,972 | |
| | — | | | | — | | | | — | |
| | 1,326,574 | | | | 471,862 | | | | 198,009 | |
| | — | | | | 4,030 | | | | 675 | |
| | — | | | | 1,095 | | | | 11,713 | |
| | 2,282 | | | | 1,840 | | | | 3,875 | |
| | 32 | | | | 575 | | | | 479 | |
| | 3,180 | | | | 9,428 | | | | 11,698 | |
| | 2,529 | | | | 10,887 | | | | 15,283 | |
| | 1,788 | | | | 7,643 | | | | 7,189 | |
| | 47 | | | | 17 | | | | 81 | |
| | 98,000 | | | | — | | | | — | |
| | 3,331 | | | | 4,666 | | | | 6,728 | |
| | — | | | | — | | | | — | |
| | | | | | | | | | |
| | 1,798,366 | | | | 542,672 | | | | 296,702 | |
| | | | | | | | | | |
| $ | 4,088,266 | | | $ | 12,772,282 | | | $ | 26,974,394 | |
| | | | | | | | | | |
| | |
| | | | | | | | | | |
| $ | 4,076,411 | | | $ | 23,722,532 | | | $ | 23,837,991 | |
| | 2,070 | | | | 26,484 | | | | (296,161 | ) |
| (39,284 | ) | | | (12,538,652 | ) | | | (151,878 | ) |
| 49,069 | | | | 1,561,918 | | | | 3,584,442 | |
| | | | | | | | | | |
| $ | 4,088,266 | | | $ | 12,772,282 | | | $ | 26,974,394 | |
| | | | | | | | | | |
| | | | | | | | | | |
| $ | 674,763 | | | $ | 12,540,936 | | | $ | 25,129,811 | |
| | 67,641 | | | | 1,029,966 | | | | 1,085,173 | |
$ | 9.98 | | | $ | 12.18 | | | $ | 23.16 | |
| | | | | | | | | | |
| | | | | | | | | | |
| $ | 3,413,503 | | | $ | 231,346 | | | $ | 1,844,583 | |
| | 341,891 | | | | 19,111 | | | | 79,835 | |
$ | 9.98 | | | $ | 12.11 | | | $ | 23.10 | |
| | | | | | | | | | |
See accompanying Notes to Financial Statements.
| | |
| |
| For the Six Months Ended April 30, 2013 | | |
| |
| Statements of Operations (unaudited) | | |
| | | | | | | | |
| | |
| | |
Montag & Caldwell
Growth Fund | | | TAMRO
Diversified
Equity Fund | |
| | | | | | | | |
INVESTMENT INCOME: | | | | | | | | |
Dividends | | $ | 48,227,425 | | | $ | 174,307 | |
Less: foreign taxes withheld | | | (241,893 | ) | | | (952 | ) |
| | | | | | | | |
Total investment income | | | 47,985,532 | | | | 173,355 | |
| | | | | | | | |
EXPENSES: | | | | | | | | |
Investment advisory fees (Note G) | | | 14,272,115 | | | | 95,158 | |
Distribution expenses (Note G)(a) | | | 2,510,925 | | | | 28,879 | |
Transfer agent fees | | | 1,871,724 | | | | 23,961 | |
Administration fees (Note G) | | | 1,015,015 | | | | 12,824 | |
Registration expenses | | | 61,491 | | | | 13,884 | |
Custodian fees | | | 53,599 | | | | 1,403 | |
Audit and tax fees | | | 14,954 | | | | 8,485 | |
Legal fees | | | 61,627 | | | | 324 | |
Amortization of offering costs (Note B (13)) | | | — | | | | — | |
Reports to shareholder expense | | | 135,679 | | | | 2,670 | |
Trustees fees and related expenses (Note G) | | | 148,822 | | | | 782 | |
Other expenses | | | 114,558 | | | | 2,905 | |
| | | | | | | | |
Total expenses before waivers/recoupment | | | 20,260,509 | | | | 191,275 | |
| | | | | | | | |
Less: Investment advisory fees waived (Note G) | | | — | | | | (49,399 | ) |
Plus: Net expenses eligible for recoupment (Note G) | | | — | | | | — | |
| | | | | | | | |
Net expenses | | | 20,260,509 | | | | 141,876 | |
| | | | | | | | |
NET INVESTMENT INCOME (LOSS) | | | 27,725,023 | | | | 31,479 | |
| | | | | | | | |
NET REALIZED AND UNREALIZED GAIN (LOSS) ON INVESTMENTS: | | | | | | | | |
Net realized gain on investments | | | 121,041,022 | | | | 207,626 | |
Net change in unrealized appreciation of investments | | | 462,609,984 | | | | 2,521,448 | |
| | | | | | | | |
NET REALIZED AND UNREALIZED GAIN ON INVESTMENTS | | | 583,651,006 | | | | 2,729,074 | |
| | | | | | | | |
| | |
NET INCREASE IN NET ASSETS FROM OPERATIONS | | $ | 611,376,029 | | | $ | 2,760,553 | |
| | | | | | | | |
| (a) | Distribution expense is incurred at the Class N level for all Funds except Montag & Caldwell Growth Fund. The distribution expense for Class N and R of the Montag & Caldwell Growth Fund is $2,487,764 and $23,161, respectively. |
| (b) | Change in unrealized appreciation does not include unrealized depreciation of $(45,176) of the combined Fund in connection with the Reorganization (Note J). |
See accompanying Notes to Financial Statements.
| | | | | | | | | | | | | | | | | | | | | | | | | | |
| | | | | | |
Herndon
Large Cap
Value Fund | | | Cornerstone
Large Cap
Value Fund | | | River Road
Dividend All
Cap Value Fund | | | River Road
Dividend All Cap
Value Fund II | | | Fairpointe
Mid Cap
Fund | | | Montag & Caldwell
Mid Cap
Growth Fund | | | LMCG
Small Cap
Growth Fund | |
| | | | | | | | | | | | | | | | | | | | | | | | | | |
| | | | | | | | | | | | | | | | | | | | | | | | | | |
| $ | 1,113,166 | | | $ | 295,003 | | | $ | 17,932,526 | | | $ | 406,089 | | | $ | 34,729,686 | | | $ | 37,633 | | | $ | 113,793 | |
| | — | | | | (5,817 | ) | | | (52,551 | ) | | | (1,170 | ) | | | (9,758 | ) | | | (136 | ) | | | — | |
| | | | | | | | | | | | | | | | | | | | | | | | | | |
| | 1,113,166 | | | | 289,186 | | | | 17,879,975 | | | | 404,919 | | | | 34,719,928 | | | | 37,497 | | | | 113,793 | |
| | | | | | | | | | | | | | | | | | | | | | | | | | |
| | | | | | | | | | | | | | | | | | | | | | | | | | |
| | 281,533 | | | | 125,990 | | | | 3,349,374 | | | | 86,406 | | | | 11,783,647 | | | | 45,428 | | | | 45,653 | |
| | 33,422 | | | | 28,668 | | | | 442,219 | | | | 1,667 | | | | 2,125,159 | | | | 13,361 | | | | 9,264 | |
| | 21,323 | | | | 23,083 | | | | 321,330 | | | | 14,595 | | | | 1,242,247 | | | | 8,577 | | | | 14,852 | |
| | 23,244 | | | | 13,990 | | | | 222,606 | | | | 12,767 | | | | 752,342 | | | | 9,994 | | | | 9,983 | |
| | 17,852 | | | | 14,876 | | | | 22,315 | | | | 13,885 | | | | 40,168 | | | | 8,431 | | | | 16,977 | |
| | 6,309 | | | | 1,689 | | | | 14,793 | | | | 12,057 | | | | 43,884 | | | | 3,652 | | | | 3,609 | |
| | 8,637 | | | | 10,095 | | | | 10,467 | | | | 10,109 | | | | 14,953 | | | | 8,555 | | | | 15,999 | |
| | 848 | | | | 383 | | | | 12,772 | | | | 239 | | | | 42,541 | | | | 130 | | | | 13,736 | |
| | — | | | | — | | | | — | | | | 27,155 | | | | — | | | | — | | | | — | |
| | 1,101 | | | | 2,239 | | | | 20,574 | | | | 418 | | | | 141,736 | | | | 386 | | | | 4,278 | |
| | 1,865 | | | | 893 | | | | 31,005 | | | | 369 | | | | 103,243 | | | | 286 | | | | 217 | |
| | 3,602 | | | | 3,009 | | | | 25,242 | | | | 2,518 | | | | 74,147 | | | | 2,259 | | | | 2,486 | |
| | | | | | | | | | | | | | | | | | | | | | | | | | |
| | 399,736 | | | | 224,915 | | | | 4,472,697 | | | | 182,185 | | | | 16,364,067 | | | | 101,059 | | | | 137,054 | |
| | | | | | | | | | | | | | | | | | | | | | | | | | |
| | — | | | | (30,781 | ) | | | — | | | | (50,906 | ) | | | — | | | | (34,253 | ) | | | (77,572 | ) |
| | 3,198 | | | | — | | | | — | | | | — | | | | — | | | | — | | | | — | |
| | | | | | | | | | | | | | | | | | | | | | | | | | |
| | 402,934 | | | | 194,134 | | | | 4,472,697 | | | | 131,279 | | | | 16,364,067 | | | | 66,806 | | | | 59,482 | |
| | | | | | | | | | | | | | | | | | | | | | | | | | |
| | 710,232 | | | | 95,052 | | | | 13,407,278 | | | | 273,640 | | | | 18,355,861 | | | | (29,309 | ) | | | 54,311 | |
| | | | | | | | | | | | | | | | | | | | | | | | | | |
| | | | | | | | | | | | | | | | | | | | | | | | | | |
| | 731,650 | | | | 736,653 | | | | 18,178,965 | | | | 51,745 | | | | 178,342,196 | | | | 208,508 | | | | 1,028,961 | |
| | 6,960,757 | | | | 3,353,042 | | | | 122,482,092 | | | | 4,311,941 | | | | 432,375,964 | | | | 779,669 | | | | 835,867 | (b) |
| | | | | | | | | | | | | | | | | | | | | | | | | | |
| | 7,692,407 | | | | 4,089,695 | | | | 140,661,057 | | | | 4,363,686 | | | | 610,718,160 | | | | 988,177 | | | | 1,864,828 | |
| | | | | | | | | | | | | | | | | | | | | | | | | | |
| | | | | | |
| $ | 8,402,639 | | | $ | 4,184,747 | | | $ | 154,068,335 | | | $ | 4,637,326 | | | $ | 629,074,021 | | | $ | 958,868 | | | $ | 1,919,139 | |
| | | | | | | | | | | | | | | | | | | | | | | | | | |
See accompanying Notes to Financial Statements.
| | |
| |
| For the Six Months Ended April 30, 2013 | | |
| |
| Statements of Operations (unaudited) – continued | | |
| | | | | | | | |
| | |
| | | Silvercrest
Small Cap
Fund | | | TAMRO
Small Cap
Fund | |
| | | | | | | | |
INVESTMENT INCOME: | | | | | | | | |
Dividends | | $ | 94,493 | | | $ | 7,376,032 | |
Less: foreign taxes withheld | | | — | | | | (48,821 | ) |
Interest | | | — | | | | — | |
| | | | | | | | |
Total investment income | | | 94,493 | | | | 7,327,211 | |
| | | | | | | | |
EXPENSES: | | | | | | | | |
Investment advisory fees (Note G) | | | 48,877 | | | | 4,683,097 | |
Distribution expenses (Note G) | | | 1,637 | | | | 500,976 | |
Transfer agent fees | | | 14,132 | | | | 374,322 | |
Administration fees (Note G) | | | 9,758 | | | | 241,666 | |
Registration expenses | | | 13,885 | | | | 24,795 | |
Custodian fees | | | 2,574 | | | | 14,800 | |
Audit and tax fees | | | 8,485 | | | | 10,219 | |
Legal fees | | | 108 | | | | 14,718 | |
Amortization of offering costs (Note B (13)) | | | 7,179 | | | | — | |
Reports to shareholder expense | | | 187 | | | | 37,498 | |
Trustees fees and related expenses (Note G) | | | 190 | | | | 36,032 | |
Other expenses | | | 2,439 | | | | 30,934 | |
| | | | | | | | |
Total expenses before waivers/earnings credit/recoupment | | | 109,451 | | | | 5,969,057 | |
| | | | | | | | |
Less: Investment advisory fees waived (Note G) | | | (51,605 | ) | | | — | |
Less: Earnings credit (Note I) | | | — | | | | — | |
Plus: Net expenses eligible for recoupment (Note G) | | | — | | | | — | |
| | | | | | | | |
Net expenses | | | 57,846 | | | | 5,969,057 | |
| | | | | | | | |
NET INVESTMENT INCOME (LOSS) | | | 36,647 | | | | 1,358,154 | |
| | | | | | | | |
NET REALIZED AND UNREALIZED GAIN (LOSS) ON INVESTMENTS: | | | | | | | | |
Net realized gain on investments | | | 139,513 | | | | 16,004,715 | (a) |
Net realized gain (loss) on purchased options | | | — | | | | — | |
Net realized gain (loss) on written option transactions | | | — | | | | — | |
Capital gain distributions received | | | — | | | | — | |
Net change in unrealized appreciation (depreciation) on investments | | | 1,186,982 | | | | 122,051,175 | |
Net change in unrealized appreciation/(depreciation) on purchased options | | | — | | | | — | |
Net change in unrealized appreciation (depreciation) on written options | | | — | | | | — | |
| | | | | | | | |
NET REALIZED AND UNREALIZED GAIN ON INVESTMENTS | | | 1,326,495 | | | | 138,055,890 | |
| | | | | | | | |
| | |
NET INCREASE IN NET ASSETS FROM OPERATIONS | | $ | 1,363,142 | | | $ | 139,414,044 | |
| | | | | | | | |
| (a) | On January 15, 2013, TAMRO Small Cap Fund had redemption-in-kind transfers of securities in the amount of $51,794,423. The net realized gain on the transaction of $8,390,446 will not be realized by the Fund for tax purposes. |
See accompanying Notes to Financial Statements.
| | | | | | | | | | | | | | | | | | | | | | | | | | |
| | | | | | |
River Road
Select
Value Fund | | | River Road
Small Cap
Value Fund | | | River Road
Independent
Value Fund | | | DoubleLine
Core Plus Fixed
Income Fund | | | TCH
Fixed Income
Fund | | | Lake Partners
LASSO
Alternatives Fund | | | Anchor Capital
Enhanced Equity
Fund | |
| | | | | | | | | | | | | | | | | | | | | | | | | | |
| | | | | | | | | | | | | | | | | | | | | | | | | | |
| $ | 3,064,084 | | | $ | 5,557,755 | | | $ | 4,033,551 | | | $ | 4,855 | | | $ | 9,024 | | | $ | 2,900,936 | | | $ | 2,841,814 | |
| | (8,968 | ) | | | (16,200 | ) | | | (77,636 | ) | | | — | | | | — | | | | — | | | | — | |
| | — | | | | — | | | | — | | | | 3,496,906 | | | | 1,500,896 | | | | — | | | | — | |
| | | | | | | | | | | | | | | | | | | | | | | | | | |
| | 3,055,116 | | | | 5,541,555 | | | | 3,955,915 | | | | 3,501,761 | | | | 1,509,920 | | | | 2,900,936 | | | | 2,841,814 | |
| | | | | | | | | | | | | | | | | | | | | | | | | | |
| | | | | | | | | | | | | | | | | | | | | | | | | | |
| | 866,042 | | | | 1,378,527 | | | | 3,627,806 | | | | 560,698 | | | | 191,294 | | | | 1,566,356 | | | | 548,799 | |
| | 10,682 | | | | 62,724 | | | | 455,015 | | | | 110,225 | | | | 44,373 | | | | 46,783 | | | | 113,429 | |
| | 70,837 | | | | 146,185 | | | | 309,081 | | | | 80,244 | | | | 34,218 | | | | 121,966 | | | | 85,022 | |
| | 46,887 | | | | 76,779 | | | | 169,544 | | | | 75,375 | | | | 31,828 | | | | 76,533 | | | | 44,677 | |
| | 15,372 | | | | 20,514 | | | | 23,803 | | | | 23,307 | | | | 15,372 | | | | 19,189 | | | | 24,299 | |
| | 7,378 | | | | 8,925 | | | | 11,023 | | | | 15,810 | | | | 3,805 | | | | 5,584 | | | | 27,361 | |
| | 10,095 | | | | 10,095 | | | | 8,485 | | | | 11,218 | | | | 11,204 | | | | 9,567 | | | | 9,567 | |
| | 2,275 | | | | 3,964 | | | | 9,596 | | | | 2,528 | | | | 944 | | | | 3,942 | | | | 3,175 | |
| | — | | | | — | | | | — | | | | — | | | | — | | | | — | | | | — | |
| | 10,334 | | | | 6,414 | | | | 20,527 | | | | 5,407 | | | | 3,589 | | | | 5,741 | | | | 5,482 | |
| | 5,444 | | | | 9,731 | | | | 23,243 | | | | 5,763 | | | | 2,304 | | | | 9,555 | | | | 5,896 | |
| | 6,510 | | | | 10,369 | | | | 19,592 | | | | 5,412 | | | | 3,896 | | | | 8,299 | | | | 5,818 | |
| | | | | | | | | | | | | | | | | | | | | | | | | | |
| | 1,051,856 | | | | 1,734,227 | | | | 4,677,715 | | | | 895,987 | | | | 342,827 | | | | 1,873,515 | | | | 873,525 | |
| | | | | | | | | | | | | | | | | | | | | | | | | | |
| | — | | | | — | | | | — | | | | (82,341 | ) | | | (58,467 | ) | | | — | | | | — | |
| | — | | | | — | | | | (16,493 | ) | | | — | | | | — | | | | (1,855 | ) | | | (139 | ) |
| | — | | | | — | | | | 21,849 | | | | — | | | | — | | | | 52,894 | | | | — | |
| | | | | | | | | | | | | | | | | | | | | | | | | | |
| | 1,051,856 | | | | 1,734,227 | | | | 4,683,071 | | | | 813,646 | | | | 284,360 | | | | 1,924,554 | | | | 873,386 | |
| | | | | | | | | | | | | | | | | | | | | | | | | | |
| | 2,003,260 | | | | 3,807,328 | | | | (727,156 | ) | | | 2,688,115 | | | | 1,225,560 | | | | 976,382 | | | | 1,968,428 | |
| | | | | | | | | | | | | | | | | | | | | | | | | | |
| | | | | | | | | | | | | | | | | | | | | | | | | | |
| | 16,847,219 | | | | 28,565,377 | | | | 24,953,502 | | | | 470,501 | | | | 1,146,492 | | | | 2,731,150 | | | | 12,151,843 | |
| | — | | | | — | | | | — | | | | — | | | | — | | | | — | | | | (6,950,784 | ) |
| | — | | | | — | | | | — | | | | — | | | | — | | | | — | | | | (6,713,685 | ) |
| | — | | | | — | | | | — | | | | — | | | | — | | | | 7,191,063 | | | | — | |
| | 9,419,052 | | | | 16,743,693 | | | | (8,439,826 | ) | | | 1,514,280 | | | | (665,491 | ) | | | 11,021,393 | | | | 11,099,100 | |
| | — | | | | — | | | | — | | | | — | | | | — | | | | — | | | | (3,196 | ) |
| | — | | | | — | | | | — | | | | — | | | | — | | | | — | | | | (1,375,746 | ) |
| | | | | | | | | | | | | | | | | | | | | | | | | | |
| | 26,266,271 | | | | 45,309,070 | | | | 16,513,676 | | | | 1,984,781 | | | | 481,001 | | | | 20,943,606 | | | | 8,207,532 | |
| | | | | | | | | | | | | | | | | | | | | | | | | | |
| | | | | | |
| $ | 28,269,531 | | | $ | 49,116,398 | | | $ | 15,786,520 | | | $ | 4,672,896 | | | $ | 1,706,561 | | | $ | 21,919,988 | | | $ | 10,175,960 | |
| | | | | | | | | | | | | | | | | | | | | | | | | | |
See accompanying Notes to Financial Statements.
| | |
| |
| For the Six Months Ended April 30, 2013 | | |
| |
| Statements of Operations (unaudited) – continued | | |
| | | | | | | | |
| | |
| | | River Road
Long-Short
Fund | | | Barings
International
Fund | |
| | | | | | | | |
INVESTMENT INCOME: | | | | | | | | |
Dividends | | $ | 75,907 | | | $ | 978,752 | |
Less: foreign taxes withheld | | | (1,610 | ) | | | (76,304 | ) |
Interest | | | — | | | | — | |
| | | | | | | | |
Total investment income | | | 74,297 | | | | 902,448 | |
| | | | | | | | |
EXPENSES: | | | | | | | | |
Investment advisory fees (Note G) | | | 74,740 | | | | 319,508 | |
Distribution expenses (Note G) | | | 13,443 | | | | 542 | |
Transfer agent fees | | | 10,433 | | | | 26,042 | |
Administration fees (Note G) | | | 10,614 | | | | 31,904 | |
Registration expenses | | | 13,254 | | | | 13,884 | |
Custodian fees | | | 10,539 | | | | 19,961 | |
Audit and tax fees | | | 9,958 | | | | 10,095 | |
Legal fees | | | 101 | | | | 874 | |
Interest and dividend expense on securities sold-short | | | 52,619 | | | | — | |
Amortization of offering costs (Note B (13)) | | | — | | | | — | |
Reports to shareholder expense | | | 170 | | | | 1,131 | |
Trustees fees and related expenses (Note G) | | | 249 | | | | 2,071 | |
Other expenses | | | 2,374 | | | | 3,709 | |
| | | | | | | | |
Total expenses before waivers/reimbursements | | | 198,494 | | | | 429,721 | |
| | | | | | | | |
Less: Investment advisory fees waived (Note G) | | | (42,121 | ) | | | (61,745 | ) |
Less: Expenses reimbursed (Note G) | | | — | | | | — | |
| | | | | | | | |
Net expenses | | | 156,373 | | | | 367,976 | |
| | | | | | | | |
NET INVESTMENT INCOME (LOSS) | | | (82,076 | ) | | | 534,472 | |
| | | | | | | | |
NET REALIZED AND UNREALIZED GAIN (LOSS) ON INVESTMENTS: | | | | | | | | |
Net realized gain (loss) on investments | | | 979,792 | | | | (1,380,275 | ) |
Net realized gain on short sales | | | (354,371 | ) | | | — | |
Net realized gain (loss) on foreign currency transactions | | | — | | | | (5,877 | ) |
Net change in unrealized appreciation of investments | | | 772,814 | | | | 6,004,796 | |
Net change in unrealized appreciation (depreciation) on securities sold short | | | (232,447 | ) | | | — | |
Net change in unrealized appreciation (depreciation) on translation of assets and liabilities denominated in foreign currency | | | — | | | | 3,095 | |
| | | | | | | | |
NET REALIZED AND UNREALIZED GAIN ON INVESTMENTS | | | 1,165,788 | | | | 4,621,739 | |
| | | | | | | | |
| | |
NET INCREASE IN NET ASSETS FROM OPERATIONS | | $ | 1,083,712 | | | $ | 5,156,211 | |
| | | | | | | | |
| (a) | LMCG Emerging Markets Fund began issuing shares on March 27, 2013. |
See accompanying Notes to Financial Statements.
| | | | | | | | | | |
| | |
LMCG
Emerging
Markets Fund(a) | | | Harrison Street
Real Estate
Fund | | | Montag & Caldwell
Balanced Fund | |
| | | | | | | | | | |
| | | | | | | | | | |
| $ | 5,702 | | | $ | 140,094 | | | $ | 204,675 | |
| | (641 | ) | | | (994 | ) | | | (1,007 | ) |
| | — | | | | — | | | | 127,685 | |
| | | | | | | | | | |
| | 5,061 | | | | 139,100 | | | | 331,353 | |
| | | | | | | | | | |
| | | | | | | | | | |
| | 2,127 | | | | 53,532 | | | | 109,510 | |
| | 154 | | | | 13,152 | | | | 13,734 | |
| | 2,529 | | | | 17,913 | | | | 26,239 | |
| | 2,415 | | | | 9,382 | | | | 15,706 | |
| | 3,899 | | | | 15,372 | | | | 15,868 | |
| | 3,912 | | | | 2,277 | | | | 1,669 | |
| | 3,180 | | | | 8,856 | | | | 11,204 | |
| | 18 | | | | 140 | | | | 475 | |
| | — | | | | — | | | | — | |
| | 9,129 | | | | — | | | | — | |
| | 97 | | | | 1,764 | | | | 2,956 | |
| | 47 | | | | 354 | | | | 1,056 | |
| | 195 | | | | 2,532 | | | | 3,022 | |
| | | | | | | | | | |
| | 27,702 | | | | 125,274 | | | | 201,439 | |
| | | | | | | | | | |
| | (2,127 | ) | | | (52,167 | ) | | | (27,090 | ) |
| | (22,584 | ) | | | — | | | | — | |
| | | | | | | | | | |
| | 2,991 | | | | 73,107 | | | | 174,349 | |
| | | | | | | | | | |
| | 2,070 | | | | 65,993 | | | | 157,004 | |
| | | | | | | | | | |
| | | | | | | | | | |
| | (36,084 | ) | | | 770,796 | | | | 1,689,654 | |
| | — | | | | — | | | | — | |
| | (3,200 | ) | | | 37 | | | | — | |
| | 49,699 | | | | 982,535 | | | | 603,765 | |
|
— |
| | | — | | | | — | |
| | (630 | ) | | | 64 | | | | — | |
| | | | | | | | | | |
| | 9,785 | | | | 1,753,432 | | | | 2,293,419 | |
| | | | | | | | | | |
| | |
| $ | 11,855 | | | $ | 1,819,425 | | | $ | 2,450,423 | |
| | | | | | | | | | |
See accompanying Notes to Financial Statements.
| | |
| |
| | |
| |
| Statements of Changes in Net Assets | | |
| | | | | | | | | | | | | | | | |
| | |
| | | Montag & Caldwell
Growth Fund | | | TAMRO Diversified
Equity Fund | |
| | | Six Months Ended
April 30, 2013
(unaudited) | | | Year Ended
October 31,
2012 | | | Six Months Ended
April 30, 2013
(unaudited) | | | Year Ended
October 31,
2012 | |
| | | | | | | | | | | | | | | | |
NET ASSETS at Beginning of Period | | $ | 4,323,578,881 | | | $ | 3,441,019,426 | | | $ | 22,548,977 | | | $ | 24,353,652 | |
| | | | | | | | | | | | | | | | |
Increase in net assets from operations: | | | | | | | | | | | | | | | | |
Net investment income | | | 27,725,023 | | | | 27,731,344 | | | | 31,479 | | | | 830 | |
Net realized gain (loss) on investments | | | 121,041,022 | | | | 287,451,677 | | | | 207,626 | | | | (34,026 | ) |
Net change in unrealized appreciation on
investments | | | 462,609,984 | | | | 78,274,829 | | | | 2,521,448 | | | | 2,549,855 | |
| | | | | | | | | | | | | | | | |
Net increase in net assets from operations | | | 611,376,029 | | | | 393,457,850 | | | | 2,760,553 | | | | 2,516,659 | |
| | | | | | | | | | | | | | | | |
Distributions to shareholders from: | | | | | | | | | | | | | | | | |
Net investment income: | | | | | | | | | | | | | | | | |
Class N | | | (16,441,713 | ) | | | (8,653,266 | ) | | | (44,731 | ) | | | — | |
Class I | | | (26,011,984 | ) | | | (13,404,436 | ) | | | (2,691 | ) | | | — | |
Class R | | | (54,774 | ) | | | (23,730 | ) | | | — | | | | — | |
Net realized gain on investments: | | | | | | | | | | | | | | | | |
Class N | | | (127,477,429 | ) | | | (125,020,421 | ) | | | (25,121 | ) | | | (473,355 | ) |
Class I | | | (157,688,991 | ) | | | (132,016,151 | ) | | | (682 | ) | | | — | |
Class R | | | (604,214 | ) | | | (653,567 | ) | | | — | | | | — | |
| | | | | | | | | | | | | | | | |
Total distributions | | | (328,279,105 | ) | | | (279,771,571 | ) | | | (73,225 | ) | | | (473,355 | ) |
| | | | | | | | | | | | | | | | |
Capital share transactions: | | | | | | | | | | | | | | | | |
Proceeds from sales of shares: | | | | | | | | | | | | | | | | |
Class N | | | 185,542,893 | | | | 441,340,857 | | | | 2,437,974 | | | | 2,735,793 | |
Class I | | | 443,973,192 | | | | 1,079,995,284 | | | | 196,911 | | | | 584,348 | |
Class R | | | 1,350,799 | | | | 2,438,971 | | | | — | | | | — | |
Proceeds from reinvestment of distributions: | | | | | | | | | | | | | | | | |
Class N | | | 140,514,488 | | | | 130,056,898 | | | | 68,008 | | | | 461,380 | |
Class I | | | 139,367,182 | | | | 100,607,628 | | | | 3,373 | | | | — | |
Class R | | | 504,660 | | | | 530,624 | | | | — | | | | — | |
Cost of shares redeemed: | | | | | | | | | | | | | | | | |
Class N | | | (199,735,842 | ) | | | (404,459,339 | ) | | | (2,397,191 | ) | | | (7,598,556 | ) |
Class I | | | (394,883,634 | ) | | | (578,526,415 | ) | | | (14,046 | ) | | | (30,944 | ) |
Class R | | | (1,276,844 | ) | | | (3,111,332 | ) | | | — | | | | — | |
| | | | | | | | | | | | | | | | |
Net increase (decrease) from capital share transactions | | | 315,356,894 | | | | 768,873,176 | | | | 295,029 | | | | (3,847,979 | ) |
| | | | | | | | | | | | | | | | |
Total increase (decrease) in net assets | | | 598,453,818 | | | | 882,559,455 | | | | 2,982,357 | | | | (1,804,675 | ) |
| | | | | | | | | | | | | | | | |
NET ASSETS at End of Period | | $ | 4,922,032,699 | | | $ | 4,323,578,881 | | | $ | 25,531,334 | | | $ | 22,548,977 | |
| | | | | | | | | | | | | | | | |
Undistributed (distributions in excess of) net investment income (loss) | | $ | 8,487,357 | | | $ | 23,270,805 | | | $ | (15,113 | ) | | $ | 830 | |
| | | | | | | | | | | | | | | | |
See accompanying Notes to Financial Statements.
| | | | | | | | | | | | | | | | | | | | | | |
| | |
Herndon Large Cap
Value Fund | | | Cornerstone Large Cap
Value Fund | | | River Road Dividend
All Cap Value Fund | |
Six Months Ended
April 30, 2013
(unaudited) | | | Year Ended
October 31,
2012 | | | Six Months Ended
April 30, 2013
(unaudited) | | | Year Ended
October 31,
2012 | | | Six Months Ended
April 30, 2013
(unaudited) | | | Year Ended
October 31,
2012 | |
| | | | | | | | | | | | | | | | | | | | | | |
| $ | 55,406,952 | | | $ | 17,969,968 | | | $ | 26,502,868 | | | $ | 24,756,738 | | | $ | 924,209,368 | | | $ | 620,152,985 | |
| | | | | | | | | | | | | | | | | | | | | | |
| | | | | | | | | | | | | | | | | | | | | | |
| | 710,232 | | | | 698,262 | | | | 95,052 | | | | 240,995 | | | | 13,407,278 | | | | 23,469,901 | |
| | 731,650 | | | | 930,577 | | | | 736,653 | | | | 1,056,316 | | | | 18,178,965 | | | | 35,184,296 | |
| 6,960,757 | | | | 984,335 | | | | 3,353,042 | | | | 1,197,003 | | | | 122,482,092 | | | | 38,094,587 | |
| | | | | | | | | | | | | | | | | | | | | | |
| | 8,402,639 | | | | 2,613,174 | | | | 4,184,747 | | | | 2,494,314 | | | | 154,068,335 | | | | 96,748,784 | |
| | | | | | | | | | | | | | | | | | | | | | |
| | | | | | | | | | | | | | | | | | | | | | |
| | | | | | | | | | | | | | | | | | | | | | |
| | (435,807 | ) | | | (69,391 | ) | | | (213,973 | ) | | | (110,362 | ) | | | (3,961,089 | ) | | | (8,876,757 | ) |
| | (712,891 | ) | | | (154,780 | ) | | | (61,387 | ) | | | (577 | ) | | | (7,305,014 | ) | | | (14,324,347 | ) |
| | — | | | | — | | | | — | | | | — | | | | — | | | | — | |
| | | | | | | | | | | | | | | | | | | | | | |
| | (431,437 | ) | | | (340,506 | ) | | | — | | | | — | | | | (12,882,031 | ) | | | (2,301,513 | ) |
| | (650,587 | ) | | | (604,334 | ) | | | — | | | | — | | | | (21,478,515 | ) | | | (2,349,496 | ) |
| | — | | | | — | | | | — | | | | — | | | | — | | | | — | |
| | | | | | | | | | | | | | | | | | | | | | |
| | (2,230,722 | ) | | | (1,169,011 | ) | | | (275,360 | ) | | | (110,939 | ) | | | (45,626,649 | ) | | | (27,852,113 | ) |
| | | | | | | | | | | | | | | | | | | | | | |
| | | | | | | | | | | | | | | | | | | | | | |
| | | | | | | | | | | | | | | | | | | | | | |
| | 14,553,165 | | | | 19,089,187 | | | | 3,612,948 | | | | 5,930,111 | | | | 26,066,868 | | | | 113,881,567 | |
| | 20,886,005 | | | | 26,894,024 | | | | 11,903,241 | | | | 5,334,807 | | | | 106,266,446 | | | | 274,730,584 | |
| | — | | | | — | | | | — | | | | — | | | | — | | | | — | |
| | | | | | | | | | | | | | | | | | | | | | |
| | 867,244 | | | | 409,897 | | | | 205,857 | | | | 106,566 | | | | 16,704,971 | | | | 11,027,472 | |
| | 959,131 | | | | 759,114 | | | | 60,827 | | | | 577 | | | | 21,008,785 | | | | 11,799,898 | |
| | — | | | | — | | | | — | | | | — | | | | — | | | | — | |
| | | | | | | | | | | | | | | | | | | | | | |
| | (4,423,463 | ) | | | (5,463,083 | ) | | | (1,849,760 | ) | | | (11,895,211 | ) | | | (21,085,548 | ) | | | (117,659,249 | ) |
| | (2,463,501 | ) | | | (5,696,318 | ) | | | (1,186,455 | ) | | | (114,095 | ) | | | (87,117,711 | ) | | | (58,620,560 | ) |
| | — | | | | — | | | | — | | | | — | | | | — | | | | — | |
| | | | | | | | | | | | | | | | | | | | | | |
| | | | | |
| | 30,378,581 | | | | 35,992,821 | | | | 12,746,658 | | | | (637,245 | ) | | | 61,843,811 | | | | 235,159,712 | |
| | | | | | | | | | | | | | | | | | | | | | |
| | 36,550,498 | | | | 37,436,984 | | | | 16,656,045 | | | | 1,746,130 | | | | 170,285,497 | | | | 304,056,383 | |
| | | | | | | | | | | | | | | | | | | | | | |
| $ | 91,957,450 | | | $ | 55,406,952 | | | $ | 43,158,913 | | | $ | 26,502,868 | | | $ | 1,094,494,865 | | | $ | 924,209,368 | |
| | | | | | | | | | | | | | | | | | | | | | |
| | | | | |
| $ | 162,825 | | | $ | 601,291 | | | $ | (50,252 | ) | | $ | 130,056 | | | $ | 2,273,812 | | | $ | 132,637 | |
| | | | | | | | | | | | | | | | | | | | | | |
See accompanying Notes to Financial Statements.
| | |
| |
| | |
| |
| Statements of Changes in Net Assets – continued | | |
| | | | | | | | | | | | | | | | |
| | |
| | | River Road Dividend
All Cap Value Fund II | | | Fairpointe Mid Cap Fund | |
| | | Six Months Ended
April 30, 2013
(unaudited) | | | Period Ended
October 31,
2012(a) | | | Six Months Ended
April 30, 2013
(unaudited) | | | Year Ended
October 31,
2012 | |
| | | | | | | | | | | | | | | | |
NET ASSETS at Beginning of Period | | $ | 10,419,240 | | | $ | — | | | $ | 3,025,731,632 | | | $ | 2,841,488,832 | |
| | | | | | | | | | | | | | | | |
Increase in net assets from operations: | | | | | | | | | | | | | | | | |
Net investment income (loss) | | | 273,640 | | | | 43,321 | | | | 18,355,861 | | | | 18,064,492 | |
Net realized gain on investments | | | 51,745 | | | | 5,681 | | | | 178,342,196 | | | | 70,142,404 | |
Net change in unrealized appreciation (depreciation) on investments | | | 4,311,941 | | | | (47,353 | ) | | | 432,375,964 | | | | 207,549,967 | |
| | | | | | | | | | | | | | | | |
Net increase in net assets from operations | | | 4,637,326 | | | | 1,649 | | | | 629,074,021 | | | | 295,756,863 | |
| | | | | | | | | | | | | | | | |
Distributions to shareholders from: | | | | | | | | | | | | | | | | |
Net investment income: | | | | | | | | | | | | | | | | |
Class N | | | (14,516 | ) | | | (4,217 | ) | | | (14,340,582 | ) | | | (2,661,253 | ) |
Class I | | | (270,007 | ) | | | (38,951 | ) | | | (17,097,297 | ) | | | (5,501,975 | ) |
Net realized gain on investments: | | | | | | | | | | | | | | | | |
Class N | | | (483 | ) | | | — | | | | (34,919,881 | ) | | | (10,321,076 | ) |
Class I | | | (6,506 | ) | | | — | | | | (32,705,189 | ) | | | (8,446,694 | ) |
| | | | | | | | | | | | | | | | |
Total distributions | | | (291,512 | ) | | | (43,168 | ) | | | (99,062,949 | ) | | | (26,930,998 | ) |
| | | | | | | | | | | | | | | | |
Capital share transactions: | | | | | | | | | | | | | | | | |
Proceeds from sales of shares: | | | | | | | | | | | | | | | | |
Class N | | | 1,708,672 | | | | 1,042,531 | | | | 286,271,117 | | | | 442,895,376 | |
Class I | | | 39,160,768 | | | | 9,388,289 | | | | 370,954,592 | | | | 655,170,800 | |
Proceeds from reinvestment of distributions: | | | | | | | | | | | | | | | | |
Class N | | | 14,547 | | | | 3,909 | | | | 47,067,455 | | | | 12,395,039 | |
Class I | | | 250,817 | | | | 36,423 | | | | 34,143,433 | | | | 9,858,507 | |
Cost of shares redeemed: | | | | | | | | | | | | | | | | |
Class N | | | (573,180 | ) | | | (414 | ) | | | (296,593,092 | ) | | | (540,581,863 | ) |
Class I | | | (349,493 | ) | | | (9,979 | ) | | | (274,853,163 | ) | | | (664,320,924 | )(c) |
Issued due to merger: | | | | | | | | | | | | | | | | |
Class N | | | — | | | | — | | | | — | | | | — | |
Class I | | | — | | | | — | | | | — | | | | — | |
| | | | | | | | | | | | | | | | |
Net increase (decrease) from capital share transactions | | | 40,212,131 | | | | 10,460,759 | | | | 166,990,342 | | | | (84,583,065 | ) |
| | | | | | | | | | | | | | | | |
Total increase (decrease) in net assets | | | 44,557,945 | | | | 10,419,240 | | | | 697,001,414 | | | | 184,242,800 | |
| | | | | | | | | | | | | | | | |
NET ASSETS at End of Period | | $ | 54,977,185 | | | $ | 10,419,240 | | | $ | 3,722,733,046 | | | $ | 3,025,731,632 | |
| | | | | | | | | | | | | | | | |
Undistributed (distributions in excess of) net investment income (loss) | | $ | (3,107 | ) | | $ | 7,776 | | | $ | (1,101,531 | ) | | $ | 11,980,487 | |
| | | | | | | | | | | | | | | | |
| (a) | River Road Dividend All Cap Value Fund II began issuing shares on June 26, 2012. |
| (b) | Silvercrest Small Cap Fund began issuing shares on December 23, 2011. |
| (c) | Fairpointe Mid Cap Fund had a redemption-in-kind in the amount of $38,722,763 on January 13, 2012. The redemption was comprised of securities and cash in the amounts of $38,179,960 and $542,803, respectively. |
| (d) | LMCG Small Cap Growth Fund had a redemption-in-kind in the amount of $2,554,395 on September 25, 2012. The redemption was comprised of securities and cash in the amounts of $2,419,213 and $135,182, respectively. |
| (e) | Silvercrest Small Cap Fund had a redemption-in-kind in the amount of $2,608,977 on April 26, 2012. The redemption was comprised of securities and cash in the amounts of $2,579,146 and $29,831, respectively. |
See accompanying Notes to Financial Statements.
| | | | | | | | | | | | | | | | | | | | | | |
| | |
Montag & Caldwell
Mid Cap Growth Fund | | | LMCG Small Cap
Growth Fund | | | Silvercrest Small
Cap Fund | |
Six Months Ended
April 30, 2013
(unaudited) | | | Year Ended
October 31,
2012 | | | Six Months Ended
April 30, 2013
(unaudited) | | | Year Ended
October 31,
2012 | | | Six Months Ended
April 30, 2013
(unaudited) | | | Year Ended
October 31,
2012(b) | |
| | | | | | | | | | | | | | | | | | | | | | |
| $ | 7,368,950 | | | $ | 4,507,024 | | | $ | 6,413,230 | | | $ | 7,961,781 | | | $ | 5,711,567 | | | $ | — | |
| | | | | | | | | | | | | | | | | | | | | | |
| | | | | | | | | | | | | | | | | | | | | | |
| | (29,309 | ) | | | (39,008 | ) | | | 54,311 | | | | (88,866 | ) | | | 36,647 | | | | 16,120 | |
| | 208,508 | | | | 426,097 | | | | 1,028,961 | | | | 793,830 | | | | 139,513 | | | | 226,287 | |
|
779,669 |
| | | (74,900 | ) | | | 835,867 | | | | 504,009 | | | | 1,186,982 | | | | 111,181 | |
| | | | | | | | | | | | | | | | | | | | | | |
| | 958,868 | | | | 312,189 | | | | 1,919,139 | | | | 1,208,973 | | | | 1,363,142 | | | | 353,588 | |
| | | | | | | | | | | | | | | | | | | | | | |
| | | | | | | | | | | | | | | | | | | | | | |
| | | | | | | | | | | | | | | | | | | | | | |
| | — | | | | — | | | | — | | | | — | | | | (9,878 | ) | | | — | |
| | — | | | | — | | | | — | | | | — | | | | (78,421 | ) | | | — | |
| | | | | | | | | | | | | | | | | | | | | | |
| | (92,399 | ) | | | — | | | | (425,537 | ) | | | — | | | | (2,878 | ) | | | — | |
| | — | | | | — | | | | (58,662 | ) | | | — | | | | (19,730 | ) | | | — | |
| | | | | | | | | | | | | | | | | | | | | | |
| | (92,399 | ) | | | — | | | | (484,199 | ) | | | — | | | | (110,907 | ) | | | — | |
| | | | | | | | | | | | | | | | | | | | | | |
| | | | | | | | | | | | | | | | | | | | | | |
| | | | | | | | | | | | | | | | | | | | | | |
| | 5,282,555 | | | | 3,071,452 | | | | 2,563,978 | | | | 1,039,380 | | | | 1,014,009 | | | | 706,680 | |
| | — | | | | — | | | | 2,426,934 | | | | 297,740 | | | | 5,536,211 | | | | 7,290,194 | |
| | | | | | | | | | | | | | | | | | | | | | |
| | 81,176 | | | | — | | | | 425,537 | | | | — | | | | 12,756 | | | | — | |
| | — | | | | — | | | | 58,662 | | | | — | | | | 98,151 | | | | — | |
| | | | | | | | | | | | | | | | | | | | | | |
| | (747,421 | ) | | | (521,715 | ) | | | (1,569,205 | ) | | | (1,540,249 | ) | | | (586,538 | ) | | | (3,366 | ) |
| | — | | | | — | | | | (25,527 | ) | | | (2,554,395 | )(d) | | | (263,591 | ) | | | (2,635,529 | )(e) |
| | | | | | | | | | | | | | | | | | | | | | |
| | — | | | | — | | | | 18,799,852 | | | | — | | | | — | | | | — | |
| | — | | | | — | | | | 1,044,848 | | | | — | | | | — | | | | — | |
| | | | | | | | | | | | | | | | | | | | | | |
|
4,616,310 |
| | | 2,549,737 | | | | 23,725,079 | | | | (2,757,524 | ) | | | 5,810,998 | | | | 5,357,979 | |
| | | | | | | | | | | | | | | | | | | | | | |
| | 5,482,779 | | | | 2,861,926 | | | | 25,160,019 | | | | (1,548,551 | ) | | | 7,063,233 | | | | 5,711,567 | |
| | | | | | | | | | | | | | | | | | | | | | |
| $ | 12,851,729 | | | $ | 7,368,950 | | | $ | 31,573,249 | | | $ | 6,413,230 | | | $ | 12,774,800 | | | $ | 5,711,567 | |
| | | | | | | | | | | | | | | | | | | | | | |
$ |
(66,990 |
) | | $ | (37,681 | ) | | $ | 49,136 | | | $ | (5,175 | ) | | $ | (15,925 | ) | | $ | 35,727 | |
| | | | | | | | | | | | | | | | | | | | | | |
See accompanying Notes to Financial Statements.
| | |
| |
| | |
| |
| Statements of Changes in Net Assets – continued | | |
| | | | | | | | | | | | | | | | |
| | |
| | | TAMRO
Small Cap Fund | | | River Road
Select Value Fund | |
| | | Six Months Ended
April 30, 2013
(unaudited) | | | Year Ended
October 31,
2012 | | | Six Months Ended
April 30, 2013
(unaudited) | | | Year Ended
October 31,
2012 | |
| | | | | | | | | | | | | | | | |
NET ASSETS at Beginning of Period | | $ | 1,024,788,083 | | | $ | 1,001,284,211 | | | $ | 162,779,864 | | | $ | 143,687,434 | |
| | | | | | | | | | | | | | | | |
Increase in net assets from operations: | | | | | | | | | | | | | | | | |
Net investment income (loss) | | | 1,358,154 | | | | (4,509,026 | ) | | | 2,003,260 | | | | 454,084 | |
Net realized gain on investments | | | 16,004,715 | | | | 104,050,686 | | | | 16,847,219 | | | | 10,079,561 | |
Net change in unrealized appreciation (depreciation) on investments | | | 122,051,175 | | | | 6,000,858 | | | | 9,419,052 | | | | 7,191,158 | |
| | | | | | | | | | | | | | | | |
Net increase in net assets from operations | | | 139,414,044 | | | | 105,542,518 | | | | 28,269,531 | | | | 17,724,803 | |
| | | | | | | | | | | | | | | | |
Distributions to shareholders from: | | | | | | | | | | | | | | | | |
Net investment income: | | | | | | | | | | | | | | | | |
Class N | | | — | | | | — | | | | (95,581 | ) | | | — | |
Class I | | | — | | | | — | | | | (2,552,798 | ) | | | — | |
Net realized gain on investments: | | | | | | | | | | | | | | | | |
Class N | | | (36,352,901 | ) | | | (37,105,939 | ) | | | (391,684 | ) | | | (2,638,084 | ) |
Class I | | | (59,453,401 | ) | | | (60,086,992 | ) | | | (8,873,103 | ) | | | (26,691,130 | ) |
| | | | | | | | | | | | | | | | |
Total distributions | | | (95,806,302 | ) | | | (97,192,931 | ) | | | (11,913,166 | ) | | | (29,329,214 | ) |
| | | | | | | | | | | | | | | | |
Capital share transactions: | | | | | | | | | | | | | | | | |
Proceeds from sales of shares: | | | | | | | | | | | | | | | | |
Class N | | | 46,927,350 | | | | 100,985,943 | | | | 6,758,713 | | | | 2,113,833 | |
Class I | | | 105,949,711 | | | | 155,633,470 | | | | 33,946,467 | | | | 50,275,199 | |
Proceeds from reinvestment of distributions: | | | | | | | | | | | | | | | | |
Class N | | | 35,759,291 | | | | 36,431,124 | | | | 459,196 | | | | 2,564,966 | |
Class I | | | 43,230,709 | | | | 41,999,122 | | | | 10,087,922 | | | | 23,172,373 | |
Cost of shares redeemed: | | | | | | | | | | | | | | | | |
Class N | | | (61,919,524 | ) | | | (126,301,603 | ) | | | (1,244,536 | ) | | | (10,015,665 | ) |
Class I | | | (134,480,385 | )(a) | | | (193,593,771 | )(b) | | | (30,535,756 | ) | | | (37,413,865 | ) |
| | | | | | | | | | | | | | | | |
Net increase (decrease) from capital share transactions | | | 35,467,152 | | | | 15,154,285 | | | | 19,472,006 | | | | 30,696,841 | |
| | | | | | | | | | | | | | | | |
Total increase (decrease) in net assets | | | 79,074,894 | | | | 23,503,872 | | | | 35,828,371 | | | | 19,092,430 | |
| | | | | | | | | | | | | | | | |
NET ASSETS at End of Period | | $ | 1,103,862,977 | | | $ | 1,024,788,083 | | | $ | 198,608,235 | | | $ | 162,779,864 | |
| | | | | | | | | | | | | | | | |
Undistributed (distributions in excess of) net investment income (loss) | | $ | 1,358,154 | | | $ | — | | | $ | (185,056 | ) | | $ | 460,063 | |
| | | | | | | | | | | | | | | | |
| (a) | TAMRO Small Cap Fund had a redemption-in-kind in the amount of $52,573,290 on January 15, 2013. The redemption was comprised of securities and cash in the amounts of $51,794,423 and $778,867, respectively. |
| (b) | TAMRO Small Cap Fund had redemptions-in-kind in the amounts of $40,667,980 and $7,010,475, respectively, on May 1, 2012 and June 27, 2012. The redemptions were comprised of securities and cash in the amounts of $39,335,174 and $6,762,586, respectively and $1,332,806 and $247,889, respectively. |
See accompanying Notes to Financial Statements.
| | | | | | | | | | | | | | | | | | | | | | |
| | |
River Road
Small Cap Value Fund | | | River Road
Independent Value Fund | | | DoubleLine Core Plus Fixed
Income Fund | |
Six Months Ended
April 30, 2013
(unaudited) | | | Year Ended
October 31,
2012 | | | Six Months Ended
April 30, 2013
(unaudited) | | | Year Ended
October 31,
2012 | | | Six Months Ended
April 30, 2013
(unaudited) | | | Year Ended
October 31,
2012 | |
| | | | | | | | | | | | | | | | | | | | | | |
| $ | 289,229,188 | | | $ | 337,488,064 | | | $ | 700,649,463 | | | $ | 391,700,125 | | | $ | 176,881,578 | | | $ | 27,143,189 | |
| | | | | | | | | | | | | | | | | | | | | | |
| | | | | | | | | | | | | | | | | | | | | | |
| | 3,807,328 | | | | 1,258,684 | | | | (727,156 | ) | | | (4,006,369 | ) | | | 2,688,115 | | | | 2,987,256 | |
| | 28,565,377 | | | | 21,254,625 | | | | 24,953,502 | | | | 36,018,328 | | | | 470,501 | | | | 1,032,232 | |
|
16,743,693 |
| | | 11,176,504 | | | | (8,439,826 | ) | | | 10,854,961 | | | | 1,514,280 | | | | 4,872,717 | |
| | | | | | | | | | | | | | | | | | | | | | |
| | 49,116,398 | | | | 33,689,813 | | | | 15,786,520 | | | | 42,866,920 | | | | 4,672,896 | | | | 8,892,205 | |
| | | | | | | | | | | | | | | | | | | | | | |
| | | | | | | | | | | | | | | | | | | | | | |
| | | | | | | | | | | | | | | | | | | | | | |
| | (768,063 | ) | | | — | | | | — | | | | — | | | | (1,398,451 | ) | | | (1,317,861 | ) |
| | (4,548,794 | ) | | | — | | | | — | | | | — | | | | (1,990,847 | ) | | | (2,043,553 | ) |
| | | | | | | | | | | | | | | | | | | | | | |
| | (1,497,083 | ) | | | — | | | | (20,379,878 | ) | | | (3,623,431 | ) | | | (491,620 | ) | | | (34,851 | ) |
| | (7,569,096 | ) | | | — | | | | (19,173,209 | ) | | | (2,074,734 | ) | | | (597,665 | ) | | | (24,248 | ) |
| | | | | | | | | | | | | | | | | | | | | | |
| | (14,383,036 | ) | | | — | | | | (39,553,087 | ) | | | (5,698,165 | ) | | | (4,478,583 | ) | | | (3,420,513 | ) |
| | | | | | | | | | | | | | | | | | | | | | |
| | | | | | | | | | | | | | | | | | | | | | |
| | | | | | | | | | | | | | | | | | | | | | |
| | 3,572,808 | | | | 11,250,505 | | | | 66,566,015 | | | | 202,967,411 | | | | 40,270,203 | | | | 71,060,094 | |
| | 23,968,968 | | | | 47,334,504 | | | | 76,966,063 | | | | 276,507,471 | | | | 40,749,775 | | | | 103,044,113 | |
| | | | | | | | | | | | | | | | | | | | | | |
| | 2,244,845 | | | | — | | | | 20,310,806 | | | | 3,615,800 | | | | 1,869,711 | | | | 1,344,828 | |
| | 12,089,609 | | | | — | | | | 18,660,298 | | | | 2,024,439 | | | | 2,310,129 | | | | 1,929,366 | |
| | | | | | | | | | | | | | | | | | | | | | |
| | (7,236,197 | ) | | | (61,115,685 | ) | | | (96,452,265 | ) | | | (170,062,099 | ) | | | (17,922,852 | ) | | | (25,676,534 | ) |
| | (29,943,804 | ) | | | (79,418,013 | ) | | | (39,449,921 | ) | | | (43,272,439 | ) | | | (13,106,829 | ) | | | (7,435,170 | ) |
| | | | | | | | | | | | | | | | | | | | | | |
|
4,696,229 |
| | | (81,948,689 | ) | | | 46,600,996 | | | | 271,780,583 | | | | 54,170,137 | | | | 144,266,697 | |
| | | | | | | | | | | | | | | | | | | | | | |
| | 39,429,591 | | | | (48,258,876 | ) | | | 22,834,429 | | | | 308,949,338 | | | | 54,364,450 | | | | 149,738,389 | |
| | | | | | | | | | | | | | | | | | | | | | |
| $ | 328,658,779 | | | $ | 289,229,188 | | | $ | 723,483,892 | | | $ | 700,649,463 | | | $ | 231,246,028 | | | $ | 176,881,578 | |
| | | | | | | | | | | | | | | | | | | | | | |
$ |
(214,865 |
) | | $ | 1,294,664 | | | $ | (770,617 | ) | | $ | (43,461 | ) | | $ | (1,081,922 | ) | | $ | (380,739 | ) |
| | | | | | | | | | | | | | | | | | | | | | |
See accompanying Notes to Financial Statements.
| | |
| |
| | |
| |
| Statements of Changes in Net Assets – continued | | |
| | | | | | | | | | | | | | | | |
| | |
| | | TCH Fixed Income Fund | | | Lake Partners
LASSO Alternatives Fund | |
| | | Six Months Ended
April 30, 2013
(unaudited) | | | Year Ended
October 31,
2012 | | | Six Months Ended
April 30, 2013
(unaudited) | | | Year Ended
October 31,
2012 | |
| | | | | | | | | | | | | | | | |
NET ASSETS at Beginning of Period | | $ | 70,167,760 | | | $ | 72,769,324 | | | $ | 287,061,601 | | | $ | 207,625,322 | |
| | | | | | | | | | | | | | | | |
Increase in net assets from operations: | | | | | | | | | | | | | | | | |
Net investment income (loss) | | | 1,225,560 | | | | 3,011,666 | | | | 976,382 | | | | 1,365,720 | |
Net realized gain (loss) on investments, purchased options, written options, securities sold short, foreign currency transactions and capital gain distributions | | | 1,146,492 | | | | 1,541,463 | | | | 9,922,213 | | | | 1,557,869 | |
Net change in unrealized appreciation (depreciation) on investments, purchased options, written options, securities sold short and translation of assets and liabilities denominated in foreign currency | | | (665,491 | ) | | | 2,125,017 | | | | 11,021,393 | | | | 10,167,273 | |
| | | | | | | | | | | | | | | | |
Net increase in net assets from operations | | | 1,706,561 | | | | 6,678,146 | | | | 21,919,988 | | | | 13,090,862 | |
| | | | | | | | | | | | | | | | |
Distributions to shareholders from: | | | | | | | | | | | | | | | | |
Net investment income: | | | | | | | | | | | | | | | | |
Class N | | | (1,205,704 | ) | | | (2,752,487 | ) | | | (472,420 | ) | | | (255,933 | ) |
Class I | | | (218,905 | ) | | | (479,605 | ) | | | (3,732,874 | ) | | | (3,425,003 | ) |
Net realized gain on investments: | | | | | | | | | | | | | | | | |
Class N | | | — | | | | — | | | | — | | | | — | |
Class I | | | — | | | | — | | | | — | | | | — | |
| | | | | | | | | | | | | | | | |
Total distributions | | | (1,424,609 | ) | | | (3,232,092 | ) | | | (4,205,294 | ) | | | (3,680,936 | ) |
| | | | | | | | | | | | | | | | |
Capital share transactions: | | | | | | | | | | | | | | | | |
Proceeds from sales of shares: | | | | | | | | | | | | | | | | |
Class N | | | 8,137,341 | | | | 11,970,554 | | | | 18,408,483 | | | | 20,838,852 | |
Class I | | | 786,153 | | | | 3,311,240 | | | | 101,084,466 | | | | 104,018,117 | |
Proceeds from reinvestment of distributions: | | | | | | | | | | | | | | | | |
Class N | | | 1,156,823 | | | | 2,642,277 | | | | 452,219 | | | | 254,528 | |
Class I | | | 190,631 | | | | 384,209 | | | | 3,236,441 | | | | 1,747,717 | |
Cost of shares redeemed: | | | | | | | | | | | | | | | | |
Class N | | | (9,770,202 | ) | | | (20,139,538 | ) | | | (12,500,660 | ) | | | (5,931,093 | ) |
Class I | | | (1,179,134 | ) | | | (4,216,360 | ) | | | (44,658,609 | ) | | | (50,901,768 | ) |
| | | | | | | | | | | | | | | | |
Net increase (decrease) from capital share transactions | | | (678,388 | ) | | | (6,047,618 | ) | | | 66,022,340 | | | | 70,026,353 | |
| | | | | | | | | | | | | | | | |
Total increase (decrease) in net assets | | | (396,436 | ) | | | (2,601,564 | ) | | | 83,737,034 | | | | 79,436,279 | |
| | | | | | | | | | | | | | | | |
NET ASSETS at End of Period | | $ | 69,771,324 | | | $ | 70,167,760 | | | $ | 370,798,635 | | | $ | 287,061,601 | |
| | | | | | | | | | | | | | | | |
Undistributed (distributions in excess of) net investment income (loss) | | $ | 58,234 | | | $ | 257,283 | | | $ | (2,447,886 | ) | | $ | 781,026 | |
| | | | | | | | | | | | | | | | |
See accompanying Notes to Financial Statements.
| | | | | | | | | | | | | | | | | | | | | | |
| | |
Anchor Capital
Enhanced Equity Fund | | | River Road
Long-Short Fund | | | Barings
International Fund | |
Six Months Ended
April 30, 2013
(unaudited) | | | Year Ended
October 31,
2012 | | | Six Months Ended
April 30, 2013
(unaudited) | | | Year Ended
October 31,
2012 | | | Six Months Ended
April 30, 2013
(unaudited) | | | Year Ended
October 31,
2012 | |
| | | | | | | | | | | | | | | | | | | | | | |
| $ | 177,809,320 | | | $ | 113,205,174 | | | $ | 7,506,387 | | | $ | 4,593,930 | | | $ | 62,083,656 | | | $ | 52,782,652 | |
| | | | | | | | | | | | | | | | | | | | | | |
| | | | | | | | | | | | | | | | | | | | | | |
| | 1,968,428 | | | | 2,759,375 | | | | (82,076 | ) | | | (98,537 | ) | | | 534,472 | | | | 1,043,951 | |
|
(1,512,626 |
) | | | 2,854,278 | | | | 625,421 | | | | 613,267 | | | | (1,386,152 | ) | | | 883,136 | |
|
9,720,158 |
| | | (1,004,621 | ) | | | 540,367 | | | | (73,523 | ) | | | 6,007,891 | | | | 760,195 | |
| | | | | | | | | | | | | | | | | | | | | | |
| | 10,175,960 | | | | 4,609,032 | | | | 1,083,712 | | | | 441,207 | | | | 5,156,211 | | | | 2,687,282 | |
| | | | | | | | | | | | | | | | | | | | | | |
| | | | | | | | | | | | | | | | | | | | | | |
| | | | | | | | | | | | | | | | | | | | | | |
| | (1,091,234 | ) | | | (1,259,013 | ) | | | — | | | | — | | | | (5,702 | ) | | | (2,517 | ) |
| | (910,892 | ) | | | (1,453,347 | ) | | | — | | | | — | | | | (986,921 | ) | | | (507,253 | ) |
| | | | | | | | | | | | | | | | | | | | | | |
| | (1,672,759 | ) | | | (5,377,824 | ) | | | (437,571 | ) | | | — | | | | (5,125 | ) | | | (9,564 | ) |
| | (1,243,697 | ) | | | (6,563,185 | ) | | | — | | | | — | | | | (754,174 | ) | | | (1,371,156 | ) |
| | | | | | | | | | | | | | | | | | | | | | |
| | (4,918,582 | ) | | | (14,653,369 | ) | | | (437,571 | ) | | | — | | | | (1,751,922 | ) | | | (1,890,490 | ) |
| | | | | | | | | | | | | | | | | | | | | | |
| | | | | | | | | | | | | | | | | | | | | | |
| | | | | | | | | | | | | | | | | | | | | | |
| | 17,670,239 | | | | 89,657,148 | | | | 15,815,644 | | | | 3,037,084 | | | | 14,984 | | | | 11,495 | |
| | 19,095,086 | | | | 42,752,026 | | | | 6,970,407 | | | | — | | | | 10,446,823 | | | | 17,971,181 | |
| | | | | | | | | | | | | | | | | | | | | | |
| | 2,742,104 | | | | 6,562,788 | | | | 437,571 | | | | — | | | | 10,574 | | | | 12,081 | |
| | 1,422,757 | | | | 5,836,625 | | | | — | | | | — | | | | 1,523,863 | | | | 1,167,329 | |
| | | | | | | | | | | | | | | | | | | | | | |
| | (42,185,073 | ) | | | (34,343,989 | ) | | | (5,259,154 | ) | | | (565,834 | ) | | | (14,548 | ) | | | (271 | ) |
| | (48,687,440 | ) | | | (35,816,115 | ) | | | (100 | ) | | | — | | | | (9,519,272 | ) | | | (10,657,603 | ) |
| | | | | | | | | | | | | | | | | | | | | | |
| | (49,942,327 | ) | | | 74,648,483 | | | | 17,964,368 | | | | 2,471,250 | | | | 2,462,424 | | | | 8,504,212 | |
| | | | | | | | | | | | | | | | | | | | | | |
| | (44,684,949 | ) | | | 64,604,146 | | | | 18,610,509 | | | | 2,912,457 | | | | 5,866,713 | | | | 9,301,004 | |
| | | | | | | | | | | | | | | | | | | | | | |
| $ | 133,124,371 | | | $ | 177,809,320 | | | $ | 26,116,896 | | | $ | 7,506,387 | | | $ | 67,950,369 | | | $ | 62,083,656 | |
| | | | | | | | | | | | | | | | | | | | | | |
$ |
93,837 |
| | $ | 127,535 | | | $ | (111,808 | ) | | $ | (29,732 | ) | | $ | 534,290 | | | $ | 992,441 | |
| | | | | | | | | | | | | | | | | | | | | | |
See accompanying Notes to Financial Statements.
| | |
| |
| | |
| |
| Statements of Changes in Net Assets – continued | | |
| | | | | | | | | | | | |
| | |
| | | LMCG Emerging
Market Fund | | | Harrison Street
Real Estate Fund | |
| | | Period Ended
April 30, 2013(a)
(unaudited) | | | Six Months Ended
April 30, 2013
(unaudited) | | | Year Ended
October 31,
2012 | |
| | | | | | | | | | | | |
NET ASSETS at Beginning of Period | | $ | — | | | $ | 10,546,604 | | | $ | 39,212,065 | |
| | | | | | | | | | | | |
Increase (decrease) in net assets from operations: | | | | | | | | | | | | |
Net investment income | | | 2,070 | | | | 65,993 | | | | 173,143 | |
Net realized gain (loss) on investments and foreign currency transactions | | | (39,284 | ) | | | 770,833 | | | | 1,929,157 | |
Net change in unrealized appreciation (depreciation) on investments and translation of assets and liabilities denominated in foreign currency | | | 49,069 | | | | 982,599 | | | | (2,376,608 | ) |
| | | | | | | | | | | | |
Net increase (decrease) in net assets from operations | | | 11,855 | | | | 1,819,425 | | | | (274,308 | ) |
| | | | | | | | | | | | |
Distributions to shareholders from: | | | | | | | | | | | | |
Net investment income: | | | | | | | | | | | | |
Class N | | | — | | | | (162,128 | ) | | | (46,752 | ) |
Class I | | | — | | | | (2,875 | ) | | | (823 | ) |
| | | | | | | | | | | | |
Total distributions | | | — | | | | (165,003 | ) | | | (47,575 | ) |
| | | | | | | | | | | | |
Capital share transactions: | | | | | | | | | | | | |
Proceeds from sales of shares: | | | | | | | | | | | | |
Class N | | | 676,407 | | | | 4,088,134 | | | | 6,295,128 | |
Class I | | | 3,400,004 | | | | 42,482 | | | | 208,772 | |
Proceeds from reinvestment of distributions: | | | | | | | | | | | | |
Class N | | | — | | | | 153,598 | | | | 44,264 | |
Class I | | | — | | | | 1,905 | | | | 539 | |
Cost of shares redeemed: | | | | | | | | | | | | |
Class N | | | — | | | | (3,706,662 | ) | | | (3,336,601 | ) |
Class I | | | — | | | | (8,201 | ) | | | (31,555,680 | )(b) |
| | | | | | | | | | | | |
Net increase (decrease) from capital share transactions | | | 4,076,411 | | | | 571,256 | | | | (28,343,578 | ) |
| | | | | | | | | | | | |
Total increase (decrease) in net assets | | | 4,088,266 | | | | 2,225,678 | | | | (28,665,461 | ) |
| | | | | | | | | | | | |
NET ASSETS at End of Period | | $ | 4,088,266 | | | $ | 12,772,282 | | | $ | 10,546,604 | |
| | | | | | | | | | | | |
Undistributed (distributions in excess of) net investment income (loss) | | $ | 2,070 | | | $ | 26,484 | | | $ | 125,494 | |
| | | | | | | | | | | | |
| (a) | LMCG Emerging Markets Fund began issuing shares on March 27, 2013. |
| (b) | Harrison Street Real Estate Fund had a redemption-in-kind in the amount of $31,399,368 on December 2, 2011. The redemption was comprised of securities and cash in the amounts of $30,913,574 and $485,794, respectively. |
See accompanying Notes to Financial Statements.
| | | | | | |
|
Montag & Caldwell
Balanced Fund | |
Six Months Ended
April 30, 2013
(unaudited) | | | Year Ended
October 31,
2012 | |
| | | | | | |
| $ | 33,466,255 | | | $ | 24,729,716 | |
| | | | | | |
| | | | | | |
| | 157,004 | | | | 227,101 | |
| | 1,689,654 | | | | 1,435,094 | |
| |
| | 603,765 | | | | 422,708 | |
| | | | | | |
| | 2,450,423 | | | | 2,084,903 | |
| | | | | | |
| | | | | | |
| | | | | | |
| | (209,359 | ) | | | (309,427 | ) |
| | (12,857 | ) | | | (22,048 | ) |
| | | | | | |
| | (222,216 | ) | | | (331,475 | ) |
| | | | | | |
| | | | | | |
| | | | | | |
| | 1,906,115 | | | | 12,344,202 | |
| | 126,073 | | | | 641,711 | |
| | | | | | |
| | 204,025 | | | | 301,482 | |
| | 5,528 | | | | 9,037 | |
| | | | | | |
| | (10,614,194 | ) | | | (6,067,796 | ) |
| | (347,615 | ) | | | (245,525 | ) |
| | | | | | |
| | (8,720,068 | ) | | | 6,983,111 | |
| | | | | | |
| | (6,491,861 | ) | | | 8,736,539 | |
| | | | | | |
| $ | 26,974,394 | | | $ | 33,466,255 | |
| | | | | | |
| $ | (296,161 | ) | | $ | (230,949 | ) |
| | | | | | |
See accompanying Notes to Financial Statements.
| | |
| |
| ASTON/Montag & Caldwell Growth Fund – Class N | | April 30, 2013 |
| |
| Financial Highlights | | |
| | | | | | | | | | | | | | | | | | | | | | | | |
| | | Six Months
Ended
04/30/13
(unaudited) | | | Year
Ended
10/31/12 | | | Year
Ended
10/31/11 | | | Year
Ended
10/31/10 | | | Year
Ended
10/31/09 | | | Year
Ended
10/31/08 | |
Net Asset Value, Beginning of Period | | $ | 25.31 | | | $ | 24.72 | | | $ | 22.92 | | | $ | 20.87 | | | $ | 18.84 | | | $ | 31.51 | |
| | | | | | | | | | | | | | | | | | | | | | | | |
Income from Investment Operations: | | | | | | | | | | | | | | | | | | | | | | | | |
Net investment income | | | 0.14 | | | | 0.15 | (a) | | | 0.14 | (a) | | | 0.12 | (a) | | | 0.08 | (a) | | | 0.07 | (a) |
Net realized and unrealized gain (loss)
on investments | | | 3.23 | | | | 2.45 | | | | 1.83 | | | | 2.01 | (b) | | | 2.61 | | | | (8.66 | ) |
| | | | | | | | | | | | | | | | | | | | | | | | |
Total from investment operations | | | 3.37 | | | | 2.60 | | | | 1.97 | | | | 2.13 | | | | 2.69 | | | | (8.59 | ) |
| | | | | | | | | | | | | | | | | | | | | | | | |
Less Distributions: | | | | | | | | | | | | | | | | | | | | | | | | |
Distributions from and in excess of net
investment income | | | (0.22 | ) | | | (0.13 | ) | | | (0.13 | ) | | | (0.08 | ) | | | (0.06 | ) | | | (0.05 | ) |
Distributions from net realized gain
on investments | | | (1.71 | ) | | | (1.88 | ) | | | (0.04 | ) | | | — | | | | (0.60 | ) | | | (4.03 | ) |
| | | | | | | | | | | | | | | | | | | | | | | | |
Total distributions | | | (1.93 | ) | | | (2.01 | ) | | | (0.17 | ) | | | (0.08 | ) | | | (0.66 | ) | | | (4.08 | ) |
| | | | | | | | | | | | | | | | | | | | | | | | |
Net increase (decrease) in net asset value . | | | 1.44 | | | | 0.59 | | | | 1.80 | | | | 2.05 | | | | 2.03 | | | | (12.67 | ) |
| | | | | | | | | | | | | | | | | | | | | | | | |
Net Asset Value, End of Period | | $ | 26.75 | | | $ | 25.31 | | | $ | 24.72 | | | $ | 22.92 | | | $ | 20.87 | | | $ | 18.84 | |
| | | | | | | | | | | | | | | | | | | | | | | | |
Total Return (c) | | | 14.36 | %(d) | | | 11.40 | % | | | 8.56 | % | | | 10.20 | % | | | 15.08 | % | | | (31.13 | )% |
| | | | | | |
Ratios/Supplemental Data: | | | | | | | | | | | | | | | | | | | | | | | | |
Net Assets, End of Period (in 000’s) | | $ | 2,161,408 | | | $ | 1,908,663 | | | $ | 1,683,183 | | | $ | 1,506,075 | | | $ | 1,277,346 | | | $ | 602,905 | |
Ratios of expenses to average net assets: | | | | | | | | | | | | | | | | | | | | | | | | |
Before expense reimbursement and/or fee waiver by Adviser | | | 1.04 | %(e) | | | 1.05 | % | | | 1.06 | % | | | 1.08 | %(f) | | | 1.11 | % | | | 1.08 | %(f) |
After expense reimbursement and/or fee waiver by Adviser | | | 1.04 | %(e) | | | 1.05 | % | | | 1.06 | % | | | 1.08 | %(f) | | | 1.11 | % | | | 1.08 | %(f) |
Ratios of net investment income to average net assets: | | | | | | | | | | | | | | | | | | | | | | | | |
Before expense reimbursement and/or fee waiver by Adviser | | | 1.10 | %(e) | | | 0.60 | % | | | 0.59 | % | | | 0.56 | % | | | 0.41 | % | | | 0.26 | % |
After expense reimbursement and/or fee waiver by Adviser | | | 1.10 | %(e) | | | 0.60 | % | | | 0.59 | % | | | 0.56 | % | | | 0.41 | % | | | 0.26 | % |
Portfolio Turnover | | | 23.27 | %(d) | | | 46.42 | % | | | 63.48 | % | | | 57.39 | %(g) | | | 35.09 | %(h) | | | 52.32 | % |
| | (a) | The selected per share data was calculated using the weighted average shares outstanding method for the period. |
| | (b) | Includes payments by affiliates of less than $0.005 per share. |
| | (c) | The total return is calculated using the Net Asset Value used for trading at the close of business at period end. |
| | (f) | Ratios of expenses to average net assets include interest expenses of less than 0.005% for each of the years ended October 31, 2010 and October 31, 2008. The interest expenses are from utilizing the line of credit as discussed in Note H to the Financial Statements. |
| | (g) | Portfolio turnover rate excludes securities received from a reorganization. |
| | (h) | Portfolio turnover rate excludes securities received from processing a subscription-in-kind. |
See accompanying Notes to Financial Statements.
| | |
| |
| ASTON/Montag & Caldwell Growth Fund – Class I | | April 30, 2013 |
| |
| Financial Highlights | | |
| | | | | | | | | | | | | | | | | | | | | | | | |
| | | Six Months
Ended
04/30/13
(unaudited) | | | Year
Ended
10/31/12 | | | Year
Ended
10/31/11 | | | Year
Ended
10/31/10 | | | Year
Ended
10/31/09 | | | Year
Ended
10/31/08 | |
Net Asset Value, Beginning of Period | | $ | 25.46 | | | $ | 24.85 | | | $ | 23.05 | | | $ | 20.97 | | | $ | 18.94 | | | $ | 31.61 | |
| | | | | | | | | | | | | | | | | | | | | | | | |
Income from Investment Operations: | | | | | | | | | | | | | | | | | | | | | | | | |
Net investment income | | | 0.18 | | | | 0.21 | (a) | | | 0.21 | (a) | | | 0.18 | (a) | | | 0.12 | (a) | | | 0.13 | (a) |
Net realized and unrealized gain (loss)
on investments | | | 3.24 | | | | 2.47 | | | | 1.82 | | | | 2.02 | (b) | | | 2.62 | | | | (8.70 | ) |
| | | | | | | | | | | | | | | | | | | | | | | | |
Total from investment operations | | | 3.42 | | | | 2.68 | | | | 2.03 | | | | 2.20 | | | | 2.74 | | | | (8.57 | ) |
| | | | | | | | | | | | | | | | | | | | | | | | |
Less Distributions: | | | | | | | | | | | | | | | | | | | | | | | | |
Distributions from and in excess of net
investment income | | | (0.28 | ) | | | (0.19 | ) | | | (0.19 | ) | | | (0.12 | ) | | | (0.11 | ) | | | (0.07 | ) |
Distributions from net realized gain
on investments | | | (1.71 | ) | | | (1.88 | ) | | | (0.04 | ) | | | — | | | | (0.60 | ) | | | (4.03 | ) |
| | | | | | | | | | | | | | | | | | | | | | | | |
Total distributions | | | (1.99 | ) | | | (2.07 | ) | | | (0.23 | ) | | | (0.12 | ) | | | (0.71 | ) | | | (4.10 | ) |
| | | | | | | | | | | | | | | | | | | | | | | | |
Net increase (decrease) in net asset value | | | 1.43 | | | | 0.61 | | | | 1.80 | | | | 2.08 | | | | 2.03 | | | | (12.67 | ) |
| | | | | | | | | | | | | | | | | | | | | | | | |
Net Asset Value, End of Period | | $ | 26.89 | | | $ | 25.46 | | | $ | 24.85 | | | $ | 23.05 | | | $ | 20.97 | | | $ | 18.94 | |
| | | | | | | | | | | | | | | | | | | | | | | | |
Total Return (c) | | | 14.52 | %(d) | | | 11.67 | % | | | 8.82 | % | | | 10.49 | % | | | 15.36 | % | | | (30.96 | )% |
| | | | | | |
Ratios/Supplemental Data: | | | | | | | | | | | | | | | | | | | | | | | | |
Net Assets, End of Period (in 000’s) | | $ | 2,750,684 | | | $ | 2,406,145 | | | $ | 1,749,183 | | | $ | 1,528,981 | | | $ | 1,205,637 | | | $ | 754,671 | |
Ratios of expenses to average net assets: | | | | | | | | | | | | | | | | | | | | | | | | |
Before expense reimbursement and/or fee waiver by Adviser | | | 0.79 | %(e) | | | 0.80 | % | | | 0.81 | % | | | 0.83 | %(f) | | | 0.86 | % | | | 0.83 | %(f) |
After expense reimbursement and/or fee waiver by Adviser | | | 0.79 | %(e) | | | 0.80 | % | | | 0.81 | % | | | 0.83 | %(f) | | | 0.86 | % | | | 0.83 | %(f) |
Ratios of net investment income to average net assets: | | | | | | | | | | | | | | | | | | | | | | | | |
Before expense reimbursement and/or fee waiver by Adviser | | | 1.35 | %(e) | | | 0.85 | % | | | 0.84 | % | | | 0.81 | % | | | 0.66 | % | | | 0.51 | % |
After expense reimbursement and/or fee waiver by Adviser | | | 1.35 | %(e) | | | 0.85 | % | | | 0.84 | % | | | 0.81 | % | | | 0.66 | % | | | 0.51 | % |
Portfolio Turnover | | | 23.27 | %(d) | | | 46.42 | % | | | 63.48 | % | | | 57.39 | %(g) | | | 35.09 | %(h) | | | 52.32 | % |
| | (a) | The selected per share data was calculated using the weighted average shares outstanding method for the period. |
| | (b) | Includes payments by affiliates of less than $0.005 per share. |
| | (c) | The total return is calculated using the Net Asset Value used for trading at the close of business at period end. |
| | (f) | Ratios of expenses to average net assets include interest expenses of less than 0.005% for each of the years ended October 31, 2010 and October 31, 2008. The interest expenses are from utilizing the line of credit as discussed in Note H to the Financial Statements. |
| | (g) | Portfolio turnover rate excludes securities received from a reorganization. |
| | (h) | Portfolio turnover rate excludes securities received from processing a subscription-in-kind. |
See accompanying Notes to Financial Statements.
| | |
| |
| ASTON/Montag & Caldwell Growth Fund – Class R | | April 30, 2013 |
| |
| Financial Highlights | | |
| | | | | | | | | | | | | | | | | | | | | | | | |
| | | Six Months
Ended
04/30/13
(unaudited) | | | Year
Ended
10/31/12 | | | Year
Ended
10/31/11 | | | Year
Ended
10/31/10 | | | Year
Ended
10/31/09 | | | Year
Ended
10/31/08 | |
Net Asset Value, Beginning of Period | | $ | 25.02 | | | $ | 24.45 | | | $ | 22.70 | | | $ | 20.73 | | | $ | 18.69 | | | $ | 31.33 | |
| | | | | | | | | | | | | | | | | | | | | | | | |
Income from Investment Operations: | | | | | | | | | | | | | | | | | | | | | | | | |
Net investment income | | | 0.11 | | | | 0.09 | (a) | | | 0.08 | (a) | | | 0.07 | (a) | | | 0.03 | (a) | | | — | (a)(b) |
Net realized and unrealized gain (loss)
on investments | | | 3.19 | | | | 2.43 | | | | 1.80 | | | | 1.98 | (c) | | | 2.61 | | | | (8.58 | ) |
| | | | | | | | | | | | | | | | | | | | | | | | |
Total from investment operations | | | 3.30 | | | | 2.52 | | | | 1.88 | | | | 2.05 | | | | 2.64 | | | | (8.58 | ) |
| | | | | | | | | | | | | | | | | | | | | | | | |
Less Distributions: | | | | | | | | | | | | | | | | | | | | | | | | |
Distributions from and in excess of net
investment income | | | (0.15 | ) | | | (0.07 | ) | | | (0.09 | ) | | | (0.08 | ) | | | — | | | | (0.03 | ) |
Distributions from net realized gain
on investments | | | (1.71 | ) | | | (1.88 | ) | | | (0.04 | ) | | | — | | | | (0.60 | ) | | | (4.03 | ) |
| | | | | | | | | | | | | | | | | | | | | | | | |
Total distributions | | | (1.86 | ) | | | (1.95 | ) | | | (0.13 | ) | | | (0.08 | ) | | | (0.60 | ) | | | (4.06 | ) |
| | | | | | | | | | | | | | | | | | | | | | | | |
Net increase (decrease) in net asset value . | | | 1.44 | | | | 0.57 | | | | 1.75 | | | | 1.97 | | | | 2.04 | | | | (12.64 | ) |
| | | | | | | | | | | | | | | | | | | | | | | | |
Net Asset Value, End of Period | | $ | 26.46 | | | $ | 25.02 | | | $ | 24.45 | | | $ | 22.70 | | | $ | 20.73 | | | $ | 18.69 | |
| | | | | | | | | | | | | | | | | | | | | | | | |
Total Return (d) | | | 14.22 | %(e) | | | 11.10 | % | | | 8.29 | % | | | 9.90 | % | | | 14.87 | % | | | (31.28 | )% |
| | | | | | |
Ratios/Supplemental Data: | | | | | | | | | | | | | | | | | | | | | | | | |
Net Assets, End of Period (in 000’s) | | $ | 9,941 | | | $ | 8,771 | | | $ | 8,654 | | | $ | 7,292 | | | $ | 3,840 | | | $ | 266 | |
Ratios of expenses to average net assets: | | | | | | | | | | | | | | | | | | | | | | | | |
Before expense reimbursement and/or fee
waiver by Adviser | | | 1.29 | %(f) | | | 1.30 | % | | | 1.31 | % | | | 1.33 | %(g) | | | 1.36 | % | | | 1.33 | %(g) |
After expense reimbursement and/or fee
waiver by Adviser | | | 1.29 | %(f) | | | 1.30 | % | | | 1.31 | % | | | 1.33 | %(g) | | | 1.36 | % | | | 1.33 | %(g) |
Ratios of net investment income to average net assets: | | | | | | | | | | | | | | | | | | | | | | | | |
Before expense reimbursement and/or fee
waiver by Adviser | | | 0.85 | %(f) | | | 0.35 | % | | | 0.34 | % | | | 0.31 | % | | | 0.16 | % | | | 0.01 | % |
After expense reimbursement and/or fee
waiver by Adviser | | | 0.85 | %(f) | | | 0.35 | % | | | 0.34 | % | | | 0.31 | % | | | 0.16 | % | | | 0.01 | % |
Portfolio Turnover | | | 23.27 | %(e) | | | 46.42 | % | | | 63.48 | % | | | 57.39 | %(h) | | | 35.09 | %(i) | | | 52.32 | % |
| | (a) | The selected per share data was calculated using the weighted average shares outstanding method for the period. |
| | (b) | Represents less than $0.005 per share. |
| | (c) | Includes payments by affiliates of less than $0.005 per share. |
| | (d) | The total return is calculated using the Net Asset Value used for trading at the close of business at period end. |
| | (g) | Ratios of expenses to average net assets include interest expenses of less than 0.005% for each of the years ended October 31, 2010 and October 31, 2008. The interest expenses are from utilizing the line of credit as discussed in Note H to the Financial Statements. |
| | (h) | Portfolio turnover rate excludes securities received from a reorganization. |
| | (i) | Portfolio turnover rate excludes securities received from processing a subscription-in-kind. |
See accompanying Notes to Financial Statements.
| | |
| |
| ASTON/TAMRO Diversified Equity Fund – Class N | | April 30, 2013 |
| |
| Financial Highlights | | |
| | | | | | | | | | | | | | | | | | | | | | | | |
| | | Six Months
Ended
04/30/13
(unaudited) | | | Year
Ended
10/31/12 | | | Year
Ended
10/31/11 | | | Year
Ended
10/31/10 | | | Year
Ended
10/31/09 | | | Year
Ended
10/31/08 | |
Net Asset Value, Beginning of Period | | $ | 13.52 | | | $ | 12.34 | | | $ | 11.83 | | | $ | 9.72 | | | $ | 8.34 | | | $ | 14.41 | |
| | | | | | | | | | | | | | | | | | | | | | | | |
Income from Investment Operations: | | | | | | | | | | | | | | | | | | | | | | | | |
Net investment income (loss) | | | 0.02 | | | | — | (a) | | | (0.02 | ) | | | — | (a) | | | — | (a) | | | 0.04 | |
Net realized and unrealized gain (loss)
on investments | | | 1.63 | | | | 1.44 | | | | 0.53 | | | | 2.13 | | | | 1.42 | | | | (4.94 | ) |
| | | | | | | | | | | | | | | | | | | | | | | | |
Total from investment operations | | | 1.65 | | | | 1.44 | | | | 0.51 | | | | 2.13 | | | | 1.42 | | | | (4.90 | ) |
| | | | | | | | | | | | | | | | | | | | | | | | |
Less Distributions: | | | | | | | | | | | | | | | | | | | | | | | | |
Distributions from and in excess of net
investment income | | | (0.03 | ) | | | — | | | | — | | | | (0.02 | ) | | | (0.04 | ) | | | (0.01 | ) |
Distributions from net realized gain
on investments | | | (0.02 | ) | | | (0.26 | ) | | | — | | | | — | | | | — | | | | (1.16 | ) |
| | | | | | | | | | | | | | | | | | | | | | | | |
Total distributions | | | (0.05 | ) | | | (0.26 | ) | | | — | | | | (0.02 | ) | | | (0.04 | ) | | | (1.17 | ) |
| | | | | | | | | | | | | | | | | | | | | | | | |
Net increase (decrease) in net asset value . | | | 1.60 | | | | 1.18 | | | | 0.51 | | | | 2.11 | | | | 1.38 | | | | (6.07 | ) |
| | | | | | | | | | | | | | | | | | | | | | | | |
Net Asset Value, End of Period | | $ | 15.12 | | | $ | 13.52 | | | $ | 12.34 | | | $ | 11.83 | | | $ | 9.72 | | | $ | 8.34 | |
| | | | | | | | | | | | | | | | | | | | | | | | |
Total Return (b) | | | 12.19 | %(c) | | | 11.94 | % | | | 4.31 | % | | | 21.95 | % | | | 17.13 | % | | | (36.75 | )% |
| | | | | | |
Ratios/Supplemental Data: | | | | | | | | | | | | | | | | | | | | | | | | |
Net Assets, End of Period (in 000’s) | | $ | 24,698 | | | $ | 21,980 | | | $ | 24,354 | | | $ | 15,670 | | | $ | 10,486 | | | $ | 8,562 | |
Ratios of expenses to average net assets: | | | | | | | | | | | | | | | | | | | | | | | | |
Before expense reimbursement and/or fee waiver by Adviser | | | 1.62 | %(d) | | | 1.68 | %(e) | | | 1.62 | %(e) | | | 1.63 | % | | | 1.95 | % | | | 1.88 | % |
After expense reimbursement and/or fee waiver by
Adviser | | | 1.20 | %(d) | | | 1.20 | %(e) | | | 1.20 | %(e) | | | 1.20 | % | | | 1.20 | % | | | 1.20 | % |
Ratios of net investment income (loss) to average net assets: | | | | | | | | | | | | | | | | | | | | | | | | |
Before expense reimbursement and/or fee waiver by Adviser | | | (0.16 | )%(d) | | | (0.47 | )% | | | (0.63 | )% | | | (0.45 | )% | | | (0.77 | )% | | | (0.37 | )% |
After expense reimbursement and/or fee waiver by
Adviser | | | 0.26 | %(d) | | | — | %(a) | | | (0.21 | )% | | | (0.02 | )% | | | (0.02 | )% | | | 0.31 | % |
Portfolio Turnover | | | 30.13 | %(c) | | | 52.56 | % | | | 65.96 | % | | | 81.75 | % | | | 85.49 | % | | | 93.82 | % |
| | (a) | Represents less than $(0.005) per share or less than (0.005)%. |
| | (b) | The total return is calculated using the Net Asset Value used for trading at the close of business at period end. |
| | (e) | Ratios of expenses to average net assets include interest expenses of less than 0.005% for each of the years ended October 31, 2012 and October 31, 2011, which are not included in the contractual expense limitation. The interest expenses are from utilizing the line of credit as discussed in Note H to the Financial Statements. |
See accompanying Notes to Financial Statements.
| | |
| |
| ASTON/TAMRO Diversified Equity Fund – Class I | | April 30, 2013 |
| |
| Financial Highlights | | |
| | | | | | | | |
| | | Six Months
Ended
04/30/13
(unaudited) | | | Period
Ended
10/31/12(a) | |
Net Asset Value, Beginning of Period | | $ | 13.55 | | | $ | 13.27 | |
| | | | | | | | |
Income from Investment Operations: | | | | | | | | |
Net investment income (loss) | | | 0.04 | | | | (0.05 | ) |
Net realized and unrealized gain on investments | | | 1.62 | | | | 0.33 | |
| | | | | | | | |
Total from investment operations | | | 1.66 | | | | 0.28 | |
| | | | | | | | |
Less Distributions: | | | | | | | | |
Distributions from and in excess of net investment income | | | (0.06 | ) | | | — | |
Distributions from net realized gain on investments | | | (0.02 | ) | | | — | |
| | | | | | | | |
Total Distributions | | | (0.08 | ) | | | — | |
| | | | | | | | |
Net increase in net asset value | | | 1.58 | | | | 0.28 | |
| | | | | | | | |
Net Asset Value, End of Period | | $ | 15.13 | | | $ | 13.55 | |
| | | | | | | | |
Total Return (b) | | | 12.38 | %(c) | | | 2.04 | %(c) |
| | |
Ratios/Supplemental Data: | | | | | | | | |
Net Assets, End of Period (in 000’s) | | $ | 833 | | | $ | 569 | |
Ratios of expenses to average net assets: | | | | | | | | |
Before expense reimbursement and/or fee waiver by Adviser | | | 1.37 | %(d) | | | 1.45 | %(d) |
After expense reimbursement and/or fee waiver by Adviser | | | 0.95 | %(d) | | | 0.95 | %(d) |
Ratios of net investment income (loss) to average net assets: | | | | | | | | |
Before expense reimbursement and/or fee waiver by Adviser | | | 0.09 | %(d) | | | (1.11 | )%(d) |
After expense reimbursement and/or fee waiver by Adviser | | | 0.51 | %(d) | | | (0.61 | )%(d) |
Portfolio Turnover | | | 30.13 | %(c) | | | 52.56 | % |
| | (a) | TAMRO Diversified Equity Fund began issuing Class I shares on March 1, 2012. |
| | (b) | The total return is calculated using the Net Asset Value used for trading at the close of business at period end. |
See accompanying Notes to Financial Statements.
| | |
| |
| ASTON/Herndon Large Cap Value Fund – Class N | | April 30, 2013 |
| |
| Financial Highlights | | |
| | | | | | | | | | | | | | | | |
| | | Six Months
Ended
04/30/13
(unaudited) | | | Year
Ended
10/31/12 | | | Year
Ended
10/31/11 | | | Period
Ended
10/31/10(a) | |
Net Asset Value, Beginning of Period | | $ | 11.73 | | | $ | 11.31 | | | $ | 10.39 | | | $ | 10.00 | |
| | | | | | | | | | | | | | | | |
Income from Investment Operations: | | | | | | | | | | | | | | | | |
Net investment income | | | 0.12 | | | | 0.18 | (b) | | | 0.12 | (b) | | | 0.03 | |
Net realized and unrealized gain on investments | | | 1.31 | | | | 0.91 | | | | 0.81 | | | | 0.36 | |
| | | | | | | | | | | | | | | | |
Total from investment operations | | | 1.43 | | | | 1.09 | | | | 0.93 | | | | 0.39 | |
| | | | | | | | | | | | | | | | |
Less Distributions: | | | | | | | | | | | | | | | | |
Distributions from and in excess of net investment income | | | (0.22 | ) | | | (0.11 | ) | | | (0.01 | ) | | | — | |
Distributions from net realized gain on investments | | | (0.22 | ) | | | (0.56 | ) | | | — | | | | — | |
| | | | | | | | | | | | | | | | |
Total distributions | | | (0.44 | ) | | | (0.67 | ) | | | (0.01 | ) | | | — | |
| | | | | | | | | | | | | | | | |
Net increase in net asset value | | | 0.99 | | | | 0.42 | | | | 0.92 | | | | 0.39 | |
| | | | | | | | | | | | | | | | |
Net Asset Value, End of Period | | $ | 12.72 | | | $ | 11.73 | | | $ | 11.31 | | | $ | 10.39 | |
| | | | | | | | | | | | | | | | |
Total Return (c) | | | 12.66 | %(d) | | | 10.39 | % | | | 9.09 | % | | | 3.90 | %(d) |
| | | | |
Ratios/Supplemental Data: | | | | | | | | | | | | | | | | |
Net Assets, End of Period (in 000’s) | | $ | 34,182 | | | $ | 20,832 | | | $ | 6,089 | | | $ | 1,472 | |
Ratios of expenses to average net assets: | | | | | | | | | | | | | | | | |
Before expense reimbursement and/or fee waiver, or recoupment by Adviser | | | 1.29 | %(e) | | | 1.41 | % | | | 2.38 | % | | | 13.84 | %(e) |
After expense reimbursement and/or fee waiver, or recoupment by Adviser | | | 1.30 | %(e) | | | 1.30 | % | | | 1.30 | % | | | 1.30 | %(e) |
Ratios of net investment income (loss) to average net assets: | | | | | | | | | | | | | | | | |
Before expense reimbursement and/or fee waiver, or recoupment by Adviser | | | 1.87 | %(e) | | | 1.44 | % | | | (0.05 | )% | | | (11.94 | )%(e) |
After expense reimbursement and/or fee waiver, or recoupment by Adviser | | | 1.86 | %(e) | | | 1.55 | % | | | 1.03 | % | | | 0.60 | %(e) |
Portfolio Turnover | | | 43.27 | %(d) | | | 80.56 | % | | | 189.70 | % | | | 38.64 | %(d) |
| | (a) | Herndon Large Cap Value Fund began issuing Class N shares on March 30, 2010. |
| | (b) | The selected per share data was calculated using the weighted average shares outstanding method for the period. |
| | (c) | The total return is calculated using the Net Asset Value used for trading at the close of business at period end. |
See accompanying Notes to Financial Statements.
| | |
| |
| ASTON/Herndon Large Cap Value Fund – Class I | | April 30, 2013 |
| |
| Financial Highlights | | |
| | | | | | | | | | | | |
| | | Six Months
Ended
04/30/13
(unaudited) | | | Year
Ended
10/31/12 | | | Period
Ended
10/31/11(a) | |
Net Asset Value, Beginning of Period | | $ | 11.75 | | | $ | 11.33 | | | $ | 11.48 | |
| | | | | | | | | | | | |
Income from Investment Operations: | | | | | | | | | | | | |
Net investment income | | | 0.13 | | | | 0.21 | (b) | | | 0.10 | (b) |
Net realized and unrealized gain (loss) on investments | | | 1.31 | | | | 0.91 | | | | (0.25 | ) |
| | | | | | | | | | | | |
Total from investment operations | | | 1.44 | | | | 1.12 | | | | (0.15 | ) |
| | | | | | | | | | | | |
Less Distributions: | | | | | | | | | | | | |
Distributions from and in excess of net investment income | | | (0.24 | ) | | | (0.14 | ) | | | — | |
Distributions from net realized gain on investments | | | (0.22 | ) | | | (0.56 | ) | | | — | |
| | | | | | | | | | | | |
Total distributions | | | (0.46 | ) | | | (0.70 | ) | | | — | |
| | | | | | | | | | | | |
Net increase (decrease) in net asset value | | | 0.98 | | | | 0.42 | | | | (0.15 | ) |
| | | | | | | | | | | | |
Net Asset Value, End of Period | | $ | 12.73 | | | $ | 11.75 | | | $ | 11.33 | |
| | | | | | | | | | | | |
Total Return (c) | | | 12.83 | %(d) | | | 10.69 | % | | | (1.31 | )%(d) |
| | | |
Ratios/Supplemental Data: | | | | | | | | | | | | |
Net Assets, End of Period (in 000’s) | | $ | 57,776 | | | $ | 34,575 | | | $ | 11,881 | |
Ratios of expenses to average net assets: | | | | | | | | | | | | |
Before expense reimbursement and/or fee waiver, or recoupment by Adviser | | | 1.04 | %(e) | | | 1.16 | % | | | 2.13 | %(e) |
After expense reimbursement and/or fee waiver, or recoupment by Adviser | | | 1.05 | %(e) | | | 1.05 | % | | | 1.05 | %(e) |
Ratios of net investment income to average net assets: | | | | | | | | | | | | |
Before expense reimbursement and/or fee waiver, or recoupment by Adviser | | | 2.12 | %(e) | | | 1.69 | % | | | 0.20 | %(e) |
After expense reimbursement and/or fee waiver, or recoupment by Adviser | | | 2.11 | %(e) | | | 1.80 | % | | | 1.28 | %(e) |
Portfolio Turnover | | | 43.27 | %(d) | | | 80.56 | % | | | 189.70 | % |
| | (a) | Herndon Large Cap Value Fund began issuing Class I shares on March 1, 2011. |
| | (b) | The selected per share data was calculated using the weighted average shares outstanding method for the period. |
| | (c) | The total return is calculated using the Net Asset Value used for trading at the close of business at period end. |
See accompanying Notes to Financial Statements.
| | |
| |
| ASTON/Cornerstone Large Cap Value Fund – Class N | | April 30, 2013 |
| |
| Financial Highlights | | |
| | | | | | | | | | | | | | | | | | | | | | | | |
| | | Six Months
Ended
04/30/13
(unaudited) | | | Year
Ended
10/31/12 | | | Year
Ended
10/31/11 | | | Year
Ended
10/31/10 | | | Year
Ended
10/31/09 | | | Year
Ended
10/31/08 | |
Net Asset Value, Beginning of Period | | $ | 11.04 | | | $ | 10.04 | | | $ | 9.20 | | | $ | 8.31 | | | $ | 9.07 | | | $ | 15.57 | |
| | | | | | | | | | | | | | | | | | | | | | | | |
Income from Investment Operations: | | | | | | | | | | | | | | | | | | | | | | | | |
Net investment income | | | 0.03 | (a) | | | 0.10 | (a) | | | 0.12 | (a) | | | 0.13 | | | | 0.15 | | | | 0.15 | |
Net realized and unrealized gain (loss)
on investments | | | 1.50 | | | | 0.94 | | | | 0.83 | | | | 0.89 | | | | 0.41 | | | | (5.08 | ) |
| | | | | | | | | | | | | | | | | | | | | | | | |
Total from investment operations | | | 1.53 | | | | 1.04 | | | | 0.95 | | | | 1.02 | | | | 0.56 | | | | (4.93 | ) |
| | | | | | | | | | | | | | | | | | | | | | | | |
Less Distributions: | | | | | | | | | | | | | | | | | | | | | | | | |
Distributions from and in excess of net
investment income | | | (0.11 | ) | | | (0.04 | ) | | | (0.11 | ) | | | (0.13 | ) | | | (0.15 | ) | | | (0.16 | ) |
Distributions from net realized gain
on investments | | | — | | | | — | | | | — | | | | — | | | | (1.17 | ) | | | (1.41 | ) |
| | | | | | | | | | | | | | | | | | | | | | | | |
Total distributions | | | (0.11 | ) | | | (0.04 | ) | | | (0.11 | ) | | | (0.13 | ) | | | (1.32 | ) | | | (1.57 | ) |
| | | | | | | | | | | | | | | | | | | | | | | | |
Net increase (decrease) in net asset value . | | | 1.42 | | | | 1.00 | | | | 0.84 | | | | 0.89 | | | | (0.76 | ) | | | (6.50 | ) |
| | | | | | | | | | | | | | | | | | | | | | | | |
Net Asset Value, End of Period | | $ | 12.46 | | | $ | 11.04 | | | $ | 10.04 | | | $ | 9.20 | | | $ | 8.31 | | | $ | 9.07 | |
| | | | | | | | | | | | | | | | | | | | | | | | |
Total Return (b) | | | 14.01 | %(c) | | | 10.43 | % | | | 10.44 | % | | | 12.37 | % | | | 8.60 | % | | | (34.85 | )% |
| | | | | | |
Ratios/Supplemental Data: | | | | | | | | | | | | | | | | | | | | | | | | |
Net Assets, End of Period (in 000’s) | | $ | 25,925 | | | $ | 21,105 | | | $ | 24,631 | | | $ | 19,984 | | | $ | 20,173 | | | $ | 19,704 | |
Ratios of expenses to average net assets: | | | | | | | | | | | | | | | | | | | | | | | | |
Before expense reimbursement and/or fee
waiver by Adviser | | | 1.50 | %(d) | | | 1.58 | % | | | 1.61 | % | | | 1.19 | %(e) | | | 1.21 | % | | | 1.18 | %(e) |
After expense reimbursement and/or fee
waiver by Adviser | | | 1.30 | %(d) | | | 1.26 | %(f) | | | 1.14 | %(f) | | | 1.07 | %(e) | | | 1.07 | %(g) | | | 1.02 | %(e) |
Ratios of net investment income to average net assets: | | | | | | | | | | | | | | | | | | | | | | | | |
Before expense reimbursement and/or fee
waiver by Adviser | | | 0.34 | %(d) | | | 0.60 | % | | | 0.80 | % | | | 1.32 | % | | | 1.77 | % | | | 1.22 | % |
After expense reimbursement and/or fee
waiver by Adviser | | | 0.54 | %(d) | | | 0.92 | % | | | 1.27 | % | | | 1.44 | % | | | 1.91 | % | | | 1.38 | % |
Portfolio Turnover | | | 28.34 | %(c) | | | 58.21 | % | | | 59.07 | %(h) | | | 37.44 | % | | | 39.00 | % | | | 67.57 | % |
| | (a) | The selected per share data was calculated using the weighted average shares outstanding method for the period. |
| | (b) | The total return is calculated using the Net Asset Value used for trading at the close of business at period end. |
| | (e) | Ratios of expenses to average net assets include interest expenses of less than 0.005% for each of the years ended October 31, 2010 and October 31, 2008, which are not included in the contractual expense limitation. The interest expenses are from utilizing the line of credit as discussed in Note H to the Financial Statements. |
| | (f) | Effective March 22, 2011, the Adviser changed the voluntary expense limitation from 1.07% to 1.19%. Subsequently, on February 29, 2012, the Adviser removed the voluntary expense limitation and replaced it with a contractual expense limitation of 1.30%. |
| | (g) | The contractual expense limitation of 1.07%, which excludes interest, taxes, investment-related costs (such as brokerage commissions), extraordinary expenses and acquired fund fees and expenses, was removed by the Adviser and replaced with a voluntary expense limitation of 1.07% effective March 1, 2009. Voluntary expense waivers can be terminated by the Adviser at any time. |
| | (h) | Portfolio turnover rate excludes securities delivered from processing a redemption-in-kind. |
See accompanying Notes to Financial Statements.
| | |
| |
| ASTON/Cornerstone Large Cap Value Fund – Class I | | April 30, 2013 |
| |
| Financial Highlights | | |
| | | | | | | | | | | | | | | | | | | | | | | | |
| | | Six Months
Ended
04/30/13
(unaudited) | | | Year
Ended
10/31/12 | | | Year
Ended
10/31/11 | | | Year
Ended
10/31/10 | | | Year
Ended
10/31/09 | | | Year
Ended
10/31/08 | |
Net Asset Value, Beginning of Period | | $ | 11.07 | | | $ | 10.05 | | | $ | 9.19 | | | $ | 8.31 | | | $ | 9.06 | | | $ | 15.57 | |
| | | | | | | | | | | | | | | | | | | | | | | | |
Income from Investment Operations: | | | | | | | | | | | | | | | | | | | | | | | | |
Net investment income | | | 0.05 | (a) | | | 0.11 | (a) | | | 0.16 | (a) | | | 0.15 | | | | 0.17 | | | | 0.20 | |
Net realized and unrealized gain (loss)
on investments | | | 1.49 | | | | 0.96 | | | | 0.84 | | | | 0.88 | | | | 0.42 | | | | (5.10 | ) |
| | | | | | | | | | | | | | | | | | | | | | | | |
Total from investment operations | | | 1.54 | | | | 1.07 | | | | 1.00 | | | | 1.03 | | | | 0.59 | | | | (4.90 | ) |
| | | | | | | | | | | | | | | | | | | | | | | | |
Less Distributions: | | | | | | | | | | | | | | | | | | | | | | | | |
Distributions from and in excess of net
investment income | | | (0.14 | ) | | | (0.05 | ) | | | (0.14 | ) | | | (0.15 | ) | | | (0.17 | ) | | | (0.20 | ) |
Distributions from net realized gain
on investments | | | — | | | | — | | | | — | | | | — | | | | (1.17 | ) | | | (1.41 | ) |
| | | | | | | | | | | | | | | | | | | | | | | | |
Total distributions | | | (0.14 | ) | | | (0.05 | ) | | | (0.14 | ) | | | (0.15 | ) | | | (1.34 | ) | | | (1.61 | ) |
| | | | | | | | | | | | | | | | | | | | | | | | |
Net increase (decrease) in net asset value . | | | 1.40 | | | | 1.02 | | | | 0.86 | | | | 0.88 | | | | (0.75 | ) | | | (6.51 | ) |
| | | | | | | | | | | | | | | | | | | | | | | | |
Net Asset Value, End of Period | | $ | 12.47 | | | $ | 11.07 | | | $ | 10.05 | | | $ | 9.19 | | | $ | 8.31 | | | $ | 9.06 | |
| | | | | | | | | | | | | | | | | | | | | | | | |
Total Return (b) | | | 14.09 | %(c) | | | 10.66 | % | | | 10.95 | % | | | 12.53 | % | | | 9.01 | % | | | (34.73 | )% |
| | | | | | |
Ratios/Supplemental Data: | | | | | | | | | | | | | | | | | | | | | | | | |
Net Assets, End of Period (in 000’s) | | $ | 17,234 | | | $ | 5,397 | | | $ | 126 | | | $ | 204,051 | | | $ | 205,580 | | | $ | 188,688 | |
Ratios of expenses to average net assets: | | | | | | | | | | | | | | | | | | | | | | | | |
Before expense reimbursement and/or fee
waiver by Adviser | | | 1.25 | %(d) | | | 1.33 | % | | | 1.36 | % | | | 0.94 | %(e) | | | 0.96 | % | | | 0.93 | %(e) |
After expense reimbursement and/or fee
waiver by Adviser | | | 1.05 | %(d) | | | 1.01 | %(f) | | | 0.89 | %(f) | | | 0.82 | %(e) | | | 0.82 | %(g) | | | 0.77 | %(e) |
Ratios of net investment income to average net assets: | | | | | | | | | | | | | | | | | | | | | | | | |
Before expense reimbursement and/or fee
waiver by Adviser | | | 0.59 | %(d) | | | 0.85 | % | | | 1.05 | % | | | 1.57 | % | | | 2.02 | % | | | 1.47 | % |
After expense reimbursement and/or fee
waiver by Adviser | | | 0.79 | %(d) | | | 1.17 | % | | | 1.52 | % | | | 1.69 | % | | | 2.16 | % | | | 1.63 | % |
Portfolio Turnover | | | 28.34 | %(c) | | | 58.21 | % | | | 59.07 | %(h) | | | 37.44 | % | | | 39.00 | % | | | 67.57 | % |
| | (a) | The selected per share data was calculated using the weighted average shares outstanding method for the period. |
| | (b) | The total return is calculated using the Net Asset Value used for trading at the close of business at period end. |
| | (e) | Ratios of expense to average net assets included interest expenses of less than 0.005% for each of the years ended October 31, 2010 and October 31, 2008, which are not included in the contractual expense limitation. The interest expenses are from utilizing the line of credit as discussed in Note H to the Financial Statements. |
| | (f) | Effective March 22, 2011, the Adviser changed the voluntary expense limitation from 0.82% to 0.94%. Subsequently, on February 29, 2012, the Adviser removed the voluntary expense limitation and replaced it with a contractual expense limitation of 1.05%. |
| | (g) | The contractual expense limitation of 0.82%, which excludes interest, taxes, investment-related costs (such as brokerage commissions), extraordinary expenses and acquired fund fees and expenses, was removed by the Adviser and replaced with a voluntary expense limitation of 0.82% effective March 1, 2009. Voluntary expense waivers can be terminated by the Adviser at any time. |
| | (h) | Portfolio turnover rate excludes securities delivered from processing a redemption-in-kind. |
See accompanying Notes to Financial Statements.
| | |
| |
| ASTON/River Road Dividend All Cap Value Fund – Class N | | April 30, 2013 |
| |
| Financial Highlights | | |
| | | | | | | | | | | | | | | | | | | | | | | | |
| | | Six Months
Ended
04/30/13
(unaudited) | | | Year
Ended
10/31/12 | | | Year
Ended
10/31/11 | | | Year
Ended
10/31/10 | | | Year
Ended
10/31/09 | | | Year
Ended
10/31/08 | |
Net Asset Value, Beginning of Period | | $ | 11.67 | | | $ | 10.68 | | | $ | 10.23 | | | $ | 8.58 | | | $ | 8.43 | | | $ | 12.58 | |
| | | | | | | | | | | | | | | | | | | | | | | | |
Income from Investment Operations: | | | | | | | | | | | | | | | | | | | | | | | | |
Net investment income | | | 0.16 | (a) | | | 0.31 | (a) | | | 0.29 | (a) | | | 0.26 | (a) | | | 0.26 | (a) | | | 0.38 | |
Net realized and unrealized gain (loss)
on investments | | | 1.69 | | | | 1.05 | | | | 0.42 | | | | 1.62 | | | | 0.08 | | | | (3.54 | ) |
| | | | | | | | | | | | | | | | | | | | | | | | |
Total from investment operations | | | 1.85 | | | | 1.36 | | | | 0.71 | | | | 1.88 | | | | 0.34 | | | | (3.16 | ) |
| | | | | | | | | | | | | | | | | | | | | | | | |
Less Distributions: | | | | | | | | | | | | | | | | | | | | | | | | |
Distributions from and in excess of net
investment income | | | (0.13 | ) | | | (0.30 | ) | | | (0.26 | ) | | | (0.23 | ) | | | (0.19 | ) | | | (0.32 | ) |
Return of capital | | | — | | | | — | | | | — | | | | — | | | | — | | | | (0.01 | ) |
Distributions from net realized gain
on investments | | | (0.44 | ) | | | (0.07 | ) | | | — | | | | — | | | | — | | | | (0.66 | ) |
| | | | | | | | | | | | | | | | | | | | | | | | |
Total distributions | | | (0.57 | ) | | | (0.37 | ) | | | (0.26 | ) | | | (0.23 | ) | | | (0.19 | ) | | | (0.99 | ) |
| | | | | | | | | | | | | | | | | | | | | | | | |
Net increase (decrease) in net asset value | | | 1.28 | | | | 0.99 | | | | 0.45 | | | | 1.65 | | | | 0.15 | | | | (4.15 | ) |
| | | | | | | | | | | | | | | | | | | | | | | | |
Net Asset Value, End of Period | | $ | 12.95 | | | $ | 11.67 | | | $ | 10.68 | | | $ | 10.23 | | | $ | 8.58 | | | $ | 8.43 | |
| | | | | | | | | | | | | | | | | | | | | | | | |
Total Return (b) | | | 16.80 | %(c) | | | 12.96 | % | | | 6.94 | % | | | 22.20 | % | | | 4.33 | % | | | (26.82 | )% |
| | | | | | |
Ratios/Supplemental Data: | | | | | | | | | | | | | | | | | | | | | | | | |
Net Assets, End of Period (in 000’s) | | $ | 399,982 | | | $ | 338,166 | | | $ | 301,290 | | | $ | 135,544 | | | $ | 81,842 | | | $ | 51,504 | |
Ratios of expenses to average net assets: | | | | | | | | | | | | | | | | | | | | | | | | |
Before expense reimbursement and/or fee
waiver by Adviser | | | 1.09 | %(d) | | | 1.12 | % | | | 1.12 | % | | | 1.14 | % | | | 1.21 | % | | | 1.35 | %(e) |
After expense reimbursement and/or fee
waiver by Adviser | | | 1.09 | %(d) | | | 1.12 | % | | | 1.12 | % | | | 1.14 | % | | | 1.21 | % | | | 1.30 | %(e) |
Ratios of net investment income to average net assets: | | | | | | | | | | | | | | | | | | | | | | | | |
Before expense reimbursement and/or fee
waiver by Adviser | | | 2.64 | %(d) | | | 2.74 | % | | | 2.70 | % | | | 2.69 | % | | | 3.36 | % | | | 3.81 | % |
After expense reimbursement and/or fee
waiver by Adviser | | | 2.64 | %(d) | | | 2.74 | % | | | 2.70 | % | | | 2.69 | % | | | 3.36 | % | | | 3.86 | % |
Portfolio Turnover | | | 17.55 | %(c) | | | 28.17 | % | | | 24.65 | % | | | 29.92 | % | | | 47.34 | % | | | 48.95 | % |
| | (a) | The selected per share data was calculated using the weighted average shares outstanding method for the period. |
| | (b) | The total return is calculated using the Net Asset Value used for trading at the close of business at period end. |
| | (e) | Ratios of expenses to average net assets include interest expense of less than 0.005% for the year ended October 31, 2008, which is not included in the contractual expense limitation. The interest expense is from utilizing the line of credit as discussed in Note H to the Financial Statements. |
See accompanying Notes to Financial Statements.
| | |
| |
| ASTON/River Road Dividend All Cap Value Fund – Class I | | April 30, 2013 |
| |
| Financial Highlights | | |
| | | | | | | | | | | | | | | | | | | | | | | | |
| | | Six Months
Ended
04/30/13
(unaudited) | | | Year
Ended
10/31/12 | | | Year
Ended
10/31/11 | | | Year
Ended
10/31/10 | | | Year
Ended
10/31/09 | | | Year
Ended
10/31/08 | |
Net Asset Value, Beginning of Period | | $ | 11.66 | | | $ | 10.67 | | | $ | 10.22 | | | $ | 8.57 | | | $ | 8.42 | | | $ | 12.57 | |
| | | | | | | | | | | | | | | | | | | | | | | | |
Income from Investment Operations: | | | | | | | | | | | | | | | | | | | | | | | | |
Net investment income | | | 0.17 | (a) | | | 0.34 | (a) | | | 0.32 | (a) | | | 0.28 | (a) | | | 0.29 | (a) | | | 0.41 | |
Net realized and unrealized gain (loss)
on investments | | | 1.71 | | | | 1.05 | | | | 0.42 | | | | 1.63 | | | | 0.07 | | | | (3.55 | ) |
| | | | | | | | | | | | | | | | | | | | | | | | |
Total from investment operations | | | 1.88 | | | | 1.39 | | | | 0.74 | | | | 1.91 | | | | 0.36 | | | | (3.14 | ) |
| | | | | | | | | | | | | | | | | | | | | | | | |
Less Distributions: | | | | | | | | | | | | | | | | | | | | | | | | |
Distributions from and in excess of net
investment income | | | (0.15 | ) | | | (0.33 | ) | | | (0.29 | ) | | | (0.26 | ) | | | (0.21 | ) | | | (0.34 | ) |
Return of capital | | | — | | | | — | | | | — | | | | — | | | | — | | | | (0.01 | ) |
Distributions from net realized gain
on investments | | | (0.44 | ) | | | (0.07 | ) | | | — | | | | — | | | | — | | | | (0.66 | ) |
| | | | | | | | | | | | | | | | | | | | | | | | |
Total distributions | | | (0.59 | ) | | | (0.40 | ) | | | (0.29 | ) | | | (0.26 | ) | | | (0.21 | ) | | | (1.01 | ) |
| | | | | | | | | | | | | | | | | | | | | | | | |
Net increase (decrease) in net asset value . | | | 1.29 | | | | 0.99 | | | | 0.45 | | | | 1.65 | | | | 0.15 | | | | (4.15 | ) |
| | | | | | | | | | | | | | | | | | | | | | | | |
Net Asset Value, End of Period | | $ | 12.95 | | | $ | 11.66 | | | $ | 10.67 | | | $ | 10.22 | | | $ | 8.57 | | | $ | 8.42 | |
| | | | | | | | | | | | | | | | | | | | | | | | |
Total Return (b) | | | 17.02 | %(c) | | | 13.25 | % | | | 7.21 | % | | | 22.53 | % | | | 4.59 | % | | | (26.66 | )% |
| | | | | | |
Ratios/Supplemental Data: | | | | | | | | | | | | | | | | | | | | | | | | |
Net Assets, End of Period (in 000’s) | | $ | 694,513 | | | $ | 586,043 | | | $ | 318,863 | | | $ | 137,629 | | | $ | 77,185 | | | $ | 144 | |
Ratios of expenses to average net assets: | | | | | | | | | | | | | | | | | | | | | | | | |
Before expense reimbursement and/or fee
waiver by Adviser | | | 0.84 | %(d) | | | 0.87 | % | | | 0.87 | % | | | 0.89 | % | | | 0.96 | % | | | 1.10 | %(e) |
After expense reimbursement and/or fee
waiver by Adviser | | | 0.84 | %(d) | | | 0.87 | % | | | 0.87 | % | | | 0.89 | % | | | 0.96 | % | | | 1.05 | %(e) |
Ratios of net investment income to average net assets: | | | | | | | | | | | | | | | | | | | | | | | | |
Before expense reimbursement and/or fee
waiver by Adviser | | | 2.89 | %(d) | | | 2.99 | % | | | 2.95 | % | | | 2.94 | % | | | 3.61 | % | | | 4.06 | % |
After expense reimbursement and/or fee
waiver by Adviser | | | 2.89 | %(d) | | | 2.99 | % | | | 2.95 | % | | | 2.94 | % | | | 3.61 | % | | | 4.11 | % |
Portfolio Turnover | | | 17.55 | %(c) | | | 28.17 | % | | | 24.65 | % | | | 29.92 | % | | | 47.34 | % | | | 48.95 | % |
| | (a) | The selected per share data was calculated using the weighted average shares outstanding method for the period. |
| | (b) | The total return is calculated using the Net Asset Value used for trading at the close of business at period end. |
| | (e) | Ratios of expenses to average net assets include interest expense of less than 0.005% for the year ended October 31, 2008, which is not included in the contractual expense limitation. The interest expense is from utilizing the line of credit as discussed in Note H to the Financial Statements. |
See accompanying Notes to Financial Statements.
| | |
| |
| ASTON/River Road Dividend All Cap Value Fund II – Class N | | April 30, 2013 |
| |
| Financial Highlights | | |
| | | | | | | | |
| | | Six Months
Ended
04/30/13
(unaudited) | | | Period
Ended
10/31/12(a) | |
Net Asset Value, Beginning of Period | | $ | 10.44 | | | $ | 10.00 | |
| | | | | | | | |
Income from Investment Operations: | | | | | | | | |
Net investment income | | | 0.11 | | | | 0.09 | (b) |
Net realized and unrealized gain on investments | | | 1.54 | | | | 0.41 | |
| | | | | | | | |
Total from investment operations | | | 1.65 | | | | 0.50 | |
| | | | | | | | |
Less Distributions: | | | | | | | | |
Distributions from and in excess of net investment income | | | (0.13 | ) | | | (0.06 | ) |
Distributions from net realized gain on investments | | | — | (c) | | | — | |
| | | | | | | | |
Total distributions | | | (0.13 | ) | | | (0.06 | ) |
| | | | | | | | |
Net increase in net asset value | | | 1.52 | | | | 0.44 | |
| | | | | | | | |
Net Asset Value, End of Period | | $ | 11.96 | | | $ | 10.44 | |
| | | | | | | | |
Total Return (d) | | | 15.92 | %(e) | | | 5.09 | %(e) |
| | |
Ratios/Supplemental Data: | | | | | | | | |
Net Assets, End of Period (in 000’s) | | $ | 2,391 | | | $ | 1,049 | |
Ratios of expenses to average net assets: | | | | | | | | |
Before expense reimbursement and/or fee waiver by Adviser | | | 1.71 | %(f) | | | 4.99 | %(f) |
After expense reimbursement and/or fee waiver by Adviser | | | 1.30 | %(f) | | | 1.30 | %(f) |
Ratios of net investment income (loss) to average net assets: | | | | | | | | |
Before expense reimbursement and/or fee waiver by Adviser | | | 1.57 | %(f) | | | (1.24 | )%(f) |
After expense reimbursement and/or fee waiver by Adviser | | | 1.98 | %(f) | | | 2.45 | %(f) |
Portfolio Turnover | | | 11.20 | %(e) | | | 5.58 | %(e)(g) |
| | (a) | River Road Dividend All Cap Value Fund II began issuing Class N shares on June 26, 2012. |
| | (b) | The selected per share data was calculated using the weighted average shares outstanding method for the period. |
| | (c) | Represents less than $(0.005) per share. |
| | (d) | The total return is calculated using the Net Asset Value used for trading at the close of business at period end. |
| | (g) | Portfolio turnover excludes securities received from processing a subscription-in-kind. |
See accompanying Notes to Financial Statements.
| | |
| |
| ASTON/River Road Dividend All Cap Value Fund II – Class I | | April 30, 2013 |
| |
| Financial Highlights | | |
| | | | | | | | |
| | | Six Months
Ended
04/30/13
(unaudited) | | | Period
Ended
10/31/12(a) | |
Net Asset Value, Beginning of Period | | $ | 10.45 | | | $ | 10.00 | |
| | | | | | | | |
Income from Investment Operations: | | | | | | | | |
Net investment income | | | 0.12 | | | | 0.10 | (b) |
Net realized and unrealized gain on investments | | | 1.53 | | | | 0.42 | |
| | | | | | | | |
Total from investment operations | | | 1.65 | | | | 0.52 | |
| | | | | | | | |
Less Distributions: | | | | | | | | |
Distributions from and in excess of net investment income | | | (0.14 | ) | | | (0.07 | ) |
Distributions from net realized gain on investments | | | — | (c) | | | — | |
| | | | | | | | |
Total distributions | | | (0.14 | ) | | | (0.07 | ) |
| | | | | | | | |
Net increase in net asset value | | | 1.51 | | | | 0.45 | |
| | | | | | | | |
Net Asset Value, End of Period | | $ | 11.96 | | | $ | 10.45 | |
| | | | | | | | |
Total Return (d) | | | 16.06 | %(e) | | | 5.17 | %(e) |
| | |
Ratios/Supplemental Data: | | | | | | | | |
Net Assets, End of Period (in 000’s) | | $ | 52,586 | | | $ | 9,370 | |
Ratios of expenses to average net assets: | | | | | | | | |
Before expense reimbursement and/or fee waiver by Adviser | | | 1.46 | %(f) | | | 4.74 | %(f) |
After expense reimbursement and/or fee waiver by Adviser | | | 1.05 | %(f) | | | 1.05 | %(f) |
Ratios of net investment income (loss) to average net assets: | | | | | | | | |
Before expense reimbursement and/or fee waiver by Adviser | | | 1.82 | %(f) | | | (0.99 | )%(f) |
After expense reimbursement and/or fee waiver by Adviser | | | 2.23 | %(f) | | | 2.70 | %(f) |
Portfolio Turnover | | | 11.20 | %(e) | | | 5.58 | %(e)(g) |
| | (a) | River Road Dividend All Cap Value Fund II began issuing Class I shares on June 26, 2012. |
| | (b) | The selected per share data was calculated using the weighted average shares outstanding method for the period. |
| | (c) | Represents less than $(0.005) per share. |
| | (d) | The total return is calculated using the Net Asset Value used for trading at the close of business at period end. |
| | (g) | Portfolio turnover excludes securities received from processing a subscription-in-kind. |
See accompanying Notes to Financial Statements.
| | |
| |
| ASTON/Fairpointe Mid Cap Fund – Class N | | April 30, 2013 |
| |
| Financial Highlights | | |
| | | | | | | | | | | | | | | | | | | | | | | | |
| | | Six Months
Ended
04/30/13
(unaudited) | | | Year
Ended
10/31/12 | | | Year
Ended
10/31/11 | | | Year
Ended
10/31/10 | | | Year
Ended
10/31/09 | | | Year
Ended
10/31/08 | |
Net Asset Value, Beginning of Period | | $ | 32.79 | | | $ | 29.76 | | | $ | 29.04 | | | $ | 22.73 | | | $ | 17.25 | | | $ | 32.32 | |
| | | | | | | | | | | | | | | | | | | | | | | | |
Income from Investment Operations: | | | | | | | | | | | | | | | | | | | | | | | | |
Net investment income | | | 0.17 | | | | 0.16 | | | | 0.06 | (a) | | | 0.01 | | | | 0.09 | | | | 0.05 | |
Net realized and unrealized gain (loss)
on investments | | | 6.46 | | | | 3.13 | | | | 0.82 | | | | 6.35 | | | | 5.82 | | | | (12.93 | ) |
| | | | | | | | | | | | | | | | | | | | | | | | |
Total from investment operations | | | 6.63 | | | | 3.29 | | | | 0.88 | | | | 6.36 | | | | 5.91 | | | | (12.88 | ) |
| | | | | | | | | | | | | | | | | | | | | | | | |
Less Distributions: | | | | | | | | | | | | | | | | | | | | | | | | |
Distributions from and in excess of net
investment income | | | (0.30 | ) | | | (0.05 | ) | | | (0.08 | ) | | | (0.05 | ) | | | (0.14 | ) | | | — | |
Distributions from net realized gain
on investments | | | (0.74 | ) | | | (0.21 | ) | | | (0.08 | ) | | | — | | | | (0.29 | ) | | | (2.19 | ) |
| | | | | | | | | | | | | | | | | | | | | | | | |
Total distributions | | | (1.04 | ) | | | (0.26 | ) | | | (0.16 | ) | | | (0.05 | ) | | | (0.43 | ) | | | (2.19 | ) |
| | | | | | | | | | | | | | | | | | | | | | | | |
Net increase (decrease) in net asset value . | | | 5.59 | | | | 3.03 | | | | 0.72 | | | | 6.31 | | | | 5.48 | | | | (15.07 | ) |
| | | | | | | | | | | | | | | | | | | | | | | | |
Net Asset Value, End of Period | | $ | 38.38 | | | $ | 32.79 | | | $ | 29.76 | | | $ | 29.04 | | | $ | 22.73 | | | $ | 17.25 | |
| | | | | | | | | | | | | | | | | | | | | | | | |
Total Return (b) | | | 20.79 | %(c) | | | 11.15 | % | | | 2.98 | % | | | 28.01 | % | | | 35.60 | % | | | (42.50 | )% |
| | | | | | |
Ratios/Supplemental Data: | | | | | | | | | | | | | | | | | | | | | | | | |
Net Assets, End of Period (in 000’s) | | $ | 1,869,671 | | | $ | 1,561,510 | | | $ | 1,502,266 | | | $ | 1,469,354 | | | $ | 842,233 | | | $ | 508,886 | |
Ratios of expenses to average net assets: | | | | | | | | | | | | | | | | | | | | | | | | |
Before expense reimbursement and/or fee waiver by Adviser | | | 1.10 | %(d) | | | 1.11 | %(e) | | | 1.14 | %(e) | | | 1.14 | %(e) | | | 1.20 | %(e) | | | 1.16 | %(e) |
After expense reimbursement and/or fee waiver by Adviser | | | 1.10 | %(d) | | | 1.11 | %(e) | | | 1.14 | %(e) | | | 1.14 | %(e) | | | 1.20 | %(e) | | | 1.16 | %(e) |
Ratios of net investment income
to average net assets: | | | | | | | | | | | | | | | | | | | | | | | | |
Before expense reimbursement and/or fee waiver by Adviser | | | 0.98 | %(d) | | | 0.50 | % | | | 0.21 | % | | | — | %(f) | | | 0.46 | % | | | 0.18 | % |
After expense reimbursement and/or fee waiver by Adviser | | | 0.98 | %(d) | | | 0.50 | % | | | 0.21 | % | | | — | %(f) | | | 0.46 | % | | | 0.18 | % |
Portfolio Turnover | | | 15.55 | %(c) | | | 28.06 | %(g) | | | 11.20 | % | | | 13.82 | % | | | 17.72 | % | | | 22.58 | % |
| | (a) | The selected per share data was calculated using the weighted average shares outstanding method for the period. |
| | (b) | The total return is calculated using the Net Asset Value used for trading at the close of business at period end. |
| | (e) | Ratios of expenses to average net assets include interest expenses of less than 0.005% for each of the years ended October 31, 2012, October 31, 2011, October 31, 2010, October 31, 2009 and October 31, 2008, which are not included in the contractual expense limitation. The interest expenses are from utilizing the line of credit as discussed in Note H to the Financial Statements. |
| | (f) | Represents less than 0.005%. |
| | (g) | Portfolio turnover rate excludes securities delivered from processing a redemption-in-kind. |
See accompanying Notes to Financial Statements.
| | |
| |
| ASTON/Fairpointe Mid Cap Fund – Class I | | April 30, 2013 |
| |
| Financial Highlights | | |
| | | | | | | | | | | | | | | | | | | | | | | | |
| | | Six Months
Ended
04/30/13
(unaudited) | | | Year
Ended
10/31/12 | | | Year
Ended
10/31/11 | | | Year
Ended
10/31/10 | | | Year
Ended
10/31/09 | | | Year
Ended
10/31/08 | |
Net Asset Value, Beginning of Period | | $ | 33.28 | | | $ | 30.20 | | | $ | 29.41 | | | $ | 23.00 | | | $ | 17.47 | | | $ | 32.64 | |
| | | | | | | | | | | | | | | | | | | | | | | | |
Income from Investment Operations: | | | | | | | | | | | | | | | | | | | | | | | | |
Net investment income | | | 0.23 | | | | 0.24 | | | | 0.14 | (a) | | | 0.07 | | | | 0.13 | | | | 0.11 | |
Net realized and unrealized gain (loss)
on investments | | | 6.55 | | | | 3.18 | | | | 0.82 | | | | 6.43 | | | | 5.89 | | | | (13.09 | ) |
| | | | | | | | | | | | | | | | | | | | | | | | |
Total from investment operations | | | 6.78 | | | | 3.42 | | | | 0.96 | | | | 6.50 | | | | 6.02 | | | | (12.98 | ) |
| | | | | | | | | | | | | | | | | | | | | | | | |
Less Distributions: | | | | | | | | | | | | | | | | | | | | | | | | |
Distributions from and in excess of net
investment income | | | (0.39 | ) | | | (0.13 | ) | | | (0.09 | ) | | | (0.09 | ) | | | (0.20 | ) | | | — | |
Distributions from net realized gain
on investment | | | (0.74 | ) | | | (0.21 | ) | | | (0.08 | ) | | | — | | | | (0.29 | ) | | | (2.19 | ) |
| | | | | | | | | | | | | | | | | | | | | | | | |
Total distributions | | | (1.13 | ) | | | (0.34 | ) | | | (0.17 | ) | | | (0.09 | ) | | | (0.49 | ) | | | (2.19 | ) |
| | | | | | | | | | | | | | | | | | | | | | | | |
Net increase (decrease) in net asset value | | | 5.65 | | | | 3.08 | | | | 0.79 | | | | 6.41 | | | | 5.53 | | | | (15.17 | ) |
| | | | | | | | | | | | | | | | | | | | | | | | |
Net Asset Value, End of Period | | $ | 38.93 | | | $ | 33.28 | | | $ | 30.20 | | | $ | 29.41 | | | $ | 23.00 | | | $ | 17.47 | |
| | | | | | | | | | | | | | | | | | | | | | | | |
Total Return (b) | | | 20.96 | %(c) | | | 11.46 | % | | | 3.22 | % | | | 28.31 | % | | | 35.97 | % | | | (42.39 | )% |
| | | | | | |
Ratios/Supplemental Data: | | | | | | | | | | | | | | | | | | | | | | | | |
Net Assets, End of Period (in 000’s) | | $ | 1,853,062 | | | $ | 1,464,222 | | | $ | 1,339,223 | | | $ | 499,651 | | | $ | 150,953 | | | $ | 93,176 | |
Ratios of expenses to average net assets: | | | | | | | | | | | | | | | | | | | | | | | | |
Before expense reimbursement and/or fee waiver by Adviser | | | 0.85 | %(d) | | | 0.86 | %(e) | | | 0.89 | %(e) | | | 0.89 | %(e) | | | 0.95 | %(e) | | | 0.91 | %(e) |
After expense reimbursement and/or fee waiver by Adviser | | | 0.85 | %(d) | | | 0.86 | %(e) | | | 0.89 | %(e) | | | 0.89 | %(e) | | | 0.95 | %(e) | | | 0.91 | %(e) |
Ratios of net investment income to average
net assets: | | | | | | | | | | | | | | | | | | | | | | | | |
Before expense reimbursement and/or fee waiver by Adviser | | | 1.23 | %(d) | | | 0.75 | % | | | 0.46 | % | | | 0.25 | % | | | 0.71 | % | | | 0.43 | % |
After expense reimbursement and/or fee waiver by Adviser | | | 1.23 | %(d) | | | 0.75 | % | | | 0.46 | % | | | 0.25 | % | | | 0.71 | % | | | 0.43 | % |
Portfolio Turnover | | | 15.55 | %(c) | | | 28.06 | %(f) | | | 11.20 | % | | | 13.82 | % | | | 17.72 | % | | | 22.58 | % |
| | (a) | The selected per share data was calculated using the weighted average shares outstanding method for the period. |
| | (b) | The total return is calculated using the Net Asset Value used for trading at the close of business at period end. |
| | (e) | Ratios of expenses to average net assets include interest expenses of less than 0.005% for each of the years ended October 31, 2012, October 31, 2011, October 31, 2010, October 31, 2009 and October 31, 2008, which are not included in the contractual expense limitation. The interest expenses are from utilizing the line of credit as discussed in Note H to the Financial Statements. |
| | (f) | Portfolio turnover rate excludes securities delivered from processing a redemption-in-kind. |
See accompanying Notes to Financial Statements.
| | |
| |
| ASTON/Montag & Caldwell Mid Cap Growth Fund – Class N | | April 30, 2013 |
| |
| Financial Highlights | | |
| | | | | | | | | | | | | | | | | | | | | | | | |
| | | Six Months
Ended
04/30/13
(unaudited) | | | Year
Ended
10/31/12 | | | Year
Ended
10/31/11 | | | Year
Ended
10/31/10 | | | Year
Ended
10/31/09 | | | Period
Ended
10/31/08(a) | |
Net Asset Value, Beginning of Period | | $ | 10.36 | | | $ | 9.71 | | | $ | 8.51 | | | $ | 6.83 | | | $ | 5.85 | | | $ | 10.00 | |
| | | | | | | | | | | | | | | | | | | | | | | | |
Income from Investment Operations: | | | | | | | | | | | | | | | | | | | | | | | | |
Net investment loss | | | (0.03 | )(b) | | | (0.07 | )(b) | | | (0.07 | ) | | | (0.04 | ) | | | (0.04 | ) | | | (0.05 | ) |
Net realized and unrealized gain (loss)
on investments | | | 1.09 | | | | 0.72 | | | | 1.27 | | | | 1.74 | | | | 1.02 | | | | (4.10 | ) |
| | | | | | | | | | | | | | | | | | | | | | | | |
Total from investment operations | | | 1.06 | | | | 0.65 | | | | 1.20 | | | | 1.70 | | | | 0.98 | | | | (4.15 | ) |
| | | | | | | | | | | | | | | | | | | | | | | | |
Less Distributions: | | | | | | | | | | | | | | | | | | | | | | | | |
Distributions from and in excess of net
investment income | | | — | | | | — | | | | — | | | | (0.02 | ) | | | — | | | | — | |
Distributions from net realized gain
on investments | | | (0.10 | ) | | | — | | | | — | | | | — | | | | — | | | | — | |
| | | | | | | | | | | | | | | | | | | | | | | | |
Total distributions | | | (0.10 | ) | | | — | | | | — | | | | (0.02 | ) | | | — | | | | — | |
| | | | | | | | | | | | | | | | | | | | | | | | |
Net increase (decrease) in net asset value | | | 0.96 | | | | 0.65 | | | | 1.20 | | | | 1.68 | | | | 0.98 | | | | (4.15 | ) |
| | | | | | | | | | | | | | | | | | | | | | | | |
Net Asset Value, End of Period | | $ | 11.32 | | | $ | 10.36 | | | $ | 9.71 | | | $ | 8.51 | | | $ | 6.83 | | | $ | 5.85 | |
| | | | | | | | | | | | | | | | | | | | | | | | |
Total Return (c) | | | 10.37 | %(d) | | | 6.70 | % | | | 14.10 | % | | | 24.85 | % | | | 16.75 | % | | | (41.50 | )%(d) |
| | | | | | |
Ratios/Supplemental Data: | | | | | | | | | | | | | | | | | | | | | | | | |
Net Assets, End of Period (in 000’s) | | $ | 12,852 | | | $ | 7,369 | | | $ | 4,507 | | | $ | 3,399 | | | $ | 2,959 | | | $ | 1,815 | |
Ratios of expenses to average net assets: | | | | | | | | | | | | | | | | | | | | | | | | |
Before expense reimbursement and/or fee
waiver by Adviser | | | 1.89 | %(e) | | | 2.50 | % | | | 3.07 | % | | | 3.55 | % | | | 5.02 | % | | | 5.80 | %(e) |
After expense reimbursement and/or fee
waiver by Adviser | | | 1.25 | %(e) | | | 1.25 | %(f) | | | 1.39 | %(f) | | | 1.40 | % | | | 1.40 | % | | | 1.40 | %(e) |
Ratios of net investment loss to average net assets: | | | | | | | | | | | | | | | | | | | | | | | | |
Before expense reimbursement and/or fee
waiver by Adviser | | | (1.19 | )%(e) | | | (1.88 | )% | | | (2.39 | )% | | | (2.75 | )% | | | (4.13 | )% | | | (5.07 | )%(e) |
After expense reimbursement and/or fee
waiver by Adviser | | | (0.55 | )%(e) | | | (0.63 | )% | | | (0.71 | )% | | | (0.60 | )% | | | (0.51 | )% | | | (0.67 | )%(e) |
Portfolio Turnover | | | 20.43 | %(d) | | | 36.60 | % | | | 29.31 | % | | | 31.49 | % | | | 54.37 | % | | | 63.66 | %(d) |
| | (a) | Montag & Caldwell Mid Cap Growth Fund began issuing Class N shares on November 1, 2007. |
| | (b) | The selected per share data was calculated using the weighted average shares outstanding method for the period. |
| | (c) | The total return is calculated using the Net Asset Value used for trading at the close of business at period end. |
| | (f) | For the period November 1, 2010 through September 29, 2011 the Adviser contractually waived management fees and/or reimbursed expenses so that the net expense ratio did not exceed 1.40%, excluding interest, taxes, investment-related costs (such as brokerage commissions), extraordinary expenses and acquired fund fees and expenses. Effective September 30, 2011, the Adviser implemented a voluntary expense limitation of 1.25%. Subsequently, on February 29, 2012, the Adviser removed the voluntary expense limitation and replaced it with a contractual expense limitation of 1.25%. |
See accompanying Notes to Financial Statements.
| | |
| |
| ASTON/LMCG Small Cap Growth Fund – Class N (formerly, ASTON Small Cap Growth Fund) | | April 30, 2013 |
| |
| Financial Highlights | | |
| | | | | | | | | | | | |
| | | Six Months
Ended
04/30/13
(unaudited) | | | Year
Ended
10/31/12 | | | Period
Ended
10/31/11(a) | |
| | | |
| | | |
| | | |
Net Asset Value, Beginning of Period | | $ | 11.42 | | | $ | 9.95 | | | $ | 10.00 | |
| | | | | | | | | | | | |
Income from Investment Operations: | | | | | | | | | | | | |
Net investment income (loss) | | | 0.07 | (b) | | | (0.12 | )(b) | | | (0.04 | ) |
Net realized and unrealized gain (loss) on investments | | | 1.88 | | | | 1.59 | | | | (0.01 | ) |
| | | | | | | | | | | | |
Total from investment operations | | | 1.95 | | | | 1.47 | | | | (0.05 | ) |
| | | | | | | | | | | | |
Less Distributions: | | | | | | | | | | | | |
Distributions from net realized gains on investments | | | (0.89 | ) | | | — | | | | — | |
| | | | | | | | | | | | |
Total distributions | | | (0.89 | ) | | | — | | | | — | |
| | | | | | | | | | | | |
Net increase (decrease) in net asset value | | | 1.06 | | | | 1.47 | | | | (0.05 | ) |
| | | | | | | | | | | | |
Net Asset Value, End of Period | | $ | 12.48 | | | $ | 11.42 | | | $ | 9.95 | |
| | | | | | | | | | | | |
Total Return (c) | | | 18.19 | %(d) | | | 14.77 | % | | | (0.50 | )%(d) |
| | | |
Ratios/Supplemental Data: | | | | | | | | | | | | |
Net Assets, End of Period (in 000’s) | | $ | 27,132 | | | $ | 5,659 | | | $ | 5,411 | |
Ratios of expenses to average net assets: | | | | | | | | | | | | |
Before expense reimbursement and/or fee waiver by Adviser | | | 3.05 | %(e) | | | 2.86 | % | | | 8.27 | %(e) |
After expense reimbursement and/or fee waiver by Adviser | | | 1.35 | %(e) | | | 1.35 | % | | | 1.35 | %(e) |
Ratios of net investment income (loss) to average net assets: | | | | | | | | | | | | |
Before expense reimbursement and/or fee waiver by Adviser | | | (0.56 | )%(e) | | | (2.68 | )% | | | (8.14 | )%(e) |
After expense reimbursement and/or fee waiver by Adviser | | | 1.14 | %(e) | | | (1.17 | )% | | | (1.21 | )%(e) |
Portfolio Turnover | | | 74.56 | %(d)(f) | | | 168.05 | %(g) | | | 205.85 | %(d) |
| | (a) | LMCG Small Cap Growth Fund began issuing Class N shares on November 2, 2010. |
| | (b) | The selected per share data was calculated using the weighted average shares outstanding method for the period. |
| | (c) | The total return is calculated using the Net Asset Value used for trading at the close of business at period end. |
| | (f) | Portfolio turnover rate excludes securities received from the Reorganization, as discussed in Note J to the Financial Statements. |
| | (g) | Portfolio turnover rate excludes securities delivered from processing a redemption-in-kind. |
See accompanying Notes to Financial Statements.
| | |
| |
| ASTON/LMCG Small Cap Growth Fund – Class I (formerly, ASTON Small Cap Growth Fund) | | April 30, 2013 |
| |
| Financial Highlights | | |
| | | | | | | | | | | | |
| | | Six Months
Ended
04/30/13
(unaudited) | | | Year
Ended
10/31/12 | | | Period
Ended
10/31/11(a) | |
| | | |
| | | |
| | | |
Net Asset Value, Beginning of Period | | $ | 11.46 | | | $ | 9.97 | | | $ | 12.40 | |
| | | | | | | | | | | | |
Income from Investment Operations: | | | | | | | | | | | | |
Net investment income (loss) | | | 0.08 | (b) | | | (0.10 | )(b) | | | (0.04 | ) |
Net realized and unrealized gain (loss) on investments | | | 1.90 | | | | 1.59 | | | | (2.39 | ) |
| | | | | | | | | | | | |
Total from investment operations | | | 1.98 | | | | 1.49 | | | | (2.43 | ) |
| | | | | | | | | | | | |
Less Distributions: | | | | | | | | | | | | |
Distributions from net realized gains on investments | | | (0.89 | ) | | | — | | | | — | |
| | | | | | | | | | | | |
Total distributions | | | (0.89 | ) | | | — | | | | — | |
| | | | | | | | | | | | |
Net increase (decrease) in net asset value | | | 1.09 | | | | 1.49 | | | | (2.43 | ) |
| | | | | | | | | | | | |
Net Asset Value, End of Period | | $ | 12.55 | | | $ | 11.46 | | | $ | 9.97 | |
| | | | | | | | | | | | |
Total Return (c) | | | 18.40 | %(d) | | | 14.95 | % | | | (19.60 | )%(d) |
| | | |
Ratios/Supplemental Data: | | | | | | | | | | | | |
Net Assets, End of Period (in 000’s) | | $ | 4,442 | | | $ | 755 | | | $ | 2,551 | |
Ratios of expenses to average net assets: | | | | | | | | | | | | |
Before expense reimbursement and/or fee waiver by Adviser | | | 2.80 | %(e) | | | 2.61 | % | | | 6.25 | %(e) |
After expense reimbursement and/or fee waiver by Adviser | | | 1.10 | %(e) | | | 1.10 | % | | | 1.10 | %(e) |
Ratios of net investment income (loss) to average net assets: | | | | | | | | | | | | |
Before expense reimbursement and/or fee waiver by Adviser | | | (0.31 | )%(e) | | | (2.43 | )% | | | (6.11 | )%(e) |
After expense reimbursement and/or fee waiver by Adviser | | | 1.39 | %(e) | | | (0.92 | )% | | | (0.96 | )%(e) |
Portfolio Turnover | | | 74.56 | %(d)(f) | | | 168.05 | %(g) | | | 205.85 | %(d) |
| | (a) | LMCG Small Cap Growth Fund began issuing Class I shares on May 31, 2011. |
| | (b) | The selected per share data was calculated using the weighted average shares outstanding method for the period. |
| | (c) | The total return is calculated using the Net Asset Value used for trading at the close of business at period end. |
| | (f) | Portfolio turnover rate excludes securities received from the Reorganization, as discussed in Note J to the Financial Statements. |
| | (g) | Portfolio turnover rate excludes securities delivered from processing a redemption-in-kind. |
See accompanying Notes to Financial Statements.
| | |
| |
| ASTON/Silvercrest Small Cap Fund – Class N | | April 30, 2013 |
| |
| Financial Highlights | | |
| | | | | | | | |
| | | Six Months
Ended
04/30/13
(unaudited) | | | Period
Ended
10/31/12(a) | |
| | |
| | |
| | |
Net Asset Value, Beginning of Period | | $ | 10.90 | | | $ | 10.00 | |
| | | | | | | | |
Income from Investment Operations: | | | | | | | | |
Net investment income | | | 0.03 | (b) | | | 0.01 | |
Net realized and unrealized gain on investments | | | 1.62 | | | | 0.89 | |
| | | | | | | | |
Total from investment operations | | | 1.65 | | | | 0.90 | |
| | | | | | | | |
Less Distributions: | | | | | | | | |
Distributions from and in excess of net investment income | | | (0.11 | ) | | | — | |
Distributions from net realized gains on investments | | | (0.03 | ) | | | — | |
| | | | | | | | |
Total distributions | | | (0.14 | ) | | | — | |
| | | | | | | | |
Net increase in net asset value | | | 1.51 | | | | 0.90 | |
| | | | | | | | |
Net Asset Value, End of Period | | $ | 12.41 | | | $ | 10.90 | |
| | | | | | | | |
Total Return (c) | | | 15.30 | %(d) | | | 9.00 | %(d) |
| | |
Ratios/Supplemental Data: | | | | | | | | |
Net Assets, End of Period (in 000’s) | | $ | 1,374 | | | $ | 750 | |
Ratios of expenses to average net assets: | | | | | | | | |
Before expense reimbursement and/or fee waiver by Adviser | | | 2.46 | %(e) | | | 5.10 | %(e) |
After expense reimbursement and/or fee waiver by Adviser | | | 1.40 | %(e) | | | 1.40 | %(e) |
Ratios of net investment income (loss) to average net assets: | | | | | | | | |
Before expense reimbursement and/or fee waiver by Adviser | | | (0.52 | )%(e) | | | (3.51 | )%(e) |
After expense reimbursement and/or fee waiver by Adviser | | | 0.53 | %(e) | | | 0.19 | %(e) |
Portfolio Turnover | | | 21.89 | %(d) | | | 26.22 | %(d)(f) |
| | (a) | Silvercrest Small Cap Fund began issuing Class N shares on December 23, 2011. |
| | (b) | The selected per share data was calculated using the weighted average shares outstanding method for the period. |
| | (c) | The total return is calculated using the Net Asset Value used for trading at the close of business at period end. |
| | (f) | Portfolio turnover rate excludes securities delivered from processing a redemption-in-kind. |
See accompanying Notes to Financial Statements.
| | |
| |
| ASTON/Silvercrest Small Cap Fund – Class I | | April 30, 2013 |
| |
| Financial Highlights | | |
| | | | | | | | |
| | | Six Months
Ended
04/30/13
(unaudited) | | | Period
Ended
10/31/12(a) | |
| | |
| | |
| | |
Net Asset Value, Beginning of Period | | $ | 10.93 | | | $ | 10.00 | |
| | | | | | | | |
Income from Investment Operations: | | | | | | | | |
Net investment income | | | 0.05 | (b) | | | 0.03 | |
Net realized and unrealized gain on investments | | | 1.62 | | | | 0.90 | |
| | | | | | | | |
Total from investment operations | | | 1.67 | | | | 0.93 | |
| | | | | | | | |
Less Distributions: | | | | | | | | |
Distributions from and in excess of net investment income | | | (0.13 | ) | | | — | |
Distributions from net realized gains on investments | | | (0.03 | ) | | | — | |
| | | | | | | | |
Total distributions | | | (0.16 | ) | | | — | |
| | | | | | | | |
Net increase in net asset value | | | 1.51 | | | | 0.93 | |
| | | | | | | | |
Net Asset Value, End of Period | | $ | 12.44 | | | $ | 10.93 | |
| | | | | | | | |
Total Return (c) | | | 15.44 | %(d) | | | 9.30 | %(d) |
| | |
Ratios/Supplemental Data: | | | | | | | | |
Net Assets, End of Period (in 000’s) | | $ | 11,401 | | | $ | 4,962 | |
Ratios of expenses to average net assets: | | | | | | | | |
Before expense reimbursement and/or fee waiver by Adviser | | | 2.21 | %(e) | | | 4.85 | %(e) |
After expense reimbursement and/or fee waiver by Adviser | | | 1.15 | %(e) | | | 1.15 | %(e) |
Ratios of net investment income (loss) to average net assets: | | | | | | | | |
Before expense reimbursement and/or fee waiver by Adviser | | | (0.27 | )(e) | | | (3.26 | )%(e) |
After expense reimbursement and/or fee waiver by Adviser | | | 0.78 | %(e) | | | 0.44 | %(e) |
Portfolio Turnover | | | 21.89 | %(d) | | | 26.22 | %(d)(f) |
| | (a) | Silvercrest Small Cap Fund began issuing Class I shares on December 23, 2011. |
| | (b) | The selected per share data was calculated using the weighted average shares outstanding method for the period. |
| | (c) | The total return is calculated using the Net Asset Value used for trading at the close of business at period end. |
| | (f) | Portfolio turnover rate excludes securities delivered from processing a redemption-in-kind. |
See accompanying Notes to Financial Statements.
| | |
| |
| ASTON/TAMRO Small Cap Fund – Class N | | April 30, 2013 |
| |
| Financial Highlights | | |
| | | | | | | | | | | | | | | | | | | | | | | | |
| | | Six Months
Ended
04/30/13
(unaudited) | | | Year
Ended
10/31/12 | | | Year
Ended
10/31/11 | | | Year
Ended
10/31/10 | | | Year
Ended
10/31/09 | | | Year
Ended
10/31/08 | |
Net Asset Value, Beginning of Period | | $ | 20.52 | | | $ | 20.57 | | | $ | 19.42 | | | $ | 14.67 | | | $ | 13.64 | | | $ | 20.99 | |
| | | | | | | | | | | | | | | | | | | | | | | | |
Income from Investment Operations: | | | | | | | | | | | | | | | | | | | | | | | | |
Net investment income (loss) | | | 0.01 | (a) | | | (0.12 | )(a) | | | (0.15 | )(a) | | | (0.08 | )(a) | | | (0.05 | )(a) | | | 0.05 | |
Net realized and unrealized gain (loss)
on investments | | | 2.69 | | | | 2.09 | | | | 1.75 | | | | 4.83 | | | | 1.08 | | | | (6.43 | ) |
| | | | | | | | | | | | | | | | | | | | | | | | |
Total from investment operations | | | 2.70 | | | | 1.97 | | | | 1.60 | | | | 4.75 | | | | 1.03 | | | | (6.38 | ) |
| | | | | | | | | | | | | | | | | | | | | | | | |
Less Distributions: | | | | | | | | | | | | | | | | | | | | | | | | |
Distributions from net realized gain
on investments | | | (1.98 | ) | | | (2.02 | ) | | | (0.45 | ) | | | — | | | | — | | | | (0.97 | ) |
| | | | | | | | | | | | | | | | | | | | | | | | |
Total distributions | | | (1.98 | ) | | | (2.02 | ) | | | (0.45 | ) | | | — | | | | — | | | | (0.97 | ) |
| | | | | | | | | | | | | | | | | | | | | | | | |
Net increase (decrease) in net asset value | | | 0.72 | | | | (0.05 | ) | | | 1.15 | | | | 4.75 | | | | 1.03 | | | | (7.35 | ) |
| | | | | | | | | | | | | | | | | | | | | | | | |
Net Asset Value, End of Period | | $ | 21.24 | | | $ | 20.52 | | | $ | 20.57 | | | $ | 19.42 | | | $ | 14.67 | | | $ | 13.64 | |
| | | | | | | | | | | | | | | | | | | | | | | | |
Total Return (b) | | | 14.34 | %(c) | | | 10.70 | % | | | 8.16 | % | | | 32.29 | % | | | 7.63 | % | | | (31.58 | )% |
| | | | | | |
Ratios/Supplemental Data: | | | | | | | | | | | | | | | | | | | | | | | | |
Net Assets, End of Period (in 000’s) | | $ | 426,614 | | | $ | 389,125 | | | $ | 375,969 | | | $ | 335,809 | | | $ | 241,524 | | | $ | 159,965 | |
Ratios of expenses to average net assets: | | | | | | | | | | | | | | | | | | | | | | | | |
Before expense reimbursement and/or fee
waiver by Adviser | | | 1.30 | %(d) | | | 1.28 | %(e) | | | 1.29 | % | | | 1.34 | % | | | 1.37 | % | | | 1.32 | % |
After expense reimbursement and/or fee
waiver by Adviser | | | 1.30 | %(d) | | | 1.28 | %(e) | | | 1.29 | % | | | 1.34 | % | | | 1.36 | %(f) | | | 1.30 | % |
Ratios of net investment income (loss)
to average net assets: | | | | | | | | | | | | | | | | | | | | | | | | |
Before expense reimbursement and/or fee
waiver by Adviser | | | 0.11 | %(d) | | | (0.59 | )% | | | (0.69 | )% | | | (0.49 | )% | | | (0.41 | )% | | | 0.29 | % |
After expense reimbursement and/or fee
waiver by Adviser | | | 0.11 | %(d) | | | (0.59 | )% | | | (0.69 | )% | | | (0.49 | )% | | | (0.40 | )% | | | 0.31 | % |
Portfolio Turnover | | | 32.53 | %(c)(g)(h) | | | 48.22 | %(g) | | | 47.25 | % | | | 62.13 | % | | | 89.92 | % | | | 66.65 | % |
| | (a) | The selected per share data was calculated using the weighted average shares outstanding method for the period. |
| | (b) | The total return is calculated using the Net Asset Value used for trading at the close of business at period end. |
| | (e) | Ratios of expenses to average net assets include interest expenses of less than 0.005% for the year ended October 31, 2012, which are not included in the contractual expense limitation. The interest expenses are from utilizing the line of credit as discussed in Note H to the Financial Statements. |
| | (f) | The Adviser removed the contractual expense limitation of 1.30%, excluding interest, taxes, investment-related costs (such as brokerage commissions), extraordinary expenses and acquired fund fees and expenses, effective March 1, 2009. |
| | (g) | Portfolio turnover rate excludes securities delivered from processing redemptions-in-kind. |
| | (h) | Portfolio turnover rate excludes securities received from processing a subscription-in-kind. |
See accompanying Notes to Financial Statements.
| | |
| |
| ASTON/TAMRO Small Cap Fund – Class I | | April 30, 2013 |
| |
| Financial Highlights | | |
| | | | | | | | | | | | | | | | | | | | | | | | |
| | | Six Months
Ended
04/30/13
(unaudited) | | | Year
Ended
10/31/12 | | | Year
Ended
10/31/11 | | | Year
Ended
10/31/10 | | | Year
Ended
10/31/09 | | | Year
Ended
10/31/08 | |
| | | | | | | | | | | | | | | | | | | | | | | | |
Net Asset Value, Beginning of Period | | $ | 20.96 | | | $ | 20.91 | | | $ | 19.69 | | | $ | 14.87 | | | $ | 13.79 | | | $ | 21.16 | |
| | | | | | | | | | | | | | | | | | | | | | | | |
Income from Investment Operations: | | | | | | | | | | | | | | | | | | | | | | | | |
Net investment income (loss) | | | 0.04 | (a) | | | (0.07 | )(a) | | | (0.09 | )(a) | | | (0.04 | )(a) | | | (0.02 | )(a) | | | 0.02 | |
Net realized and unrealized gain (loss)
on investments | | | 2.75 | | | | 2.14 | | | | 1.76 | | | | 4.87 | | | | 1.12 | | | | (6.42 | ) |
| | | | | | | | | | | | | | | | | | | | | | | | |
Total from investment operations | | | 2.79 | | | | 2.07 | | | | 1.67 | | | | 4.83 | | | | 1.10 | | | | (6.40 | ) |
| | | | | | | | | | | | | | | | | | | | | | | | |
Less Distributions: | | | | | | | | | | | | | | | | | | | | | | | | |
Distributions from and in excess of net
investment income | | | — | | | | — | | | | — | | | | (0.01 | ) | | | (0.02 | ) | | | — | |
Distributions from net realized gain
on investments | | | (1.98 | ) | | | (2.02 | ) | | | (0.45 | ) | | | — | | | | — | | | | (0.97 | ) |
| | | | | | | | | | | | | | | | | | | | | | | | |
Total distributions | | | (1.98 | ) | | | (2.02 | ) | | | (0.45 | ) | | | (0.01 | ) | | | (0.02 | ) | | | (0.97 | ) |
| | | | | | | | | | | | | | | | | | | | | | | | |
Net increase (decrease) in net asset value | | | 0.81 | | | | 0.05 | | | | 1.22 | | | | 4.82 | | | | 1.08 | | | | (7.37 | ) |
| | | | | | | | | | | | | | | | | | | | | | | | |
Net Asset Value, End of Period | | $ | 21.77 | | | $ | 20.96 | | | $ | 20.91 | | | $ | 19.69 | | | $ | 14.87 | | | $ | 13.79 | |
| | | | | | | | | | | | | | | | | | | | | | | | |
Total Return (b) | | | 14.53 | %(c) | | | 10.98 | % | | | 8.40 | % | | | 32.62 | % | | | 7.94 | % | | | (31.42 | )% |
| | | | | | |
Ratios/Supplemental Data: | | | | | | | | | | | | | | | | | | | | | | | | |
Net Assets, End of Period (in 000’s) | | $ | 677,249 | | | $ | 635,663 | | | $ | 625,315 | | | $ | 549,627 | | | $ | 515,592 | | | $ | 238,399 | |
Ratios of expenses to average net assets: | | | | | | | | | | | | | | | | | | | | | | | | |
Before expense reimbursement and/or fee
waiver by Adviser | | | 1.05 | %(d) | | | 1.03 | %(e) | | | 1.04 | % | | | 1.09 | % | | | 1.12 | % | | | 1.07 | % |
After expense reimbursement and/or fee
waiver by Adviser | | | 1.05 | %(d) | | | 1.03 | %(e) | | | 1.04 | % | | | 1.09 | % | | | 1.11 | %(f) | | | 1.05 | % |
Ratios of net investment income (loss)
to average net assets: | | | | | | | | | | | | | | | | | | | | | | | | |
Before expense reimbursement and/or fee
waiver by Adviser | | | 0.36 | %(d) | | | (0.34 | )% | | | (0.44 | )% | | | (0.24 | )% | | | (0.16 | )% | | | 0.54 | % |
After expense reimbursement and/or fee
waiver by Adviser | | | 0.36 | %(d) | | | (0.34 | )% | | | (0.44 | )% | | | (0.24 | )% | | | (0.15 | )% | | | 0.56 | % |
Portfolio Turnover | | | 32.53 | %(c)(g)(h) | | | 48.22 | %(g) | | | 47.25 | % | | | 62.13 | % | | | 89.92 | % | | | 66.65 | % |
| | (a) | The selected per share data was calculated using the weighted average shares outstanding method for the period. |
| | (b) | The total return is calculated using the Net Asset Value used for trading at the close of business at period end. |
| | (e) | Ratios of expenses to average net assets include interest expenses of less than 0.005% for the year ended October 31, 2012, which are not included in the contractual expense limitation. The interest expenses are from utilizing the line of credit as discussed in Note H to the Financial Statements. |
| | (f) | The Adviser removed the contractual expense limitation of 1.05%, excluding interest, taxes, investment-related costs (such as brokerage commissions), extraordinary expenses and acquired fund fees and expenses, effective March 1, 2009. |
| | (g) | Portfolio turnover rate excludes securities delivered from processing redemptions-in-kind. |
| | (h) | Portfolio turnover rate excludes securities received from processing a subscription-in-kind. |
See accompanying Notes to Financial Statements.
| | |
| |
| ASTON/River Road Select Value Fund – Class N | | April 30, 2013 |
| |
| Financial Highlights | | |
| | | | | | | | | | | | | | | | | | | | | | | | |
| | | Six Months
Ended
04/30/13
(unaudited) | | | Year
Ended
10/31/12 | | | Year
Ended
10/31/11 | | | Year
Ended
10/31/10 | | | Year
Ended
10/31/09 | | | Year
Ended
10/31/08 | |
| | | | | | | | | | | | | | | | | | | | | | | | |
Net Asset Value, Beginning of Period | | $ | 8.50 | | | $ | 9.54 | | | $ | 9.01 | | | $ | 7.71 | | | $ | 7.13 | | | $ | 10.13 | |
| | | | | | | | | | | | | | | | | | | | | | | | |
Income from Investment Operations: | | | | | | | | | | | | | | | | | | | | | | | | |
Net investment income (loss) | | | 0.09 | (a) | | | 0.01 | (a) | | | (0.02 | )(a) | | | 0.02 | (a) | | | — | (a)(b) | | | — | (a)(b) |
Net realized and unrealized gain (loss)
on investments | | | 1.33 | | | | 1.01 | | | | 0.66 | | | | 1.28 | | | | 0.59 | | | | (3.00 | ) |
| | | | | | | | | | | | | | | | | | | | | | | | |
Total from investment operations | | | 1.42 | | | | 1.02 | | | | 0.64 | | | | 1.30 | | | | 0.59 | | | | (3.00 | ) |
| | | | | | | | | | | | | | | | | | | | | | | | |
Less Distributions: | | | | | | | | | | | | | | | | | | | | | | | | |
Distributions from net investment income | | | (0.12 | ) | | | — | | | | (0.03 | ) | | | — | | | | (0.01 | ) | | | — | |
Distributions from net realized gains
on investments | | | (0.51 | ) | | | (2.06 | ) | | | (0.08 | ) | | | — | | | | — | | | | — | |
| | | | | | | | | | | | | | | | | | | | | | | | |
Total distributions | | | (0.63 | ) | | | (2.06 | ) | | | (0.11 | ) | | | — | | | | (0.01 | ) | | | — | |
| | | | | | | | | | | | | | | | | | | | | | | | |
Net increase (decrease) in net asset value | | | 0.79 | | | | (1.04 | ) | | | 0.53 | | | | 1.30 | | | | 0.58 | | | | (3.00 | ) |
| | | | | | | | | | | | | | | | | | | | | | | | |
Net Asset Value, End of Period | | $ | 9.29 | | | $ | 8.50 | | | $ | 9.54 | | | $ | 9.01 | | | $ | 7.71 | | | $ | 7.13 | |
| | | | | | | | | | | | | | | | | | | | | | | | |
Total Return (c) | | | 17.88 | %(d) | | | 12.87 | % | | | 7.12 | % | | | 16.86 | % | | | 8.33 | % | | | (29.62 | )% |
| | | | | | |
Ratios/Supplemental Data: | | | | | | | | | | | | | | | | | | | | | | | | |
Net Assets, End of Period (in 000’s) | | $ | 13,094 | | | $ | 6,270 | | | $ | 13,160 | | | $ | 52,522 | | | $ | 41,801 | | | $ | 26,714 | |
Ratios of expenses to average net assets: | | | | | | | | | | | | | | | | | | | | | | | | |
Before expense reimbursement and/or fee
waiver, or recoupment by Adviser | | | 1.45 | %(e) | | | 1.43 | %(f) | | | 1.42 | %(f) | | | 1.41 | %(f) | | | 1.44 | % | | | 1.56 | % |
After expense reimbursement and/or fee
waiver, or recoupment by Adviser | | | 1.45 | %(e) | | | 1.43 | %(f) | | | 1.42 | %(f) | | | 1.43 | %(f) | | | 1.50 | % | | | 1.50 | % |
Ratios of net investment income (loss)
to average net assets: | | | | | | | | | | | | | | | | | | | | | | | | |
Before expense reimbursement and/or fee
waiver, or recoupment by Adviser | | | 2.08 | %(e) | | | 0.07 | % | | | (0.18 | )% | | | 0.31 | % | | | 0.04 | % | | | (0.08 | )% |
After expense reimbursement and/or fee
waiver, or recoupment by Adviser | | | 2.08 | %(e) | | | 0.07 | % | | | (0.18 | )% | | | 0.29 | % | | | (0.02 | )% | | | (0.02 | )% |
Portfolio Turnover | | | 40.92 | %(d) | | | 38.84 | % | | | 48.22 | % | | | 53.73 | % | | | 44.09 | % | | | 54.93 | % |
| | (a) | The selected per share data was calculated using the weighted average shares outstanding method for the period. |
| | (b) | Represents less than $(0.005) per share. |
| | (c) | The total return is calculated using the Net Asset Value used for trading at the close of business at period end. |
| | (f) | Ratios of expenses to average net assets include interest expenses of less than 0.005% for each of the years ended October 31, 2012, October 31, 2011 and October 31, 2010, which are not included in the contractual expense limitation. The interest expenses are from utilizing the line of credit as discussed in Note H to the Financial Statements. |
See accompanying Notes to Financial Statements.
| | |
| |
| ASTON/River Road Select Value Fund – Class I | | April 30, 2013 |
| |
| Financial Highlights | | |
| | | | | | | | | | | | | | | | | | | | | | | | |
| | | Six Months
Ended
04/30/13
(unaudited) | | | Year
Ended
10/31/12 | | | Year
Ended
10/31/11 | | | Year
Ended
10/31/10 | | | Year
Ended
10/31/09 | | | Year
Ended
10/31/08 | |
| | | | | | | | | | | | | | | | | | | | | | | | |
Net Asset Value, Beginning of Period | | $ | 8.58 | | | $ | 9.59 | | | $ | 9.04 | | | $ | 7.73 | | | $ | 7.14 | | | $ | 10.13 | |
| | | | | | | | | | | | | | | | | | | | | | | | |
Income from Investment Operations: | | | | | | | | | | | | | | | | | | | | | | | | |
Net investment income | | | 0.10 | (a) | | | 0.03 | (a) | | | 0.01 | (a) | | | 0.05 | (a) | | | 0.02 | (a) | | | 0.02 | (a) |
Net realized and unrealized gain (loss)
on investments | | | 1.35 | | | | 1.02 | | | | 0.67 | | | | 1.28 | | | | 0.59 | | | | (3.00 | ) |
| | | | | | | | | | | | | | | | | | | | | | | | |
Total from investment operations | | | 1.45 | | | | 1.05 | | | | 0.68 | | | | 1.33 | | | | 0.61 | | | | (2.98 | ) |
| | | | | | | | | | | | | | | | | | | | | | | | |
Less Distributions: | | | | | | | | | | | | | | | | | | | | | | | | |
Distributions from net investment income | | | (0.15 | ) | | | — | | | | (0.05 | ) | | | (0.02 | ) | | | (0.02 | ) | | | (0.01 | ) |
Distributions from net realized gains
on investments | | | (0.51 | ) | | | (2.06 | ) | | | (0.08 | ) | | | — | | | | — | | | | — | |
| | | | | | | | | | | | | | | | | | | | | | | | |
Total distributions | | | (0.66 | ) | | | (2.06 | ) | | | (0.13 | ) | | | (0.02 | ) | | | (0.02 | ) | | | (0.01 | ) |
| | | | | | | | | | | | | | | | | | | | | | | | |
Net increase (decrease) in net asset value | | | 0.79 | | | | (1.01 | ) | | | 0.55 | | | | 1.31 | | | | 0.59 | | | | (2.99 | ) |
| | | | | | | | | | | | | | | | | | | | | | | | |
Net Asset Value, End of Period | | $ | 9.37 | | | $ | 8.58 | | | $ | 9.59 | | | $ | 9.04 | | | $ | 7.73 | | | $ | 7.14 | |
| | | | | | | | | | | | | | | | | | | | | | | | |
Total Return (b) | | | 18.02 | %(c) | | | 13.18 | % | | | 7.56 | % | | | 17.19 | % | | | 8.52 | % | | | (29.49 | )% |
| | | | | | |
Ratios/Supplemental Data: | | | | | | | | | | | | | | | | | | | | | | | | |
Net Assets, End of Period (in 000’s) | | $ | 185,514 | | | $ | 156,510 | | | $ | 130,527 | | | $ | 163,232 | | | $ | 167,334 | | | $ | 84,002 | |
Ratios of expenses to average net assets: | | | | | | | | | | | | | | | | | | | | | | | | |
Before expense reimbursement and/or fee
waiver, or recoupment by Adviser | | | 1.20 | %(d) | | | 1.18 | %(e) | | | 1.17 | %(e) | | | 1.16 | %(e) | | | 1.19 | % | | | 1.31 | % |
After expense reimbursement and/or fee
waiver, or recoupment by Adviser | | | 1.20 | %(d) | | | 1.18 | %(e) | | | 1.17 | %(e) | | | 1.18 | %(e) | | | 1.25 | % | | | 1.25 | % |
Ratios of net investment income
to average net assets: | | | | | | | | | | | | | | | | | | | | | | | | |
Before expense reimbursement and/or fee
waiver, or recoupment by Adviser | | | 2.33 | %(d) | | | 0.32 | % | | | 0.07 | % | | | 0.56 | % | | | 0.29 | % | | | 0.17 | % |
After expense reimbursement and/or fee
waiver, or recoupment by Adviser | | | 2.33 | %(d) | | | 0.32 | % | | | 0.07 | % | | | 0.54 | % | | | 0.23 | % | | | 0.23 | % |
Portfolio Turnover | | | 40.92 | %(c) | | | 38.84 | % | | | 48.22 | % | | | 53.73 | % | | | 44.09 | % | | | 54.93 | % |
| | (a) | The selected per share data was calculated using the weighted average shares outstanding method for the period. |
| | (b) | The total return is calculated using the Net Asset Value used for trading at the close of business at period end. |
| | (e) | Ratios of expenses to average net assets include interest expenses of less than 0.005% for each of the years ended October 31, 2012, October 31, 2011 and October 31, 2010, which are not included in the contractual expense limitation. The interest expenses are from utilizing the line of credit as discussed in Note H to the Financial Statements. |
See accompanying Notes to Financial Statements.
| | |
| |
| ASTON/River Road Small Cap Value Fund – Class N | | April 30, 2013 |
| |
| Financial Highlights | | |
| | | | | | | | | | | | | | | | | | | | | | | | |
| | | Six Months
Ended
04/30/13
(unaudited) | | | Year
Ended
10/31/12 | | | Year
Ended
10/31/11 | | | Year
Ended
10/31/10 | | | Year
Ended
10/31/09 | | | Year
Ended
10/31/08 | |
| | | | | | | | | | | | | | | | | | | | | | | | |
Net Asset Value, Beginning of Period | | $ | 13.56 | | | $ | 12.20 | | | $ | 11.60 | | | $ | 10.22 | | | $ | 9.30 | | | $ | 14.37 | |
| | | | | | | | | | | | | | | | | | | | | | | | |
Income from Investment Operations: | | | | | | | | | | | | | | | | | | | | | | | | |
Net investment income (loss) | | | 0.17 | | | | 0.03 | (a) | | | (0.03 | ) | | | 0.03 | | | | 0.01 | | | | 0.01 | (a) |
Net realized and unrealized gain (loss)
on investments | | | 2.05 | | | | 1.33 | | | | 0.67 | | | | 1.36 | | | | 0.92 | | | | (4.54 | ) |
| | | | | | | | | | | | | | | | | | | | | | | | |
Total from investment operations | | | 2.22 | | | | 1.36 | | | | 0.64 | | | | 1.39 | | | | 0.93 | | | | (4.53 | ) |
| | | | | | | | | | | | | | | | | | | | | | | | |
Less Distributions: | | | | | | | | | | | | | | | | | | | | | | | | |
Distributions from and in excess of net
investment income | | | (0.22 | ) | | | — | | | | (0.04 | ) | | | (0.01 | ) | | | (0.01 | ) | | | — | |
Distributions from net realized gain
on investments | | | (0.43 | ) | | | — | | | | — | | | | — | | | | — | | | | (0.54 | ) |
| | | | | | | | | | | | | | | | | | | | | | | | |
Total distributions | | | (0.65 | ) | | | — | | | | (0.04 | ) | | | (0.01 | ) | | | (0.01 | ) | | | (0.54 | ) |
| | | | | | | | | | | | | | | | | | | | | | | | |
Net increase (decrease) in net asset value | | | 1.57 | | | | 1.36 | | | | 0.60 | | | | 1.38 | | | | 0.92 | | | | (5.07 | ) |
| | | | | | | | | | | | | | | | | | | | | | | | |
Net Asset Value, End of Period | | $ | 15.13 | | | $ | 13.56 | | | $ | 12.20 | | | $ | 11.60 | | | $ | 10.22 | | | $ | 9.30 | |
| | | | | | | | | | | | | | | | | | | | | | | | |
Total Return (b) | | | 17.12 | %(c) | | | 11.15 | % | | | 5.46 | % | | | 13.60 | % | | | 9.99 | % | | | (32.51 | )% |
| | | | | | |
Ratios/Supplemental Data: | | | | | | | | | | | | | | | | | | | | | | | | |
Net Assets, End of Period (in 000’s) | | $ | 53,457 | | | $ | 49,154 | | | $ | 91,347 | | | $ | 213,326 | | | $ | 216,221 | | | $ | 160,245 | |
Ratios of expenses to average net assets: | | | | | | | | | | | | | | | | | | | | | | | | |
Before expense reimbursement and/or fee
waiver by Adviser | | | 1.34 | %(d) | | | 1.37 | % | | | 1.37 | %(e) | | | 1.39 | %(e) | | | 1.40 | % | | | 1.45 | %(e) |
After expense reimbursement and/or fee
waiver by Adviser | | | 1.34 | %(d) | | | 1.37 | % | | | 1.37 | %(e) | | | 1.39 | %(e) | | | 1.40 | %(f) | | | 1.45 | %(e) |
Ratios of net investment income (loss)
to average net assets: | | | | | | | | | | | | | | | | | | | | | | | | |
Before expense reimbursement and/or fee
waiver by Adviser | | | 2.28 | %(d) | | | 0.22 | % | | | (0.13 | )% | | | 0.27 | % | | | 0.05 | % | | | 0.08 | % |
After expense reimbursement and/or fee
waiver by Adviser | | | 2.28 | %(d) | | | 0.22 | % | | | (0.13 | )% | | | 0.27 | % | | | 0.05 | % | | | 0.08 | % |
Portfolio Turnover | | | 32.30 | %(c) | | | 26.95 | % | | | 42.29 | % | | | 51.05 | % | | | 35.83 | % | | | 57.32 | % |
| | (a) | The selected per share data was calculated using the weighted average shares outstanding method for the period. |
| | (b) | The total return is calculated using the Net Asset Value used for trading at the close of business at period end. |
| | (e) | Ratios of expenses to average net assets include interest expenses of less than 0.005% for each of the years ended October 31, 2011, October 31, 2010 and October 31, 2008, which are not included in the contractual expense limitation. The interest expenses are from utilizing the line of credit as discussed in Note H to the Financial Statements. |
| | (f) | The Adviser removed the contractual expense limitation of 1.50%, excluding interest, taxes, investment-related costs (such as brokerage commissions), extraordinary expenses and acquired fund fees and expenses, effective March 1, 2009. |
See accompanying Notes to Financial Statements.
| | |
| |
| ASTON/River Road Small Cap Value Fund – Class I | | April 30, 2013 |
| |
| Financial Highlights | | |
| | | | | | | | | | | | | | | | | | | | | | | | |
| | | Six Months
Ended
04/30/13
(unaudited) | | | Year
Ended
10/31/12 | | | Year
Ended
10/31/11 | | | Year
Ended
10/31/10 | | | Year
Ended
10/31/09 | | | Year
Ended
10/31/08 | |
| | | | | | | | | | | | | | | | | | | | | | | | |
Net Asset Value, Beginning of Period | | $ | 13.62 | | | $ | 12.22 | | | $ | 11.62 | | | $ | 10.24 | | | $ | 9.32 | | | $ | 14.37 | |
| | | | | | | | | | | | | | | | | | | | | | | | |
Income from Investment Operations: | | | | | | | | | | | | | | | | | | | | | | | | |
Net investment income | | | 0.19 | | | | 0.06 | (a) | | | 0.01 | | | | 0.06 | | | | 0.03 | | | | 0.04 | (a) |
Net realized and unrealized gain (loss)
on investments | | | 2.06 | | | | 1.34 | | | | 0.65 | | | | 1.35 | | | | 0.92 | | | | (4.54 | ) |
| | | | | | | | | | | | | | | | | | | | | | | | |
Total from investment operations | | | 2.25 | | | | 1.40 | | | | 0.66 | | | | 1.41 | | | | 0.95 | | | | (4.50 | ) |
| | | | | | | | | | | | | | | | | | | | | | | | |
Less Distributions: | | | | | | | | | | | | | | | | | | | | | | | | |
Distributions from and in excess of net
investment income | | | (0.26 | ) | | | — | | | | (0.06 | ) | | | (0.03 | ) | | | (0.03 | ) | | | (0.01 | ) |
Distributions from net realized gain
on investments | | | (0.43 | ) | | | — | | | | — | | | | — | | | | — | | | | (0.54 | ) |
| | | | | | | | | | | | | | | | | | | | | | | | |
Total distributions | | | (0.69 | ) | | | — | | | | (0.06 | ) | | | (0.03 | ) | | | (0.03 | ) | | | (0.55 | ) |
| | | | | | | | | | | | | | | | | | | | | | | | |
Net increase (decrease) in net asset value | | | 1.56 | | | | 1.40 | | | | 0.60 | | | | 1.38 | | | | 0.92 | | | | (5.05 | ) |
| | | | | | | | | | | | | | | | | | | | | | | | |
Net Asset Value, End of Period | | $ | 15.18 | | | $ | 13.62 | | | $ | 12.22 | | | $ | 11.62 | | | $ | 10.24 | | | $ | 9.32 | |
| | | | | | | | | | | | | | | | | | | | | | | | |
Total Return (b) | | | 17.29 | %(c) | | | 11.46 | % | | | 5.70 | % | | | 13.80 | % | | | 10.31 | % | | | (32.34 | )% |
| | | | | | |
Ratios/Supplemental Data: | | | | | | | | | | | | | | | | | | | | | | | | |
Net Assets, End of Period (in 000’s) | | $ | 275,202 | | | $ | 240,075 | | | $ | 246,141 | | | $ | 255,344 | | | $ | 282,542 | | | $ | 114,666 | |
Ratios of expenses to average net assets: | | | | | | | | | | | | | | | | | | | | | | | | |
Before expense reimbursement and/or fee
waiver by Adviser | | | 1.09 | %(d) | | | 1.12 | % | | | 1.12 | %(e) | | | 1.14 | %(e) | | | 1.15 | % | | | 1.20 | %(e) |
After expense reimbursement and/or fee
waiver by Adviser | | | 1.09 | %(d) | | | 1.12 | % | | | 1.12 | %(e) | | | 1.14 | %(e) | | | 1.15 | %(f) | | | 1.20 | %(e) |
Ratios of net investment income
to average net assets: | | | | | | | | | | | | | | | | | | | | | | | | |
Before expense reimbursement and/or fee
waiver by Adviser | | | 2.53 | %(d) | | | 0.47 | % | | | 0.12 | % | | | 0.52 | % | | | 0.30 | % | | | 0.33 | % |
After expense reimbursement and/or fee
waiver by Adviser | | | 2.53 | %(d) | | | 0.47 | % | | | 0.12 | % | | | 0.52 | % | | | 0.30 | % | | | 0.33 | % |
Portfolio Turnover | | | 32.30 | %(c) | | | 26.95 | % | | | 42.29 | % | | | 51.05 | % | | | 35.83 | % | | | 57.32 | % |
| | (a) | The selected per share data was calculated using the weighted average shares outstanding method for the period. |
| | (b) | The total return is calculated using the Net Asset Value used for trading at the close of business at period end. |
| | (e) | Ratios of expenses to average net assets include interest expenses of less than 0.005% for each of the years ended October 31, 2011, October 31, 2010 and October 31, 2008, which are not included in the contractual expense limitation. The interest expenses are from utilizing the line of credit as discussed in Note H to the Financial Statements. |
| | (f) | The Adviser removed the contractual expense limitation of 1.25%, excluding interest, taxes, investment-related costs (such as brokerage commissions), extraordinary expenses and acquired fund fees and expenses, effective March 1, 2009. |
See accompanying Notes to Financial Statements.
| | |
| |
| ASTON/River Road Independent Value Fund – Class N | | April 30, 2013 |
| |
| Financial Highlights | | |
| | | | | | | | | | | | |
| | | Six Months
Ended
04/30/13
(unaudited) | | | Year
Ended
10/31/12 | | | Period
Ended
10/31/11(a) | |
Net Asset Value, Beginning of Period | | $ | 11.42 | | | $ | 10.75 | | | $ | 10.00 | |
| | | | | | | | | | | | |
Income from Investment Operations: | | | | | | | | | | | | |
Net investment loss | | | (0.02 | )(b) | | | (0.09 | )(b) | | | (0.07 | )(b) |
Net realized and unrealized gain on investments | | | 0.24 | | | | 0.88 | | | | 0.82 | |
| | | | | | | | | | | | |
Total from investment operations | | | 0.22 | | | | 0.79 | | | | 0.75 | |
| | | | | | | | | | | | |
Less Distributions: | | | | | | | | | | | | |
Distributions from net realized gain on investments | | | (0.63 | ) | | | (0.12 | ) | | | — | |
| | | | | | | | | | | | |
Total distributions | | | (0.63 | ) | | | (0.12 | ) | | | — | |
| | | | | | | | | | | | |
Net increase (decrease) in net asset value | | | (0.41 | ) | | | 0.67 | | | | 0.75 | |
| | | | | | | | | | | | |
Net Asset Value, End of Period | | $ | 11.01 | | | $ | 11.42 | | | $ | 10.75 | |
| | | | | | | | | | | | |
Total Return (c) | | | 2.10 | %(d) | | | 7.41 | % | | | 7.50 | %(d) |
| | | |
Ratios/Supplemental Data: | | | | | | | | | | | | |
Net Assets, End of Period (in 000’s) | | $ | 340,369 | | | $ | 362,416 | | | $ | 306,223 | |
Ratios of expenses to average net assets: | | | | | | | | | | | | |
Before earnings credit, expense reimbursement and/or fee waiver, or recoupment by the Adviser | | | 1.41 | %(e)(f) | | | 1.44 | %(f) | | | 1.59 | %(e) |
After earnings credit, expense reimbursement and/or fee waiver, or recoupment by the Adviser | | | 1.42 | %(e)(f) | | | 1.42 | %(f) | | | 1.42 | %(e) |
Ratios of net investment loss to average net assets: | | | | | | | | | | | | |
Before earnings credit, expense reimbursement and/or fee waiver, or recoupment by the Adviser | | | (0.32 | )%(e) | | | (0.81 | )% | | | (0.98 | )%(e) |
After earnings credit, expense reimbursement and/or fee waiver, or recoupment by the Adviser | | | (0.33 | )%(e) | | | (0.79 | )% | | | (0.80 | )%(e) |
Portfolio Turnover | | | 54.20 | %(d)(g) | | | 141.17 | % | | | 105.69 | %(d) |
| | (a) | River Road Independent Value Fund began issuing Class N shares on December 30, 2010. |
| | (b) | The selected per share data was calculated using the weighted average shares outstanding method for the period. |
| | (c) | The total return is calculated using the Net Asset Value used for trading at the close of business at period end. |
| | (f) | Ratios of expenses to average net assets include Earnings Credits of less than 0.005% for the six months ended April 30, 2013 and year ended October 31, 2012, which is not included in the contractual expense limitation. See Note I to the Financial Statements. |
| | (g) | Portfolio turnover rate excludes securities received from processing a subscription-in-kind. |
See accompanying Notes to Financial Statements.
| | |
| |
| ASTON/River Road Independent Value Fund – Class I | | April 30, 2013 |
| |
| Financial Highlights | | |
| | | | | | | | | | | | |
| | | Six Months
Ended
04/30/13
(unaudited) | | | Year
Ended
10/31/12 | | | Period
Ended
10/31/11(a) | |
Net Asset Value, Beginning of Period | | $ | 11.46 | | | $ | 10.75 | | | $ | 10.92 | |
| | | | | | | | | | | | |
Income from Investment Operations: | | | | | | | | | | | | |
Net investment loss | | | — | (b)(c) | | | (0.06 | )(b) | | | (0.02 | )(b) |
Net realized and unrealized gain (loss) on investments | | | 0.23 | | | | 0.89 | | | | (0.15 | ) |
| | | | | | | | | | | | |
Total from investment operations | | | 0.23 | | | | 0.83 | | | | (0.17 | ) |
| | | | | | | | | | | | |
Less Distributions: | | | | | | | | | | | | |
Distributions from net realized gain on investments | | | (0.63 | ) | | | (0.12 | ) | | | — | |
| | | | | | | | | | | | |
Total distributions | | | (0.63 | ) | | | (0.12 | ) | | | — | |
| | | | | | | | | | | | |
Net increase (decrease) in net asset value | | | (0.40 | ) | | | 0.71 | | | | (0.17 | ) |
| | | | | | | | | | | | |
Net Asset Value, End of Period | | $ | 11.06 | | | $ | 11.46 | | | $ | 10.75 | |
| | | | | | | | | | | | |
Total Return (d) | | | 2.18 | %(e) | | | 7.68 | % | | | (1.47 | )%(e) |
| | | |
Ratios/Supplemental Data: | | | | | | | | | | | | |
Net Assets, End of Period (in 000’s) | | $ | 383,114 | | | $ | 338,234 | | | $ | 85,478 | |
Ratios of expenses to average net assets: | | | | | | | | | | | | |
Before earnings credit, expense reimbursement and/or fee waiver, or recoupment by the Adviser | | | 1.16 | %(f)(g) | | | 1.19 | %(g) | | | 1.34 | %(f) |
After earnings credit, expense reimbursement and/or fee waiver, or recoupment by the Adviser | | | 1.17 | %(f)(g) | | | 1.17 | %(g) | | | 1.17 | %(f) |
Ratios of net investment loss to average net assets: | | | | | | | | | | | | |
Before earnings credit, expense reimbursement and/or fee waiver, or recoupment by the Adviser | | | (0.07 | )%(f) | | | (0.56 | )% | | | (0.73 | )%(f) |
After earnings credit, expense reimbursement and/or fee waiver, or recoupment by the Adviser | | | (0.08 | )%(f) | | | (0.54 | )% | | | (0.55 | )%(f) |
Portfolio Turnover | | | 54.20 | %(e)(h) | | | 141.17 | % | | | 105.69 | %(e) |
| | (a) | River Road Independent Value Fund began issuing Class I shares on May 31, 2011. |
| | (b) | The selected per share data was calculated using the weighted average shares outstanding method for the period. |
| | (c) | Represents less than $(0.005) per share. |
| | (d) | The total return is calculated using the Net Asset Value used for trading at the close of business at period end. |
| | (g) | Ratios of expenses to average net assets include Earnings Credits of less than 0.005% for the six months ended April 30, 2013 and year ended October 31, 2012, which is not included in the contractual expense limitation. See Note I to the Financial Statements. |
| | (h) | Portfolio turnover rate excludes securities received from processing a subscription-in-kind. |
See accompanying Notes to Financial Statements.
| | |
| |
| ASTON/DoubleLine Core Plus Fixed Income Fund – Class N | | April 30, 2013 |
| |
| Financial Highlights | | |
| | | | | | | | | | | | |
| | | Six Months
Ended
04/30/13
(unaudited) | | | Year
Ended
10/31/12 | | | Period
Ended
10/31/11(a) | |
Net Asset Value, Beginning of Period | | $ | 11.10 | | | $ | 10.44 | | | $ | 10.00 | |
| | | | | | | | | | | | |
Income from Investment Operations: | | | | | | | | | | | | |
Net investment income | | | 0.14 | (b) | | | 0.33 | (b) | | | 0.12 | (b) |
Net realized and unrealized gain on investments | | | 0.09 | | | | 0.72 | | | | 0.41 | |
| | | | | | | | | | | | |
Total from investment operations | | | 0.23 | | | | 1.05 | | | | 0.53 | |
| | | | | | | | | | | | |
Less Distributions: | | | | | | | | | | | | |
Distributions from and in excess of net investment income | | | (0.17 | ) | | | (0.37 | ) | | | (0.09 | ) |
Distributions from net realized gain on investments | | | (0.06 | ) | | | (0.02 | ) | | | — | |
| | | | | | | | | | | | |
Total distributions | | | (0.23 | ) | | | (0.39 | ) | | | (0.09 | ) |
| | | | | | | | | | | | |
Net increase in net asset value | | | — | | | | 0.66 | | | | 0.44 | |
| | | | | | | | | | | | |
Net Asset Value, End of Period | | $ | 11.10 | | | $ | 11.10 | | | $ | 10.44 | |
| | | | | | | | | | | | |
Total Return (c) | | | 2.12 | %(d) | | | 10.25 | % | | | 5.33 | %(d) |
| | | |
Ratios/Supplemental Data: | | | | | | | | | | | | |
Net Assets, End of Period (in 000’s) | | $ | 95,786 | | | $ | 71,546 | | | $ | 22,657 | |
Ratios of expenses to average net assets: | | | | | | | | | | | | |
Before expense reimbursement and/or fee waiver by Adviser | | | 1.02 | %(e) | | | 1.35 | % | | | 3.16 | %(e) |
After expense reimbursement and/or fee waiver by Adviser | | | 0.94 | %(e) | | | 0.94 | % | | | 0.94 | %(e) |
Ratios of net investment income to average net assets: | | | | | | | | | | | | |
Before expense reimbursement and/or fee waiver by Adviser | | | 2.41 | %(e) | | | 2.59 | % | | | 1.63 | %(e) |
After expense reimbursement and/or fee waiver by Adviser | | | 2.49 | %(e) | | | 3.01 | % | | | 3.85 | %(e) |
Portfolio Turnover | | | 52.97 | %(d) | | | 118.67 | % | | | 38.49 | %(d) |
| | (a) | DoubleLine Core Plus Fixed Income Fund began issuing Class N shares on July 15, 2011. |
| | (b) | The selected per share data was calculated using the weighted average shares outstanding method for the period. |
| | (c) | The total return is calculated using the Net Asset Value used for trading at the close of business at period end. |
See accompanying Notes to Financial Statements.
| | |
| |
| ASTON/DoubleLine Core Plus Fixed Income Fund – Class I | | April 30, 2013 |
| |
| Financial Highlights | | |
| | | | | | | | | | | | |
| | | Six Months
Ended
04/30/13
(unaudited) | | | Year
Ended
10/31/12 | | | Period
Ended
10/31/11(a) | |
Net Asset Value, Beginning of Period | | $ | 11.10 | | | $ | 10.44 | | | $ | 10.00 | |
| | | | | | | | | | | | |
Income from Investment Operations: | | | | | | | | | | | | |
Net investment income | | | 0.15 | (b) | | | 0.35 | (b) | | | 0.13 | (b) |
Net realized and unrealized gain on investments | | | 0.10 | | | | 0.73 | | | | 0.41 | |
| | | | | | | | | | | | |
Total from investment operations | | | 0.25 | | | | 1.08 | | | | 0.54 | |
| | | | | | | | | | | | |
Less Distributions: | | | | | | | | | | | | |
Distributions from and in excess of net investment income | | | (0.19 | ) | | | (0.40 | ) | | | (0.10 | ) |
Distributions from net realized gain on investments | | | (0.06 | ) | | | (0.02 | ) | | | — | |
| | | | | | | | | | | | |
Total distributions | | | (0.25 | ) | | | (0.42 | ) | | | (0.10 | ) |
| | | | | | | | | | | | |
Net increase in net asset value | | | — | | | | 0.66 | | | | 0.44 | |
| | | | | | | | | | | | |
Net Asset Value, End of Period | | $ | 11.10 | | | $ | 11.10 | | | $ | 10.44 | |
| | | | | | | | | | | | |
Total Return (c) | | | 2.24 | %(d) | | | 10.52 | % | | | 5.38 | %(d) |
| | | |
Ratios/Supplemental Data: | | | | | | | | | | | | |
Net Assets, End of Period (in 000’s) | | $ | 135,460 | | | $ | 105,335 | | | $ | 4,486 | |
Ratios of expenses to average net assets: | | | | | | | | | | | | |
Before expense reimbursement and/or fee waiver by Adviser | | | 0.77 | %(e) | | | 1.10 | % | | | 2.91 | %(e) |
After expense reimbursement and/or fee waiver by Adviser | | | 0.69 | %(e) | | | 0.69 | % | | | 0.69 | %(e) |
Ratios of net investment income to average net assets: | | | | | | | | | | | | |
Before expense reimbursement and/or fee waiver by Adviser | | | 2.66 | %(e) | | | 2.84 | % | | | 1.88 | %(e) |
After expense reimbursement and/or fee waiver by Adviser | | | 2.74 | %(e) | | | 3.26 | % | | | 4.10 | %(e) |
Portfolio Turnover | | | 52.97 | %(d) | | | 118.67 | % | | | 38.49 | %(d) |
| | (a) | DoubleLine Core Plus Fixed Income Fund began issuing Class I shares on July 15, 2011. |
| | (b) | The selected per share data was calculated using the weighted average shares outstanding method for the period. |
| | (c) | The total return is calculated using the Net Asset Value used for trading at the close of business at period end. |
See accompanying Notes to Financial Statements.
| | |
| |
| ASTON/TCH Fixed Income Fund – Class N | | April 30, 2013 |
| |
| Financial Highlights | | |
| | | | | | | | | | | | | | | | | | | | | | | | |
| | | Six Months
Ended
04/30/13
(unaudited) | | | Year
Ended
10/31/12 | | | Year
Ended
10/31/11 | | | Year
Ended
10/31/10 | | | Year
Ended
10/31/09 | | | Year
Ended
10/31/08 | |
Net Asset Value, Beginning of Period | | $ | 11.11 | | | $ | 10.59 | | | $ | 10.49 | | | $ | 10.02 | | | $ | 8.60 | | | $ | 9.73 | |
| | | | | | | | | | | | | | | | | | | | | | | | |
Income from Investment Operations: | | | | | | | | | | | | | | | | | | | | | | | | |
Net investment income | | | 0.19 | | | | 0.45 | (a) | | | 0.47 | (a) | | | 0.50 | (a) | | | 0.49 | (a) | | | 0.47 | |
Net realized and unrealized gain (loss)
on investments | | | 0.08 | | | | 0.56 | | | | 0.10 | | | | 0.47 | | | | 1.44 | | | | (1.10 | ) |
| | | | | | | | | | | | | | | | | | | | | | | | |
Total from investment operations | | | 0.27 | | | | 1.01 | | | | 0.57 | | | | 0.97 | | | | 1.93 | | | | (0.63 | ) |
| | | | | | | | | | | | | | | | | | | | | | | | |
Less Distributions: | | | | | | | | | | | | | | | | | | | | | | | | |
Distributions from and in excess of net
investment income | | | (0.22 | ) | | | (0.49 | ) | | | (0.47 | ) | | | (0.50 | ) | | | (0.51 | ) | | | (0.50 | ) |
| | | | | | | | | | | | | | | | | | | | | | | | |
Total distributions | | | (0.22 | ) | | | (0.49 | ) | | | (0.47 | ) | | | (0.50 | ) | | | (0.51 | ) | | | (0.50 | ) |
| | | | | | | | | | | | | | | | | | | | | | | | |
Net increase (decrease) in net asset value | | | 0.05 | | | | 0.52 | | | | 0.10 | | | | 0.47 | | | | 1.42 | | | | (1.13 | ) |
| | | | | | | | | | | | | | | | | | | | | | | | |
Net Asset Value, End of Period | | $ | 11.16 | | | $ | 11.11 | | | $ | 10.59 | | | $ | 10.49 | | | $ | 10.02 | | | $ | 8.60 | |
| | | | | | | | | | | | | | | | | | | | | | | | |
Total Return (b) | | | 2.50 | %(c) | | | 9.74 | % | | | 5.62 | % | | | 9.98 | % | | | 22.99 | % | | | (6.89 | )% |
| | | | | | |
Ratios/Supplemental Data: | | | | | | | | | | | | | | | | | | | | | | | | |
Net Assets, End of Period (in 000’s) | | $ | 59,537 | | | $ | 59,772 | | | $ | 62,346 | | | $ | 46,274 | | | $ | 47,008 | | | $ | 42,765 | |
Ratios of expenses to average net assets: | | | | | | | | | | | | | | | | | | | | | | | | |
Before expense reimbursement and/or fee
waiver by Adviser | | | 1.01 | %(d) | | | 1.02 | % | | | 1.14 | % | | | 0.98 | % | | | 0.96 | % | | | 1.06 | % |
After expense reimbursement and/or fee
waiver by Adviser | | | 0.84 | %(d) | | | 0.86 | % | | | 0.88 | %(e) | | | 0.62 | % | | | 0.61 | % | | | 0.65 | %(e) |
Ratios of net investment income
to average net assets: | | | | | | | | | | | | | | | | | | | | | | | | |
Before expense reimbursement and/or fee
waiver by Adviser | | | 3.33 | %(d) | | | 4.03 | % | | | 4.20 | % | | | 4.51 | % | | | 4.93 | % | | | 4.59 | % |
After expense reimbursement and/or fee
waiver by Adviser | | | 3.50 | %(d) | | | 4.19 | % | | | 4.46 | % | | | 4.87 | % | | | 5.28 | % | | | 5.00 | % |
Portfolio Turnover | | | 25.00 | %(c) | | | 57.43 | % | | | 37.51 | % | | | 23.92 | % | | | 40.81 | % | | | 78.39 | % |
| | (a) | The selected per share data was calculated using the weighted average shares outstanding method for the period. |
| | (b) | The total return is calculated using the Net Asset Value used for trading at the close of business at period end. |
| | (e) | The Adviser’s contractual expense limitation, which affects the net expense ratio, was changed from 0.74% to 0.64% on September 1, 2007. Subsequently, on October 1, 2008, the Adviser’s contractual expense limitation changed from 0.64% to 0.74%. Subsequently, on March 1, 2011, the Adviser’s contractual expense limitation changed from 0.74% to 0.94%. The contractual expense limitation excludes interest, taxes, investment-related costs (such as brokerage commissions), extraordinary expenses and acquired fund fees and expenses. |
See accompanying Notes to Financial Statements.
| | |
| |
| ASTON/TCH Fixed Income Fund – Class I | | April 30, 2013 |
| |
| Financial Highlights | | |
| | | | | | | | | | | | | | | | | | | | | | | | |
| | | Six Months
Ended
04/30/13
(unaudited) | | | Year
Ended
10/31/12 | | | Year
Ended
10/31/11 | | | Year
Ended
10/31/10 | | | Year
Ended
10/31/09 | | | Year
Ended
10/31/08 | |
Net Asset Value, Beginning of Period | | $ | 11.11 | | | $ | 10.59 | | | $ | 10.49 | | | $ | 10.02 | | | $ | 8.60 | | | $ | 9.73 | |
| | | | | | | | | | | | | | | | | | | | | | | | |
Income from Investment Operations: | | | | | | | | | | | | | | | | | | | | | | | | |
Net investment income | | | 0.20 | | | | 0.47 | (a) | | | 0.49 | (a) | | | 0.51 | (a) | | | 0.50 | (a) | | | 0.48 | |
Net realized and unrealized gain (loss)
on investments | | | 0.08 | | | | 0.55 | | | | 0.11 | | | | 0.48 | | | | 1.44 | | | | (1.09 | ) |
| | | | | | | | | | | | | | | | | | | | | | | | |
Total from investment operations | | | 0.28 | | | | 1.02 | | | | 0.60 | | | | 0.99 | | | | 1.94 | | | | (0.61 | ) |
| | | | | | | | | | | | | | | | | | | | | | | | |
Less Distributions: | | | | | | | | | | | | | | | | | | | | | | | | |
Distributions from and in excess of net
investment income | | | (0.23 | ) | | | (0.50 | ) | | | (0.50 | ) | | | (0.52 | ) | | | (0.52 | ) | | | (0.52 | ) |
| | | | | | | | | | | | | | | | | | | | | | | | |
Total distributions | | | (0.23 | ) | | | (0.50 | ) | | | (0.50 | ) | | | (0.52 | ) | | | (0.52 | ) | | | (0.52 | ) |
| | | | | | | | | | | | | | | | | | | | | | | | |
Net increase (decrease) in net asset value . | | | 0.05 | | | | 0.52 | | | | 0.10 | | | | 0.47 | | | | 1.42 | | | | (1.13 | ) |
| | | | | | | | | | | | | | | | | | | | | | | | |
Net Asset Value, End of Period | | $ | 11.16 | | | $ | 11.11 | | | $ | 10.59 | | | $ | 10.49 | | | $ | 10.02 | | | $ | 8.60 | |
| | | | | | | | | | | | | | | | | | | | | | | | |
Total Return (b) | | | 2.58 | %(c) | | | 9.93 | % | | | 5.89 | % | | | 10.11 | % | | | 23.14 | % | | | (6.65 | )% |
| | | | | | |
Ratios/Supplemental Data: | | | | | | | | | | | | | | | | | | | | | | | | |
Net Assets, End of Period (in 000’s) | | $ | 10,234 | | | $ | 10,396 | | | $ | 10,423 | | | $ | 14,881 | | | $ | 20,276 | | | $ | 25,891 | |
Ratios of expenses to average net assets: | | | | | | | | | | | | | | | | | | | | | | | | |
Before expense reimbursement and/or fee
waiver by Adviser | | | 0.86 | %(d) | | | 0.85 | % | | | 0.89 | % | | | 0.85 | % | | | 0.84 | % | | | 0.81 | % |
After expense reimbursement and/or fee
waiver by Adviser | | | 0.69 | %(d) | | | 0.69 | % | | | 0.63 | %(e) | | | 0.49 | % | | | 0.49 | % | | | 0.40 | %(e) |
Ratios of net investment income
to average net assets: | | | | | | | | | | | | | | | | | | | | | | | | |
Before expense reimbursement and/or fee
waiver by Adviser | | | 3.48 | %(d) | | | 4.20 | % | | | 4.45 | % | | | 4.64 | % | | | 5.05 | % | | | 4.84 | % |
After expense reimbursement and/or fee
waiver by Adviser | | | 3.65 | %(d) | | | 4.36 | % | | | 4.71 | % | | | 5.00 | % | | | 5.40 | % | | | 5.25 | % |
Portfolio Turnover | | | 25.00 | %(c) | | | 57.43 | % | | | 37.51 | % | | | 23.92 | % | | | 40.81 | % | | | 78.39 | % |
| | (a) | The selected per share data was calculated using the weighted average shares outstanding method for the period. |
| | (b) | The total return is calculated using the Net Asset Value used for trading at the close of business at period end. |
| | (e) | The Adviser’s contractual expense limitation, which affects the net expense ratio, was changed from 0.49% to 0.39% on September 1, 2007. Subsequently, on October 1, 2008, the Adviser’s contractual expense limitation changed from 0.39% to 0.49%. Subsequently, on March 1, 2011, the Adviser’s contractual expense limitation changed from 0.49% to 0.69%. The contractual expense limitation excludes interest, taxes, investment-related costs (such as brokerage commissions), extraordinary expenses and acquired fund fees and expenses. |
See accompanying Notes to Financial Statements.
| | |
| |
| ASTON/Lake Partners LASSO Alternatives Fund – Class N | | April 30, 2013 |
| |
| Financial Highlights | | |
| | | | | | | | | | | | | | | | |
| | | Six Months
Ended
04/30/13
(unaudited) | | | Year
Ended
10/31/12 | | | Year
Ended
10/31/11 | | | Period
Ended
10/31/10(a) | |
Net Asset Value, Beginning of Period | | $ | 12.39 | | | $ | 11.94 | | | $ | 11.97 | | | $ | 11.48 | |
| | | | | | | | | | | | | | | | |
Income from Investment Operations: | | | | | | | | | | | | | | | | |
Net investment income (loss) | | | 0.03 | (b) | | | 0.04 | (b) | | | (0.01 | )(b) | | | 0.04 | (b) |
Net realized and unrealized gain on investments | | | 0.84 | | | | 0.59 | | | | 0.13 | | | | 0.45 | |
| | | | | | | | | | | | | | | | |
Total from investment operations | | | 0.87 | | | | 0.63 | | | | 0.12 | | | | 0.49 | |
| | | | | | | | | | �� | | | | | | |
Less Distributions: | | | | | | | | | | | | | | | | |
Distributions from and in excess of net investment income | | | (0.16 | ) | | | (0.18 | ) | | | (0.08 | ) | | | — | |
Distributions from capital gains | | | — | | | | — | | | | (0.07 | ) | | | — | |
| | | | | | | | | | | | | | | | |
Total distributions | | | (0.16 | ) | | | (0.18 | ) | | | (0.15 | ) | | | — | |
| | | | | | | | | | | | | | | | |
Net increase (decrease) in net asset value | | | 0.71 | | | | 0.45 | | | | (0.03 | ) | | | 0.49 | |
| | | | | | | | | | | | | | | | |
Net Asset Value, End of Period | | $ | 13.10 | | | $ | 12.39 | | | $ | 11.94 | | | $ | 11.97 | |
| | | | | | | | | | | | | | | | |
Total Return (c) | | | 7.09 | %(d) | | | 5.34 | % | | | 0.92 | % | | | 4.27 | %(d) |
| | | | |
Ratios/Supplemental Data: | | | | | | | | | | | | | | | | |
Net Assets, End of Period (in 000’s) | | $ | 42,220 | | | $ | 33,719 | | | $ | 17,626 | | | $ | 8,296 | |
Ratios of expenses to average net assets: | | | | | | | | | | | | | | | | |
Before earnings credit, expense reimbursement and/or fee waiver, or recoupment by the Adviser (e) | | | 1.42 | %(f)(i) | | | 1.41 | %(g)(i) | | | 1.53 | % | | | 2.19 | %(f) |
After earnings credit, expense reimbursement and/or fee waiver, or recoupment by the Adviser (e) | | | 1.45 | %(f)(i) | | | 1.45 | %(g)(i) | | | 1.45 | % | | | 1.45 | %(f)(h) |
Ratios of net investment income (loss) to average net assets: | | | | | | | | | | | | | | | | |
Before earnings credit, expense reimbursement and/or fee waiver, or recoupment by the Adviser | | | 0.44 | %(f) | | | 0.36 | %(g) | | | (0.17 | )% | | | (0.25 | )%(f) |
After earnings credit, expense reimbursement and/or fee waiver, or recoupment by the Adviser | | | 0.40 | %(f) | | | 0.32 | %(g) | | | (0.10 | )% | | | 0.49 | %(f) |
Portfolio Turnover | | | 18.76 | %(d) | | | 45.60 | % | | | 79.77 | % | | | 116.68 | % |
| | (a) | Lake Partners LASSO Alternatives Fund began issuing Class N shares on March 2, 2010. |
| | (b) | The selected per share data was calculated using the weighted average shares outstanding method for the period. |
| | (c) | The total return is calculated using the Net Asset Value used for trading at the close of business at period end. |
| | (e) | Does not include expenses of the underlying funds in which the Fund invests. |
| | (g) | Ratios of expenses and net investment income to average net assets include advisory fee waiver of less than 0.005% for the year ended October 31, 2012. |
| | (h) | Effective March 30, 2010, the contractual expense limitation was decreased from 1.60% to 1.45% excluding interest, taxes, investment-related costs (such as brokerage commissions), extraordinary expenses and acquired fund fees and expenses. |
| | (i) | Ratios of expenses to average net assets includes Earnings Credits of less than 0.005% for the six months ended April 30, 2013 and the year ended October 31, 2012, which is not included in the contractual expense limitation. See Note I to the Financial Statements. |
See accompanying Notes to Financial Statements.
| | |
| |
| ASTON/Lake Partners LASSO Alternatives Fund – Class I | | April 30, 2013 |
| |
| Financial Highlights | | |
| | | | | | | | | | | | | | | | | | | | |
| | | Six Months
Ended
04/30/13
(unaudited) | | | Year
Ended
10/31/12 | | | Year
Ended
10/31/11 | | | Year
Ended
10/31/10 | | | Period
Ended
10/31/09(a) | |
| | | | | | | | | | | | | | | | | | | | |
Net Asset Value, Beginning of Period | | $ | 12.42 | | | $ | 11.97 | | | $ | 11.98 | | | $ | 11.15 | | | $ | 10.00 | |
| | | | | | | | | | | | | | | | | | | | |
Income from Investment Operations: | | | | | | | | | | | | | | | | | | | | |
Net investment income (loss) | | | 0.04 | (b) | | | 0.07 | (b) | | | 0.02 | (b) | | | 0.08 | (b) | | | (— | )(c) |
Net realized and unrealized gain on investments | | | 0.85 | | | | 0.59 | | | | 0.13 | | | | 0.89 | | | | 1.15 | |
| | | | | | | | | | | | | | | | | | | | |
Total from investment operations | | | 0.89 | | | | 0.66 | | | | 0.15 | | | | 0.97 | | | | 1.15 | |
| | | | | | | | | | | | | | | | | | | | |
Less Distributions: | | | | | | | | | | | | | | | | | | | | |
Distributions from and in excess of net investment income | | | (0.18 | ) | | | (0.21 | ) | | | (0.09 | ) | | | (0.07 | ) | | | — | |
Distributions from net realized gain on investments | | | — | | | | — | | | | (0.07 | ) | | | (0.07 | ) | | | — | |
| | | | | | | | | | | | | | | | | | | | |
Total distributions | | | (0.18 | ) | | | (0.21 | ) | | | (0.16 | ) | | | (0.14 | ) | | | — | |
| | | | | | | | | | | | | | | | | | | | |
Net increase (decrease) in net asset value | | | 0.71 | | | | 0.45 | | | | (0.01 | ) | | | 0.83 | | | | 1.15 | |
| | | | | | | | | | | | | | | | | | | | |
Net Asset Value, End of Period | | $ | 13.13 | | | $ | 12.42 | | | $ | 11.97 | | | $ | 11.98 | | | $ | 11.15 | |
| | | | | | | | | | | | | | | | | | | | |
Total Return (d) | | | 7.26 | %(e) | | | 5.56 | % | | | 1.22 | % | | | 8.74 | % | | | 11.50 | %(e) |
| | | | | |
Ratios/Supplemental Data: | | | | | | | | | | | | | | | | | | | | |
Net Assets, End of Period (in 000’s) | | $ | 328,579 | | | $ | 253,343 | | | $ | 189,999 | | | $ | 19,723 | | | $ | 1,845 | |
Ratios of expenses to average net assets: | | | | | | | | | | | | | | | | | | | | |
Before earnings credit, expense reimbursement and/or fee waiver, or recoupment by the Adviser (f) | | | 1.17 | %(g)(i) | | | 1.16 | %(h)(i) | | | 1.28 | % | | | 2.32 | % | | | 18.16 | %(g) |
After earnings credit, expense reimbursement and/or fee waiver, or recoupment by the Adviser (f) | | | 1.20 | %(g)(i) | | | 1.20 | %(h)(i) | | | 1.20 | % | | | 1.24 | %(j) | | | 1.35 | %(g) |
Ratios of net investment income (loss) to average net assets: | | | | | | | | | | | | | | | | | | | | |
Before earnings credit, expense reimbursement and/or fee waiver, or recoupment by the Adviser | | | 0.69 | %(g) | | | 0.61 | %(h) | | | 0.08 | % | | | (0.41 | )% | | | (16.92 | )%(g) |
After earnings credit, expense reimbursement and/or fee waiver, or recoupment by the Adviser | | | 0.65 | %(g) | | | 0.57 | %(h) | | | 0.15 | % | | | 0.67 | % | | | (0.11 | )%(g) |
Portfolio Turnover | | | 18.76 | %(e) | | | 45.60 | % | | | 79.77 | % | | | 116.68 | % | | | 65.93 | %(e) |
| | (a) | Lake Partners LASSO Alternatives Fund began issuing Class I shares on March 31, 2009. |
| | (b) | The selected per share data was calculated using the weighted average shares outstanding method for the period. |
| | (c) | Represents less than $(0.005) per share. |
| | (d) | The total return is calculated using the Net Asset Value used for trading at the close of business at period end. |
| | (f) | Does not include expenses of the underlying funds in which the Fund invests. |
| | (h) | Ratios of expenses and net investment income to average net assets include advisory fee waiver of less than 0.005% for the year ended October 31, 2012. |
| | (i) | Ratios of expenses to average net assets include Earnings Credits of less than 0.005% for the six months ended April 30, 2013 and the year ended October 31, 2012, which is not included in the contractual expense limitation. See Note I to the Financial Statements. |
| | (j) | Effective March 30, 2010, the contractual expense limitation was decreased from 1.35% to 1.20% excluding interest, taxes, investment-related costs (such as brokerage commissions), extraordinary expenses and acquired fund fees and expenses. |
See accompanying Notes to Financial Statements.
| | |
| |
| ASTON/Anchor Capital Enhanced Equity Fund – Class N | | April 30, 2013 |
| |
| Financial Highlights | | |
| | | | | | | | | | | | | | | | | | | | | | | | |
| | | Six Months
Ended
04/30/13
(unaudited) | | | Year
Ended
10/31/12 | | | Year
Ended
10/31/11 | | | Year
Ended
10/31/10 | | | Year
Ended
10/31/09 | | | Period
Ended
10/31/08(a) | |
| | | | | | | | | | | | | | | | | | | | | | | | |
Net Asset Value, Beginning of Period | | $ | 8.68 | | | $ | 9.61 | | | $ | 9.41 | | | $ | 8.57 | | | $ | 8.09 | | | $ | 10.00 | |
| | | | | | | | | | | | | | | | | | | | | | | | |
Income from Investment Operations: | | | | | | | | | | | | | | | | | | | | | | | | |
Net investment income | | | 0.10 | | | | 0.16 | | | | 0.14 | | | | 0.10 | | | | 0.11 | | | | 0.14 | |
Net realized and unrealized gain (loss)
on investments | | | 0.50 | | | | 0.11 | | | | 0.56 | | | | 0.84 | | | | 1.02 | | | | (1.91 | ) |
| | | | | | | | | | | | | | | | | | | | | | | | |
Total from investment operations | | | 0.60 | | | | 0.27 | | | | 0.70 | | | | 0.94 | | | | 1.13 | | | | (1.77 | ) |
| | | | | | | | | | | | | | | | | | | | | | | | |
Less Distributions: | | | | | | | | | | | | | | | | | | | | | | | | |
Distributions from and in excess of net
investment income | | | (0.10 | ) | | | (0.16 | ) | | | (0.13 | ) | | | (0.10 | ) | | | (0.13 | ) | | | (0.14 | ) |
Distributions from net realized gain
on investments | | | (0.15 | ) | | | (1.04 | ) | | | (0.37 | ) | | | — | | | | (0.52 | ) | | | — | |
| | | | | | | | | | | | | | | | | | | | | | | | |
Total distributions | | | (0.25 | ) | | | (1.20 | ) | | | (0.50 | ) | | | (0.10 | ) | | | (0.65 | ) | | | (0.14 | ) |
| | | | | | | | | | | | | | | | | | | | | | | | |
Net increase (decrease) in net asset value | | | 0.35 | | | | (0.93 | ) | | | 0.20 | | | | 0.84 | | | | 0.48 | | | | (1.91 | ) |
| | | | | | | | | | | | | | | | | | | | | | | | |
Net Asset Value, End of Period | | $ | 9.03 | | | $ | 8.68 | | | $ | 9.61 | | | $ | 9.41 | | | $ | 8.57 | | | $ | 8.09 | |
| | | | | | | | | | | | | | | | | | | | | | | | |
Total Return (b) | | | 7.18 | %(c) | | | 3.12 | % | | | 7.69 | % | | | 11.05 | % | | | 15.86 | % | | | (17.91 | )%(c) |
| | | | | | |
Ratios/Supplemental Data: | | | | | | | | | | | | | | | | | | | | | | | | |
Net Assets, End of Period (in 000’s) | | $ | 87,673 | | | $ | 106,191 | | | $ | 48,365 | | | $ | 46,423 | | | $ | 22,552 | | | $ | 14,389 | |
Ratios of expenses to average net assets: | | | | | | | | | | | | | | | | | | | | | | | | |
Before earnings credit, expense reimbursement and/or fee waiver, or recoupment
by the Adviser | | | 1.22 | %(d)(e) | | | 1.22 | %(e)(f) | | | 1.24 | %(f) | | | 1.37 | % | | | 2.11 | % | | | 2.38 | %(d) |
After earnings credit, expense reimbursement and/or fee waiver, or recoupment
by the Adviser | | | 1.22 | %(d)(e) | | | 1.27 | %(e)(f) | | | 1.33 | %(f) | | | 1.40 | % | | | 1.25 | %(g) | | | 1.10 | %(d) |
Ratios of net investment income to average net assets: | | | | | | | | | | | | | | | | | | | | | | | | |
Before earnings credit, expense reimbursement and/or fee waiver, or recoupment
by the Adviser | | | 2.41 | %(d) | | | 1.82 | % | | | 1.51 | % | | | 1.20 | % | | | 0.55 | % | | | 0.86 | %(d) |
After earnings credit, expense reimbursement and/or fee waiver, or recoupment
by the Adviser | | | 2.41 | %(d) | | | 1.78 | % | | | 1.41 | % | | | 1.17 | % | | | 1.41 | % | | | 2.14 | %(d) |
Portfolio Turnover | | | 32.52 | %(c) | | | 56.33 | % | | | 87.37 | % | | | 41.33 | % | | | 51.56 | % | | | 23.68 | %(c) |
| | (a) | Anchor Capital Enhanced Equity Fund began issuing Class N shares on January 14, 2008. |
| | (b) | The total return is calculated using the Net Asset Value used for trading at the close of business at period end. |
| | (e) | Ratios of expenses to average net assets include Earnings Credits of less than 0.005% for the six months ended April 30, 2013 and the year ended October 31, 2012, which is not included in the contractual expense limitation. See Note I to the Financial Statements. |
| | (f) | Ratios of expenses to average net assets include interest expenses of less than 0.005% for each of the years ended October 31, 2012 and October 31, 2011, which are not included in the contractual expense limitation. The interest expenses are from utilizing the line of credit as discussed in Note H to the Financial Statements. |
| | (g) | Effective June 1, 2009, due to the change in Subadviser, the contractual expense limitation was increased from 1.10% to 1.40% excluding interest, taxes, investment-related costs (such as brokerage commissions), extraordinary expenses and acquired fund fee’s and expenses. |
See accompanying Notes to Financial Statements.
| | |
| |
| ASTON/Anchor Capital Enhanced Equity Fund – Class I | | April 30, 2013 |
| |
| Financial Highlights | | |
| | | | | | | | | | | | | | | | |
| | | Six Months
Ended
04/30/13
(unaudited) | | | Year
Ended
10/31/12 | | | Year
Ended
10/31/11 | | | Period
Ended
10/31/10(a) | |
Net Asset Value, Beginning of Period | | $ | 8.69 | | | $ | 9.62 | | | $ | 9.41 | | | $ | 9.04 | |
| | | | | | | | | | | | | | | | |
Income from Investment Operations: | | | | | | | | | | | | | | | | |
Net investment income | | | 0.12 | | | | 0.18 | | | | 0.16 | | | | 0.09 | |
Net realized and unrealized gain on investments | | | 0.50 | | | | 0.11 | | | | 0.57 | | | | 0.37 | |
| | | | | | | | | | | | | | | | |
Total from investment operations | | | 0.62 | | | | 0.29 | | | | 0.73 | | | | 0.46 | |
| | | | | | | | | | | | | | | | |
Less Distributions: | | | | | | | | | | | | | | | | |
Distributions from and in excess of net investment income | | | (0.12 | ) | | | (0.18 | ) | | | (0.15 | ) | | | (0.09 | ) |
Distributions from net realized gain on investments | | | (0.15 | ) | | | (1.04 | ) | | | (0.37 | ) | | | — | |
| | | | | | | | | | | | | | | | |
Total distributions | | | (0.27 | ) | | | (1.22 | ) | | | (0.52 | ) | | | (0.09 | ) |
| | | | | | | | | | | | | | | | |
Net increase (decrease) in net asset value | | | 0.35 | | | | (0.93 | ) | | | 0.21 | | | | 0.37 | |
| | | | | | | | | | | | | | | | |
Net Asset Value, End of Period | | $ | 9.04 | | | $ | 8.69 | | | $ | 9.62 | | | $ | 9.41 | |
| | | | | | | | | | | | | | | | |
Total Return (b) | | | 7.32 | %(c) | | | 3.46 | % | | | 7.97 | % | | | 5.10 | %(c) |
| | | | |
Ratios/Supplemental Data: | | | | | | | | | | | | | | | | |
Net Assets, End of Period (in 000’s) | | $ | 45,451 | | | $ | 71,618 | | | $ | 64,840 | | | $ | 46,140 | |
Ratios of expenses to average net assets: | | | | | | | | | | | | | | | | |
Before earnings credit, expense reimbursement and/or fee waiver, or recoupment by the Adviser | | | 0.97 | %(d)(e) | | | 0.97 | %(e)(f) | | | 0.99 | %(f) | | | 1.10 | %(d) |
After earnings credit, expense reimbursement and/or fee waiver, or recoupment by the Adviser | | | 0.97 | %(d)(e) | | | 1.02 | %(e)(f) | | | 1.08 | %(f) | | | 1.15 | %(d) |
Ratios of net investment income to average net assets: | | | | | | | | | | | | | | | | |
Before earnings credit, expense reimbursement and/or fee waiver, or recoupment by the Adviser | | | 2.66 | %(d) | | | 2.07 | % | | | 1.76 | % | | | 1.37 | %(d) |
After earnings credit, expense reimbursement and/or fee waiver, or recoupment by the Adviser | | | 2.66 | %(d) | | | 2.03 | % | | | 1.66 | % | | | 1.32 | %(d) |
Portfolio Turnover | | | 32.52 | %(c) | | | 56.33 | % | | | 87.37 | % | | | 41.33 | % |
| | (a) | Anchor Capital Enhanced Equity Fund began issuing Class I shares on March 2, 2010. |
| | (b) | The total return is calculated using the Net Asset Value used for trading at the close of business at period end. |
| | (e) | Ratios of expenses to average net assets include Earnings Credits of less than 0.005% for the six months ended April 30, 2013 and the year ended October 31, 2012, which is not included in the contractual expense limitation. See Note I to the Financial Statements. |
| | (f) | Ratios of expenses to average net assets include interest expenses of less than 0.005% for each of the years ended October 31, 2012 and October 31, 2011, which are not included in the contractual expense limitation. The interest expenses are from utilizing the line of credit as discussed in Note H to the Financial Statements. |
See accompanying Notes to Financial Statements.
| | |
| |
| ASTON/River Road Long-Short Fund – Class N | | April 30, 2013 |
| |
| Financial Highlights | | |
| | | | | | | | | | | | |
| | | Six Months
Ended
04/30/13
(unaudited) | | | Year
Ended
10/31/12 | | | Period
Ended
10/31/11(a) | |
Net Asset Value, Beginning of Period | | $ | 10.73 | | | $ | 9.91 | | | $ | 10.00 | |
| | | | | | | | | | | | |
Income from Investment Operations: | | | | | | | | | | | | |
Net investment loss | | | (0.07 | )(b) | | | (0.18 | ) | | | (0.04 | )(b) |
Net realized and unrealized gain (loss) on investments | | | 1.06 | | | | 1.00 | | | | (0.05 | ) |
| | | | | | | | | | | | |
Total from investment operations | | | 0.99 | | | | 0.82 | | | | (0.09 | ) |
| | | | | | | | | | | | |
Less Distributions: | | | | | | | | | | | | |
Distributions from net realized gain on investments | | | (0.56 | ) | | | — | | | | — | |
| | | | | | | | | | | | |
Total distributions | | | (0.56 | ) | | | — | | | | — | |
| | | | | | | | | | | | |
Net increase (decrease) in net asset value | | | 0.43 | | | | 0.82 | | | | (0.09 | ) |
| | | | | | | | | | | | |
Net Asset Value, End of Period | | $ | 11.16 | | | $ | 10.73 | | | $ | 9.91 | |
| | | | | | | | | | | | |
Total Return (c) | | | 9.78 | %(d) | | | 8.17 | % | | | (0.80 | )%(d) |
| | | |
Ratios/Supplemental Data: | | | | | | | | | | | | |
Net Assets, End of Period (in 000’s) | | $ | 19,061 | | | $ | 7,506 | | | $ | 4,594 | |
Ratios of expenses to average net assets: | | | | | | | | | | | | |
Before expense reimbursement and/or fee waiver by Adviser, including interest and
dividend expense for securities sold short | | | 3.26 | %(e) | | | 5.03 | % | | | 8.68 | %(e) |
After expense reimbursement and/or fee waiver by Adviser, including interest and
dividend expense for securities sold short | | | 2.56 | %(e) | | | 3.11 | % | | | 2.72 | %(e) |
After expense reimbursement and/or fee waiver by Adviser, excluding interest and
dividend expense for securities sold short | | | 1.70 | %(e) | | | 1.70 | % | | | 1.70 | %(e) |
Ratios of net investment loss to average net assets: | | | | | | | | | | | | |
Before expense reimbursement and/or fee waiver by Adviser | | | (1.91 | )%(e) | | | (3.63 | )% | | | (6.80 | )%(e) |
After expense reimbursement and/or fee waiver by Adviser | | | (1.21 | )%(e) | | | (1.71 | )% | | | (0.84 | )%(e) |
Portfolio Turnover | | | 157.87 | %(d) | | | 277.72 | % | | | 127.32 | %(d) |
| | (a) | River Road Long-Short Fund began issuing Class N shares on May 3, 2011. |
| | (b) | The selected per share data was calculated using the weighted average shares outstanding method for the period. |
| | (c) | The total return is calculated using the Net Asset Value used for trading at the close of business at period end. |
See accompanying Notes to Financial Statements.
| | |
| |
| ASTON/River Road Long-Short Fund – Class I | | April 30, 2013 |
| |
| Financial Highlights | | |
| | | | |
| | | Period
Ended
04/30/13(a)
(unaudited) | |
Net Asset Value, Beginning of Period | | $ | 10.96 | |
| | | | |
Income from Investment Operations: | | | | |
Net investment loss | | | (0.04 | )(b) |
Net realized and unrealized gain on investments | | | 0.25 | |
| | | | |
Total from investment operations | | | 0.21 | |
| | | | |
Net increase in net asset value | | | 0.21 | |
| | | | |
Net Asset Value, End of Period | | $ | 11.17 | |
| | | | |
Total Return (c) | | | 1.92 | %(d) |
| |
Ratios/Supplemental Data: | | | | |
Net Assets, End of Period (in 000’s) | | $ | 7,056 | |
Ratios of expenses to average net assets: | | | | |
Before expense reimbursement and/or fee waiver by Adviser, including interest and
dividend expense for securities sold short | | | 2.74 | %(e) |
After expense reimbursement and/or fee waiver by Adviser, including interest and
dividend expense for securities sold short | | | 2.23 | %(e) |
After expense reimbursement and/or fee waiver by Adviser, excluding interest and
dividend expense for securities sold short | | | 1.45 | %(e) |
Ratios of net investment loss to average net assets: | | | | |
Before expense reimbursement and/or fee waiver by Adviser | | | (2.52 | )%(e) |
After expense reimbursement and/or fee waiver by Adviser | | | (2.01 | )%(e) |
Portfolio Turnover | | | 157.87 | %(d) |
| | (a) | River Road Long-Short Fund began issuing Class I shares on March 1, 2013. |
| | (b) | The selected per share data was calculated using the weighted average shares outstanding method for the period. |
| | (c) | The total return is calculated using the Net Asset Value used for trading at the close of business at period end. |
See accompanying Notes to Financial Statements.
| | |
| |
| ASTON/Barings International Fund – Class N | | April 30, 2013 |
| |
| Financial Highlights | | |
| | | | | | | | | | | | | | | | |
| | | Six Months
Ended
04/30/13
(unaudited) | | | Year
Ended
10/31/12 | | | Year
Ended
10/31/11 | | | Period
Ended
10/31/10(a) | |
Net Asset Value, Beginning of Period | | $ | 6.87 | | | $ | 6.81 | | | $ | 7.24 | | | $ | 6.48 | |
| | | | | | | | | | | | | | | | |
Income from Investment Operations: | | | | | | | | | | | | | | | | |
Net investment income | | | 0.05 | | | | 0.10 | (b) | | | 0.07 | (b) | | | 0.06 | (b) |
Net realized and unrealized gain (loss) on investments | | | 0.50 | | | | 0.17 | | | | (0.37 | ) | | | 0.70 | |
| | | | | | | | | | | | | | | | |
Total from investment operations | | | 0.55 | | | | 0.27 | | | | (0.30 | ) | | | 0.76 | |
| | | | | | | | | | | | | | | | |
Less Distributions: | | | | | | | | | | | | | | | | |
Distributions from and in excess of net investment income | | | (0.09 | ) | | | (0.04 | ) | | | (0.13 | ) | | | — | |
Distributions from net realized gain on investments | | | (0.08 | ) | | | (0.17 | ) | | | — | | | | — | |
| | | | | | | | | | | | | | | | |
Total distributions | | | (0.17 | ) | | | (0.21 | ) | | | (0.13 | ) | | | — | |
| | | | | | | | | | | | | | | | |
Net increase (decrease) in net asset value | | | 0.38 | | | | 0.06 | | | | (0.43 | ) | | | 0.76 | |
| | | | | | | | | | | | | | | | |
Net Asset Value, End of Period | | $ | 7.25 | | | $ | 6.87 | | | $ | 6.81 | | | $ | 7.24 | |
| | | | | | | | | | | | | | | | |
Total Return (c) | | | 8.27 | %(d) | | | 4.28 | % | | | (4.22 | )% | | | 11.73 | %(d) |
| | | | |
Ratios/Supplemental Data: | | | | | | | | | | | | | | | | |
Net Assets, End of Period (in 000’s) | | $ | 456 | | | $ | 421 | | | $ | 393 | | | $ | 184 | |
Ratios of expenses to average net assets: | | | | | | | | | | | | | | | | |
Before expense reimbursement and/or fee waiver by Adviser | | | 1.59 | %(e) | | | 1.60 | % | | | 1.68 | %(f) | | | 1.72 | %(e) |
After expense reimbursement and/or fee waiver by Adviser | | | 1.40 | %(e) | | | 1.40 | % | | | 1.40 | %(f) | | | 1.40 | %(e) |
Ratios of net investment income to average net assets: | | | | | | | | | | | | | | | | |
Before expense reimbursement and/or fee waiver by Adviser | | | 1.23 | %(e) | | | 1.30 | % | | | 0.76 | %(f) | | | 1.07 | %(e) |
After expense reimbursement and/or fee waiver by Adviser | | | 1.42 | %(e) | | | 1.50 | % | | | 1.04 | %(f) | | | 1.39 | %(e) |
Portfolio Turnover | | | 30.21 | %(d) | | | 33.48 | % | | | 58.96 | % | | | 65.32 | % |
| | (a) | Barings International Fund began issuing Class N shares on March 2, 2010. |
| | (b) | The selected per share data was calculated using the weighted average shares outstanding method for the period. |
| | (c) | The total return is calculated using the Net Asset Value used for trading at the close of business at period end. |
| | (f) | For the period November 1, 2010 through February 28, 2011, the Adviser voluntarily waived management fees and/or reimbursed expenses at 1.40%. Effective March 1, 2011, the contractual expense limitation was decreased from 1.50% to 1.40% excluding interest, taxes, investment-related costs (such as brokerage commissions), extraordinary expenses and acquired fund fees and expenses. |
See accompanying Notes to Financial Statements.
| | |
| |
| ASTON/Barings International Fund – Class I | | April 30, 2013 |
| |
| Financial Highlights | | |
| | | | | | | | | | | | | | | | | | | | | | | | |
| | | Six Months
Ended
04/30/13
(unaudited) | | | Year
Ended
10/31/12 | | | Year
Ended
10/31/11 | | | Year
Ended
10/31/10 | | | Year
Ended
10/31/09 | | | Period
Ended
10/31/08(a) | |
| | | | | | | | | | | | | | | | | | | | | | | | |
Net Asset Value, Beginning of Period | | $ | 6.89 | | | $ | 6.82 | | | $ | 7.26 | | | $ | 6.44 | | | $ | 5.08 | | | $ | 10.00 | |
| | | | | | | | | | | | | | | | | | | | | | | | |
Income from Investment Operations: | | | | | | | | | | | | | | | | | | | | | | | | |
Net investment income | | | 0.06 | | | | 0.12 | (b) | | | 0.09 | (b) | | | 0.06 | (b) | | | 0.10 | (b) | | | 0.10 | |
Net realized and unrealized gain (loss)
on investments | | | 0.49 | | | | 0.18 | | | | (0.38 | ) | | | 0.78 | | | | 1.27 | (c) | | | (5.02 | ) |
| | | | | | | | | | | | | | | | | | | | | | | | |
Total from investment operations | | | 0.55 | | | | 0.30 | | | | (0.29 | ) | | | 0.84 | | | | 1.37 | | | | (4.92 | ) |
| | | | | | | | | | | | | | | | | | | | | | | | |
Less Distributions: | | | | | | | | | | | | | | | | | | | | | | | | |
Distributions from and in excess of net
investment income | | | (0.11 | ) | | | (0.06 | ) | | | (0.15 | ) | | | (0.02 | ) | | | (0.01 | ) | | | — | |
Distributions from net realized gain
on investments | | | (0.08 | ) | | | (0.17 | ) | | | — | | | | — | | | | — | | | | — | |
| | | | | | | | | | | | | | | | | | | | | | | | |
Total distributions | | | (0.19 | ) | | | (0.23 | ) | | | (0.15 | ) | | | (0.02 | ) | | | (0.01 | ) | | | — | |
| | | | | | | | | | | | | | | | | | | | | | | | |
Net increase (decrease) in net asset value | | | 0.36 | | | | 0.07 | | | | (0.44 | ) | | | 0.82 | | | | 1.36 | | | | (4.92 | ) |
| | | | | | | | | | | | | | | | | | | | | | | | |
Net Asset Value, End of Period | | $ | 7.25 | | | $ | 6.89 | | | $ | 6.82 | | | $ | 7.26 | | | $ | 6.44 | | | $ | 5.08 | |
| | | | | | | | | | | | | | | | | | | | | | | | |
Total Return (d) | | | 8.21 | %(e) | | | 4.72 | % | | | (4.09 | )% | | | 12.89 | % | | | 27.11 | % | | | (49.20 | )%(e) |
| | | | | | |
Ratios/Supplemental Data: | | | | | | | | | | | | | | | | | | | | | | | | |
Net Assets, End of Period (in 000’s) | | $ | 67,494 | | | $ | 61,662 | | | $ | 52,390 | | | $ | 47,985 | | | $ | 28,277 | | | $ | 5,517 | |
Ratios of expenses to average net assets: | | | | | | | | | | | | | | | | | | | | | | | | |
Before expense reimbursement and/or fee
waiver by Adviser | | | 1.34 | %(f) | | | 1.35 | % | | | 1.43 | %(g) | | | 1.47 | % | | | 2.01 | % | | | 3.95 | %(f)(h) |
After expense reimbursement and/or fee
waiver by Adviser | | | 1.15 | %(f) | | | 1.15 | % | | | 1.15 | %(g) | | | 1.15 | % | | | 1.15 | % | | | 1.18 | %(f)(h) |
Ratios of net investment income (loss)
to average net assets: | | | | | | | | | | | | | | | | | | | | | | | | |
Before expense reimbursement and/or fee
waiver by Adviser | | | 1.48 | %(f) | | | 1.55 | % | | | 1.01 | % | | | 0.63 | % | | | 0.80 | % | | | (1.11 | )%(f) |
After expense reimbursement and/or fee
waiver by Adviser | | | 1.67 | %(f) | | | 1.75 | % | | | 1.29 | % | | | 0.95 | % | | | 1.66 | % | | | 1.66 | %(f) |
Portfolio Turnover | | | 30.21 | %(e) | | | 33.48 | % | | | 58.96 | % | | | 65.32 | % | | | 115.51 | % | | | 121.99 | %(e) |
| | (a) | Barings International Fund began issuing Class I shares on November 1, 2007. |
| | (b) | The selected per share data was calculated using the weighted average shares outstanding method for the period. |
| | (c) | Includes payments by affiliates of less than $0.005 per share. |
| | (d) | The total return is calculated using the Net Asset Value used for trading at the close of business at period end. |
| | (g) | For the period November 1, 2010 through February 28, 2011, the Adviser voluntarily waived management fees and/or reimbursed expenses at 1.15%. Effective March 1, 2011, the contractual expense limitation was decreased from 1.25% to 1.15% excluding interest, taxes, investment-related costs (such as brokerage commissions), extraordinary expenses and acquired fund fees and expenses. |
| | (h) | Ratios of expenses to average net assets include interest expense of less than 0.01% for the period ended October 31, 2008, which is not included in the contractual or voluntary expense limitations. The interest expense is from utilizing the line of credit as discussed in Note H to the Financial Statements. |
See accompanying Notes to Financial Statements.
| | |
| |
| ASTON/LMCG Emerging Markets Fund – Class N | | April 30, 2013 |
| |
| Financial Highlights | | |
| | | | |
| | | Period
Ended
04/30/13(a)
(unaudited) | |
Net Asset Value, Beginning of Period | | $ | 10.00 | |
| | | | |
Income from Investment Operations: | | | | |
Net investment income | | | 0.01 | (b) |
Net realized and unrealized loss on investments | | | (0.03 | ) |
| | | | |
Total from investment operations | | | (0.02 | ) |
| | | | |
Net decrease in net asset value | | | (0.02 | ) |
| | | | |
Net Asset Value, End of Period | | $ | 9.98 | |
| | | | |
Total Return (c) | | | (0.20 | )%(d) |
| |
Ratios/Supplemental Data: | | | | |
Net Assets, End of Period (in 000’s) | | $ | 675 | |
Ratios of expenses to average net assets: | | | | |
Before expense reimbursement and/or fee waiver by Adviser | | | 13.85 | %(e) |
After expense reimbursement and/or fee waiver by Adviser | | | 1.65 | %(e) |
Ratios of net investment income (loss) to average net assets: | | | | |
Before expense reimbursement and/or fee waiver by Adviser | | | (11.35 | )%(e) |
After expense reimbursement and/or fee waiver by Adviser | | | 0.85 | %(e) |
Portfolio Turnover | | | 90.13 | %(d) |
| | (a) | LMCG Emerging Markets Fund began issuing Class N shares on March 27, 2013. |
| | (b) | The selected per share data was calculated using the weighted average shares outstanding method for the period. |
| | (c) | The total return is calculated using the Net Asset Value used for trading at the close of business at period end. |
See accompanying Notes to Financial Statements.
| | |
| |
| ASTON/LMCG Emerging Markets Fund – Class I | | April 30, 2013 |
| |
| Financial Highlights | | |
| | | | |
| | | Period
Ended
04/30/13 (a)
(unaudited) | |
| | | | |
Net Asset Value, Beginning of Period | | $ | 10.00 | |
| | | | |
Income from Investment Operations: | | | | |
Net investment income | | | 0.01 | (b) |
Net realized and unrealized loss on investments | | | (0.03 | ) |
| | | | |
Total from investment operations | | | (0.02 | ) |
| | | | |
Net decrease in net asset value | | | (0.02 | ) |
| | | | |
Net Asset Value, End of Period | | $ | 9.98 | |
| | | | |
Total Return (c) | | | (0.20 | )%(d) |
| |
Ratios/Supplemental Data: | | | | |
Net Assets, End of Period (in 000’s) | | $ | 3,414 | |
Ratios of expenses to average net assets: | | | | |
Before expense reimbursement and/or fee waiver by Adviser | | | 13.60 | %(e) |
After expense reimbursement and/or fee waiver by Adviser | | | 1.40 | %(e) |
Ratios of net investment income (loss) to average net assets: | | | | |
Before expense reimbursement and/or fee waiver by Adviser | | | (11.10 | )%(e) |
After expense reimbursement and/or fee waiver by Adviser | | | 1.10 | %(e) |
Portfolio Turnover | | | 90.13 | %(d) |
| | (a) | LMCG Emerging Markets Fund began issuing Class I shares on March 27, 2013. |
| | (b) | The selected per share data was calculated using the weighted average shares outstanding method for the period. |
| | (c) | The total return is calculated using the Net Asset Value used for trading at the close of business at period end. |
See accompanying Notes to Financial Statements.
| | |
| |
| ASTON/Harrison Street Real Estate Fund – Class N | | April 30, 2013 |
| |
| Financial Highlights | | |
| | | | | | | | | | | | | | | | | | | | | | | | |
| | | Six Months
Ended
04/30/13
(unaudited) | | | Year
Ended
10/31/12 | | | Year
Ended
10/31/11 | | | Year
Ended
10/31/10 | | | Year
Ended
10/31/09 | | | Year
Ended
10/31/08 | |
| | | | | | | | | | | | | | | | | | | | | | | | |
Net Asset Value, Beginning of Period | | $ | 10.49 | | | $ | 8.97 | | | $ | 8.16 | | | $ | 5.77 | | | $ | 6.08 | | | $ | 15.59 | |
| | | | | | | | | | | | | | | | | | | | | | | | |
Income from Investment Operations: | | | | | | | | | | | | | | | | | | | | | | | | |
Net investment income | | | 0.07 | (a) | | | 0.15 | (a) | | | 0.15 | (a) | | | 0.14 | (a) | | | 0.15 | (a) | | | 0.07 | (a) |
Net realized and unrealized gain (loss)
on investments | | | 1.78 | | | | 1.44 | | | | 0.79 | | | | 2.36 | | | | (0.28 | ) | | | (5.50 | ) |
| | | | | | | | | | | | | | | | | | | | | | | | |
Total from investment operations | | | 1.85 | | | | 1.59 | | | | 0.94 | | | | 2.50 | | | | (0.13 | ) | | | (5.43 | ) |
| | | | | | | | | | | | | | | | | | | | | | | | |
Less Distributions: | | | | | | | | | | | | | | | | | | | | | | | | |
Distributions from and in excess of net
investment income | | | (0.16 | ) | | | (0.07 | ) | | | (0.13 | ) | | | (0.11 | ) | | | (0.18 | ) | | | (0.09 | ) |
Distributions from net realized gain
on investments | | | — | | | | — | | | | — | | | | — | | | | — | | | | (3.99 | ) |
| | | | | | | | | | | | | | | | | | | | | | | | |
Total distributions | | | (0.16 | ) | | | (0.07 | ) | | | (0.13 | ) | | | (0.11 | ) | | | (0.18 | ) | | | (4.08 | ) |
| | | | | | | | | | | | | | | | | | | | | | | | |
Net increase (decrease) in net asset value . | | | 1.69 | | | | 1.52 | | | | 0.81 | | | | 2.39 | | | | (0.31 | ) | | | (9.51 | ) |
| | | | | | | | | | | | | | | | | | | | | | | | |
Net Asset Value, End of Period | | $ | 12.18 | | | $ | 10.49 | | | $ | 8.97 | | | $ | 8.16 | | | $ | 5.77 | | | $ | 6.08 | |
| | | | | | | | | | | | | | | | | | | | | | | | |
Total Return (b) | | | 17.82 | %(c) | | | 17.85 | % | | | 11.66 | % | | | 43.77 | % | | | (1.44 | )% | | | (43.76 | )% |
| | | | | | |
Ratios/Supplemental Data: | | | | | | | | | | | | | | | | | | | | | | | | |
Net Assets, End of Period (in 000’s) | | $ | 12,541 | | | $ | 10,381 | | | $ | 6,287 | | | $ | 6,158 | | | $ | 4,011 | | | $ | 6,030 | |
Ratios of expenses to average net assets: | | | | | | | | | | | | | | | | | | | | | | | | |
Before expense reimbursement and/or fee
waiver by Adviser | | | 2.34 | %(d) | | | 2.36 | % | | | 1.61 | %(e) | | | 1.68 | %(e) | | | 1.94 | % | | | 1.57 | %(e) |
After expense reimbursement and/or fee
waiver by Adviser | | | 1.37 | %(d) | | | 1.37 | % | | | 1.29 | %(e) | | | 1.37 | %(e) | | | 1.37 | % | | | 1.37 | %(e) |
Ratios of net investment income to average
net assets: | | | | | | | | | | | | | | | | | | | | | | | | |
Before expense reimbursement and/or fee
waiver by Adviser | | | 0.25 | %(d) | | | 0.53 | % | | | 1.36 | % | | | 1.65 | % | | | 2.55 | % | | | 0.49 | % |
After expense reimbursement and/or fee
waiver by Adviser | | | 1.23 | %(d) | | | 1.52 | % | | | 1.68 | % | | | 1.96 | % | | | 3.12 | % | | | 0.69 | % |
Portfolio Turnover | | | 68.07 | %(c) | | | 86.62 | %(f) | | | 143.86 | % | | | 75.30 | % | | | 139.76 | % | | | 85.08 | % |
| | (a) | The selected per share data was calculated using the weighted average shares outstanding method for the period. |
| | (b) | The total return is calculated using the Net Asset Value used for trading at the close of business at period end. |
| | (e) | Ratios of expenses to average net assets include interest expenses of less than 0.005% for each of the years ended October 31, 2011, October 31, 2010 and October 31, 2008, which are not included in the contractual expense limitation. The interest expenses are from utilizing the line of credit as discussed in Note H to the Financial Statements. |
| | (f) | Portfolio turnover rate excludes securities delivered from processing a redemption-in-kind. |
See accompanying Notes to Financial Statements.
| | |
| |
| ASTON/Harrison Street Real Estate Fund – Class I | | April 30, 2013 |
| |
| Financial Highlights | | |
| | | | | | | | | | | | | | | | | | | | | | | | |
| | | Six Months
Ended
04/30/13
(unaudited) | | | Year
Ended
10/31/12 | | | Year
Ended
10/31/11 | | | Year
Ended
10/31/10 | | | Year
Ended
10/31/09 | | | Year
Ended
10/31/08 | |
| | | | | | | | | | | | | | | | | | | | | | | | |
Net Asset Value, Beginning of Period | | $ | 10.44 | | | $ | 8.92 | | | $ | 8.12 | | | $ | 5.74 | | | $ | 6.08 | | | $ | 15.62 | |
| | | | | | | | | | | | | | | | | | | | | | | | |
Income from Investment Operations: | | | | | | | | | | | | | | | | | | | | | | | | |
Net investment income | | | 0.08 | (a) | | | 0.15 | (a) | | | 0.16 | (a) | | | 0.16 | (a) | | | 0.16 | (a) | | | 0.09 | (a) |
Net realized and unrealized gain (loss)
on investments | | | 1.78 | | | | 1.46 | | | | 0.79 | | | | 2.34 | | | | (0.28 | ) | | | (5.51 | ) |
| | | | | | | | | | | | | | | | | | | | | | | | |
Total from investment operations | | | 1.86 | | | | 1.61 | | | | 0.95 | | | | 2.50 | | | | (0.12 | ) | | | (5.42 | ) |
| | | | | | | | | | | | | | | | | | | | | | | | |
Less Distributions: | | | | | | | | | | | | | | | | | | | | | | | | |
Distributions from and in excess of net
investment income | | | (0.19 | ) | | | (0.09 | ) | | | (0.15 | ) | | | (0.12 | ) | | | (0.22 | ) | | | (0.13 | ) |
Distributions from net realized gain
on investments | | | — | | | | — | | | | — | | | | — | | | | — | | | | (3.99 | ) |
| | | | | | | | | | | | | | | | | | | | | | | | |
Total distributions | | | (0.19 | ) | | | (0.09 | ) | | | (0.15 | ) | | | (0.12 | ) | | | (0.22 | ) | | | (4.12 | ) |
| | | | | | | | | | | | | | | | | | | | | | | | |
Net increase (decrease) in net asset value . | | | 1.67 | | | | 1.52 | | | | 0.80 | | | | 2.38 | | | | (0.34 | ) | | | (9.54 | ) |
| | | | | | | | | | | | | | | | | | | | | | | | |
Net Asset Value, End of Period | | $ | 12.11 | | | $ | 10.44 | | | $ | 8.92 | | | $ | 8.12 | | | $ | 5.74 | | | $ | 6.08 | |
| | | | | | | | | | | | | | | | | | | | | | | | |
Total Return (b) | | | 17.96 | %(c) | | | 18.16 | % | | | 11.82 | % | | | 44.14 | % | | | (1.27 | )% | | | (43.58 | )% |
| | | | | | |
Ratios/Supplemental Data: | | | | | | | | | | | | | | | | | | | | | | | | |
Net Assets, End of Period (in 000’s) | | $ | 231 | | | $ | 166 | | | $ | 32,925 | | | $ | 29,425 | | | $ | 21,905 | | | $ | 23,411 | |
Ratios of expenses to average net assets: | | | | | | | | | | | | | | | | | | | | | | | | |
Before expense reimbursement and/or fee
waiver by Adviser | | | 2.09 | %(d) | | | 2.11 | % | | | 1.44 | %(e) | | | 1.43 | %(e) | | | 1.69 | % | | | 1.32 | %(e) |
After expense reimbursement and/or fee
waiver by Adviser | | | 1.12 | %(d) | | | 1.12 | % | | | 1.12 | %(e) | | | 1.12 | %(e) | | | 1.12 | % | | | 1.12 | %(e) |
Ratios of net investment income to average net assets: | | | | | | | | | | | | | | | | | | | | | | | | |
Before expense reimbursement and/or fee
waiver by Adviser | | | 0.50 | %(d) | | | 0.78 | % | | | 1.53 | % | | | 1.90 | % | | | 2.80 | % | | | 0.74 | % |
After expense reimbursement and/or fee
waiver by Adviser | | | 1.48 | %(d) | | | 1.77 | % | | | 1.85 | % | | | 2.21 | % | | | 3.37 | % | | | 0.94 | % |
Portfolio Turnover | | | 68.07 | %(c) | | | 86.62 | %(f) | | | 143.86 | % | | | 75.30 | % | | | 139.76 | % | | | 85.08 | % |
| | (a) | The selected per share data was calculated using the weighted average shares outstanding method for the period. |
| | (b) | The total return is calculated using the Net Asset Value used for trading at the close of business at period end. |
| | (e) | Ratios of expenses to average net assets include interest expenses of less than 0.005% for each of the years ended October 31, 2011, October 31, 2010 and October 31, 2008, which are not included in the contractual expense limitation. The interest expenses are from utilizing the line of credit as discussed in Note H to the Financial Statements. |
| | (f) | Portfolio turnover rate excludes securities delivered from processing a redemption-in-kind. |
See accompanying Notes to Financial Statements.
| | |
| |
| ASTON/Montag & Caldwell Balanced Fund – Class N | | April 30, 2013 |
| |
| Financial Highlights | | |
| | | | | | | | | | | | | | | | | | | | | | | | |
| | | Six Months
Ended
04/30/13
(unaudited) | | | Year
Ended
10/31/12 | | | Year
Ended
10/31/11 | | | Year
Ended
10/31/10 | | | Year
Ended
10/31/09 | | | Year
Ended
10/31/08 | |
| | | | | | | | | | | | | | | | | | | | | | | | |
Net Asset Value, Beginning of Period | | $ | 21.46 | | | $ | 20.09 | | | $ | 19.13 | | | $ | 17.73 | | | $ | 15.61 | | | $ | 19.98 | |
| | | | | | | | | | | | | | | | | | | | | | | | |
Income from Investment Operations: | | | | | | | | | | | | | | | | | | | | | | | | |
Net investment income | | | 0.12 | (a) | | | 0.16 | (a) | | | 0.15 | (a) | | | 0.21 | (a) | | | 0.21 | (a) | | | 0.29 | |
Net realized and unrealized gain (loss)
on investments | | | 1.74 | | | | 1.45 | | | | 1.03 | | | | 1.47 | | | | 2.15 | | | | (4.42 | ) |
| | | | | | | | | | | | | | | | | | | | | | | | |
Total from investment operations | | | 1.86 | | | | 1.61 | | | | 1.18 | | | | 1.68 | | | | 2.36 | | | | (4.13 | ) |
| | | | | | | | | | | | | | | | | | | | | | | | |
Less Distributions: | | | | | | | | | | | | | | | | | | | | | | | | |
Distributions from and in excess of net
investment income | | | (0.16 | ) | | | (0.24 | ) | | | (0.22 | ) | | | (0.28 | ) | | | (0.24 | ) | | | (0.24 | ) |
| | | | | | | | | | | | | | | | | | | | | | | | |
Total distributions | | | (0.16 | ) | | | (0.24 | ) | | | (0.22 | ) | | | (0.28 | ) | | | (0.24 | ) | | | (0.24 | ) |
| | | | | | | | | | | | | | | | | | | | | | | | |
Net increase (decrease) in net asset value. | | | 1.70 | | | | 1.37 | | | | 0.96 | | | | 1.40 | | | | 2.12 | | | | (4.37 | ) |
| | | | | | | | | | | | | | | | | | | | | | | | |
Net Asset Value, End of Period | | $ | 23.16 | | | $ | 21.46 | | | $ | 20.09 | | | $ | 19.13 | | | $ | 17.73 | | | $ | 15.61 | |
| | | | | | | | | | | | | | | | | | | | | | | | |
Total Return (b) | | | 8.71 | %(c) | | | 8.03 | % | | | 6.20 | % | | | 9.54 | % | | | 15.32 | % | | | (20.87 | )% |
| | | | | | |
Ratios/Supplemental Data: | | | | | | | | | | | | | | | | | | | | | | | | |
Net Assets, End of Period (in 000’s) | | $ | 25,130 | | | $ | 31,536 | | | $ | 23,315 | | | $ | 29,194 | | | $ | 14,938 | | | $ | 16,586 | |
Ratios of expenses to average net assets: | | | | | | | | | | | | | | | | | | | | | | | | |
Before expense reimbursement and/or fee waiver by Adviser | | | 1.39 | %(d) | | | 1.42 | % | | | 1.57 | %(e) | | | 1.38 | % | | | 1.73 | % | | | 1.74 | % |
After expense reimbursement and/or fee waiver by Adviser | | | 1.20 | %(d) | | | 1.22 | % | | | 1.35 | %(e) | | | 1.13 | % | | | 1.26 | % | | | 1.35 | % |
Ratios of net investment income to average net assets: | | | | | | | | | | | | | | | | | | | | | | | | |
Before expense reimbursement and/or fee waiver by Adviser | | | 0.88 | %(d) | | | 0.57 | % | | | 0.53 | % | | | 0.89 | % | | | 0.81 | % | | | 0.74 | % |
After expense reimbursement and/or fee waiver by Adviser | | | 1.07 | %(d) | | | 0.77 | % | | | 0.76 | % | | | 1.15 | % | | | 1.28 | % | | | 1.13 | % |
Portfolio Turnover | | | 17.85 | %(c) | | | 35.48 | % | | | 40.31 | % | | | 51.68 | %(f) | | | 38.72 | % | | | 43.65 | % |
| (a) | The selected per share data was calculated using the weighed average shares outstanding method for the period. |
| (b) | The total return is calculated using the Net Asset Value used for trading at the close of business at period end. |
| (e) | Ratios of expenses to average net assets include interest expenses of less than 0.005% for the year ended October 31, 2011, which are not included in the voluntary expense limitation. The interest expenses are from utilizing the line of credit as discussed in Note H to the Financial Statements. |
| (f) | Portfolio turnover rate excludes securities received from a reorganization. |
See accompanying Notes to Financial Statements.
| | |
| |
| ASTON/Montag & Caldwell Balanced Fund – Class I | | April 30, 2013 |
| |
| Financial Highlights | | |
| | | | | | | | | | | | | | | | | | | | | | | | |
| | | Six Months
Ended
04/30/13
(unaudited) | | | Year
Ended
10/31/12 | | | Year
Ended
10/31/11 | | | Year
Ended
10/31/10 | | | Year
Ended
10/31/09 | | | Year
Ended
10/31/08 | |
| | | | | | | | | | | | | | | | | | | | | | | | |
Net Asset Value, Beginning of Period | | $ | 21.41 | | | $ | 20.05 | | | $ | 19.08 | | | $ | 17.68 | | | $ | 15.57 | | | $ | 19.94 | |
| | | | | | | | | | | | | | | | | | | | | | | | |
Income from Investment Operations: | | | | | | | | | | | | | | | | | | | | | | | | |
Net investment income | | | 0.13 | (a) | | | 0.19 | (a) | | | 0.20 | (a) | | | 0.22 | (a) | | | 0.23 | (a) | | | 0.27 | |
Net realized and unrealized gain (loss)
on investments | | | 1.73 | | | | 1.44 | | | | 1.04 | | | | 1.46 | | | | 2.16 | | | | (4.35 | ) |
| | | | | | | | | | | | | | | | | | | | | | | | |
Total from investment operations | | | 1.86 | | | | 1.63 | | | | 1.24 | | | | 1.68 | | | | 2.39 | | | | (4.08 | ) |
| | | | | | | | | | | | | | | | | | | | | | | | |
Less Distributions: | | | | | | | | | | | | | | | | | | | | | | | | |
Distributions from and in excess of net
investment income | | | (0.17 | ) | | | (0.27 | ) | | | (0.27 | ) | | | (0.28 | ) | | | (0.28 | ) | | | (0.29 | ) |
| | | | | | | | | | | | | | | | | | | | | | | | |
Total distributions | | | (0.17 | ) | | | (0.27 | ) | | | (0.27 | ) | | | (0.28 | ) | | | (0.28 | ) | | | (0.29 | ) |
| | | | | | | | | | | | | | | | | | | | | | | | |
Net increase (decrease) in net asset value . | | | 1.69 | | | | 1.36 | | | | 0.97 | | | | 1.40 | | | | 2.11 | | | | (4.37 | ) |
| | | | | | | | | | | | | | | | | | | | | | | | |
Net Asset Value, End of Period | | $ | 23.10 | | | $ | 21.41 | | | $ | 20.05 | | | $ | 19.08 | | | $ | 17.68 | | | $ | 15.57 | |
| | | | | | | | | | | | | | | | | | | | | | | | |
Total Return (b) | | | 8.77 | %(c) | | | 8.14 | % | | | 6.52 | % | | | 9.57 | % | | | 15.53 | % | | | (20.71 | )% |
| | | | | | |
Ratios/Supplemental Data: | | | | | | | | | | | | | | | | | | | | | | | | |
Net Assets, End of Period (in 000’s) | | $ | 1,845 | | | $ | 1,930 | | | $ | 1,415 | | | $ | 1,362 | | | $ | 1,149 | | | $ | 919 | |
Ratios of expenses to average net assets: | | | | | | | | | | | | | | | | | | | | | | | | |
Before expense reimbursement and/or fee
waiver by Adviser | | | 1.29 | %(d) | | | 1.30 | % | | | 1.32 | %(e) | | | 1.35 | % | | | 1.57 | % | | | 1.49 | % |
After expense reimbursement and/or fee
waiver by Adviser | | | 1.10 | %(d) | | | 1.10 | % | | | 1.10 | %(e) | | | 1.10 | % | | | 1.10 | % | | | 1.10 | % |
Ratios of net investment income to average net assets: | | | | | | | | | | | | | | | | | | | | | | | | |
Before expense reimbursement and/or fee
waiver by Adviser | | | 0.98 | %(d) | | | 0.69 | % | | | 0.79 | % | | | 0.92 | % | | | 0.97 | % | | | 0.99 | % |
After expense reimbursement and/or fee
waiver by Adviser | | | 1.17 | %(d) | | | 0.89 | % | | | 1.02 | % | | | 1.17 | % | | | 1.44 | % | | | 1.38 | % |
Portfolio Turnover | | | 17.85 | %(c) | | | 35.48 | % | | | 40.31 | % | | | 51.68 | %(f) | | | 38.72 | % | | | 43.65 | % |
| (a) | The selected per share data was calculated using the weighted average shares outstanding method for the period. |
| (b) | The total return is calculated using the Net Asset Value used for trading at the close of business at period end. |
| (e) | Ratios of expenses to average net assets include interest expenses of less than 0.01% for the year ended October 31, 2011, which are not included in the voluntary expense limitation. The interest expenses are from utilizing the line of credit as discussed in Note H to the Financial Statements. |
| (f) | Portfolio turnover rate includes securities received from a reorganization. |
See accompanying Notes to Financial Statements.
| | |
| |
| | April 30, 2013 |
| |
| Notes to Financial Statements (unaudited) | | |
Note (A) Fund Organization: Aston Funds (the “Trust”) was organized as a Delaware statutory trust under a Declaration of Trust dated September 10, 1993. The Trust is registered under the Investment Company Act of 1940, as amended (the “1940 Act”) as an open-end management investment company with 23 separate portfolios (each, a “Fund” and collectively, the “Funds”) as of April 30, 2013.
Aston Asset Management, LP (“Aston” or the “Adviser”), the investment adviser and the administrator, manages each Fund by retaining one or more subadvisers (each, a “Subadviser”) to manage each Fund’s portfolio on a subadvisory basis. The following 23 portfolios of the Trust are included in these financial statements:
|
| ASTON/Montag & Caldwell Growth Fund (the “M&C Growth Fund”) |
ASTON/TAMRO Diversified Equity Fund (the “TAMRO Diversified Equity Fund”) |
ASTON/Herndon Large Cap Value Fund
(the “Herndon Large Cap Value Fund”) |
ASTON/Cornerstone Large Cap Value Fund
(the “Cornerstone Large Cap Value Fund”) |
ASTON/River Road Dividend All Cap Value Fund
(the “River Road Dividend All Cap Value Fund”) |
ASTON/River Road Dividend All Cap Value Fund II
(the “River Road Dividend All Cap Value Fund II”) |
| ASTON/Fairpointe Mid Cap Fund (the “Fairpointe Mid Cap Fund”) |
ASTON/Montag & Caldwell Mid Cap Growth Fund
(the “M&C Mid Cap Growth Fund”) |
| ASTON/LMCG Small Cap Growth Fund, formerly, ASTON Small Cap Growth Fund (the “LMCG Small Cap Growth Fund”) |
| ASTON/Silvercrest Small Cap Fund (the “Silvercrest Small Cap Fund”) |
| ASTON/TAMRO Small Cap Fund (the “TAMRO Small Cap Fund”) |
ASTON/River Road Select Value Fund
(the “River Road Select Value Fund”) |
ASTON/River Road Small Cap Value Fund
(the “River Road Small Cap Value Fund”) |
ASTON/River Road Independent Value Fund
(the “River Road Independent Value Fund”) |
ASTON/DoubleLine Core Plus Fixed Income Fund
(the “DoubleLine Core Plus Fixed Income Fund”) |
| ASTON/TCH Fixed Income Fund (the “TCH Fixed Income Fund”) |
ASTON/Lake Partners LASSO Alternatives Fund
(the “Lake Partners LASSO Alternatives Fund”) |
ASTON/Anchor Capital Enhanced Equity Fund
(the “Anchor Capital Enhanced Equity Fund”) |
| ASTON/River Road Long-Short Fund (the “River Road Long-Short Fund”) |
| ASTON/Barings International Fund (the “Barings International Fund”) |
ASTON/LMCG Emerging Markets Fund
(the “LMCG Emerging Markets Fund”) |
ASTON/Harrison Street Real Estate Fund (the “Harrison Street Real Estate Fund”) |
| ASTON/Montag & Caldwell Balanced Fund (the “M&C Balanced Fund”) |
M&C Growth Fund is authorized to issue three classes of shares (Class N shares, Class I shares and Class R shares). The following Funds are each authorized to issue two classes of shares (Class N shares and Class I shares): TAMRO Diversified Equity Fund, Herndon Large Cap Value Fund, Cornerstone Large Cap Value Fund, River Road Dividend All Cap Value Fund, River Road Dividend All Cap Value Fund II, Fairpointe Mid Cap Fund, LMCG Small Cap Growth Fund, Silvercrest Small Cap Fund, TAMRO Small Cap Fund, River Road Select Value Fund, River Road Small Cap Value Fund, River Road Independent Value Fund, DoubleLine Core Plus Fixed Income Fund, TCH Fixed Income Fund, Lake Partners LASSO Alternatives Fund, Anchor Capital Enhanced Equity Fund, River Road Long-Short Fund, Barings International Fund, LMCG Emerging Markets Fund, Harrison Street Real Estate Fund and M&C Balanced Fund. The following Fund is authorized to issue one class of shares (Class N shares): M&C Mid Cap Growth Fund. Each class of shares is substantially the same except that certain classes of shares bear class specific expenses that include distribution and services fees. TAMRO Small Cap Fund, River Road Dividend All Cap Value Fund and River Road Independent Value Fund are closed to new investors until further notice.
The investment objectives of the Funds are as follows:
| | |
M&C Growth Fund Long-term capital appreciation and, secondarily, current income, by investing primarily in common stocks and convertible securities. |
TAMRO Diversified Equity Fund Long-term capital appreciation. |
Herndon Large Cap Value Fund Long-term capital appreciation. |
Cornerstone Large Cap Value Fund Total return through long-term capital appreciation and current income. |
River Road Dividend All Cap Value Fund High current income and, secondarily, long-term capital appreciation. |
River Road Dividend All Cap Value Fund II Long-term capital appreciation and high current income. |
Fairpointe Mid Cap Fund Long-term total return through capital appreciation by investing primarily in common and preferred stocks and convertible securities. |
M&C Mid Cap Growth Fund Long-term capital appreciation and secondarily, current income, by investing primarily in common stocks and convertible securities. |
LMCG Small Cap Growth Fund Long-term capital appreciation. |
Silvercrest Small Cap Fund Long-term capital appreciation. |
TAMRO Small Cap Fund Long-term capital appreciation. |
River Road Select Value Fund Long-term capital appreciation. |
River Road Small Cap Value Fund Long-term capital appreciation. |
| | |
| |
| | April 30, 2013 |
| |
| Notes to Financial Statements (unaudited) – continued | | |
| | |
River Road Independent Value Fund Long-term total return. |
DoubleLine Core Plus Fixed Income Fund Maximize total return. |
TCH Fixed Income Fund High current income consistent with prudent risk of capital. |
Lake Partners LASSO Alternatives Fund Long term total return with reduced correlation to the conventional stock and bond markets. |
Anchor Capital Enhanced Equity Fund Total return through a combination of a high level of current income and capital appreciation. |
River Road Long-Short Fund Absolute return while minimizing volatility over a full market cycle. |
Barings International Fund Total return. |
LMCG Emerging Markets Fund Long-term capital appreciation. |
Harrison Street Real Estate Fund Total return through a combination of growth and income. |
M&C Balanced Fund Long-term total return. |
Note (B) Significant Accounting Policies: The following is a summary of the significant accounting policies consistently followed by each Fund in the preparation of its financial statements. These policies are in conformity with U.S. generally accepted accounting principles (“U.S. GAAP”).
(1) Security Valuation: Equity securities, closed-end funds, exchange-traded funds, index options traded on a national securities exchange, and over-the-counter securities listed on the NASDAQ National Market System are valued at the last sale price or the NASDAQ Official Closing Price (“NOCP”), if applicable. If no last sale price or NOCP, if applicable, is reported, the mean of the last bid and asked prices may be used. Fixed income securities, except short-term investments, are valued on the basis of mean prices provided by an independent pricing service when such prices are believed by the Adviser to reflect the current market value of such securities, in accordance with guidelines adopted by the Board of Trustees. The pricing service provider may employ methodologies that utilize actual market transactions, broker-dealer supplied valuations, or other electronic data processing techniques. Such techniques generally consider such factors as security prices, yields, maturities, call features, ratings and developments relating to specific securities in arriving at valuations. If accurate market quotations are not available, securities are valued at fair values in accordance with guidelines adopted by the Board of Trustees. Short-term investments, that is, those with maturities of 60 days or less, are valued at amortized cost, which approximates fair value. Repurchase agreements are valued at cost. Investments in money market funds and other mutual funds are valued at the underlying fund’s net asset value (“NAV”) at the date of valuation. Foreign securities are valued at the last sales price on the primary exchange where the security is traded. Under the fair valuation procedures adopted by the Board of Trustees, the
Funds may utilize the services of an independent pricing service to determine fair value prices for foreign securities if certain market events occur.
Certain Funds invest in securities of other investment companies, including exchange-traded funds (“ETFs”), open-end funds and closed-end funds. Open-end funds are investment companies that issue new shares continuously and redeem shares daily. Closed-end funds are investment companies that typically issue a fixed number of shares that trade on a securities exchange or over-the-counter. An ETF is an investment company that seeks to track the performance of an index by holding in its portfolio shares of all the companies, or a representative sample of the companies, that are components of a particular index. ETFs are traded on a securities exchange based on their market values. The risks of investment in other investment companies typically reflect the risks of the types of securities in which investment companies invest. Investments in ETFs and closed-end funds are subject to the additional risk that shares of the fund may trade at a premium or discount to their NAV per share. When a Fund invests in another investment company, shareholders of the Fund bear their proportionate shares of the other investment company’s fees and expenses, including operating, registration, trustee, licensing and marketing, as well as their shares of the Fund’s fees and expenses.
Fair Value Measurements - The inputs and valuation techniques used to measure fair value of the Funds’ net assets are summarized into three levels as described in the hierarchy below:
| | |
• Level 1 – | | unadjusted quoted prices in active markets for identical assets or liabilities |
• Level 2 – | | other significant observable inputs (including quoted prices for similar securities, interest rates, prepayment speeds, credit risk, etc.) |
• Level 3 – | | significant unobservable inputs (including the Funds’ own assumptions in determining the fair value of investments) |
| | |
| |
| | April 30, 2013 |
| |
| Notes to Financial Statements (unaudited) – continued | | |
The inputs or methodology used for valuing securities are not necessarily an indication of the risk associated with investing in those securities. Transfers in and out of the levels are recognized at the market value at the end of the period. The summary of each Fund’s investments that are measured at fair value by Level within the fair value hierarchy as of April 30, 2013 is as follows:
| | | | | | | | | | | | | | | | |
Funds | | Total
Value at
04/30/13 | | | Level 1
Quoted
Prices | | | Level 2
Significant
Observable
Inputs | | | Level 3
Significant
Unobservable
Inputs | |
| | | | | | | | | | | | | | | | |
| M&C Growth Fund | | | | | | | | | | | | | | | | |
| Assets | | | | | | | | | | | | | | | | |
Investments in Securities* | | $ | 4,943,112,900 | | | $ | 4,943,112,900 | | | $ | — | | | $ | — | |
| | | | | | | | | | | | | | | | |
| TAMRO Diversified Equity Fund | | | | | | | | | | | | | | | | |
| Assets | | | | | | | | | | | | | | | | |
Investments in Securities* | | $ | 25,880,858 | | | $ | 25,880,858 | | | $ | — | | | $ | — | |
| | | | | | | | | | | | | | | | |
| Herndon Large Cap Value Fund | | | | | | | | | | | | | | | | |
| Assets | | | | | | | | | | | | | | | | |
Investments in Securities* | | $ | 91,527,942 | | | $ | 91,527,942 | | | $ | — | | | $ | — | |
| | | | | | | | | | | | | | | | |
| Cornerstone Large Cap Value Fund | | | | | | | | | | | | | | | | |
| Assets | | | | | | | | | | | | | | | | |
Investments in Securities* | | $ | 43,474,816 | | | $ | 43,474,816 | | | $ | — | | | $ | — | |
| | | | | | | | | | | | | | | | |
| River Road Dividend All Cap Value Fund | | | | | | | | | | | | | | | | |
| Assets | | | | | | | | | | | | | | | | |
Investments in Securities* | | $ | 1,100,352,452 | | | $ | 1,100,352,452 | | | $ | — | | | $ | — | |
| | | | | | | | | | | | | | | | |
| River Road Dividend All Cap Value Fund II | | | | | | | | | | | | | | | | |
| Assets | | | | | | | | | | | | | | | | |
Investments in Securities* | | $ | 55,867,286 | | | $ | 55,867,286 | | | $ | — | | | $ | — | |
| | | | | | | | | | | | | | | | |
| Fairpointe Mid Cap Fund | | | | | | | | | | | | | | | | |
| Assets | | | | | | | | | | | | | | | | |
Investments in Securities* | | $ | 3,731,821,140 | | | $ | 3,731,821,140 | | | $ | — | | | $ | — | |
| | | | | | | | | | | | | | | | |
| M&C Mid Cap Growth Fund | | | | | | | | | | | | | | | | |
| Assets | | | | | | | | | | | | | | | | |
Investments in Securities* | | $ | 12,778,602 | | | $ | 12,778,602 | | | $ | — | | | $ | — | |
| | | | | | | | | | | | | | | | |
| LMCG Small Cap Growth Fund | | | | | | | | | | | | | | | | |
| Assets | | | | | | | | | | | | | | | | |
Investment in Securities* | | $ | 32,138,227 | | | $ | 32,138,227 | | | $ | — | | | $ | — | |
| | | | | | | | | | | | | | | | |
| Silvercrest Small Cap Fund | | | | | | | | | | | | | | | | |
| Assets | | | | | | | | | | | | | | | | |
Investments in Securities* | | $ | 12,724,752 | | | $ | 12,724,752 | | | $ | — | | | $ | — | |
| | | | | | | | | | | | | | | | |
| TAMRO Small Cap Fund | | | | | | | | | | | | | | | | |
| Assets | | | | | | | | | | | | | | | | |
Investments in Securities* | | $ | 1,098,780,456 | | | $ | 1,098,780,456 | | | $ | — | | | $ | — | |
| | | | | | | | | | | | | | | | |
| River Road Select Value Fund | | | | | | | | | | | | | | | | |
| Assets | | | | | | | | | | | | | | | | |
Investments in Securities* | | $ | 199,966,539 | | | $ | 199,966,539 | | | $ | — | | | $ | — | |
| | | | | | | | | | | | | | | | |
| River Road Small Cap Value Fund | | | | | | | | | | | | | | | | |
| Assets | | | | | | | | | | | | | | | | |
Common Stocks | | | | | | | | | | | | | | | | |
Consumer Discretionary | | $ | 76,652,530 | | | $ | 69,378,631 | | | $ | 7,273,899 | | | $ | — | |
Consumer Staples | | | 27,948,903 | | | | 27,948,903 | | | | — | | | | — | |
Energy | | | 20,682,369 | | | | 20,682,369 | | | | — | | | | — | |
Financials | | | 41,648,372 | | | | 41,648,372 | | | | — | | | | — | |
Healthcare | | | 35,695,092 | | | | 35,695,092 | | | | — | | | | — | |
Industrials | | | 42,454,731 | | | | 42,454,731 | | | | — | | | | — | |
Information Technology | | | 40,904,430 | | | | 40,904,430 | | | | — | | | | — | |
Materials | | | 13,944,502 | | | | 13,944,502 | | | | — | | | | — | |
Telecommunication Services | | | 8,969,979 | | | | 8,969,979 | | | | — | | | | — | |
Utilities | | | 2,497,292 | | | | 2,497,292 | | | | — | | | | — | |
| | | | | | | | | | | | | | | | |
Total Common Stocks | | | 311,398,200 | | | | 304,124,301 | | | | 7,273,899 | | | | — | |
| | | | | | | | | | | | | | | | |
Investment Company* | | | 16,779,073 | | | | 16,779,073 | | | | — | | | | — | |
| | | | | | | | | | | | | | | | |
Total | | $ | 328,177,273 | | | $ | 320,903,374 | | | $ | 7,273,899 | | | $ | — | |
| | | | | | | | | | | | | | | | |
| | |
| |
| | April 30, 2013 |
| |
| Notes to Financial Statements (unaudited) – continued | | |
| | | | | | | | | | | | | | | | |
Funds | | Total
Value at
04/30/13 | | | Level 1
Quoted
Prices | | | Level 2
Significant
Observable
Inputs | | | Level 3
Significant
Unobservable
Inputs | |
| | | | | | | | | | | | | | | | |
| River Road Independent Value Fund | | | | | | | | | | | | | | | | |
| Assets | | | | | | | | | | | | | | | | |
Common Stocks | | | | | | | | | | | | | | | | |
Consumer Discretionary | | $ | 34,013,098 | | | $ | 34,013,098 | | | $ | — | | | $ | — | |
Consumer Staples | | | 31,240,054 | | | | 31,240,054 | | | | — | | | | — | |
Energy | | | 70,926,981 | | | | 70,926,981 | | | | — | | | | — | |
Financials | | | 5,738,324 | | | | — | | | | 5,738,324 | | | | — | |
Healthcare | | | 13,174,988 | | | | 13,174,988 | | | | — | | | | — | |
Industrials | | | 30,538,256 | | | | 30,538,256 | | | | — | | | | — | |
Information Technology | | | 71,986,114 | | | | 71,986,114 | | | | — | | | | — | |
Materials | | | 50,090,284 | | | | 50,090,284 | | | | — | | | | — | |
Utilities | | | 3,947,669 | | | | 3,947,669 | | | | — | | | | — | |
| | | | | | | | | | | | | | | | |
Total Common Stocks | | | 311,655,768 | | | | 305,917,444 | | | | 5,738,324 | | | | — | |
| | | | | | | | | | | | | | | | |
Investment Company* | | | 416,693,043 | | | | 416,693,043 | | | | — | | | | — | |
| | | | | | | | | | | | | | | | |
Total | | $ | 728,348,811 | | | $ | 722,610,487 | | | $ | 5,738,324 | | | $ | — | |
| | | | | | | | | | | | | | | | |
| DoubleLine Core Plus Fixed Income Fund | | | | | | | | | | | | | | | | |
| Assets | | | | | | | | | | | | | | | | |
Corporate Notes and Bonds | | $ | 89,927,135 | | | $ | — | | | $ | 89,927,135 | | | $ | — | |
Collateralized Mortgage-Backed Securities | | | 43,971,474 | | | | — | | | | 43,971,474 | | | | — | |
U.S. Government Obligations | | | 34,662,260 | | | | — | | | | 34,662,260 | | | | — | |
Agency Collateralized Mortgage Obligations | | | 25,249,853 | | | | — | | | | 25,249,853 | | | | — | |
U.S. Government Mortgage-Backed Securities | | | 18,199,473 | | | | — | | | | 18,199,473 | | | | — | |
Asset-Backed Securities | | | 8,076,906 | | | | — | | | | 8,076,906 | | | | — | |
Foreign Government Bonds | | | 2,320,196 | | | | — | | | | 2,320,196 | | | | — | |
Investment Company* | | | 7,043,033 | | | | 7,043,033 | | | | — | | | | — | |
| | | | | | | | | | | | | | | | |
Total | | $ | 229,450,330 | | | $ | 7,043,033 | | | $ | 222,407,297 | | | $ | — | |
| | | | | | | | | | | | | | | | |
| TCH Fixed Income Fund | | | | | | | | | | | | | | | | |
| Assets | | | | | | | | | | | | | | | | |
Corporate Notes and Bonds | | $ | 44,664,988 | | | $ | — | | | $ | 44,664,988 | | | $ | — | |
U.S. Government and Agency Obligations | | | 19,659,207 | | | | — | | | | 19,659,207 | | | | — | |
Asset-Backed Securities | | | 1,252,581 | | | | — | | | | 1,252,581 | | | | — | |
Commercial Mortgage-Backed Securities | | | 884,889 | | | | — | | | | 884,889 | | | | — | |
Foreign Government Bond | | | 789,775 | | | | — | | | | 789,775 | | �� | | — | |
Commercial Paper | | | — | | | | — | | | | — | | | | — | |
Investment Company* | | | 1,951,600 | | | | 1,951,600 | | | | — | | | | — | |
| | | | | | | | | | | | | | | | |
Total | | $ | 69,203,040 | | | $ | 1,951,600 | | | $ | 67,251,440 | | | $ | — | |
| | | | | | | | | | | | | | | | |
| Lake Partners LASSO Alternative Fund | | | | | | | | | | | | | | | | |
| Assets | | | | | | | | | | | | | | | | |
Investments in Securities* | | $ | 370,090,828 | | | $ | 370,090,828 | | | $ | — | | | $ | — | |
| | | | | | | | | | | | | | | | |
| Anchor Capital Enhanced Equity Fund | | | | | | | | | | | | | | | | |
| Assets | | | | | | | | | | | | | | | | |
Common Stocks* | | $ | 135,916,262 | | | $ | 135,916,262 | | | $ | — | | | $ | — | |
Derivatives | | | | | | | | | | | | | | | | |
Equity Contracts | | | 459,000 | | | | 459,000 | | | | — | | | | — | |
Investment Company* | | | 2,649,663 | | | | 2,649,663 | | | | — | | | | — | |
| | | | | | | | | | | | | | | | |
Total Assets | | | 139,024,925 | | | | 139,024,925 | | | | — | | | | — | |
| | | | | | | | | | | | | | | | |
| Liabilities | | | | | | | | | | | | | | | | |
Derivatives | | | | | | | | | | | | | | | | |
Equity Covered Call Contracts | | | (7,393,873 | ) | | | (7,393,873 | ) | | | — | | | | — | |
| | | | | | | | | | | | | | | | |
Total Liabilities | | | (7,393,873 | ) | | | (7,393,873 | ) | | | — | | | | — | |
| | | | | | | | | | | | | | | | |
Total | | $ | 131,631,052 | | | $ | 131,631,052 | | | $ | — | | | $ | — | |
| | | | | | | | | | | | | | | | |
| River Road Long-Short Fund | | | | | | | | | | | | | | | | |
| Assets | | | | | | | | | | | | | | | | |
Investments in Securities* | | $ | 25,276,210 | | | $ | 25,276,210 | | | $ | — | | | $ | — | |
| | | | | | | | | | | | | | | | |
Total Assets | | | 25,276,210 | | | | 25,276,210 | | | | — | | | | — | |
| | | | | | | | | | | | | | | | |
| Liabilities | | | | | | | | | | | | | | | | |
Short Sales* | | | (6,288,803 | ) | | | (6,288,803 | ) | | | — | | | | — | |
| | | | | | | | | | | | | | | | |
Total Liabilities | | | (6,288,803 | ) | | | (6,288,803 | ) | | | — | | | | — | |
| | | | | | | | | | | | | | | | |
Total | | $ | 18,987,407 | | | $ | 18,987,407 | | | $ | — | | | $ | — | |
| | | | | | | | | | | | | | | | |
| | |
| |
| | April 30, 2013 |
| |
| Notes to Financial Statements (unaudited) – continued | | |
| | | | | | | | | | | | | | | | |
Funds | | Total
Value at
04/30/13 | | | Level 1
Quoted
Prices | | | Level 2
Significant
Observable
Inputs | | | Level 3
Significant
Unobservable
Inputs | |
| | | | | | | | | | | | | | | | |
| Barings International Fund | | | | | | | | | | | | | | | | |
| Assets | | | | | | | | | | | | | | | | |
Common Stocks | | | | | | | | | | | | | | | | |
Belgium | | $ | 1,117,533 | | | $ | 1,117,533 | | | $ | — | | | $ | — | |
China | | | 1,061,497 | | | | 1,061,497 | | | | — | | | | — | |
Denmark | | | 830,906 | | | | 830,906 | | | | — | | | | — | |
France | | | 5,790,799 | | | | 5,790,799 | | | | — | | | | — | |
Germany | | | 6,585,811 | | | | 6,585,811 | | | | — | | | | — | |
Hong Kong | | | 626,836 | | | | 626,836 | | | | — | | | | — | |
Israel | | | 1,430,010 | | | | 1,430,010 | | | | — | | | | — | |
Japan | | | 16,877,460 | | | | 16,877,460 | | | | — | | | | — | |
Mexico | | | 945,177 | | | | 945,177 | | | | — | | | | — | |
Netherlands | | | 2,600,654 | | | | 2,600,654 | | | | — | | | | — | |
Norway | | | 1,540,674 | | | | 1,540,674 | | | | — | | | | — | |
Russia | | | 1,624,148 | | | | 1,624,148 | | | | — | | | | — | |
Singapore | | | 2,419,641 | | | | 2,396,912 | | | | 22,729 | | | | — | |
South Korea | | | 800,508 | | | | 800,508 | | | | — | | | | — | |
Sweden | | | 1,494,784 | | | | 1,494,784 | | | | — | | | | — | |
Switzerland | | | 6,525,083 | | | | 6,525,083 | | | | — | | | | — | |
Taiwan | | | 875,772 | | | | 875,772 | | | | — | | | | — | |
United Kingdom | | | 15,950,174 | | | | 15,938,790 | | | | — | | | | 11,384 | |
| | | | | | | | | | | | | | | | |
Total Common Stocks | | | 69,097,467 | | | | 69,063,354 | | | | 22,729 | | | | 11,384 | |
| | | | | | | | | | | | | | | | |
Investment Company* | | | 421,643 | | | | 421,643 | | | | — | | | | — | |
| | | | | | | | | | | | | | | | |
Total | | $ | 69,519,110 | | | $ | 69,484,997 | | | $ | 22,729 | | | $ | 11,384 | |
| | | | | | | | | | | | | | | | |
| LMCG Emerging Markets Fund | | | | | | | | | | | | | | | | |
| Assets | | | | | | | | | | | | | | | | |
Investments in Securities* | | $ | 5,141,951 | | | $ | 5,141,951 | | | $ | — | | | $ | — | |
| | | | | | | | | | | | | | | | |
| Harrison Street Real Estate Fund | | | | | | | | | | | | | | | | |
| Assets | | | | | | | | | | | | | | | | |
Investments in Securities* | | $ | 12,906,235 | | | $ | 12,906,235 | | | $ | — | | | $ | — | |
| | | | | | | | | | | | | | | | |
| M&C Balanced Fund | | | | | | | | | | | | | | | | |
| Assets | | | | | | | | | | | | | | | | |
Common Stocks* | | $ | 16,200,817 | | | $ | 16,200,817 | | | $ | — | | | $ | — | |
Corporate Notes and Bonds | | | 5,925,988 | | | | — | | | | 5,925,988 | | | | — | |
U.S. Government and Agency Obligations | | | 3,794,845 | | | | — | | | | 3,794,845 | | | | — | |
Investment Company* | | | 960,968 | | | | 960,968 | | | | — | | | | — | |
| | | | | | | | | | | | | | | | |
Total | | $ | 26,882,618 | | | $ | 17,161,785 | | | $ | 9,720,833 | | | $ | — | |
| | | | | | | | | | | | | | | | |
| * | | All Common Stocks, Short Sales and Investment Companies are Level 1. Please refer to the Schedule of Investments for industry, sector or country breakout. |
At the end of each calendar quarter, management evaluates the Level 2 and 3 assets and liabilities for changes in liquidity, including but not limited to: whether a broker is willing to execute at the quoted price, the depth and consistency of prices from third party services, and the existence of contemporaneous, observable trades in the market. Additionally, management evaluates the Level 1 and 2 assets and liabilities on a quarterly basis for changes in listings or delistings on national exchanges. Due to the inherent uncertainty of determining the fair values of investments that do not have readily available market values, the fair values of the Funds’ investments may fluctuate from period to period. Additionally, the fair values of investments may differ significantly from the values that would have been used had a ready market existed for such investments and may differ materially from the values the Funds may ultimately realize upon the disposition of such investments. Further, such investments may be subject to legal and other restrictions on resale or they may be otherwise less liquid than publicly-traded securities.
Barings International Fund and LMCG Emerging Markets Fund may utilize an external pricing service to fair value certain foreign securities if certain market events occur. Such fair valuations are categorized as Level 2 in the hierarchy. Because such market events were not deemed to have occurred at April 30, 2013, Barings International Fund and LMCG Emerging Markets Fund did not utilize the external pricing service model adjustments.
Certain securities that were held at April 30, 2013 and since the beginning of the fiscal year in TAMRO Small Cap Fund, River Road Small Cap Value Fund and River Road Independent Value Fund had changes in liquidity assessments which resulted in a transfer between levels.
| | |
| |
| | April 30, 2013 |
| |
| Notes to Financial Statements (unaudited) – continued | | |
| | | | | | | | |
Funds | | Transfer from
Level 1 to Level 2 | | | Transfer from
Level 2 to Level 1 | |
| TAMRO Small Cap Fund | | $ | — | | | $ | 16,204,852 | |
| River Road Small Cap Value Fund | | | 1,802,252 | | | | 2,121,993 | |
| River Road Independent Value Fund | | | 5,738,324 | | | | 3,947,669 | |
Level 3 holdings were valued using internal valuation techniques which took into consideration factors including previous experience with similar securities of the same issuer, conversion ratio and security terms.
The following is a reconciliation of Level 3 holdings for which significant unobservable inputs were used in determining fair value as of April 30, 2013:
| | | | |
| Barings International Fund | | | Common Stocks | |
| | | | |
Fair Value, beginning of period | | $ | 7,049 | |
Purchases | | | 11,188 | |
Sales | | | (7,005 | ) |
Net realized gains | | | 3 | |
Change in unrealized appreciation (depreciation) | | | 149 | |
| | | | |
Fair Value, end of period | | $ | 11,384 | |
| | | | |
Change in net unrealized appreciation (depreciation)
on Level 3 holdings held at end of period | | $ | 196 | |
| | | | |
(2) Repurchase Agreements: Each Fund may enter into repurchase agreements with financial institutions deemed to be creditworthy by the Fund’s Adviser or Subadviser, subject to the seller’s agreement to repurchase and the Fund’s agreement to resell such securities at a mutually agreed upon price. Securities purchased subject to repurchase agreements are deposited with the Fund’s custodian and, pursuant to the terms of the repurchase agreement, must have an aggregate market value greater than or equal to the repurchase price plus accrued interest at all times. If the value of the underlying securities falls below the value of the repurchase price plus accrued interest, the Fund will require the seller to deposit additional collateral by the next business day. If the request for additional collateral is not met, or the seller defaults on its repurchase obligation, the Fund has the right to sell the underlying securities at market value and may claim any resulting loss against the seller. As of and during the six months ended April 30, 2013, the Funds did not own any repurchase agreements.
(3) When Issued/Delayed Delivery Securities: Each Fund may purchase and sell securities on a “when issued” or “delayed delivery” basis, with settlement to occur at a later date. The value of any security so purchased is subject to market fluctuations during the applicable period. The Funds segregate assets having an aggregate value at least equal to the amount of when issued or delayed delivery purchase commitments until payment is made. During the six months ended April 30, 2013, DoubleLine Core Plus Fixed Income Fund and TCH Fixed Income Fund owned delayed delivery securities. At April 30, 2013, only DoubleLine Core Plus Fixed Income Fund owned delayed delivery securities.
(4) Mortgage-Backed Securities: M&C Balanced Fund, DoubleLine Core Plus Fixed Income Fund and TCH Fixed Income Fund may
invest in mortgage-backed securities (“MBS”). These securities represent interests in pools of mortgage loans and they provide shareholders with payments consisting of both principal and interest as the mortgages in the underlying mortgage pools are paid. The timely payment of principal and interest on MBS issued or guaranteed by Ginnie Mae (formerly known as the Government National Mortgage Association) is backed by Ginnie Mae and the full faith and credit of the U.S. government. MBS issued by U.S. government agencies or instrumentalities other than Ginnie Mae are not “full faith and credit” obligations. Certain obligations, such as those issued by the Federal Home Loan Banks, Fannie Mae (formerly known as the Federal National Mortgage Association) and Freddie Mac (formerly known as the Federal Home Loan Mortgage Corporation) are supported only by the credit of the issuer. MBS issued by private issuers are not government securities and are not directly guaranteed by any government agency. They are secured by the underlying collateral of the private issuer. Yields on privately issued MBS tend to be higher than those of government-backed issues. However, risk of loss due to default and sensitivity to interest rate fluctuations are also higher. M&C Balanced Fund, DoubleLine Core Plus Fixed Income Fund and TCH Fixed Income Fund may also invest in collateralized mortgage obligations (“CMOs”), collateralized debt obligations (“CLOs”) and real estate mortgage investment conduits (“REMICs”). A CMO is a bond that is collateralized by a pool of MBS, a CLO is a bond that is collateralized by a financial institution’s receivables from loans and a REMIC is similar in form to a CMO. These MBS pools are divided into classes with each class having its own characteristics. The different classes are retired in sequence as the underlying mortgages are repaid.
(5) Securities Sold Short: River Road Long-Short Fund utilizes short sales as part of its overall portfolio management strategy. A short sale involves the sale of a security that is borrowed from a broker or other institution. A gain, limited to the price at which the Fund sold the security short, or a loss, unlimited in size, will be recognized upon closing a short sale. Short sales expose the Fund to the risk that it will be required to acquire, convert or exchange securities to replace the borrowed securities at a time when the securities sold short have appreciated in value, thus resulting in a loss to the Fund. The Fund making a short sale must segregate liquid assets, or otherwise cover its position in a permissible manner. The Subadviser determines the liquidity of assets, in accordance with procedures established by the Board of Trustees. Cash segregated for short sales is shown in the Statement of Assets and Liabilities as cash held as collateral. Security positions segregated for short sales are included in the Total Investments on the Statement of Assets and Liabilities.
(6) Options Contracts: In the normal course of pursuing its investment objectives, certain Funds are subject to price volatility risk. Certain Funds may write and/or purchase call and put options on securities for hedging purposes, to seek capital appreciation, to mitigate risk and/or to increase exposure. Writing put options or purchasing call options tends to increase a Fund’s exposure to the underlying instrument. Writing call options or purchasing put options tends to decrease a Fund’s
| | |
| |
| | April 30, 2013 |
| |
| Notes to Financial Statements (unaudited) – continued | | |
exposure to the underlying instrument. When a Fund writes or purchases a call or put option, an amount equal to the premium received or paid by the Fund is included in a Fund’s Statement of Assets and Liabilities as a liability or an investment and subsequently adjusted to the current market value based on the quoted daily settlement price of the option written or purchased. Premiums received or paid from writing or purchasing options that expire unexercised are treated by the Fund on the expiration date as realized gains or losses. The difference between the premium and the amount paid or received on a closing purchase or sale transaction, including brokerage commissions, is also treated as a realized gain or loss. If an option is exercised, the premium paid or received is added to the cost of the purchase or proceeds from the sale in determining whether the Fund has realized a gain or loss on investment transactions. If the Fund writes a covered call option, the Fund forgoes, in exchange for the premium, the opportunity to profit during the option period from an increase in the market value of the underlying security above the exercise price. If the Fund writes a put option, it accepts the risk of a decline in the market value of the underlying security below the exercise price. There is the risk a Fund may not be able to enter into a closing transaction because of an illiquid market. The risk associated with purchasing put and call options is limited to the premium paid. Options were traded during the period in Anchor Capital Enhanced Equity Fund. See the Schedule of Investments for open options contracts held by Anchor Capital Enhanced Equity Fund at April 30, 2013. For the six months ended April 30, 2013, the average* volume of derivative activities are as follows:
| | | | | | | | |
Funds | | Purchased
Options
(Cost) | | | Written
Options
(Premiums Received) | |
| Anchor Capital Enhanced Equity Fund | | $ | 1,502,538 | | | $ | 4,036,434 | |
| * | estimate based on quarter-end holdings |
(7) Forward Foreign Currency Contracts: In the normal course of pursuing their investment objectives, certain Funds are subject to foreign investment and currency risk. Certain Funds may enter into forward foreign currency contracts (“forward contracts”) for purposes of hedging, duration management, as a substitute for securities, to increase returns, for currency hedging or risk management, or to otherwise help achieve a Fund’s investment goal. These contracts are marked-to-market daily at the applicable exchange rates. A Fund records realized gains or losses at the time the forward contract is closed. A forward contract is extinguished through a closing transaction or upon delivery of the currency or entering an offsetting contract. Risks may arise upon entering these contracts from the potential inability of a counterparty to meet the terms of its contracts and from unanticipated movements in the value of a foreign currency relative to the U.S. dollar or other currencies. During the six months ended April 30, 2013, the Funds did not enter into any forward foreign currency contracts.
(8) Disclosures about Derivative Instruments: The following is a table summarizing the fair value of derivatives held at April 30, 2013, by primary risk exposure:
| | | | | | | | |
| | | Asset Derivative
Investments Value | | | Liability Derivative
Investments Value | |
Fund | | Equity
Contracts (a) | | | Equity
Contracts(a) | |
| | | | | | | | |
| Anchor Capital Enhanced Equity Fund | | $ | 459,000 | | | $ | 7,393,873 | |
| (a) | Statement of Assets and Liabilities location: Total investments at value for purchased options and call options written, at value for written options. |
The effect of derivative instruments on the Statement of Operations for the six months ended April 30, 2013:
| | | | | | | | |
| | | Amount of
Realized Gain (Loss)
on Derivatives | | | Change in Unrealized
Appreciation
(Depreciation)
on Derivatives | |
Fund | | Equity
Contracts(a) | | | Equity
Contracts(b) | |
| Anchor Capital Enhanced Equity Fund | | $ | (13,664,469 | ) | | $ | (1,378,942 | ) |
| (a) | Statement of Operations location: Net realized loss on purchased options and net realized loss on written option transactions. |
| (b) | Statement of Operations location: Net change in unrealized depreciation on purchased options and net change in unrealized depreciation on written options transactions. |
(9) Investment Income and Securities Transactions: Dividend income is recorded on the ex-dividend date, except for certain dividends from foreign securities where the ex-dividend date may have passed, which are recorded as soon as a Fund is informed of the ex-dividend date. Interest income is accrued daily. Dividend income and interest income are recorded in the Statement of Operations as investment income. Premiums and discounts are amortized or accreted on an effective yield method on fixed income securities. The Funds may be subject to foreign taxes on income, gains on investments, securities transactions or currency repatriation, some of which may be recoverable in part. The Funds will accrue such taxes and reclaims as applicable, based upon their current interpretation of tax rules and regulations that exist in the markets in which the Funds invest. Securities are accounted for on a trade date basis. The cost of securities sold is determined using the identified cost method for the Fairpointe Mid Cap Fund and first in first out (“FIFO”) method for all other Funds.
(10) Foreign Currency: Foreign currencies, investments and other assets and liabilities are translated into U.S. dollars at the exchange rates at the close of the regular trading session on the New York Stock Exchange. Fluctuations in the value of the foreign currencies and other assets and liabilities resulting from changes in exchange rates are recorded as unrealized foreign currency gains (losses). Realized gains (losses) and unrealized appreciation (depreciation) on investment securities and income and expenses are translated on the respective dates of such transactions. The effects of changes in foreign currency exchange rates on investments in securities are segregated on the Statement of Operations from the effects of changes in
| | |
| |
| | April 30, 2013 |
| |
| Notes to Financial Statements (unaudited) – continued | | |
market prices of those securities, and are included with the net realized and change in unrealized gain or loss on investment securities.
(11) Federal Income Taxes: The Funds have elected to be treated as “regulated investment companies” under Subchapter M of the Internal Revenue Code of 1986, as amended, and to
distribute substantially all of their respective net taxable income. Accordingly, no provisions for federal income taxes have been made in the accompanying financial statements. The Funds intend to utilize provisions of the federal income tax laws, which allow them to carry a realized capital loss forward for eight years following the year of the loss and offset such losses against any future realized capital gains.
At October 31, 2012, the following Funds had available realized capital loss carryforwards to offset future net capital gains through the fiscal year ended:
| | | | | | | | | | | | | | | | | | | | | | | | | | | | | | | | |
| | | Capital Loss Carryforwards: | |
Fund | | 2014 | | | 2016 | | | 2017 | | | 2018 | | | 2019 | | | No Expiration
Short Term* | | | No Expiration
Long Term* | | | Total | |
| | | | | | | | | | | | | | | | | | | | | | | | | | | | | | | | |
| M&C Growth Fund | | $ | — | | | $ | — | | | $ | 12,098,064 | ** | | $ | — | | | $ | — | | | $ | — | | | $ | — | | | $ | 12,098,064 | |
| Cornerstone Large Cap Value Fund | | | — | | | | — | | | | 21,265,288 | | | | 6,819,813 | | | | — | | | | — | | | | — | | | | 28,085,101 | |
| TCH Fixed Income Fund | | | 2,331,750 | | | | 2,654,917 | | | | 1,270,780 | | | | — | | | | — | | | | — | | | | — | | | | 6,257,447 | |
| Lake Partners LASSO Alternatives Fund | | | — | | | | — | | | | — | | | | — | | | | 4,140,503 | | | | 729,638 | | | | — | | | | 4,870,141 | |
| Harrison Street Real Estate Fund | | | — | | | | 1,949,371 | | | | 11,228,100 | | | | — | | | | — | | | | — | | | | — | | | | 13,177,471 | |
| M&C Balanced Fund | | | — | | | | — | | | | 1,726,376 | ** | | | — | | | | — | | | | — | | | | — | | | | 1,726,376 | |
| * | On December 22, 2010, the Regulated Investment Company Modernization Act of 2010 (the “Modernization Act”) was signed into law. Under the Modernization Act the Funds will be permitted to carry forward capital losses incurred for an unlimited period. However, any losses incurred during those future taxable years will be required to be utilized prior to the losses incurred in pre-enactment taxable years. As a result of this ordering rule, pre-enactment capital loss carryforwards may be more likely to expire unused. Additionally, post-enactment capital losses that are carried forward will retain their character as either short-term or long-term capital losses rather than being considered all short-term as under previous law. |
| ** | These capital loss carryforward amounts were acquired in the reorganizations of the Growth Fund into the M&C Growth Fund and the Balanced Fund into the M&C Balanced Fund on March 29, 2010. The Funds’ ability to utilize the capital loss carryforwards is limited under Internal Revenue Service regulations. |
Management has analyzed the Funds’ tax positions for all open tax years (current and prior three tax years) and has concluded that no provision for federal, state, or international income tax is required in the Funds’ financial statements. The Funds’ federal income and excise tax returns for tax years for which the applicable statutes of limitations have not expired are subject to examination by the Internal Revenue Service.
(12) Multi-Class Operations: Each class offered by a Fund that is authorized to offer multiple classes of shares has equal rights as to the Fund’s net assets.
Income, fund and trust level expenses and realized and unrealized capital gains and losses, if any, are allocated to each class of shares based on the relative net assets of each class. Class specific expenses are allocated to each class.
(13) Offering Costs: Certain costs were incurred in connection with the offering of the following Funds, as disclosed in the table below. The costs associated have been capitalized and are being amortized on a straight-line basis over twelve months based on the commencement date of the Funds, stated below.
| | | | | | | | |
Fund | | Commencement Date | | | Original
Offering Costs | |
| Silvercrest Small Cap Fund | | | December 27, 2011 | | | $ | 63,821 | |
| River Road Dividend All Cap Value Fund II | | | June 27, 2012 | | | | 57,711 | |
| LMCG Emerging Markets Fund | | | March 28, 2013 | | | | 98,000 | |
(14) Use of Estimates: The preparation of financial statements in conformity with U.S. GAAP requires management to make estimates and assumptions that affect the reported amounts of assets and liabilities and disclosure of contingent assets and liabilities at the date of the financial statements and the reported amounts of revenues and expenses during the reporting period. Actual results could differ from those estimates.
| | |
| |
| | April 30, 2013 |
| |
| Notes to Financial Statements (unaudited) – continued | | |
(15) Commitments and Contingencies: In the normal course of business, the Trust enters into contracts on behalf of the Funds that contain a variety of provisions for general indemnifications. Each Fund’s maximum exposure under these arrangements is unknown, as this would involve future claims that may be made against each Fund that are not known at this time. However, based on experience, the Funds believe the risk of loss is remote.
(16) Recent Accounting Pronouncements: In December 2011, the Financial Accounting Standards Board (the “FASB”) issued ASU No. 2011-11, Disclosures about Offsetting Assets and Liabilities. ASU 2011-11 requires disclosures to make financial statements that are prepared under U.S. GAAP more comparable to those prepared under IFRS. The new disclosure requirements mandate that entities disclose both gross and net information about instruments and transactions eligible for offset in the Statement of Assets and Liabilities as well as instruments and transactions subject to an agreement similar to a master netting arrangement. In addition, ASU 2011-11 requires disclosure of collateral received and posted in connection with master netting agreements or similar arrangements. In January 2013, the FASB issued ASU No. 2013-01, “Clarifying the Scope of Disclosures about Offsetting Assets and Liabilities.” This update limits the scope of ASU No. 2011-11 to derivatives, repurchase agreements, reverse repurchase agreements, securities borrowing and securities lending transactions that are either offset in the Statement of Assets and Liabilities or subject to an enforceable master netting arrangement or similar agreement. New disclosures are required for annual reporting periods beginning on or after January 1, 2013, and interim periods within those annual periods. Management is evaluating the impact these updates may have on the financial statements and disclosures.
In June 2013, FASB issued guidance that creates a two-tiered approach to assess whether an entity is an investment company. The guidance will also require an investment company to measure noncontrolling ownership interests in other investment companies at fair value and will require additional disclosures relating to investment company status, any changes thereto and information about financial support provided or contractually required to be provided to any of the investment company’s investees. The guidance is effective for financial statements with fiscal years beginning on or after December 15, 2013 and interim periods within those fiscal years. Management is evaluating the impact of this guidance on the Fund’s financial statement disclosures.
Note (C) Dividends from Net Investment Income and Distributions of Capital Gains: Dividends and distributions to shareholders are recorded on the ex-dividend date. River Road Dividend All Cap Value Fund, River Road Dividend All Cap Value Fund II, DoubleLine Core Plus Fixed Income Fund and TCH Fixed Income Fund distribute dividends from net investment income to shareholders monthly and net realized gains from investment transactions, if any, are generally distributed annually, usually in December.
Anchor Capital Enhanced Equity Fund and M&C Balanced Fund distribute dividends from net investment income to shareholders
quarterly and net realized gains from investment transactions, if any, are generally distributed annually, usually in December.
The following Funds distribute dividends from net investment income to shareholders annually and net realized gains from investment transactions, if any, are generally distributed annually, usually in December: M&C Growth Fund, TAMRO Diversified Equity Fund, Herndon Large Cap Value Fund, Cornerstone Large Cap Value Fund, Fairpointe Mid Cap Fund, M&C Mid Cap Growth Fund, LMCG Small Cap Growth Fund, Silvercrest Small Cap Fund, TAMRO Small Cap Fund, River Road Select Value Fund, River Road Small Cap Value Fund, River Road Independent Value Fund, Lake Partners LASSO Alternatives Fund, River Road Long-Short Fund, Barings International Fund, LMCG Emerging Markets Fund and Harrison Street Real Estate Fund.
Dividends and distributions are automatically reinvested in additional Fund shares on ex-date at that day’s ending NAV for the respective Fund for those shareholders who have elected the reinvestment option.
Differences in dividends per share between classes of the following Funds are due to different class expenses: M&C Growth Fund, TAMRO Diversified Equity Fund, Herndon Large Cap Value Fund, Cornerstone Large Cap Value Fund, River Road Dividend All Cap Value Fund, River Road Dividend All Cap Value Fund II, Fairpointe Mid Cap Fund, LMCG Small Cap Growth Fund, Silvercrest Small Cap Fund, TAMRO Small Cap Fund, River Road Select Value Fund, River Road Small Cap Value Fund, River Road Independent Value Fund, DoubleLine Core Plus Fixed Income Fund, TCH Fixed Income Fund, Lake Partners LASSO Alternatives Fund, Anchor Capital Enhanced Equity Fund, River Road Long-Short Fund, Barings International Fund, LMCG Emerging Markets Fund, Harrison Street Real Estate Fund and M&C Balanced Fund.
Net investment income and realized gains and losses for federal income tax purposes may differ from those reported on the financial statements because of temporary and permanent book and tax basis differences. Permanent differences, such as net operating losses, disallowed expenses, premium reversals, reclassification of short-term gain to ordinary income, capitalized dividends on short sales, in-kind distribution for redemptions, paydown reclass, reversal of prior year writeoff of capital loss carryovers, redesignation of dividends paid, partnership reclasses and adjustment for Real Estate Investment Trusts, are reclassified among capital accounts in the financial statements to reflect their character. Temporary differences, such as deferrals on losses relating to wash sales transactions, amortization of offering costs, premium amortization, current year dividends payable, passive foreign investment company adjustments and capital loss carryovers, arise when income, expenses, gains or losses are recognized in different periods for financial statement and tax purposes; these differences will reverse at some time in the future.
Distributions from net realized gains for book purposes may include short-term capital gains, which are classified as ordinary income for tax purposes.
| | |
| |
| | April 30, 2013 |
| |
| Notes to Financial Statements (unaudited) – continued | | |
The tax character of distributions paid during the fiscal years ended 2012 and 2011 was as follows:
| | | | | | | | | | | | | | | | |
| | | Distributions Paid in 2012 | | | Distributions Paid in 2011 | |
| | | Ordinary Income | | | Long-Term
Capital Gains | | | Ordinary Income | | | Long-Term
Capital Gains | |
| | | | | | | | | | | | | | | | |
| | | | | | | | | | | | | | | | |
| M&C Growth Fund | | $ | 22,081,432 | | | $ | 257,690,139 | | | $ | 20,834,824 | | | $ | 5,383,920 | |
| TAMRO Diversified Equity Fund | | | — | | | | 473,355 | | | | — | | | | — | |
| Herndon Large Cap Value Fund | | | 1,044,862 | | | | 124,149 | | | | 13,657 | | | | — | |
| Cornerstone Large Cap Value Fund | | | 110,939 | | | | — | | | | 1,807,144 | | | | — | |
| River Road Dividend All Cap Value Fund | | | 22,890,654 | | | | 4,651,009 | | | | 10,476,590 | | | | 118,593 | |
| River Road Dividend All Cap Value Fund II | | | 42,004 | | | | — | | | | — | | | | — | |
| Fairpointe Mid Cap Fund | | | 8,163,228 | | | | 18,767,770 | | | | 6,035,391 | | | | 5,436,739 | |
| TAMRO Small Cap Fund | | | — | | | | 97,192,931 | | | | — | | | | 19,802,159 | |
| River Road Select Value Fund | | | 1,196,413 | | | | 28,132,801 | | | | 1,134,027 | | | | 1,959,747 | |
| River Road Small Cap Value Fund | | | — | | | | — | | | | 2,048,490 | | | | — | |
| River Road Independent Value Fund | | | 5,597,522 | | | | 100,643 | | | | — | | | | — | |
| DoubleLine Core Plus Fixed Income Fund | | | 3,389,167 | | | | — | | | | 190,808 | | | | — | |
| TCH Fixed Income Fund | | | 3,234,814 | | | | — | | | | 2,810,584 | | | | — | |
| Lake Partners LASSO Alternatives Fund | | | 3,680,936 | | | | — | | | | 454,894 | | | | 448 | |
| Anchor Capital Enhanced Equity Fund | | | 12,244,228 | | | | 2,409,141 | | | | 5,872,771 | | | | — | |
| Barings International Fund | | | 509,770 | | | | 1,380,720 | | | | 1,019,611 | | | | — | |
| Harrison Street Real Estate Fund | | | 47,575 | | | | — | | | | 627,254 | | | | — | |
| M&C Balanced Fund | | | 331,475 | | | | — | | | | 312,292 | | | | — | |
As of October 31, 2012, the most recent tax year end, the components of distributable earnings on a tax basis were as follows:
| | | | | | | | | | | | | | | | | | | | |
| | | Accumulated
Capital and
Other Losses | | | Undistributed
Ordinary Income | | | Undistributed
Long-Term Gain | | | Unrealized
Appreciation
(Depreciation) | | | Total | |
| | | | | | | | | | | | | | | | | | | | |
| M&C Growth Fund | | $ | (12,098,064 | ) | | $ | 33,942,232 | | | $ | 275,099,058 | | | $ | 459,648,376 | | | $ | 756,591,602 | |
| TAMRO Diversified Equity Fund | | | — | | | | 830 | | | | 25,756 | | | | 4,240,679 | | | | 4,267,265 | |
| Herndon Large Cap Value Fund | | | — | | | | 1,678,137 | | | | 4,508 | | | | 412,721 | | | | 2,095,366 | |
| Cornerstone Large Cap Value Fund | | | (28,085,101 | ) | | | 130,056 | | | | — | | | | 1,399,087 | | | | (26,555,958 | ) |
| River Road Dividend All Cap Value Fund | | | — | | | | 8,345,565 | | | | 26,559,658 | | | | 92,343,115 | | | | 127,248,338 | |
| River Road Dividend All Cap Value Fund II | | | — | | | | 18,055 | | | | — | | | | (48,603 | ) | | | (30,548 | ) |
| Fairpointe Mid Cap Fund | | | — | | | | 13,547,048 | | | | 66,049,888 | | | | 485,270,647 | | | | 564,867,583 | |
| M&C Mid Cap Growth Fund | | | (37,681 | ) | | | — | | | | 92,379 | | | | 848,955 | | | | 903,653 | |
| LMCG Small Cap Growth Fund | | | — | | | | 389,762 | | | | 47,265 | | | | 334,113 | | | | 771,140 | |
| Silvercrest Small Cap Fund | | | — | | | | 68,147 | | | | 649 | | | | 103,316 | | | | 172,112 | |
| TAMRO Small Cap Fund | | | — | | | | 18,818,417 | | | | 74,805,986 | | | | 188,601,423 | | | | 282,225,826 | |
| River Road Select Value Fund | | | — | | | | 1,038,194 | | | | 8,698,768 | | | | 20,831,044 | | | | 30,568,006 | |
| River Road Small Cap Value Fund | | | — | | | | 1,328,652 | | | | 9,066,096 | | | | 65,718,103 | | | | 76,112,851 | |
| River Road Independent Value Fund | | | — | | | | 38,493,742 | | | | — | | | | 2,446,974 | | | | 40,940,716 | |
| DoubleLine Core Plus Fixed Income Fund | | | — | | | | 1,274,175 | | | | 22,764 | | | | 4,714,088 | | | | 6,011,027 | |
| TCH Fixed Income Fund | | | (6,257,447 | ) | | | 47,411 | | | | — | | | | 7,374,593 | | | | 1,164,557 | |
| Lake Partners LASSO Alternatives Fund | | | (4,870,141 | ) | | | 781,026 | | | | — | | | | 7,800,212 | | | | 3,711,097 | |
| Anchor Capital Enhanced Equity Fund | | | — | | | | 2,487,451 | | | | 556,618 | | | | (8,640,364 | ) | | | (5,596,295 | ) |
| River Road Long-Short Fund | | | — | | | | 406,152 | | | | 21,693 | | | | (6 | ) | | | 427,839 | |
| Barings International Fund | | | — | | | | 1,201,598 | | | | 549,691 | | | | 790,834 | | | | 2,542,123 | |
| Harrison Street Real Estate Fund | | | (13,177,471 | ) | | | 125,494 | | | | — | | | | 447,305 | | | | (12,604,672 | ) |
| M&C Balanced Fund | | | (1,726,376 | ) | | | 33,019 | | | | — | | | | 2,601,553 | | | | 908,196 | |
Note (D) Shares of Beneficial Interest: Each Fund is authorized to issue an unlimited number of shares of beneficial interest with no par value. Share transactions of the Funds were as follows:
Six Months Ended April 30, 2013
| | | | | | | | | | | | | | | | |
Class N | | Sold | | | Proceeds From
Reinvestment
of Distributions | | | Redeemed | | | Net Increase
(Decrease) in
Shares Outstanding | |
| M&C Growth Fund | | | 7,245,652 | | | | 5,984,433 | | | | (7,831,413 | ) | | | 5,398,672 | |
| TAMRO Diversified Equity Fund | | | 171,549 | | | | 5,057 | | | | (168,966 | ) | | | 7,640 | |
| Herndon Large Cap Value Fund | | | 1,196,355 | | | | 77,295 | | | | (363,030 | ) | | | 910,620 | |
| Cornerstone Large Cap Value Fund | | | 311,558 | | | | 18,800 | | | | (160,494 | ) | | | 169,864 | |
| | |
| |
| | April 30, 2013 |
| |
| Notes to Financial Statements (unaudited) – continued | | |
| | | | | | | | | | | | | | | | | | | | |
Class N | | Sold | | | Issued From
Merger | | | Proceeds From
Reinvestment
of Distributions | | | Redeemed | | | Net Increase
(Decrease) in
Shares Outstanding | |
| River Road Dividend All Cap Value Fund | | | 2,187,422 | | | | — | | | | 1,510,675 | | | | (1,789,728 | ) | | | 1,908,369 | |
| River Road Dividend All Cap Value Fund II | | | 155,206 | | | | — | | | | 1,350 | | | | (57,092 | ) | | | 99,464 | |
| Fairpointe Mid Cap Fund | | | 7,964,169 | | | | — | | | | 1,435,859 | | | | (8,307,589 | ) | | | 1,092,439 | |
| M&C Mid Cap Growth Fund | | | 484,967 | | | | — | | | | 7,828 | | | | (69,093 | ) | | | 423,702 | |
| LMCG Small Cap Growth Fund | | | 211,485 | | | | 1,557,689 | | | | 38,933 | | | | (129,976 | ) | | | 1,678,131 | |
| Silvercrest Small Cap Fund | | | 87,929 | | | | — | | | | 1,162 | | | | (47,159 | ) | | | 41,932 | |
| TAMRO Small Cap Fund | | | 2,274,481 | | | | — | | | | 1,892,026 | | | | (3,046,033 | ) | | | 1,120,474 | |
| River Road Select Value Fund | | | 758,086 | | | | — | | | | 56,761 | | | | (143,553 | ) | | | 671,294 | |
| River Road Small Cap Value Fund | | | 251,214 | | | | — | | | | 169,935 | | | | (513,934 | ) | | | (92,785 | ) |
| River Road Independent Value Fund | | | 5,981,945 | | | | — | | | | 1,889,377 | | | | (8,698,952 | ) | | | (827,630 | ) |
| DoubleLine Core Plus Fixed Income Fund | | | 3,635,670 | | | | — | | | | 169,224 | | | | (1,623,192 | ) | | | 2,181,702 | |
| TCH Fixed Income Fund | | | 732,058 | | | | — | | | | 104,191 | | | | (879,764 | ) | | | (43,515 | ) |
| Lake Partners LASSO Alternatives Fund | | | 1,441,467 | | | | — | | | | 36,352 | | | | (977,847 | ) | | | 499,972 | |
| Anchor Capital Enhanced Equity Fund | | | 2,041,341 | | | | — | | | | 324,017 | | | | (4,891,769 | ) | | | (2,526,411 | ) |
| River Road Long-Short Fund | | | 1,445,200 | | | | — | | | | 42,565 | | | | (480,235 | ) | | | 1,007,530 | |
| Barings International Fund | | | 2,147 | | | | — | | | | 1,555 | | | | (2,075 | ) | | | 1,627 | |
| LMCG Emerging Markets Fund (a) | | | 67,641 | | | | — | | | | — | | | | — | | | | 67,641 | |
| Harrison Street Real Estate Fund | | | 363,997 | | | | — | | | | 14,559 | | | | (337,814 | ) | | | 40,742 | |
| M&C Balanced Fund | | | 86,838 | | | | — | | | | 9,387 | | | | (480,677 | ) | | | (384,452 | ) |
| (a) | LMCG Emerging Markets Fund began issuing Class N shares on March 27, 2013. |
| | | | | | | | | | | | | | | | | | | | |
Class I | | Sold | | | Issued From
Merger | | | Proceeds From
Reinvestment
of Distributions | | | Redeemed | | | Net Increase
(Decrease) in
Shares Outstanding | |
M&C Growth Fund | | | 17,240,793 | | | | — | | | | 5,907,892 | | | | (15,337,803 | ) | | | 7,810,882 | |
TAMRO Diversified Equity Fund | | | 13,845 | | | | — | | | | 251 | | | | (1,050 | ) | | | 13,046 | |
Herndon Large Cap Value Fund | | | 1,711,518 | | | | — | | | | 85,484 | | | | (203,312 | ) | | | 1,593,690 | |
Cornerstone Large Cap Value Fund | | | 992,480 | | | | — | | | | 5,555 | | | | (103,506 | ) | | | 894,529 | |
River Road Dividend All Cap Value Fund | | | 8,929,319 | | | | — | | | | 1,899,271 | | | | (7,426,265 | ) | | | 3,402,325 | |
River Road Dividend All Cap Value Fund II | | | 3,509,373 | | | | — | | | | 22,994 | | | | (32,347 | ) | | | 3,500,020 | |
Fairpointe Mid Cap Fund | | | 10,258,256 | | | | — | | | | 1,027,798 | | | | (7,675,655 | ) | | | 3,610,399 | |
LMCG Small Cap Growth Fund | | | 198,735 | | | | 86,108 | | | | 5,342 | | | | (2,098 | ) | | | 288,087 | |
Sillvercrest Small Cap Fund | | | 475,198 | | | | — | | | | 8,931 | | | | (21,661 | ) | | | 462,468 | |
TAMRO Small Cap Fund (a) | | | 5,037,501 | | | | — | | | | 2,234,145 | | | | (6,494,282 | ) | | | 777,364 | |
River Road Select Value Fund | | | 3,812,957 | | | | — | | | | 1,237,782 | | | | (3,500,674 | ) | | | 1,550,065 | |
River Road Small Cap Value Fund | | | 1,678,823 | | | | — | | | | 913,112 | | | | (2,090,350 | ) | | | 501,585 | |
River Road Independent Value Fund (b) | | | 6,928,925 | | | | — | | | | 1,729,407 | | | | (3,551,886 | ) | | | 5,106,446 | |
DoubleLine Core Plus Fixed Income Fund | | | 3,685,961 | | | | — | | | | 209,036 | | | | (1,184,140 | ) | | | 2,710,857 | |
TCH Fixed Income Fund | | | 70,652 | | | | — | | | | 17,167 | | | | (106,224 | ) | | | (18,405 | ) |
Lake Partners LASSO Alternatives Fund | | | 7,856,986 | | | | — | | | | 259,746 | | | | (3,492,509 | ) | | | 4,624,223 | |
Anchor Capital Enhanced Equity Fund | | | 2,208,613 | | | | — | | | | 167,948 | | | | (5,590,366 | ) | | | (3,213,805 | ) |
| River Road Long-Short Fund (c) | | | 631,664 | | | | — | | | | — | | | | (9 | ) | | | 631,655 | |
Barings International Fund | | | 1,493,102 | | | | — | | | | 224,097 | | | | (1,364,760 | ) | | | 352,439 | |
LMCG Emerging Markets Fund (d) | | | 341,891 | | | | — | | | | — | | | | — | | | | 341,891 | |
Harrison Street Real Estate Fund | | | 3,816 | | | | — | | | | 182 | | | | (760 | ) | | | 3,238 | |
M&C Balanced Fund | | | 5,636 | | | | — | | | | 254 | | | | (16,219 | ) | | | (10,329 | ) |
| (a) | TAMRO Small Cap Fund had a subscription-in-kind in the amount of $2,677,539 on April 25, 2013. The subscription was comprised of securities, cash and dividends accrued in the amounts of $2,657,373, $19,712 and $453, respectively. The Fund also had a redemption-in-kind in the amount of $52,573,290 on January 15, 2013. The redemption was comprised of securities and cash in the amounts of $51,794,423 and $778,867, respectively. |
| (b) | River Road Independent Value Fund had a subscription-in-kind in the amount of $597,549 on March 27, 2013. The subscription was comprised of securities, cash and dividends accrued in the amounts of $258,478, $338,808 and $262, respectively. |
| (c) | River Road Long-Short Fund began issuing Class I shares on March 1, 2013. |
| (d) | LMCG Emerging Markets Fund began issuing Class I shares on March 27, 2013. |
| | | | | | | | | | | | | | | | |
Class R | | Sold | | | Proceeds From
Reinvestment of
Distributions | | | Redeemed | | | Net
Increase in
Shares Outstanding | |
| M&C Growth Fund | | | 53,704 | | | | 21,706 | | | | (50,238 | ) | | | 25,172 | |
| | |
| |
| | April 30, 2013 |
| |
| Notes to Financial Statements (unaudited) – continued | | |
Year Ended October 31, 2012
| | | | | | | | | | | | | | | | |
Class N | | Sold | | | Proceeds From
Reinvestment
of Distributions | | | Redeemed | | | Net Increase
(Decrease) in
Shares Outstanding | |
| M&C Growth Fund | | | 18,041,363 | | | | 5,664,499 | | | | (16,394,064 | ) | | | 7,311,798 | |
| TAMRO Diversified Equity Fund | | | 210,627 | | | | 38,289 | | | | (597,734 | ) | | | (348,818 | ) |
| Herndon Large Cap Value Fund | | | 1,664,603 | | | | 39,719 | | | | (466,689 | ) | | | 1,237,633 | |
| Cornerstone Large Cap Value Fund | | | 574,279 | | | | 10,721 | | | | (1,126,860 | ) | | | (541,860 | ) |
| River Road Dividend All Cap Value Fund | | | 10,262,549 | | | | 985,104 | | | | (10,485,646 | ) | | | 762,007 | |
| River Road Dividend All Cap Value Fund II (a) | | | 100,138 | | | | 373 | | | | (40 | ) | | | 100,471 | |
| Fairpointe Mid Cap Fund | | | 13,920,692 | | | | 417,341 | | | | (17,204,213 | ) | | | (2,866,180 | ) |
| M&C Mid Cap Growth Fund | | | 296,901 | | | | — | | | | (49,540 | ) | | | 247,361 | |
| LMCG Small Cap Growth Fund | | | 94,914 | | | | — | | | | (143,050 | ) | | | (48,136 | ) |
| Silvercrest Small Cap Fund (b) | | | 69,067 | | | | — | | | | (306 | ) | | | 68,761 | |
| TAMRO Small Cap Fund | | | 4,990,377 | | | | 1,982,107 | | | | (6,291,677 | ) | | | 680,807 | |
| River Road Select Value Fund | | | 248,746 | | | | 332,250 | | | | (1,222,289 | ) | | | (641,293 | ) |
| River Road Small Cap Value Fund | | | 862,257 | | | | — | | | | (4,725,116 | ) | | | (3,862,859 | ) |
| River Road Independent Value Fund | | | 18,469,468 | | | | 339,193 | | | | (15,564,710 | ) | | | 3,243,951 | |
| DoubleLine Core Plus Fixed Income Fund | | | 6,542,470 | | | | 124,012 | | | | (2,391,890 | ) | | | 4,274,592 | |
| TCH Fixed Income Fund | | | 1,111,218 | | | | 245,495 | | | | (1,865,034 | ) | | | (508,321 | ) |
| Lake Partners LASSO Alternatives Fund | | | 1,713,847 | | | | 21,588 | | | | (489,123 | ) | | | 1,246,312 | |
| Anchor Capital Enhanced Equity Fund | | | 10,363,817 | | | | 763,094 | | | | (3,930,442 | ) | | | 7,196,469 | |
| River Road Long-Short Fund | | | 290,834 | | | | — | | | | (54,850 | ) | | | 235,984 | |
| Barings International Fund | | | 1,673 | | | | 1,945 | | | | (43 | ) | | | 3,575 | |
| Harrison Street Real Estate Fund | | | 621,290 | | | | 4,957 | | | | (337,947 | ) | | | 288,300 | |
| M&C Balanced Fund | | | 584,267 | | | | 14,308 | | | | (289,262 | ) | | | 309,313 | |
| (a) | River Road Dividend All Cap Value Fund II began issuing Class N shares on June 26, 2012. |
| (b) | Silvercrest Small Cap Fund began issuing Class N shares on December 23, 2011. |
| | | | | | | | | | | | | | | | |
Class I | | Sold | | | Proceeds From
Reinvestment
of Distributions | | | Redeemed | | | Net Increase
(Decrease) in
Shares Outstanding | |
| M&C Growth Fund | | | 43,042,995 | | | | 4,364,756 | | | | (23,294,443 | ) | | | 24,113,308 | |
| TAMRO Diversified Equity Fund (a) | | | 44,338 | | | | — | | | | (2,319 | ) | | | 42,019 | |
| Herndon Large Cap Value Fund | | | 2,306,966 | | | | 73,629 | | | | (485,691 | ) | | | 1,894,904 | |
| Cornerstone Large Cap Value Fund | | | 485,538 | | | | 58 | | | | (10,500 | ) | | | 475,096 | |
| River Road Dividend All Cap Value Fund | | | 24,480,603 | | | | 1,049,359 | | | | (5,161,671 | ) | | | 20,368,291 | |
| River Road Dividend All Cap Value Fund II (b) | | | 894,279 | | | | 3,478 | | | | (952 | ) | | | 896,805 | |
| Fairpointe Mid Cap Fund (c) | | | 20,254,334 | | | | 327,743 | | | | (20,929,526 | ) | | | (347,449 | ) |
| LMCG Small Cap Growth Fund (d) | | | 25,824 | | | | — | | | | (215,934 | ) | | | (190,110 | ) |
| Silvercrest Small Cap Fund (e) (f) | | | 694,135 | | | | — | | | | (240,046 | ) | | | 454,089 | |
| TAMRO Small Cap Fund (g) | | | 7,501,659 | | | | 2,242,345 | | | | (9,314,452 | ) | | | 429,552 | |
| River Road Select Value Fund | | | 6,030,361 | | | | 2,982,288 | | | | (4,372,992 | ) | | | 4,639,657 | |
| River Road Small Cap Value Fund | | | 3,570,354 | | | | — | | | | (6,081,336 | ) | | | (2,510,982 | ) |
| River Road Independent Value Fund | | | 25,305,662 | | | | 189,732 | | | | (3,918,323 | ) | | | 21,577,071 | |
| DoubleLine Core Plus Fixed Income Fund | | | 9,567,318 | | | | 177,202 | | | | (684,564 | ) | | | 9,059,956 | |
| TCH Fixed Income Fund | | | 308,748 | | | | 35,661 | | | | (393,122 | ) | | | (48,713 | ) |
| Lake Partners LASSO Alternatives Fund | | | 8,580,923 | | | | 148,112 | | | | (4,201,794 | ) | | | 4,527,241 | |
| Anchor Capital Enhanced Equity Fund | | | 4,796,811 | | | | 678,182 | | | | (3,978,006 | ) | | | 1,496,987 | |
| Barings International Fund | | | 2,684,137 | | | | 187,976 | | | | (1,593,922 | ) | | | 1,278,191 | |
| Harrison Street Real Estate Fund (h) | | | 20,224 | | | | 61 | | | | (3,696,962 | ) | | | (3,676,677 | ) |
| M&C Balanced Fund | | | 30,540 | | | | 428 | | | | (11,383 | ) | | | 19,585 | |
| (a) | TAMRO Diversified Equity Fund began issuing Class I shares on March 1, 2012. |
| (b) | River Road Dividend All Cap Value Fund II began issuing Class I shares on June 26, 2012. |
| (c) | Fairpointe Mid Cap Fund had a redemption-in-kind in the amount of $38,722,763 on January 13, 2012. The redemption was comprised of securities and cash in the amounts of $38,179,960 and $542,803, respectively. |
| (d) | LMCG Small Cap Growth Fund had a redemption-in-kind in the amount of $2,554,395 on September 25, 2012. The redemption was comprised of securities and cash in the amounts of $2,419,219 and $135,175, respectively. |
| (e) | Silvercrest Small Cap Fund began issuing Class I shares on December 23, 2011. |
| (f) | Silvercrest Small Cap Fund had a redemption-in-kind in the amount of $2,608,977 on April 26, 2012. The redemption was comprised of securities and cash in the amounts of $2,579,146 and $29,831, respectively. |
| (g) | TAMRO Small Cap Fund had redemptions-in-kind in the amount of $40,667,980 and $7,010,475 on May 1, 2012 and June 27, 2012, respectively. The redemption was comprised of securities and cash in the amounts of $39,335,174 and $6,762,586, respectively and $1,332,806 and $247,889, respectively. |
| (h) | Harrison Street Real Estate Fund had a redemption-in-kind in the amount of $31,399,368 on December 2, 2011. The redemption was comprised of securities and cash in the amounts of $30,913,574 and $485,794, respectively. |
| | |
| |
| | April 30, 2013 |
| |
| Notes to Financial Statements (unaudited) – continued | | |
| | | | | | | | | | | | | | | | |
Class R | | Sold | | | Proceeds From
Reinvestment of
Distributions | | | Redeemed | | | Net
Decrease in
Shares Outstanding | |
| M&C Growth Fund | | | 100,372 | | | | 23,324 | | | | (127,056 | ) | | | (3,360 | ) |
Note (E) Investment Transactions: Aggregate purchases and proceeds from sales and maturities of investment securities (other than short-term investments) for the six months ended April 30, 2013 were as follows:
| | | | | | | | | | | | | | | | |
| | | Aggregate Purchases | | | Proceeds from Sales | |
| | | U.S. Government | | | Other | | | U.S. Government | | | Other | |
| M&C Growth Fund | | $ | — | | | $ | 1,264,401,375 | | | $ | — | | | $ | 999,310,081 | |
| TAMRO Diversified Equity Fund | | | — | | | | 7,113,301 | | | | — | | | | 7,137,661 | |
| Herndon Large Cap Value Fund | | | — | | | | 57,939,035 | | | | — | | | | 29,709,867 | |
| Cornerstone Large Cap Value Fund | | | — | | | | 20,151,759 | | | | — | | | | 8,692,344 | |
| River Road Dividend All Cap Value Fund | | | — | | | | 195,148,620 | | | | — | | | | 165,877,469 | |
| River Road Dividend All Cap Value Fund II | | | — | | | | 41,592,574 | | | | — | | | | 2,721,482 | |
| Fairpointe Mid Cap Fund | | | — | | | | 522,923,985 | | | | — | | | | 507,885,258 | |
| M&C Mid Cap Growth Fund | | | — | | | | 6,587,823 | | | | — | | | | 2,081,726 | |
| LMCG Small Cap Growth Fund (a) | | | — | | | | 12,262,673 | | | | — | | | | 8,019,210 | |
| Silvercrest Small Cap Fund | | | — | | | | 7,890,031 | | | | — | | | | 2,120,017 | |
| TAMRO Small Cap Fund (b) | | | — | | | | 337,107,939 | | | | — | | | | 363,357,205 | |
| River Road Select Value Fund | | | — | | | | 75,892,447 | | | | — | | | | 68,423,603 | |
| River Road Small Cap Value Fund | | | — | | | | 95,273,103 | | | | — | | | | 101,569,480 | |
| River Road Independent Value Fund (c) | | | — | | | | 180,787,969 | | | | — | | | | 229,880,938 | |
| DoubleLine Core Plus Fixed Income Fund | | | 89,578,583 | | | | 70,433,808 | | | | 73,007,941 | | | | 30,754,669 | |
| TCH Fixed Income Fund | | | 5,838,663 | | | | 10,838,992 | | | | 4,474,341 | | | | 12,544,441 | |
| Lake Partners LASSO Alternatives Fund | | | — | | | | 134,032,343 | | | | — | | | | 57,971,706 | |
| Anchor Capital Enhanced Equity Fund | | | — | | | | 51,725,431 | | | | — | | | | 117,481,582 | |
| River Road Long-Short Fund | | | — | | | | 27,023,603 | | | | — | | | | 15,419,192 | |
Barings International Fund | | | — | | | | 23,275,002 | | | | — | | | | 19,126,132 | |
LMCG Emerging Markets Fund | | | — | | | | 6,055,509 | | | | — | | | | 2,099,298 | |
Harrison Street Real Estate Fund | | | — | | | | 7,714,758 | | | | — | | | | 7,323,209 | |
M&C Balanced Fund | | | — | | | | 5,026,473 | | | | 1,301,729 | | | | 11,226,883 | |
| (a) | The cost of purchases excludes securities received from the reorganization (Note J). |
| (b) | TAMRO Small Cap Fund had a subscription-in-kind in the amount of $2,677,539 on April 25, 2013, which is excluded from the aggregate purchases above. The subscription was comprised of securities, cash and dividends accrued in the amounts of $2,657,373, $19,712 and $453, respectively. The Fund also had a redemption-in-kind in the amount of $52,573,290 on January 15, 2013, which is excluded from the proceeds from sales above. The redemption was comprised of securities and cash in the amounts of $51,794,423 and $778,867, respectively. |
| (c) | River Road Independent Value Fund had a subscription-in-kind in the amount of $597,549 on March 27, 2013, which is excluded from the aggregate purchases above. The subscription was comprised of securities, cash and dividends accrued in the amounts of $258,478, $338,808 and $262, respectively. |
Note (F) Redemption Fees: In accordance with the prospectus, certain Funds assessed a 2% redemption fee on Fund share redemptions and exchanges within specified time periods, as indicated in the following table for the six months ended April 30, 2013 and included in the Cost of Shares redeemed on the Statements of Changes in Net Assets:
| | | | | | |
Fund Name | | Time Period | | Amount | |
| Barings International Fund | | 2% Within 90 Days | | $ | 1,230 | |
| Harrison Street Real Estate Fund | | 2% Within 90 Days | | | 1,483 | |
| LMCG Emerging Markets Fund | | 2% Within 90 Days | | | — | |
Note (G) Advisory, Administration, Distribution Services and Trustee Agreements:
Advisory. Aston serves as investment adviser and administrator to the Funds. Under the terms of the investment advisory agreement for the Funds (the “Investment Advisory Agreement”), fees are accrued daily and paid monthly, based on specific annual rates of average daily net assets. The factors considered by the Board of Trustees in approving the current Investment Advisory Agreement are included in the Funds’ annual or semi-annual report to shareholders covering the period during which the approval occurred.
Certain Funds are subject to an expense limitation agreement with the Adviser, pursuant to which annual ordinary operating expenses for Class N and Class I shareholders are capped at certain specified annual rates of average daily net assets. There are no contractual expense limitations for Class R shareholders.
| | |
| |
| | April 30, 2013 |
| |
| Notes to Financial Statements (unaudited) – continued | | |
The contractual expense limitations for the Funds are effective through February 28, 2014, except as noted below. The advisory rates and contractual expense limitations for the six months ended April 30, 2013 were as follows:
| | | | | | |
| | | | | Contractual Expense Limitations |
Fund Name | | Advisory Fees | | Class N | | Class I |
| M&C Growth Fund | | 0.80% on first $800,000,000 | | | | |
| | 0.60% over $800,000,000 up to $6 billion | | | | |
| | 0.55% over $6 billion up to $12 billion
0.50% over $12 billion | | N/A | | N/A |
| TAMRO Diversified Equity Fund | | 0.80% | | 1.20% | | 0.95% |
| Herndon Large Cap Value Fund | | 0.80% | | 1.30%(a) | | 1.05%(a) |
| Cornerstone Large Cap Value Fund | | 0.80% | | 1.30% | | 1.05% |
| River Road Dividend All Cap Value Fund | | 0.70% | | 1.30% | | 1.05% |
| River Road Dividend All Cap Value Fund II | | 0.70% | | 1.30%(a) | | 1.05%(a) |
| Fairpointe Mid Cap Fund | | 0.80% on first $100,000,000 | | | | |
| | 0.75% next $300,000,000 | | | | |
| | 0.70% over $400,000,000 | | N/A | | N/A |
| M&C Mid Cap Growth Fund | | 0.85% | | 1.25%(a) | | N/A |
| LMCG Small Cap Growth Fund | | 1.00% | | 1.35%(a) | | 1.10%(a) |
| Silvercrest Small Cap Growth | | 1.00% | | 1.40%(a) | | 1.15%(a) |
| TAMRO Small Cap Fund | | 0.90% | | N/A | | N/A |
| River Road Select Value Fund | | 1.00% | | 1.50% | | 1.25% |
| River Road Small Cap Value Fund | | 0.90% | | N/A | | N/A |
| River Road Independent Value Fund | | 1.00% | | 1.42%(a) | | 1.17%(a) |
| DoubleLine Core Plus Fixed Income Fund | | 0.55% | | 0.94%(a) | | 0.69%(a) |
| TCH Fixed Income Fund | | 0.55% | | 0.94% | | 0.69% |
| Lake Partners LASSO Alternatives Fund | | 1.00% | | 1.45%(a) | | 1.20%(a) |
| Anchor Capital Enhanced Equity Fund | | 0.70% | | 1.40% | | 1.15% |
| River Road Long-Short Fund (b) | | 1.20% | | 1.70%(a) | | 1.45%(a) |
| Barings International Fund | | 1.00% | | 1.40%(a) | | 1.15%(a) |
| LMCG Emerging Markets Fund (c) | | 1.05% | | 1.65%(a)* | | 1.40%(a)* |
| Harrison Street Real Estate Fund | | 1.00% | | 1.37% | | 1.12% |
| M&C Balanced Fund | | 0.75% | | 1.35% | | 1.10% |
| (a) | Pursuant to a contractual expense reimbursement agreement between the Adviser and the Fund, from commencement of operations through the completion of the first three full fiscal years for a period up to three years from the fiscal year end during which such amount was waived or reduced, the Adviser is entitled to be reimbursed by the Fund for previously waived fees and reimbursed expenses to the extent that the Fund’s expense ratio (not including interest, taxes, other investment-related costs (such as brokerage commissions), extraordinary expenses and acquired fund fees and expenses,) remains below the operating expense cap after such reimbursement. |
| (b) | River Road Long-Short Fund began issuing Class I shares on March 1, 2013. |
| (c) | LMCG Emerging Markets Fund began issuing Class N and Class I shares on March 27, 2013. |
| * | The contractual expense limitation for LMCG Emerging Markets Fund is in effect through March 31, 2014. |
Pursuant to a contractual expense reimbursement agreement between the Adviser and the following Funds, from commencement of operations through the completion of the first three full fiscal years for a period of up to three years from the fiscal year end during which the Advisor waived its advisory fees or reimbursed expenses for each of Herndon Large Cap Value Fund-Classes N and I, River Road Dividend All Cap Value Fund II-Classes N and I, M&C Mid Cap Growth Fund-Class N, LMCG Small Cap Growth Fund-Classes N and I, Silvercrest Small Cap Fund-Classes N and I, River Road Select Value Fund-Classes N and I, River Road Independent Value Fund-Classes N and I, DoubleLine Core Plus Fixed Income Fund-Classes N and I, Lake Partners LASSO Alternatives Fund-Classes N and I, River Road Long-Short Fund-Classes N and I, Barings International Fund-Classes N and I and LMCG Emerging Markets Fund-Classes N and I, the Adviser is entitled to be reimbursed by each Fund for such previously waived fees and reimbursed expenses to the extent that each Fund’s expense ratio (not including interest, taxes, other investment-related costs (such as brokerage commissions), extraordinary expenses and acquired fund fees and expenses) remains below the operating expense cap after such reimbursement.
As of April 30, 2013, the cumulative amounts that are subject to recoupment by the Adviser for each Fund are as follows:
| | | | | | | | | | | | | | | | |
| | | Expiration | |
| | | 2013 | | | 2014 | | | 2015 | | | 2016 | |
| Herndon Large Cap Value Fund | | $ | 71,086 | | | $ | 129,816 | | | $ | 42,793 | | | $ | — | |
| River Road Dividend All Cap Value Fund II | | | N/A | | | | N/A | | | | 59,860 | | | | 50,906 | |
| Montag & Caldwell Mid Cap Growth Fund | | | 67,970 | | | | 72,010 | | | | N/A | | | | N/A | |
| LMCG Small Cap Growth Fund | | | N/A | | | | 190,704 | | | | 123,269 | | | | 77,572 | |
| Silvercrest Small Cap Fund | | | N/A | | | | N/A | | | | 147,166 | | | | 51,605 | |
| River Road Select Value Fund | | | — | | | | N/A | | | | N/A | | | | N/A | |
| River Road Independent Value Fund | | | N/A | | | | 222,622 | | | | 143,528 | | | | — | |
| DoubleLine Core Plus Fixed Income Fund | | | N/A | | | | 105,633 | | | | 389,195 | | | | 82,341 | |
| Lake Partners LASSO Alternatives Fund | | | 83,001 | | | | 87,814 | | | | N/A | | | | — | |
| River Road Long-Short Fund | | | N/A | | | | 97,108 | | | | 110,750 | | | | 42,121 | |
| Barings International Fund | | | 134,828 | | | | 147,896 | | | | N/A | | | | N/A | |
| LMCG Emerging Markets Fund (1) | | | N/A | | | | N/A | | | | N/A | | | | 24,711 | |
| | | | | | | | | | | | | | | | |
| Total | | $ | 356,885 | | | $ | 1,053,603 | | | $ | 1,016,561 | | | $ | 329,256 | |
| | | | | | | | | | | | | | | | |
| (1) | The Fund commenced operations in the current fiscal year. |
| | |
| |
| | April 30, 2013 |
| |
| Notes to Financial Statements (unaudited) – continued | | |
Through the six months ended April 30, 2013, the Adviser is eligible to recapture prior year fee waivers and expense reimbursements of $3,198 from Herndon Large Cap Value Fund, $21,849 from River Road Independent Value Fund, and $52,894 from Lake Partners LASSO Alternatives Fund.
The Adviser manages each Fund by retaining one or more Subadvisers to manage each Fund, as follows:
| | |
| Fund | | Subadviser |
M&C Growth Fund | | Montag & Caldwell, LLC |
TAMRO Diversified Equity Fund | | TAMRO Capital Partners LLC |
Herndon Large Cap Value Fund | | Herndon Capital Management, LLC |
Cornerstone Large Cap Value Fund | | Cornerstone Investment Partners, LLC |
River Road Dividend All Cap Value Fund | | River Road Asset Management, LLC |
River Road Dividend All Cap Value Fund II | | River Road Asset Management, LLC |
Fairpointe Mid Cap Fund | | Fairpointe Capital LLC |
M&C Mid Cap Growth Fund | | Montag & Caldwell, LLC |
LMCG Small Cap Growth Fund | | Lee Munder Capital Group, LLC |
Silvercrest Small Cap Fund | | Silvercrest Asset Management Group LLC |
TAMRO Small Cap Fund | | TAMRO Capital Partners LLC |
River Road Select Value Fund | | River Road Asset Management, LLC |
River Road Small Cap Value Fund | | River Road Asset Management, LLC |
River Road Independent Value Fund | | River Road Asset Management, LLC |
DoubleLine Core Plus Fixed Income Fund | | DoubleLine Capital LP |
TCH Fixed Income Fund | | Taplin, Canida & Habacht LLC |
Lake Partners LASSO Alternatives Fund | | Lake Partners, Inc. |
Anchor Capital Enhanced Equity Fund | | Anchor Capital Advisors LLC |
River Road Long-Short Fund | | River Road Asset Management, LLC |
Barings International Fund | | Baring International Investment Limited |
LMCG Emerging Markets Fund | | Lee Munder Capital Group, LLC |
Harrison Street Real Estate Fund | | Harrison Street Securities, LLC |
M&C Balanced Fund | | Montag & Caldwell, LLC |
Subadvisory fees are paid monthly by Aston. The factors considered by the Board of Trustees in approving the current sub-investment advisory agreements for the Funds (each, a “Sub-Investment Advisory Agreement”) are included in the additional information section of the Funds’ annual or semi-annual report to shareholders covering the period in which such approval occurred.
Administration. Under the terms of the administration agreement between the Trust and Aston, the Funds’ administrator (the “Administration Agreement”), administration fees are accrued daily and paid monthly, based on a specified percentage of average daily net assets of the Trust, and base fees are fixed at an annual rate of $12,000 per Fund. The fee is allocated to each Fund based on the relative net assets of the Trust. Administration expenses also include pricing agent fees and compliance-related expenses. The administration fee arrangement is as follows:
| | |
Administration Fees at Trust Level | | Annual Rate |
| |
| First $7.4 billion | | 0.0437% |
| Over $7.4 billion | | 0.0412% |
BNY Mellon Investment Servicing (US) Inc. (“BNY Mellon”) provides certain administrative services to the Funds pursuant to a Sub-administration and Accounting Services Agreement between Aston and BNY Mellon (the “Sub-Administration Agreement”). Under the terms of the Sub-Administration Agreement, sub-administration fees (inclusive of tax services fees), which are paid by Aston, are accrued daily and paid monthly, at a rate of 0.0167% of average daily net assets of the Trust and a base fee at an annual rate of $12,000 per Fund.
Distribution Services. Foreside Funds Distributors LLC (the “Distributor”) serves as principal underwriter and distributor of the Fund’s shares. Pursuant to Rule 12b-1 distribution and service plans (the “Plans”) adopted by the Funds, with respect to Class N shares and Class R shares, the Funds pay certain expenses associated with the distribution of their shares. Under the Plans, each Fund may pay actual expenses not exceeding, on an annual basis, 0.25% of each participating Fund’s Class N average daily net assets and 0.50% of each participating Fund’s Class R average daily net assets. The Class I shares do not have Rule 12b-1 plans. Effective January 1, 2012 the TCH Fixed Income Fund and M&C Balanced Fund reduced their 12b-1 fees to 0.10% and 0.15%, respectively.
Trustees. The Trustees of the Trust who are not affiliated with the Adviser or Subadviser receive an annual retainer and per meeting fees, and they are reimbursed for out-of-pocket expenses for each meeting of the Board of Trustees they attend. The Chairman of the Board and Committee Chairs receive an additional retainer. No officer or employee of the Adviser, of a Subadviser or of their affiliates receives any compensation from the Funds for acting as a Trustee of the Trust. The officers of the Trust receive no compensation directly from the Funds for performing the duties of their offices, except that the Funds compensate the Administrator for providing an officer to serve as the Funds’ Chief Compliance Officer. The aggregate remuneration paid to the Trustees during the six months ended April 30, 2013 was $359,250.
Note (H) Credit Agreement: Effective July 6, 2010 and as amended August 31, 2012, the Trust entered into a Credit Agreement with The Bank of New York Mellon (the “Bank”) which provides the Trust with a revolving line of credit facility of up to $50 million. The facility is shared by each series of the Trust and is available for temporary, emergency purposes including liquidity needs in meeting redemptions. The interest rate on outstanding Alternate Base Rate Loans is equivalent to the greater of the Prime Rate plus 1.25% or 0.50% plus the Federal Funds Effective Rate plus 1.25%. The interest rate on outstanding Overnight Loans is equivalent to the greater of the Federal Funds Effective Rate plus 1.25% or the One Month LIBOR Rate plus 1.25%. The Trust pays a commitment fee on the unutilized commitment amount of 0.12% per annum. The Funds did not utilize the line of credit during the six months ended April 30, 2013.
| | |
| |
| | April 30, 2013 |
| |
| Notes to Financial Statements (unaudited) – continued | | |
Note (I) Fully FDIC-insured Uninvested Deposit Balance Program: Effective July 3, 2012, the Trust entered into a program under which cash that is currently held in custody and trust accounts by the Bank, as custodian for the Trust, would be held in non-interest bearing transaction accounts at the Bank that are fully covered by the FDIC. River Road Independent Value Fund, Lake Partners LASSO Alternatives Fund and Anchor Capital Enhanced Equity Fund have accrued Earnings Credits to offset the Funds’ respective custody and transfer agency fees (including overdraft charges) based on the specified Earnings Credit Rate. The Earnings Credit Rate was 8 basis points on positive balances, subject to adjustment by the Bank. The term of this agreement was June 1, 2012 through December 31, 2012. For the six months ended April 30, 2013, the Funds’ accrued Earnings Credits as follows:
| | | | |
Fund | | Earnings
Credit to Custody
and Transfer
Agency Fees | |
| River Road Independent Value Fund | | $ | 16,493 | |
| Lake Partners LASSO Alternatives Fund | | | 1,855 | |
| Anchor Capital Enhanced Equity Fund | | | 139 | |
Note (J) Reorganization: On December 13, 2012, the Board of Trustees approved an agreement and plan of reorganization (and the related transactions) (the “Agreement”), which provides for (i) the transfer of all the assets of ASTON Small Cap Fund (formerly ASTON/Veredus Small Cap Growth Fund) (the “Small Cap Fund”) to the LMCG Small Cap Growth Fund in exchange
solely for shares of beneficial interest of the LMCG Small Cap Growth Fund and the assumption by the LMCG Small Cap Growth Fund of all the liabilities of the Small Cap Fund; and (ii) the distribution by the Small Cap Fund of all the shares of each class of the LMCG Small Cap Growth Fund received by the Small Cap Fund to the holders of shares of the corresponding class of the Small Cap Fund in complete liquidation and termination of the Small Cap Fund. At a special meeting of shareholders of Small Cap Fund held on April 16, 2013, the shareholders of Small Cap Fund voted to approve the Agreement. The closing date of the reorganization was April 22, 2013.
The results of the voting are as follows:
| | | | | | | | | | | | |
| | | For | | | Against | | | Abstain | |
| ASTON Small Cap Fund | | | 800,546.220 | | | | 28,635.759 | | | | 38,341.525 | |
The acquisition was accomplished by a tax-free exchange of shares on April 19, 2013. For financial reporting purposes, assets received and shares issued by the Small Cap Fund were recorded at fair value on April 19, 2013; however, the cost basis of the investments received from LMCG Small Cap Growth Fund were carried forward to align ongoing reporting of the Small Cap Fund’s realized and unrealized gains and losses with amounts distributable to shareholders for tax purposes. Prior to the merger, the Small Cap Fund had unused capital loss carryforwards. A portion of these capital loss carryforwards can be utilized by LMCG Small Cap Growth Fund in future periods.
The net assets and net unrealized appreciation immediately before the acquisition were as follows:
| | | | | | | | | | | | | | | | | | | | | | | | | | |
Merged Fund | | Acquiring Fund | | Class N
Shares Issued | | | Class N
Net Asset
Value | | | Class N
Conversion
Ratio | | | Class I
Shares Issued | | | Class I
Net Asset
Value | | | Class I
Conversion
Ratio | |
| Small Cap Fund | | LMCG Small Cap Growth Fund | | | 1,557,689 | | | $ | 12.07 | | | | 1.16622 | | | | 86,108 | | | $ | 12.13 | | | | 1.20650 | |
| | | | | | | | | | | | | | |
Merged Fund | | Net Assets | | | Unrealized Depreciation | | | Acquiring Fund | | Net Assets | |
| Small Cap Fund | | $ | 19,844,700 | | | $ | (45,176 | ) | | LMCG Small Cap Growth Fund | | $ | 11,343,723 | |
Assuming the acquisition had been completed on November 1, 2012, the Fund’s results of operations for the six months ended April 30, 2013 are as follows:
| | | | |
| Net investment income | | $ 127,107 | | |
| Net realized and unrealized gain on investments | | 3,613,858 | | |
| Net increase in assets from operations | | 3,740,965 | | |
| | | | |
Because the combined investment portfolios have been managed as a single portfolio since the acquisition was completed, it is not practicable to separate the amounts of revenue and earnings of the Small Cap Fund that have been included in LMCG Small Cap Growth Fund’s statement of operations since April 19, 2013.
Note (K) Liquidations: ASTON/Veredus Select Growth Fund and ASTON Dynamic Allocation Fund were terminated and liquidated on January 30, 2013.
Note (L) Significant Concentrations: Certain Funds may invest a significant percentage of their assets in securities of foreign issuers. These investments may involve certain considerations and risks not typically associated with investments in the United States as a result of, among other factors, the possibility of future political and economic developments and the level of governmental supervision and regulation of securities markets in the respective countries. Some countries in which the Funds invest may require government approval for repatriation of investment income, capital or the proceeds for sales of secu-
| | |
| |
| | April 30, 2013 |
| |
| Notes to Financial Statements (unaudited) – continued | | |
rities by foreign investors. In addition, if there is deterioration in a country’s balance of payments or for other reasons, a country may impose temporary restrictions on foreign capital remittances abroad. In addition, changes in currency exchange rates will affect the value of investments denominated in a foreign currency, as well as investment income derived from those securities.
Note (M) Subsequent Events: Management has evaluated the impact of all subsequent events on the Funds through the date the financial statements were issued, and has determined that there were no subsequent events requiring recognition or disclosure in the financial statements.
| | |
| |
| | April 30, 2013 |
| |
| Additional Information (unaudited) | | |
Form N-Q: The Trust files complete schedules of portfolio holdings for the Funds with the Securities and Exchange Commission (the “SEC”) for the Trust’s first and third quarters of each fiscal year on Form N-Q. The Trust’s Form N-Q are available on the SEC’s website at www.sec.gov and are available for review and copying at the SEC’s Public Reference Room in Washington, DC. Information on the operations of the Public Reference Room may be obtained by calling the SEC at 202-942-8090.
Proxy Voting: The Trust’s Proxy Voting Policies and Procedures, used to determine how to vote proxies relating to portfolio securities, are included in the Trust’s Statement of Additional Information, which is available (i) upon request, without charge, by calling 800-992-8151; (ii) on Aston Funds’ website at www. astonfunds.com; and (iii) on the SEC’s website at www.sec.gov. The Funds’ Proxy Voting Record for the most recent twelve-month period ended June 30 is available without charge (i) on the Funds’ website at www.astonfunds.com; and (ii) on the SEC’s website at www.sec.gov.
FACTORS CONSIDERED BY THE BOARD OF TRUSTEES IN CONNECTION WITH THE APPROVAL OF THE SUB-INVESTMENT ADVISORY AGREEMENT FOR ASTON SMALL CAP FUND
The Board of Trustees (the “Board”) of Aston Funds (the “Trust”), including the trustees who are not interested persons of the Trust (the “Independent Trustees”), considered the approval of a Sub-Investment Advisory Agreement (the “LMCG Sub-Investment Advisory Agreement”) between Aston Asset Management, LP (“Aston”) and Lee Munder Capital Group, LLC (“LMCG”) with respect to the ASTON Small Cap Fund (formerly, ASTON/Veredus Small Cap Growth Fund) (the “Fund”), at an in-person meeting on December 13, 2012.
The Independent Trustees met separately from the “interested” Trustees of the Trust and any officers of Aston, LMCG or their affiliates to consider the approval of the LMCG Sub-Investment Advisory Agreement and were assisted by independent legal counsel in their deliberations. The Board considered information provided at the December 13, 2012 Board meeting and at previous Board meetings in connection with annual contract renewal with respect to other funds managed by LMCG. Among the matters considered by the Board, including the Independent Trustees, in connection with the approval of the LMCG Sub-Investment Advisory Agreement were the following:
Nature, Quality and Extent of Services. The Board considered the nature, quality and extent of services expected to be provided under the LMCG Sub-Investment Advisory Agreement. The Board considered the reputation, qualifications and background of LMCG and its operational and compliance infrastructures. The Board also considered information provided regarding the experience and skills of senior management and investment personnel of LMCG, the resources made available to such personnel, the ability of LMCG to attract and retain high-quality personnel, and
the organizational depth of LMCG. The Board considered that LMCG currently serves as subadviser to the ASTON/LMCG Small Cap Growth Fund, a fund with a similar investment objective and similar investment policies managed by the same portfolio manager that will manage the Fund. On the basis of this evaluation, the Board concluded that the nature, quality and extent of services to be provided by LMCG are expected to be satisfactory.
Fees, Profitability and Economies of Scale. The Board considered the subadvisory fee rate under the LMCG Sub-Investment Advisory Agreement as well as the overall management fee structure of the Fund, noting that the subadvisory fee rate is fifty percent (50%) of management fees less certain third-party payments, fee waivers and expense reimbursement incurred by Aston. The Board considered that the subadvisory fee rate was negotiated at arm’s length between Aston and LMCG, an unaffiliated third party, and that Aston would compensate LMCG from the fees it receives from the Fund. As part of its review of the investment advisory agreement with Aston, the Board considered whether there will be economies of scale with respect to the overall fee structure of the Fund and whether the Fund will benefit from any economies of scale.
The Board also considered information provided by LMCG in connection with annual contract renewal with respect to fees charged to other mutual funds and separate account clients, as applicable. The Board considered that the fee rates charged to the Fund and other clients vary because of the additional regulatory and compliance requirements, among other things, associated with registered investment companies such as the Fund and other differences in the products and services provided, including differences in fee structures. The Board determined that profitability information with respect to LMCG was not material to its considerations in light of the fee model used by Aston and the unaffiliated status of LMCG.
The Board concluded that the proposed subadvisory fee rate was reasonable in light of the nature, quality and extent of services to be provided and that economies of scale were limited at this time.
Other Benefits to the Subadviser. The Board also considered the character and amount of other incidental benefits expected to be received by LMCG as a result of its association with the Fund. The Board considered potential benefits to LMCG from the use of “soft dollars” to pay for research services generated by parties other than the executing broker-dealer. The Board concluded that the subadvisory fees were reasonable taking into account any other benefits expected to be received by LMCG from its relationship with the Fund.
Conclusion. Based on all of the information considered and the conclusions reached, the Board determined that the terms of the LMCG Sub-Investment Advisory Agreement are fair and reasonable, and that the approval of the LMCG Sub-Investment Advisory Agreement is in the best interests of the Fund. No single factor was determinative in the Board’s analysis.
| | |
| |
| | April 30, 2013 |
| |
| Additional Information (unaudited) – continued | | |
FACTORS CONSIDERED BY THE BOARD OF TRUSTEES IN CONNECTION WITH ANNUAL RENEWAL OF THE INVESTMENT ADVISORY AGREEMENT AND SUB-INVESTMENT ADVISORY AGREEMENTS
The Board of Trustees (the “Board”) of Aston Funds (the “Trust”), including the trustees who are not “interested persons” as defined in Section 2(a)(9) of the Investment Company Act of 1940, as amended (the “Independent Trustees”), is responsible for approving the Investment Advisory Agreement (the “Investment Advisory Agreement”) between the Trust and Aston Asset Management, LP (“Aston” or the “Adviser”) with respect to each series of the Trust and the Sub-Investment Advisory Agreements between Aston and each subadviser (each, a “Sub-Advisory Agreement” and collectively, the “Subadvisory Agreements”) and their periodic continuance. Pursuant to the Investment Company Act of 1940, as amended, the Board is required to consider the continuation of the Investment Advisory Agreement and Subadvisory Agreements on an annual basis following the initial term of each agreement. Accordingly, the Board considered the continuance of the Investment Advisory Agreement with respect to each series of the Trust for which the term ends in December 2012 and each Subadvisory Agreement with a term ending in December 2012, as set forth in Exhibit A-1 (collectively, the “Advisory Agreements”), at an in-person meeting held in December 2012 and the Board determined to continue the Advisory Agreements for an additional one-year period. Each series of the Trust for which an Advisory Agreement is being continued is referred to as a “Fund” or a “Renewal Fund.”
The Board, including the Independent Trustees, considered materials received and discussions held with respect to the continuation of the Advisory Agreements at in-person meetings held in September 2012 and December 2012. The Board requested and received a broad range of information relating to the Renewal Funds, the Adviser and the applicable subadviser (each, a “Subadviser”). As discussed in more detail below, the information provided included, among other things, a review of Fund performance, including Fund performance assessments against peer groups and appropriate benchmarks, compiled by an independent mutual fund data provider, a comparison of Fund fees and expenses relative to a peer expense group, compiled by an independent mutual fund data provider, and an assessment with respect to the Adviser and each Subadviser of the organizational structure, investment philosophy and process, operational matters and compliance matters. With respect to the Adviser, the materials also included a review of information regarding the Adviser’s business and fee model, marketing and product initiatives, an analysis of the Adviser’s profitability with comparisons to prior years and an assessment of other services provided by the Adviser. As a result of its review of the materials and discussions, the Board presented the Adviser with questions and the Adviser responded.
The materials and information prepared and provided in connection with the annual review of the Advisory Agreements supplement the information and analysis provided to the Board during the year. In this regard, throughout the year, the Board regularly reviews the performance of, and various services provided by, the Adviser, Subadvisers and other service providers to
the Trust. The Board also meets with key investment personnel managing the Fund portfolios at a special investment meeting held in February of each year, and on an as-needed basis throughout the year. At quarterly meetings, the Board reviews reports on, among other things, Fund performance, changes in investment process, policies and strategies, operational matters, and compliance and regulatory matters. The Board also reviewed information provided by counsel to the Trust describing applicable law and its duties in reviewing the Advisory Agreements. The Independent Trustees met separately from the “interested” Trustees of the Trust and any officers of Aston, the Subadvisers or their affiliates to consider the continuation of the Advisory Agreements and were assisted by independent legal counsel in their deliberations.
In considering the continuation of the Advisory Agreements, the Board, including the Independent Trustees, did not identify any single factor or group of factors as all-important or controlling, but considered all factors together, including (a) the nature, extent, and quality of services provided by the Adviser and Subadvisers, (b) the investment performance of the Renewal Funds, (c) management fees, gross and net expenses, and contractual expense limitations of the Renewal Funds, (d) the extent of any economies of scale, (e) benefits derived by the Adviser or Subadvisers from their relationships with the Trust and (f) other factors. The principal factors considered by the Board and its conclusions are summarized below.
Nature, Quality and Extent of Services. The Board considered the nature, quality and extent of services provided by the Adviser and Subadvisers. In light of the manager-of-managers structure employed by the Adviser, the Board recognized that the Adviser is responsible for the selection and oversight of the Subadvisers and that the Subadvisers provide day-to-day portfolio management services. In addition to performance information (as described in more detail below), the Board considered information regarding Aston’s business and fee model, product initiatives, investment committee structure, and investment processes and philosophy with respect to the selection and ongoing monitoring of the investment performance of the Subadvisers. In this regard, the Board noted the responsibilities and experience of Aston personnel, the resources made available to such personnel, the ability of Aston to attract and retain high-quality personnel and the organizational depth and stability of Aston. With respect to the Subadvisers, the Board considered information provided regarding the experience and skills of senior management and investment personnel of each Subadviser, the resources made available to such personnel, the ability of each Subadviser to attract and retain high-quality personnel, and the organizational depth and stability of each Subadviser, as well as information regarding recent changes in ownership or key personnel, if any, and the impact of such changes on the services provided. The Board also considered the Adviser’s evaluation of each Subadviser’s performance including, where applicable, performance attribution analysis.
In addition to advisory services, the Board considered the nature, quality and extent of other services provided by Aston
| | |
| |
| | April 30, 2013 |
| |
| Additional Information (unaudited) – continued | | |
including oversight of service providers, regulatory administration and Board support, fund administration and operational support, compliance services, shareholder servicing and platform management, and distribution- and marketing-related services. The Board noted that the Adviser had recently completed a comprehensive request for proposal with respect to the third-party service providers to the Trust (other than portfolio management) and recognized the favorable results achieved by the Adviser on behalf of the Trust with respect to fees, expenses and services. Given the importance of compliance, the Board also considered the Adviser’s and Trust’s compliance program, including reports from the Chief Compliance Officer received throughout the year regarding the compliance policies and procedures of the Trust, Adviser, Subadvisers and other service providers; the resources dedicated to compliance; and the record of compliance with the policies and procedures.
Performance. The Board reviewed reports that contained historical performance data for each Renewal Fund for various periods as well as information comparing such performance to the performance of other mutual funds compiled by an independent provider of mutual fund data based on Morningstar categories (the “Performance Peer Group”) and to recognized benchmarks. In this regard, the Board reviewed performance information for the one-, three-, five- and ten-year periods ended June 30, 2012 (in each case, as available with respect to each Renewal Fund) compared to the Fund’s Performance Peer Group and benchmark index or indices over the periods presented. The Adviser also provided year-to-date performance information for the period ended October 31, 2012. The Board considered the methodology for selecting the Performance Peer Group and Expense Group (defined below) and recognized that the selection of a new third-party provider to provide the performance and expense assessments could have impacted the results relative to prior years. While the Board is cognizant of each Fund’s performance relative to the Performance Peer Group and the benchmark indices, the Board evaluated performance in light of the respective Fund’s investment objective and policies and the investment strategy of the applicable Subadviser. With respect to Funds that the Board considers to have underperformed the Performance Peer Group and/or benchmark from time to time, the Board considered the Adviser’s assessment of whether performance was consistent with the Subadviser’s strategy and was satisfactory over time, and, if applicable, steps taken by the Adviser to monitor or address such circumstances.
With respect to ASTON/Anchor Capital Enhanced Equity Fund and ASTON Small Cap Growth Fund, the Board considered that each Fund had recently undergone a change of Subadviser and that the performance information reflected the performance of a previous Subadviser for some or all periods presented. However, the Board noted that each Fund’s portfolio management team had remained the same and had joined a new management firm that now serves as Subadviser to the Fund.
With respect to ASTON Dynamic Allocation Fund, ASTON/Veredus Select Growth Fund and ASTON/Veredus Small Cap Growth Fund, the Board considered that each Fund had underperformed the Performance Peer Group and/or benchmark
indices over both short-term and long-term periods. For these Funds, the Board requested and considered additional information provided by, and discussions held with, the Adviser regarding the factors that contributed to such underperformance and factors affecting the investment process, including ownership changes, stability of personnel and investment process changes. The Board considered that the Adviser had recommended, and the Board had approved, the liquidation and termination of the ASTON Dynamic Allocation Fund and the ASTON/Veredus Select Growth Fund and that such liquidations and terminations were expected to occur in the first quarter of 2013. With respect to the ASTON/Veredus Small Cap Growth Fund, the Board considered that the Adviser had recommended, and the Board had approved, a proposal to appoint a new Subadviser for the Fund on or about January 31, 2013 and a proposal to reorganize the Fund into another series of the Trust with a similar investment objective and similar investment policies.
On the basis of this evaluation and its ongoing review of operations, the Board concluded that the nature, quality and extent of services provided by the Adviser and Subadvisers had been satisfactory except as described above. With respect to the ASTON Dynamic Allocation Fund, ASTON/Veredus Select Growth Fund and ASTON/Veredus Small Cap Growth Fund, the Board took into account the proposals to liquidate and reorganize the Funds discussed above.
Fees and Expenses. The Board evaluated the management fees and expenses of each Renewal Fund reviewing, among other things, each Fund’s gross management fees, net management fees and total expense ratio, both on an absolute basis and as compared to fee and expense information of a relevant peer group compiled by an independent mutual fund data provider based on Morningstar categories (the “Expense Group”). As a part of this analysis, the Board also considered advisory fees waived or expenses reimbursed by Aston pursuant to contractual expense limitation or reimbursement agreements and the applicable Subadviser’s obligation to contribute to such waiver or reimbursement as set forth in the Subadvisory Agreements. Except as discussed below, the Board noted that the gross management fees, net management fees and total operating expenses of the Renewal Funds were within a reasonable range of Expense Group averages. With respect to ASTON Small Cap Growth Fund, ASTON/TAMRO Small Cap Fund, ASTON/River Road Independent Value Fund and ASTON/River Road Long-Short Fund, the Board considered that while gross management fees were higher than Expense Group averages, net total expenses were within a reasonable range of Expense Group averages taking into account the impact of contractual fee waivers and reimbursements. With respect to ASTON/River Road Select Value Fund, the Board considered that net total expenses of the Fund were within a reasonable range of the Expense Group averages. Although the gross management fees and net management fees are above Expense Group averages, the Board considered the quality of management and capacity constraints of this product. With respect to ASTON/River Road Small Cap Value Fund, the net management fees were higher than Expense Group averages, but the Board considered that gross manage-
| | |
| |
| | April 30, 2013 |
| |
| Additional Information (unaudited) – continued | | |
ment fees and net total expenses were within a reasonable range of Expense Group averages and that the product is capacity constrained. With respect to ASTON/Montag & Caldwell Mid Cap Growth Fund, the Board considered that while gross management fees were above Expense Group averages, the net total expenses for the Fund were within the range of the Expense Group averages. With respect to ASTON/Lake Partners LASSO Alternatives Fund, the Board considered that higher total operating expenses of the Fund were attributable primarily to the inclusion of acquired fund fees and expenses in the expense ratio which do not reflect operating expenses.
The Board considered the fee structure under the Subadvisory Agreements, noting that the subadvisory fee rate generally is fifty per percent (50%) of management fees less certain third-party payments, fee waivers and expense reimbursement incurred by the Adviser. The Board considered that the subadvisory fee rates were negotiated at arm’s length between Aston and each Subadviser, each an unaffiliated third party, and that Aston would compensate each Subadviser from its own fees. With respect to ASTON/River Road Independent Value Fund, ASTON/River Road Small Cap Value Fund and ASTON/TAMRO Small Cap Fund, the Board considered the capacity constraints and resulting limits on asset growth with respect to these strategies.
The Board considered that each of the ASTON Dynamic Allocation Fund and the ASTON/Lake Partners LASSO Alternatives Fund invests primarily in other investment companies (each, a “Fund-of-Funds”). The Board noted that each Fund-of-Funds historically has invested in underlying funds outside of the Aston Funds complex and that, with respect to the ASTON Dynamic Allocation Fund, Aston Funds does not offer exchange-traded funds. Accordingly, the Board determined, with respect to each Fund-of-Funds, that the management fees charged are based on services provided that are in addition to, rather than duplicative of, services provided under the advisory contract of the underlying funds in which the Fund-of-Funds may invest.
The Board also considered the advisory fees charged by Aston and the Subadvisers to separate account clients and, in the case of certain Subadvisers, other mutual funds. The Board considered that the fee rates charged to the Renewal Funds and separately managed account clients vary because of the different services involved and the additional regulatory and compliance requirements, among other things, associated with registered investment companies such as the Renewal Funds. Accordingly, the Board considered the differences in product types, including differences in the services provided, the structure and operations, product distribution and costs thereof, investor profiles, account sizes and regulatory requirements. The Board noted that the range of services provided to the Renewal Funds (as discussed above) is much more extensive than those provided to separate accounts.
On the basis of the information provided, the Board concluded that advisory and Subadvisory fees were reasonable and appropriate in light of the nature, quality and extent of services provided.
Costs and Profitability. The Board considered certain financial information and statistics related to the costs of providing
advisory services and the profitability of Aston’s Advisory Agreements in light of Aston’s business model, as well as fee waivers or expenses to be reimbursed, where applicable, including comparative information for the prior two years. The Board noted that for certain Renewal Funds, Aston and the Subadviser will each bear 50% of any fee waivers or expense reimbursements and for other Renewal Funds, the Subadviser is not responsible for contributing to expense reimbursements. The Board considered that the information was provided by Aston and was subject to a number of estimates and allocation decisions. Because the Board recognized the inherently subjective nature of profitability analysis, this information was utilized as an approximate rather than a definitive measure of profitability. The Board considered that Aston must be able to compensate its employees at competitive rates in order to attract and retain high-quality personnel to provide high-quality services to the Funds.
Based on the information provided, the Board concluded that the profits realized by Aston in connection with the management of the Funds were not unreasonable. The Board determined that profitability information with respect to the Subadvisers was not material to its considerations in light of the fee model used by Aston and the unaffiliated status of all Subadvisers.
Economies of Scale. The Board considered whether there are economies of scale with respect to the management of the Renewal Funds and whether the Renewal Funds benefit from any economies of scale. The Board considered the size of the Renewal Funds, any breakpoints in fees, and the nature of the asset class and any capacity limits. The Board noted that the Investment Advisory Agreement with Aston with respect to ASTON/Fairpointe Mid Cap Fund and ASTON/Montag & Caldwell Growth Fund contains breakpoints based on average daily net assets. With respect to the ASTON/Montag & Caldwell Growth Fund, the Board considered the Adviser’s proposal to add additional breakpoints to the fee schedule. The Board concluded that the management fee schedules for the ASTON/Fairpointe Mid Cap Fund and the ASTON/Montag & Caldwell Growth Fund, including the proposed additional breakpoints, reflect an appropriate level of sharing of economies of scale. The Board determined that economies of scale were limited for the other Renewal Funds at this time due to their asset size and/or capacity constraints with respect to the investment strategy of the applicable Subadviser.
Other Benefits to the Adviser and Subadvisers. The Board considered the character and amount of other incidental benefits received by Aston as a result of its relationship with the Funds. The Board considered the nature and amount of fees to be paid by the Funds for administration services provided by Aston and payments under the Rule 12b-1 distribution plans. The Board also took into account other businesses that the Adviser has, or may develop, with Subadvisers to the Funds with respect to separately managed accounts of certain Subadvisers, including the compensation received by Aston for client solicitation or support services provided in connection with such products. The Board noted that Aston does not manage any of the Funds directly and therefore will not benefit from the use of “soft” commission dollars to pay for research and brokerage services.
| | |
| |
| | April 30, 2013 |
| |
| Additional Information (unaudited) – continued | | |
The Board concluded that any incidental benefits to be received by Aston from its relationship with the Funds are expected to be reasonable and that the management fees were reasonable, taking into account any other benefits to be received by the Adviser.
The Board also considered the character and amount of other incidental benefits received by the Subadvisers and their affiliates as a result of their association with the Funds. The Board considered information provided regarding potential benefits to certain Subadvisers from the use of “soft dollars” to pay for research services generated by parties other than the executing broker-dealer. The Board also noted other business relationships with Aston and certain Subadvisers with respect to separately managed accounts. The Board concluded that the subadvisory fees were reasonable, taking into account any other benefits to be received by the Subadvisers from their relationship with the Funds.
Conclusion. Based upon its evaluation of all material factors and assisted by the advice of independent legal counsel, the Board, including all of the Independent Trustees, concluded that the terms of the Advisory Agreements including the advisory fees (and the additional breakpoints with respect to the ASTON/Montag & Caldwell Growth Fund) were fair and reasonable, and that the continuation of the Advisory Agreements with respect to each Renewal Fund for an additional one-year period should be approved.
EXHIBIT A-1
Schedule of Advisory Agreements and Renewal Funds
EXCEPT AS OTHERWISE NOTED, THE INVESTMENT ADVISORY AGREEMENT AND SUB-INVESTMENT ADVISORY AGREEMENT FOR EACH FUND IS SUBJECT TO CONTINUATION.
| | |
ASTON/Anchor Capital Enhanced Equity Fund* | | |
ASTON/Barings International Fund | | Baring International Investment Limited |
ASTON/Cornerstone Large Cap Value Fund | | Cornerstone Investment Partners, LLC |
ASTON/DoubleLine Core Plus Fixed Income Fund | | DoubleLine Capital LP |
ASTON/Fairpointe Mid Cap Fund | | Fairpointe Capital LLC |
ASTON/Harrison Street Real Estate Fund | | Harrison Street Securities, LLC |
ASTON/Herndon Large Cap Value Fund | | Herndon Capital Management, LLC |
ASTON/Lake Partners LASSO Alternatives Fund | | Lake Partners, Inc. |
ASTON/Montag & Caldwell Balanced Fund, ASTON/Montag & Caldwell Growth Fund, and ASTON/Montag & Caldwell Mid Cap Growth Fund | | Montag & Caldwell, LLC |
ASTON/River Road Dividend All Cap Value Fund, ASTON/River Road Independent Value Fund, ASTON/River Road Long-Short Fund, ASTON/River Road Select Value Fund, and ASTON/River Road Small Cap Value Fund | | River Road Asset Management, LLC |
ASTON/LMCG Small Cap Growth Fund* | | |
ASTON/TAMRO Diversified Equity Fund and ASTON/TAMRO Small Cap Fund | | TAMRO Capital Partners, LLC |
ASTON/TCH Fixed Income Fund | | Taplin, Canida & Habacht, LLC |
| * | Sub-Investment Advisory Agreement was not subject to renewal. |
FACTORS CONSIDERED BY THE BOARD OF TRUSTEES IN CONNECTION WITH THE APPROVAL OF THE INVESTMENT ADVISORY AGREEMENT FOR ASTON/LMCG EMERGING MARKETS FUND
At an in-person meeting on March 21, 2013, the Board of Trustees (the “Board”) of Aston Funds (the “Trust”), including the trustees who are not “interested persons” as defined in Section 2(a)(9) of the Investment Company Act of 1940, as amended (the “Independent Trustees”), determined that the terms of the Investment Advisory Agreement between the Trust and Aston Asset Management, LP (“Aston”) with respect to the ASTON/LMCG Emerging Markets Fund (the “New Fund”) are fair and reasonable and approved the Investment Advisory Agreement for the New Fund as being in the best interests of the New Fund. In making such determinations, the Board, including the Independent Trustees, considered materials received and discussions held with respect to the approval of the Investment Advisory Agreement at the March meeting and prior meetings. The Independent Trustees met separately from the “interested” Trustees of the Trust and any officers of Aston or its affiliates to consider approval of the Investment Advisory Agreement with respect to the New Fund and were assisted by independent legal counsel in their deliberations.
In evaluating the Investment Advisory Agreement on behalf of the New Fund, the Board reviewed information regarding: (1) the nature, quality and extent of the services to be provided to the New Fund; (2) the advisory fees to be charged and estimated total expense ratio of the New Fund compared to a peer group of funds; (3) fee waivers or expenses to be reimbursed by Aston and/or the New Fund’s subadviser; and (4) potential benefits to be received by Aston or its affiliates from Aston’s relationship with the New Fund. In considering the Investment Advisory Agreement on behalf of the New Fund, the Board, including the Independent Trustees, did not identify any single factor or group of factors as all-important or controlling, but considered all factors together. The following summary does not detail all the matters considered.
Nature, Quality and Extent of Services. The Board considered the nature, quality and extent of services to be provided by Aston, including advisory services and administrative services. The Board considered that Aston is a manager-of-managers, and that in its role as adviser to the New Fund it intends to delegate the day-to-day investment responsibility for managing the New Fund to a subadviser. Accordingly, the Board considered Aston’s capabilities and processes with respect to the selection and monitoring of subadvisers on an ongoing basis, as well as information regarding the composition, experience and role of its Investment Committee. In this regard, the Board noted the responsibilities and experience of Aston personnel, the resources made available to such personnel, the ability of Aston to attract and retain high quality personnel and the organizational depth and stability of Aston.
In addition to advisory services, the Board considered the quality of other services provided by Aston including oversight of
| | |
| |
| | April 30, 2013 |
| |
| Additional Information (unaudited) – continued | | |
service providers, regulatory administration and Board support, fund administration and operational support, compliance services, shareholder servicing and platform management, and distribution- and marketing-related services. The Board also considered the nature and quality of services provided by Aston with respect to other series of the Trust. On the basis of this evaluation, the Board concluded that the nature, quality and extent of services to be provided by Aston are expected to be satisfactory.
Fees and Expenses. The Board considered the New Fund’s proposed management fee rate and total net expense ratio after contractual expense reimbursements and fee waivers. As a part of this analysis, the Board compared the proposed advisory fees and total net expenses to those of a relevant peer group for the New Fund. The Board concluded that the proposed advisory fees were reasonable and appropriate in light of the nature, quality and extent of services to be provided by Aston.
Costs and Profitability. With respect to the costs of services to be provided and profits expected to be realized by Aston, the Board considered the resources involved in managing the New Fund in light of Aston’s business model as well as fee waivers or expenses to be reimbursed under an Expense Reimbursement Agreement with Aston. The Board noted that, with respect to the New Fund, Aston and the subadviser each will bear a portion of any fee waivers or expense reimbursements. Because the New Fund has not yet commenced operations, profitability information was not available. However, based upon projected asset size and the impact of fee waivers or expenses to be reimbursed by Aston, the Board concluded that profitability was not expected to be unreasonable.
Economies of Scale. The Board considered the extent to which economies of scale would be realized as the New Fund grows. The Board considered the potential asset size of the New Fund, as well as the terms of the Expense Reimbursement Agreement, and concluded that at this time the potential for economies of scale are limited.
Other Benefits to the Investment Adviser. The Board considered the nature and amount of fees to be paid by the New Fund for services to be provided by Aston for administration services. The Board noted that Aston currently does not intend to manage any of the Aston Funds directly, and therefore, will not benefit from the use of “soft” commission dollars to pay for research and brokerage services. The Board concluded that any other benefits to be received by the Adviser from its relationship with the New Fund were not expected to be unreasonable.
Conclusion. Based upon its evaluation of all material factors and assisted by the advice of independent legal counsel, the Board, including all of the Independent Trustees, concluded that the terms of the Investment Advisory Agreement for the New Fund, including the proposed advisory fee, were fair and reasonable, and that the Investment Advisory Agreement on behalf of the New Fund should be approved.
FACTORS CONSIDERED BY THE BOARD OF TRUSTEES IN CONNECTION WITH THE APPROVAL OF THE SUB-INVESTMENT ADVISORY AGREEMENT FOR ASTON/LMCG EMERGING MARKETS FUND
The Board of Trustees (the “Board”) of Aston Funds (the “Trust”), including the trustees who are not “interested persons” as defined in Section 2(a)(9) of the Investment Company Act of 1940, as amended (the “Independent Trustees”), considered the approval of a Sub-Investment Advisory Agreement (the “Sub-Investment Advisory Agreement”) between Aston Asset Management, LP (“Aston”) and Lee Munder Capital Group, LLC (“LMCG”) with respect to the ASTON/LMCG Emerging Markets Fund (the “New Fund”), at an in-person meeting on March 21, 2013. The Board considered information provided and discussions held at the March meeting and at prior meetings.
The Independent Trustees met separately from the “interested” Trustees of the Trust and any officers of Aston, LMCG or their affiliates to consider approval of the Sub-Investment Advisory Agreement and were assisted by independent legal counsel in their deliberations. Among the matters considered by the Board, including the Independent Trustees, in connection with its approval of the Sub-Investment Advisory Agreement were the following:
Nature, Quality and Extent of Services. The Board considered the nature, quality and extent of services expected to be provided under the Sub-Investment Advisory Agreement. The Board considered the reputation, qualifications and background of LMCG and its operational and compliance infrastructures. The Board also considered information provided regarding LMCG’s investment approach, the experience and skills of senior management and investment personnel of LMCG, the resources made available to such personnel, the ability of LMCG to attract and retain high-quality personnel, and the organizational depth of LMCG. The Board also considered the nature and quality of services provided by LMCG with respect to other series of the Trust. On the basis of this evaluation, the Board concluded that the nature, quality and extent of services to be provided by LMCG are expected to be satisfactory.
Fees, Profitability and Economies of Scale. The Board considered the subadvisory fee rate under the Sub-Investment Advisory Agreement as well as the overall management fee structure of the New Fund, noting that the subadvisory fee rate is fifty percent (50%) of the management fee less certain third-party payments, fee waivers and expense reimbursements incurred by Aston. The Board considered that the subadvisory fee rate was negotiated at arm’s length between Aston and LMCG, an unaffiliated third party, and that Aston would compensate LMCG from the fees it receives from the Fund. As part of its review of the investment advisory agreement with Aston, the Board considered whether there will be economies of scale with respect to the overall fee structure of the New Fund and whether the New Fund will benefit from any economies of scale.
| | |
| |
| | April 30, 2013 |
| |
| Additional Information (unaudited) – continued | | |
The Board determined that profitability information with respect to LMCG was not material to its considerations in light of the fee model used by Aston and the unaffiliated status of LMCG. The Board concluded that the proposed subadvisory fee rate was reasonable in light of the nature, quality and extent of services to be provided and economies of scale were limited at this time.
Other Benefits to the Subadviser. The Board also considered the character and amount of other incidental benefits expected to be received by LMCG and its affiliates. The Board considered potential benefits to LMCG from the use of “soft dollars” to pay for research services generated by parties other than the executing broker-dealer. The Board concluded that the subadvisory fees were reasonable taking into account any other benefits expected to be received by LMCG from its relationship with the New Fund.
Conclusion. Based on all of the information considered and the conclusions reached, the Board determined that the terms of the Sub-Investment Advisory Agreement are fair and reasonable, and that the approval of the Sub-Investment Advisory Agreement is in the best interests of the New Fund. No single factor was determinative in the Board’s analysis.
Disclosure of Fund Expenses: We believe it is important for you to understand the impact of fees regarding your investment. All mutual funds have operating expenses. As a shareholder of a mutual fund, you incur ongoing costs, which include costs for portfolio management, administrative services, and shareholder reports (like this one), among others. Operating expenses, which are deducted from a fund’s gross income, directly reduce the investment return of the fund. A fund’s expenses are expressed as a percentage of its average daily net assets. This figure is known as the expense ratio. The following examples are intended to help you understand the ongoing fees (in dollars) of investing in your Fund and to compare these costs with those of other mutual funds. The examples are based on an investment of $1,000 made at the beginning of the period shown and held for the entire period.
This table illustrates each Fund’s costs in two ways:
Actual Fund Return: This section helps you to estimate the actual expenses, after any applicable fee waivers, that you paid over the period. The “Ending Account Value” shown is derived from the Fund’s actual return for the past six-month period, the “Expense Ratio” column shows the period’s annualized expense ratio, and the “Expenses Paid During Period” column shows the dollar amount that would have been paid by an investor who started with $1,000 in the Fund at the beginning of the period. You may use the information here, together with your account value, to estimate the expenses that you paid over the period. To do so, simply divide your account value by $1,000 (for example, an $8,600 account value divided by $1,000 = 8.6), then multiply the result by the number given for your Fund in the first line under the heading entitled “Expenses Paid During Period.”
Hypothetical 5% Return: This section is intended to help you compare your Fund’s costs with those of other mutual funds. It
assumes that the Fund had an annual return of 5% before expenses, but that the expense ratio is unchanged. In this case, because the return used is not the Fund’s actual return, the results do not apply to your investment. This example is useful in making comparisons to other mutual funds because the SEC requires all mutual funds to calculate expenses based on an assumed 5% annual return. You can assess your Fund’s costs by comparing this hypothetical example with the hypothetical examples that appear in shareholder reports of other funds.
Please note that the expenses shown in the table are meant to highlight and help you compare your ongoing costs only and do not reflect any transactional costs such as sales charges (loads) and redemption fees, which are described in the prospectus. If these costs were applied to your account, your costs would be higher.
| | | | | | | | | | | | | | | | |
| | | Beginning
Account
Value
11/01/12 | | | Ending
Account
Value
04/30/13 | | | Expense
Ratio(1) | | | Expenses
Paid During
Period(2) | |
| M&C Growth Fund | | | | | | | | | |
Actual Fund Return | | | | | | | | | | | | | | | | |
Class N | | | $1,000 | | | | $1,143.60 | | | | 1.04% | | | | $5.53 | |
Class I | | | 1,000 | | | | 1,145.20 | | | | 0.79% | | | | 4.20 | |
Class R | | | 1,000 | | | | 1,142.20 | | | | 1.29% | | | | 6.85 | |
Hypothetical 5% Return | | | | | | | | | | | | | | | | |
Class N | | | $1,000 | | | | $1,019.64 | | | | 1.04% | | | | $5.21 | |
Class I | | | 1,000 | | | | 1,020.88 | | | | 0.79% | | | | 3.96 | |
Class R | | | 1,000 | | | | 1,018.40 | | | | 1.29% | | | | 6.46 | |
| TAMRO Diversified Equity Fund | |
Actual Fund Return | | | | | | | | | | | | | | | | |
Class N | | | $1,000 | | | | $1,121.90 | | | | 1.20% | | | | $6.31 | |
Class I | | | 1,000 | | | | 1,123.80 | | | | 0.95% | | | | 5.00 | |
Hypothetical 5% Return | | | | | | | | | | | | | | | | |
Class N | | | $1,000 | | | | $1,018.84 | | | | 1.20% | | | | $6.01 | |
Class I | | | 1,000 | | | | 1,020.08 | | | | 0.95% | | | | 4.76 | |
| Herndon Large Cap Value Fund | |
Actual Fund Return | | | | | | | | | | | | | | | | |
Class N | | | $1,000 | | | | $1,126.60 | | | | 1.30% | | | | $6.85 | |
Class I | | | 1,000 | | | | 1,128.30 | | | | 1.05% | | | | 5.54 | |
Hypothetical 5% Return | | | | | | | | | | | | | | | | |
Class N | | | $1,000 | | | | $1,018.35 | | | | 1.30% | | | | $6.51 | |
Class I | | | 1,000 | | | | 1,019.59 | | | | 1.05% | | | | 5.26 | |
| Cornerstone Large Cap Value Fund | |
Actual Fund Return | | | | | | | | | | | | | | | | |
Class N | | | $1,000 | | | | $1,140.10 | | | | 1.30% | | | | $6.90 | |
Class I | | | 1,000 | | | | 1,140.90 | | | | 1.05% | | | | 5.57 | |
Hypothetical 5% Return | | | | | | | | | | | | | | | | |
Class N | | | $1,000 | | | | $1,018.35 | | | | 1.30% | | | | $6.51 | |
Class I | | | 1,000 | | | | 1,019.59 | | | | 1.05% | | | | 5.26 | |
| River Road Dividend All Cap Value Fund | | | | | | | | | | | | | |
Actual Fund Return | | | | | | | | | | | | | | | | |
Class N | | | $1,000 | | | | $1,168.00 | | | | 1.09% | | | | $5.86 | |
Class I | | | 1,000 | | | | 1,170.20 | | | | 0.84% | | | | 4.52 | |
Hypothetical 5% Return | | | | | | | | | | | | | | | | |
Class N | | | $1,000 | | | | $1,019.39 | | | | 1.09% | | | | $5.46 | |
Class I | | | 1,000 | | | | 1,020.63 | | | | 0.84% | | | | 4.21 | |
| River Road Dividend All Cap Value Fund II | | | | | |
Actual Fund Return | | | | | | | | | | | | | | | | |
Class N | | | $1,000 | | | | $1,159.20 | | | | 1.30% | | | | $4.88 | |
Class I | | | 1,000 | | | | 1,160.60 | | | | 1.05% | | | | 3.95 | |
Hypothetical 5% Return | | | | | | | | | | | | | | | | |
Class N | | | $1,000 | | | | $1,018.35 | | | | 1.30% | | | | $6.51 | |
Class I | | | 1,000 | | | | 1,019.59 | | | | 1.05% | | | | 5.26 | |
| | |
| |
| | April 30, 2013 |
| |
| Additional Information (unaudited) – continued | | |
| | | | | | | | | | | | | | | | |
| | | Beginning
Account
Value
11/01/12 | | | Ending
Account
Value
04/30/13 | | | Expense
Ratio(1) | | | Expenses
Paid During
Period(2) | |
| Fairpointe Mid Cap Fund | | | | | | | | | |
Actual Fund Return | | | | | | | | | | | | | | | | |
Class N | | | $1,000 | | | | $1,207.90 | | | | 1.10% | | | | $6.02 | |
Class I | | | 1,000 | | | | 1,209.60 | | | | 0.85% | | | | 4.66 | |
Hypothetical 5% Return | | | | | | | | | | | | | | | | |
Class N | | | $1,000 | | | | $1,019.34 | | | | 1.10% | | | | $5.51 | |
Class I | | | 1,000 | | | | 1,020.58 | | | | 0.85% | | | | 4.26 | |
| M&C Mid Cap Growth Fund | | | | | | | | | |
Actual Fund Return | | | | | | | | | | | | | | | | |
Class N | | | $1,000 | | | | $1,103.70 | | | | 1.25% | | | | $6.52 | |
Hypothetical 5% Return | | | | | | | | | | | | | | | | |
Class N | | | $1,000 | | | | $1,018.60 | | | | 1.25% | | | | $6.26 | |
| LMCG Small Cap Growth Fund | | | | | | | | | |
Actual Fund Return | | | | | | | | | | | | | | | | |
Class N | | | $1,000 | | | | $1,181.90 | | | | 1.35% | | | | $7.30 | |
Class I | | | 1,000 | | | | 1,184.00 | | | | 1.10% | | | | 5.96 | |
Hypothetical 5% Return | | | | | | | | | | | | | | | | |
Class N | | | $1,000 | | | | $1,018.10 | | | | 1.35% | | | | $6.76 | |
Class I | | | 1,000 | | | | 1,019.34 | | | | 1.10% | | | | 5.51 | |
| Silvercrest Small Cap Fund | | | | | | | | | |
Actual Fund Return | | | | | | | | | | | | | | | | |
Class N | | | $1,000 | | | | $1,153.00 | | | | 1.40% | | | | $7.47 | |
Class I | | | 1,000 | | | | 1,154.40 | | | | 1.15% | | | | 6.14 | |
Hypothetical 5% Return | | | | | | | | | | | | | | | | |
Class N | | | $1,000 | | | | $1,017.85 | | | | 1.40% | | | | $7.00 | |
Class I | | | 1,000 | | | | 1,019.09 | | | | 1.15% | | | | 5.76 | |
| TAMRO Small Cap Fund | | | | | | | | | |
Actual Fund Return | | | | | | | | | | | | | | | | |
Class N | | | $1,000 | | | | $1,143.40 | | | | 1.30% | | | | $6.91 | |
Class I | | | 1,000 | | | | 1,145.30 | | | | 1.05% | | | | 5.59 | |
Hypothetical 5% Return | | | | | | | | | | | | | | | | |
Class N | | | $1,000 | | | | $1,018.35 | | | | 1.30% | | | | $6.51 | |
Class I | | | 1,000 | | | | 1,019.59 | | | | 1.05% | | | | 5.26 | |
| River Road Select Value Fund | |
Actual Fund Return | | | | | | | | | | | | | | | | |
Class N | | | $1,000 | | | | $1,178.80 | | | | 1.45% | | | | $7.83 | |
Class I | | | 1,000 | | | | 1,180.20 | | | | 1.20% | | | | 6.49 | |
Hypothetical 5% Return | | | | | | | | | | | | | | | | |
Class N | | | $1,000 | | | | $1,017.60 | | | | 1.45% | | | | $7.25 | |
Class I | | | 1,000 | | | | 1,018.84 | | | | 1.20% | | | | 6.01 | |
| River Road Small Cap Value Fund | |
Actual Fund Return | | | | | | | | | | | | | | | | |
Class N | | | $1,000 | | | | $1,171.20 | | | | 1.34% | | | | $7.21 | |
Class I | | | 1,000 | | | | 1,172.90 | | | | 1.09% | | | | 5.87 | |
Hypothetical 5% Return | | | | | | | | | | | | | | | | |
Class N | | | $1,000 | | | | $1,018.15 | | | | 1.34% | | | | $6.71 | |
Class I | | | 1,000 | | | | 1,019.39 | | | | 1.09% | | | | 5.46 | |
| River Road Independent Value Fund(3) | |
Actual Fund Return | | | | | | | | | | | | | | | | |
Class N | | | $1,000 | | | | $1,021.00 | | | | 1.42% | | | | $7.12 | |
Class I | | | 1,000 | | | | 1,021.80 | | | | 1.17% | | | | 5.87 | |
Hypothetical 5% Return | | | | | | | | | | | | | | | | |
Class N | | | $1,000 | | | | $1,017.75 | | | | 1.42% | | | | $7.10 | |
Class I | | | 1,000 | | | | 1,018.99 | | | | 1.17% | | | | 5.86 | |
| DoubleLine Core Plus Fixed Income Fund | |
Actual Fund Return | | | | | | | | | | | | | | | | |
Class N | | | $1,000 | | | | $1,021.20 | | | | 0.94% | | | | $4.71 | |
Class I | | | 1,000 | | | | 1,022.40 | | | | 0.69% | | | | 3.46 | |
Hypothetical 5% Return | | | | | | | | | | | | | | | | |
Class N | | | $1,000 | | | | $1,020.13 | | | | 0.94% | | | | $4.71 | |
Class I | | | 1,000 | | | | 1,021.37 | | | | 0.69% | | | | 3.46 | |
| | | | | | | | | | | | | | | | |
| | | Beginning
Account
Value
11/01/12 | | | Ending
Account
Value
04/30/13 | | | Expense
Ratio(1) | | | Expenses
Paid During
Period(2) | |
| TCH Fixed Income Fund | | | | | | | | | | | | | | | | |
Actual Fund Return | | | | | | | | | | | | | | | | |
Class N | | | $1,000 | | | | $1,025.00 | | | | 0.84% | | | | $4.22 | |
Class I | | | 1,000 | | | | 1,025.80 | | | | 0.69% | | | | 3.47 | |
Hypothetical 5% Return | | | | | | | | | | | | | | | | |
Class N | | | $1,000 | | | | $1,020.63 | | | | 0.84% | | | | $4.21 | |
Class I | | | 1,000 | | | | 1,021.37 | | | | 0.69% | | | | 3.46 | |
| Lake Partners LASSO Alternatives Fund(3) | |
Actual Fund Return | | | | | | | | | | | | | | | | |
Class N | | | $1,000 | | | | $1,070.90 | | | | 1.45% | | | | $7.45 | |
Class I | | | 1,000 | | | | 1,072.60 | | | | 1.20% | | | | 6.17 | |
Hypothetical 5% Return | | | | | | | | | | | | | | | | |
Class N | | | $1,000 | | | | $1,017.60 | | | | 1.45% | | | | $7.25 | |
Class I | | | 1,000 | | | | 1,018.84 | | | | 1.20% | | | | 6.01 | |
| Anchor Capital Enhanced Equity Fund(3) | |
Actual Fund Return | | | | | | | | | | | | | | | | |
Class N | | | $1,000 | | | | $1,071.80 | | | | 1.22% | | | | $6.27 | |
Class I | | | 1,000 | | | | 1,073.20 | | | | 0.97% | | | | 4.99 | |
Hypothetical 5% Return | | | | | | | | | | | | | | | | |
Class N | | | $1,000 | | | | $1,018.74 | | | | 1.22% | | | | $6.11 | |
Class I | | | 1,000 | | | | 1,019.98 | | | | 0.97% | | | | 4.86 | |
| River Road Long-Short Fund(4)(5) | |
Actual Fund Return | | | | | | | | | | | | | | | | |
Class N | | | $1,000 | | | | $1,097.80 | | | | 1.70% | | | | $8.84 | |
Class I | | | 1,000 | | | | 1,019.20 | | | | 1.45% | | | | 2.33 | |
Hypothetical 5% Return | | | | | | | | | | | | | | | | |
Class N | | | $1,000 | | | | $1,016.36 | | | | 1.70% | | | | $8.50 | |
Class I | | | 1,000 | | | | 1,017.60 | | | | 1.45% | | | | 2.32 | |
| Barings International Fund | | | | | | | | | | | | | | | | |
Actual Fund Return | | | | | | | | | | | | | | | | |
Class N | | | $1,000 | | | | $1,082.70 | | | | 1.40% | | | | $7.23 | |
Class I | | | 1,000 | | | | 1,082.10 | | | | 1.15% | | | | 5.94 | |
Hypothetical 5% Return | | | | | | | | | | | | | | | | |
Class N | | | $1,000 | | | | $1,017.85 | | | | 1.40% | | | | $7.00 | |
Class I | | | 1,000 | | | | 1,019.09 | | | | 1.15% | | | | 5.76 | |
| LMCG Emerging Markets Fund(6) | |
Actual Fund Return | | | | | | | | | | | | | | | | |
Class N | | | $1,000 | | | | $998.00 | | | | 1.65% | | | | $1.54 | |
Class I | | | 1,000 | | | | 998.00 | | | | 1.40% | | | | 1.30 | |
Hypothetical 5% Return | | | | | | | | | | | | | | | | |
Class N | | | $1,000 | | | | $1,016.61 | | | | 1.65% | | | | $8.25 | |
Class I | | | 1,000 | | | | 1,017.85 | | | | 1.40% | | | | 7.00 | |
| Harrison Street Real Estate Fund | |
Actual Fund Return | | | | | | | | | | | | | | | | |
Class N | | | $1,000 | | | | $1,178.20 | | | | 1.37% | | | | $7.40 | |
Class I | | | 1,000 | | | | 1,179.60 | | | | 1.12% | | | | 6.05 | |
Hypothetical 5% Return | | | | | | | | | | | | | | | | |
Class N | | | $1,000 | | | | $1,018.00 | | | | 1.37% | | | | $6.85 | |
Class I | | | 1,000 | | | | 1,019.24 | | | | 1.12% | | | | 5.61 | |
| M&C Balanced Fund | | | | | | | | | | | | | | | | |
Actual Fund Return | | | | | | | | | | | | | | | | |
Class N | | | $1,000 | | | | $1,087.10 | | | | 1.20% | | | | $6.21 | |
Class I | | | 1,000 | | | | 1,087.70 | | | | 1.10% | | | | 5.69 | |
Hypothetical 5% Return | | | | | | | | | | | | | | | | |
Class N | | | $1,000 | | | | $1,018.84 | | | | 1.20% | | | | $6.01 | |
Class I | | | 1,000 | | | | 1,019.34 | | | | 1.10% | | | | 5.51 | |
| (1) | Annualized, based on the Fund’s most recent fiscal half-year expenses. |
| (2) | Expenses are equal to the Fund’s annualized expense ratio multiplied by the average account value over the period, multiplied by the number of days in the most recent fiscal half-year (181) or partial year, if applicable, for the actual return and multiplied by the most recent fiscal half-year for the hypothetical 5% return, then divided by 365. Expense ratios do not include interest expense, if applicable. |
| | |
| |
| | April 30, 2013 |
| |
| Additional Information (unaudited) – continued | | |
| (3) | Earnings Credit did not affect the six months expense ratio for the six months ended April 30, 2013. |
| (4) | Excludes interest expense and dividends on short positions. If included, your annualized expense ratios are 2.56% and 2.23% for Class N and Class I, respectively and your actual and hypothetical expenses paid during the period are $13.32 and $11.16 and $12.77 and $11.13 for Class N and Class I, respectively. |
| (5) | River Road Long-Short Fund began issuing Class I shares on March 1, 2013. |
| (6) | LMCG Emerging Markets Fund began issuing shares on March 27, 2013. |
Aston Funds
ADVISER
Aston Asset Management, LP
120 N. LaSalle Street, 25th Floor
Chicago, IL 60602
SUBADVISERS
Anchor Capital Advisors LLC
One Post Office Square, Suite 3850
Boston, MA 02109
Baring International Investment Limited
155 Bishopsgate
London, EC2M 3XY UK
Cornerstone Investment Partners, LLC
Phipps Tower
3438 Peachtree Road NE, Suite 900
Atlanta, GA 30326
DoubleLine Capital LP
333 South Grand Avenue, Suite 1800
Los Angeles, CA 90071
Fairpointe Capital LLC
One North Franklin, Suite 3300
Chicago, IL 60606
Harrison Street Securities, LLC
71 South Wacker Drive, Suite 3575
Chicago, IL 60606
Herndon Capital Management, LLC
191 Peachtree Street, NE, Suite 2500
Atlanta, GA 30303
Lake Partners, Inc.
4 High Ridge Park, Suite 300
Stamford, CT 06905
Lee Munder Capital Group, LLC
200 Clarendon Street, 28th Floor
Boston, MA 02116
SUBADVISERS - continued
Montag & Caldwell, LLC
3455 Peachtree Road NE, Suite 1200
Atlanta, GA 30326
River Road Asset Management, LLC
Meidinger Tower, Suite 1600
462 South Fourth Street
Louisville, KY 40202
Silvercrest Asset Management Group LLC
1330 Avenue of the Americas, 38th Floor
New York, NY 10019
TAMRO Capital Partners LLC
1701 Duke St., Suite 250
Alexandria, VA 22314
Taplin, Canida & Habacht LLC
1001 Brickell Bay Drive, Suite 2100
Miami, FL 33131
SHAREHOLDER SERVICES
Aston Funds
P.O. Box 9765
Providence, RI 02940
DISTRIBUTOR
Foreside Funds Distributors LLC
400 Berwyn Park
899 Cassatt Road
Berwyn, PA 19312
OFFICERS
Stuart D. Bilton, Chief Executive Officer
Kenneth C. Anderson, President
Gerald F. Dillenburg, Senior Vice President and Secretary, Chief Operating Officer and Chief Compliance Officer
Christine C. Carsman, Chief Legal Officer
Laura M. Curylo, Treasurer and Chief Financial Officer
Juli A. Braun, Assistant Treasurer
Michael A. Cozzi, Assistant Treasurer
James A. Dimmick, Assistant Secretary
Marc J. Peirce, Assistant Secretary
Diana R. Podgorny, Assistant Secretary
CUSTODIAN
The Bank of New York Mellon
One Wall Street
New York, New York 10286
LEGAL COUNSEL
Vedder Price P.C.
222 N. LaSalle Street
Chicago, IL 60601
INDEPENDENT REGISTERED PUBLIC ACCOUNTING FIRM
Ernst & Young LLP
155 N. Wacker Drive
Chicago, IL 60606
THE STATEMENT OF ADDITIONAL INFORMATION INCLUDES ADDITIONAL INFORMATION ABOUT FUND TRUSTEES AND IS AVAILABLE UPON REQUEST WITHOUT CHARGE BY CALLING 800-992-8151.
Guide to Shareholder Benefits
We’re delighted to offer all Aston Funds shareholders a variety of services and convenient options. To receive more information about any of these benefits, simply call an Investor Services Associate Monday through Friday, 9 a.m. – 7 p.m. Eastern Time.
THE EASY WAY TO ADD TO YOUR ACCOUNT: START AN AUTOMATIC INVESTMENT PLAN
For Class N shareholders, systematic investing is an easy, effortless way to help reach any investment goal. Just choose a fixed amount, and we’ll automatically deduct it from your checking or savings account on a regular schedule and invest it in your Aston Funds account. Periodic investment plans involve continuous investments in securities regardless of price. You should consider your financial ability to continue to purchase shares through periods of both high and low price levels. This plan does not assure a profit and does not protect against loss in declining markets.
COMPOUND YOUR EARNINGS WITH AUTOMATIC DIVIDEND REINVESTMENT
By automatically reinvesting dividends into your Fund account, profits have the opportunity to mount. Monthly and quarterly dividends and annual capital gain distributions are reinvested at no charge.
ACCESS INFORMATION AND MAKE TRANSACTIONS ONLINE AT OUR WEBSITE
You can open a new account, access account balances, view statements, obtain fund information, and make transactions online 24 hours a day, 7 days a week.
| | |
| | www.astonfunds.com |
| |
| | Our Automated Shareholder Services Line Is at Your Service 24 Hours a Day |
| | 800-992-8151 |
Investor Services
Associates are available to assist you Monday – Friday 9 a.m. to 7 p.m., Eastern Time. Or, call any time, day or night, for automated account information to make exchanges or check fund performance.

ATSEM 13
Item 2. Code of Ethics.
Not applicable.
Item 3. Audit Committee Financial Expert.
Not applicable.
Item 4. Principal Accountant Fees and Services.
Not applicable.
Item 5. Audit Committee of Listed registrants.
Not applicable.
Item 6. Investments.
| (a) | Schedule of Investments in securities of unaffiliated issuers as of the close of the reporting period is included as part of the report to shareholders filed under Item 1 of this form. |
Item 7. Disclosure of Proxy Voting Policies and Procedures for Closed-End Management Investment Companies.
Not applicable.
Item 8. Portfolio Managers of Closed-End Management Investment Companies.
Not applicable.
Item 9. Purchases of Equity Securities by Closed-End Management Investment Company and Affiliated Purchasers.
Not applicable.
Item 10. Submission of Matters to a Vote of Security Holders.
There have been no material changes to the procedures by which the shareholders may recommend nominees to the registrant’s board of directors, where those changes were implemented after the registrant last provided disclosure in response to the requirements of Item 407(c)(2)(iv) of Regulation S-K (17 CFR 229.407) (as required by Item 22(b)(15) of Schedule 14A (17 CFR 240.14a-101)), or this Item.
Item 11. Controls and Procedures.
| | (a) | The registrant’s principal executive and principal financial officers, or persons performing similar functions, have concluded that the registrant’s disclosure controls and procedures (as defined in Rule 30a-3(c) under the Investment Company Act of 1940, as amended (the “1940 Act”) (17 CFR 270.30a-3(c))) are effective, as of a date within 90 days of the filing date of the report that includes the disclosure required by this paragraph, based on their evaluation of these controls and procedures required by Rule 30a-3(b) under the 1940 Act (17 CFR 270.30a-3(b)) and Rules 13a-15(b) or 15d-15(b) under the Securities Exchange Act of 1934, as amended (17 CFR 240.13a-15(b) or 240.15d-15(b)). |
| | (b) | There were no changes in the registrant’s internal control over financial reporting (as defined in Rule 30a-3(d) under the 1940 Act (17 CFR 270.30a-3(d)) that occurred during the registrant’s second fiscal quarter of the period covered by this report that has materially affected, or is reasonably likely to materially affect, the registrant’s internal control over financial reporting. |
Item 12. Exhibits.
| | (a)(2) | Certifications pursuant to Rule 30a-2(a) under the 1940 Act and Section 302 of the Sarbanes-Oxley Act of 2002 are attached hereto. |
| | (b) | Certifications pursuant to Rule 30a-2(b) under the 1940 Act and Section 906 of the Sarbanes- Oxley Act of 2002 are attached hereto. |
SIGNATURES
Pursuant to the requirements of the Securities Exchange Act of 1934 and the Investment Company Act of 1940, the registrant has duly caused this report to be signed on its behalf by the undersigned, thereunto duly authorized.
(registrant) Aston Funds
By (Signature and Title)* /s/ Stuart D. Bilton
Stuart D. Bilton, Chief Executive Officer
(principal executive officer)
Date 7/1/13
Pursuant to the requirements of the Securities Exchange Act of 1934 and the Investment Company Act of 1940, this report has been signed below by the following persons on behalf of the registrant and in the capacities and on the dates indicated.
By (Signature and Title)* /s/ Stuart D. Bilton
Stuart D. Bilton, Chief Executive Officer
(principal executive officer)
Date 7/1/13
By (Signature and Title)* /s/ Laura M. Curylo
Laura M. Curylo, Treasurer and Chief Financial Officer
(principal financial officer)
Date 7/1/13
| * | Print the name and title of each signing officer under his or her signature. |