UNITED STATES
SECURITIES AND EXCHANGE COMMISSION
Washington, D.C. 20549
FORM N-CSR
CERTIFIED SHAREHOLDER REPORT OF REGISTERED MANAGEMENT INVESTMENT COMPANIES
Investment Company Act file number 811-08004
Aston Funds
(Exact name of registrant as specified in charter)
120 North LaSalle Street, 25th Floor
Chicago, IL 60602
(Address of principal executive offices) (Zip code)
Stuart D. Bilton, President
Aston Funds
120 North LaSalle Street, 25th Floor
Chicago, IL 60602
(Name and address of agent for service)
Registrant’s telephone number, including area code: (312) 268-1400
Date of fiscal year end: October 31
Date of reporting period: April 30, 2015
Form N-CSR is to be used by management investment companies to file reports with the Commission not later than 10 days after the transmission to stockholders of any report that is required to be transmitted to stockholders under Rule 30e-1 under the Investment Company Act of 1940 (17 CFR 270.30e-1). The Commission may use the information provided on Form N-CSR in its regulatory, disclosure review, inspection, and policymaking roles.
A registrant is required to disclose the information specified by Form N-CSR, and the Commission will make this information public. A registrant is not required to respond to the collection of information contained in Form N-CSR unless the Form displays a currently valid Office of Management and Budget (“OMB”) control number. Please direct comments concerning the accuracy of the information collection burden estimate and any suggestions for reducing the burden to Secretary, Securities and Exchange Commission, 100 F Street, NE, Washington, DC 20549. The OMB has reviewed this collection of information under the clearance requirements of 44 U.S.C. § 3507.
| Item 1. | Reports to Stockholders. |
The Report to Shareholders is attached herewith.

Semi Annual Report 2015
April 30, 2015
Class N, I & R Shares
Equity
Fixed Income
Alternative
International
Sector
Balanced
This Privacy Statement is not part of the Semi Annual Report
PRIVACY STATEMENT
At Aston Funds, we appreciate the privacy concerns and expectations of our customers and we have established the following policies to maintain the privacy of information you share with us.
INFORMATION WE COLLECT
We collect and retain nonpublic personal information about you that may include:
| | • | | Information we receive on your account applications or other forms such as your name, address, financial information and/or social security number; |
| | • | | Information we receive about your mutual fund transactions, such as purchases, sales, exchanges and account balances; and |
| | • | | Information we collect through the use of Internet “cookies” when you access our website. Cookies are software files we use to track which of our sites you visit. |
INFORMATION WE MAY SHARE
We do not sell any of your nonpublic personal information to third parties. We may share the information we collect with affiliates or with non-affiliated third parties only when those parties are acting on our behalf in servicing your account, or as required by law. These third parties may include:
| | • | | Administrative service providers who, for example, process transactions for your account, print checks or prepare account statements; |
| | • | | Companies that provide services for us to help market our products to you; and |
| | • | | Governmental or other legal agencies, as required by law |
When information is shared with third parties, they are legally obligated to maintain the confidentiality of the information and to limit their use of it to servicing your account, except as permitted or required by law.
CONFIDENTIALITY AND SECURITY
We restrict access to your nonpublic personal information to authorized employees who need to access such information in order to provide services or products to you. We maintain physical, electronic and procedural safeguards to protect your nonpublic personal information.
As previously mentioned, we may collect information through the use of Internet “cookies” on our Web site. In addition, in order to provide you with access to your account via the web, it is necessary for us to collect certain nonpublic personal information such as your name, social security number and account information. Special measures such as data encryption and authentication apply to all nonpublic personal information and communications on our Web site.
APPLICABILITY
Our privacy policies apply only to those individual investors who have a direct customer relationship with us. If you are an individual shareholder of record of any of the Funds, the Funds consider you to be their customer. Shareholders purchasing or owning shares of any of the Funds through their bank, broker, or other financial institution should also consult that financial institution’s privacy policies.
Aston Funds values your business. We understand the importance of maintaining the integrity of your personal information and are committed to keeping your trust. Please contact us at 800-992-8151 if you have any questions concerning our policy, or visit us at www.astonfunds.com for additional copies of this policy.
This page intentionally left blank.
Aston Funds
Large Cap Funds
ASTON/Cornerstone Large Cap Value Fund
ASTON/Fairpointe Focused Equity Fund
ASTON/Herndon Large Cap Value Fund
ASTON/Montag & Caldwell Growth Fund
ASTON/TAMRO Diversified Equity Fund
Equity Income Funds
ASTON/River Road Dividend All Cap Value Fund
ASTON/River Road Dividend All Cap Value Fund II
Mid Cap Funds
ASTON/Fairpointe Mid Cap Fund
ASTON/Montag & Caldwell Mid Cap Growth Fund
Table of Contents
Small Cap Funds
ASTON/LMCG Small Cap Growth Fund
ASTON/River Road Independent Value Fund
ASTON/River Road Select Value Fund
ASTON/River Road Small Cap Value Fund
ASTON/Silvercrest Small Cap Fund
ASTON/TAMRO Small Cap Fund
Fixed Income Funds
ASTON/DoubleLine Core Plus Fixed Income Fund ASTON/TCH Fixed Income Fund
Alternative Funds
ASTON/Anchor Capital Enhanced Equity Fund
ASTON/Lake Partners LASSO Alternatives Fund
ASTON/River Road Long-Short Fund
International Funds
ASTON/Barings International Fund
ASTON/Guardian Capital Global Dividend Fund
ASTON/LMCG Emerging Markets Fund
ASTON/Pictet International Fund
ASTON/TAMRO International Small Cap Fund
Sector Fund
ASTON/Harrison Street Real Estate Fund
Balanced Fund
ASTON/Montag & Caldwell Balanced Fund
This report is submitted for general information to the shareholders of the funds. It is not authorized for distribution to prospective investors in the funds unless preceded or accompanied by an effective prospectus which includes details regarding the funds’ objectives, policies, expenses and other information.
Aston Funds are distributed by Foreside Funds Distributors LLC, 400 Berwyn Park, 899 Cassatt Road, Berwyn, PA 19312
Shareholder Services 800-992-8151 • www.astonfunds.com
NOT FDIC INSURED • NO BANK GUARANTEE • MAY LOSE VALUE
| | |
| |
| | As of April 30, 2015 |
| |
| Performance Summary (unaudited) | | |
| | | | | | | | | | | | | | | | | | | | | | | | | | | | | | | | | | | | |
| | | | | | | | | Average Annual Total Returns | | | | | | | | | | | | | |
| | | Class | | | Six Month Total Return (a) | | | One Year | | | Five Year | | | Ten Year | | | Since Inception | | | Total Expense Ratio (b) | | | Net Expense Ratio (b) | | | Inception Date | |
| Equity | | | | | | | | | | | | | | | | | | | | | | | | | | | | | | | | | | | | |
ASTON/Cornerstone Large Cap Value Fund | | | N | | | | -1.24 | % | | | 1.95 | % | | | 11.24 | % | | | 6.99 | % | | | 7.91 | % | | | 1.31 | % | | | 1.31 | % | | | 01/04/93 | |
| | | I | | | | -1.09 | | | | 2.24 | | | | 11.53 | | | | NA | | | | 6.88 | | | | 1.06 | | | | 1.06 | | | | 09/20/05 | |
| | | | | | | | | |
ASTON/Fairpointe Focused Equity Fund (c) | | | N | | | | NA | | | | NA | | | | NA | | | | NA | | | | 4.60 | (d) | | | 8.47 | | | | 1.16 | | | | 12/24/14 | |
| | | I | | | | NA | | | | NA | | | | NA | | | | NA | | | | 4.70 | (d) | | | 8.22 | | | | 0.91 | | | | 12/24/14 | |
| | | | | | | | | |
ASTON/Herndon Large Cap Value Fund (c) | | | N | | | | 1.05 | | | | 2.83 | | | | 11.44 | | | | NA | | | | 11.39 | | | | 1.31 | | | | 1.31 | | | | 03/31/10 | |
| | | I | | | | 1.22 | | | | 3.13 | | | | NA | | | | NA | | | | 10.61 | | | | 1.06 | | | | 1.06 | | | | 03/02/11 | |
| | | | | | | | | |
ASTON/Montag & Caldwell Growth Fund | | | N | | | | 3.19 | | | | 9.44 | | | | 10.99 | | | | 7.99 | | | | 9.18 | | | | 1.04 | | | | 1.04 | | | | 11/02/94 | |
| | | I | | | | 3.28 | | | | 9.69 | | | | 11.27 | | | | 8.27 | | | | 7.74 | | | | 0.79 | | | | 0.79 | | | | 06/28/96 | |
| | | R | | | | 3.02 | | | | 9.15 | | | | 10.71 | | | | 7.73 | | | | 7.63 | | | | 1.29 | | | | 1.29 | | | | 12/31/02 | |
| | | | | | | | | |
ASTON/TAMRO Diversified Equity Fund (c) | | | N | | | | 2.41 | | | | 11.01 | | | | 12.46 | | | | 7.93 | | | | 6.90 | | | | 1.37 | | | | 1.20 | | | | 11/30/00 | |
| | | I | | | | 2.51 | | | | 11.21 | | | | NA | | | | NA | | | | 13.78 | | | | 1.12 | | | | 0.95 | | | | 03/02/12 | |
| | | | | | | | | |
ASTON/River Road Dividend All Cap Value Fund | | | N | | | | 3.63 | | | | 9.57 | | | | 12.75 | | | | NA | | | | 8.59 | | | | 1.09 | | | | 1.09 | | | | 06/28/05 | |
| | | I | | | | 3.76 | | | | 9.86 | | | | 13.05 | | | | NA | | | | 6.52 | | | | 0.84 | | | | 0.84 | | | | 06/28/07 | |
| | | | | | | | | |
ASTON/River Road Dividend All Cap Value II Fund | | | N | | | | 3.25 | | | | 9.73 | | | | NA | | | | NA | | | | 15.60 | | | | 1.18 | | | | 1.18 | | | | 06/27/12 | |
| | | I | | | | 3.46 | | | | 10.07 | | | | NA | | | | NA | | | | 15.90 | | | | 0.93 | | | | 0.93 | | | | 06/27/12 | |
| | | | | | | | | |
ASTON/Fairpointe Mid Cap Fund | | | N | | | | 7.15 | | | | 9.86 | | | | 14.72 | | | | 12.07 | | | | 13.20 | | | | 1.11 | | | | 1.11 | | | | 09/19/94 | |
| | | I | | | | 7.29 | | | | 10.15 | | | | 15.01 | | | | 12.35 | | | | 11.30 | | | | 0.86 | | | | 0.86 | | | | 07/06/04 | |
| | | | | | | | | |
ASTON/Montag & Caldwell Mid Cap Growth Fund (c) | | | N | | | | 7.07 | | | | 12.03 | | | | 13.13 | | | | NA | | | | 5.73 | | | | 2.17 | | | | 1.26 | | | | 11/02/07 | |
| | | I | | | | 7.25 | | | | NA | | | | NA | | | | NA | | | | 13.29 | (d) | | | 1.92 | | | | 1.01 | | | | 05/14/14 | |
| | | | | | | | | |
ASTON/LMCG Small Cap Growth Fund (c) | | | N | | | | 8.18 | | | | 21.24 | | | | NA | | | | NA | | | | 16.46 | | | | 1.68 | | | | 1.36 | | | | 11/03/10 | |
| | | I | | | | 8.25 | | | | 21.55 | | | | NA | | | | NA | | | | 13.01 | | | | 1.43 | | | | 1.11 | | | | 06/01/11 | |
| | | | | | | | | |
ASTON/River Road Independent Value Fund (c) | | | N | | | | 0.62 | | | | -2.69 | | | | NA | | | | NA | | | | 4.71 | | | | 1.46 | | | | 1.46 | | | | 12/31/10 | |
| | | I | | | | 0.80 | | | | -2.40 | | | | NA | | | | NA | | | | 3.13 | | | | 1.21 | | | | 1.21 | | | | 06/01/11 | |
| | | | | | | | | |
ASTON/River Road Select Value Fund | | | N | | | | 5.42 | | | | 5.06 | | | | 10.33 | | | | NA | | | | 5.12 | | | | 1.46 | | | | 1.46 | | | | 03/29/07 | |
| | | I | | | | 5.60 | | | | 5.36 | | | | 10.63 | | | | NA | | | | 4.89 | | | | 1.21 | | | | 1.21 | | | | 06/28/07 | |
| | | | | | | | | |
ASTON/River Road Small Cap Value Fund | | | N | | | | 5.23 | | | | 3.70 | | | | 9.32 | | | | NA | | | | 7.28 | | | | 1.35 | | | | 1.35 | | | | 06/28/05 | |
| | | I | | | | 5.36 | | | | 3.91 | | | | 9.58 | | | | NA | | | | 4.55 | | | | 1.10 | | | | 1.10 | | | | 12/13/06 | |
| | | | | | | | | |
ASTON/Silvercrest Small Cap Fund (c) | | | N | | | | 2.07 | | | | 7.67 | | | | NA | | | | NA | | | | 15.64 | | | | 1.61 | | | | 1.40 | | | | 12/27/11 | |
| | | I | | | | 2.17 | | | | 7.97 | | | | NA | | | | NA | | | | 15.94 | | | | 1.36 | | | | 1.15 | | | | 12/27/11 | |
| | | | | | | | | |
ASTON/TAMRO Small Cap Fund | | | N | | | | 1.80 | | | | 7.25 | | | | 10.35 | | | | 9.20 | | | | 10.48 | | | | 1.31 | | | | 1.31 | | | | 11/30/00 | |
| | | I | | | | 1.89 | | | | 7.51 | | | | 10.62 | | | | 9.48 | | | | 8.42 | | | | 1.06 | | | | 1.06 | | | | 01/04/05 | |
| | | | | | | | | |
| Fixed Income | | | | | | | | | | | | | | | | | | | | | | | | | | | | | | | | | | | | |
ASTON/Doubleline Core Plus Fixed Income Fund (c) | | | N | | | | 1.92 | | | | 5.20 | | | | NA | | | | NA | | | | 6.08 | | | | 1.10 | | | | 0.96 | | | | 07/18/11 | |
| | | I | | | | 2.03 | | | | 5.45 | | | | NA | | | | NA | | | | 6.34 | | | | 0.85 | | | | 0.71 | | | | 07/18/11 | |
| | | | | | | | | |
ASTON/TCH Fixed Income Fund (c) | | | N | | | | 1.40 | | | | 3.92 | | | | 5.44 | | | | 5.71 | | | | 5.80 | | | | 1.18 | | | | 0.95 | | | | 12/13/93 | |
| | | I | | | | 1.52 | | | | 4.18 | | | | 5.66 | | | | 5.93 | | | | 6.05 | | | | 0.93 | | | | 0.70 | | | | 07/31/00 | |
| | |
| |
| | As of April 30, 2015 |
| |
| Performance Summary (unaudited) – continued | | |
| | | | | | | | | | | | | | | | | | | | | | | | | | | | | | | | | | | | |
| | | | | | | | | Average Annual Total Returns | | | | | | | | | | | | | |
| | | Class | | | Six Month Total Return (a) | | | One Year | | | Five Year | | | Ten Year | | | Since Inception | | | Total Expense Ratio (b) | | | Net Expense Ratio (b) | | | Inception Date | |
| Alternative | | | | | | | | | | | | | | | | | | | | | | | | | | | | | | | | | | | | |
ASTON/Anchor Capital Enhanced Equity Fund | | | N | | | | 3.43 | % | | | 5.25 | % | | | 6.34 | % | | | NA | % | | | 4.75 | % | | | 1.20 | % | | | 1.20 | % | | | 01/15/08 | |
| | | I | | | | 3.55 | | | | 5.50 | | | | 6.62 | | | | NA | | | | 6.92 | | | | 0.95 | | | | 0.95 | | | | 03/03/10 | |
| | | | | | | | | |
ASTON/Lake Partners LASSO Alternatives Fund (c) | | | N | | | | 0.17 | | | | 0.10 | | | | 4.00 | | | | NA | | | | 4.43 | | | | 3.25 | | | | 3.24 | | | | 03/03/10 | |
| | | I | | | | 0.27 | | | | 0.35 | | | | 4.25 | | | | NA | | | | 6.55 | | | | 3.00 | | | | 2.99 | | | | 04/01/09 | |
| | | | | | | | | |
ASTON/River Road Long-Short Fund (c) | | | N | | | | 4.33 | | | | 2.97 | | | | NA | | | | NA | | | | 6.36 | | | | 2.62 | | | | 2.62 | | | | 05/04/11 | |
| | | I | | | | 4.49 | | | | 3.22 | | | | NA | | | | NA | | | | 5.08 | | | | 2.37 | | | | 2.37 | | | | 03/04/13 | |
| | | | | | | | | |
| International | | | | | | | | | | | | | | | | | | | | | | | | | | | | | | | | | | | | |
ASTON/Barings International Fund (c) | | | N | | | | 8.34 | | | | 3.73 | | | | 5.97 | | | | NA | | | | 6.34 | | | | 1.95 | | | | 1.40 | | | | 03/02/10 | |
| | | I | | | | 8.49 | | | | 3.88 | | | | 6.24 | | | | NA | | | | -1.32 | | | | 1.70 | | | | 1.15 | | | | 11/02/07 | |
| | | | | | | | | |
ASTON/Guardian Capital Global Dividend Fund (c) | | | N | | | | 2.74 | | | | 5.39 | | | | NA | | | | NA | | | | 8.69 | | | | 5.21 | | | | 1.30 | | | | 04/14/14 | |
| | | I | | | | 2.63 | | | | 5.49 | | | | NA | | | | NA | | | | 8.78 | | | | 4.96 | | | | 1.05 | | | | 04/14/14 | |
| | | | | | | | | |
ASTON/LMCG Emerging Markets Fund (c) | | | N | | | | 3.19 | | | | 7.82 | | | | NA | | | | NA | | | | 0.03 | | | | 6.01 | | | | 1.48 | | | | 03/28/13 | |
| | | I | | | | 3.44 | | | | 8.18 | | | | NA | | | | NA | | | | 0.39 | | | | 5.76 | | | | 1.23 | | | | 03/28/13 | |
| | | | | | | | | |
ASTON/Pictet International Fund (c) | | | N | | | | 7.33 | | | | -1.62 | | | | NA | | | | NA | | | | 0.24 | | | | 3.26 | | | | 1.40 | | | | 04/14/14 | |
| | | I | | | | 7.53 | | | | -1.24 | | | | NA | | | | NA | | | | 0.61 | | | | 3.01 | | | | 1.15 | | | | 04/14/14 | |
| | | | | | | | | |
ASTON/TAMRO International Small Cap Fund (c) | | | N | | | | NA | | | | NA | | | | NA | | | | NA | | | | 7.80 | (d) | | | 17.01 | | | | 1.51 | | | | 12/23/14 | |
| | | I | | | | NA | | | | NA | | | | NA | | | | NA | | | | 7.90 | (d) | | | 16.76 | | | | 1.26 | | | | 12/23/14 | |
| | | | | | | | | |
| Sector | | | | | | | | | | | | | | | | | | | | | | | | | | | | | | | | | | | | |
ASTON/Harrison Street Real Estate Fund (c) | | | N | | | | -0.58 | | | | 7.69 | | | | 11.66 | | | | 6.94 | | | | 8.65 | | | | 2.16 | | | | 1.37 | | | | 12/30/97 | |
| | | I | | | | -0.42 | | | | 8.00 | | | | 11.93 | | | | NA | | | | 6.10 | | | | 1.91 | | | | 1.12 | | | | 09/20/05 | |
| | | | | | | | | |
| Balanced | | | | | | | | | | | | | | | | | | | | | | | | | | | | | | | | | | | | |
ASTON/Montag & Caldwell Balanced Fund (c) | | | N | | | | 2.67 | | | | 7.19 | | | | 7.71 | | | | 6.38 | | | | 7.65 | | | | 1.59 | | | | 1.36 | | | | 11/02/94 | |
| | | I | | | | 2.72 | | | | 7.28 | | | | 7.85 | | | | 6.56 | | | | 4.34 | | | | 1.34 | | | | 1.11 | | | | 12/31/98 | |
The performance data quoted represents past performance. Past performance does not guarantee future results. Investment return and principal value will fluctuate so that an investor’s shares, upon redemption may be worth more or less than their original cost. Current performance may be lower or higher than the performance data quoted. For performance data current to the most recent month-end, please visit our website at www.astonfunds.com.
Performance figures do not reflect the deduction of taxes that a shareholder would pay on Fund distributions or redemptions of Fund shares.
| (b) | | The expense ratios presented above may vary from the expense ratios presented in other sections of this report that are based on expenses incurred during the period covered by this report. |
| (c) | | Certain expenses were subsidized or recouped. If these subsidies or recoupment were not in effect, the returns would have been lower or higher, respectively. The Adviser is contractually obligated to waive management fees and/or reimburse expenses through February 29, 2016 for the Funds. |
| (d) | | Returns are cumulative since inception and are not annualized. |
The stocks of small- and mid-cap companies may be subject to a higher degree of market risk because they tend to be more volatile and less liquid. Bond and balanced funds have the same interest rate, high yield, and credit risks associated with the underlying bonds in the portfolio, all of which could reduce a fund’s value. By selling covered call options, a fund limits its opportunity to profit from an increase in the price of the underlying stock above the exercise price, but continues to bear the risk of a decline in the stock. Sector funds may be subject to a higher degree of market risk because of concentration in a specific industry sector. International investing may include the risk of social and political instability, market illiquidity and currency volatility. Emerging markets securities tend to be more volatile and less liquid than securities traded in developed countries. Hedged mutual funds may use derivative instruments, short selling, leveraging and investing in commodities, commodity-linked instruments and non-U.S. companies that involve significant risks.
| | |
| |
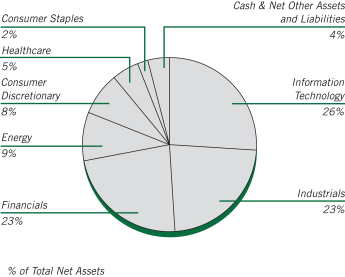
| ASTON/Cornerstone Large Cap Value Fund | | April 30, 2015 |
| |
| Schedule of Investments (unaudited) | | |
| | | | | | | | |
Shares | | | | | Market Value | |
| |
| | COMMON STOCKS – 96.01% | | | | |
| | |
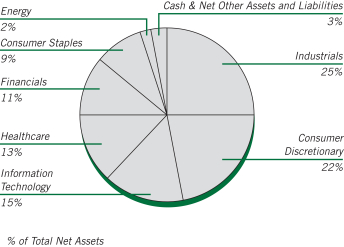
| | | | Consumer Discretionary – 8.19% | | | | |
| | 61,760 | | | Bed Bath & Beyond * | | $ | 4,351,610 | |
| | 50,925 | | | BorgWarner | | | 3,014,760 | |
| | 129,125 | | | Gap | | | 5,118,515 | |
| | | | | | | | |
| | | | | | | 12,484,885 | |
| | | | | | | | |
| | |
| | | | Consumer Staples – 1.95% | | | | |
| | 38,100 | | | Wal-Mart Stores | | | 2,973,705 | |
| | | | | | | | |
| | |
| | | | Energy – 8.67% | | | | |
| | 48,925 | | | Chevron | | | 5,433,610 | |
| | 144,350 | | | Ensco, Class A (United Kingdom) | | | 3,937,868 | |
| | 60,650 | | | Royal Dutch Shell PLC, ADR | | | 3,847,030 | |
| | | | | | | | |
| | | | | | | 13,218,508 | |
| | | | | | | | |
| | |
| | | | Financials – 22.47% | | | | |
| | 52,375 | | | ACE (Switzerland) | | | 5,603,601 | |
| | 76,200 | | | Capital One Financial | | | 6,160,770 | |
| | 109,075 | | | Citigroup | | | 5,815,879 | |
| | 107,875 | | | JPMorgan Chase | | | 6,824,173 | |
| | 54,925 | | | Lincoln National | | | 3,102,713 | |
| | 32,075 | | | PNC Financial Services Group | | | 2,942,240 | |
| | 111,255 | | | Unum Group | | | 3,800,471 | |
| | | | | | | | |
| | | | | | | 34,249,847 | |
| | | | | | | | |
| | |
| | | | Healthcare – 5.32% | | | | |
| | 44,500 | | | Baxter International | | | 3,058,930 | |
| | 50,925 | | | Johnson & Johnson | | | 5,051,760 | |
| | | | | | | | |
| | | | | | | 8,110,690 | |
| | | | | | | | |
| | |
| | | | Industrials – 23.01% | | | | |
| | 24,450 | | | Boeing | | | 3,504,663 | |
| | 43,900 | | | Cummins | | | 6,069,614 | |
| | 101,450 | | | Emerson Electric | | | 5,968,304 | |
| | | | | | | | |
Shares | | | | | Market Value | |
| | |
| | | | Industrials (continued) | | | | |
| | 37,300 | | | Honeywell International | | $ | 3,764,316 | |
| | 42,900 | | | Norfolk Southern | | | 4,326,465 | |
| | 52,925 | | | Parker-Hannifin | | | 6,317,128 | |
| | 20,640 | | | WW Grainger | | | 5,127,595 | |
| | | | | | | | |
| | | | | | | 35,078,085 | |
| | | | | | | | |
| | |
| | | | Information Technology – 26.40% | | | | |
| | 217,350 | | | Cisco Systems | | | 6,266,200 | |
| | 193,575 | | | EMC | | | 5,209,103 | |
| | 142,550 | | | Intel | | | 4,640,002 | |
| | 141,150 | | | Microsoft | | | 6,865,536 | |
| | 152,575 | | | Oracle | | | 6,655,322 | |
| | 65,190 | | | QUALCOMM | | | 4,432,920 | |
| | 63,050 | | | Western Digital | | | 6,162,507 | |
| | | | | | | | |
| | | | | | | 40,231,590 | |
| | | | | | | | |
| | |
| | | | Total Common Stocks
(Cost $143,070,788) | | | 146,347,310 | |
| | | | | | | | |
| |
| | INVESTMENT COMPANY – 3.58% | | | | |
| | |
| | 5,452,832 | | | BlackRock Liquidity Funds
TempFund Portfolio | | | 5,452,832 | |
| | | | | | | | |
| | |
| | | | Total Investment Company
(Cost $5,452,832) | | | 5,452,832 | |
| | | | | | | | |
| Total Investments – 99.59%
(Cost $148,523,620)** | | | 151,800,142 | |
| | | | | | | | |
| Net Other Assets and Liabilities – 0.41% | | | 617,529 | |
| | | | | | | | |
| Net Assets – 100.00% | | $ | 152,417,671 | |
| | | | | | | | |
| * | | Non-income producing security. |
| ** | | At April 30, 2015, cost is identical for book and Federal income tax purposes. |
| | | | |
Gross unrealized appreciation | | $ | 7,931,750 | |
Gross unrealized depreciation | | | (4,655,228 | ) |
| | | | |
Net unrealized appreciation | | $ | 3,276,522 | |
| | | | |
| ADR | | American Depositary Receipt |
See accompanying Notes to Financial Statements.
| | |
| |
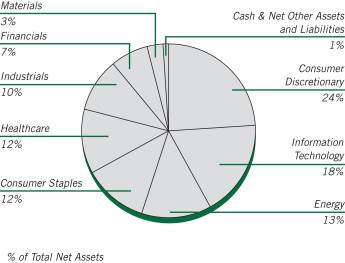
| ASTON/Fairpointe Focused Equity Fund | | April 30, 2015 |
| |
| Schedule of Investments (unaudited) | | |
| | | | | | | | |
Shares | | | | | Market Value | |
| |
| | COMMON STOCKS – 98.50% | | | | |
| | |
| | | | Consumer Discretionary – 23.73% | | | | |
| | 5,300 | | | Carnival | | $ | 233,041 | |
| | 7,200 | | | Discovery Communications, Class C * | | | 217,656 | |
| | 4,800 | | | Interpublic Group | | | 100,032 | |
| | 4,300 | | | Liberty Interactive, Class A * | | | 123,668 | |
| | 14,200 | | | News, Class A * | | | 224,076 | |
| | 4,600 | | | Scholastic | | | 186,944 | |
| | 5,900 | | | Staples | | | 96,288 | |
| | 8,400 | | | Twenty-First Century Fox, Class A | | | 286,272 | |
| | | | | | | | |
| | | | | | | 1,467,977 | |
| | | | | | | | |
| | |
| | | | Consumer Staples – 12.15% | | | | |
| | 25,700 | | | Avon Products | | | 209,969 | |
| | 3,300 | | | PepsiCo | | | 313,896 | |
| | 5,200 | | | Univelver, SP ADR | | | 227,864 | |
| | | | | | | | |
| | | | | | | 751,729 | |
| | | | | | | | |
| | |
| | | | Energy – 12.95% | | | | |
| | 1,850 | | | Apache | | | 126,540 | |
| | 4,900 | | | Atwood Oceanics | | | 163,562 | |
| | 5,600 | | | BP, SP ADR | | | 241,696 | |
| | 6,100 | | | Cenovus Energy (Canada) | | | 114,802 | |
| | 8,200 | | | Transocean (Switzerland) | | | 154,324 | |
| | | | | | | | |
| | | | | | | 800,924 | |
| | | | | | | | |
| | |
| | | | Financials – 6.83% | | | | |
| | 4,000 | | | Legg Mason | | | 210,600 | |
| | 2,900 | | | Northern Trust | | | 212,135 | |
| | | | | | | | |
| | | | | | | 422,735 | |
| | | | | | | | |
| | | | | | | | |
Shares | | | | | Market Value | |
| | |
| | | | Healthcare – 11.83% | | | | |
| | 11,900 | | | Boston Scientific * | | $ | 212,058 | |
| | 6,100 | | | Hologic * | | | 205,814 | |
| | 1,100 | | | Hospira * | | | 96,019 | |
| | 700 | | | Quest Diagnostics | | | 49,994 | |
| | 1,600 | | | Varian Medical Systems * | | | 142,160 | |
| | 500 | | | VCA * | | | 25,485 | |
| | | | | | | | |
| | | | | | | 731,530 | |
| | | | | | | | |
| | |
| | | | Industrials – 9.90% | | | | |
| | 6,000 | | | AGCO | | | 309,060 | |
| | 3,400 | | | Fluor | | | 204,476 | |
| | 2,800 | | | Kennametal | | | 99,148 | |
| | | | | | | | |
| | | | | | | 612,684 | |
| | | | | | | | |
| | |
| | | | Information Technology – 18.01% | | | | |
| | 8,000 | | | Cisco Systems | | | 230,640 | |
| | 7,100 | | | Cree * | | | 224,928 | |
| | 10,000 | | | Hewlett-Packard | | | 329,700 | |
| | 3,400 | | | Itron * | | | 121,924 | |
| | 4,700 | | | Teradata * | | | 206,753 | |
| | | | | | | | |
| | | | | | | 1,113,945 | |
| | | | | | | | |
| | |
| | | | Materials – 3.10% | | | | |
| | 4,700 | | | Greif, Class A | | | 191,572 | |
| | | | | | | | |
| | |
| | | | Total Common Stocks
(Cost $5,903,018) | | | 6,093,096 | |
| | | | | | | | |
| |
| | INVESTMENT COMPANY – 3.28% | | | | |
| | |
| | 202,836 | | | BlackRock Liquidity Funds
TempFund Portfolio | | | 202,836 | |
| | | | | | | | |
| | |
| | | | Total Investment Company
(Cost $202,836) | | | 202,836 | |
| | | | | | | | |
| Total Investments – 101.78%
(Cost $6,105,854)** | | | 6,295,932 | |
| | | | | | | | |
| Net Other Assets and Liabilities – (1.78)% | | | (110,119 | ) |
| | | | | | | | |
| Net Assets – 100.00% | | $ | 6,185,813 | |
| | | | | | | | |
| * | | Non-income producing security. |
| ** | | At April 30, 2015, cost is identical for book and Federal income tax purposes. |
| | | | |
Gross unrealized appreciation | | $ | 310,244 | |
Gross unrealized depreciation | | | (120,166 | ) |
| | | | |
Net unrealized appreciation | | $ | 190,078 | |
| | | | |
| SP ADR | | Sponsored American Depositary Receipt |
See accompanying Notes to Financial Statements.
| | |
| |
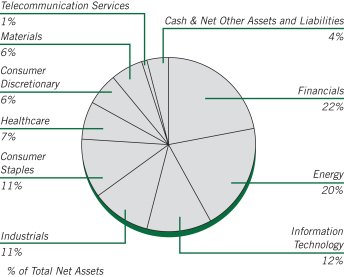
| ASTON/Herndon Large Cap Value Fund | | April 30, 2015 |
| |
| Schedule of Investments (unaudited) | | |
| | | | | | | | |
Shares | | | | | Market Value | |
|
| | COMMON STOCKS – 96.39% | |
| | | | Consumer Discretionary – 6.47% | | | | |
| | 34,765 | | | Ross Stores | | $ | 3,437,563 | |
| | 66,020 | | | TJX | | | 4,260,931 | |
| | 16,266 | | | Yum! Brands | | | 1,398,225 | |
| | | | | | | | |
| | | | | | | 9,096,719 | |
| | | | | | | | |
| | | | Consumer Staples – 10.60% | | | | |
| | 79,416 | | | Altria Group | | | 3,974,771 | |
| | 83,243 | | | Campbell Soup | | | 3,721,794 | |
| | 50,074 | | | Colgate-Palmolive | | | 3,368,979 | |
| | 45,927 | | | Philip Morris International | | | 3,833,527 | |
| | | | | | | | |
| | | | | | | 14,899,071 | |
| | | | | | | | |
| | | | Energy – 20.44% | | | | |
| | 47,522 | | | Apache | | | 3,250,505 | |
| | 57,409 | | | Atwood Oceanics | | | 1,916,312 | |
| | 57,090 | | | ConocoPhillips | | | 3,877,553 | |
| | 46,246 | | | Continental Resources * | | | 2,433,927 | |
| | 44,652 | | | Exxon Mobil | | | 3,901,245 | |
| | 43,057 | | | Marathon Petroleum | | | 4,244,128 | |
| | 70,486 | | | Oil States International * | | | 3,354,429 | |
| | 42,738 | | | SM Energy | | | 2,477,522 | |
| | 57,409 | | | Valero Energy | | | 3,266,572 | |
| | | | | | | | |
| | | | | | | 28,722,193 | |
| | | | | | | | |
| | | | Financials – 21.67% | | | | |
| | 36,040 | | | Aflac | | | 2,271,962 | |
| | 17,485 | | | American Express | | | 1,354,213 | |
| | 89,622 | | | Apartment Investment & Management, Class A, REIT | | | 3,381,438 | |
| | 71,442 | | | CBOE Holdings | | | 4,020,041 | |
| | 59,323 | | | Discover Financial Services | | | 3,438,954 | |
| | 64,745 | | | Eaton Vance | | | 2,659,725 | |
| | 35,721 | | | McGraw-Hill | | | 3,725,700 | |
| | 31,575 | | | Moody’s | | | 3,394,944 | |
| | 136,505 | | | Nationstar Mortgage Holdings * | | | 3,426,275 | |
| | 56,133 | | | Waddell & Reed Financial, Class A | | | 2,768,480 | |
| | | | | | | | |
| | | | | | | 30,441,732 | |
| | | | | | | | |
| | | | | | | | |
Shares | | | | | Market Value | |
| | |
| | | | Healthcare – 6.69% | | | | |
| | 22,297 | | | AbbVie | | $ | 1,441,724 | |
| | 4,815 | | | Actavis (Ireland) * | | | 1,361,971 | |
| | 38,911 | | | Baxter International | | | 2,674,742 | |
| | 14,901 | | | Endo International (Ireland) * | | | 1,252,652 | |
| | 26,472 | | | Gilead Sciences * | | | 2,660,701 | |
| | | | | | | | |
| | | | | | | 9,391,790 | |
| | | | | | | | |
| | |
| | | | Industrials – 11.22% | | | | |
| | 7,819 | | | Copa Holdings SA, Class A (Panama) | | | 867,049 | |
| | 23,921 | | | Lockheed Martin | | | 4,463,659 | |
| | 32,213 | | | Rockwell Collins | | | 3,135,291 | |
| | 40,505 | | | United Parcel Service, Class B | | | 4,071,968 | |
| | 43,057 | | | Verisk Analytics, Class A * | | | 3,230,997 | |
| | | | | | | | |
| | | | | | | 15,768,964 | |
| | | | | | | | |
| | |
| | | | Information Technology – 12.24% | | | | |
| | 46,884 | | | Apple | | | 5,867,533 | |
| | 78,778 | | | Microsoft | | | 3,831,762 | |
| | 41,143 | | | Western Digital | | | 4,021,317 | |
| | 171,270 | | | Western Union | | | 3,473,356 | |
| | | | | | | | |
| | | | | | | 17,193,968 | |
| | | | | | | | |
| | |
| | | | Materials – 6.01% | | | | |
| | 5,778 | | | CF Industries Holdings | | | 1,661,002 | |
| | 32,532 | | | LyondellBasell Industries NV, Class A, (Netherlands) | | | 3,367,713 | |
| | 7,655 | | | Newmarket | | | 3,421,019 | |
| | | | | | | | |
| | | | | | | 8,449,734 | |
| | | | | | | | |
| | |
| | | | Telecommunication Services – 1.05% | | | | |
| | 29,343 | | | Verizon Communications | | | 1,480,061 | |
| | | | | | | | |
| | |
| | | | Total Common Stocks
(Cost $117,268,698) | | | 135,444,232 | |
| | | | | | | | |
|
| | INVESTMENT COMPANY – 3.67% | |
| | |
| | 5,152,792 | | | BlackRock Liquidity Funds
TempFund Portfolio | | | 5,152,792 | |
| | | | | | | | |
| | |
| | | | Total Investment Company
(Cost $5,152,792) | | | 5,152,792 | |
| | | | | | | | |
| Total Investments – 100.06%
(Cost $122,421,490)** | | | 140,597,024 | |
| | | | | | | | |
| Net Other Assets and Liabilities – (0.06)% | | | (85,631 | ) |
| | | | | | | | |
| Net Assets – 100.00% | | $ | 140,511,393 | |
| | | | | | | | |
| * | | Non-income producing security. |
| ** | | At April 30, 2015, cost is identical for book and Federal income tax purposes. |
| | | | |
Gross unrealized appreciation | | $ | 23,227,186 | |
Gross unrealized depreciation | | | (5,051,652 | ) |
| | | | |
Net unrealized appreciation | | $ | 18,175,534 | |
| | | | |
| REIT | | Real Estate Investment Trust |
See accompanying Notes to Financial Statements.
| | |
| |
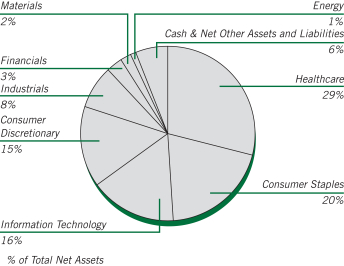
| ASTON/Montag & Caldwell Growth Fund | | April 30, 2015 |
| |
| Schedule of Investments (unaudited) | | |
| | | | | | | | |
Shares | | | | | Market Value | |
| |
| | COMMON STOCKS – 93.77% | | | | |
| | |
| | | | Consumer Discretionary – 14.95% | | | | |
| | 1,111,500 | | | Carnival | | $ | 48,872,655 | |
| | 645,800 | | | Dollar General | | | 46,956,118 | |
| | 994,900 | | | Dollar Tree * | | | 76,020,309 | |
| | 392,700 | | | NIKE, Class B | | | 38,814,468 | |
| | 1,850,000 | | | Starbucks | | | 91,723,000 | |
| | 1,071,200 | | | TJX | | | 69,135,248 | |
| | | | | | | | |
| | | | | | | 371,521,798 | |
| | | | | | | | |
| | |
| | | | Consumer Staples – 20.23% | | | | |
| | 1,020,000 | | | Colgate-Palmolive | | | 68,625,600 | |
| | 262,971 | | | Costco Wholesale | | | 37,618,002 | |
| | 909,800 | | | Estee Lauder, Class A | | | 73,957,642 | |
| | 2,570,800 | | | Mondelez International, Class A | | | 98,641,596 | |
| | 1,180,400 | | | PepsiCo | | | 112,279,648 | |
| | 480,200 | | | Procter & Gamble | | | 38,180,702 | |
| | 883,700 | | | Walgreens Boots Alliance | | | 73,285,241 | |
| | | | | | | | |
| | | | | | | 502,588,431 | |
| | | | | | | | |
| | |
| | | | Energy – 1.13% | | | | |
| | 350,300 | | | Occidental Petroleum | | | 28,059,030 | |
| | | | | | | | |
| | |
| | | | Financials – 2.59% | | | | |
| | 307,400 | | | State Street | | | 23,706,688 | |
| | 738,700 | | | Wells Fargo | | | 40,702,370 | |
| | | | | | | | |
| | | | | | | 64,409,058 | |
| | | | | | | | |
| | |
| | | | Healthcare – 29.14% | | | | |
| | 1,800,000 | | | Abbott Laboratories | | | 83,556,000 | |
| | 360,000 | | | Actavis PLC (Ireland) * | | | 101,829,600 | |
| | 442,900 | | | AmerisourceBergen | | | 50,623,470 | |
| | 395,000 | | | Amgen | | | 62,374,450 | |
| | 201,129 | | | Biogen Idec * | | | 75,208,167 | |
| | 223,800 | | | Celgene * | | | 24,183,828 | |
| | | | | | | | |
Shares | | | | | Market Value | |
| | |
| | | | Healthcare (continued) | | | | |
| | 739,000 | | | Cerner * | | $ | 53,067,590 | |
| | 764,700 | | | Gilead Sciences * | | | 76,859,997 | |
| | 505,000 | | | McKesson | | | 112,817,000 | |
| | 665,000 | | | Thermo Fisher Scientific | | | 83,577,200 | |
| | | | | | | | |
| | | | | | | 724,097,302 | |
| | | | | | | | |
| | |
| | | | Industrials – 7.78% | | | | |
| | 703,200 | | | Honeywell International | | | 70,966,944 | |
| | 243,200 | | | Union Pacific | | | 25,835,136 | |
| | 627,500 | | | United Parcel Service, Class B | | | 63,082,575 | |
| | 134,310 | | | WW Grainger | | | 33,366,633 | |
| | | | | | | | |
| | | | | | | 193,251,288 | |
| | | | | | | | |
| | |
| | | | Information Technology – 16.12% | | | | |
| | 719,600 | | | Accenture PLC, Class A (Ireland) | | | 66,670,940 | |
| | 790,000 | | | Cognizant Technology Solutions, Class A * | | | 46,246,600 | |
| | 555,700 | | | Facebook, Class A * | | | 43,772,489 | |
| | 120,000 | | | Google, Class A * | | | 65,852,400 | |
| | 560,000 | | | MasterCard, Class A | | | 50,517,600 | |
| | 370,000 | | | QUALCOMM | | | 25,160,000 | |
| | 1,550,000 | | | Visa, Class A | | | 102,377,500 | |
| | | | | | | | |
| | | | | | | 400,597,529 | |
| | | | | | | | |
| | |
| | | | Materials – 1.83% | | | | |
| | 400,000 | | | Monsanto | | | 45,584,000 | |
| | | | | | | | |
| | |
| | | | Total Common Stocks
(Cost $2,044,182,278) | | | 2,330,108,436 | |
| | | | | | | | |
| |
| | INVESTMENT COMPANY – 4.43% | | | | |
| | |
| | 110,221,661 | | | BlackRock Liquidity Funds TempFund Portfolio | | | 110,221,661 | |
| | | | | | | | |
| | |
| | | | Total Investment Company
(Cost $110,221,661) | | | 110,221,661 | |
| | | | | | | | |
| Total Investments – 98.20%
(Cost $2,154,403,939)** | | | 2,440,330,097 | |
| | | | | | | | |
| Net Other Assets and Liabilities – 1.80% | | | 44,669,412 | |
| | | | | | | | |
| Net Assets – 100.00% | | $ | 2,484,999,509 | |
| | | | | | | | |
| * | | Non-income producing security. |
| ** | | At April 30,2015, cost is identical for book and Federal income tax purposes. |
| | | | |
Gross unrealized appreciation | | $ | 307,856,957 | |
Gross unrealized depreciation | | | (21,930,799 | ) |
| | | | |
Net unrealized appreciation | | $ | 285,926,158 | |
| | | | |
See accompanying Notes to Financial Statements.
| | |
| |
| ASTON/TAMRO Diversified Equity Fund | | April 30, 2015 |
| |
| Schedule of Investments (unaudited) | | |
| | | | | | | | |
Shares | | | | | Market
Value | |
|
| | COMMON STOCKS – 99.10% | |
| | |
| | | | Consumer Discretionary – 17.47% | | | | |
| | 5,007 | | | Amazon.com * | | $ | 2,111,853 | |
| | 13,248 | | | CarMax * | | | 902,321 | |
| | 7,250 | | | Grand Canyon Education * | | | 328,280 | |
| | 7,160 | | | Home Depot | | | 765,977 | |
| | 23,067 | | | Iconix Brand Group * | | | 606,893 | |
| | 32,651 | | | Live Nation Entertainment * | | | 818,234 | |
| | 8,104 | | | McDonald’s | | | 782,441 | |
| | 417 | | | NVR * | | | 553,146 | |
| | 9,222 | | | Red Robin Gourmet Burgers * | | | 692,480 | |
| | | | | | | | |
| | | | | | | 7,561,625 | |
| | | | | | | | |
| | |
| | | | Consumer Staples – 12.58% | | | | |
| | 20,748 | | | Coca-Cola | | | 841,539 | |
| | 8,664 | | | Constellation Brands, Class A * | | | 1,004,504 | |
| | 6,356 | | | Keurig Green Mountain | | | 739,648 | |
| | 14,467 | | | Nu Skin Enterprises, Class A | | | 818,109 | |
| | 11,246 | | | Sysco | | | 416,439 | |
| | 10,896 | | | United Natural Foods * | | | 735,044 | |
| | 10,762 | | | Walgreens Boots Alliance | | | 892,493 | |
| | | | | | | | |
| | | | | | | 5,447,776 | |
| | | | | | | | |
| | |
| | | | Energy – 3.71% | | | | |
| | 15,203 | | | Kinder Morgan | | | 652,969 | |
| | 5,761 | | | Phillips 66 | | | 456,905 | |
| | 7,810 | | | Range Resources | | | 496,404 | |
| | | | | | | | |
| | | | | | | 1,606,278 | |
| | | | | | | | |
| | |
| | | | Financials – 13.10% | | | | |
| | 9,568 | | | American Express | | | 741,042 | |
| | 18,168 | | | American International Group | | | 1,022,677 | |
| | 9,929 | | | American Tower, REIT | | | 938,588 | |
| | 30,117 | | | Bank of the Ozarks | | | 1,167,335 | |
| | | | | | | | |
Shares | | | | | Market
Value | |
| | |
| | | | Financials (continued) | | | | |
| | 6,834 | | | Berkshire Hathaway, Class B * | | $ | 965,029 | |
| | 21,395 | | | Geo Group, REIT | | | 834,405 | |
| | | | | | | | |
| | | | | | | 5,669,076 | |
| | | | | | | | |
| | |
| | | | Healthcare – 14.86% | | | | |
| | 10,858 | | | DaVita HealthCare Partners * | | | 880,584 | |
| | 16,264 | | | DexCom * | | | 1,098,958 | |
| | 6,237 | | | Edwards Lifesciences * | | | 789,916 | |
| | 10,734 | | | Endo International (Ireland) * | | | 902,354 | |
| | 9,653 | | | Express Scripts * | | | 834,019 | |
| | 11,500 | | | Gilead Sciences * | | | 1,155,865 | |
| | 1,556 | | | Intuitive Surgical * | | | 771,745 | |
| | | | | | | | |
| | | | | | | 6,433,441 | |
| | | | | | | | |
| | |
| | | | Industrials – 14.75% | | | | |
| | 17,531 | | | American Airlines Group | | | 846,484 | |
| | 6,227 | | | Boeing | | | 892,578 | |
| | 11,791 | | | Cintas | | | 942,691 | |
| | 18,292 | | | Colfax * | | | 907,100 | |
| | 9,143 | | | Danaher | | | 748,629 | |
| | 14,280 | | | Healthcare Services Group | | | 432,256 | |
| | 7,818 | | | Middleby * | | | 792,276 | |
| | 12,030 | | | Spirit Airlines * | | | 823,694 | |
| | | | | | | | |
| | | | | | | 6,385,708 | |
| | | | | | | | |
| | |
| | | | Information Technology – 18.14% | | | | |
| | 3,335 | | | Baidu, SP ADR * | | | 667,934 | |
| | 45,373 | | | Cisco Systems | | | 1,308,104 | |
| | 9,755 | | | Facebook, Class A * | | | 768,401 | |
| | 1,209 | | | Google, Class A * | | | 663,463 | |
| | 802 | | | Google, Class C * | | | 431,052 | |
| | 24,253 | | | Hewlett-Packard | | | 799,621 | |
| | 44,380 | | | Pandora Media * | | | 791,739 | |
| | 15,417 | | | Seagate Technology (Ireland) | | | 905,286 | |
| | 16,160 | | | Synchronoss Technologies * | | | 741,421 | |
| | 18,284 | | | Yahoo! * | | | 778,258 | |
| | | | | | | | |
| | | | | | | 7,855,279 | |
| | | | | | | | |
| | |
| | | | Materials – 4.49% | | | | |
| | 2,658 | | | CF Industries Holdings | | | 764,095 | |
| | 5,255 | | | Monsanto | | | 598,860 | |
| | 8,991 | | | Royal Gold | | | 580,189 | |
| | | | | | | | |
| | | | | | | 1,943,144 | |
| | | | | | | | |
| | |
| | | | Total Common Stocks
(Cost $30,336,870) | | | 42,902,327 | |
| | | | | | | | |
See accompanying Notes to Financial Statements.
| | |
| |
| ASTON/TAMRO Diversified Equity Fund | | April 30, 2015 |
| |
| Schedule of Investments (unaudited) – continued | | |
| | | | | | | | |
Shares | | | | | Market
Value | |
|
| | INVESTMENT COMPANY – 1.02% | |
| | |
| | 443,898 | | | BlackRock Liquidity Funds TempFund Portfolio | | $ | 443,898 | |
| | | | | | | | |
| | |
| | | | Total Investment Company
(Cost $443,898) | | | 443,898 | |
| | | | | | | | |
| Total Investments – 100.12%
(Cost $30,780,768)** | | | 43,346,225 | |
| | | | | | | | |
| Net Other Assets and Liabilities – (0.12)% | | | (52,748 | ) |
| | | | | | | | |
| Net Assets – 100.00% | | $ | 43,293,477 | |
| | | | | | | | |
| * | | Non-income producing security. |
| ** | | At April 30, 2015, cost is identical for book and Federal income tax purposes. |
| | | | |
Gross unrealized appreciation | | $ | 13,055,220 | |
Gross unrealized depreciation | | | (489,763 | ) |
| | | | |
Net unrealized appreciation | | $ | 12,565,457 | |
| | | | |
| REIT | | Real Estate Investment Trust |
| SP ADR | | Sponsored American Depositary Receipt |
See accompanying Notes to Financial Statements.
| | |
| |
| ASTON/River Road Dividend All Cap Value Fund | | April 30, 2015 |
| |
| Schedule of Investments (unaudited) | | |
| | | | | | | | |
Shares | | | | | Market
Value | |
|
| | COMMON STOCKS – 98.57% | |
| | |
| | | | Consumer Discretionary – 14.89% | | | | |
| | 230,382 | | | Bob Evans Farms | | $ | 9,911,034 | |
| | 268,167 | | | Cinemark Holdings | | | 11,431,959 | |
| | 624,339 | | | Ford Motor | | | 9,864,556 | |
| | 201,266 | | | Hasbro | | | 14,247,620 | |
| | 345,924 | | | Kohl’s | | | 24,785,455 | |
| | 510,884 | | | National CineMedia | | | 7,785,872 | |
| | 311,951 | | | Omnicom Group | | | 23,633,408 | |
| | 523,926 | | | Shaw Communications, Class B (Canada) | | | 11,971,709 | |
| | 201,111 | | | Target | | | 15,853,580 | |
| | 433,370 | | | Thomson Reuters (Canada) | | | 17,794,172 | |
| | | | | | | | |
| | | | | | | 147,279,365 | |
| | | | | | | | |
| | |
| | | | Consumer Staples – 10.39% | | | | |
| | 165,289 | | | Kimberly-Clark | | | 18,130,550 | |
| | 256,509 | | | Molson Coors Brewing, Class B | | | 18,855,977 | |
| | 113,371 | | | PepsiCo | | | 10,783,850 | |
| | 611,746 | | | Sysco | | | 22,652,954 | |
| | 342,778 | | | Univelver, SP ADR (Great Britain) | | | 15,020,532 | |
| | 221,637 | | | Wal-Mart Stores | | | 17,298,768 | |
| | | | | | | | |
| | | | | | | 102,742,631 | |
| | | | | | | | |
| | |
| | | | Energy – 7.53% | | | | |
| | 165,166 | | | Chevron | | | 18,343,336 | |
| | 280,369 | | | Martin Midstream Partners LP | | | 10,401,690 | |
| | 443,626 | | | Memorial Production Partners LP | | | 7,949,778 | |
| | 312,949 | | | Occidental Petroleum | | | 25,067,215 | |
| | 170,159 | | | TransMontaigne Partners LP | | | 6,416,696 | |
| | 128,050 | | | Williams Partners LP | | | 6,325,670 | |
| | | | | | | | |
| | | | | | | 74,504,385 | |
| | | | | | | | |
| | | | | | | | |
Shares | | | | | Market
Value | |
| | |
| | | | Financials – 18.99% | | | | |
| | 152,628 | | | CME Group | | $ | 13,875,412 | |
| | 194,609 | | | CNA Financial | | | 7,842,743 | |
| | 309,650 | | | Compass Diversified Holdings | | | 5,332,173 | |
| | 484,857 | | | CyrusOne, REIT | | | 15,748,155 | |
| | 398,107 | | | Geo Group, REIT | | | 15,526,173 | |
| | 852,617 | | | Iron Mountain, REIT | | | 29,406,747 | |
| | 73,866 | | | PartnerRe (Bermuda) | | | 9,454,848 | |
| | 319,136 | | | PNC Financial Services Group | | | 29,274,345 | |
| | 341,382 | | | Sabra Health Care, REIT | | | 10,200,494 | |
| | 111,012 | | | Stock Yards Bancorp | | | 3,863,218 | |
| | 535,270 | | | U.S. Bancorp | | | 22,947,025 | |
| | 441,302 | | | Wells Fargo | | | 24,315,740 | |
| | | | | | | | |
| | | | | | | 187,787,073 | |
| | | | | | | | |
| | |
| | | | Healthcare – 3.90% | | | | |
| | 388,984 | | | Owens & Minor | | | 13,116,541 | |
| | 356,441 | | | Quest Diagnostics | | | 25,457,016 | |
| | | | | | | | |
| | | | | | | 38,573,557 | |
| | | | | | | | |
| | |
| | | | Industrials – 14.35% | | | | |
| | 158,183 | | | ABM Industries | | | 5,069,765 | |
| | 722,958 | | | ADT | | | 27,183,221 | |
| | 642,466 | | | Aircastle (Bermuda) | | | 15,406,335 | |
| | 308,310 | | | Emerson Electric | | | 18,137,877 | |
| | 530,288 | | | Fastenal | | | 22,600,875 | |
| | 150,214 | | | Parker-Hannifin | | | 17,929,543 | |
| | 396,586 | | | Republic Services | | | 16,113,289 | |
| | 193,471 | | | United Parcel Service, Class B | | | 19,449,640 | |
| | | | | | | | |
| | | | | | | 141,890,545 | |
| | | | | | | | |
| | |
| | | | Information Technology – 14.88% | | | | |
| | 199,431 | | | CSG Systems International | | | 5,807,431 | |
| | 841,946 | | | Intel | | | 27,405,342 | |
| | 265,274 | | | j2 Global | | | 18,402,057 | |
| | 709,853 | | | Microsoft | | | 34,527,250 | |
| | 340,374 | | | Motorola Solutions | | | 20,337,347 | |
| | 310,905 | | | QUALCOMM | | | 21,141,540 | |
| | 963,593 | | | Western Union | | | 19,541,666 | |
| | | | | | | | |
| | | | | | | 147,162,633 | |
| | | | | | | | |
| | |
| | | | Materials – 4.36% | | | | |
| | 189,834 | | | Bemis | | | 8,542,530 | |
| | 142,246 | | | Compass Minerals International | | | 12,564,589 | |
| | 126,202 | | | Innophos Holdings | | | 6,668,514 | |
| | 370,561 | | | Myers Industries | | | 5,991,971 | |
| | 191,450 | | | Nucor | | | 9,354,247 | |
| | | | | | | | |
| | | | | | | 43,121,851 | |
| | | | | | | | |
| | |
| | | | Telecommunication Services – 5.24% | | | | |
| | 101,068 | | | Atlantic Tele-Network | | | 6,672,509 | |
| | 506,099 | | | Rogers Communications, Class B (Canada) | | | 18,072,795 | |
| | 536,481 | | | Verizon Communications | | | 27,060,102 | |
| | | | | | | | |
| | | | | | | 51,805,406 | |
| | | | | | | | |
See accompanying Notes to Financial Statements.
| | |
| |
| ASTON/River Road Dividend All Cap Value Fund | | April 30, 2015 |
| |
| Schedule of Investments (unaudited) – continued | | |
| | | | | | | | |
Shares | | | | | Market
Value | |
| | |
| | | | Utilities – 4.04% | | | | |
| | 269,330 | | | AmeriGas Partners LP | | $ | 13,124,451 | |
| | 415,681 | | | National Fuel Gas | | | 26,790,640 | |
| | | | | | | | |
| | | | | | | 39,915,091 | |
| | | | | | | | |
| | |
| | | | Total Common Stocks
(Cost $767,275,964) | | | 974,782,537 | |
| | | | | | | | |
|
| | INVESTMENT COMPANY – 1.66% | |
| | |
| | 16,433,914 | | | BlackRock Liquidity Funds
TempFund Portfolio | | | 16,433,914 | |
| | | | | | | | |
| | |
| | | | Total Investment Company
(Cost $16,433,914) | | | 16,433,914 | |
| | | | | | | | |
| Total Investments – 100.23%
(Cost $783,709,878)* | | | 991,216,451 | |
| | | | | | | | |
| Net Other Assets and Liabilities – (0.23)% | | | (2,253,506 | ) |
| | | | | | | | |
| Net Assets – 100.00% | | $ | 988,962,945 | |
| | | | | | | | |
| * | | At April 30, 2015, cost is identical for book and Federal income tax purposes. |
| | | | |
Gross unrealized appreciation | | $ | 213,615,749 | |
Gross unrealized depreciation | | | (6,109,176 | ) |
| | | | |
Net unrealized appreciation | | $ | 207,506,573 | |
| | | | |
| REIT | | Real Estate Investment Trust |
| SP ADR | | Sponsored American Depositary Receipt |
See accompanying Notes to Financial Statements.
| | |
| |
| ASTON/River Road Dividend All Cap Value Fund II | | April 30, 2015 |
| |
| Schedule of Investments (unaudited) | | |
| | | | | | | | |
Shares | | | | | Market
Value | |
|
| | COMMON STOCKS – 96.69% | |
| | |
| | | | Consumer Discretionary – 14.99% | | | | |
| | 35,301 | | | Bob Evans Farms | | $ | 1,518,649 | |
| | 40,094 | | | Cinemark Holdings | | | 1,709,207 | |
| | 95,976 | | | Ford Motor | | | 1,516,421 | |
| | 31,114 | | | Hasbro | | | 2,202,560 | |
| | 52,404 | | | Kohl’s | | | 3,754,747 | |
| | 47,925 | | | Omnicom Group | | | 3,630,798 | |
| | 79,115 | | | Shaw Communications, Class B
(Canada) | | | 1,807,778 | |
| | 31,794 | | | Target | | | 2,506,321 | |
| | 66,027 | | | Thomson Reuters (Canada) | | | 2,711,069 | |
| | | | | | | | |
| | | | | | | 21,357,550 | |
| | | | | | | | |
| | |
| | | | Consumer Staples – 11.03% | | | | |
| | 24,933 | | | Kimberly-Clark | | | 2,734,901 | |
| | 38,175 | | | Molson Coors Brewing, Class B | | | 2,806,244 | |
| | 17,283 | | | PepsiCo | | | 1,643,959 | |
| | 94,454 | | | Sysco | | | 3,497,632 | |
| | 54,126 | | | Univelver, SP ADR (Great Britain) | | | 2,371,801 | |
| | 34,080 | | | Wal-Mart Stores | | | 2,659,944 | |
| | | | | | | | |
| | | | | | | 15,714,481 | |
| | | | | | | | |
| | |
| | | | Energy – 6.70% | | | | |
| | 25,931 | | | Chevron | | | 2,879,897 | |
| | 26,100 | | | Martin Midstream Partners LP | | | 968,310 | |
| | 43,798 | | | Memorial Production Partners LP | | | 784,860 | |
| | 49,195 | | | Occidental Petroleum | | | 3,940,519 | |
| | 19,693 | | | Williams Partners LP | | | 972,834 | |
| | | | | | | | |
| | | | | | | 9,546,420 | |
| | | | | | | | |
| | |
| | | | Financials – 16.82% | | | | |
| | 23,496 | | | CME Group | | | 2,136,021 | |
| | 17,712 | | | CNA Financial | | | 713,794 | |
| | 26,898 | | | CyrusOne, REIT | | | 873,647 | |
| | | | | | | | |
Shares | | | | | Market
Value | |
| | |
| | | | Financials (continued) | | | | |
| | 59,652 | | | Geo Group, REIT | | $ | 2,326,428 | |
| | 134,193 | | | Iron Mountain, REIT | | | 4,628,319 | |
| | 10,916 | | | PartnerRe (Bermuda) | | | 1,397,248 | |
| | 50,101 | | | PNC Financial Services Group | | | 4,595,765 | |
| | 82,955 | | | U.S. Bancorp | | | 3,556,281 | |
| | 67,871 | | | Wells Fargo & Co | | | 3,739,692 | |
| | | | | | | | |
| | | | | | | 23,967,195 | |
| | | | | | | | |
| | |
| | | | Healthcare – 4.13% | | | | |
| | 55,931 | | | Owens & Minor | | | 1,885,993 | |
| | 56,027 | | | Quest Diagnostics | | | 4,001,448 | |
| | | | | | | | |
| | | | | | | 5,887,441 | |
| | | | | | | | |
| | |
| | | | Industrials – 14.78% | | | | |
| | 25,045 | | | ABM Industries | | | 802,692 | |
| | 111,555 | | | ADT | | | 4,194,468 | |
| | 64,683 | | | Aircastle (Bermuda) | | | 1,551,098 | |
| | 48,463 | | | Emerson Electric | | | 2,851,078 | |
| | 81,711 | | | Fastenal | | | 3,482,523 | |
| | 23,138 | | | Parker-Hannifin | | | 2,761,752 | |
| | 61,360 | | | Republic Services | | | 2,493,057 | |
| | 29,039 | | | United Parcel Service, Class B | | | 2,919,291 | |
| | | | | | | | |
| | | | | | | 21,055,959 | |
| | | | | | | | |
| | |
| | | | Information Technology – 15.22% | | | | |
| | 131,699 | | | Intel | | | 4,286,802 | |
| | 36,891 | | | j2 Global | | | 2,559,129 | |
| | 112,192 | | | Microsoft | | | 5,457,019 | |
| | 52,336 | | | Motorola Solutions | | | 3,127,076 | |
| | 48,394 | | | QUALCOMM | | | 3,290,792 | |
| | 146,392 | | | Western Union | | | 2,968,830 | |
| | | | | | | | |
| | | | | | | 21,689,648 | |
| | | | | | | | |
| | |
| | | | Materials – 3.71% | | | | |
| | 29,418 | | | Bemis | | | 1,323,810 | |
| | 22,041 | | | Compass Minerals International | | | 1,946,882 | |
| | 11,767 | | | Innophos Holdings | | | 621,768 | |
| | 28,457 | | | Nucor | | | 1,390,409 | |
| | | | | | | | |
| | | | | | | 5,282,869 | |
| | | | | | | | |
| | |
| | | | Telecommunication Services – 4.94% | | | | |
| | 77,841 | | | Rogers Communications, Class B (Canada) | | | 2,779,702 | |
| | 84,374 | | | Verizon Communications | | | 4,255,825 | |
| | | | | | | | |
| | | | | | | 7,035,527 | |
| | | | | | | | |
| | |
| | | | Utilities – 4.37% | | | | |
| | 41,359 | | | AmeriGas Partners LP | | | 2,015,424 | |
| | 65,340 | | | National Fuel Gas | | | 4,211,163 | |
| | | | | | | | |
| | | | | | | 6,226,587 | |
| | | | | | | | |
| | |
| | | | Total Common Stocks
(Cost $123,304,819) | | | 137,763,677 | |
| | | | | | | | |
See accompanying Notes to Financial Statements.
| | |
| |
| ASTON/River Road Dividend All Cap Value Fund II | | April 30, 2015 |
| |
| Schedule of Investments (unaudited) – continued | | |
| | | | | | | | |
Shares | | | | | Market
Value | |
|
| | INVESTMENT COMPANY – 3.42% | |
| | |
| | 4,875,308 | | | BlackRock Liquidity Fund
TempCash Portfolio | | $ | 4,875,308 | |
| | | | | | | | |
| | |
| | | | Total Investment Company
(Cost $4,875,308) | | | 4,875,308 | |
| | | | | | | | |
| Total Investments – 100.11%
(Cost $128,180,127)* | | | 142,638,985 | |
| | | | | | | | |
| Net Other Assets and Liabilities – (0.11)% | | | (150,443 | ) |
| | | | | | | | |
| Net Assets – 100.00% | | $ | 142,488,542 | |
| | | | | | | | |
| * | | At April 30, 2015, cost is identical for book and Federal income tax purposes. |
| | | | |
Gross unrealized appreciation | | $ | 16,410,393 | |
Gross unrealized depreciation | | | (1,951,535 | ) |
| | | | |
Net unrealized appreciation | | $ | 14,458,858 | |
| | | | |
| REIT | | Real Estate Investment Trust |
| SP ADR | | Sponsored American Depositary Receipt |
See accompanying Notes to Financial Statements.
| | |
| |
| ASTON/Fairpointe Mid Cap Fund | | April 30, 2015 |
| |
| Schedule of Investments (unaudited) | | |
| | | | | | | | |
Shares | | | | | Market
Value | |
|
| | COMMON STOCKS – 98.57% | |
| | |
| | | | Consumer Discretionary – 22.51% | | | | |
| | 1,390,100 | | | BorgWarner | | $ | 82,293,920 | |
| | 2,140,800 | | | Cooper Tire & Rubber | | | 90,962,592 | |
| | 4,592,300 | | | DeVry Education Group | | | 138,871,152 | |
| | 3,413,300 | | | Gannett | | | 117,144,456 | |
| | 5,748,100 | | | Interpublic Group | | | 119,790,404 | |
| | 833,800 | | | Lear | | | 92,576,814 | |
| | 7,382,600 | | | Mattel | | | 207,894,016 | |
| | 10,597,854 | | | New York Times, Class A | | | 141,905,265 | |
| | 2,286,478 | | | Scholastic | | | 92,922,466 | |
| | 4,034,600 | | | Staples | | | 65,844,672 | |
| | 6,316,452 | | | Time | | | 144,204,599 | |
| | | | | | | | |
| | | | | | | 1,294,410,356 | |
| | | | | | | | |
| | |
| | | | Consumer Staples – 2.22% | | | | |
| | 1,102,300 | | | Bunge | | | 95,205,651 | |
| | 442,900 | | | Molson Coors Brewing, Class B | | | 32,557,579 | |
| | | | | | | | |
| | | | | | | 127,763,230 | |
| | | | | | | | |
| | |
| | | | Energy – 8.04% | | | | |
| | 4,446,592 | | | FMC Technologies * | | | 196,094,707 | |
| | 19,749,400 | | | McDermott International * | | | 103,684,350 | |
| | 8,627,500 | | | Transocean Ltd. (Switzerland) | | | 162,369,550 | |
| | | | | | | | |
| | | | | | | 462,148,607 | |
| | | | | | | | |
| | |
| | | | Financials – 7.08% | | | | |
| | 1,335,700 | | | Cincinnati Financial | | | 67,639,848 | |
| | 1,528,585 | | | Eaton Vance | | | 62,794,272 | |
| | 1,789,100 | | | Northern Trust | | | 130,872,665 | |
| | 2,582,500 | | | Raymond James Financial | | | 145,988,725 | |
| | | | | | | | |
| | | | | | | 407,295,510 | |
| | | | | | | | |
| | | | | | | | |
Shares | | | | | Market
Value | |
| | | | Healthcare – 4.90% | | | | |
| | 207,500 | | | Charles River Laboratories * | | $ | 14,350,700 | |
| | 461,500 | | | Hospira * | | | 40,284,335 | |
| | 1,647,400 | | | Quest Diagnostics | | | 117,657,308 | |
| | 1,230,400 | | | Varian Medical Systems * | | | 109,321,040 | |
| | | | | | | | |
| | | | | | | 281,613,383 | |
| | | | | | | | |
| | | | Industrials – 16.41% | | | | |
| | 3,657,500 | | | AGCO | | | 188,397,825 | |
| | 1,996,000 | | | Chicago Bridge & Iron (Netherlands) | | | 95,109,400 | |
| | 2,606,200 | | | Con-way | | | 107,114,820 | |
| | 625,000 | | | Copa Holdings SA, Class A (Panama) | | | 69,306,250 | |
| | 621,044 | | | ManpowerGroup | | | 52,993,685 | |
| | 4,518,100 | | | Owens Corning | | | 174,669,746 | |
| | 1,081,700 | | | Polypore International * | | | 63,344,352 | |
| | 2,584,300 | | | Werner Enterprises | | | 69,440,141 | |
| | 3,332,100 | | | Xylem | | | 123,354,342 | |
| | | | | | | | |
| | | | | | | 943,730,561 | |
| | | | | | | | |
| | | | Information Technology – 26.03% | | | | |
| | 1,776,800 | | | Akamai Technologies * | | | 131,092,304 | |
| | 1,804,500 | | | Citrix Systems * | | | 121,190,220 | |
| | 5,278,892 | | | Cree * | | | 167,235,299 | |
| | 4,424,800 | | | Finisar * | | | 89,956,184 | |
| | 3,026,948 | | | Itron * | | | 108,546,355 | |
| | 5,453,800 | | | Jabil Circuit | | | 122,819,576 | |
| | 7,801,000 | | | Juniper Networks | | | 206,180,430 | |
| | 10,529,700 | | | Nuance Communications * | | | 161,420,301 | |
| | 4,512,400 | | | NVIDIA | | | 100,152,718 | |
| | 4,150,700 | | | Teradata * | | | 182,589,293 | |
| | 4,834,468 | | | Unisys * | | | 105,246,368 | |
| | | | | | | | |
| | | | | | | 1,496,429,048 | |
| | | | | | | | |
| | | | Materials – 11.38% | | | | |
| | 10,278,800 | | | Alcoa | | | 137,941,496 | |
| | 1,342,804 | | | Domtar (Canada) | | | 58,035,989 | |
| | 2,908,262 | | | FMC | | | 172,489,019 | |
| | 30,900,400 | | | Gerdau SA, SP ADR | | | 103,825,344 | |
| | 7,584,200 | | | United States Steel | | | 182,172,484 | |
| | | | | | | | |
| | | | | | | 654,464,332 | |
| | | | | | | | |
| | | | Total Common Stocks
(Cost $4,737,973,854) | | | 5,667,855,027 | |
| | | | | | | | |
|
| | INVESTMENT COMPANY – 1.19% | |
| | |
| | 68,521,578 | | | BlackRock Liquidity Funds
TempFund Portfolio | | | 68,521,578 | |
| | | | | | | | |
| | |
| | | | Total Investment Company
(Cost $68,521,578) | | | 68,521,578 | |
| | | | | | | | |
| Total Investments – 99.76%
(Cost $4,806,495,432)** | | | 5,736,376,605 | |
| | | | | | | | |
| Net Other Assets and Liabilities – 0.24% | | | 13,969,298 | |
| | | | | | | | |
| Net Assets – 100.00% | | $ | 5,750,345,903 | |
| | | | | | | | |
See accompanying Notes to Financial Statements.
| | |
| |
| ASTON/Fairpointe Mid Cap Fund | | April 30, 2015 |
| |
| Schedule of Investments (unaudited) – continued | | |
| * | | Non-income producing security. |
| ** | | At April 30, 2015, cost is identical for book and Federal income tax purposes. |
| | | | |
Gross unrealized appreciation | | $ | 1,170,573,754 | |
Gross unrealized depreciation | | | (240,692,581 | ) |
| | | | |
Net unrealized appreciation | | $ | 929,881,173 | |
| | | | |
| SP ADR | | Sponsored American Depositary Receipt |
See accompanying Notes to Financial Statements.
| | |
| |
| ASTON/Montag & Caldwell Mid Cap Growth Fund | | April 30, 2015 |
| |
| Schedule of Investments (unaudited) | | |
| | | | | | | | |
Shares | | | | | Market
Value | |
|
| | COMMON STOCKS – 97.40% | |
| | |
| | | | Consumer Discretionary – 22.42% | | | | |
| | 1,026 | | | Advance Auto Parts | | $ | 146,718 | |
| | 2,900 | | | BorgWarner | | | 171,680 | |
| | 1,530 | | | Dollar General | | | 111,246 | |
| | 4,060 | | | Dollar Tree * | | | 310,225 | |
| | 5,190 | | | Dunkin’ Brands Group | | | 270,451 | |
| | 2,110 | | | Harman International Industries | | | 275,102 | |
| | 9,670 | | | LKQ * | | | 261,767 | |
| | 1,012 | | | O’Reilly Automotive * | | | 220,444 | |
| | 419 | | | Panera Bread, Class A * | | | 76,459 | |
| | 960 | | | PVH | | | 99,216 | |
| | 2,290 | | | Ross Stores | | | 226,435 | |
| | 1,830 | | | Tractor Supply | | | 157,490 | |
| | | | | | | | |
| | | | | | | 2,327,233 | |
| | | | | | | | |
| | | | Consumer Staples – 8.93% | | | | |
| | 2,460 | | | Church & Dwight | | | 199,678 | |
| | 2,700 | | | Mead Johnson Nutrition | | | 258,984 | |
| | 1,450 | | | Molson Coors Brewing, Class B | | | 106,589 | |
| | 1,920 | | | Monster Beverage * | | | 263,251 | |
| | 1,220 | | | TreeHouse Foods * | | | 99,137 | |
| | | | | | | | |
| | | | | | | 927,639 | |
| | | | | | | | |
| | | | Energy – 2.23% | | | | |
| | 1,160 | | | Core Laboratories (Netherlands) | | | 152,285 | |
| | 1,450 | | | Oceaneering International | | | 79,909 | |
| | | | | | | | |
| | | | | | | 232,194 | |
| | | | | | | | |
| | | | Financials – 11.20% | | | | |
| | 3,950 | | | First Republic Bank | | | 230,246 | |
| | 1,196 | | | Intercontinental Exchange | | | 268,538 | |
| | 1,890 | | | Lazard MLP, Class A (Bermuda) | | | 100,227 | |
| | 4,960 | | | Raymond James Financial | | | 280,389 | |
| | 2,110 | | | Signature Bank New York NY * | | | 282,930 | |
| | | | | | | | |
| | | | | | | 1,162,330 | |
| | | | | | | | |
| | | | Healthcare – 12.71% | | | | |
| | 2,030 | | | AmerisourceBergen | | | 232,029 | |
| | 592 | | | Cooper | | | 105,417 | |
| | | | | | | | |
Shares | | | | | Market
Value | |
| | | | Healthcare (continued) | | | | |
| | 1,580 | | | Henry Schein * | | $ | 216,618 | |
| | 1,040 | | | IDEXX Laboratories * | | | 130,385 | |
| | 3,370 | | | MEDNAX * | | | 238,529 | |
| | 679 | | | Perrigo (Ireland) | | | 124,447 | |
| | 2,100 | | | Quintiles Transnational Holdings * | | | 138,348 | |
| | 2,090 | | | ResMed | | | 133,635 | |
| | | | | | | | |
| | | | | | | 1,319,408 | |
| | | | | | | | |
| | | | Industrials – 25.31% | | | | |
| | 4,550 | | | AMETEK | | | 238,511 | |
| | 4,580 | | | Copart * | | | 162,911 | |
| | 3,090 | | | Donaldson | | | 115,473 | |
| | 3,980 | | | Expeditors International of Washington | | | 182,403 | |
| | 3,910 | | | Fastenal | | | 166,644 | |
| | 2,060 | | | IHS, Class A * | | | 258,468 | |
| | 2,710 | | | J.B. Hunt Transport Services | | | 236,312 | |
| | 2,410 | | | Nordson | | | 191,957 | |
| | 1,700 | | | Pall | | | 165,444 | |
| | 925 | | | Roper Technologies | | | 155,557 | |
| | 1,920 | | | Stericycle * | | | 256,186 | |
| | 2,830 | | | Verisk Analytics, Class A * | | | 212,363 | |
| | 3,030 | | | Wabtec | | | 284,972 | |
| | | | | | | | |
| | | | | | | 2,627,201 | |
| | | | | | | | |
| | | | Information Technology – 14.60% | | | | |
| | 2,630 | | | Akamai Technologies * | | | 194,041 | |
| | 5,190 | | | Amphenol, Class A | | | 287,370 | |
| | 2,050 | | | ANSYS * | | | 175,972 | |
| | 1,730 | | | EPAM Systems * | | | 111,948 | |
| | 1,050 | | | F5 Networks * | | | 128,121 | |
| | 2,100 | | | FactSet Research Systems | | | 330,519 | |
| | 2,550 | | | WEX * | | | 287,411 | |
| | | | | | | | |
| | | | | | | 1,515,382 | |
| | | | | | | | |
| | | | Total Common Stocks
(Cost $8,175,173) | | | 10,111,387 | |
| | | | | | | | |
|
| | INVESTMENT COMPANY – 3.61% | |
| | |
| | 374,524 | | | BlackRock Liquidity Funds
TempFund Portfolio | | | 374,524 | |
| | | | | | | | |
| | | | Total Investment Company
(Cost $374,524) | | | 374,524 | |
| | | | | | | | |
| Total Investments – 101.01%
(Cost $8,549,697)** | | | 10,485,911 | |
| | | | | | | | |
| Net Other Assets and Liabilities – (1.01)% | | | (105,089 | ) |
| | | | | | | | |
| Net Assets – 100.00% | | $ | 10,380,822 | |
| | | | | | | | |
| * | | Non-income producing security. |
| ** | | At April 30, 2015, cost is identical for book and Federal income tax purposes. |
| | | | |
Gross unrealized appreciation | | $ | 2,031,342 | |
Gross unrealized depreciation | | | (95,128 | ) |
| | | | |
Net unrealized appreciation | | $ | 1,936,214 | |
| | | | |
See accompanying Notes to Financial Statements.
| | |
| |
| ASTON/LMCG Small Cap Growth Fund | | April 30, 2015 |
| |
| Schedule of Investments (unaudited) | | |
| | | | | | | | |
Shares | | | | | Market Value | |
|
| | COMMON STOCKS – 92.71% | |
| | |
| | | | Consumer Discretionary – 16.87% | | | | |
| | 141,383 | | | Black Diamond * | | $ | 1,273,861 | |
| | 104,663 | | | Bloomin’ Brands | | | 2,371,664 | |
| | 7,265 | | | Buffalo Wild Wings * | | | 1,157,314 | |
| | 61,042 | | | Del Frisco’s Restaurant Group * | | | 1,231,217 | |
| | 14,273 | | | Life Time Fitness * | | | 1,020,519 | |
| | 18,498 | | | Lithia Motors, Class A | | | 1,844,805 | |
| | 23,151 | | | Nexstar Broadcasting Group, Class A | | | 1,353,407 | |
| | 60,087 | | | Party City Holdco * | | | 1,249,209 | |
| | 54,483 | | | Shutterfly * | | | 2,438,659 | |
| | 40,155 | | | Sinclair Broadcast Group, Class A | | | 1,230,349 | |
| | 105,585 | | | Sotheby’s | | | 4,509,535 | |
| | | | | | | | |
| | | | | | | 19,680,539 | |
| | | | | | | | |
| | |
| | | | Consumer Staples – 4.73% | | | | |
| | 9,600 | | | Boston Beer, Class A * | | | 2,378,880 | |
| | 46,525 | | | United Natural Foods * | | | 3,138,576 | |
| | | | | | | | |
| | | | | | | 5,517,456 | |
| | | | | | | | |
| | |
| | | | Energy – 2.14% | | | | |
| | 8,017 | | | Diamondback Energy * | | | 661,964 | |
| | 8,403 | | | Gulfport Energy * | | | 411,243 | |
| | 28,920 | | | Memorial Resource Development * | | | 583,895 | |
| | 33,965 | | | Rice Energy * | | | 836,558 | |
| | | | | | | | |
| | | | | | | 2,493,660 | |
| | | | | | | | |
| | |
| | | | Financials – 2.59% | | | | |
| | 31,696 | | | Ashford Hospitality Prime | | | 496,359 | |
| | 6,566 | | | BofI Holding * | | | 602,824 | |
| | 24,945 | | | Evercore Partners | | | 1,203,347 | |
| | 26,473 | | | Moelis, Class A | | | 716,095 | |
| | | | | | | | |
| | | | | | | 3,018,625 | |
| | | | | | | | |
| | | | | | | | |
Shares | | | | | Market Value | |
| | |
| | | | Healthcare – 24.30% | | | | |
| | 33,115 | | | Aduro Biotech * | | $ | 841,121 | |
| | 24,737 | | | Akorn * | | | 1,030,049 | |
| | 38,904 | | | Align Technology * | | | 2,289,111 | |
| | 71,566 | | | Allscripts Healthcare Solutions * | | | 951,828 | |
| | 39,257 | | | Amsurg * | | | 2,462,199 | |
| | 10,259 | | | athenahealth * | | | 1,258,369 | |
| | 88,167 | | | Community Health Systems * | | | 4,732,805 | |
| | 19,154 | | | Cyberonics * | | | 1,166,670 | |
| | 39,195 | | | HealthSouth | | | 1,772,398 | |
| | 10,682 | | | HeartWare International * | | | 808,734 | |
| | 9,703 | | | ICON PLC (Ireland) * | | | 624,291 | |
| | 46,147 | | | Insulet * | | | 1,377,488 | |
| | 3,662 | | | Intercept Pharmaceuticals * | | | 925,790 | |
| | 27,886 | | | LifePoint Hospitals * | | | 2,088,104 | |
| | 14,784 | | | Neurocrine Biosciences * | | | 503,986 | |
| | 19,078 | | | PAREXEL International * | | | 1,212,884 | |
| | 43,032 | | | Premier, Class A * | | | 1,630,913 | |
| | 5,244 | | | Puma Biotechnology * | | | 946,961 | |
| | 7,676 | | | Synageva BioPharma * | | | 705,885 | |
| | 38,774 | | | Veeva Systems * | | | 1,029,450 | |
| | | | | | | | |
| | | | | | | 28,359,036 | |
| | | | | | | | |
| | | | Industrials – 12.33% | | | | |
| | 33,744 | | | Advisory Board * | | | 1,750,976 | |
| | 181,133 | | | Builders FirstSource * | | | 2,311,257 | |
| | 17,800 | | | HEICO | | | 993,952 | |
| | 23,699 | | | Herman Miller | | | 649,590 | |
| | 42,139 | | | Hexcel | | | 2,113,271 | |
| | 82,323 | | | Kelly Services, Class A | | | 1,351,744 | |
| | 74,267 | | | Kforce | | | 1,688,832 | |
| | 33,777 | | | Korn/Ferry International | | | 1,064,989 | |
| | 61,142 | | | USG * | | | 1,622,709 | |
| | 17,318 | | | XPO Logistics * | | | 839,923 | |
| | | | | | | | |
| | | | | | | 14,387,243 | |
| | | | | | | | |
| | | | Information Technology – 24.51% | | | | |
| | 45,615 | | | Cardtronics * | | | 1,721,054 | |
| | 89,377 | | | Dealertrack Technologies * | | | 3,513,410 | |
| | 47,418 | | | ExlService Holdings * | | | 1,632,602 | |
| | 14,625 | | | Fleetmatics Group PLC (Ireland) * | | | 666,607 | |
| | 138,193 | | | Global Eagle Entertainment * | | | 1,764,725 | |
| | 63,340 | | | Heartland Payment Systems | | | 3,224,006 | |
| | 290,344 | | | Internap * | | | 2,729,234 | |
| | 25,073 | | | MAXIMUS | | | 1,604,923 | |
| | 31,916 | | | NetScout Systems * | | | 1,311,748 | |
| | 47,741 | | | SciQuest * | | | 733,779 | |
| | 106,891 | | | Synchronoss Technologies * | | | 4,904,159 | |
| | 7,011 | | | Ultimate Software Group * | | | 1,165,368 | |
| | 95,403 | | | WNS Holdings, ADR (Jersey) * | | | 2,302,074 | |
| | 33,760 | | | Yelp * | | | 1,329,806 | |
| | | | | | | | |
| | | | | | | 28,603,495 | |
| | | | | | | | |
| | |
| | | | Materials – 3.45% | | | | |
| | 56,520 | | | Boise Cascade * | | | 1,961,244 | |
| | 86,912 | | | Summit Materials * | | | 2,058,945 | |
| | | | | | | | |
| | | | | | | 4,020,189 | |
| | | | | | | | |
See accompanying Notes to Financial Statements.
| | |
| |
| ASTON/LMCG Small Cap Growth Fund | | April 30, 2015 |
| |
| Schedule of Investments (unaudited) – continued | | |
| | | | | | | | |
Shares | | | | | Market Value | |
| | |
| | | | Telecommunication Services – 1.79% | | | | |
| | |
| | 59,835 | | | Cogent Communications Holdings | | $ | 2,093,627 | |
| | | | | | | | |
| | |
| | | | Total Common Stocks
(Cost $99,815,163) | | | 108,173,870 | |
| | | | | | | | |
|
| | EXCHANGE TRADED FUND – 2.91% | |
| | |
| | 23,088 | | | iShares Russell 2000 Growth Index Fund | | | 3,395,090 | |
| | | | | | | | |
| | |
| | | | Total Exchange Traded Fund
(Cost $3,325,682) | | | 3,395,090 | |
| | | | | | | | |
|
| | WARRANTS – 0% | |
| | |
| | | | Energy – 0.00% | | | | |
| | 11,820 | | | Magnum Hunter Resources, Strike Price $8.50, Expiration 04/15/16 | | | — | |
| | | | | | | | |
| | |
| | | | Total Warrants
(Cost $—) | | | — | |
| | | | | | | | |
|
| | INVESTMENT COMPANY – 5.49% | |
| | |
| | 6,406,335 | | | BlackRock Liquidity Fund
TempCash Portfolio | | | 6,406,335 | |
| | | | | | | | |
| | |
| | | | Total Investment Company
(Cost $6,406,335) | | | 6,406,335 | |
| | | | | | | | |
| Total Investments – 101.11%
(Cost $109,547,180)** | | | 117,975,295 | |
| | | | | | | | |
| Net Other Assets and Liabilities – (1.11)% | | | (1,295,791 | ) |
| | | | | | | | |
| Net Assets – 100.00% | | $ | 116,679,504 | |
| | | | | | | | |
| * | | Non-income producing security. |
| ** | | At April 30, 2015, cost is identical for book and Federal income tax purposes. |
| | | | |
Gross unrealized appreciation | | $ | 10,801,198 | |
Gross unrealized depreciation | | | (2,373,083 | ) |
| | | | |
Net unrealized appreciation | | $ | 8,428,115 | |
| | | | |
| ADR | | American Depositary Receipt |
See accompanying Notes to Financial Statements.
| | |
| |
| ASTON/River Road Independent Value Fund | | April 30, 2015 |
| |
| Schedule of Investments (unaudited) | | |
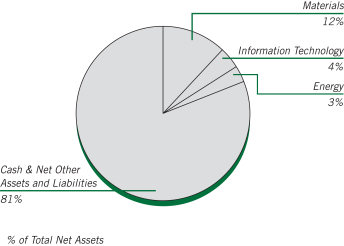
At April 30, 2015, 11.21% of the Total Net Assets of the Fund were comprised of securities of issuers outside the United States.
| | | | | | | | |
Shares | | | | | Market Value | |
|
| | COMMON STOCKS – 19.43% | |
| | |
| | | | Energy – 2.86% | | | | |
| | 95,262 | | | Contango Oil & Gas * | | $ | 2,388,218 | |
| | 228,574 | | | QEP Resources | | | 5,142,915 | |
| | 157,222 | | | Unit * | | | 5,477,615 | |
| | | | | | | | |
| | | | | | | 13,008,748 | |
| | | | | | | | |
| | |
| | | | Financials – 0.45% | | | | |
| | 89,231 | | | Baldwin & Lyons, Class B | | | 2,024,651 | |
| | | | | | | | |
| | |
| | | | Information Technology – 4.18% | | | | |
| | 109,977 | | | Benchmark Electronics * | | | 2,587,759 | |
| | 196,530 | | | Convergys | | | 4,457,300 | |
| | 177,190 | | | CSG Systems International | | | 5,159,773 | |
| | 272,145 | | | Sykes Enterprises * | | | 6,811,789 | |
| | | | | | | | |
| | | | | | | 19,016,621 | |
| | | | | | | | |
| | |
| | | | Materials – 11.94% | | | | |
| | 303,078 | | | American Vanguard | | | 3,306,581 | |
| | 4,242,444 | | | AuRico Gold (Canada) | | | 14,806,130 | |
| | 4,821,322 | | | New Gold (Canada) * | | | 16,296,068 | |
| | 1,686,552 | | | Pan American Silver (Canada) | | | 16,055,975 | |
| | 703,867 | | | Silver Standard Resources
(Canada) * | | | 3,832,556 | |
| | | | | | | | |
| | | | | | | 54,297,310 | |
| | | | | | | | |
| | |
| | | | Total Common Stocks
(Cost $90,045,315) | | | 88,347,330 | |
| | | | | | | | |
| | | | | | | | |
Shares | | | | | Market
Value | |
|
| | INVESTMENT COMPANY – 80.88% | |
| | |
| | 367,738,703 | | | BlackRock Liquidity Funds Treasury Trust Fund Portfolio | | $ | 367,738,703 | |
| | | | | | | | |
| | | | Total Investment Company
(Cost $367,738,703) | | | 367,738,703 | |
| | | | | | | | |
| Total Investments – 100.31%
(Cost $457,784,018)** | | | 456,086,033 | |
| | | | | | | | |
| Net Other Assets and Liabilities – (0.31)% | | | (1,397,286 | ) |
| | | | | | | | |
| Net Assets – 100.00% | | $ | 454,688,747 | |
| | | | | | | | |
| * | | Non-income producing security. |
| ** | | At April 30, 2015, cost is identical for book and Federal income tax purposes. |
| | | | |
Gross unrealized appreciation | | $ | 6,675,041 | |
Gross unrealized depreciation | | | (8,373,026 | ) |
| | | | |
Net unrealized depreciation | | $ | (1,697,985 | ) |
| | | | |
See accompanying Notes to Financial Statements.
| | |
| |
| ASTON/River Road Select Value Fund | | April 30, 2015 |
| |
| Schedule of Investments (unaudited) | | |
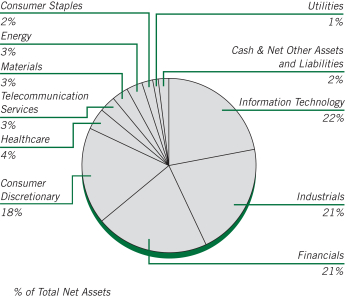
| | | | | | | | |
Shares | | | | | Market
Value | |
| | | | | | | | |
|
| | COMMON STOCKS – 98.04% | |
| | |
| | | | Consumer Discretionary – 17.71% | | | | |
| | 86,999 | | | Ascena Retail Group * | | $ | 1,304,115 | |
| | 27,388 | | | Ascent Capital Group, Class A * | | | 1,096,616 | |
| | 7,928 | | | Biglari Holdings * | | | 2,897,763 | |
| | 18,510 | | | Children’s Place | | | 1,122,817 | |
| | 112,065 | | | International Speedway, Class A | | | 4,074,683 | |
| | 17,208 | | | Madison Square Garden, Class A * | | | 1,381,802 | |
| | 32,340 | | | Motorcar Parts of America * | | | 945,298 | |
| | 23,743 | | | Outerwall | | | 1,577,247 | |
| | 138,289 | | | Remy International | | | 3,076,930 | |
| | 113,670 | | | SodaStream International * | | | 2,208,608 | |
| | 69,630 | | | Sotheby’s | | | 2,973,897 | |
| | 38,660 | | | Stage Stores | | | 746,525 | |
| | | | | | | | |
| | | | | | | 23,406,301 | |
| | | | | | | | |
| | |
| | | | Consumer Staples – 1.97% | | | | |
| | 65,990 | | | Darling Ingredients * | | | 901,423 | |
| | 9,902 | | | Ingles Markets, Class A | | | 414,498 | |
| | 40,457 | | | Village Super Market, Class A | | | 1,291,792 | |
| | | | | | | | |
| | | | | | | 2,607,713 | |
| | | | | | | | |
| | |
| | | | Energy – 3.24% | | | | |
| | 183,273 | | | Evolution Petroleum | | | 1,260,918 | |
| | 284,840 | | | Gran Tierra Energy * | | | 1,059,605 | |
| | 50,900 | | | QEP Resources | | | 1,145,250 | |
| | 59,241 | | | WPX Energy * | | | 814,564 | |
| | | | | | | | |
| | | | | | | 4,280,337 | |
| | | | | | | | |
| | |
| | | | Financials – 20.98% | | | | |
| | 6,885 | | | Alleghany * | | | 3,260,185 | |
| | 91,904 | | | Brown & Brown | | | 2,936,333 | |
| | 63,231 | | | Capital Southwest | | | 3,010,428 | |
| | | | | | | | |
Shares | | | | | Market
Value | |
| | |
| | | | Financials (continued) | | | | |
| | 198,384 | | | FNFV Group * | | $ | 2,965,841 | |
| | 73,853 | | | Forest City Enterprises, Class A * | | | 1,754,747 | |
| | 18,667 | | | Geo Group, REIT | | | 728,013 | |
| | 82,897 | | | Hilltop Holdings * | | | 1,667,059 | |
| | 27,349 | | | International Bancshares | | | 710,527 | |
| | 100,980 | | | Leucadia National | | | 2,400,295 | |
| | 174,993 | | | PICO Holdings * | | | 3,151,624 | |
| | 7,613 | | | White Mountains Insurance Group (Bermuda) | | | 5,146,160 | |
| | | | | | | | |
| | | | | | | 27,731,212 | |
| | | | | | | | |
| | |
| | | | Healthcare – 4.36% | | | | |
| | 16,721 | | | Bio-Rad Laboratories, Class A * | | | 2,248,138 | |
| | 47,924 | | | Myriad Genetics * | | | 1,582,930 | |
| | 57,141 | | | Owens & Minor | | | 1,926,795 | |
| | | | | | | | |
| | | | | | | 5,757,863 | |
| | | | | | | | |
| | |
| | | | Industrials – 20.90% | | | | |
| | 149,045 | | | ADT | | | 5,604,092 | |
| | 166,501 | | | Air Transport Services Group * | | | 1,551,789 | |
| | 101,280 | | | Brink’s | | | 2,680,882 | |
| | 43,427 | | | Clean Harbors * | | | 2,399,342 | |
| | 8,503 | | | Cubic | | | 421,579 | |
| | 17,236 | | | Forward Air | | | 868,177 | |
| | 45,480 | | | Kelly Services, Class A | | | 746,782 | |
| | 70,690 | | | KLX * | | | 2,962,618 | |
| | 89,224 | | | Marten Transport | | | 1,986,126 | |
| | 117,631 | | | SP Plus * | | | 2,677,282 | |
| | 42,960 | | | UniFirst | | | 4,864,361 | |
| | 18,239 | | | US Ecology | | | 855,591 | |
| | | | | | | | |
| | | | | | | 27,618,621 | |
| | | | | | | | |
| | |
| | | | Information Technology – 22.08% | | | | |
| | 101,302 | | | Blackhawk Network Holdings,
Class B * | | | 3,718,796 | |
| | 114,482 | | | Convergys | | | 2,596,452 | |
| | 147,436 | | | CSG Systems International | | | 4,293,336 | |
| | 96,390 | | | Dolby Laboratories, Class A | | | 3,880,661 | |
| | 32,590 | | | IAC/InterActive | | | 2,275,434 | |
| | 51,907 | | | Knowles * | | | 995,057 | |
| | 115,721 | | | NeuStar, Class A * | | | 3,471,630 | |
| | 158,867 | | | Rovi * | | | 2,940,628 | |
| | 41,473 | | | Sykes Enterprises * | | | 1,038,069 | |
| | 45,880 | | | Tech Data * | | | 2,586,256 | |
| | 108,970 | | | Vishay Intertechnology | | | 1,381,740 | |
| | | | | | | | |
| | | | | | | 29,178,059 | |
| | | | | | | | |
| | |
| | | | Materials – 2.63% | | | | |
| | 62,888 | | | American Vanguard | | | 686,108 | |
| | 34,449 | | | AptarGroup | | | 2,138,249 | |
| | 40,128 | | | Myers Industries | | | 648,870 | |
| | | | | | | | |
| | | | | | | 3,473,227 | |
| | | | | | | | |
See accompanying Notes to Financial Statements.
| | |
| |
| ASTON/River Road Select Value Fund | | April 30, 2015 |
| |
| Schedule of Investments (unaudited) – continued | | |
| | | | | | | | |
Shares | | | | | Market
Value | |
| | |
| | | | Telecommunication Services – 3.46% | | | | |
| | 24,383 | | | Atlantic Tele-Network | | $ | 1,609,766 | |
| | 110,779 | | | Telephone & Data Systems | | | 2,958,907 | |
| | | | | | | | |
| | | | | | | 4,568,673 | |
| | | | | | | | |
| | |
| | | | Utilities – 0.71% | | | | |
| | 14,605 | | | National Fuel Gas | | | 941,292 | |
| | | | | | | | |
| | |
| | | | Total Common Stocks
(Cost $118,790,601) | | | 129,563,298 | |
| | | | | | | | |
| |
| | INVESTMENT COMPANY – 2.62% | | | | |
| | 3,465,572 | | | BlackRock Liquidity Funds
TempFund Portfolio | | | 3,465,572 | |
| | | | | | | | |
| | |
| | | | Total Investment Company
(Cost $3,465,572) | | | 3,465,572 | |
| | | | | | | | |
| Total Investments – 100.66%
(Cost $122,256,173)** | | | 133,028,870 | |
| | | | | | | | |
| Net Other Assets and Liabilities – (0.66)% | | | (871,861 | ) |
| | | | | | | | |
| Net Assets – 100.00% | | $ | 132,157,009 | |
| | | | | | | | |
| * | | Non-income producing security. |
| ** | | At April 30, 2015, cost is identical for book and Federal income tax purposes. |
| | | | |
Gross unrealized appreciation | | $ | 16,505,968 | |
Gross unrealized depreciation | | | (5,733,271 | ) |
| | | | |
Net unrealized appreciation | | $ | 10,772,697 | |
| | | | |
| REIT | | Real Estate Investment Trust |
See accompanying Notes to Financial Statements.
| | |
| |
| ASTON/River Road Small Cap Value Fund | | April 30, 2015 |
| |
| Schedule of Investments (unaudited) | | |
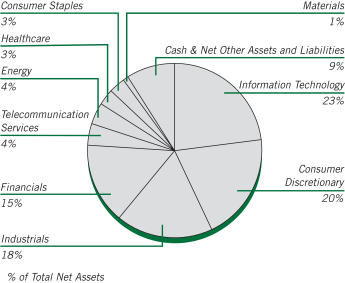
| | | | | | | | |
Shares | | | | | Market
Value | |
| | | | | | | | |
|
| | COMMON STOCKS – 90.73% | |
| | |
| | | | Consumer Discretionary – 19.69% | | | | |
| | 221,898 | | | Ascena Retail Group * | | $ | 3,326,251 | |
| | 61,544 | | | Ascent Capital Group, Class A * | | | 2,464,222 | |
| | 15,709 | | | Biglari Holdings * | | | 5,741,797 | |
| | 38,000 | | | Children’s Place | | | 2,305,080 | |
| | 238,720 | | | International Speedway, Class A | | | 8,679,859 | |
| | 71,295 | | | Liberty Tax | | | 1,974,871 | |
| | 66,610 | | | Marcus | | | 1,290,236 | |
| | 200,552 | | | Monarch Casino & Resort * (a) | | | 3,670,102 | |
| | 74,135 | | | Motorcar Parts of America * | | | 2,166,966 | |
| | 45,020 | | | Outerwall | | | 2,990,679 | |
| | 286,662 | | | Remy International | | | 6,378,229 | |
| | 227,090 | | | SodaStream International * | | | 4,412,359 | |
| | 134,510 | | | Sotheby’s | | | 5,744,922 | |
| | 99,140 | | | Stage Stores | | | 1,914,393 | |
| | 123,270 | | | UCP * | | | 1,067,518 | |
| | | | | | | | |
| | | | | | | 54,127,484 | |
| | | | | | | | |
| | |
| | | | Consumer Staples – 2.77% | | | | |
| | 127,850 | | | Darling Ingredients * | | | 1,746,431 | |
| | 37,759 | | | Ingles Markets, Class A | | | 1,580,592 | |
| | 77,020 | | | Omega Protein * | | | 984,316 | |
| | 102,934 | | | Village Super Market, Class A | | | 3,286,683 | |
| | | | | | | | |
| | | | | | | 7,598,022 | |
| | | | | | | | |
| | |
| | | | Energy – 3.70% | | | | |
| | 604,473 | | | Evolution Petroleum | | | 4,158,774 | |
| | 840,240 | | | Gran Tierra Energy * | | | 3,125,693 | |
| | 37,264 | | | PHI * | | | 1,167,481 | |
| | 124,620 | | | WPX Energy * | | | 1,713,525 | |
| | | | | | | | |
| | | | | | | 10,165,473 | |
| | | | | | | | |
| | | | | | | | |
Shares | | | | | Market
Value | |
| | | | | | | | |
| | |
| | | | Financials – 14.88% | | | | |
| | 70,000 | | | 1st Source | | $ | 2,178,400 | |
| | 133,914 | | | Capital Southwest | | | 6,375,646 | |
| | 6,685 | | | First Citizens BancShares, Class A | | | 1,606,673 | |
| | 416,980 | | | FNFV Group * | | | 6,233,851 | |
| | 40,635 | | | Geo Group, REIT | | | 1,584,765 | |
| | 166,120 | | | Hilltop Holdings * | | | 3,340,673 | |
| | 54,269 | | | International Bancshares | | | 1,409,909 | |
| | 16,096 | | | Navigators Group * | | | 1,256,293 | |
| | 350,294 | | | PICO Holdings * | | | 6,308,795 | |
| | 15,708 | | | White Mountains Insurance Group (Bermuda) | | | 10,618,137 | |
| | | | | | | | |
| | | | | | | 40,913,142 | |
| | | | | | | | |
| | |
| | | | Healthcare – 2.86% | | | | |
| | 111,008 | | | Myriad Genetics * | | | 3,666,594 | |
| | 124,700 | | | Owens & Minor | | | 4,204,884 | |
| | | | | | | | |
| | | | | | | 7,871,478 | |
| | | | | | | | |
| | |
| | | | Industrials – 18.24% | | | | |
| | 344,408 | | | Air Transport Services Group * | | | 3,209,883 | |
| | 190,134 | | | Brink’s | | | 5,032,847 | |
| | 87,840 | | | Clean Harbors * | | | 4,853,160 | |
| | 28,037 | | | Cubic | | | 1,390,074 | |
| | 34,110 | | | Forward Air | | | 1,718,121 | |
| | 161,640 | | | Kelly Services, Class A | | | 2,654,129 | |
| | 154,270 | | | KLX * | | | 6,465,456 | |
| | 186,307 | | | Marten Transport | | | 4,147,194 | |
| | 309,369 | | | SP Plus * | | | 7,041,238 | |
| | 81,277 | | | UniFirst | | | 9,202,995 | |
| | 34,218 | | | US Ecology | | | 1,605,166 | |
| | 192,880 | | | UTI Worldwide (British Virgin
Islands) * | | | 1,741,706 | |
| | 40,360 | | | Werner Enterprises | | | 1,084,473 | |
| | | | | | | | |
| | | | | | | 50,146,442 | |
| | | | | | | | |
| | |
| | | | Information Technology – 23.52% | | | | |
| | 208,820 | | | Blackhawk Network Holdings,
Class B * | | | 7,665,782 | |
| | 134,105 | | | Computer Services (a) | | | 5,726,283 | |
| | 272,780 | | | Convergys | | | 6,186,650 | |
| | 293,060 | | | CSG Systems International | | | 8,533,907 | |
| | 208,180 | | | Daktronics | | | 2,233,771 | |
| | 17,644 | | | DST Systems | | | 2,030,472 | |
| | 28,844 | | | Electro Rent | | | 312,669 | |
| | 55,567 | | | ePlus * | | | 4,609,838 | |
| | 116,728 | | | Ituran Location and Control (a) | | | 2,664,900 | |
| | 101,550 | | | Knowles * | | | 1,946,714 | |
| | 212,830 | | | NeuStar, Class A * | | | 6,384,900 | |
| | 298,320 | | | Rovi * | | | 5,521,903 | |
| | 122,483 | | | Sykes Enterprises * | | | 3,065,749 | |
| | 89,700 | | | Tech Data * | | | 5,056,389 | |
| | 214,530 | | | Vishay Intertechnology | | | 2,720,240 | |
| | | | | | | | |
| | | | | | | 64,660,167 | |
| | | | | | | | |
See accompanying Notes to Financial Statements.
| | |
| |
| ASTON/River Road Small Cap Value Fund | | April 30, 2015 |
| |
| Schedule of Investments (unaudited) – continued | | |
| | | | | | | | |
Shares | | | | | Market
Value | |
| | | | | | | | |
| | |
| | | | Materials – 1.12% | | | | |
| | 128,640 | | | American Vanguard | | $ | 1,403,462 | |
| | 104,025 | | | Myers Industries | | | 1,682,084 | |
| | | | | | | | |
| | | | | | | 3,085,546 | |
| | | | | | | | |
| | |
| | | | Telecommunication Services – 3.95% | | | | |
| | 64,380 | | | Atlantic Tele-Network | | | 4,250,368 | |
| | 247,160 | | | Telephone & Data Systems | | | 6,601,644 | |
| | | | | | | | |
| | | | | | | 10,852,012 | |
| | | | | | | | |
| | |
| | | | Total Common Stocks
(Cost $202,481,839) | | | 249,419,766 | |
| | | | | | | | |
|
| | INVESTMENT COMPANY – 10.04% | |
| | |
| | 27,588,289 | | | BlackRock Liquidity Funds
TempFund Portfolio | | | 27,588,289 | |
| | | | | | | | |
| | |
| | | | Total Investment Company
(Cost $27,588,289) | | | 27,588,289 | |
| | | | | | | | |
| Total Investments – 100.77%
(Cost $230,070,128)** | | | 277,008,055 | |
| | | | | | | | |
| Net Other Assets and Liabilities – (0.77)% | | | (2,112,026 | ) |
| | | | | | | | |
| Net Assets – 100.00% | | $ | 274,896,029 | |
| | | | | | | | |
| * | | Non-income producing security. |
| ** | | At April 30, 2015, cost is identical for book and Federal income tax purposes. |
| | | | |
Gross unrealized appreciation | | $ | 55,010,409 | |
Gross unrealized depreciation | | | (8,072,482 | ) |
| | | | |
Net unrealized appreciation | | $ | 46,937,927 | |
| | | | |
| (a) | | These securities have been determined by the Subadviser to be illiquid securities. At April 30, 2015, these securities amounted to $12,061,285 or 4.39% of net assets. |
| REIT | | Real Estate Investment Trust |
See accompanying Notes to Financial Statements.
| | |
| |
| ASTON/Silvercrest Small Cap Fund | | April 30, 2015 |
| |
| Schedule of Investments (unaudited) | | |
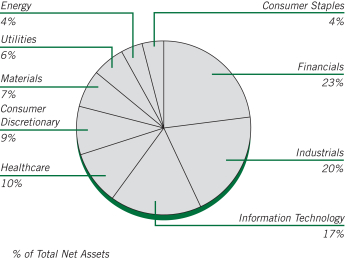
| | | | | | | | |
Shares | | | | | Market
Value | |
| | | | | | | | |
|
| | COMMON STOCKS – 100.43% | |
| | |
| | | | Consumer Discretionary – 9.43% | | | | |
| | 66,920 | | | EW Scripps, Class A * | | $ | 1,558,567 | |
| | 49,950 | | | Hillenbrand | | | 1,468,030 | |
| | 20,900 | | | Journal Media Group * | | | 194,161 | |
| | 81,060 | | | La-Z-Boy | | | 2,124,582 | |
| | 17,140 | | | Lithia Motors, Class A | | | 1,709,372 | |
| | 26,000 | | | Men’s Wearhouse | | | 1,471,340 | |
| | 64,490 | | | Wolverine World Wide | | | 1,981,778 | |
| | | | | | | | |
| | | | | | | 10,507,830 | |
| | | | | | | | |
| | |
| | | | Consumer Staples – 3.99% | | | | |
| | 19,654 | | | J & J Snack Foods | | | 2,050,502 | |
| | 26,754 | | | Lancaster Colony | | | 2,398,763 | |
| | | | | | | | |
| | | | | | | 4,449,265 | |
| | | | | | | | |
| | |
| | | | Energy – 4.08% | | | | |
| | 36,210 | | | Bonanza Creek Energy * | | | 997,948 | |
| | 68,020 | | | Forum Energy Technologies * | | | 1,582,145 | |
| | 70,890 | | | Matador Resources * | | | 1,965,071 | |
| | | | | | | | |
| | | | | | | 4,545,164 | |
| | | | | | | | |
| | |
| | | | Financials – 23.16% | | | | |
| | 99,690 | | | BancorpSouth | | | 2,413,495 | |
| | 63,930 | | | Bank of the Ozarks | | | 2,477,927 | |
| | 146,950 | | | CVB Financial | | | 2,299,767 | |
| | 37,908 | | | EastGroup Properties, REIT | | | 2,168,338 | |
| | 94,664 | | | Horace Mann Educators | | | 3,215,736 | |
| | 33,199 | | | Iberiabank | | | 2,068,630 | |
| | 65,923 | | | Independent Bank | | | 2,750,307 | |
| | 38,260 | | | PacWest Bancorp | | | 1,725,526 | |
| | 69,870 | | | Pebblebrook Hotel Trust, REIT | | | 3,000,218 | |
| | 121,060 | | | Physicians Realty Trust, REIT | | | 2,009,596 | |
| | 31,680 | | | Stifel Financial * | | | 1,673,971 | |
| | | | | | | | |
| | | | | | | 25,803,511 | |
| | | | | | | | |
| | | | | | | | |
Shares | | | | | Market
Value | |
| | | | | | | | |
| | |
| | | | Healthcare – 9.55% | | | | |
| | 26,657 | | | Analogic | | $ | 2,252,516 | |
| | 38,910 | | | Greatbatch * | | | 2,098,027 | |
| | 28,434 | | | ICU Medical * | | | 2,398,977 | |
| | 39,490 | | | Integra LifeSciences Holdings * | | | 2,321,222 | |
| | 23,490 | | | STERIS | | | 1,562,085 | |
| | | | | | | | |
| | | | | | | 10,632,827 | |
| | | | | | | | |
| | |
| | | | Industrials – 20.42% | | | | |
| | 74,015 | | | Altra Industrial Motion | | | 1,951,775 | |
| | 35,243 | | | Applied Industrial Technologies | | | 1,472,100 | |
| | 180,910 | | | CBIZ * | | | 1,635,426 | |
| | 27,350 | | | CIRCOR International | | | 1,494,404 | |
| | 52,136 | | | EMCOR Group | | | 2,326,830 | |
| | 44,300 | | | ESCO Technologies | | | 1,625,810 | |
| | 21,000 | | | G & K Services, Class A | | | 1,482,600 | |
| | 102,970 | | | Knoll | | | 2,344,627 | |
| | 37,089 | | | MSA Safety | | | 1,696,451 | |
| | 24,820 | | | Standex International | | | 2,007,193 | |
| | 61,969 | | | US Ecology | | | 2,906,966 | |
| | 33,040 | | | Watts Water Technologies,
Class A | | | 1,802,332 | |
| | | | | | | | |
| | | | | | | 22,746,514 | |
| | | | | | | | |
| | |
| | | | Information Technology – 17.15% | | | | |
| | 114,287 | | | ACI Worldwide * | | | 2,632,030 | |
| | 160,780 | | | Entegris * | | | 2,139,982 | |
| | 16,817 | | | FEI | | | 1,269,011 | |
| | 40,320 | | | Itron * | | | 1,445,875 | |
| | 28,435 | | | Littelfuse | | | 2,786,346 | |
| | 92,970 | | | M/A-COM Technology Solutions Holdings * | | | 2,832,796 | |
| | 90,120 | | | Mentor Graphics | | | 2,156,572 | |
| | 39,650 | | | Methode Electronics | | | 1,683,539 | |
| | 62,105 | | | MKS Instruments | | | 2,161,875 | |
| | | | | | | | |
| | | | | | | 19,108,026 | |
| | | | | | | | |
| | |
| | | | Materials – 6.59% | | | | |
| | 70,680 | | | Calgon Carbon | | | 1,568,389 | |
| | 27,320 | | | Minerals Technologies | | | 1,850,384 | |
| | 86,583 | | | PH Glatfelter | | | 2,147,258 | |
| | 27,149 | | | Sensient Technologies | | | 1,774,459 | |
| | | | | | | | |
| | | | | | | 7,340,490 | |
| | | | | | | | |
| |
| | | | Utilities – 6.06% | |
| | 41,903 | | | MGE Energy | | | 1,738,136 | |
| | 48,370 | | | ONE Gas | | | 2,030,089 | |
| | 35,579 | | | Portland General Electric | | | 1,250,958 | |
| | 34,683 | | | UIL Holdings | | | 1,729,988 | |
| | | | | | | | |
| | | | | | | 6,749,171 | |
| | | | | | | | |
| | |
| | | | Total Common Stocks
(Cost $107,677,710) | | | 111,882,798 | |
| | | | | | | | |
See accompanying Notes to Financial Statements.
| | |
| |
| ASTON/Silvercrest Small Cap Fund | | April 30, 2015 |
| |
| Schedule of Investments (unaudited) – continued | | |
| | | | | | | | |
Shares | | | | | Market
Value | |
| | | | | | | | |
|
| | INVESTMENT COMPANY – 0.97% | |
| | 1,078,947 | | | BlackRock Liquidity Funds
TempFund Portfolio | | $ | 1,078,947 | |
| | | | | | | | |
| | |
| | | | Total Investment Company
(Cost $1,078,947) | | | 1,078,947 | |
| | | | | | | | |
| Total Investments – 101.40%
(Cost $108,756,657)** | | | 112,961,745 | |
| | | | | | | | |
| Net Other Assets and Liabilities – (1.40)% | | | (1,559,383 | ) |
| | | | | | | | |
| Net Assets – 100.00% | | $ | 111,402,362 | |
| | | | | | | | |
| * | | Non-income producing security. |
| ** | | At April 30, 2015, cost is identical for book and Federal income tax purposes. |
| | | | |
Gross unrealized appreciation | | $ | 6,232,097 | |
Gross unrealized depreciation | | | (2,027,009 | ) |
| | | | |
Net unrealized appreciation | | $ | 4,205,088 | |
| | | | |
| REIT | | Real Estate Investment Trust |
See accompanying Notes to Financial Statements.
| | |
| |
| ASTON/TAMRO Small Cap Fund | | April 30, 2015 |
| |
| Schedule of Investments (unaudited) | | |
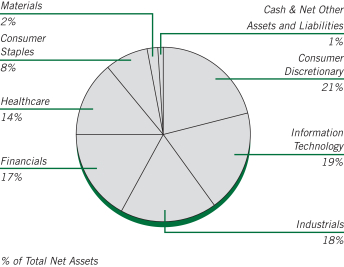
| | | | | | | | |
Shares | | | | | Market
Value | |
| | | | | | | | |
|
| | COMMON STOCKS – 98.88% | |
| | |
| | | | Consumer Discretionary – 21.20% | | | | |
| | 302,211 | | | Dorman Products * | | $ | 14,152,541 | |
| | 411,913 | | | Five Below * | | | 13,889,706 | |
| | 107,836 | | | Grand Canyon Education * | | | 4,882,814 | |
| | 245,426 | | | Hibbett Sports * | | | 11,485,937 | |
| | 639,276 | | | Iconix Brand Group * | | | 16,819,352 | |
| | 187,218 | | | Monro Muffler Brake | | | 11,212,486 | |
| | 110,188 | | | Morningstar | | | 8,362,167 | |
| | 697,072 | | | Pier 1 Imports | | | 8,817,961 | |
| | 221,660 | | | Pool | | | 14,383,517 | |
| | 181,037 | | | Red Robin Gourmet Burgers * | | | 13,594,068 | |
| | 347,048 | | | Steven Madden * | | | 13,541,813 | |
| | 90,196 | | | Strayer Education * | | | 4,574,741 | |
| | 363,812 | | | Texas Roadhouse | | | 12,224,083 | |
| | | | | | | | |
| | | | | | | 147,941,186 | |
| | | | | | | | |
| | |
| | | | Consumer Staples – 7.92% | | | | |
| | 243,409 | | | Nu Skin Enterprises, Class A | | | 13,764,779 | |
| | 157,132 | | | Sanderson Farms | | | 11,803,756 | |
| | 187,106 | | | Tootsie Roll Industries (a) | | | 5,796,544 | |
| | 153,208 | | | TreeHouse Foods * | | | 12,449,682 | |
| | 170,164 | | | United Natural Foods * | | | 11,479,263 | |
| | | | | | | | |
| | | | | | | 55,294,024 | |
| | | | | | | | |
| | |
| | | | Financials – 17.65% | | | | |
| | 501,531 | | | Bank of the Ozarks | | | 19,439,342 | |
| | 185,355 | | | BofI Holding * | | | 17,017,443 | |
| | 676,496 | | | Colony Financial, REIT | | | 17,528,011 | |
| | 105,129 | | | Financial Engines | | | 4,433,290 | |
| | 182,867 | | | First Cash Financial Services * | | | 8,839,791 | |
| | 368,443 | | | Geo Group, REIT | | | 14,369,277 | |
| | 184,890 | | | Hanover Insurance Group | | | 12,677,907 | |
| | | | | | | | |
Shares | | | | | Market
Value | |
| | | | | | | | |
| | |
| | | | Financials (continued) | | | | |
| | 374,588 | | | LaSalle Hotel Properties, REIT | | $ | 13,743,634 | |
| | 286,998 | | | Stifel Financial * | | | 15,164,974 | |
| | | | | | | | |
| | | | | | | 123,213,669 | |
| | | | | | | | |
| | |
| | | | Healthcare – 13.87% | | | | |
| | 282,310 | | | Cepheid * | | | 15,837,591 | |
| | 51,153 | | | Clovis Oncology * | | | 4,110,655 | |
| | 263,029 | | | DexCom * | | | 17,772,870 | |
| | 818,310 | | | HMS Holdings * | | | 13,919,453 | |
| | 183,766 | | | ICU Medical * | | | 15,504,337 | |
| | 261,178 | | | Medidata Solutions * | | | 13,954,741 | |
| | 74,301 | | | Neogen * | | | 3,309,367 | |
| | 419,585 | | | Repligen * | | | 12,381,953 | |
| | | | | | | | |
| | | | | | | 96,790,967 | |
| | | | | | | | |
| | |
| | | | Industrials – 17.66% | | | | |
| | 284,927 | | | Advisory Board * | | | 14,784,862 | |
| | 357,978 | | | Barnes Group | | | 14,354,918 | |
| | 153,243 | | | Corporate Executive Board | | | 12,846,361 | |
| | 249,679 | | | Franklin Electric | | | 9,028,393 | |
| | 493,640 | | | Hawaiian Holdings * | | | 11,393,211 | |
| | 443,517 | | | Healthcare Services Group | | | 13,425,260 | |
| | 216,849 | | | Landstar System | | | 13,511,861 | |
| | 168,235 | | | Proto Labs * | | | 11,776,450 | |
| | 392,239 | | | Simpson Manufacturing | | | 12,857,594 | |
| | 237,549 | | | Team * | | | 9,283,415 | |
| | | | | | | | |
| | | | | | | 123,262,325 | |
| | | | | | | | |
| |
| | | | Information Technology – 18.96% | |
| | 422,131 | | | Cardtronics * | | | 15,927,003 | |
| | 90,370 | | | Cavium * | | | 5,855,072 | |
| | 218,705 | | | Interactive Intelligence Group * | | | 9,618,646 | |
| | 288,687 | | | Manhattan Associates * | | | 15,173,389 | |
| | 824,262 | | | Pandora Media * | | | 14,704,834 | |
| | 306,781 | | | Solarwinds * | | | 14,964,777 | |
| | 153,627 | | | Synaptics * | | | 13,015,279 | |
| | 322,469 | | | Synchronoss Technologies * | | | 14,794,878 | |
| | 122,792 | | | Tyler Technologies * | | | 14,974,484 | |
| | 371,387 | | | VeriFone Systems * | | | 13,284,513 | |
| | | | | | | | |
| | | | | | | 132,312,875 | |
| | | | | | | | |
| | |
| | | | Materials – 1.62% | | | | |
| | 215,985 | | | Balchem | | | 11,321,934 | |
| | | | | | | | |
| | | | Total Common Stocks
(Cost $522,299,201) | | | 690,136,980 | |
| | | | | | | | |
See accompanying Notes to Financial Statements.
| | |
| |
| ASTON/TAMRO Small Cap Fund | | April 30, 2015 |
| |
| Schedule of Investments (unaudited) – continued | | |
| | | | | | | | |
Shares | | | | | Market
Value | |
| | | | | | | | |
|
| | INVESTMENT COMPANY – 1.54% | |
| | |
| | 10,749,406 | | | BlackRock Liquidity Funds
TempFund Portfolio | | $ | 10,749,406 | |
| | | | | | | | |
| | |
| | | | Total Investment Company
(Cost $10,749,406) | | | 10,749,406 | |
| | | | | | | | |
| Total Investments – 100.42%
(Cost $533,048,607)** | | | 700,886,386 | |
| | | | | | | | |
| Net Other Assets and Liabilities – (0.42)% | | | (2,929,696 | ) |
| | | | | | | | |
| Net Assets – 100.00% | | $ | 697,956,690 | |
| | | | | | | | |
| * | | Non-income producing security. |
| ** | | At April 30, 2015, cost is identical for book and Federal income tax purposes. |
| | | | |
Gross unrealized appreciation | | $ | 181,603,573 | |
Gross unrealized depreciation | | | (13,765,794 | ) |
| | | | |
Net unrealized appreciation | | $ | 167,837,779 | |
| | | | |
| (a) | | This security has been determined by the Subadviser to be an illiquid security. At April 30, 2015, this security amounted to $5,796,544 or 0.83% of net assets. |
| REIT | | Real Estate Investment Trust |
See accompanying Notes to Financial Statements.
| | |
| |
| ASTON/DoubleLine Core Plus Fixed Income Fund | | April 30, 2015 |
| |
| Schedule of Investments (unaudited) | | |
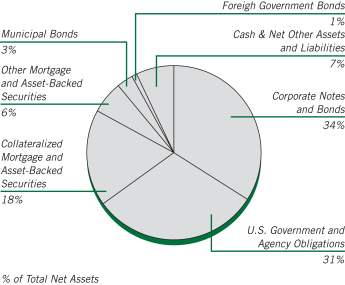
At April 30, 2015, 24.77% of the Total Net Assets of the Fund were comprised of securities of issuers located outside the United States.
| | | | | | | | |
Par Value | | | | | Market
Value | |
| | | | | | | |
|
| | CORPORATE NOTES AND BONDS – 33.58% | |
| | |
| | | | Consumer Discretionary – 2.35% | | | | |
| | $ 495,000 | | | American Axle & Manufacturing
6.625%, 10/15/22 | | $ | 528,413 | |
| | 255,000 | | | Asbury Automotive Group
6.000%, 12/15/24 (a) | | | 268,388 | |
| | 100,000 | | | Cinemark USA
7.375%, 06/15/21 | | | 107,500 | |
| | 155,000 | | | Family Tree Escrow LLC
Senior Secured Notes
5.750%, 03/01/23 (a) | | | 163,525 | |
| | 325,000 | | | Ford Motor
Senior Unsecured Notes
7.450%, 07/16/31 | | | 441,316 | |
| | 200,000 | | | Gol LuxCo SA (Luxembourg)
8.875%, 01/24/22 | | | 153,813 | |
| | 670,000 | | | Goodyear Tire & Rubber
7.000%, 05/15/22 | | | 736,163 | |
| | 510,000 | | | Gray Television
7.500%, 10/01/20 | | | 544,425 | |
| | 600,000 | | | Grupo Idesa SA de CV (Mexico)
7.875%, 12/18/20 (a) | | | 612,000 | |
| | 200,000 | | | Hutchison Whampoa International 12 II (Cayman Islands)
3.250%, 11/08/22 | | | 202,390 | |
| | | | InRetail Shopping Malls (Peru) | | | | |
| | 250,000 | | | 6.500%, 07/09/21 | | | 264,375 | |
| | 50,000 | | | 6.500%, 07/09/21 (a) | | | 52,875 | |
| | 125,000 | | | Levi Strauss
Senior Unsecured Notes
5.000%, 05/01/25 (a) | | | 125,547 | |
| | | | Mattel
Senior Unsecured Notes | | | | |
| | 155,000 | | | 2.500%, 11/01/16 | | | 157,488 | |
| | 75,000 | | | 2.350%, 05/06/19 | | | 74,897 | |
| | | | | | | | |
Par Value | | | | | Market
Value | |
| | | | | | | |
| | |
| | | | Consumer Discretionary (continued) | | | | |
| | $ 415,000 | | | MGM Resorts International
6.625%, 12/15/21 | | $ | 446,125 | |
| | | | NCL (Bermuda) | | | | |
| | 100,000 | | | 5.000%, 02/15/18 | | | 102,500 | |
| | | | Senior Unsecured Notes | | | | |
| | 605,000 | | | 5.250%, 11/15/19 (a) | | | 627,688 | |
| | 170,000 | | | Pilgrim’s Pride
5.750%, 03/15/25 (a) | | | 174,675 | |
| | 300,000 | | | Regal Entertainment Group
Senior Unsecured Notes
5.750%, 03/15/22 | | | 309,375 | |
| | 200,000 | | | SACI Falabella (Chile)
Senior Unsecured Notes
4.375%, 01/27/25 | | | 209,958 | |
| | 480,000 | | | Sally Holdings
5.750%, 06/01/22 | | | 511,200 | |
| | 325,000 | | | Station Casinos
7.500%, 03/01/21 | | | 351,813 | |
| | 225,000 | | | Teva Pharmaceutical Finance Co BV (Cook Islands)
2.950%, 12/18/22 | | | 223,695 | |
| | 685,000 | | | Viking Cruises (Bermuda)
Senior Unsecured Notes
8.500%, 10/15/22 (a) | | | 762,885 | |
| | 415,000 | | | Walgreens Boots Alliance
Senior Unsecured Notes
4.800%, 11/18/44 | | | 433,132 | |
| | | | | | | | |
| | | | | | | 8,586,161 | |
| | | | | | | | |
| | |
| | | | Consumer Staples – 3.82% | | | | |
| | 400,000 | | | Ajecorp BV (Netherlands)
6.500%, 05/14/22 | | | 282,000 | |
| | 231,000 | | | Altria Group
2.850%, 08/09/22 | | | 230,310 | |
| | | | Camposol SA (Peru) | | | | |
| | 150,000 | | | 9.875%, 02/02/17 (a) | | | 150,330 | |
| | 280,000 | | | 9.875%,02/02/17 | | | 280,616 | |
| | 300,000 | | | Cencosud SA (Chile)
5.150%, 02/12/25 (a) | | | 305,745 | |
| | 900,000 | | | 4.875%, 01/20/23 | | | 919,914 | |
| | 600,000 | | | Central American Bottling (British Virgin Islands)
6.750%, 02/09/22 | | | 635,250 | |
| | | | Coca-Cola
Senior Unsecured Notes | | | | |
| | 185,000 | | | 1.800%, 09/01/16 | | | 188,001 | |
| | 50,000 | | | 1.650%, 11/01/18 | | | 50,804 | |
| | 800,000 | | | Corp Azucarera del Peru SA (Peru)
6.375%, 08/02/22 | | | 725,000 | |
| | | | Corp Pesquera Inca SAC (Peru) | | | | |
| | 200,000 | | | 9.000%, 02/10/17 | | | 201,900 | |
| | 100,000 | | | 9.000%, 02/10/17 (a) | | | 100,950 | |
| | 100,000 | | | Cosan Overseas (Cayman Islands) 8.250%, 11/29/49 | | | 101,000 | |
| | 245,000 | | | Dana Holding
Senior Unsecured Notes
5.500%, 12/15/24 | | | 252,963 | |
See accompanying Notes to Financial Statements.
| | |
| |
| ASTON/DoubleLine Core Plus Fixed Income Fund | | April 30, 2015 |
| |
| Schedule of Investments (unaudited) – continued | | |
| | | | | | | | |
Par Value | | | | | Market
Value | |
| | | | | | | |
| | |
| | | | Consumer Staples (continued) | | | | |
| | $ 1,121,392 | | | ENA Norte Trust (Panama)
4.950%, 04/25/23 | | $ | 1,169,052 | |
| | 125,000 | | | Glencore Funding
3.125%, 04/29/19 (a) | | | 127,600 | |
| | 255,000 | | | HCA
5.375%, 02/01/25 | | | 269,025 | |
| | 400,000 | | | JBS Investments GmbH (Austria) 7.250%, 04/03/24 | | | 418,200 | |
| | 113,000 | | | Kellogg
Senior Unsecured Notes
7.450%, 04/01/31 | | | 151,376 | |
| | 270,000 | | | Kindred Escrow II
Senior Secured Notes
8.000%, 01/15/20 (a) | | | 292,626 | |
| | 325,000 | | | Kroger
Senior Unsecured Notes
3.400%, 04/15/22 | | | 335,144 | |
| | | | Laboratory Corp of America Holdings Senior Unsecured Notes | | | | |
| | 240,000 | | | 2.500%,11/01/18 | | | 244,203 | |
| | 220,000 | | | 4.700%, 02/01/45 | | | 219,706 | |
| | 200,000 | | | Maestro Peru SA (Peru)
6.750%, 09/26/19 | | | 214,500 | |
| | | | Marfrig Holding Europe BV (Netherlands) | | | | |
| | 200,000 | | | 8.375%, 05/09/18 | | | 195,460 | |
| | 800,000 | | | 6.875%, 06/24/19 | | | 714,000 | |
| | 200,000 | | | 6.875%, 06/24/19 (a) | | | 179,000 | |
| | | | Minerva Luxembourg SA (Luxembourg) | | | | |
| | 400,000 | | | 7.750%, 01/31/23 | | | 400,000 | |
| | 600,000 | | | 8.750%, 12/29/49 (b) | | | 586,500 | |
| | 300,000 | | | 8.750%, 12/29/49 (a) (b) | | | 293,250 | |
| | 205,000 | | | Mylan
2.600%, 06/24/18 | | | 208,501 | |
| | 230,000 | | | PepsiCo
Senior Unsecured Notes
1.850%, 04/30/20 | | | 228,901 | |
| | 490,000 | | | Post Holdings
7.375%, 02/15/22 | | | 510,727 | |
| | 615,000 | | | Revlon Consumer Products
5.750%, 02/15/21 | | | 618,075 | |
| | 195,000 | | | Rite Aid
6.125%, 04/01/23 (a) | | | 203,044 | |
| | 520,000 | | | Scientific Games International
Senior Secured Notes
7.000%, 01/01/22 (a) | | | 544,700 | |
| | 485,000 | | | Service Corp International
Senior Unsecured Notes
5.375%, 01/15/22 | | | 516,525 | |
| | 405,000 | | | Spectrum Brands
6.750%, 03/15/20 | | | 427,275 | |
| | 415,000 | | | Tyson Foods
3.950%, 08/15/24 | | | 433,745 | |
| | | | | | | | |
| | | | | | | 13,925,918 | |
| | | | | | | | |
| | | | | | | | |
Par Value | | | | | Market
Value | |
| | | | | | | |
| | |
| | | | Energy – 3.42% | | | | |
| | $ 240,000 | | | BP Capital Markets (United Kingdom)
3.062%, 03/17/22 | | $ | 244,903 | |
| | 235,000 | | | Chevron
Senior Unsecured Notes
1.365%, 03/02/18 | | | 236,217 | |
| | 1,400,000 | | | CNOOC Finance 2015 Australia
Property (Australia)
2.625%, 05/05/20 | | | 1,397,001 | |
| | 135,000 | | | ConocoPhillips
6.500%, 02/01/39 | | | 178,707 | |
| | 600,000 | | | Delek & Avner Tamar Bond (Israel)
Senior Unsecured Notes
4.435%, 12/30/20 (a) | | | 609,000 | |
| | 140,000 | | | 5.412%, 12/30/25 (a) | | | 143,675 | |
| | 170,000 | | | Devon Energy
Senior Unsecured Notes
6.300%, 01/15/19 | | | 194,979 | |
| | 175,000 | | | Ecolab
Senior Unsecured Notes
3.000%, 12/08/16 | | | 180,339 | |
| | 400,000 | | | Ecopetrol SA (Colombia)
Senior Unsecured Notes
4.125%, 01/16/25 | | | 385,880 | |
| | 300,000 | | | 7.375%, 09/18/43 | | | 338,007 | |
| | 1,150,000 | | | 5.875%, 05/28/45 | | | 1,108,313 | |
| | 330,000 | | | Energy XXI Gulf Coast
9.250%, 12/15/17 | | | 247,500 | |
| | 65,000 | | | 7.500%, 12/15/21 | | | 27,219 | |
| | 179,000 | | | Senior Secured Notes
11.000%, 03/15/20 (a) | | | 172,735 | |
| | 115,000 | | | EPL Oil & Gas
8.250%, 02/15/18 | | | 90,850 | |
| | 400,000 | | | Inkia Energy (Bermuda)
Senior Unsecured Notes
8.375%, 04/04/21 | | | 434,000 | |
| | 200,000 | | | 8.375%, 04/04/21 (a) | | | 217,000 | |
| | 195,000 | | | Kinder Morgan Energy Partners, MTN
Senior Unsecured Notes
6.950%, 01/15/38 | | | 223,944 | |
| | 595,000 | | | Memorial Production Partners
Senior Unsecured Notes
6.875%, 08/01/22 (a) | | | 560,788 | |
| | 750,000 | | | Pacific Rubiales Energy (Canada)
5.125%, 03/28/23 | | | 534,375 | |
| | 500,000 | | | 5.625%, 01/19/25 (a) | | | 351,250 | |
| | 300,000 | | | 5.625%, 01/19/25 | | | 210,750 | |
| | 400,000 | | | Petroleos Mexicanos (Mexico) 4.500%, 01/23/26 (a) | | | 407,000 | |
| | 425,000 | | | 5.625%, 01/23/46 (a) | | | 426,955 | |
| | 70,000 | | | Phillips 66
5.875%, 05/01/42 | | | 83,011 | |
| | 500,000 | | | Reliance Industries (India)
Senior Unsecured Notes
5.875%, 02/28/49 | | | 504,375 | |
| | 180,000 | | | Sanchez Energy
6.125%, 01/15/23 | | | 177,300 | |
See accompanying Notes to Financial Statements.
| | |
| |
| ASTON/DoubleLine Core Plus Fixed Income Fund | | April 30, 2015 |
| |
| Schedule of Investments (unaudited) – continued | | |
| | | | | | | | |
Par Value | | | | | Market
Value | |
| | | | | | | |
| | |
| | | | Energy (continued) | | | | |
| | $ 370,000 | | | Seven Generations Energy (Canada)
Senior Unsecured Notes
8.250%, 05/15/20 (a) | | $ | 398,675 | |
| | 350,000 | | | Southern Star Central
Senior Unsecured Notes
5.125%, 07/15/22 (a) | | | 365,750 | |
| | 695,000 | | | Tesoro Logistics
Senior Unsecured Notes
6.250%, 10/15/22 (a) | | | 741,044 | |
| | 140,000 | | | TransCanada PipeLines (Canada)
Senior Unsecured Notes
4.625%, 03/01/34 | | | 148,774 | |
| | 200,000 | | | Transportadora de Gas Internacional
SA ESP (Colombia)
Senior Unsecured Notes
5.700%, 03/20/22 | | | 212,500 | |
| | 415,000 | | | Triangle USA Petroleum
Senior Unsecured Notes
6.750%, 07/15/22 (a) | | | 356,900 | |
| | 610,000 | | | Ultra Petroleum (Canada)
Senior Unsecured Notes
5.750%, 12/15/18 (a) | | | 576,450 | |
| | | | | | | | |
| | | | | | | 12,486,166 | |
| | | | | | | | |
| | |
| | | | Financials – 8.63% | | | | |
| | 400,000 | | | Agromercantil Senior Trust
(Cayman Islands)
6.250%, 04/10/19 (a) | | | 412,000 | |
| | 900,000 | | | 6.250%, 04/10/19 | | | 927,000 | |
| | 225,000 | | | Air Lease
Senior Unsecured Notes
3.750%, 02/01/22 | | | 228,095 | |
| | 230,000 | | | Ally Financial
Senior Unsecured Notes
4.125%, 03/30/20 | | | 231,725 | |
| | 145,000 | | | American Express Credit
Senior Unsecured Notes
2.125%, 03/18/19 | | | 146,286 | |
| | 300,000 | | | American Express Credit, GMTN
Senior Unsecured Notes
2.250%, 08/15/19 | | | 304,030 | |
| | 175,000 | | | Argos Merger Sub
Senior Unsecured Notes
7.125%, 03/15/23 (a) | | | 184,188 | |
| | 400,000 | | | Australia & New Zealand Banking Group, EMTN (Australia)
Senior Unsecured Notes
4.875%, 01/12/21 (a) | | | 453,332 | |
| | 300,000 | | | Banco Continental SAECA (Paraguay) Senior Unsecured Notes
8.875%, 10/15/17 | | | 314,625 | |
| | 600,000 | | | Banco de Costa Rica (Cost Rica) 5.250%, 08/12/18 | | | 616,500 | |
| | 500,000 | | | Banco do Brasil SA/Cayman Islands (Brazil)
9.000%, 06/29/49 (a) (b) | | | 465,000 | |
| | | | | | | | |
Par Value | | | | | Market
Value | |
| | | | | | | |
| | |
| | | | Financials (continued) | | | | |
| | $ 700,000 | | | Banco GNB Sudameris SA (Colombia) Subordinated Notes
7.500%, 07/30/22 | | $ | 752,850 | |
| | 800,000 | | | Banco Inbursa SA Institucion de Banca Multiple (Mexico)
Senior Unsecured Notes
4.125%, 06/06/24 | | | 798,000 | |
| | 300,000 | | | Banco Internacional del Peru SAA (Peru)
8.500%, 04/23/70 (b) | | | 344,274 | |
| | 700,000 | | | Banco Latinoamericano de Comercio Exterior SA (Panama)
Senior Unsecured Notes
3.250%, 05/07/20 (a) | | | 697,571 | |
| | 600,000 | | | Banco Nacional de Costa Rica
(Costa Rica)
Senior Unsecured Notes
4.875%, 11/01/18 | | | 610,500 | |
| | 150,000 | | | Banco Regional SAECA (Paraguay)
Senior Unsecured Notes
8.125%, 01/24/19 (a) | | | 162,000 | |
| | 950,000 | | | 8.125%, 01/24/19 | | | 1,026,000 | |
| | 700,000 | | | Banco Santander Mexico SA Institucion de Banca Multiple Grupo Financiero Santand
(Mexico)
Subordinated Notes
5.950%, 01/30/24 (b) | | | 744,625 | |
| | 330,000 | | | Bank of America
Senior Unsecured Notes
2.000%, 01/11/18 | | | 332,470 | |
| | | | Bank of Montreal, MTN (Canada)
Senior Unsecured Notes | | | | |
| | 170,000 | | | 1.400%, 09/11/17 | | | 170,877 | |
| | 275,000 | | | 2.375%, 01/25/19 | | | 280,579 | |
| | 150,000 | | | Bantrab Senior Trust (Cayman Islands) Senior Secured Notes
9.000%, 11/14/20 | | | 158,625 | |
| | 225,000 | | | BB&T
Senior Unsecured Notes
2.450%, 01/15/20 | | | 227,736 | |
| | 600,000 | | | BBVA Banco Continental SA (Peru) Subordinated Notes
5.250%, 09/22/29 (b) | | | 621,000 | |
| | | | BBVA Bancomer SA (Mexico) Subordinated Notes | | | | |
| | 1,100,000 | | | 5.350%, 11/12/29 (b) | | | 1,100,110 | |
| | 300,000 | | | 5.350%, 11/12/29 (a) (b) | | | 300,030 | |
| | 850,000 | | | BBVA Colombia SA (Colombia) Subordinated Notes
4.875%, 04/21/25 (a) | | | 859,563 | |
| | 205,000 | | | Boston Properties, REIT
Senior Unsecured Notes
4.125%, 05/15/21 | | | 222,102 | |
See accompanying Notes to Financial Statements.
| | |
| |
| ASTON/DoubleLine Core Plus Fixed Income Fund | | April 30, 2015 |
| |
| Schedule of Investments (unaudited) – continued | | |
| | | | | | | | |
Par Value | | | | | Market
Value | |
| | | | | | | |
| | |
| | | | Financials (continued) | | | | |
| | $ 200,000 | | | Cementos Progreso Trust (Cayman Islands)
7.125%, 11/06/23 | | $ | 217,000 | |
| | | | CIMPOR Financial Operations BV (Netherlands) | | | | |
| | 200,000 | | | 5.750%, 07/17/24 | | | 181,500 | |
| | 200,000 | | | 5.750%, 07/17/24 (a) | | | 181,500 | |
| | 330,000 | | | Citigroup
Senior Unsecured Notes
1.750%, 05/01/18 | | | 329,541 | |
| | 300,000 | | | Comcel Trust (Cayman Islands)
6.875%, 02/06/24 (a) | | | 322,500 | |
| | 400,000 | | | 6.875%, 02/06/24 | | | 430,000 | |
| | | | CorpGroup Banking SA (Chile)
Senior Unsecured Notes | | | | |
| | 500,000 | | | 6.750%, 03/15/23 | | | 498,531 | |
| | 250,000 | | | 6.750%, 03/15/23 (a) | | | 249,265 | |
| | | | Credito Real SAB de CV (Mexico)
Senior Unsecured Notes | | | | |
| | 200,000 | | | 7.500%, 03/13/19 (a) | | | 210,500 | |
| | 200,000 | | | 7.500%, 03/13/19 | | | 211,500 | |
| | 210,000 | | | ERP Operating, REIT
Senior Unsecured Notes
4.500%, 07/01/44 | | | 220,505 | |
| | 440,000 | | | General Electric Capital
Senior Unsecured Notes
2.900%, 01/09/17 | | | 455,803 | |
| | 285,000 | | | General Motors Financial
2.400%, 04/10/18 | | | 285,576 | |
| | 500,000 | | | Global Bank (Panama)
4.750%, 10/05/17 | | | 518,750 | |
| | 700,000 | | | Senior Unsecured Notes
5.125%, 10/30/19 (a) | | | 724,500 | |
| | 215,000 | | | Goldman Sachs Group
Senior Unsecured Notes
2.600%, 04/23/20 | | | 216,220 | |
| | 600,000 | | | Grupo Aval (Cayman Islands) 4.750%, 09/26/22 | | | 603,000 | |
| | 500,000 | | | GrupoSura Finance SA (Cayman Islands)
5.700%, 05/18/21 | | | 548,125 | |
| | 1,250,000 | | | Guanay Finance (Cayman Islands) Senior Secured Notes
6.000%, 12/15/20 | | | 1,323,438 | |
| | 725,000 | | | Icahn Enterprises
4.875%, 03/15/19 | | | 740,515 | |
| | 700,000 | | | Industrial Senior Trust
(Cayman Islands)
5.500%, 11/01/22 | | | 693,350 | |
| | 460,000 | | | JPMorgan Chase
Senior Unsecured Notes
1.700%, 03/01/18 | | | 461,990 | |
| | | | Korea Development Bank (South Korea)
Senior Unsecured Notes | | | | |
| | 160,000 | | | 4.375%, 08/10/15 | | | 161,569 | |
| | 100,000 | | | 3.250%, 03/09/16 | | | 101,927 | |
| | | | | | | | |
Par Value | | | | | Market
Value | |
| | | | | | | |
| | |
| | | | Financials (continued) | | | | |
| | $ 279,000 | | | Liberty Mutual Group
6.500%, 05/01/42 (a) | | $ | 345,290 | |
| | 700,000 | | | Magnesita Finance (British Virgin Islands)
8.625%, 04/29/49 | | | 570,500 | |
| | 420,000 | | | MetLife
Senior Unsecured Notes
4.125%, 08/13/42 | | | 424,598 | |
| | | | Morgan Stanley
Senior Unsecured Notes | | | | |
| | 225,000 | | | 2.650%, 01/27/20 | | | 227,888 | |
| | 210,000 | | | 3.750%, 02/25/23 | | | 217,833 | |
| | 150,000 | | | MUFG Americas Holdings
Senior Unsecured Notes
1.625%, 02/09/18 | | | 150,184 | |
| | | | National Rural Utilities Cooperative Finance | | | | |
| | 230,000 | | | 10.375%, 11/01/18 | | | 297,328 | |
| | 215,000 | | | 2.000%, 01/27/20 | | | 215,084 | |
| | 800,000 | | | Oversea-Chinese Banking, EMTN (Singapore)
Subordinated Notes
4.000%, 10/15/24 (b) | | | 831,812 | |
| | 210,000 | | | PNC Funding
3.300%, 03/08/22 | | | 219,175 | |
| | 250,000 | | | Rio Oil Finance Trust
Senior Secured Notes
6.250%, 07/06/24 | | | 248,198 | |
| | | | Simon Property Group, REIT
Senior Unsecured Notes | | | | |
| | 175,000 | | | 5.650%, 02/01/20 | | | 202,529 | |
| | 25,000 | | | 4.125%, 12/01/21 | | | 27,376 | |
| | 700,000 | | | SUAM Finance BV (Netherlands)
4.875%, 04/17/24 | | | 736,050 | |
| | 235,000 | | | Synchrony Financial
Senior Unsecured Notes
3.000%, 08/15/19 | | | 239,639 | |
| | 400,000 | | | Tanner Servicios Financieros SA (Chile)
Senior Unsecured Notes
4.375%, 03/13/18 | | | 400,309 | |
| | 210,000 | | | TIAA Asset Management Finance
Senior Unsecured Notes
2.950%, 11/01/19 (a) | | | 214,788 | |
| | | | Unifin Financiera SA de CV (Mexico) | | | | |
| | 200,000 | | | 6.250%, 07/22/19 (a) | | | 194,250 | |
| | 700,000 | | | 6.250%, 07/22/19 | | | 679,875 | |
| | 1,000,000 | | | United Overseas Bank, EMTN (Singapore)
Subordinated Notes
3.750%, 09/19/24 (b) | | | 1,035,810 | |
| | | | Wells Fargo, GMTN
Senior Unsecured Notes | | | | |
| | 80,000 | | | 4.600%, 04/01/21 | | | 89,397 | |
| | 350,000 | | | 3.500%, 03/08/22 | | | 367,257 | |
| | | | | | | | |
| | | | | | | 31,513,968 | |
| | | | | | | | |
See accompanying Notes to Financial Statements.
| | |
| |
| ASTON/DoubleLine Core Plus Fixed Income Fund | | April 30, 2015 |
| |
| Schedule of Investments (unaudited) – continued | | |
| | | | | | | | |
Par Value | | | | | Market
Value | |
| | | | | | | |
| | |
| | | | Healthcare – 1.18% | | | | |
| | | | Actavis Funding SCS (Luxembourg) | | | | |
| | $ 220,000 | | | 2.350%, 03/12/18 | | $ | 222,746 | |
| | 220,000 | | | 4.750%, 03/15/45 | | | 222,680 | |
| | 625,000 | | | Alere
6.500%, 06/15/20 | | | 654,688 | |
| | 240,000 | | | Amgen
Senior Unsecured Notes
2.700%, 05/01/22 | | | 238,402 | |
| | 515,000 | | | Biomet
6.500%, 08/01/20 | | | 546,544 | |
| | 285,000 | | | Covidien International Finance SA (Luxembourg)
2.950%, 06/15/23 | | | 287,486 | |
| | 445,000 | | | HCA
Senior Secured Notes
4.250%, 10/15/19 | | | 465,581 | |
| | 625,000 | | | LifePoint Hospitals
5.500%, 12/01/21 | | | 658,500 | |
| | 550,000 | | | Select Medical
6.375%, 06/01/21 | | | 548,625 | |
| | 235,000 | | | WellPoint
Senior Unsecured Notes
2.300%, 07/15/18 | | | 239,084 | |
| | 235,000 | | | Zimmer Holdings
Senior Unsecured Notes
1.450%, 04/01/17 | | | 235,985 | |
| | | | | | | | |
| | | | | | | 4,320,321 | |
| | | | | | | | |
| | |
| | | | Industrials – 4.73% | | | | |
| | 400,000 | | | Aeropuerto Internacional de Tocumen SA (Panama)
Senior Secured Notes
5.750%, 10/09/23 (c) | | | 419,924 | |
| | | | Aeropuertos Dominicanos Siglo XXI SA (Domican Republic)
Senior Secured Notes | | | | |
| | 200,000 | | | 9.750%, 11/13/19 (d) | | | 198,280 | |
| | 200,000 | | | 9.750%, 11/13/19 (a) (d) | | | 198,280 | |
| | 190,000 | | | Air Medical Merger Sub
Senior Unsecured Notes
6.375%, 05/15/23 (a) | | | 185,013 | |
| | | | Avianca Holdings SA (Panama) | | | | |
| | 400,000 | | | 8.375%, 05/10/20 (a) | | | 401,600 | |
| | 800,000 | | | 8.375%, 05/10/20 | | | 803,200 | |
| | 525,000 | | | Avis Budget Car Rental
5.500%, 04/01/23 | | | 537,962 | |
| | 710,000 | | | Berry Plastics
Secured Notes
5.500%, 05/15/22 | | | 738,400 | |
| | 160,000 | | | Boeing
Senior Unsecured Notes
6.875%, 03/15/39 | | | 234,515 | |
| | 210,000 | | | Burlington Northern Santa Fe
Senior Unsecured Notes
4.550%, 09/01/44 | | | 221,557 | |
| | | | | | | | |
Par Value | | | | | Market
Value | |
| | | | | | | |
| | |
| | | | Industrials (continued) | | | | |
| | | | Cemex SAB de CV (Mexico)
Senior Secured Notes | | | | |
| | $ 400,000 | | | 5.700%, 01/11/25 (a) | | $ | 401,880 | |
| | 400,000 | | | 5.700%, 01/11/25 | | | 401,880 | |
| | 230,000 | | | Delphi
4.150%, 03/15/24 | | | 244,098 | |
| | | | ESAL GmbH (Austria) | | | | |
| | 600,000 | | | 6.250%, 02/05/23 (a) | | | 600,000 | |
| | 200,000 | | | 6.250%, 02/05/23 (a) | | | 198,940 | |
| | 225,000 | | | FedEx
4.100%, 02/01/45 | | | 216,448 | |
| | 755,000 | | | Gates Global
6.000%, 07/15/22 (a) | | | 707,813 | |
| | 400,000 | | | Gol LuxCo SA (Luxembourg)
8.875%, 01/24/22 (a) | | | 307,626 | |
| | 200,000 | | | Grupo Cementos de Chihuahua SAB de CV (Mexico)
Senior Secured Notes
8.125%, 02/08/20 | | | 217,500 | |
| | 250,000 | | | Grupo Elektra SAB de CV (Mexico) 7.250%, 08/06/18 | | | 260,625 | |
| | 675,000 | | | HD Supply
7.500%, 07/15/20 | | | 727,313 | |
| | 615,000 | | | Hexion US Finance
Senior Secured Notes
6.625%, 04/15/20 | | | 578,100 | |
| | | | Illinois Tool Works
Senior Unsecured Notes | | | | |
| | 132,000 | | | 3.375%, 09/15/21 | | | 139,816 | |
| | 20,000 | | | 3.500%, 03/01/24 | | | 21,067 | |
| | 535,000 | | | Louisiana-Pacific
7.500%, 06/01/20 | | | 572,450 | |
| | 200,000 | | | Manitowoc
8.500%, 11/01/20 | | | 215,000 | |
| | 60,000 | | | Masonite International (Canada) 5.625%, 03/15/23 (a) | | | 63,000 | |
| | 530,000 | | | Milacron
7.750%, 02/15/21 (a) | | | 553,850 | |
| | | | OAS Financial (British Virgin Islands) | | | | |
| | 400,000 | | | 8.875%, 04/29/49 (a) (e) | | | 76,500 | |
| | 600,000 | | | 8.875%, 04/29/49 (e) | | | 114,750 | |
| | 400,000 | | | Odebrecht Finance (Cayman Island) 7.125%, 06/26/42 | | | 358,500 | |
| | | | Pesquera Exalmar S.A.A. (Peru)
Senior Unsecured Notes | | | | |
| | 200,000 | | | 7.375%, 01/31/20 (a) | | | 164,500 | |
| | 400,000 | | | 7.375%, 01/31/20 | | | 329,000 | |
| | 725,000 | | | Plastipak Holdings
Senior Unsecured Notes
6.500%, 10/01/21 (a) | | | 746,750 | |
| | 675,000 | | | Reynolds Group Issuer
8.250%, 02/15/21 | | | 721,406 | |
| | | | Southern Copper
Senior Unsecured Notes | | | | |
| | 100,000 | | | 3.875%, 04/23/25 | | | 99,766 | |
| | 200,000 | | | 7.500%, 07/27/35 | | | 231,700 | |
See accompanying Notes to Financial Statements.
| | |
| |
| ASTON/DoubleLine Core Plus Fixed Income Fund | | April 30, 2015 |
| |
| Schedule of Investments (unaudited) – continued | | |
| | | | | | | | |
Par Value | | | | | Market
Value | |
| | | | | | | |
| | |
| | | | Industrials (continued) | | | | |
| | $ 105,000 | | | Southwest Airlines
Senior Unsecured Notes
5.125%, 03/01/17 | | $ | 112,185 | |
| | 490,000 | | | Terex
6.000%, 05/15/21 | | | 497,963 | |
| | 340,000 | | | Thermo Fisher Scientific
Senior Unsecured Notes
3.300%, 02/15/22 | | | 346,297 | |
| | 725,000 | | | TransDigm
6.000%, 07/15/22 | | | 735,875 | |
| | | | Union Andina de Cementos SAA (Peru)
Senior Unsecured Notes | | | | |
| | 900,000 | | | 5.875%, 10/30/21 | | | 924,750 | |
| | 350,000 | | | 5.875%, 10/30/21 (a) | | | 359,625 | |
| | 665,000 | | | United Rentals North America
7.625%, 04/15/22 | | | 736,488 | |
| | | | Waste Management | | | | |
| | 200,000 | | | 3.125%, 03/01/25 | | | 180,138 | |
| | 180,000 | | | 4.100%, 03/01/45 | | | 175,065 | |
| | | | | | | | |
| | | | | | | 17,277,395 | |
| | | | | | | | |
| | |
| | | | Information Technology – 1.02% | | | | |
| | 505,000 | | | Activision Blizzard
5.625%, 09/15/21 (a) | | | 540,981 | |
| | 540,000 | | | Audatex North America
6.000%, 06/15/21 (a) | | | 559,742 | |
| | 685,000 | | | CDW
6.000%, 08/15/22 | | | 740,656 | |
| | 570,000 | | | Infor US
Senior Unsecured Notes
6.500%, 05/15/22 (a) | | | 587,100 | |
| | 430,000 | | | International Business Machines Senior Unsecured Notes
1.125%, 02/06/18 | | | 429,964 | |
| | 420,000 | | | Oracle
Senior Unsecured Notes
2.375%, 01/15/19 | | | 430,697 | |
| | 200,000 | | | Tencent Holdings (Cayman Islands) Senior Unsecured Notes
3.800%, 02/11/25 (a) | | | 201,038 | |
| | 225,000 | | | Xerox
Senior Unsecured Notes
2.950%, 03/15/17 | | | 231,481 | |
| | | | | | | | |
| | | | | | | 3,721,659 | |
| | | | | | | | |
| | |
| | | | Materials – 2.74% | | | | |
| | 510,000 | | | Ashland
4.750%, 08/15/22 | | | 525,300 | |
| | 500,000 | | | Braskem America Finance
7.125%, 07/22/41 | | | 483,750 | |
| | 1,100,000 | | | Cia Minera Ares SAC (Peru)
7.750%, 01/23/21 | | | 1,120,295 | |
| | 210,000 | | | Dow Chemical
Senior Unsecured Notes
3.000%, 11/15/22 | | | 211,778 | |
| | | | | | | | |
Par Value | | | | | Market
Value | |
| | | | | | | |
| | |
| | | | Materials (continued) | | | | |
| | $ 300,000 | | | Freeport-McMoRan 3.875%, 03/15/23 | | $ | 282,828 | |
| | 850,000 | | | 5.450%, 03/15/43 | | | 745,771 | |
| | 430,000 | | | Georgia-Pacific
Senior Unsecured Notes
3.600%, 03/01/25 (a) | | | 435,374 | |
| | 600,000 | | | Grupo Idesa SA de CV (Mexico) 7.875%, 12/18/20 | | | 612,000 | |
| | 500,000 | | | Mexichem SAB De CV (Mexico) 5.875%, 09/17/44 | | | 497,500 | |
| | 175,000 | | | Platform Specialty Products
Senior Unsecured Notes
6.500%, 02/01/22 (a) | | | 183,750 | |
| | 725,000 | | | Signode Industrial Group Lux SA Senior Unsecured Notes
6.375%, 05/01/22 (a) | | | 728,625 | |
| | | | Southern Copper
Senior Unsecured Notes | | | | |
| | 1,000,000 | | | 6.750%, 04/16/40 | | | 1,090,005 | |
| | 280,000 | | | 5.250%, 11/08/42 | | | 258,810 | |
| | 525,000 | | | Steel Dynamics
5.125%, 10/01/21 (a) | | | 539,438 | |
| | | | Vedanta Resources
(United Kingdom)
Senior Unsecured Notes | | | | |
| | 800,000 | | | 7.125%, 05/31/23 (a) | | | 740,000 | |
| | 400,000 | | | 7.125%, 05/31/23 | | | 370,000 | |
| | 750,000 | | | Volcan Cia Minera SAA (Peru) 5.375%, 02/02/22 | | | 738,000 | |
| | 435,000 | | | WCI Communities
6.875%, 08/15/21 | | | 450,225 | |
| | | | | | | | |
| | | | | | | 10,013,449 | |
| | | | | | | | |
| | |
| | | | Telecommunications – 3.82% | | | | |
| | 105,000 | | | 21st Century Fox America
4.750%, 09/15/44 | | | 112,984 | |
| | 445,000 | | | Alibaba Group Holding
(Cayman Islands)
3.600%, 11/28/24 (a) | | | 444,081 | |
| | 205,000 | | | Amazon.com
Senior Unsecured Notes
3.800%, 12/05/24 | | | 213,755 | |
| | 100,000 | | | AT&T
Senior Unsecured Notes
3.400%, 05/15/25 | | | 99,280 | |
| | 700,000 | | | B Communications (Israel)
Senior Secured Notes
7.375%, 02/15/21 (a) | | | 751,240 | |
| | 376,000 | | | British Telecommunications
(United Kingdom)
Senior Unsecured Notes
5.950%, 01/15/18 | | | 420,034 | |
| | 565,000 | | | CCO Holdings
5.250%, 09/30/22 | | | 566,695 | |
| | 130,000 | | | 5.125%, 05/01/23 (a) | | | 129,025 | |
| | 280,000 | | | Cequel Communications Holdings I
Senior Unsecured Notes
6.375%, 09/15/20 (a) | | | 296,450 | |
See accompanying Notes to Financial Statements.
| | |
| |
| ASTON/DoubleLine Core Plus Fixed Income Fund | | April 30, 2015 |
| |
| Schedule of Investments (unaudited) – continued | | |
| | | | | | | | |
Par Value | | | | | Market
Value | |
| | | | | | | |
| | |
| | | | Telecommunications (continued) | | | | |
| | $ 210,000 | | | Comcast
4.200%, 08/15/34 | | $ | 218,096 | |
| | 565,000 | | | CommScope
5.000%, 06/15/21 (a) | | | 567,825 | |
| | 300,000 | | | Digicel Group (Bermuda)
Senior Unsecured Notes
7.125%, 04/01/22 (a) | | | 284,813 | |
| | 1,200,000 | | | 7.125%, 04/01/22 | | | 1,139,250 | |
| | 125,000 | | | DIRECTV Holdings
3.950%, 01/15/25 | | | 127,412 | |
| | 700,000 | | | ENTEL Chile SA (Chile)
Senior Unsecured Notes
4.750%, 08/01/26 | | | 737,291 | |
| | 300,000 | | | 4.750%, 08/01/26 (a) | | | 315,982 | |
| | 365,000 | | | Frontier Communications
Senior Unsecured Notes
8.500%, 04/15/20 | | | 406,063 | |
| | 705,000 | | | Gannett
4.875%, 09/15/21 (a) | | | 726,150 | |
| | 200,000 | | | Globo Comunicacao e Participacoes SA (Brazil)
Senior Unsecured Notes
5.307%, 05/11/22 (d) | | | 209,000 | |
| | 590,000 | | | Intelsat Jackson Holdings SA (Luxembourg)
5.500%, 08/01/23 | | | 557,550 | |
| | 730,000 | | | Level 3 Communications
Senior Unsecured Notes
5.750%, 12/01/22 | | | 746,425 | |
| | 230,000 | | | Orange SA (France)
Senior Unsecured Notes
2.750%, 09/14/16 | | | 235,615 | |
| | 670,000 | | | SBA Communications
Senior Unsecured Notes
5.625%, 10/01/19 | | | 704,170 | |
| | 40,000 | | | SBA Telecommunications
5.750%, 07/15/20 | | | 42,100 | |
| | 200,000 | | | Sixsigma Networks Mexico SA de CV (Mexico)
8.250%, 11/07/21 (a) | | | 211,500 | |
| | 1,000,000 | | | Telefonica Celular del Paraguay SA (Paraguay)
Senior Unsecured Notes
6.750%, 12/13/22 | | | 1,046,250 | |
| | 500,000 | | | Telefonica Chile SA (Chile)
Senior Unsecured Notes
3.875%, 10/12/22 | | | 509,105 | |
| | 500,000 | | | TV Azteca SAB de CV, EMTN (Mexico)
7.625%, 09/18/20 | | | 536,250 | |
| | 435,000 | | | Verizon Communications
Senior Unsecured Notes
4.400%, 11/01/34 | | | 428,396 | |
| | 1,100,000 | | | VTR Finance BV (Netherlands)
Senior Secured Notes
6.875%, 01/15/24 | | | 1,140,920 | |
| | | | | | | | |
| | | | | | | 13,923,707 | |
| | | | | | | | |
| | | | | | | | |
Par Value | | | | | Market
Value | |
| | | | | | | |
| | |
| | | | Utilities – 1.87% | | | | |
| | $ 600,000 | | | Abengoa Transmision Sur SA (Peru)
Senior Secured Notes
6.875%, 04/30/43 (a) | | $ | 679,680 | |
| | 900,000 | | | AES Andres Dominicana (Cayman Island)
Senior Secured Notes
9.500%, 11/12/20 | | | 940,950 | |
| | 300,000 | | | AES El Salvador Trust II (Panama)
6.750%, 03/28/23 | | | 273,780 | |
| | 200,000 | | | Duke Energy Progress
4.150%, 12/01/44 | | | 212,689 | |
| | 700,000 | | | Empresa Electrica Guacolda SA (Chile)
Senior Unsecured Notes
4.560%, 04/30/25 (a) (c) | | | 697,543 | |
| | 297,821 | | | Fermaca Enterprises S de RL de CV (Mexico)
Senior Secured Notes
6.375%, 03/30/38 (a) | | | 315,690 | |
| | 200,000 | | | GNL Quintero SA (Chile)
Senior Unsecured Notes
4.634%, 07/31/29 | | | 209,457 | |
| | 200,000 | | | 4.634%, 07/31/29 (a) | | | 209,457 | |
| | 1,500,000 | | | Israel Electric (Israel)
Senior Secured Notes
5.000%, 11/12/24 (a) | | | 1,599,375 | |
| | 400,000 | | | Mexico Generadora de
Energia S de rl (Mexico)
Senior Secured Notes
5.500%, 12/06/32 | | | 407,800 | |
| | 245,000 | | | Midamerican Energy Holdings
Senior Unsecured Notes
6.500%, 09/15/37 | | | 323,278 | |
| | 270,528 | | | Nakilat (Marshall Islands)
Secured Notes
6.267%,12/31/33 | | | 317,194 | |
| | 300,000 | | | Senior Secured Notes
6.067%, 12/31/33 | | | 354,375 | |
| | 125,000 | | | Southern
Senior Unsecured Notes
1.950%, 09/01/16 | | | 126,892 | |
| | 25,000 | | | 2.450%, 09/01/18 | | | 25,719 | |
| | 125,000 | | | Southern Power
Senior Unsecured Notes
4.875%, 07/15/15 | | | 126,066 | |
| | | | | | | | |
| | | | | | | 6,819,945 | |
| | | | | | | | |
| | |
| | | | Total Corporate Notes and Bonds
(Cost $122,915,220) | | | 122,588,689 | |
| | | | | | | | |
|
| COLLATERALIZED MORTGAGE AND ASSET-BACKED
SECURITIES – 18.01% |
|
| | 3,306,651 | | | Alternative Loan Trust
Series 2007-J2, Class 2A1
6.000%, 07/25/37 | | | 3,385,932 | |
See accompanying Notes to Financial Statements.
| | |
| |
| ASTON/DoubleLine Core Plus Fixed Income Fund | | April 30, 2015 |
| |
| Schedule of Investments (unaudited) – continued | | |
| | | | | | | | |
Par Value | | | | | Market
Value | |
| | | | | | | |
| | $ 1,072,000 | | | American General Mortgage Loan Trust
Series 2010-1A, Class A3
5.650%, 03/25/58 (a) (b) | | $ | 1,102,618 | |
| | 600,000 | | | Banc of America Commercial Mortgage Trust
Series 2007-1, Class AMFX
5.482%, 01/15/49 (b) | | | 630,042 | |
| | 350,000 | | | Banc of America Commercial Mortgage Trust
Series 2007-4, Class AM
6.011%, 02/10/51 (b) | | | 379,736 | |
| | 657,763 | | | Banc of America Funding
Series 2006-B, Class 7A1
5.669%, 03/20/36 (b) | | | 600,556 | |
| | 741,090 | | | Banc of America Funding
Series 2010-R9, Class 3A3
5.500%, 12/26/35 (a) | | | 618,296 | |
| | 355,580 | | | Banc of America Funding
Series 2012-R4, Class A
0.434%, 03/04/39 (a) (b) | | | 351,008 | |
| | 298,277 | | | Bear Stearns Asset Backed Securities I Trust
Series 2004-AC2, Class 2A
5.000%, 05/25/34 | | | 301,009 | |
| | 450,000 | | | Bear Stearns Commercial Mortgage Securities Trust
Series 2007-T26, Class AJ
5.566%, 01/12/45 (b) | | | 465,320 | |
| | 403,500 | | | CDGJ Commercial Mortage Trust
Series 2014-BXCH, Class B
2.025%, 12/15/27 (a) (b) | | | 405,388 | |
| | 1,952,828 | | | CHL Mortgage Pass-Through Trust
Series 2007-14, Class A15
6.500%, 09/25/37 | | | 1,947,673 | |
| | 128,330 | | | Citicorp Mortgage Securities Trust
Series 2007-2, Class 3A1
5.500%, 02/25/37 | | | 128,713 | |
| | 450,000 | | | Citigroup Commercial Mortgage Trust
Series 2007-C6, Class AM
5.900%, 12/10/49 (b) | | | 480,407 | |
| | 964,055 | | | Citigroup Commercial Mortgage Trust
Series 2012-GC8, Class XA
2.361%, 09/10/45 (a) (b) | | | 92,442 | |
| | 350,000 | | | Citigroup Commercial Mortgage Trust
Series 2013-SMP, Class C
2.738%, 01/12/30 (a) | | | 356,158 | |
| | 350,000 | | | Citigroup Commercial Mortgage Trust
Series 2013-SMP, Class D
3.008%, 01/12/30 (a) (b) | | | 355,038 | |
| | 4,946,282 | | | Citigroup Commercial Mortgage Trust
Series 2014-GC25, Class XA
1.252%, 10/10/47 (b) | | | 391,657 | |
| | 440,700 | | | Citigroup Commercial Mortgage Trust
Series 2015-GC27, Class D
4.430%, 02/10/48 (a) (b) | | | 404,176 | |
| | 2,542,681 | | | Citigroup Mortgage Loan Trust
Series 2006-AR2, Class 1A2
2.600%, 03/25/36 (b) | | | 2,435,665 | |
| | | | | | | | |
Par Value | | | | | Market
Value | |
| | | | | | | |
| | $ 340,000 | | | Citigroup/Deutsche Bank Commercial Mortgage Trust
Series 2007-CD4, Class AMFX
5.366%, 12/11/49 (b) | | $ | 355,032 | |
| | 300,000 | | | COBALT CMBS Commercial Mortgage Trust
Series 2007-C2, Class AFJX
5.568%, 04/15/47 (b) | | | 307,122 | |
| | 105,713 | | | Commercial Mortgage Pass Through Certificates
Series 2010-C1, Class XPA
2.204%, 07/10/46 (a) (b) | | | 2,476 | |
| | 1,935,553 | | | Commercial Mortgage Pass Through Certificates
Series 2012-CR3, Class XA
2.321%, 10/15/45 (b) | | | 206,611 | |
| | 7,841,642 | | | Commercial Mortgage Pass Through Certificates
Series 2013-CR10, Class XA
1.164%, 08/10/46 (b) | | | 400,516 | |
| | 3,723,984 | | | Commercial Mortgage Pass Through Certificates
Series 2014-CCRE19, Class XA
1.469%, 08/10/47 (b) | | | 289,705 | |
| | 300,000 | | | Commercial Mortgage Pass Through Certificates
Series 2014-CR20, Class C
4.658%, 11/10/47 (b) | | | 314,802 | |
| | 350,000 | | | Commercial Mortgage Pass Through Certificates
Series 2014-KYO, Class E
2.527%, 06/11/27 (a) (b) | | | 350,030 | |
| | 300,000 | | | Commercial Mortgage Pass Through Certificates
Series 2014-KYO, Class F
3.677%, 06/11/27 (a) (b) | | | 299,672 | |
| | 350,000 | | | Commercial Mortgage Trust
Series 2006-GG7, Class AJ
6.014%, 07/10/38 (b) | | | 357,982 | |
| | 300,000 | | | Commercial Mortgage Trust
Series 2007-GG11, Class AJ
6.254%, 12/10/49 (b) | | | 318,030 | |
| | 500,000 | | | Core Industrial Trust
Series 2015-CALW, Class D
3.850%, 02/10/34 (a) (b) | | | 513,656 | |
| | 1,587,303 | | | Countrywide Alternative Loan Trust
Series 2005-86CB, Class A5
5.500%, 02/25/36 | | | 1,471,259 | |
| | 531,765 | | | Countrywide Alternative Loan Trust
Series 2006-J1, Class 2A1
7.000%, 02/25/36 | | | 276,377 | |
| | 94,240 | | | Countrywide Alternative Loan Trust
Series 2007-18CB, Class 2A17
6.000%, 08/25/37 | | | 85,786 | |
| | 362,545 | | | Countrywide Alternative Loan Trust
Series 2007-23CB, Class A3
0.674%, 09/25/37 (b) | | | 240,421 | |
| | 346,170 | | | Countrywide Alternative Loan Trust
Series 2007-23CB, Class A4
6.329%, 09/25/37 (b) (e) | | | 100,161 | |
See accompanying Notes to Financial Statements.
| | |
| |
| ASTON/DoubleLine Core Plus Fixed Income Fund | | April 30, 2015 |
| |
| Schedule of Investments (unaudited) – continued | | |
| | | | | | | | |
Par Value | | | | | Market
Value | |
| | | | | | | |
| | $ 740,917 | | | Countrywide Home Loan Mortgage Pass Through Trust
Series 2005-HYB8, Class 4A1
4.312%, 12/20/35 (b) | | $ | 664,245 | |
| | 669,113 | | | Countrywide Home Loan Mortgage Pass Through Trust
Series 2007-2, Class A13
6.000%, 03/25/37 | | | 631,019 | |
| | 150,156 | | | Countrywide Home Loan Mortgage Pass Through Trust
Series 2007-7, Class A4
5.750%, 06/25/37 | | | 137,995 | |
| | 275,000 | | | Credit Suisse Commercial Mortgage Trust
Series 2006-C4, Class AM
5.509%, 09/15/39 | | | 289,191 | |
| | 59,333 | | | Credit Suisse First Boston Mortgage Securities
Series 1998-C2, Class F
6.750%, 11/15/30 (a) (b) | | | 61,171 | |
| | 2,135,094 | | | Credit Suisse First Boston Mortgage Securities
Series 2005-9, Class 5A9
5.500%, 10/25/35 | | | 1,909,114 | |
| | 1,067,518 | | | Credit Suisse Mortgage Capital Certificates
Series 2007-1, Class 5A4
6.000%, 02/25/37 | | | 958,545 | |
| | 8,826 | | | Credit Suisse Mortgage Capital Certificates Series 2009-13R, Class 2A1
6.000%, 01/26/37 (a) | | | 8,853 | |
| | 250,000 | | | Credit Suisse Mortgage Capital Certificates
Series 2009-RR2, Class IQB 5.695%, 04/16/49 (a) (b) | | | 263,919 | |
| | 4,482,424 | | | CSMC Trust
Series 2013-IVR4, Class A2
3.000%, 07/25/43 (a) (b) | | | 4,457,981 | |
| | 150,000 | | | Del Coronado Trust
Series 2013-HDC, Class D
2.125%, 03/15/26 (a) (b) | | | 150,125 | |
| | 150,000 | | | Del Coronado Trust
Series 2013-HDC, Class E
2.825%, 03/15/26 (a) (b) | | | 150,169 | |
| | 4,047,296 | | | First Horizon Alternative Mortgage Securities Trust
Series 2005-FA4, Class 1A6
5.500%, 06/25/35 | | | 3,788,617 | |
| | 2,188,354 | | | First Horizon Mortgage Pass-Through Trust
Series 2006-2, Class 1A3
6.000%, 08/25/36 | | | 2,096,334 | |
| | 350,000 | | | GS Mortgage Securities Trust
Series 2006-GG6, Class AJ
5.708%, 04/10/38 (b) | | | 357,842 | |
| | 396,600 | | | GS Mortgage Securities Trust
Series 2006-GG8, Class AJ
5.622%, 11/10/39 | | | 405,356 | |
| | | | | | | | |
Par Value | | | | | Market
Value | |
| | | | | | | |
| | $ 391,000 | | | GS Mortgage Securities Trust
Series 2014-GC26, Class C
4.662%, 11/10/47 (b) | | $ | 407,474 | |
| | 774,492 | | | GSR Mortgage Loan Trust
Series 2006-AR1, Class 3A1
2.780%, 01/25/36 (b) | | | 709,302 | |
| | 62,700 | | | HSI Asset Loan Obligation Trust
Series 2007-2, Class 1A1
5.500%, 09/25/37 | | | 60,353 | |
| | 1,628,850 | | | JP Morgan Chase Commercial Mortgage Securities Trust
Series 2006-LDP8, Class X
0.718%, 05/15/45 (b) | | | 8,900 | |
| | 350,000 | | | JP Morgan Chase Commercial Mortgage Securities Trust
Series 2006-LDP9, Class AM
5.372%, 05/15/47 | | | 363,326 | |
| | 350,000 | | | JP Morgan Chase Commercial Mortgage Securities Trust
Series 2007-CB19 Class AM
5.885%, 02/12/49 (b) | | | 370,057 | |
| | 387,200 | | | JP Morgan Chase Commercial Mortgage Securities Trust
Series 2007-CB20, Class AJ
6.277%, 02/12/51 (b) | | | 406,524 | |
| | 250,000 | | | JP Morgan Chase Commercial Mortgage Securities Trust
Series 2007-LD12, Class AM
6.208%, 02/15/51 (b) | | | 272,127 | |
| | 1,127,754 | | | JP Morgan Chase Commercial Mortgage Securities Trust
Series 2011-C4, Class XA
1.643%, 07/15/46 (a) (b) | | | 44,724 | |
| | 2,350,306 | | | JP Morgan Chase Commercial Mortgage Securities Trust
Series 2012-C8, Class XA
2.267%, 10/15/45 (b) | | | 228,528 | |
| | 799,339 | | | JP Morgan Chase Commercial Mortgage Securities Trust
Series 2012-CBX, Class XA
1.928%, 06/15/45 (b) | | | 59,532 | |
| | 5,922,679 | | | JP Morgan Chase Commercial Mortgage Securities Trust
Series 2014-C18, Class XA
1.312%, 02/15/47 (b) | | | 379,339 | |
| | 300,000 | | | JP Morgan Chase Commercial Mortgage Securities Trust
Series 2014-C21, Class C
4.816%, 08/15/47 (b) | | | 320,185 | |
| | 3,734,275 | | | JP Morgan Chase Commercial Mortgage Securities Trust
Series 2014-C21, Class XA
1.279%, 08/15/47 (b) | | | 286,305 | |
| | 330,824 | | | JP Morgan Chase Commercial Mortgage Securities Trust
Series 2014-C23, Class C
4.609%, 09/15/47 (b) | | | 347,085 | |
See accompanying Notes to Financial Statements.
| | |
| |
| ASTON/DoubleLine Core Plus Fixed Income Fund | | April 30, 2015 |
| |
| Schedule of Investments (unaudited) – continued | | |
| | | | | | | | |
Par Value | | | | | Market
Value | |
| | | | | | | |
| | $ 300,000 | | | JP Morgan Chase Commercial Mortgage Securities Trust
Series 2014-DSTY, Class A
3.429%, 06/10/27 (a) | | $ | 312,607 | |
| | 4,465,567 | | | JPMBB Commercial Mortgage Securities Trust
Series 2015-C27, Class XA
1.538%, 02/15/48 (b) | | | 399,905 | |
| | 8,000,000 | | | JPMBB Commercial Mortgage Securities Trust
Series 2015-C28, Class XA
1.211%, 10/15/48 (b) | | | 627,516 | |
| | 450,000 | | | JPMBB Commercial Mortgage Securities Trust
Series 2014-C25, Class C
4.598%, 11/15/47 (b) | | | 472,202 | |
| | 6,540,154 | | | JPMBB Commercial Mortgage Securities Trust
Series 2014-C25, Class XA
1.166%, 11/15/47 (b) | | | 449,515 | |
| | 5,309,749 | | | JPMBB Commercial Mortgage Securities Trust
Series 2014-C26, Class XA
1.331%, 01/15/48 (b) | | | 396,184 | |
| | 250,000 | | | LB Commercial Mortgage Trust
Series 2007-C3, Class AMFL
6.110%, 07/15/44 (a) (b) | | | 272,160 | |
| | 350,000 | | | LB-UBS Commercial Mortgage Trust
Series 2007-C1, Class AJ
5.484%, 02/15/40 | | | 362,777 | |
| | 300,000 | | | Merrill Lynch Mortgage Trust
Series 2005-CIP1, Class AM
5.107%, 07/12/38 (b) | | | 301,163 | |
| | 350,000 | | | Merrill Lynch Mortgage Trust
Series 2006-C2, Class AJ
5.802%, 08/12/43 (b) | | | 353,803 | |
| | 300,000 | | | ML-CFC Commercial Mortgage Trust
Series 2006-1, Class AJ
5.749%, 02/12/39 (b) | | | 306,721 | |
| | 250,000 | | | ML-CFC Commercial Mortgage Trust
Series 2007-5, Class AM
5.419%, 08/12/48 | | | 263,841 | |
| | 948,534 | | | Morgan Stanley Bank of America
Merrill Lynch Trust
Series 2012-C5, Class XA
2.017%, 08/15/45 (a) (b) | | | 74,930 | |
| | 410,200 | | | Morgan Stanley Bank of America
Merrill Lynch Trust
Series 2014-C14, Class D
4.995%, 02/15/47 (a) (b) | | | 412,412 | |
| | 5,973,115 | | | Morgan Stanley Bank of America
Merrill Lynch Trust
Series 2014-C14, Class XA
1.458%, 02/15/47 (b) | | | 402,083 | |
| | 300,000 | | | Morgan Stanley Bank of America
Merrill Lynch Trust
Series 2014-C18, Class C
4.489%, 10/15/47 | | | 309,656 | |
| | | | | | | | |
Par Value | | | | | Market
Value | |
| | | | | | | |
| | $ 413,500 | | | Morgan Stanley Bank of America
Merrill Lynch Trust
Series 2014-C19, Class C
4.000%, 12/15/47 | | $ | 408,335 | |
| | 493,800 | | | Morgan Stanley Bank of America
Merrill Lynch Trust
Series 2015-C20, Class D
3.071%, 02/15/48 (a) | | | 411,428 | |
| | 300,000 | | | Morgan Stanley Capital I Trust
Series 2006-HQ8, Class AJ
5.679%, 03/12/44 (b) | | | 306,165 | |
| | 375,100 | | | Morgan Stanley Capital I Trust
Series 2007-1Q16, Class AMA
6.284%, 12/12/49 (b) | | | 407,158 | |
| | 300,000 | | | Morgan Stanley Capital I Trust
Series 2007-HQ11, Class AJ
5.508%, 02/12/44 (b) | | | 313,077 | |
| | 250,000 | | | Morgan Stanley Capital I Trust
Series 2007-IQ13, Class AM
5.406%, 03/15/44 | | | 265,943 | |
| | 1,406,638 | | | Morgan Stanley Capital I Trust
Series 2011-C1, Class XA
1.061%, 09/15/47 (a) (b) | | | 18,713 | |
| | 250,000 | | | Morgan Stanley Capital I Trust
Series 2014-CPT, Class E
3.560%, 07/13/29 (a) (b) | | | 253,394 | |
| | 350,000 | | | Morgan Stanley Capital I Trust
Series 2014-MP, Class D
3.693%, 08/11/29 (a) (b) | | | 360,249 | |
| | 1,087,766 | | | Morgan Stanley Mortgage Loan Trust
Series 2005-3AR, Class 2A2
2.496%, 07/25/35 (b) | | | 1,012,566 | |
| | 294,749 | | | Nomura Asset Acceptance Corp
Alternative Loan Trust
Series 2005-AP3, Class A3
5.318%, 08/25/35 (b) | | | 222,863 | |
| | 5,297,101 | | | RALI
Series 2006-QS7, Class A2
6.000%, 06/25/36 | | | 4,610,406 | |
| | 232,312 | | | Residential Asset Securitization Trust
Series 2006-A6, Class 1A1
6.500%, 07/25/36 | | | 145,011 | |
| | 543,668 | | | Residential Asset Securitization Trust
Series 2007-A1, Class A8
6.000%, 03/25/37 | | | 388,385 | |
| | 2,497,635 | | | Sequoia Mortgage Trust
Series 2013-1, Class 2A1
1.855%, 02/25/43 (b) | | | 2,288,053 | |
| | 384,080 | | | Structured Adjustable Rate Mortgage Loan Trust
Series 2006-1, Class 2A2
2.412%, 02/25/36 (b) | | | 339,619 | |
| | 1,910,107 | | | UBS-Barclays Commercial Mortgage Trust
Series 2012-C3, Class XA
2.283%, 08/10/49 (a) (b) | | | 202,189 | |
See accompanying Notes to Financial Statements.
| | |
| |
| ASTON/DoubleLine Core Plus Fixed Income Fund | | April 30, 2015 |
| |
| Schedule of Investments (unaudited) – continued | | |
| | | | | | | | |
Par Value | | | | | Market
Value | |
| | | | | | | |
| | $ 500,000 | | | Wachovia Bank Commercial Mortgage Trust
Series 2007-C32, Class AMFX
5.703%, 06/15/49 (a) | | $ | 537,753 | |
| | 393,000 | | | Wachovia Bank Commercial Mortgage Trust
Series 2007-C30, Class AJ
5.413%, 12/15/43 (b) | | | 403,008 | |
| | 350,000 | | | Wachovia Bank Commercial Mortgage Trust
Series 2007-C30, Class AMFL
0.377%, 12/15/43 (a) (b) | | | 338,553 | |
| | 300,000 | | | Wachovia Bank Commercial Mortgage Trust
Series 2007-C33, Class AJ
6.150%, 02/15/51 (b) | | | 315,947 | |
| | 2,599,518 | | | Washington Mutual Mortgage Pass-Through Certificates WMALT Trust
Series 2005-8, Class 2CB1
5.500%, 10/25/35 | | | 2,648,943 | |
| | 471,800 | | | Wells Fargo Commercial Mortgage Trust
Series 2015-C26, Class D
3.586%, 02/15/48 (a) | | | 409,900 | |
| | 4,500,000 | | | Wells Fargo Commercial Mortgage Trust
Series 2015-NXS1, Class XA
1.215%, 05/15/48 (b) | | | 372,470 | |
| | 512,000 | | | Wells Fargo Commerical Mortgage Trust
Series 2014-LC18, Class B
3.959%, 12/15/47 | | | 534,674 | |
| | 449,292 | | | Wells Fargo Mortgage Backed Securities Trust
Series 2007-13, Class A6
6.000%, 09/25/37 | | | 467,175 | |
| | 468,086 | | | Wells Fargo Mortgage Backed Securities Trust
Series 2007-8, Class 1A16
6.000%, 07/25/37 | | | 474,270 | |
| | 962,160 | | | WF-RBS Commercial Mortgage Trust
Series 2012-C8, Class XA
2.352%, 08/15/45 (a) (b) | | | 94,135 | |
| | 1,426,711 | | | WF-RBS Commercial Mortgage Trust
Series 2012-C9, Class XA
2.359%, 11/15/45 (a) (b) | | | 152,199 | |
| | | | | | | | |
| | |
| | | | Total Collateralized Mortgage and Asset-Backed Securities
(Cost $63,810,907) | | | 65,735,765 | |
| | | | | | | | |
|
| | U.S. GOVERNMENT AND AGENCY OBLIGATIONS – 31.09% | |
| | |
| | | | Fannie Mae – 9.18% | | | | |
| | 4,737,354 | | | 3.000%, 10/01/34
Pool # AS3456 | | | 4,891,726 | |
| | 4,908,219 | | | 3.000%, 01/01/35
Pool # AS4281 | | | 5,068,462 | |
| | 3,992,666 | | | 3.000%, 03/01/45
Pool # AS4645 | | | 4,070,679 | |
| | | | | | | | |
Par Value | | | | | Market
Value | |
| | | | | | | |
| | |
| | | | Fannie Mae (continued) | | | | |
| | $ 420,661 | | | 4.000%, 06/01/42
Pool # AB5459 | | $ | 441,048 | |
| | 748,791 | | | 3.500%, 12/01/31
Pool # MA0919 | | | 793,912 | |
| | 664,304 | | | 3.500%, 01/01/32
Pool # MA0949 | | | 704,403 | |
| | 290,303 | | | 4.500%, 03/01/42
Pool # MA1050 | | | 308,260 | |
| | 1,713,513 | | | 3.000%, 06/01/33
Pool # MA1459 | | | 1,769,570 | |
| | 305,771 | | | 4.000%, 09/01/31
Pool # MA3894 | | | 330,128 | |
| | 273,897 | | | 6.449%, 10/25/36 (b) (e)
Series 2007-57, Class SX, REMIC | | | 43,903 | |
| | 555,014 | | | 5.629%, 09/25/36 (b) (e)
Series 2009-86, Class CI, REMIC | | | 65,814 | |
| | 313,779 | | | 4.000%, 01/25/41
Series 2010-156, Class ZC, REMIC | | | 338,805 | |
| | 463,617 | | | 4.500%, 12/25/41
Series 2011-121, Class JP, REMIC | | | 509,593 | |
| | 472,413 | | | 4.000%, 03/25/41
Series 2011-18, Class UZ, REMIC | | | 489,973 | |
| | 25,458 | | | 8.942%, 09/25/41 (b)
Series 2011-88, Class SB, REMIC | | | 26,033 | |
| | 1,094,486 | | | 3.500%, 10/25/42
Series 2012-105, Class Z, REMIC | | | 1,089,001 | |
| | 1,117,028 | | | 3.500%, 03/25/42
Series 2012-20, Class ZT, REMIC | | | 1,123,134 | |
| | 1,696,544 | | | 4.000%, 04/25/42
Series 2012-31, Class Z, REMIC | | | 1,785,922 | |
| | 145,344 | | | 1.500%, 02/25/43
Series 2013-6, Class ZH, REMIC | | | 136,418 | |
| | 5,098,070 | | | 3.000%, 02/25/43
Series 2013-8, Class Z, REMIC | | | 4,880,502 | |
| | 5,075,470 | | | 3.000%, 11/25/44 Series 2014-73, Class CZ, REMIC | | | 4,647,352 | |
| | | | | | | | |
| | | | | | | 33,514,638 | |
| | | | | | | | |
| | |
| | | | Freddie Mac – 7.00% | | | | |
| | 6,966,541 | | | 3.500%, 02/01/45
Gold Pool # Q31596 | | | 7,300,072 | |
| | 1,639,483 | | | 3.000%, 01/01/33
Gold Pool # C91594 | | | 1,690,069 | |
| | 45,816 | | | 5.000%, 07/01/35
Gold Pool # G01840 | | | 51,380 | |
| | 14,460 | | | 5.500%, 12/01/38
Gold Pool # G06172 | | | 16,307 | |
See accompanying Notes to Financial Statements.
| | |
| |
| ASTON/DoubleLine Core Plus Fixed Income Fund | | April 30, 2015 |
| |
| Schedule of Investments (unaudited) – continued | | |
| | | | | | | | |
Par Value | | | | | Market
Value | |
| | | | | | | |
| | |
| | | | Freddie Mac (continued) | | | | |
| | $ 290,623 | | | 4.000%, 10/01/41
Gold Pool # T60392 | | $ | 304,255 | |
| | 1,071,807 | | | 3.500%, 10/01/42
Gold Pool # T65110 | | | 1,106,025 | |
| | 627,602 | | | 5.000%, 12/15/34
Series 2909, Class Z, REMIC | | | 700,044 | |
| | 172,269 | | | 5.926%, 04/15/37 (b) (e)
Series 3301, Class MS, REMIC | | | 22,598 | |
| | 100,209 | | | 5.826%, 11/15/37 (b) (e)
Series 3382, Class SB, REMIC | | | 11,873 | |
| | 110,976 | | | 6.216%, 11/15/37 (b) (e)
Series 3384, Class S, REMIC | | | 13,595 | |
| | 321,492 | | | 5.346%, 01/15/39 (b) (e)
Series 3500, Class SA, REMIC | | | 30,553 | |
| | 311,813 | | | 5.500%, 08/15/36
Series 3626, Class AZ, REMIC | | | 343,372 | |
| | 1,500,000 | | | 4.000%, 12/15/38
Series 3738, Class BP, REMIC | | | 1,605,401 | |
| | 118,497 | | | 4.000%, 01/15/41
Series 3795, Class VZ, REMIC | | | 124,608 | |
| | 87,877 | | | 4.000%, 06/15/41
Series 3872, Class BA, REMIC | | | 92,196 | |
| | 232,309 | | | 4.000%, 07/15/41
Series 3888, Class ZG, REMIC | | | 249,524 | |
| | 414,152 | | | 4.500%, 07/15/41
Series 3894, Class ZA, REMIC | | | 445,407 | |
| | 14,901 | | | 9.202%, 09/15/41 (b)
Series 3924, Class US, REMIC | | | 16,170 | |
| | 563,416 | | | 3.500%, 11/15/41
Series 3957, Class DZ, REMIC | | | 556,848 | |
| | 515,783 | | | 4.000%, 11/15/41 Series 3957, Class HZ, REMIC | | | 556,395 | |
| | 2,793,563 | | | 9.511%, 01/15/41 (b)
Series 3792, Class SE, REMIC | | | 2,873,088 | |
| | 4,331,663 | | | 3.000%, 06/15/40
Series 4323, Class GA, REMIC | | | 4,506,006 | |
| | 3,098,976 | | | 3.000%, 03/15/44
Series 4316, Class BZ, REMIC | | | 2,939,056 | |
| | | | | | | | |
| | | | | | | 25,554,842 | |
| | | | | | | | |
| | |
| | | | Ginnie Mae – 1.16% | | | | |
| | 40,740 | | | 31.356%, 03/20/34 (b)
Series 2004-35, Class SA | | | 71,328 | |
| | 539,872 | | | 7.457%, 08/20/38 (b) (e)
Series 2008-69, Class SB | | | 111,738 | |
| | 646,215 | | | 4.500%, 05/16/39
Series 2009-32, Class ZE | | | 714,207 | |
| | 652,206 | | | 4.500%, 05/20/39
Series 2009-35, Class DZ | | | 709,828 | |
| | 642,514 | | | 4.500%, 09/20/39
Series 2009-75, Class GZ | | | 695,597 | |
| | 318,229 | | | 5.889%, 03/20/39 (b) (e)
Series 2010-98, Class IA | | | 23,628 | |
| | 1,388,342 | | | 5.277%, 06/20/41 (b) (e)
Series 2011-89, Class SA | | | 205,477 | |
| | 5,860,337 | | | 6.070%, 10/20/44 (b) (e)
Series 2014-156, Class PS | | | 839,125 | |
| | | | | | | | |
Par Value | | | | | Market
Value | |
| | | | | | | |
| | |
| | | | Ginnie Mae (continued) | | | | |
| | $ 5,041,993 | | | 5.970%, 07/20/43 (b) (e)
Series 2014-5, Class PS | | $ | 864,867 | |
| | | | | | | | |
| | | | | | | 4,235,795 | |
| | | | | | | | |
| | |
| | | | U.S. Treasury Bonds – 2.83% | | | | |
| | 4,650,000 | | | 0.250%, 09/30/15 | | | 4,653,269 | |
| | 3,150,000 | | | 2.750%, 11/15/42 | | | 3,148,277 | |
| | 2,160,000 | | | 3.625%, 02/15/44 | | | 2,543,737 | |
| | | | | | | | |
| | | | | | | 10,345,283 | |
| | | | | | | | |
| | |
| | | | U.S. Treasury Notes – 10.92% | | | | |
| | 3,500,000 | | | 0.250%, 05/31/15 | | | 3,500,546 | |
| | 6,960,000 | | | 0.250%, 07/31/15 | | | 6,964,079 | |
| | 3,630,000 | | | 1.750%, 10/31/20 | | | 3,666,017 | |
| | 5,600,000 | | | 2.375%, 12/31/20 | | | 5,835,810 | |
| | 6,290,000 | | | 2.250%, 03/31/21 | | | 6,502,288 | |
| | 5,800,000 | | | 2.000%, 08/31/21 | | | 5,896,060 | |
| | 3,060,000 | | | 1.750%, 02/28/22 | | | 3,052,350 | |
| | 1,790,000 | | | 2.750%, 11/15/23 | | | 1,904,812 | |
| | 1,920,000 | | | 4.500%, 02/15/36 | | | 2,541,450 | |
| | | | | | | | |
| | | | | | | 39,863,412 | |
| | | | | | | | |
| | |
| | | | Total U.S. Government and Agency Obligations
(Cost $113,018,313) | | | 113,513,970 | |
| | | | | | | | |
|
| | OTHER MORTGAGE AND ASSET-BACKED SECURITIES – 5.68% | |
| | 250,000 | | | Adams Mill CLO (Cayman Islands) Series 2014-1A, Class D1 3.753%, 07/15/26 (a) (b) | | | 239,460 | |
| | 250,000 | | | Adams Mill CLO (Cayman Islands) Series 2014-1A, Class E1 5.253%, 07/15/26 (a) (b) | | | 222,859 | |
| | 500,000 | | | Apidos CDO V (Cayman Islands) Seires 2007-5A, Class B 0.953%, 04/15/21 (a) (b) | | | 481,622 | |
| | 500,000 | | | Apidos CLO XVI (Cayman Islands)
Series 2013-16A, Class B
3.057%, 01/19/25 (a) (b) | | | 491,650 | |
| | 250,000 | | | Apidos CLO XVIII (Cayman Islands)
Series 2014-18A, Class C
3.925%, 07/22/26 (a) (b) | | | 244,796 | |
| | 250,000 | | | Apidos CLO XVIII (Cayman Islands)
Series 2014-18A, Class D
5.475%, 07/22/26 (a) (b) | | | 232,780 | |
| | 500,000 | | | Apidos CLO XX (Cayman Islands)
Series 2015-20A, Class B
3.416%, 01/16/27 (a) (b) | | | 502,013 | |
| | 500,000 | | | Apidos CLO XX (Cayman Islands)
Series 2015-20A, Class C
3.916%, 01/16/27 (a) (b) | | | 490,413 | |
| | 250,000 | | | ARES CLO (Cayman Islands)
Series 2012-2A, Class D
4.952%, 10/12/23 (a) (b) | | | 247,284 | |
See accompanying Notes to Financial Statements.
| | |
| |
| ASTON/DoubleLine Core Plus Fixed Income Fund | | April 30, 2015 |
| |
| Schedule of Investments (unaudited) – continued | | |
| | | | | | | | |
Par Value | | | | | Market
Value | |
| | | | | | | |
| | $ 500,000 | | | ARES XXVI CLO (Cayman Islands)
Series 2013-1A, Class D
4.003%, 04/15/25 (a) (b) | | $ | 485,556 | |
| | 250,000 | | | Babson CLO (Cayman Islands)
Series 2014-3A, Class E2
6.791%, 01/15/26 (a) (b) | | | 251,055 | |
| | 250,000 | | | Babson CLO (Cayman Islands) Series 2015-IA, Class D1
3.725%, 04/20/27 (a) (b) | | | 242,531 | |
| | 250,000 | | | Ballyrock CLO (Cayman Islands)
Series 2014-1A. Class C
3.981%, 10/20/26 (a) (b) | | | 243,826 | |
| | 868,382 | | | Bayview Financial Acquisition Trust
Series 2007-A, Class 1A5
6.101%, 05/28/37 (d) | | | 873,440 | |
| | 250,000 | | | Birchwood Park CLO (Cayman Islands) Series 2014-1A, Class C2
3.403%, 07/15/26 (a) (b) | | | 250,799 | |
| | 250,000 | | | Birchwood Park CLO (Cayman Islands) Series 2014-1A, Class D2
4.453%, 07/15/26 (a) (b) | | | 250,660 | |
| | 250,000 | | | BlueMountain CLO (Cayman Islands) Series 2012-1A, Class E
5.757%, 07/20/23 (a) (b) | | | 247,409 | |
| | 250,000 | | | Brookside Mill CLO (Cayman Islands) Series 2013-1A, Class D
3.324%, 04/17/25 (a) (b) | | | 233,127 | |
| | 250,000 | | | Brookside Mill CLO (Cayman Islands) Series 2013-1A, Class E
4.653%, 04/17/25 (a) (b) | | | 219,036 | |
| | 500,000 | | | Canyon Capital CLO (Cayman Islands) Series 2014-1A, Class B
2.905%, 04/30/25 (a) (b) | | | 491,864 | |
| | 500,000 | | | Carlyle Global Market Strategies (Cayman Islands)
Series 2014-7A, Class C
3.257%, 04/17/25 (a) (b) | | | 501,051 | |
| | 250,000 | | | Catamaran CLO (Cayman Islands)
Series 2015-1A, Class C1
3.375%, 04/22/27 (a) (b) | | | 247,600 | |
| | 500,000 | | | Cent CDO 10 (Cayman Islands)
Series 2005-10A, Class D 2.021%, 12/15/17 (a) (b) | | | 493,778 | |
| | 500,000 | | | ColumbusNova CLO (Cayman Islands)
Series 2006-2A, Class D 1.756%, 04/04/18 (a) (b) | | | 498,908 | |
| | 100,000 | | | Credit-Based Asset Servicing and Securitization
Series 2007-MX1, Class A4 6.231%, 12/25/36 (a) (d) | | | 95,697 | |
| | 750,000 | | | Dryden XXIV Senior Loan Fund (Cayman Islands)
Series 2012-24RA, Class DR 3.979%, 11/15/23 (b) (c) | | | 750,000 | |
| | | | | | | | |
Par Value | | | | | Market
Value | |
| | | | | | | |
| | $ 250,000 | | | Eaton Vance CDO VIII (Cayman Islands)
Series 2006-8A, Class B 0.907%, 08/15/22 (a) (b) | | $ | 240,834 | |
| | 250,000 | | | Emerson Park CLO (Cayman Islands) Series 2013-1A, Class C1 3.003%, 07/15/25 (a) (b) | | | 247,707 | |
| | 250,000 | | | Flatiron CLO (Cayman Islands)
Series 2014-1A, Class B 3.125%, 07/17/26 (a) (b) | | | 248,948 | |
| | 250,000 | | | Flatiron CLO (Cayman Islands)
Series 2014-1A, Class C 3.575%, 07/17/26 (a) (b) | | | 239,442 | |
| | 500,000 | | | Galaxy XVIII CLO (Cayman Islands)
Series 2014-18A, Class D1 3.963%, 10/15/26 (a) (b) | | | 490,800 | |
| | 250,000 | | | Goldentree Loan Opportunities VI (Cayman Islands)
Series 2012-6A, Class D
4.457%, 04/17/22 (a) (b) | | | 250,836 | |
| | 757,000 | | | GSAA Home Equity Trust
Series 2006-15, Class AF3B
5.933%, 09/25/36 (b) | | | 163,423 | |
| | 250,000 | | | Halcyon Loan Advisors Funding (Cayman Islands)
Series 2013-2A, Class C
2.955%, 08/01/25 (a) (b) | | | 240,367 | |
| | 500,000 | | | ING Investment Management CLO II (Cayman Islands)
Series 2006-2X, Class D
1.855%, 08/01/20 (b) | | | 479,417 | |
| | 500,000 | | | LCM VI (Cayman Islands)
Series 6A, Class C
1.062%, 05/28/19 (a) (b) | | | 486,750 | |
| | 250,000 | | | LCM XI (Cayman Islands)
Series 11A, Class D
4.207%, 04/19/22 (a) (b) | | | 249,984 | |
| | 250,000 | | | LCM XIV (Cayman Islands)
Series 14A, Class D
3.753%, 07/15/25 (a) (b) | | | 244,656 | |
| | 500,000 | | | LCM XV (Cayman Islands)
Series 15A, Class C
3.362%, 08/25/24 (a) (b) | | | 501,018 | |
| | 350,000 | | | Madison Park Funding IV (Cayman Islands)
Series 2007-4A, Class D
1.695%, 03/22/21 (a) (b) | | | 338,413 | |
| | 500,000 | | | Madison Park Funding XIV (Cayman Islands)
Series 2014-14A, Class D
3.857%, 07/20/26 (a) (b) | | | 488,200 | |
| | 500,000 | | | Madison Park Funding XV (Cayman Islands)
Series 2014-15A, Class C
3.914%, 01/27/26 (a) (b) | | | 493,690 | |
| | 500,000 | | | Madison Park Funding XVI (Cayman Islands)
Series 2015-16A, Class B
3.263%, 04/20/26 (a) (b) | | | 501,030 | |
See accompanying Notes to Financial Statements.
| | |
| |
| ASTON/DoubleLine Core Plus Fixed Income Fund | | April 30, 2015 |
| |
| Schedule of Investments (unaudited) – continued | | |
| | | | | | | | |
Par Value | | | | | Market
Value | |
| | | | | | | |
| | $ 500,000 | | | Magnetite IX (Cayman Islands) Series 2014-9A, Class B
3.256%, 07/25/26 (a) (b) | | $ | 499,100 | |
| | 500,000 | | | Magnetite XI (Cayman Islands) Series 2014-11A, Class C
3.843%, 01/18/27 (a) (b) | | | 487,574 | |
| | 250,000 | | | Nomad CLO (Cayman Islands) Series 2013-1A, Class B
3.203%, 01/15/25 (a) (b) | | | 247,917 | |
| | 250,000 | | | Nomad CLO (Cayman Islands) Series 2013-1A, Class C
3.753%, 01/15/25 (a) (b) | | | 239,763 | |
| | 250,000 | | | Octagon Investment Partners XVI (Cayman Islands)
Series 2013-1A, Class D
3.607%, 07/17/25 (a) (b) | | | 239,445 | |
| | 250,000 | | | Octagon Investment Partners XVI (Cayman Islands)
Series 2013-1A, Class E
4.757%, 07/17/25 (a) (b) | | | 221,482 | |
| | 250,000 | | | Octagon Investment Partners XXI (Cayman Islands)
Series 2014-1A, Class C
3.903%, 11/14/26 (a) (b) | | | 243,920 | |
| | 250,000 | | | Octagon Investment Partners XXII (Cayman Islands)
Series 2014-1A, Class C2
3.791%, 11/22/25 (a) (b) | | | 252,845 | |
| | 250,000 | | | Octagon Investment Partners XXII (Cayman Islands)
Series 2014-1A, Class D2
4.871%, 11/22/25 (a) (b) | | | 251,110 | |
| | 132,653 | | | Residential Asset Mortgage Products Series 2006-RS5, Class A3
0.344%, 09/25/36 (b) | | | 129,660 | |
| | 500,000 | | | Symphony CLO XI (Cayman Islands) Series 2013-11A, Class C
3.407%, 01/17/25 (a) (b) | | | 500,990 | |
| | 750,000 | | | Symphony CLO XIV (Cayman Islands) Series 2014-14A, Class D2
3.870%, 07/14/26 (a) (b) | | | 734,987 | |
| | 750,000 | | | Venture XV CLO (Cayman Islands) Series 2013-15A, Class C
3.353%, 07/15/25 (a) (b) | | | 748,089 | |
| | 250,000 | | | WhiteHorse III (Cayman Islands) Series 2006-1A, Class B1L
2.105%, 05/01/18 (a) (b) | | | 250,000 | |
| | 250,000 | | | Wind River CLO (Cayman Islands) Series 2013-1A, Class C
3.657%, 04/20/25 (a) (b) | | | 239,487 | |
| | | | | | | | |
| | |
| | | | Total Other Mortgage and Asset-Backed Securities
(Cost $20,658,179) | | | 20,721,098 | |
| | | | | | | | |
| | | | | | | | |
Par Value | | | | | Market
Value | |
| | | | | | | |
|
| | MUNICIPAL BONDS – 3.17% | |
| | |
| | | | California – 0.42% | | | | |
| | $ 580,000 | | | East Bay Municipal Utility District Water System RB, Series A
5.000%, 06/01/31 | | $ | 691,865 | |
| | 390,000 | | | State of California, GO
5.000%, 10/01/32 | | | 450,731 | |
| | 340,000 | | | State of California, GO
5.000%, 05/01/31 | | | 392,938 | |
| | | | | | | | |
| | | | | | | 1,535,534 | |
| | | | | | | | |
| | |
| | | | Georgia – 0.31% | | | | |
| | 930,000 | | | Gwinnett County School District, GO 5.000%, 02/01/31 | | | 1,120,194 | |
| | | | | | | | |
| | |
| | | | Louisiana – 0.14% | | | | |
| | 420,000 | | | State of Louisiana,GO
Series D-1
5.000%, 12/01/27 | | | 501,388 | |
| | | | | | | | |
| | |
| | | | Maryland – 0.23% | | | | |
| | 680,000 | | | Montgomery County, GO
Series B
5.000%, 11/01/26 | | | 836,366 | |
| | | | | | | | |
| | |
| | | | Nevada – 0.27% | | | | |
| | 800,000 | | | State of Nevada, GO
Series B
5.000%, 11/01/26 | | | 977,400 | |
| | | | | | | | |
| | |
| | | | New York – 0.14% | | | | |
| | 430,000 | | | New York State Dormitory
Authority, RB
Series E
5.000%, 02/15/32 | | | 497,261 | |
| | | | | | | | |
| | |
| | | | Oregon – 0.25% | | | | |
| | 770,000 | | | State of Oregon Department of Transportation, RB
Series A
5.000%, 11/15/29 | | | 915,761 | |
| | | | | | | | |
| | |
| | | | Texas – 0.68% | | | | |
| | 980,000 | | | State of Texas, GO
Transportation Commission,
Series A
5.000%, 10/01/28 | | | 1,170,590 | |
| | 740,000 | | | University of Texas System, RB
Series B
5.000%, 08/15/27 | | | 890,953 | |
| | 370,000 | | | City of Dallas, GO
5.000%, 02/15/27 | | | 441,521 | |
| | | | | | | | |
| | | | | | | 2,503,064 | |
| | | | | | | | |
| | |
| | | | Utah – 0.29% | | | | |
| | 890,000 | | | Utah Transit Authority, RB Series A
5.000%, 06/15/31 | | | 1,056,181 | |
| | | | | | | | |
See accompanying Notes to Financial Statements.
| | |
| |
| ASTON/DoubleLine Core Plus Fixed Income Fund | | April 30, 2015 |
| |
| Schedule of Investments (unaudited) – continued | | |
| | | | | | | | |
Par Value | | | | | Market
Value | |
| | | | | | | |
| | |
| | | | Virginia – 0.20% | | | | |
| | $ 610,000 | | | Virginia State, GO
Standing Aid Witholding,
Series B
5.000%, 06/01/27 | | $ | 751,111 | |
| | | | | | | | |
| | |
| | | | Washington – 0.24% | | | | |
| | 770,000 | | | State of Washington, GO
Series R-2015E
5.000%, 07/01/33 | | | 894,032 | |
| | | | | | | | |
| | |
| | | | Total Municipal Bonds
(Cost $11,732,068) | | | 11,588,292 | |
| | | | | | | | |
|
| | FOREIGN GOVERNMENT BONDS – 0.58% | |
| | 1,200,000 | | | Instituto Costarricense de Electricidad
Senior Unsecured Notes
6.950%, 11/10/21 | | | 1,291,500 | |
| | 290,000 | | | Mexico Government International Bond
Senior Unsecured Notes
4.000%, 10/02/23 | | | 305,153 | |
| | 500,000 | | | Panama Government International Bond
Senior Unsecured Notes
3.750%, 03/16/25 | | | 509,375 | |
| | | | | | | | |
| | |
| | | | Total Foreign Government Bonds
(Cost $2,064,052) | | | 2,106,028 | |
| | | | | | | | |
| | |
Shares | | | | | | |
|
| | INVESTMENT COMPANIES – 7.38% | |
| | |
| | 17,135,830 | | | BlackRock Liquidity Funds TempFund Portfolio | | | 17,135,830 | |
| | 963,812 | | | DoubleLine Floating Rate Fund (f) | | | 9,811,607 | |
| | | | | | | | |
| | |
| | | | Total Investment Companies
(Cost $26,876,290) | | | 26,947,437 | |
| | | | | | | | |
| Total Investments – 99.49%
(Cost $361,075,029)* | | | 363,201,279 | |
| | | | | | | | |
| Net Other Assets and Liabilities – 0.51% | | | 1,877,705 | |
| | | | | | | | |
| Net Assets – 100.00% | | $ | 365,078,984 | |
| | | | | | | | |
| * | | At April 30, 2015, cost is identical for book and Federal income tax purposes. |
| | | | |
Gross unrealized appreciation | | $ | 6,330,700 | |
Gross unrealized depreciation | | | (4,204,450 | ) |
| | | | |
Net unrealized appreciation | | $ | 2,126,250 | |
| | | | |
| (a) | | Securities exempt from registration under Rule 144A of the Securities Act of 1933, as amended. These securities are purchased in accordance with guidelines approved by the Fund’s Board of Trustees and may only be resold, in transactions exempt from registration, to qualified institutional buyers. At April 30, 2015, these securities amounted to $65,162,243 or 17.85% of net assets. These securities have not been determined by the Subadviser to be illiquid securities. |
| (b) | | Variable rate bond. The interest rate shown reflects the rate in effect at April 30, 2015. |
| (c) | | Securities with a total aggregate market value of $1,867,467 or 0.51% of the net assets, were valued under the fair value procedures established by the Funds’ Board of Trustees. |
| (d) | | Step Coupon. Security becomes interest bearing at a future date. |
| (e) | | Interest only security. This type of security represents the right to receive the monthly interest payments on an underlying pool of mortgages. Payments of principal on the pool reduce the value of the “interest only” holding. |
| (f) | | Affiliated issuer. (See Note G of the Financial Statements) |
| CLO | | Collateralized Loan Obligation |
| CDO | | Collateralized Debt Obligation |
| EMTN | | Euro Medium Term Note |
| GMTN | | Global Medium Term Note |
| REIT | | Real Estate Investment Trust |
| REMIC | | Real Estate Mortgage Investment Conduit |
| | | | |
Portfolio Composition | | | | |
U.S. Government Obligations | | | 14% | |
U.S. Government Agency Obligations | | | 17% | |
Corporate Notes and Bonds | | | | |
(S&P Ratings) | | | | |
AAA | | | 5% | |
AA | | | 4% | |
A | | | 7% | |
BBB | | | 15% | |
BB | | | 16% | |
B | | | 6% | |
Lower than B | | | 10% | |
Not Rated | | | 6% | |
| | | | |
| | | 100% | |
| | | | |
For financial reporting purposes, credit quality ratings shown are assigned by Standard & Poor’s. This rating agency is an independent, nationally recognized statistical rating organization and is widely used. Investment grade ratings are credit ratings of BBB or higher. Below investment grade ratings are credit ratings of BB or lower. Credit quality ratings are subject to change.
See accompanying Notes to Financial Statements.
| | |
| |
| ASTON/TCH Fixed Income Fund | | April 30, 2015 |
| |
| Schedule of Investments (unaudited) | | |
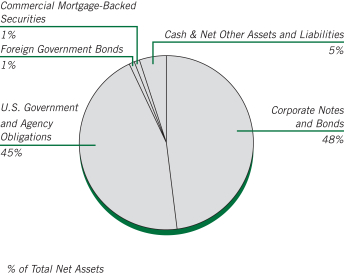
At April 30, 2015, 16.54% of the Total Net Assets of the Fund were comprised of securities of issuers located outside the United States.
| | | | | | | | |
Par Value | | | | | Market
Value | |
| | | | | | | |
|
| | CORPORATE NOTES AND BONDS – 48.44% | |
| | |
| | | | Consumer Discretionary – 4.15% | | | | |
| | $ 650,000 | | | ADT
Senior Unsecured Notes
4.875%, 07/15/42 | | $ | 546,000 | |
| | 225,000 | | | Coach
Senior Unsecured Notes
4.250%, 04/01/25 | | | 226,308 | |
| | 865,000 | | | L Brands
Senior Unsecured Notes
7.600%, 07/15/37 | | | 1,009,888 | |
| | 250,000 | | | Nabisco
Senior Unsecured Notes
7.550%, 06/15/15 | | | 251,899 | |
| | 250,000 | | | Netflix
Senior Unsecured Notes
5.750%, 03/01/24 | | | 265,625 | |
| | | | | | | | |
| | | | | | | 2,299,720 | |
| | | | | | | | |
| | |
| | | | Consumer Staples – 0.74% | | | | |
| | 65,000 | | | Altria Group
10.200%, 02/06/39 | | | 113,197 | |
| | 150,000 | | | PepsiCo
Senior Unsecured Notes
7.900%, 11/01/18 | | | 180,818 | |
| | 100,000 | | | Reynolds American
7.750%, 06/01/18 | | | 116,655 | |
| | | | | | | | |
| | | | | | | 410,670 | |
| | | | | | | | |
| | |
| | | | Energy – 3.80% | | | | |
| | | | Chesapeake Energy | | | | |
| | 250,000 | | | 6.625%,08/15/20 | | | 258,750 | |
| | 250,000 | | | 6.125%,02/15/21 | | | 252,500 | |
| | | | | | | | |
Par Value | | | | | Market
Value | |
| | | | | | | |
| | |
| | | | Energy (continued) | | | | |
| | $ 250,000 | | | Energy Transfer Partners
Senior Unsecured Notes
9.000%, 04/15/19 | | $ | 307,380 | |
| | 250,000 | | | KazMunayGas National (Kazakhstan)
Senior Unsecured Notes
5.750%, 04/30/43 (a) | | | 227,850 | |
| | 100,000 | | | Petroleos Mexicanos (Mexico)
4.500%, 01/23/26 (a) | | | 101,750 | |
| | 250,000 | | | Pride International
6.875%, 08/15/20 | | | 286,933 | |
| | 250,000 | | | Transocean (Cayman Islands)
7.350%, 12/15/41 (b) | | | 205,859 | |
| | 400,000 | | | Weatherford International (Bermuda)
9.625%, 03/01/19 | | | 465,692 | |
| | | | | | | | |
| | | | | | | 2,106,714 | |
| | | | | | | | |
| | |
| | | | Financials – 16.90% | | | | |
| | 250,000 | | | AerCap Ireland Capital (Ireland)
4.500%, 05/15/21 (a) | | | 263,750 | |
| | 500,000 | | | Ally Financial
Senior Unsecured Notes
4.125%, 02/13/22 | | | 491,250 | |
| | 450,000 | | | American Express Credit, MTN
Senior Unsecured Notes
0.535%, 06/05/17 (c) | | | 449,482 | |
| | 450,000 | | | American Financial Group
Senior Unsecured Notes
9.875%, 06/15/19 | | | 572,266 | |
| | 250,000 | | | Banco Bradesco SA/Cayman
Islands (Brazil)
Subordinated Notes
5.750%, 03/01/22 (a) | | | 264,525 | |
| | 250,000 | | | Bancolombia SA (Colombia)
Senior Unsecured Notes
| | | | |
| | | | 5.950%, 06/03/21 | | | 277,925 | |
| | 250,000 | | | Subordinated Notes
5.125%, 09/11/22 | | | 256,375 | |
| | 580,000 | | | Bank of America
Senior Unsecured Notes
1.315%, 01/15/19 (c) | | | 588,264 | |
| | | | MTN, Subordinated Notes
| | | | |
| | 175,000 | | | 4.000%, 01/22/25 | | | 173,870 | |
| | 250,000 | | | Barrick North America Finance
5.700%, 05/30/41 | | | 248,379 | |
| | 250,000 | | | Berkshire Hathaway Finance
0.576%, 01/12/18 (c) | | | 250,820 | |
| | 250,000 | | | Blackstone Holdings Finance
6.250%, 08/15/42 (a) (d) | | | 307,520 | |
| | 250,000 | | | Bunge Ltd Finance
8.500%, 06/15/19 | | | 307,081 | |
| | 140,000 | | | Citigroup
Senior Unsecured Notes
1.237%, 07/25/16 (c) | | | 140,768 | |
| | 500,000 | | | Credit Suisse New York (Switzerland) MTN Senior Unsecured Notes
0.567%, 03/11/16 (c) | | | 499,786 | |
| | 150,000 | | | Daimler Finance
0.958%, 08/01/16 (a) (c) | | | 150,880 | |
See accompanying Notes to Financial Statements.
| | |
| |
| ASTON/TCH Fixed Income Fund | | April 30, 2015 |
| |
| Schedule of Investments (unaudited) – continued | | |
| | | | | | | | |
Par Value | | | | | Market
Value | |
| | | | | | | |
| | |
| | | | Financials (continued) | | | | |
| | $ 250,000 | | | Discover Bank
Subordinated Notes
7.000%, 04/15/20 | | $ | 295,586 | |
| | 500,000 | | | Ensco (United Kingdom)
Senior Unsecured Notes
5.200%, 03/15/25 (c) | | | 516,586 | |
| | 500,000 | | | Ford Motor
Senior Unsecured Notes
1.209%, 11/04/19 (c) | | | 500,984 | |
| | 375,000 | | | Goldman Sachs Group
Senior Unsecured Notes
1.297%, 10/23/19 (c) | | | 378,472 | |
| | 500,000 | | | Goldman Sachs Group, MTN
Senior Unsecured Notes
1.357%, 11/15/18 (c) | | | 505,963 | |
| | 400,000 | | | Itau Unibanco Holding SA (Brazil) Subordinated Notes
5.500%, 08/06/22 (a) | | | 414,380 | |
| | 250,000 | | | Jefferies Group
Senior Unsecured Notes
6.500%, 01/20/43 | | | 249,396 | |
| | 200,000 | | | Leucadia National
Senior Unsecured Notes
5.500%, 10/18/23 | | | 205,812 | |
| | 250,000 | | | Nomura Holdings (Japan), MTN
Senior Unsecured Notes
1.720%, 09/13/16 (c) | | | 253,353 | |
| | 300,000 | | | Turkiye Halk Bankasi AS (Turkey)
Senior Unsecured Notes
4.750%, 06/04/19 (a) | | | 300,750 | |
| | 500,000 | | | Wells Fargo
Senior Unsecured Notes
1.189%, 06/26/15 (c) | | | 500,748 | |
| | | | | | | | |
| | | | | | | 9,364,971 | |
| | | | | | | | |
| | |
| | | | Healthcare – 3.98% | | | | |
| | 500,000 | | | Bayer US Finance
0.521%, 10/07/16 (a) (c) | | | 500,277 | |
| | 500,000 | | | Lorillard Tobacco
8.125%, 05/01/40 | | | 699,878 | |
| | 1,000,000 | | | Merck
Senior Unsecured Notes
0.631%, 02/10/20 (c) | | | 1,007,052 | |
| | | | | | | | |
| | | | | | | 2,207,207 | |
| | | | | | | | |
| | |
| | | | Industrials – 4.30% | | | | |
| | 300,000 | | | Ball Corp
5.000%, 03/15/22 | | | 314,250 | |
| | 250,000 | | | FedEx
Senior Notes
8.000%, 01/15/19 | | | 303,639 | |
| | 200,000 | | | Jaguar Land Rover Automotive (United Kingdom)
4.125%, 12/15/18 (a) | | | 205,500 | |
| | 500,000 | | | Mexichem SAB de CV (Mexico)
6.750%, 09/19/42 (a) | | | 547,500 | |
| | 200,000 | | | Nissan Motor Acceptance
0.969%, 09/26/16 (a)(c) | | | 201,275 | |
| | | | | | | | |
Par Value | | | | | Market
Value | |
| | | | | | | |
| | |
| | | | Industrials (continued) | | | | |
| | $ 500,000 | | | Southern Copper
Senior Unsecured Notes
7.500%, 07/27/35 | | $ | 579,250 | |
| | 250,000 | | | Vale SA (Brazil)
Senior Unsecured Notes
5.625%, 09/11/42 | | | 227,573 | |
| | | | | | | | |
| | | | | | | 2,378,987 | |
| | | | | | | | |
| | |
| | | | Information Technology – 3.05% | | | | |
| | 350,000 | | | eBay
Senior Unsecured Notes
4.000%, 07/15/42 | | | 305,880 | |
| | 150,000 | | | Hewlett-Packard
Senior Unsecured Notes
1.217%, 01/14/19 (c) | | | 150,884 | |
| | 250,000 | | | Micron Technology
Senior Unsecured Notes
5.500%, 02/01/25 (a) | | | 249,375 | |
| | | | | | | | |
| | 250,000 | | | Seagate HDD (Cayman Islands)
5.750%, 12/01/34 (a) | | | 265,312 | |
| | 600,000 | | | Telecom Italia Capital SA (Luxembourg)
7.721%, 06/04/38 | | | 715,500 | |
| | | | | | | | |
| | | | | | | 1,686,951 | |
| | | | | | | | |
| | |
| | | | Materials – 5.25% | | | | |
| | 100,000 | | | Allegheny Technologies
Senior Unsecured Notes
6.375%, 08/15/23 (b) | | | 106,250 | �� |
| | 400,000 | | | ArcelorMittal (Luxembourg)
Senior Unsecured Notes
7.750%, 10/15/39 (b) | | | 415,000 | |
| | 500,000 | | | Braskem America Finance
7.125%, 07/22/41 (a) | | | 483,750 | |
| | 250,000 | | | Dow Chemical (The)
Senior Unsecured Notes
8.550%, 05/15/19 | | | 310,856 | |
| | 500,000 | | | GTL Trade Finance (Virgin Islands)
7.250%, 04/16/44 (a) | | | 495,625 | |
| | 250,000 | | | International Paper
Senior Unsecured Notes
8.700%, 06/15/38 | | | 359,537 | |
| | 250,000 | | | Teck Resources (Canada)
6.250%, 07/15/41 | | | 232,167 | |
| | 500,000 | | | Vale Overseas (Cayman Islands)
6.875%, 11/21/36 | | | 507,250 | |
| | | | | | | | |
| | | | | | | 2,910,435 | |
| | | | | | | | |
| | |
| | | | Telecommunication Services – 5.31% | | | | |
| | | | CenturyLink
Senior Unsecured Notes | | | | |
| | 500,000 | | | 7.600%, 09/15/39 | | | 502,500 | |
| | 500,000 | | | 7.650%, 03/15/42 | | | 505,000 | |
| | 350,000 | | | Frontier Communications
Senior Unsecured Notes
9.000%, 08/15/31 | | | 370,125 | |
See accompanying Notes to Financial Statements.
| | |
| |
| ASTON/TCH Fixed Income Fund | | April 30, 2015 |
| |
| Schedule of Investments (unaudited) – continued | | |
| | | | | | | | |
Par Value | | | | | Market
Value | |
| | | | | | | |
| | |
| | | | Telecommunication Services (continued) | | | | |
| | $ 250,000 | | | Telecom Italia Capital SA (Luxembourg)
6.375%, 11/15/33 | | $ | 270,872 | |
| | 500,000 | | | Telefonica Europe BV (Netherlands)
8.250%, 09/15/30 | | | 712,872 | |
| | 100,000 | | | Verizon Communications
Senior Unsecured Notes
1.801%, 09/15/16 (c) | | | 101,558 | |
| | 500,000 | | | Windstream
7.500%, 06/01/22 | | | 478,125 | |
| | | | | | | | |
| | | | | | | 2,941,052 | |
| | | | | | | | |
| | |
| | | | Utilities – 0.96% | | | | |
| | 334,000 | | | FPL Group Capital
7.875%, 12/15/15 | | | 348,161 | |
| | 150,000 | | | Pacific Gas & Electric
Senior Unsecured Notes
8.250%, 10/15/18 | | | 182,559 | |
| | | | | | | | |
| | | | | | | 530,720 | |
| | | | | | | | |
| | |
| | | | Total Corporate Notes and Bonds
(Cost $25,069,500) | | | 26,837,427 | |
| | | | | | | | |
|
| | U.S. GOVERNMENT AND AGENCY OBLIGATIONS – 45.14% | |
| | |
| | | | Fannie Mae – 13.25% | | | | |
| | 111,556 | | | 6.000%, 11/01/17
Pool # 662854 | | | 116,307 | |
| | 27,837 | | | 6.000%, 04/01/18
Pool # 725175 | | | 28,785 | |
| | 121,784 | | | 5.500%, 11/01/18
Pool # 748886 | | | 128,847 | |
| | 40,154 | | | 4.500%, 06/01/19
Pool # 747860 | | | 42,209 | |
| | 223,234 | | | 6.000%, 01/01/21
Pool # 850787 | | | 246,026 | |
| | 102,312 | | | 6.000%, 09/01/32
Pool # 847899 | | | 116,814 | |
| | 62,506 | | | 6.000%, 02/01/34
Pool # 771952 | | | 71,883 | |
| | 52,909 | | | 7.500%, 02/01/35
Pool # 787557 | | | 56,102 | |
| | 18,367 | | | 7.500%, 04/01/35
Pool # 819231 | | | 19,612 | |
| | 80,127 | | | 6.000%, 11/01/35
Pool # 844078 | | | 91,490 | |
| | 91,887 | | | 5.000%, 05/01/36
Pool # 745581 | | | 102,453 | |
| | 48,157 | | | 6.000%, 12/01/36
Pool # 888029 | | | 55,130 | |
| | 65,763 | | | 5.500%, 06/01/37
Pool # 918778 | | | 74,377 | |
| | 68,360 | | | 6.500%, 10/01/37
Pool # 888890 | | | 79,184 | |
| | 215,722 | | | 5.500%, 03/01/38
Pool # 962344 | | | 243,936 | |
| | 221,643 | | | 4.000%, 02/01/41
Pool # AE0949 | | | 238,039 | |
| | 196,381 | | | 4.000%, 02/01/41
Pool # AH5695 | | | 210,569 | |
| | | | | | | | |
Par Value | | | | | Market
Value | |
| | | | | | | |
| | |
| | | | Fannie Mae (continued) | | | | |
| | $ 924,274 | | | 3.000%, 03/01/43
Pool # AB8615 | | $ | 943,992 | |
| | 515,862 | | | 3.500%, 05/01/43
Pool # AB9512 | | | 541,439 | |
| | 547,614 | | | 3.000%, 07/01/43
Pool # AU1629 | | | 558,725 | |
| | 921,845 | | | 3.000%, 08/01/43
Pool # AS0331 | | | 940,571 | |
| | 897,495 | | | 3.000%, 09/01/44
Pool # AX7336 | | | 915,031 | |
| | 1,491,664 | | | 3.000%, 02/01/45
Pool # AS4474 | | | 1,520,810 | |
| | | | | | | | |
| | | | | | | 7,342,331 | |
| | | | | | | | |
| | |
| | | | Freddie Mac – 11.97% | | | | |
| | 216,803 | | | 5.500%, 11/01/20
Gold Pool # G18083 | | | 233,860 | |
| | 44,626 | | | 5.500%, 12/01/20
Gold Pool # G11820 | | | 48,380 | |
| | 71,465 | | | 5.500%, 05/01/37
Gold Pool # A60048 | | | 80,700 | |
| | 139,215 | | | 5.500%, 09/01/37
Gold Pool # G03202 | | | 157,053 | |
| | 100,664 | | | 5.000%, 02/01/38
Gold Pool # A73409 | | | 111,780 | |
| | 330,099 | | | 5.000%, 04/01/38
Gold Pool # G04334 | | | 369,023 | |
| | 200,851 | | | 4.000%, 12/01/39
Gold Pool # G06935 | | | 215,268 | |
| | 96,104 | | | 4.000%, 05/01/41
Gold Pool # Q00870 | | | 102,850 | |
| | 648,706 | | | 4.000%, 11/01/41
Gold Pool # Q04550 | | | 694,583 | |
| | 887,705 | | | 3.000%, 04/01/43
Gold Pool # V80006 | | | 904,710 | |
| | 891,026 | | | 3.000%, 05/01/43
Gold Pool # G08525 | | | 907,602 | |
| | 458,432 | | | 3.000%, 09/01/43
Gold Pool # G08544 | | | 466,748 | |
| | 766,625 | | | 3.500%, 10/01/43
Gold Pool # G08554 | | | 803,328 | |
| | 286,931 | | | 3.500%, 11/01/43
Gold Pool # G08557 | | | 300,668 | |
| | 670,590 | | | 3.500%, 01/01/44
Gold Pool # G08562 | | | 702,695 | |
| | 512,167 | | | 3.500%, 02/01/44
Gold Pool # G08572 | | | 536,688 | |
| | | | | | | | |
| | | | | | | 6,635,936 | |
| | | | | | | | |
| | |
| | | | Ginnie Mae – 1.32% | | | | |
| | 102,802 | | | 5.000%, 05/01/37
Pool # 782156 | | | 113,202 | |
| | 224,288 | | | 5.000%, 08/01/37
Pool # 4015 | | | 248,654 | |
| | 182,405 | | | 6.000%, 07/01/38
Pool # 4195 | | | 206,632 | |
| | 100,358 | | | 5.500%, 08/01/38
Pool # 4215 | | | 107,835 | |
See accompanying Notes to Financial Statements.
| | |
| |
| ASTON/TCH Fixed Income Fund | | April 30, 2015 |
| |
| Schedule of Investments (unaudited) – continued | | |
| | | | | | | | |
Par Value | | | | | Market
Value | |
| | | | | | | |
| | |
| | | | Ginnie Mae (continued) | | | | |
| | $ 47,064 | | | 6.000%, 01/01/39
Pool # 698036 | | $ | 53,577 | |
| | | | | | | | |
| | | | | | | 729,900 | |
| | | | | | | | |
| | |
| | | | U.S. Treasury Bond – 0.95% | | | | |
| | 500,000 | | | 3.000%, 05/15/42 | | | 524,961 | |
| | | | | | | | |
| |
| | | | U.S. Treasury Inflation Index Bonds – 5.54% | |
| | 1,632,735 | | | 1.375%, 07/15/18 | | | 1,751,874 | |
| | 1,120,410 | | | 1.750%, 01/15/28 | | | 1,315,956 | |
| | | | | | | | |
| | | | | | | 3,067,830 | |
| | | | | | | | |
| | |
| | | | U.S. Treasury Notes – 12.11% | | | | |
| | 1,000,000 | | | 2.125%, 05/31/15 | | | 1,001,758 | |
| | 1,500,000 | | | 2.000%, 01/31/16 | | | 1,520,274 | |
| | 1,250,000 | | | 2.000%, 04/30/16 | | | 1,271,485 | |
| | 500,000 | | | 3.000%, 08/31/16 | | | 517,461 | |
| | 500,000 | | | 2.250%, 11/30/17 | | | 518,711 | |
| | 350,000 | | | 2.000%, 11/30/20 | | | 357,875 | |
| | 1,500,000 | | | 2.000%, 11/15/21 | | | 1,523,907 | |
| | | | | | | | |
| | | | | | | 6,711,471 | |
| | | | | | | | |
| | |
| | | | Total U.S. Government and Agency Obligations
(Cost $24,157,578) | | | 25,012,429 | |
| | | | | | | | |
|
| | COMMERCIAL MORTGAGE-BACKED SECURITY – 0.54% | |
| | 275,000 | | | Bear Stearns Commercial Mortgage Securities
Series 2007-T28, Class A4
5.742%, 09/11/42 (c) | | | 298,611 | |
| | | | | | | | |
| | |
| | | | Total Commercial Mortgage-Backed Security
(Cost $193,192) | | | 298,611 | |
| | | | | | | | |
| |
| | FOREIGN GOVERNMENT BOND – 0.94% | | | | |
| | 500,000 | | | Costa Rica Government International Bond
Senior Unsecured Notes
7.158%, 03/12/45 (a) | | | 521,250 | |
| | | | | | | | |
| | |
| | | | Total Foreign Government Bond
(Cost $500,000) | | | 521,250 | |
| | | | | | | | |
Shares | | | | | | |
| |
| | INVESTMENT COMPANY – 4.33% | | | | |
| | 2,399,114 | | | BlackRock Liquidity Funds
TempFund Portfolio | | | 2,399,114 | |
| | | | | | | | |
| | |
| | | | Total Investment Company
(Cost $2,399,114) | | | 2,399,114 | |
| | | | | | | | |
| Total Investments – 99.39%
(Cost $52,319,384)* | | | 55,068,831 | |
| | | | | | | | |
| Net Other Assets and Liabilities – 0.61% | | | 336,462 | |
| | | | | | | | |
| Net Assets – 100.00% | | $ | 55,405,293 | |
| | | | | | | | |
| * | | At April 30, 2015, cost is identical for book and Federal income tax purposes. |
| | | | |
Gross unrealized appreciation | | $ | 2,918,353 | |
Gross unrealized depreciation | | | (168,906 | ) |
| | | | |
Net unrealized appreciation | | $ | 2,749,447 | |
| | | | |
| (a) | | Securities exempt from registration under Rule 144A of the Securities Act of 1933, as amended. These securities are purchased in accordance with guidelines approved by the Fund’s Board of Trustees and may only be resold, in transactions exempt from registration, to qualified institutional buyers. At April 30, 2015, these securities amounted to $5,501,269 or 9.93% of net assets. These securities have not been determined by the Subadviser to be illiquid securities. |
| (b) | | Step Coupon. A bond that pays an initial coupon rate for the first period and then a higher coupon rate for the following periods until maturity. The coupon rate shown will be accrual rate until maturity. |
| (c) | | Variable rate bond. The interest rate shown reflects the rate in effect at April 30, 2015. |
| (d) | | S&P credit ratings are used in the absence of a rating by Moody’s Investors, Inc. |
| | | | |
Portfolio Composition | | | | |
U.S. Government and Agency Obligations | | | 45% | |
Commercial Mortgage-Backed Security | | | 1% | |
Foreign Government Bond | | | 1% | |
Investment Company | | | 4% | |
Corporate Notes and Bonds | | | | |
(Moody’s Ratings (d)) | | | | |
Aa | | | 1% | |
A | | | 8% | |
Baa | | | 25% | |
Ba | | | 13% | |
B | | | 2% | |
| | | | |
| | | 100% | |
| | | | |
For financial reporting purposes, credit quality ratings shown are assigned by Moody’s Investors Service. If a Moody’s credit quality rating is not available the credit quality ratings shown are assigned by Standard & Poor’s. These rating agencies are independent, nationally recognized statistical rating organizations and are widely used. Investment grade ratings are credit ratings of Baa/ BBB or higher. Below investment grade ratings are credit ratings of Ba/BB or lower. Investments designated N/R are not rated by either rating agency. Credit quality ratings are subject to change.
See accompanying Notes to Financial Statements.
| | |
| |
| ASTON/Anchor Capital Enhanced Equity Fund | | April 30, 2015 |
| |
| Schedule of Investments (unaudited) | | |
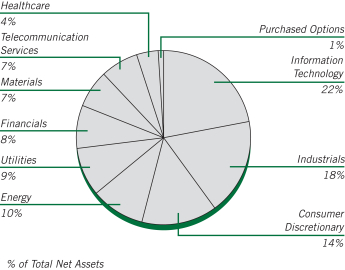
| | | | | | | | |
Shares | | | | | Market
Value | |
|
| | COMMON STOCKS – 99.71% | |
| | |
| | | | Consumer Discretionary – 14.41% | | | | |
| | 115,000 | | | Coach (a) | | $ | 4,394,150 | |
| | 500,000 | | | Ford Motor | | | 7,900,000 | |
| | 225,000 | | | General Motors (a) | | | 7,888,500 | |
| | 600,000 | | | Staples (a) | | | 9,792,000 | |
| | | | | | | | |
| | | | | | | 29,974,650 | |
| | | | | | | | |
| | |
| | | | Energy – 9.50% | | | | |
| | 65,000 | | | Baker Hughes (a) | | | 4,449,900 | |
| | 35,000 | | | Devon Energy (a) | | | 2,387,350 | |
| | 100,000 | | | Halliburton (a) | | | 4,895,000 | |
| | 85,000 | | | Schlumberger (a) | | | 8,041,850 | |
| | | | | | | | |
| | | | | | | 19,774,100 | |
| | | | | | | | |
| | |
| | | | Financials – 8.43% | | | | |
| | 105,000 | | | BB&T (a) | | | 4,020,450 | |
| | 175,000 | | | Hartford Financial Services Group (a) | | | 7,134,750 | |
| | 587,400 | | | Huntington Bancshares (a) | | | 6,379,164 | |
| | | | | | | | |
| | | | | | | 17,534,364 | |
| | | | | | | | |
| | |
| | | | Healthcare – 3.95% | | | | |
| | 115,000 | | | Quest Diagnostics (a) | | | 8,213,300 | |
| | | | | | | | |
| | |
| | | | Industrials – 18.17% | | | | |
| | 177,600 | | | ADT (a) | | | 6,677,760 | |
| | 80,000 | | | Deere (a) | | | 7,241,600 | |
| | 110,000 | | | Emerson Electric (a) | | | 6,471,300 | |
| | 70,000 | | | Fastenal (a) | | | 2,983,400 | |
| | 270,000 | | | General Electric (a) | | | 7,311,600 | |
| | 175,000 | | | Republic Services (a) | | | 7,110,250 | |
| | | | | | | | |
| | | | | | | 37,795,910 | |
| | | | | | | | |
| | |
| | | | Information Technology – 21.93% | | | | |
| | 175,900 | | | Altera (a) | | | 7,331,512 | |
| | 270,000 | | | Cisco Systems (a) | | | 7,784,100 | |
| | 260,000 | | | EMC (a) | | | 6,996,600 | |
| | | | | | | | |
Shares | | | | | Market
Value | |
| |
| | | | Information Technology (continued) | |
| | 280,000 | | | Intel (a) | | $ | 9,114,000 | |
| | 145,000 | | | Paychex (a) | | | 7,016,550 | |
| | 170,000 | | | Xilinx (a) | | | 7,371,200 | |
| | | | | | | | |
| | | | | | | 45,613,962 | |
| | | | | | | | |
| | |
| | | | Materials – 7.10% | | | | |
| | 160,000 | | | Alcoa (a) | | | 2,147,200 | |
| | 75,000 | | | Dow Chemical (a) | | | 3,825,000 | |
| | 85,000 | | | LyondellBasell Industries NV, Class A, (Netherlands) (a) | | | 8,799,200 | |
| | | | | | | | |
| | | | | | | 14,771,400 | |
| | | | | | | | |
| |
| | | | Telecommunication Services – 6.88% | |
| | 170,000 | | | AT&T (a) | | | 5,888,800 | |
| | 115,000 | | | CenturyLink (a) | | | 4,135,400 | |
| | 85,000 | | | Verizon Communications (a) | | | 4,287,400 | |
| | | | | | | | |
| | | | | | | 14,311,600 | |
| | | | | | | | |
| | |
| | | | Utilities – 9.34% | | | | |
| | 200,000 | | | Exelon (a) | | | 6,804,000 | |
| | 200,000 | | | FirstEnergy (a) | | | 7,182,000 | |
| | 160,000 | | | PPL (a) | | | 5,444,800 | |
| | | | | | | | |
| | | | | | | 19,430,800 | |
| | | | | | | | |
| | |
| | | | Total Common Stocks
(Cost $186,966,459) | | | 207,420,086 | |
| | | | | | | | |
Number of
Contracts | | | | | | |
|
| | PURCHASED OPTIONS – 0.27% | |
| | |
| | | | SPDR S&P 500 ETF TRUST | | | | |
| | 600 | | | Strike @ $180 Exp 05/15 | | | 2,400 | |
| | 4,500 | | | Strike @ $182 Exp 05/15 | | | 22,500 | |
| | 3,200 | | | Strike @ $183 Exp 05/15 | | | 16,000 | |
| | 1,800 | | | Strike @ $184 Exp 05/15 | | | 10,800 | |
| | 3,250 | | | Strike @ $185 Exp 05/15 | | | 16,250 | |
| | 6,000 | | | Strike @ $186 Exp 05/15 | | | 36,000 | |
| | 2,650 | | | Strike @ $187 Exp 05/15 | | | 21,200 | |
| | 1,750 | | | Strike @ $188 Exp 05/15 | | | 14,000 | |
| | 1,750 | | | Strike @ $189 Exp 05/15 | | | 15,750 | |
| | 500 | | | Strike @ $186 Exp 06/15 | | | 29,000 | |
| | 500 | | | Strike @ $186 Exp 06/15 | | | 39,000 | |
| | 500 | | | Strike @ $187 Exp 06/15 | | | 31,000 | |
| | 500 | | | Strike @ $187 Exp 06/15 | | | 42,500 | |
| | 500 | | | Strike @ $188 Exp 06/15 | | | 32,500 | |
| | 500 | | | Strike @ $188 Exp 06/15 | | | 49,000 | |
| | 500 | | | Strike @ $189 Exp 06/15 | | | 49,500 | |
| | 500 | | | Strike @ $189 Exp 06/15 | | | 38,000 | |
| | 500 | | | Strike @ $190 Exp 06/15 | | | 38,500 | |
| | 500 | | | Strike @ $190 Exp 06/15 | | | 55,500 | |
| | | | | | | | |
| | |
| | | | Total Purchased Options
(Cost $2,561,004) | | | 559,400 | |
| | | | | | | | |
See accompanying Notes to Financial Statements.
| | |
| |
| ASTON/Anchor Capital Enhanced Equity Fund | | April 30, 2015 |
| |
| Schedule of Investments (unaudited) – continued | | |
| | | | | | | | |
Shares | | | | | Market
Value | |
|
| | INVESTMENT COMPANY – 3.16% | |
| | 6,576,623 | | | BlackRock Liquidity Funds
TempFund Portfolio | | $ | 6,576,623 | |
| | | | | | | | |
| | |
| | | | Total Investment Company
(Cost $6,576,623) | | | 6,576,623 | |
| | | | | | | | |
| Total Investments – 103.14%
(Cost $196,104,086)* | | | 214,556,109 | |
| | | | | | | | |
| Net Other Assets and Liabilities – (3.14)% | | | (6,530,418 | ) |
| | | | | | | | |
| Net Assets – 100.00% | | $ | 208,025,691 | |
| | | | | | | | |
| * | | At April 30, 2015, cost is identical for book and Federal income tax purposes. |
| | | | |
Gross unrealized appreciation | | $ | 23,131,024 | |
Gross unrealized depreciation | | | (4,679,001 | ) |
| | | | |
Net unrealized appreciation | | $ | 18,452,023 | |
| | | | |
| (a) | | Security position is either partially or entirely pledged as collateral for written call options. |
| SPDR | | Standard & Poor’s Depositary Receipt |
Transactions in written call options for the period ended April 30, 2015 were as follows:
| | | | | | | | |
| Contracts | | Number of
Contracts | | | Premium | |
Outstanding, October 31, 2014 | | | 59,168 | | | $ | 5,230,766 | |
Call Options Written | | | 160,087 | | | | 16,778,940 | |
Call Options Closed or Expired | | | (163,235 | ) | | | (16,701,016 | ) |
| | | | | | | | |
Outstanding, April 30, 2015 | | | 56,020 | | | $ | 5,308,690 | |
| | | | | | | | |
Premiums received and value of written call options outstanding as of April 30, 2015.
| | | | | | | | | | | | |
Number of
Contracts | | | Description | | Premium
Received | | | Market
Value | |
| | | |
| | | | ADT | | | | | | | | |
| | 37 | | | Strike @ $38 Exp 7/15 | | | $ 4,216 | | | | $ 6,290 | |
| | 300 | | | Strike @ $40 Exp 1/16 | | | 95,386 | | | | 76,500 | |
| | 1,239 | | | Strike @ $42 Exp 1/16 | | | 310,723 | | | | 216,825 | |
| | 200 | | | Strike @ $45 Exp 1/16 | | | 39,391 | | | | 24,000 | |
| |
| | | | Alcoa | |
| | 300 | | | Strike @ $16 Exp 10/15 | | | 10,200 | | | | 9,000 | |
| | 600 | | | Strike @ $18 Exp 1/16 | | | 12,000 | | | | 12,000 | |
| | 700 | | | Strike @ $19 Exp 1/16 | | | 9,100 | | | | 9,450 | |
| | | |
| | | | Altera | | | | | | | | |
| | 774 | | | Strike @ $39 Exp 9/15 | | | 89,630 | | | | 500,004 | |
| | 935 | | | Strike @ $41 Exp 9/15 | | | 62,644 | | | | 506,770 | |
| | 50 | | | Strike @ $43 Exp 1/16 | | | 20,650 | | | | 26,750 | |
| | | |
| | | | AT&T | | | | | | | | |
| | 200 | | | Strike @ $35 Exp 10/15 | | | 19,280 | | | | 24,400 | |
| | 850 | | | Strike @ $37 Exp 10/15 | | | 41,294 | | | | 51,000 | |
| | 200 | | | Strike @ $38 Exp 10/15 | | | 7,400 | | | | 7,000 | |
| | 250 | | | Strike @ $37 Exp 1/16 | | | 17,490 | | | | 20,750 | |
| | | | | | | | | | | | |
Number of
Contracts | | | Description | | Premium
Received | | | Market
Value | |
| | | |
| | | | Baker Hughes | | | | | | | | |
| | 650 | | | Strike @ $70 Exp 1/16 | | | $ 184,746 | | | | $ 286,000 | |
| | | |
| | | | BB&T | | | | | | | | |
| | 1,000 | | | Strike @ $37 Exp 9/15 | | | 157,958 | | | | 210,000 | |
| | 50 | | | Strike @ $40 Exp 9/15 | | | 2,098 | | | | 3,350 | |
| | | |
| | | | CenturyLink | | | | | | | | |
| | 211 | | | Strike @ $42 Exp 10/15 | | | 10,200 | | | | 3,693 | |
| | 135 | | | Strike @ $40 Exp 1/16 | | | 8,634 | | | | 8,775 | |
| | 804 | | | Strike @ $42 Exp 1/16 | | | 27,303 | | | | 28,140 | |
| |
| | | | Cisco Systems | |
| | 23 | | | Strike @ $27 Exp 7/15 | | | 1,172 | | | | 5,520 | |
| | 1,677 | | | Strike @ $32 Exp 1/16 | | | 122,352 | | | | 130,806 | |
| | 1,000 | | | Strike @ $33 Exp 1/16 | | | 49,449 | | | | 59,000 | |
| |
| | | | Coach | |
| | 50 | | | Strike @ $45 Exp 11/15 | | | 12,048 | | | | 3,750 | |
| | 900 | | | Strike @ $40 Exp 1/16 | | | 362,417 | | | | 207,000 | |
| | 200 | | | Strike @ $42 Exp 1/16 | | | 43,549 | | | | 34,000 | |
| |
| | | | Deere | |
| | 450 | | | Strike @ $95 Exp 1/16 | | | 103,030 | | | | 141,750 | |
| | 350 | | | Strike @ $97.50 Exp 1/16 | | | 57,735 | | | | 83,650 | |
| | | |
| | | | Devon Energy | | | | | | | | |
| | 350 | | | Strike @ $57.50 Exp 7/15 | | | 169,925 | | | | 392,000 | |
| |
| | | | Dow Chemical | |
| | 500 | | | Strike @ $52.50 Exp 9/15 | | | 42,309 | | | | 91,000 | |
| | 250 | | | Strike @ $57.50 Exp 1/16 | | | 22,475 | | | | 29,500 | |
| |
| | | | EMC | |
| | 300 | | | Strike @ $31 Exp 10/15 | | | 8,859 | | | | 8,700 | |
| | 800 | | | Strike @ $33 Exp 10/15 | | | 41,699 | | | | 9,200 | |
| | 1,500 | | | Strike @ $34 Exp 10/15 | | | 55,019 | | | | 9,750 | |
| | | |
| | | | Emerson Electric | | | | | | | | |
| | 450 | | | Strike @ $70 Exp 9/15 | | | 17,376 | | | | 5,625 | |
| | 600 | | | Strike @ $75 Exp 9/15 | | | 9,342 | | | | 3,000 | |
| | 11 | | | Strike @ $67.50 Exp 1/16 | | | 979 | | | | 825 | |
| | | |
| | | | Exelon | | | | | | | | |
| | 759 | | | Strike @ $38 Exp 10/15 | | | 38,946 | | | | 27,324 | |
| | 1,241 | | | Strike @ $38 Exp 1/16 | | | 66,492 | | | | 80,665 | |
| | | |
| | | | Fastenal | | | | | | | | |
| | 150 | | | Strike @ $46 Exp 11/15 | | | 15,060 | | | | 17,250 | |
| | 200 | | | Strike @ $47 Exp 1/16 | | | 17,800 | | | | 26,500 | |
| | 200 | | | Strike @ $48 Exp 1/16 | | | 17,800 | | | | 22,000 | |
| | | |
| | | | FirstEnergy | | | | | | | | |
| | 150 | | | Strike @ $40 Exp 10/15 | | | 7,929 | | | | 6,000 | |
| | 1,700 | | | Strike @ $41 Exp 10/15 | | | 83,170 | | | | 46,750 | |
| | 150 | | | Strike @ $40 Exp 1/16 | | | 9,969 | | | | 10,500 | |
| | | |
| | | | General Electric | | | | | | | | |
| | 350 | | | Strike @ $27 Exp 9/15 | | | 13,586 | | | | 36,400 | |
| | 550 | | | Strike @ $29 Exp 12/15 | | | 41,799 | | | | 33,000 | |
| | 1,800 | | | Strike @ $31 Exp 12/15 | | | 54,395 | | | | 45,000 | |
See accompanying Notes to Financial Statements.
| | |
| |
| ASTON/Anchor Capital Enhanced Equity Fund | | April 30, 2015 |
| |
| Schedule of Investments (unaudited) – continued | | |
| | | | | | | | | | | | |
Number of
Contracts | | | Description | | Premium
Received | | | Market
Value | |
| | | |
| | | | General Motors | | | | | | | | |
| | 800 | | | Strike @ $42 Exp 1/16 | | | $ 139,765 | | | | $ 44,000 | |
| | 1,450 | | | Strike @ $45 Exp 1/16 | | | 152,189 | | | | 43,500 | |
| | | |
| | | | Halliburton | | | | | | | | |
| | 700 | | | Strike @ $55 Exp 1/16 | | | 65,771 | | | | 158,200 | |
| | 300 | | | Strike @ $57.50 Exp 1/16 | | | 24,588 | | | | 48,000 | |
| |
| | | | Hartford Financial Services Group | |
| | 50 | | | Strike @ $42 Exp 9/15 | | | 7,500 | | | | 6,000 | |
| | 1,700 | | | Strike @ $45 Exp 1/16 | | | 273,695 | | | | 166,600 | |
| |
| | | | Huntington Bancshares | |
| | 300 | | | Strike @ $10 Exp 7/15 | | | 17,688 | | | | 29,250 | |
| | 424 | | | Strike @ $11 Exp 10/15 | | | 20,759 | | | | 21,412 | |
| | 5,150 | | | Strike @ $12 Exp 10/15 | | | 159,441 | | | | 95,275 | |
| | | |
| | | | Intel | | | | | | | | |
| | 2,800 | | | Strike @ $37 Exp 1/16 | | | 188,828 | | | | 224,000 | |
| |
| | | | LyondellBasell Industries NV | |
| | 100 | | | Strike @ $95 Exp 9/15 | | | 32,212 | | | | 111,000 | |
| | 750 | | | Strike @ $100 Exp 9/15 | | | 157,093 | | | | 630,000 | |
| |
| | | | Paychex | |
| | 1,250 | | | Strike @ $47 Exp 9/15 | | | 226,266 | | | | 300,000 | |
| | 200 | | | Strike @ $48 Exp 9/15 | | | 25,771 | | | | 36,000 | |
| | | |
| | | | PPL | | | | | | | | |
| | 1,600 | | | Strike @ $37 Exp 10/15 | | | 62,335 | | | | 68,000 | |
| | | |
| | | | Quest Diagnostics | | | | | | | | |
| | 1,150 | | | Strike @ $85 Exp 1/16 | | | 168,879 | | | | 115,000 | |
| | | |
| | | | Republic Services | | | | | | | | |
| | 1,100 | | | Strike @ $43 Exp 10/15 | | | 86,854 | | | | 63,250 | |
| | 650 | | | Strike @ $44 Exp 10/15 | | | 31,823 | | | | 24,375 | |
| | | |
| | | | Schlumberger | | | | | | | | |
| | 850 | | | Strike @ $105 Exp 1/16 | | | 142,968 | | | | 255,000 | |
| |
| | | | Staples | |
| | 2,500 | | | Strike @ $20 Exp 1/16 | | | 239,396 | | | | 168,750 | |
| | 3,000 | | | Strike @ $22 Exp 1/16 | | | 153,557 | | | | 112,500 | |
| | 500 | | | Strike @ $23 Exp 1/16 | | | 13,480 | | | | 14,000 | |
| | | |
| | | | Verizon Communications | | | | | | | | |
| | 850 | | | Strike @ $50 Exp 10/15 | | | 89,364 | | | | 172,550 | |
| | | |
| | | | Xilinx | | | | | | | | |
| | 50 | | | Strike @ $46 Exp 9/15 | | | 3,548 | | | | 7,175 | |
| | 1,650 | | | Strike @ $47 Exp 1/16 | | | 207,896 | | | | 301,125 | |
| | | | | | | | | | | | |
| | | |
| | | | Total Written Call Options | | | $5,308,690 | | | | $6,812,124 | |
| | | | | | | | | | | | |
See accompanying Notes to Financial Statements.
| | |
| |
| ASTON/Lake Partners LASSO Alternatives Fund | | April 30, 2015 |
| |
| Schedule of Investments (unaudited) | | |
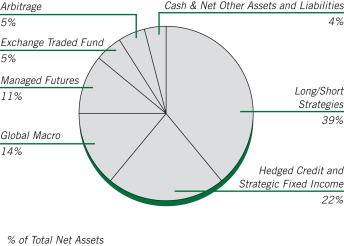
| | | | | | | | |
Shares | | | | | Market
Value | |
| |
| | INVESTMENT COMPANIES – 96.35% | | | | |
| | |
| | | | Long/Short Strategies – 39.49% | | | | |
| | 916,745 | | | Blackrock Global Long/Short Equity Fund-IS | | $ | 11,055,948 | |
| | 889,931 | | | Convergence Core Plus Fund | | | 15,911,968 | |
| | 772,302 | | | Driehaus Emerging Markets Small Cap Growth Fund | | | 11,198,378 | |
| | 702,977 | | | FPA Crescent Fund-I | | | 24,041,798 | |
| | 1,320,127 | | | Gotham Enhanced Return Fund-I | | | 16,329,966 | |
| | 826,331 | | | Robeco Boston Partners Long/Short Equity Fund-IS | | | 16,196,089 | |
| | 1,858,435 | | | The Weitz Funds - Partners III Opportunity Fund | | | 32,057,997 | |
| | | | | | | | |
| | | | | | | 126,792,144 | |
| | | | | | | | |
| |
| | | | Hedged Credit and Strategic Fixed Income – 22.43% | |
| | 1,489,558 | | | Avenue Credit Strategies Fund | | | 16,102,121 | |
| | 3,042,640 | | | Legg Mason BW Alternative Credit
Fund | | | 32,251,982 | |
| | 1,980,809 | | | Metropolitan West Unconstrained Bond Fund | | | 23,650,853 | |
| | | | | | | | |
| | | | | | | 72,004,956 | |
| | | | | | | | |
| | |
| | | | Global Macro – 13.52% | | | | |
| | 1,714,797 | | | John Hancock Funds II - Global Absolute Return Strategies Fund | | | 19,257,165 | |
| | 2,193,854 | | | Western Asset Macro Opportunities Fund | | | 24,132,394 | |
| | | | | | | | |
| | | | | | | 43,389,559 | |
| | | | | | | | |
| | |
| | | | Managed Futures – 11.39% | | | | |
| | 1,692,651 | | | Abbey Capital Futures Strategy
Fund-I | | | 20,785,760 | |
| | 1,374,264 | | | ASG Managed Futures Strategy
Fund-Y | | | 15,790,294 | |
| | | | | | | | |
| | | | | | | 36,576,054 | |
| | | | | | | | |
| | | | | | | | |
Shares | | | | | Market
Value | |
| | |
| | | | Arbitrage – 5.00% | | | | |
| | 1,236,763 | | | Calamos Market Neutral Income Fund | | $ | 16,053,184 | |
| | | | | | | | |
| | |
| | | | Money Market – 4.52% | | | | |
| | 14,507,174 | | | BlackRock Liquidity Funds Treasury Trust Fund Portfolio | | | 14,507,174 | |
| | | | | | | | |
| | |
| | | | Total Investment Companies (Cost $298,268,934) | | | 309,323,071 | |
| | | | | | | | |
| |
| | EXCHANGE TRADED FUNDS – 4.96% | | | | |
| | |
| | 158,100 | | | Proshares Large Cap Core Plus | | | 15,939,642 | |
| | | | | | | | |
| | |
| | | | Total Exchange Traded Funds (Cost $16,083,518) | | | 15,939,642 | |
| | | | | | | | |
| Total Investments – 101.31%
(Cost $314,352,452)* | | | 325,262,713 | |
| | | | | | | | |
| Net Other Assets and Liabilities – (1.31)% | | | (4,209,672 | ) |
| | | | | | | | |
| Net Assets – 100.00% | | $ | 321,053,041 | |
| | | | | | | | |
| * | | At April 30, 2015, cost is identical for book and Federal income tax purposes. |
| | | | |
Gross unrealized appreciation | | $ | 14,902,708 | |
Gross unrealized depreciation | | | (3,992,447 | ) |
| | | | |
Net unrealized appreciation | | $ | 10,910,261 | |
| | | | |
See accompanying Notes to Financial Statements.
| | |
| |
| ASTON/River Road Long-Short Fund | | April 30, 2015 |
| |
| Schedule of Investments (unaudited) | | |
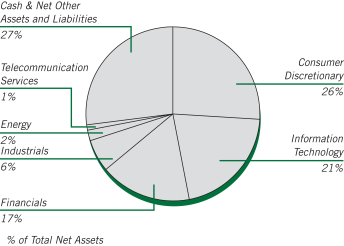
The chart represents total investments in the Fund. Consumer Staples, Healthcare, Utilities, Exchange Traded Funds and Materials are negative 0.29%, 0.48%, 0.50% 0.75% and 3.37%, respectively, and cannot be represented in the pie chart format.
| | | | | | | | |
Shares | | | | | Market
Value | |
|
| | COMMON STOCKS – 96.10% | |
| | |
| | | | Consumer Discretionary – 34.70% | | | | |
| | 10,245 | | | Biglari Holdings (a) * | | $ | 3,744,650 | |
| | 91,974 | | | Comcast, Class A (a) | | | 5,312,418 | |
| | 116,643 | | | Discovery Communications, Class C (a) * | | | 3,526,118 | |
| | 144,914 | | | General Motors (a) | | | 5,080,685 | |
| | 99,149 | | | International Speedway, Class A (a) | | | 3,605,058 | |
| | 67,219 | | | Liberty Broadband, Class C * | | | 3,647,303 | |
| | 183,837 | | | Liberty Media, Class C (a) * | | | 6,976,614 | |
| | 131,669 | | | Liberty Ventures, Class A (a) * | | | 5,487,964 | |
| | 15,202 | | | Panera Bread, Class A * | | | 2,774,061 | |
| | 181,436 | | | Quebecor, Class B (Canada) | | | 4,989,678 | |
| | 108,339 | | | Restaurant Brands International (Canada) | | | 4,418,064 | |
| | 66,744 | | | Sotheby’s (a) | | | 2,850,636 | |
| | 65,760 | | | Time Warner (a) | | | 5,550,802 | |
| | 171,624 | | | Twenty-First Century Fox, Class A | | | 5,848,946 | |
| | | | | | | | |
| | | | | | | 63,812,997 | |
| | | | | | | | |
| |
| | | | Consumer Staples – 1.60% | |
| | 37,842 | | | Nestle, SP ADR (a) | | | 2,937,296 | |
| | | | | | | | |
| |
| | | | Energy – 1.61% | |
| | 37,066 | | | Occidental Petroleum (a) | | | 2,968,987 | |
| | | | | | | | |
| |
| | | | Financials – 19.78% | |
| | 69,137 | | | American Express | | | 5,354,661 | |
| | 243,782 | | | Bank of America | | | 3,883,447 | |
| | | | | | |
Shares | | | | Market
Value | |
| | |
| | Financials (continued) | | | | |
| 158,863 | | Blackhawk Network Holdings, Class B * | | $ | 5,831,861 | |
| 252,580 | | FNFV Group (a) * | | | 3,776,071 | |
| 114,389 | | Loews (a) | | | 4,763,158 | |
| 134,286 | | Oaktree Capital Group, MLP (a) | | | 7,181,615 | |
| 177,276 | | Weyerhaeuser, REIT (a) | | | 5,585,967 | |
| | | | | | |
| | | | | 36,376,780 | |
| | | | | | |
| |
| | Industrials – 12.44% | |
| 104,884 | | ADT (a) | | | 3,943,638 | |
| 29,752 | | Parker-Hannifin | | | 3,551,199 | |
| 21,219 | | Precision Castparts | | | 4,385,755 | |
| 63,848 | | Rolls-Royce Holdings, SP ADR | | | 5,102,094 | |
| 23,744 | | WW Grainger | | | 5,898,722 | |
| | | | | | |
| | | | | 22,881,408 | |
| | | | | | |
| |
| | Information Technology – 23.32% | |
| 41,092 | | Apple | | | 5,142,664 | |
| 94,747 | | eBay (a) * | | | 5,519,960 | |
| 9,286 | | Google, Class A * | | | 5,095,878 | |
| 51,083 | | IAC/InterActiveCorp (a) | | | 3,566,615 | |
| 115,675 | | Microsoft (a) | | | 5,626,432 | |
| 92,070 | | Motorola Solutions (a) | | | 5,501,182 | |
| 155,924 | | Oracle (a) | | | 6,801,405 | |
| 82,675 | | QUALCOMM | | | 5,621,900 | |
| | | | | | |
| | | | | 42,876,036 | |
| | | | | | |
| |
| | Telecommunication Services – 2.65% | |
| 156,104 | | SoftBank, ADR (a) | | | 4,864,201 | |
| | | | | | |
| | |
| | Total Common Stocks
(Cost $168,033,716) | | | 176,717,705 | |
| | | | | | |
|
| INVESTMENT COMPANY – 17.32% | |
| | |
| 31,847,045 | | BlackRock Liquidity Funds
TempFund Portfolio | | | 31,847,045 | |
| | | | | | |
| | |
| | Total Investment Company
(Cost $31,847,045) | | | 31,847,045 | |
| | | | | | |
Total Investments – 113.42%
(Cost $199,880,761)** | | | 208,564,750 | |
| | | | | | |
$32,054,567 in cash and $62,693,210 in securities was segregated or on deposit with a prime broker to cover short sales as of April 30, 2015 and are included in “Net Other Assets and Liabilities”. | |
|
| SHORT SALES – (29.27)% (b) | |
|
| Common Stock – (28.52)% | |
| |
| | Consumer Discretionary – (8.44)% | |
| (18,896) | | Cabela’s * | | | (996,575 | ) |
| (78,927) | | Callaway Golf | | | (764,013 | ) |
| (65,104) | | ClubCorp Holdings | | | (1,425,127 | ) |
| (25,996) | | Five Below * | | | (876,585 | ) |
| (79,756) | | Goodyear Tire & Rubber | | | (2,262,279 | ) |
| (32,290) | | Men’s Wearhouse | | | (1,827,291 | ) |
See accompanying Notes to Financial Statements.
| | |
| |
| ASTON/River Road Long-Short Fund | | April 30, 2015 |
| |
| Schedule of Investments (unaudited) – continued | | |
| | | | | | | | |
Shares | | | | | Market
Value | |
| | |
| | | | Consumer Discretionary (continued) | | | | |
| | (110,861) | | | Regis * | | $ | (1,831,424 | ) |
| | (309,286) | | | Ruby Tuesday * | | | (2,251,602 | ) |
| | (7,938) | | | TESLA Motors * | | | (1,794,385 | ) |
| | (65,429) | | | Time | | | (1,493,744 | ) |
| | | | | | | | |
| | | | | | | (15,523,025 | ) |
| | | | | | | | |
| |
| | | | Consumer Staples – (1.89)% | |
| | (125,899) | | | Dean Foods | | | (2,045,859 | ) |
| | (35,989) | | | Tyson Foods, Class A | | | (1,421,566 | ) |
| | | | | | | | |
| | | | | | | (3,467,425 | ) |
| | | | | | | | |
| |
| | | | Financials – (3.11)% | |
| | (20,047) | | | Camden Property Trust, REIT | | | (1,505,129 | ) |
| | (35,763) | | | Mercury General | | | (1,964,819 | ) |
| | (13,476) | | | Pennsylvania Real Estate Investment Trust, REIT | | | (304,692 | ) |
| | (45,880) | | | Plum Creek Timber, REIT | | | (1,936,136 | ) |
| | | | | | | | |
| | | | | | | (5,710,776 | ) |
| | | | | | | | |
| |
| | | | Healthcare – (0.48)% | |
| | (7,678) | | | Chemed | | | (884,890 | ) |
| | | | | | | | |
| |
| | | | Industrials – (6.41)% | |
| | (189,313) | | | ACCO Brands * | | | (1,489,893 | ) |
| | (30,201) | | | Healthcare Services Group | | | (914,184 | ) |
| | (22,325) | | | Mobile Mini | | | (860,405 | ) |
| | (42,505) | | | Pitney Bowes | | | (950,837 | ) |
| | (97,058) | | | Quad Graphics | | | (2,090,629 | ) |
| | (94,877) | | | RR Donnelley & Sons | | | (1,766,610 | ) |
| | (49,005) | | | Swift Transportation * | | | (1,185,921 | ) |
| | (23,885) | | | TAL International Group | | | (920,528 | ) |
| | (59,584) | | | Tetra Tech | | | (1,615,322 | ) |
| | | | | | | | |
| | | | | | | (11,794,329 | ) |
| | | | | | | | |
| |
| | | | Information Technology – (2.31)% | |
| | (37,260) | | | CANON, SP ADR | | | (1,326,456 | ) |
| | (37,054) | | | Dealertrack Technologies * | | | (1,456,593 | ) |
| | (13,552) | | | LogMein * | | | (869,767 | ) |
| | (16,025) | | | Stratasys * | | | (600,136 | ) |
| | | | | | | | |
| | | | | | | (4,252,952 | ) |
| | | | | | | | |
| |
| | | | Materials – (3.37)% | |
| | (129,675) | | | ArcelorMittal, NY Reg | | | (1,386,226 | ) |
| | (16,987) | | | Balchem | | | (890,459 | ) |
| | (57,420) | | | Louisiana-Pacific * | | | (875,081 | ) |
| | (34,502) | | | Southern Copper | | | (1,124,075 | ) |
| | (126,602) | | | Teck Resources, Class B (Canada) | | | (1,921,818 | ) |
| | | | | | | | |
| | | | | | | (6,197,659 | ) |
| | | | | | | | |
| |
| | | | Telecommunication Services – (2.01)% | |
| | (63,907) | | | CenturyLink | | | (2,298,096 | ) |
| | (40,210) | | | Cogent Communications Holdings | | | (1,406,948 | ) |
| | | | | | | | |
| | | | | | | (3,705,044 | ) |
| | | | | | | | |
| | | | | | | | |
Shares | | | | | Market
Value | |
| | |
| | | | Utilities – (0.50)% | | | | |
| | (17,360) | | | South Jersey Industries | | $ | (915,740 | ) |
| | | | | | | | |
| | | | Total Common Stock
(Proceeds $51,345,113) | | | (52,451,840 | ) |
| | | | | | | | |
|
| | Exchange Traded Funds – (0.75)% | |
| | |
| | (66,729) | | | United States Natural Gas Fund LP * | | | (898,172 | ) |
| | (23,362) | | | United States Oil Fund LP * | | | (479,155 | ) |
| | | | | | | | |
| | |
| | | | Total Exchange Traded Funds
(Proceeds $2,016,885) | | | (1,377,327 | ) |
| | | | | | | | |
| Total Short Sales – (29.27)%
(Proceeds $53,361,998) | | | (53,829,167 | ) |
| | | | | | | | |
| Net Other Assets and Liabilities – 15.85% | | | 29,151,265 | |
| | | | | | | | |
| Net Assets – 100.00% | | $ | 183,886,848 | |
| | | | | | | | |
| * | | Non-income producing security. |
| ** | | At April 30, 2015, cost is identical for book and Federal income tax purposes. |
| | | | |
Gross unrealized appreciation | | $ | 10,426,894 | |
Gross unrealized depreciation | | | (1,742,905 | ) |
| | | | |
Net unrealized appreciation | | $ | 8,683,989 | |
| | | | |
| (a) | | Security position is either entirely or partially held in a segregated account as collateral for securities sold short. |
| (b) | | The Fund is contractually responsible to the lender for any dividends payable and interest accrued on securities while those securities are in a short position. These dividends and interest are recorded as an expense of the Fund. |
| ADR | | American Depositary Receipt |
| MLP | | Master Limited Partnership |
| REIT | | Real Estate Investment Trust |
| SP ADR | | Sponsored American Depositary Receipt |
See accompanying Notes to Financial Statements.
| | |
| |
| ASTON/Barings International Fund | | April 30, 2015 |
| |
| Schedule of Investments (unaudited) | | |
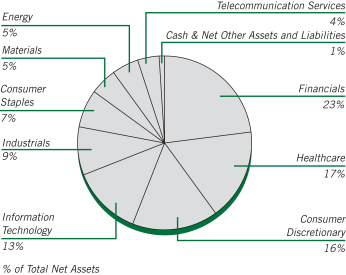
| | | | | | | | |
Shares | | | | | Market
Value | |
|
| | COMMON STOCKS – 98.54% | |
| | |
| | | | Australia – 1.83% | | | | |
| | 21,239 | | | Amcor (a) | | $ | 226,113 | |
| | 2,310 | | | CSL (a) | | | 165,589 | |
| | | | | | | | |
| | | | | | | 391,702 | |
| | | | | | | | |
| | |
| | | | Bermuda – 1.17% | | | | |
| | 173,000 | | | Pax Global Technology (a) * | | | 251,334 | |
| | | | | | | | |
| | |
| | | | France – 8.27% | | | | |
| | 7,390 | | | Accor (a) | | | 405,230 | |
| | 2,325 | | | Air Liquide (a) | | | 304,065 | |
| | 11,786 | | | AXA (a) | | | 298,019 | |
| | 3,487 | | | BNP Paribas (a) | | | 220,209 | |
| | 8,152 | | | SES (a) | | | 285,697 | |
| | 4,736 | | | Total (a) | | | 256,454 | |
| | | | | | | | |
| | | | | | | 1,769,674 | |
| | | | | | | | |
| | |
| | | | Germany – 10.97% | | | | |
| | 2,647 | | | Bayer (a) | | | 380,990 | |
| | 3,281 | | | Daimler (a) | | | 315,458 | |
| | 4,200 | | | Deutsche Boerse (a) | | | 348,029 | |
| | 6,688 | | | Fresenius (a) | | | 397,889 | |
| | 4,130 | | | SAP (a) | | | 312,084 | |
| | 18,643 | | | TUI (a) | | | 347,628 | |
| | 5,595 | | | Wirecard (a) | | | 245,728 | |
| | | | | | | | |
| | | | | | | 2,347,806 | |
| | | | | | | | |
| | |
| | | | Hong Kong – 2.58% | | | | |
| | 45,800 | | | AIA Group (a) | | | 304,592 | |
| | 24,800 | | | HSBC Holdings (a) | | | 246,856 | |
| | | | | | | | |
| | | | | | | 551,448 | |
| | | | | | | | |
| | |
| | | | India – 1.52% | | | | |
| | 10,495 | | | Infosys, SP ADR | | | 325,135 | |
| | | | | | | | |
| | | | | | | | |
Shares | | | | | Market
Value | |
| | |
| | | | Japan – 27.07% | | | | |
| | 22,100 | | | Astellas Pharma (a) | | $ | 344,112 | |
| | 3,800 | | | Bridgestone (a) | | | 159,158 | |
| | 5,600 | | | Daikin Industries (a) | | | 377,267 | |
| | 4,900 | | | Denso (a) | | | 243,264 | |
| | 38,000 | | | Hitachi (a) | | | 259,270 | |
| | 20,000 | | | Hitachi Metals (a) | | | 312,785 | |
| | 19,800 | | | Isuzu Motors (a) | | | 262,426 | |
| | 9,400 | | | Japan Tobacco (a) | | | 328,256 | |
| | 14,400 | | | KDDI (a) | | | 340,738 | |
| | 21,000 | | | Kubota (a) | | | 328,671 | |
| | 27,000 | | | Mitsubishi Electric (a) | | | 352,612 | |
| | 61,300 | | | Mitsubishi UFJ Financial Group (a) | | | 435,497 | |
| | 11,000 | | | Mitsui Fudosan (a) | | | 326,087 | |
| | 11,200 | | | Sony (a) * | | | 338,596 | |
| | 77,000 | | | Sumitomo Mitsui Trust Holdings (a) | | | 338,949 | |
| | 7,300 | | | Takeda Pharmaceutical (a) | | | 374,790 | |
| | 8,800 | | | Tokio Marine Holdings (a) | | | 358,738 | |
| | 4,500 | | | Toyota Motor (a) | | | 313,241 | |
| | | | | | | | |
| | | | | | | 5,794,457 | |
| | | | | | | | |
| | |
| | | | Netherlands – 7.09% | | | | |
| | 3,777 | | | Airbus Group NV (a) | | | 261,755 | |
| | 4,493 | | | ASML Holding NV (a) | | | 483,506 | |
| | 13,341 | | | Koninklijke Ahold NV (a) | | | 258,469 | |
| | 8,819 | | | Koninklijke Philips (a) | | | 252,615 | |
| | 8,266 | | | Royal Dutch Shell, Class A (a) | | | 262,092 | |
| | | | | | | | |
| | | | | | | 1,518,437 | |
| | | | | | | | |
| | |
| | | | Papua New Guinea – 0.84% | | | | |
| | 28,194 | | | Oil Search (a) | | | 178,992 | |
| | | | | | | | |
| | |
| | | | Singapore – 1.23% | | | | |
| | 16,500 | | | DBS Group Holdings (a) | | | 262,191 | |
| | | | | | | | |
| | |
| | | | Sweden – 1.51% | | | | |
| | 5,571 | | | Assa Abloy AB, Class B (a) | | | 323,195 | |
| | | | | | | | |
| | |
| | | | Switzerland – 9.01% | | | | |
| | 3,429 | | | Actelion (a) | | | 451,191 | |
| | 4,521 | | | Julius Baer Group (a) | | | 236,633 | |
| | 3,255 | | | Novartis AG (a) | | | 332,245 | |
| | 929 | | | Syngenta (a) | | | 310,871 | |
| | 18,643 | | | UBS (a) | | | 372,437 | |
| | 727 | | | Zurich Financial Services (a) | | | 224,391 | |
| | | | | | | | |
| | | | | | | 1,927,768 | |
| | | | | | | | |
| | |
| | | | Taiwan – 1.64% | | | | |
| | 14,400 | | | Taiwan Semiconductor Manufacturing, SP ADR | | | 351,936 | |
| | | | | | | | |
| | |
| | | | United Kingdom – 23.81% | | | | |
| | 14,197 | | | Admiral Group (a) | | | 338,535 | |
| | 27,605 | | | ARM Holdings (a) | | | 469,044 | |
| | 4,865 | | | AstraZeneca (a) | | | 333,866 | |
| | 58,747 | | | Barclays (a) | | | 229,843 | |
| | 25,537 | | | BG Group (a) | | | 462,563 | |
| | 5,587 | | | British American Tobacco PLC (a) | | | 306,968 | |
See accompanying Notes to Financial Statements.
| | |
| |
| ASTON/Barings International Fund | | April 30, 2015 |
| |
| Schedule of Investments (unaudited) – continued | | |
| | | | | | | | |
Shares | | | | | Market
Value | |
| | |
| | | | United Kingdom (continued) | | | | |
| | 62,234 | | | BT Group (a) | | $ | 434,054 | |
| | 47,920 | | | GKN (a) | | | 257,022 | |
| | 79,018 | | | Indivior * | | | 241,977 | |
| | 15,823 | | | Prudential (a) | | | 393,951 | |
| | 3,442 | | | Reckitt Benckiser Group (a) | | | 306,351 | |
| | 7,239 | | | SABMiller (a) | | | 383,179 | |
| | 6,310 | | | Shire (a) | | | 512,770 | |
| | 18,242 | | | WPP (a) | | | 425,428 | |
| | | | | | | | |
| | | | | | | 5,095,551 | |
| | | | | | | | |
| | |
| | | | Total Common Stocks
(Cost $18,647,658) | | | 21,089,626 | |
| | | | | | | | |
|
| | INVESTMENT COMPANY – 0.77% | |
| | |
| | 163,588 | | | BlackRock Liquidity Funds
TempFund Portfolio | | | 163,588 | |
| | | | | | | | |
| | |
| | | | Total Investment Company
(Cost $163,588) | | | 163,588 | |
| | | | | | | | |
| Total Investments – 99.31%
(Cost $18,811,246)** | | | 21,253,214 | |
| | | | | | | | |
| Net Other Assets and Liabilities – 0.69% | | | 148,625 | |
| | | | | | | | |
| Net Assets – 100.00% | | $ | 21,401,839 | |
| | | | | | | | |
| * | | Non-income producing security. |
| ** | | At April 30, 2015, cost is identical for book and Federal income tax purposes |
| | | | |
Gross unrealized appreciation | | $ | 2,750,940 | |
Gross unrealized depreciation | | | (308,972 | ) |
| | | | |
Net unrealized appreciation | | $ | 2,441,968 | |
| | | | |
| (a) | | Securities with a total aggregate market value of $20,170,578 or 94.25% of the net assets, were valued under the fair value procedures established by the Funds’ Board of Trustees. |
| SP ADR | | Sponsored American Depository Receipt |
See accompanying Notes to Financial Statements.
| | |
| |
| ASTON/Guardian Capital Global Dividend Fund | | April 30, 2015 |
| |
| Schedule of Investments (unaudited) | | |
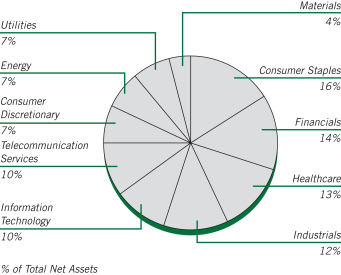
| | | | | | | | |
Shares | | | | | Market
Value | |
|
| | COMMON STOCKS – 99.48% | |
| | |
| | | | Australia – 4.61% | | | | |
| | 2,300 | | | Australia & New Zealand Banking Group (a) | | $ | 61,543 | |
| | 300 | | | Commonwealth Bank of Australia (a) | | | 20,999 | |
| | 1,100 | | | Sonic Healthcare (a) | | | 17,239 | |
| | 5,200 | | | Sydney Airport (a) | | | 22,090 | |
| | 10,100 | | | Telstra (a) | | | 49,649 | |
| | 1,200 | | | Westpac Banking (a) | | | 34,477 | |
| | | | | | | | |
| | | | | | | 205,997 | |
| | | | | | | | |
| | |
| | | | Belgium – 3.52% | | | | |
| | 660 | | | Anheuser-Busch InBev, SP ADR | | | 79,226 | |
| | 2,100 | | | Belgacom (a) | | | 78,214 | |
| | | | | | | | |
| | | | | | | 157,440 | |
| | | | | | | | |
| | |
| | | | Canada – 2.68% | | | | |
| | 350 | | | DH Corp | | | 12,265 | |
| | 1,220 | | | Keyera | | | 42,945 | |
| | 690 | | | Pembina Pipeline | | | 24,014 | |
| | 610 | | | Royal Bank of Canada | | | 40,503 | |
| | | | | | | | |
| | | | | | | 119,727 | |
| | | | | | | | |
| | |
| | | | France – 3.24% | | | | |
| | 2,600 | | | AXA (a) | | | 65,743 | |
| | 1,400 | | | Electricite de France (a) | | | 35,623 | |
| | 800 | | | Total (a) | | | 43,320 | |
| | | | | | | | |
| | | | | | | 144,686 | |
| | | | | | | | |
| | |
| | | | Germany – 5.57% | | | | |
| | 500 | | | BASF (a) | | | 49,674 | |
| | 300 | | | Bayer (a) | | | 43,180 | |
| | 200 | | | Daimler (a) | | | 19,229 | |
| | 2,500 | | | Deutsche Telekom (a) | | | 45,952 | |
| | 100 | | | Muenchener Rueckversicherungs-Gesellschaft (a) | | | 19,520 | |
| | | | | | | | |
Shares | | | | | Market
Value | |
| | |
| | | | Germany (continued) | | | | |
| | 1,400 | | | ProSiebenSat.1 Media (a) | | $ | 71,578 | |
| | | | | | | | |
| | | | | | | 249,133 | |
| | | | | | | | |
| | |
| | | | Ireland – 2.86% | | | | |
| | 730 | | | Medtronic | | | 54,349 | |
| | 1,250 | | | Seagate Technology (Ireland) | | | 73,400 | |
| | | | | | | | |
| | | | | | | 127,749 | |
| | | | | | | | |
| | |
| | | | Israel – 1.01% | | | | |
| | 750 | | | Teva Pharmaceutical, SP ADR | | | 45,315 | |
| | | | | | | | |
| | |
| | | | Italy – 0.51% | | | | |
| | 1,200 | | | Eni (a) | | | 23,023 | |
| | | | | | | | |
| | |
| | | | Netherlands – 1.35% | | | | |
| | 1,390 | | | Unilever | | | 60,437 | |
| | | | | | | | |
| | |
| | | | Spain – 2.72% | | | | |
| | 5,367 | | | Ferrovial (a) | | | 121,713 | |
| | | | | | | | |
| | |
| | | | Sweden – 1.55% | | | | |
| | 4,200 | | | Skandinaviska Enskilda Banken AB (a) | | | 53,074 | |
| | 700 | | | Swedbank AB, Class A (a) | | | 16,277 | |
| | | | | | | | |
| | | | | | | 69,351 | |
| | | | | | | | |
| | |
| | | | Switzerland – 6.97% | | | | |
| | 495 | | | Garmin | | | 22,369 | |
| | 1,000 | | | Nestle (a) | | | 77,584 | |
| | 910 | | | Novartis, ADR | | | 92,638 | |
| | 200 | | | Swisscom (a) | | | 118,901 | |
| | | | | | | | |
| | | | | | | 311,492 | |
| | | | | | | | |
| | |
| | | | United Kingdom – 10.95% | | | | |
| | 600 | | | AstraZeneca (a) | | | 41,176 | |
| | 5,491 | | | BAE Systems (a) | | | 42,540 | |
| | 258 | | | BP, SP ADR | | | 11,135 | |
| | 540 | | | British American Tobacco, SP ADR | | | 59,459 | |
| | 660 | | | GlaxoSmithKline, SP ADR | | | 30,459 | |
| | 1,500 | | | Imperial Tobacco Group PLC (a) | | | 73,245 | |
| | 5,500 | | | Legal & General Group (a) | | | 21,863 | |
| | 5,000 | | | National Grid (a) | | | 67,266 | |
| | 920 | | | Prudential, ADR | | | 45,917 | |
| | 500 | | | Royal Dutch Shell, Class A (a) | | | 15,765 | |
| | 3,400 | | | SSE (a) | | | 80,558 | |
| | | | | | | | |
| | | | | | | 489,383 | |
| | | | | | | | |
| | |
| | | | United States – 51.94% | | | | |
| | 1,090 | | | AbbVie | | | 70,480 | |
| | 440 | | | Air Products & Chemicals | | | 63,109 | |
| | 1,500 | | | Altria Group | | | 75,075 | |
| | 740 | | | Ameren | | | 30,296 | |
| | 1,054 | | | Apple | | | 131,908 | |
| | 2,566 | | | AT&T | | | 88,886 | |
| | 860 | | | Automatic Data Processing | | | 72,705 | |
| | 1,900 | | | BioMed Realty Trust | | | 39,425 | |
| | 211 | | | Chevron | | | 23,434 | |
| | 430 | | | ConocoPhillips | | | 29,206 | |
| | 1,400 | | | CSX | | | 50,526 | |
See accompanying Notes to Financial Statements.
| | |
| |
| ASTON/Guardian Capital Global Dividend Fund | | April 30, 2015 |
| |
| Schedule of Investments (unaudited) – continued | | |
| | | | | | | | |
Shares | | | | | Market
Value | |
| | |
| | | | United States (continued) | | | | |
| | 1,390 | | | Dow Chemical | | $ | 70,890 | |
| | 490 | | | Dr Pepper Snapple Group | | | 36,544 | |
| | 770 | | | Duke Energy | | | 59,729 | |
| | 340 | | | Emerson Electric | | | 20,002 | |
| | 270 | | | Entergy | | | 20,839 | |
| | 390 | | | Exxon Mobil | | | 34,074 | |
| | 560 | | | General Dynamics | | | 76,899 | |
| | 220 | | | Genuine Parts | | | 19,767 | |
| | 1,460 | | | Hospitality Properties Trust, REIT | | | 43,917 | |
| | 850 | | | Illinois Tool Works | | | 79,543 | |
| | 760 | | | Intel | | | 24,738 | |
| | 1,030 | | | Johnson & Johnson | | | 102,176 | |
| | 700 | | | JPMorgan Chase | | | 44,282 | |
| | 270 | | | Kimberly-Clark | | | 29,616 | |
| | 764 | | | Kinder Morgan | | | 32,814 | |
| | 360 | | | Lockheed Martin | | | 67,176 | |
| | 1,330 | | | Lorillard | | | 92,914 | |
| | 330 | | | Macy’s | | | 21,328 | |
| | 220 | | | McDonald’s | | | 21,241 | |
| | 740 | | | Merck | | | 44,075 | |
| | 1,250 | | | Microsoft | | | 60,800 | |
| | 540 | | | Newell Rubbermaid | | | 20,590 | |
| | 290 | | | Omnicom Group | | | 21,971 | |
| | 1,080 | | | Pfizer | | | 36,644 | |
| | 380 | | | Philip Morris International | | | 31,719 | |
| | 370 | | | Procter & Gamble | | | 29,419 | |
| | 396 | | | Republic Services | | | 16,089 | |
| | 700 | | | Reynolds American | | | 51,310 | |
| | 1,380 | | | Six Flags Entertainment | | | 64,888 | |
| | 3,490 | | | Spirit Realty Capital, REIT | | | 39,402 | |
| | 1,570 | | | Texas Instruments | | | 85,110 | |
| | 1,355 | | | Verizon Communications | | | 68,346 | |
| | 480 | | | VF | | | 34,766 | |
| | 740 | | | Waste Management | | | 36,652 | |
| | 1,540 | | | Wells Fargo | | | 84,854 | |
| | 427 | | | Williams | | | 21,858 | |
| | | | | | | | |
| | | | | | | 2,322,032 | |
| | | | | | | | |
| | |
| | | | Total Common Stocks
(Cost $4,136,591) | | | 4,447,478 | |
| | | | | | | | |
| | | | | | | | |
Shares | | | | | Market
Value | |
|
| INVESTMENT COMPANY – 0.49%
|
|
| | |
| | 21,815 | | | BlackRock Liquidity Funds
TempFund Portfolio | | $ | 21,815 | |
| | | | | | | | |
| | |
| | | | Total Investment Company
(Cost $21,815) | | | 21,815 | |
| | | | | | | | |
| Total Investments – 99.97%
(Cost $4,158,406)* | | | 4,469,293 | |
| | | | | | | | |
| Net Other Assets and Liabilities – 0.03% | | | 1,436 | |
| | | | | | | | |
| Net Assets – 100.00% | | $ | 4,470,729 | |
| | | | | | | | |
| * | | At April 30, 2015, cost is identical for book and Federal income tax purposes. |
| | | | |
Gross unrealized appreciation | | $ | 553,296 | |
Gross unrealized depreciation | | | (242,409 | ) |
| | | | |
Net unrealized appreciation | | $ | 310,887 | |
| | | | |
| (a) | | Securities with a total aggregate market value of $1,431,015 or 32.01% of the net assets, were valued under the fair value procedures established by the Funds’ Board of Trustees. |
| ADR | | American Depositary Receipt |
| REIT | | Real Estate Investment Trust |
| SP ADR | | Sponsored American Depositary Receipt |
See accompanying Notes to Financial Statements.
| | |
| |
| ASTON/LMCG Emerging Markets Fund | | April 30, 2015 |
| |
| Schedule of Investments (unaudited) | | |
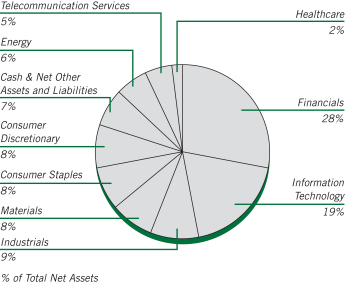
| | | | | | | | |
Shares | | | | | Market
Value | |
|
| | COMMON STOCKS – 93.42% | |
| | |
| | | | Brazil – 9.64% | | | | |
| | 5,700 | | | AMBEV SA | | $ | 35,869 | |
| | 4,680 | | | Banco Bradesco | | | 49,985 | |
| | 3,400 | | | Banco do Brasil SA | | | 29,554 | |
| | 4,000 | | | Braskem, Preference A | | | 16,529 | |
| | 507 | | | Cia Brasileira de Distribuicao Grupo Pao de Acucar, SP ADR | | | 17,005 | |
| | 900 | | | Cia Energetica de Sao Paulo, Preference B | | | 5,580 | |
| | 3,300 | | | Embraer SA | | | 25,761 | |
| | 4,500 | | | Itau Unibanco Holding | | | 57,636 | |
| | 9,600 | | | JBS | | | 48,941 | |
| | 5,100 | | | Metalurgica Gerdau SA, Preference | | | 16,571 | |
| | 2,200 | | | Porto Seguro SA | | | 27,155 | |
| | 8,200 | | | Suzano Papel e Celulose, Preference A | | | 41,069 | |
| | 3,076 | | | Vale, SP ADR | | | 18,609 | |
| | | | | | | | |
| | | | | | | 390,264 | |
| | | | | | | | |
| | |
| | | | China – 18.68% | | | | |
| | 64,000 | | | Agricultural Bank of China, Class H (a) | | | 36,031 | |
| | 26,000 | | | Air China, Class H (a) | | | 31,359 | |
| | 143,000 | | | Bank of China, Class H (a) | | | 97,984 | |
| | 50,000 | | | China CITIC Bank, Class H (a) | | | 45,343 | |
| | 51,000 | | | China Construction Bank, Class H (a) | | | 49,507 | |
| | 28,000 | | | China National Building Material,
Class H (a) | | | 33,962 | |
| | 44,000 | | | China Railway Group (a) | | | 61,748 | |
| | 12,500 | | | China Shenhua Energy, Class H (a) | | | 32,463 | |
| | 64,000 | | | Chongqing Rural Commerical Bank, Class H (a) | | | 57,089 | |
| | 68,000 | | | Evergrande Real Estate, Class H (a) | | | 64,300 | |
| | 5,000 | | | Great Wall Motor, Class H (a) | | | 37,938 | |
| | 114,000 | | | Industrial and Commercial Bank of China, Class H (a) | | | 98,891 | |
| | 3,900 | | | Tencent Holdings (a) | | | 80,492 | |
| | | | | | | | |
Shares | | | | | Market
Value | |
| | |
| | | | China (continued) | | | | |
| | 18,000 | | | Zhejiang Expressway, Class H (a) | | $ | 28,586 | |
| | | | | | | | |
| | | | | | | 755,693 | |
| | | | | | | | |
| | |
| | | | Egypt – 0.75% | | | | |
| | 4,400 | | | Commerical International Bank SAE, GDR (a) | | | 30,370 | |
| | | | | | | | |
| | |
| | | | Hong Kong – 4.31% | | | | |
| | 5,000 | | | China Mobile (a) | | | 71,416 | |
| | 18,000 | | | CITIC (a) | | | 36,009 | |
| | 65,000 | | | Geely Automobile Holdings (a) | | | 36,566 | |
| | 13,000 | | | Shimao Property Holdings (a) | | | 30,605 | |
| | | | | | | | |
| | | | | | | 174,596 | |
| | | | | | | | |
| | |
| | | | India – 3.84% | | | | |
| | 3,897 | | | ICICI Bank, SP ADR | | | 42,594 | |
| | 1,545 | | | Reliance Industries, GDR | | | 41,561 | |
| | 1,029 | | | Tata Motors, SP ADR | | | 42,385 | |
| | 2,513 | | | Wipro, ADR | | | 28,824 | |
| | | | | | | | |
| | | | | | | 155,364 | |
| | | | | | | | |
| | |
| | | | Indonesia – 3.05% | | | | |
| | 309,700 | | | Adaro Energy Tbk PT (a) | | | 20,852 | |
| | 91,000 | | | Bank Negara Indonesia Persero Tbk (a) | | | 44,910 | |
| | 35,900 | | | Bank Rakyat Indonesia Persero Tbk PT (a) | | | 32,052 | |
| | 49,500 | | | Indofood Sukses Makmur Tbk PT (a) | | | 25,692 | |
| | | | | | | | |
| | | | | | | 123,506 | |
| | | | | | | | |
| | |
| | | | Malaysia – 1.62% | | | | |
| | 20,900 | | | DiGi.Com (a) | | | 35,234 | |
| | 14,600 | | | Telekom Malaysia (a) | | | 30,316 | |
| | | | | | | | |
| | | | | | | 65,550 | |
| | | | | | | | |
| | |
| | | | Mexico – 4.40% | | | | |
| | 64,000 | | | America Movil | | | 67,079 | |
| | 4,600 | | | Arca Continental * | | | 28,217 | |
| | 13,800 | | | Compartamos * | | | 23,621 | |
| | 1,900 | | | Gruma, Class B * | | | 22,889 | |
| | 5,100 | | | Grupo Aeroportuario del Pacifico | | | 36,244 | |
| | | | | | | | |
| | | | | | | 178,050 | |
| | | | | | | | |
| | |
| | | | Philippines – 1.28% | | | | |
| | 11,680 | | | BDO Unibank (a) | | | 28,563 | |
| | 4,760 | | | Universal Robina (a) | | | 23,213 | |
| | | | | | | | |
| | | | | | | 51,776 | |
| | | | | | | | |
| | |
| | | | Poland – 1.49% | | | | |
| | 920 | | | KGHM Polska Miedz, SA (a) | | | 32,258 | |
| | 1,468 | | | Polski Koncern Naftowy Orlen SA (a) | | | 27,880 | |
| | | | | | | | |
| | | | | | | 60,138 | |
| | | | | | | | |
| | |
| | | | Russia – 2.85% | | | | |
| | 3,073 | | | Gazprom, SP ADR (a) | | | 18,005 | |
| | 3,429 | | | Gazprom, SP ADR | | | 20,163 | |
| | 546 | | | Lukoil, SP ADR | | | 27,983 | |
See accompanying Notes to Financial Statements.
| | |
| |
| ASTON/LMCG Emerging Markets Fund | | April 30, 2015 |
| |
| Schedule of Investments (unaudited) – continued | | |
| | | | | | | | |
Shares | | | | | Market
Value | |
| | |
| | | | Russia (continued) | | | | |
| | 45 | | | Lukoil, SP ADR (a) | | $ | 2,302 | |
| | 887 | | | MMC Norilsk Nickel OJSC, ADR (a) | | | 16,709 | |
| | 880 | | | Tatneft, SP ADR (a) | | | 30,186 | |
| | | | | | | | |
| | | | | | | 115,348 | |
| | | | | | | | |
| | |
| | | | South Africa – 7.74% | | | | |
| | 3,021 | | | Barloworld (a) | | | 24,100 | |
| | 8,107 | | | FirstRand (a) | | | 38,728 | |
| | 1,761 | | | Foschini Group (a) | | | 26,074 | |
| | 7,757 | | | Gold Fields (a) | | | 35,813 | |
| | 2,133 | | | Liberty Holdings | | | 29,728 | |
| | 5,006 | | | Mediclinic International (a) | | | 53,010 | |
| | 11,917 | | | Netcare (a) | | | 41,688 | |
| | 7,942 | | | Sappi * | | | 32,579 | |
| | 1,202 | | | Tiger Brands (a) | | | 31,285 | |
| | | | | | | | |
| | | | | | | 313,005 | |
| | | | | | | | |
| | |
| | | | South Korea – 15.68% | | | | |
| | 81 | | | CJ CheilJedang (a) | | | 31,501 | |
| | 573 | | | Daesang (a) | | | 24,760 | |
| | 574 | | | Dongbu Insurance (a) | | | 29,172 | |
| | 2,104 | | | Doosan Infracore (a) * | | | 23,253 | |
| | 132 | | | E-Mart (a) | | | 27,194 | |
| | 542 | | | Hankook Tire (a) * | | | 22,778 | |
| | 294 | | | Hyundai Motor (a) | | | 46,141 | |
| | 2,492 | | | Industrial Bank of Korea (a) * | | | 34,240 | |
| | 1,100 | | | LG Display (a) | | | 30,462 | |
| | 468 | | | LG Electronics (a) | | | 26,317 | |
| | 710 | | | LG International (a) | | | 27,169 | |
| | 1,028 | | | Nexen Tire (a) | | | 12,471 | |
| | 535 | | | Samsung Electro-Mechanics (a) | | | 33,574 | |
| | 121 | | | Samsung Electronics (a) | | | 158,734 | |
| | 111 | | | Samsung Fire & Marine Insurance | | | 29,251 | |
| | 1,185 | | | SK Hynix (a) | | | 50,700 | |
| | 246 | | | SK Innovation (a) * | | | 26,926 | |
| | | | | | | | |
| | | | | | | 634,643 | |
| | | | | | | | |
| | |
| | | | Taiwan – 13.82% | | | | |
| | 31,000 | | | Advanced Semiconductor Engineering (a) | | | 43,962 | |
| | 72,000 | | | Au Optronics (a) | | | 36,133 | |
| | 4,000 | | | Catcher Technology (a) | | | 46,807 | |
| | 11,000 | | | Cheng Uei Precision Industry (a) | | | 21,631 | |
| | 50,000 | | | China Airlines * | | | 26,611 | |
| | 35,000 | | | China Steel (a) | | | 29,399 | |
| | 29,000 | | | Compal Electronics (a) | | | 26,402 | |
| | 23,000 | | | Fubon Financial Holding (a) | | | 49,463 | |
| | 22,400 | | | Hon Hai Precision Industry (a) | | | 67,120 | |
| | 29,000 | | | King Yuan Electronics (a) | | | 26,362 | |
| | 7,000 | | | Pegatron (a) | | | 20,737 | |
| | 15,000 | | | Pou Chen (a) | | | 21,020 | |
| | 15,000 | | | Taiwan Semiconductor Manufacturing (a) | | | 72,214 | |
| | 21,984 | | | Uni-President Enterprises (a) | | | 35,979 | |
| | 74,000 | | | United Microelectronics (a) | | | 35,455 | |
| | | | | | | | |
| | | | | | | 559,295 | |
| | | | | | | | |
| | | | | | | | |
Shares | | | | | Market
Value | |
| | |
| | | | Thailand – 1.45% | | | | |
| | 5,300 | | | Kasikornbank (a) | | $ | 33,648 | |
| | 266,351 | | | Quality Houses (a) | | | 24,959 | |
| | | | | | | | |
| | | | | | | 58,607 | |
| | | | | | | | |
| | |
| | | | Turkey – 2.82% | | | | |
| | 19,504 | | | Eregli Demir ve Celik Fabrikalari TAS (a) | | | 32,913 | |
| | 26,027 | | | Kardemir Karabuk Demir Celik Sanayi ve Ticaret, Class D (a) * | | | 17,941 | |
| | 7,940 | | | Tekfen Holding AS (a) | | | 14,840 | |
| | 8,158 | | | Turk Hava Yollari (a) * | | | 27,061 | |
| | 12,013 | | | Turkiye Vakiflar Bankasi Tao, Class D (a) | | | 21,314 | |
| | | | | | | | |
| | | | | | | 114,069 | |
| | | | | | | | |
| | |
| | | | Total Common Stocks
(Cost $3,478,134) | | | 3,780,274 | |
| | | | | | | | |
|
| | EXCHANGE TRADED FUNDS – 4.19% | |
| | |
| | | | United States – 4.19% | | | | |
| | 210 | | | iPath MSCI India Index Fund * | | | 14,314 | |
| | 1,897 | | | iShares MSCI Emerging Markets Index Fund | | | 81,343 | |
| | 2,513 | | | iShares MSCI India | | | 73,845 | |
| | | | | | | | |
| | | | | | | 169,502 | |
| | | | | | | | |
| | |
| | | | Total Exchange Traded Funds
(Cost $136,162) | | | 169,502 | |
| | | | | | | | |
|
| | INVESTMENT COMPANY – 2.04% | |
| | |
| | 82,488 | | | BlackRock Liquidity Funds TempFund Portfolio | | | 82,488 | |
| | | | | | | | |
| | |
| | | | Total Investment Company
(Cost $82,488) | | | 82,488 | |
| | | | | | | | |
| Total Investments – 99.65%
(Cost $3,696,784)** | | | 4,032,264 | |
| | | | | | | | |
| Net Other Assets and Liabilities – 0.35% | | | 14,244 | |
| | | | | | | | |
| Net Assets – 100.00% | | $ | 4,046,508 | |
| | | | | | | | |
| * | | Non-income producing security. |
| ** | | At April 30, 2015, cost is identical for book and Federal income tax purposes. |
| | | | |
Gross unrealized appreciation | | $ | 673,268 | |
Gross unrealized depreciation | | | (337,788 | ) |
| | | | |
Net unrealized appreciation | | $ | 335,480 | |
| | | | |
| (a) | | Securities with a total aggregate market value of $2,890,281 or 71.43% of the net assets, were valued under the fair value procedures established by the Funds’ Board of Trustees. |
| ADR | | American Depositary Receipt |
| GDR | | Global Depositary Receipt |
| SP ADR | | Sponsored American Depositary Receipt |
See accompanying Notes to Financial Statements.
| | |
| |
| ASTON/Pictet International Fund | | April 30, 2015 |
| |
| Schedule of Investments (unaudited) | | |
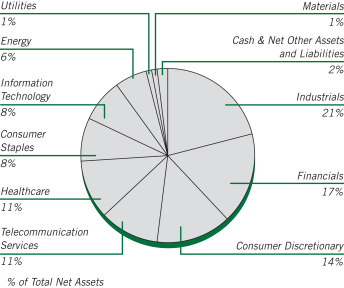
| | | | | | | | |
Shares | | | | | Market
Value | |
|
| | COMMON STOCKS – 96.38% | |
| | |
| | | | Australia – 3.27% | | | | |
| | 11,137 | | | Ansell (a) | | $ | 229,202 | |
| | 56,818 | | | Asciano (a) | | | 295,222 | |
| | 28,010 | | | Computershare (a) | | | 271,708 | |
| | 70,046 | | | Estia Health * | | | 333,141 | |
| | 12,129 | | | Spotless Group Holdings (a) | | | 21,795 | |
| | | | | | | | |
| | | | | | | 1,151,068 | |
| | | | | | | | |
| | |
| | | | Austria – 1.09% | | | | |
| | 13,590 | | | Erste Bank Group (a) | | | 383,695 | |
| | | | | | | | |
| | |
| | | | Belgium – 1.48% | | | | |
| | 7,662 | | | Ageas (a) | | | 287,879 | |
| | 7,790 | | | Ontex Group NV (a) * | | | 231,649 | |
| | | | | | | | |
| | | | | | | 519,528 | |
| | | | | | | | |
| | |
| | | | Bermuda – 1.62% | | | | |
| | 9,200 | | | Jardine Matheson Holdings (a) | | | 568,403 | |
| | | | | | | | |
| | |
| | | | Cayman Islands – 1.29% | | | | |
| | 239,600 | | | MGM China Holdings (a) | | | 452,284 | |
| | | | | | | | |
| | |
| | | | Denmark – 3.36% | | | | |
| | 5,096 | | | Carlsberg, Class B (a) | | | 464,595 | |
| | 22,519 | | | H Lundbeck (a) * | | | 438,017 | |
| | 11,854 | | | Matas (a) | | | 280,375 | |
| | | | | | | | |
| | | | | | | 1,182,987 | |
| | | | | | | | |
| | |
| | | | Finland – 1.98% | | | | |
| | 103,284 | | | Nokia (a) | | | 696,903 | |
| | | | | | | | |
| | | | | | | | |
Shares | | | | | Market
Value | |
| | |
| | | | France – 9.19% | | | | |
| | 118,481 | | | Bollore (a) | | $ | 677,125 | |
| | 24,551 | | | Elis * | | | 499,241 | |
| | 7,812 | | | Orpea (a) | | | 514,594 | |
| | 5,520 | | | Rubis (a) | | | 375,051 | |
| | 10,673 | | | Societe Generale (a) | | | 533,594 | |
| | 10,321 | | | Vinci (a) | | | 633,036 | |
| | | | | | | | |
| | | | | | | 3,232,641 | |
| | | | | | | | |
| | |
| | | | Germany – 1.65% | | | | |
| | 4,041 | | | Bayer (a) | | | 581,632 | |
| | | | | | | | |
| | |
| | | | Hong Kong – 4.51% | | | | |
| | 72,000 | | | Hutchison Whampoa | | | 1,060,880 | |
| | 792,074 | | | PCCW (a) | | | 527,331 | |
| | | | | | | | |
| | | | | | | 1,588,211 | |
| | | | | | | | |
| | |
| | | | Italy – 6.05% | | | | |
| | 29,204 | | | Astaldi (a) | | | 253,884 | |
| | 47,340 | | | Cerved Information Solutions (a) * | | | 343,467 | |
| | 40,507 | | | Finmeccanica (a) * | | | 516,826 | |
| | 93,408 | | | Sorin * | | | 295,771 | |
| | 192,184 | | | UnipolSai (a) | | | 537,802 | |
| | 16,301 | | | World Duty Free (a) * | | | 181,973 | |
| | | | | | | | |
| | | | | | | 2,129,723 | |
| | | | | | | | |
| | |
| | | | Japan – 19.61% | | | | |
| | 9,100 | | | Daiichikosho (a) | | | 293,491 | |
| | 25,500 | | | DMG Mori Seiki (a) | | | 415,881 | |
| | 24,600 | | | Fujitec (a) | | | 267,483 | |
| | 7,600 | | | GMO Internet (a) | | | 95,541 | |
| | 57,800 | | | Inpex (a) | | | 725,409 | |
| | 18,600 | | | Japan Tobacco (a) | | | 649,528 | |
| | 26,000 | | | LIXIL Group Corp (a) | | | 541,932 | |
| | 6,200 | | | Miraca Holdings (a) | | | 311,919 | |
| | 6,100 | | | Nippon Telegraph & Telephone (a) | | | 411,903 | |
| | 16,300 | | | NKSJ Holdings (a) | | | 532,518 | |
| | 17,400 | | | SoftBank (a) | | | 1,087,680 | |
| | 9,100 | | | Sohgo Security Services Co (a) | | | 296,638 | |
| | 12,100 | | | Sony (a) * | | | 365,804 | |
| | 13,300 | | | Sumitomo Mitsui Financial Group (a) | | | 580,739 | |
| | 7,400 | | | Welcia Holdings (a) | | | 323,582 | |
| | | | | | | | |
| | | | | | | 6,900,048 | |
| | | | | | | | |
| | |
| | | | Malaysia – 0.51% | | | | |
| | 73,600 | | | Genting (a) | | | 180,670 | |
| | | | | | | | |
| | |
| | | | Netherlands – 3.28% | | | | |
| | 6,367 | | | ASML Holding NV (a) | | | 685,173 | |
| | 8,221 | | | Konnikluke DSM NV (a) | | | 468,849 | |
| | | | | | | | |
| | | | 1,154,022 | |
| | | | | | | | |
| | |
| | | | New Zealand – 0.79% | | | | |
| | 96,059 | | | Trade Me Group (a) | | | 279,785 | |
| | | | | | | | |
| | |
| | | | Papua New Guinea – 0.64% | | | | |
| | 35,257 | | | Oil Search (a) | | | 223,834 | |
| | | | | | | | |
See accompanying Notes to Financial Statements.
| | |
| |
| ASTON/Pictet International Fund | | April 30, 2015 |
| |
| Schedule of Investments (unaudited) – continued | | |
| | | | | | | | |
Shares | | | | | Market
Value | |
| | |
| | | | Philippines – 0.46% | | | | |
| | 1,582,700 | | | Metro Pacific Investments (a) | | $ | 160,710 | |
| | | | | | | | |
| | |
| | | | Portugal – 1.50% | | | | |
| | 6,800 | | | Galp Energia (a) | | | 92,886 | |
| | 59,792 | | | NOS SGPS (a) | | | 435,510 | |
| | | | | | | | |
| | | | 528,396 | |
| | | | | | | | |
| | |
| | | | Singapore – 1.24% | | | | |
| | 5,578 | | | Millicom International Cellular, SDR (a) | | | 435,178 | |
| | | | | | | | |
| | |
| | | | South Korea – 2.70% | | | | |
| | 869 | | | NAVER (a) | | | 525,465 | |
| | 325 | | | Samsung Electronics (a) | | | 426,353 | |
| | | | | | | | |
| | | | 951,818 | |
| | | | | | | | |
| | |
| | | | Spain – 4.83% | | | | |
| | 6,313 | | | Aena * | | | 594,801 | |
| | 64,347 | | | Distribuidora Internacional de Alimentacion (a) | | | 515,348 | |
| | 5,060 | | | Merlin Properties Socimi, REIT * | | | 69,174 | |
| | 13,901 | | | Merlin Properties Socimi, REIT * | | | 190,037 | |
| | 14,267 | | | Obrascon Huarte Lain (a) | | | 330,941 | |
| | | | | | | | |
| | | | 1,700,301 | |
| | | | | | | | |
| | |
| | | | Sweden – 1.65% | | | | |
| | 42,097 | | | Com Hem Holding (a) * | | | 353,412 | |
| | 6,786 | | | Modern Times Group, Class B (a) | | | 225,670 | |
| | | | | | | | |
| | | | 579,082 | |
| | | | | | | | |
| | |
| | | | Switzerland – 7.12% | | | | |
| | 5,334 | | | Cie Financiere Richemont (a) | | | 475,435 | |
| | 10,166 | | | Gategroup Holding | | | 356,319 | |
| | 11,551 | | | Nestle (a) | | | 896,175 | |
| | 1,807 | | | Sunrise Communications Group * | | | 168,895 | |
| | 30,554 | | | UBS Group AG (a) | | | 610,388 | |
| | | | | | | | |
| | | | 2,507,212 | |
| | | | | | | | |
| | |
| | | | United Kingdom – 16.56% | | | | |
| | 7,357 | | | AstraZeneca (a) | | | 504,883 | |
| | 31,846 | | | BBA Aviation (a) | | | 167,566 | |
| | 48,452 | | | BG Group (a) | | | 877,632 | |
| | 225,567 | | | Enterprise Inns (a) * | | | 403,237 | |
| | 24,313 | | | GlaxoSmithKline (a) | | | 561,546 | |
| | 81,078 | | | HSBC Holdings (a) | | | 809,927 | |
| | 62,287 | | | Inmarsat (a) | | | 959,125 | |
| | 23,570 | | | Prudential (a) | | | 586,831 | |
| | 23,672 | | | Standard Chartered (a) | | | 387,554 | |
| | 26,956 | | | Tate & Lyle | | | 246,815 | |
| | 58,673 | | | William Hill (a) | | | 324,173 | |
| | | | | | | | |
| | | | 5,829,289 | |
| | | | | | | | |
| | |
| | | | Total Common Stocks
(Cost $31,672,424) | | | 33,917,420 | |
| | | | | | | | |
| | | | | | | | |
Shares | | | | | Market
Value | |
|
| | PREFERRED STOCK – 1.39% | |
| | |
| | | | Germany – 1.39% | | | | |
| | 5,170 | | | Porsche Automobile Holding | | $ | 490,547 | |
| | | | | | | | |
| | | | 490,547 | |
| | | | | | | | |
| | |
| | | | Total Preferred Stock
(Cost $494,680) | | | 490,547 | |
| | | | | | | | |
|
| | INVESTMENT COMPANY – 0.67% | |
| | |
| | 233,688 | | | BlackRock Liquidity Funds
TempFund Portfolio | | | 233,688 | |
| | | | | | | | |
| | |
| | | | Total Investment Company
(Cost $233,688) | | | 233,688 | |
| | | | | | | | |
| Total Investments – 98.44%
(Cost $32,400,792)** | | | 34,641,655 | |
| | | | | | | | |
| Net Other Assets and Liabilities – 1.56% | | | 548,242 | |
| | | | | | | | |
| Net Assets – 100.00% | | $ | 35,189,897 | |
| | | | | | | | |
| * | | Non-income producing security. |
| ** | | At April 30, 2015, cost is identical for book and Federal income tax purposes. |
| | | | |
Gross unrealized appreciation | | $ | 3,666,637 | |
Gross unrealized depreciation | | | (1,425,774 | ) |
| | | | |
Net unrealized appreciation | | $ | 2,240,863 | |
| | | | |
| (a) | | Securities with a total aggregate market value of $30,102,346 or 85.54% of the net assets, were valued under the fair value procedures established by the Funds’ Board of Trustees. |
| REIT | | Real Estate Investment Trust |
| SDR | | Swedish Depositary Receipts |
See accompanying Notes to Financial Statements.
| | |
| |
| ASTON/TAMRO International Small Cap Fund | | April 30, 2015 |
| |
| Schedule of Investments (unaudited) | | |
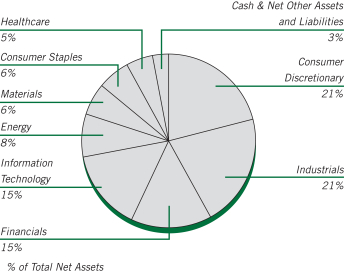
| | | | | | | | |
Shares | | Market
Value | |
| |
| | COMMON STOCKS – 95.92% | | | | |
| | |
| | | | Australia – 6.40% | | | | |
| | 12,500 | | | FlexiGroup (a) | | $ | 33,558 | |
| | 3,800 | | | Mineral Resources (a) | | | 19,319 | |
| | 4,300 | | | Super Retail Group (a) | | | 33,473 | |
| | 7,500 | | | Treasury Wine Estates (a) | | | 32,893 | |
| | | | | | | | |
| | | | 119,243 | |
| | | | | | | | |
| | |
| | | | Bermuda – 4.29% | | | | |
| | 5,800 | | | Cosan Ltd, Class A | | | 42,108 | |
| | 1,050 | | | Golar LNG | | | 37,795 | |
| | | | | | | | |
| | | | 79,903 | |
| | | | | | | | |
| | |
| | | | Canada – 5.87% | | | | |
| | 3,500 | | | Cott | | | 30,485 | |
| | 2,700 | | | Descartes Systems Group * | | | 40,573 | |
| | 3,200 | | | Labrador Iron Ore Royalty | | | 38,193 | |
| | | | | | | | |
| | | | 109,251 | |
| | | | | | | | |
| | |
| | | | Cayman Islands – 5.50% | | | | |
| | 68,000 | | | Baoxin Auto Group (a) | | | 53,662 | |
| | 13,500 | | | Phoenix Healthcare Group (a) | | | 27,858 | |
| | 24,000 | | | Yingde Gases Group (a) | | | 20,937 | |
| | | | | | | | |
| | | | 102,457 | |
| | | | | | | | |
| | |
| | | | France – 8.17% | | | | |
| | 500 | | | Gaztransport Et Technigaz SA | | | 29,924 | |
| | 300 | | | ID Logistics Group * | | | 33,012 | |
| | 1,400 | | | Tarkett SA (a) | | | 37,618 | |
| | 2,800 | | | UBISOFT Entertainment (a) * | | | 51,631 | |
| | | | | | | | |
| | | | 152,185 | |
| | | | | | | | |
| | | | | | | | |
Shares | | Market
Value | |
| | |
| | | | Germany – 3.76% | | | | |
| | 560 | | | KUKA AG (a) | | $ | 39,783 | |
| | 800 | | | Wincor Nixdorf AG (a) | | | 30,281 | |
| | | | | | | | |
| | | | 70,064 | |
| | | | | | | | |
| | |
| | | | Hong Kong – 2.87% | | | | |
| | 36,500 | | | Hongkong & Shanghai Hotels (a) | | | 53,499 | |
| | | | | | | | |
| | |
| | | | Italy – 6.22% | | | | |
| | 1,660 | | | Recordati (a) | | | 33,077 | |
| | 460 | | | Tod’s (a) | | | 42,205 | |
| | 1,288 | | | Yoox (a) * | | | 40,572 | |
| | | | | | | | |
| | | | 115,854 | |
| | | | | | | | |
| | |
| | | | Japan – 21.96% | | | | |
| | 1,700 | | | Azbil (a) | | | 44,782 | |
| | 45 | | | GLP J-REIT (a) | | | 46,268 | |
| | 3,900 | | | Haseko (a) | | | 38,510 | |
| | 2,000 | | | Ito En (a) | | | 41,557 | |
| | 1,100 | | | MISUMI Group (a) | | | 41,281 | |
| | 2,200 | | | Park24 (a) | | | 43,940 | |
| | 6,300 | | | Shinko Plantech (a) | | | 47,670 | |
| | 6,000 | | | Sumitomo Heavy Industries (a) | | | 37,278 | |
| | 1,300 | | | Sumitomo Real Estate Sales (a) | | | 35,335 | |
| | 6,200 | | | Wacom (a) | | | 32,146 | |
| | | | | | | | |
| | | | 408,767 | |
| | | | | | | | |
| | |
| | | | Mexico – 1.60% | | | | |
| | 19,650 | | | Mexico Real Estate Management SA de CV, REIT | | | 29,740 | |
| | | | | | | | |
| | |
| | | | Norway – 1.88% | | | | |
| | 1,625 | | | Kongsberg Gruppen ASA (a) | | | 34,918 | |
| | | | | | | | |
| | |
| | | | Panama – 1.76% | | | | |
| | 1,030 | | | Banco Latinoamericano de Comercio Exterior SA | | | 32,723 | |
| | | | | | | | |
| | |
| | | | Singapore – 3.32% | | | | |
| | 24,000 | | | CDL Hospitality Trusts, REIT | | | 31,107 | |
| | 20,000 | | | OSIM International | | | 30,683 | |
| | | | | | | | |
| | | | 61,790 | |
| | | | | | | | |
| | |
| | | | Switzerland – 3.81% | | | | |
| | 1,540 | | | GAM Holding AG (a) | | | 34,744 | |
| | 55 | | | Kaba Holding AG (a) | | | 36,122 | |
| | | | | | | | |
| | | | 70,866 | |
| | | | | | | | |
| | |
| | | | United Kingdom – 16.22% | | | | |
| | 3,100 | | | BrainJuicer Group | | | 19,502 | |
| | 910 | | | Dialog Semiconductor (a) * | | | 41,031 | |
| | 11,500 | | | Electrocomponents (a) | | | 42,488 | |
| | 5,200 | | | Intermediate Capital Group (a) | | | 41,998 | |
| | 3,375 | | | Northgate | | | 33,415 | |
| | 5,825 | | | SThree | | | 33,329 | |
| | 1,010 | | | Ted Baker (a) | | | 44,113 | |
See accompanying Notes to Financial Statements.
| | |
| |
| ASTON/TAMRO International Small Cap Fund | | April 30, 2015 |
| |
| Schedule of Investments (unaudited) – continued | | |
| | | | | | | | |
Shares | | Market
Value | |
| | |
| | | | United Kingdom (continued) | | | | |
| | 1,520 | | | Victrex (a) | | $ | 46,005 | |
| | | | | | | | |
| | | | 301,881 | |
| | | | | | | | |
| | |
| | | | Virgin Islands (British) – 2.29% | | | | |
| | 7,100 | | | Arcos Dorados Holdings * | | | 42,600 | |
| | | | | | | | |
| | |
| | | | Total Common Stocks
(Cost $1,670,824) | | | 1,785,741 | |
| | | | | | | | |
| |
| | PREFERRED STOCK – 1.48% | | | | |
| | |
| | | | Germany – 1.48% | | | | |
| | 330 | | | Biotest AG (a) | | | 27,681 | |
| | | | | | | | |
| | | | 27,681 | |
| | | | | | | | |
| | |
| | | | Total Preferred Stock
(Cost $34,213) | | | 27,681 | |
| | | | | | | | |
| |
| | INVESTMENT COMPANY – 3.96% | | | | |
| | |
| | 73,673 | | | BlackRock Liquidity Funds
TempFund Portfolio | | | 73,673 | |
| | | | | | | | |
| | |
| | | | Total Investment Company
(Cost $73,673) | | | 73,673 | |
| | | | | | | | |
| Total Investments – 101.36%
(Cost $1,778,710)** | | | 1,887,095 | |
| | | | | | | | |
| Net Other Assets and Liabilities – (1.36)% | | | (25,367 | ) |
| | | | | | | | |
| Net Assets – 100.00% | | $ | 1,861,728 | |
| | | | | | | | |
| * | | Non-income producing security. |
| ** | | At April 30, 2015, cost is identical for book and Federal income tax purposes |
| | | | |
Gross unrealized appreciation | | $ | 153,387 | |
Gross unrealized depreciation | | | (45,002 | ) |
| | | | |
Net unrealized appreciation | | $ | 108,385 | |
| | | | |
| (a) | | Securities with a total aggregate market value of $1,308,233 or 70.27% of the net assets, were valued under the fair value procedures established by the Funds’ Board of Trustees. |
| REIT | | Real Estate Investment Trust |
See accompanying Notes to Financial Statements.
| | |
| |
| ASTON/Harrison Street Real Estate Fund | | April 30, 2015 |
| |
| Schedule of Investments (unaudited) | | |
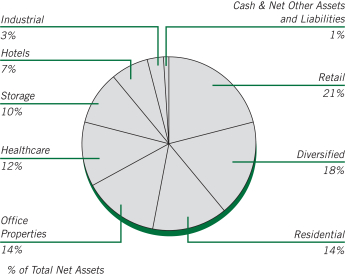
| | | | | | | | |
Shares | | | | | Market
Value | |
|
| | COMMON STOCKS – 99.57% | |
| | |
| | | | Diversified – 18.49% | | | | |
| | 8,924 | | | American Tower | | $ | 843,586 | |
| | 7,128 | | | DuPont Fabros Technology | | | 222,037 | |
| | 4,711 | | | EPR Properties | | | 271,683 | |
| | 7,362 | | | Geo Group | | | 287,118 | |
| | 24,862 | | | Spirit Realty Capital | | | 280,692 | |
| | 4,472 | | | Vornado Realty Trust | | | 462,807 | |
| | | | | | | | |
| | | | | | | 2,367,923 | |
| | | | | | | | |
| | |
| | | | Healthcare – 11.53% | | | | |
| | 6,282 | | | LTC Properties | | | 273,016 | |
| | 12,803 | | | Omega Healthcare Investors | | | 462,060 | |
| | 10,770 | | | Ventas | | | 742,053 | |
| | | | | | | | |
| | | | | | | 1,477,129 | |
| | | | | | | | |
| | |
| | | | Hotels – 6.87% | | | | |
| | 10,531 | | | Chesapeake Lodging Trust | | | 334,359 | |
| | 3,408 | | | Hyatt Hotels Corp, Class A * | | | 197,834 | |
| | 29,696 | | | Strategic Hotels & Resorts * | | | 347,443 | |
| | | | | | | | |
| | | | | | | 879,636 | |
| | | | | | | | |
| | |
| | | | Industrial – 2.56% | | | | |
| | 15,106 | | | STAG Industrial | | | 328,253 | |
| | | | | | | | |
| | |
| | | | Office Properties – 14.34% | | | | |
| | 14,131 | | | BioMed Realty Trust | | | 293,218 | |
| | 4,607 | | | Boston Properties | | | 609,552 | |
| | 7,033 | | | CyrusOne | | | 228,432 | |
| | 7,206 | | | Hudson Pacific Properties | | | 217,333 | |
| | 3,994 | | | SL Green Realty | | | 488,706 | |
| | | | | | | | |
| | | | | | | 1,837,241 | |
| | | | | | | | |
| | | | | | | | |
Shares | | | | | Market
Value | |
| | |
| | | | Residential – 13.72% | | | | |
| | 9,392 | | | Equity Residential | | $ | 693,693 | |
| | 2,482 | | | Essex Property Trust | | | 550,880 | |
| | 15,647 | | | UDR | | | 512,752 | |
| | | | | | | | |
| | | | | | | 1,757,325 | |
| | | | | | | | |
| | |
| | | | Retail – 20.94% | | | | |
| | 9,726 | | | Acadia Realty Trust | | | 300,534 | |
| | 7,157 | | | Agree Realty | | | 220,293 | |
| | 17,175 | | | Kimco Realty | | | 413,918 | |
| | 12,567 | | | Retail Opportunity Investments | | | 210,874 | |
| | 7,053 | | | Simon Property Group | | | 1,280,049 | |
| | 3,566 | | | Taubman Centers | | | 256,788 | |
| | | | | | | | |
| | | | | | | 2,682,456 | |
| | | | | | | | |
| | |
| | | | Storage – 9.65% | | | | |
| | 10,566 | | | Extra Space Storage | | | 696,616 | |
| | 6,168 | | | Sovran Self Storage | | | 538,713 | |
| | | | | | | | |
| | | | | | | 1,235,329 | |
| | | | | | | | |
| | |
| | | | Telecommunications Equipment – 1.47% | | | | |
| | 1,624 | | | SBA Communications * | | | 188,092 | |
| | | | | | | | |
| | |
| | | | Total Common Stocks
(Cost $12,779,222) | | | 12,753,384 | |
| | | | | | | | |
|
| | INVESTMENT COMPANY – 0.66% | |
| | |
| | 84,955 | | | BlackRock Liquidity Funds
TempFund Portfolio | | | 84,955 | |
| | | | | | | | |
| | |
| | | | Total Investment Company
(Cost $84,955) | | | 84,955 | |
| | | | | | | | |
| Total Investments – 100.23%
(Cost $12,864,177)** | | | 12,838,339 | |
| | | | | | | | |
| Net Other Assets and Liabilities – (0.23)% | | | (29,409 | ) |
| | | | | | | | |
| Net Assets – 100.00% | | $ | 12,808,930 | |
| | | | | | | | |
| * | | Non-income producing security. |
| ** | | At April 30, 2015, cost is identical for book and Federal income tax purposes. |
| | | | |
Gross unrealized appreciation | | $ | 422,192 | |
Gross unrealized depreciation | | | (448,030 | ) |
| | | | |
Net unrealized depreciation | | $ | (25,838 | ) |
| | | | |
See accompanying Notes to Financial Statements.
| | |
| |
| ASTON/Montag & Caldwell Balanced Fund | | April 30, 2015 |
| |
| Schedule of Investments (unaudited) | | |
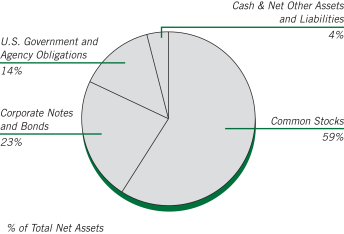
| | | | | | | | |
Shares | | | | | Market
Value | |
| |
| | COMMON STOCKS – 59.50% | | | | |
| | |
| | | | Consumer Discretionary – 9.18% | | | | |
| | 5,700 | | | Carnival | | $ | 250,629 | |
| | 3,200 | | | Dollar General | | | 232,672 | |
| | 5,100 | | | Dollar Tree * | | | 389,691 | |
| | 2,300 | | | NIKE, Class B | | | 227,332 | |
| | 10,600 | | | Starbucks | | | 525,548 | |
| | 6,050 | | | TJX | | | 390,467 | |
| | | | | | | | |
| | | | | | | 2,016,339 | |
| | | | | | | | |
| | |
| | | | Consumer Staples – 12.97% | | | | |
| | 6,600 | | | Colgate-Palmolive | | | 444,048 | |
| | 1,400 | | | Costco Wholesale | | | 200,270 | |
| | 4,750 | | | Estee Lauder, Class A | | | 386,127 | |
| | 15,750 | | | Mondelez International, Class A | | | 604,327 | |
| | 6,720 | | | PepsiCo | | | 639,206 | |
| | 2,450 | | | Procter & Gamble | | | 194,799 | |
| | 4,600 | | | Walgreens Boots Alliance | | | 381,478 | |
| | | | | | | | |
| | | | | | | 2,850,255 | |
| | | | | | | | |
| | |
| | | | Energy – 0.84% | | | | |
| | 2,300 | | | Occidental Petroleum | | | 184,230 | |
| | | | | | | | |
| | |
| | | | Financials – 1.79% | | | | |
| | 1,800 | | | State Street | | | 138,816 | |
| | 4,600 | | | Wells Fargo | | | 253,460 | |
| | | | | | | | |
| | | | | | | 392,276 | |
| | | | | | | | |
| | |
| | | | Healthcare – 18.13% | | | | |
| | 11,250 | | | Abbott Laboratories | | | 522,225 | |
| | 1,885 | | | Actavis PLC (Ireland) * | | | 533,191 | |
| | 2,350 | | | AmerisourceBergen | | | 268,605 | |
| | 2,156 | | | Amgen | | | 340,454 | |
| | 1,039 | | | Biogen Idec * | | | 388,513 | |
| | 1,200 | | | Celgene * | | | 129,672 | |
| | 3,800 | | | Cerner * | | | 272,878 | |
| | 4,000 | | | Gilead Sciences * | | | 402,040 | |
| | | | | | | | |
Shares | | | | | Market
Value | |
| | |
| | | | Healthcare (continued) | | | | |
| | 2,900 | | | McKesson | | $ | 647,860 | |
| | 3,800 | | | Thermo Fisher Scientific | | | 477,584 | |
| | | | | | | | |
| | | | | | | 3,983,022 | |
| | | | | | | | |
| | |
| | | | Industrials – 5.03% | | | | |
| | 3,600 | | | Honeywell International | | | 363,312 | |
| | 1,496 | | | Union Pacific | | | 158,920 | |
| | 3,300 | | | United Parcel Service, Class B | | | 331,749 | |
| | 1,013 | | | WW Grainger | | | 251,660 | |
| | | | | | | | |
| | | | | | | 1,105,641 | |
| | | | | | | | |
| | |
| | | | Information Technology – 10.26% | | | | |
| | 3,650 | | | Accenture PLC, Class A (Ireland) | | | 338,172 | |
| | 4,300 | | | Cognizant Technology Solutions, Class A * | | | 251,722 | |
| | 3,000 | | | Facebook, Class A * | | | 236,310 | |
| | 727 | | | Google, Class A * | | | 398,956 | |
| | 3,100 | | | MasterCard, Class A | | | 279,651 | |
| | 2,400 | | | QUALCOMM | | | 163,200 | |
| | 8,868 | | | Visa, Class A | | | 585,731 | |
| | | | | | | | |
| | | | | | | 2,253,742 | |
| | | | | | | | |
| | |
| | | | Materials – 1.30% | | | | |
| | 2,500 | | | Monsanto | | | 284,900 | |
| | | | | | | | |
| | |
| | | | Total Common Stocks
(Cost $10,693,355) | | | 13,070,405 | |
| | | | | | | | |
Par Value | | | | | | |
|
| | CORPORATE NOTES AND BONDS – 22.62% | |
| | |
| | | | Consumer Staples – 2.85% | | | | |
| | $275,000 | | | PepsiCo
Senior Unsecured Notes
5.000%, 06/01/18 | | | 304,377 | |
| | 300,000 | | | Wal-Mart Stores
Senior Unsecured Notes
3.250%, 10/25/20 | | | 321,098 | |
| | | | | | | | |
| | | | | | | 625,475 | |
| | | | | | | | |
| | |
| | | | Energy – 1.39% | | | | |
| | 300,000 | | | Chevron
Senior Unsecured Notes
1.718%, 06/24/18 | | | 304,030 | |
| | | | | | | | |
| | |
| | | | Financials – 7.15% | | | | |
| | 300,000 | | | General Electric Capital
Senior Unsecured Notes, MTN
4.375%, 09/16/20 | | | 334,347 | |
| | 300,000 | | | Goldman Sachs Group
Senior Unsecured Notes
3.625%, 02/07/16 | | | 306,222 | |
| | 300,000 | | | JPMorgan Chase
Senior Unsecured Notes
4.350%, 08/15/21 | | | 328,379 | |
See accompanying Notes to Financial Statements.
| | |
| |
| ASTON/Montag & Caldwell Balanced Fund | | April 30, 2015 |
| |
| Schedule of Investments (unaudited) – continued | | |
| | | | | | | | |
Par Value | | | | | Market
Value | |
| | |
| | | | Financials (continued) | | | | |
| | $300,000 | | | U.S. Bancorp
Subordinated Notes, MTN
2.950%, 07/15/22 | | $ | 301,520 | |
| | 300,000 | | | Wells Fargo & Co
Senior Unsecured Notes, MTN
2.150%, 01/30/20 | | | 300,251 | |
| | | | | | | | |
| | | | | | | 1,570,719 | |
| | | | | | | | |
| | |
| | | | Healthcare – 2.90% | | | | |
| | 250,000 | | | Johnson & Johnson
Senior Unsecured Notes
5.950%, 08/15/37 | | | 336,312 | |
| | 300,000 | | | Pfizer
Senior Unsecured Notes
1.100%, 05/15/17 | | | 301,525 | |
| | | | | | | | |
| | | | | | | 637,837 | |
| | | | | | | | |
| | |
| | | | Industrials – 1.45% | | | | |
| | 300,000 | | | United Parcel Service
Senior Unsecured Notes
3.125%, 01/15/21 | | | 318,556 | |
| | | | | | | | |
| | |
| | | | Information Technology – 6.88% | | | | |
| | 300,000 | | | Apple
Senior Unsecured Notes
1.000%, 05/03/18 | | | 298,653 | |
| | 300,000 | | | Cisco Systems
Senior Unsecured Notes
5.500%, 02/22/16 | | | 312,218 | |
| | 275,000 | | | EMC
Senior Unsecured Notes
1.875%, 06/01/18 | | | 278,183 | |
| | 300,000 | | | Google
Senior Unsecured Notes
3.625%, 05/19/21 | | | 326,504 | |
| | 300,000 | | | Oracle
Senior Unsecured Notes
2.500%, 10/15/22 | | | 296,664 | |
| | | | | | | | |
| | | | | | | 1,512,222 | |
| | | | | | | | |
| | |
| | | | Total Corporate Notes and Bonds
(Cost $4,821,534) | | | 4,968,839 | |
| | | | | | | | |
|
| | U.S. GOVERNMENT AND AGENCY OBLIGATIONS – 13.53% | |
| | |
| | | | Fannie Mae – 0.13% | | | | |
| | 8,295 | | | 7.500%, 02/01/35
Pool # 787557 | | | 8,796 | |
| | 2,880 | | | 7.500%, 04/01/35
Pool # 819231 | | | 3,076 | |
| | 14,256 | | | 6.000%, 11/01/35
Pool # 844078 | | | 16,277 | |
| | | | | | | | |
| | | | | | | 28,149 | |
| | | | | | | | |
| | | | | | | | |
Par Value | | | | | Market
Value | |
| | |
| | | | Freddie Mac – 1.76% | | | | |
| $ | 7,936 | | | 5.500%, 12/01/20
Gold Pool # G11820 | | $ | 8,604 | |
| | 375,000 | | | 1.000%, 09/29/17 | | | 377,631 | |
| | | | | | | | |
| | | | | | | 386,235 | |
| | | | | | | | |
| | |
| | | | Ginnie Mae – 0.03% | | | | |
| | 6,945 | | | 5.500%, 02/15/39
Pool # 698060 | | | 7,847 | |
| | | | | | | | |
| | |
| | | | U.S. Treasury Bonds – 3.72% | | | | |
| | 225,000 | | | 5.375%, 02/15/31 | | | 313,769 | |
| | 300,000 | | | 3.500%, 02/15/39 | | | 343,102 | |
| | 150,000 | | | 3.125%, 11/15/41 | | | 161,555 | |
| | | | | | | | |
| | | | | | | 818,426 | |
| | | | | | | | |
| | |
| | | | U.S. Treasury Notes – 7.89% | | | | |
| | 225,000 | | | 4.500%, 02/15/16 | | | 232,682 | |
| | 250,000 | | | 2.625%, 04/30/16 | | | 255,860 | |
| | 250,000 | | | 4.625%, 02/15/17 | | | 268,223 | |
| | 250,000 | | | 1.500%, 01/31/19 | | | 253,047 | |
| | 375,000 | | | 2.125%, 08/15/21 | | | 383,994 | |
| | 325,000 | | | 2.500%, 05/15/24 | | | 338,660 | |
| | | | | | | | |
| | | | | | | 1,732,466 | |
| | | | | | | | |
| | |
| | | | Total U.S. Government and Agency Obligations
(Cost $2,855,651) | | | 2,973,123 | |
| | | | | | | | |
Shares | | | | | | |
|
| | INVESTMENT COMPANY – 3.22% | |
| | |
| | 706,153 | | | BlackRock Liquidity Funds
TempFund Portfolio | | | 706,153 | |
| | | | | | | | |
| | |
| | | | Total Investment Company
(Cost $706,153) | | | 706,153 | |
| | | | | | | | |
| Total Investments – 98.87%
(Cost $19,076,693)** | | | 21,718,520 | |
| | | | | | | | |
| Net Other Assets and Liabilities – 1.13% | | | 249,053 | |
| | | | | | | | |
| Net Assets – 100.00% | | $ | 21,967,573 | |
| | | | | | | | |
| * | | Non-income producing security. |
| ** | | At April 30, 2015, cost is identical for book and Federal income tax purposes. |
| | | | |
Gross unrealized appreciation | | $ | 2,742,205 | |
Gross unrealized depreciation | | | (100,378 | ) |
| | | | |
Net unrealized appreciation | | $ | 2,641,827 | |
| | | | |
See accompanying Notes to Financial Statements.
| | |
| |
| ASTON/Montag & Caldwell Balanced Fund | | April 30, 2015 |
| |
| Schedule of Investments (unaudited) – continued | | |
| | | | |
Portfolio Composition | | | | |
Common Stocks | | | 60% | |
U.S. Government and Agency Obligations | | | 13% | |
Investment Company | | | 4% | |
Corporate Notes and Bonds | | | | |
(Moody’s Ratings) | | | | |
Aaa | | | 5% | |
Aa | | | 11% | |
A | | | 7% | |
| | | | |
| | | 100% | |
| | | | |
For financial reporting purposes, credit quality ratings shown are assigned by Moody’s Investors Service. If a Moody’s credit quality rating is not available the credit quality ratings shown are assigned by Standard & Poor’s. These rating agencies are independent, nationally recognized statistical rating organizations and are widely used. Investment grade ratings are credit ratings of Baa/ BBB or higher. Below investment grade ratings are credit ratings of Ba/BB or lower. Investments designated N/R are not rated by either rating agency. Credit quality ratings are subject to change.
See accompanying Notes to Financial Statements.
This page intentionally left blank.
| | |
| |
| | April 30, 2015 |
| |
| Statements of Assets and Liabilities (unaudited) | | |
| | | | | | | | |
| | |
| |
| Cornerstone
Large Cap
Value Fund
|
| |
| Fairpointe
Focused
Equity Fund
|
|
| | |
ASSETS: | | | | | | | | |
Investments: | | | | | | | | |
Investments at cost | | $ | 148,523,620 | | | $ | 6,105,854 | |
Net unrealized appreciation | | | 3,276,522 | | | | 190,078 | |
| | | | | | | | |
Total investments at value | | | 151,800,142 | | | | 6,295,932 | |
Receivables: | | | | | | | | |
Dividends and interest | | | 46,508 | | | | 2,827 | |
Dividend reclaims | | | 5,317 | | | | — | |
Fund shares sold | | | 83,328 | | | | — | |
Investments sold | | | 1,054,505 | | | | 64,290 | |
Due from Adviser, net (Note G) | | | — | | | | 9,800 | |
Other assets | | | 1,075 | | | | 38,984 | |
| | | | | | | | |
Total assets | | | 152,990,875 | | | | 6,411,833 | |
| | | | | | | | |
| | |
LIABILITIES: | | | | | | | | |
Payables: | | | | | | | | |
Dividend distribution | | | — | | | | — | |
Investments purchased | | | — | | | | 145,833 | |
Fund shares redeemed | | | 423,547 | | | | — | |
Due to Adviser, net (Note G) | | | 100,523 | | | | — | |
Administration fees (Note G) | | | 6,592 | | | | 2,258 | |
Distribution fees (Note G) | | | 1,547 | | | | 57 | |
Audit and tax fees | | | 11,835 | | | | 7,589 | |
Custodian fees | | | 11,220 | | | | 413 | |
Transfer agent fees | | | 10,529 | | | | 2,376 | |
Offering costs | | | — | | | | 58,224 | |
Accrued expenses and other payables | | | 7,411 | | | | 9,270 | |
| | | | | | | | |
Total liabilities | | | 573,204 | | | | 226,020 | |
| | | | | | | | |
NET ASSETS | | $ | 152,417,671 | | | $ | 6,185,813 | |
| | | | | | | | |
| | |
NET ASSETS CONSIST OF: | | | | | | | | |
Paid-in capital | | $ | 163,341,268 | | | $ | 5,910,663 | |
Accumulated undistributed (distribution in excess of) net investment income (loss) | | | 244,332 | | | | 14,021 | |
Accumulated net realized gain (loss) on investments | | | (14,444,451 | ) | | | 71,051 | |
Net unrealized appreciation on investments | | | 3,276,522 | | | | 190,078 | |
| | | | | | | | |
TOTAL NET ASSETS | | $ | 152,417,671 | | | $ | 6,185,813 | |
| | | | | | | | |
Class N: | | | | | | | | |
Net Assets | | $ | 56,060,806 | | | $ | 2,091,793 | |
Shares of beneficial interest outstanding (unlimited authorization) | | | 3,725,969 | | | | 200,054 | |
NET ASSET VALUE Offering and redemption price per share
(Net Assets/Shares Outstanding) | | $ | 15.05 | | | $ | 10.46 | |
| | | | | | | | |
Class I: | | | | | | | | |
Net Assets | | $ | 96,356,865 | | | $ | 4,094,020 | |
Shares of beneficial interest outstanding (unlimited authorization) | | | 6,389,998 | | | | 391,185 | |
NET ASSET VALUE Offering and redemption price per share
(Net Assets/Shares Outstanding) | | $ | 15.08 | | | $ | 10.47 | |
| | | | | | | | |
Class R: | | | | | | | | |
Net Assets | | $ | — | | | $ | — | |
Shares of beneficial interest outstanding (unlimited authorization) | | | — | | | | — | |
NET ASSET VALUE Offering and redemption price per share
(Net Assets/Shares Outstanding) | | $ | — | | | $ | — | |
| | | | | | | | |
See accompanying Notes to Financial Statements.
| | | | | | | | | | | | | | | | | | | | | | | | | | |
| | | | | | |
| Herndon
Large Cap
Value Fund
|
| |
| Montag & Caldwell
Growth Fund
|
| |
| TAMRO
Diversified
Equity Fund
|
| |
| River Road
Dividend All
Cap Value Fund
|
| |
| River Road
Dividend All
Cap Value Fund II
|
| |
| Fairpointe
Mid Cap Fund
|
| |
| Montag & Caldwell
Mid Cap
Growth Fund
|
|
| | | | | | |
| | | | | | | | | | | | | | | | | | | | | | | | | | |
| | | | | | | | | | | | | | | | | | | | | | | | | | |
| $ | 122,421,490 | | | $ | 2,154,403,939 | | | $ | 30,780,768 | | | $ | 783,709,878 | | | $ | 128,180,127 | | | $ | 4,806,495,432 | | | $ | 8,549,697 | |
| | 18,175,534 | | | | 285,926,158 | | | | 12,565,457 | | | | 207,506,573 | | | | 14,458,858 | | | | 929,881,173 | | | | 1,936,214 | |
| | | | | | | | | | | | | | | | | | | | | | | | | | |
| | 140,597,024 | | | | 2,440,330,097 | | | | 43,346,225 | | | | 991,216,451 | | | | 142,638,985 | | | | 5,736,376,605 | | | | 10,485,911 | |
| | | | | | | | | | | | | | | | | | | | | | | | | | |
| | 124,785 | | | | 2,846,022 | | | | 19,966 | | | | 1,270,476 | | | | 179,089 | | | | 846,969 | | | | 3,424 | |
| | — | | | | — | | | | — | | | | 9,544 | | | | — | | | | — | | | | — | |
| | 185,576 | | | | 1,795,973 | | | | 42,348 | | | | 784,340 | | | | 83,670 | | | | 6,180,977 | | | | — | |
| | — | | | | 92,876,815 | | | | — | | | | — | | | | — | | | | 58,057,633 | | | | — | |
| | — | | | | — | | | | — | | | | — | | | | — | | | | — | | | | 193 | |
| | 10,044 | | | | 35,264 | | | | 373 | | | | 8,123 | | | | 929 | | | | 53,330 | | | | 97 | |
| | | | | | | | | | | | | | | | | | | | | | | | | | |
| | 140,917,429 | | | | 2,537,884,171 | | | | 43,408,912 | | | | 993,288,934 | | | | 142,902,673 | | | | 5,801,515,514 | | | | 10,489,625 | |
| | | | | | | | | | | | | | | | | | | | | | | | | | |
| | | | | | |
| | | | | | | | | | | | | | | | | | | | | | | | | | |
| | | | | | | | | | | | | | | | | | | | | | | | | | |
| | — | | | | — | | | | — | | | | 170,837 | | | | 8,776 | | | | — | | | | — | |
| | — | | | | 27,489,899 | | | | 46,040 | | | | 1,855,342 | | | | 32,145 | | | | 37,671,646 | | | | 86,391 | |
| | 244,184 | | | | 23,017,705 | | | | 20,482 | | | | 1,402,343 | | | | 239,323 | | | | 8,444,908 | | | | — | |
| | 122,508 | | | | 1,601,585 | | | | 20,825 | | | | 574,450 | | | | 82,186 | | | | 3,350,052 | | | | — | |
| | 6,509 | | | | 108,470 | | | | 3,048 | | | | 37,229 | | | | 6,529 | | | | 205,810 | | | | 1,720 | |
| | 286 | | | | 24,736 | | | | 587 | | | | 6,777 | | | | 178 | | | | 66,673 | | | | 144 | |
| | 10,340 | | | | 16,962 | | | | 10,097 | | | | 12,560 | | | | 12,560 | | | | 16,957 | | | | 10,097 | |
| | 4,277 | | | | 45,703 | | | | 1,325 | | | | 14,946 | | | | 2,901 | | | | 55,741 | | | | 53 | |
| | 11,795 | | | | 379,821 | | | | 6,929 | | | | 209,670 | | | | 12,582 | | | | 1,121,426 | | | | 5,800 | |
| | — | | | | — | | | | — | | | | — | | | | — | | | | — | | | | — | |
| | 6,137 | | | | 199,781 | | | | 6,102 | | | | 41,835 | | | | 16,951 | | | | 236,398 | | | | 4,598 | |
| | | | | | | | | | | | | | | | | | | | | | | | | | |
| | 406,036 | | | | 52,884,662 | | | | 115,435 | | | | 4,325,989 | | | | 414,131 | | | | 51,169,611 | | | | 108,803 | |
| | | | | | | | | | | | | | | | | | | | | | | | | | |
| $ | 140,511,393 | | | $ | 2,484,999,509 | | | $ | 43,293,477 | | | $ | 988,962,945 | | | $ | 142,488,542 | | | $ | 5,750,345,903 | | | $ | 10,380,822 | |
| | | | | | | | | | | | | | | | | | | | | | | | | | |
| | | | | | |
| | | | | | | | | | | | | | | | | | | | | | | | | | |
| $ | 120,573,087 | | | $ | 1,667,199,361 | | | $ | 27,527,009 | | | $ | 725,911,004 | | | $ | 125,838,015 | | | $ | 4,383,298,105 | | | $ | 7,604,001 | |
| | 289,364 | | | | 5,436,605 | | | | 1,756 | | | | (1,419,801 | ) | | | (172,071 | ) | | | 1,416,969 | | | | (21,306 | ) |
| | 1,473,408 | | | | 526,437,385 | | | | 3,199,255 | | | | 56,965,169 | | | | 2,363,740 | | | | 435,749,656 | | | | 861,913 | |
| | 18,175,534 | | | | 285,926,158 | | | | 12,565,457 | | | | 207,506,573 | | | | 14,458,858 | | | | 929,881,173 | | | | 1,936,214 | |
| | | | | | | | | | | | | | | | | | | | | | | | | | |
| $ | 140,511,393 | | | $ | 2,484,999,509 | | | $ | 43,293,477 | | | $ | 988,962,945 | | | $ | 142,488,542 | | | $ | 5,750,345,903 | | | $ | 10,380,822 | |
| | | | | | | | | | | | | | | | | | | | | | | | | | |
| | | | | | | | | | | | | | | | | | | | | | | | | | |
| $ | 10,390,753 | | | $ | 872,677,702 | | | $ | 20,971,838 | | | $ | 244,562,361 | | | $ | 6,430,151 | | | $ | 2,410,369,765 | | | $ | 5,130,950 | |
| | 727,631 | | | | 34,240,830 | | | | 1,172,415 | | | | 18,396,848 | | | | 472,699 | | | | 56,887,485 | | | | 433,974 | |
| | | | | | | | | | | | | | | | | | | | | | | | | | |
| $ | 14.28 | | | $ | 25.49 | | | $ | 17.89 | | | $ | 13.29 | | | $ | 13.60 | | | $ | 42.37 | | | $ | 11.82 | |
| | | | | | | | | | | | | | | | | | | | | | | | | | |
| | | | | | | | | | | | | | | | | | | | | | | | | | |
| $ | 130,120,640 | | | $ | 1,606,176,562 | | | $ | 22,321,639 | | | $ | 744,400,584 | | | $ | 136,058,391 | | | $ | 3,339,976,138 | | | $ | 5,249,872 | |
| | 9,134,420 | | | | 62,731,300 | | | | 1,241,282 | | | | 56,039,651 | | | | 9,997,175 | | | | 77,104,186 | | | | 443,155 | |
| | | | | | | | | | | | | | | | | | | | | | | | | | |
| $ | 14.25 | | | $ | 25.60 | | | $ | 17.98 | | | $ | 13.28 | | | $ | 13.61 | | | $ | 43.32 | | | $ | 11.85 | |
| | | | | | | | | | | | | | | | | | | | | | | | | | |
| | | | | | | | | | | | | | | | | | | | | | | | | | |
| $ | — | | | $ | 6,145,245 | | | $ | — | | | $ | — | | | $ | — | | | $ | — | | | $ | — | |
| | — | | | | 244,905 | | | | — | | | | — | | | | — | | | | — | | | | — | |
| | | | | | | | | | | | | | | | | | | | | | | | | | |
| $ | — | | | $ | 25.09 | | | $ | — | | | $ | — | | | $ | — | | | $ | — | | | $ | — | |
| | | | | | | | | | | | | | | | | | | | | | | | | | |
See accompanying Notes to Financial Statements.
| | |
| |
| | April 30, 2015 |
| |
| Statements of Assets and Liabilities (unaudited) | | |
| | | | | | | | |
| | |
| |
| LMCG
Small Cap Growth Fund |
| |
| River Road
Independent
Value Fund
|
|
| | |
ASSETS: | | | | | | | | |
Investments: | | | | | | | | |
Investments at cost | | $ | 109,547,180 | | | $ | 457,784,018 | |
Affiliated Investment at cost (Note G) | | | — | | | | — | |
Net unrealized appreciation (depreciation) | | | 8,428,115 | | | | (1,697,985 | ) |
| | | | | | �� | | |
Total investments at value | | | 117,975,295 | | | | 456,086,033 | |
Total affilated investments at value (Note G) | | | — | | | | — | |
Cash | | | — | | | | — | |
Receivables: | | | | | | | | |
Dividends and interest | | | 4,698 | | | | 11 | |
Fund shares sold | | | 1,428,068 | | | | 771,649 | |
Investments sold | | | 1,407,462 | | | | 2,674,516 | |
Other assets | | | 3,731 | | | | 4,276 | |
| | | | | | | | |
Total assets | | | 120,819,254 | | | | 459,536,485 | |
| | | | | | | | |
| | |
LIABILITIES: | | | | | | | | |
Payables: | | | | | | | | |
Dividend distribution | | | — | | | | — | |
Investments purchased | | | 3,886,619 | | | | — | |
Fund shares redeemed | | | 143,165 | | | | 4,284,555 | |
Due to Adviser, net (Note G) | | | 78,087 | | | | 381,096 | |
Administration fees (Note G) | | | 5,420 | | | | 17,897 | |
Distribution fees (Note G) | | | 2,090 | | | | 7,200 | |
Audit and tax fees | | | 10,097 | | | | 10,097 | |
Custodian fees | | | 1,662 | | | | 7,512 | |
Transfer agent fees | | | 11,033 | | | | 91,822 | |
Accrued expenses and other payables | | | 1,577 | | | | 47,559 | |
Call options written, at value (premiums received $5,308,690) | | | — | | | | — | |
| | | | | | | | |
Total liabilities | | | 4,139,750 | | | | 4,847,738 | |
| | | | | | | | |
NET ASSETS | | $ | 116,679,504 | | | $ | 454,688,747 | |
| | | | | | | | |
| | |
NET ASSETS CONSIST OF: | | | | | | | | |
Paid-in capital | | $ | 106,577,991 | | | $ | 472,060,221 | |
Accumulated undistributed (distribution in excess of) net investment income (loss) | | | (376,251 | ) | | | (2,802,440 | ) |
Accumulated net realized gain (loss) on investments, purchased and written options and capital gain distributions received | | | 2,049,649 | | | | (12,871,049 | ) |
Net unrealized appreciation (depreciation) on investments and purchased and written options | | | 8,428,115 | | | | (1,697,985 | ) |
| | | | | | | | |
TOTAL NET ASSETS | | $ | 116,679,504 | | | $ | 454,688,747 | |
| | | | | | | | |
Class N: | | | | | | | | |
Net Assets | | $ | 75,529,467 | | | $ | 261,050,459 | |
Shares of beneficial interest outstanding (unlimited authorization) | | | 4,905,776 | | | | 25,314,346 | |
NET ASSET VALUE Offering and redemption price per share
(Net Assets/Shares Outstanding) | | $ | 15.40 | | | $ | 10.31 | |
| | | | | | | | |
Class I: | | | | | | | | |
Net Assets | | $ | 41,150,037 | | | $ | 193,638,288 | |
Shares of beneficial interest outstanding (unlimited authorization) | | | 2,646,402 | | | | 18,580,802 | |
NET ASSET VALUE Offering and redemption price per share
(Net Assets/Shares Outstanding) | | $ | 15.55 | | | $ | 10.42 | |
| | | | | | | | |
See accompanying Notes to Financial Statements.
| | | | | | | | | | | | | | | | | | | | | | | | | | |
| | | | | | |
River Road
Select Value
Fund | | | River Road
Small Cap
Value Fund | | | Silvercrest
Small Cap
Fund | | | TAMRO
Small Cap
Fund | | | DoubleLine Core
Plus Fixed
Income Fund | | | TCH
Fixed Income
Fund | | | Anchor Capital
Enhanced Equity
Fund | |
| | | | | | |
| | | | | | | | | | | | | | | | | | | | | | | | | | |
| | | | | | | | | | | | | | | | | | | | | | | | | | |
| $ | 122,256,173 | | | $ | 230,070,128 | | | $ | 108,756,657 | | | $ | 533,048,607 | | | $ | 351,334,569 | | | $ | 52,319,384 | | | $ | 196,104,086 | |
| | — | | | | — | | | | — | | | | — | | | | 9,740,460 | | | | — | | | | — | |
| | 10,772,697 | | | | 46,937,927 | | | | 4,205,088 | | | | 167,837,779 | | | | 2,126,250 | | | | 2,749,447 | | | | 18,452,023 | |
| | | | | | | | | | | | | | | | | | | | | | | | | | |
| | 133,028,870 | | | | 277,008,055 | | | | 112,961,745 | | | | 700,886,386 | | | | 353,389,672 | | | | 55,068,831 | | | | 214,556,109 | |
| | — | | | | — | | | | — | | | | — | | | | 9,811,607 | | | | — | | | | — | |
| | — | | | | — | | | | 29,143 | | | | — | | | | 1,398 | | | | — | | | | 49,449 | |
| | | | | | | | | | | | | | | | | | | | | | | | | | |
| | 61,621 | | | | 10,671 | | | | 43,477 | | | | 48,091 | | | | 2,714,179 | | | | 454,632 | | | | 349,998 | |
| | 952 | | | | 204,623 | | | | 177,423 | | | | 770,658 | | | | 1,085,545 | | | | 4,621 | | | | 704,309 | |
| | 1,902,497 | | | | 258,326 | | | | — | | | | 1,826,015 | | | | 4,110,944 | | | | — | | | | 13,480 | |
| | 5,607 | | | | 2,097 | | | | 494 | | | | 6,436 | | | | 20,285 | | | | 373 | | | | 1,494 | |
| | | | | | | | | | | | | | | | | | | | | | | | | | |
| | 134,999,547 | | | | 277,483,772 | | | | 113,212,282 | | | | 703,537,586 | | | | 371,133,630 | | | | 55,528,457 | | | | 215,674,839 | |
| | | | | | | | | | | | | | | | | | | | | | | | | | |
| | | | | | |
| | | | | | | | | | | | | | | | | | | | | | | | | | |
| | | | | | | | | | | | | | | | | | | | | | | | | | |
| | 86 | | | | — | | | | 77 | | | | — | | | | 128,771 | | | | 6,584 | | | | — | |
| | 771,192 | | | | 1,672,022 | | | | 1,482,102 | | | | 3,906,360 | | | | 5,158,531 | | | | — | | | | 7,020 | |
| | 1,911,150 | | | | 578,830 | | | | 185,148 | | | | 846,554 | | | | 550,802 | | | | 61,240 | | | | 633,465 | |
| | 113,654 | | | | 206,322 | | | | 94,509 | | | | 537,367 | | | | 146,704 | | | | 14,720 | | | | 123,248 | |
| | 6,673 | | | | 11,553 | | | | 5,677 | | | | 27,477 | | | | 23,526 | | | | 6,780 | | | | 8,047 | |
| | 195 | | | | 722 | | | | 149 | | | | 7,902 | | | | 3,197 | | | | 1,045 | | | | 2,772 | |
| | 11,835 | | | | 11,835 | | | | 10,097 | | | | 12,077 | | | | 16,900 | | | | 13,735 | | | | 11,202 | |
| | 4,380 | | | | 3,414 | | | | 1,660 | | | | 18,060 | | | | 4,968 | | | | 2,088 | | | | 14,661 | |
| | 13,700 | | | | 83,987 | | | | 15,641 | | | | 168,456 | | | | 14,052 | | | | 8,030 | | | | 21,408 | |
| | 9,673 | | | | 19,058 | | | | 14,860 | | | | 56,643 | | | | 7,195 | | | | 8,942 | | | | 15,201 | |
| | — | | | | — | | | | — | | | | — | | | | — | | | | — | | | | 6,812,124 | |
| | | | | | | | | | | | | | | | | | | | | | | | | | |
| | 2,842,538 | | | | 2,587,743 | | | | 1,809,920 | | | | 5,580,896 | | | | 6,054,646 | | | | 123,164 | | | | 7,649,148 | |
| | | | | | | | | | | | | | | | | | | | | | | | | | |
| $ | 132,157,009 | | | $ | 274,896,029 | | | $ | 111,402,362 | | | $ | 697,956,690 | | | $ | 365,078,984 | | | $ | 55,405,293 | | | $ | 208,025,691 | |
| | | | | | | | | | | | | | | | | | | | | | | | | | |
| | | | | | |
| | | | | | | | | | | | | | | | | | | | | | | | | | |
| $ | 116,736,588 | | | $ | 223,780,209 | | | $ | 103,418,168 | | | $ | 452,901,640 | | | $ | 366,365,759 | | | $ | 56,193,357 | | | $ | 194,722,777 | |
| | (199,768 | ) | | | (370,098 | ) | | | 75,044 | | | | (6,002,514 | ) | | | (626,987 | ) | | | (812 | ) | | | 376,537 | |
| | | | | | | | | | | | | | | | | | | | | | | | | | |
| | 4,847,492 | | | | 4,547,991 | | | | 3,704,062 | | | | 83,219,785 | | | | (2,786,038 | ) | | | (3,536,699 | ) | | | (4,022,212 | ) |
| | 10,772,697 | | | | 46,937,927 | | | | 4,205,088 | | | | 167,837,779 | | | | 2,126,250 | | | | 2,749,447 | | | | 16,948,589 | |
| | | | | | | | | | | | | | | | | | | | | | | | | | |
| $ | 132,157,009 | | | $ | 274,896,029 | | | $ | 111,402,362 | | | $ | 697,956,690 | | | $ | 365,078,984 | | | $ | 55,405,293 | | | $ | 208,025,691 | |
| | | | | | | | | | | | | | | | | | | | | | | | | | |
| | | | | | | | | | | | | | | | | | | | | | | | | | |
| $ | 7,004,497 | | | $ | 26,001,238 | | | $ | 5,288,133 | | | $ | 279,247,414 | | | $ | 116,756,279 | | | $ | 38,047,589 | | | $ | 100,749,835 | |
| | 899,198 | | | | 2,129,747 | | | | 348,176 | | | | 14,140,249 | | | | 10,728,830 | | | | 3,510,653 | | | | 10,352,613 | |
| | | | | | | | | | | | | | | | | | | | | | | | | | |
| $ | 7.79 | | | $ | 12.21 | | | $ | 15.19 | | | $ | 19.75 | | | $ | 10.88 | | | $ | 10.84 | | | $ | 9.73 | |
| | | | | | | | | | | | | | | | | | | | | | | | | | |
| | | | | | | | | | | | | | | | | | | | | | | | | | |
| $ | 125,152,512 | | | $ | 248,894,791 | | | $ | 106,114,229 | | | $ | 418,709,276 | | | $ | 248,322,705 | | | $ | 17,357,704 | | | $ | 107,275,856 | |
| | 15,825,722 | | | | 20,230,586 | | | | 6,948,945 | | | | 20,452,055 | | | | 22,831,940 | | | | 1,601,272 | | | | 11,011,117 | |
| | | | | | | | | | | | | | | | | | | | | | | | | | |
| $ | 7.91 | | | $ | 12.30 | | | $ | 15.27 | | | $ | 20.47 | | | $ | 10.88 | | | $ | 10.84 | | | $ | 9.74 | |
| | | | | | | | | | | | | | | | | | | | | | | | | | |
See accompanying Notes to Financial Statements.
| | |
| |
| | April 30, 2015 |
| |
| Statements of Assets and Liabilities (unaudited) | | |
| | | | | | | | |
| | |
| |
| Lake Partners
LASSO
Alternatives Fund
|
| |
| River Road
Long-Short
Fund |
|
| | |
ASSETS: | | | | | | | | |
Investments: | | | | | | | | |
Investments at cost | | $ | 314,352,452 | | | $ | 199,880,761 | |
Net unrealized appreciation (depreciation) | | | 10,910,261 | | | | 8,683,989 | |
| | | | | | | | |
Total investments at value | | | 325,262,713 | | | | 208,564,750 | |
Foreign currency (Cost $35,741) | | | — | | | | 134,220 | |
Cash | | | 778,000 | | | | 1,794,904 | |
Segregated Cash (Note B-5) | | | — | | | | 32,054,567 | |
Receivables: | | | | | | | | |
Dividends and interest | | | 86,142 | | | | 162,501 | |
Dividend reclaims | | | — | | | | 14,964 | |
Fund shares sold | | | 756,222 | | | | 651,842 | |
Investments sold | | | — | | | | 2,338,610 | |
Due from Adviser, net (Note G) | | | — | | | | — | |
Deferred offering costs (Note B-13) | | | — | | | | — | |
Other assets | | | 25,324 | | | | 1,418 | |
| | | | | | | | |
Total assets | | | 326,908,401 | | | | 245,717,776 | |
| | | | | | | | |
| | |
LIABILITIES: | | | | | | | | |
Payables: | | | | | | | | |
Interest and dividends on securities sold short | | | — | | | | 3,944 | |
Investments purchased | | | 5,011,703 | | | | 7,283,796 | |
Fund shares redeemed | | | 510,118 | | | | 437,510 | |
Due to Adviser, net (Note G) | | | 257,173 | | | | 210,792 | |
Administration fees (Note G) | | | 12,866 | | | | 8,148 | |
Distribution fees (Note G) | | | 1,808 | | | | 2,829 | |
Audit and tax fees | | | 11,202 | | | | 11,928 | |
Custodian fees | | | 4,738 | | | | 7,464 | |
Transfer agent fees | | | 31,539 | | | | 14,260 | |
Offering costs | | | — | | | | — | |
Accrued expenses and other payables | | | 14,213 | | | | 21,090 | |
Securities sold short, at value (proceeds $53,361,998) | | | — | | | | 53,829,167 | |
| | | | | | | | |
Total liabilities | | | 5,855,360 | | | | 61,830,928 | |
| | | | | | | | |
NET ASSETS | | $ | 321,053,041 | | | $ | 183,886,848 | |
| | | | | | | | |
| | |
NET ASSETS CONSIST OF: | | | | | | | | |
Paid-in capital | | $ | 295,051,084 | | | $ | 184,220,877 | |
Accumulated undistributed (distribution in excess of) net investment income (loss) | | | (2,724,787 | ) | | | (843,917 | ) |
Accumulated net realized gain (loss) on investments, securities sold short, foreign currency transactions and capital gain distributions received | | | 17,816,483 | | | | (7,709,513 | ) |
Net unrealized appreciation (depreciation) on investments, securities sold short, and translation of assets and liabilities in foreign currency | | | 10,910,261 | | | | 8,219,401 | |
| | | | | | | | |
TOTAL NET ASSETS | | $ | 321,053,041 | | | $ | 183,886,848 | |
| | | | | | | | |
Class N: | | | | | | | | |
Net Assets | | $ | 65,372,786 | | | $ | 102,377,389 | |
Shares of beneficial interest outstanding (unlimited authorization) | | | 4,968,437 | | | | 8,870,157 | |
NET ASSET VALUE Offering and redemption price per share (Net Assets/Shares Outstanding) | | $ | 13.16 | | | $ | 11.54 | |
| | | | | | | | |
Class I: | | | | | | | | |
Net Assets | | $ | 255,680,255 | | | $ | 81,509,459 | |
Shares of beneficial interest outstanding (unlimited authorization) | | | 19,384,541 | | | | 7,020,685 | |
NET ASSET VALUE Offering and redemption price per share
(Net Assets/Shares Outstanding) | | $ | 13.19 | | | $ | 11.61 | |
| | | | | | | | |
See accompanying Notes to Financial Statements.
| | | | | | | | | | | | | | | | | | | | | | | | | | |
| | | | | | |
| Barings
International
Fund |
| |
| Guardian
Capital Global
Dividend Fund |
| |
| LMCG
Emerging
Markets Fund |
| |
| Pictet
International
Fund |
| |
| TAMRO
International
Small Cap Fund
|
| |
| Harrison Street
Real Estate
Fund |
| |
| Montag & Caldwell
Balanced Fund
|
|
| | | | | | |
| | | | | | | | | | | | | | | | | | | | | | | | | | |
| | | | | | | | | | | | | | | | | | | | | | | | | | |
| $ | 18,811,246 | | | $ | 4,158,406 | | | $ | 3,696,784 | | | $ | 32,400,792 | | | $ | 1,778,710 | | | $ | 12,864,177 | | | $ | 19,076,693 | |
| | 2,441,968 | | | | 310,887 | | | | 335,480 | | | | 2,240,863 | | | | 108,385 | | | | (25,838 | ) | | | 2,641,827 | |
| | | | | | | | | | | | | | | | | | | | | | | | | | |
| | 21,253,214 | | | | 4,469,293 | | | | 4,032,264 | | | | 34,641,655 | | | | 1,887,095 | | | | 12,838,339 | | | | 21,718,520 | |
| | 11,715 | | | | 2,366 | | | | 35,435 | | | | 431,916 | | | | — | | | | — | | | | — | |
| | — | | | | — | | | | — | | | | — | | | | — | | | | — | | | | 4,030 | |
| | — | | | | — | | | | — | | | | — | | | | — | | | | — | | | | — | |
| | | | | | | | | | | | | | | | | | | | | | | | | | |
| | 81,239 | | | | 11,883 | | | | 3,041 | | | | 87,532 | | | | 5,359 | | | | 5,433 | | | | 70,125 | |
| | 110,960 | | | | 3,212 | | | | — | | | | 13,280 | | | | 361 | | | | 1,916 | | | | — | |
| | — | | | | 500 | | | | — | | | | 143,111 | | | | — | | | | 482 | | | | 291 | |
| | 49,493 | | | | 4,298 | | | | — | | | | 149,130 | | | | 25,184 | | | | — | | | | 320,389 | |
| | — | | | | 7,409 | | | | 9,316 | | | | — | | | | 12,406 | | | | — | | | | — | |
| | — | | | | — | | | | — | | | | — | | | | 38,795 | | | | — | | | | — | |
| | 179 | | | | 6,049 | | | | 8,585 | | | | 6,200 | | | | 9 | | | | 98 | | | | 169 | |
| | | | | | | | | | | | | | | | | | | | | | | | | | |
| | 21,506,800 | | | | 4,505,010 | | | | 4,088,641 | | | | 35,472,824 | | | | 1,969,209 | | | | 12,846,268 | | | | 22,113,524 | |
| | | | | | | | | | | | | | | | | | | | | | | | | | |
| | | | | | |
| | | | | | | | | | | | | | | | | | | | | | | | | | |
| | | | | | | | | | | | | | | | | | | | | | | | | | |
| | — | | | | — | | | | — | | | | — | | | | — | | | | — | | | | — | |
| | 55,079 | | | | 11,176 | | | | — | | | | 229,813 | | | | 25,320 | | | | — | | | | 104,726 | |
| | — | | | | — | | | | — | | | | 11,366 | | | | — | | | | — | | | | 175 | |
| | 4,553 | | | | — | | | | — | | | | 15,380 | | | | — | | | | 1,829 | | | | 8,598 | |
| | 8,504 | | | | 2,917 | | | | 4,874 | | | | 4,645 | | | | 1,748 | | | | 1,696 | | | | 3,020 | |
| | 10 | | | | 30 | | | | 21 | | | | 29 | | | | 32 | | | | 342 | | | | 225 | |
| | 11,835 | | | | 11,835 | | | | 14,804 | | | | 11,835 | | | | 8,956 | | | | 10,823 | | | | 13,735 | |
| | 13,945 | | | | 3,762 | | | | 17,133 | | | | 4,303 | | | | 1,520 | | | | 2,674 | | | | 1,424 | |
| | 7,030 | | | | 3,917 | | | | 4,032 | | | | 4,360 | | | | 2,667 | | | | 5,870 | | | | 5,973 | |
| | — | | | | — | | | | — | | | | — | | | | 58,224 | | | | — | | | | — | |
| | 4,005 | | | | 644 | | | | 1,269 | | | | 1,196 | | | | 9,014 | | | | 14,104 | | | | 8,075 | |
| | — | | | | — | | | | — | | | | — | | | | — | | | | — | | | | — | |
| | | | | | | | | | | | | | | | | | | | | | | | | | |
| | 104,961 | | | | 34,281 | | | | 42,133 | | | | 282,927 | | | | 107,481 | | | | 37,338 | | | | 145,951 | |
| | | | | | | | | | | | | | | | | | | | | | | | | | |
| $ | 21,401,839 | | | $ | 4,470,729 | | | $ | 4,046,508 | | | $ | 35,189,897 | | | $ | 1,861,728 | | | $ | 12,808,930 | | | $ | 21,967,573 | |
| | | | | | | | | | | | | | | | | | | | | | | | | | |
| | | | | | |
| | | | | | | | | | | | | | | | | | | | | | | | | | |
| $ | 18,941,855 | | | $ | 4,191,041 | | | $ | 4,055,607 | | | $ | 33,043,313 | | | $ | 1,755,151 | | | $ | 23,623,419 | | | $ | 18,741,063 | |
| | | | | | | | | | | | | | | | | | | | | | | | | | |
| | 82,402 | | | | 29,855 | | | | (3,622 | ) | | | 83,346 | | | | 5,564 | | | | 59,644 | | | | (339,932 | ) |
| | | | | | | | | | | | | | | | | | | | | | | | | | |
| | (51,556 | ) | | | (61,085 | ) | | | (340,613 | ) | | | (179,809 | ) | | | (7,347 | ) | | | (10,848,295 | ) | | | 924,615 | |
| | 2,429,138 | | | | 310,918 | | | | 335,136 | | | | 2,243,047 | | | | 108,360 | | | | (25,838 | ) | | | 2,641,827 | |
| | | | | | | | | | | | | | | | | | | | | | | | | | |
| $ | 21,401,839 | | | $ | 4,470,729 | | | $ | 4,046,508 | | | $ | 35,189,897 | | | $ | 1,861,728 | | | $ | 12,808,930 | | | $ | 21,967,573 | |
| | | | | | | | | | | | | | | | | | | | | | | | | | |
| | | | | | | | | | | | | | | | | | | | | | | | | | |
| $ | 354,775 | | | $ | 1,082,275 | | | $ | 748,122 | | | $ | 1,054,783 | | | $ | 1,144,122 | | | $ | 12,070,061 | | | $ | 20,255,286 | |
| | 55,115 | | | | 101,286 | | | | 76,321 | | | | 105,907 | | | | 106,175 | | | | 972,516 | | | | 874,865 | |
| | | | | | | | | | | | | | | | | | | | | | | | | | |
| $ | 6.44 | | | $ | 10.69 | | | $ | 9.80 | | | $ | 9.96 | | | $ | 10.78 | | | $ | 12.41 | | | $ | 23.15 | |
| | | | | | | | | | | | | | | | | | | | | | | | | | |
| | | | | | | | | | | | | | | | | | | | | | | | | | |
| $ | 21,047,064 | | | $ | 3,388,454 | | | $ | 3,298,386 | | | $ | 34,135,114 | | | $ | 717,606 | | | $ | 738,869 | | | $ | 1,712,287 | |
| | 3,267,484 | | | | 317,479 | | | | 335,417 | | | | 3,419,462 | | | | 66,529 | | | | 59,896 | | | | 74,213 | |
| | | | | | | | | | | | | | | | | | | | | | | | | | |
| $ | 6.44 | | | $ | 10.67 | | | $ | 9.83 | | | $ | 9.98 | | | $ | 10.79 | | | $ | 12.34 | | | $ | 23.07 | |
| | | | | | | | | | | | | | | | | | | | | | | | | | |
See accompanying Notes to Financial Statements.
| | |
| |
| For the Six Months Ended April 30, 2015 | | |
| |
| Statements of Operations (unaudited) | | |
| | | | | | | | |
| | |
| | | Cornerstone
Large Cap
Value Fund | | | Fairpointe
Focused
Equity Fund(a) | |
INVESTMENT INCOME: | | | | | | | | |
Dividends | | $ | 1,689,273 | | | $ | 31,409 | |
Less: foreign taxes withheld | | | (12,743 | ) | | | (317 | ) |
| | | | | | | | |
Total investment income | | | 1,676,530 | | | | 31,092 | |
| | | | | | | | |
EXPENSES: | | | | | | | | |
Investment advisory fees (Note G) | | | 633,115 | | | | 14,162 | |
Distribution expenses (Note G)(b) | | | 73,033 | | | | 1,139 | |
Transfer agent fees | | | 67,352 | | | | 8,940 | |
Administration fees (Note G) | | | 41,790 | | | | 6,195 | |
Custodian fees | | | 14,746 | | | | 2,104 | |
Audit and tax fees | | | 10,813 | | | | 7,589 | |
Legal fees | | | 1,293 | | | | 14 | |
Registration expenses | | | 17,356 | | | | 11,487 | |
Amortization of offering costs (Note B-13) | | | — | | | | 21,041 | |
Reports to shareholder expense | | | 3,751 | | | | 88 | |
Trustees fees and related expenses (Note G) | | | 5,594 | | | | 66 | |
Other expenses | | | 5,566 | | | | 1,771 | |
| | | | | | | | |
Total expenses before waiver/reimbursements/recoupment | | | 874,409 | | | | 74,596 | |
| | | | | | | | |
Less: Investment advisory fees waived (Note G) | | | — | | | | (14,162 | ) |
Less: Expenses reimbursed (Note G) | | | — | | | | (43,363 | ) |
Plus: Expenses recouped (Note G) | | | — | | | | — | |
| | | | | | | | |
Net expenses | | | 874,409 | | | | 17,071 | |
| | | | | | | | |
NET INVESTMENT INCOME (LOSS) | | | 802,121 | | | | 14,021 | |
| | | | | | | | |
NET REALIZED AND UNREALIZED GAIN (LOSS) ON INVESTMENTS: | | | | | | | | |
Net realized gain on investments | | | 3,582,945 | | | | 71,051 | |
Net change in unrealized appreciation (depreciation) on investments | | | (6,119,169 | ) | | | 190,078 | |
| | | | | | | | |
NET REALIZED AND UNREALIZED GAIN (LOSS) ON INVESTMENTS | | | (2,536,224 | ) | | | 261,129 | |
| | | | | | | | |
| | |
NET INCREASE (DECREASE) IN NET ASSETS FROM OPERATIONS | | $ | (1,734,103 | ) | | $ | 275,150 | |
| | | | | | | | |
| (a) | The inception date for Fairpointe Focused Equity Fund is December 24, 2014. |
| (b) | Distribution expense is incurred at the Class N level for all funds except the Montag & Caldwell Growth Fund. The distribution expense for Class N and R of the Montag & Caldwell Growth Fund is $1,380,024 and $18,260, respectively. |
See accompanying Notes to Financial Statements.
| | | | | | | | | | | | | | | | | | | | | | | | | | |
| | | | | | |
| Herndon
Large Cap
Value Fund |
| |
| Montag & Caldwell
Growth Fund |
| |
| TAMRO
Diversified
Equity Fund |
| |
| River Road
Dividend All
Cap Value Fund |
| |
| River Road
Dividend All
Cap Value Fund II |
| |
| Fairpointe
Mid Cap Fund |
| |
| Montag & Caldwell
Mid Cap
Growth Fund |
|
| | | | | | | | | | | | | | | | | | | | | | | | | | |
| $ | 1,310,656 | | | $ | 25,647,637 | | | $ | 259,759 | | | $ | 13,363,992 | | | $ | 1,830,802 | | | $ | 36,002,316 | | | $ | 37,966 | |
| | — | | | | — | | | | — | | | | (152,779 | ) | | | (20,735 | ) | | | (101,615 | ) | | | (190 | ) |
| | | | | | | | | | | | | | | | | | | | | | | | | | |
| | 1,310,656 | | | | 25,647,637 | | | | 259,759 | | | | 13,211,213 | | | | 1,810,067 | | | | 35,900,701 | | | | 37,776 | |
| | | | | | | | | | | | | | | | | | | | | | | | | | |
| | | | | | | | | | | | | | | | | | | | | | | | | | |
| | 571,667 | | | | 11,578,616 | | | | 191,964 | | | | 3,640,362 | | | | 480,591 | | | | 20,281,386 | | | | 44,131 | |
| | 14,609 | | | | 1,398,284 | | | | 30,047 | | | | 344,895 | | | | 8,464 | | | | 3,016,454 | | | | 7,163 | |
| | 56,956 | | | | 1,305,100 | | | | 32,447 | | | | 354,705 | | | | 48,671 | | | | 2,309,917 | | | | 15,098 | |
| | 38,861 | | | | 800,120 | | | | 18,135 | | | | 236,774 | | | | 37,682 | | | | 1,272,936 | | | | 9,709 | |
| | 5,099 | | | | 63,466 | | | | 2,550 | | | | 20,486 | | | | 3,674 | | | | 83,034 | | | | 1,222 | |
| | 9,222 | | | | 15,926 | | | | 9,072 | | | | 11,258 | | | | 11,258 | | | | 15,928 | | | | 9,072 | |
| | 1,202 | | | | 32,754 | | | | 391 | | | | 9,068 | | | | 1,046 | | | | 46,784 | | | | 59 | |
| | 17,852 | | | | 51,490 | | | | 14,813 | | | | 22,811 | | | | 22,811 | | | | 53,983 | | | | 14,380 | |
| | — | | | | — | | | | — | | | | — | | | | — | | | | — | | | | — | |
| | 3,620 | | | | 162,112 | | | | 1,463 | | | | 21,918 | | | | 3,032 | | | | 249,265 | | | | 202 | |
| | 5,059 | | | | 134,721 | | | | 1,694 | | | | 37,502 | | | | 4,642 | | | | 200,620 | | | | 237 | |
| | 5,450 | | | | 88,643 | | | | 3,495 | | | | 25,715 | | | | 5,055 | | | | 96,310 | | | | 2,654 | |
| | | | | | | | | | | | | | | | | | | | | | | | | | |
| | 729,597 | | | | 15,631,232 | | | | 306,071 | | | | 4,725,494 | | | | 626,926 | | | | 27,626,617 | | | | 103,927 | |
| | | | | | | | | | | | | | | | | | | | | | | | | | |
| | — | | | | — | | | | (48,068 | ) | | | — | | | | — | | | | — | | | | (44,131 | ) |
| | — | | | | — | | | | — | | | | — | | | | — | | | | — | | | | (714 | ) |
| | 35,325 | | | | — | | | | — | | | | — | | | | — | | | | — | | | | — | |
| | | | | | | | | | | | | | | | | | | | | | | | | | |
| | 764,922 | | | | 15,631,232 | | | | 258,003 | | | | 4,725,494 | | | | 626,926 | | | | 27,626,617 | | | | 59,082 | |
| | | | | | | | | | | | | | | | | | | | | | | | | | |
| | 545,734 | | | | 10,016,405 | | | | 1,756 | | | | 8,485,719 | | | | 1,183,141 | | | | 8,274,084 | | | | (21,306 | ) |
| | | | | | | | | | | | | | | | | | | | | | | | | | |
| | | | | | | | | | | | | | | | | | | | | | | | | | |
| | 1,849,704 | | | | 535,116,918 | | | | 3,260,838 | | | | 54,995,667 | | | | 2,259,877 | | | | 436,268,285 | | | | 899,037 | |
| | (1,031,369 | ) | | | (399,752,927 | ) | | | (1,983,900 | ) | | | (23,219,800 | ) | | | 1,166,591 | | | | (32,752,447 | ) | | | (150,793 | ) |
| | | | | | | | | | | | | | | | | | | | | | | | | | |
| | 818,335 | | | | 135,363,991 | | | | 1,276,938 | | | | 31,775,867 | | | | 3,426,468 | | | | 403,515,838 | | | | 748,244 | |
| | | | | | | | | | | | | | | | | | | | | | | | | | |
| | | | | | |
| $ | 1,364,069 | | | $ | 145,380,396 | | | $ | 1,278,694 | | | $ | 40,261,586 | | | $ | 4,609,609 | | | $ | 411,789,922 | | | $ | 726,938 | |
| | | | | | | | | | | | | | | | | | | | | | | | | | |
See accompanying Notes to Financial Statements.
| | |
| |
| For the Six Months Ended April 30, 2015 | | |
| |
| Statements of Operations (unaudited) | | |
| | | | | | | | |
| | |
| | | LMCG
Small Cap
Growth Fund | | | River Road
Independent
Value Fund | |
INVESTMENT INCOME: | | | | | | | | |
Dividends | | $ | 124,739 | | | $ | 828,396 | |
Dividends from affiliated security | | | — | | | | — | |
Less: foreign taxes withheld | | | — | | | | (78,974 | ) |
Interest | | | — | | | | — | |
| | | | | | | | |
Total investment income | | | 124,739 | | | | 749,422 | |
| | | | | | | | |
EXPENSES: | �� | | | | | | | |
Investment advisory fees (Note G) | | | 392,903 | | | | 2,715,083 | |
Distribution expenses (Note G)(a) | | | 64,418 | | | | 338,278 | |
Transfer agent fees | | | 40,798 | | | | 234,138 | |
Administration fees (Note G) | | | 24,872 | | | | 126,791 | |
Custodian fees | | | 3,367 | | | | 11,030 | |
Audit and tax fees | | | 9,072 | | | | 9,072 | |
Legal fees | | | 399 | | | | 5,399 | |
Registration expenses | | | 17,356 | | | | 26,779 | |
Reports to shareholder expense | | | 3,597 | | | | 33,105 | |
Trustees fees and related expenses (Note G) | | | 2,196 | | | | 20,626 | |
Other expenses | | | 3,522 | | | | 16,184 | |
| | | | | | | | |
Total expenses before waivers/reimbursements | | | 562,500 | | | | 3,536,485 | |
| | | | | | | | |
Less: Investment advisory fees waived (Note G) | | | (65,889 | ) | | | (21,560 | ) |
| | | | | | | | |
Net expenses | | | 496,611 | | | | 3,514,925 | |
| | | | | | | | |
NET INVESTMENT INCOME (LOSS) | | | (371,872 | ) | | | (2,765,503 | ) |
| | | | | | | | |
NET REALIZED AND UNREALIZED GAIN (LOSS) ON INVESTMENTS: | | | | | | | | |
Net realized gain (loss) on investments | | | 3,219,183 | | | | (1,424,044 | ) |
Net realized gain on affiliated investments | | | — | | | | — | |
Net realized gain (loss) on purchased options | | | — | | | | — | |
Net realized gain (loss) on written options | | | — | | | | — | |
Capital gain distributions received | | | — | | | | — | |
Net change in unrealized appreciation (depreciation) on investments | | | 2,855,846 | | | | 9,390,145 | |
Net change in unrealized appreciation (depreciation) on purchased options | | | — | | | | — | |
Net change in unrealized appreciation (depreciation) on written options | | | — | | | | — | |
| | | | | | | | |
NET REALIZED AND UNREALIZED GAIN ON INVESTMENTS | | | 6,075,029 | | | | 7,966,101 | |
| | | | | | | | |
| | |
NET INCREASE IN NET ASSETS FROM OPERATIONS | | $ | 5,703,157 | | | $ | 5,200,598 | |
| | | | | | | | |
| (a) | Distribution expense is incurred at the Class N level. |
See accompanying Notes to Financial Statements.
| | | | | | | | | | | | | | | | | | | | | | | | | | |
| | | | | | |
River Road
Select Value
Fund | | | River Road
Small Cap
Value Fund | | | Silvercrest
Small Cap
Fund | | | TAMRO
Small Cap
Fund | | | DoubleLine Core
Plus Fixed
Income Fund | | | TCH
Fixed Income
Fund | | | Anchor Capital
Enhanced Equity
Fund | |
| | | | | | | | | | | | | | | | | | | | | | | | | | |
| $ | 733,797 | | | $ | 1,219,557 | | | $ | 650,588 | | | $ | 2,994,273 | | | $ | 6,501 | | | $ | 650 | | | $ | 3,010,152 | |
| | — | | | | — | | | | — | | | | — | | | | 109,374 | | | | — | | | | — | |
| | (1,220 | ) | | | (15,302 | ) | | | — | | | | — | | | | — | | | | — | | | | — | |
| | — | | | | — | | | | — | | | | — | | | | 6,151,414 | | | | 948,336 | | | | — | |
| | | | | | | | | | | | | | | | | | | | | | | | | | |
| | 732,577 | | | | 1,204,255 | | | | 650,588 | | | | 2,994,273 | | | | 6,267,289 | | | | 948,986 | | | | 3,010,152 | |
| | | | | | | | | | | | | | | | | | | | | | | | | | |
| | | | | | | | | | | | | | | | | | | | | | | | | | |
| | 752,654 | | | | 1,268,538 | | | | 427,057 | | | | 3,398,498 | | | | 785,462 | | | | 146,601 | | | | 756,458 | |
| | 9,796 | | | | 46,231 | | | | 7,303 | | | | 399,656 | | | | 80,943 | | | | 46,368 | | | | 127,355 | |
| | 75,231 | | | | 124,436 | | | | 37,958 | | | | 313,888 | | | | 105,293 | | | | 32,214 | | | | 97,484 | |
| | 41,118 | | | | 69,875 | | | | 26,206 | | | | 173,955 | | | | 98,244 | | | | 26,103 | | | | 55,302 | |
| | 7,327 | | | | 7,222 | | | | 3,799 | | | | 24,201 | | | | 12,724 | | | | 3,515 | | | | 29,047 | |
| | 10,813 | | | | 10,813 | | | | 9,072 | | | | 10,961 | | | | 15,876 | | | | 12,710 | | | | 10,179 | |
| | 1,440 | | | | 2,350 | | | | 544 | | | | 6,496 | | | | 1,975 | | | | 419 | | | | 1,671 | |
| | 15,868 | | | | 19,964 | | | | 21,819 | | | | 20,828 | | | | 29,678 | | | | 15,720 | | | | 18,911 | |
| | 6,394 | | | | 7,413 | | | | 1,493 | | | | 33,417 | | | | 9,809 | | | | 1,157 | | | | 11,502 | |
| | 5,606 | | | | 9,917 | | | | 2,558 | | | | 27,044 | | | | 8,356 | | | | 1,796 | | | | 7,415 | |
| | 6,098 | | | | 7,594 | | | | 3,808 | | | | 20,173 | | | | 5,137 | | | | 3,077 | | | | 5,326 | |
| | | | | | | | | | | | | | | | | | | | | | | | | | |
| | 932,345 | | | | 1,574,353 | | | | 541,617 | | | | 4,429,117 | | | | 1,153,497 | | | | 289,680 | | | | 1,120,650 | |
| | | | | | | | | | | | | | | | | | | | | | | | | | |
| | — | | | | — | | | | (43,199 | ) | | | — | | | | (87,157 | ) | | | (59,394 | ) | | | — | |
| | | | | | | | | | | | | | | | | | | | | | | | | | |
| | 932,345 | | | | 1,574,353 | | | | 498,418 | | | | 4,429,117 | | | | 1,066,340 | | | | 230,286 | | | | 1,120,650 | |
| | | | | | | | | | | | | | | | | | | | | | | | | | |
| | (199,768 | ) | | | (370,098 | ) | | | 152,170 | | | | (1,434,844 | ) | | | 5,200,949 | | | | 718,700 | | | | 1,889,502 | |
| | | | | | | | | | | | | | | | | | | | | | | | | | |
| | | | | | | | | | | | | | | | | | | | | | | | | | |
| | 5,431,627 | | | | 6,844,762 | | | | 3,719,349 | | | | 89,998,942 | | | | 1,513,344 | | | | 388,998 | | | | 8,481,772 | |
| | — | | | | — | | | | — | | | | — | | | | 23,715 | | | | — | | | | — | |
| | — | | | | — | | | | — | | | | — | | | | — | | | | — | | | | (5,305,837 | ) |
| | — | | | | — | | | | — | | | | — | | | | — | | | | — | | | | (5,657,080 | ) |
| | — | | | | — | | | | — | | | | — | | | | 159 | | | | — | | | | — | |
| | 2,638,606 | | | | 8,395,594 | | | | (2,761,495 | ) | | | (74,212,102 | ) | | | (599,727 | ) | | | (335,537 | ) | | | 5,973,694 | |
| | — | | | | — | | | | — | | | | — | | | | — | | | | — | | | | (553,096 | ) |
| | — | | | | — | | | | — | | | | — | | | | — | | | | — | | | | 2,491,387 | |
| | | | | | | | | | | | | | | | | | | | | | | | | | |
| | 8,070,233 | | | | 15,240,356 | | | | 957,854 | | | | 15,786,840 | | | | 937,491 | | | | 53,461 | | | | 5,430,840 | |
| | | | | | | | | | | | | | | | | | | | | | | | | | |
| | | | | | |
| $ | 7,870,465 | | | $ | 14,870,258 | | | $ | 1,110,024 | | | $ | 14,351,996 | | | $ | 6,138,440 | | | $ | 772,161 | | | $ | 7,320,342 | |
| | | | | | | | | | | | | | | | | | | | | | | | | | |
See accompanying Notes to Financial Statements.
| | |
| |
| For the Six Months Ended April 30, 2015 | | |
| |
| Statements of Operations (unaudited) | | |
| | | | | | | | |
| | |
| | | Lake Partners
LASSO
Alternatives Fund | | | River Road
Long-Short
Fund | |
| | | | | | | | |
INVESTMENT INCOME: | | | | | | | | |
Dividends | | $ | 2,550,658 | | | $ | 1,873,379 | |
Less: foreign taxes withheld | | | — | | | | (179,162 | ) |
Interest | | | — | | | | 2,349 | |
| | | | | | | | |
Total investment income | | | 2,550,658 | | | | 1,696,566 | |
| | | | | | | | |
EXPENSES: | | | | | | | | |
Investment advisory fees (Note G) | | | 1,866,728 | | | | 1,177,731 | |
Distribution expenses (Note G) (b) | | | 61,378 | | | | 127,916 | |
Transfer agent fees | | | 150,067 | | | | 83,948 | |
Administration fees (Note G) | | | 89,503 | | | | 51,167 | |
Custodian fees | | | 6,692 | | | | 9,627 | |
Audit and tax fees | | | 10,179 | | | | 10,627 | |
Legal fees | | | 3,323 | | | | 1,756 | |
Registration expenses | | | 36,062 | | | | 29,257 | |
Interest and dividend expense on securities sold-short | | | — | | | | 964,103 | |
Amortization of offering costs (Note B-13) | | | — | | | | — | |
Reports to shareholder expense | | | 12,303 | | | | 6,624 | |
Trustees fees and related expenses (Note G) | | | 14,687 | | | | 7,134 | |
Other expenses | | | 9,993 | | | | 6,793 | |
| | | | | | | | |
Total expenses before waivers/reimbursement/recoupment | | | 2,260,915 | | | | 2,476,683 | |
| | | | | | | | |
Less: Investment advisory fees waived (Note G) | | | (13,850 | ) | | | — | |
Less: Expenses reimbursed (Note G) | | | — | | | | — | |
Plus: Net expenses recouped (Note G) | | | — | | | | 38,429 | |
| | | | | | | | |
Net expenses | | | 2,247,065 | | | | 2,515,112 | |
| | | | | | | | |
NET INVESTMENT INCOME (LOSS) | | | 303,593 | | | | (818,546 | ) |
| | | | | | | | |
NET REALIZED AND UNREALIZED GAIN (LOSS) ON INVESTMENTS: | | | | | | | | |
Net realized gain (loss) on investments | | | 9,595,043 | | | | 4,222,810 | |
Net realized loss on securities sold short | | | — | | | | (5,542,841 | ) |
Net realized gain (loss) on foreign currency transactions | | | — | | | | 7,246 | |
Capital gain distributions received | | | 8,304,361 | | | | — | |
Net change in unrealized appreciation (depreciation) on investments | | | (16,524,621 | ) | | | 5,972,013 | |
Net change in unrealized appreciation on securities sold short | | | — | | | | 4,896,424 | |
Net change in unrealized appreciation (depreciation) on translation of assets and liabilities denominated in foreign currency | | | — | | | | 3,347 | |
| | | | | | | | |
NET REALIZED AND UNREALIZED GAIN (LOSS) ON INVESTMENTS | | | 1,374,783 | | | | 9,558,999 | |
| | | | | | | | |
| | |
NET INCREASE (DECREASE) IN NET ASSETS FROM OPERATIONS | | $ | 1,678,376 | | | $ | 8,740,453 | |
| | | | | | | | |
| (a) | The inception date for TAMRO International Small Cap Fund is December 23, 2014. |
| (b) | Distribution expense is incurred at the Class N level. |
See accompanying Notes to Financial Statements.
| | | | | | | | | | | | | | | | | | | | | | | | | | |
| | | | | | |
Barings
International
Fund | | | Guardian
Capital Global
Dividend Fund | | | LMCG
Emerging
Markets Fund | | | Pictet
International
Fund | | | TAMRO
International
Small Cap Fund(a) | | | Harrison Street
Real Estate
Fund | | | Montag & Caldwell
Balanced Fund | |
| | | | | | | | | | | | | | | | | | | | | | | | | | |
| $ | 218,678 | | | $ | 92,215 | | | $ | 34,224 | | | $ | 277,544 | | | $ | 13,502 | | | $ | 201,665 | | | $ | 100,159 | |
| | (14,298 | ) | | | (4,799 | ) | | | (4,283 | ) | | | (19,820 | ) | | | (1,075 | ) | | | — | | | | — | |
| | — | | | | 1 | | | | — | | | | — | | | | — | | | | — | | | | 92,859 | |
| | | | | | | | | | | | | | | | | | | | | | | | | | |
| | 204,380 | | | | 87,417 | | | | 29,941 | | | | 257,724 | | | | 12,427 | | | | 201,665 | | | | 193,018 | |
| | | | | | | | | | | | | | | | | | | | | | | | | | |
| | | | | | | | | | | | | | | | | | | | | | | | | | |
| | 104,787 | | | | 17,367 | | | | 20,035 | | | | 117,060 | | | | 4,905 | | | | 68,668 | | | | 83,717 | |
| | 414 | | | | 1,321 | | | | 885 | | | | 1,210 | | | | 731 | | | | 16,224 | | | | 10,214 | |
| | 19,703 | | | | 11,972 | | | | 12,148 | | | | 15,304 | | | | 8,756 | | | | 19,294 | | | | 20,061 | |
| | 24,100 | | | | 11,299 | | | | 15,258 | | | | 18,004 | | | | 5,315 | | | | 10,007 | | | | 14,038 | |
| | 21,943 | | | | 3,513 | | | | 20,303 | | | | 10,712 | | | | 2,474 | | | | 3,144 | | | | 1,729 | |
| | 10,813 | | | | 10,813 | | | | 13,689 | | | | 10,813 | | | | 8,957 | | | | 9,519 | | | | 12,710 | |
| | 167 | | | | 106 | | | | 36 | | | | 71 | | | | 6 | | | | 107 | | | | 179 | |
| | 13,885 | | | | 15,124 | | | | 14,380 | | | | 15,124 | | | | 11,540 | | | | 15,372 | | | | 14,877 | |
| | — | | | | — | | | | — | | | | — | | | | — | | | | — | | | | — | |
| | — | | | | 24,002 | | | | — | | | | 33,421 | | | | 21,205 | | | | — | | | | — | |
| | 303 | | | | 62 | | | | 63 | | | | 211 | | | | 12 | | | | 1,067 | | | | 672 | |
| | 726 | | | | 147 | | | | 131 | | | | 676 | | | | 21 | | | | 473 | | | | 771 | |
| | 2,845 | | | | 2,560 | | | | 2,563 | | | | 2,663 | | | | 1,774 | | | | 2,697 | | | | 2,848 | |
| | | | | | | | | | | | | | | | | | | | | | | | | | |
| | 199,686 | | | | 98,286 | | | | 99,491 | | | | 225,269 | | | | 65,696 | | | | 146,572 | | | | 161,816 | |
| | | | | | | | | | | | | | | | | | | | | | | | | | |
| | (78,767 | ) | | | (17,367 | ) | | | (20,035 | ) | | | (74,482 | ) | | | (4,905 | ) | | | (53,441 | ) | | | (28,816 | ) |
| | — | | | | (56,803 | ) | | | (56,056 | ) | | | — | | | | (53,928 | ) | | | — | | | | — | |
| | — | | | | — | | | | — | | | | — | | | | — | | | | — | | | | — | |
| | | | | | | | | | | | | | | | | | | | | | | | | | |
| | 120,919 | | | | 24,116 | | | | 23,400 | | | | 150,787 | | | | 6,863 | | | | 93,131 | | | | 133,000 | |
| | | | | | | | | | | | | | | | | | | | | | | | | | |
| | 83,461 | | | | 63,301 | | | | 6,541 | | | | 106,937 | | | | 5,564 | | | | 108,534 | | | | 60,018 | |
| | | | | | | | | | | | | | | | | | | | | | | | | | |
| | | | | | | | | | | | | | | | | | | | | | | | | | |
| | 120,339 | | | | (31,295 | ) | | | (65,932 | ) | | | (152,667 | ) | | | (7,817 | ) | | | 1,006,815 | | | | 933,648 | |
| | — | | | | — | | | | — | | | | — | | | | — | | | | — | | | | — | |
| | (6,532 | ) | | | 8,095 | | | | (5,036 | ) | | | (21,691 | ) | | | 470 | | | | (74 | ) | | | — | |
| | — | | | | — | | | | — | | | | — | | | | — | | | | — | | | | — | |
| | 1,527,522 | | | | 76,625 | | | | 198,431 | | | | 3,040,321 | | | | 108,385 | | | | (1,179,811 | ) | | | (390,179 | ) |
| | — | | | | — | | | | — | | | | — | | | | — | | | | — | | | | — | |
| | | | | | | | | | | | | | | | | | | | | | | | | | |
| | (4,245 | ) | | | 147 | | | | (217 | ) | | | 3,339 | | | | (25 | ) | | | 45 | | | | — | |
| | | | | | | | | | | | | | | | | | | | | | | | | | |
| | 1,637,084 | | | | 53,572 | | | | 127,246 | | | | 2,869,302 | | | | 101,013 | | | | (173,025 | ) | | | 543,469 | |
| | | | | | | | | | | | | | | | | | | | | | | | | | |
| | | | | | |
| $ | 1,720,545 | | | $ | 116,873 | | | $ | 133,787 | | | $ | 2,976,239 | | | $ | 106,577 | | | $ | (64,491 | ) | | $ | 603,487 | |
| | | | | | | | | | | | | | | | | | | | | | | | | | |
See accompanying Notes to Financial Statements.
| | |
| |
| | |
| |
| Statements of Changes in Net Assets | | |
| | | | | | | | | | | | |
| | |
| | | Cornerstone Large Cap
Value Fund | | | Fairpointe Focused
Equity Fund | |
| | | Six Months Ended | | | | | | Period Ended | |
| | | April 30, 2015 | | | Year Ended | | | April 30, 2015(a) | |
| | | (unaudited) | | | October 31, 2014 | | | (unaudited) | |
NET ASSETS at Beginning of Period | | $ | 163,910,660 | | | $ | 62,648,378 | | | $ | — | |
| | | | | | | | | | | | |
Increase (decrease) in net assets from operations: | | | | | | | | | | | | |
Net investment income (loss) | | | 802,121 | | | | 1,017,771 | | | | 14,021 | |
Net realized gain on investments | | | 3,582,945 | | | | 6,701,835 | | | | 71,051 | |
Net change in unrealized appreciation (depreciation) on investments | | | (6,119,169 | ) | | | 2,552,837 | | | | 190,078 | |
| | | | | | | | | | | | |
Net increase (decrease) in net assets from operations | | | (1,734,103 | ) | | | 10,272,443 | | | | 275,150 | |
| | | | | | | | | | | | |
Distributions to shareholders from: | | | | | | | | | | | | |
Net investment income: | | | | | | | | | | | | |
Class N | | | (453,376 | ) | | | (102,489 | ) | | | — | |
Class I | | | (916,253 | ) | | | (297,744 | ) | | | — | |
Class R | | | — | | | | — | | | | — | |
Net realized gain on investments: | | | | | | | | | | | | |
Class N | | | — | | | | — | | | | — | |
Class I | | | — | | | | — | | | | — | |
Class R | | | — | | | | — | | | | — | |
| | | | | | | | | | | | |
Total distributions | | | (1,369,629 | ) | | | (400,233 | ) | | | — | |
| | | | | | | | | | | | |
Capital share transactions: | | | | | | | | | | | | |
Proceeds from sales of shares: | | | | | | | | | | | | |
Class N | | | 5,959,864 | | | | 46,807,591 | | | | 2,038,222(b | ) |
Class I | | | 9,559,771 | | | | 71,518,302 | | | | 3,879,199(b | ) |
Class R | | | — | | | | — | | | | — | |
Proceeds from reinvestment of distributions: | | | | | | | | | | | | |
Class N | | | 443,961 | | | | 97,214 | | | | — | |
Class I | | | 892,106 | | | | 290,077 | | | | — | |
Class R | | | — | | | | — | | | | — | |
Cost of shares redeemed: | | | | | | | | | | | | |
Class N | | | (9,883,643 | ) | | | (12,358,613 | ) | | | (6,758 | ) |
Class I | | | (15,361,316 | ) | | | (14,964,499 | ) | | | — | |
Class R | | | — | | | | — | | | | — | |
| | | | | | | | | | | | |
Net increase (decrease) from capital share transactions | | | (8,389,257 | ) | | | 91,390,072 | | | | 5,910,663 | |
| | | | | | | | | | | | |
Total increase (decrease) in net assets | | | (11,492,989 | ) | | | 101,262,282 | | | | 6,185,813 | |
| | | | | | | | | | | | |
NET ASSETS at End of Period | | $ | 152,417,671 | | | $ | 163,910,660 | | | $ | 6,185,813 | |
| | | | | | | | | | | | |
Undistributed net investment income | | $ | 244,332 | | | $ | 811,840 | | | $ | 14,021 | |
| | | | | | | | | | | | |
| (a) | The inception date for Fairpointe Focused Equity Fund is December 24, 2014. |
| (b) | Fairpointe Focused Equity Fund had a subscription-in-kind in the amount of $2,333,718 on December 24, 2014. The subscription was composed of securities, cash, and dividends accrued in the amounts of $2,305,531, $26,148 and $2,039, respectively. |
See accompanying Notes to Financial Statements.
| | | | | | | | | | | | | | | | | | | | | | |
| | |
Herndon Large Cap
Value Fund | | | Montag & Caldwell
Growth Fund | | | TAMRO Diversified
Equity Fund | |
| Six Months Ended | | | | | | Six Months Ended | | | | | | Six Months Ended | | | | |
| April 30, 2015 | | | Year Ended | | | April 30, 2015 | | | Year Ended | | | April 30, 2015 | | | Year Ended | |
| (unaudited) | | | October 31, 2014 | | | (unaudited) | | | October 31, 2014 | | | (unaudited) | | | October 31, 2014 | |
| $ | 153,445,046 | | | $ | 122,395,081 | | | $ | 4,136,667,896 | | | $ | 5,235,796,676 | | | $ | 50,721,423 | | | $ | 55,677,027 | |
| | | | | | | | | | | | | | | | | | | | | | |
| | | | | | | | | | | | | | | | | | | | | | |
| | 545,734 | | | | 1,429,201 | | | | 10,016,405 | | | | 23,807,692 | | | | 1,756 | | | | (150,492 | ) |
| | 1,849,704 | | | | 9,189,481 | | | | 535,116,918 | | | | 830,078,413 | | | | 3,260,838 | | | | 3,506,744 | |
| | (1,031,369 | ) | | | 3,565,628 | | | | (399,752,927 | ) | | | (344,295,024 | ) | | | (1,983,900 | ) | | | 4,502,060 | |
| | | | | | | | | | | | | | | | | | | | | | |
| | 1,364,069 | | | | 14,184,310 | | | | 145,380,396 | | | | 509,591,081 | | | | 1,278,694 | | | | 7,858,312 | |
| | | | | | | | | | | | | | | | | | | | | | |
| | | | | | | | | | | | | | | | | | | | | | |
| | | | | | | | | | | | | | | | | | | | | | |
| | (45,034 | ) | | | (300,533 | ) | | | (2,061,260 | ) | | | (12,394,334 | ) | | | — | | | | — | |
| | (1,262,040 | ) | | | (733,243 | ) | | | (15,765,431 | ) | | | (24,280,948 | ) | | | — | | | | (21,488 | ) |
| | — | | | | — | | | | (2,777 | ) | | | (34,093 | ) | | | — | | | | — | |
| | | | | | | | | | | | | | | | | | | | | | |
| | (823,682 | ) | | | (829,848 | ) | | | (212,615,826 | ) | | | (147,918,291 | ) | | | (1,684,542 | ) | | | (786,608 | ) |
| | (7,930,253 | ) | | | (1,561,843 | ) | | | (439,875,742 | ) | | | (202,241,647 | ) | | | (1,683,921 | ) | | | (844,736 | ) |
| | — | | | | — | | | | (1,298,521 | ) | | | (700,844 | ) | | | — | | | | — | |
| | | | | | | | | | | | | | | | | | | | | | |
| | (10,061,009 | ) | | | (3,425,467 | ) | | | (671,619,557 | ) | | | (387,570,157 | ) | | | (3,368,463 | ) | | | (1,652,832 | ) |
| | | | | | | | | | | | | | | | | | | | | | |
| | | | | | | | | | | | | | | | | | | | | | |
| | | | | | | | | | | | | | | | | | | | | | |
| | 1,782,727 | | | | 11,262,099 | | | | 91,329,544 | | | | 215,113,264 | | | | 1,456,068 | | | | 3,394,402 | |
| | 13,818,536 | | | | 88,729,125 | | | | 180,884,591 | | | | 694,385,708 | | | | 490,555 | | | | 3,934,241 | |
| | — | | | | — | | | | 570,902 | | | | 1,218,147 | | | | — | | | | — | |
| | | | | | | | | | | | | | | | | | | | | | |
| | 868,259 | | | | 1,130,230 | | | | 209,112,111 | | | | 156,933,268 | | | | 1,525,858 | | | | 725,967 | |
| | 8,623,751 | | | | 2,099,431 | | | | 365,652,584 | | | | 167,592,670 | | | | 1,679,348 | | | | 864,408 | |
| | — | | | | — | | | | 1,092,344 | | | | 580,629 | | | | — | | | | — | |
| | | | | | | | | | | | | | | | | | | | | | |
| | (5,402,065 | ) | | | (44,133,670 | ) | | | (597,806,719 | ) | | | (1,264,451,943 | ) | | | (6,979,033 | ) | | | (7,815,171 | ) |
| | (23,927,921 | ) | | | (38,796,093 | ) | | | (1,374,100,437 | ) | | | (1,188,092,282 | ) | | | (3,510,973 | ) | | | (12,264,931 | ) |
| | — | | | | — | | | | (2,164,146 | ) | | | (4,429,165 | ) | | | — | | | | — | |
| | | | | | | | | | | | | | | | | | | | | | |
| | (4,236,713 | ) | | | 20,291,122 | | | | (1,125,429,226 | ) | | | (1,221,149,704 | ) | | | (5,338,177 | ) | | | (11,161,084 | ) |
| | | | | | | | | | | | | | | | | | | | | | |
| | (12,933,653 | ) | | | 31,049,965 | | | | (1,651,668,387 | ) | | | (1,099,128,780 | ) | | | (7,427,946 | ) | | | (4,955,604 | ) |
| | | | | | | | | | | | | | | | | | | | | | |
| $ | 140,511,393 | | | $ | 153,445,046 | | | $ | 2,484,999,509 | | | $ | 4,136,667,896 | | | $ | 43,293,477 | | | $ | 50,721,423 | |
| | | | | | | | | | | | | | | | | | | | | | |
| $ | 289,364 | | | $ | 1,050,704 | | | $ | 5,436,605 | | | $ | 13,249,668 | | | $ | 1,756 | | | $ | — | |
| | | | | | | | | | | | | | | | | | | | | | |
See accompanying Notes to Financial Statements.
| | |
| |
| | |
| |
| Statements of Changes in Net Assets (continued) | | |
| | | | | | | | | | | | | | | | |
| | |
| | | River Road Dividend
All Cap Value Fund | | | River Road Dividend
All Cap Value Fund II | |
| | | Six Months Ended | | | | | | Six Months Ended | | | | |
| | | April 30, 2015 | | | Year Ended | | | April 30, 2015 | | | Year Ended | |
| | | (unaudited) | | | October 31, 2014 | | | (unaudited) | | | October 31, 2014 | |
| | | | | | | | | | | | | | | | |
NET ASSETS at Beginning of Period | | $ | 1,138,258,945 | | | $ | 1,228,988,525 | | | $ | 132,696,953 | | | $ | 89,873,662 | |
| | | | | | | | | | | | | | | | |
Increase in net assets from operations: | | | | | | | | | | | | | | | | |
Net investment income (loss) | | | 8,485,719 | | | | 38,247,126 | | | | 1,183,141 | | | | 3,295,012 | |
Net realized gain on investments | | | 54,995,667 | | | | 100,414,252 | | | | 2,259,877 | | | | 4,129,826 | |
Net change in unrealized appreciation (depreciation) on investments | | | (23,219,800 | ) | | | (21,456,186 | ) | | | 1,166,591 | | | | 4,067,038 | |
| | | | | | | | | | | | | | | | |
Net increase in net assets from operations | | | 40,261,586 | | | | 117,205,192 | | | | 4,609,609 | | | | 11,491,876 | |
| | | | | | | | | | | | | | | | |
Distributions to shareholders from: | | | | | | | | | | | | | | | | |
Net investment income: | | | | | | | | | | | | | | | | |
Class N | | | (2,106,884 | ) | | | (13,621,324 | ) | | | (55,093 | ) | | | (173,767 | ) |
Class I | | | (6,711,688 | ) | | | (26,859,558 | ) | | | (1,227,066 | ) | | | (3,298,001 | ) |
Net realized gain on investments: | | | | | | | | | | | | | | | | |
Class N | | | (24,073,946 | ) | | | (26,590,807 | ) | | | (214,191 | ) | | | (43,196 | ) |
Class I | | | (65,111,598 | ) | | | (45,069,967 | ) | | | (3,926,743 | ) | | | (981,977 | ) |
| | | | | | | | | | | | | | | | |
Total distributions | | | (98,004,116 | ) | | | (112,141,656 | ) | | | (5,423,093 | ) | | | (4,496,941 | ) |
| | | | | | | | | | | | | | | | |
Capital share transactions: | | | | | | | | | | | | | | | | |
Proceeds from sales of shares: | | | | | | | | | | | | | | | | |
Class N | | | 20,572,891 | | | | 62,653,200 | | | | 673,611 | | | | 3,999,728 | |
Class I | | | 55,992,035 | | | | 134,042,328 | | | | 16,076,847 | | | | 41,902,478 | |
Proceeds from reinvestment of distributions: | | | | | | | | | | | | | | | | |
Class N | | | 25,807,259 | | | | 39,949,265 | | | | 268,862 | | | | 215,899 | |
Class I | | | 48,711,403 | | | | 46,719,016 | | | | 4,800,140 | | | | 3,879,481 | |
Cost of shares redeemed: | | | | | | | | | | | | | | | | |
Class N | | | (136,404,720 | ) | | | (202,510,406 | ) | | | (1,508,866 | ) | | | (1,213,066 | ) |
Class I | | | (106,232,338 | ) | | | (176,646,519 | ) | | | (9,705,521 | ) | | | (12,956,164 | ) |
| | | | | | | | | | | | | | | | |
Net increase (decrease) from capital share transactions | | | (91,553,470 | ) | | | (95,793,116 | ) | | | 10,605,073 | | | | 35,828,356 | |
| | | | | | | | | | | | | | | | |
Total increase (decrease) in net assets | | | (149,296,000 | ) | | | (90,729,580 | ) | | | 9,791,589 | | | | 42,823,291 | |
| | | | | | | | | | | | | | | | |
NET ASSETS at End of Period | | $ | 988,962,945 | | | $ | 1,138,258,945 | | | $ | 142,488,542 | | | $ | 132,696,953 | |
| | | | | | | | | | | | | | | | |
Undistributed (distributions in excess of) net investment income (loss) | | $ | (1,419,801 | ) | | $ | (1,086,948 | ) | | $ | (172,071 | ) | | $ | (73,053 | ) |
| | | | | | | | | | | | | | | | |
See accompanying Notes to Financial Statements.
| | | | | | | | | | | | | | | | | | | | | | |
| | |
| Fairpointe Mid Cap Fund | | | Montag & Caldwell Mid Cap
Growth Fund | | | LMCG Small Cap
Growth Fund | |
| Six Months Ended | | | | | | Six Months Ended | | | | | | Six Months Ended | | | | |
| April 30, 2015 | | | Year Ended | | | April 30, 2015 | | | Year Ended | | | April 30, 2015 | | | Year Ended | |
| (unaudited) | | | October 31, 2014 | | | (unaudited) | | | October 31, 2014 | | | (unaudited) | | | October 31, 2014 | |
| | | | | | | | | | | | | | | | | | | | | | |
| $ | 5,963,929,210 | | | $ | 4,892,248,060 | | | $ | 11,500,265 | | | $ | 11,402,187 | | | $ | 52,181,137 | | | $ | 40,540,640 | |
| | | | | | | | | | | | | | | | | | | | | | |
| | | | | | | | | | | | | | | | | | | | | | |
| | 8,274,084 | | | | 890,017 | | | | (21,306 | ) | | | (63,632 | ) | | | (371,872 | ) | | | (350,017 | ) |
| | 436,268,285 | | | | 1,049,016,350 | | | | 899,037 | | | | 797,891 | | | | 3,219,183 | | | | 3,358,983 | |
| | | | | |
| | (32,752,447 | ) | | | (389,789,424 | ) | | | (150,793 | ) | | | 320,711 | | | | 2,855,846 | | | | 3,429,213 | |
| | | | | | | | | | | | | | | | | | | | | | |
| | 411,789,922 | | | | 660,116,943 | | | | 726,938 | | | | 1,054,970 | | | | 5,703,157 | | | | 6,438,179 | |
| | | | | | | | | | | | | | | | | | | | | | |
| | | | | | | | | | | | | | | | | | | | | | |
| | | | | | | | | | | | | | | | | | | | | | |
| | (2,292,874 | ) | | | — | | | | — | | | | — | | | | — | | | | — | |
| | (4,564,241 | ) | | | (3,375,463 | ) | | | — | | | | — | | | | — | | | | (14,282 | ) |
| | | | | | | | | | | | | | | | | | | | | | |
| | (388,644,763 | ) | | | (223,568,950 | ) | | | (403,184 | ) | | | (1,708,527 | ) | | | (1,601,490 | ) | | | (4,374,487 | ) |
| | (533,671,049 | ) | | | (234,479,219 | ) | | | (315,621 | ) | | | — | | | | (873,314 | ) | | | (1,139,027 | ) |
| | | | | | | | | | | | | | | | | | | | | | |
| | (929,172,927 | ) | | | (461,423,632 | ) | | | (718,805 | ) | | | (1,708,527 | ) | | | (2,474,804 | ) | | | (5,527,796 | ) |
| | | | | | | | | | | | | | | | | | | | | | |
| | | | | | | | | | | | | | | | | | | | | | |
| | | | | | | | | | | | | | | | | | | | | | |
| | 261,537,072 | | | | 611,134,453 | | | | 96,799 | | | | 411,838 | | | | 42,822,526 | | | | 8,647,070 | |
| | 524,719,215 | | | | 1,427,015,336 | | | | 1,173,694 | | | | 3,668,445 | | | | 26,464,398 | | | | 9,672,810 | |
| | | | | | | | | | | | | | | | | | | | | | |
| | 374,916,825 | | | | 215,069,467 | | | | 401,616 | | | | 1,673,347 | | | | 1,532,620 | | | | 4,189,554 | |
| | 421,110,375 | | | | 170,521,263 | | | | 315,621 | | | | — | | | | 772,122 | | | | 1,140,513 | |
| | | | | | | | | | | | | | | | | | | | | | |
| | (437,348,303 | ) | | | (850,386,062 | ) | | | (2,974,645 | ) | | | (5,001,822 | ) | | | (7,932,697 | ) | | | (8,150,286 | ) |
| | (841,135,486 | ) | | | (700,366,618 | ) | | | (140,661 | ) | | | (173 | ) | | | (2,388,955 | ) | | | (4,769,547 | ) |
| | | | | | | | | | | | | | | | | | | | | | |
| | | | | |
| | 303,799,698 | | | | 872,987,839 | | | | (1,127,576 | ) | | | 751,635 | | | | 61,270,014 | | | | 10,730,114 | |
| | | | | | | | | | | | | | | | | | | | | | |
| | (213,583,307 | ) | | | 1,071,681,150 | | | | (1,119,443 | ) | | | 98,078 | | | | 64,498,367 | | | | 11,640,497 | |
| | | | | | | | | | | | | | | | | | | | | | |
| $ | 5,750,345,903 | | | $ | 5,963,929,210 | | | $ | 10,380,822 | | | $ | 11,500,265 | | | $ | 116,679,504 | | | $ | 52,181,137 | |
| | | | | | | | | | | | | | | | | | | | | | |
| | | | | |
| $ | 1,416,969 | | | $ | — | | | $ | (21,306 | ) | | $ | — | | | $ | (376,251 | ) | | $ | (4,379 | ) |
| | | | | | | | | | | | | | | | | | | | | | |
See accompanying Notes to Financial Statements.
| | |
| |
| | |
| |
| Statements of Changes in Net Assets (continued) | | |
| | | | | | | | | | | | | | | | |
| | |
| | | River Road
Independent Value Fund | | | River Road Select Value Fund | |
| | | Six Months Ended | | | | | | Six Months Ended | | | | |
| | | April 30, 2015 | | | Year Ended | | | April 30, 2015 | | | Year Ended | |
| | | (unaudited) | | | October 31, 2014 | | | (unaudited) | | | October 31, 2014 | |
NET ASSETS at Beginning of Period | | $ | 667,238,002 | | | $ | 725,355,861 | | | $ | 184,553,976 | | | $ | 217,318,502 | |
| | | | | | | | | | | | | | | | |
Increase (decrease) in net assets from operations: | | | | | | | | | | | | | | | | |
Net investment income (loss) | | | (2,765,503 | ) | | | (6,388,141 | ) | | | (199,768 | ) | | | (270,098 | ) |
Net realized gain (loss) on investments and purchased and written options | | | (1,424,044 | ) | | | 37,973,231 | | | | 5,431,627 | | | | 30,115,873 | |
Net change in unrealized appreciation (depreciation) on investments and purchased and written options | | | 9,390,145 | | | | (38,109,822 | ) | | | 2,638,606 | | | | (29,790,084 | ) |
| | | | | | | | | | | | | | | | |
Net increase (decrease) in net assets from
operations | | | 5,200,598 | | | | (6,524,732 | ) | | | 7,870,465 | | | | 55,691 | |
| | | | | | | | | | | | | | | | |
Distributions to shareholders from: | | | | | | | | | | | | | | | | |
Net investment income: | | | | | | | | | | | | | | | | |
Class N | | | — | | | | — | | | | — | | | | (30,707 | ) |
Class I | | | — | | | | — | | | | — | | | | (702,476 | ) |
Net realized gain on investments: | | | | | | | | | | | | | | | | |
Class N | | | (16,133,453 | ) | | | (13,027,499 | ) | | | (1,302,384 | ) | | | (2,748,770 | ) |
Class I | | | (18,654,429 | ) | | | (15,234,387 | ) | | | (23,636,785 | ) | | | (28,381,897 | ) |
| | | | | | | | | | | | | | | | |
Total distributions | | | (34,787,882 | ) | | | (28,261,886 | ) | | | (24,939,169 | ) | | | (31,863,850 | ) |
| | | | | | | | | | | | | | | | |
Capital share transactions: | | | | | | | | | | | | | | | | |
Proceeds from sales of shares: | | | | | | | | | | | | | | | | |
Class N | | | 29,645,833 | | | | 74,910,227 | | | | 383,299 | | | | 1,992,585 | |
Class I | | | 18,057,556 | | | | 154,544,987 | | | | 2,911,998 | | | | 29,881,645 | |
Proceeds from reinvestment of distributions: | | | | | | | | | | | | | | | | |
Class N | | | 16,067,708 | | | | 12,978,719 | | | | 1,186,303 | | | | 2,654,598 | |
Class I | | | 16,055,433 | | | | 14,687,638 | | | | 23,099,814 | | | | 28,799,580 | |
Cost of shares redeemed: | | | | | | | | | | | | | | | | |
Class N | | | (56,452,622 | ) | | | (125,071,162 | ) | | | (2,093,322 | ) | | | (12,614,171 | ) |
Class I | | | (206,335,879 | ) | | | (155,381,650 | ) | | | (60,816,355 | ) | | | (51,670,604 | ) |
| | | | | | | | | | | | | | | | |
Net increase (decrease) from capital share transactions | | | (182,961,971 | ) | | | (23,331,241 | ) | | | (35,328,263 | ) | | | (956,367 | ) |
| | | | | | | | | | | | | | | | |
Total increase (decrease) in net assets | | | (212,549,255 | ) | | | (58,117,859 | ) | | | (52,396,967 | ) | | | (32,764,526 | ) |
| | | | | | | | | | | | | | | | |
NET ASSETS at End of Period | | $ | 454,688,747 | | | $ | 667,238,002 | | | $ | 132,157,009 | | | $ | 184,553,976 | |
| | | | | | | | | | | | | | | | |
Undistributed (distributions in excess of)
net investment income (loss) | | $ | (2,802,440 | ) | | $ | (36,937 | ) | | $ | (199,768 | ) | | $ | — | |
| | | | | | | | | | | | | | | | |
See accompanying Notes to Financial Statements.
| | | | | | | | | | | | | | | | | | | | | | |
| | |
River Road
Small Cap Value Fund | | | Silvercrest
Small Cap Fund | | | TAMRO
Small Cap Fund | |
| Six Months Ended | | | | | | Six Months Ended | | | | | | Six Months Ended | | | | |
| April 30, 2015 | | | Year Ended | | | April 30, 2015 | | | Year Ended | | | April 30, 2015 | | | Year Ended | |
| (unaudited) | | | October 31, 2014 | | | (unaudited) | | | October 31, 2014 | | | (unaudited) | | | October 31, 2014 | |
| $ | 299,221,337 | | | $ | 309,597,171 | | | $ | 68,888,134 | | | $ | 33,267,442 | | | $ | 835,868,756 | | | $ | 1,325,799,376 | |
| | | | | | | | | | | | | | | | | | | | | | |
| | | | | | | | | | | | | | | | | | | | | | |
| | (370,098 | ) | | | (163,580 | ) | | | 152,170 | | | | 135,005 | | | | (1,434,844 | ) | | | (4,876,541 | ) |
|
6,844,762 |
| | | 48,359,630 | | | | 3,719,349 | | | | 1,540,966 | | | | 89,998,942 | | | | 116,264,947 | |
|
8,395,594 |
| | | (46,163,511 | ) | | | (2,761,495 | ) | | | 2,445,591 | | | | (74,212,102 | ) | | | (117,572,672 | ) |
| | | | | | | | | | | | | | | | | | | | | | |
|
14,870,258 |
| | | 2,032,539 | | | | 1,110,024 | | | | 4,121,562 | | | | 14,351,996 | | | | (6,184,266 | ) |
| | | | | | | | | | | | | | | | | | | | | | |
| | | | | | | | | | | | | | | | | | | | | | |
| | | | | | | | | | | | | | | | | | | | | | |
| | — | | | | (125,993 | ) | | | (10,817 | ) | | | (229 | ) | | | — | | | | — | |
| | — | | | | (1,180,379 | ) | | | (144,060 | ) | | | (56,178 | ) | | | — | | | | — | |
| | | | | | | | | | | | | | | | | | | | | | |
| | (6,051,268 | ) | | | (12,061,338 | ) | | | (132,428 | ) | | | (146,801 | ) | | | (42,602,557 | ) | | | (47,504,176 | ) |
| | (35,176,931 | ) | | | (54,042,337 | ) | | | (1,405,279 | ) | | | (1,082,382 | ) | | | (51,414,056 | ) | | | (68,914,775 | ) |
| | | | | | | | | | | | | | | | | | | | | | |
| | (41,228,199 | ) | | | (67,410,047 | ) | | | (1,692,584 | ) | | | (1,285,590 | ) | | | (94,016,613 | ) | | | (116,418,951 | ) |
| | | | | | | | | | | | �� | | | | | | | | | | |
| | | | | | | | | | | | | | | | | | | | | | |
| | | | | | | | | | | | | | | | | | | | | | |
| | 2,520,794 | | | | 10,064,979 | | | | 471,389 | | | | 4,648,830 | | | | 10,279,611 | | | | 48,233,449 | |
| | 31,342,784 | | | | 87,864,652 | | | | 63,069,796 | | | | 34,184,068 | | | | 47,055,317 | | | | 124,353,293 | |
| | | | | | | | | | | | | | | | | | | | | | |
| | 6,025,656 | | | | 12,142,608 | | | | 143,245 | | | | 147,030 | | | | 41,973,876 | | | | 44,495,639 | |
| | 34,115,956 | | | | 55,057,909 | | | | 1,549,339 | | | | 1,138,560 | | | | 49,177,354 | | | | 55,420,970 | |
| | | | | | | | | | | | | | | | | | | | | | |
| | (27,677,050 | ) | | | (17,845,889 | ) | | | (1,914,589 | ) | | | (2,442,586 | ) | | | (102,154,043 | ) | | | (211,736,661 | ) |
| | (44,295,507 | ) | | | (92,282,585 | ) | | | (20,222,392 | ) | | | (4,891,182 | ) | | | (104,579,564 | ) | | | (428,094,093 | ) |
| | | | | | | | | | | | | | | | | | | | | | |
|
2,032,633 |
| | | 55,001,674 | | | | 43,096,788 | | | | 32,784,720 | | | | (58,247,449 | ) | | | (367,327,403 | ) |
| | | | | | | | | | | | | | | | | | | | | | |
| | (24,325,308 | ) | | | (10,375,834 | ) | | | 42,514,228 | | | | 35,620,692 | | | | (137,912,066 | ) | | | (489,930,620 | ) |
| | | | | | | | | | | | | | | | | | | | | | |
| $ | 274,896,029 | | | $ | 299,221,337 | | | $ | 111,402,362 | | | $ | 68,888,134 | | | $ | 697,956,690 | | | $ | 835,868,756 | |
| | | | | | | | | | | | | | | | | | | | | | |
| | | | | |
| $ | (370,098 | ) | | $ | — | | | $ | 75,044 | | | $ | 77,751 | | | $ | (6,002,514 | ) | | $ | (4,567,670 | ) |
| | | | | | | | | | | | | | | | | | | | | | |
See accompanying Notes to Financial Statements.
| | |
| |
| | |
| |
| Statements of Changes in Net Assets (continued) | | |
| | | | | | | | | | | | | | | | |
| | |
| | | DoubleLine Core Plus
Fixed Income Fund | | | TCH Fixed Income Fund | |
| | | Six Months Ended | | | | | | Six Months Ended | | | | |
| | | April 30, 2015 | | | Year Ended | | | April 30, 2015 | | | Year Ended | |
| | | (unaudited) | | | October 31, 2014 | | | (unaudited) | | | October 31, 2014 | |
NET ASSETS at Beginning of Period | | $ | 207,345,624 | | | $ | 176,385,864 | | | $ | 52,148,980 | | | $ | 54,512,660 | |
| | | | | | | | | | | | | | | | |
Increase (decrease) in net assets from operations: | | | | | | | | | | | | | | | | |
Net investment income (loss) | | | 5,200,949 | | | | 5,528,276 | | | | 718,700 | | | | 1,750,503 | |
Net realized gain (loss) on investments, affiliated investments, purchased and written options, capital gain distributions, securities sold short and foreign currency transactions | | | 1,537,218 | | | | (860,472 | ) | | | 388,998 | | | | 937,543 | |
Net change in unrealized appreciation (depreciation) on investments, purchased and written options, securities sold short and translation of assets and liabilities denominated in foreign currency | | | (599,727 | ) | | | 3,161,286 | | | | (335,537 | ) | | | 153,019 | |
| | | | | | | | | | | | | | | | |
Net increase (decrease) in net assets from operations | | | 6,138,440 | | | | 7,829,090 | | | | 772,161 | | | | 2,841,065 | |
| | | | | | | | | | | | | | | | |
Distributions to shareholders from: | | | | | | | | | | | | | | | | |
Net investment income: | | | | | | | | | | | | | | | | |
Class N | | | (1,261,532 | ) | | | (1,658,186 | ) | | | (556,092 | ) | | | (1,513,765 | ) |
Class I | | | (4,189,433 | ) | | | (4,001,526 | ) | | | (264,848 | ) | | | (444,550 | ) |
Net realized gain on investments: | | | | | | | | | | | | | | | | |
Class N | | | — | | | | — | | | | — | | | | — | |
Class I | | | — | | | | — | | | | — | | | | — | |
| | | | | | | | | | | | | | | | |
Total distributions | | | (5,450,965 | ) | | | (5,659,712 | ) | | | (820,940 | ) | | | (1,958,315 | ) |
| | | | | | | | | | | | | | | | |
Capital share transactions: | | | | | | | | | | | | | | | | |
Proceeds from sales of shares: | | | | | | | | | | | | | | | | |
Class N | | | 88,624,982 | | | | 23,358,553 | | | | 3,165,883 | | | | 5,903,056 | |
Class I | | | 112,520,606 | | | | 109,666,232 | | | | 5,737,684 | | | | 9,601,364 | |
Proceeds from reinvestment of distributions: | | | | | | | | | | | | | | | | |
Class N | | | 1,158,611 | | | | 1,513,332 | | | | 527,326 | | | | 1,435,599 | |
Class I | | | 3,657,095 | | | | 3,409,741 | | | | 259,077 | | | | 433,047 | |
Cost of shares redeemed: | | | | | | | | | | | | | | | | |
Class N | | | (22,302,863 | ) | | | (42,728,442 | ) | | | (2,563,963 | ) | | | (16,909,433 | ) |
Class I | | | (26,612,546 | ) | | | (66,429,034 | ) | | | (3,820,915 | ) | | | (3,710,063 | ) |
Capital Contribution (Note G): | | | | | | | | | | | | | | | | |
Class N | | | — | | | | — | | | | — | | | | — | |
Class I | | | — | | | | — | | | | — | | | | — | |
| | | | | | | | | | | | | | | | |
Net increase (decrease) from capital share transactions | | | 157,045,885 | | | | 28,790,382 | | | | 3,305,092 | | | | (3,246,430 | ) |
| | | | | | | | | | | | | | | | |
Total increase (decrease) in net assets | | | 157,733,360 | | | | 30,959,760 | | | | 3,256,313 | | | | (2,363,680 | ) |
| | | | | | | | | | | | | | | | |
NET ASSETS at End of Period | | $ | 365,078,984 | | | $ | 207,345,624 | | | $ | 55,405,293 | | | $ | 52,148,980 | |
| | | | | | | | | | | | | | | | |
Undistributed (distributions in excess of) net investment income (loss) | | $ | (626,987 | ) | | $ | (376,971 | ) | | $ | (812 | ) | | $ | 101,428 | |
| | | | | | | | | | | | | | | | |
See accompanying Notes to Financial Statements.
| | | | | | | | | | | | | | | | | | | | | | |
| | |
Anchor Capital
Enhanced Equity Fund | | | Lake Partners
LASSO Alternatives Fund | | | River Road
Long-Short Fund | |
| Six Months Ended | | | | | | Six Months Ended | | | | | | Six Months Ended | | | | |
| April 30, 2015 | | | Year Ended | | | April 30, 2015 | | | Year Ended | | | April 30, 2015 | | | Year Ended | |
| (unaudited) | | | October 31, 2014 | | | (unaudited) | | | October 31, 2014 | | | (unaudited) | | | October 31, 2014 | |
| $ | 210,964,549 | | | $ | 159,761,924 | | | $ | 521,542,660 | | | $ | 470,862,793 | | | $ | 219,410,621 | | | $ | 180,141,159 | |
| | | | | | | | | | | | | | | | | | | | | | |
| | | | | | | | | | | | | | | | | | | | | | |
| | 1,889,502 | | | | 3,494,860 | | | | 303,593 | | | | (1,496,938 | ) | | | (818,546 | ) | | | (3,311,713 | ) |
| | | | | |
| | (2,481,145 | ) | | | (487,554 | ) | | | 17,899,404 | | | | 18,553,737 | | | | (1,312,785 | ) | | | 2,468,897 | |
| | | | | |
| | 7,911,985 | | | | 2,733,967 | | | | (16,524,621 | ) | | | (448,365 | ) | | | 10,871,784 | | | | (8,658,331 | ) |
| | | | | | | | | | | | | | | | | | | | | | |
| | | | | |
| | 7,320,342 | | | | 5,741,273 | | | | 1,678,376 | | | | 16,608,434 | | | | 8,740,453 | | | | (9,501,147 | ) |
| | | | | | | | | | | | | | | | | | | | | | |
| | | | | | | | | | | | | | | | | | | | | | |
| | | | | | | | | | | | | | | | | | | | | | |
| | (799,016 | ) | | | (1,760,434 | ) | | | (15,074 | ) | | | (378,809 | ) | | | — | | | | — | |
| | (1,041,818 | ) | | | (1,547,989 | ) | | | (1,016,136 | ) | | | (3,788,207 | ) | | | — | | | | — | |
| | | | | | | | | | | | | | | | | | | | | | |
| | — | | | | — | | | | (1,747,938 | ) | | | (186,666 | ) | | | (2,666,296 | ) | | | (2,911,026 | ) |
| | — | | | | — | | | | (13,332,770 | ) | | | (1,404,331 | ) | | | (2,591,486 | ) | | | (2,032,930 | ) |
| | | | | | | | | | | | | | | | | | | | | | |
| | (1,840,834 | ) | | | (3,308,423 | ) | | | (16,111,918 | ) | | | (5,758,013 | ) | | | (5,257,782 | ) | | | (4,943,956 | ) |
| | | | | | | | | | | | | | | | | | | | | | |
| | | | | | | | | | | | | | | | | | | | | | |
| | | | | | | | | | | | | | | | | | | | | | |
| | 11,212,843 | | | | 35,023,834 | | | | 30,999,471 | | | | 21,759,727 | | | | 19,859,633 | | | | 94,199,671 | |
| | 27,987,262 | | | | 71,169,669 | | | | 68,780,903 | | | | 136,099,370 | | | | 15,021,722 | | | | 106,897,007 | |
| | | | | | | | | | | | | | | | | | | | | | |
| | 780,171 | | | | 1,731,451 | | | | 1,751,278 | | | | 544,810 | | | | 2,640,850 | | | | 2,838,180 | |
| | 779,206 | | | | 1,151,589 | | | | 10,592,840 | | | | 4,429,761 | | | | 1,835,170 | | | | 1,960,122 | |
| | | | | | | | | | | | | | | | | | | | | | |
| | (15,783,148 | ) | | | (37,674,832 | ) | | | (10,019,648 | ) | | | (33,487,553 | ) | | | (31,049,446 | ) | | | (89,100,715 | ) |
| | (33,394,700 | ) | | | (22,631,936 | ) | | | (288,161,793 | ) | | | (89,517,183 | ) | | | (47,314,373 | ) | | | (63,079,700 | ) |
| | | | | | | | | | | | | | | | | | | | | | |
| | — | | | | — | | | | — | | | | 45 | | | | — | | | | — | |
| | — | | | | — | | | | 872 | | | | 469 | | | | — | | | | — | |
| | | | | | | | | | | | | | | | | | | | | | |
| | | | | |
| | (8,418,366 | ) | | | 48,769,775 | | | | (186,056,077 | ) | | | 39,829,446 | | | | (39,006,444 | ) | | | 53,714,565 | |
| | | | | | | | | | | | | | | | | | | | | | |
| | (2,938,858 | ) | | | 51,202,625 | | | | (200,489,619 | ) | | | 50,679,867 | | | | (35,523,773 | ) | | | 39,269,462 | |
| | | | | | | | | | | | | | | | | | | | | | |
| $ | 208,025,691 | | | $ | 210,964,549 | | | $ | 321,053,041 | | | $ | 521,542,660 | | | $ | 183,886,848 | | | $ | 219,410,621 | |
| | | | | | | | | | | | | | | | | | | | | | |
| | | | | |
| $ | 376,537 | | | $ | 327,869 | | | $ | (2,724,787 | ) | | $ | (1,997,170 | ) | | $ | (843,917 | ) | | $ | (25,371 | ) |
| | | | | | | | | | | | | | | | | | | | | | |
See accompanying Notes to Financial Statements.
| | |
| |
| | |
| |
| Statements of Changes in Net Assets (continued) | | |
| | | | | | | | | | | | | | | | |
| | |
| | | Barings
International Fund | | | Guardian Capital
Global Dividend Fund | |
| | | Six Months Ended | | | | | | Six Months Ended | | | | |
| | | April 30, 2015 | | | Year Ended | | | April 30, 2015 | | | Period Ended | |
| | | (unaudited) | | | October 31, 2014 | | | (unaudited) | | | October 31, 2014(a) | |
NET ASSETS at Beginning of Period | | $ | 21,590,303 | | | $ | 37,984,420 | | | $ | 4,263,024 | | | $ | — | |
| | | | | | | | | | | | | | | | |
Increase (decrease) in net assets from operations: | | | | | | | | | | | | | | | | |
Net investment income | | | 83,461 | | | | 619,600 | | | | 63,301 | | | | 54,125 | |
Net realized gain (loss) on investments and foreign currency transactions | | | 113,807 | | | | 3,377,022 | | | | (23,200 | ) | | | (34,774 | ) |
Net change in unrealized appreciation (depreciation) on investments and translation of assets and liabilities denominated in foreign currency | | | 1,523,277 | | | | (4,350,016 | ) | | | 76,772 | | | | 234,146 | |
| | | | | | | | | | | | | | | | |
Net increase (decrease) in net assets from operations | | | 1,720,545 | | | | (353,394 | ) | | | 116,873 | | | | 253,497 | |
| | | | | | | | | | | | | | | | |
Distributions to shareholders from: | | | | | | | | | | | | | | | | |
Net investment income: | | | | | | | | | | | | | | | | |
Class N | | | (6,430 | ) | | | (10,891 | ) | | | (10,655 | ) | | | (10,791 | ) |
Class I | | | (466,160 | ) | | | (988,215 | ) | | | (39,126 | ) | | | (35,829 | ) |
Net realized gain on investments: | | | | | | | | | | | | | | | | |
Class N | | | (41,150 | ) | | | (28,909 | ) | | | — | | | | — | |
Class I | | | (2,620,405 | ) | | | (2,374,296 | ) | | | — | | | | — | |
| | | | | | | | | | | | | | | | |
Total distributions | | | (3,134,145 | ) | | | (3,402,311 | ) | | | (49,781 | ) | | | (46,620 | ) |
| | | | | | | | | | | | | | | | |
Capital share transactions: | | | | | | | | | | | | | | | | |
Proceeds from sales of shares: | | | | | | | | | | | | | | | | |
Class N | | | 8,318 | | | | 61,141 | | | | 12,740 | | | | 1,001,103 | |
Class I | | | 1,046,591 | | | | 5,876,501 | | | | 106,476 | | | | 3,029,962 | |
Proceeds from reinvestment of distributions: | | | | | | | | | | | | | | | | |
Class N | | | 47,580 | | | | 39,800 | | | | 85 | | | | 1 | |
Class I | | | 3,086,565 | | | | 3,362,511 | | | | 27,851 | | | | 25,081 | |
Cost of shares redeemed: | | | | | | | | | | | | | | | | |
Class N | | | (11,575 | ) | | | (202,001 | ) | | | (497 | ) | | | — | |
Class I | | | (2,952,343 | ) | | | (21,776,364 | ) | | | (6,042 | ) | | | — | |
Capital Contribution (Note G): | | | | | | | | | | | | | | | | |
Class N | | | — | | | | — | | | | — | | | | — | |
Class I | | | — | | | | — | | | | — | | | | — | |
| | | | | | | | | | | | | | | | |
Net increase (decrease) from capital share transactions | | | 1,225,136 | | | | (12,638,412 | ) | | | 140,613 | | | | 4,056,147 | |
| | | | | | | | | | | | | | | | |
Total increase (decrease) in net assets | | | (188,464 | ) | | | (16,394,117 | ) | | | 207,705 | | | | 4,263,024 | |
| | | | | | | | | | | | | | | | |
NET ASSETS at End of Period | | $ | 21,401,839 | | | $ | 21,590,303 | | | $ | 4,470,729 | | | $ | 4,263,024 | |
| | | | | | | | | | | | | | | | |
Undistributed (distributions in excess of) net investment income (loss) | | $ | 82,402 | | | $ | 471,531 | | | $ | 29,855 | | | $ | 16,335 | |
| | | | | | | | | | | | | | | | |
| (a) | The inception date for Guardian Capital Global Dividend Fund is April 14, 2014. |
| (b) | The inception date for Pictet International Fund is April 14, 2014. |
| (c) | The inception date for TAMRO International Small Cap Fund is December 23, 2014. |
See accompanying Notes to Financial Statements.
| | | | | | | | | | | | | | | | | | |
| | |
| LMCG Emerging Markets Fund | | | Pictet International Fund | | | TAMRO International
Small Cap Fund | |
| Six Months Ended | | | | | | Six Months Ended | | | | | | Period Ended | |
| April 30, 2015 | | | Year Ended | | | April 30, 2015 | | | Period Ended | | | April 30, 2015(c) | |
| (unaudited) | | | October 31, 2014 | | | (unaudited) | | | October 31, 2014(b) | | | (unaudited) | |
| $ | 3,913,026 | | | $ | 3,981,658 | | | $ | 9,450,969 | | | $ | — | | | $ | — | |
| | | | | | | | | | | | | | | | | | |
| | | | | | | | | | | | | | | | | | |
| | 6,541 | | | | 53,625 | | | | 106,937 | | | | 100,895 | | | | 5,564 | |
| | | | | | | | | | | | | | | | | | |
| | (70,968 | ) | | | (44,370 | ) | | | (174,358 | ) | | | 47,967 | | | | (7,347 | ) |
| | | | | | | | | | | | | | | | | | |
| | | | | | | | | | | | | | | | | | |
| | | | | | | | | | | | | | | | | | |
| | 198,214 | | | | 47,409 | | | | 3,043,660 | | | | (800,613 | ) | | | 108,360 | |
| | | | | | | | | | | | | | | | | | |
| | | | | | | | | | | | | | | | | | |
| | 133,787 | | | | 56,664 | | | | 2,976,239 | | | | (651,751 | ) | | | 106,577 | |
| | | | | | | | | | | | | | | | | | |
| | | | | | | | | | | | | | | | | | |
| | | | | | | | | | | | | | | | | | |
| | (3,910 | ) | | | (9,940 | ) | | | (3,516 | ) | | | — | | | | — | |
| | (24,689 | ) | | | (54,634 | ) | | | (122,686 | ) | | | — | | | | — | |
| | | | | | | | | | | | | | | | | | |
| | — | | | | — | | | | (2,589 | ) | | | — | | | | — | |
| | — | | | | — | | | | (59,646 | ) | | | — | | | | — | |
| | | | | | | | | | | | | | | | | | |
| | (28,599 | ) | | | (64,574 | ) | | | (188,437 | ) | | | — | | | | — | |
| | | | | | | | | | | | | | | | | | |
| | | | | | | | | | | | | | | | | | |
| | | | | | | | | | | | | | | | | | |
| | 2,750 | | | | 58,981 | | | | 8,780 | | | | 1,052,710 | | | | 1,082,641 | |
| | — | | | | 225,396 | | | | 27,516,025 | | | | 9,050,010 | | | | 672,510 | |
| | | | | | | | | | | | | | | | | | |
| | 3,910 | | | | 9,940 | | | | 305 | | | | — | | | | — | |
| | 24,688 | | | | 54,634 | | | | 47,891 | | | | — | | | | — | |
| | | | | | | | | | | | | | | | | | |
| | (3,054 | ) | | | (12,775 | ) | | | (2,524 | ) | | | — | | | | — | |
| | — | | | | (396,898 | ) | | | (4,642,649 | ) | | | — | | | | — | |
| | | | | | | | | | | | | | | | | | |
| | — | | | | — | | | | 1,022 | | | | — | | | | — | |
| | — | | | | — | | | | 22,276 | | | | — | | | | — | |
| | | | | | | | | | | | | | | | | | |
| | | | | | | | | | | | | | | | | | |
| | 28,294 | | | | (60,722 | ) | | | 22,951,126 | | | | 10,102,720 | | | | 1,755,151 | |
| | | | | | | | | | | | | | | | | | |
| | 133,482 | | | | (68,632 | ) | | | 25,738,928 | | | | 9,450,969 | | | | 1,861,728 | |
| | | | | | | | | | | | | | | | | | |
| $ | 4,046,508 | | | $ | 3,913,026 | | | $ | 35,189,897 | | | $ | 9,450,969 | | | $ | 1,861,728 | |
| | | | | | | | | | | | | | | | | | |
| $ | (3,622 | ) | | $ | 18,436 | | | $ | 83,346 | | | $ | 102,611 | | | $ | 5,564 | |
| | | | | | | | | | | | | | | | | | |
See accompanying Notes to Financial Statements.
| | |
| |
| | |
| |
| Statements of Changes in Net Assets (continued) | | |
| | | | | | | | | | | | | | | | |
| | |
| | | Harrison Street
Real Estate Fund | | | Montag & Caldwell
Balanced Fund | |
| | | Six Months Ended | | | | | | Six Months Ended | | | | |
| | | April 30, 2015 | | | Year Ended | | | April 30, 2015 | | | Year Ended | |
| | | (unaudited) | | | October 31, 2014 | | | (unaudited) | | | October 31, 2014 | |
NET ASSETS at Beginning of Period | | $ | 13,583,237 | | | $ | 13,625,155 | | | $ | 22,379,687 | | | $ | 24,264,373 | |
| | | | | | | | | | | | | | | | |
Increase (decrease) in net assets from operations: | | | | | | | | | | | | | | | | |
Net investment income | | | 108,534 | | | | 115,696 | | | | 60,018 | | | | 118,156 | |
Net realized gain on investments and foreign currency transactions | | | 1,006,741 | | | | 398,784 | | | | 933,648 | | | | 1,933,249 | |
Net change in unrealized appreciation (depreciation) on investments and translation of assets and liabilities denominated in foreign currency | | | (1,179,766 | ) | | | 1,080,562 | | | | (390,179 | ) | | | (274,140 | ) |
| | | | | | | | | | | | | | | | |
Net increase (decrease) in net assets from operations | | | (64,491 | ) | | | 1,595,042 | | | | 603,487 | | | | 1,777,265 | |
| | | | | | | | | | | | | | | | |
Distributions to shareholders from: | | | | | | | | | | | | | | | | |
Net investment income: | | | | | | | | | | | | | | | | |
Class N | | | (153,738 | ) | | | (140,263 | ) | | | (86,643 | ) | | | (189,116 | ) |
Class I | | | (10,622 | ) | | | (7,304 | ) | | | (8,903 | ) | | | (19,216 | ) |
Net realized gain on investments: | | | | | | | | | | | | | | | | |
Class N | | | — | | | | — | | | | (1,709,308 | ) | | | (686,237 | ) |
Class I | | | — | | | | — | | | | (163,800 | ) | | | (54,424 | ) |
| | | | | | | | | | | | | | | | |
Total distributions | | | (164,360 | ) | | | (147,567 | ) | | | (1,968,654 | ) | | | (948,993 | ) |
| | | | | | | | | | | | | | | | |
Capital share transactions: | | | | | | | | | | | | | | | | |
Proceeds from sales of shares: | | | | | | | | | | | | | | | | |
Class N | | | 1,449,827 | | | | 4,328,824 | | | | 439,578 | | | | 1,181,819 | |
Class I | | | 65,413 | | | | 356,754 | | | | 178,433 | | | | 356,063 | |
Proceeds from reinvestment of distributions: | | | | | | | | | | | | | | | | |
Class N | | | 148,501 | | | | 136,039 | | | | 1,744,501 | | | | 851,885 | |
Class I | | | 7,332 | | | | 4,230 | | | | 81,833 | | | | 31,658 | |
Cost of shares redeemed: | | | | | | | | | | | | | | | | |
Class N | | | (2,166,907 | ) | | | (6,092,762 | ) | | | (1,126,354 | ) | | | (4,776,971 | ) |
Class I | | | (49,622 | ) | | | (222,478 | ) | | | (364,938 | ) | | | (357,412 | ) |
| | | | | | | | | | | | | | | | |
Net increase (decrease) from capital share transactions | | | (545,456 | ) | | | (1,489,393 | ) | | | 953,053 | | | | (2,712,958 | ) |
| | | | | | | | | | | | | | | | |
Total decrease in net assets | | | (774,307 | ) | | | (41,918 | ) | | | (412,114 | ) | | | (1,884,686 | ) |
| | | | | | | | | | | | | | | | |
NET ASSETS at End of Period | | $ | 12,808,930 | | | $ | 13,583,237 | | | $ | 21,967,573 | | | $ | 22,379,687 | |
| | | | | | | | | | | | | | | | |
Undistributed (distributions in excess of) net investment income (loss) | | $ | 59,644 | | | $ | 115,470 | | | $ | (339,932 | ) | | $ | (304,404 | ) |
| | | | | | | | | | | | | | | | |
See accompanying Notes to Financial Statements.
| | |
| |
| ASTON/Cornerstone Large Cap Value Fund – Class N | | April 30, 2015 |
| |
| Financial Highlights | | |
| | | | | | | | | | | | | | | | | | | | | | | | |
| | | Six Months
Ended
04/30/15
(unaudited) | | | Year
Ended
10/31/14 | | | Year
Ended
10/31/13 | | | Year
Ended
10/31/12 | | | Year
Ended
10/31/11 | | | Year
Ended
10/31/10 | |
Net Asset Value, Beginning of Period | | $ | 15.35 | | | $ | 13.74 | | | $ | 11.04 | | | $ | 10.04 | | | $ | 9.20 | | | $ | 8.31 | |
| | | | | | | | | | | | | | | | | | | | | | | | |
Income from Investment Operations: | | | | | | | | | | | | | | | | | | | | | | | | |
Net investment income | | | 0.06 | (a) | | | 0.11 | (a) | | | 0.09 | (a) | | | 0.10 | (a) | | | 0.12 | (a) | | | 0.13 | |
Net realized and unrealized gain (loss) on investments | | | (0.24 | ) | | | 1.56 | | | | 2.72 | | | | 0.94 | | | | 0.83 | | | | 0.89 | |
| | | | | | | | | | | | | | | | | | | | | | | | |
Total from investment operations | | | (0.18 | ) | | | 1.67 | | | | 2.81 | | | | 1.04 | | | | 0.95 | | | | 1.02 | |
| | | | | | | | | | | | | | | | | | | | | | | | |
Less Distributions: | | | | | | | | | | | | | | | | | | | | | | | | |
Distributions from and in excess of net investment income | | | (0.12 | ) | | | (0.06 | ) | | | (0.11 | ) | | | (0.04 | ) | | | (0.11 | ) | | | (0.13 | ) |
| | | | | | | | | | | | | | | | | | | | | | | | |
Total distributions | | | (0.12 | ) | | | (0.06 | ) | | | (0.11 | ) | | | (0.04 | ) | | | (0.11 | ) | | | (0.13 | ) |
| | | | | | | | | | | | | | | | | | | | | | | | |
Net increase (decrease) in net asset value . | | | (0.30 | ) | | | 1.61 | | | | 2.70 | | | | 1.00 | | | | 0.84 | | | | 0.89 | |
| | | | | | | | | | | | | | | | | | | | | | | | |
Net Asset Value, End of Period | | $ | 15.05 | | | $ | 15.35 | | | $ | 13.74 | | | $ | 11.04 | | | $ | 10.04 | | | $ | 9.20 | |
| | | | | | | | | | | | | | | | | | | | | | | | |
Total Return (b) | | | (1.24 | )%(c) | | | 12.17 | % | | | 25.72 | % | | | 10.43 | % | | | 10.44 | % | | | 12.37 | % |
| | | | | | |
Ratios/Supplemental Data: | | | | | | | | | | | | | | | | | | | | | | | | |
Net Assets, End of Period (in 000’s) | | $ | 56,061 | | | $ | 60,683 | | | $ | 23,913 | | | $ | 21,105 | | | $ | 24,631 | | | $ | 19,984 | |
Ratios of expenses to average net assets: | | | | | | | | | | | | | | | | | | | | | | | | |
Before expense reimbursement and/or fee waiver by Adviser | | | 1.26 | %(d) | | | 1.30 | % | | | 1.48 | % | | | 1.58 | % | | | 1.61 | % | | | 1.19 | %(f) |
After expense reimbursement and/or fee waiver by Adviser | | | 1.26 | %(d) | | | 1.30 | % | | | 1.30 | % | | | 1.26 | %(e) | | | 1.14 | %(e) | | | 1.07 | %(f) |
Ratios of net investment income to average net assets: | | | | | | | | | | | | | | | | | | | | | | | | |
Before expense reimbursement and/or fee waiver by Adviser | | | 0.86 | %(d) | | | 0.73 | % | | | 0.53 | % | | | 0.60 | % | | | 0.80 | % | | | 1.32 | % |
After expense reimbursement and/or fee waiver by Adviser | | | 0.86 | %(d) | | | 0.73 | % | | | 0.71 | % | | | 0.92 | % | | | 1.27 | % | | | 1.44 | % |
Portfolio Turnover | | | 20.43 | %(c) | | | 30.03 | % | | | 58.24 | % | | | 58.21 | % | | | 59.07 | %(g) | | | 37.44 | % |
| | (a) | The selected per share data was calculated using the weighted average shares outstanding method for the period. |
| | (b) | The total return is calculated using the Net Asset Value used for trading at the close of business at period end. |
| | (e) | Effective March 22, 2011, the Adviser changed the voluntary expense limitation from 1.07% to 1.19%. Subsequently, on February 29, 2012, the Adviser removed the voluntary expense limitation and replaced it with a contractual expense limitation of 1.30%. |
| | (f) | Ratios of expenses to average net assets include interest expense of less than 0.005% for the year ended October 31, 2010, which is not included in the contractual expense limitation. The interest expense is from utilizing the line of credit, as discussed in Note H to the Financial Statements. |
| | (g) | Portfolio turnover rate excludes securities delivered from processing a redemption-in-kind. |
See accompanying Notes to Financial Statements.
| | |
| |
| ASTON/Cornerstone Large Cap Value Fund – Class I | | April 30, 2015 |
| |
| Financial Highlights | | |
| | | | | | | | | | | | | | | | | | | | | | | | |
| | | Six Months
Ended
04/30/15
(unaudited) | | | Year
Ended
10/31/14 | | | Year
Ended
10/31/13 | | | Year
Ended
10/31/12 | | | Year
Ended
10/31/11 | | | Year
Ended
10/31/10 | |
Net Asset Value, Beginning of Period | | $ | 15.38 | | | $ | 13.78 | | | $ | 11.07 | | | $ | 10.05 | | | $ | 9.19 | | | $ | 8.31 | |
| | | | | | | | | | | | | | | | | | | | | | | | |
Income from Investment Operations: | | | | | | | | | | | | | | | | | | | | | | | | |
Net investment income | | | 0.08 | (a) | | | 0.15 | (a) | | | 0.12 | (a) | | | 0.11 | (a) | | | 0.16 | (a) | | | 0.15 | |
Net realized and unrealized gain (loss) on
investments | | | (0.24 | ) | | | 1.54 | | | | 2.73 | | | | 0.96 | | | | 0.84 | | | | 0.88 | |
| | | | | | | | | | | | | | | | | | | | | | | | |
Total from investment operations | | | (0.16 | ) | | | 1.69 | | | | 2.85 | | | | 1.07 | | | | 1.00 | | | | 1.03 | |
| | | | | | | | | | | | | | | | | | | | | | | | |
Less Distributions: | | | | | | | | | | | | | | | | | | | | | | | | |
Distributions from and in excess of net investment income | | | (0.14 | ) | | | (0.09 | ) | | | (0.14 | ) | | | (0.05 | ) | | | (0.14 | ) | | | (0.15 | ) |
| | | | | | | | | | | | | | | | | | | | | | | | |
Total distributions | | | (0.14 | ) | | | (0.09 | ) | | | (0.14 | ) | | | (0.05 | ) | | | (0.14 | ) | | | (0.15 | ) |
| | | | | | | | | | | | | | | | | | | | | | | | |
Net increase (decrease) in net asset value . | | | (0.30 | ) | | | 1.60 | | | | 2.71 | | | | 1.02 | | | | 0.86 | | | | 0.88 | |
| | | | | | | | | | | | | | | | | | | | | | | | |
Net Asset Value, End of Period | | $ | 15.08 | | | $ | 15.38 | | | $ | 13.78 | | | $ | 11.07 | | | $ | 10.05 | | | $ | 9.19 | |
| | | | | | | | | | | | | | | | | | | | | | | | |
Total Return (b) | | | (1.09 | )%(c) | | | 12.33 | % | | | 26.08 | % | | | 10.66 | % | | | 10.95 | % | | | 12.53 | % |
| | | | | | |
Ratios/Supplemental Data: | | | | | | | | | | | | | | | | | | | | | | | | |
Net Assets, End of Period (in 000’s) | | $ | 96,357 | | | $ | 103,228 | | | $ | 38,735 | | | $ | 5,397 | | | $ | 126 | | | $ | 204,051 | |
Ratios of expenses to average net assets: | | | | | | | | | | | | | | | | | | | | | | | | |
Before expense reimbursement and/or fee waiver by Adviser | | | 1.01 | %(d) | | | 1.05 | % | | | 1.23 | % | | | 1.33 | % | | | 1.36 | % | | | 0.94 | %(f) |
After expense reimbursement and/or fee waiver by Adviser | | | 1.01 | %(d) | | | 1.05 | % | | | 1.05 | % | | | 1.01 | %(e) | | | 0.89 | %(e) | | | 0.82 | %(f) |
Ratios of net investment income to average net assets: | | | | | | | | | | | | | | | | | | | | | | | | |
Before expense reimbursement and/or fee waiver by Adviser | | | 1.11 | %(d) | | | 0.98 | % | | | 0.78 | % | | | 0.85 | % | | | 1.05 | % | | | 1.57 | % |
After expense reimbursement and/or fee waiver by Adviser | | | 1.11 | %(d) | | | 0.98 | % | | | 0.96 | % | | | 1.17 | % | | | 1.52 | % | | | 1.69 | % |
Portfolio Turnover | | | 20.43 | %(c) | | | 30.03 | % | | | 58.24 | % | | | 58.21 | % | | | 59.07 | %(g) | | | 37.44 | % |
| | (a) | The selected per share data was calculated using the weighted average shares outstanding method for the period. |
| | (b) | The total return is calculated using the Net Asset Value used for trading at the close of business at period end. |
| | (e) | Effective March 22, 2011, the Adviser changed the voluntary expense limitation from 0.82% to 0.94%. Subsequently, on February 29, 2012, the Adviser removed the voluntary expense limitation and replaced it with a contractual expense limitation of 1.05%. |
| | (f) | Ratios of expense to average net assets included interest expense of less than 0.005% for the year ended October 31, 2010, which is not included in the contractual expense limitation. The interest expense is from utilizing the line of credit, as discussed in Note H to the Financial Statements. |
| | (g) | Portfolio turnover rate excludes securities delivered from processing a redemption-in-kind. |
See accompanying Notes to Financial Statements.
| | |
| |
| ASTON/Fairpointe Focused Equity Fund – Class N | | April 30, 2015 |
| |
| Financial Highlights | | |
| | | | |
| | | Period
Ended
04/30/15(a)
(unaudited) | |
Net Asset Value, Beginning of Period | | $ | 10.00 | |
| | | | |
Income from Investment Operations: | | | | |
Net investment income | | | 0.02 | |
Net realized and unrealized gain on investments | | | 0.44 | |
| | | | |
Total from investment operations | | | 0.46 | |
| | | | |
Net increase in net asset value | | | 0.46 | |
| | | | |
Net Asset Value, End of Period | | $ | 10.46 | |
| | | | |
Total Return (b) | | | 4.60 | %(c) |
| |
Ratios/Supplemental Data: | | | | |
Net Assets, End of Period (in 000’s) | | $ | 2,092 | |
Ratios of expenses to average net assets: | | | | |
Before expense reimbursement and/or fee waiver by Adviser | | | 4.40 | %(d) |
After expense reimbursement and/or fee waiver by Adviser | | | 1.15 | %(d) |
Ratios of net investment income (loss) to average net assets: | | | | |
Before expense reimbursement and/or fee waiver by Adviser | | | (2.64 | )%(d) |
After expense reimbursement and/or fee waiver by Adviser | | | 0.61 | %(d) |
Portfolio Turnover | | | 11.03 | %(c)(e) |
| | (a) | The inception date for Fairpointe Focused Equity Fund Class N shares is December 24, 2014. |
| | (b) | The total return is calculated using the Net Asset Value used for trading at the close of business at period end. |
| | (e) | Portfolio turnover rate excludes securities received from processing a subscription-in-kind. |
See accompanying Notes to Financial Statements.
| | |
| |
| ASTON/Fairpointe Focused Equity Fund – Class I | | April 30, 2015 |
| |
| Financial Highlights | | |
| | | | |
| | | Period
Ended
04/30/15(a)
(unaudited) | |
Net Asset Value, Beginning of Period | | $ | 10.00 | |
| | | | |
Income from Investment Operations: | | | | |
Net investment income | | | 0.03 | |
Net realized and unrealized gain on investments | | | 0.44 | |
| | | | |
Total from investment operations | | | 0.47 | |
| | | | |
Net increase in net asset value | | | 0.47 | |
| | | | |
Net Asset Value, End of Period | | $ | 10.47 | |
| | | | |
Total Return (b) | | | 4.70 | %(c) |
| |
Ratios/Supplemental Data: | | | | |
Net Assets, End of Period (in 000’s) | | $ | 4,094 | |
Ratios of expenses to average net assets: | | | | |
Before expense reimbursement and/or fee waiver by Adviser | | | 4.15 | %(d) |
After expense reimbursement and/or fee waiver by Adviser | | | 0.90 | %(d) |
Ratios of net investment income (loss) to average net assets: | | | | |
Before expense reimbursement and/or fee waiver by Adviser | | | (2.39 | )%(d) |
After expense reimbursement and/or fee waiver by Adviser | | | 0.86 | %(d) |
Portfolio Turnover | | | 11.03 | %(c)(e) |
| | (a) | The inception date for Fairpointe Focused Equity Fund Class I shares is December 24, 2014. |
| | (b) | The total return is calculated using the Net Asset Value used for trading at the close of business at period end. |
| | (e) | Portfolio turnover rate excludes securities received from processing a subscription-in-kind. |
See accompanying Notes to Financial Statements.
| | |
| |
| ASTON/Herndon Large Cap Value Fund – Class N | | April 30, 2015 |
| |
| Financial Highlights | | |
| | | | | | | | | | | | | | | | | | | | | | | | |
| | | Six Months
Ended
04/30/15
(unaudited) | | | Year
Ended
10/31/14 | | | Year
Ended
10/31/13 | | | Year
Ended
10/31/12 | | | Year
Ended
10/31/11 | | | Period
Ended
10/31/10(a) | |
Net Asset Value, Beginning of Period | | $ | 15.08 | | | $ | 13.84 | | | $ | 11.73 | | | $ | 11.31 | | | $ | 10.39 | | | $ | 10.00 | |
| | | | | | | | | | | | | | | | | | | | | | | | |
Income from Investment Operations: | | | | | | | | | | | | | | | | | | | | | | | | |
Net investment income | | | 0.04 | (b) | | | 0.11 | (b) | | | 0.15 | (b) | | | 0.18 | (b) | | | 0.12 | (b) | | | 0.03 | |
Net realized and unrealized gain on investments | | | 0.09 | | | | 1.49 | | | | 2.40 | | | | 0.91 | | | | 0.81 | | | | 0.36 | |
| | | | | | | | | | | | | | | | | | | | | | | | |
Total from investment operations | | | 0.13 | | | | 1.60 | | | | 2.55 | | | | 1.09 | | | | 0.93 | | | | 0.39 | |
| | | | | | | | | | | | | | | | | | | | | | | | |
Less Distributions: | | | | | | | | | | | | | | | | | | | | | | | | |
Distributions from and in excess of net investment income | | | (0.05 | ) | | | (0.10 | ) | | | (0.22 | ) | | | (0.11 | ) | | | (0.01 | ) | | | — | |
Distributions from net realized gain on investments | | | (0.88 | ) | | | (0.26 | ) | | | (0.22 | ) | | | (0.56 | ) | | | — | | | | — | |
| | | | | | | | | | | | | | | | | | | | | | | | |
Total distributions | | | (0.93 | ) | | | (0.36 | ) | | | (0.44 | ) | | | (0.67 | ) | | | (0.01 | ) | | | — | |
| | | | | | | | | | | | | | | | | | | | | | | | |
Net increase (decrease) in net asset value | | | (0.80 | ) | | | 1.24 | | | | 2.11 | | | | 0.42 | | | | 0.92 | | | | 0.39 | |
| | | | | | | | | | | | | | | | | | | | | | | | |
Net Asset Value, End of Period | | $ | 14.28 | | | $ | 15.08 | | | $ | 13.84 | | | $ | 11.73 | | | $ | 11.31 | | | $ | 10.39 | |
| | | | | | | | | | | | | | | | | | | | | | | | |
Total Return (c) | | | 1.05 | (d) | | | 11.67 | % | | | 22.58 | % | | | 10.39 | % | | | 9.09 | % | | | 3.90 | %(d) |
| | | | | | |
Ratios/Supplemental Data: | | | | | | | | | | | | | | | | | | | | | | | | |
Net Assets, End of Period (in 000’s) | | $ | 10,391 | | | $ | 13,997 | | | $ | 41,861 | | | $ | 20,832 | | | $ | 6,089 | | | $ | 1,472 | |
Ratios of expenses to average net assets: | | | | | | | | | | | | | | | | | | | | | | | | |
Before expense reimbursement and/or fee waiver, or recoupment by Adviser | | | 1.25 | %(e) | | | 1.23 | % | | | 1.27 | % | | | 1.41 | % | | | 2.38 | % | | | 13.84 | %(e) |
After expense reimbursement and/or fee waiver, or recoupment by Adviser | | | 1.30 | %(e) | | | 1.30 | % | | | 1.30 | % | | | 1.30 | % | | | 1.30 | % | | | 1.30 | %(e) |
Ratios of net investment income (loss) to average net assets: | | | | | | | | | | | | | | | | | | | | | | | | |
Before expense reimbursement and/or fee waiver, or recoupment by Adviser | | | 0.58 | %(e) | | | 0.84 | % | | | 1.24 | % | | | 1.44 | % | | | (0.05 | )% | | | (11.94 | )%(e) |
After expense reimbursement and/or fee waiver, or recoupment by Adviser | | | 0.53 | %(e) | | | 0.77 | % | | | 1.21 | % | | | 1.55 | % | | | 1.03 | % | | | 0.60 | %(e) |
Portfolio Turnover | | | 26.59 | %(d) | | | 75.46 | % | | | 69.51 | % | | | 80.56 | % | | | 189.70 | % | | | 38.64 | %(d) |
| | (a) | The inception date for Herndon Large Cap Value Fund Class N shares is March 31, 2010. |
| | (b) | The selected per share data was calculated using the weighted average shares outstanding method for the period. |
| | (c) | The total return is calculated using the Net Asset Value used for trading at the close of business at period end. |
See accompanying Notes to Financial Statements.
| | |
| |
| ASTON/Herndon Large Cap Value Fund – Class I | | April 30, 2015 |
| |
| Financial Highlights | | |
| | | | | | | | | | | | | | | | | | | | |
| | | Six Months
Ended
04/30/15
(unaudited) | | | Year
Ended
10/31/14 | | | Year
Ended
10/31/13 | | | Year
Ended
10/31/12 | | | Period
Ended
10/31/11(a) | |
Net Asset Value, Beginning of Period | | $ | 15.12 | | | $ | 13.87 | | | $ | 11.75 | | | $ | 11.33 | | | $ | 11.48 | |
| | | | | | | | | | | | | | | | | | | | |
Income from Investment Operations: | | | | | | | | | | | | | | | | | | | | |
Net investment income | | | 0.06 | (b) | | | 0.15 | (b) | | | 0.19 | (b) | | | 0.21 | (b) | | | 0.10 | (b) |
Net realized and unrealized gain (loss) on investments | | | 0.09 | | | | 1.48 | | | | 2.39 | | | | 0.91 | | | | (0.25 | ) |
| | | | | | | | | | | | | | | | | | | | |
Total from investment operations | | | 0.15 | | | | 1.63 | | | | 2.58 | | | | 1.12 | | | | (0.15 | ) |
| | | | | | | | | | | | | | | | | | | | |
Less Distributions: | | | | | | | | | | | | | | | | | | | | |
Distributions from and in excess of net investment income | | | (0.14 | ) | | | (0.12 | ) | | | (0.24 | ) | | | (0.14 | ) | | | — | |
Distributions from net realized gain on investments | | | (0.88 | ) | | | (0.26 | ) | | | (0.22 | ) | | | (0.56 | ) | | | — | |
| | | | | | | | | | | | | | | | | | | | |
Total distributions | | | (1.02 | ) | | | (0.38 | ) | | | (0.46 | ) | | | (0.70 | ) | | | — | |
| | | | | | | | | | | | | | | | | | | | |
Net increase (decrease) in net asset value | | | (0.87 | ) | | | 1.25 | | | | 2.12 | | | | 0.42 | | | | (0.15 | ) |
| | | | | | | | | | | | | | | | | | | | |
Net Asset Value, End of Period | | $ | 14.25 | | | $ | 15.12 | | | $ | 13.87 | | | $ | 11.75 | | | $ | 11.33 | |
| | | | | | | | | | | | | | | | | | | | |
Total Return (c) | | | 1.22 | (d) | | | 11.94 | % | | | 22.94 | % | | | 10.69 | % | | | (1.31 | )%(d) |
| | | | | |
Ratios/Supplemental Data: | | | | | | | | | | | | | | | | | | | | |
Net Assets, End of Period (in 000’s) | | $ | 130,121 | | | $ | 139,448 | | | $ | 80,534 | | | $ | 34,575 | | | $ | 11,881 | |
Ratios of expenses to average net assets: | | | | | | | | | | | | | | | | | | | | |
Before expense reimbursement and/or fee waiver, or recoupment by Adviser | | | 1.00 | %(e) | | | 0.98 | % | | | 1.02 | % | | | 1.16 | % | | | 2.13 | %(e) |
After expense reimbursement and/or fee waiver, or recoupment by Adviser | | | 1.05 | %(e) | | | 1.05 | % | | | 1.05 | % | | | 1.05 | % | | | 1.05 | %(e) |
Ratios of net investment income to average net assets: | | | | | | | | | | | | | | | | | | | | |
Before expense reimbursement and/or fee waiver, or recoupment by Adviser | | | 0.83 | %(e) | | | 1.09 | % | | | 1.49 | % | | | 1.69 | % | | | 0.20 | %(e) |
After expense reimbursement and/or fee waiver, or recoupment by Adviser | | | 0.78 | %(e) | | | 1.02 | % | | | 1.46 | % | | | 1.80 | % | | | 1.28 | %(e) |
Portfolio Turnover | | | 26.59 | %(d) | | | 75.46 | % | | | 69.51 | % | | | 80.56 | % | | | 189.70 | %(d) |
| | (a) | The inception date for Herndon Large Cap Value Fund Class I shares is March 2, 2011. |
| | (b) | The selected per share data was calculated using the weighted average shares outstanding method for the period. |
| | (c) | The total return is calculated using the Net Asset Value used for trading at the close of business at period end. |
See accompanying Notes to Financial Statements.
| | |
| |
| ASTON/Montag & Caldwell Growth Fund – Class N | | April 30, 2015 |
| |
| Financial Highlights | | |
| | | | | | | | | | | | | | | | | | | | | | | | |
| | | Six Months
Ended
04/30/15
(unaudited) | | | Year
Ended
10/31/14 | | | Year
Ended
10/31/13 | | | Year
Ended
10/31/12 | | | Year
Ended
10/31/11 | | | Year
Ended
10/31/10 | |
Net Asset Value, Beginning of Period | | $ | 29.59 | | | $ | 28.68 | | | $ | 25.31 | | | $ | 24.72 | | | $ | 22.92 | | | $ | 20.87 | |
| | | | | | | | | | | | | | | | | | | | | | | | |
Income from Investment Operations: | | | | | | | | | | | | | | | | | | | | | | | | |
Net investment income | | | 0.05 | (a) | | | 0.10 | (a) | | | 0.23 | (a) | | | 0.15 | (a) | | | 0.14 | (a) | | | 0.12 | (a) |
Net realized and unrealized gain on investments | | | 0.90 | | | | 2.93 | | | | 5.07 | | | | 2.45 | | | | 1.83 | | | | 2.01 | (b) |
| | | | | | | | | �� | | | | | | | | | | | | | | | |
Total from investment operations | | | 0.95 | | | | 3.03 | | | | 5.30 | | | | 2.60 | | | | 1.97 | | | | 2.13 | |
| | | | | | | | | | | | | | | | | | | | | | | | |
Less Distributions: | | | | | | | | | | | | | | | | | | | | | | | | |
Distributions from and in excess of net investment income | | | (0.05 | ) | | | (0.16 | ) | | | (0.22 | ) | | | (0.13 | ) | | | (0.13 | ) | | | (0.08 | ) |
Distributions from net realized gain on investments | | | (5.00 | ) | | | (1.96 | ) | | | (1.71 | ) | | | (1.88 | ) | | | (0.04 | ) | | | — | |
| | | | | | | | | | | | | | | | | | | | | | | | |
Total distributions | | | (5.05 | ) | | | (2.12 | ) | | | (1.93 | ) | | | (2.01 | ) | | | (0.17 | ) | | | (0.08 | ) |
| | | | | | | | | | | | | | | | | | | | | | | | |
Net increase (decrease) in net asset value | | | (4.10 | ) | | | 0.91 | | | | 3.37 | | | | 0.59 | | | | 1.80 | | | | 2.05 | |
| | | | | | | | | | | | | | | | | | | | | | | | |
Net Asset Value, End of Period | | $ | 25.49 | | | $ | 29.59 | | | $ | 28.68 | | | $ | 25.31 | | | $ | 24.72 | | | $ | 22.92 | |
| | | | | | | | | | | | | | | | | | | | | | | | |
Total Return (c) | | | 3.19 | %(d) | | | 10.98 | % | | | 22.61 | % | | | 11.40 | % | | | 8.56 | % | | | 10.20 | % |
| | | | | | |
Ratios/Supplemental Data: | | | | | | | | | | | | | | | | | | | | | | | | |
Net Assets, End of Period (in 000’s) | | $ | 872,678 | | | $ | 1,344,317 | | | $ | 2,190,074 | | | $ | 1,908,663 | | | $ | 1,683,183 | | | $ | 1,506,075 | |
Ratios of expenses to average net assets: | | | | | | | | | | | | | | | | | | | | | | | | |
Before expense reimbursement and/or fee waiver by Adviser | | | 1.04 | %(e) | | | 1.03 | % | | | 1.04 | % | | | 1.05 | % | | | 1.06 | % | | | 1.08 | %(f) |
After expense reimbursement and/or fee waiver by Adviser | | | 1.04 | %(e) | | | 1.03 | % | | | 1.04 | % | | | 1.05 | % | | | 1.06 | % | | | 1.08 | %(f) |
Ratios of net investment income to average net assets: | | | | | | | | | | | | | | | | | | | | | | | | |
Before expense reimbursement and/or fee waiver by Adviser | | | 0.39 | %(e) | | | 0.34 | % | | | 0.88 | % | | | 0.60 | % | | | 0.59 | % | | | 0.56 | % |
After expense reimbursement and/or fee waiver by Adviser | | | 0.39 | %(e) | | | 0.34 | % | | | 0.88 | % | | | 0.60 | % | | | 0.59 | % | | | 0.56 | % |
Portfolio Turnover | | | 31.82 | %(d) | | | 47.31 | % | | | 50.57 | % | | | 46.42 | % | | | 63.48 | % | | | 57.39 | %(g) |
| | (a) | The selected per share data was calculated using the weighted average shares outstanding method for the period. |
| | (b) | Includes payments by affiliates of less than $0.005 per share. |
| | (c) | The total return is calculated using the Net Asset Value used for trading at the close of business at period end. |
| | (f) | Ratios of expenses to average net assets include interest expense of less than 0.005% for the year ended October 31, 2010. The interest expense is from utilizing the line of credit as discussed in Note H to the Financial Statements. |
| | (g) | Portfolio turnover rate excludes securities received from a reorganization. |
See accompanying Notes to Financial Statements.
| | |
| |
| ASTON/Montag & Caldwell Growth Fund – Class I | | April 30, 2015 |
| |
| Financial Highlights | | |
| | | | | | | | | | | | | | | | | | | | | | | | |
| | | Six Months
Ended
04/30/15
(unaudited) | | | Year
Ended
10/31/14 | | | Year
Ended
10/31/13 | | | Year
Ended
10/31/12 | | | Year
Ended
10/31/11 | | | Year
Ended
10/31/10 | |
Net Asset Value, Beginning of Period | | $ | 29.80 | | | $ | 28.87 | | | $ | 25.46 | | | $ | 24.85 | | | $ | 23.05 | | | $ | 20.97 | |
| | | | | | | | | | | | | | | | | | | | | | | | |
Income from Investment Operations: | | | | | | | | | | | | | | | | | | | | | | | | |
Net investment income | | | 0.09 | (a) | | | 0.17 | (a) | | | 0.30 | (a) | | | 0.21 | (a) | | | 0.21 | (a) | | | 0.18 | (a) |
Net realized and unrealized gain on investments | | | 0.89 | | | | 2.96 | | | | 5.10 | | | | 2.47 | | | | 1.82 | | | | 2.02 | (b) |
| | | | | | | | | | | | | | | | | | | | | | | | |
Total from investment operations | | | 0.98 | | | | 3.13 | | | | 5.40 | | | | 2.68 | | | | 2.03 | | | | 2.20 | |
| | | | | | | | | | | | | | | | | | | | | | | | |
Less Distributions: | | | | | | | | | | | | | | | | | | | | | | | | |
Distributions from and in excess of net investment income | | | (0.18 | ) | | | (0.24 | ) | | | (0.28 | ) | | | (0.19 | ) | | | (0.19 | ) | | | (0.12 | ) |
Distributions from net realized gain on investments | | | (5.00 | ) | | | (1.96 | ) | | | (1.71 | ) | | | (1.88 | ) | | | (0.04 | ) | | | — | |
| | | | | | | | | | | | | | | | | | | | | | | | |
Total distributions | | | (5.18 | ) | | | (2.20 | ) | | | (1.99 | ) | | | (2.07 | ) | | | (0.23 | ) | | | (0.12 | ) |
| | | | | | | | | | | | | | | | | | | | | | | | |
Net increase (decrease) in net asset value | | | (4.20 | ) | | | 0.93 | | | | 3.41 | | | | 0.61 | | | | 1.80 | | | | 2.08 | |
| | | | | | | | | | | | | | | | | | | | | | | | |
Net Asset Value, End of Period | | $ | 25.60 | | | $ | 29.80 | | | $ | 28.87 | | | $ | 25.46 | | | $ | 24.85 | | | $ | 23.05 | |
| | | | | | | | | | | | | | | | | | | | | | | | |
Total Return (c) | | | 3.28 | %(d) | | | 11.26 | % | | | 22.95 | % | | | 11.67 | % | | | 8.82 | % | | | 10.49 | % |
| | | | | | |
Ratios/Supplemental Data: | | | | | | | | | | | | | | | | | | | | | | | | |
Net Assets, End of Period (in 000’s) | | $ | 1,606,177 | | | $ | 2,784,650 | | | $ | 3,035,623 | | | $ | 2,406,145 | | | $ | 1,749,183 | | | $ | 1,528,981 | |
Ratios of expenses to average net assets: | | | | | | | | | | | | | | | | | | | | | | | | |
Before expense reimbursement and/or fee waiver by Adviser | | | 0.79 | %(e) | | | 0.78 | % | | | 0.79 | % | | | 0.80 | % | | | 0.81 | % | | | 0.83 | %(f) |
After expense reimbursement and/or fee waiver by Adviser | | | 0.79 | %(e) | | | 0.78 | % | | | 0.79 | % | | | 0.80 | % | | | 0.81 | % | | | 0.83 | %(f) |
Ratios of net investment income to average net assets: | | | | | | | | | | | | | | | | | | | | | | | | |
Before expense reimbursement and/or fee waiver by Adviser | | | 0.64 | %(e) | | | 0.59 | % | | | 1.13 | % | | | 0.85 | % | | | 0.84 | % | | | 0.81 | % |
After expense reimbursement and/or fee waiver by Adviser | | | 0.64 | %(e) | | | 0.59 | % | | | 1.13 | % | | | 0.85 | % | | | 0.84 | % | | | 0.81 | % |
Portfolio Turnover | | | 31.82 | %(d) | | | 47.31 | % | | | 50.57 | % | | | 46.42 | % | | | 63.48 | % | | | 57.39 | %(g) |
| | (a) | The selected per share data was calculated using the weighted average shares outstanding method for the period. |
| | (b) | Includes payments by affiliates of less than $0.005 per share. |
| | (c) | The total return is calculated using the Net Asset Value used for trading at the close of business at period end. |
| | (f) | Ratios of expenses to average net assets include interest expense of less than 0.005% for the year ended October 31, 2010. The interest expense is from utilizing the line of credit as discussed in Note H to the Financial Statements. |
| | (g) | Portfolio turnover rate excludes securities received from a reorganization. |
See accompanying Notes to Financial Statements.
| | |
| |
| ASTON/Montag & Caldwell Growth Fund – Class R | | April 30, 2015 |
| |
| Financial Highlights | | |
| | | | | | | | | | | | | | | | | | | | | | | | |
| | | Six Months
Ended
04/30/15
(unaudited) | | | Year
Ended
10/31/14 | | | Year
Ended
10/31/13 | | | Year
Ended
10/31/12 | | | Year
Ended
10/31/11 | | | Year
Ended
10/31/10 | |
Net Asset Value, Beginning of Period | | $ | 29.21 | | | $ | 28.33 | | | $ | 25.02 | | | $ | 24.45 | | | $ | 22.70 | | | $ | 20.73 | |
| | | | | | | | | | | | | | | | | | | | | | | | |
Income from Investment Operations: | | | | | | | | | | | | | | | | | | | | | | | | |
Net investment income | | | 0.02 | (a) | | | 0.03 | (a) | | | 0.16 | (a) | | | 0.09 | (a) | | | 0.08 | (a) | | | 0.07 | (a) |
Net realized and unrealized gain on investments | | | 0.87 | | | | 2.91 | | | | 5.01 | | | | 2.43 | | | | 1.80 | | | | 1.98 | (b) |
| | | | | | | | | | | | | | | | | | | | | | | | |
Total from investment operations | | | 0.89 | | | | 2.94 | | | | 5.17 | | | | 2.52 | | | | 1.88 | | | | 2.05 | |
| | | | | | | | | | | | | | | | | | | | | | | | |
Less Distributions: | | | | | | | | | | | | | | | | | | | | | | | | |
Distributions from and in excess of net investment income | | | (0.01 | ) | | | (0.10 | ) | | | (0.15 | ) | | | (0.07 | ) | | | (0.09 | ) | | | (0.08 | ) |
Distributions from net realized gain on investments | | | (5.00 | ) | | | (1.96 | ) | | | (1.71 | ) | | | (1.88 | ) | | | (0.04 | ) | | | — | |
| | | | | | | | | | | | | | | | | | | | | | | | |
Total distributions | | | (5.01 | ) | | | (2.06 | ) | | | (1.86 | ) | | | (1.95 | ) | | | (0.13 | ) | | | (0.08 | ) |
| | | | | | | | | | | | | | | | | | | | | | | | |
Net increase (decrease) in net asset value . | | | (4.12 | ) | | | 0.88 | | | | 3.31 | | | | 0.57 | | | | 1.75 | | | | 1.97 | |
| | | | | | | | | | | | | | | | | | | | | | | | |
Net Asset Value, End of Period | | $ | 25.09 | | | $ | 29.21 | | | $ | 28.33 | | | $ | 25.02 | | | $ | 24.45 | | | $ | 22.70 | |
| | | | | | | | | | | | | | | | | | | | | | | | |
Total Return (c) | | | 3.02 | %(d) | | | 10.74 | % | | | 22.30 | % | | | 11.10 | % | | | 8.29 | % | | | 9.90 | % |
| | | | | | |
Ratios/Supplemental Data: | | | | | | | | | | | | | | | | | | | | | | | | |
Net Assets, End of Period (in 000’s) | | $ | 6,145 | | | $ | 7,701 | | | $ | 10,099 | | | $ | 8,771 | | | $ | 8,654 | | | $ | 7,292 | |
Ratios of expenses to average net assets: | | | | | | | | | | | | | | | | | | | | | | | | |
Before expense reimbursement and/or fee waiver by Adviser | | | 1.29 | %(e) | | | 1.28 | % | | | 1.29 | % | | | 1.30 | % | | | 1.31 | % | | | 1.33 | %(f) |
After expense reimbursement and/or fee waiver by Adviser | | | 1.29 | %(e) | | | 1.28 | % | | | 1.29 | % | | | 1.30 | % | | | 1.31 | % | | | 1.33 | %(f) |
Ratios of net investment income to average net assets: | | | | | | | | | | | | | | | | | | | | | | | | |
Before expense reimbursement and/or fee waiver by Adviser | | | 0.14 | %(e) | | | 0.09 | % | | | 0.63 | % | | | 0.35 | % | | | 0.34 | % | | | 0.31 | % |
After expense reimbursement and/or fee waiver by Adviser | | | 0.14 | %(e) | | | 0.09 | % | | | 0.63 | % | | | 0.35 | % | | | 0.34 | % | | | 0.31 | % |
Portfolio Turnover | | | 31.82 | %(d) | | | 47.31 | % | | | 50.57 | % | | | 46.42 | % | | | 63.48 | % | | | 57.39 | %(g) |
| | (a) | The selected per share data was calculated using the weighted average shares outstanding method for the period. |
| | (b) | Includes payments by affiliates of less than $0.005 per share. |
| | (c) | The total return is calculated using the Net Asset Value used for trading at the close of business at period end. |
| | (f) | Ratios of expenses to average net assets include interest expense of less than 0.005% for the year ended October 31, 2010. The interest expense is from utilizing the line of credit as discussed in Note H to the Financial Statements. |
| | (g) | Portfolio turnover rate excludes securities received from a reorganization. |
See accompanying Notes to Financial Statements.
| | |
| |
| ASTON/TAMRO Diversified Equity Fund – Class N | | April 30, 2015 |
| |
| Financial Highlights | | |
| | | | | | | | | | | | | | | | | | | | | | | | |
| | | Six Months
Ended
04/30/15
(unaudited) | | | Year
Ended
10/31/14 | | | Year
Ended
10/31/13 | | | Year
Ended
10/31/12 | | | Year
Ended
10/31/11 | | | Year
Ended
10/31/10 | |
Net Asset Value, Beginning of Period | | $ | 18.73 | | | $ | 16.75 | | | $ | 13.52 | | | $ | 12.34 | | | $ | 11.83 | | | $ | 9.72 | |
| | | | | | | | | | | | | | | | | | | | | | | | |
Income from Investment Operations: | | | | | | | | | | | | | | | | | | | | | | | | |
Net investment income (loss) | | | (0.01 | )(a) | | | (0.08 | ) | | | 0.01 | (a) | | | (— | )(b) | | | (0.02 | ) | | | — | (b) |
Net realized and unrealized gain on investments | | | 0.47 | | | | 2.56 | | | | 3.27 | | | | 1.44 | | | | 0.53 | | | | 2.13 | |
| | | | | | | | | | | | | | | | | | | | | | | | |
Total from investment operations | | | 0.46 | | | | 2.48 | | | | 3.28 | | | | 1.44 | | | | 0.51 | | | | 2.13 | |
| | | | | | | | | | | | | | | | | | | | | | | | |
Less Distributions: | | | | | | | | | | | | | | | | | | | | | | | | |
Distributions from and in excess of net investment income | | | — | | | | — | | | | (0.03 | ) | | | — | | | | — | | | | (0.02 | ) |
Distributions from net realized gain on investments | | | (1.30 | ) | | | (0.50 | ) | | | (0.02 | ) | | | (0.26 | ) | | | — | | | | — | |
| | | | | | | | | | | | | | | | | | | | | | | | |
Total distributions | | | (1.30 | ) | | | (0.50 | ) | | | (0.05 | ) | | | (0.26 | ) | | | — | | | | (0.02 | ) |
| | | | | | | | | | | | | | | | | | | | | | | | |
Net increase (decrease) in net asset value . | | | (0.84 | ) | | | 1.98 | | | | 3.23 | | | | 1.18 | | | | 0.51 | | | | 2.11 | |
| | | | | | | | | | | | | | | | | | | | | | | | |
Net Asset Value, End of Period | | $ | 17.89 | | | $ | 18.73 | | | $ | 16.75 | | | $ | 13.52 | | | $ | 12.34 | | | $ | 11.83 | |
| | | | | | | | | | | | | | | | | | | | | | | | |
Total Return (c) | | | 2.41 | %(d) | | | 15.10 | % | | | 24.29 | % | | | 11.94 | % | | | 4.31 | % | | | 21.95 | % |
| | | | | | |
Ratios/Supplemental Data: | | | | | | | | | | | | | | | | | | | | | | | | |
Net Assets, End of Period (in 000’s) | | $ | 20,972 | | | $ | 26,022 | | | $ | 26,797 | | | $ | 21,980 | | | $ | 24,354 | | | $ | 15,670 | |
Ratios of expenses to average net assets: | | | | | | | | | | | | | | | | | | | | | | | | |
Before expense reimbursement and/or fee waiver by Adviser | | | 1.40 | %(e) | | | 1.37 | % | | | 1.46 | % | | | 1.68 | %(f) | | | 1.62 | %(f) | | | 1.63 | % |
After expense reimbursement and/or fee waiver by Adviser | | | 1.20 | %(e) | | | 1.20 | % | | | 1.20 | % | | | 1.20 | %(f) | | | 1.20 | %(f) | | | 1.20 | % |
Ratios of net investment income (loss) to average net assets: | | | | | | | | | | | | | | | | | | | | | | | | |
Before expense reimbursement and/or fee waiver by Adviser | | | (0.32 | )%(e) | | | (0.58 | )% | | | (0.19 | )% | | | (0.47 | )% | | | (0.63 | )% | | | (0.45 | )% |
After expense reimbursement and/or fee waiver by Adviser | | | (0.12 | )%(e) | | | (0.40 | )% | | | 0.07 | % | | | (— | )%(b) | | | (0.21 | )% | | | (0.02 | )% |
Portfolio Turnover | | | 19.87 | %(d) | | | 40.41 | % | | | 79.61 | % | | | 52.56 | % | | | 65.96 | % | | | 81.75 | % |
| | (a) | The selected per share data was calculated using the weighted average shares outstanding method for the period. |
| | (b) | Represents less than $(0.005) per share or less than (0.005)%. |
| | (c) | The total return is calculated using the Net Asset Value used for trading at the close of business at period end. |
| | (f) | Ratios of expenses to average net assets include interest expense of less than 0.005% for each of the years ended October 31, 2012 and October 31, 2011, which are not included in the contractual expense limitation. The interest expense is from utilizing the line of credit as discussed in Note H to the Financial Statements. |
See accompanying Notes to Financial Statements.
| | |
| |
| ASTON/TAMRO Diversified Equity Fund – Class I | | April 30, 2015 |
| |
| Financial Highlights | | |
| | | | | | | | | | | | | | | | |
| | | Six Months
Ended
04/30/15
(unaudited) | | | Year
Ended
10/31/14 | | | Year
Ended
10/31/13 | | | Period
Ended
10/31/12(a) | |
Net Asset Value, Beginning of Period | | $ | 18.80 | | | $ | 16.78 | | | $ | 13.55 | | | $ | 13.27 | |
| | | | | | | | | | | | | | | | |
Income from Investment Operations: | | | | | | | | | | | | | | | | |
Net investment income (loss) | | | 0.01 | (b) | | | (0.03 | ) | | | 0.05 | (b) | | | (0.05 | ) |
Net realized and unrealized gain on investments | | | 0.47 | | | | 2.56 | | | | 3.26 | | | | 0.33 | |
| | | | | | | | | | | | | | | | |
Total from investment operations | | | 0.48 | | | | 2.53 | | | | 3.31 | | | | 0.28 | |
| | | | | | | | | | | | | | | | |
Less Distributions: | | | | | | | | | | | | | | | | |
Distributions from and in excess of net investment income | | | — | | | | (0.01 | ) | | | (0.06 | ) | | | — | |
Distributions from net realized gain on investments | | | (1.30 | ) | | | (0.50 | ) | | | (0.02 | ) | | | — | |
| | | | | | | | | | | | | | | | |
Total Distributions | | | (1.30 | ) | | | (0.51 | ) | | | (0.08 | ) | | | — | |
| | | | | | | | | | | | | | | | |
Net increase (decrease) in net asset value | | | (0.82 | ) | | | 2.02 | | | | 3.23 | | | | 0.28 | |
| | | | | | | | | | | | | | | | |
Net Asset Value, End of Period | | $ | 17.98 | | | $ | 18.80 | | | $ | 16.78 | | | $ | 13.55 | |
| | | | | | | | | | | | | | | | |
Total Return (c) | | | 2.51 | %(d) | | | 15.40 | % | | | 24.64 | % | | | 2.04 | %(d) |
| | | | |
Ratios/Supplemental Data: | | | | | | | | | | | | | | | | |
Net Assets, End of Period (in 000’s) | | $ | 22,322 | | | $ | 24,700 | | | $ | 28,880 | | | $ | 569 | |
Ratios of expenses to average net assets: | | | | | | | | | | | | | | | | |
Before expense reimbursement and/or fee waiver by Adviser | | | 1.15 | %(e) | | | 1.12 | % | | | 1.21 | % | | | 1.45 | %(e)(f) |
After expense reimbursement and/or fee waiver by Adviser | | | 0.95 | %(e) | | | 0.95 | % | | | 0.95 | % | | | 0.95 | %(e)(f) |
Ratios of net investment income (loss) to average net assets: | | | | | | | | | | | | | | | | |
Before expense reimbursement and/or fee waiver by Adviser | | | (0.07 | )%(e) | | | (0.33 | )% | | | 0.06 | % | | | (1.11 | )%(e) |
After expense reimbursement and/or fee waiver by Adviser | | | 0.13 | %(e) | | | (0.15 | )% | | | 0.32 | % | | | (0.61 | )%(e) |
Portfolio Turnover | | | 19.87 | %(d) | | | 40.41 | % | | | 79.61 | % | | | 52.56 | % |
| | (a) | The inception date for the TAMRO Diversified Equity Fund Class I shares is March 2, 2012. |
| | (b) | The selected per share data was calculated using the weighted average shares outstanding method for the period. |
| | (c) | The total return is calculated using the Net Asset Value used for trading at the close of business at period end. |
| | (f) | Ratios of expenses to average net assets include interest expense of less than 0.005% for the year ended October 31, 2012, which is not included in the contractual expense limitation. The interest expense is from utilizing the line of credit as discussed in Note H to the Financial Statements. |
See accompanying Notes to Financial Statements.
| | |
| |
| ASTON/River Road Dividend All Cap Value Fund – Class N | | April 30, 2015 |
| |
| Financial Highlights | | |
| | | | | | | | | | | | | | | | | | | | | | | | |
| | | Six Months
Ended
04/30/15
(unaudited) | | | Year
Ended
10/31/14 | | | Year
Ended
10/31/13 | | | Year
Ended
10/31/12 | | | Year
Ended
10/31/11 | | | Year
Ended
10/31/10 | |
Net Asset Value, Beginning of Period | | $ | 14.05 | | | $ | 13.99 | | | $ | 11.67 | | | $ | 10.68 | | | $ | 10.23 | | | $ | 8.58 | |
| | | | | | | | | | | | | | | | | | | | | | | | |
Income from Investment Operations: | | | | | | | | | | | | | | | | | | | | | | | | |
Net investment income | | | 0.10 | (a) | | | 0.42 | | | | 0.30 | | | | 0.31 | (a) | | | 0.29 | (a) | | | 0.26 | (a) |
Net realized and unrealized gain on investments | | | 0.41 | | | | 0.89 | | | | 2.73 | | | | 1.05 | | | | 0.42 | | | | 1.62 | |
| | | | | | | | | | | | | | | | | | | | | | | | |
Total from investment operations | | | 0.51 | | | | 1.31 | | | | 3.03 | | | | 1.36 | | | | 0.71 | | | | 1.88 | |
| | | | | | | | | | | | | | | | | | | | | | | | |
Less Distributions: | | | | | | | | | | | | | | | | | | | | | | | | |
Distributions from and in excess of net investment income | | | (0.10 | ) | | | (0.44 | ) | | | (0.27 | ) | | | (0.30 | ) | | | (0.26 | ) | | | (0.23 | ) |
Distributions from net realized gain on investments | | | (1.17 | ) | | | (0.81 | ) | | | (0.44 | ) | | | (0.07 | ) | | | — | | | | — | |
| | | | | | | | | | | | | | | | | | | | | | | | |
Total distributions | | | (1.27 | ) | | | (1.25 | ) | | | (0.71 | ) | | | (0.37 | ) | | | (0.26 | ) | | | (0.23 | ) |
| | | | | | | | | | | | | | | | | | | | | | | | |
Net increase (decrease) in net asset value | | | (0.76 | ) | | | 0.06 | | | | 2.32 | | | | 0.99 | | | | 0.45 | | | | 1.65 | |
| | | | | | | | | | | | | | | | | | | | | | | | |
Net Asset Value, End of Period | | $ | 13.29 | | | $ | 14.05 | | | $ | 13.99 | | | $ | 11.67 | | | $ | 10.68 | | | $ | 10.23 | |
| | | | | | | | | | | | | | | | | | | | | | | | |
Total Return (b) | | | 3.63 | %(c) | | | 9.89 | % | | | 27.47 | % | | | 12.96 | % | | | 6.94 | % | | | 22.20 | % |
| | | | | | |
Ratios/Supplemental Data: | | | | | | | | | | | | | | | | | | | | | | | | |
Net Assets, End of Period (in 000’s) | | $ | 244,562 | | | $ | 349,937 | | | $ | 449,130 | | | $ | 338,166 | | | $ | 301,290 | | | $ | 135,544 | |
Ratios of expenses to average net assets: | | | | | | | | | | | | | | | | | | | | | | | | |
Before expense reimbursement and/or fee waiver by Adviser | | | 1.09 | %(d) | | | 1.09 | % | | | 1.09 | % | | | 1.12 | % | | | 1.12 | % | | | 1.14 | % |
After expense reimbursement and/or fee waiver by Adviser | | | 1.09 | %(d) | | | 1.09 | % | | | 1.09 | % | | | 1.12 | % | | | 1.12 | % | | | 1.14 | % |
Ratios of net investment income to average net assets: | | | | | | | | | | | | | | | | | | | | | | | | |
Before expense reimbursement and/or fee waiver by Adviser | | | 1.45 | %(d) | | | 2.96 | % | | | 2.38 | % | | | 2.74 | % | | | 2.70 | % | | | 2.69 | % |
After expense reimbursement and/or fee waiver by Adviser | | | 1.45 | %(d) | | | 2.96 | % | | | 2.38 | % | | | 2.74 | % | | | 2.70 | % | | | 2.69 | % |
Portfolio Turnover | | | 13.43 | %(c) | | | 31.78 | % | | | 35.18 | % | | | 28.17 | % | | | 24.65 | % | | | 29.92 | % |
| | (a) | The selected per share data was calculated using the weighted average shares outstanding method for the period. |
| | (b) | The total return is calculated using the Net Asset Value used for trading at the close of business at period end. |
See accompanying Notes to Financial Statements.
| | |
| |
| ASTON/River Road Dividend All Cap Value Fund – Class I | | April 30, 2015 |
| |
| Financial Highlights | | |
| | | | | | | | | | | | | | | | | | | | | | | | |
| | | Six Months
Ended
04/30/15
(unaudited) | | | Year
Ended
10/31/14 | | | Year
Ended
10/31/13 | | | Year
Ended
10/31/12 | | | Year
Ended
10/31/11 | | | Year
Ended
10/31/10 | |
Net Asset Value, Beginning of Period | | $ | 14.04 | | | $ | 13.98 | | | $ | 11.66 | | | $ | 10.67 | | | $ | 10.22 | | | $ | 8.57 | |
| | | | | | | | | | | | | | | | | | | | | | | | |
Income from Investment Operations: | | | | | | | | | | | | | | | | | | | | | | | | |
Net investment income | | | 0.11 | (a) | | | 0.44 | | | | 0.34 | | | | 0.34 | (a) | | | 0.32 | (a) | | | 0.28 | (a) |
Net realized and unrealized gain on investments | | | 0.42 | | | | 0.90 | | | | 2.72 | | | | 1.05 | | | | 0.42 | | | | 1.63 | |
| | | | | | | | | | | | | | | | | | | | | | | | |
Total from investment operations | | | 0.53 | | | | 1.34 | | | | 3.06 | | | | 1.39 | | | | 0.74 | | | | 1.91 | |
| | | | | | | | | | | | | | | | | | | | | | | | |
Less Distributions: | | | | | | | | | | | | | | | | | | | | | | | | |
Distributions from and in excess of net investment income | | | (0.12 | ) | | | (0.47 | ) | | | (0.30 | ) | | | (0.33 | ) | | | (0.29 | ) | | | (0.26 | ) |
Distributions from net realized gain on investments | | | (1.17 | ) | | | (0.81 | ) | | | (0.44 | ) | | | (0.07 | ) | | | — | | | | — | |
| | | | | | | | | | | | | | | | | | | | | | | | |
Total distributions | | | (1.29 | ) | | | (1.28 | ) | | | (0.74 | ) | | | (0.40 | ) | | | (0.29 | ) | | | (0.26 | ) |
| | | | | | | | | | | | | | | | | | | | | | | | |
Net increase (decrease) in net asset value . | | | (0.76 | ) | | | 0.06 | | | | 2.32 | | | | 0.99 | | | | 0.45 | | | | 1.65 | |
| | | | | | | | | | | | | | | | | | | | | | | | |
Net Asset Value, End of Period | | $ | 13.28 | | | $ | 14.04 | | | $ | 13.98 | | | $ | 11.66 | | | $ | 10.67 | | | $ | 10.22 | |
| | | | | | | | | | | | | | | | | | | | | | | | |
Total Return (b) | | | 3.76 | %(c) | | | 10.18 | % | | | 27.81 | % | | | 13.25 | % | | | 7.21 | % | | | 22.53 | % |
| | | | | | |
Ratios/Supplemental Data: | | | | | | | | | | | | | | | | | | | | | | | | |
Net Assets, End of Period (in 000’s) | | $ | 744,401 | | | $ | 788,322 | | | $ | 779,859 | | | $ | 586,043 | | | $ | 318,863 | | | $ | 137,629 | |
Ratios of expenses to average net assets: | | | | | | | | | | | | | | | | | | | | | | | | |
Before expense reimbursement and/or fee waiver by Adviser | | | 0.84 | %(d) | | | 0.84 | % | | | 0.84 | % | | | 0.87 | % | | | 0.87 | % | | | 0.89 | % |
After expense reimbursement and/or fee waiver by Adviser | | | 0.84 | %(d) | | | 0.84 | % | | | 0.84 | % | | | 0.87 | % | | | 0.87 | % | | | 0.89 | % |
Ratios of net investment income to average net assets: | | | | | | | | | | | | | | | | | | | | | | | | |
Before expense reimbursement and/or fee waiver by Adviser | | | 1.70 | %(d) | | | 3.21 | % | | | 2.63 | % | | | 2.99 | % | | | 2.95 | % | | | 2.94 | % |
After expense reimbursement and/or fee waiver by Adviser | | | 1.70 | %(d) | | | 3.21 | % | | | 2.63 | % | | | 2.99 | % | | | 2.95 | % | | | 2.94 | % |
Portfolio Turnover | | | 13.43 | %(c) | | | 31.78 | % | | | 35.18 | % | | | 28.17 | % | | | 24.65 | % | | | 29.92 | % |
| | (a) | The selected per share data was calculated using the weighted average shares outstanding method for the period. |
| | (b) | The total return is calculated using the Net Asset Value used for trading at the close of business at period end. |
See accompanying Notes to Financial Statements.
| | |
| |
| ASTON/River Road Dividend All Cap Value Fund II – Class N | | April 30, 2015 |
| |
| Financial Highlights | | |
| | | | | | | | | | | | | | | | |
| | | Six Months
Ended
04/30/15
(unaudited) | | | Year
Ended
10/31/14 | | | Year
Ended
10/31/13 | | | Period
Ended
10/31/12(a) | |
Net Asset Value, Beginning of Period | | $ | 13.69 | | | $ | 12.89 | | | $ | 10.44 | | | $ | 10.00 | |
| | | | | | | | | | | | | | | | |
Income from Investment Operations: | | | | | | | | | | | | | | | | |
Net investment income | | | 0.10 | (b) | | | 0.36 | | | | 0.22 | | | | 0.09 | (b) |
Net realized and unrealized gain on investments | | | 0.35 | | | | 0.96 | | | | 2.46 | | | | 0.41 | |
| | | | | | | | | | | | | | | | |
Total from investment operations | | | 0.45 | | | | 1.32 | | | | 2.68 | | | | 0.50 | |
| | | | | | | | | | | | | | | | |
Less Distributions: | | | | | | | | | | | | | | | | |
Distributions from and in excess of net investment income | | | (0.11 | ) | | | (0.38 | ) | | | (0.23 | ) | | | (0.06 | ) |
Distributions from net realized gain on investments | | | (0.43 | ) | | | (0.14 | ) | | | — | (c) | | | — | |
| | | | | | | | | | | | | | | | |
Total distributions | | | (0.54 | ) | | | (0.52 | ) | | | (0.23 | ) | | | (0.06 | ) |
| | | | | | | | | | | | | | | | |
Net increase (decrease) in net asset value | | | (0.09 | ) | | | 0.80 | | | | 2.45 | | | | 0.44 | |
| | | | | | | | | | | | | | | | |
Net Asset Value, End of Period | | $ | 13.60 | | | $ | 13.69 | | | $ | 12.89 | | | $ | 10.44 | |
| | | | | | | | | | | | | | | | |
Total Return (d) | | | 3.25 | %(e) | | | 10.46 | % | | | 25.99 | % | | | 5.09 | %(e) |
| | | | |
Ratios/Supplemental Data: | | | | | | | | | | | | | | | | |
Net Assets, End of Period (in 000’s) | | $ | 6,430 | | | $ | 7,037 | | | $ | 3,634 | | | $ | 1,049 | |
Ratios of expenses to average net assets: | | | | | | | | | | | | | | | | |
Before expense reimbursement and/or fee waiver, or recoupment by Adviser | | | 1.15 | %(f) | | | 1.17 | % | | | 1.37 | % | | | 4.99 | %(f) |
After expense reimbursement and/or fee waiver, or recoupment by Adviser | | | 1.15 | %(f) | | | 1.25 | % | | | 1.30 | % | | | 1.30 | %(f) |
Ratios of net investment income (loss) to average net assets: | | | | | | | | | | | | | | | | |
Before expense reimbursement and/or fee waiver, or recoupment by Adviser | | | 1.49 | %(f) | | | 2.81 | % | | | 1.68 | % | | | (1.24 | )%(f) |
After expense reimbursement and/or fee waiver, or recoupment by Adviser | | | 1.49 | %(f) | | | 2.72 | % | | | 1.76 | % | | | 2.45 | %(f) |
Portfolio Turnover | | | 15.77 | %(e) | | | 29.42 | % | | | 27.80 | % | | | 5.58 | %(e)(g) |
| | (a) | The inception date for River Road Dividend All Cap Value Fund II Class N shares is June 27, 2012. |
| | (b) | The selected per share data was calculated using the weighted average shares outstanding method for the period. |
| | (c) | Represents less than $(0.005) per share. |
| | (d) | The total return is calculated using the Net Asset Value used for trading at the close of business at period end. |
| | (g) | Portfolio turnover excludes securities received from processing a subscription-in-kind. |
See accompanying Notes to Financial Statements.
| | |
| |
| ASTON/River Road Dividend All Cap Value Fund II – Class I | | April 30, 2015 |
| |
| Financial Highlights | | |
| | | | | | | | | | | | | | | | |
| | | Six Months
Ended
04/30/15
(unaudited) | | | Year
Ended
10/31/14 | | | Year
Ended
10/31/13 | | | Period
Ended
10/31/12(a) | |
Net Asset Value, Beginning of Period | | $ | 13.69 | | | $ | 12.89 | | | $ | 10.45 | | | $ | 10.00 | |
| | | | | | | | | | | | | | | | |
Income from Investment Operations: | | | | | | | | | | | | | | | | |
Net investment income | | | 0.12 | (b) | | | 0.39 | | | | 0.25 | | | | 0.10 | (b) |
Net realized and unrealized gain on investments | | | 0.36 | | | | 0.96 | | | | 2.45 | | | | 0.42 | |
| | | | | | | | | | | | | | | | |
Total from investment operations | | | 0.48 | | | | 1.35 | | | | 2.70 | | | | 0.52 | |
| | | | | | | | | | | | | | | | |
Less Distributions: | | | | | | | | | | | | | | | | |
Distributions from and in excess of net investment income | | | (0.13 | ) | | | (0.41 | ) | | | (0.26 | ) | | | (0.07 | ) |
Distributions from net realized gain on investments | | | (0.43 | ) | | | (0.14 | ) | | | — | (c) | | | — | |
| | | | | | | | | | | | | | | | |
Total distributions | | | (0.56 | ) | | | (0.55 | ) | | | (0.26 | ) | | | (0.07 | ) |
| | | | | | | | | | | | | | | | |
Net increase (decrease) in net asset value | | | (0.08 | ) | | | 0.80 | | | | 2.44 | | | | 0.45 | |
| | | | | | | | | | | | | | | | |
Net Asset Value, End of Period | | $ | 13.61 | | | $ | 13.69 | | | $ | 12.89 | | | $ | 10.45 | |
| | | | | | | | | | | | | | | | |
Total Return (d) | | | 3.46 | %(e) | | | 10.73 | % | | | 26.30 | % | | | 5.17 | %(e) |
| | | | |
Ratios/Supplemental Data: | | | | | | | | | | | | | | | | |
Net Assets, End of Period (in 000’s) | | $ | 136,058 | | | $ | 125,660 | | | $ | 86,240 | | | $ | 9,370 | |
Ratios of expenses to average net assets: | | | | | | | | | | | | | | | | |
Before expense reimbursement and/or fee waiver, or recoupment by Adviser | | | 0.90 | %(f) | | | 0.92 | % | | | 1.12 | % | | | 4.74 | %(f) |
After expense reimbursement and/or fee waiver, or recoupment by Adviser | | | 0.90 | %(f) | | | 1.00 | % | | | 1.05 | % | | | 1.05 | %(f) |
Ratios of net investment income (loss) to average net assets: | | | | | | | | | | | | | | | | |
Before expense reimbursement and/or fee waiver, or recoupment by Adviser | | | 1.74 | %(f) | | | 3.06 | % | | | 1.93 | % | | | (0.99 | )%(f) |
After expense reimbursement and/or fee waiver, or recoupment by Adviser | | | 1.74 | %(f) | | | 2.97 | % | | | 2.01 | % | | | 2.70 | %(f) |
Portfolio Turnover | | | 15.77 | %(e) | | | 29.42 | % | | | 27.80 | % | | | 5.58 | %(e)(g) |
| | (a) | The inception date for River Road Dividend All Cap Value Fund II Class I shares is June 27, 2012. |
| | (b) | The selected per share data was calculated using the weighted average shares outstanding method for the period. |
| | (c) | Represents less than $(0.005) per share. |
| | (d) | The total return is calculated using the Net Asset Value used for trading at the close of business at period end. |
| | (g) | Portfolio turnover excludes securities received from processing a subscription-in-kind. |
See accompanying Notes to Financial Statements.
| | |
| |
| ASTON/Fairpointe Mid Cap Fund – Class N | | April 30, 2015 |
| |
| Financial Highlights | | |
| | | | | | | | | | | | | | | | | | | | | | | | |
| | | Six Months
Ended
04/30/15
(unaudited) | | | Year
Ended
10/31/14 | | | Year
Ended
10/31/13 | | | Year
Ended
10/31/12 | | | Year
Ended
10/31/11 | | | Year
Ended
10/31/10 | |
Net Asset Value, Beginning of Period | | $ | 46.89 | | | $ | 45.40 | | | $ | 32.79 | | | $ | 29.76 | | | $ | 29.04 | | | $ | 22.73 | |
| | | | | | | | | | | | | | | | | | | | | | | | |
Income from Investment Operations: | | | | | | | | | | | | | | | | | | | | | | | | |
Net investment income (loss) | | | 0.03 | (a) | | | (0.06 | ) | | | 0.17 | | | | 0.16 | | | | 0.06 | (a) | | | 0.01 | |
Net realized and unrealized gain on investments | | | 3.07 | | | | 5.82 | | | | 13.48 | | | | 3.13 | | | | 0.82 | | | | 6.35 | |
| | | | | | | | | | | | | | | | | | | | | | | | |
Total from investment operations | | | 3.10 | | | | 5.76 | | | | 13.65 | | | | 3.29 | | | | 0.88 | | | | 6.36 | |
| | | | | | | | | | | | | | | | | | | | | | | | |
Less Distributions: | | | | | | | | | | | | | | | | | | | | | | | | |
Distributions from and in excess of net investment income | | | (0.04 | ) | | | — | | | | (0.30 | ) | | | (0.05 | ) | | | (0.08 | ) | | | (0.05 | ) |
Distributions from net realized gain on investments | | | (7.58 | ) | | | (4.27 | ) | | | (0.74 | ) | | | (0.21 | ) | | | (0.08 | ) | | | — | |
| | | | | | | | | | | | | | | | | | | | | | | | |
Total distributions | | | (7.62 | ) | | | (4.27 | ) | | | (1.04 | ) | | | (0.26 | ) | | | (0.16 | ) | | | (0.05 | ) |
| | | | | | | | | | | | | | | | | | | | | | | | |
Net increase (decrease) in net asset value . | | | (4.52 | ) | | | 1.49 | | | | 12.61 | | | | 3.03 | | | | 0.72 | | | | 6.31 | |
| | | | | | | | | | | | | | | | | | | | | | | | |
Net Asset Value, End of Period | | $ | 42.37 | | | $ | 46.89 | | | $ | 45.40 | | | $ | 32.79 | | | $ | 29.76 | | | $ | 29.04 | |
| | | | | | | | | | | | | | | | | | | | | | | | |
Total Return (b) | | | 7.15 | %(c) | | | 13.32 | % | | | 42.88 | % | | | 11.15 | % | | | 2.98 | % | | | 28.01 | % |
| | | | | | |
Ratios/Supplemental Data: | | | | | | | | | | | | | | | | | | | | | | | | |
Net Assets, End of Period (in 000’s) | | $ | 2,410,370 | | | $ | 2,432,815 | | | $ | 2,370,432 | | | $ | 1,561,510 | | | $ | 1,502,266 | | | $ | 1,469,354 | |
Ratios of expenses to average net assets: | | | | | | | | | | | | | | | | | | | | | | | | |
Before expense reimbursement and/or fee waiver by Adviser | | | 1.10 | %(d) | | | 1.10 | % | | | 1.11 | % | | | 1.11 | %(e) | | | 1.14 | %(e) | | | 1.14 | %(e) |
After expense reimbursement and/or fee waiver by Adviser | | | 1.10 | %(d) | | | 1.10 | % | | | 1.11 | % | | | 1.11 | %(e) | | | 1.14 | %(e) | | | 1.14 | %(e) |
Ratios of net investment income (loss) to average net assets: | | | | | | | | | | | | | | | | | | | | | | | | |
Before expense reimbursement and/or fee waiver by Adviser | | | 0.14 | %(d) | | | (0.12 | )% | | | 0.42 | % | | | 0.50 | % | | | 0.21 | % | | | — | %(f) |
After expense reimbursement and/or fee waiver by Adviser | | | 0.14 | %(d) | | | (0.12 | )% | | | 0.42 | % | | | 0.50 | % | | | 0.21 | % | | | — | %(f) |
Portfolio Turnover | | | 19.11 | %(c) | | | 50.25 | % | | | 36.98 | % | | | 28.06 | %(g) | | | 11.20 | % | | | 13.82 | % |
| | (a) | The selected per share data was calculated using the weighted average shares outstanding method for the period. |
| | (b) | The total return is calculated using the Net Asset Value used for trading at the close of business at period end. |
| | (e) | Ratios of expenses to average net assets include interest expense of less than 0.005% for each of the years ended October 31, 2012, October 31, 2011, and October 31, 2010, which are not included in the contractual expense limitation. The interest expense is from utilizing the line of credit, as discussed in Note H to the Financial Statements. |
| | (f) | Represents less than 0.005%. |
| | (g) | Portfolio turnover rate excludes securities delivered from processing a redemption-in-kind. |
See accompanying Notes to Financial Statements.
| | |
| |
| ASTON/Fairpointe Mid Cap Fund – Class I | | April 30, 2015 |
| |
| Financial Highlights | | |
| | | | | | | | | | | | | | | | | | | | | | | | |
| | | Six Months
Ended
04/30/15
(unaudited) | | | Year
Ended
10/31/14 | | | Year
Ended
10/31/13 | | | Year
Ended
10/31/12 | | | Year
Ended
10/31/11 | | | Year
Ended
10/31/10 | |
Net Asset Value, Beginning of Period | | $ | 47.74 | | | $ | 46.10 | | | $ | 33.28 | | | $ | 30.20 | | | $ | 29.41 | | | $ | 23.00 | |
| | | | | | | | | | | | | | | | | | | | | | | | |
Income from Investment Operations: | | | | | | | | | | | | | | | | | | | | | | | | |
Net investment income | | | 0.09 | (a) | | | 0.05 | | | | 0.28 | | | | 0.24 | | | | 0.14 | (a) | | | 0.07 | |
Net realized and unrealized gain on investments | | | 3.13 | | | | 5.92 | | | | 13.67 | | | | 3.18 | | | | 0.82 | | | | 6.43 | |
| | | | | | | | | | | | | | | | | | | | | | | | |
Total from investment operations | | | 3.22 | | | | 5.97 | | | | 13.95 | | | | 3.42 | | | | 0.96 | | | | 6.50 | |
| | | | | | | | | | | | | | | | | | | | | | | | |
Less Distributions: | | | | | | | | | | | | | | | | | | | | | | | | |
Distributions from and in excess of net investment income | | | (0.06 | ) | | | (0.06 | ) | | | (0.39 | ) | | | (0.13 | ) | | | (0.09 | ) | | | (0.09 | ) |
Distributions from net realized gain on investment | | | (7.58 | ) | | | (4.27 | ) | | | (0.74 | ) | | | (0.21 | ) | | | (0.08 | ) | | | — | |
| | | | | | | | | | | | | | | | | | | | | | | | |
Total distributions | | | (7.64 | ) | | | (4.33 | ) | | | (1.13 | ) | | | (0.34 | ) | | | (0.17 | ) | | | (0.09 | ) |
| | | | | | | | | | | | | | | | | | | | | | | | |
Net increase (decrease) in net asset value | | | (4.42 | ) | | | 1.64 | | | | 12.82 | | | | 3.08 | | | | 0.79 | | | | 6.41 | |
| | | | | | | | | | | | | | | | | | | | | | | | |
Net Asset Value, End of Period | | $ | 43.32 | | | $ | 47.74 | | | $ | 46.10 | | | $ | 33.28 | | | $ | 30.20 | | | $ | 29.41 | |
| | | | | | | | | | | | | | | | | | | | | | | | |
Total Return (b) | | | 7.29 | %(c) | | | 13.61 | % | | | 43.23 | % | | | 11.46 | % | | | 3.22 | % | | | 28.31 | % |
| | | | | | |
Ratios/Supplemental Data: | | | | | | | | | | | | | | | | | | | | | | | | |
Net Assets, End of Period (in 000’s) | | $ | 3,339,976 | | | $ | 3,531,114 | | | $ | 2,521,876 | | | $ | 1,464,222 | | | $ | 1,339,223 | | | $ | 499,651 | |
Ratios of expenses to average net assets: | | | | | | | | | | | | | | | | | | | | | | | | |
Before expense reimbursement and/or fee waiver by Adviser | | | 0.85 | %(d) | | | 0.85 | % | | | 0.86 | % | | | 0.86 | %(e) | | | 0.89 | %(e) | | | 0.89 | %(e) |
After expense reimbursement and/or fee waiver by Adviser | | | 0.85 | %(d) | | | 0.85 | % | | | 0.86 | % | | | 0.86 | %(e) | | | 0.89 | %(e) | | | 0.89 | %(e) |
Ratios of net investment income to average net assets: | | | | | | | | | | | | | | | | | | | | | | | | |
Before expense reimbursement and/or fee waiver by Adviser | | | 0.39 | %(d) | | | 0.13 | % | | | 0.67 | % | | | 0.75 | % | | | 0.46 | % | | | 0.25 | % |
After expense reimbursement and/or fee waiver by Adviser | | | 0.39 | %(d) | | | 0.13 | % | | | 0.67 | % | | | 0.75 | % | | | 0.46 | % | | | 0.25 | % |
Portfolio Turnover | | | 19.11 | %(c) | | | 50.25 | % | | | 36.98 | % | | | 28.06 | %(f) | | | 11.20 | % | | | 13.82 | % |
| | (a) | The selected per share data was calculated using the weighted average shares outstanding method for the period. |
| | (b) | The total return is calculated using the Net Asset Value used for trading at the close of business at period end. |
| | (e) | Ratios of expenses to average net assets include interest expense of less than 0.005% for each of the years ended October 31, 2012, October 31, 2011, and October 31, 2010, which are not included in the contractual expense limitation. The interest expense is from utilizing the line of credit, as discussed in Note H to the Financial Statements. |
| | (f) | Portfolio turnover rate excludes securities delivered from processing a redemption-in-kind. |
See accompanying Notes to Financial Statements.
| | |
| |
| ASTON/Montag & Caldwell Mid Cap Growth Fund – Class N | | April 30, 2015 |
| |
| Financial Highlights | | |
| | | | | | | | | | | | | | | | | | | | | | | | |
| | | Six Months
Ended
04/30/15
(unaudited) | | | Year
Ended
10/31/14 | | | Year
Ended
10/31/13 | | | Year
Ended
10/31/12 | | | Year
Ended
10/31/11 | | | Year
Ended
10/31/10 | |
Net Asset Value, Beginning of Period | | $ | 11.99 | | | $ | 12.77 | | | $ | 10.36 | | | $ | 9.71 | | | $ | 8.51 | | | $ | 6.83 | |
| | | | | | | | | | | | | | | | | | | | | | | | |
Income from Investment Operations: | | | | | | | | | | | | | | | | | | | | | | | | |
Net investment loss | | | (0.04 | )(a) | | | (0.06 | )(a) | | | (0.07 | ) | | | (0.07 | )(a) | | | (0.07 | ) | | | (0.04 | ) |
Net realized and unrealized gain on investments | | | 0.86 | | | | 1.20 | | | | 2.58 | | | | 0.72 | | | | 1.27 | | | | 1.74 | |
| | | | | | | | | | | | | | | | | | | | | | | | |
Total from investment operations | | | 0.82 | | | | 1.14 | | | | 2.51 | | | | 0.65 | | | | 1.20 | | | | 1.70 | |
| | | | | | | | | | | | | | | | | | | | | | | | |
Less Distributions: | | | | | | | | | | | | | | | | | | | | | | | | |
Distributions from and in excess of net investment
income | | | — | | | | — | | | | — | | | | — | | | | — | | | | (0.02 | ) |
Distributions from net realized gain on investments | | | (0.99 | ) | | | (1.92 | ) | | | (0.10 | ) | | | — | | | | — | | | | — | |
| | | | | | | | | | | | | | | | | | | | | | | | |
Total distributions | | | (0.99 | ) | | | (1.92 | ) | | | (0.10 | ) | | | — | | | | — | | | | (0.02 | ) |
| | | | | | | | | | | | | | | | | | | | | | | | |
Net increase (decrease) in net asset value | | | (0.17 | ) | | | (0.78 | ) | | | 2.41 | | | | 0.65 | | | | 1.20 | | | | 1.68 | |
| | | | | | | | | | | | | | | | | | | | | | | | |
Net Asset Value, End of Period | | $ | 11.82 | | | $ | 11.99 | | | $ | 12.77 | | | $ | 10.36 | | | $ | 9.71 | | | $ | 8.51 | |
| | | | | | | | | | | | | | | | | | | | | | | | |
Total Return (b) | | | 7.07 | %(c) | | | 9.75 | % | | | 24.51 | % | | | 6.70 | % | | | 14.10 | % | | | 24.85 | % |
| | | | | | |
Ratios/Supplemental Data: | | | | | | | | | | | | | | | | | | | | | | | | |
Net Assets, End of Period (in 000’s) | | $ | 5,131 | | | $ | 7,633 | | | $ | 11,402 | | | $ | 7,369 | | | $ | 4,507 | | | $ | 3,399 | |
Ratios of expenses to average net assets: | | | | | | | | | | | | | | | | | | | | | | | | |
Before expense reimbursement and/or fee waiver by Adviser | | | 2.11 | %(d) | | | 2.16 | % | | | 1.85 | % | | | 2.50 | % | | | 3.07 | % | | | 3.55 | % |
After expense reimbursement and/or fee waiver by Adviser | | | 1.25 | %(d) | | | 1.25 | % | | | 1.25 | % | | | 1.25 | %(e) | | | 1.39 | %(e) | | | 1.40 | % |
Ratios of net investment loss to average net assets: | | | | | | | | | | | | | | | | | | | | | | | | |
Before expense reimbursement and/or fee waiver by Adviser | | | (1.39 | )%(d) | | | (1.45 | )% | | | (1.18 | )% | | | (1.88 | )% | | | (2.39 | )% | | | (2.75 | )% |
After expense reimbursement and/or fee waiver by Adviser | | | (0.52 | )%(d) | | | (0.55 | )% | | | (0.58 | )% | | | (0.63 | )% | | | (0.71 | )% | | | (0.60 | )% |
Portfolio Turnover | | | 29.24 | %(c) | | | 32.96 | % | | | 74.24 | % | | | 36.60 | % | | | 29.31 | % | | | 31.49 | % |
| | (a) | The selected per share data was calculated using the weighted average shares outstanding method for the period. |
| | (b) | The total return is calculated using the Net Asset Value used for trading at the close of business at period end. |
| | (e) | For the period November 1, 2010 through September 29, 2011 the Adviser contractually waived management fees and/or reimbursed expenses so that the net expense ratio did not exceed 1.40%, excluding interest, taxes, investment-related costs (such as brokerage commissions), extraordinary expenses and acquired fund fees and expenses. Effective September 30, 2011, the Adviser implemented a voluntary expense limitation of 1.25%. Subsequently, on February 29, 2012, the Adviser removed the voluntary expense limitation and replaced it with a contractual expense limitation of 1.25%. |
See accompanying Notes to Financial Statements.
| | |
| |
| ASTON/Montag & Caldwell Mid Cap Growth Fund – Class I | | April 30, 2015 |
| |
| Financial Highlights | | |
| | | | | | | | |
| | | Six Months
Ended
04/30/15
(unaudited) | | | Period
Ended
10/31/14(a) | |
| | | | | | | | |
Net Asset Value, Beginning of Period | | $ | 12.00 | | | $ | 11.36 | |
| | | | | | | | |
Income from Investment Operations: | | | | | | | | |
Net investment loss | | | (0.02 | )(b) | | | (0.04 | )(b) |
Net realized and unrealized gain on investments | | | 0.86 | | | | 0.68 | |
| | | | | | | | |
Total from investment operations | | | 0.84 | | | | 0.64 | |
| | | | | | | | |
Less Distributions: | | | | | | | | |
Distributions from net realized gain on investments | | | (0.99 | ) | | | — | |
| | | | | | | | |
Total Distributions | | | (0.99 | ) | | | — | |
| | | | | | | | |
Net increase (decrease) in net asset value | | | (0.15 | ) | | | 0.64 | |
| | | | | | | | |
Net Asset Value, End of Period | | $ | 11.85 | | | $ | 12.00 | |
| | | | | | | | |
Total Return (c) | | | 7.25 | %(d) | | | 5.63 | %(d) |
| | |
Ratios/Supplemental Data: | | | | | | | | |
Net Assets, End of Period (in 000’s) | | $ | 5,250 | | | $ | 3,867 | |
Ratios of expenses to average net assets: | | | | | | | | |
Before expense reimbursement and/or fee waiver by Adviser | | | 1.86 | %(e) | | | 2.27 | %(e) |
After expense reimbursement and/or fee waiver by Adviser | | | 1.00 | %(e) | | | 1.00 | %(e) |
Ratios of net investment loss to average net assets: | | | | | | | | |
Before expense reimbursement and/or fee waiver by Adviser | | | (1.14 | )%(e) | | | (1.95 | )%(e) |
After expense reimbursement and/or fee waiver by Adviser | | | (0.27 | )%(e) | | | (0.68 | )%(e) |
Portfolio Turnover | | | 29.24 | %(d) | | | 32.96 | % |
| | (a) | The inception date for Montag & Caldwell Mid Cap Growth Fund Class I shares is May 14, 2014. |
| | (b) | The selected per share data was calculated using the weighted average shares outstanding method for the period. |
| | (c) | The total return is calculated using the Net Asset Value used for trading at the close of business at period end. |
See accompanying Notes to Financial Statements.
| | |
| |
| ASTON/LMCG Small Cap Growth Fund – Class N | | April 30, 2015 |
| |
| Financial Highlights | | |
| | | | | | | | | | | | | | | | | | | | |
| | | Six Months
Ended
04/30/15
(unaudited) | | | Year
Ended
10/31/14 | | | Year
Ended
10/31/13 | | | Year
Ended
10/31/12 | | | Period
Ended
10/31/11(a) | |
| | | | | |
| | | | | |
| | | | | |
Net Asset Value, Beginning of Period | | $ | 14.76 | | | $ | 14.71 | | | $ | 11.42 | | | $ | 9.95 | | | $ | 10.00 | |
| | | | | | | | | | | | | | | | | | | | |
Income from Investment Operations: | | | | | | | | | | | | | | | | | | | | |
Net investment income (loss) | | | (0.08 | )(b) | | | (0.13 | )(b) | | | — | (b)(c) | | | (0.12 | )(b) | | | (0.04 | ) |
Net realized and unrealized gain (loss) on investments | | | 1.26 | | | | 2.21 | | | | 4.18 | | | | 1.59 | | | | (0.01 | ) |
| | | | | | | | | | | | | | | | | | | | |
Total from investment operations | | | 1.18 | | | | 2.08 | | | | 4.18 | | | | 1.47 | | | | (0.05 | ) |
| | | | | | | | | | | | | | | | | | | | |
Less Distributions: | | | | | | | | | | | | | | | | | | | | |
Distributions from net realized gains on investments | | | (0.54 | ) | | | (2.03 | ) | | | (0.89 | ) | | | — | | | | — | |
| | | | | | | | | | | | | | | | | | | | |
Total distributions | | | (0.54 | ) | | | (2.03 | ) | | | (0.89 | ) | | | — | | | | — | |
| | | | | | | | | | | | | | | | | | | | |
Net increase (decrease) in net asset value | | | 0.64 | | | | 0.05 | | | | 3.29 | | | | 1.47 | | | | (0.05 | ) |
| | | | | | | | | | | | | | | | | | | | |
Net Asset Value, End of Period | | $ | 15.40 | | | $ | 14.76 | | | $ | 14.71 | | | $ | 11.42 | | | $ | 9.95 | |
| | | | | | | | | | | | | | | | | | | | |
Total Return (d) | | | 8.18 | %(e) | | | 15.18 | % | | | 39.31 | % | | | 14.77 | % | | | (0.50 | )%(e) |
| | | | | |
Ratios/Supplemental Data: | | | | | | | | | | | | | | | | | | | | |
Net Assets, End of Period (in 000’s) | | $ | 75,529 | | | $ | 37,099 | | | $ | 32,045 | | | $ | 5,659 | | | $ | 5,411 | |
Ratios of expenses to average net assets: | | | | | | | | | | | | | | | | | | | | |
Before expense reimbursement and/or fee waiver by Adviser | | | 1.52 | %(f) | | | 1.67 | % | | | 2.03 | % | | | 2.86 | % | | | 8.27 | %(f) |
After expense reimbursement and/or fee waiver by Adviser | | | 1.35 | %(f) | | | 1.35 | % | | | 1.35 | % | | | 1.35 | % | | | 1.35 | %(f) |
Ratios of net investment income (loss) to average net assets: | | | | | | | | | | | | | | | | | | | | |
Before expense reimbursement and/or fee waiver by Adviser | | | (1.20 | )%(f) | | | (1.22 | )% | | | (0.66 | )% | | | (2.68 | )% | | | (8.14 | )%(f) |
After expense reimbursement and/or fee waiver by Adviser | | | (1.03 | )%(f) | | | (0.90 | )% | | | 0.02 | % | | | (1.17 | )% | | | (1.21 | )%(f) |
Portfolio Turnover | | | 38.83 | %(e) | | | 143.99 | % | | | 186.40 | %(g) | | | 168.05 | %(h) | | | 205.85 | %(e) |
| | (a) | The inception date for LMCG Small Cap Growth Fund Class N shares is November 3, 2010. |
| | (b) | The selected per share data was calculated using the weighted average shares outstanding method for the period. |
| | (c) | Represents less than $0.005 per share. |
| | (d) | The total return is calculated using the Net Asset Value used for trading at the close of business at period end. |
| | (g) | Portfolio turnover rate excludes securities received from the reorganization. |
| | (h) | Portfolio turnover rate excludes securities delivered from processing a redemption-in-kind. |
See accompanying Notes to Financial Statements.
| | |
| |
| ASTON/LMCG Small Cap Growth Fund – Class I | | April 30, 2015 |
| |
| Financial Highlights | | |
| | | | | | | | | | | | | | | | | | | | |
| | | Six Months
Ended
04/30/15
(unaudited) | | | Year
Ended
10/31/14 | | | Year
Ended
10/31/13 | | | Year
Ended
10/31/12 | | | Period
Ended
10/31/11(a) | |
| | | | | |
| | | | | |
| | | | | |
Net Asset Value, Beginning of Period | | $ | 14.89 | | | $ | 14.81 | | | $ | 11.46 | | | $ | 9.97 | | | $ | 12.40 | |
| | | | | | | | | | | | | | | | | | | | |
Income from Investment Operations: | | | | | | | | | | | | | | | | | | | | |
Net investment income (loss) | | | (0.06 | )(b) | | | (0.09 | )(b) | | | 0.04 | (b) | | | (0.10 | )(b) | | | (0.04 | ) |
Net realized and unrealized gain (loss) on investments | | | 1.26 | | | | 2.23 | | | | 4.20 | | | | 1.59 | | | | (2.39 | ) |
| | | | | | | | | | | | | | | | | | | | |
Total from investment operations | | | 1.20 | | | | 2.14 | | | | 4.24 | | | | 1.49 | | | | (2.43 | ) |
| | | | | | | | | | | | | | | | | | | | |
Less Distributions: | | | | | | | | | | | | | | | | | | | | |
Distributions from and in excess of net investment income | | | — | | | | (0.03 | ) | | | — | | | | — | | | | — | |
Distributions from net realized gains on investments | | | (0.54 | ) | | | (2.03 | ) | | | (0.89 | ) | | | — | | | | — | |
| | | | | | | | | | | | | | | | | | | | |
Total distributions | | | (0.54 | ) | | | (2.06 | ) | | | (0.89 | ) | | | — | | | | — | |
| | | | | | | | | | | | | | | | | | | | |
Net increase (decrease) in net asset value | | | 0.66 | | | | 0.08 | | | | 3.35 | | | | 1.49 | | | | (2.43 | ) |
| | | | | | | | | | | | | | | | | | | | |
Net Asset Value, End of Period | | $ | 15.55 | | | $ | 14.89 | | | $ | 14.81 | | | $ | 11.46 | | | $ | 9.97 | |
| | | | | | | | | | | | | | | | | | | | |
Total Return (c) | | | 8.25 | %(d) | | | 15.51 | % | | | 39.72 | % | | | 14.95 | % | | | (19.60 | )%(d) |
| | | | | |
Ratios/Supplemental Data: | | | | | | | | | | | | | | | | | | | | |
Net Assets, End of Period (in 000’s) | | $ | 41,150 | | | $ | 15,083 | | | $ | 8,496 | | | $ | 755 | | | $ | 2,551 | |
Ratios of expenses to average net assets: | | | | | | | | | | | | | | | | | | | | |
Before expense reimbursement and/or fee waiver by Adviser | | | 1.27 | %(e) | | | 1.42 | % | | | 1.78 | % | | | 2.61 | % | | | 6.25 | %(e) |
After expense reimbursement and/or fee waiver by Adviser | | | 1.10 | %(e) | | | 1.10 | % | | | 1.10 | % | | | 1.10 | % | | | 1.10 | %(e) |
Ratios of net investment income (loss) to average net assets: | | | | | | | | | | | | | | | | | | | | |
Before expense reimbursement and/or fee waiver by Adviser | | | (0.95 | )%(e) | | | (0.97 | )% | | | (0.41 | )% | | | (2.43 | )% | | | (6.11 | )%(e) |
After expense reimbursement and/or fee waiver by Adviser | | | (0.78 | )%(e) | | | (0.65 | )% | | | 0.27 | % | | | (0.92 | )% | | | (0.96 | )%(e) |
Portfolio Turnover | | | 38.83 | %(d) | | | 143.99 | % | | | 186.40 | %(f) | | | 168.05 | %(g) | | | 205.85 | %(d) |
| | (a) | The inception date for LMCG Small Cap Growth Fund Class I shares is June 1, 2011. |
| | (b) | The selected per share data was calculated using the weighted average shares outstanding method for the period. |
| | (c) | The total return is calculated using the Net Asset Value used for trading at the close of business at period end. |
| | (f) | Portfolio turnover rate excludes securities received from the reorganization. |
| | (g) | Portfolio turnover rate excludes securities delivered from processing a redemption-in-kind. |
See accompanying Notes to Financial Statements.
| | |
| |
| ASTON/River Road Independent Value Fund – Class N | | April 30, 2015 |
| |
| Financial Highlights | | |
| | | | | | | | | | | | | | | | | | | | |
| | | Six Months
Ended
04/30/15
(unaudited) | | | Year
Ended
10/31/14 | | | Year
Ended
10/31/13 | | | Year
Ended
10/31/12 | | | Period
Ended
10/31/11(a) | |
Net Asset Value, Beginning of Period | | $ | 10.89 | | | $ | 11.47 | | | $ | 11.42 | | | $ | 10.75 | | | $ | 10.00 | |
| | | | | | | | | | | | | | | | | | | | |
Income from Investment Operations: | | | | | | | | | | | | | | | | | | | | |
Net investment loss | | | (0.06 | )(b) | | | (0.12 | )(b) | | | (0.07 | ) | | | (0.09 | )(b) | | | (0.07 | )(b) |
Net realized and unrealized gain (loss) on investments | | | 0.13 | | | | (0.01 | ) | | | 0.75 | | | | 0.88 | | | | 0.82 | |
| | | | | | | | | | | | | | | | | | | | |
Total from investment operations | | | 0.07 | | | | (0.13 | ) | | | 0.68 | | | | 0.79 | | | | 0.75 | |
| | | | | | | | | | | | | | | | | | | | |
Less Distributions: | | | | | | | | | | | | | | | | | | | | |
Distributions from net realized gain on investments | | | (0.65 | ) | | | (0.45 | ) | | | (0.63 | ) | | | (0.12 | ) | | | — | |
| | | | | | | | | | | | | | | | | | | | |
Total distributions | | | (0.65 | ) | | | (0.45 | ) | | | (0.63 | ) | | | (0.12 | ) | | | — | |
| | | | | | | | | | | | | | | | | | | | |
Net increase (decrease) in net asset value | | | (0.58 | ) | | | (0.58 | ) | | | 0.05 | | | | 0.67 | | | | 0.75 | |
| | | | | | | | | | | | | | | | | | | | |
Net Asset Value, End of Period | | $ | 10.31 | | | $ | 10.89 | | | $ | 11.47 | | | $ | 11.42 | | | $ | 10.75 | |
| | | | | | | | | | | | | | | | | | | | |
Total Return (c) | | | 0.62 | %(d) | | | (1.24 | )% | | | 6.37 | % | | | 7.41 | % | | | 7.50 | %(d) |
| | | | | |
Ratios/Supplemental Data: | | | | | | | | | | | | | | | | | | | | |
Net Assets, End of Period (in 000’s) | | $ | 261,050 | | | $ | 285,949 | | | $ | 339,088 | | | $ | 362,416 | | | $ | 306,223 | |
Ratios of expenses to average net assets: | | | | | | | | | | | | | | | | | | | | |
Before earnings credit, expense reimbursement and/or fee waiver, by the Adviser | | | 1.43 | %(e) | | | 1.42 | %(f) | | | 1.43 | %(f) | | | 1.44 | %(f) | | | 1.59 | %(e) |
After earnings credit, expense reimbursement and/or fee waiver, by the Adviser | | | 1.42 | %(e) | | | 1.42 | %(f) | | | 1.41 | %(f) | | | 1.42 | %(f) | | | 1.42 | %(e) |
Ratios of net investment loss to average net assets: | | | | | | | | | | | | | | | | | | | | |
Before earnings credit, expense reimbursement and/or fee waiver, by the Adviser | | | (1.15 | )%(e) | | | (1.04 | )% | | | (0.61 | )% | | | (0.81 | )% | | | (0.98 | )%(e) |
After earnings credit, expense reimbursement and/or fee waiver, by the Adviser | | | (1.14 | )%(e) | | | (1.03 | )% | | | (0.59 | )% | | | (0.79 | )% | | | (0.80 | )%(e) |
Portfolio Turnover | | | 23.67 | %(d) | | | 91.10 | % | | | 82.24 | %(g) | | | 141.17 | % | | | 105.69 | %(d) |
| | (a) | The inception date for River Road Independent Value Fund Class N shares is December 31, 2010. |
| | (b) | The selected per share data was calculated using the weighted average shares outstanding method for the period. |
| | (c) | The total return is calculated using the Net Asset Value used for trading at the close of business at period end. |
| | (f) | Ratios of expenses to average net assets include Earnings Credits of 0.01% for the year ended October 31, 2013 and less than 0.005% for the years ended October 31, 2014 and 2012, which are not included in the contractual expense limitation. See Note I to the Financial Statements. |
| | (g) | Portfolio turnover rate excludes securities received from processing a subscription-in-kind. |
See accompanying Notes to Financial Statements.
| | |
| |
| ASTON/River Road Independent Value Fund – Class I | | April 30, 2015 |
| |
| Financial Highlights | | |
| | | | | | | | | | | | | | | | | | | | |
| | | Six Months
Ended
04/30/15
(unaudited) | | | Year
Ended
10/31/14 | | | Year
Ended
10/31/13 | | | Year
Ended
10/31/12 | | | Period
Ended
10/31/11(a) | |
Net Asset Value, Beginning of Period | | $ | 10.98 | | | $ | 11.54 | | | $ | 11.46 | | | $ | 10.75 | | | $ | 10.92 | |
| | | | | | | | | | | | | | | | | | | | |
Income from Investment Operations: | | | | | | | | | | | | | | | | | | | | |
Net investment loss | | | (0.05 | )(b) | | | (0.09 | )(b) | | | (0.04 | ) | | | (0.06 | )(b) | | | (0.02 | )(b) |
Net realized and unrealized gain (loss) on investments | | | 0.14 | | | | (0.02 | ) | | | 0.75 | | | | 0.89 | | | | (0.15 | ) |
| | | | | | | | | | | | | | | | | | | | |
Total from investment operations | | | 0.09 | | | | (0.11 | ) | | | 0.71 | | | | 0.83 | | | | (0.17 | ) |
| | | | | | | | | | | | | | | | | | | | |
Less Distributions: | | | | | | | | | | | | | | | | | | | | |
Distributions from net realized gain on investments | | | (0.65 | ) | | | (0.45 | ) | | | (0.63 | ) | | | (0.12 | ) | | | — | |
| | | | | | | | | | | | | | | | | | | | |
Total distributions | | | (0.65 | ) | | | (0.45 | ) | | | (0.63 | ) | | | (0.12 | ) | | | — | |
| | | | | | | | | | | | | | | | | | | | |
Net increase (decrease) in net asset value | | | (0.56 | ) | | | (0.56 | ) | | | 0.08 | | | | 0.71 | | | | (0.17 | ) |
| | | | | | | | | | | | | | | | | | | | |
Net Asset Value, End of Period | | $ | 10.42 | | | $ | 10.98 | | | $ | 11.54 | | | $ | 11.46 | | | $ | 10.75 | |
| | | | | | | | | | | | | | | | | | | | |
Total Return (c) | | | 0.80 | %(d) | | | (1.05 | )% | | | 6.62 | % | | | 7.68 | % | | | (1.47 | )%(d) |
| | | | | |
Ratios/Supplemental Data: | | | | | | | | | | | | | | | | | | | | |
Net Assets, End of Period (in 000’s) | | $ | 193,638 | | | $ | 381,289 | | | $ | 386,268 | | | $ | 338,234 | | | $ | 85,478 | |
Ratios of expenses to average net assets: | | | | | | | | | | | | | | | | | | | | |
Before earnings credit, expense reimbursement and/or fee waiver, by the Adviser | | | 1.18 | %(e) | | | 1.17 | %(f) | | | 1.18 | %(f) | | | 1.19 | %(f) | | | 1.34 | %(e) |
After earnings credit, expense reimbursement and/or fee waiver, by the Adviser | | | 1.17 | %(e) | | | 1.17 | %(f) | | | 1.16 | %(f) | | | 1.17 | %(f) | | | 1.17 | %(e) |
Ratios of net investment loss to average net assets: | | | | | | | | | | | | | | | | | | | | |
Before earnings credit, expense reimbursement and/or fee waiver, by the Adviser | | | (0.90 | )%(e) | | | (0.79 | )% | | | (0.36 | )% | | | (0.56 | )% | | | (0.73 | )%(e) |
After earnings credit, expense reimbursement and/or fee waiver, by the Adviser | | | (0.89 | )%(e) | | | (0.78 | )% | | | (0.34 | )% | | | (0.54 | )% | | | (0.55 | )%(e) |
Portfolio Turnover | | | 23.67 | %(d) | | | 91.10 | % | | | 82.24 | %(g) | | | 141.17 | % | | | 105.69 | %(d) |
| | (a) | The inception date for River Road Independent Value Fund Class I shares is June 1, 2011. |
| | (b) | The selected per share data was calculated using the weighted average shares outstanding method for the period. |
| | (c) | The total return is calculated using the Net Asset Value used for trading at the close of business at period end. |
| | (f) | Ratios of expenses to average net assets include Earnings Credits of 0.01% for the year ended October 31, 2013 and less than 0.005% for the years ended October 31, 2014 and 2012, which are not included in the contractual expense limitation. See Note I to the Financial Statements. |
| | (g) | Portfolio turnover rate excludes securities received from processing a subscription-in-kind. |
See accompanying Notes to Financial Statements.
| | |
| |
| ASTON/River Road Select Value Fund – Class N | | April 30, 2015 |
| |
| Financial Highlights | | |
| | | | | | | | | | | | | | | | | | | | | | | | |
| | | Six Months
Ended
04/30/15
(unaudited) | | | Year
Ended
10/31/14 | | | Year
Ended
10/31/13 | | | Year
Ended
10/31/12 | | | Year
Ended
10/31/11 | | | Year
Ended
10/31/10 | |
Net Asset Value, Beginning of Period | | $ | 8.77 | | | $ | 10.28 | | | $ | 8.50 | | | $ | 9.54 | | | $ | 9.01 | | | $ | 7.71 | |
| | | | | | | | | | | | | | | | | | | | | | | | |
Income from Investment Operations: | | | | | | | | | | | | | | | | | | | | | | | | |
Net investment income (loss) | | | (0.02 | ) | | | (0.03 | )(a) | | | 0.07 | (a) | | | 0.01 | (a) | | | (0.02 | )(a) | | | 0.02 | (a) |
Net realized and unrealized gain on investments | | | 0.47 | | | | 0.03 | | | | 2.34 | | | | 1.01 | | | | 0.66 | | | | 1.28 | |
| | | | | | | | | | | | | | | | | | | | | | | | |
Total from investment operations | | | 0.45 | | | | — | | | | 2.41 | | | | 1.02 | | | | 0.64 | | | | 1.30 | |
| | | | | | | | | | | | | | | | | | | | | | | | |
Less Distributions: | | | | | | | | | | | | | | | | | | | | | | | | |
Distributions from net investment income | | | — | | | | (0.02 | ) | | | (0.12 | ) | | | — | | | | (0.03 | ) | | | — | |
Distributions from net realized gains on investments | | | (1.43 | ) | | | (1.49 | ) | | | (0.51 | ) | | | (2.06 | ) | | | (0.08 | ) | | | — | |
| | | | | | | | | | | | | | | | | | | | | | | | |
Total distributions | | | (1.43 | ) | | | (1.51 | ) | | | (0.63 | ) | | | (2.06 | ) | | | (0.11 | ) | | | — | |
| | | | | | | | | | | | | | | | | | | | | | | | |
Net increase (decrease) in net asset value | | | (0.98 | ) | | | (1.51 | ) | | | 1.78 | | | | (1.04 | ) | | | 0.53 | | | | 1.30 | |
| | | | | | | | | | | | | | | | | | | | | | | | |
Net Asset Value, End of Period | | $ | 7.79 | | | $ | 8.77 | | | $ | 10.28 | | | $ | 8.50 | | | $ | 9.54 | | | $ | 9.01 | |
| | | | | | | | | | | | | | | | | | | | | | | | |
Total Return (b) | | | 5.42 | %(c) | | | (0.23 | )% | | | 30.44 | % | | | 12.87 | % | | | 7.12 | % | | | 16.86 | % |
| | | | | | |
Ratios/Supplemental Data: | | | | | | | | | | | | | | | | | | | | | | | | |
Net Assets, End of Period (in 000’s) | | $ | 7,004 | | | $ | 8,388 | | | $ | 19,099 | | | $ | 6,270 | | | $ | 13,160 | | | $ | 52,522 | |
Ratios of expenses to average net assets: | | | | | | | | | | | | | | | | | | | | | | | | |
Before expense reimbursement and/or fee waiver, or recoupment by Adviser | | | 1.48 | %(d) | | | 1.45 | % | | | 1.46 | % | | | 1.43 | %(e) | | | 1.42 | %(e) | | | 1.41 | %(e) |
After expense reimbursement and/or fee waiver, or recoupment by Adviser | | | 1.48 | %(d) | | | 1.45 | % | | | 1.46 | % | | | 1.43 | %(e) | | | 1.42 | %(e) | | | 1.43 | %(e) |
Ratios of net investment income (loss) to average net assets: | | | | | | | | | | | | | | | | | | | | | | | | |
Before expense reimbursement and/or fee waiver, or recoupment by Adviser | | | (0.50 | )%(d) | | | (0.36 | )% | | | 0.78 | % | | | 0.07 | % | | | (0.18 | )% | | | 0.31 | % |
After expense reimbursement and/or fee waiver, or recoupment by Adviser | | | (0.50 | )%(d) | | | (0.36 | )% | | | 0.78 | % | | | 0.07 | % | | | (0.18 | )% | | | 0.29 | % |
Portfolio Turnover | | | 26.64 | %(c) | | | 64.44 | % | | | 71.01 | % | | | 38.84 | % | | | 48.22 | % | | | 53.73 | % |
| | (a) | The selected per share data was calculated using the weighted average shares outstanding method for the period. |
| | (b) | The total return is calculated using the Net Asset Value used for trading at the close of business at period end. |
| | (e) | Ratios of expenses to average net assets include interest expense of less than 0.005% for each of the years ended October 31, 2012, October 31, 2011 and October 31, 2010, which are not included in the contractual expense limitation. The interest expense is from utilizing the line of credit, as discussed in Note H to the Financial Statements. |
See accompanying Notes to Financial Statements.
| | |
| |
| ASTON/River Road Select Value Fund – Class I | | April 30, 2015 |
| |
| Financial Highlights | | |
| | | | | | | | | | | | | | | | | | | | | | | | |
| | | Six Months
Ended
04/30/15
(unaudited) | | | Year
Ended
10/31/14 | | | Year
Ended
10/31/13 | | | Year
Ended
10/31/12 | | | Year
Ended
10/31/11 | | | Year
Ended
10/31/10 | |
Net Asset Value, Beginning of Period | | $ | 8.88 | | | $ | 10.38 | | | $ | 8.58 | | | $ | 9.59 | | | $ | 9.04 | | | $ | 7.73 | |
| | | | | | | | | | | | | | | | | | | | | | | | |
Income from Investment Operations: | | | | | | | | | | | | | | | | | | | | | | | | |
Net investment income (loss) | | | (0.01 | ) | | | (0.01 | )(a) | | | 0.10 | (a) | | | 0.03 | (a) | | | 0.01 | (a) | | | 0.05 | (a) |
Net realized and unrealized gain on investments | | | 0.47 | | | | 0.04 | | | | 2.36 | | | | 1.02 | | | | 0.67 | | | | 1.28 | |
| | | | | | | | | | | | | | | | | | | | | | | | |
Total from investment operations | | | 0.46 | | | | 0.03 | | | | 2.46 | | | | 1.05 | | | | 0.68 | | | | 1.33 | |
| | | | | | | | | | | | | | | | | | | | | | | | |
Less Distributions: | | | | | | | | | | | | | | | | | | | | | | | | |
Distributions from net investment income | | | — | | | | (0.04 | ) | | | (0.15 | ) | | | — | | | | (0.05 | ) | | | (0.02 | ) |
Distributions from net realized gains on investments | | | (1.43 | ) | | | (1.49 | ) | | | (0.51 | ) | | | (2.06 | ) | | | (0.08 | ) | | | — | |
| | | | | | | | | | | | | | | | | | | | | | | | |
Total distributions | | | (1.43 | ) | | | (1.53 | ) | | | (0.66 | ) | | | (2.06 | ) | | | (0.13 | ) | | | (0.02 | ) |
| | | | | | | | | | | | | | | | | | | | | | | | |
Net increase (decrease) in net asset value | | | (0.97 | ) | | | (1.50 | ) | | | 1.80 | | | | (1.01 | ) | | | 0.55 | | | | 1.31 | |
| | | | | | | | | | | | | | | | | | | | | | | | |
Net Asset Value, End of Period | | $ | 7.91 | | | $ | 8.88 | | | $ | 10.38 | | | $ | 8.58 | | | $ | 9.59 | | | $ | 9.04 | |
| | | | | | | | | | | | | | | | | | | | | | | | |
Total Return (b) | | | 5.60 | %(c) | | | 0.00 | % | | | 30.74 | % | | | 13.18 | % | | | 7.56 | % | | | 17.19 | % |
| | | | | | |
Ratios/Supplemental Data: | | | | | | | | | | | | | | | | | | | | | | | | |
Net Assets, End of Period (in 000’s) | | $ | 125,153 | | | $ | 176,166 | | | $ | 198,220 | | | $ | 156,510 | | | $ | 130,527 | | | $ | 163,232 | |
Ratios of expenses to average net assets: | | | | | | | | | | | | | | | | | | | | | | | | |
Before expense reimbursement and/or fee waiver, or recoupment by Adviser | | | 1.23 | %(d) | | | 1.20 | % | | | 1.21 | % | | | 1.18 | %(e) | | | 1.17 | %(e) | | | 1.16 | %(e) |
After expense reimbursement and/or fee waiver, or recoupment by Adviser | | | 1.23 | %(d) | | | 1.20 | % | | | 1.21 | % | | | 1.18 | %(e) | | | 1.17 | %(e) | | | 1.18 | %(e) |
Ratios of net investment income (loss) to average net assets: | | | | | | | | | | | | | | | | | | | | | | | | |
Before expense reimbursement and/or fee waiver, or recoupment by Adviser | | | (0.25 | )%(d) | | | (0.11 | )% | | | 1.03 | % | | | 0.32 | % | | | 0.07 | % | | | 0.56 | % |
After expense reimbursement and/or fee waiver, or recoupment by Adviser | | | (0.25 | )%(d) | | | (0.11 | )% | | | 1.03 | % | | | 0.32 | % | | | 0.07 | % | | | 0.54 | % |
Portfolio Turnover | | | 26.64 | %(c) | | | 64.44 | % | | | 71.01 | % | | | 38.84 | % | | | 48.22 | % | | | 53.73 | % |
| | (a) | The selected per share data was calculated using the weighted average shares outstanding method for the period. |
| | (b) | The total return is calculated using the Net Asset Value used for trading at the close of business at period end. |
| | (e) | Ratios of expenses to average net assets include interest expense of less than 0.005% for each of the years ended October 31, 2012, October 31, 2011 and October 31, 2010, which are not included in the contractual expense limitation. The interest expense is from utilizing the line of credit, as discussed in Note H to the Financial Statements. |
See accompanying Notes to Financial Statements.
| | |
| |
| ASTON/River Road Small Cap Value Fund – Class N | | April 30, 2015 |
| |
| Financial Highlights | | |
| | | | | | | | | | | | | | | | | | | | | | | | |
| | | Six Months
Ended
04/30/15
(unaudited) | | | Year
Ended
10/31/14 | | | Year
Ended
10/31/13 | | | Year
Ended
10/31/12 | | | Year
Ended
10/31/11 | | | Year
Ended
10/31/10 | |
| | | | | | | | | | | | | | | | | | | | | | | | |
Net Asset Value, Beginning of Period | | $ | 13.53 | | | $ | 17.05 | | | $ | 13.56 | | | $ | 12.20 | | | $ | 11.60 | | | $ | 10.22 | |
| | | | | | | | | | | | | | | | | | | | | | | | |
Income from Investment Operations: | | | | | | | | | | | | | | | | | | | | | | | | |
Net investment income (loss) | | | (0.03 | )(a) | | | (0.04 | )(a) | | | 0.16 | | | | 0.03 | (a) | | | (0.03 | ) | | | 0.03 | |
Net realized and unrealized gain on investments | | | 0.70 | | | | 0.14 | | | | 3.98 | | | | 1.33 | | | | 0.67 | | | | 1.36 | |
| | | | | | | | | | | | | | | | | | | | | | | | |
Total from investment operations | | | 0.67 | | | | 0.10 | | | | 4.14 | | | | 1.36 | | | | 0.64 | | | | 1.39 | |
| | | | | | | | | | | | | | | | | | | | | | | | |
Less Distributions: | | | | | | | | | | | | | | | | | | | | | | | | |
Distributions from and in excess of net investment income | | | — | | | | (0.04 | ) | | | (0.22 | ) | | | — | | | | (0.04 | ) | | | (0.01 | ) |
Distributions from net realized gain on investments | | | (1.99 | ) | | | (3.58 | ) | | | (0.43 | ) | | | — | | | | — | | | | — | |
| | | | | | | | | | | | | | | | | | | | | | | | |
Total distributions | | | (1.99 | ) | | | (3.62 | ) | | | (0.65 | ) | | | — | | | | (0.04 | ) | | | (0.01 | ) |
| | | | | | | | | | | | | | | | | | | | | | | | |
Net increase (decrease) in net asset value | | | (1.32 | ) | | | (3.52 | ) | | | 3.49 | | | | 1.36 | | | | 0.60 | | | | 1.38 | |
| | | | | | | | | | | | | | | | | | | | | | | | |
Net Asset Value, End of Period | | $ | 12.21 | | | $ | 13.53 | | | $ | 17.05 | | | $ | 13.56 | | | $ | 12.20 | | | $ | 11.60 | |
| | | | | | | | | | | | | | | | | | | | | | | | |
Total Return (b) | | | 5.23 | %(c) | | | (0.05 | )% | | | 31.98 | % | | | 11.15 | % | | | 5.46 | % | | | 13.60 | % |
| | | | | | |
Ratios/Supplemental Data: | | | | | | | | | | | | | | | | | | | | | | | | |
Net Assets, End of Period (in 000’s) | | $ | 26,001 | | | $ | 49,049 | | | $ | 56,793 | | | $ | 49,154 | | | $ | 91,347 | | | $ | 213,326 | |
Ratios of expenses to average net assets: | | | | | | | | | | | | | | | | | | | | | | | | |
Before expense reimbursement and/or fee waiver by Adviser | | | 1.33 | %(d) | | | 1.33 | % | | | 1.34 | % | | | 1.37 | % | | | 1.37 | %(e) | | | 1.39 | %(e) |
After expense reimbursement and/or fee waiver by Adviser | | | 1.33 | %(d) | | | 1.33 | % | | | 1.34 | % | | | 1.37 | % | | | 1.37 | %(e) | | | 1.39 | %(e) |
Ratios of net investment income (loss) to average net assets: | | | | | | | | | | | | | | | | | | | | | | | | |
Before expense reimbursement and/or fee waiver by Adviser | | | (0.48 | )%(d) | | | (0.26 | )% | | | 1.03 | % | | | 0.22 | % | | | (0.13 | )% | | | 0.27 | % |
After expense reimbursement and/or fee waiver by Adviser | | | (0.48 | )%(d) | | | (0.26 | )% | | | 1.03 | % | | | 0.22 | % | | | (0.13 | )% | | | 0.27 | % |
Portfolio Turnover | | | 27.25 | %(c) | | | 66.22 | % | | | 56.08 | % | | | 26.95 | % | | | 42.29 | % | | | 51.05 | % |
| | (a) | The selected per share data was calculated using the weighted average shares outstanding method for the period. |
| | (b) | The total return is calculated using the Net Asset Value used for trading at the close of business at period end. |
| | (e) | Ratios of expenses to average net assets include interest expense of less than 0.005% for each of the years ended October 31, 2011 and October 31, 2010, which are not included in the contractual expense limitation. The interest expense is from utilizing the line of credit, as discussed in Note H to the Financial Statements. |
See accompanying Notes to Financial Statements.
| | |
| |
| ASTON/River Road Small Cap Value Fund – Class I | | April 30, 2015 |
| |
| Financial Highlights | | |
| | | | | | | | | | | | | | | | | | | | | | | | |
| | | Six Months
Ended
04/30/15
(unaudited) | | | Year
Ended
10/31/14 | | | Year
Ended
10/31/13 | | | Year
Ended
10/31/12 | | | Year
Ended
10/31/11 | | | Year
Ended
10/31/10 | |
| | | | | | | | | | | | | | | | | | | | | | | | |
Net Asset Value, Beginning of Period | | $ | 13.60 | | | $ | 17.13 | | | $ | 13.62 | | | $ | 12.22 | | | $ | 11.62 | | | $ | 10.24 | |
| | | | | | | | | | | | | | | | | | | | | | | | |
Income from Investment Operations: | | | | | | | | | | | | | | | | | | | | | | | | |
Net investment income (loss) | | | (0.01 | )(a) | | | (— | )(a)(b) | | | 0.19 | | | | 0.06 | (a) | | | 0.01 | | | | 0.06 | |
Net realized and unrealized gain on investments | | | 0.70 | | | | 0.13 | | | | 4.01 | | | | 1.34 | | | | 0.65 | | | | 1.35 | |
| | | | | | | | | | | | | | | | | | | | | | | | |
Total from investment operations | | | 0.69 | | | | 0.13 | | | | 4.20 | | | | 1.40 | | | | 0.66 | | | | 1.41 | |
| | | | | | | | | | | | | | | | | | | | | | | | |
Less Distributions: | | | | | | | | | | | | | | | | | | | | | | | | |
Distributions from and in excess of net investment income | | | — | | | | (0.08 | ) | | | (0.26 | ) | | | — | | | | (0.06 | ) | | | (0.03 | ) |
Distributions from net realized gain on investments | | | (1.99 | ) | | | (3.58 | ) | | | (0.43 | ) | | | — | | | | — | | | | — | |
| | | | | | | | | | | | | | | | | | | | | | | | |
Total distributions | | | (1.99 | ) | | | (3.66 | ) | | | (0.69 | ) | | | — | | | | (0.06 | ) | | | (0.03 | ) |
| | | | | | | | | | | | | | | | | | | | | | | | |
Net increase (decrease) in net asset value | | | (1.30 | ) | | | (3.53 | ) | | | 3.51 | | | | 1.40 | | | | 0.60 | | | | 1.38 | |
| | | | | | | | | | | | | | | | | | | | | | | | |
Net Asset Value, End of Period | | $ | 12.30 | | | $ | 13.60 | | | $ | 17.13 | | | $ | 13.62 | | | $ | 12.22 | | | $ | 11.62 | |
| | | | | | | | | | | | | | | | | | | | | | | | |
Total Return (c) | | | 5.36 | %(d) | | | 0.16 | % | | | 32.36 | % | | | 11.46 | % | | | 5.70 | % | | | 13.80 | % |
| | | | | | |
Ratios/Supplemental Data: | | | | | | | | | | | | | | | | | | | | | | | | |
Net Assets, End of Period (in 000’s) | | $ | 248,895 | | | $ | 250,173 | | | $ | 252,804 | | | $ | 240,075 | | | $ | 246,141 | | | $ | 255,344 | |
Ratios of expenses to average net assets: | | | | | | | | | | | | | | | | | | | | | | | | |
Before expense reimbursement and/or fee waiver by Adviser | | | 1.08 | %(e) | | | 1.08 | % | | | 1.09 | % | | | 1.12 | % | | | 1.12 | %(f) | | | 1.14 | %(f) |
After expense reimbursement and/or fee waiver by Adviser | | | 1.08 | %(e) | | | 1.08 | % | | | 1.09 | % | | | 1.12 | % | | | 1.12 | %(f) | | | 1.14 | %(f) |
Ratios of net investment income (loss) to average net assets: | | | | | | | | | | | | | | | | | | | | | | | | |
Before expense reimbursement and/or fee waiver by Adviser | | | (0.23 | )%(e) | | | (0.01 | )% | | | 1.28 | % | | | 0.47 | % | | | 0.12 | % | | | 0.52 | % |
After expense reimbursement and/or fee waiver by Adviser | | | (0.23 | )%(e) | | | (0.01 | )% | | | 1.28 | % | | | 0.47 | % | | | 0.12 | % | | | 0.52 | % |
Portfolio Turnover | | | 27.25 | %(d) | | | 66.22 | % | | | 56.08 | % | | | 26.95 | % | | | 42.29 | % | | | 51.05 | % |
| | (a) | The selected per share data was calculated using the weighted average shares outstanding method for the period. |
| | (b) | Represents less than $(0.005) per share. |
| | (c) | The total return is calculated using the Net Asset Value used for trading at the close of business at period end. |
| | (f) | Ratios of expenses to average net assets include interest expense of less than 0.005% for each of the years ended October 31, 2011 and October 31, 2010, which are not included in the contractual expense limitation. The interest expense is from utilizing the line of credit, as discussed in Note H to the Financial Statements. |
See accompanying Notes to Financial Statements.
| | |
| |
| ASTON/Silvercrest Small Cap Fund – Class N | | April 30, 2015 |
| |
| Financial Highlights | | |
| | | | | | | | | | | | | | | | |
| | | Six Months
Ended
04/30/15
(unaudited) | | | Year
Ended
10/31/14 | | | Year
Ended
10/31/13 | | | Period
Ended
10/31/12(a) | |
| | | | |
| | | | |
| | | | |
Net Asset Value, Beginning of Period | | $ | 15.20 | | | $ | 14.54 | | | $ | 10.90 | | | $ | 10.00 | |
| | | | | | | | | | | | | | | | |
Income from Investment Operations: | | | | | | | | | | | | | | | | |
Net investment income | | | 0.01 | (b) | | | 0.01 | | | | 0.01 | (b) | | | 0.01 | |
Net realized and unrealized gain on investments | | | 0.30 | | | | 1.16 | | | | 3.77 | | | | 0.89 | |
| | | | | | | | | | | | | | | | |
Total from investment operations | | | 0.31 | | | | 1.17 | | | | 3.78 | | | | 0.90 | |
| | | | | | | | | | | | | | | | |
Less Distributions: | | | | | | | | | | | | | | | | |
Distributions from and in excess of net investment income | | | (0.02 | ) | | | — | (c) | | | (0.11 | ) | | | — | |
Distributions from net realized gains on investments | | | (0.30 | ) | | | (0.51 | ) | | | (0.03 | ) | | | — | |
| | | | | | | | | | | | | | | | |
Total distributions | | | (0.32 | ) | | | (0.51 | ) | | | (0.14 | ) | | | — | |
| | | | | | | | | | | | | | | | |
Net increase (decrease) in net asset value | | | (0.01 | ) | | | 0.66 | | | | 3.64 | | | | 0.90 | |
| | | | | | | | | | | | | | | | |
Net Asset Value, End of Period | | $ | 15.19 | | | $ | 15.20 | | | $ | 14.54 | | | $ | 10.90 | |
| | | | | | | | | | | | | | | | |
Total Return (d) | | | 2.07 | %(e) | | | 8.18 | % | | | 35.09 | % | | | 9.00 | %(e) |
| | | | |
Ratios/Supplemental Data: | | | | | | | | | | | | | | | | |
Net Assets, End of Period (in 000’s) | | $ | 5,288 | | | $ | 6,673 | | | $ | 4,049 | | | $ | 750 | |
Ratios of expenses to average net assets: | | | | | | | | | | | | | | | | |
Before expense reimbursement and/or fee waiver by Adviser | | | 1.50 | %(f) | | | 1.61 | % | | | 2.05 | % | | | 5.10 | %(f) |
After expense reimbursement and/or fee waiver by Adviser | | | 1.40 | %(f) | | | 1.40 | % | | | 1.40 | % | | | 1.40 | %(f) |
Ratios of net investment income (loss) to average net assets: | | | | | | | | | | | | | | | | |
Before expense reimbursement and/or fee waiver by Adviser | | | 0.02 | %(f) | | | (0.17 | )% | | | (0.61 | )% | | | (3.51 | )%(f) |
After expense reimbursement and/or fee waiver by Adviser | | | 0.12 | %(f) | | | 0.04 | % | | | 0.04 | % | | | 0.19 | %(f) |
Portfolio Turnover | | | 26.39 | %(e) | | | 31.68 | % | | | 36.82 | % | | | 26.22 | %(e)(g) |
| | (a) | The inception date for Silvercrest Small Cap Fund Class N shares is December 27, 2011. |
| | (b) | The selected per share data was calculated using the weighted average shares outstanding method for the period. |
| | (c) | Represents less than $(0.005) per share. |
| | (d) | The total return is calculated using the Net Asset Value used for trading at the close of business at period end. |
| | (g) | Portfolio turnover rate excludes securities delivered from processing a redemption-in-kind. |
See accompanying Notes to Financial Statements.
| | |
| |
| ASTON/Silvercrest Small Cap Fund – Class I | | April 30, 2015 |
| |
| Financial Highlights | | |
| | | | | | | | | | | | | | | | |
| | | Six Months
Ended
04/30/15
(unaudited) | | | Year
Ended
10/31/14 | | | Year
Ended
10/31/13 | | | Period
Ended
10/31/12(a) | |
| | | | |
| | | | |
| | | | |
Net Asset Value, Beginning of Period | | $ | 15.27 | | | $ | 14.59 | | | $ | 10.93 | | | $ | 10.00 | |
| | | | | | | | | | | | | | | | |
Income from Investment Operations: | | | | | | | | | | | | | | | | |
Net investment income | | | 0.03 | (b) | | | 0.05 | | | | 0.04 | (b) | | | 0.03 | |
Net realized and unrealized gain on investments | | | 0.30 | | | | 1.17 | | | | 3.78 | | | | 0.90 | |
| | | | | | | | | | | | | | | | |
Total from investment operations | | | 0.33 | | | | 1.22 | | | | 3.82 | | | | 0.93 | |
| | | | | | | | | | | | | | | | |
Less Distributions: | | | | | | | | | | | | | | | | |
Distributions from and in excess of net investment income | | | (0.03 | ) | | | (0.03 | ) | | | (0.13 | ) | | | — | |
Distributions from net realized gains on investments | | | (0.30 | ) | | | (0.51 | ) | | | (0.03 | ) | | | — | |
| | | | | | | | | | | | | | | | |
Total distributions | | | (0.33 | ) | | | (0.54 | ) | | | (0.16 | ) | | | — | |
| | | | | | | | | | | | | | | | |
Net increase in net asset value | | | — | | | | 0.68 | | | | 3.66 | | | | 0.93 | |
| | | | | | | | | | | | | | | | |
Net Asset Value, End of Period | | $ | 15.27 | | | $ | 15.27 | | | $ | 14.59 | | | $ | 10.93 | |
| | | | | | | | | | | | | | | | |
Total Return (c) | | | 2.17 | %(d) | | | 8.47 | % | | | 35.39 | % | | | 9.30 | %(d) |
| | | | |
Ratios/Supplemental Data: | | | | | | | | | | | | | | | | |
Net Assets, End of Period (in 000’s) | | $ | 106,114 | | | $ | 62,215 | | | $ | 29,219 | | | $ | 4,962 | |
Ratios of expenses to average net assets: | | | | | | | | | | | | | | | | |
Before expense reimbursement and/or fee waiver by Adviser | | | 1.25 | %(e) | | | 1.36 | % | | | 1.80 | % | | | 4.85 | %(e) |
After expense reimbursement and/or fee waiver by Adviser | | | 1.15 | %(e) | | | 1.15 | % | | | 1.15 | % | | | 1.15 | %(e) |
Ratios of net investment income (loss) to average net assets: | | | | | | | | | | | | | | | | |
Before expense reimbursement and/or fee waiver by Adviser | | | 0.27 | %(e) | | | 0.08 | % | | | (0.36 | )% | | | (3.26 | )%(e) |
After expense reimbursement and/or fee waiver by Adviser | | | 0.37 | %(e) | | | 0.29 | % | | | 0.29 | % | | | 0.44 | %(e) |
Portfolio Turnover | | | 26.39 | %(d) | | | 31.68 | % | | | 36.82 | % | | | 26.22 | %(d)(f) |
| | (a) | The inception date for Silvercrest Small Cap Fund Class I shares is December 27, 2011. |
| | (b) | The selected per share data was calculated using the weighted average shares outstanding method for the period. |
| | (c) | The total return is calculated using the Net Asset Value used for trading at the close of business at period end. |
| | (f) | Portfolio turnover rate excludes securities delivered from processing a redemption-in-kind. |
See accompanying Notes to Financial Statements.
| | |
| |
| ASTON/TAMRO Small Cap Fund – Class N | | April 30, 2015 |
| |
| Financial Highlights | | |
| | | | | | | | | | | | | | | | | | | | | | | | |
| | | Six Months
Ended
04/30/15
(unaudited) | | | Year
Ended
10/31/14 | | | Year
Ended
10/31/13 | | | Year
Ended
10/31/12 | | | Year
Ended
10/31/11 | | | Year
Ended
10/31/10 | |
Net Asset Value, Beginning of Period | | $ | 22.07 | | | $ | 24.06 | | | $ | 20.52 | | | $ | 20.57 | | | $ | 19.42 | | | $ | 14.67 | |
| | | | | | | | | | | | | | | | | | | | | | | | |
Income from Investment Operations: | | | | | | | | | | | | | | | | | | | | | | | | |
Net investment loss | | | (0.05 | )(a) | | | (0.13 | )(a) | | | (0.03 | )(a) | | | (0.12 | )(a) | | | (0.15 | )(a) | | | (0.08 | )(a) |
Net realized and unrealized gain on investments | | | 0.47 | | | | 0.30 | | | | 5.55 | | | | 2.09 | | | | 1.75 | | | | 4.83 | |
| | | | | | | | | | | | | | | | | | | | | | | | |
Total from investment operations | | | 0.42 | | | | 0.17 | | | | 5.52 | | | | 1.97 | | | | 1.60 | | | | 4.75 | |
| | | | | | | | | | | | | | | | | | | | | | | | |
Less Distributions: | | | | | | | | | | | | | | | | | | | | | | | | |
Distributions from net realized gain on investments | | | (2.74 | ) | | | (2.16 | ) | | | (1.98 | ) | | | (2.02 | ) | | | (0.45 | ) | | | — | |
| | | | | | | | | | | | | | | | | | | | | | | | |
Total distributions | | | (2.74 | ) | | | (2.16 | ) | | | (1.98 | ) | | | (2.02 | ) | | | (0.45 | ) | | | — | |
| | | | | | | | | | | | | | | | | | | | | | | | |
Net increase (decrease) in net asset value | | | (2.32 | ) | | | (1.99 | ) | | | 3.54 | | | | (0.05 | ) | | | 1.15 | | | | 4.75 | |
| | | | | | | | | | | | | | | | | | | | | | | | |
Net Asset Value, End of Period | | $ | 19.75 | | | $ | 22.07 | | | $ | 24.06 | | | $ | 20.52 | | | $ | 20.57 | | | $ | 19.42 | |
| | | | | | | | | | | | | | | | | | | | | | | | |
Total Return (b) | | | 1.80 | %(c) | | | 0.57 | % | | | 29.52 | % | | | 10.70 | % | | | 8.16 | % | | | 32.29 | % |
| | | | | | |
Ratios/Supplemental Data: | | | | | | | | | | | | | | | | | | | | | | | | |
Net Assets, End of Period (in 000’s) | | $ | 279,247 | | | $ | 336,350 | | | $ | 533,627 | | | $ | 389,125 | | | $ | 375,969 | | | $ | 335,809 | |
Ratios of expenses to average net assets: | | | | | | | | | | | | | | | | | | | | | | | | |
Before expense reimbursement and/or fee waiver by Adviser | | | 1.32 | %(d) | | | 1.31 | % | | | 1.31 | % | | | 1.28 | %(e) | | | 1.29 | % | | | 1.34 | % |
After expense reimbursement and/or fee waiver by Adviser | | | 1.32 | %(d) | | | 1.31 | % | | | 1.31 | % | | | 1.28 | %(e) | | | 1.29 | % | | | 1.34 | % |
Ratios of net investment loss to average net assets: | | | | | | | | | | | | | | | | | | | | | | | | |
Before expense reimbursement and/or fee waiver by Adviser | | | (0.52 | )(d) | | | (0.57 | )% | | | (0.16 | )% | | | (0.59 | )% | | | (0.69 | )% | | | (0.49 | )% |
After expense reimbursement and/or fee waiver by Adviser | | | (0.52 | )(d) | | | (0.57 | )% | | | (0.16 | )% | | | (0.59 | )% | | | (0.69 | )% | | | (0.49 | )% |
Portfolio Turnover | | | 32.00 | %(c) | | | 69.72 | % | | | 71.28 | %(f)(g) | | | 48.22 | %(f) | | | 47.25 | % | | | 62.13 | % |
| | (a) | The selected per share data was calculated using the weighted average shares outstanding method for the period. |
| | (b) | The total return is calculated using the Net Asset Value used for trading at the close of business at period end. |
| | (e) | Ratios of expenses to average net assets include interest expense of less than 0.005% for the year ended October 31, 2012, which is not included in the contractual expense limitation. The interest expense is from utilizing the line of credit, as discussed in Note H to the Financial Statements. |
| | (f) | Portfolio turnover rate excludes securities delivered from processing redemptions-in-kind. |
| | (g) | Portfolio turnover rate excludes securities received from processing a subscription-in-kind. |
See accompanying Notes to Financial Statements.
| | |
| |
| ASTON/TAMRO Small Cap Fund – Class I | | April 30, 2015 |
| |
| Financial Highlights | | |
| | | | | | | | | | | | | | | | | | | | | | | | |
| | | Six Months
Ended
04/30/15
(unaudited) | | | Year
Ended
10/31/14 | | | Year
Ended
10/31/13 | | | Year
Ended
10/31/12 | | | Year
Ended
10/31/11 | | | Year
Ended
10/31/10 | |
| | | | | | | | | | | | | | | | | | | | | | | | |
Net Asset Value, Beginning of Period | | $ | 22.76 | | | $ | 24.69 | | | $ | 20.96 | | | $ | 20.91 | | | $ | 19.69 | | | $ | 14.87 | |
| | | | | | | | | | | | | | | | | | | | | | | | |
Income from Investment Operations: | | | | | | | | | | | | | | | | | | | | | | | | |
Net investment income (loss) | | | (0.03 | )(a) | | | (0.07 | )(a) | | | 0.02 | (a) | | | (0.07 | )(a) | | | (0.09 | )(a) | | | (0.04 | )(a) |
Net realized and unrealized gain on investments | | | 0.48 | | | | 0.30 | | | | 5.69 | | | | 2.14 | | | | 1.76 | | | | 4.87 | |
| | | | | | | | | | | | | | | | | | | | | | | | |
Total from investment operations | | | 0.45 | | | | 0.23 | | | | 5.71 | | | | 2.07 | | | | 1.67 | | | | 4.83 | |
| | | | | | | | | | | | | | | | | | | | | | | | |
Less Distributions: | | | | | | | | | | | | | | | | | | | | | | | | |
Distributions from and in excess of net investment income | | | — | | | | — | | | | — | | | | — | | | | — | | | | (0.01 | ) |
Distributions from net realized gain on investments | | | (2.74 | ) | | | (2.16 | ) | | | (1.98 | ) | | | (2.02 | ) | | | (0.45 | ) | | | — | |
| | | | | | | | | | | | | | | | | | | | | | | | |
Total distributions | | | (2.74 | ) | | | (2.16 | ) | | | (1.98 | ) | | | (2.02 | ) | | | (0.45 | ) | | | (0.01 | ) |
| | | | | | | | | | | | | | | | | | | | | | | | |
Net increase (decrease) in net asset value | | | (2.29 | ) | | | (1.93 | ) | | | 3.73 | | | | 0.05 | | | | 1.22 | | | | 4.82 | |
| | | | | | | | | | | | | | | | | | | | | | | | |
Net Asset Value, End of Period | | $ | 20.47 | | | $ | 22.76 | | | $ | 24.69 | | | $ | 20.96 | | | $ | 20.91 | | | $ | 19.69 | |
| | | | | | | | | | | | | | | | | | | | | | | | |
Total Return (b) | | | 1.89 | %(c) | | | 0.86 | % | | | 29.84 | % | | | 10.98 | % | | | 8.40 | % | | | 32.62 | % |
| | | | | | |
Ratios/Supplemental Data: | | | | | | | | | | | | | | | | | | | | | | | | |
Net Assets, End of Period (in 000’s) | | $ | 418,709 | | | $ | 469,518 | | | $ | 792,172 | | | $ | 635,663 | | | $ | 625,315 | | | $ | 549,627 | |
Ratios of expenses to average net assets: | | | | | | | | | | | | | | | | | | | | | | | | |
Before expense reimbursement and/or fee waiver by Adviser | | | 1.07 | %(d) | | | 1.06 | % | | | 1.06 | % | | | 1.03 | %(e) | | | 1.04 | % | | | 1.09 | % |
After expense reimbursement and/or fee waiver by Adviser | | | 1.07 | %(d) | | | 1.06 | % | | | 1.06 | % | | | 1.03 | %(e) | | | 1.04 | % | | | 1.09 | % |
Ratios of net investment income (loss) to average net assets: | | | | | | | | | | | | | | | | | | | | | | | | |
Before expense reimbursement and/or fee waiver by Adviser | | | (0.27 | )%(d) | | | (0.32 | )% | | | 0.09 | % | | | (0.34 | )% | | | (0.44 | )% | | | (0.24 | )% |
After expense reimbursement and/or fee waiver by Adviser | | | (0.27 | )%(d) | | | (0.32 | )% | | | 0.09 | % | | | (0.34 | )% | | | (0.44 | )% | | | (0.24 | )% |
Portfolio Turnover | | | 32.00 | %(c) | | | 69.72 | % | | | 71.28 | %(f)(g) | | | 48.22 | %(f) | | | 47.25 | % | | | 62.13 | % |
| | (a) | The selected per share data was calculated using the weighted average shares outstanding method for the period. |
| | (b) | The total return is calculated using the Net Asset Value used for trading at the close of business at period end. |
| | (e) | Ratios of expenses to average net assets include interest expense of less than 0.005% for the year ended October 31, 2012, which is not included in the contractual expense limitation. The interest expense is from utilizing the line of credit, as discussed in Note H to the Financial Statements. |
| | (f) | Portfolio turnover rate excludes securities delivered from processing redemptions-in-kind. |
| | (g) | Portfolio turnover rate excludes securities received from processing a subscription-in-kind. |
See accompanying Notes to Financial Statements.
| | |
| |
| ASTON/DoubleLine Core Plus Fixed Income Fund – Class N | | April 30, 2015 |
| |
| Financial Highlights | | |
| | | | | | | | | | | | | | | | | | | | |
| | | Six Months
Ended
04/30/15
(unaudited) | | | Year
Ended
10/31/14 | | | Year
Ended
10/31/13 | | | Year
Ended
10/31/12 | | | Period
Ended
10/31/11(a) | |
Net Asset Value, Beginning of Period | | $ | 10.86 | | | $ | 10.65 | | | $ | 11.10 | | | $ | 10.44 | | | $ | 10.00 | |
| | | | | | | | | | | | | | | | | | | | |
Income from Investment Operations: | | | | | | | | | | | | | | | | | | | | |
Net investment income | | | 0.19 | | | | 0.40 | | | | 0.30 | | | | 0.33 | (b) | | | 0.12 | (b) |
Net realized and unrealized gain (loss) on investments | | | 0.02 | | | | 0.22 | | | | (0.33 | ) | | | 0.72 | | | | 0.41 | |
| | | | | | | | | | | | | | | | | | | | |
Total from investment operations | | | 0.21 | | | | 0.62 | | | | (0.03 | ) | | | 1.05 | | | | 0.53 | |
| | | | | | | | | | | | | | | | | | | | |
Less Distributions: | | | | | | | | | | | | | | | | | | | | |
Distributions from and in excess of net investment income | | | (0.19 | ) | | | (0.41 | ) | | | (0.36 | ) | | | (0.37 | ) | | | (0.09 | ) |
Distributions from net realized gain on investments | | | — | | | | — | | | | (0.06 | ) | | | (0.02 | ) | | | — | |
| | | | | | | | | | | | | | | | | | | | |
Total distributions | | | (0.19 | ) | | | (0.41 | ) | | | (0.42 | ) | | | (0.39 | ) | | | (0.09 | ) |
| | | | | | | | | | | | | | | | | | | | |
Net increase (decrease) in net asset value | | | 0.02 | | | | 0.21 | | | | (0.45 | ) | | | 0.66 | | | | 0.44 | |
| | | | | | | | | | | | | | | | | | | | |
Net Asset Value, End of Period | | $ | 10.88 | | | $ | 10.86 | | | $ | 10.65 | | | $ | 11.10 | | | $ | 10.44 | |
| | | | | | | | | | | | | | | | | | | | |
Total Return (c) | | | 1.92 | %(d) | | | 5.96 | % | | | (0.28 | )% | | | 10.25 | % | | | 5.33 | %(d) |
| | | | | |
Ratios/Supplemental Data: | | | | | | | | | | | | | | | | | | | | |
Net Assets, End of Period (in 000’s) | | $ | 116,756 | | | $ | 49,147 | | | $ | 66,368 | | | $ | 71,546 | | | $ | 22,657 | |
Ratios of expenses to average net assets: | | | | | | | | | | | | | | | | | | | | |
Before expense reimbursement and/or fee waiver by Adviser | | | 1.00 | %(e) | | | 1.08 | % | | | 1.04 | % | | | 1.35 | % | | | 3.16 | %(e) |
After expense reimbursement and/or fee waiver by Adviser | | | 0.94 | %(e) | | | 0.94 | % | | | 0.94 | % | | | 0.94 | % | | | 0.94 | %(e) |
Ratios of net investment income to average net assets: | | | | | | | | | | | | | | | | | | | | |
Before expense reimbursement and/or fee waiver by Adviser | | | 3.39 | %(e) | | | 3.58 | % | | | 2.66 | % | | | 2.59 | % | | | 1.63 | %(e) |
After expense reimbursement and/or fee waiver by Adviser | | | 3.45 | %(e) | | | 3.72 | % | | | 2.77 | % | | | 3.01 | % | | | 3.85 | %(e) |
Portfolio Turnover | | | 35.09 | %(d) | | | 117.18 | % | | | 125.07 | % | | | 118.67 | % | | | 38.49 | %(d) |
| | (a) | The inception date for DoubleLine Core Plus Fixed Income Fund Class N shares is July 18, 2011. |
| | (b) | The selected per share data was calculated using the weighted average shares outstanding method for the period. |
| | (c) | The total return is calculated using the Net Asset Value used for trading at the close of business at period end. |
See accompanying Notes to Financial Statements.
| | |
| |
| ASTON/DoubleLine Core Plus Fixed Income Fund – Class I | | April 30, 2015 |
| |
| Financial Highlights | | |
| | | | | | | | | | | | | | | | | | | | |
| | | Six Months
Ended
04/30/15
(unaudited) | | | Year
Ended
10/31/14 | | | Year
Ended
10/31/13 | | | Year
Ended
10/31/12 | | | Period
Ended
10/31/11(a) | |
Net Asset Value, Beginning of Period | | $ | 10.86 | | | $ | 10.65 | | | $ | 11.10 | | | $ | 10.44 | | | $ | 10.00 | |
| | | | | | | | | | | | | | | | | | | | |
Income from Investment Operations: | | | | | | | | | | | | | | | | | | | | |
Net investment income | | | 0.20 | | | | 0.44 | | | | 0.33 | | | | 0.35 | (b) | | | 0.13 | (b) |
Net realized and unrealized gain (loss) on investments | | | 0.02 | | | | 0.21 | | | | (0.33 | ) | | | 0.73 | | | | 0.41 | |
| | | | | | | | | | | | | | | | | | | | |
Total from investment operations | | | 0.22 | | | | 0.65 | | | | — | | | | 1.08 | | | | 0.54 | |
| | | | | | | | | | | | | | | | | | | | |
Less Distributions: | | | | | | | | | | | | | | | | | | | | |
Distributions from and in excess of net investment income | | | (0.20 | ) | | | (0.44 | ) | | | (0.39 | ) | | | (0.40 | ) | | | (0.10 | ) |
Distributions from net realized gain on investments | | | — | | | | — | | | | (0.06 | ) | | | (0.02 | ) | | | — | |
| | | | | | | | | | | | | | | | | | | | |
Total distributions | | | (0.20 | ) | | | (0.44 | ) | | | (0.45 | ) | | | (0.42 | ) | | | (0.10 | ) |
| | | | | | | | | | | | | | | | | | | | |
Net increase (decrease) in net asset value | | | 0.02 | | | | 0.21 | | | | (0.45 | ) | | | 0.66 | | | | 0.44 | |
| | | | | | | | | | | | | | | | | | | | |
Net Asset Value, End of Period | | $ | 10.88 | | | $ | 10.86 | | | $ | 10.65 | | | $ | 11.10 | | | $ | 10.44 | |
| | | | | | | | | | | | | | | | | | | | |
Total Return (c) | | | 2.03 | %(d) | | | 6.22 | % | | | (0.03 | )% | | | 10.52 | % | | | 5.38 | %(d) |
| | | | | |
Ratios/Supplemental Data: | | | | | | | | | | | | | | | | | | | | |
Net Assets, End of Period (in 000’s) | | $ | 248,323 | | | $ | 158,198 | | | $ | 110,018 | | | $ | 105,335 | | | $ | 4,486 | |
Ratios of expenses to average net assets: | | | | | | | | | | | | | | | | | | | | |
Before expense reimbursement and/or fee waiver by Adviser | | | 0.75 | %(e) | | | 0.83 | % | | | 0.79 | % | | | 1.10 | % | | | 2.91 | %(e) |
After expense reimbursement and/or fee waiver by Adviser | | | 0.69 | %(e) | | | 0.69 | % | | | 0.69 | % | | | 0.69 | % | | | 0.69 | %(e) |
Ratios of net investment income to average net assets: | | | | | | | | | | | | | | | | | | | | |
Before expense reimbursement and/or fee waiver by Adviser | | | 3.64 | %(e) | | | 3.83 | % | | | 2.91 | % | | | 2.84 | % | | | 1.88 | %(e) |
After expense reimbursement and/or fee waiver by Adviser | | | 3.70 | %(e) | | | 3.97 | % | | | 3.02 | % | | | 3.26 | % | | | 4.10 | %(e) |
Portfolio Turnover | | | 35.09 | %(d) | | | 117.18 | % | | | 125.07 | % | | | 118.67 | % | | | 38.49 | %(d) |
| | (a) | The inception date for DoubleLine Core Plus Fixed Income Fund Class I shares is July 18, 2011. |
| | (b) | The selected per share data was calculated using the weighted average shares outstanding method for the period. |
| | (c) | The total return is calculated using the Net Asset Value used for trading at the close of business at period end. |
See accompanying Notes to Financial Statements.
| | |
| |
| ASTON/TCH Fixed Income Fund – Class N | | April 30, 2015 |
| |
| Financial Highlights | | |
| | | | | | | | | | | | | | | | | | | | | | | | |
| | | Six Months
Ended
04/30/15
(unaudited) | | | Year
Ended
10/31/14 | | | Year
Ended
10/31/13 | | | Year
Ended
10/31/12 | | | Year
Ended
10/31/11 | | | Year
Ended
10/31/10 | |
Net Asset Value, Beginning of Period | | $ | 10.85 | | | $ | 10.67 | | | $ | 11.11 | | | $ | 10.59 | | | $ | 10.49 | | | $ | 10.02 | |
| | | | | | | | | | | | | | | | | | | | | | | | |
Income from Investment Operations: | | | | | | | | | | | | | | | | | | | | | | | | |
Net investment income | | | 0.14 | (a) | | | 0.35 | (a) | | | 0.40 | (a) | | | 0.45 | (a) | | | 0.47 | (a) | | | 0.50 | (a) |
Net realized and unrealized gain (loss) on investments | | | 0.01 | | | | 0.23 | | | | (0.39 | ) | | | 0.56 | | | | 0.10 | | | | 0.47 | |
| | | | | | | | | | | | | | | | | | | | | | | | |
Total from investment operations | | | 0.15 | | | | 0.58 | | | | 0.01 | | | | 1.01 | | | | 0.57 | | | | 0.97 | |
| | | | | | | | | | | | | | | | | | | | | | | | |
Less Distributions: | | | | | | | | | | | | | | | | | | | | | | | | |
Distributions from and in excess of net investment income | | | (0.16 | ) | | | (0.40 | ) | | | (0.45 | ) | | | (0.49 | ) | | | (0.47 | ) | | | (0.50 | ) |
| | | | | | | | | | | | | | | | | | | | | | | | |
Total distributions | | | (0.16 | ) | | | (0.40 | ) | | | (0.45 | ) | | | (0.49 | ) | | | (0.47 | ) | | | (0.50 | ) |
| | | | | | | | | | | | | | | | | | | | | | | | |
Net increase (decrease) in net asset value | | | (0.01 | ) | | | 0.18 | | | | (0.44 | ) | | | 0.52 | | | | 0.10 | | | | 0.47 | |
| | | | | | | | | | | | | | | | | | | | | | | | |
Net Asset Value, End of Period | | $ | 10.84 | | | $ | 10.85 | | | $ | 10.67 | | | $ | 11.11 | | | $ | 10.59 | | | $ | 10.49 | |
| | | | | | | | | | | | | | | | | | | | | | | | |
Total Return (b) | | | 1.40 | %(c) | | | 5.48 | % | | | 0.13 | % | | | 9.74 | % | | | 5.62 | % | | | 9.98 | % |
| | | | | | |
Ratios/Supplemental Data: | | | | | | | | | | | | | | | | | | | | | | | | |
Net Assets, End of Period (in 000’s) | | $ | 38,048 | | | $ | 36,950 | | | $ | 45,771 | | | $ | 59,772 | | | $ | 62,346 | | | $ | 46,274 | |
Ratios of expenses to average net assets: | | | | | | | | | | | | | | | | | | | | | | | | |
Before expense reimbursement and/or fee waiver by Adviser | | | 1.16 | %(d) | | | 1.17 | % | | | 1.02 | % | | | 1.02 | % | | | 1.14 | % | | | 0.98 | % |
After expense reimbursement and/or fee waiver by Adviser | | | 0.94 | %(d) | | | 0.94 | % | | | 0.84 | % | | | 0.86 | % | | | 0.88 | %(e) | | | 0.62 | % |
Ratios of net investment income to average net assets: | | | | | | | | | | | | | | | | | | | | | | | | |
Before expense reimbursement and/or fee waiver by Adviser | | | 2.40 | %(d) | | | 3.04 | % | | | 3.49 | % | | | 4.03 | % | | | 4.20 | % | | | 4.51 | % |
After expense reimbursement and/or fee waiver by Adviser | | | 2.62 | %(d) | | | 3.26 | % | | | 3.67 | % | | | 4.19 | % | | | 4.46 | % | | | 4.87 | % |
Portfolio Turnover | | | 11.41 | %(c) | | | 36.31 | % | | | 53.77 | % | | | 57.43 | % | | | 37.51 | % | | | 23.92 | % |
| | (a) | The selected per share data was calculated using the weighted average shares outstanding method for the period. |
| | (b) | The total return is calculated using the Net Asset Value used for trading at the close of business at period end. |
| | (e) | Effective March 1, 2011, the contractual expense limitation was increased from 0.74% to 0.94%, excluding interest, taxes, investment-related costs (such as brokerage commissions), extraordinary expenses and acquired fund fees and expenses. |
See accompanying Notes to Financial Statements.
| | |
| |
| ASTON/TCH Fixed Income Fund – Class I | | April 30, 2015 |
| |
| Financial Highlights | | |
| | | | | | | | | | | | | | | | | | | | | | | | |
| | | Six Months
Ended
04/30/15
(unaudited) | | | Year
Ended
10/31/14 | | | Year
Ended
10/31/13 | | | Year
Ended
10/31/12 | | | Year
Ended
10/31/11 | | | Year
Ended
10/31/10 | |
Net Asset Value, Beginning of Period | | $ | 10.85 | | | $ | 10.67 | | | $ | 11.11 | | | $ | 10.59 | | | $ | 10.49 | | | $ | 10.02 | |
| | | | | | | | | | | | | | | | | | | | | | | | |
Income from Investment Operations: | | | | | | | | | | | | | | | | | | | | | | | | |
Net investment income | | | 0.15 | (a) | | | 0.38 | (a) | | | 0.42 | (a) | | | 0.47 | (a) | | | 0.49 | (a) | | | 0.51 | (a) |
Net realized and unrealized gain (loss) on investments | | | 0.01 | | | | 0.22 | | | | (0.39 | ) | | | 0.55 | | | | 0.11 | | | | 0.48 | |
| | | | | | | | | | | | | | | | | | | | | | | | |
Total from investment operations | | | 0.16 | | | | 0.60 | | | | 0.03 | | | | 1.02 | | | | 0.60 | | | | 0.99 | |
| | | | | | | | | | | | | | | | | | | | | | | | |
Less Distributions: | | | | | | | | | | | | | | | | | | | | | | | | |
Distributions from and in excess of net investment income | | | (0.17 | ) | | | (0.42 | ) | | | (0.47 | ) | | | (0.50 | ) | | | (0.50 | ) | | | (0.52 | ) |
| | | | | | | | | | | | | | | | | | | | | | | | |
Total distributions | | | (0.17 | ) | | | (0.42 | ) | | | (0.47 | ) | | | (0.50 | ) | | | (0.50 | ) | | | (0.52 | ) |
| | | | | | | | | | | | | | | | | | | | | | | | |
Net increase (decrease) in net asset value . | | | (0.01 | ) | | | 0.18 | | | | (0.44 | ) | | | 0.52 | | | | 0.10 | | | | 0.47 | |
| | | | | | | | | | | | | | | | | | | | | | | | |
Net Asset Value, End of Period | | $ | 10.84 | | | $ | 10.85 | | | $ | 10.67 | | | $ | 11.11 | | | $ | 10.59 | | | $ | 10.49 | |
| | | | | | | | | | | | | | | | | | | | | | | | |
Total Return (b) | | | 1.52 | %(c) | | | 5.75 | % | | | 0.28 | % | | | 9.93 | % | | | 5.89 | % | | | 10.11 | % |
| | | | | | |
Ratios/Supplemental Data: | | | | | | | | | | | | | | | | | | | | | | | | |
Net Assets, End of Period (in 000’s) | | $ | 17,358 | | | $ | 15,199 | | | $ | 8,742 | | | $ | 10,396 | | | $ | 10,423 | | | $ | 14,881 | |
Ratios of expenses to average net assets: | | | | | | | | | | | | | | | | | | | | | | | | |
Before expense reimbursement and/or fee waiver by Adviser | | | 0.91 | %(d) | | | 0.92 | % | | | 0.87 | % | | | 0.85 | % | | | 0.89 | % | | | 0.85 | % |
After expense reimbursement and/or fee waiver by Adviser | | | 0.69 | %(d) | | | 0.69 | % | | | 0.69 | % | | | 0.69 | % | | | 0.63 | %(e) | | | 0.49 | % |
Ratios of net investment income to average net assets: | | | | | | | | | | | | | | | | | | | | | | | | |
Before expense reimbursement and/or fee waiver by Adviser | | | 2.65 | %(d) | | | 3.29 | % | | | 3.64 | % | | | 4.20 | % | | | 4.45 | % | | | 4.64 | % |
After expense reimbursement and/or fee waiver by Adviser | | | 2.87 | %(d) | | | 3.51 | % | | | 3.82 | % | | | 4.36 | % | | | 4.71 | % | | | 5.00 | % |
Portfolio Turnover | | | 11.41 | %(c) | | | 36.31 | % | | | 53.77 | % | | | 57.43 | % | | | 37.51 | % | | | 23.92 | % |
| | (a) | The selected per share data was calculated using the weighted average shares outstanding method for the period. |
| | (b) | The total return is calculated using the Net Asset Value used for trading at the close of business at period end. |
| | (e) | Effective March 1, 2011, the contractual expense limitation was increased from 0.49% to 0.69%, excluding interest, taxes, investment-related costs (such as brokerage commissions), extraordinary expenses and acquired fund fees and expenses. |
See accompanying Notes to Financial Statements.
| | |
| |
| ASTON/Anchor Capital Enhanced Equity Fund – Class N | | April 30, 2015 |
| |
| Financial Highlights | | |
| | | | | | | | | | | | | | | | | | | | | | | | |
| | | Six Months
Ended
04/30/15
(unaudited) | | | Year
Ended
10/31/14 | | | Year
Ended
10/31/13 | | | Year
Ended
10/31/12 | | | Year
Ended
10/31/11 | | | Year
Ended
10/31/10 | |
| | | | | | | | | | | | | | | | | | | | | | | | |
Net Asset Value, Beginning of Period | | $ | 9.49 | | | $ | 9.39 | | | $ | 8.68 | | | $ | 9.61 | | | $ | 9.41 | | | $ | 8.57 | |
| | | | | | | | | | | | | | | | | | | | | | | | |
Income from Investment Operations: | | | | | | | | | | | | | | | | | | | | | | | | |
Net investment income | | | 0.07 | | | | 0.17 | | | | 0.20 | | | | 0.16 | | | | 0.14 | | | | 0.10 | |
Net realized and unrealized gain on investments | | | 0.24 | | | | 0.09 | | | | 0.86 | | | | 0.11 | | | | 0.56 | | | | 0.84 | |
| | | | | | | | | | | | | | | | | | | | | | | | |
Total from investment operations | | | 0.31 | | | | 0.26 | | | | 1.06 | | | | 0.27 | | | | 0.70 | | | | 0.94 | |
| | | | | | | | | | | | | | | | | | | | | | | | |
Less Distributions: | | | | | | | | | | | | | | | | | | | | | | | | |
Distributions from and in excess of net investment income | | | (0.07 | ) | | | (0.16 | ) | | | (0.20 | ) | | | (0.16 | ) | | | (0.13 | ) | | | (0.10 | ) |
Distributions from net realized gain on investments | | | — | | | | — | | | | (0.15 | ) | | | (1.04 | ) | | | (0.37 | ) | | | — | |
| | | | | | | | | | | | | | | | | | | | | | | | |
Total distributions | | | (0.07 | ) | | | (0.16 | ) | | | (0.35 | ) | | | (1.20 | ) | | | (0.50 | ) | | | (0.10 | ) |
| | | | | | | | | | | | | | | | | | | | | | | | |
Net increase (decrease) in net asset value | | | 0.24 | | | | 0.10 | | | | 0.71 | | | | (0.93 | ) | | | 0.20 | | | | 0.84 | |
| | | | | | | | | | | | | | | | | | | | | | | | |
Net Asset Value, End of Period | | $ | 9.73 | | | $ | 9.49 | | | $ | 9.39 | | | $ | 8.68 | | | $ | 9.61 | | | $ | 9.41 | |
| | | | | | | | | | | | | | | | | | | | | | | | |
Total Return (a) | | | 3.43 | %(b) | | | 2.68 | % | | | 12.60 | % | | | 3.12 | % | | | 7.69 | % | | | 11.05 | % |
| | | | | | |
Ratios/Supplemental Data: | | | | | | | | | | | | | | | | | | | | | | | | |
Net Assets, End of Period (in 000’s) | | $ | 100,750 | | | $ | 101,980 | | | $ | 101,663 | | | $ | 106,191 | | | $ | 48,365 | | | $ | 46,423 | |
Ratios of expenses to average net assets: | | | | | | | | | | | | | | | | | | | | | | | | |
Before earnings credit, expense reimbursement and/or fee waiver, or recoupment by the Adviser | | | 1.17 | %(c) | | | 1.19 | % | | | 1.23 | %(d) | | | 1.22 | %(d)(e) | | | 1.24 | %(e) | | | 1.37 | % |
After earnings credit, expense reimbursement and/or fee waiver, or recoupment by the Adviser | | | 1.17 | %(c) | | | 1.19 | % | | | 1.23 | %(d) | | | 1.27 | %(d)(e) | | | 1.33 | %(e) | | | 1.40 | % |
Ratios of net investment income to average net assets: | | | | | | | | | | | | | | | | | | | | | | | | |
Before earnings credit, expense reimbursement and/or fee waiver, or recoupment by the Adviser | | | 1.62 | %(c) | | | 1.81 | % | | | 2.24 | % | | | 1.82 | % | | | 1.51 | % | | | 1.20 | % |
After earnings credit, expense reimbursement and/or fee waiver, or recoupment by the Adviser | | | 1.62 | %(c) | | | 1.81 | % | | | 2.24 | % | | | 1.78 | % | | | 1.41 | % | | | 1.17 | % |
Portfolio Turnover | | | 24.64 | %(b) | | | 41.24 | % | | | 77.70 | % | | | 56.33 | % | | | 87.37 | % | | | 41.33 | % |
| | (a) | The total return is calculated using the Net Asset Value used for trading at the close of business at period end. |
| | (d) | Ratios of expenses to average net assets include Earnings Credits of less than 0.005% for each of the years ended October 31, 2013 and October 31, 2012, which are not included in the contractual expense limitation. See Note I to the Financial Statements. |
| | (e) | Ratios of expenses to average net assets include interest expense of less than 0.005% for each of the years ended October 31, 2012 and October 31, 2011, which are not included in the contractual expense limitation. The interest expense is from utilizing the line of credit, as discussed in Note H to the Financial Statements. |
See accompanying Notes to Financial Statements.
| | |
| |
| ASTON/Anchor Capital Enhanced Equity Fund – Class I | | April 30, 2015 |
| |
| Financial Highlights | | |
| | | | | | | | | | | | | | | | | | | | | | | | |
| | | Six Months
Ended
04/30/15
(unaudited) | | | Year
Ended
10/31/14 | | | Year
Ended
10/31/13 | | | Year
Ended
10/31/12 | | | Year
Ended
10/31/11 | | | Period
Ended
10/31/10(a) | |
| | | | | | | | | | | | | | | | | | | | | | | | |
Net Asset Value, Beginning of Period | | $ | 9.50 | | | $ | 9.40 | | | $ | 8.69 | | | $ | 9.62 | | | $ | 9.41 | | | $ | 9.04 | |
| | | | | | | | | | | | | | | | | | | | | | | | |
Income from Investment Operations: | | | | | | | | | | | | | | | | | | | | | | | | |
Net investment income | | | 0.09 | | | | 0.18 | | | | 0.22 | | | | 0.18 | | | | 0.16 | | | | 0.09 | |
Net realized and unrealized gain on investments | | | 0.24 | | | | 0.10 | | | | 0.86 | | | | 0.11 | | | | 0.57 | | | | 0.37 | |
| | | | | | | | | | | | | | | | | | | | | | | | |
Total from investment operations | | | 0.33 | | | | 0.28 | | | | 1.08 | | | | 0.29 | | | | 0.73 | | | | 0.46 | |
| | | | | | | | | | | | | | | | | | | | | | | | |
Less Distributions: | | | | | | | | | | | | | | | | | | | | | | | | |
Distributions from and in excess of net investment income | | | (0.09 | ) | | | (0.18 | ) | | | (0.22 | ) | | | (0.18 | ) | | | (0.15 | ) | | | (0.09 | ) |
Distributions from net realized gain on investments | | | — | | | | — | | | | (0.15 | ) | | | (1.04 | ) | | | (0.37 | ) | | | — | |
| | | | | | | | | | | | | | | | | | | | | | | | |
Total distributions | | | (0.09 | ) | | | (0.18 | ) | | | (0.37 | ) | | | (1.22 | ) | | | (0.52 | ) | | | (0.09 | ) |
| | | | | | | | | | | | | | | | | | | | | | | | |
Net increase (decrease) in net asset value | | | 0.24 | | | | 0.10 | | | | 0.71 | | | | (0.93 | ) | | | 0.21 | | | | 0.37 | |
| | | | | | | | | | | | | | | | | | | | | | | | |
Net Asset Value, End of Period | | $ | 9.74 | | | $ | 9.50 | | | $ | 9.40 | | | $ | 8.69 | | | $ | 9.62 | | | $ | 9.41 | |
| | | | | | | | | | | | | | | | | | | | | | | | |
Total Return (b) | | | 3.55 | %(c) | | | 2.94 | % | | | 12.88 | % | | | 3.46 | % | | | 7.97 | % | | | 5.10 | %(c) |
| | | | | | |
Ratios/Supplemental Data: | | | | | | | | | | | | | | | | | | | | | | | | |
Net Assets, End of Period (in 000’s) | | $ | 107,276 | | | $ | 108,985 | | | $ | 58,099 | | | $ | 71,618 | | | $ | 64,840 | | | $ | 46,140 | |
Ratios of expenses to average net assets: | | | | | | | | | | | | | | | | | | | | | | | | |
Before earnings credit, expense reimbursement and/or fee waiver, or recoupment by the Adviser | | | 0.92 | %(d) | | | 0.94 | % | | | 0.98 | %(e) | | | 0.97 | %(e)(f) | | | 0.99 | %(f) | | | 1.10 | %(d) |
After earnings credit, expense reimbursement and/or fee waiver, or recoupment by the Adviser | | | 0.92 | %(d) | | | 0.94 | % | | | 0.98 | %(e) | | | 1.02 | %(e)(f) | | | 1.08 | %(f) | | | 1.15 | %(d) |
Ratios of net investment income to average net assets: | | | | | | | | | | | | | | | | | | | | | | | | |
Before earnings credit, expense reimbursement and/or fee waiver, or recoupment by the Adviser | | | 1.87 | %(d) | | | 2.06 | % | | | 2.49 | % | | | 2.07 | % | | | 1.76 | % | | | 1.37 | %(d) |
After earnings credit, expense reimbursement and/or fee waiver, or recoupment by the Adviser | | | 1.87 | %(d) | | | 2.06 | % | | | 2.49 | % | | | 2.03 | % | | | 1.66 | % | | | 1.32 | %(d) |
Portfolio Turnover | | | 24.64 | %(c) | | | 41.24 | % | | | 77.70 | % | | | 56.33 | % | | | 87.37 | % | | | 41.33 | % |
| | (a) | The inception date for Anchor Capital Enhanced Equity Fund Class I shares is March 3, 2010. |
| | (b) | The total return is calculated using the Net Asset Value used for trading at the close of business at period end. |
| | (e) | Ratios of expenses to average net assets include Earnings Credits of less than 0.005% for each of the years ended October 31, 2013 and October 31, 2012, which are not included in the contractual expense limitation. See Note I to the Financial Statements. |
| | (f) | Ratios of expenses to average net assets include interest expense of less than 0.005% for each of the years ended October 31, 2012 and October 31, 2011, which are not included in the contractual expense limitation. The interest expense is from utilizing the line of credit, as discussed in Note H to the Financial Statements. |
See accompanying Notes to Financial Statements.
| | |
| |
| ASTON/Lake Partners LASSO Alternatives Fund – Class N | | April 30, 2015 |
| |
| Financial Highlights | | |
| | | | | | | | | | | | | | | | | | | | | | | | |
| | | Six Months
Ended
04/30/15
(unaudited) | | | Year
Ended
10/31/14 | | | Year
Ended
10/31/13 | | | Year
Ended
10/31/12 | | | Year
Ended
10/31/11 | | | Period
Ended
10/31/10(a) | |
Net Asset Value, Beginning of Period | | $ | 13.64 | | | $ | 13.34 | | | $ | 12.39 | | | $ | 11.94 | | | $ | 11.97 | | | $ | 11.48 | |
| | | | | | | | | | | | | | | | | | | | | | | | |
Income from Investment Operations: | | | | | | | | | | | | | | | | | | | | | | | | |
Net investment income (loss) | | | (— | )(b)(c) | | | (0.07 | )(b) | | | — | (b)(c) | | | 0.04 | (b) | | | (0.01 | )(b) | | | 0.04 | (b) |
Net realized and unrealized gain on investments | | | 0.02 | | | | 0.50 | (d) | | | 1.11 | | | | 0.59 | | | | 0.13 | | | | 0.45 | |
| | | | | | | | | | | | | | | | | | | | | | | | |
Total from investment operations | | | 0.02 | | | | 0.43 | | | | 1.11 | | | | 0.63 | | | | 0.12 | | | | 0.49 | |
| | | | | | | | | | | | | | | | | | | | | | | | |
Less Distributions: | | | | | | | | | | | | | | | | | | | | | | | | |
Distributions from and in excess of net investment income | | | — | (c) | | | (0.09 | ) | | | (0.16 | ) | | | (0.18 | ) | | | (0.08 | ) | | | — | |
Distributions from capital gains | | | (0.50 | ) | | | (0.04 | ) | | | — | | | | — | | | | (0.07 | ) | | | — | |
| | | | | | | | | | | | | | | | | | | | | | | | |
Total distributions | | | (0.50 | ) | | | (0.13 | ) | | | (0.16 | ) | | | (0.18 | ) | | | (0.15 | ) | | | — | |
| | | | | | | | | | | | | | | | | | | | | | | | |
Net increase (decrease) in net asset value | | | (0.48 | ) | | | 0.30 | | | | 0.95 | | | | 0.45 | | | | (0.03 | ) | | | 0.49 | |
| | | | | | | | | | | | | | | | | | | | | | | | |
Net Asset Value, End of Period | | $ | 13.16 | | | $ | 13.64 | | | $ | 13.34 | | | $ | 12.39 | | | $ | 11.94 | | | $ | 11.97 | |
| | | | | | | | | | | | | | | | | | | | | | | | |
Total Return (e) | | | 0.17 | %(f) | | | 3.27 | % | | | 9.05 | % | | | 5.34 | % | | | 0.92 | % | | | 4.27 | %(f) |
| | | | | | |
Ratios/Supplemental Data: | | | | | | | | | | | | | | | | | | | | | | | | |
Net Assets, End of Period (in 000’s) | | $ | 65,373 | | | $ | 44,386 | | | $ | 54,388 | | | $ | 33,719 | | | $ | 17,626 | | | $ | 8,296 | |
Ratios of expenses to average net assets: | | | | | | | | | | | | | | | | | | | | | | | | |
Before earnings credit, expense reimbursement and/or fee waiver, or recoupment by the Adviser (g) | | | 1.43 | %(h)(i) | | | 1.41 | % | | | 1.43 | %(j) | | | 1.41 | %(j)(k) | | | 1.53 | % | | | 2.19 | %(i) |
After earnings credit, expense reimbursement and/or fee waiver, or recoupment by the Adviser (g) | | | 1.42 | %(h)(i) | | | 1.43 | % | | | 1.45 | %(j) | | | 1.45 | %(j)(k) | | | 1.45 | % | | | 1.45 | %(i)(l) |
Ratios of net investment income (loss) to average net assets: | | | | | | | | | | | | | | | | | | | | | | | | |
Before earnings credit, expense reimbursement and/or fee waiver, or recoupment by the Adviser | | | (0.06 | )%(i) | | | (0.51 | )% | | | — | %(c) | | | 0.36 | %(k) | | | (0.17 | )% | | | (0.25 | )%(i) |
After earnings credit, expense reimbursement and/or fee waiver, or recoupment by the Adviser | | | (0.05 | )%(i) | | | (0.53 | )% | | | (0.03 | )% | | | 0.32 | %(k) | | | (0.10 | )% | | | 0.49 | %(i) |
Portfolio Turnover | | | 42.70 | %(f) | | | 45.91 | % | | | 43.55 | % | | | 45.60 | % | | | 79.77 | % | | | 116.68 | % |
| | (a) | The inception date for Lake Partners LASSO Alternatives Fund Class N shares is March 3, 2010. |
| | (b) | The selected per share data was calculated using the weighted average shares outstanding method for the period. |
| | (c) | Represents less than ($0.005) or $0.005 per share or less than 0.005%. |
| | (d) | Includes capital contribution of less than $0.005 per share. |
| | (e) | The total return is calculated using the Net Asset Value used for trading at the close of business at period end. |
| | (g) | Does not include expenses of the underlying funds in which the Fund invests. |
| | (h) | Effective February 28, 2015, the contractual expense limitation was decreased from 1.45% to 1.40%, excluding interest, taxes, investment-related costs (such as brokerage commissions), extraordinary expenses and acquired fund fees and expenses. |
| | (j) | Ratios of expenses to average net assets includes Earnings Credits of less than 0.005% for each of the years ended October 31, 2013 and October 31, 2012, which are not included in the contractual expense limitation. See Note I to the Financial Statements. |
| | (k) | Ratios of expenses and net investment income to average net assets include advisory fee waiver of less than 0.005% for the year ended October 31, 2012. |
| | (l) | Effective March 30, 2010, the contractual expense limitation was decreased from 1.60% to 1.45%, excluding interest, taxes, investment-related costs (such as brokerage commissions), extraordinary expenses and acquired fund fees and expenses. |
See accompanying Notes to Financial Statements.
| | |
| |
| ASTON/Lake Partners LASSO Alternatives Fund – Class I | | April 30, 2015 |
| |
| Financial Highlights | | |
| | | | | | | | | | | | | | | | | | | | | | | | |
| | | Six Months
Ended
04/30/15
(unaudited) | | | Year
Ended
10/31/14 | | | Year
Ended
10/31/13 | | | Year
Ended
10/31/12 | | | Year
Ended
10/31/11 | | | Year
Ended
10/31/10 | |
| | | | | | | | | | | | | | | | | | | | | | | | |
Net Asset Value, Beginning of Period | | $ | 13.69 | | | $ | 13.38 | | | $ | 12.42 | | | $ | 11.97 | | | $ | 11.98 | | | $ | 11.15 | |
| | | | | | | | | | | | | | | | | | | | | | | | |
Income from Investment Operations: | | | | | | | | | | | | | | | | | | | | | | | | |
Net investment income (loss) | | | 0.01 | (a) | | | (0.04 | )(a) | | | 0.03 | (a) | | | 0.07 | (a) | | | 0.02 | (a) | | | 0.08 | (a) |
Net realized and unrealized gain on investments | | | 0.03 | (b) | | | 0.51 | (b) | | | 1.11 | | | | 0.59 | | | | 0.13 | | | | 0.89 | |
| | | | | | | | | | | | | | | | | | | | | | | | |
Total from investment operations | | | 0.04 | | | | 0.47 | | | | 1.14 | | | | 0.66 | | | | 0.15 | | | | 0.97 | |
| | | | | | | | | | | | | | | | | | | | | | | | |
Less Distributions: | | | | | | | | | | | | | | | | | | | | | | | | |
Distributions from and in excess of net investment income | | | (0.04 | ) | | | (0.12 | ) | | | (0.18 | ) | | | (0.21 | ) | | | (0.09 | ) | | | (0.07 | ) |
Distributions from net realized gain on investments | | | (0.50 | ) | | | (0.04 | ) | | | — | | | | — | | | | (0.07 | ) | | | (0.07 | ) |
| | | | | | | | | | | | | | | | | | | | | | | | |
Total distributions | | | (0.54 | ) | | | (0.16 | ) | | | (0.18 | ) | | | (0.21 | ) | | | (0.16 | ) | | | (0.14 | ) |
| | | | | | | | | | | | | | | | | | | | | | | | |
Net increase (decrease) in net asset value | | | (0.50 | ) | | | 0.31 | | | | 0.96 | | | | 0.45 | | | | (0.01 | ) | | | 0.83 | |
| | | | | | | | | | | | | | | | | | | | | | | | |
Net Asset Value, End of Period | | $ | 13.19 | | | $ | 13.69 | | | $ | 13.38 | | | $ | 12.42 | | | $ | 11.97 | | | $ | 11.98 | |
| | | | | | | | | | | | | | | | | | | | | | | | |
Total Return (c) | | | 0.27 | %(d) | | | 3.56 | % | | | 9.31 | % | | | 5.56 | % | | | 1.22 | % | | | 8.74 | % |
| | | | | | |
Ratios/Supplemental Data: | | | | | | | | | | | | | | | | | | | | | | | | |
Net Assets, End of Period (in 000’s) | | $ | 255,680 | | | $ | 477,157 | | | $ | 416,475 | | | $ | 253,343 | | | $ | 189,999 | | | $ | 19,723 | |
Ratios of expenses to average net assets: | | | | | | | | | | | | | | | | | | | | | | | | |
Before earnings credit, expense reimbursement and/or fee waiver, or recoupment by the Adviser (e) | | | 1.18 | %(f)(g) | | | 1.16 | % | | | 1.18 | %(h) | | | 1.16 | %(h)(i) | | | 1.28 | % | | | 2.32 | % |
After earnings credit, expense reimbursement and/or fee waiver, or recoupment by the Adviser (e) | | | 1.17 | %(f)(g) | | | 1.18 | % | | | 1.20 | %(h) | | | 1.20 | %(h)(i) | | | 1.20 | % | | | 1.24 | %(j) |
Ratios of net investment income (loss) to average net assets: | | | | | | | | | | | | | | | | | | | | | | | | |
Before earnings credit, expense reimbursement and/or fee waiver, or recoupment by the Adviser | | | 0.19 | %(g) | | | (0.26 | )% | | | 0.25 | % | | | 0.61 | %(i) | | | 0.08 | % | | | (0.41 | )% |
After earnings credit, expense reimbursement and/or fee waiver, or recoupment by the Adviser | | | 0.20 | %(g) | | | (0.28 | )% | | | 0.22 | % | | | 0.57 | %(i) | | | 0.15 | % | | | 0.67 | % |
Portfolio Turnover | | | 42.70 | %(d) | | | 45.91 | % | | | 43.55 | % | | | 45.60 | % | | | 79.77 | % | | | 116.68 | % |
| | (a) | The selected per share data was calculated using the weighted average shares outstanding method for the period. |
| | (b) | Includes capital contribution of less than $0.005 per share. |
| | (c) | The total return is calculated using the Net Asset Value used for trading at the close of business at period end. |
| | (e) | Does not include expenses of the underlying funds in which the Fund invests. |
| | (f) | Effective February 28, 2015, the contractual expense limitation was decreased from 1.20% to 1.15%, excluding interest, taxes, investment-related costs (such as brokerage commissions), extraordinary expenses and acquired fund fees and expenses. |
| | (h) | Ratios of expenses to average net assets include Earnings Credits of less than 0.005% for each of the years ended October 31, 2013 and October 31, 2012, which are not included in the contractual expense limitation. See Note I to the Financial Statements. |
| | (i) | Ratios of expenses and net investment income to average net assets include advisory fee waiver of less than 0.005% for the year ended October 31, 2012. |
| | (j) | Effective March 30, 2010, the contractual expense limitation was decreased from 1.35% to 1.20%, excluding interest, taxes, investment-related costs (such as brokerage commissions), extraordinary expenses and acquired fund fees and expenses. |
See accompanying Notes to Financial Statements.
| | |
| |
| ASTON/River Road Long-Short Fund – Class N | | April 30, 2015 |
| |
| Financial Highlights | | |
| | | | | | | | | | | | | | | | | | | | |
| | | Six Months
Ended
04/30/15
(unaudited) | | | Year
Ended
10/31/14 | | | Year
Ended
10/31/13 | | | Year
Ended
10/31/12 | | | Period
Ended
10/31/11(a) | |
| | | | | | | | | | | | | | | | | | | | |
Net Asset Value, Beginning of Period | | $ | 11.35 | | | $ | 12.02 | | | $ | 10.73 | | | $ | 9.91 | | | $ | 10.00 | |
| | | | | | | | | | | | | | | | | | | | |
Income from Investment Operations: | | | | | | | | | | | | | | | | | | | | |
Net investment loss | | | (0.06 | ) | | | (0.19 | ) | | | (0.17 | )(b) | | | (0.18 | ) | | | (0.04 | )(b) |
Net realized and unrealized gain (loss) on investments | | | 0.55 | | | | (0.19 | ) | | | 2.02 | | | | 1.00 | | | | (0.05 | ) |
| | | | | | | | | | | | | | | | | | | | |
Total from investment operations | | | 0.49 | | | | (0.38 | ) | | | 1.85 | | | | 0.82 | | | | (0.09 | ) |
| | | | | | | | | | | | | | | | | | | | |
Less Distributions: | | | | | | | | | | | | | | | | | | | | |
Distributions from net realized gain on investments | | | (0.30 | ) | | | (0.29 | ) | | | (0.56 | ) | | | — | | | | — | |
| | | | | | | | | | | | | | | | | | | | |
Total distributions | | | (0.30 | ) | | | (0.29 | ) | | | (0.56 | ) | | | — | | | | — | |
| | | | | | | | | | | | | | | | | | | | |
Net increase (decrease) in net asset value | | | 0.19 | | | | (0.67 | ) | | | 1.29 | | | | 0.82 | | | | (0.09 | ) |
| | | | | | | | | | | | | | | | | | | | |
Net Asset Value, End of Period | | $ | 11.54 | | | $ | 11.35 | | | $ | 12.02 | | | $ | 10.73 | | | $ | 9.91 | |
| | | | | | | | | | | | | | | | | | | | |
Total Return (c) | | | 4.33 | %(d) | | | (3.27 | )% | | | 18.14 | % | | | 8.17 | % | | | (0.80 | )%(d) |
| | | | | |
Ratios/Supplemental Data: | | | | | | | | | | | | | | | | | | | | |
Net Assets, End of Period (in 000’s) | | $ | 102,377 | | | $ | 109,140 | | | $ | 108,966 | | | $ | 7,506 | | | $ | 4,594 | |
Ratios of expenses to average net assets: | | | | | | | | | | | | | | | | | | | | |
Before expense reimbursement and/or fee waiver, or recoupment by Adviser, including interest and dividend expense for securities sold short | | | 2.64 | %(e) | | | 2.53 | % | | | 2.54 | % | | | 5.03 | % | | | 8.68 | %(e) |
After expense reimbursement and/or fee waiver, or recoupment by Adviser, including interest and dividend expense for securities sold short | | | 2.68 | %(e) | | | 2.58 | % | | | 2.38 | % | | | 3.11 | % | | | 2.72 | %(e) |
After expense reimbursement and/or fee waiver, or recoupment by Adviser, excluding interest and dividend expense for securities sold short | | | 1.70 | %(e) | | | 1.70 | % | | | 1.70 | % | | | 1.70 | % | | | 1.70 | %(e) |
Ratios of net investment loss to average net assets: | | | | | | | | | | | | | | | | | | | | |
Before expense reimbursement and/or fee waiver, or recoupment by Adviser | | | (0.91 | )%(e) | | | (1.55 | )% | | | (1.62 | )% | | | (3.63 | )% | | | (6.80 | )%(e) |
After expense reimbursement and/or fee waiver, or recoupment by Adviser | | | (0.95 | )%(e) | | | (1.59 | )% | | | (1.46 | )% | | | (1.71 | )% | | | (0.84 | )%(e) |
Portfolio Turnover | | | 129.69 | %(d) | | | 303.04 | % | | | 291.36 | % | | | 277.72 | % | | | 127.32 | %(d) |
| | (a) | The inception date for River Road Long-Short Fund Class N shares is May 4, 2011. |
| | (b) | The selected per share data was calculated using the weighted average shares outstanding method for the period. |
| | (c) | The total return is calculated using the Net Asset Value used for trading at the close of business at period end. |
See accompanying Notes to Financial Statements.
| | |
| |
| ASTON/River Road Long-Short Fund – Class I | | April 30, 2015 |
| |
| Financial Highlights | | |
| | | | | | | | | | | | |
| | | Six Months
Ended
04/30/15
(unaudited) | | | Year
Ended
10/31/14 | | | Period
Ended
10/31/13(a) | |
Net Asset Value, Beginning of Period | | $ | 11.40 | | | $ | 12.05 | | | $ | 10.96 | |
| | | | | | | | | | | | |
Income from Investment Operations: | | | | | | | | | | | | |
Net investment loss | | | (0.04 | ) | | | (0.16 | ) | | | (0.10 | )(b) |
Net realized and unrealized gain (loss) on investments | | | 0.55 | | | | (0.20 | ) | | | 1.19 | |
| | | | | | | | | | | | |
Total from investment operations | | | 0.51 | | | | (0.36 | ) | | | 1.09 | |
| | | | | | | | | | | | |
Less Distributions: | | | | | | | | | | | | |
Distributions from net realized gain on investments | | | (0.30 | ) | �� | | (0.29 | ) | | | — | |
| | | | | | | | | | | | |
Total distributions | | | (0.30 | ) | | | (0.29 | ) | | | — | |
| | | | | | | | | | | | |
Net increase (decrease) in net asset value | | | 0.21 | | | | (0.65 | ) | | | 1.09 | |
| | | | | | | | | | | | |
Net Asset Value, End of Period | | $ | 11.61 | | | $ | 11.40 | | | $ | 12.05 | |
| | | | | | | | | | | | |
Total Return (c) | | | 4.49 | %(d) | | | (3.01 | )% | | | 9.85 | %(d) |
| | | |
Ratios/Supplemental Data: | | | | | | | | | | | | |
Net Assets, End of Period (in 000’s) | | $ | 81,509 | | | $ | 110,271 | | | $ | 71,175 | |
Ratios of expenses to average net assets: | | | | | | | | | | | | |
Before expense reimbursement and/or fee waiver, or recoupment by Adviser, including interest and dividend expense for securities sold short | | | 2.39 | %(e) | | | 2.28 | % | | | 2.20 | %(e) |
After expense reimbursement and/or fee waiver, or recoupment by Adviser, including interest and dividend expense for securities sold short | | | 2.43 | %(e) | | | 2.33 | % | | | 2.10 | %(e) |
After expense reimbursement and/or fee waiver, or recoupment by Adviser, excluding interest and dividend expense for securities sold short | | | 1.45 | %(e) | | | 1.45 | % | | | 1.45 | %(e) |
Ratios of net investment loss to average net assets: | | | | | | | | | | | | |
Before expense reimbursement and/or fee waiver, or recoupment by Adviser | | | (0.66 | )%(e) | | | (1.30 | )% | | | (1.44 | )%(e) |
After expense reimbursement and/or fee waiver, or recoupment by Adviser | | | (0.70 | )%(e) | | | (1.34 | )% | | | (1.33 | )%(e) |
Portfolio Turnover | | | 129.69 | %(d) | | | 303.04 | % | | | 291.36 | % |
| | (a) | The inception date for River Road Long-Short Fund Class I shares is March 4, 2013. |
| | (b) | The selected per share data was calculated using the weighted average shares outstanding method for the period. |
| | (c) | The total return is calculated using the Net Asset Value used for trading at the close of business at period end. |
See accompanying Notes to Financial Statements.
| | |
| |
| ASTON/Barings International Fund – Class N | | April 30, 2015 |
| |
| Financial Highlights | | |
| | | | | | | | | | | | | | | | | | | | | | | | |
| | | Six Months
Ended
04/30/15
(unaudited) | | | Year
Ended
10/31/14 | | | Year
Ended
10/31/13 | | | Year
Ended
10/31/12 | | | Year
Ended
10/31/11 | | | Period
Ended
10/31/10(a) | |
Net Asset Value, Beginning of Period | | $ | 6.98 | | | $ | 7.81 | | | $ | 6.87 | | | $ | 6.81 | | | $ | 7.24 | | | $ | 6.48 | |
| | | | | | | | | | | | | | | | | | | | | | | | |
Income from Investment Operations: | | | | | | | | | | | | | | | | | | | | | | | | |
Net investment income | | | 0.02 | (b) | | | 0.14 | (b) | | | 0.11 | (b) | | | 0.10 | (b) | | | 0.07 | (b) | | | 0.06 | (b) |
Net realized and unrealized gain (loss) on investments | | | 0.46 | | | | (0.31 | ) | | | 1.00 | | | | 0.17 | | | | (0.37 | ) | | | 0.70 | |
| | | | | | | | | | | | | | | | | | | | | | | | |
Total from investment operations | | | 0.48 | | | | (0.17 | ) | | | 1.11 | | | | 0.27 | | | | (0.30 | ) | | | 0.76 | |
| | | | | | | | | | | | | | | | | | | | | | | | |
Less Distributions: | | | | | | | | | | | | | | | | | | | | | | | | |
Distributions from and in excess of net investment income | | | (0.14 | ) | | | (0.18 | ) | | | (0.09 | ) | | | (0.04 | ) | | | (0.13 | ) | | | — | |
Distributions from net realized gain on investments | | | (0.88 | ) | | | (0.48 | ) | | | (0.08 | ) | | | (0.17 | ) | | | — | | | | — | |
| | | | | | | | | | | | | | | | | | | | | | | | |
Total distributions | | | (1.02 | ) | | | (0.66 | ) | | | (0.17 | ) | | | (0.21 | ) | | | (0.13 | ) | | | — | |
| | | | | | | | | | | | | | | | | | | | | | | | |
Net increase (decrease) in net asset value | | | (0.54 | ) | | | (0.83 | ) | | | 0.94 | | | | 0.06 | | | | (0.43 | ) | | | 0.76 | |
| | | | | | | | | | | | | | | | | | | | | | | | |
Net Asset Value, End of Period | | $ | 6.44 | | | $ | 6.98 | | | $ | 7.81 | | | $ | 6.87 | | | $ | 6.81 | | | $ | 7.24 | |
| | | | | | | | | | | | | | | | | | | | | | | | |
Total Return (c) | | | 8.34 | %(d) | | | (2.62 | )% | | | 16.64 | % | | | 4.28 | % | | | (4.22 | )% | | | 11.73 | %(d) |
| | | | | | |
Ratios/Supplemental Data: | | | | | | | | | | | | | | | | | | | | | | | | |
Net Assets, End of Period (in 000’s) | | $ | 355 | | | $ | 331 | | | $ | 477 | | | $ | 421 | | | $ | 393 | | | $ | 184 | |
Ratios of expenses to average net assets: | | | | | | | | | | | | | | | | | | | | | | | | |
Before expense reimbursement and/or fee waiver by Adviser | | | 2.15 | %(e) | | | 1.95 | % | | | 1.67 | % | | | 1.60 | % | | | 1.68 | %(f) | | | 1.72 | %(e) |
After expense reimbursement and/or fee waiver by Adviser | | | 1.40 | %(e) | | | 1.40 | % | | | 1.40 | % | | | 1.40 | % | | | 1.40 | %(f) | | | 1.40 | %(e) |
Ratios of net investment income to average net assets: | | | | | | | | | | | | | | | | | | | | | | | | |
Before expense reimbursement and/or fee waiver by Adviser | | | (0.20 | )%(e) | | | 1.42 | % | | | 1.26 | % | | | 1.30 | % | | | 0.76 | %(f) | | | 1.07 | %(e) |
After expense reimbursement and/or fee waiver by Adviser | | | 0.55 | %(e) | | | 1.97 | % | | | 1.53 | % | | | 1.50 | % | | | 1.04 | %(f) | | | 1.39 | %(e) |
Portfolio Turnover | | | 21.68 | %(d) | | | 53.14 | % | | | 55.78 | % | | | 33.48 | % | | | 58.96 | % | | | 65.32 | % |
| | (a) | The inception date for Barings International Fund Class N shares is March 3, 2010. |
| | (b) | The selected per share data was calculated using the weighted average shares outstanding method for the period. |
| | (c) | The total return is calculated using the Net Asset Value used for trading at the close of business at period end. |
| | (f) | For the period November 1, 2010 through February 28, 2011, the Adviser voluntarily waived management fees and/or reimbursed expenses so that the net expense ratio did not exceed 1.40%, excluding interest, taxes, investment-related costs (such as brokerage commissions), extraordinary expenses and acquired fund fees and expenses. Effective March 1, 2011, the expense limitation became contractual and was decreased from 1.50% to 1.40%, excluding interest, taxes, investment-related costs (such as brokerage commissions), extraordinary expenses and acquired fund fees and expenses. |
See accompanying Notes to Financial Statements.
| | |
| |
| ASTON/Barings International Fund – Class I | | April 30, 2015 |
| |
| Financial Highlights | | |
| | | | | | | | | | | | | | | | | | | | | | | | |
| | | Six Months
Ended
04/30/15
(unaudited) | | | Year
Ended
10/31/14 | | | Year
Ended
10/31/13 | | | Year
Ended
10/31/12 | | | Year
Ended
10/31/11 | | | Year
Ended
10/31/10 | |
| | | | | | | | | | | | | | | | | | | | | | | | |
Net Asset Value, Beginning of Period | | $ | 6.99 | | | $ | 7.82 | | | $ | 6.89 | | | $ | 6.82 | | | $ | 7.26 | | | $ | 6.44 | |
| | | | | | | | | | | | | | | | | | | | | | | | |
Income from Investment Operations: | | | | | | | | | | | | | | | | | | | | | | | | |
Net investment income | | | 0.03 | (a) | | | 0.16 | (a) | | | 0.13 | (a) | | | 0.12 | (a) | | | 0.09 | (a) | | | 0.06 | (a) |
Net realized and unrealized gain (loss) on investments | | | 0.46 | | | | (0.31 | ) | | | 0.99 | | | | 0.18 | | | | (0.38 | ) | | | 0.78 | |
| | | | | | | | | | | | | | | | | | | | | | | | |
Total from investment operations | | | 0.49 | | | | (0.15 | ) | | | 1.12 | | | | 0.30 | | | | (0.29 | ) | | | 0.84 | |
| | | | | | | | | | | | | | | | | | | | | | | | |
Less Distributions: | | | | | | | | | | | | | | | | | | | | | | | | |
Distributions from and in excess of net investment income | | | (0.16 | ) | | | (0.20 | ) | | | (0.11 | ) | | | (0.06 | ) | | | (0.15 | ) | | | (0.02 | ) |
Distributions from net realized gain on investments | | | (0.88 | ) | | | (0.48 | ) | | | (0.08 | ) | | | (0.17 | ) | | | — | | | | — | |
| | | | | | | | | | | | | | | | | | | | | | | | |
Total distributions | | | (1.04 | ) | | | (0.68 | ) | | | (0.19 | ) | | | (0.23 | ) | | | (0.15 | ) | | | (0.02 | ) |
| | | | | | | | | | | | | | | | | | | | | | | | |
Net increase (decrease) in net asset value | | | (0.55 | ) | | | (0.83 | ) | | | 0.93 | | | | 0.07 | | | | (0.44 | ) | | | 0.82 | |
| | | | | | | | | | | | | | | | | | | | | | | | |
Net Asset Value, End of Period | | $ | 6.44 | | | $ | 6.99 | | | $ | 7.82 | | | $ | 6.89 | | | $ | 6.82 | | | $ | 7.26 | |
| | | | | | | | | | | | | | | | | | | | | | | | |
Total Return (b) | | | 8.49 | %(c) | | | (2.37 | )% | | | 16.72 | % | | | 4.72 | % | | | (4.09 | )% | | | 12.89 | % |
| | | | | | |
Ratios/Supplemental Data: | | | | | | | | | | | | | | | | | | | | | | | | |
Net Assets, End of Period (in 000’s) | | $ | 21,047 | | | $ | 21,260 | | | $ | 37,507 | | | $ | 61,662 | | | $ | 52,390 | | | $ | 47,985 | |
Ratios of expenses to average net assets: | | | | | | | | | | | | | | | | | | | | | | | | |
Before expense reimbursement and/or fee waiver by Adviser | | | 1.90 | %(d) | | | 1.70 | % | | | 1.42 | % | | | 1.35 | % | | | 1.43 | %(e) | | | 1.47 | % |
After expense reimbursement and/or fee waiver by Adviser | | | 1.15 | %(d) | | | 1.15 | % | | | 1.15 | % | | | 1.15 | % | | | 1.15 | %(e) | | | 1.15 | % |
Ratios of net investment income to average net assets: | | | | | | | | | | | | | | | | | | | | | | | | |
Before expense reimbursement and/or fee waiver by Adviser | | | 0.05 | %(d) | | | 1.67 | % | | | 1.51 | % | | | 1.55 | % | | | 1.01 | %(e) | | | 0.63 | % |
After expense reimbursement and/or fee waiver by Adviser | | | 0.80 | %(d) | | | 2.22 | % | | | 1.78 | % | | | 1.75 | % | | | 1.29 | %(e) | | | 0.95 | % |
Portfolio Turnover | | | 21.68 | %(c) | | | 53.14 | % | | | 55.78 | % | | | 33.48 | % | | | 58.96 | % | | | 65.32 | % |
| | (a) | The selected per share data was calculated using the weighted average shares outstanding method for the period. |
| | (b) | The total return is calculated using the Net Asset Value used for trading at the close of business at period end. |
| | (e) | For the period November 1, 2010 through February 28, 2011, the Adviser voluntarily waived management fees and/or reimbursed expenses so that the net expense ratio did not exceed 1.15%, excluding interest, taxes, investment related costs (such as brokerage commissions), extraordinary expenses and acquired fund fees and expenses. Effective March 1, 2011, the expense limitation became contractual and was decreased from 1.25% to 1.15%, excluding interest, taxes, investment-related costs (such as brokerage commissions), extraordinary expenses and acquired fund fees and expenses. |
See accompanying Notes to Financial Statements.
| | |
| |
| ASTON/Guardian Capital Global Dividend Fund – Class N | | April 30, 2015 |
| |
| Financial Highlights | | |
| | | | | | | | |
| | | Six Months
Ended
04/30/15
(unaudited) | | | Period
Ended
10/31/14(a) | |
Net Asset Value, Beginning of Period | | $ | 10.51 | | | $ | 10.00 | |
| | | | | | | | |
Income from Investment Operations: | | | | | | | | |
Net investment income | | | 0.14 | (b) | | | 0.13 | |
Net realized and unrealized gain on investments | | | 0.15 | | | | 0.49 | |
| | | | | | | | |
Total from investment operations | | | 0.29 | | | | 0.62 | |
| | | | | | | | |
Less Distributions: | | | | | | | | |
Distributions from and in excess of net investment income | | | (0.11 | ) | | | (0.11 | ) |
| | | | | | | | |
Total Distributions | | | (0.11 | ) | | | (0.11 | ) |
| | | | | | | | |
Net increase in net asset value | | | 0.18 | | | | 0.51 | |
| | | | | | | | |
Net Asset Value, End of Period | | $ | 10.69 | | | $ | 10.51 | |
| | | | | | | | |
Total Return (c) | | | 2.74 | %(d) | | | 6.17 | %(d) |
| | |
Ratios/Supplemental Data: | | | | | | | | |
Net Assets, End of Period (in 000’s) | | $ | 1,082 | | | $ | 1,052 | |
Ratios of expenses to average net assets: | | | | | | | | |
Before expense reimbursement and/or fee waiver by Adviser | | | 4.72 | %(e) | | | 5.21 | %(e) |
After expense reimbursement and/or fee waiver by Adviser | | | 1.30 | %(e) | | | 1.30 | %(e) |
Ratios of net investment income (loss) to average net assets: | | | | | | | | |
Before expense reimbursement and/or fee waiver by Adviser | | | (0.69 | )%(e) | | | (1.74 | )%(e) |
After expense reimbursement and/or fee waiver by Adviser | | | 2.73 | %(e) | | | 2.17 | %(e) |
Portfolio Turnover | | | 9.70 | %(d) | | | 15.97 | %(d) |
| | (a) | The inception date for Guardian Capital Global Dividend Fund Class N shares is April 14, 2014. |
| | (b) | The selected per share data was calculated using the weighted average shares outstanding method for the period. |
| | (c) | The total return is calculated using the Net Asset Value used for trading at the close of business at period end. |
See accompanying Notes to Financial Statements.
| | |
| |
| ASTON/Guardian Capital Global Dividend Fund – Class I | | April 30, 2015 |
| |
| Financial Highlights | | |
| | | | | | | | |
| | | Six Months
Ended
04/30/15
(unaudited) | | | Period
Ended
10/31/14(a) | |
| | | | | | | | |
Net Asset Value, Beginning of Period | | $ | 10.52 | | | $ | 10.00 | |
| | | | | | | | |
Income from Investment Operations: | | | | | | | | |
Net investment income | | | 0.16 | (b) | | | 0.14 | |
Net realized and unrealized gain on investments | | | 0.11 | | | | 0.50 | |
| | | | | | | | |
Total from investment operations | | | 0.27 | | | | 0.64 | |
| | | | | | | | |
Less Distributions: | | | | | | | | |
Distributions from and in excess of net investment income | | | (0.12 | ) | | | (0.12 | ) |
| | | | | | | | |
Total Distributions | | | (0.12 | ) | | | (0.12 | ) |
| | | | | | | | |
Net increase in net asset value | | | 0.15 | | | | 0.52 | |
| | | | | | | | |
Net Asset Value, End of Period | | $ | 10.67 | | | $ | 10.52 | |
| | | | | | | | |
Total Return (c) | | | 2.63 | %(d) | | | 6.39 | %(d) |
| | |
Ratios/Supplemental Data: | | | | | | | | |
Net Assets, End of Period (in 000’s) | | $ | 3,388 | | | $ | 3,211 | |
Ratios of expenses to average net assets: | | | | | | | | |
Before expense reimbursement and/or fee waiver by Adviser | | | 4.47 | %(e) | | | 4.96 | %(e) |
After expense reimbursement and/or fee waiver by Adviser | | | 1.05 | %(e) | | | 1.05 | %(e) |
Ratios of net investment income (loss) to average net assets: | | | | | | | | |
Before expense reimbursement and/or fee waiver by Adviser | | | (0.44 | )%(e) | | | (1.49 | )%(e) |
After expense reimbursement and/or fee waiver by Adviser | | | 2.98 | %(e) | | | 2.42 | %(e) |
Portfolio Turnover | | | 9.70 | %(d) | | | 15.97 | %(d) |
| | (a) | The inception date for Guardian Capital Global Dividend Fund Class I shares is April 14, 2014. |
| | (b) | The selected per share data was calculated using the weighted average shares outstanding method for the period. |
| | (c) | The total return is calculated using the Net Asset Value used for trading at the close of business at period end. |
See accompanying Notes to Financial Statements.
| | |
| |
| ASTON/LMCG Emerging Markets Fund – Class N | | April 30, 2015 |
| |
| Financial Highlights | | |
| | | | | | | | | | | | |
| | | Six Months
Ended
04/30/15
(unaudited) | | | Year
Ended
10/31/14 | | | Period
Ended
10/31/13(a) | |
Net Asset Value, Beginning of Period | | $ | 9.55 | | | $ | 9.65 | | | $ | 10.00 | |
| | | | | | | | | | | | |
Income from Investment Operations: | | | | | | | | | | | | |
Net investment income | | | 0.01 | (b) | | | 0.11 | | | | 0.08 | (b) |
Net realized and unrealized gain (loss) on investments | | | 0.29 | | | | (0.07 | ) | | | (0.43 | ) |
| | | | | | | | | | | | |
Total from investment operations | | | 0.30 | | | | 0.04 | | | | (0.35 | ) |
| | | | | | | | | | | | |
Less Distributions: | | | | | | | | | | | | |
Distributions from and in excess of net investment income | | | (0.05 | ) | | | (0.14 | ) | | | — | |
| | | | | | | | | | | | |
Total distributions | | | (0.05 | ) | | | (0.14 | ) | | | — | |
| | | | | | | | | | | | |
Net decrease in net asset value | | | 0.25 | | | | (0.10 | ) | | | (0.35 | ) |
| | | | | | | | | | | | |
Net Asset Value, End of Period | | $ | 9.80 | | | $ | 9.55 | | | $ | 9.65 | |
| | | | | | | | | | | | |
Total Return (c) | | | 3.19 | %(d) | | | 0.49 | % | | | (3.50 | )%(d) |
| | | |
Ratios/Supplemental Data: | | | | | | | | | | | | |
Net Assets, End of Period (in 000’s) | | $ | 748 | | | $ | 725 | | | $ | 675 | |
Ratios of expenses to average net assets: | | | | | | | | | | | | |
Before expense reimbursement and/or fee waiver by Adviser | | | 5.42 | %(e) | | | 5.96 | % | | | 7.24 | %(e) |
After expense reimbursement and/or fee waiver by Adviser | | | 1.43 | %(e) | | | 1.57 | % | | | 1.65 | %(e) |
Ratios of net investment income (loss) to average net assets: | | | | | | | | | | | | |
Before expense reimbursement and/or fee waiver by Adviser | | | (3.85 | )%(e) | | | (3.24 | )% | | | (4.13 | )%(e) |
After expense reimbursement and/or fee waiver by Adviser | | | 0.14 | %(e) | | | 1.15 | % | | | 1.46 | %(e) |
Portfolio Turnover | | | 31.49 | %(d) | | | 63.48 | % | | | 101.96 | %(d) |
| | (a) | The inception date for LMCG Emerging Markets Fund Class N shares is March 28, 2013. |
| | (b) | The selected per share data was calculated using the weighted average shares outstanding method for the period. |
| | (c) | The total return is calculated using the Net Asset Value used for trading at the close of business at period end. |
See accompanying Notes to Financial Statements.
| | |
| |
| ASTON/LMCG Emerging Markets Fund – Class I | | April 30, 2015 |
| |
| Financial Highlights | | |
| | | | | | | | | | | | |
| | | Six Months
Ended
04/30/15
(unaudited) | | | Year
Ended
10/31/14 | | | Period
Ended
10/31/13 (a)
| |
| | | | | | | | | | | | |
Net Asset Value, Beginning of Period | | $ | 9.58 | | | $ | 9.67 | | | $ | 10.00 | |
| | | | | | | | | | | | |
Income from Investment Operations: | | | | | | | | | | | | |
Net investment income | | | 0.01 | (b) | | | 0.14 | | | | 0.10 | (b) |
Net realized and unrealized gain (loss) on investments | | | 0.31 | | | | (0.07 | ) | | | (0.43 | ) |
| | | | | | | | | | | | |
Total from investment operations | | | 0.32 | | | | 0.07 | | | | (0.33 | ) |
| | | | | | | | | | | | |
Less Distributions: | | | | | | | | | | | | |
Distributions from and in excess of net investment income | | | (0.07 | ) | | | (0.16 | ) | | | — | |
| | | | | | | | | | | | |
Total distributions | | | (0.07 | ) | | | (0.16 | ) | | | — | |
| | | | | | | | | | | | |
Net decrease in net asset value | | | 0.25 | | | | (0.09 | ) | | | (0.33 | ) |
| | | | | | | | | | | | |
Net Asset Value, End of Period | | $ | 9.83 | | | $ | 9.58 | | | $ | 9.67 | |
| | | | | | | | | | | | |
Total Return (c) | | | 3.44 | %(d) | | | 0.79 | % | | | (3.30 | )%(d) |
| | | |
Ratios/Supplemental Data: | | | | | | | | | | | | |
Net Assets, End of Period (in 000’s) | | $ | 3,298 | | | $ | 3,188 | | | $ | 3,307 | |
Ratios of expenses to average net assets: | | | | | | | | | | | | |
Before expense reimbursement and/or fee waiver by Adviser | | | 5.17 | %(e) | | | 5.71 | % | | | 6.99 | %(e) |
After expense reimbursement and/or fee waiver by Adviser | | | 1.18 | %(e) | | | 1.33 | % | | | 1.40 | %(e) |
Ratios of net investment income (loss) to average net assets: | | | | | | | | | | | | |
Before expense reimbursement and/or fee waiver by Adviser | | | (3.60 | )%(e) | | | (2.99 | )% | | | (3.88 | )%(e) |
After expense reimbursement and/or fee waiver by Adviser | | | 0.39 | %(e) | | | 1.40 | % | | | 1.71 | %(e) |
Portfolio Turnover | | | 31.49 | %(d) | | | 63.48 | % | | | 101.96 | %(d) |
| | (a) | The inception date for LMCG Emerging Markets Fund Class I shares is March 28, 2013. |
| | (b) | The selected per share data was calculated using the weighted average shares outstanding method for the period. |
| | (c) | The total return is calculated using the Net Asset Value used for trading at the close of business at period end. |
See accompanying Notes to Financial Statements.
| | |
| |
| ASTON/Pictet International Fund – Class N | | April 30, 2015 |
| |
| Financial Highlights | | |
| | | | | | | | |
| | | Six Months
Ended
04/30/15
(unaudited) | | | Period
Ended
10/31/14(a) | |
Net Asset Value, Beginning of Period | | $ | 9.34 | | | $ | 10.00 | |
| | | | | | | | |
Income from Investment Operations: | | | | | | | | |
Net investment income | | | 0.03 | (b) | | | 0.09 | |
Net realized and unrealized gain (loss) on investments | | | 0.64 | (c) | | | (0.75 | ) |
| | | | | | | | |
Total from investment operations | | | 0.67 | | | | (0.66 | ) |
| | | | | | | | |
Less Distributions: | | | | | | | | |
Distributions from and in excess of net investment income | | | (0.03 | ) | | | — | |
Distributions from net realized gain on investments | | | (0.02 | ) | | | — | |
| | | | | | | | |
Total distributions | | | (0.05 | ) | | | — | |
| | | | | | | | |
Net increase (decrease) in net asset value | | | 0.62 | | | | (0.66 | ) |
| | | | | | | | |
Net Asset Value, End of Period | | $ | 9.96 | | | $ | 9.34 | |
| | | | | | | | |
Total Return (d) | | | 7.33 | %(e) | | | (6.60 | )%(e) |
| | |
Ratios/Supplemental Data: | | | | | | | | |
Net Assets, End of Period (in 000’s) | | $ | 1,055 | | | $ | 984 | |
Ratios of expenses to average net assets: | | | | | | | | |
Before expense reimbursement and/or fee waiver by Adviser | | | 1.97 | %(f) | | | 3.26 | %(f) |
After expense reimbursement and/or fee waiver by Adviser | | | 1.40 | %(f) | | | 1.40 | %(f) |
Ratios of net investment income (loss) to average net assets: | | | | | | | | |
Before expense reimbursement and/or fee waiver by Adviser | | | 0.01 | %(f) | | | (0.25 | )%(f) |
After expense reimbursement and/or fee waiver by Adviser | | | 0.58 | %(f) | | | 1.61 | %(f) |
Portfolio Turnover | | | 40.86 | %(e) | | | 25.82 | %(e) |
| | (a) | The inception date for Pictet International Fund Class N shares is April 14, 2014. |
| | (b) | The selected per share data was calculated using the weighted average shares outstanding method for the period. |
| | (c) | Includes capital contribution of $0.01 per share. |
| | (d) | The total return is calculated using the Net Asset Value used for trading at the close of business at period end. |
See accompanying Notes to Financial Statements.
| | |
| |
| ASTON/Pictet International Fund – Class I | | April 30, 2015 |
| |
| Financial Highlights | | |
| | | | | | | | |
| | | Six Months
Ended
04/30/15
(unaudited) | | | Period
Ended
10/31/14(a) | |
| | | | | | | | |
Net Asset Value, Beginning of Period | | $ | 9.36 | | | $ | 10.00 | |
| | | | | | | | |
Income from Investment Operations: | | | | | | | | |
Net investment income | | | 0.04 | (b) | | | 0.10 | |
Net realized and unrealized gain (loss) on investments | | | 0.65 | (c) | | | (0.74 | ) |
| | | | | | | | |
Total from investment operations | | | 0.69 | | | | (0.64 | ) |
| | | | | | | | |
Less Distributions: | | | | | | | | |
Distributions from and in excess of net investment income | | | (0.05 | ) | | | — | |
Distributions from net realized gain on investments | | | (0.02 | ) | | | — | |
| | | | | | | | |
Total distributions | | | (0.07 | ) | | | — | |
| | | | | | | | |
Net increase (decrease) in net asset value | | | 0.62 | | | | (0.64 | ) |
| | | | | | | | |
Net Asset Value, End of Period | | $ | 9.98 | | | $ | 9.36 | |
| | | | | | | | |
Total Return (d) | | | 7.53 | %(e) | | | (6.40 | )%(e) |
| | |
Ratios/Supplemental Data: | | | | | | | | |
Net Assets, End of Period (in 000’s) | | $ | 34,135 | | | $ | 8,467 | |
Ratios of expenses to average net assets: | | | | | | | | |
Before expense reimbursement and/or fee waiver by Adviser | | | 1.72 | %(f) | | | 3.01 | %(f) |
After expense reimbursement and/or fee waiver by Adviser | | | 1.15 | %(f) | | | 1.15 | %(f) |
Ratios of net investment income (loss) to average net assets: | | | | | | | | |
Before expense reimbursement and/or fee waiver by Adviser | | | 0.26 | %(f) | | | — | %(f)(g) |
After expense reimbursement and/or fee waiver by Adviser | | | 0.83 | %(f) | | | 1.86 | %(f) |
Portfolio Turnover | | | 40.86 | %(e) | | | 25.82 | %(e) |
| | (a) | The inception date for Pictet International Fund Class I shares is April 14, 2014. |
| | (b) | The selected per share data was calculated using the weighted average shares outstanding method for the period. |
| | (c) | Includes capital contribution of $0.01 per share. |
| | (d) | The total return is calculated using the Net Asset Value used for trading at the close of business at period end. |
| | (g) | Represents less than 0.005%. |
See accompanying Notes to Financial Statements.
| | |
| |
| ASTON/TAMRO International Small Cap Fund – Class N | | April 30, 2015 |
| |
| Financial Highlights | | |
| | | | |
| | | Period
Ended
04/30/15(a)
(unaudited) | |
Net Asset Value, Beginning of Period | | $ | 10.00 | |
| | | | |
Income from Investment Operations: | | | | |
Net investment income | | | 0.04 | |
Net realized and unrealized gain on investments | | | 0.74 | |
| | | | |
Total from investment operations | | | 0.78 | |
| | | | |
Net increase in net asset value | | | 0.78 | |
| | | | |
Net Asset Value, End of Period | | $ | 10.78 | |
| | | | |
Total Return (b) | | | 7.80 | (c) |
| |
Ratios/Supplemental Data: | | | | |
Net Assets, End of Period (in 000’s) | | $ | 1,144 | |
Ratios of expenses to average net assets: | | | | |
Before expense reimbursement and/or fee waiver by Adviser | | | 13.49 | %(d) |
After expense reimbursement and/or fee waiver by Adviser | | | 1.50 | %(d) |
Ratios of net investment income (loss) to average net assets: | | | | |
Before expense reimbursement and/or fee waiver by Adviser | | | (10.96 | )%(d) |
After expense reimbursement and/or fee waiver by Adviser | | | 1.03 | %(d) |
Portfolio Turnover | | | 18.13 | %(c) |
| | (a) | The inception date for TAMRO International Small Cap Fund Class N shares is December 23, 2014. |
| | (b) | The total return is calculated using the Net Asset Value used for trading at the close of business at period end. |
See accompanying Notes to Financial Statements.
| | |
| |
| ASTON/TAMRO International Small Cap Fund – Class I | | April 30, 2015 |
| |
| Financial Highlights | | |
| | | | |
| | | Period
Ended
04/30/15(a)
(unaudited) | |
| | | | |
Net Asset Value, Beginning of Period | | $ | 10.00 | |
| | | | |
Income from Investment Operations: | | | | |
Net investment income | | | 0.05 | |
Net realized and unrealized gain on investments | | | 0.74 | |
| | | | |
Total from investment operations | | | 0.79 | |
| | | | |
Net increase in net asset value | | | 0.79 | |
| | | | |
Net Asset Value, End of Period | | $ | 10.79 | |
| | | | |
Total Return (b) | | | 7.90 | (c) |
| |
Ratios/Supplemental Data: | | | | |
Net Assets, End of Period (in 000’s) | | $ | 718 | |
Ratios of expenses to average net assets: | | | | |
Before expense reimbursement and/or fee waiver by Adviser | | | 13.24 | %(d) |
After expense reimbursement and/or fee waiver by Adviser | | | 1.25 | %(d) |
Ratios of net investment income (loss) to average net assets: | | | | |
Before expense reimbursement and/or fee waiver by Adviser | | | (10.71 | )%(d) |
After expense reimbursement and/or fee waiver by Adviser | | | 1.28 | %(d) |
Portfolio Turnover | | | 18.13 | %(c) |
| | (a) | The inception date for TAMRO International Small Cap Fund Class I shares is December 23, 2014. |
| | (b) | The total return is calculated using the Net Asset Value used for trading at the close of business at period end. |
See accompanying Notes to Financial Statements.
| | |
| |
| ASTON/Harrison Street Real Estate Fund – Class N | | April 30, 2015 |
| |
| Financial Highlights | | |
| | | | | | | | | | | | | | | | | | | | | | | | |
| | | Six Months
Ended
04/30/15
(unaudited) | | | Year
Ended
10/31/14 | | | Year
Ended
10/31/13 | | | Year
Ended
10/31/12 | | | Year
Ended
10/31/11 | | | Year
Ended
10/31/10 | |
| | | | | | | | | | | | | | | | | | | | | | | | |
Net Asset Value, Beginning of Period | | $ | 12.63 | | | $ | 11.29 | | | $ | 10.49 | | | $ | 8.97 | | | $ | 8.16 | | | $ | 5.77 | |
| | | | | | | | | | | | | | | | | | | | | | | | |
Income from Investment Operations: | | | | | | | | | | | | | | | | | | | | | | | | |
Net investment income | | | 0.10 | (a) | | | 0.10 | (a) | | | 0.17 | (a) | | | 0.15 | (a) | | | 0.15 | (a) | | | 0.14 | (a) |
Net realized and unrealized gain (loss) on investments | | | (0.17 | ) | | | 1.37 | | | | 0.79 | (b) | | | 1.44 | | | | 0.79 | | | | 2.36 | |
| | | | | | | | | | | | | | | | | | | | | | | | |
Total from investment operations | | | (0.07 | ) | | | 1.47 | | | | 0.96 | | | | 1.59 | | | | 0.94 | | | | 2.50 | |
| | | | | | | | | | | | | | | | | | | | | | | | |
Less Distributions: | | | | | | | | | | | | | | | | | | | | | | | | |
Distributions from and in excess of net investment income | | | (0.15 | ) | | | (0.13 | ) | | | (0.16 | ) | | | (0.07 | ) | | | (0.13 | ) | | | (0.11 | ) |
| | | | | | | | | | | | | | | | | | | | | | | | |
Total distributions | | | (0.15 | ) | | | (0.13 | ) | | | (0.16 | ) | | | (0.07 | ) | | | (0.13 | ) | | | (0.11 | ) |
| | | | | | | | | | | | | | | | | | | | | | | | |
Net increase (decrease) in net asset value . | | | (0.22 | ) | | | 1.34 | | | | 0.80 | | | | 1.52 | | | | 0.81 | | | | 2.39 | |
| | | | | | | | | | | | | | | | | | | | | | | | |
Net Asset Value, End of Period | | $ | 12.41 | | | $ | 12.63 | | | $ | 11.29 | | | $ | 10.49 | | | $ | 8.97 | | | $ | 8.16 | |
| | | | | | | | | | | | | | | | | | | | | | | | |
Total Return (c) | | | (0.58 | )%(d) | | | 13.19 | % | | | 9.30 | % | | | 17.85 | % | | | 11.66 | % | | | 43.77 | % |
| | | | | | |
Ratios/Supplemental Data: | | | | | | | | | | | | | | | | | | | | | | | | |
Net Assets, End of Period (in 000’s) | | $ | 12,070 | | | $ | 12,852 | | | $ | 13,093 | | | $ | 10,381 | | | $ | 6,287 | | | $ | 6,158 | |
Ratios of expenses to average net assets: | | | | | | | | | | | | | | | | | | | | | | | | |
Before expense reimbursement and/or fee waiver by Adviser | | | 2.15 | %(e) | | | 2.16 | % | | | 2.22 | % | | | 2.36 | % | | | 1.61 | %(f) | | | 1.68 | %(f) |
After expense reimbursement and/or fee waiver by Adviser | | | 1.37 | %(e) | | | 1.37 | % | | | 1.37 | % | | | 1.37 | % | | | 1.29 | %(f) | | | 1.37 | %(f) |
Ratios of net investment income to average net assets: | | | | | | | | | | | | | | | | | | | | | | | | |
Before expense reimbursement and/or fee waiver by Adviser | | | 0.79 | %(e) | | | 0.08 | % | | | 0.67 | % | | | 0.53 | % | | | 1.36 | % | | | 1.65 | % |
After expense reimbursement and/or fee waiver by Adviser | | | 1.57 | %(e) | | | 0.87 | % | | | 1.52 | % | | | 1.52 | % | | | 1.68 | % | | | 1.96 | % |
Portfolio Turnover | | | 89.43 | %(d) | | | 162.93 | % | | | 159.14 | % | | | 86.62 | %(g) | | | 143.86 | % | | | 75.30 | % |
| | (a) | The selected per share data was calculated using the weighted average shares outstanding method for the period. |
| | (b) | Includes capital contribution of less than $0.005 per share. |
| | (c) | The total return is calculated using the Net Asset Value used for trading at the close of business at period end. |
| | (f) | Ratios of expenses to average net assets include interest expense of less than 0.005% for each of the years ended October 31, 2011 and October 31, 2010, which are not included in the contractual expense limitation. The interest expense is from utilizing the line of credit as discussed in Note H to the Financial Statements. |
| | (g) | Portfolio turnover rate excludes securities delivered from processing a redemption-in-kind. |
See accompanying Notes to Financial Statements.
| | |
| |
| ASTON/Harrison Street Real Estate Fund – Class I | | April 30, 2015 |
| |
| Financial Highlights | | |
| | | | | | | | | | | | | | | | | | | | | | | | |
| | | Six Months
Ended
04/30/15
(unaudited) | | | Year
Ended
10/31/14 | | | Year
Ended
10/31/13 | | | Year
Ended
10/31/12 | | | Year
Ended
10/31/11 | | | Year
Ended
10/31/10 | |
| | | | | | | | | | | | | | | | | | | | | | | | |
Net Asset Value, Beginning of Period | | $ | 12.57 | | | $ | 11.24 | | | $ | 10.44 | | | $ | 8.92 | | | $ | 8.12 | | | $ | 5.74 | |
| | | | | | | | | | | | | | | | | | | | | | | | |
Income from Investment Operations: | | | | | | | | | | | | | | | | | | | | | | | | |
Net investment income | | | 0.12 | (a) | | | 0.13 | (a) | | | 0.20 | (a) | | | 0.15 | (a) | | | 0.16 | (a) | | | 0.16 | (a) |
Net realized and unrealized gain (loss) on investments | | | (0.16 | ) | | | 1.35 | | | | 0.79 | (b) | | | 1.46 | | | | 0.79 | | | | 2.34 | |
| | | | | | | | | | | | | | | | | | | | | | | | |
Total from investment operations | | | (0.04 | ) | | | 1.48 | | | | 0.99 | | | | 1.61 | | | | 0.95 | | | | 2.50 | |
| | | | | | | | | | | | | | | | | | | | | | | | |
Less Distributions: | | | | | | | | | | | | | | | | | | | | | | | | |
Distributions from and in excess of net investment income | | | (0.19 | ) | | | (0.15 | ) | | | (0.19 | ) | | | (0.09 | ) | | | (0.15 | ) | | | (0.12 | ) |
| | | | | | | | | | | | | | | | | | | | | | | | |
Total distributions | | | (0.19 | ) | | | (0.15 | ) | | | (0.19 | ) | | | (0.09 | ) | | | (0.15 | ) | | | (0.12 | ) |
| | | | | | | | | | | | | | | | | | | | | | | | |
Net increase (decrease) in net asset value . | | | (0.23 | ) | | | 1.33 | | | | 0.80 | | | | 1.52 | | | | 0.80 | | | | 2.38 | |
| | | | | | | | | | | | | | | | | | | | | | | | |
Net Asset Value, End of Period | | $ | 12.34 | | | $ | 12.57 | | | $ | 11.24 | | | $ | 10.44 | | | $ | 8.92 | | | $ | 8.12 | |
| | | | | | | | | | | | | | | | | | | | | | | | |
Total Return (c) | | | (0.42 | )%(d) | | | 13.45 | % | | | 9.58 | % | | | 18.16 | % | | | 11.82 | % | | | 44.14 | % |
| | | | | | |
Ratios/Supplemental Data: | | | | | | | | | | | | | | | | | | | | | | | | |
Net Assets, End of Period (in 000’s) | | $ | 739 | | | $ | 732 | | | $ | 532 | | | $ | 166 | | | $ | 32,925 | | | $ | 29,425 | |
Ratios of expenses to average net assets: | | | | | | | | | | | | | | | | | | | | | | | | |
Before expense reimbursement and/or fee waiver by Adviser | | | 1.90 | %(e) | | | 1.91 | % | | | 1.97 | % | | | 2.11 | % | | | 1.44 | %(f) | | | 1.43 | %(f) |
After expense reimbursement and/or fee waiver by Adviser | | | 1.12 | %(e) | | | 1.12 | % | | | 1.12 | % | | | 1.12 | % | | | 1.12 | %(f) | | | 1.12 | %(f) |
Ratios of net investment income to average net assets: | | | | | | | | | | | | | | | | | | | | | | | | |
Before expense reimbursement and/or fee waiver by Adviser | | | 1.04 | %(e) | | | 0.33 | % | | | 0.92 | % | | | 0.78 | % | | | 1.53 | % | | | 1.90 | % |
After expense reimbursement and/or fee waiver by Adviser | | | 1.82 | %(e) | | | 1.12 | % | | | 1.77 | % | | | 1.77 | % | | | 1.85 | % | | | 2.21 | % |
Portfolio Turnover | | | 89.43 | %(d) | | | 162.93 | % | | | 159.14 | % | | | 86.62 | %(g) | | | 143.86 | % | | | 75.30 | % |
| | (a) | The selected per share data was calculated using the weighted average shares outstanding method for the period. |
| | (b) | Includes capital contribution of less than $0.005 per share. |
| | (c) | The total return is calculated using the Net Asset Value used for trading at the close of business at period end. |
| | (f) | Ratios of expenses to average net assets include interest expense of less than 0.005% for each of the years ended October 31, 2011 and October 31, 2010, which are not included in the contractual expense limitation. The interest expense is from utilizing the line of credit as discussed in Note H to the Financial Statements. |
| | (g) | Portfolio turnover rate excludes securities delivered from processing a redemption-in-kind. |
See accompanying Notes to Financial Statements.
| | |
| |
| ASTON/Montag & Caldwell Balanced Fund – Class N | | April 30, 2015 |
| |
| Financial Highlights | | |
| | | | | | | | | | | | | | | | | | | | | | | | |
| | | Six Months
Ended
04/30/15
(unaudited) | | | Year
Ended
10/31/14 | | | Year
Ended
10/31/13 | | | Year
Ended
10/31/12 | | | Year
Ended
10/31/11 | | | Year
Ended
10/31/10 | |
| | | | | | | | | | | | | | | | | | | | | | | | |
Net Asset Value, Beginning of Period | | $ | 24.68 | | | $ | 23.81 | | | $ | 21.46 | | | $ | 20.09 | | | $ | 19.13 | | | $ | 17.73 | |
| | | | | | | | | | | | | | | | | | | | | | | | |
Income from Investment Operations: | | | | | | | | | | | | | | | | | | | | | | | | |
Net investment income | | | 0.06 | (a) | | | 0.12 | (a) | | | 0.21 | (a) | | | 0.16 | (a) | | | 0.15 | (a) | | | 0.21 | (a) |
Net realized and unrealized gain on investments | | | 0.59 | | | | 1.70 | | | | 2.43 | | | | 1.45 | | | | 1.03 | | | | 1.47 | |
| | | | | | | | | | | | | | | | | | | | | | | | |
Total from investment operations | | | 0.65 | | | | 1.82 | | | | 2.64 | | | | 1.61 | | | | 1.18 | | | | 1.68 | |
| | | | | | | | | | | | | | | | | | | | | | | | |
Less Distributions: | | | | | | | | | | | | | | | | | | | | | | | | |
Distributions from and in excess of net investment income | | | (0.10 | ) | | | (0.21 | ) | | | (0.29 | ) | | | (0.24 | ) | | | (0.22 | ) | | | (0.28 | ) |
Distributions from net realized gain on investments | | | (2.08 | ) | | | (0.74 | ) | | | — | | | | — | | | | — | | | | — | |
| | | | | | | | | | | | | | | | | | | | | | | | |
Total distributions | | | (2.18 | ) | | | (0.95 | ) | | | (0.29 | ) | | �� | (0.24 | ) | | | (0.22 | ) | | | (0.28 | ) |
| | | | | | | | | | | | | | | | | | | | | | | | |
Net increase (decrease) in net asset value. | | | (1.53 | ) | | | 0.87 | | | | 2.35 | | | | 1.37 | | | | 0.96 | | | | 1.40 | |
| | | | | | | | | | | | | | | | | | | | | | | | |
Net Asset Value, End of Period | | $ | 23.15 | | | $ | 24.68 | | | $ | 23.81 | | | $ | 21.46 | | | $ | 20.09 | | | $ | 19.13 | |
| | | | | | | | | | | | | | | | | | | | | | | | |
Total Return (b) | | | 2.67 | %(c) | | | 7.83 | % | | | 12.40 | % | | | 8.03 | % | | | 6.20 | % | | | 9.54 | % |
| | | | | | |
Ratios/Supplemental Data: | | | | | | | | | | | | | | | | | | | | | | | | |
Net Assets, End of Period (in 000’s) | | $ | 20,255 | | | $ | 20,446 | | | $ | 22,425 | | | $ | 31,536 | | | $ | 23,315 | | | $ | 29,194 | |
Ratios of expenses to average net assets: | | | | | | | | | | | | | | | | | | | | | | | | |
Before expense reimbursement and/or fee waiver by Adviser | | | 1.46 | %(d) | | | 1.43 | % | | | 1.37 | % | | | 1.42 | % | | | 1.57 | %(e) | | | 1.38 | % |
After expense reimbursement and/or fee waiver by Adviser | | | 1.20 | %(d) | | | 1.20 | % | | | 1.20 | % | | | 1.22 | % | | | 1.35 | %(e) | | | 1.13 | % |
Ratios of net investment income to average net assets: | | | | | | | | | | | | | | | | | | | | | | | | |
Before expense reimbursement and/or fee waiver by Adviser | | | 0.27 | %(d) | | | 0.26 | % | | | 0.77 | % | | | 0.57 | % | | | 0.53 | % | | | 0.89 | % |
After expense reimbursement and/or fee waiver by Adviser | | | 0.53 | %(d) | | | 0.50 | % | | | 0.94 | % | | | 0.77 | % | | | 0.76 | % | | | 1.15 | % |
Portfolio Turnover | | | 24.30 | %(c) | | | 27.43 | % | | | 34.62 | % | | | 35.48 | % | | | 40.31 | % | | | 51.68 | %(f) |
| | (a) | The selected per share data was calculated using the weighted average shares outstanding method for the period. |
| | (b) | The total return is calculated using the Net Asset Value used for trading at the close of business at period end. |
| | (e) | Ratios of expenses to average net assets include interest expense of less than 0.005% for the year ended October 31, 2011, which is not included in the voluntary expense limitation. The interest expense is from utilizing the line of credit as discussed in Note H to the Financial Statements. |
| | (f) | Portfolio turnover rate excludes securities received from a reorganization. |
See accompanying Notes to Financial Statements.
| | |
| |
| ASTON/Montag & Caldwell Balanced Fund – Class I | | April 30, 2015 |
| |
| Financial Highlights | | |
| | | | | | | | | | | | | | | | | | | | | | | | |
| | | Six Months
Ended
04/30/15
(unaudited) | | | Year
Ended
10/31/14 | | | Year
Ended
10/31/13 | | | Year
Ended
10/31/12 | | | Year
Ended
10/31/11 | | | Year
Ended
10/31/10 | |
| | | | | | | | | | | | | | | | | | | | | | | | |
Net Asset Value, Beginning of Period | | $ | 24.60 | | | $ | 23.76 | | | $ | 21.41 | | | $ | 20.05 | | | $ | 19.08 | | | $ | 17.68 | |
| | | | | | | | | | | | | | | | | | | | | | | | |
Income from Investment Operations: | | | | | | | | | | | | | | | | | | | | | | | | |
Net investment income | | | 0.07 | (a) | | | 0.14 | (a) | | | 0.23 | (a) | | | 0.19 | (a) | | | 0.20 | (a) | | | 0.22 | (a) |
Net realized and unrealized gain on investments | | | 0.59 | | | | 1.70 | | | | 2.43 | | | | 1.44 | | | | 1.04 | | | | 1.46 | |
| | | | | | | | | | | | | | | | | | | | | | | | |
Total from investment operations | | | 0.66 | | | | 1.84 | | | | 2.66 | | | | 1.63 | | | | 1.24 | | | | 1.68 | |
| | | | | | | | | | | | | | | | | | | | | | | | |
Less Distributions: | | | | | | | | | | | | | | | | | | | | | | | | |
Distributions from and in excess of net investment income | | | (0.11 | ) | | | (0.26 | ) | | | (0.31 | ) | | | (0.27 | ) | | | (0.27 | ) | | | (0.28 | ) |
Distributions from net realized gain on investments | | | (2.08 | ) | | | (0.74 | ) | | | — | | | | — | | | | — | | | | — | |
| | | | | | | | | | | | | | | | | | | | | | | | |
Total distributions | | | (2.19 | ) | | | (1.00 | ) | | | (0.31 | ) | | | (0.27 | ) | | | (0.27 | ) | | | (0.28 | ) |
| | | | | | | | | | | | | | | | | | | | | | | | |
Net increase in net asset value . | | | (1.53 | ) | | | 0.84 | | | | 2.35 | | | | 1.36 | | | | 0.97 | | | | 1.40 | |
| | | | | | | | | | | | | | | | | | | | | | | | |
Net Asset Value, End of Period | | $ | 23.07 | | | $ | 24.60 | | | $ | 23.76 | | | $ | 21.41 | | | $ | 20.05 | | | $ | 19.08 | |
| | | | | | | | | | | | | | | | | | | | | | | | |
Total Return (b) | | | 2.72 | %(c) | | | 7.92 | % | | | 12.53 | % | | | 8.14 | % | | | 6.52 | % | | | 9.57 | % |
| | | | | | |
Ratios/Supplemental Data: | | | | | | | | | | | | | | | | | | | | | | | | |
Net Assets, End of Period (in 000’s) | | $ | 1,712 | | | $ | 1,934 | | | $ | 1,839 | | | $ | 1,930 | | | $ | 1,415 | | | $ | 1,362 | |
Ratios of expenses to average net assets: | | | | | | | | | | | | | | | | | | | | | | | | |
Before expense reimbursement and/or fee waiver by Adviser | | | 1.36 | %(d) | | | 1.33 | % | | | 1.27 | % | | | 1.30 | % | | | 1.32 | %(e) | | | 1.35 | % |
After expense reimbursement and/or fee waiver by Adviser | | | 1.10 | %(d) | | | 1.10 | % | | | 1.10 | % | | | 1.10 | % | | | 1.10 | %(e) | | | 1.10 | % |
Ratios of net investment income to average net assets: | | | | | | | | | | | | | | | | | | | | | | | | |
Before expense reimbursement and/or fee waiver by Adviser | | | 0.37 | %(d) | | | 0.36 | % | | | 0.87 | % | | | 0.69 | % | | | 0.79 | % | | | 0.92 | % |
After expense reimbursement and/or fee waiver by Adviser | | | 0.63 | %(d) | | | 0.60 | % | | | 1.04 | % | | | 0.89 | % | | | 1.02 | % | | | 1.17 | % |
Portfolio Turnover | | | 24.30 | %(c) | | | 27.43 | % | | | 34.62 | % | | | 35.48 | % | | | 40.31 | % | | | 51.68 | %(f) |
| | (a) | The selected per share data was calculated using the weighted average shares outstanding method for the period. |
| | (b) | The total return is calculated using the Net Asset Value used for trading at the close of business at period end. |
| | (e) | Ratios of expenses to average net assets include interest expense of less than 0.005% for the year ended October 31, 2011, which is not included in the voluntary expense limitation. The interest expense is from utilizing the line of credit as discussed in Note H to the Financial Statements. |
| | (f) | Portfolio turnover rate excludes securities received from a reorganization. |
See accompanying Notes to Financial Statements.
| | |
| |
| | April 30, 2015 |
| |
| Notes to Financial Statements (unaudited) | | |
Note (A) Fund Organization: Aston Funds (the “Trust”) was organized as a Delaware statutory trust under a Declaration of Trust dated September 10, 1993. The Trust is registered under the Investment Company Act of 1940, as amended (the “1940 Act”) as an open-end management investment company with 27 separate portfolios (each, a “Fund” and collectively, the “Funds”) as of April 30, 2015.
Aston Asset Management, LLC (“Aston” or the “Adviser”), the investment adviser and the administrator, manages each Fund by retaining one or more subadvisers (each, a “Subadviser”) to manage each Fund’s portfolio on a subadvisory basis. The following 27 portfolios of the Trust are included in these financial statements:
|
ASTON/Cornerstone Large Cap Value Fund
(the “Cornerstone Large Cap Value Fund”) |
ASTON/Fairpointe Focused Equity Fund
(the “Fairpointe Focused Equity Fund”) |
ASTON/Herndon Large Cap Value Fund
(the “Herndon Large Cap Value Fund”) |
ASTON/Montag & Caldwell Growth Fund
(the “Montag & Caldwell Growth Fund”) |
ASTON/TAMRO Diversified Equity Fund (the “TAMRO Diversified Equity Fund”) |
ASTON/River Road Dividend All Cap Value Fund
(the “River Road Dividend All Cap Value Fund”) |
ASTON/River Road Dividend All Cap Value Fund II
(the “River Road Dividend All Cap Value Fund II”) |
| ASTON/Fairpointe Mid Cap Fund (the “Fairpointe Mid Cap Fund”) |
ASTON/Montag & Caldwell Mid Cap Growth Fund
(the “Montag & Caldwell Mid Cap Growth Fund”) |
ASTON/LMCG Small Cap Growth Fund
(the “LMCG Small Cap Growth Fund”) |
ASTON/River Road Independent Value Fund
(the “River Road Independent Value Fund”) |
ASTON/River Road Select Value Fund
(the “River Road Select Value Fund”) |
ASTON/River Road Small Cap Value Fund
(the “River Road Small Cap Value Fund”) |
| ASTON/Silvercrest Small Cap Fund (the “Silvercrest Small Cap Fund”) |
| ASTON/TAMRO Small Cap Fund (the “TAMRO Small Cap Fund”) |
ASTON/DoubleLine Core Plus Fixed Income Fund
(the “DoubleLine Core Plus Fixed Income Fund”) |
| ASTON/TCH Fixed Income Fund (the “TCH Fixed Income Fund”) |
ASTON/Anchor Capital Enhanced Equity Fund
(the “Anchor Capital Enhanced Equity Fund”) |
ASTON/Lake Partners LASSO Alternatives Fund
(the “Lake Partners LASSO Alternatives Fund”) |
| ASTON/River Road Long-Short Fund (the “River Road Long-Short Fund”) |
| ASTON/Barings International Fund (the “Barings International Fund”) |
ASTON/Guardian Capital Global Dividend Fund
(the “Guardian Capital Global Dividend Fund”) |
ASTON/LMCG Emerging Markets Fund
(the “LMCG Emerging Markets Fund”) |
|
| ASTON/Pictet International Fund (the “Pictet International Fund”) |
ASTON/TAMRO International Small Cap Fund
(the “TAMRO International Small Cap Fund”) |
ASTON/Harrison Street Real Estate Fund (the “Harrison Street Real Estate Fund”) |
ASTON/Montag & Caldwell Balanced Fund
(the “Montag & Caldwell Balanced Fund”) |
Each Fund, except Montag & Caldwell Growth Fund, is authorized to issue two classes of shares (Class N shares and Class I shares). Montag & Caldwell Growth Fund is authorized to issue three classes of shares (Class N shares, Class I shares and Class R shares). Each class of shares is substantially the same except that certain classes of shares bear class specific expenses that include distribution and services fees. River Road Dividend All Cap Value Fund and Fairpointe Mid Cap Fund are closed to new investors until further notice.
The Funds are investment companies that follow accounting and reporting guidance in Accounting Standards Codification 946, Financial Services-Investment Companies.
The investment objectives of the Funds are as follows:
| | |
Cornerstone Large Cap Value Fund Total return through long-term capital appreciation and current income. |
Fairpointe Focused Equity Fund Long-term total return through capital appreciation. |
Herndon Large Cap Value Fund Long-term capital appreciation. |
Montag & Caldwell Growth Fund Long-term capital appreciation and, secondarily, current income, by investing primarily in common stocks and convertible securities. |
TAMRO Diversified Equity Fund Long-term capital appreciation. |
River Road Dividend All Cap Value Fund High current income and, secondarily, long-term capital appreciation. |
River Road Dividend All Cap Value Fund II Long-term capital appreciation and high current income. |
Fairpointe Mid Cap Fund Long-term total return through capital appreciation by investing primarily in common and preferred stocks and convertible securities. |
Montag & Caldwell Mid Cap Growth Fund Long-term capital appreciation, and secondarily, current income, by investing primarily in common stocks and convertible securities. |
LMCG Small Cap Growth Fund Long-term capital appreciation. |
River Road Independent Value Fund Long-term total return. |
River Road Select Value Fund Long-term capital appreciation. |
River Road Small Cap Value Fund Long-term capital appreciation. |
Silvercrest Small Cap Fund Long-term capital appreciation. |
| | |
| |
| | April 30, 2015 |
| |
| Notes to Financial Statements (unaudited) – continued | | |
| | |
TAMRO Small Cap Fund Long-term capital appreciation. |
DoubleLine Core Plus Fixed Income Fund Maximize total return. |
TCH Fixed Income Fund High current income consistent with prudent risk of capital. |
Anchor Capital Enhanced Equity Fund Total return through a combination of a high level of current income and capital appreciation. |
Lake Partners LASSO Alternatives Fund Long term total return with reduced correlation to the conventional stock and bond markets. |
River Road Long-Short Fund Absolute return while minimizing volatility over a full market cycle. |
Barings International Fund Total return. |
Guardian Capital Global Dividend Fund Long-term capital appreciation and current income. |
LMCG Emerging Markets Fund Long-term capital appreciation. |
Pictet International Fund Capital appreciation. |
TAMRO International Small Cap Fund Long-term capital appreciation. |
Harrison Street Real Estate Fund Total return through a combination of growth and income. |
Montag & Caldwell Balanced Fund Long-term total return. |
Note (B) Significant Accounting Policies: The following is a summary of the significant accounting policies consistently followed by each Fund in the preparation of its financial statements. These policies are in conformity with U.S. generally accepted accounting principles (“U.S. GAAP”).
(1) Security Valuation: Equity securities, closed-end funds, exchange-traded funds, index options traded on a national securities exchange, and over-the-counter securities listed on the NASDAQ National Market System are valued at the last sale price or the NASDAQ Official Closing Price (“NOCP”), if applicable. If no last sale price or NOCP, if applicable, is reported, the mean of the last bid and asked prices may be used. Fixed income securities, except short-term investments, are valued on the basis of mean prices provided by an independent pricing service when such prices are believed by the Adviser to reflect the current market value of such securities, in accordance with guidelines adopted by the Board of Trustees of the Trust (the “Board”). The pricing service provider may employ methodologies that utilize actual market transactions, broker-dealer supplied valuations, or other techniques. Such techniques generally consider factors such as composite security prices, yields, maturities, call features, credit ratings and developments relating to specific securities, in arriving at valuations. If accurate market quotations are not available, securities are valued at fair values in accordance with guidelines adopted by the Board. Short-term investments, that is, those with maturities of 60 days or less, are valued at amortized cost, which approximates fair
market value. Repurchase agreements are valued at cost. Investments in money market funds and other mutual funds are valued at the underlying fund’s net asset value (“NAV”) at the date of valuation. Foreign equity securities are valued at the last sales price on the primary exchange where the security is traded. Under the fair valuation procedures adopted by the Board, the Funds may utilize the services of an independent pricing service to determine fair value prices for foreign equity securities held by Barings International Fund, Guardian Capital Global Dividend Fund, LMCG Emerging Markets Fund, Pictet International Fund and TAMRO International Small Cap Fund, if certain market events occur.
Certain Funds invest in securities of other investment companies, including open-end funds, closed-end funds and exchange-traded funds (“ETFs”). Open-end funds are investment companies that issue new shares continuously and redeem shares daily. Closed-end funds are investment companies that typically issue a fixed number of shares that trade on a securities exchange or over-the-counter. An ETF is an investment company. Typically, an ETF seeks to track the performance of an index by holding in its portfolio shares of all the companies, or a representative sample of the companies, that are components of a particular index; however, some ETFs are actively managed. ETFs are traded on securities exchanges based on their market values. The risks of investment in other investment companies typically reflect the risks of the types of securities in which investment companies invest. Investments in ETFs and closed-end funds are subject to the additional risk that shares of the fund may trade at a premium or discount to their NAV per share. When a Fund invests in another investment company, shareholders of the Fund bear their proportionate shares of the other investment company’s fees and expenses, including operating, registration, trustee, licensing and marketing, as well as their shares of the Fund’s fees and expenses.
Fair Value Measurements - The inputs and valuation techniques used to measure fair value of the Funds’ net assets are summarized into three levels as described in the hierarchy below:
| | |
• Level 1 – | | unadjusted quoted prices in active markets for identical assets or liabilities |
• Level 2 – | | other significant observable inputs (including quoted prices for similar securities, interest rates, prepayment speeds, credit risk, etc.) |
• Level 3 – | | significant unobservable inputs (including the Funds’ own assumptions in determining the fair value of investments) |
| | |
| |
| | April 30, 2015 |
| |
| Notes to Financial Statements (unaudited) – continued | | |
The inputs or methodology used for valuing securities are not necessarily an indication of the risk associated with investing in those securities. Transfers in and out of the levels are recognized at the market value at the end of the period. The summary of each Fund’s investments that are measured at fair value by Level within the fair value hierarchy as of April 30, 2015 is as follows:
| | | | | | | | | | | | | | | | |
Funds | | Total
Value at
04/30/15 | | | Level 1
Significant
Unobservable
Inputs | | | Level 2
Significant
Unobservable
Inputs | | | Level 3
Significant
Unobservable
Inputs | |
| | | | | | | | | | | | | | | | |
| Cornerstone Large Cap Value Fund | | | | | | | | | | | | | | | | |
| Assets | | | | | | | | | | | | | | | | |
Investments in Securities* | | $ | 151,800,142 | | | $ | 151,800,142 | | | $ | — | | | $ | — | |
| | | | | | | | | | | | | | | | |
| Fairpointe Focused Equity Fund | | | | | | | | | | | | | | | | |
| Assets | | | | | | | | | | | | | | | | |
Investments in Securities* | | $ | 6,295,932 | | | $ | 6,295,932 | | | $ | — | | | $ | — | |
| | | | | | | | | | | | | | | | |
| Herndon Large Cap Value Fund | | | | | | | | | | | | | | | | |
| Assets | | | | | | | | | | | | | | | | |
Investments in Securities* | | $ | 140,597,024 | | | $ | 140,597,024 | | | $ | — | | | $ | — | |
| | | | | | | | | | | | | | | | |
| Montag & Caldwell Growth Fund | | | | | | | | | | | | | | | | |
| Assets | | | | | | | | | | | | | | | | |
Investments in Securities* | | $ | 2,440,330,097 | | | $ | 2,440,330,097 | | | $ | — | | | $ | — | |
| | | | | | | | | | | | | | | | |
| TAMRO Diversified Equity Fund | | | | | | | | | | | | | | | | |
| Assets | | | | | | | | | | | | | | | | |
Investments in Securities* | | $ | 43,346,225 | | | $ | 43,346,225 | | | $ | — | | | $ | — | |
| | | | | | | | | | | | | | | | |
| River Road Dividend All Cap Value Fund | | | | | | | | | | | | | | | | |
| Assets | | | | | | | | | | | | | | | | |
Investments in Securities* | | $ | 991,216,451 | | | $ | 991,216,451 | | | $ | — | | | $ | — | |
| | | | | | | | | | | | | | | | |
| River Road Dividend All Cap Value Fund II | | | | | | | | | | | | | | | | |
| Assets | | | | | | | | | | | | | | | | |
Investments in Securities* | | $ | 142,638,985 | | | $ | 142,638,985 | | | $ | — | | | $ | — | |
| | | | | | | | | | | | | | | | |
| Fairpointe Mid Cap Fund | | | | | | | | | | | | | | | | |
| Assets | | | | | | | | | | | | | | | | |
Investments in Securities* | | $ | 5,736,376,605 | | | $ | 5,736,376,605 | | | $ | — | | | $ | — | |
| | | | | | | | | | | | | | | | |
| Montag & Caldwell Mid Cap Growth Fund | | | | | | | | | | | | | | | | |
| Assets | | | | | | | | | | | | | | | | |
Investments in Securities* | | $ | 10,485,911 | | | $ | 10,485,911 | | | $ | — | | | $ | — | |
| | | | | | | | | | | | | | | | |
| LMCG Small Cap Growth Fund | | | | | | | | | | | | | | | | |
| Assets | | | | | | | | | | | | | | | | |
Investment in Securities* | | $ | 117,975,295 | | | $ | 117,975,295 | | | $ | — | | | $ | — | |
| | | | | | | | | | | | | | | | |
| River Road Independent Value Fund | | | | | | | | | | | | | | | | |
| Assets | | | | | | | | | | | | | | | | |
Investments in Securities* | | $ | 456,086,033 | | | $ | 456,086,033 | | | $ | — | | | $ | — | |
| | | | | | | | | | | | | | | | |
| River Road Select Value Fund | | | | | | | | | | | | | | | | |
| Assets | | | | | | | | | | | | | | | | |
Investments in Securities* | | $ | 133,028,870 | | | $ | 133,028,870 | | | $ | — | | | $ | — | |
| | | | | | | | | | | | | | | | |
| | |
| |
| | April 30, 2015 |
| |
| Notes to Financial Statements (unaudited) – continued | | |
| | | | | | | | | | | | | | | | |
Funds | | Total
Value at
04/30/15 | | | Level 1
Significant
Unobservable
Inputs | | | Level 2
Significant
Unobservable
Inputs | | | Level 3
Significant
Unobservable
Inputs | |
| | | | | | | | | | | | | | | | |
| River Road Small Cap Value Fund | | | | | | | | | | | | | | | | |
| Assets | | | | | | | | | | | | | | | | |
Common Stocks | | | | | | | | | | | | | | | | |
Consumer Discretionary | | $ | 54,127,484 | | | $ | 50,457,382 | | | $ | 3,670,102 | | | $ | — | |
Consumer Staples | | | 7,598,022 | | | | 7,598,022 | | | | — | | | | — | |
Energy | | | 10,165,473 | | | | 10,165,473 | | | | — | | | | — | |
Financials | | | 40,913,142 | | | | 40,913,142 | | | | — | | | | — | |
Healthcare | | | 7,871,478 | | | | 7,871,478 | | | | — | | | | — | |
Industrials | | | 50,146,442 | | | | 50,146,442 | | | | — | | | | — | |
Information Technology | | | 64,660,167 | | | | 56,268,984 | | | | 8,391,183 | | | | — | |
Materials | | | 3,085,546 | | | | 3,085,546 | | | | — | | | | — | |
Telecommunication Services | | | 10,852,012 | | | | 10,852,012 | | | | — | | | | — | |
| | | | | | | | | | | | | | | | |
Total Common Stocks | | | 249,419,766 | | | | 237,358,481 | | | | 12,061,285 | | | | — | |
Investment Company* | | | 27,588,289 | | | | 27,588,289 | | | | — | | | | — | |
| | | | | | | | | | | | | | | | |
Total | | $ | 277,008,055 | | | $ | 264,946,770 | | | $ | 12,061,285 | | | $ | — | |
| | | | | | | | | | | | | | | | |
| Silvercrest Small Cap Fund | | | | | | | | | | | | | | | | |
| Assets | | | | | | | | | | | | | | | | |
Investments in Securities* | | $ | 112,961,745 | | | $ | 112,961,745 | | | $ | — | | | $ | — | |
| | | | | | | | | | | | | | | | |
| TAMRO Small Cap Fund | | | | | | | | | | | | | | | | |
| Assets | | | | | | | | | | | | | | | | |
Common Stocks | | | | | | | | | | | | | | | | |
Consumer Discretionary | | $ | 147,941,186 | | | $ | 147,941,186 | | | $ | — | | | $ | — | |
Consumer Staples | | | 55,294,024 | | | | 49,497,480 | | | | 5,796,544 | | | | — | |
Financials | | | 123,213,669 | | | | 123,213,669 | | | | — | | | | — | |
Healthcare | | | 96,790,967 | | | | 96,790,967 | | | | — | | | | — | |
Industrials | | | 123,262,325 | | | | 123,262,325 | | | | — | | | | — | |
Information Technology | | | 132,312,875 | | | | 132,312,875 | | | | — | | | | — | |
Materials | | | 11,321,934 | | | | 11,321,934 | | | | — | | | | — | |
| | | | | | | | | | | | | | | | |
Total Common Stocks | | | 690,136,980 | | | | 684,340,436 | | | | 5,796,544 | | | | — | |
Investment Company* | | | 10,749,406 | | | | 10,749,406 | | | | — | | | | — | |
| | | | | | | | | | | | | | | | |
Total | | $ | 700,886,386 | | | $ | 695,089,842 | | | $ | 5,796,544 | | | $ | — | |
| | | | | | | | | | | | | | | | |
| DoubleLine Core Plus Fixed Income Fund | | | | | | | | | | | | | | | | |
| Assets | | | | | | | | | | | | | | | | |
Corporate Notes and Bonds | | $ | 122,588,689 | | | $ | — | | | $ | 122,588,689 | | | $ | — | |
Collateralized Mortgage and Asset-Backed Securities | | | 65,735,765 | | | | — | | | | 65,735,765 | | | | — | |
U.S. Government and Agency Obligations | | | 113,513,970 | | | | — | | | | 113,513,970 | | | | — | |
Other Mortgage and Asset-Backed Securities | | | 20,721,098 | | | | — | | | | 19,971,098 | | | | 750,000 | |
Municipal Bonds | | | 11,588,292 | | | | — | | | | 11,588,292 | | | | — | |
Foreign Government Bonds | | | 2,106,028 | | | | — | | | | 2,106,028 | | | | — | |
Investment Companies* | | | 26,947,437 | | | | 26,947,437 | | | | — | | | | — | |
| | | | | | | | | | | | | | | | |
Total | | $ | 363,201,279 | | | $ | 26,947,437 | | | $ | 335,503,842 | | | $ | 750,000 | |
| | | | | | | | | | | | | | | | |
| TCH Fixed Income Fund | | | | | | | | | | | | | | | | |
| Assets | | | | | | | | | | | | | | | | |
Corporate Notes and Bonds | | $ | 26,837,427 | | | $ | — | | | $ | 26,837,427 | | | $ | — | |
U.S. Government and Agency Obligations | | | 25,012,429 | | | | — | | | | 25,012,429 | | | | — | |
Commercial Mortgage-Backed Security | | | 298,611 | | | | — | | | | 298,611 | | | | — | |
Foreign Government Bond | | | 521,250 | | | | — | | | | 521,250 | | | | — | |
Investment Company* | | | 2,399,114 | | | | 2,399,114 | | | | — | | | | — | |
| | | | | | | | | | | | | | | | |
Total | | $ | 55,068,831 | | | $ | 2,399,114 | | | $ | 52,669,717 | | | $ | — | |
| | | | | | | | | | | | | | | | |
| Anchor Capital Enhanced Equity Fund | | | | | | | | | | | | | | | | |
| Assets | | | | | | | | | | | | | | | | |
Common Stocks* | | $ | 207,420,086 | | | $ | 207,420,086 | | | $ | — | | | $ | — | |
Purchased Options | | | 559,400 | | | | 559,400 | | | | — | | | | — | |
Investment Company* | | | 6,576,623 | | | | 6,576,623 | | | | — | | | | — | |
| | | | | | | | | | | | | | | | |
Total Assets | | | 214,556,109 | | | | 214,556,109 | | | | — | | | | — | |
| | | | | | | | | | | | | | | | |
| | |
| |
| | April 30, 2015 |
| |
| Notes to Financial Statements (unaudited) – continued | | |
| | | | | | | | | | | | | | | | |
Funds | | Total
Value at
04/30/15 | | | Level 1
Significant
Unobservable
Inputs | | | Level 2
Significant
Unobservable
Inputs | | | Level 3
Significant
Unobservable
Inputs | |
| | | | | | | | | | | | | | | | |
| Anchor Capital Enhanced Equity Fund (continued) | | | | | | | | | | | | | | | | |
| Liabilities | | | | | | | | | | | | | | | | |
Written Options | | $ | (6,812,124 | ) | | $ | (6,812,124 | ) | | $ | — | | | $ | — | |
| | | | | | | | | | | | | | | | |
Total Liabilities | | | (6,812,124 | ) | | | (6,812,124 | ) | | | — | | | | — | |
| | | | | | | | | | | | | | | | |
Total | | $ | 207,743,985 | | | $ | 207,743,985 | | | $ | — | | | $ | — | |
| | | | | | | | | | | | | | | | |
| Lake Partners LASSO Alternative Fund | | | | | | | | | | | | | | | | |
| Assets | | | | | | | | | | | | | | | | |
Investments in Securities* | | $ | 325,262,713 | | | $ | 325,262,713 | | | $ | — | | | $ | — | |
| | | | | | | | | | | | | | | | |
| River Road Long-Short Fund | | | | | | | | | | | | | | | | |
| Assets | | | | | | | | | | | | | | | | |
Investments in Securities* | | $ | 208,564,750 | | | $ | 208,564,750 | | | $ | — | | | $ | — | |
| | | | | | | | | | | | | | | | |
Total Assets | | | 208,564,750 | | | | 208,564,750 | | | | — | | | | — | |
| | | | | | | | | | | | | | | | |
| Liabilities | | | | | | | | | | | | | | | | |
Common Stock Sold Short* | | | (52,451,840 | ) | | | (52,451,840 | ) | | | — | | | | — | |
Exchange Traded Funds Sold Short | | | (1,377,327 | ) | | | (1,377,327 | ) | | | — | | | | — | |
| | | | | | | | | | | | | | | | |
Total Liabilities | | | (53,829,167 | ) | | | (53,829,167 | ) | | | — | | | | — | |
| | | | | | | | | | | | | | | | |
Total | | $ | 154,735,583 | | | $ | 154,735,583 | | | $ | — | | | $ | — | |
| | | | | | | | | | | | | | | | |
| Barings International Fund | | | | | | | | | | | | | | | | |
| Assets | | | | | | | | | | | | | | | | |
Common Stocks | | | | | | | | | | | | | | | | |
Australia | | $ | 391,702 | | | $ | — | | | $ | 391,702 | | | $ | — | |
Bermuda | | | 251,334 | | | | — | | | | 251,334 | | | | — | |
France | | | 1,769,674 | | | | — | | | | 1,769,674 | | | | — | |
Germany | | | 2,347,806 | | | | — | | | | 2,347,806 | | | | — | |
Hong Kong | | | 551,448 | | | | — | | | | 551,448 | | | | — | |
India | | | 325,135 | | | | 325,135 | | | | — | | | | — | |
Japan | | | 5,794,457 | | | | — | | | | 5,794,457 | | | | — | |
Netherlands | | | 1,518,437 | | | | — | | | | 1,518,437 | | | | — | |
Papua New Guinea | | | 178,992 | | | | — | | | | 178,992 | | | | — | |
Singapore | | | 262,191 | | | | — | | | | 262,191 | | | | — | |
Sweden | | | 323,195 | | | | — | | | | 323,195 | | | | — | |
Switzerland | | | 1,927,768 | | | | — | | | | 1,927,768 | | | | — | |
Taiwan | | | 351,936 | | | | 351,936 | | | | — | | | | — | |
United Kingdom | | | 5,095,551 | | | | 241,977 | | | | 4,853,574 | | | | — | |
| | | | | | | | | | | | | | | | |
Total Common Stocks | | | 21,089,626 | | | | 919,048 | | | | 20,170,578 | | | | — | |
Investment Company* | | | 163,588 | | | | 163,588 | | | | — | | | | — | |
| | | | | | | | | | | | | | | | |
Total | | $ | 21,253,214 | | | $ | 1,082,636 | | | $ | 20,170,578 | | | $ | — | |
| | | | | | | | | | | | | | | | |
| Guardian Capital Global Dividend Fund | | | | | | | | | | | | | | | | |
| Assets | | | | | | | | | | | | | | | | |
Common Stocks | | | | | | | | | | | | | | | | |
Australia | | $ | 205,997 | | | $ | — | | | $ | 205,997 | | | $ | — | |
Belgium | | | 157,440 | | | | 79,226 | | | | 78,214 | | | | — | |
Canada | | | 119,727 | | | | 119,727 | | | | — | | | | — | |
France | | | 144,686 | | | | — | | | | 144,686 | | | | — | |
Germany | | | 249,133 | | | | — | | | | 249,133 | | | | — | |
Ireland | | | 127,749 | | | | 127,749 | | | | — | | | | — | |
Israel | | | 45,315 | | | | 45,315 | | | | — | | | | — | |
Italy | | | 23,023 | | | | — | | | | 23,023 | | | | — | |
Netherlands | | | 60,437 | | | | 60,437 | | | | — | | | | — | |
Spain | | | 121,713 | | | | — | | | | 121,713 | | | | — | |
Sweden | | | 69,351 | | | | — | | | | 69,351 | | | | — | |
Switzerland | | | 311,492 | | | | 115,007 | | | | 196,485 | | | | — | |
United Kingdom | | | 489,383 | | | | 146,970 | | | | 342,413 | | | | — | |
United States | | | 2,322,032 | | | | 2,322,032 | | | | — | | | | — | |
| | | | | | | | | | | | | | | | |
Total Common Stocks | | | 4,447,478 | | | | 3,016,463 | | | | 1,431,015 | | | | — | |
Investment Company* | | | 21,815 | | | | 21,815 | | | | — | | | | — | |
| | | | | | | | | | | | | | | | |
Total | | $ | 4,469,293 | | | $ | 3,038,278 | | | $ | 1,431,015 | | | $ | — | |
| | | | | | | | | | | | | | | | |
| | |
| |
| | April 30, 2015 |
| |
| Notes to Financial Statements (unaudited) – continued | | |
| | | | | | | | | | | | | | | | |
Funds | | Total
Value at
04/30/15 | | | Level 1
Significant
Unobservable
Inputs | | | Level 2
Significant
Unobservable
Inputs | | | Level 3
Significant
Unobservable
Inputs | |
| | | | | | | | | | | | | | | | |
| LMCG Emerging Markets Fund | | | | | | | | | | | | | | | | |
| Assets | | | | | | | | | | | | | | | | |
Common Stocks | | | | | | | | | | | | | | | | |
Brazil | | $ | 390,264 | | | $ | 390,264 | | | $ | — | | | $ | — | |
China | | | 755,693 | | | | — | | | | 755,693 | | | | — | |
Egypt | | | 30,370 | | | | 30,370 | | | | — | | | | — | |
Hong Kong | | | 174,596 | | | | — | | | | 174,596 | | | | — | |
India | | | 155,364 | | | | 155,364 | | | | — | | | | — | |
Indonesia | | | 123,506 | | | | — | | | | 123,506 | | | | — | |
Malaysia | | | 65,550 | | | | — | | | | 65,550 | | | | — | |
Mexico | | | 178,050 | | | | 178,050 | | | | — | | | | — | |
Philippines | | | 51,776 | | | | — | | | | 51,776 | | | | — | |
Poland | | | 60,138 | | | | — | | | | 60,138 | | | | — | |
Russia | | | 115,348 | | | | 115,348 | | | | — | | | | — | |
South Africa | | | 313,005 | | | | 62,307 | | | | 250,698 | | | | — | |
South Korea | | | 634,643 | | | | 29,251 | | | | 605,392 | | | | — | |
Taiwan | | | 559,295 | | | | 26,611 | | | | 532,684 | | | | — | |
Thailand | | | 58,607 | | | | — | | | | 58,607 | | | | — | |
Turkey | | | 114,069 | | | | — | | | | 114,069 | | | | — | |
| | | | | | | | | | | | | | | | |
Total Common Stocks | | | 3,780,274 | | | | 987,565 | | | | 2,792,709 | | | | — | |
Exchange Traded Funds | | | 169,502 | | | | 169,502 | | | | — | | | | — | |
Investment Company* | | | 82,488 | | | | 82,488 | | | | — | | | | — | |
| | | | | | | | | | | | | | | | |
Total | | $ | 4,032,264 | | | $ | 1,239,555 | | | $ | 2,792,709 | | | $ | — | |
| | | | | | | | | | | | | | | | |
| ASTON/Pictet International Fund | | | | | | | | | | | | | | | | |
| Assets | | | | | | | | | | | | | | | | |
Common Stocks | | | | | | | | | | | | | | | | |
Australia | | $ | 1,151,068 | | | $ | 333,141 | | | $ | 817,927 | | | $ | — | |
Austria | | | 383,695 | | | | — | | | | 383,695 | | | | — | |
Belgium | | | 519,528 | | | | — | | | | 519,528 | | | | — | |
Bermuda | | | 568,403 | | | | 568,403 | | | | — | | | | — | |
Cayman Islands | | | 452,284 | | | | — | | | | 452,284 | | | | — | |
Denmark | | | 1,182,987 | | | | — | | | | 1,182,987 | | | | — | |
Finland | | | 696,903 | | | | — | | | | 696,903 | | | | — | |
France | | | 3,232,641 | | | | 499,241 | | | | 2,733,400 | | | | — | |
Germany | | | 581,632 | | | | — | | | | 581,632 | | | | — | |
Hong Kong | | | 1,588,211 | | | | 1,060,880 | | | | 527,331 | | | | — | |
Italy | | | 2,129,723 | | | | 295,771 | | | | 1,833,952 | | | | — | |
Japan | | | 6,900,048 | | | | — | | | | 6,900,048 | | | | — | |
Luxembourg | | | 435,178 | | | | — | | | | 435,178 | | | | — | |
Malaysia | | | 180,670 | | | | — | | | | 180,670 | | | | — | |
Netherlands | | | 1,154,022 | | | | — | | | | 1,154,022 | | | | — | |
New Zealand | | | 279,785 | | | | — | | | | 279,785 | | | | — | |
Papua New Guinea | | | 223,834 | | | | — | | | | 223,834 | | | | — | |
Philippines | | | 160,710 | | | | — | | | | 160,710 | | | | — | |
Portugal | | | 528,396 | | | | — | | | | 528,396 | | | | — | |
South Korea | | | 951,818 | | | | — | | | | 951,818 | | | | — | |
Spain | | | 1,700,301 | | | | 784,838 | | | | 846,289 | | | | 69,174 | |
Sweden | | | 579,082 | | | | — | | | | 579,082 | | | | — | |
Switzerland | | | 2,507,212 | | | | 525,214 | | | | 1,981,998 | | | | — | |
United Kingdom | | | 5,829,289 | | | | 246,815 | | | | 5,582,474 | | | | — | |
| | | | | | | | | | | | | | | | |
Total Common Stocks | | | 33,917,420 | | | | 4,314,303 | | | | 29,533,943 | | | | 69,174 | |
Preferred Stock | | | 490,547 | | | | — | | | | 490,547 | | | | — | |
Investment Company* | | | 233,688 | | | | 233,688 | | | | — | | | | — | |
| | | | | | | | | | | | | | | | |
Total | | $ | 34,641,655 | | | $ | 4,547,991 | | | $ | 30,024,490 | | | $ | 69,174 | |
| | | | | | | | | | | | | | | | |
| | |
| |
| | April 30, 2015 |
| |
| Notes to Financial Statements (unaudited) – continued | | |
| | | | | | | | | | | | | | | | |
Funds | | Total
Value at
04/30/15 | | | Level 1
Significant
Unobservable
Inputs | | | Level 2
Significant
Unobservable
Inputs | | | Level 3
Significant
Unobservable
Inputs | |
| | | | | | | | | | | | | | | | |
| TAMRO International Small Cap Fund | | | | | | | | | | | | | | | | |
| Assets | | | | | | | | | | | | | | | | |
Common Stocks | | | | | | | | | | | | | | | | |
Australia | | $ | 119,243 | | | $ | — | | | $ | 119,243 | | | $ | — | |
Bermuda | | | 79,903 | | | | 79,903 | | | | — | | | | — | |
Canada | | | 109,251 | | | | 109,251 | | | | — | | | | — | |
Cayman Islands | | | 102,457 | | | | — | | | | 102,457 | | | | — | |
France | | | 152,185 | | | | 62,936 | | | | 89,249 | | | | — | |
Germany | | | 70,064 | | | | — | | | | 70,064 | | | | — | |
Hong Kong | | | 53,499 | | | | — | | | | 53,499 | | | | — | |
Italy | | | 115,854 | | | | — | | | | 115,854 | | | | — | |
Japan | | | 408,767 | | | | — | | | | 408,767 | | | | — | |
Mexico | | | 29,740 | | | | 29,740 | | | | — | | | | — | |
Norway | | | 34,918 | | | | — | | | | 34,918 | | | | — | |
Panama | | | 32,723 | | | | 32,723 | | | | — | | | | — | |
Singapore | | | 61,790 | | | | 61,790 | | | | — | | | | — | |
Switzerland | | | 70,866 | | | | — | | | | 70,866 | | | | — | |
United Kingdom | | | 301,881 | | | | 86,246 | | | | 215,635 | | | | — | |
Virgin Islands (British) | | | 42,600 | | | | 42,600 | | | | — | | | | — | |
| | | | | | | | | | | | | | | | |
Total Common Stocks | | | 1,785,741 | | | | 505,189 | | | | 1,280,552 | | | | — | |
Preferred Stock | | | 27,681 | | | | — | | | | 27,681 | | | | — | |
Investment Company* | | | 73,673 | | | | 73,673 | | | | — | | | | — | |
| | | | | | | | | | | | | | | | |
Total | | $ | 1,887,095 | | | $ | 578,862 | | | $ | 1,308,233 | | | $ | — | |
| | | | | | | | | | | | | | | | |
| Harrison Street Real Estate Fund | | | | | | | | | | | | | | | | |
| Assets | | | | | | | | | | | | | | | | |
Investments in Securities* | | $ | 12,838,339 | | | $ | 12,838,339 | | | $ | — | | | $ | — | |
| | | | | | | | | | | | | | | | |
| Montag & Caldwell Balanced Fund | | | | | | | | | | | | | | | | |
| Assets | | | | | | | | | | | | | | | | |
Common Stocks* | | $ | 13,070,405 | | | $ | 13,070,405 | | | $ | — | | | $ | — | |
Corporate Notes and Bonds | | | 4,968,839 | | | | — | | | | 4,968,839 | | | | — | |
U.S. Government and Agency Obligations | | | 2,973,123 | | | | — | | | | 2,973,123 | | | | — | |
Investment Company* | | | 706,153 | | | | 706,153 | | | | — | | | | — | |
| | | | | | | | | | | | | | | | |
Total | | $ | 21,718,520 | | | $ | 13,776,558 | | | $ | 7,941,962 | | | $ | — | |
| | | | | | | | | | | | | | | | |
| * | | All Common Stocks and Investment Companies are Level 1. Please refer to the Schedule of Investments for industry, sector or country breakout. |
At the end of each fiscal quarter, management evaluates the Level 2 and 3 assets and liabilities for changes in liquidity, including but not limited to: whether a broker is willing to execute at a quoted price, the depth and consistency of prices from third party services, and the existence of contemporaneous, observable trades in the market. Additionally, management evaluates the Level 1 and 2 assets and liabilities on a quarterly basis for changes in listings or delistings on national exchanges. Due to the inherent uncertainty of determining the fair values of investments that do not have readily available market values, the fair values of the Funds’ investments may fluctuate from period to period. Additionally, the fair values of investments may differ significantly from the values that would have been used had a ready market existed for such investments and may differ materially from the values the Funds may ultimately realize upon the disposition of such investments. Further, such investments may be subject to legal and other restrictions on resale or they may be otherwise less liquid than publicly-traded securities.
Barings International Fund, Guardian Capital Global Dividend Fund, LMCG Emerging Markets Fund, Pictet International Fund
and TAMRO International Small Cap Fund may utilize an external pricing service to fair value certain foreign securities if certain market events occur. Such fair valuations are categorized as Level 2 in the hierarchy. Because such market events were deemed to have occurred at April 30, 2015, Barings International Fund, Guardian Capital Global Dividend Fund, LMCG Emerging Markets Fund, Pictet International Fund and TAMRO International Small Cap Fund utilized the external pricing service adjustments. As a result, Pictet International Fund owned certain securities during the year ended October 31, 2014 that were still owned as of April 30, 2015 and were transferred from Level 1 to Level 2.
Certain securities that were held at April 30, 2015 and since the beginning of the fiscal year in River Road Dividend All Cap Value Fund, River Road Independent Value Fund, River Road Small Cap Value Fund, LMCG Emerging Markets Fund and Pictet International Fund had changes in liquidity assessments which resulted in a transfer between levels. Transfers between Levels, if any, are recognized as of the last day of the fiscal quarter in which the event or change in circumstances that resulted in reclassification occurred.
| | |
| |
| | April 30, 2015 |
| |
| Notes to Financial Statements (unaudited) – continued | | |
| | | | | | | | |
Funds | | Transfer from
Level 1 to Level 2 | | | Transfer from
level 2 to Level 1 | |
| River Road Dividend All Cap Value Fund | | $ | — | | | $ | 5,991,971 | |
| River Road Independent Value | | | — | | | | 16,830,781 | |
| River Road Small Cap Value | | | — | | | | 7,445,457 | |
| LMCG Emerging Markets Fund | | | — | | | | 103,868 | |
| Pictet International Fund | | | 353,412 | | | | 1,417,199 | |
Level 3 holdings were valued using internal valuation techniques that took into consideration factors including previous experience with similar securities of the same issuer, conversion ratio, purchase price and security terms.
The following is a reconciliation of Level 3 holdings for which significant unobservable inputs and Adviser assumptions were used in determining fair value as of April 30, 2015:
| | | | | | | | | | | | |
| DoubleLine Core Plus Fixed Income Fund | | | Total | | |
| Corporate
Bonds |
| |
| Asset-
Backed |
|
Fair Value, beginning of period | | $ | 640,628 | | | $ | 154,500 | | | $ | 486,128 | |
Purchases | | | 750,000 | | | | — | | | | 750,000 | |
Transfer out | | | (634,937 | ) | | | (154,730 | ) | | | (480,207 | ) |
Change in unrealized appreciation (depreciation) | | | (5,691 | ) | | | 230 | | | | (5,921 | ) |
| | | | | | | | | | | | |
Fair value, end of period | | $ | 750,000 | | | $ | — | | | $ | 750,000 | |
| | | | | | | | | | | | |
Change in net unrealized appreciation (depreciation) on Level 3 holdings held at end of period | | $ | — | | | $ | — | | | $ | — | |
| | | | | | | | | | | | |
| | | | |
| Pictet International Fund | | | Common Stocks | |
| | | | |
Fair Value, beginning of period | | $ | — | |
Purchases | | | 52,749 | |
Change in unrealized appreciation (depreciation) | | | 16,425 | |
| | | | |
Fair value, end of period | | $ | 69,174 | |
| | | | |
Change in net unrealized appreciation (depreciation) on Level 3 holdings held at end of period | | $ | 16,425 | |
| | | | |
(2) Repurchase Agreements: Each Fund may enter into repurchase agreements with financial institutions deemed to be creditworthy by the Fund’s Adviser or Subadviser, subject to the seller’s agreement to repurchase and the Fund’s agreement to sell such securities at a mutually agreed upon price. Securities purchased subject to repurchase agreements are deposited with the Fund’s custodian and, pursuant to the terms of the repurchase agreement, must have an aggregate market value greater than or equal to the repurchase price plus accrued interest at all times. If the value of the underlying securities falls below the value of the repurchase price plus accrued interest, the Fund will require the seller to deposit additional collateral by the next business day. If the request for additional collateral is not met, or the seller defaults on its repurchase obligation, the Fund has the right to sell the underlying securities at market value and may claim any resulting loss against the seller. During the six months ended April 30, 2015, the Funds did not hold any repurchase agreements.
(3) When Issued/Delayed Delivery Securities: Each Fund may purchase and sell securities on a “when issued” or “delayed delivery” basis, with settlement to occur at a later date. The value of any security so purchased is subject to market fluctua-
tions during the applicable period. The Funds segregate assets having an aggregate value at least equal to the amount of when issued or delayed delivery purchase commitments until payment is made. During the six months ended April 30, 2015, DoubleLine Core Plus Fixed Income Fund owned delayed delivery securities.
(4) Mortgage-Backed Securities: Montag & Caldwell Balanced Fund, DoubleLine Core Plus Fixed Income Fund and TCH Fixed Income Fund may invest in mortgage-backed securities (“MBS”). These securities represent interests in pools of mortgage loans and they provide shareholders with payments consisting of both principal and interest as the mortgages in the underlying mortgage pools are paid. The timely payment of principal and interest on MBS issued or guaranteed by Ginnie Mae (formerly known as the Government National Mortgage Association) is backed by Ginnie Mae and the full faith and credit of the U.S. government. MBS issued by U.S. government agencies or instrumentalities other than Ginnie Mae are not “full faith and credit” obligations. Certain obligations, such as those issued by the Federal Home Loan Banks, Fannie Mae (formerly known as the Federal National Mortgage Association) and Freddie Mac (formerly known as the Federal Home Loan Mortgage Corporation) are supported only by the credit of the issuer. MBS issued by private issuers are not government securities and are not directly guaranteed by any government agency. They are secured by the underlying collateral of the private issuer. Yields on privately issued MBS tend to be higher than those of government-backed issues. However, risk of loss due to default and sensitivity to interest rate fluctuations are also higher. Montag & Caldwell Balanced Fund, DoubleLine Core Plus Fixed Income Fund and TCH Fixed Income Fund may also invest in collateralized mortgage obligations (“CMOs”), collateralized loan obligations (“CLOs”) and real estate mortgage investment conduits (“REMICs”). A CMO and/or REMIC is a bond that is collateralized by a pool of MBS. A CLO is a bond that is collateralized by a financial institution’s receivables from loans. These MBS pools are divided into classes with each class having its own characteristics. The different classes are retired in sequence as the underlying mortgages are repaid.
(5) Securities Sold Short: River Road Long-Short Fund utilizes short sales as part of its overall portfolio management strategy. A short sale involves the sale of a security that is borrowed from a broker or other institution. A gain, limited to the price at which the Fund sold the security short, or a loss, unlimited in size, will be recognized upon closing a short sale. Short sales expose the Fund to the risk that it will be required to acquire, convert or exchange securities to replace the borrowed securities at a time when the securities sold short have appreciated in value, thus resulting in a loss to the Fund. The Fund making a short sale must segregate liquid assets, or otherwise cover its position in a permissible manner. The Subadviser determines the liquidity of assets, in accordance with procedures established by the Board. Cash segregated as collateral for short sales is shown in the Statement of Assets and Liabilities as segregated cash. Security positions segregated as collateral for short sales are included in the Total Investments on the Statement of Assets and Liabilities.
| | |
| |
| | April 30, 2015 |
| |
| Notes to Financial Statements (unaudited) – continued | | |
(6) Options Contracts: In the normal course of pursuing its investment objectives, certain Funds are subject to price volatility risk. Certain Funds may write and/or purchase call and put options on securities for hedging purposes, to seek capital appreciation, to mitigate risk and/or to increase exposure. Writing put options or purchasing call options tends to increase a Fund’s exposure to the underlying instrument. Writing call options or purchasing put options tends to decrease a Fund’s exposure to the underlying instrument. When a Fund writes or purchases a call or put option, an amount equal to the premium received or paid by the Fund is included in a Fund’s Statement of Assets and Liabilities as a liability or an investment and subsequently adjusted to the current market value based on the quoted daily settlement price of the option written or purchased. Premiums received or paid from writing or purchasing options that expire unexercised are treated by the Fund on the expiration date as realized gains or losses. The difference between the premium and the amount paid or received on a closing purchase or sale transaction, including brokerage commissions, is also treated as a realized gain or loss. If an option is exercised, the premium paid or received is added to the cost of the purchase or proceeds from the sale in determining whether the Fund has realized a gain or loss on investment transactions. If the Fund writes a covered call option, the Fund forgoes, in exchange for the premium, the opportunity to profit during the option period from an increase in the market value of the underlying security above the exercise price. If the Fund writes a put option, it accepts the risk of a decline in the market value of the underlying security below the exercise price. There is the risk a Fund may not be able to enter into a closing transaction because of an illiquid market. The risk associated with purchasing put and call options is limited to the premium paid. Options were traded during the period in Anchor Capital Enhanced Equity Fund. See the Schedule of Investments for open options contracts held by Anchor Capital Enhanced Equity Fund at April 30, 2015. During the six months ended April 30, 2015, the average* volume of derivative activities were as follows:
| | | | | | | | |
Funds | | Purchased
Options
(Premiums Paid) | | | Written
Options
(Premiums Received) | |
| Anchor Capital Enhanced Equity Fund | | $ | 2,196,587 | | | $ | 5,734,479 | |
| * | estimated based on quarter end holdings |
(7) Forward Foreign Currency Contracts: In the normal course of pursuing their investment objectives, certain Funds are subject to foreign investment and currency risk. Certain Funds may enter into forward foreign currency contracts (“forward contracts”) for purposes of hedging, duration management, as a substitute for securities, to increase returns, for currency hedging or risk management, or to otherwise help achieve a Fund’s investment goal. These contracts are marked-to-market daily at the applicable exchange rates. A Fund records realized gains or losses at the time the forward contract is closed. A forward contract is extinguished through a closing transaction or upon delivery of the currency or entering an offsetting contract. Risks may arise upon entering these contracts from the potential inability of a counterparty to meet the terms of its contracts and from unanticipated movements in the value of a foreign currency relative to the U.S. dollar or other currencies. During the six months ended April 30, 2015, the Funds did not enter into any forward foreign currency contracts.
(8) Disclosures about Derivative Instruments: The following is a table summarizing the fair value of derivatives held at April 30, 2015, by primary risk exposure:
| | | | | | | | |
| | | Asset Derivative
Investments Value | | | Liability Derivative
Investments Value | |
| | | Equity
Contracts | | | Equity
Contracts | |
| Anchor Capital Enhanced Equity Fund | | $ | 559,400 | | | $ | (6,812,129 | ) |
The effect of derivative instruments on the Statement of Operations for the six months ended April 30, 2015:
| | | | | | | | |
| | | Amount of
Realized Gain (Loss)
on Derivatives
Investments Value | | | Change in Unrealized
Appreciation
(Depreciation)
on Derivatives
Investments Value | |
| | | Equity
Contracts(a) | | | Equity
Contracts(b) | |
| Anchor Capital Enhanced Equity Fund | | $ | (10,962,917 | ) | | $ | 1,938,291 | |
| (a) | Statement of Operations location: Net realized loss on purchased options and net realized loss on written options. |
| (b) | Statement of Operations location: Net change in unrealized appreciation (depreciation) on purchased options and net change in unrealized appreciation (depreciation) on written options. |
(9) Investment Income and Securities Transactions: Dividend income is recorded on the ex-dividend date, except for certain dividends from foreign securities where the ex-dividend date may have passed, which are recorded as soon as a Fund is informed of the ex-dividend date. Interest income is accrued daily. Dividend income and interest income are recorded in the Statement of Operations as investment income. Premiums and discounts are amortized or accreted on an effective yield method on fixed income securities. The Funds may be subject to foreign taxes on income, gains on investments, securities transactions or currency repatriation, some of which may be recoverable in part. The Funds will accrue such taxes and reclaims as applicable, based upon their current interpretation of tax rules and regulations that exist in the markets in which the Funds invest. Transactions in securities are accounted for on a trade date basis. The cost of securities sold is determined using the identified cost method.
(10) Foreign Currency: Foreign currencies, investments and other assets and liabilities are translated into U.S. dollars at the exchange rates at the close of the regular trading session on the New York Stock Exchange. Fluctuations in the value of the foreign currencies and other assets and liabilities resulting from changes in exchange rates are recorded as unrealized foreign currency gains (losses). Realized gains (losses) and unrealized appreciation (depreciation) on investment securities and income and expenses are translated on the respective dates of such transactions. The effects of changes in foreign currency exchange rates on investments in securities are segregated from the effects of changes in market prices of those securities, and are included with the net realized and net change in unrealized gain or loss on investment securities on the Statement of Operations.
| | |
| |
| | April 30, 2015 |
| |
| Notes to Financial Statements (unaudited) – continued | | |
(11) Federal Income Taxes: The Funds have elected to be treated as “regulated investment companies” under Subchapter M of the Internal Revenue Code of 1986, as amended, and to distribute substantially all of their respective net taxable income. Accordingly, no provisions for federal income taxes have
been made in the accompanying financial statements. The Funds intend to utilize provisions of the federal income tax laws, which allow them to carry a realized capital loss forward for eight years following the year of the loss and offset such losses against any future realized capital gains.
At October 31, 2014, the following Funds had available realized capital loss carryforwards to offset future net capital gains through the fiscal year ended:
| | | | | | | | | | | | | | | | | | | | | | | | | | | | |
| | | Capital Loss Carryforwards: | |
Fund | | 2016 | | | 2017 | | | 2018 | | | 2019 | | | No Expiration
Short Term* | | | No Expiration
Long Term* | | | Total | |
| Cornerstone Large Cap Value Fund | | $ | — | | | $ | 11,124,593 | | | $ | 6,819,813 | | | $ | — | | | $ | — | | | $ | — | | | $ | 17,944,406 | |
| Montag & Caldwell Growth Fund | | | — | | | | 5,719,602 | | | | — | | | | — | | | | — | | | | — | | | | 5,719,602 | |
| LMCG Small Cap Growth Fund | | | 1,123,210 | ** | | | — | | | | — | | | | — | | | | — | | | | — | | | | 1,123,210 | |
| DoubleLine Core Plus Fixed Income Fund | | | — | | | | — | | | | — | | | | — | | | | 2,938,510 | | | | 1,300,564 | | | | 4,239,074 | |
| TCH Fixed Income Fund | | | 2,654,917 | | | | 1,270,780 | | | | — | | | | — | | | | — | | | | — | | | | 3,925,697 | |
| Anchor Capital Enhanced Equity Fund | | | — | | | | — | | | | — | | | | — | | | | 441,599 | | | | — | | | | 441,599 | |
| Guardian Capital Global Dividend Fund | | | — | | | | — | | | | — | | | | — | | | | 37,885 | | | | — | | | | 37,885 | |
| LMCG Emerging Markets Fund | | | — | | | | — | | | | — | | | | — | | | | 260,214 | | | | — | | | | 260,214 | |
| Harrison Street Real Estate Fund | | | 606,778 | | | | 11,228,100 | | | | — | | | | — | | | | — | | | | — | | | | 11,834,878 | |
| * | On December 22, 2010, the Regulated Investment Company Modernization Act of 2010 (the “Modernization Act”) was signed into law. Under the Modernization Act, the Funds are permitted to carry forward capital losses incurred for an unlimited period. However, any losses incurred during those future taxable years will be required to be utilized prior to the losses incurred in pre-enactment taxable years. As a result of this ordering rule, pre-enactment capital loss carryforwards may be more likely to expire unused. Additionally, post-enactment capital losses that are carried forward will retain their character as either short-term or long-term capital losses rather than being considered all short-term as under previous law. |
| ** | This capital loss carryforward amount was acquired in the reorganization of the Aston Small Cap Fund into the LMCG Small Cap Growth Fund on April 19, 2013. The Fund’s ability to utilize the capital loss carryforwards is limited under Internal Revenue Service regulations. |
Management has analyzed the Funds’ tax positions for all open tax years (current and prior three tax years) and has concluded that no provision for federal, state, or international income tax is required in the Funds’ financial statements. The Funds’ federal income and excise tax returns for tax years for which the applicable statutes of limitations have not expired are subject to examination by the Internal Revenue Service.
(12) Multi-Class Operations: Each class offered by a Fund that is authorized to offer multiple classes of shares has equal rights as to the Fund’s net assets.
Income, fund and trust level expenses, and realized and unrealized capital gains and losses, if any, are allocated to each class of shares based on the relative net assets of each class. Class specific expenses are allocated to each class.
(13) Offering Costs: Certain costs were incurred in connection with the offering of the following Funds, as disclosed in the table below. The costs associated have been capitalized and are being amortized on a straight-line basis over twelve months based on the commencement date of the Funds, stated below.
| | | | | | | | |
Fund | | Inception Date | | | Original
Offering Costs | |
| Fairpointe Focused Equity Fund | | | December 24, 2014 | | | $ | 49,967 | |
| Guardian Capital Global Dividend Fund | | | April 14, 2014 | | | | 59,779 | |
| Pictet International Fund | | | April 14, 2014 | | | | 72,702 | |
| TAMRO International Small Cap fund | | | December 23, 2014 | | | | 50,521 | |
(14) Use of Estimates: The preparation of financial statements in conformity with U.S. GAAP requires management to make estimates and assumptions that affect the reported amounts of assets and liabilities and disclosure of contingent assets and liabilities at the date of the financial statements and the reported amounts of revenues and expenses during the reporting period. Actual results could differ from those estimates.
(15) Commitments and Contingencies: In the normal course of business, the Trust enters into contracts on behalf of the Funds that contain a variety of provisions for general indemnifications. Each Fund’s maximum exposure under these arrangements is unknown, as this would involve future claims that may be made against each Fund that are not known at this time. However, based on experience, the Funds believe the risk of loss is remote.
Note (C) Dividends from Net Investment Income and Distributions of Capital Gains: Dividends and distributions to shareholders are recorded on the ex-dividend date. River Road Dividend All Cap Value Fund, River Road Dividend All Cap Value Fund II, DoubleLine Core Plus Fixed Income Fund and TCH Fixed Income Fund distribute dividends from net investment income to shareholders monthly and net realized gains from investment transactions, if any, are generally distributed annually, usually in December.
Anchor Capital Enhanced Equity Fund, Guardian Capital Global Dividend Fund, and Montag & Caldwell Balanced Fund distribute dividends from net investment income to shareholders quarterly and net realized gains from investment transactions, if any, are generally distributed annually, usually in December.
| | |
| |
| | April 30, 2015 |
| |
| Notes to Financial Statements (unaudited) – continued | | |
The following Funds distribute dividends from net investment income to shareholders annually and net realized gains from investment transactions, if any, are generally distributed annually, usually in December: Fairpointe Focused Equity Fund, Montag & Caldwell Growth Fund, TAMRO Diversified Equity Fund, Herndon Large Cap Value Fund, Cornerstone Large Cap Value Fund, Fairpointe Mid Cap Fund, Montag & Caldwell Mid Cap Growth Fund, LMCG Small Cap Growth Fund, Silvercrest Small Cap Fund, TAMRO Small Cap Fund, River Road Select Value Fund, River Road Small Cap Value Fund, River Road Independent Value Fund, Lake Partners LASSO Alternatives Fund, River Road Long-Short Fund, Barings International Fund, LMCG Emerging Markets Fund, Pictet International Fund, TAMRO International Small Cap Fund and Harrison Street Real Estate Fund.
Dividends and distributions are automatically reinvested in additional Fund shares on ex-date at that day’s ending NAV for the respective Fund for those shareholders who have elected the reinvestment option.
Differences in dividends per share between classes of the Funds are due to different class expenses.
Net investment income and realized gains and losses for federal income tax purposes may differ from those reported on the financial statements because of temporary and permanent book and tax basis differences. Permanent differences, such as redesignation of dividends paid, partnership reclasses, disallowed capitalized dividends on short sales, reclass of short-term gain to ordinary income, write off of capital loss carryovers, return of capital adjustments, premium reversals, paydown reclasses, passive foreign investment company reclasses, foreign currency reclasses, adjustments for business development corporations, the use of equalization and net operating loss reclasses are reclassified among capital accounts in the financial statements to reflect their character. Temporary differences, such as deferrals on losses relating to wash sales transactions, amortization of offering costs, premium amortization, current year dividends payable, passive foreign investment company adjustments and capital loss carryovers, arise when income, expenses, gains or losses are recognized in different periods for financial statement and tax purposes; these differences will reverse at some time in the future.
Distributions from net realized gains for book purposes may include short-term capital gains, which are classified as ordinary income for tax purposes.
The tax character of distributions paid during the fiscal years ended 2014 and 2013 was as follows:
| | | | | | | | | | | | | | | | |
| | | Distributions Paid in 2014 | | | Distributions Paid in 2013 | |
| | | Ordinary Income | | | Long-Term
Capital Gains | | | Ordinary Income | | | Long-Term
Capital Gains | |
| | | | | | | | | | | | | | | | |
| Cornerstone Large Cap Value Fund | | $ | 400,233 | | | $ | — | | | $ | 275,360 | | | $ | — | |
| Herndon Large Cap Value Fund | | | 3,419,118 | | | | 6,349 | | | | 2,225,740 | | | | 4,982 | |
| Montag & Caldwell Growth Fund | | | 45,645,316 | | | | 341,924,841 | | | | 53,175,678 | | | | 275,103,427 | |
| TAMRO Diversified Equity Fund | | | 21,488 | | | | 1,631,344 | | | | 47,422 | | | | 25,803 | |
| River Road Dividend All Cap Value Fund | | | 46,656,555 | | | | 64,851,857 | | | | 31,709,319 | | | | 26,566,474 | |
| River Road Dividend All Cap Value Fund II | | | 4,391,126 | | | | 86,891 | | | | 964,010 | | | | — | |
| Fairpointe Mid Cap Fund | | | 3,375,463 | | | | 458,048,169 | | | | 33,005,046 | | | | 66,057,903 | |
| Montag & Caldwell Mid Cap Growth Fund | | | 54,000 | | | | 1,654,527 | | | | — | | | | 92,399 | |
| LMCG Small Cap Growth Fund | | | 4,567,533 | | | | 960,263 | | | | 436,931 | | | | 47,268 | |
| River Road Independent Value Fund | | | 27,428,053 | | | | 833,833 | | | | 39,553,086 | | | | — | |
| River Road Select Value Fund | | | 5,039,706 | | | | 26,824,144 | | | | 3,212,685 | | | | 8,700,481 | |
| River Road Small Cap Value Fund | | | 10,537,955 | | | | 56,872,092 | | | | 5,316,856 | | | | 9,066,179 | |
| Silvercrest Small Cap Fund | | | 723,403 | | | | 562,187 | | | | 110,190 | | | | 717 | |
| TAMRO Small Cap Fund | | | — | | | | 116,418,951 | | | | 18,818,417 | | | | 76,987,885 | |
| DoubleLine Core Plus Fixed Income Fund | | | 5,696,835 | | | | — | | | | 8,127,489 | | | | 22,764 | |
| TCH Fixed Income Fund | | | 1,961,530 | | | | — | | | | 2,721,001 | | | | — | |
| Anchor Capital Enhanced Equity Fund | | | 3,308,423 | | | | — | | | | 5,860,687 | | | | 556,618 | |
| Lake Partners LASSO Alternatives Fund | | | 4,167,016 | | | | 1,590,997 | | | | 4,205,294 | | | | — | |
| River Road Long-Short Fund | | | 4,915,054 | | | | 28,902 | | | | 415,810 | | | | 21,761 | |
| Barings International Fund | | | 2,458,302 | | | | 944,009 | | | | 1,201,521 | | | | 550,401 | |
| Guardian Capital Global Dividend Fund | | | 46,620 | | | | — | | | | — | | | | — | |
| LMCG Emerging Markets Fund | | | 64,574 | | | | — | | | | — | | | | — | |
| Harrison Street Real Estate Fund | | | 147,567 | | | | — | | | | 165,004 | | | | — | |
| Montag & Caldwell Balanced Fund | | | 208,332 | | | | 740,661 | | | | 366,801 | | | | — | |
| | |
| |
| | April 30, 2015 |
| |
| Notes to Financial Statements (unaudited) – continued | | |
As of October 31, 2014, the most recent tax year end, the components of distributable earnings on a tax basis were as follows:
| | | | | | | | | | | | | | | | | | | | |
| | | | | | | | | | | | | | | | | | | | |
| | | Accumulated Capital and
Other Losses | | | Undistributed
Ordinary
Income | | | Undistributed Long-Term Gain | | | Unrealized Appreciation
(Depreciation) | | | Total | |
| Cornerstone Large Cap Value Fund | | $ | (17,944,406 | ) | | $ | 811,840 | | | $ | — | | | $ | 9,312,701 | | | $ | (7,819,865 | ) |
| Herndon Large Cap Value Fund | | | — | | | | 2,077,706 | | | | 7,725,697 | | | | 18,831,843 | | | | 28,635,246 | |
| Montag & Caldwell Growth Fund | | | (5,719,602 | ) | | | 39,806,758 | | | | 627,214,322 | | | | 682,737,831 | | | | 1,344,039,309 | |
| TAMRO Diversified Equity Fund | | | — | | | | 1,330,732 | | | | 2,037,416 | | | | 14,488,089 | | | | 17,856,237 | |
| River Road Dividend All Cap Value Fund | | | — | | | | 1,450,183 | | | | 89,180,525 | | | | 231,097,821 | | | | 321,728,529 | |
| River Road Dividend All Cap Value Fund II | | | — | | | | 1,313,975 | | | | 2,890,310 | | | | 13,296,819 | | | | 17,501,104 | |
| Fairpointe Mid Cap Fund | | | — | | | | 151,395,419 | | | | 770,914,068 | | | | 962,121,316 | | | | 1,884,430,803 | |
| Montag & Caldwell Mid Cap Growth Fund | | | — | | | | 22,455 | | | | 660,992 | | | | 2,085,241 | | | | 2,768,688 | |
| LMCG Small Cap Growth Fund | | | (1,123,210 | ) | | | 1,396,041 | | | | 1,049,684 | | | | 5,555,024 | | | | 6,877,539 | |
| River Road Independent Value Fund | | | — | | | | 13,123,488 | | | | 21,660,989 | | | | (22,531,730 | ) | | | 12,252,747 | |
| River Road Select Value Fund | | | — | | | | 7,894,025 | | | | 17,042,127 | | | | 7,552,973 | | | | 32,489,125 | |
| River Road Small Cap Value Fund | | | — | | | | 9,288,601 | | | | 31,937,090 | | | | 36,248,070 | | | | 77,473,761 | |
| Silvercrest Small Cap Fund | | | — | | | | 427,578 | | | | 1,197,754 | | | | 6,951,946 | | | | 8,577,278 | |
| TAMRO Small Cap Fund | | | (4,567,670 | ) | | | — | | | | 94,013,543 | | | | 235,273,794 | | | | 324,719,667 | |
| DoubleLine Core Plus Fixed Income Fund | | | (4,239,074 | ) | | | 56,676 | | | | — | | | | 2,372,929 | | | | (1,809,469 | ) |
| TCH Fixed Income Fund | | | (3,925,697 | ) | | | 13,088 | | | | — | | | | 3,179,390 | | | | (733,219 | ) |
| Anchor Capital Enhanced Equity Fund | | | (441,599 | ) | | | 327,869 | | | | — | | | | 7,937,136 | | | | 7,823,406 | |
| Lake Partners LASSO Alternatives Fund | | | (1,997,170 | ) | | | — | | | | 15,080,174 | | | | 27,352,495 | | | | 40,435,499 | |
| River Road Long-Short Fund | | | — | | | | 4,915,572 | | | | 334,672 | | | | (9,041,573 | ) | | | (3,791,329 | ) |
| Barings International Fund | | | — | | | | 772,590 | | | | 2,360,278 | | | | 740,716 | | | | 3,873,584 | |
| Guardian Capital Global Dividend Fund | | | (37,885 | ) | | | 16,335 | | | | — | | | | 234,146 | | | | 212,596 | |
| LMCG Emerging Markets Fund | | | (260,214 | ) | | | 22,462 | | | | — | | | | 127,491 | | | | (110,261 | ) |
| Pictet International Fund | | | — | | | | 170,163 | | | | — | | | | (805,564 | ) | | | (635,401 | ) |
| Harrison Street Real Estate Fund | | | (11,834,878 | ) | | | 115,470 | | | | — | | | | 1,133,770 | | | | (10,585,638 | ) |
| Montag & Caldwell Balanced Fund | | | — | | | | 83,638 | | | | 1,807,933 | | | | 2,700,106 | | | | 4,591,677 | |
Note (D) Shares of Beneficial Interest: Each Fund is authorized to issue an unlimited number of shares of beneficial interest with no par value. Share transactions of the Funds were as follows:
Six Months Ended April 30, 2015
| | | | | | | | | | | | | | | | |
Class N | | Sold | | | Proceeds From
Reinvestment
of Distributions | | | Redeemed | | | Net Increase
(Decrease) in
Shares Outstanding | |
| Cornerstone Large Cap Value Fund | | | 391,442 | | | | 28,081 | | | | (647,766 | ) | | | (228,243 | ) |
| Fairpointe Focused Equity Fund (a)(b) | | | 200,698 | | | | — | | | | (644 | ) | | | 200,054 | |
| Herndon Large Cap Value Fund | | | 125,704 | | | | 62,690 | | | | (389,156 | ) | | | (200,762 | ) |
| Montag & Caldwell Growth Fund | | | 3,471,968 | | | | 8,194,048 | | | | (22,850,753 | ) | | | (11,184,737 | ) |
| TAMRO Diversified Equity Fund | | | 78,923 | | | | 84,769 | | | | (380,546 | ) | | | (216,854 | ) |
| River Road Dividend All Cap Value Fund | | | 1,523,864 | | | | 1,935,866 | | | | (9,977,864 | ) | | | (6,518,134 | ) |
| River Road Dividend All Cap Value Fund II | | | 49,440 | | | | 19,602 | | | | (110,461 | ) | | | (41,419 | ) |
| Fairpointe Mid Cap Fund | | | 6,129,373 | | | | 9,137,627 | | | | (10,259,613 | ) | | | 5,007,387 | |
| Montag & Caldwell Mid Cap Growth Fund | | | 8,544 | | | | 34,984 | | | | (246,202 | ) | | | (202,674 | ) |
| LMCG Small Cap Growth Fund | | | 2,808,235 | | | | 105,407 | | | | (520,491 | ) | | | 2,393,151 | |
| River Road Independent Value Fund | | | 2,814,084 | | | | 1,563,006 | | | | (5,330,816 | ) | | | (953,726 | ) |
| River Road Select Value Fund | | | 49,998 | | | | 156,298 | | | | (262,970 | ) | | | (56,674 | ) |
| River Road Small Cap Value Fund | | | 202,391 | | | | 503,817 | | | | (2,201,570 | ) | | | (1,495,362 | ) |
| Silvercrest Small Cap Fund | | | 31,060 | | | | 9,374 | | | | (131,166 | ) | | | (90,732 | ) |
| TAMRO Small Cap Fund | | | 497,775 | | | | 2,105,009 | | | | (5,058,748 | ) | | | (2,455,964 | ) |
| DoubleLine Core Plus Fixed Income Fund | | | 8,150,914 | | | | 106,589 | | | | (2,055,835 | ) | | | 6,201,668 | |
| TCH Fixed Income Fund | | | 292,024 | | | | 48,690 | | | | (236,515 | ) | | | 104,199 | |
| Anchor Capital Enhanced Equity Fund | | | 1,161,200 | | | | 80,361 | | | | (1,639,506 | ) | | | (397,945 | ) |
| Lake Partners LASSO Alternatives Fund | | | 2,337,025 | | | | 133,279 | | | | (755,610 | ) | | | 1,714,694 | |
| River Road Long-Short Fund | | | 1,740,721 | | | | 231,451 | | | | (2,721,329 | ) | | | (749,157 | ) |
| Barings International Fund | | | 1,383 | | | | 8,119 | | | | (1,773 | ) | | | 7,729 | |
| Guardian Capital Global Dividend Fund | | | 1,219 | | | | 8 | | | | (47 | ) | | | 1,180 | |
| LMCG Emerging Markets Fund | | | 296 | | | | 426 | | | | (327 | ) | | | 395 | |
| Pictet International Fund | | | 903 | | | | 34 | | | | (292 | ) | | | 645 | |
| TAMRO International Small Cap Fund (c) | | | 106,175 | | | | — | | | | — | | | | 106,175 | |
| Harrison Street Real Estate Fund | | | 109,932 | | | | 11,379 | | | | (166,155 | ) | | | (44,844 | ) |
| Montag & Caldwell Balanced Fund | | | 18,781 | | | | 75,379 | | | | (47,771 | ) | | | 46,389 | |
| | |
| |
| | April 30, 2015 |
| |
| Notes to Financial Statements (unaudited) – continued | | |
| | | | | | | | | | | | | | | | |
Class I | | Sold | | | Proceeds From
Reinvestment
of Distributions | | | Redeemed | | | Net Increase
(Decrease) in
Shares Outstanding | |
| Cornerstone Large Cap Value Fund | | | 626,142 | | | | 56,355 | | | | (1,002,405 | ) | | | (319,908 | ) |
| Fairpointe Focused Equity Fund (a)(b) | | | 391,185 | | | | — | | | | — | | | | 391,185 | |
| Herndon Large Cap Value Fund | | | 975,796 | | | | 624,457 | | | | (1,689,939 | ) | | | (89,686 | ) |
| Montag & Caldwell Growth Fund | | | 6,818,963 | | | | 14,272,154 | | | | (51,798,425 | ) | | | (30,707,308 | ) |
| TAMRO Diversified Equity Fund | | | 26,567 | | | | 92,884 | | | | (191,958 | ) | | | (72,507 | ) |
| River Road Dividend All Cap Value Fund | | | 4,151,879 | | | | 3,657,086 | | | | (7,933,261 | ) | | | (124,296 | ) |
| River Road Dividend All Cap Value Fund II | | | 1,177,971 | | | | 349,779 | | | | (709,050 | ) | | | 818,700 | |
| Fairpointe Mid Cap Fund | | | 11,864,750 | | | | 10,047,969 | | | | (18,768,984 | ) | | | 3,143,735 | |
| Montag & Caldwell Mid Cap Growth Fund | | | 105,024 | | | | 27,469 | | | | (11,624 | ) | | | 120,869 | |
| LMCG Small Cap Growth Fund | | | 1,739,479 | | | | 52,633 | | | | (158,699 | ) | | | 1,633,413 | |
| River Road Independent Value Fund | | | 1,692,241 | | | | 1,546,766 | | | | (19,383,808 | ) | | | (16,144,801 | ) |
| River Road Select Value Fund | | | 364,172 | | | | 2,999,976 | | | | (7,386,835 | ) | | | (4,022,687 | ) |
| River Road Small Cap Value Fund | | | 2,471,874 | | | | 2,833,551 | | | | (3,466,616 | ) | | | 1,838,809 | |
| Silvercrest Small Cap Fund | | | 4,070,777 | | | | 100,934 | | | | (1,297,134 | ) | | | 2,874,577 | |
| TAMRO Small Cap Fund | | | 2,278,946 | | | | 2,381,470 | | | | (4,837,096 | ) | | | (176,680 | ) |
| DoubleLine Core Plus Fixed Income Fund | | | 10,375,034 | | | | 336,710 | | | | (2,452,986 | ) | | | 8,258,758 | |
| TCH Fixed Income Fund | | | 528,584 | | | | 23,916 | | | | (352,196 | ) | | | 200,304 | |
| Anchor Capital Enhanced Equity Fund | | | 2,896,764 | | | | 80,213 | | | | (3,442,844 | ) | | | (465,867 | ) |
| Lake Partners LASSO Alternatives Fund | | | 5,164,883 | | | | 804,315 | | | | (21,433,091 | ) | | | (15,463,893 | ) |
| River Road Long-Short Fund | | | 1,308,795 | | | | 160,137 | | | | (4,125,157 | ) | | | (2,656,225 | ) |
| Barings International Fund | | | 168,035 | | | | 526,717 | | | | (467,167 | ) | | | 227,585 | |
| Guardian Capital Global Dividend Fund | | | 10,042 | | | | 2,668 | | | | (572 | ) | | | 12,138 | |
| LMCG Emerging Markets Fund | | | — | | | | 2,687 | | | | — | | | | 2,687 | |
| Pictet International Fund | | | 3,014,742 | | | | 5,369 | | | | (505,500 | ) | | | 2,514,611 | |
| TAMRO International Small Cap Fund (c) | | | 66,529 | | | | — | | | | — | | | | 66,529 | |
| Harrison Street Real Estate Fund | | | 5,036 | | | | 566 | | | | (3,903 | ) | | | 1,699 | |
| Montag & Caldwell Balanced Fund | | | 7,644 | | | | 3,548 | | | | (15,578 | ) | | | (4,386 | ) |
| (a) | The inception date for Fairpointe Focused Equity Fund is December 24, 2014. |
| (b) | Fairpointe Focused Equity Fund had a subscription-in-kind in the amount of $2,333,718 on December 24, 2014. The subscription was comprised of securities, cash and dividends accrued in the amount of $2,305,531, $26,148 and $2,039, respectively |
| (c) | The inception date for TAMRO International Small Cap Fund is December 23, 2014. |
| | | | | | | | | | | | | | | | |
Class R | | Sold | | | Proceeds From
Reinvestment
of Distributions | | | Redeemed | | | Net Decrease in
Shares Outstanding | |
| Montag & Caldwell Growth Fund | | | 21,870 | | | | 43,433 | | | | (84,064 | ) | | | (18,761 | ) |
Year Ended October 31, 2014
| | | | | | | | | | | | | | | | |
Class N | | Sold | | | Proceeds From
Reinvestment
of Distributions | | | Redeemed | | | Net Increase
(Decrease) in
Shares Outstanding | |
| Cornerstone Large Cap Value Fund | | | 3,048,364 | | | | 6,618 | | | | (840,585 | ) | | | 2,214,397 | |
| Herndon Large Cap Value Fund | | | 774,911 | | | | 78,380 | | | | (2,949,039 | ) | | | (2,095,748 | ) |
| Montag & Caldwell Growth Fund | | | 7,516,258 | | | | 5,582,826 | | | | (44,037,900 | ) | | | (30,938,816 | ) |
| TAMRO Diversified Equity Fund | | | 192,994 | | | | 42,330 | | | | (445,529 | ) | | | (210,205 | ) |
| River Road Dividend All Cap Value Fund | | | 4,595,497 | | | | 2,941,808 | | | | (14,719,302 | ) | | | (7,181,997 | ) |
| River Road Dividend All Cap Value Fund II | | | 308,070 | | | | 16,347 | | | | (92,224 | ) | | | 232,193 | |
| Fairpointe Mid Cap Fund | | | 13,219,533 | | | | 4,903,545 | | | | (18,453,660 | ) | | | (330,582 | ) |
| Montag & Caldwell Mid Cap Growth Fund | | | 35,309 | | | | 147,172 | | | | (438,462 | ) | | | (255,981 | ) |
| LMCG Small Cap Growth Fund | | | 615,033 | | | | 304,695 | | | | (585,882 | ) | | | 333,846 | |
| River Road Independent Value Fund | | | 6,616,331 | | | | 1,167,151 | | | | (11,067,285 | ) | | | (3,283,803 | ) |
| River Road Select Value Fund | | | 215,257 | | | | 295,283 | | | | (1,412,098 | ) | | | (901,558 | ) |
| River Road Small Cap Value Fund | | | 695,985 | | | | 871,062 | | | | (1,272,564 | ) | | | 294,483 | |
| Silvercrest Small Cap Fund | | | 318,690 | | | | 9,961 | | | | (168,205 | ) | | | 160,446 | |
| TAMRO Small Cap Fund | | | 2,156,386 | | | | 1,983,756 | | | | (9,725,416 | ) | | | (5,585,274 | ) |
| DoubleLine Core Plus Fixed Income Fund | | | 2,161,225 | | | | 141,089 | | | | (4,006,735 | ) | | | (1,704,421 | ) |
| TCH Fixed Income Fund | | | 549,014 | | | | 133,538 | | | | (1,567,315 | ) | | | (884,763 | ) |
| Anchor Capital Enhanced Equity Fund | | | 3,747,280 | | | | 184,255 | | | | (4,009,865 | ) | | | (78,330 | ) |
| Lake Partners LASSO Alternatives Fund | | | 1,605,400 | | | | 40,597 | | | | (2,469,534 | ) | | | (823,537 | ) |
| River Road Long-Short Fund | | | 8,014,551 | | | | 238,102 | | | | (7,696,381 | ) | | | 556,272 | |
| Barings International Fund | | | 8,221 | | | | 5,415 | | | | (27,372 | ) | | | (13,736 | ) |
| Guardian Capital Global Dividend Fund (a) | | | 100,106 | | | | — | | | | — | | | | 100,106 | |
| LMCG Emerging Markets Fund | | | 6,335 | | | | 1,079 | | | | (1,378 | ) | | | 6,036 | |
| Pictet International Fund (b) | | | 105,262 | | | | — | | | | — | | | | 105,262 | |
| Harrison Street Real Estate Fund | | | 374,724 | | | | 12,655 | | | | (529,928 | ) | | | (142,549 | ) |
| Montag & Caldwell Balanced Fund | | | 49,674 | | | | 35,776 | | | | (198,637 | ) | | | (113,187 | ) |
| | |
| |
| | April 30, 2015 |
| |
| Notes to Financial Statements (unaudited) – continued | | |
| | | | | | | | | | | | | | | | |
Class I | | Sold | | | Proceeds From
Reinvestment
of Distributions | | | Redeemed | | | Net Increase
(Decrease) in
Shares Outstanding | |
| Cornerstone Large Cap Value Fund | | | 4,871,810 | | | | 19,747 | | | | (993,206 | ) | | | 3,898,351 | |
| Herndon Large Cap Value Fund | | | 5,946,567 | | | | 145,491 | | | | (2,674,050 | ) | | | 3,418,008 | |
| Montag & Caldwell Growth Fund | | | 24,146,473 | | | | 5,932,472 | | | | (41,799,885 | ) | | | (11,720,940 | ) |
| TAMRO Diversified Equity Fund | | | 222,404 | | | | 50,315 | | | | (679,730 | ) | | | (407,011 | ) |
| River Road Dividend All Cap Value Fund | | | 9,868,160 | | | | 3,439,419 | | | | (12,909,103 | ) | | | 398,476 | |
| River Road Dividend All Cap Value Fund II | | | 3,185,525 | | | | 293,676 | | | | (990,015 | ) | | | 2,489,186 | |
| Fairpointe Mid Cap Fund | | | 30,513,534 | | | | 3,826,779 | | | | (15,079,903 | ) | | | 19,260,410 | |
| Montag & Caldwell Mid Cap Growth Fund (c) | | | 322,300 | | | | — | | | | (14 | ) | | | 322,286 | |
| LMCG Small Cap Growth Fund | | | 696,705 | | | | 82,467 | | | | (339,984 | ) | | | 439,188 | |
| River Road Independent Value Fund | | | 13,556,500 | | | | 1,311,396 | | | | (13,609,667 | ) | | | 1,258,229 | |
| River Road Select Value Fund | | | 3,281,294 | | | | 3,175,257 | | | | (5,705,277 | ) | | | 751,274 | |
| River Road Small Cap Value Fund | | | 6,333,689 | | | | 3,935,519 | | | | (6,638,474 | ) | | | 3,630,734 | |
| Silvercrest Small Cap Fund | | | 2,326,474 | | | | 76,930 | | | | (331,458 | ) | | | 2,071,946 | |
| TAMRO Small Cap Fund | | | 5,439,909 | | | | 2,400,215 | | | | (19,301,842 | ) | | | (11,461,718 | ) |
| DoubleLine Core Plus Fixed Income Fund | | | 10,159,407 | | | | 317,973 | | | | (6,234,468 | ) | | | 4,242,912 | |
| TCH Fixed Income Fund | | | 885,168 | | | | 40,165 | | | | (343,869 | ) | | | 581,464 | |
| Anchor Capital Enhanced Equity Fund | | | 7,598,733 | | | | 122,231 | | | | (2,426,538 | ) | | | 5,294,426 | |
| Lake Partners LASSO Alternatives Fund | | | 9,990,525 | | | | 329,595 | | | | (6,588,040 | ) | | | 3,732,080 | |
| River Road Long-Short Fund | | | 9,063,711 | | | | 164,164 | | | | (5,460,015 | ) | | | 3,767,860 | |
| Barings International Fund | | | 775,349 | | | | 457,485 | | | | (2,987,094 | ) | | | (1,754,260 | ) |
| Guardian Capital Global Dividend Fund (a) | | | 302,975 | | | | 2,366 | | | | — | | | | 305,341 | |
| LMCG Emerging Markets Fund | | | 26,107 | | | | 5,932 | | | | (41,200 | ) | | | (9,161 | ) |
| Pictet International Fund (b) | | | 904,851 | | | | — | | | | — | | | | 904,851 | |
| Harrison Street Real Estate Fund | | | 29,872 | | | | 396 | | | | (19,438 | ) | | | 10,830 | |
| Montag & Caldwell Balanced Fund | | | 14,759 | | | | 1,333 | | | | (14,900 | ) | | | 1,192 | |
| (a) | The inception date for Guardian Capital Global Dividend Fund is April 14, 2014. |
| (b) | The inception date for Pictet International Fund is April 14, 2014. |
| (c) | The inception date for Montag & Caldwell Mid Cap Growth Fund Class I is May 14, 2014. |
| | | | | | | | | | | | | | | | |
Class R | | Sold | | | Proceeds From
Reinvestment
of Distributions | | | Redeemed | | | Net
Decrease in
Shares Outstanding | |
| Montag & Caldwell Growth Fund | | | 43,265 | | | | 20,886 | | | | (156,936 | ) | | | (92,785 | ) |
Note (E) Investment Transactions: Aggregate purchases and proceeds from sales and maturities of investment securities (other than short-term investments) for the six months ended April 30, 2015 were as follows:
| | | | | | | | | | | | | | | | |
| | | Aggregate Purchases | | | Proceeds from Sales | |
| | | | |
| | | U.S Government | | | Other | | | U.S Government | | | Other | |
| Cornerstone Large Cap Value Fund | | $ | — | | | $ | 31,420,879 | | | $ | — | | | $ | 42,859,085 | |
| Fairpointe Focused Equity Fund | | | — | | | | 3,973,159 | | | | — | | | | 446,722 | |
| Herndon Large Cap Value Fund | | | — | | | | 37,408,326 | | | | — | | | | 52,966,045 | |
| Montag & Caldwell Growth Fund | | | — | | | | 1,072,410,381 | | | | — | | | | 2,658,663,323 | |
| TAMRO Diversified Equity Fund | | | — | | | | 9,445,523 | | | | — | | | | 18,264,953 | |
| River Road Dividend All Cap Value Fund | | | — | | | | 138,403,870 | | | | — | | | | 303,236,729 | |
| River Road Dividend All Cap Value Fund II | | | — | | | | 26,550,172 | | | | — | | | | 21,081,598 | |
| Fairpointe Mid Cap Fund | | | — | | | | 1,070,713,723 | | | | — | | | | 1,387,965,248 | |
| Montag & Caldwell Mid Cap Growth Fund | | | — | | | | 2,979,008 | | | | — | | | | 4,715,880 | |
| LMCG Small Cap Growth Fund | | | — | | | | 85,658,266 | | | | — | | | | 29,601,080 | |
| River Road Independent Value Fund | | | — | | | | 28,896,443 | | | | — | | | | 107,899,833 | |
| River Road Select Value Fund | | | — | | | | 39,814,030 | | | | — | | | | 100,435,664 | |
| River Road Small Cap Value Fund | | | — | | | | 70,973,568 | | | | — | | | | 112,496,987 | |
| Silvercrest Small Cap Fund | | | — | | | | 66,136,557 | | | | — | | | | 23,204,610 | |
| TAMRO Small Cap Fund | | | — | | | | 240,667,182 | | | | — | | | | 408,321,721 | |
| DoubleLine Core Plus Fixed Income Fund | | | 85,961,453 | | | | 170,054,947 | | | | 37,443,736 | | | | 48,361,373 | |
| TCH Fixed Income Fund | | | 3,340,756 | | | | 6,192,095 | | | | 3,005,511 | | | | 3,116,145 | |
| Anchor Capital Enhanced Equity Fund | | | — | | | | 53,674,017 | | | | — | | | | 71,537,326 | |
| Lake Partners LASSO Alternatives Fund | | | — | | | | 160,841,379 | | | | — | | | | 345,575,668 | |
| River Road Long-Short Fund | | | — | | | | 222,520,425 | | | | — | | | | 247,564,731 | |
| Barings International Fund | | | — | | | | 4,533,792 | | | | — | | | | 5,899,440 | |
| Guardian Capital Global Dividend Fund | | | — | | | | 558,690 | | | | — | | | | 420,908 | |
| LMCG Emerging Markets Fund | | | — | | | | 1,203,753 | | | | — | | | | 1,195,431 | |
| Pictet International Fund | | | — | | | | 32,306,885 | | | | — | | | | 10,259,164 | |
| TAMRO International Small Cap Fund | | | — | | | | 1,912,411 | | | | — | | | | 199,581 | |
| Harrison Street Real Estate Fund | | | — | | | | 12,290,150 | | | | — | | | | 12,941,068 | |
| Montag & Caldwell Balanced Fund | | | — | | | | 5,264,839 | | | | 883,958 | | | | 5,235,260 | |
| | |
| |
| | April 30, 2015 |
| |
| Notes to Financial Statements (unaudited) – continued | | |
Note (F) Redemption Fees: In accordance with the prospectus, certain Funds may assess a redemption fee on Fund share redemptions and exchanges within specified time periods. The redemption fees are indicated in the following table for the six months ended April 30, 2015 and are included in the Cost of Shares Redeemed on the Statements of Changes in Net Assets:
| | | | | | |
Fund Name | | Time Period | | Amount | |
| Barings International Fund | | 2% Within 90 Days | | $ | 114 | |
| Guardian Capital Global Dividend Fund | | 2% Within 90 Days | | | — | |
| LMCG Emerging Markets Fund | | 2% Within 90 Days | | | — | |
| Pictet International Fund | | 2% Within 90 Days | | | — | |
| TAMRO International Small Cap Fund | | 2% Within 90 Days | | | — | |
| Harrison Street Real Estate Fund | | 2% Within 90 Days | | | 459 | |
Note (G) Advisory, Administration, Distribution Services and Trustee Arrangements:
Advisory. Aston serves as investment adviser and administrator to the Funds. Under the terms of the investment advisory agreement for the Funds (the “Investment Advisory Agreement”), fees are accrued daily and paid monthly, at specified annual rates of average daily net assets. The factors considered by the Board in approving the current Investment Advisory Agreement are included in the Funds’ annual or semi-annual report to shareholders covering the period during which the approval occurred.
Certain Funds are subject to an expense limitation agreement with the Adviser, pursuant to which annual ordinary operating expenses for Class N and Class I shareholders are capped at certain specified annual rates of average daily net assets. There are no contractual expense limitations for Class R shareholders.
The contractual expense limitations for the Funds are effective through February 29, 2016. The advisory rates and contractual expense limitations for the six months ended April 30, 2015 were as follows:
| | | | | | |
| | | | | Contractual Expense Limitations |
Fund Name | | Advisory Fees | | Class N | | Class I |
| Cornerstone Large Cap Value Fund | | 0.80% | | 1.30% | | 1.05% |
| Fairpointe Focused Equity Fund (a) | | 0.80% | | 1.15% | | 0.90% |
| Herndon Large Cap Value Fund | | 0.80% | | 1.30% | | 1.05% |
| Montag & Caldwell Growth Fund | | 0.80% on first $800,000,000 | | | | |
| | 0.60% over $800,000,000 up to $6 billion | | | | |
| | 0.55% over $6 billion up to $12 billion
0.50% over $12 billion | | N/A | | N/A |
| TAMRO Diversified Equity Fund | | 0.80% | | 1.20% | | 0.95% |
| River Road Dividend All Cap Value Fund | | 0.70% | | 1.30% | | 1.05% |
| River Road Dividend All Cap Value Fund II | | 0.70% | | 1.30% | | 1.05% |
| Fairpointe Mid Cap Fund | | 0.80% on first $100,000,000 | | | | |
| | 0.75% next $300,000,000 | | | | |
| | 0.70% over $400,000,000 | | N/A | | N/A |
| Montag & Caldwell Mid Cap Growth Fund | | 0.85% | | 1.25% | | 1.00% |
| LMCG Small Cap Growth Fund | | 1.00% | | 1.35% | | 1.10% |
| River Road Independent Value Fund | | 1.00% | | 1.42% | | 1.17% |
| River Road Select Value Fund | | 1.00% | | 1.50% | | 1.25% |
| River Road Small Cap Value Fund | | 0.90% | | N/A | | N/A |
| Silvercrest Small Cap Fund | | 1.00% | | 1.40% | | 1.15% |
| TAMRO Small Cap Fund | | 0.90% | | N/A | | N/A |
| DoubleLine Core Plus Fixed Income Fund | | 0.55% | | 0.94% | | 0.69% |
| TCH Fixed Income Fund | | 0.55% | | 0.94% | | 0.69% |
| Anchor Capital Enhanced Equity Fund | | 0.70% | | 1.40% | | 1.15% |
| Lake Partners LASSO Alternatives Fund (b) | | 1.00% | | 1.40% | | 1.15% |
| River Road Long-Short Fund | | 1.20% | | 1.70% | | 1.45% |
| Barings International Fund | | 1.00% | | 1.40% | | 1.15% |
| Guardian Capital Global Dividend Fund | | 0.80% | | 1.30% | | 1.05% |
| LMCG Emerging Markets Fund | | 1.05% | | 1.43% | | 1.18% |
| Pictet International Fund | | 0.90% | | 1.40% | | 1.15% |
| TAMRO International Small Cap Fund (c) | | 1.00% | | 1.50% | | 1.25% |
| Harrison Street Real Estate Fund | | 1.00% | | 1.37% | | 1.12% |
| Montag & Caldwell Balanced Fund | | 0.75% | | 1.35% | | 1.10% |
| | |
| |
| | April 30, 2015 |
| |
| Notes to Financial Statements (unaudited) – continued | | |
| (a) | The inception date for Fairpointe Focused Equity Fund is December 24, 2014. |
| (b) | Prior to February 28, 2015, the contractual expense limitation was 1.45% and 1.20% for Class N and Class I, respectively. |
| (c) | The inception date for TAMRO International Small Cap Fund is December 23, 2014. |
Pursuant to a contractual expense reimbursement agreement between the Adviser and the Trust, for a period of up to three years from the fiscal year end during which the Adviser waived its advisory fees or reimbursed expenses for each of: Fairpointe Focused Equity Fund-Classes N and I, Herndon Large Cap Value Fund-Classes N and I, River Road Dividend All Cap Value Fund II-Classes N and I, LMCG Small Cap Growth Fund-Classes N and I, River Road Independent Value Fund-Classes N and I, Silvercrest Small Cap Fund-Classes N and I, DoubleLine Core Plus Fixed Income Fund-Classes N and I, Lake Partners LASSO Alternatives Fund-Classes N and I, River Road Long-Short Fund-Classes N and I, Guardian Capital Global Dividend Fund-Classes N and I, LMCG Emerging Markets Fund-Classes N and I, Pictet International Fund-Classes N and I, and TAMRO International Small Cap Fund-Classes N and I, the Adviser is entitled to be reimbursed by each Fund for such previously waived fees and reimbursed expenses from commencement of operations through the completion of the first three full fiscal years, to the extent that each Fund’s expense ratio (not including interest, taxes, other investment-related costs (such as brokerage commissions), extraordinary expenses and acquired fund fees and expenses) remains below the operating expense cap after such reimbursement.
The cumulative reimbursement amounts as of April 30, 2015 that are entitled to be recouped for each Fund are as follows:
| | | | | | | | | | | | | | | | |
| | | Expiration | |
| | | 2015 | | | 2016 | | | 2017 | | | 2018 | |
| Fairpointe Focused Equity Fund(1) | | | N/A | | | | N/A | | | | N/A | | | $ | 57,525 | |
| Herndon Large Cap Value Fund | | $ | 7,468 | | | $ | — | | | | N/A | | | | N/A | |
| River Road Dividend All Cap Value Fund II | | | — | | | | — | | | $ | — | | | | — | |
| LMCG Small Cap Growth Fund | | | 123,269 | | | | 157,143 | | | | 131,012 | | | | N/A | |
| River Road Independent Value Fund | | | 143,528 | | | | 59,855 | | | | 25,960 | | | | N/A | |
| Silvercrest Small Cap Fund | | | 147,166 | | | | 116,435 | | | | 108,554 | | | | 43,199 | |
| DoubleLine Core Plus Fixed Income Fund | | | 389,195 | | | | 205,067 | | | | 183,865 | | | | N/A | |
| Lake Partners LASSO Alternatives Fund | | | — | | | | — | | | | N/A | | | | N/A | |
| River Road Long-Short Fund | | | 65,714 | | | | 76,699 | | | | — | | | | N/A | |
| Guardian Capital Global Dividend Fund | | | N/A | | | | N/A | | | | 89,764 | | | | 74,170 | |
| LMCG Emerging Markets Fund | | | N/A | | | | 119,333 | | | | 173,395 | | | | 76,091 | |
| Pictet International Fund | | | N/A | | | | N/A | | | | 102,208 | | | | 74,482 | |
| TAMRO International Small Cap Fund(1) | | | N/A | | | | N/A | | | | N/A | | | | 58,833 | |
| | | | | | | | | | | | | | | | |
| Total | | $ | 876,340 | | | $ | 734,532 | | | $ | 814,758 | | | $ | 384,300 | |
| | | | | | | | | | | | | | | | |
| (1) | The Fund commenced operations in the current fiscal year. |
Through the six months ended April 30, 2015, the Adviser is eligible to recapture prior year fee waivers and expense reimbursements of $35,325 from Herndon Large Cap Value Fund, and $38,429 from River Road Long-Short Fund.
During the six months ended April 30, 2015, the following Fund was reimbursed by the Subadviser for losses incurred on transactions not meeting the Fund’s investment guidelines:
| | | | |
| | | Capital Contribution | |
| Pictet International Fund | | $ | 23,298 | |
On March 13, 2015, BNY Mellon contributed $872 of capital to the following Fund to mitigate the negative impact to Shareholders from an incorrect calculation of net asset value.
| | | | |
| | | Capital Contribution | |
| Lake Partners LASSO Alternatives Fund | | $ | 872 | |
The Adviser manages each Fund by retaining one or more Subadvisers to manage each Fund, as follows:
| | |
| Fund | | Subadviser |
Cornerstone Large Cap Value Fund | | Cornerstone Investment Partners, LLC |
Fairpointe Focused Equity Fund | | Fairpointe Capital LLC |
Herndon Large Cap Value Fund | | Herndon Capital Management, LLC |
Montag & Caldwell Growth Fund | | Montag & Caldwell, LLC |
TAMRO Diversified Equity Fund | | TAMRO Capital Partners LLC |
River Road Dividend All Cap Value Fund | | River Road Asset Management, LLC |
River Road Dividend All Cap Value Fund II | | River Road Asset Management, LLC |
Fairpointe Mid Cap Fund | | Fairpointe Capital LLC |
Montag & Caldwell Mid Cap Growth Fund | | Montag & Caldwell, LLC |
LMCG Small Cap Growth Fund | | LMCG Investments, LLC |
River Road Independent Value Fund | | River Road Asset Management, LLC |
River Road Select Value Fund | | River Road Asset Management, LLC |
River Road Small Cap Value Fund | | River Road Asset Management, LLC |
Silvercrest Small Cap Fund | | Silvercrest Asset Management Group LLC |
TAMRO Small Cap Fund | | TAMRO Capital Partners LLC |
DoubleLine Core Plus Fixed Income Fund | | DoubleLine Capital LP |
TCH Fixed Income Fund | | Taplin, Canida & Habacht, LLC |
Anchor Capital Enhanced Equity Fund | | Anchor Capital Advisors LLC |
Lake Partners LASSO Alternatives Fund | | Lake Partners, Inc. |
River Road Long-Short Fund | | River Road Asset Management, LLC |
Barings International Fund | | Baring International Investment Limited |
Guardian Capital Global Dividend Fund | | Guardian Capital LP |
LMCG Emerging Markets Fund | | LMCG Investments, LLC |
Pictet International Fund | | Pictet Asset Management Limited |
TAMRO International Small Cap Fund | | TAMRO Capital Partners LLC |
Harrison Street Real Estate Fund | | Harrison Street Securities, LLC |
Montag & Caldwell Balanced Fund | | Montag & Caldwell, LLC |
Subadvisory fees are paid monthly by Aston. The factors considered by the Board in approving the current sub-investment advisory agreements for the Funds (each, a “Sub-Investment Advisory Agreement”) are included in the additional information section of the Funds’ annual or semi-annual report to shareholders covering the period in which such approval occurred.
Administration. Under the terms of the administration agreement between the Trust and Aston, the Funds’ administrator (the “Administration Agreement”), administration fees are accrued daily and paid monthly, based on a specified percentage of average daily net assets of the Trust, and base fees are fixed at an annual rate of $12,000 per Fund. The fee is allocated to
| | |
| |
| | April 30, 2015 |
| |
| Notes to Financial Statements (unaudited) – continued | | |
each Fund based on the relative net assets of the Trust. Administration expenses also include pricing agent fees and compliance-related expenses. The administration fee arrangement is as follows:
| | |
Administration Fees at Trust Level | | Annual Rate |
| |
| First $7.4 billion | | 0.0437% |
| Over $7.4 billion | | 0.0412% |
BNY Mellon Investment Servicing (US) Inc. (“BNY Mellon”) provides certain administrative services to the Funds pursuant to a Sub-administration and Accounting Services Agreement between Aston and BNY Mellon (the “Sub-Administration Agreement”). Under the terms of the Sub-Administration Agreement, sub-administration fees (inclusive of tax services fees), which are paid by Aston, are accrued daily and paid monthly, at a rate of 0.0167% of average daily net assets of the Trust and a base fee at an annual rate of $12,000 per Fund. The fees may be subject to an annual increase by BNY Mellon, in an amount not to exceed the cumulative percentage increase in the Consumer Price Index for All Urban Consumers (CPI-U) U.S. City Average, all items (unadjusted) published since the last such increase in fees. The last such annual increase, of 1.5%, was effective October 1, 2014.
Distribution Services. Foreside Funds Distributors LLC (the “Distributor”) serves as principal underwriter and distributor of the Funds’ shares. Pursuant to Rule 12b-1 distribution and service plans (the “Plans”) adopted by the Funds, with respect to Class N shares and Class R shares, the Funds pay certain expenses associated with the distribution and servicing of their shares. Under the Plans, each Fund may pay actual expenses not exceeding, on an annual basis, 0.25% of each participating Fund’s Class N average daily net assets and 0.50% of each participating Fund’s Class R average daily net assets. The Class I
shares do not have Rule 12b-1 plans. Effective January 1, 2012 and ending October 31, 2013, the TCH Fixed Income Fund 12b-1 fee was reduced to 0.15%. Effective January 1, 2012, Montag & Caldwell Balanced Fund reduced its 12b-1 fees to 0.10%.
Trustees. The Trustees of the Trust who are not affiliated with the Adviser or a Subadviser receive an annual retainer and per meeting fees, and they are reimbursed for out-of-pocket expenses for each meeting of the Board they attend. The Chairman of the Board and Committee Chairs receive additional retainers. No officer or employee of the Adviser, of a Subadviser, or of their affiliates receives any compensation from the Funds for acting as a Trustee of the Trust. The officers of the Trust receive no compensation directly from the Funds for performing the duties of their offices, except that the Funds compensate the Administrator for providing an officer to serve as the Funds’ Chief Compliance Officer. The aggregate remuneration paid to the Trustees during the six months ended April 30, 2015 was $447,054.
Effective May 30, 2014, Aston became an indirect, wholly-owned subsidiary of Affiliated Managers Group, Inc. (“AMG”), the interests in which are held by AMG through its wholly-owned subsidiary, AMG Funds LLC. AMG Funds LLC serves as investment adviser to the AMG Funds family of mutual funds (“AMG Funds”) and the same trustees serve on the Boards of Trustees of both the Trust and AMG Funds. Effective January 1, 2015, the Trustees’ fees and expenses are generally allocated among all of the Funds and the funds within AMG Funds based on the relative net assets of such funds. Before January 1, 2015, the Trustees’ fees and expenses were allocated among all of the Funds. The “Trustees fees and related expenses” shown in the financial statements represents each Fund’s allocated portion of the total fees and expenses paid to the Trustees of the Trust.
Affiliated Investments: Certain Funds may invest in affiliated funds subject to compliance with each Fund’s policies.
A summary of each Fund’s investment, as applicable, in affiliated funds for the six months ended April 30, 2015, is as follows:
DoubleLine Core Plus Fixed Income Fund
| | | | | | | | | | | | | | | | | | | | |
Underlying Fund | | Purchases | | | Proceeds
from Sales | | | Market Value
04/30/2015 | | | Dividend
Income | | | Realized
Gain | |
| DoubleLine Floating Rate Fund | | $ | 11,200,000 | | | $ | 4,000,000 | | | $ | 9,811,607 | | | $ | 109,374 | | | $ | 23,715 | |
Note (H) Credit Agreement: Effective July 6, 2010 and as amended August 29, 2014, the Trust entered into a Credit Agreement with The Bank of New York Mellon (the “Bank”) which provides the Trust with a revolving line of credit facility of up to $50 million. The facility is shared by each series of the Trust and is available for temporary, emergency purposes including liquidity needs in meeting redemptions. The interest rate on outstanding Alternate Base Rate Loans is equal to the greater of the Prime Rate plus 1.25% or 0.50% plus the Federal Funds Effective Rate plus 1.25%. The interest rate on out standing Overnight Loans is equal to the greater of the Federal Funds Effective Rate plus 1.25% or the One Month LIBOR Rate plus 1.25%. The Trust pays a commitment fee on the unutilized
commitment amount of 0.12% per annum, included in Other Expenses on the Statement of Operations. The Funds did not utilize the line of credit during the six months ended April 30, 2015.
Note (I) Significant Concentrations: Certain Funds may invest a significant percentage of their assets in securities of foreign issuers. These investments may involve certain considerations and risks not typically associated with investments in the United States as a result of, among other factors, the possibility of future political and economic developments and the level of governmental supervision and regulation of securities markets in the respective countries. Some countries in which the Funds
| | |
| |
| | April 30, 2015 |
| |
| Notes to Financial Statements (unaudited) – continued | | |
invest may require government approval for repatriation of investment income, capital or the proceeds for sales of securities by foreign investors. In addition, if there is deterioration in a country’s balance of payments or for other reasons, a country may impose temporary restrictions on foreign capital remittances abroad. In addition, changes in currency exchange rates will affect the value of investments denominated in a foreign currency, as well as investment income derived from those securities.
Note (J) Subsequent Events: Management has evaluated the impact of all subsequent events on the Funds through the date the financial statements were issued, and has determined that there were no subsequent events requiring recognition or disclosure in the financial statements.
| | |
| |
| | April 30, 2015 |
| |
| Additional Information (unaudited) | | |
Form N-Q: The Trust files complete schedules of portfolio holdings for the Funds with the Securities and Exchange Commission (the “SEC”) for the Trust’s first and third quarters of each fiscal year on Form N-Q. The Trust’s Form N-Q are available on the SEC’s website at www.sec.gov and are available for review and copying at the SEC’s Public Reference Room in Washington, DC. Information on the operations of the Public Reference Room may be obtained by calling the SEC at 202-942-8090.
Proxy Voting: The Trust’s Proxy Voting Policies and Procedures, used to determine how to vote proxies relating to portfolio securities, are included in the Trust’s Statement of Additional Information, which is available (i) upon request, without charge, by calling 800-992-8151; (ii) on Aston Funds’ website at www. astonfunds.com; and (iii) on the SEC’s website at www.sec.gov. The Funds’ Proxy Voting Record for the most recent twelve-month period ended June 30 is available without charge (i) on the Funds’ website at www.astonfunds.com; and (ii) on the SEC’s website at www.sec.gov.
CONSIDERATIONS OF THE BOARD OF TRUSTEES IN CONNECTION WITH THE APPROVAL OF THE INVESTMENT ADVISORY AGREEMENTS FOR ASTON/FAIRPOINTE FOCUSED EQUITY FUND AND ASTON/TAMRO INTERNATIONAL SMALL CAP FUND
At an in-person meeting held on December 18, 2014, the Board of Trustees (the “Board”) of Aston Funds (the “Trust”), including the trustees who are not “interested persons,” as defined in Section 2(a)(19) of the Investment Company Act of 1940, as amended (the “Independent Trustees”), determined that the terms of the Investment Advisory Agreement between the Trust and Aston Asset Management, LLC (“Aston”) with respect to ASTON/Fairpointe Focused Equity Fund and ASTON/TAMRO International Small Cap Fund (each, a “New Fund” and collectively, the “New Funds”) are fair and reasonable and approved the Investment Advisory Agreement for each New Fund as being in the best interests of the New Fund. In making such determinations, the Board, including the Independent Trustees, considered materials received and discussions held with respect to the approval of the Investment Advisory Agreements at the December 18, 2014 meeting and prior meetings. The Independent Trustees met separately from the Trustees who are “interested persons” of the Trust as defined in Section 2(a)(19) of the Investment Company Act of 1940, as amended, and any officers of Aston or its affiliates to consider approval of the Investment Advisory Agreements with respect to the New Funds. The Independent Trustees were assisted by independent legal counsel in their deliberations.
In evaluating the Investment Advisory Agreement on behalf of each New Fund, the Board reviewed information regarding: (1) the nature, quality and extent of the services to be provided to the New Fund; (2) the investment advisory fees to be charged and estimated total expense ratio of the New Fund compared to a peer group of funds; (3) fee waivers or expenses to be reimbursed by Aston and/or the New Fund’s subadviser; and (4) potential benefits to be received by Aston or its affiliates from Aston’s
relationship with the New Fund. In considering the Investment Advisory Agreement on behalf of each New Fund, the Board, including the Independent Trustees, did not identify any single factor or group of factors as all-important or controlling, and with each Trustee not necessarily attributing the same weight to each factor, but considered all factors together. The following summary does not detail all the matters considered.
Nature, Quality and Extent of Services. The Board considered the nature, quality and extent of services to be provided by Aston, including investment advisory services and administrative services. The Board considered that Aston is a manager-of-managers, and that in its role as investment adviser to each New Fund it intends to delegate the day-to-day responsibility for managing the New Fund’s investments to a subadviser. Accordingly, the Board considered Aston’s capabilities and processes with respect to the selection and monitoring of subadvisers on an ongoing basis, as well as information regarding the composition, experience and role of its Investment Committee. In this regard, the Board noted the responsibilities and experience of Aston personnel, the resources made available to such personnel, the ability of Aston to attract and retain high quality personnel and the organizational depth and stability of Aston.
In considering the nature, extent and quality of the services to be provided by Aston under the Investment Advisory Agreements, the Board took into account information provided periodically throughout the previous year by Aston in Board meetings relating to Aston’s financial information, operations and personnel, the performance of its duties with respect to other Funds in the Aston complex, the quality of the performance of Aston’s duties and the Trustees’ knowledge of Aston’s management team.
In addition to investment advisory services, the Board considered the quality of other services provided by Aston including oversight of service providers, regulatory administration and Board support, fund administration and operational support, compliance services, shareholder servicing and platform management and distribution- and marketing-related services. The Board also considered Aston’s risk management processes. On the basis of this evaluation, the Board concluded that the nature, quality and extent of services to be provided by Aston are expected to be satisfactory.
Fees and Expenses. The Board considered each New Fund’s proposed management fee rate and total net expense ratio after contractual expense reimbursements and fee waivers. As a part of this analysis, the Board compared the proposed investment advisory fees and total net expenses to those of a relevant peer group for each New Fund. The Board considered the amount of the management fee to be retained by Aston after payment of the subadvisory fee in light of the services to be rendered for those amounts. The Board concluded that the proposed investment advisory fees were reasonable and appropriate in light of the nature, quality and extent of services to be provided by Aston.
| | |
| |
| | April 30, 2015 |
| |
| Additional Information (unaudited) – continued | | |
Costs and Profitability. With respect to the costs of services to be provided and profits expected to be realized by Aston, the Board considered the resources involved in managing each New Fund in light of Aston’s business model as well as fees to be waived or expenses to be reimbursed under an Expense Reimbursement Agreement with Aston. The Board noted that, with respect to each New Fund, Aston and the applicable subadviser, each will bear a portion of any fee waivers or expense reimbursements. Because the New Funds have not yet commenced operations, profitability information was not available. However, based upon projected asset size and the impact of fee waivers or expenses to be reimbursed by Aston, the Board concluded that profitability was not expected to be unreasonable.
Economies of Scale. The Board considered the extent to which economies of scale would be realized as each New Fund grows. The Board considered the potential asset size of the New Funds, as well as the terms of the Expense Reimbursement Agreement, and concluded that at this time the potential for economies of scale are limited.
Other Benefits to the Investment Adviser. The Board considered the nature and amount of fees to be paid by each New Fund for administration services to be provided by Aston. The Board noted that Aston currently does not intend to manage the New Funds directly, and therefore, will not benefit from the use of “soft” commission dollars to pay for research and brokerage services. The Board concluded that any other benefits to be received by the Adviser from its relationship with the New Funds were not expected to be unreasonable.
Conclusion. Based upon its evaluation of all material factors and assisted by the advice of independent legal counsel, the Board, including all of the Independent Trustees, concluded that the terms of the Investment Advisory Agreement for each New Fund, including the proposed investment advisory fee, were fair and reasonable, and that the Investment Advisory Agreement on behalf of each New Fund should be approved.
CONSIDERATIONS OF THE BOARD OF TRUSTEES IN CONNECTION WITH THE APPROVAL OF THE SUB-INVESTMENT ADVISORY AGREEMENT FOR ASTON/FAIRPOINTE FOCUSED EQUITY FUND
At an in-person meeting held on December 18, 2014, the Board of Trustees (the “Board”) of Aston Funds (the “Trust”), including the trustees who are not “interested persons,” as defined in Section 2(a)(19) of the Investment Company Act of 1940, as amended (the “Independent Trustees”), considered the approval of a Sub-Investment Advisory Agreement (the “Sub-Investment Advisory Agreement”) between Aston Asset Management, LLC (“Aston”) and Fairpointe Capital LLC (“Fairpointe”) with respect to ASTON/Fairpointe Focused Equity Fund (the “New Fund”). The Board considered information provided and discussions held at the December 18, 2014 meeting and at prior meetings. The Independent Trustees met separately from the Trustees who are “interested persons” of the Trust as defined in Section 2(a)(19) of the Investment Company Act of 1940, as amended, and any
officers of Aston, Fairpointe or their respective affiliates to consider approval of the Sub-Investment Advisory Agreement. The Independent Trustees were assisted by independent legal counsel in their deliberations.
Among the matters considered by the Board, including the Independent Trustees, in connection with its approval of the Sub-Investment Advisory Agreement were the following:
Nature, Quality and Extent of Services. The Board considered the nature, quality and extent of services expected to be provided under the Sub-Investment Advisory Agreement. The Board considered the reputation, qualifications and background of Fairpointe and its operational and compliance infrastructures. The Board also considered information provided regarding Fairpointe’s investment approach, the experience and skills of senior management and investment personnel of Fairpointe, the resources made available to such personnel, the ability of Fairpointe to attract and retain high-quality personnel and the organizational depth of Fairpointe. The Board also considered the nature and quality of services provided by Fairpointe with respect to other series of the Trust. The Board also considered Fairpointe’s risk management processes. On the basis of this evaluation, the Board concluded that the nature, quality and extent of services to be provided by Fairpointe are expected to be satisfactory.
Performance. Because the New Fund had not yet commenced operations, the Board noted that they could not draw any conclusions regarding the performance of the New Fund. The Trustees, however, considered the performance of a strategy comparable to the New Fund managed by Fairpointe, as well as the performance of the other series of the Trust managed by Fairpointe.
Fees, Profitability and Economies of Scale. The Board considered the subadvisory fee rate under the Sub-Investment Advisory Agreement as well as the overall management fee structure of the New Fund, including the amount of management fee to be retained by Aston after payment of the subadvisory fee. The Board considered that the subadvisory fee rate had been negotiated at arm’s length between Aston and Fairpointe, an unaffiliated third party, and that Aston would compensate Fairpointe from the investment advisory fees it receives from the New Fund. As part of its review of the investment advisory agreement with Aston, the Board considered whether there will be economies of scale with respect to the overall fee structure of the New Fund and whether the New Fund will benefit from any economies of scale.
The Board determined that profitability information with respect to Fairpointe was not material to its considerations in light of the fee model used by Aston and the unaffiliated status of Fairpointe. The Board concluded that the proposed subadvisory fee rate was reasonable in light of the nature, quality and extent of services to be provided and that economies of scale were limited at this time.
| | |
| |
| | April 30, 2015 |
| |
| Additional Information (unaudited) – continued | | |
Other Benefits to the Subadviser. The Board also considered the character and amount of other incidental benefits expected to be received by Fairpointe and its affiliates. The Board considered potential benefits to Fairpointe from the use of “soft dollars” to pay for research services generated by parties other than the executing broker-dealer. The Board concluded that the subadvisory fees were reasonable, taking into account any other benefits expected to be received by Fairpointe from its relationship with the New Fund.
Conclusion. Based on all of the information considered and the conclusions reached, the Board determined that the terms of the Sub-Investment Advisory Agreement are fair and reasonable, and that the approval of the Sub-Investment Advisory Agreement is in the best interests of the New Fund. No single factor was determinative in the Board’s analysis and each Trustee may have given different weight to the various factors.
CONSIDERATIONS OF THE BOARD OF TRUSTEES IN CONNECTION WITH THE APPROVAL OF THE SUB-INVESTMENT ADVISORY AGREEMENT FOR ASTON/TAMRO INTERNATIONAL SMALL CAP FUND
At an in-person meeting held on December 18, 2014, the Board of Trustees (the “Board”) of Aston Funds (the “Trust”), including the trustees who are not “interested persons,” as defined in Section 2(a)(19) of the Investment Company Act of 1940, as amended (the “Independent Trustees”), considered the approval of a Sub-Investment Advisory Agreement (the “Sub-Investment Advisory Agreement”) between Aston Asset Management, LLC (“Aston”) and TAMRO Capital Partners LLC (“TAMRO) with respect to ASTON/TAMRO International Small Cap Fund (the “New Fund”). The Board considered information provided and discussions held at the December 18, 2014 meeting and at prior meetings. The Independent Trustees met separately from the Trustees who are “interested persons” of the Trust as defined in Section 2(a)(19) of the Investment Company Act of 1940, as amended, and any officers of Aston, TAMRO or their respective affiliates to consider approval of the Sub-Investment Advisory Agreement. The Independent Trustees were assisted by independent legal counsel in their deliberations.
Among the matters considered by the Board, including the Independent Trustees, in connection with its approval of the Sub-Investment Advisory Agreement were the following:
Nature, Quality and Extent of Services. The Board considered the nature, quality and extent of services expected to be provided under the Sub-Investment Advisory Agreement. The Board considered the reputation, qualifications and background of TAMRO and its operational and compliance infrastructures. The Board also considered information provided regarding TAMRO’s investment approach, the experience and skills of senior management and investment personnel of TAMRO, the resources made available to such personnel, the ability of TAMRO to attract and retain high-quality personnel and the organizational depth of TAMRO. The Board also considered the nature and quality of services provided by TAMRO with respect to other series of the
Trust. The Board also considered TAMRO’s risk management processes. On the basis of this evaluation, the Board concluded that the nature, quality and extent of services to be provided by TAMRO are expected to be satisfactory.
Performance. Because the New Fund had not yet commenced operations, the Board noted that they could not draw any conclusions regarding the performance of the New Fund. The Board, however, took into account that the New Fund will utilize a similar investment process to that used by TAMRO with respect to other series of the Trust it manages, and the Board is generally satisfied with the performance of such series.
Fees, Profitability and Economies of Scale. The Board considered the subadvisory fee rate under the Sub-Investment Advisory Agreement as well as the overall management fee structure of the New Fund, including the amount of management fee to be retained by Aston after payment of the subadvisory fee. The Board considered that the subadvisory fee rate had been negotiated at arm’s length between Aston and TAMRO, an unaffiliated third party, and that Aston would compensate TAMRO from the investment advisory fees it receives from the New Fund. As part of its review of the investment advisory agreement with Aston, the Board considered whether there will be economies of scale with respect to the overall fee structure of the New Fund and whether the New Fund will benefit from any economies of scale.
The Board determined that profitability information with respect to TAMRO was not material to its considerations in light of the fee model used by Aston and the unaffiliated status of TAMRO. The Board concluded that the proposed subadvisory fee rate was reasonable in light of the nature, quality and extent of services to be provided and that economies of scale were limited at this time.
Other Benefits to the Subadviser. The Board also considered the character and amount of other incidental benefits expected to be received by TAMRO and its affiliates. The Board considered potential benefits to TAMRO from the use of “soft dollars” to pay for research services generated by parties other than the executing broker-dealer. The Board concluded that the subadvisory fees were reasonable, taking into account any other benefits expected to be received by TAMRO from its relationship with the New Fund.
Conclusion. Based on all of the information considered and the conclusions reached, the Board determined that the terms of the Sub-Investment Advisory Agreement are fair and reasonable, and that the approval of the Sub-Investment Advisory Agreement is in the best interests of the New Fund. No single factor was determinative in the Board’s analysis and each Trustee may have given different weight to the various factors.
Disclosure of Fund Expenses: We believe it is important for you to understand the impact of fees regarding your investment. All mutual funds have operating expenses. As a shareholder of a mutual fund, you incur ongoing costs, which include costs for
| | |
| |
| | April 30, 2015 |
| |
| Additional Information (unaudited) – continued | | |
portfolio management, administrative services, and shareholder reports (like this one), among others. Operating expenses, which are deducted from a fund’s gross income, directly reduce the investment return of the fund. A fund’s expenses are expressed as a percentage of its average daily net assets. This figure is known as the expense ratio. The following examples are intended to help you understand the ongoing fees (in dollars) of investing in your Fund and to compare these costs with those of other mutual funds. The examples are based on an investment of $1,000 made at the beginning of the period shown and held for the entire period.
The below table illustrates each Fund’s costs in two ways:
Actual Fund Return: This section helps you to estimate the actual expenses, after any applicable fee waivers, that you paid over the period. The “Ending Account Value” shown is derived from the Fund’s actual return for the past six-month period, the “Expense Ratio” column shows the period’s annualized expense ratio, and the “Expenses Paid During Period” column shows the dollar amount that would have been paid by an investor who started with $1,000 in the Fund at the beginning of the period. You may use the information here, together with your account value, to estimate the expenses that you paid over the period. To do so, simply divide your account value by $1,000 (for example, an $8,600 account value divided by $1,000 = 8.6), then multiply the result by the number given for your Fund in the first line under the heading entitled “Expenses Paid During Period.”
Hypothetical 5% Return: This section is intended to help you compare your Fund’s costs with those of other mutual funds. It assumes that the Fund had an annual return of 5% before expenses, but that the expense ratio is unchanged. In this case, because the return used is not the Fund’s actual return, the results do not apply to your investment. This example is useful in making comparisons to other mutual funds because the SEC requires all mutual funds to calculate expenses based on an assumed 5% annual return. You can assess your Fund’s costs by comparing this hypothetical example with the hypothetical examples that appear in shareholder reports of other funds.
Please note that the expenses shown in the table are meant to highlight and help you compare your ongoing costs only and do not reflect any transactional costs such as sales charges (loads) and redemption fees, which are described in the prospectus. If these costs were applied to your account, your costs would be higher.
| | | | | | | | | | | | | | | | |
| | | Beginning
Account
Value
11/01/14 | | | Ending
Account
Value
04/30/15 | | | Expense
Ratio(1) | | | Expenses
Paid During
Period(2) | |
| Cornerstone Large Cap Value Fund | | | | | | | | | |
Actual Fund Return | | | | | | | | | | | | | | | | |
Class N | | | $1,000 | | | | $987.60 | | | | 1.26% | | | | $6.21 | |
Class I | | | 1,000 | | | | 989.10 | | | | 1.01% | | | | 4.98 | |
Hypothetical 5% Return | | | | | | | | | | | | | | | | |
Class N | | | $1,000 | | | | $1,018.55 | | | | 1.26% | | | | $6.31 | |
Class I | | | 1,000 | | | | 1,019.79 | | | | 1.01% | | | | 5.06 | |
| | | | | | | | | | | | | | | | |
| | | Beginning
Account
Value
11/01/14 | | | Ending
Account
Value
04/30/15 | | | Expense
Ratio(1) | | | Expenses
Paid During
Period(2) | |
| Fairpointe Focused Equity Fund(3) | | | | | | | | | |
Actual Fund Return | | | | | | | | | | | | | | | | |
Class N | | | $1,000 | | | | $1,046.00 | | | | 1.15% | | | | $4.83 | |
Class I | | | 1,000 | | | | 1,047.00 | | | | 0.90% | | | | 3.78 | |
Hypothetical 5% Return | | | | | | | | | | | | | | | | |
Class N | | | $1,000 | | | | $1,019.09 | | | | 1.15% | | | | $5.76 | |
Class I | | | 1,000 | | | | 1,020.33 | | | | 0.90% | | | | 4.51 | |
| Herndon Large Cap Value Fund | |
Actual Fund Return | | | | | | | | | | | | | | | | |
Class N | | | $1,000 | | | | $1,010.50 | | | | 1.30% | | | | $6.48 | |
Class I | | | 1,000 | | | | 1,012.20 | | | | 1.05% | | | | 5.24 | |
Hypothetical 5% Return | | | | | | | | | | | | | | | | |
Class N | | | $1,000 | | | | $1,018.35 | | | | 1.30% | | | | $6.51 | |
Class I | | | 1,000 | | | | 1,019.59 | | | | 1.05% | | | | 5.26 | |
| Montag & Caldwell Growth Fund | | | | | | | | | |
Actual Fund Return | | | | | | | | | | | | | | | | |
Class N | | | $1,000 | | | | $1,031.90 | | | | 1.04% | | | | $5.24 | |
Class I | | | 1,000 | | | | 1,032.80 | | | | 0.79% | | | | 3.98 | |
Class R | | | 1,000 | | | | 1,030.20 | | | | 1.29% | | | | 6.49 | |
Hypothetical 5% Return | | | | | | | | | | | | | | | | |
Class N | | | $1,000 | | | | $1,019.64 | | | | 1.04% | | | | $5.21 | |
Class I | | | 1,000 | | | | 1,020.88 | | | | 0.79% | | | | 3.96 | |
Class R | | | 1,000 | | | | 1,018.40 | | | | 1.29% | | | | 6.46 | |
| TAMRO Diversified Equity Fund | | | | | | | | | |
Actual Fund Return | | | | | | | | | | | | | | | | |
Class N | | | $1,000 | | | | $1,024.10 | | | | 1.20% | | | | $6.02 | |
Class I | | | 1,000 | | | | 1,025.10 | | | | 0.95% | | | | 4.77 | |
Hypothetical 5% Return | | | | | | | | | | | | | | | | |
Class N | | | $1,000 | | | | $1,018.84 | | | | 1.20% | | | | $6.01 | |
Class I | | | 1,000 | | | | 1,020.08 | | | | 0.95% | | | | 4.76 | |
| River Road Dividend All Cap Value Fund | |
Actual Fund Return | | | | | | | | | | | | | | | | |
Class N | | | $1,000 | | | | $1,036.30 | | | | 1.09% | | | | $5.50 | |
Class I | | | 1,000 | | | | 1,037.60 | | | | 0.84% | | | | 4.24 | |
Hypothetical 5% Return | | | | | | | | | | | | | | | | |
Class N | | | $1,000 | | | | $1,019.39 | | | | 1.09% | | | | $5.46 | |
Class I | | | 1,000 | | | | 1,020.63 | | | | 0.84% | | | | 4.21 | |
| River Road Dividend All Cap Value Fund II | |
Actual Fund Return | | | | | | | | | | | | | | | | |
Class N | | | $1,000 | | | | $1,032.50 | | | | 1.15% | | | | $5.80 | |
Class I | | | 1,000 | | | | 1,034.60 | | | | 0.90% | | | | 4.54 | |
Hypothetical 5% Return | | | | | | | | | | | | | | | | |
Class N | | | $1,000 | | | | $1,019.09 | | | | 1.15% | | | | $5.76 | |
Class I | | | 1,000 | | | | 1,020.33 | | | | 0.90% | | | | 4.51 | |
| Fairpointe Mid Cap Fund | | | | | | | | | |
Actual Fund Return | | | | | | | | | | | | | | | | |
Class N | | | $1,000 | | | | $1,071.50 | | | | 1.10% | | | | $5.65 | |
Class I | | | 1,000 | | | | 1,072.90 | | | | 0.85% | | | | 4.37 | |
Hypothetical 5% Return | | | | | | | | | | | | | | | | |
Class N | | | $1,000 | | | | $1,019.34 | | | | 1.10% | | | | $5.51 | |
Class I | | | 1,000 | | | | 1,020.58 | | | | 0.85% | | | | 4.26 | |
| Montag & Caldwell Mid Cap Growth Fund | | | | | | | | | |
Actual Fund Return | | | | | | | | | | | | | | | | |
Class N | | | $1,000 | | | | $1,070.70 | | | | 1.25% | | | | $6.42 | |
Class I | | | 1,000 | | | | 1,072.50 | | | | 1.00% | | | | 5.14 | |
Hypothetical 5% Return | | | | | | | | | | | | | | | | |
Class N | | | $1,000 | | | | $1,018.60 | | | | 1.25% | | | | $6.26 | |
Class I | | | 1,000 | | | | 1,019.84 | | | | 1.00% | | | | 5.01 | |
| | |
| |
| | April 30, 2015 |
| |
| Additional Information (unaudited) – continued | | |
| | | | | | | | | | | | | | | | |
| | | Beginning
Account
Value
11/01/14 | | | Ending
Account
Value
04/30/15 | | | Expense
Ratio(1) | | | Expenses
Paid During
Period(2) | |
| LMCG Small Cap Growth Fund | | | | | | | | | |
Actual Fund Return | | | | | | | | | | | | | | | | |
Class N | | | $1,000 | | | | $1,081.80 | | | | 1.35% | | | | $6.97 | |
Class I | | | 1,000 | | | | 1,082.50 | | | | 1.10% | | | | 5.68 | |
Hypothetical 5% Return | | | | | | | | | | | | | | | | |
Class N | | | $1,000 | | | | $1,018.10 | | | | 1.35% | | | | $6.76 | |
Class I | | | 1,000 | | | | 1,019.34 | | | | 1.10% | | | | 5.51 | |
| River Road Independent Value Fund | |
Actual Fund Return | | | | | | | | | | | | | | | | |
Class N | | | $1,000 | | | | $1,006.20 | | | | 1.42% | | | | $7.06 | |
Class I | | | 1,000 | | | | 1,008.00 | | | | 1.17% | | | | 5.83 | |
Hypothetical 5% Return | | | | | | | | | | | | | | | | |
Class N | | | $1,000 | | | | $1,017.75 | | | | 1.42% | | | | $7.10 | |
Class I | | | 1,000 | | | | 1,018.99 | | | | 1.17% | | | | 5.86 | |
| River Road Select Value Fund | | | | | | | | | |
Actual Fund Return | | | | | | | | | | | | | | | | |
Class N | | | $1,000 | | | | $1,054.20 | | | | 1.48% | | | | $7.54 | |
Class I | | | 1,000 | | | | 1,056.00 | | | | 1.23% | | | | 6.27 | |
Hypothetical 5% Return | | | | | | | | | | | | | | | | |
Class N | | | $1,000 | | | | $1,017.46 | | | | 1.48% | | | | $7.40 | |
Class I | | | 1,000 | | | | 1,018.70 | | | | 1.23% | | | | 6.16 | |
| River Road Small Cap Value Fund | | | | | | | | | |
Actual Fund Return | | | | | | | | | | | | | | | | |
Class N | | | $1,000 | | | | $1,052.30 | | | | 1.33% | | | | $6.77 | |
Class I | | | 1,000 | | | | 1,053.60 | | | | 1.08% | | | | 5.50 | |
Hypothetical 5% Return | | | | | | | | | | | | | | | | |
Class N | | | $1,000 | | | | $1,018.20 | | | | 1.33% | | | | $6.66 | |
Class I | | | 1,000 | | | | 1,019.44 | | | | 1.08% | | | | 5.41 | |
| Silvercrest Small Cap Fund | | | | | | | | | | | | | |
Actual Fund Return | | | | | | | | | | | | | | | | |
Class N | | | $1,000 | | | | $1,020.70 | | | | 1.40% | | | | $7.01 | |
Class I | | | 1,000 | | | | 1,021.70 | | | | 1.15% | | | | 5.76 | |
Hypothetical 5% Return | | | | | | | | | | | | | | | | |
Class N | | | $1,000 | | | | $1,017.85 | | | | 1.40% | | | | $7.00 | |
Class I | | | 1,000 | | | | 1,019.09 | | | | 1.15% | | | | 5.76 | |
| TAMRO Small Cap Fund | | | | | | | | | | | | | |
Actual Fund Return | | | | | | | | | | | | | | | | |
Class N | | | $1,000 | | | | $1,018.00 | | | | 1.32% | | | | $6.60 | |
Class I | | | 1,000 | | | | 1,018.90 | | | | 1.07% | | | | 5.36 | |
Hypothetical 5% Return | | | | | | | | | | | | | | | | |
Class N | | | $1,000 | | | | $1,018.25 | | | | 1.32% | | | | $6.61 | |
Class I | | | 1,000 | | | | 1,019.49 | | | | 1.07% | | | | 5.36 | |
| DoubleLine Core Plus Fixed Income Fund | |
Actual Fund Return | | | | | | | | | | | | | | | | |
Class N | | | $1,000 | | | | $1,019.20 | | | | 0.94% | | | | $4.71 | |
Class I | | | 1,000 | | | | 1,020.30 | | | | 0.69% | | | | 3.46 | |
Hypothetical 5% Return | | | | | | | | | | | | | | | | |
Class N | | | $1,000 | | | | $1,020.13 | | | | 0.94% | | | | $4.71 | |
Class I | | | 1,000 | | | | 1,021.37 | | | | 0.69% | | | | 3.46 | |
| TCH Fixed Income Fund | | | | | | | | | | | | | |
Actual Fund Return | | | | | | | | | | | | | | | | |
Class N | | | $1,000 | | | | $1,014.00 | | | | 0.94% | | | | $4.69 | |
Class I | | | 1,000 | | | | 1,015.20 | | | | 0.69% | | | | 3.45 | |
Hypothetical 5% Return | | | | | | | | | | | | | | | | |
Class N | | | $1,000 | | | | $1,020.13 | | | | 0.94% | | | | $4.71 | |
Class I | | | 1,000 | | | | 1,021.37 | | | | 0.69% | | | | 3.46 | |
| | | | | | | | | | | | | | | | |
| | | Beginning
Account
Value
11/01/14 | | | Ending
Account
Value
04/30/15 | | | Expense
Ratio(1) | | | Expenses
Paid During
Period(2) | |
| Anchor Capital Enhanced Equity Fund | |
Actual Fund Return | | | | | | | | | | | | | | | | |
Class N | | | $1,000 | | | | $1,034.30 | | | | 1.17% | | | | $5.90 | |
Class I | | | 1,000 | | | | 1,035.50 | | | | 0.92% | | | | 4.64 | |
Hypothetical 5% Return | | | | | | | | | | | | | | | | |
Class N | | | $1,000 | | | | $1,018.99 | | | | 1.17% | | | | $5.86 | |
Class I | | | 1,000 | | | | 1,020.23 | | | | 0.92% | | | | 4.61 | |
| Lake Partners LASSO Alternatives Fund | |
Actual Fund Return | | | | | | | | | | | | | | | | |
Class N | | | $1,000 | | | | $1,001.70 | | | | 1.42% | | | | $7.05 | |
Class I | | | 1,000 | | | | 1,002.70 | | | | 1.17% | | | | 5.81 | |
Hypothetical 5% Return | | | | | | | | | | | | | | | | |
Class N | | | $1,000 | | | | $1,017.75 | | | | 1.42% | | | | $7.10 | |
Class I | | | 1,000 | | | | 1,018.99 | | | | 1.17% | | | | 5.86 | |
| River Road Long-Short Fund(4) | | | | | | | | | |
Actual Fund Return | | | | | | | | | | | | | | | | |
Class N | | | $1,000 | | | | $1,043.30 | | | | 1.70% | | | | $8.61 | |
Class I | | | 1,000 | | | | 1,044.90 | | | | 1.45% | | | | 7.35 | |
Hypothetical 5% Return | | | | | | | | | | | | | | | | |
Class N | | | $1,000 | | | | $1,016.36 | | | | 1.70% | | | | $8.50 | |
Class I | | | 1,000 | | | | 1,017.60 | | | | 1.45% | | | | 7.25 | |
| Barings International Fund | | | | | | | | | | | | | |
Actual Fund Return | | | | | | | | | | | | | | | | |
Class N | | | $1,000 | | | | $1,083.40 | | | | 1.40% | | | | $7.23 | |
Class I | | | 1,000 | | | | 1,084.90 | | | | 1.15% | | | | 5.94 | |
Hypothetical 5% Return | | | | | | | | | | | | | | | | |
Class N | | | $1,000 | | | | $1,017.85 | | | | 1.40% | | | | $7.00 | |
Class I | | | 1,000 | | | | 1,019.09 | | | | 1.15% | | | | 5.76 | |
| Guardian Capital Global Dividend Fund | |
Actual Fund Return | | | | | | | | | | | | | | | | |
Class N | | | $1,000 | | | | $1,027.40 | | | | 1.30% | | | | $6.53 | |
Class I | | | 1,000 | | | | 1,026.30 | | | | 1.05% | | | | 5.28 | |
Hypothetical 5% Return | | | | | | | | | | | | | | | | |
Class N | | | $1,000 | | | | $1,018.35 | | | | 1.30% | | | | $6.51 | |
Class I | | | 1,000 | | | | 1,019.59 | | | | 1.05% | | | | 5.26 | |
| LMCG Emerging Markets Fund | | | | | | | | | |
Actual Fund Return | | | | | | | | | | | | | | | | |
Class N | | | $1,000 | | | | $1,031.90 | | | | 1.43% | | | | $7.20 | |
Class I | | | 1,000 | | | | 1,034.40 | | | | 1.18% | | | | 5.95 | |
Hypothetical 5% Return | | | | | | | | | | | | | | | | |
Class N | | | $1,000 | | | | $1,017.70 | | | | 1.43% | | | | $7.15 | |
Class I | | | 1,000 | | | | 1,018.94 | | | | 1.18% | | | | 5.91 | |
Pictet International Fund | | | | | | | | | |
Actual Fund Return | | | | | | | | | | | | | | | | |
Class N | | | $1,000 | | | | $1,073.30 | | | | 1.40% | | | | $7.20 | |
Class I | | | 1,000 | | | | 1,075.30 | | | | 1.15% | | | | 5.92 | |
Hypothetical 5% Return | | | | | | | | | | | | | | | | |
Class N | | | $1,000 | | | | $1,017.85 | | | | 1.40% | | | | $7.00 | |
Class I | | | 1,000 | | | | 1,019.09 | | | | 1.15% | | | | 5.76 | |
TAMRO International Small Cap Fund(5) | |
Actual Fund Return | | | | | | | | | | | | | | | | |
Class N | | | $1,000 | | | | $1,078.00 | | | | 1.50% | | | | $6.42 | |
Class I | | | 1,000 | | | | 1,079.00 | | | | 1.25% | | | | 5.36 | |
Hypothetical 5% Return | | | | | | | | | | | | | | | | |
Class N | | | $1,000 | | | | $1,017.36 | | | | 1.50% | | | | $7.50 | |
Class I | | | 1,000 | | | | 1,018.60 | | | | 1.25% | | | | 6.26 | |
| | |
| |
| | April 30, 2015 |
| |
| Additional Information (unaudited) – continued | | |
| | | | | | | | | | | | | | | | |
| | | Beginning
Account
Value
11/01/14 | | | Ending
Account
Value
04/30/15 | | | Expense
Ratio(1) | | | Expenses
Paid During
Period(2) | |
| Harrison Street Real Estate Fund | | | | | | | | | | | | | |
Actual Fund Return | | | | | | | | | | | | | | | | |
Class N | | | $1,000 | | | | $994.20 | | | | 1.37% | | | | $6.77 | |
Class I | | | 1,000 | | | | 995.80 | | | | 1.12% | | | | 5.54 | |
Hypothetical 5% Return | | | | | | | | | | | | | | | | |
Class N | | | $1,000 | | | | $1,018.00 | | | | 1.37% | | | | $6.85 | |
Class I | | | 1,000 | | | | 1,019.24 | | | | 1.12% | | | | 5.61 | |
| Montag & Caldwell Balanced Fund | | | | | | | | | | | | | |
Actual Fund Return | | | | | | | | | | | | | | | | |
Class N | | | $1,000 | | | | $1,026.70 | | | | 1.20% | | | | $6.03 | |
Class I | | | 1,000 | | | | 1,027.20 | | | | 1.10% | | | | 5.53 | |
Hypothetical 5% Return | | | | | | | | | | | | | | | | |
Class N | | | $1,000 | | | | $1,018.84 | | | | 1.20% | | | | $6.01 | |
Class I | | | 1,000 | | | | 1,019.34 | | | | 1.10% | | | | 5.51 | |
| (1) | Annualized, based on the Fund’s most recent fiscal half-year expenses. |
| (2) | Expenses are equal to the Fund’s annualized expense ratio multiplied by the average account value over the period, multiplied by the number of days in the most recent fiscal half-year (181) or partial year, if applicable, for the actual return and multiplied by the most recent fiscal half-year for the hypothetical 5% return, then divided by 365. Expense ratios do not include interest expense, if applicable. |
| (3) | The inception date for Fairpointe Focused Equity Fund is December 24, 2014. |
| (4) | Excludes interest expense and dividends on short positions. If included, your annualized expense ratios would be 2.68% and 2.43% for Class N and Class I, respectively and your actual and hypothetical expenses paid during the period would be $13.58 and $13.37 and $12.32 and $12.13 for Class N and Class I, respectively. |
| (5) | The inception date for TAMRO International Small Cap Fund is December 23, 2014. |
Aston Funds
ADVISER
Aston Asset Management, LLC
120 N. LaSalle Street, 25th Floor
Chicago, IL 60602
SUBADVISERS
Anchor Capital Advisors LLC
One Post Office Square, Suite 3850
Boston, MA 02109
Baring International Investment Limited
155 Bishopsgate
London, EC2M 3XY UK
Cornerstone Investment Partners, LLC
Phipps Tower
3438 Peachtree Road NE, Suite 900
Atlanta, GA 30326
DoubleLine Capital LP
333 South Grand Avenue, Suite 1800
Los Angeles, CA 90071
Fairpointe Capital LLC
One North Franklin, Suite 3300
Chicago, IL 60606
Guardian Capital LP
199 Bay Street, Suite 3100
Toronto, ON, M5L 1E8
Harrison Street Securities, LLC
71 South Wacker Drive, Suite 3575
Chicago, IL 60606
Herndon Capital Management, LLC
191 Peachtree Street, NE, Suite 2500
Atlanta, GA 30303
Lake Partners, Inc.
4 High Ridge Park, Suite 300
Stamford, CT 06905
LMCG Investments, LLC
200 Clarendon Street, 28th Floor
Boston, MA 02116
SUBADVISERS - continued
Montag & Caldwell, LLC
3455 Peachtree Road NE, Suite 1200
Atlanta, GA 30326
Pictet Asset Management Limited
120 London Wall
London, EC2Y 5ET UK
River Road Asset Management, LLC
Meidinger Tower, Suite 2000
462 South Fourth Street
Louisville, KY 40202
Silvercrest Asset Management Group LLC
1330 Avenue of the Americas, 38th Floor
New York, NY 10019
TAMRO Capital Partners LLC
1701 Duke St., Suite 250
Alexandria, VA 22314
Taplin, Canida & Habacht LLC
1001 Brickell Bay Drive, Suite 2100
Miami, FL 33131
SHAREHOLDER SERVICES
Aston Funds
P.O. Box 9765
Providence, RI 02940
DISTRIBUTOR
Foreside Funds Distributors LLC
400 Berwyn Park
899 Cassatt Road
Berwyn, PA 19312
OFFICERS
Stuart D. Bilton, President and Chief Executive Officer
Gerald F. Dillenburg, Senior Vice President, Chief Operating Officer and Chief Compliance Officer
Mark J. Duggan, Secretary and Chief Legal Officer
Laura M. Curylo, Treasurer and Chief Financial Officer
Juli A. Braun, Assistant Treasurer
Michael A. Cozzi, Assistant Treasurer
James A. Dimmick, Assistant Secretary
Marc J. Peirce, Assistant Secretary
Diana R. Podgorny, Assistant Secretary
CUSTODIAN
The Bank of New York Mellon
One Wall Street
New York, New York 10286
LEGAL COUNSEL
Vedder Price P.C.
222 N. LaSalle Street
Chicago, IL 60601
INDEPENDENT REGISTERED PUBLIC ACCOUNTING FIRM
Ernst & Young LLP
155 N. Wacker Drive
Chicago, IL 60606
THE STATEMENT OF ADDITIONAL INFORMATION INCLUDES ADDITIONAL INFORMATION ABOUT FUND TRUSTEES AND IS AVAILABLE UPON REQUEST WITHOUT CHARGE BY CALLING 800-992-8151.
Guide to Shareholder Benefits
We’re delighted to offer all Aston Funds shareholders a variety of services and convenient options. To receive more information about any of these benefits, simply call an Investor Services Associate Monday through Friday, 9 a.m. – 7 p.m. Eastern Time.
THE EASY WAY TO ADD TO YOUR ACCOUNT: START AN AUTOMATIC INVESTMENT PLAN
For Class N shareholders, systematic investing is an easy, effortless way to help reach any investment goal. Just choose a fixed amount, and we’ll automatically deduct it from your checking or savings account on a regular schedule and invest it in your Aston Funds account. Periodic investment plans involve continuous investments in securities regardless of price. You should consider your financial ability to continue to purchase shares through periods of both high and low price levels. This plan does not assure a profit and does not protect against loss in declining markets.
COMPOUND YOUR EARNINGS WITH AUTOMATIC DIVIDEND REINVESTMENT
By automatically reinvesting dividends into your Fund account, profits have the opportunity to mount. Monthly and quarterly dividends and annual capital gain distributions are reinvested at no charge.
ACCESS INFORMATION AND MAKE TRANSACTIONS ONLINE AT OUR WEBSITE
You can open a new account, access account balances, view statements, obtain fund information, and make transactions online 24 hours a day, 7 days a week.
| | |
| | www.astonfunds.com |
| |
| | Our Automated Shareholder Services Line Is at Your Service 24 Hours a Day |
| | 800-992-8151 |
Investor Services
Associates are available to assist you Monday – Friday 9 a.m. to 7 p.m., Eastern Time. Or, call any time, day or night, for automated account information to make exchanges or check fund performance.

Aston Funds
P.O. Box 9765
Providence, Rhode Island 02940
ATSEM 15
Not applicable.
| Item 3. | Audit Committee Financial Expert. |
Not applicable.
| Item 4. | Principal Accountant Fees and Services. |
Not applicable.
| Item 5. | Audit Committee of Listed Registrants. |
Not applicable.
| (a) | Schedule of Investments in securities of unaffiliated issuers as of the close of the reporting period is included as part of the report to shareholders filed under Item 1 of this form. |
| Item 7. | Disclosure of Proxy Voting Policies and Procedures for Closed-End Management Investment Companies. |
Not applicable.
| Item 8. | Portfolio Managers of Closed-End Management Investment Companies. |
Not applicable.
| Item 9. | Purchases of Equity Securities by Closed-End Management Investment Company and Affiliated Purchasers. |
Not applicable.
| Item 10. | Submission of Matters to a Vote of Security Holders. |
There have been no material changes to the procedures by which the shareholders may recommend nominees to the registrant’s board of directors, where those changes were implemented after the registrant last provided disclosure in response to the requirements of Item 407(c)(2)(iv) of Regulation S-K (17 CFR 229.407) (as required by Item 22(b)(15) of Schedule 14A (17 CFR 240.14a-101)), or this Item.
| Item 11. | Controls and Procedures. |
| | (a) | The registrant’s principal executive and principal financial officers, or persons performing similar functions, have concluded that the registrant’s disclosure controls and procedures (as defined in Rule 30a-3(c) under the Investment Company Act of 1940, as amended (the “1940 Act”) (17 CFR 270.30a-3(c))) are effective, as of a date within 90 days of the filing date of the report that includes the disclosure required by this paragraph, based on their evaluation of these controls and procedures required by Rule 30a-3(b) under the 1940 Act (17 CFR 270.30a-3(b)) and Rules 13a-15(b) or 15d-15(b) under the Securities Exchange Act of 1934, as amended (17 CFR 240.13a-15(b) or 240.15d-15(b)). |
| | (b) | There were no changes in the registrant’s internal control over financial reporting (as defined in Rule 30a-3(d) under the 1940 Act (17 CFR 270.30a-3(d))) that occurred during the registrant’s second fiscal quarter of the period covered by this report that has materially affected, or is reasonably likely to materially affect, the registrant’s internal control over financial reporting. |
| | (a)(2) | Certifications pursuant to Rule 30a-2(a) under the 1940 Act and Section 302 of the Sarbanes-Oxley Act of 2002 are attached hereto. |
| | (b) | Certifications pursuant to Rule 30a-2(b) under the 1940 Act and Section 906 of the Sarbanes-Oxley Act of 2002 are attached hereto. |
SIGNATURES
Pursuant to the requirements of the Securities Exchange Act of 1934 and the Investment Company Act of 1940, the registrant has duly caused this report to be signed on its behalf by the undersigned, thereunto duly authorized.
| | | | |
| | |
By (Signature and Title)* | | /s/ Stuart D. Bilton | | |
| | Stuart D. Bilton, Chief Executive Officer and President | | |
| | (principal executive officer) | | |
Pursuant to the requirements of the Securities Exchange Act of 1934 and the Investment Company Act of 1940, this report has been signed below by the following persons on behalf of the registrant and in the capacities and on the dates indicated.
| | | | |
By (Signature and Title)* | | /s/ Stuart D. Bilton | | |
| | Stuart D. Bilton, Chief Executive Officer and President | | |
| | (principal executive officer) | | |
| | | | |
| | |
By (Signature and Title)* | | /s/ Laura M. Curylo | | |
| | Laura M. Curylo, Treasurer and Chief Financial Officer | | |
| | (principal financial officer) | | |
* Print the name and title of each signing officer under his or her signature.