UNITED STATES
SECURITIES AND EXCHANGE COMMISSION
Washington, D.C. 20549
FORM N-CSRS
CERTIFIED SHAREHOLDER REPORT OF REGISTERED
MANAGEMENT INVESTMENT COMPANIES
Investment Company Act file number: 811-08004
AMG FUNDS IV
(Exact name of registrant as specified in charter)
600 Steamboat Road, Suite 300, Greenwich, Connecticut 06830
(Address of principal executive offices) (Zip code)
AMG Funds LLC
600 Steamboat Road, Suite 300, Greenwich, Connecticut 06830
(Name and address of agent for service)
Registrant’s telephone number, including area code: (203) 299-3500
Date of fiscal year end: OCTOBER 31
Date of reporting period: NOVEMBER 1, 2016 – APRIL 30, 2017 (Semi-Annual Shareholder Report)
| Item 1. | Reports to Shareholders |

| | | | |
| Semi-Annual Report 2017 | | | April 30, 2017 | |
AMG Funds Class N, I, R & Z Shares Equity Fixed Income Alternative International Balanced | |
Large Cap Funds
AMG Managers Fairpointe Focused Equity Fund
AMG River Road Focused Absolute Value Fund
AMG Managers Montag & Caldwell Growth Fund
Equity Income Funds
AMG River Road Dividend All Cap Value Fund
AMG River Road Dividend All Cap Value Fund II
Mid Cap Funds
AMG Managers Fairpointe Mid Cap Fund
AMG Managers Montag & Caldwell Mid Cap Growth Fund
Small Cap Funds
AMG Managers LMCG Small Cap Growth Fund
AMG River Road Select Value Fund
AMG River Road Small Cap Value Fund
AMG Managers Silvercrest Small Cap Fund
AMG GW&K U.S. Small Cap Growth Fund
Fixed Income Fund
AMG Managers DoubleLine Core Plus Bond Fund
Alternative Funds
AMG Managers Lake Partners LASSO Alternatives Fund
AMG River Road Long-Short Fund
International Funds
AMG Managers Guardian Capital Global Dividend Fund
AMG Managers Pictet International Fund
AMG Managers Value Partners Asia Dividend Fund
Balanced Fund
AMG Managers Montag & Caldwell Balanced Fund
Table of Contents
Nothing contained herein is to be considered an offer, sale or solicitation of an offer to buy shares of any series of the AMG Funds family of mutual funds. Such offering is made only by prospectus, which includes details as to offering price and other material information.
AMG Funds are distributed by AMG Distributors, Inc., member FINRA/SIPC, 600 Steamboat Road, Suite 300, Greenwich, CT 06830
Shareholder Services 800-835-3879 • www.amgfunds.com
NOT FDIC INSURED • NO BANK GUARANTEE • MAY LOSE VALUE
AMG Funds
| | |
| | As of April 30, 2017 |
| Fund Performance (unaudited) | | |
| | | | | | | | | | | | | | | | | | | | | | | | | | | | |
Average Annual Total Returns 1 | | Class | | | Six
Months † | | | One
Year | | | Five
Years | | | Ten
Years | | | Since
Inception | | | Inception
Date | |
Equity Funds | | | | | | | | | | | | | | | | | | | | | | | | | | | | |
AMG Managers Fairpointe Focused Equity Fund 2,3,4,5,6 | | | N | | | | 18.30 | % | | | 24.77 | % | | | — | | | | — | | | | 6.23 | % | | | 12/24/14 | |
| | | I | | | | 18.49 | | | | 25.09 | | | | — | | | | — | | | | 6.50 | | | | 12/24/14 | |
| | | | | | | |
AMG River Road Focused Absolute Value Fund 2,3,4,5,6,7,8,9 | | | N | | | | 14.95 | | | | 23.12 | | | | — | | | | — | | | | 15.94 | | | | 11/03/15 | |
| | | I | | | | 15.05 | | | | 23.45 | | | | — | | | | — | | | | 16.23 | | | | 11/03/15 | |
| | | | | | | |
AMG Managers Montag & Caldwell Growth Fund 2,3,10 | | | N | | | | 8.84 | | | | 9.39 | | | | 9.47 | % | | | 7.08 | % | | | 8.87 | | | | 11/02/94 | |
| | | I | | | | 8.97 | | | | 9.69 | | | | 9.74 | | | | 7.35 | | | | 7.58 | | | | 06/28/96 | |
| | | R | | | | 8.72 | | | | 9.12 | | | | 9.19 | | | | 6.82 | | | | 7.33 | | | | 12/31/02 | |
| | | | | | | |
AMG River Road Dividend All Cap Value Fund 2,3,4,5,6,9,11 | | | N | | | | 10.96 | | | | 13.28 | | | | 11.66 | | | | 6.64 | | | | 8.39 | | | | 06/28/05 | |
| | | I | | | | 11.08 | | | | 13.54 | | | | 11.94 | | | | — | | | | 6.74 | | | | 06/28/07 | |
| | | | | | | |
AMG River Road Dividend All Cap Value II Fund 3,4,5,6,9,11 | | | N | | | | 10.98 | | | | 13.20 | | | | — | | | | — | | | | 12.09 | | | | 06/27/12 | |
| | | I | | | | 11.09 | | | | 13.45 | | | | — | | | | — | | | | 12.38 | | | | 06/27/12 | |
| | | | | | | |
AMG Managers Fairpointe Mid Cap Fund 2,3,4,5,12 | | | N | | | | 19.32 | | | | 24.67 | | | | 14.70 | | | | 9.64 | | | | 12.53 | | | | 09/19/94 | |
| | | I | | | | 19.48 | | | | 24.98 | | | | 14.99 | | | | 9.91 | | | | 10.49 | | | | 07/06/04 | |
| | | | | | | |
AMG Managers Montag & Caldwell Mid Cap Growth Fund 2,3,4,10 | | | N | | | | 11.27 | | | | 10.62 | | | | 8.73 | | | | — | | | | 5.38 | | | | 11/02/07 | |
| | | I | | | | 11.45 | | | | 10.91 | | | | — | | | | — | | | | 7.29 | | | | 05/14/14 | |
| | | | | | | |
AMG Managers LMCG Small Cap Growth Fund 2,3,4,5,7,9,10,13 | | | N | | | | 18.70 | | | | 18.41 | | | | 10.87 | | | | — | | | | 10.06 | | | | 11/03/10 | |
| | | I | | | | 18.77 | | | | 18.68 | | | | 11.14 | | | | — | | | | 7.39 | | | | 06/01/11 | |
| | | | | | | |
AMG River Road Select Value Fund 2,3,4,5,6,9 | | | N | | | | 21.27 | | | | 27.04 | | | | 12.67 | | | | 6.62 | | | | 6.74 | | | | 03/29/07 | |
| | | I | | | | 21.49 | | | | 27.18 | | | | 12.93 | | | | — | | | | 6.64 | | | | 06/28/07 | |
| | | | | | | |
AMG River Road Small Cap Value Fund 2,3,4,5,6,9 | | | N | | | | 19.25 | | | | 26.45 | | | | 12.58 | | | | 5.60 | | | | 8.23 | | | | 06/28/05 | |
| | | I | | | | 19.42 | | | | 26.75 | | | | 12.87 | | | | 5.87 | | | | 6.19 | | | | 12/13/06 | |
| | | | | | | |
AMG Managers Silvercrest Small Cap Fund 2,4,5,6,9 | | | N | | | | 17.28 | | | | 25.23 | | | | 12.88 | | | | — | | | | 14.03 | | | | 12/27/11 | |
| | | I | | | | 17.38 | | | | 25.53 | | | | 13.17 | | | | — | | | | 14.32 | | | | 12/27/11 | |
| | | | | | | |
AMG GW&K U.S. Small Cap Growth Fund 2,5,10,14 | | | N | | | | 17.77 | | | | 20.99 | | | | 7.05 | | | | 5.44 | | | | 9.54 | | | | 11/30/00 | |
| | | I | | | | 18.20 | | | | 21.46 | | | | 7.34 | | | | 5.71 | | | | 7.57 | | | | 01/04/05 | |
| | | Z | | | | — | | | | — | | | | — | | | | — | | | | 3.71 | | | | 02/24/17 | |
| | | | | | | |
Fixed Income Funds | | | | | | | | | | | | | | | | | | | | | | | | | | | | |
AMG Managers DoubleLine Core Plus Bond Fund 2,3,15,16,17,18,19,20 | | | N | | | | 0.66 | | | | 3.19 | | | | 3.31 | | | | — | | | | 4.71 | | | | 07/18/11 | |
| | | I | | | | 0.88 | | | | 3.56 | | | | 3.56 | | | | — | | | | 4.97 | | | | 07/18/11 | |
| | | | | | | |
Alternative Funds | | | | | | | | | | | | | | | | | | | | | | | | | | | | |
AMG Managers Lake Partners LASSO Alternatives Fund 2,3,8,12,15,21,22,23,24 | | | N | | | | 2.53 | | | | 2.97 | | | | 2.20 | | | | — | | | | 2.92 | | | | 03/03/10 | |
| | | I | | | | 2.61 | | | | 3.22 | | | | 2.44 | | | | — | | | | 4.72 | | | | 04/01/09 | |
AMG River Road Long-Short Fund 2,3,6,7,8,9,12,21 | | | N | | | | 7.88 | | | | 9.07 | | | | 5.56 | | | | — | | | | 5.34 | | | | 05/04/11 | |
| | | I | | | | 7.98 | | | | 9.36 | | | | — | | | | — | | | | 4.36 | | | | 03/04/13 | |
| | | | | | | |
International Funds | | | | | | | | | | | | | | | | | | | | | | | | | | | | |
AMG Managers Guardian Capital Global Dividend Fund 2,3,4,5,9,11,16,25 | | | N | | | | 10.99 | | | | 8.06 | | | | — | | | | — | | | | 4.19 | | | | 04/14/14 | |
| | | I | | | | 11.18 | | | | 8.28 | | | | — | | | | — | | | | 4.43 | | | | 04/14/14 | |
AMG Managers Pictect International Fund 2,3,4,5,13,16,25 | | | N | | | | 12.62 | | | | 14.04 | | | | — | | | | — | | | | 3.15 | | | | 04/14/14 | |
| | | I | | | | 12.73 | | | | 14.39 | | | | — | | | | — | | | | 3.47 | | | | 04/14/14 | |
AMG Managers Value Partners Asia Dividend Fund 2,3,4,5,6,9,12,15,16,19,21,25 | | | N | | | | 11.53 | | | | 19.10 | | | | — | | | | — | | | | 14.82 | | | | 12/16/15 | |
| | | I | | | | 11.60 | | | | 19.40 | | | | — | | | | — | | | | 15.03 | | | | 12/16/15 | |
AMG Funds
| | |
| | As of April 30, 2017 |
Fund Performance (unaudited) – continued | | |
| | | | | | | | | | | | | | | | | | | | | | | | | | | | |
Average Annual Total Returns 1 | | Class | | | Six
Months † | | | One
Year | | | Five
Years | | | Ten
Years | | | Since
Inception | | | Inception
Date | |
Balanced Fund | | | | | | | | | | | | | | | | | | | | | | | | | | | | |
AMG Managers Montag & Caldwell Balanced Fund 2,3,10,15,17,20 | | | N | | | | 5.31 | % | | | 5.41 | % | | | 6.33 | % | | | 5.74 | % | | | 7.34 | % | | | 11/02/94 | |
| | | I | | | | 5.36 | | | | 5.52 | | | | 6.44 | | | | 5.89 | | | | 4.33 | | | | 12/31/98 | |
The performance data shown represents past performance. Past performance is not a guarantee of future results. Current performance may be lower or higher than the performance data quoted. The investment return and principal value of an investment in the Fund will fluctuate so that an investor’s shares, when redeemed, may be worth more or less than their original cost.
Investors should carefully consider the Fund’s investment objectives, risks, charges and expenses before investing. For performance information through the most recent month end, current net asset per share for the Fund and other information, please call (800) 835-3879 or visit our website at www.amgfunds.com for a free prospectus. Read it carefully before investing or sending money.
| 1 | Total return equals income yield plus share price change and assumes reinvestment of all dividends and capital gain distributions. Returns are net of fees and may reflect offsets of Fund expenses as described in the prospectus. No adjustment has been made for taxes payable by shareholders on their reinvested dividends and capital gain distributions. Returns for periods greater than one year are annualized. The listed returns on the Funds are net of expenses and based on the published NAV as of April 30, 2017. All returns are in U.S. dollars ($). |
| 2 | From time to time, the Fund’s advisor has waived its fees and/or absorbed Fund expenses, which has resulted in higher returns. |
| 3 | Investments in international securities are subject to certain risks of overseas investing including currency fluctuations and changes in political and economic conditions, which could result in significant market fluctuations. These risks are magnified in emerging markets. |
| 4 | The Fund is subject to risks associated with investments in mid-capitalization companies such as greater price volatility, lower trading volume, and less liquidity than the stocks of larger, more established companies. |
| 5 | The Fund is subject to risks associated with investments in small-capitalization companies, such as erratic earnings patterns, competitive conditions, limited earnings history and a reliance on one or a limited number of products. |
| 6 | The Fund invests in value stocks, which may perform differently from the market as a whole and may be undervalued by the market for a long period of time. |
| 7 | Active and frequent trading of a fund may result in higher transaction costs and increased tax liability. |
| 8 | A greater percentage of the Fund’s holdings may be focused in a smaller number of securities which may place the Fund at greater risk than a more diversified fund. |
| 9 | The Fund is subject to special risk considerations similar to those associated with the direct ownership of real estate. Real estate valuations may be subject to factors such as changing general and local economic, financial, competitive, and environmental conditions. |
| 10 | The Fund invests in growth stocks, which may be more sensitive to market movements because their prices tend to reflect future investor expectations rather than just current profits. Growth stocks may underperform value stocks during given periods. |
| 11 | An issuer of a security may be unwilling or unable to pay income on a security. Common stocks do not assure dividend payments and are paid only when declared by an issuer’s board of directors. |
| 12 | The Fund may invest in derivatives such as options and futures; the complexity and rapidly changing structure of derivatives markets may increase the possibility of market losses. |
| 13 | Investing in initial public offerings (IPOs) is risky and the prices of stocks purchased in IPOs tend to fluctuate more widely than stocks of companies that have been publicly traded for a longer period of time. Stocks purchased in IPOs generally do not have a trading history, and information about the companies may be available for very limited periods. |
| 14 | Companies that are in similar businesses may be similarly affected by particular economic or market events; to the extent the Fund has substantial holdings within a particular sector, the risks associated with that sector increase. |
| 15 | The Fund is subject to the risks associated with investments in debt securities, such as default risk and fluctuations in the perception of the debtor’s ability to pay its creditors. Changing interest rates may adversely affect the value of an investment. An increase in interest rates typically causes the value of bonds and other fixed income securities to fall. |
| 16 | The Fund is subject to the risks associated with investments in emerging markets, such as erratic earnings patterns, economic and political instability, changing exchange controls, limitations on repatriation of foreign capital and changes in local governmental attitudes toward private investment, possibly leading to nationalization or confiscation of investor assets. |
| 17 | To the extent that the Fund invests in asset-backed or mortgage-backed securities, its exposure to prepayment and extension risks may be greater than investments in other fixed income securities. |
| 18 | Bank loans are subject to the credit risk of nonpayment of principal or interest. |
| 19 | High-yield bonds (also known as “junk bonds”) may be subject to greater levels of interest rate, credit, and liquidity risk than investments in higher rated securities. These securities are considered predominantly speculative with respect to the issuer’s continuing ability to make principal and interest payments. The issuers of the Fund’s holdings may be involved in bankruptcy proceedings, reorganizations, or financial restructurings, and are not as strong financially as higher-rated issuers. Factors unique to the municipal bond market may negatively affect the value in municipal bonds. |
| 20 | Obligations of certain government agencies are not backed by the full faith and credit of the U.S. government. If one of these agencies defaulted on a loan, there is no guarantee that the U.S. government would provide financial support. Additionally, debt securities of the U.S. government may be affected by changing interest rates and subject to prepayment risk. |
| 21 | The Fund may suffer significant losses on assets that it sells short. Unlike the possible loss on a security that is purchased, there is no limit on the amount of loss on an appreciating security that is sold short. |
| 22 | Alternative investments are speculative, subject to high return volatility and involve aggressive investment techniques and a high degree of risk including, but not limited to, the risks associated with leverage, derivative instruments such as options and futures, commodities, and distressed securities may be illiquid on a long term basis and short sales. There can be no assurance that these types of strategies will achieve their objectives or avoid substantial losses. |
| 23 | The Fund is subject to currency risk resulting from fluctuations in exchange rates that may affect the total loss or gain on a non-U.S. Dollar investment when converted back to U.S. Dollars. |
| 24 | The Fund is subject to the risks of any underlying fund in which the Fund invests. There are expenses associated with the underlying funds in addition to the Fund’s expenses. |
| 25 | A short-term redemption fee of 2% will be charged on shares held for less than 90 days. |
AMG Funds
| | |
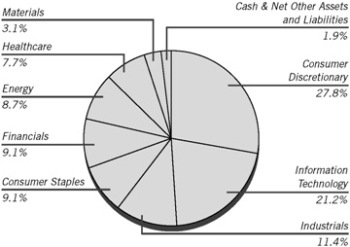
| AMG Managers Fairpointe Focused Equity Fund | | April 30, 2017 |
| Schedule of Investments (unaudited) | | |
% of Net Assets
| | | | | | | | |
Shares | | Market
Value | |
| | COMMON STOCKS – 98.1% | | | | |
| | |
| | | | Consumer Discretionary – 27.8% | | | | |
| | 5,300 | | | Carnival Corp. (Panama) | | $ | 327,381 | |
| | 8,400 | | | Discovery Communications, Inc., Class C * | | | 235,032 | |
| | 13,400 | | | Liberty Interactive Corp. QVC Group, Class A * | | | 283,812 | |
| | 7,400 | | | Lions Gate Entertainment Corp., Class B (Canada) * | | | 176,490 | |
| | 3,400 | | | Ralph Lauren Corp. | | | 274,448 | |
| | 6,500 | | | Scholastic Corp. | | | 280,995 | |
| | 24,500 | | | Staples, Inc. | | | 239,365 | |
| | 5,300 | | | Twenty-First Century Fox, Inc., Class A | | | 161,862 | |
| | | | | | | | |
| | | | | | | 1,979,385 | |
| | | | | | | | |
| | | | Consumer Staples – 9.1% | | | | |
| | 700 | | | PepsiCo, Inc. | | | 79,296 | |
| | 6,100 | | | Unilever PLC, Sponsored ADR (United Kingdom) | | | 313,174 | |
| | 3,400 | | | Wal-Mart Stores, Inc. | | | 255,612 | |
| | | | | | | | |
| | | | | | | 648,082 | |
| | | | | | | | |
| | | | Energy – 8.7% | | | | |
| | 4,600 | | | Baker Hughes, Inc. | | | 273,102 | |
| | 6,300 | | | BP PLC, Sponsored ADR (United Kingdom) | | | 216,216 | |
| | 11,700 | | | Transocean, Ltd. (Switzerland) * | | | 129,051 | |
| | | | | | | | |
| | | | | | | 618,369 | |
| | | | | | | | |
| | | | Financials – 9.1% | | | | |
| | 6,900 | | | Legg Mason, Inc. | | | 257,922 | |
| | 2,800 | | | Northern Trust Corp. | | | 252,000 | |
| | 2,900 | | | The Bank of New York Mellon Corp. | | | 136,474 | |
| | | | | | | | |
| | | | | | | 646,396 | |
| | | | | | | | |
| | | | | | | | |
Shares | | Market
Value | |
| | | | Healthcare – 7.7% | | | | |
| | 5,300 | | | Hologic, Inc. * | | $ | 239,295 | |
| | 3,400 | | | Varian Medical Systems, Inc. * | | | 308,516 | |
| | | | | | | | |
| | | | | | | 547,811 | |
| | | | | | | | |
| | | | Industrials – 11.4% | | | | |
| | 3,200 | | | AGCO Corp. | | | 204,768 | |
| | 2,300 | | | Fluor Corp. | | | 118,036 | |
| | 5,200 | | | Kennametal, Inc. | | | 216,216 | |
| | 7,800 | | | Quanta Services, Inc. * | | | 276,432 | |
| | | | | | | | |
| | | | | | | 815,452 | |
| | | | | | | | |
| | | | Information Technology – 21.2% | | | | |
| | 5,200 | | | Cisco Systems, Inc. | | | 177,164 | |
| | 11,200 | | | Cree, Inc. * | | | 245,056 | |
| | 1,426 | | | DXC Technology Co. * | | | 107,435 | |
| | 15,900 | | | Hewlett Packard Enterprise Co. | | | 296,217 | |
| | 11,400 | | | HP, Inc. | | | 214,548 | |
| | 8,100 | | | Teradata Corp. * | | | 236,358 | |
| | 2,500 | | | VMware, Inc., Class A * | | | 235,300 | |
| | | | | | | | |
| | | | | | | 1,512,078 | |
| | | | | | | | |
| | | | Materials – 3.1% | | | | |
| | 3,000 | | | FMC Corp. | | | 219,690 | |
| | | | | | | | |
| | | | Total Common Stocks (Cost $5,716,001) | | | 6,987,263 | |
| | | | | | | | |
| | INVESTMENT COMPANY – 2.2% | | | | |
| | 158,702 | | | Dreyfus Government Cash Management Fund, Institutional Class Shares, 0.69%** | | | 158,702 | |
| | | | | | | | |
| | | | Total Investment Company (Cost $158,702) | | | 158,702 | |
| | | | | | | | |
| Total Investments – 100.3%
(Cost $5,874,703)*** | | | 7,145,965 | |
| | | | | | | | |
| | Net Other Assets and Liabilities – (0.3)% | | | (18,531 | ) |
| | | | | | | | |
| | Net Assets – 100.0% | | $ | 7,127,434 | |
| | | | | | | | |
| * | Non-income producing security. |
| ** | Yield shown represents the April 30, 2017, seven-day average yield, which refers to the sum of the previous seven days’ dividends paid, expressed as an annual percentage. |
| *** | At April 30, 2017, the aggregate cost for Federal income tax purposes approximates the aggregate cost for book purposes. |
The aggregate gross unrealized appreciation and depreciation were as follows:
| | | | |
Gross unrealized appreciation | | $ | 1,364,631 | |
Gross unrealized depreciation | | | (93,369 | ) |
| | | | |
Net unrealized appreciation | | $ | 1,271,262 | |
| | | | |
ADR American Depositary Receipt
The accompanying notes are an integral part of these financial statements.
AMG Funds
| | |
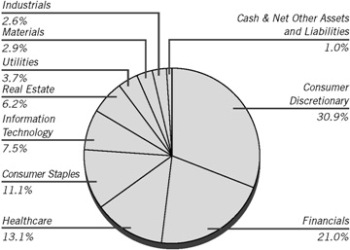
| AMG River Road Focused Absolute Value Fund | | April 30, 2017 |
| Schedule of Investments (unaudited) | | |
% of Net Assets
| | | | | | | | |
Shares | | | | | Market
Value | |
| | COMMON STOCKS – 99.0% | | | | |
| | |
| | | | Consumer Discretionary – 30.9% | | | | |
| | 9,360 | | | Asbury Automotive Group, Inc. * | | $ | 572,832 | |
| | 19,910 | | | Comcast Corp., Class A | | | 780,273 | |
| | 24,112 | | | General Motors Co. | | | 835,240 | |
| | 8,430 | | | L Brands, Inc. | | | 445,188 | |
| | 4,166 | | | Liberty Broadband Corp., Class C * | | | 379,773 | |
| | 7,988 | | | Liberty Expedia Holdings, Inc., Class A * | | | 385,900 | |
| | 19,812 | | | Liberty Media Corp-Liberty SiriusXM, Class C * | | | 752,658 | |
| | 22,203 | | | Liberty Ventures, Class A * | | | 1,195,632 | |
| | 5,406 | | | Polaris Industries, Inc. (a) | | | 460,916 | |
| | | | | | | | |
| | | | | | | 5,808,412 | |
| | | | | | | | |
| | | | Consumer Staples – 11.1% | | | | |
| | 30,812 | | | Coty, Inc., Class A | | | 549,994 | |
| | 10,383 | | | CVS Health Corp. | | | 855,974 | |
| | 14,531 | | | Ingles Markets, Inc., Class A | | | 678,598 | |
| | | | | | | | |
| | | | | | | 2,084,566 | |
| | | | | | | | |
| | | | Financials – 21.0% | | | | |
| | 7,466 | | | Berkshire Hathaway, Inc., Class B * | | | 1,233,458 | |
| | 48,994 | | | FNFV Group * | | | 671,218 | |
| | 14,371 | | | Oaktree Capital Group LLC, MLP | | | 675,437 | |
| | 6,824 | | | U.S. Bancorp | | | 349,935 | |
| | 11,320 | | | Wells Fargo & Co. | | | 609,469 | |
| | 491 | | | White Mountains Insurance Group, Ltd. (Bermuda) | | | 421,740 | |
| | | | | | | | |
| | | | | | | 3,961,257 | |
| | | | | | | | |
| | | | Healthcare – 13.1% | | | | |
| | 7,083 | | | Cardinal Health, Inc. | | | 514,155 | |
| | 10,624 | | | DaVita, Inc. * | | | 733,162 | |
| | 36,003 | | | Premier, Inc., Class A * | | | 1,216,901 | |
| | | | | | | | |
| | | | | | | 2,464,218 | |
| | | | | | | | |
| | | | | | | | |
Shares | | | | | Market
Value | |
| | | | Industrials – 2.6% | | | | |
| | 8,608 | | | Spirit AeroSystems Holdings, Inc., Class A | | $ | 492,033 | |
| | | | | | | | |
| | | | Information Technology – 7.5% | | | | |
| | 17,323 | | | Blackhawk Network Holdings, Inc. * | | | 700,715 | |
| | 30,642 | | | Sabre Corp. | | | 717,329 | |
| | | | | | | | |
| | | | | | | 1,418,044 | |
| | | | | | | | |
| | | | Materials – 2.9% | | | | |
| | 4,380 | | | Praxair, Inc. | | | 547,412 | |
| | | | | | | | |
| | | | Real Estate – 6.2% | | | | |
| | 18,260 | | | Iron Mountain, Inc., REIT | | | 634,718 | |
| | 17,591 | | | Realogy Holdings Corp. | | | 537,405 | |
| | | | | | | | |
| | | | | | | 1,172,123 | |
| | | | | | | | |
| | | | Utilities – 3.7% | | | | |
| | 12,551 | | | National Fuel Gas Co. | | | 695,074 | |
| | | | | | | | |
| | | | Total Common Stocks (Cost $16,966,086) | | | 18,643,139 | |
| | | | | | | | |
Principal
Amount | | | | | | |
| | SHORT TERM INVESTMENTS – 2.6% | | | | |
| | |
| | | | Repurchase Agreements – 1.9% (b) | | | | |
| | $358,021 | | | Royal Bank of Scotland PLC, dated 04/28/17, due 05/01/17, 0.800% total to be received $358,045 (collateralized by various U.S. Government Agency Obligations, 0.077% – 1.125%, 05/31/17 – 08/31/21, totaling $365,183) | | | 358,021 | |
| | | | | | | | |
Shares | | | | | | |
| | | | Other Investment Company – 0.7% | | | | |
| | 140,372 | | | Dreyfus Government Cash Management Fund, Institutional Class Shares, 0.69%** | | | 140,372 | |
| | | | | | | | |
| | | | Total Short Term Investments (Cost $498,393) | | | 498,393 | |
| | | | | | | | |
| Total Investments – 101.6%
(Cost $17,464,479)*** | | | 19,141,532 | |
| | | | | | | | |
| | Net Other Assets and Liabilities – (1.6)% | | | (301,766 | ) |
| | | | | | | | |
| | Net Assets – 100.0% | | $ | 18,839,766 | |
| | | | | | | | |
| * | Non-income producing security. |
| ** | Yield shown represents the April 30, 2017, seven-day average yield, which refers to the sum of the previous seven days’ dividends paid, expressed as an annual percentage. |
| *** | At April 30, 2017, the aggregate cost for Federal income tax purposes approximates the aggregate cost for book purposes. |
The accompanying notes are an integral part of these financial statements.
AMG Funds
| | |
| AMG River Road Focused Absolute Value Fund | | April 30, 2017 |
| Schedule of Investments – continued | | |
The aggregate gross unrealized appreciation and depreciation were as follows:
| | | | |
Gross unrealized appreciation | | $ | 1,887,610 | |
Gross unrealized depreciation | | | (210,557 | ) |
| | | | |
Net unrealized appreciation | | $ | 1,677,053 | |
| | | | |
| (a) | Some or all of these securities were out on loan to various brokers as of April 30, 2017, amounting to $345,644, or 1.8% of net assets. |
| (b) | Collateral received from brokers for securities lending was invested in these joint repurchase agreements. |
| MLP | Master Limited Partnership |
| REIT | Real Estate Investment Trust |
The accompanying notes are an integral part of these financial statements.
AMG Funds
| | |
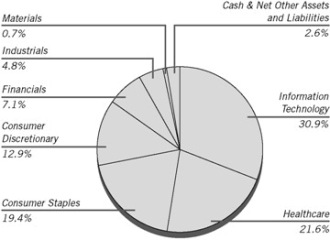
| AMG Managers Montag & Caldwell Growth Fund | | April 30, 2017 |
| Schedule of Investments (unaudited) | | |
% of Net Assets
| | | | | | | | |
Shares | | | | | Market
Value | |
| | COMMON STOCKS – 97.4% | | | | |
| | |
| | | | Consumer Discretionary – 12.9% | | | | |
| | 360,708 | | | Dollar Tree, Inc. * | | $ | 29,855,801 | |
| | 517,805 | | | Starbucks Corp. | | | 31,099,368 | |
| | 23,850 | | | The Priceline Group, Inc. * | | | 44,046,657 | |
| | 310,000 | | | The TJX Cos, Inc. | | | 24,378,400 | |
| | | | | | | | |
| | | | | | | 129,380,226 | |
| | | | | | | | |
| | | | Consumer Staples – 19.4% | | | | |
| | 54,018 | | | Costco Wholesale Corp. | | | 9,589,275 | |
| | 664,600 | | | Mondelez International, Inc., Class A | | | 29,926,938 | |
| | 627,483 | | | Monster Beverage Corp. * | | | 28,475,179 | |
| | 278,900 | | | PepsiCo, Inc. | | | 31,593,792 | |
| | 368,700 | | | The Estee Lauder Cos, Inc., Class A . | | | 32,128,518 | |
| | 425,800 | | | The Kraft Heinz Co. | | | 38,488,062 | |
| | 291,756 | | | Walgreens Boots Alliance, Inc. | | | 25,248,564 | |
| | | | | | | | |
| | | | | | | 195,450,328 | |
| | | | | | | | |
| | | | Financials – 7.1% | | | | |
| | 512,315 | | | Intercontinental Exchange, Inc. | | | 30,841,363 | |
| | 208,700 | | | S&P Global, Inc. | | | 28,005,453 | |
| | 317,700 | | | The Charles Schwab Corp. | | | 12,342,645 | |
| | | | | | | | |
| | | | | | | 71,189,461 | |
| | | | | | | | |
| | | | Healthcare – 21.6% | | | | |
| | 96,333 | | | Becton Dickinson & Co. | | | 18,011,381 | |
| | 294,800 | | | Celgene Corp. * | | | 36,569,940 | |
| | 295,000 | | | Danaher Corp. | | | 24,582,350 | |
| | 315,709 | | | Edwards Lifesciences Corp. * | | | 34,623,806 | |
| | 249,500 | | | Medtronic PLC (Ireland) | | | 20,730,955 | |
| | 219,929 | | | Thermo Fisher Scientific, Inc. | | | 36,360,862 | |
| | 263,785 | | | UnitedHealth Group, Inc. | | | 46,130,721 | |
| | | | | | | | |
| | | | | | | 217,010,015 | |
| | | | | | | | |
| | | | | | | | |
Shares | | | | | Market
Value | |
| | | | Industrials – 4.8% | | | | |
| | 371,700 | | | Fastenal Co. | | $ | 16,607,556 | |
| | 241,800 | | | Honeywell International, Inc. | | | 31,709,652 | |
| | | | | | | | |
| | | | | | | 48,317,208 | |
| | | | | | | | |
| | | | Information Technology – 30.9% | | | | |
| | 52,786 | | | Alphabet, Inc., Class A * | | | 48,801,713 | |
| | 325,900 | | | Apple, Inc. | | | 46,815,535 | |
| | 338,100 | | | Facebook, Inc., Class A * | | | 50,799,525 | |
| | 238,791 | | | Fidelity National Information Services, Inc. | | | 20,103,814 | |
| | 45,961 | | | FleetCor Technologies, Inc. * | | | 6,486,936 | |
| | 200,100 | | | MasterCard, Inc., Class A | | | 23,275,632 | |
| | 684,900 | | | Microsoft Corp. | | | 46,888,254 | |
| | 456,600 | | | Oracle Corp. | | | 20,528,736 | |
| | 507,100 | | | Visa, Inc., Class A | | | 46,257,662 | |
| | | | | | | | |
| | | | | | | 309,957,807 | |
| | | | | | | | |
| | | | Materials – 0.7% | | | | |
| | 53,400 | | | Air Products & Chemicals, Inc. | | | 7,502,700 | |
| | | | | | | | |
| | | | Total Common Stocks (Cost $789,209,385) | | | 978,807,745 | |
| | | | | | | | |
| | INVESTMENT COMPANY – 2.8% | | | | |
| | 27,821,824 | | | Dreyfus Government Cash Management Fund, Institutional Class Shares, 0.69%** | | | 27,821,824 | |
| | | | | | | | |
| | | | Total Investment Company (Cost $27,821,824) | | | 27,821,824 | |
| | | | | | | | |
| Total Investments – 100.2%
(Cost $817,031,209)*** | | | 1,006,629,569 | |
| | | | | | | | |
| | Net Other Assets and Liabilities – (0.2)% | | | (2,320,103 | ) |
| | | | | | | | |
| | Net Assets – 100.0% | | $ | 1,004,309,466 | |
| | | | | | | | |
| * | Non-income producing security. |
| ** | Yield shown represents the April 30, 2017, seven-day average yield, which refers to the sum of the previous seven days’ dividends paid, expressed as an annual percentage. |
| *** | At April 30, 2017, the aggregate cost for Federal income tax purposes approximates the aggregate cost for book purposes. |
| | The aggregate gross unrealized appreciation and depreciation were as follows: |
| | | | |
Gross unrealized appreciation | | $ | 193,024,070 | |
Gross unrealized depreciation | | | (3,425,710 | ) |
| | | | |
Net unrealized appreciation | | $ | 189,598,360 | |
| | | | |
The accompanying notes are an integral part of these financial statements.
AMG Funds
| | |
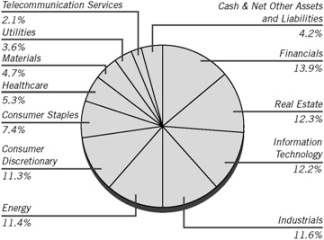
| AMG River Road Dividend All Cap Value Fund | | April 30, 2017 |
| Schedule of Investments (unaudited) | | |
% of Net Assets
| | | | | | | | |
Shares | | | | | Market
Value | |
| | COMMON STOCKS – 95.8% | | | | |
| | |
| | | | Consumer Discretionary – 11.3% | | | | |
| | 265,575 | | | Cedar Fair LP | | $ | 19,033,760 | |
| | 476,025 | | | Cinemark Holdings, Inc. | | | 20,564,280 | |
| | 419,750 | | | Extended Stay America, Inc. | | | 7,320,440 | |
| | 427,183 | | | National CineMedia, Inc. | | | 5,070,662 | |
| | 207,798 | | | Omnicom Group, Inc. | | | 17,064,372 | |
| | 91,252 | | | Polaris Industries, Inc. (a) | | | 7,780,145 | |
| | 259,650 | | | Target Corp. | | | 14,501,453 | |
| | 293,440 | | | The Interpublic Group of Cos, Inc. | | | 6,916,381 | |
| | 99,936 | | | Time Warner, Inc. | | | 9,920,647 | |
| | | | | | | | |
| | | | | | | 108,172,140 | |
| | | | | | | | |
| | | | Consumer Staples – 7.4% | | | | |
| | 277,865 | | | Coty, Inc., Class A | | | 4,959,890 | |
| | 119,869 | | | CVS Health Corp. | | | 9,882,000 | |
| | 98,602 | | | Kimberly-Clark Corp. | | | 12,793,609 | |
| | 95,268 | | | PepsiCo, Inc. | | | 10,791,959 | |
| | 294,637 | | | Unilever PLC, Sponsored ADR (United Kingdom) | | | 15,126,664 | |
| | 230,725 | | | Wal-Mart Stores, Inc. | | | 17,345,906 | |
| | | | | | | | |
| | | | | | | 70,900,028 | |
| | | | | | | | |
| | | | Energy – 11.4% | | | | |
| | 95,569 | | | Chevron Corp. | | | 10,197,212 | |
| | 160,008 | | | Exxon Mobil Corp. | | | 13,064,653 | |
| | 164,291 | | | Magellan Midstream Partners LP | | | 12,206,821 | |
| | 417,010 | | | Marathon Petroleum Corp. | | | 21,242,489 | |
| | 226,685 | | | Occidental Petroleum Corp. | | | 13,950,195 | |
| | 356,661 | | | Spectra Energy Partners LP | | | 16,103,244 | |
| | 215,771 | | | TransMontaigne Partners LP (a) | | | 9,493,924 | |
| | 198,845 | | | Valero Energy Corp. | | | 12,847,375 | |
| | | | | | | | |
| | | | | | | 109,105,913 | |
| | | | | | | | |
| | | | | | | | |
Shares | | | | | Market
Value | |
| | | | Financials – 13.9% | | | | |
| | 184,530 | | | Axis Capital Holding, Ltd. (Bermuda) | | $ | 12,160,527 | |
| | 554,868 | | | BB&T Corp. | | | 23,959,200 | |
| | 163,515 | | | CNA Financial Corp. | | | 7,400,689 | |
| | 260,768 | | | MetLife, Inc. | | | 13,510,390 | |
| | 112,747 | | | The PNC Financial Services Group, Inc. | | | 13,501,453 | |
| | 353,064 | | | Thomson Reuters Corp. (Canada) | | | 16,039,698 | |
| | 500,137 | | | U.S. Bancorp | | | 25,647,025 | |
| | 265,085 | | | Wells Fargo & Co. | | | 14,272,176 | |
| | 169,723 | | | WesBanco, Inc. | | | 6,756,673 | |
| | | | | | | | |
| | | | | | | 133,247,831 | |
| | | | | | | | |
| | | | Healthcare – 5.3% | | | | |
| | 92,387 | | | Amgen, Inc. | | | 15,088,645 | |
| | 195,828 | | | Cardinal Health, Inc. | | | 14,215,155 | |
| | 279,389 | | | Novo Nordisk, Sponsored ADR (Denmark) | | | 10,806,767 | |
| | 325,716 | | | Owens & Minor, Inc. | | | 11,286,059 | |
| | | | | | | | |
| | | | | | | 51,396,626 | |
| | | | | | | | |
| | | | Industrials – 11.6% | | | | |
| | 645,113 | | | Aircastle, Ltd. (Bermuda) | | | 15,237,569 | |
| | 248,356 | | | Emerson Electric Co. | | | 14,970,900 | |
| | 443,945 | | | Fastenal Co. | | | 19,835,463 | |
| | 343,932 | | | Johnson Controls International PLC (Ireland) | | | 14,297,253 | |
| | 112,945 | | | KAR Auction Services | | | 4,926,661 | |
| | 157,954 | | | Union Pacific Corp. | | | 17,684,530 | |
| | 130,358 | | | United Parcel Service, Inc., Class B | | | 14,008,271 | |
| | 52,901 | | | WW Grainger, Inc. (a) | | | 10,194,023 | |
| | | | | | | | |
| | | | | | | 111,154,670 | |
| | | | | | | | |
| | | | Information Technology – 12.2% | | | | |
| | 798,232 | | | Corning, Inc. | | | 23,028,993 | |
| | 170,793 | | | CSG Systems International, Inc. | | | 6,406,445 | |
| | 381,838 | | | Intel Corp. | | | 13,803,444 | |
| | 400,435 | | | Microsoft Corp. | | | 27,413,780 | |
| | 178,561 | | | Motorola Solutions, Inc. | | | 15,350,889 | |
| | 275,016 | | | QUALCOMM, Inc. | | | 14,779,360 | |
| | 210,053 | | | TE Connectivity, Ltd. (Switzerland) | | | 16,251,801 | |
| | | | | | | | |
| | | | | | | 117,034,712 | |
| | | | | | | | |
| | | | Materials – 4.7% | | | | |
| | 177,350 | | | Compass Minerals International, Inc. (a) | | | 11,705,100 | |
| | 105,788 | | | LyondellBasell Industries NV, Class A (Netherlands) | | | 8,966,591 | |
| | 194,620 | | | Praxair, Inc. | | | 24,323,608 | |
| | | | | | | | |
| | | | | | | 44,995,299 | |
| | | | | | | | |
| | | | Real Estate – 12.3% | | | | |
| | 786,070 | | | Iron Mountain, Inc., REIT | | | 27,323,780 | |
| | 287,606 | | | Ryman Hospitality Properties, Inc., REIT | | | 18,343,511 | |
| | 514,034 | | | Sabra Health Care REIT, Inc., REIT | | | 13,976,584 | |
The accompanying notes are an integral part of these financial statements.
AMG Funds
| | |
| AMG River Road Dividend All Cap Value Fund | | April 30, 2017 |
| Schedule of Investments – continued | | |
| | | | | | |
Shares | | | | Market
Value | |
| | Real Estate (continued) | | | | |
| 486,468 | | The GEO Group, Inc., REIT | | $ | 16,209,114 | |
| 403,918 | | Uniti Group, Inc., REIT * | | | 11,091,588 | |
| 290,478 | | Ventas, Inc., REIT | | | 18,593,497 | |
| 377,692 | | Weyerhaeuser Co., REIT | | | 12,792,428 | |
| | | | | | |
| | | | | 118,330,502 | |
| | | | | | |
| | Telecommunication Services – 2.1% | | | | |
| 449,956 | | Verizon Communications, Inc. | | | 20,657,480 | |
| | | | | | |
| | Utilities – 3.6% | | | | |
| 340,020 | | AmeriGas Partners LP (a) | | | 15,307,700 | |
| 353,598 | | National Fuel Gas Co. | | | 19,582,257 | |
| | | | | | |
| | | | | 34,889,957 | |
| | | | | | |
| | Total Common Stocks (Cost $757,181,803) | | | 919,885,158 | |
| | | | | | |
Principal
Amount | | | | | |
SHORT TERM INVESTMENTS – 6.2% | | | | |
| | Repurchase Agreements – 2.3% (b) | | | | |
| $5,370,665 | | Cantor Fitzgerald Securities, Inc., dated 04/28/17, due 05/01/17, 0.840% total to be received $5,371,041 (collateralized by various U.S. Government Agency Obligations, 0.000% - 10.000%, 04/30/17 - 03/20/67, totaling $5,478,079) | | | 5,370,665 | |
| 1,130,207 | | Citibank N.A., dated 04/28/17, due 05/01/17, 0.800% total to be received $1,130,282 (collateralized by various U.S. Government Agency Obligations, 0.000% - 8.875%, 04/30/17 - 09/09/49, totaling $1,152,811) | | | 1,130,207 | |
| 5,370,665 | | Daiwa Capital Markets America, dated 04/28/17, due 05/01/17, 0.850% total to be received $5,371,045 (collateralized by various U.S. Government Agency Obligations, 0.000% - 6.500%, 05/18/17 - 12/01/51, totaling $5,478,078) | | | 5,370,665 | |
| 5,370,665 | | Deutsche Bank Securities, Inc., dated 04/28/17, due 05/01/17, 0.850% total to be received $5,371,045 (collateralized by various U.S. Government Agency Obligations, 2.000% - 6.500%, 05/01/17 - 04/01/47, totaling $5,478,078) | | | 5,370,665 | |
| | | | | | |
Principal
Amount | | | | Market
Value | |
| | Repurchase Agreements (continued) | | | | |
| $5,370,665 | | Nomura Securities International, Inc., dated 04/28/17, due 05/01/17, 0.830% total to be received $5,371,036 (collateralized by various U.S. Government Agency Obligations, 1.950% - 9.000%, 06/01/18 - 03/20/67, totaling $5,478,078) | | $ | 5,370,665 | |
| | | | | | |
| | | | | 22,612,867 | |
| | | | | | |
Shares | | | | | |
| | Other Investment Company –3.9% | | | | |
| 37,139,790 | | Dreyfus Government Cash Management Fund, Institutional Class Shares, 0.69%** | | | 37,139,790 | |
| | | | | | |
| | Total Short Term Investments (Cost $59,752,657) | | | 59,752,657 | |
| | | | | | |
Total Investments – 102.0%
(Cost $816,934,460)*** | | | 979,637,815 | |
| | | | | | |
Net Other Assets and Liabilities – (2.0)% | | | (19,656,819 | ) |
| | | | | | |
Net Assets – 100.0% | | $ | 959,980,996 | |
| | | | | | |
| * | Non-income producing security. |
| ** | Yield shown represents the April 30, 2017, seven-day average yield, which refers to the sum of the previous seven days’ dividends paid, expressed as an annual percentage. |
| *** | At April 30, 2017, the aggregate cost for Federal income tax purposes approximates the aggregate cost for book purposes. |
The aggregate gross unrealized appreciation and depreciation were as follows:
| | | | |
Gross unrealized appreciation | | $ | 177,942,030 | |
Gross unrealized depreciation | | | (15,238,675 | ) |
| | | | |
Net unrealized appreciation | | $ | 162,703,355 | |
| | | | |
| | (a) | Some or all of these securities were out on loan to various brokers as of April 30, 2017, amounting to $21,904,456, or 2.3% of net assets. |
| | (b) | Collateral received from brokers for securities lending was invested in these joint repurchase agreements. |
| | ADR | American Depositary Receipt |
| REIT | Real Estate Investment Trust |
The accompanying notes are an integral part of these financial statements.
AMG Funds
| | |
| AMG River Road Dividend All Cap Value Fund II | | April 30, 2017 |
| Schedule of Investments (unaudited) | | |
% of Net Assets
| | | | | | | | |
Shares | | | | | Market
Value | |
| | COMMON STOCKS – 99.0% | | | | |
| | |
| | | | Consumer Discretionary – 10.6% | | | | |
| | 15,611 | | | Cedar Fair LP | | $ | 1,118,840 | |
| | 68,871 | | | Cinemark Holdings, Inc. | | | 2,975,227 | |
| | 59,260 | | | Extended Stay America, Inc. | | | 1,033,494 | |
| | 29,476 | | | Omnicom Group, Inc. | | | 2,420,569 | |
| | 13,212 | | �� | Polaris Industries, Inc. (a) | | | 1,126,455 | |
| | 36,777 | | | Target Corp. | | | 2,053,995 | |
| | 41,410 | | | The Interpublic Group of Cos, Inc. | | | 976,034 | |
| | 14,295 | | | Time Warner, Inc. | | | 1,419,065 | |
| | | | | | | | |
| | | | | | | 13,123,679 | |
| | | | | | | | |
| | | | Consumer Staples – 8.1% | | | | |
| | 39,030 | | | Coty, Inc., Class A | | | 696,686 | |
| | 16,834 | | | CVS Health Corp. | | | 1,387,795 | |
| | 13,941 | | | Kimberly-Clark Corp. | | | 1,808,845 | |
| | 13,455 | | | PepsiCo, Inc. | | | 1,524,182 | |
| | 41,847 | | | Unilever PLC, Sponsored ADR (United Kingdom) | | | 2,148,425 | |
| | 34,059 | | | Wal-Mart Stores, Inc. | | | 2,560,556 | |
| | | | | | | | |
| | | | | | | 10,126,489 | |
| | | | | | | | |
| | | | Energy – 11.5% | | | | |
| | 13,938 | | | Chevron Corp. | | | 1,487,185 | |
| | 22,877 | | | Exxon Mobil Corp. | | | 1,867,907 | |
| | 24,041 | | | Magellan Midstream Partners LP | | | 1,786,246 | |
| | 60,024 | | | Marathon Petroleum Corp. | | | 3,057,623 | |
| | 33,362 | | | Occidental Petroleum Corp. | | | 2,053,097 | |
| | 50,158 | | | Spectra Energy Partners LP | | | 2,264,634 | |
| | 28,348 | | | Valero Energy Corp. | | | 1,831,564 | |
| | | | | | | | |
| | | | | | | 14,348,256 | |
| | | | | | | | |
| | | | Financials – 14.2% | | | | |
| | 26,208 | | | Axis Capital Holding, Ltd. (Bermuda) | | | 1,727,107 | |
| | 80,083 | | | BB&T Corp. | | | 3,457,984 | |
| | | | | | | | |
| | | | Financials (continued) | | | | |
| | 13,868 | | | CNA Financial Corp. | | $ | 627,666 | |
| | 36,961 | | | MetLife, Inc. | | | 1,914,949 | |
| | 15,901 | | | The PNC Financial Services Group, Inc. | | | 1,904,145 | |
| | 51,063 | | | Thomson Reuters Corp. (Canada) | | | 2,319,792 | |
| | 72,420 | | | U.S. Bancorp | | | 3,713,698 | |
| | 37,522 | | | Wells Fargo & Co. | | | 2,020,184 | |
| | | | | | | | |
| | | | | | | 17,685,525 | |
| | | | | | | | |
| | | | Healthcare – 5.9% | | | | |
| | 13,509 | | | Amgen, Inc. | | | 2,206,290 | |
| | 28,355 | | | Cardinal Health, Inc. | | | 2,058,289 | |
| | 39,214 | | | Novo Nordisk, Sponsored ADR (Denmark) | | | 1,516,798 | |
| | 43,517 | | | Owens & Minor, Inc. | | | 1,507,864 | |
| | | | | | | | |
| | | | | | | 7,289,241 | |
| | | | | | | | |
| | | | Industrials – 12.0% | | | | |
| | 50,434 | | | Aircastle, Ltd. (Bermuda) | | | 1,191,251 | |
| | 36,642 | | | Emerson Electric Co. | | | 2,208,780 | |
| | 63,242 | | | Fastenal Co. | | | 2,825,653 | |
| | 48,479 | | | Johnson Controls International PLC (Ireland) | | | 2,015,272 | |
| | 15,840 | | | KAR Auction Services | | | 690,941 | |
| | 23,396 | | | Union Pacific Corp. | | | 2,619,416 | |
| | 18,373 | | | United Parcel Service, Inc., Class B | | | 1,974,363 | |
| | 7,409 | | | WW Grainger, Inc. | | | 1,427,714 | |
| | | | | | | | |
| | | | | | | 14,953,390 | |
| | | | | | | | |
| | | | Information Technology – 12.7% | | | | |
| | 118,388 | | | Corning, Inc. | | | 3,415,494 | |
| | 55,869 | | | Intel Corp. | | | 2,019,664 | |
| | 55,746 | | | Microsoft Corp. | | | 3,816,371 | |
| | 25,054 | | | Motorola Solutions, Inc. | | | 2,153,892 | |
| | 38,738 | | | QUALCOMM, Inc. | | | 2,081,780 | |
| | 30,028 | | | TE Connectivity, Ltd. (Switzerland) | | | 2,323,266 | |
| | | | | | | | |
| | | | | | | 15,810,467 | |
| | | | | | | | |
| | | | Materials – 5.2% | | | | |
| | 26,023 | | | Compass Minerals International, Inc. (a) | | | 1,717,518 | |
| | 15,146 | | | LyondellBasell Industries NV, Class A (Netherlands) | | | 1,283,775 | |
| | 27,671 | | | Praxair, Inc. | | | 3,458,322 | |
| | | | | | | | |
| | | | | | | 6,459,615 | |
| | | | | | | | |
| | | | Real Estate – 13.0% | | | | |
| | 110,700 | | | Iron Mountain, Inc., REIT | | | 3,847,935 | |
| | 40,865 | | | Ryman Hospitality Properties, Inc., REIT | | | 2,606,370 | |
| | 46,800 | | | Sabra Health Care REIT, Inc., REIT | | | 1,272,492 | |
| | 69,606 | | | The GEO Group, Inc., REIT | | | 2,319,272 | |
| | 56,589 | | | Uniti Group, Inc., REIT * | | | 1,553,934 | |
| | 41,748 | | | Ventas, Inc., REIT | | | 2,672,289 | |
| | 55,241 | | | Weyerhaeuser Co., REIT | | | 1,871,013 | |
| | | | | | | | |
| | | | | | | 16,143,305 | |
| | | | | | | | |
The accompanying notes are an integral part of these financial statements.
AMG Funds
| | |
| AMG River Road Dividend All Cap Value Fund II | | April 30, 2017 |
| Schedule of Investments – continued | | |
| | | | | | |
Shares | | | | Market
Value | |
| | Telecommunication Services – 2.4% | | | | |
| 65,343 | | Verizon Communications, Inc. | | $ | 2,999,897 | |
| | | | | | |
| | Utilities – 3.4% | | | | |
| 32,096 | | AmeriGas Partners LP (a) | | | 1,444,962 | |
| 51,135 | | National Fuel Gas Co. | | | 2,831,856 | |
| | | | | | |
| | | | | 4,276,818 | |
| | | | | | |
| | Total Common Stocks (Cost $106,757,779) | | | 123,216,682 | |
| | | | | | |
Principal
Amount | | | | | |
SHORT TERM INVESTMENTS – 2.0% | | | | |
| | Repurchase Agreements –1.0% (b) | | | | |
| $174,348 | | Citibank N.A., dated 04/28/17, due 05/01/17, 0.800% total to be received $174,360 (collateralized by various U.S. Government Agency Obligations, 0.000%—8.875%, 04/30/17 - 09/09/49, totaling $177,835) | | | 174,348 | |
| 1,000,000 | | Merrill Lynch Pierce Fenner & Smith, Inc., dated 04/28/17, due 05/01/17, 0.800% total to be received $1,000,067 (collateralized by various U.S. Government Agency Obligations, 2.250% - 2.875%, 08/15/45 - 09/09/49, totaling $1,020,000) | | | 1,000,000 | |
| | | | | | |
| | | | | 1,174,348 | |
| | | | | | |
Shares | | | | | |
| | Other Investment Company –1.0% | | | | |
| 1,251,758 | | Dreyfus Government Cash Management Fund, Institutional Class Shares, 0.69%** | | | 1,251,758 | |
| | | | | | |
| | Total Short Term Investments
(Cost $2,426,106) | | | 2,426,106 | |
| | | | | | |
Total Investments – 101.0%
(Cost $109,183,885)*** | | | 125,642,788 | |
| | | | | | |
Net Other Assets and Liabilities – (1.0)% | | | (1,237,478 | ) |
| | | | | | |
Net Assets – 100.0% | | $ | 124,405,310 | |
| | | | | | |
| * | Non-income producing security. |
| ** | Yield shown represents the April 30, 2017, seven-day average yield, which refers to the sum of the previous seven days’ dividends paid, expressed as an annual percentage. |
| *** | At April 30, 2017, the aggregate cost for Federal income tax purposes approximates the aggregate cost for book purposes. |
The aggregate gross unrealized appreciation and depreciation were as follows:
| | | | |
Gross unrealized appreciation | | $ | 19,709,738 | |
Gross unrealized depreciation | | | (3,250,835 | ) |
| | | | |
Net unrealized appreciation | | $ | 16,458,903 | |
| | | | |
| (a) | Some or all of these securities were out on loan to various brokers as of April 30, 2017, amounting to $1,131,073, or 0.9% of net assets. |
| (b) | Collateral received from brokers for securities lending was invested in these joint repurchase agreements. |
| ADR | American Depositary Receipt |
| REIT | Real Estate Investment Trust |
The accompanying notes are an integral part of these financial statements.
AMG Funds
| | |
| AMG Managers Fairpointe Mid Cap Fund | | April 30, 2017 |
| Schedule of Investments (unaudited) | | |
% of Net Assets
| | | | | | | | |
Shares | | | | | Market
Value | |
| | COMMON STOCKS – 93.6% | | | | |
| |
| | | | Consumer Discretionary – 33.2% | |
| | 1,143,400 | | | BorgWarner, Inc. | | $ | 48,342,952 | |
| | 2,297,620 | | | Cooper Tire & Rubber Co. | | | 87,998,846 | |
| | 2,362,400 | | | DeVry Education Group, Inc. | | | 89,416,840 | |
| | 4,606,700 | | | Gentex Corp. | | | 95,128,355 | |
| | 460,600 | | | Lear Corp. | | | 65,709,196 | |
| | 2,647,196 | | | Lions Gate Entertainment Corp., Class A (Canada) | | | 69,277,119 | |
| | 2,516,696 | | | Lions Gate Entertainment Corp., Class B (Canada) * | | | 60,023,200 | |
| | 2,503,900 | | | LKQ Corp. * | | | 78,221,836 | |
| | 5,271,700 | | | Mattel, Inc. | | | 118,191,514 | |
| | 24,760,800 | | | Office Depot, Inc. | | | 123,061,176 | |
| | 1,281,026 | | | Scholastic Corp. (a) | | | 55,378,754 | |
| | 5,729,000 | | | TEGNA, Inc. | | | 145,974,920 | |
| | 824,100 | | | The Interpublic Group of Cos, Inc. | | | 19,424,037 | |
| | 8,836,854 | | | The New York Times Co., Class A (a) | | | 127,692,540 | |
| | 7,674,542 | | | Time, Inc. (a) | | | 116,653,038 | |
| | 382,400 | | | Whirlpool Corp. | | | 71,004,032 | |
| | | | | | | | |
| | | | | | | 1,371,498,355 | |
| | | | | | | | |
| | | | Consumer Staples – 1.8% | | | | |
| | 501,400 | | | Bunge, Ltd. (Bermuda) | | | 39,625,642 | |
| | 936,700 | | | Hormel Foods Corp. | | | 32,859,436 | |
| | | | | | | | |
| | | | | | | 72,485,078 | |
| | | | | | | | |
| | | | Energy – 4.6% | | | | |
| | 12,174,200 | | | McDermott International, Inc. (Panama) * | | | 79,619,268 | |
| | 2,567,192 | | | TechnipFMC PLC (United Kingdom)* | | | 77,349,495 | |
| | 3,143,000 | | | Transocean, Ltd. (Switzerland) * | | | 34,667,290 | |
| | | | | | | | |
| | | | | | | 191,636,053 | |
| | | | | | | | |
| | | | | | | | |
Shares | | | | | Market
Value | |
| | | | Financials – 4.9% | | | | |
| | 437,200 | | | Cincinnati Financial Corp. | | $ | 31,517,748 | |
| | 1,067,100 | | | Northern Trust Corp. | | | 96,039,000 | |
| | 1,022,800 | | | Raymond James Financial, Inc. | | | 76,219,056 | |
| | | | | | | | |
| | | | | | | 203,775,804 | |
| | | | | | | | |
| | | | Healthcare – 8.4% | | | | |
| | 2,612,638 | | | Patterson Cos, Inc. | | | 116,236,265 | |
| | 692,200 | | | Quest Diagnostics, Inc. | | | 73,034,022 | |
| | 615,120 | | | Varex Imaging Corp. * | | | 20,643,427 | |
| | 1,495,200 | | | Varian Medical Systems, Inc. * | | | 135,674,448 | |
| | | | | | | | |
| | | | | | | 345,588,162 | |
| | | | | | | | |
| | | | Industrials – 15.2% | | | | |
| | 1,182,400 | | | AGCO Corp. | | | 75,661,776 | |
| | 3,987,434 | | | Arconic Inc. | | | 108,976,571 | |
| | 2,112,800 | | | Chicago Bridge & Iron Co. NV (Netherlands) | | | 63,553,024 | |
| | 927,535 | | | Copa Holdings SA, Class A (Panama) | | | 107,983,625 | |
| | 918,100 | | | Donaldson Co., Inc. | | | 42,489,668 | |
| | 1,846,000 | | | Stericycle, Inc. * | | | 157,537,640 | |
| | 2,568,600 | | | Werner Enterprises, Inc. | | | 70,122,780 | |
| | | | | | | | |
| | | | | | | 626,325,084 | |
| | | | | | | | |
| | | | Information Technology – 19.0% | | | | |
| | 1,770,800 | | | Akamai Technologies, Inc. * | | | 107,912,552 | |
| | 4,451,868 | | | Cree, Inc. * | | | 97,406,872 | |
| | 967,998 | | | Itron, Inc. * | | | 62,774,670 | |
| | 3,393,400 | | | Jabil Circuit, Inc. | | | 98,476,468 | |
| | 5,335,700 | | | Juniper Networks, Inc. | | | 160,444,499 | |
| | 4,356,700 | | | Nuance Communications, Inc. * | | | 77,941,363 | |
| | 4,352,500 | | | Teradata Corp. * | | | 127,005,950 | |
| | 4,441,788 | | | Unisys Corp. * (a) | | | 50,192,204 | |
| | | | | | | | |
| | | | | | | 782,154,578 | |
| | | | | | | | |
| | | | Materials – 6.5% | | | | |
| | 2,820,904 | | | Domtar Corp. (a) | | | 111,848,844 | |
| | 1,423,950 | | | FMC Corp. | | | 104,275,859 | |
| | 17,255,900 | | | Gerdau SA, Sponsored ADR (Brazil) | | | 52,630,495 | |
| | | | | | | | |
| | | | | | | 268,755,198 | |
| | | | | | | | |
| | | | Total Common Stocks (Cost $3,062,177,992) | | | 3,862,218,312 | |
| | | | | | | | |
| | INVESTMENT COMPANY – 6.7% | | | | |
| | 276,251,003 | | | Dreyfus Government Cash Management Fund, Institutional Class Shares, 0.69%** | | | 276,251,003 | |
| | | | | | | | |
| | | | Total Investment Company (Cost $276,251,003) | | | 276,251,003 | |
| | | | | | | | |
| Total Investments – 100.3%
(Cost $3,338,428,995)*** | | | 4,138,469,315 | |
| | | | | | | | |
| | Net Other Assets and Liabilities – (0.3)% | | | (12,355,348 | ) |
| | | | | | | | |
| | Net Assets – 100.0% | | $ | 4,126,113,967 | |
| | | | | | | | |
The accompanying notes are an integral part of these financial statements.
AMG Funds
| | |
| AMG Managers Fairpointe Mid Cap Fund | | April 30, 2017 |
| Schedule of Investments – continued | | |
| * | Non-income producing security. |
| ** | Yield shown represents the April 30, 2017, seven-day average yield, which refers to the sum of the previous seven days’ dividends paid, expressed as an annual percentage. |
| *** | At April 30, 2017, the aggregate cost for Federal income tax purposes approximates the aggregate cost for book purposes. |
The aggregate gross unrealized appreciation and depreciation were as follows:
| | | | |
Gross unrealized appreciation | | $ | 998,486,167 | |
Gross unrealized depreciation | | | (198,445,847 | ) |
| | | | |
Net unrealized appreciation | | $ | 800,040,320 | |
| | | | |
| (a) | These securities have been determined to be illiquid securities. At April 30, 2017, these securities amounted to $461,765,380, or 11.2% of net assets. These securities were valued using a quote from the primary exchange and management has determined these securities are traded in active markets. Therefore, it has been determined that these securities are valued using Level 1 pricing inputs. |
| ADR | American Depositary Receipt |
The accompanying notes are an integral part of these financial statements.
AMG Funds
| | |
| AMG Managers Montag & Caldwell Mid Cap Growth Fund | | April 30, 2017 |
| Schedule of Investments (unaudited) | | |
% of Net Assets
| | | | | | |
Shares | | Market
Value | |
COMMON STOCKS – 96.2% | | | | |
| | |
| | Consumer Discretionary – 17.5% | | | | |
3,440 | | Dollar Tree, Inc. * | | $ | 284,729 | |
1,550 | | Dunkin’ Brands Group, Inc. | | | 86,583 | |
1,780 | | Expedia, Inc. | | | 238,022 | |
2,110 | | Five Below, Inc. * | | | 103,643 | |
9,020 | | LKQ Corp. * | | | 281,785 | |
854 | | O’Reilly Automotive, Inc. * | | | 211,920 | |
3,600 | | Ross Stores, Inc. | | | 234,000 | |
3,450 | | ServiceMaster Global Holdings, Inc. * | | | 131,445 | |
| | | | | | |
| | | | | 1,572,127 | |
| | | | | | |
| | Consumer Staples – 7.5% | | | | |
9,910 | | Blue Buffalo Pet Products, Inc. * (a) | | | 244,282 | |
1,250 | | Molson Coors Brewing Co., Class B | | | 119,862 | |
6,880 | | Monster Beverage Corp. * | | | 312,214 | |
| | | | | | |
| | | | | 676,358 | |
| | | | | | |
| | Energy – 1.7% | | | | |
1,350 | | Core Laboratories NV (Netherlands) (a) | | | 149,607 | |
| | | | | | |
| | Financials – 9.1% | | | | |
757 | | FactSet Research Systems, Inc. | | | 123,588 | |
3,940 | | Intercontinental Exchange, Inc. | | | 237,188 | |
2,420 | | Raymond James Financial, Inc. | | | 180,338 | |
1,989 | | Signature Bank New York NY * | | | 275,377 | |
| | | | | | |
| | | | | 816,491 | |
| | | | | | |
| | Healthcare – 11.2% | | | | |
747 | | CR Bard, Inc. | | | 229,688 | |
2,870 | | Edwards Lifesciences Corp. * | | | 314,753 | |
1,980 | | Laboratory Corp. of America Holdings* | | | 277,497 | |
2,230 | | Quintiles IMS Holdings, Inc. * | | | 187,944 | |
| | | | | | |
| | | | | 1,009,882 | |
| | | | | | |
| | | | | | |
Shares | | Market
Value | |
| | Industrials – 20.8% | | | | |
383 | | Acuity Brands, Inc. | | $ | 67,446 | |
3,760 | | AMETEK, Inc. | | | 215,072 | |
7,280 | | Copart, Inc. * | | | 224,952 | |
4,650 | | Fastenal Co. | | | 207,762 | |
4,300 | | HD Supply Holdings, Inc. * | | | 173,290 | |
5,825 | | IHS Markit, Ltd. (United Kingdom) * | | | 252,805 | |
2,630 | | J.B. Hunt Transport Services, Inc. | | | 235,806 | |
1,387 | | Snap-On, Inc. | | | 232,364 | |
3,110 | | Verisk Analytics, Inc. * | | | 257,539 | |
| | | | | | |
| | | | | 1,867,036 | |
| | | | | | |
| | Information Technology – 28.4% | | | | |
1,490 | | Akamai Technologies, Inc. * | | | 90,801 | |
2,750 | | Amphenol Corp., Class A | | | 198,853 | |
2,100 | | ANSYS, Inc. * | | | 231,336 | |
1,680 | | Arista Networks, Inc. * (a) | | | 234,595 | |
2,560 | | EPAM Systems, Inc. * | | | 197,120 | |
1,800 | | Euronet Worldwide, Inc. * | | | 148,716 | |
1,290 | | F5 Networks, Inc. * | | | 166,578 | |
2,750 | | Fidelity National Information Services, Inc. | | | 231,522 | |
1,636 | | FleetCor Technologies, Inc. * | | | 230,905 | |
6,960 | | Genpact Ltd. (Bermunda) | | | 169,963 | |
5,650 | | MACOM Technology Solutions Holdings, Inc.* | | | 276,172 | |
1,210 | | Skyworks Solutions, Inc. | | | 120,685 | |
2,530 | | WEX, Inc. * | | | 256,694 | |
| | | | | | |
| | | | | 2,553,940 | |
| | | | | | |
| | Total Common Stocks (Cost $7,360,223) | | | 8,645,441 | |
| | | | | | |
| | | | | | | | |
Principal
Amount | | | | | | |
| | SHORT TERM INVESTMENTS – 10.4% | | | | |
| | | | Repurchase Agreements – 4.7% (b) | | | | |
| $ | 423,918 | | | Royal Bank of Scotland PLC, dated 04/28/17, due 05/01/17, 0.800% total to be received $423,946 (collateralized by various U.S. Government Agency Obligations, 0.077% – 1.125%, 05/31/17 – 08/31/21, totaling $432,398) | | | 423,918 | |
| | | | | | | | |
Shares | | | | | | |
| | | | Other Investment Company – 5.7% | | | | |
| | 509,965 | | | Dreyfus Government Cash Management Fund, Institutional Class Shares, 0.69%** | | | 509,965 | |
| | | | | | | | |
| | | | Total Short Term Investments (Cost $933,883) | | | 933,883 | |
| | | | | | | | |
| Total Investments – 106.6%
(Cost $8,294,106)*** | | | 9,579,324 | |
| | | | | | | | |
| | Net Other Assets and Liabilities – (6.6)% | | | (589,484 | ) |
| | | | | | | | |
| | Net Assets – 100.0% | | $ | 8,989,840 | |
| | | | | | | | |
The accompanying notes are an integral part of these financial statements.
AMG Funds
| | |
| AMG Managers Montag & Caldwell Mid Cap Growth Fund | | April 30, 2017 |
| Schedule of Investments – continued | | |
| * | Non-income producing security. |
| ** | Yield shown represents the April 30, 2017, seven-day average yield, which refers to the sum of the previous seven days’ dividends paid, expressed as an annual percentage. |
| *** | At April 30, 2017, the aggregate cost for Federal income tax purposes approximates the aggregate cost for book purposes. The aggregate gross unrealized appreciation and depreciation were as follows: |
| | | | |
Gross unrealized appreciation | | $ | 1,359,165 | |
Gross unrealized depreciation | | | (73,947 | ) |
| | | | |
Net unrealized appreciation | | $ | 1,285,218 | |
| | | | |
| (a) | Some or all of these securities were out on loan to various brokers as of April 30, 2017, amounting to $408,459 or 4.5% of net assets. |
| (b) | Collateral received from brokers for securities lending was invested in these joint repurchase agreements. |
The accompanying notes are an integral part of these financial statements.
AMG Funds
| | |
| AMG Managers LMCG Small Cap Growth Fund | | April 30, 2017 |
| Schedule of Investments (unaudited) | | |
% of Net Assets
| | | | | | | | |
Shares | | | | | Market
Value | |
| COMMON STOCKS – 96.4% | | | | |
| | |
| | | | Consumer Discretionary – 16.6% | | | | |
| | 50,514 | | | Camping World Holdings, Inc., Class A (a) | | $ | 1,561,893 | |
| | 14,565 | | | Dave & Buster’s Entertainment, Inc. * | | | 932,306 | |
| | 146,755 | | | ILG, Inc. | | | 3,538,263 | |
| | 9,160 | | | Monro Muffler Brake, Inc. | | | 474,946 | |
| | 30,066 | | | Murphy USA, Inc. * | | | 2,091,692 | |
| | 84,144 | | | Nexstar Broadcasting Group, Inc. | | | 5,805,936 | |
| | 14,276 | | | Papa John’s International, Inc. | | | 1,128,660 | |
| | 112,613 | | | Planet Fitness Inc., Class A | | | 2,342,350 | |
| | 17,219 | | | Sinclair Broadcast Group, Inc., Class A | | | 679,290 | |
| | 15,224 | | | Tenneco, Inc. | | | 959,569 | |
| | 21,632 | | | Texas Roadhouse, Inc. | | | 1,014,108 | |
| | 9,303 | | | Vail Resorts, Inc. | | | 1,838,831 | |
| | | | | | | | |
| | | | | | | 22,367,844 | |
| | | | | | | | |
| | | | Energy – 1.2% | | | | |
| | 62,929 | | | Carrizo Oil & Gas, Inc. * | | | 1,582,664 | |
| | | | | | | | |
| | | | Financials – 4.5% | | | | |
| | 47,822 | | | Pinnacle Financial Partners, Inc. | | | 3,060,608 | |
| | 15,284 | | | Primerica, Inc. | | | 1,280,799 | |
| | 37,241 | | | Western Alliance BanCorp. * | | | 1,783,844 | |
| | | | | | | | |
| | | | | | | 6,125,251 | |
| | | | | | | | |
| | | | Healthcare – 19.4% | | | | |
| | 30,685 | | | Alder Biopharmaceuticals, Inc. * | | | 615,234 | |
| | 133,845 | | | Cross Country Healthcare, Inc.. * | | | 1,869,815 | |
| | 51,605 | | | Envision Healthcare Corp. * | | | 2,891,428 | |
| | 29,952 | | | HealthEquity, Inc. * | | | 1,363,415 | |
| | 125,756 | | | Horizon Pharma PLC * | | | 1,934,127 | |
| | 66,508 | | | INC Research Holdings, Inc., Class A * | | | 2,992,860 | |
| | 25,369 | | | Integra LifeSciences Holdings Corp. * | | | 1,166,213 | |
| | 18,648 | | | Ligand Pharmaceuticals, Inc. * (a) | | | 2,073,098 | |
| | | | | | | | |
Shares | | | | | Market
Value | |
| | | | Healthcare (continued) | | | | |
| | 31,640 | | | Neurocrine Biosciences, Inc. * | | $ | 1,689,576 | |
| | 29,518 | | | Nevro Corp. * (a) | | | 2,781,186 | |
| | 43,385 | | | NuVasive, Inc. * | | | 3,145,846 | |
| | 35,189 | | | Pacira Pharmaceuticals, Inc. * | | | 1,708,426 | |
| | 50,562 | | | Radius Health, Inc. * (a) | | | 1,975,457 | |
| | | | | | | | |
| | | | | | | 26,206,681 | |
| | | | | | | | |
| | | | Industrials – 19.0% | | | | |
| | 59,189 | | | Actuant Corp., Class A | | | 1,615,860 | |
| | 19,060 | | | Apogee Enterprises, Inc. | | | 1,038,770 | |
| | 68,762 | | | Beacon Roofing Supply, Inc. * | | | 3,408,532 | |
| | 4,219 | | | Dycom Industries, Inc. * | | | 445,779 | |
| | 81,981 | | | Echo Global Logistics, Inc. * | | | 1,537,144 | |
| | 49,809 | | | Healthcare Services Group, Inc. | | | 2,286,731 | |
| | 62,529 | | | JELD-WEN Holding, Inc. * | | | 2,065,333 | |
| | 29,592 | | | John Bean Technologies Corp. | | | 2,623,331 | |
| | 48,577 | | | Knight Transportation, Inc. (a) | | | 1,666,191 | |
| | 22,658 | | | Masonite International Corp. * | | | 1,885,146 | |
| | 11,043 | | | RBC Bearings, Inc. * | | | 1,107,613 | |
| | 14,199 | | | Rexnord Corp. * | | | 346,456 | |
| | 66,262 | | | SiteOne Landscape Supply, Inc. * | | | 3,167,986 | |
| | 32,120 | | | WageWorks, Inc. * | | | 2,370,456 | |
| | | | | | | | |
| | | | | | | 25,565,328 | |
| | | | | | | | |
| | | | Information Technology – 23.2% | | | | |
| | 70,649 | | | Advanced Micro Devices, Inc. * | | | 939,632 | |
| | 40,875 | | | Cavium, Inc. * | | | 2,814,244 | |
| | 7,409 | | | Coherent, Inc. * | | | 1,597,380 | |
| | 9,101 | | | Euronet Worldwide, Inc. * | | | 751,925 | |
| | 10,945 | | | GrubHub, Inc. * (a) | | | 470,416 | |
| | 128,546 | | | GTT Communications, Inc. * | | | 3,535,015 | |
| | 27,491 | | | HubSpot, Inc. * | | | 1,843,271 | |
| | 31,325 | | | Imperva, Inc. * | | | 1,392,396 | |
| | 19,956 | | | InterXion Holding NV * | | | 831,367 | |
| | 37,219 | | | J2 Global, Inc. | | | 3,358,643 | |
| | 61,237 | | | MACOM Technology Solutions Holdings, Inc.* | | | 2,993,265 | |
| | 10,937 | | | MAXIMUS, Inc. | | | 667,048 | |
| | 87,893 | | | MINDBODY, Inc., Class A * (a) | | | 2,491,767 | |
| | 29,305 | | | Paylocity Holding Corp. * | | | 1,155,789 | |
| | 20,170 | | | Proofpoint, Inc. * | | | 1,520,213 | |
| | 41,581 | | | RealPage, Inc. * | | | 1,540,576 | |
| | 34,767 | | | Take-Two Interactive Software, Inc. * | | | 2,185,106 | |
| | 7,617 | | | Tyler Technologies, Inc. * | | | 1,246,065 | |
| | | | | | | | |
| | | | | | | 31,334,118 | |
| | | | | | | | |
| | | | Materials – 6.5% | | | | |
| | 45,992 | | | Berry Plastics Group, Inc. * | | | 2,299,600 | |
| | 122,305 | | | Forterra, Inc. * | | | 2,353,148 | |
| | 13,159 | | | Ingevity Corp. * | | | 832,044 | |
| | 8,164 | | | Sensient Technologies Corp | | | 667,815 | |
| | 51,678 | | | Summit Materials, Inc., Class A * | | | 1,326,057 | |
| | 31,449 | | | The Chemours Co | | | 1,267,080 | |
| | | | | | | | |
| | | | | | | 8,745,744 | |
| | | | | | | | |
The accompanying notes are an integral part of these financial statements.
AMG Funds
| | |
| AMG Managers LMCG Small Cap Growth Fund | | April 30, 2017 |
| Schedule of Investments – continued | | |
| | | | | | | | |
Shares | | | | | Market
Value | |
| | | | Real Estate – 3.8% | | | | |
| | 32,382 | | | DuPont Fabros Technology, Inc., REIT | | $ | 1,669,292 | |
| | 63,221 | | | National Storage Affiliates Trust, REIT | | | 1,548,915 | |
| | 35,873 | | | QTS Realty Trust, Inc., Class A, REIT | | | 1,917,053 | |
| | | | | | | | |
| | | | | | | 5,135,260 | |
| | | | | | | | |
| | | | Telecommunication Services – 2.2% | | | | |
| | 437,151 | | | Vonage Holdings Corp. * | | | 2,933,283 | |
| | | | | | | | |
| | | | Total Common Stocks
(Cost $113,810,290) | | | 129,996,173 | |
| | | | | | | | |
| | RIGHTS – 0.00%# | | | | |
| | | | Healthcare – 0.00%# | | | | |
| | 99,639 | | | Dyax Corp., CVR Expiration 12/31/19 * (b) (c) | | | 996 | |
| | | | | | | | |
| | | | Total Rights
(Cost $0) | | | 996 | |
| | | | | | | | |
Principal
Amount | | | | | | |
| | SHORT TERM INVESTMENTS – 6.3% | | | | |
| | | | Repurchase Agreements –4.3% (d) | | | | |
| | $1,367,066 | | | Deutsche Bank Securities, Inc., dated 04/28/17, due 05/01/17, 0.850% total to be received $1,367,163 (collateralized by various U.S. Government Agency Obligations, 2.000%—6.500%, 05/01/17—04/01/47, totaling $1,394,407) | | | 1,367,066 | |
| | 1,367,066 | | | Citigroup Global Markets, Inc., dated 04/28/17, due 05/01/17, 0.820% total to be received $1,367,159 (collateralized by various U.S. Government Agency Obligations, 0.000%—11.500%, 05/01/17—06/01/53, totaling $1,394,407) | | | 1,367,066 | |
| | 287,677 | | | JP Morgan Securities LLC, dated 04/28/17, due 05/01/17, 0.810% total to be received $287,696 (collateralized by various U.S. Government Agency Obligations, 1.375%—2.250%, 11/30/17 - 08/15/21, totaling $293,431) | | | 287,677 | |
| | 1,367,066 | | | Merrill Lynch, Pierce, Fenner & Smith, Inc., dated 04/28/17, due 05/01/17, 0.810% total to be received $1,367,158 (collateralized by various U.S. Government Agency Obligations, 3.000%—4.500%, 09/20/42—04/20/45, totaling $1,394,407) | | | 1,367,066 | |
| | | | | | | | |
Principal
Amount | | | | | Market Value | |
| | | | Repurchase Agreements (continued) | | | | |
| | $1,367,066 | | | RBC Dominion Securities, Inc, dated 04/28/17, due 05/01/17, 0.810% total to be received $1,367,158 (collateralized by various U.S. Government Agency Obligations, 0.125%—7.000%, 07/15/17—07/01/55, totaling $1,394,407) | | $ | 1,367,066 | |
| | | | | | | | |
| | | | Total Repurchase Agreements | | | 5,755,941 | |
| | | | | | | | |
Shares | | | | | | |
| | | | Other Investment Company – 2.0% | | | | |
| | 2,689,117 | | | Dreyfus Government Cash Management Fund, Institutional Class Shares, 0.69%** | | | 2,689,117 | |
| | | | | | | | |
| | | | Total Short Term Investments
(Cost $8,445,058) | | | 8,445,058 | |
| | | | | | | | |
| Total Investments – 102.7%
(Cost $122,255,348)*** | | | 138,442,227 | |
| | | | | | | | |
| | Net Other Assets and Liabilities – (2.7)% | | | (3,613,885 | ) |
| | | | | | | | |
| | Net Assets – 100.0% | | $ | 134,828,342 | |
| | | | | | | | |
| * | Non-income producing security. |
| ** | Yield shown represents the April 30, 2017, seven-day average yield, which refers to the sum of the previous seven days’ dividends paid, expressed as an annual percentage. |
| *** | At April 30, 2017, the aggregate cost for Federal income tax purposes approximates the aggregate cost for book purposes. The aggregate gross unrealized appreciation and depreciation were as follows: |
| | | | |
Gross unrealized appreciation | | $ | 18,788,847 | |
Gross unrealized depreciation | | | (2,601,968 | ) |
| | | | |
Net unrealized appreciation | | $ | 16,186,879 | |
| | | | |
| (a) | Some or all of these securities were out on loan to various brokers as of April 30, 2017, amounting to $5,585,456, or 4.1% of net assets. |
| (b) | Securities with a total aggregate market value of $996, or less than 0.05% of net assets, were valued under fair value procedures established by the Fund’s Board of Trustees. |
| (c) | The security is restricted for resale. |
| (d) | Collateral received from brokers for securities lending was invested in these joint repurchase agreements. |
| CVR | Contingent Value Rights |
| REIT | Real Estate Investment Trust |
The accompanying notes are an integral part of these financial statements.
AMG Funds
| | |
| AMG River Road Select Value Fund | | April 30, 2017 |
| Schedule of Investments (unaudited) | | |

% of Net Assets
| | | | | | | | |
Shares | | | | | Market
Value | |
| | COMMON STOCKS – 97.9% | | | | |
| | | | Consumer Discretionary – 30.9% | | | | |
| | 8,060 | | | Asbury Automotive Group, Inc. * | | $ | 493,272 | |
| | 1,778 | | | Biglari Holdings, Inc. * | | | 758,548 | |
| | 30,560 | | | Extended Stay America, Inc. | | | 532,966 | |
| | 19,477 | | | International Speedway Corp., Class A | | | 722,597 | |
| | 26,331 | | | J Alexander’s Holdings, Inc. * | | | 289,641 | |
| | 54,470 | | | La Quinta Holdings, Inc. * | | | 768,572 | |
| | 7,834 | | | Liberty Broadband Corp., Class C * | | | 714,147 | |
| | 27,178 | | | Liberty Expedia Holdings, Inc., Class A * | | | 1,312,969 | |
| | 39,372 | | | Liberty Ventures, Class A * | | | 2,120,182 | |
| | 26,350 | | | Motorcar Parts of America, Inc. * | | | 798,932 | |
| | 19,823 | | | Murphy USA, Inc. * | | | 1,379,086 | |
| | 5,140 | | | Polaris Industries, Inc. (a) | | | 438,236 | |
| | 24,522 | | | Select Comfort Corp. * | | | 757,730 | |
| | 3,289 | | | The Madison Square Garden Co., Class A * | | | 663,622 | |
| | 19,047 | | | Tribune Media Co., Class A | | | 696,358 | |
| | 10,170 | | | Vista Outdoor, Inc. * | | | 198,925 | |
| | | | | | | | |
| | | | | | | 12,645,783 | |
| | | | | | | | |
| | | | Consumer Staples – 2.9% | | | | |
| | 25,693 | | | Ingles Markets, Inc., Class A | | | 1,199,863 | |
| | | | | | | | |
| | | | Energy – 3.3% | | | | |
| | 51,820 | | | Gran Tierra Energy, Inc. * | | | 130,586 | |
| | 21,175 | | | PBF Energy, Inc., Class A (a) | | | 472,626 | |
| | 19,520 | | | QEP Resources, Inc. * | | | 230,531 | |
| | 13,870 | | | World Fuel Services Corp. | | | 510,832 | |
| | | | | | | | |
| | | | | | | 1,344,575 | |
| | | | | | | | |
| | | | Financials – 14.5% | | | | |
| | 1,201 | | | American National Insurance Co. | | | 140,421 | |
| | 20,567 | | | Capital Southwest Corp. (BDC) | | | 333,597 | |
| | 14,980 | | | CNA Financial Corp. | | | 677,995 | |
| | | | | | | | |
Shares | | | | | Market
Value | |
| | | | Financials (continued) | | | | |
| | 125,595 | | | FNFV Group * | | $ | 1,720,651 | |
| | 22,529 | | | Leucadia National Corp. | | | 572,011 | |
| | 42,432 | | | PICO Holdings, Inc. * | | | 683,155 | |
| | 2,102 | | | White Mountains Insurance Group, Ltd. (Bermuda) | | | 1,805,492 | |
| | | | | | | | |
| | | | | | | 5,933,322 | |
| | | | | | | | |
| | | | Healthcare – 7.2% | | | | |
| | 20,493 | | | Computer Programs & Systems, Inc. | | | 562,533 | |
| | 3,741 | | | Orthofix International NV * | | | 147,957 | |
| | 53,040 | | | Premier, Inc., Class A * | | | 1,792,752 | |
| | 3,880 | | | Taro Pharmaceutical Industries, Ltd. (a) | | | 453,378 | |
| | | | | | | | |
| | | | | | | 2,956,620 | |
| | | | | | | | |
| | | | Industrials – 16.3% | | | | |
| | 40,016 | | | Air Transport Services Group, Inc. * | | | 735,894 | |
| | 13,583 | | | Cubic Corp. | | | 704,958 | |
| | 10,129 | | | Forward Air Corp. | | | 538,559 | |
| | 6,682 | | | Kansas City Southern | | | 601,848 | |
| | 9,145 | | | Kelly Services, Inc., Class A | | | 204,116 | |
| | 5,643 | | | KLX, Inc. * | | | 266,914 | |
| | 31,958 | | | Resources Connection, Inc. | | | 444,216 | |
| | 20,956 | | | SP Plus Corp. * | | | 721,934 | |
| | 12,286 | | | Spirit AeroSystems Holdings, Inc., | | | | |
| | | | Class A | | | 702,268 | |
| | 11,436 | | | UniFirst Corp. | | | 1,591,891 | |
| | 3,664 | | | US Ecology, Inc. | | | 172,758 | |
| | | | | | | | |
| | | | | | | 6,685,356 | |
| | | | | | | | |
| | | | Information Technology – 15.9% | | | | |
| | 34,620 | | | Blackhawk Network Holdings, Inc. * | | | 1,400,379 | |
| | 31,490 | | | Conduent, Inc. * | | | 513,602 | |
| | 17,264 | | | CSG Systems International, Inc. | | | 647,573 | |
| | 15,210 | | | Dolby Laboratories, Inc., Class A | | | 802,023 | |
| | 5,942 | | | ePlus, Inc. * | | | 423,368 | |
| | 13,485 | | | Match Group, Inc. * (a) | | | 251,226 | |
| | 2,030 | | | MicroStrategy, Inc., Class A * | | | 386,045 | |
| | 3,980 | | | OSI Systems, Inc. * | | | 308,052 | |
| | 26,810 | | | Sabre Corp. | | | 627,622 | |
| | 16,818 | | | Sykes Enterprises, Inc. * | | | 501,345 | |
| | 33,650 | | | VeriFone Systems, Inc. * (a) | | | 623,871 | |
| | | | | | | | |
| | | | | | | 6,485,106 | |
| | | | | | | | |
| | | | Materials – 1.1% | | | | |
| | 32,570 | | | Graphic Packaging Holding Co. | | | 442,301 | |
| | | | | | | | |
| | | | Real Estate – 2.3% | | | | |
| | 7,790 | | | Marcus & Millichap, Inc. * | | | 200,982 | |
| | 24,190 | | | Realogy Holdings Corp. | | | 739,005 | |
| | | | | | | | |
| | | | | | | 939,987 | |
| | | | | | | | |
| | | | Telecommunication Services – 2.0% | |
| | 4,566 | | | ATN International, Inc. | | | 315,922 | |
| | 18,583 | | | Telephone & Data Systems, Inc. | | | 510,289 | |
| | | | | | | | |
| | | | | | | 826,211 | |
| | | | | | | | |
The accompanying notes are an integral part of these financial statements.
AMG Funds
| | |
| AMG River Road Select Value Fund | | April 30, 2017 |
| Schedule of Investments – continued | | |
| | | | | | | | |
Shares | | | | | Market
Value | |
| | | | Utilities – 1.5% | | | | |
| | 10,898 | | | National Fuel Gas Co. (a) | | $ | 603,531 | |
| | | | | | | | |
| | | | Total Common Stocks (Cost $34,083,268) | | | 40,062,655 | |
| | | | | | | | |
Principal
Amount | | | | | | |
| | SHORT TERM INVESTMENTS – 5.6% | | | | |
| | | | Repurchase Agreements – 3.5% (b) | |
| | $1,000,000 | | | Merrill Lynch, Pierce, Fenner & Smith, Inc., dated 04/28/17, due 05/01/17, 0.810% total to be received $1,000,068 (collateralized by various U.S. Government Agency Obligations, 3.000% - 4.500%, 09/20/42 - 04/20/45, totaling $1,020,000) | | | 1,000,000 | |
| | 409,152 | | | Royal Bank of Scotland PLC, dated 04/28/17, due 05/01/17, 0.800% total to be received $409,179 (collateralized by various U.S. Government Agency Obligations, 0.077% - 1.125%, 05/31/17 - 08/31/21, totaling $417,337) | | | 409,152 | |
| | | | | | | | |
| | | | Total Repurchase Agreements | | | 1,409,152 | |
| | | | | | | | |
Shares | | | | | | |
| | | | Other Investment Company – 2.1% | |
| | 869,010 | | | Dreyfus Government Cash Management Fund, Institutional Class Shares, 0.69%** | | | 869,010 | |
| | | | | | | | |
| | | | Total Short Term Investments
(Cost $2,278,162) | | | 2,278,162 | |
| | | | | | | | |
| Total Investments – 103.5%
(Cost $36,361,430)*** | | | 42,340,817 | |
| | | | | | | | |
| | Net Other Assets and Liabilities – (3.5)% | | | (1,417,356 | ) |
| | | | | | | | |
| | Net Assets – 100.0% | | $ | 40,923,461 | |
| | | | | | | | |
| * | Non-income producing security. |
| ** | Yield shown represents the April 30, 2017, seven-day average yield, which refers to the sum of the previous seven days’ dividends paid, expressed as an annual percentage. |
| *** | At April 30, 2017, the aggregate cost for Federal income tax purposes approximates the aggregate cost for book purposes. The aggregate gross unrealized appreciation and depreciation were as follows: |
| | | | |
Gross unrealized appreciation | | $ | 6,313,991 | |
Gross unrealized depreciation | | | (334,604 | ) |
| | | | |
Net unrealized appreciation | | $ | 5,979,387 | |
| | | | |
| (a) | Some or all of these securities were out on loan to various brokers as of April 30, 2017, amounting to $1,363,682, or 3.3% of net assets. |
| (b) | Collateral received from brokers for securities lending was invested in these joint repurchase agreements. |
| BDC | Business Development Company |
The accompanying notes are an integral part of these financial statements.
AMG Funds
| | |
| AMG River Road Small Cap Value Fund | | April 30, 2017 |
| Schedule of Investments (unaudited) | | |
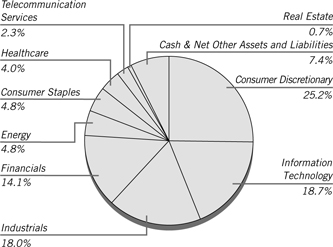
% of Net Assets
| | | | | | | | |
Shares | | | | | Market
Value | |
| | COMMON STOCKS – 92.6% | | | | |
| | | | Consumer Discretionary – 25.2% | | | | |
| | 73,110 | | | Asbury Automotive Group, Inc. * | | $ | 4,474,332 | |
| | 15,845 | | | Biglari Holdings, Inc. * | | | 6,759,952 | |
| | 190,126 | | | International Speedway Corp., Class A | | | 7,053,675 | |
| | 326,645 | | | J Alexander’s Holdings, Inc. * (a) | | | 3,593,095 | |
| | 394,960 | | | La Quinta Holdings, Inc. * | | | 5,572,886 | |
| | 189,830 | | | Liberty Expedia Holdings, Inc., Class A * | | | 9,170,687 | |
| | 97,552 | | | Monarch Casino & Resort, Inc. * | | | 2,874,857 | |
| | 220,176 | | | Motorcar Parts of America, Inc. * | | | 6,675,736 | |
| | 150,542 | | | Murphy USA, Inc. * | | | 10,473,207 | |
| | 208,353 | | | Select Comfort Corp. * | | | 6,438,108 | |
| | 44,892 | | | SodaStream International, Ltd. (Israel) * | | | 2,441,676 | |
| | 134,864 | | | Tribune Media Co., Class A | | | 4,930,628 | |
| | 254,360 | | | UCP, Inc., Class A * (a) | | | 2,912,422 | |
| | 140,590 | | | Vista Outdoor, Inc. * | | | 2,749,940 | |
| | | | | | | | |
| | | | | | | 76,121,201 | |
| | | | | | | | |
| | | | Consumer Staples – 4.8% | | | | |
| | 215,895 | | | Ingles Markets, Inc., Class A | | | 10,082,297 | |
| | 394,013 | | | Natural Grocers by Vitamin Cottage, Inc. * | | | 4,310,502 | |
| | | | | | | | |
| | | | | | | 14,392,799 | |
| | | | | | | | |
| | | | Energy – 4.8% | | | | |
| | 208,470 | | | Evolution Petroleum Corp. | | | 1,667,760 | |
| | 657,120 | | | Gran Tierra Energy, Inc. * | | | 1,655,942 | |
| | 182,060 | | | PBF Energy, Inc., Class A (b) | | | 4,063,579 | |
| | 219,050 | | | QEP Resources, Inc. * | | | 2,586,981 | |
| | 124,900 | | | World Fuel Services Corp. | | | 4,600,067 | |
| | | | | | | | |
| | | | | | | 14,574,329 | |
| | | | | | | | |
| | | | | | | | |
Shares | | | | | Market
Value | |
| | | | Financials – 14.1% | | | | |
| | 30,690 | | | American National Insurance Co. | | $ | 3,588,275 | |
| | 239,229 | | | Capital Southwest Corp. (BDC) | | | 3,880,294 | |
| | 7,185 | | | First Citizens BancShares, Inc., Class A | | | 2,500,811 | |
| | 951,865 | | | FNFV Group * | | | 13,040,551 | |
| | 345,294 | | | PICO Holdings, Inc. * | | | 5,559,233 | |
| | 16,438 | | | White Mountains Insurance Group, Ltd. (Bermuda) | | | 14,119,256 | |
| | | | | | | | |
| | | | | | | 42,688,420 | |
| | | | | | | | |
| | | | Healthcare – 4.0% | | | | |
| | 139,698 | | | Akorn, Inc. * | | | 4,672,898 | |
| | 216,872 | | | Computer Programs & Systems, Inc. | | | 5,953,136 | |
| | 33,808 | | | Orthofix International NV * | | | 1,337,106 | |
| | | | | | | | |
| | | | | | | 11,963,140 | |
| | | | | | | | |
| | | | Industrials – 18.0% | | | | |
| | 348,923 | | | Air Transport Services Group, Inc. * | | | 6,416,694 | |
| | 46,142 | | | Barrett Business Services, Inc. | | | 2,660,548 | |
| | 99,757 | | | Cubic Corp. | | | 5,177,388 | |
| | 107,950 | | | Forward Air Corp. | | | 5,739,701 | |
| | 141,480 | | | Kelly Services, Inc., Class A | | | 3,157,834 | |
| | 68,057 | | | KLX, Inc. * | | | 3,219,096 | |
| | 285,383 | | | Resources Connection, Inc. | | | 3,966,824 | |
| | 212,369 | | | SP Plus Corp. * | | | 7,316,112 | |
| | 92,877 | | | UniFirst Corp. | | | 12,928,478 | |
| | 45,386 | | | US Ecology, Inc. | | | 2,139,950 | |
| | 39,569 | | | Viad Corp. | | | 1,788,519 | |
| | | | | | | | |
| | | | | | | 54,511,144 | |
| | | | | | | | |
| | | | Information Technology – 18.7% | |
| | 288,917 | | | Blackhawk Network Holdings, Inc. * | | | 11,686,693 | |
| | 134,105 | | | Computer Services, Inc. (a) | | | 6,148,714 | |
| | 152,945 | | | CSG Systems International, Inc. | | | 5,736,967 | |
| | 64,028 | | | ePlus, Inc. * | | | 4,561,995 | |
| | 155,578 | | | Ituran Location and Control, Ltd. (Israel) | | | 4,869,591 | |
| | 138,836 | | | Match Group, Inc. * | | | 2,586,515 | |
| | 24,750 | | | MicroStrategy, Inc., Class A * | | | 4,706,708 | |
| | 59,902 | | | NeuStar, Inc., Class A * | | | 1,988,746 | |
| | 37,210 | | | OSI Systems, Inc. * | | | 2,880,054 | |
| | 126,968 | | | Sykes Enterprises, Inc. * | | | 3,784,916 | |
| | 140,344 | | | TechTarget Inc. * | | | 1,298,182 | |
| | 333,870 | | | VeriFone Systems, Inc. * (b) | | | 6,189,950 | |
| | | | | | | | |
| | | | | | | 56,439,031 | |
| | | | | | | | |
| | | | Real Estate – 0.7% | | | | |
| | 84,801 | | | Marcus & Millichap, Inc. * | | | 2,187,866 | |
| | | | | | | | |
| | | | Telecommunication Services – 2.3% | |
| | 44,103 | | | ATN International, Inc. | | | 3,051,487 | |
| | 139,240 | | | Telephone & Data Systems, Inc. | | | 3,823,530 | |
| | | | | | | | |
| | | | | | | 6,875,017 | |
| | | | | | | | |
| | | | Total Common Stocks
(Cost $213,626,279) | | | 279,752,947 | |
| | | | | | | | |
The accompanying notes are an integral part of these financial statements.
AMG Funds
| | |
| AMG River Road Small Cap Value Fund | | April 30, 2017 |
| Schedule of Investments – continued | | |
| | | | | | | | |
Principal
Amount | | | | | Market Value | |
| | SHORT TERM INVESTMENTS – 9.3% | |
| | | | Repurchase Agreements – 1.9% (c) | |
| | $1,344,834 | | | Cantor Fitzgerald Securities, Inc., dated 04/28/17, due 05/01/17, 0.840% total to be received $1,344,928 (collateralized by various U.S. Government Agency Obligations, 0.000% - 10.000%, 04/30/17 - 03/20/67, totaling $1,371,731) | | $ | 1,344,834 | |
| | 282,997 | | | Citigroup Global Markets, Inc., dated 04/28/17, due 05/01/17, 0.800% total to be received $283,016 (collateralized by various U.S. Government Agency Obligations, 0.000% - 8.875%, 04/30/17 - 09/09/49, totaling $288,657) | | | 282,997 | |
| | 1,344,834 | | | Daiwa Capital Markets America, dated 04/28/17, due 05/01/17, 0.850% total to be received $1,344,929 (collateralized by various U.S. Government Agency Obligations, 0.000% - 6.500%, 05/18/17 - 12/01/51, totaling $1,371,731) | | | 1,344,834 | |
| | 1,344,834 | | | HSBC Securities USA, Inc., dated 04/28/17, due 05/01/17, 0.780% total to be received $1,344,921 (collateralized by various U.S. Government Agency Obligations, 0.000%, 08/15/27 - 08/15/40, totaling $1,371,733) | | | 1,344,834 | |
| | 1,344,834 | | | Nomura Securities International, Inc., dated 04/28/17, due 05/01/17, 0.830% total to be received $1,344,927 (collateralized by various U.S. Government Agency Obligations, 1.950% - 9.000%, 06/01/18 - 03/20/67, totaling $1,371,733) | | | 1,344,834 | |
| | | | | | | | |
| | | | Total Repurchase Agreements | | | 5,662,333 | |
| | | | | | | | |
Shares | | | | | | |
| | | | Other Investment Company – 7.4% | |
| | 22,458,281 | | | Dreyfus Government Cash Management Fund, Institutional Class Shares, 0.69%** | | | 22,458,281 | |
| | | | | | | | |
| | | | Total Short Term Investments
(Cost $28,120,614) | | | 28,120,614 | |
| | | | | | | | |
| Total Investments – 101.9%
(Cost $241,746,893)*** | | | 307,873,561 | |
| | | | | | | | |
| | Net Other Assets and Liabilities – (1.9)% | | | (5,753,349 | ) |
| | | | | | | | |
| | Net Assets – 100.0% | | $ | 302,120,212 | |
| | | | | | | | |
| * | Non-income producing security. |
| ** | Yield shown represents the April 30, 2017, seven-day average yield, which refers to the sum of the previous seven days’ dividends paid, expressed as an annual percentage. |
| *** | At April 30, 2017, the aggregate cost for Federal income tax purposes approximates the aggregate cost for book purposes. The aggregate gross unrealized appreciation and depreciation were as follows: |
| | | | |
Gross unrealized appreciation | | $ | 69,344,912 | |
Gross unrealized depreciation | | | (3,218,244 | ) |
| | | | |
Net unrealized appreciation | | $ | 66,126,668 | |
| | | | |
| (a) | These securities have been determined to be illiquid securities. At April 30, 2017, these securities amounted to $12,654,231, or 4.2% of net assets. These securities were valued using a quote from the primary exchange and management has determined these securities are traded in active markets. Therefore, it has been determined that these securities are valued using Level 1 pricing inputs. |
| (b) | Some or all of these securities were out on loan to various brokers as of April 30, 2017, amounting to $5,404,619, or 1.8% of net assets. |
| (c) | Collateral received from brokers for securities lending was invested in these joint repurchase agreements. |
| BDC | Business Development Company |
The accompanying notes are an integral part of these financial statements.
AMG Funds
| | |
| AMG Managers Silvercrest Small Cap Fund | | April 30, 2017 |
| Schedule of Investments (unaudited) | | |
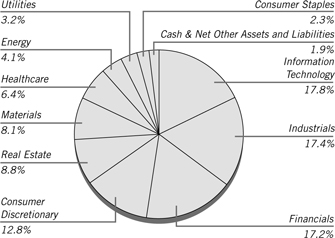
% of Net Assets
| | | | | | | | |
Shares | | | | | Market
Value | |
| | COMMON STOCKS – 98.1% | | | | |
| | | | Consumer Discretionary – 12.8% | | | | |
| | 170,990 | | | Fox Factory Holding Corp. * | | $ | 5,138,249 | |
| | 177,470 | | | La-Z-Boy, Inc. | | | 4,951,413 | |
| | 41,860 | | | Lithia Motors, Inc., Class A | | | 3,999,723 | |
| | 66,140 | | | Meredith Corp. (a) | | | 3,872,497 | |
| | 47,800 | | | Murphy USA, Inc. * | | | 3,325,446 | |
| | 155,810 | | | The EW Scripps Co., Class A * | | | 3,471,447 | |
| | 162,090 | | | The Finish Line, Inc., Class A | | | 2,562,643 | |
| | 219,430 | | | Wolverine World Wide, Inc. | | | 5,290,457 | |
| | | | | | | | |
| | | | | | | 32,611,875 | |
| | | | | | | | |
| | | | Consumer Staples – 2.3% | | | | |
| | 28,004 | | | J & J Snack Foods Corp. | | | 3,768,778 | |
| | 16,884 | | | Lancaster Colony Corp. | | | 2,125,696 | |
| | | | | | | | |
| | | | | | | 5,894,474 | |
| | | | | | | | |
| | | | Energy – 4.1% | | | | |
| | 294,640 | | | Callon Petroleum Co. * | | | 3,488,538 | |
| | 152,050 | | | Forum Energy Technologies, Inc. * | | | 2,569,645 | |
| | 197,220 | | | Matador Resources Co. * (a) | | | 4,275,730 | |
| | | | | | | | |
| | | | | | | 10,333,913 | |
| | | | | | | | |
| | | | Financials – 17.2% | | | | |
| | 294,630 | | | BancorpSouth, Inc. | | | 8,971,483 | |
| | 254,910 | | | CVB Financial Corp. | | | 5,490,761 | |
| | 142,480 | | | FCB Financial Holdings, Inc., Class A * | | | 6,732,180 | |
| | 121,404 | | | Horace Mann Educators Corp. | | | 4,692,265 | |
| | 92,969 | | | Iberiabank Corp. | | | 7,377,090 | |
| | 98,443 | | | Independent Bank Corp./Rockland MA | | | 6,231,442 | |
| | 81,410 | | | Selective Insurance Group, Inc. | | | 4,298,448 | |
| | | | | | | | |
| | | | | | | 43,793,669 | |
| | | | | | | | |
| | | | | | | | |
Shares | | | | | Market
Value | |
| | | | Healthcare – 6.4% | | | | |
| | 96,270 | | | AMN Healthcare Services, Inc. * | | $ | 3,932,629 | |
| | 44,544 | | | ICU Medical, Inc. * | | | 6,850,867 | |
| | 121,770 | | | INC Research Holdings, Inc., Class A * | | | 5,479,650 | |
| | | | | | | | |
| | | | | | | 16,263,146 | |
| | | | | | | | |
| | | | Industrials – 17.4% | | | | |
| | 128,885 | | | Altra Industrial Motion Corp. | | | 5,690,273 | |
| | 162,980 | | | Babcock & Wilcox Enterprises, Inc. * | | | 1,527,123 | |
| | 46,760 | | | CIRCOR International, Inc. | | | 3,119,360 | |
| | 74,596 | | | EMCOR Group, Inc. | | | 4,903,941 | |
| | 74,070 | | | ESCO Technologies, Inc. | | | 4,359,019 | |
| | 172,600 | | | Knoll, Inc. | | | 4,135,496 | |
| | 60,119 | | | MSA Safety, Inc. | | | 4,680,264 | |
| | 327,540 | | | Mueller Water Products, Inc., Class A | | | 3,684,825 | |
| | 134,310 | | | Quanex Building Products Corp. | | | 2,739,924 | |
| | 46,190 | | | Standex International Corp. | | | 4,339,550 | |
| | 103,849 | | | US Ecology, Inc. | | | 4,896,480 | |
| | | | | | | | |
| | | | | | | 44,076,255 | |
| | | | | | | | |
| | | | Information Technology – 17.8% | |
| | 141,847 | | | ACI Worldwide, Inc. * | | | 3,048,292 | |
| | 322,330 | | | Entegris, Inc. * | | | 7,993,784 | |
| | 45,725 | | | Littelfuse, Inc. | | | 7,048,509 | |
| | 151,630 | | | MACOM Technology Solutions Holdings, Inc. * | | | 7,411,674 | |
| | 90,390 | | | Methode Electronics, Inc. | | | 4,026,874 | |
| | 114,890 | | | MKS Instruments, Inc. | | | 8,990,143 | |
| | 59,500 | | | Netgear, Inc. * | | | 2,805,425 | |
| | 104,100 | | | NetScout Systems, Inc. * | | | 3,919,365 | |
| | | | | | | | |
| | | | | | | 45,244,066 | |
| | | | | | | | |
| | | | Materials – 8.1% | | | | |
| | 96,700 | | | H.B. Fuller Co. | | | 5,108,661 | |
| | 94,630 | | | Ingevity Corp. * | | | 5,983,455 | |
| | 72,860 | | | Minerals Technologies, Inc. | | | 5,734,082 | |
| | 177,453 | | | PH Glatfelter Co. | | | 3,817,014 | |
| | | | | | | | |
| | | | | | | 20,643,212 | |
| | | | | | | | |
| | | | Real Estate – 8.8% | | | | |
| | 70,638 | | | EastGroup Properties, Inc., REIT | | | 5,527,424 | |
| | 209,510 | | | Pebblebrook Hotel Trust, REIT (a) | | | 6,235,018 | |
| | 270,200 | | | Physicians Realty Trust, REIT | | | 5,306,728 | |
| | 98,000 | | | QTS Realty Trust, Inc., Class A, REIT | | | 5,237,120 | |
| | | | | | | | |
| | | | | | | 22,306,290 | |
| | | | | | | | |
| | | | Utilities – 3.2% | | | | |
| | 45,003 | | | MGE Energy, Inc. | | | 2,893,693 | |
| | 36,150 | | | ONE Gas, Inc. | | | 2,488,205 | |
| | 61,559 | | | Portland General Electric Co. | | | 2,791,085 | |
| | | | | | | | |
| | | | | | | 8,172,983 | |
| | | | | | | | |
| | | | Total Common Stocks
(Cost $207,364,450) | | | 249,339,883 | |
| | | | | | | | |
The accompanying notes are an integral part of these financial statements.
AMG Funds
| | |
| AMG Managers Silvercrest Small Cap Fund | | April 30, 2017 |
| Schedule of Investments – continued | | |
| | | | | | | | |
Principal Amount | | | | | Market
Value | |
| | SHORT TERM INVESTMENTS – 2.0% | | | | |
| | | | Repurchase Agreements – 0.7% (b) | |
| | $1,000,000 | | | Citigroup Global Markets, Inc., dated 04/28/17, due 05/01/17, 0.820% total to be received $1,000,068 (collateralized by various U.S. Government Agency Obligations, 0.000% - 11.500%, 05/01/17 - 06/01/53, totaling $1,019,999) | | $ | 1,000,000 | |
| | 765,432 | | | Royal Bank of Scotland PLC, dated 04/28/17, due 05/01/17, 0.800% total to be received $765,483 (collateralized by various U.S. Government Agency Obligations, 0.077% - 1.125%, 05/31/17 - 08/31/21, totaling $780,744) | | | 765,432 | |
| | | | | | | | |
| | | | Total Repurchase Agreements | | | 1,765,432 | |
| | | | | | | | |
Shares | | | | | | |
| | | | Other Investment Company – 1.3% | |
| | 3,306,765 | | | Dreyfus Government Cash Management Fund, Institutional Class Shares, 0.69%** | | | 3,306,765 | |
| | | | | | | | |
| | | | Total Short Term Investments
(Cost $5,072,197) | | | 5,072,197 | |
| | | | | | | | |
| Total Investments – 100.1%
(Cost $212,436,647)*** | | | 254,412,080 | |
| | | | | | | | |
| | Net Other Assets and Liabilities – (0.1)% | | | (304,945 | ) |
| | | | | | | | |
| | Net Assets – 100.0% | | $ | 254,107,135 | |
| | | | | | | | |
| * | Non-income producing security. |
| ** | Yield shown represents the April 30, 2017, seven-day average yield, which refers to the sum of the previous seven days’ dividends paid, expressed as an annual percentage. |
| *** | At April 30, 2017, the aggregate cost for Federal income tax purposes approximates the aggregate cost for book purposes. The aggregate gross unrealized appreciation and depreciation were as follows: |
| | | | |
Gross unrealized appreciation | | $ | 46,531,272 | |
Gross unrealized depreciation | | | (4,555,839 | ) |
| | | | |
Net unrealized appreciation | | $ | 41,975,433 | |
| | | | |
| (a) | Some or all of these securities were out on loan to various brokers as of April 30, 2017, amounting to $1,560,750, or 0.6% of net assets. |
| (b) | Collateral received from brokers for securities lending was invested in these joint repurchase agreements. |
| REIT | Real Estate Investment Trust |
The accompanying notes are an integral part of these financial statements.
AMG Funds
| | |
| AMG GW&K U.S. Small Cap Growth Fund | | April 30, 2017 |
| Schedule of Investments (unaudited) | | |
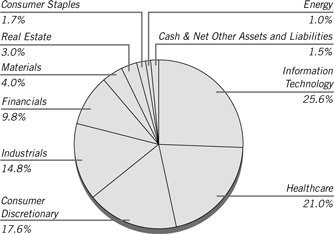
% of Net Assets
| | | | | | | | |
Shares | | | | | Market
Value | |
| | COMMON STOCKS – 98.5% | |
| | | | Consumer Discretionary – 17.6% | | | | |
| | 10,038 | | | Burlington Stores, Inc. * | | $ | 992,959 | |
| | 17,704 | | | Chuy’s Holdings, Inc. * | | | 527,579 | |
| | 12,680 | | | Dave & Buster’s Entertainment, Inc. * | | | 811,647 | |
| | 15,881 | | | Five Below, Inc. * | | | 780,075 | |
| | 17,776 | | | Fox Factory Holding Corp. * | | | 534,169 | |
| | 16,150 | | | Grand Canyon Education, Inc. * | | | 1,213,834 | |
| | 7,806 | | | Hibbett Sports, Inc. * | | | 202,956 | |
| | 13,595 | | | Horizon Global Corp. * | | | 191,554 | |
| | 6,576 | | | Oxford Industries, Inc. | | | 381,276 | |
| | 7,106 | | | Pool Corp. | | | 850,020 | |
| | 4,382 | | | Vitamin Shoppe, Inc. * | | | 84,573 | |
| | | | | | | | |
| | | | | | | 6,570,642 | |
| | | | | | | | |
| | | | Consumer Staples – 1.7% | | | | |
| | 20,897 | | | Amplify Snack Brands, Inc. * (a) | | | 188,073 | |
| | 5,174 | | | PriceSmart, Inc. | | | 449,879 | |
| | | | | | | | |
| | | | | | | 637,952 | |
| | | | | | | | |
| | | | Energy – 1.0% | | | | |
| | 17,697 | | | Matador Resources Co. * (a) | | | 383,671 | |
| | | | | | | | |
| | | | Financials – 9.8% | | | | |
| | 12,250 | | | Encore Capital Group, Inc. * (a) | | | 408,538 | |
| | 6,055 | | | Greenhill & Co., Inc. | | | 153,192 | |
| | 14,983 | | | Heritage Insurance Holdings, Inc. | | | 181,294 | |
| | 5,356 | | | MarketAxess Holdings, Inc. | | | 1,031,137 | |
| | 6,157 | | | Pinnacle Financial Partners, Inc. | | | 394,048 | |
| | 12,096 | | | PrivateBancorp, Inc. | | | 698,786 | |
| | 6,854 | | | Stifel Financial Corp. * | | | 334,955 | |
| | 6,164 | | | Texas Capital Bancshares, Inc. * | | | 469,080 | |
| | | | | | | | |
| | | | | | | 3,671,030 | |
| | | | | | | | |
| | | | | | | | |
Shares | | | | | Market
Value | |
| | | | Healthcare – 21.0% | | | | |
| | 3,218 | | | ABIOMED, Inc. * | | $ | 419,370 | |
| | 8,559 | | | Acadia Healthcare Co., Inc. * (a) | | | 373,001 | |
| | 51,318 | | | Amicus Therapeutics, Inc. * (a) | | | 394,122 | |
| | 11,262 | | | Bruker Corp. | | | 274,680 | |
| | 17,615 | | | Catalent, Inc. * | | | 515,767 | |
| | 13,272 | | | Cotiviti Holdings, Inc. * | | | 554,637 | |
| | 13,378 | | | DBV Technologies SA, Sponsored ADR * | | | 472,645 | |
| | 20,936 | | | Endologix, Inc. * (a) | | | 156,811 | |
| | 18,695 | | | Globus Medical, Inc., Class A * | | | 567,019 | |
| | 3,617 | | | ICU Medical, Inc. * | | | 556,295 | |
| | 11,474 | | | Impax Laboratories, Inc. * | | | 161,210 | |
| | 11,701 | | | INC Research Holdings, Inc., Class A * | | | 526,545 | |
| | 11,500 | | | Medidata Solutions, Inc. * | | | 752,445 | |
| | 10,980 | | | Neurocrine Biosciences, Inc. * | | | 586,332 | |
| | 17,338 | | | Retrophin, Inc. * | | | 339,651 | |
| | 5,710 | | | West Pharmaceutical Services, Inc. | | | 525,491 | |
| | 21,094 | | | Wright Medical Group NV (Netherlands) * | | | 641,047 | |
| | | | | | | | |
| | | | | | | 7,817,068 | |
| | | | | | | | |
| | | | Industrials – 14.8% | | | | |
| | 6,940 | | | Cubic Corp. | | | 360,186 | |
| | 6,920 | | | Exponent, Inc. | | | 423,158 | |
| | 5,644 | | | Graco, Inc. | | | 608,705 | |
| | 10,590 | | | HEICO Corp. | | | 752,631 | |
| | 10,381 | | | Knight Transportation, Inc. (a) | | | 356,068 | |
| | 21,871 | | | Ritchie Bros Auctioneers, Inc. (Canada) | | | 716,494 | |
| | 14,350 | | | SiteOne Landscape Supply, Inc. * | | | 686,074 | |
| | 9,894 | | | Thermon Group Holdings, Inc. * | | | 202,827 | |
| | 11,706 | | | WageWorks, Inc. * | | | 863,903 | |
| | 7,915 | | | Woodward, Inc. | | | 535,608 | |
| | | | | | | | |
| | | | | | | 5,505,654 | |
| | | | | | | | |
| | | | Information Technology – 25.6% | | | | |
| | 7,369 | | | Blackbaud, Inc. | | | 592,541 | |
| | 11,278 | | | Bottomline Technologies de, Inc. * | | | 262,777 | |
| | 5,731 | | | Cabot Microelectronics Corp. | | | 449,024 | |
| | 21,020 | | | Callidus Software, Inc. * | | | 442,471 | |
| | 7,813 | | | Cognex Corp. | | | 666,761 | |
| | 6,518 | | | CyberArk Software, Ltd. (Israel) * | | | 344,867 | |
| | 8,666 | | | EPAM Systems, Inc. * | | | 667,282 | |
| | 6,639 | | | ExlService Holdings, Inc. * | | | 316,747 | |
| | 13,218 | | | Forrester Research, Inc. | | | 535,990 | |
| | 1,623 | | | Gartner, Inc. * | | | 185,168 | |
| | 9,883 | | | HubSpot, Inc. * | | | 662,655 | |
| | 6,802 | | | LogMeIn, Inc. | | | 768,626 | |
| | 9,769 | | | MACOM Technology Solutions Holdings, Inc. * | | | 477,509 | |
| | 5,787 | | | MAXIMUS, Inc. | | | 352,949 | |
| | 11,979 | | | Mimecast Ltd. (Jersey) * | | | 289,532 | |
| | 12,161 | | | Power Integrations, Inc. | | | 802,018 | |
| | 4,459 | | | Tyler Technologies, Inc. * | | | 729,448 | |
| | 14,956 | | | VeriFone Systems, Inc. * (a) | | | 277,284 | |
| | 25,264 | | | Xactly Corp. * | | | 293,062 | |
| | 4,655 | | | Zebra Technologies Corp., Class A * | | | 438,827 | |
| | | | | | | | |
| | | | | | | 9,555,538 | |
| | | | | | | | |
The accompanying notes are an integral part of these financial statements.
AMG Funds
| | |
| AMG GW&K U.S. Small Cap Growth Fund | | April 30, 2017 |
| Schedule of Investments – continued | | |
| | | | | | | | |
Shares | | | | | Market
Value | |
| | | | Materials – 4.0% | | | | |
| | 9,158 | | | Balchem Corp. | | $ | 743,263 | |
| | 16,207 | | | KapStone Paper and Packaging Corp. | | | 341,806 | |
| | 10,732 | | | PolyOne | | | 420,802 | |
| | | | | | | | |
| | | | | | | 1,505,871 | |
| | | | | | | | |
| | | | Real Estate – 3.0% | | | | |
| | 19,658 | | | STAG Industrial, Inc., REIT | | | 518,185 | |
| | 7,059 | | | Sun Communities, Inc., REIT | | | 590,203 | |
| | | | | | | | |
| | | | | | | 1,108,388 | |
| | | | | | | | |
| | | | Total Common Stocks
(Cost $27,623,001) | | | 36,755,814 | |
| | | | | | | | |
Principal
Amount | | | | | | |
| | SHORT TERM INVESTMENTS – 5.8% | |
| | | | Repurchase Agreements – 3.9% (b) | |
| | $1,000,000 | | | Cantor Fitzgerald Securities, Inc., dated 04/28/17, due 05/01/17, 0.840% total to be received $1,000,070 (collateralized by various U.S. Government Agency Obligations, 0.000% - 10.000%, 04/30/17 - 03/20/67, totaling $1,020,000) | | | 1,000,000 | |
| | 458,663 | | | Daiwa Capital Markets America, dated 04/28/17, due 05/01/17, 0.850% total to be received $458,695 (collateralized by various U.S. Government Agency Obligations, 0.000% - 6.500%, 05/18/17 - 12/01/51, totaling $467,836) | | | 458,663 | |
| | | | | | | | |
| | | | Total Repurchase Agreements | | | 1,458,663 | |
| | | | | | | | |
Shares | | | | | | |
| | | | Other Investment Company – 1.9% | |
| | 721,165 | | | Dreyfus Government Cash Management Fund, Institutional Class Shares, 0.69% ** | | | 721,165 | |
| | | | | | | | |
| | | | Total Short Term Investments
(Cost $2,179,828) | | | 2,179,828 | |
| | | | | | | | |
| | Total Investments – 104.3% | |
| | (Cost $29,802,829)*** | | | 38,935,642 | |
| | | | | | | | |
| | Net Other Assets and Liabilities – (4.3)% | | | (1,600,101 | ) |
| | | | | | | | |
| | Net Assets – 100.0% | | $ | 37,335,541 | |
| | | | | | | | |
| * | Non-income producing security. |
| ** | Yield shown represents the April 30, 2017, seven-day average yield, which refers to the sum of the previous seven days’ dividends paid, expressed as an annual percentage. |
| *** | At April 30, 2017, the aggregate cost for Federal income tax purposes approximates the aggregate cost for book purposes. |
The aggregate gross unrealized appreciation and depreciation were as follows:
| | | | |
Gross unrealized appreciation | | $ | 10,354,166 | |
Gross unrealized depreciation | | | (1,221,353 | ) |
| | | | |
Net unrealized appreciation | | $ | 9,132,813 | |
| | | | |
| (a) | Some or all of these securities were out on loan to various brokers as of April 30, 2017, amounting to $1,427,367, or 3.8% of net assets. |
| (b) | Collateral received from brokers for securities lending was invested in these joint repurchase agreements. |
| ADR | American Depositary Receipt |
| REIT | Real Estate Investment Trust |
The accompanying notes are an integral part of these financial statements.
AMG Funds
| | |
| AMG Managers DoubleLine Core Plus Bond Fund | | April 30, 2017 |
| Schedule of Investments (unaudited) | | |
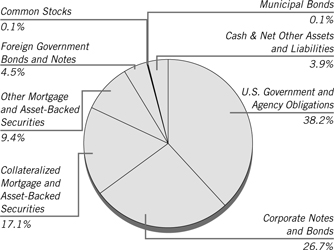
% of Net Assets
| | | | | | | | |
Principal
Amount | | | | | Market
Value | |
| | CORPORATE NOTES AND BONDS – 26.7% | |
| | | | Basic Materials – 0.5% | | | | |
| $ | 30,000 | | | Cliffs Natural Resources, Inc. 5.750%, 03/01/25 (a) (b) | | $ | 29,175 | |
| | 190,000 | | | Hexion, Inc. Senior Secured Notes 10.375%, 02/01/22 (a) | | | 195,700 | |
| | 330,000 | | | International Paper Co. Senior Unsecured Notes 3.000%, 02/15/27 | | | 315,007 | |
| | 2,000,000 | | | Inversiones CMPC SA (Chile) 4.375%, 04/04/27 (a) (b) | | | 2,006,371 | |
| | 100,000 | | | Olin Corp. Senior Unsecured Notes 5.125%, 09/15/27 (b) | | | 104,375 | |
| | 135,000 | | | PQ Corp. Senior Secured Notes 6.750%, 11/15/22 (a) | | | 146,811 | |
| | 410,000 | | | Vale Overseas Ltd. (Cayman Islands) 5.875%, 06/10/21 (b) | | | 443,825 | |
| | | | | | | | |
| | | | | | | 3,241,264 | |
| | | | | | | | |
| | | | Consumer Discretionary – 1.8% | | | | |
| | 80,000 | | | AMC Entertainment Holding, Inc. 6.125%, 05/15/27 (a) | | | 81,900 | |
| | 85,000 | | | Senior Subordinated 5.875%, 11/15/26 (a) | | | 86,753 | |
| | 265,000 | | | American Axle & Manufacturing, Inc. 6.625%, 10/15/22 | | | 274,275 | |
| | 145,000 | | | Aramark Services, Inc. 5.000%, 04/01/25 (a) | | | 151,887 | |
| | 130,000 | | | Asbury Automotive Group, Inc. 6.000%, 12/15/24 | | | 134,875 | |
| | | | | | | | |
Principal
Amount | | | | | Market
Value | |
| | | | Consumer Discretionary (continued) | |
| $ | 430,000 | | | Camposol SA (Peru) Senior Secured Notes 10.500%, 07/15/21 (a) | | $ | 459,025 | |
| | 290,000 | | | Celgene Corp. Senior Unsecured Notes 3.875%, 08/15/25 | | | 300,921 | |
| | 215,000 | | | Cintas Corp. 3.700%, 04/01/27 | | | 222,594 | |
| | 105,000 | | | Dana Financing Luxembourg Sarl (Luxembourg) 5.750%, 04/15/25 (a) | | | 107,822 | |
| | 265,000 | | | Delta Air Lines, Inc. Senior Unsecured Notes 3.625%, 03/15/22 | | | 272,241 | |
| | 480,000 | | | Ford Motor Co. Senior Unsecured Notes 7.450%, 07/16/31 | | | 606,872 | |
| | 835,000 | | | General Motors Financial Co., Inc. 3.950%, 04/13/24 | | | 841,474 | |
| | 95,000 | | | GLP Capital LP 5.375%, 04/15/26 | | | 100,462 | |
| | 1,500,000 | | | Gohl Capital Ltd. (Isle of Man) 4.250%, 01/24/27 | | | 1,527,709 | |
| | 600,000 | | | Grupo Idesa SA de CV (Mexico) 7.875%, 12/18/20 (a) | | | 526,500 | |
| | 310,000 | | | Hilton Domestic Operating Co., Inc. Senior Unsecured Notes 4.250%, 09/01/24 (a) | | | 313,100 | |
| | 90,000 | | | Levi Strauss & Co. Senior Unsecured Notes 5.000%, 05/01/25 | | | 93,262 | |
| | 195,000 | | | Live Nation Entertainment, Inc. 4.875%, 11/01/24 (a) | | | 196,950 | |
| | 265,000 | | | Lowe’s Cos, Inc. Senior Unsecured Notes 3.100%, 05/03/27 (c) | | | 265,306 | |
| | 200,000 | | | NCL Corp., Ltd. (Bermuda) Senior Unsecured Notes 4.750%, 12/15/21 (a) | | | 205,500 | |
| | 150,000 | | | Newell Brands, Inc. Senior Unsecured Notes 3.150%, 04/01/21 | | | 154,187 | |
| | 275,000 | | | PetSmart, Inc. Senior Unsecured Notes 7.125%, 03/15/23 (a) (b) | | | 251,625 | |
| | 180,000 | | | Pilgrim’s Pride Corp. 5.750%, 03/15/25 (a) | | | 188,100 | |
| | 190,000 | | | Pinnacle Entertainment, Inc. Senior Unsecured Notes 5.625%, 05/01/24 (a) | | | 196,650 | |
| | 345,000 | | | S&P Global, Inc. 4.400%, 02/15/26 | | | 370,070 | |
| | 225,000 | | | Sally Holdings LLC 5.750%, 06/01/22 | | | 232,312 | |
| | | | Six Flags Entertainment Corp. | | | | |
| | 190,000 | | | 4.875%, 07/31/24 (a) | | | 192,137 | |
| | 200,000 | | | 5.500%, 04/15/27 (a) | | | 204,375 | |
The accompanying notes are an integral part of these financial statements.
AMG Funds
| | |
| AMG Managers DoubleLine Core Plus Bond Fund | | April 30, 2017 |
| Schedule of Investments – continued | | |
| | | | | | | | |
Principal
Amount | | | | | Market
Value | |
| | | | Consumer Discretionary (continued) | |
| | $165,000 | | | Station Casinos LLC 7.500%, 03/01/21 | | $ | 172,219 | |
| | 200,000 | | | Team Health Holdings Inc. 6.375%, 02/01/25 (a) (b) | | | 195,750 | |
| | 85,000 | | | Tempur Sealy International Inc. 5.625%, 10/15/23 (b) | | | 87,295 | |
| | | | Tenet Healthcare Corp. Senior Unsecured Notes | | | | |
| | 45,000 | | | 8.125%, 04/01/22 | | | 45,900 | |
| | 145,000 | | | 6.750%, 06/15/23 (b) | | | 138,837 | |
| | 510,000 | | | Teva Pharmaceutical Finance Co. BV (Cook Islands) 2.950%, 12/18/22 | | | 503,467 | |
| | 185,000 | | | The Goodyear Tire & Rubber Co. 5.125%, 11/15/23 | | | 195,079 | |
| | | | The Home Depot, Inc. Senior Unsecured Notes | | | | |
| | 140,000 | | | 3.350%, 09/15/25 | | | 145,043 | |
| | 440,000 | | | 3.000%, 04/01/26 | | | 443,784 | |
| | 90,000 | | | The ServiceMaster Co. LLC 5.125%, 11/15/24 (a) | | | 93,150 | |
| | 275,000 | | | Viking Cruises, Ltd. (Bermuda) Senior Unsecured Notes 8.500%, 10/15/22 (a) | | | 288,062 | |
| | 190,000 | | | WMG Acquisition Corp. 6.750%, 04/15/22 (a) | | | 200,946 | |
| | | | | | | | |
| | | | | | | 11,068,416 | |
| | | | | | | | |
| | | | Consumer Staples – 2.1% | | | | |
| | 400,000 | | | Ajecorp BV (Netherlands) 6.500%, 05/14/22 | | | 342,000 | |
| | 215,000 | | | Albertsons Cos LLC / Safeway, Inc. Senior Unsecured Notes 5.750%, 03/15/25 (a) | | | 209,625 | |
| | 195,000 | | | B&G Foods, Inc. 5.250%, 04/01/25 | | | 200,125 | |
| | 700,000 | | | Cencosud SA (Chile) 5.150%, 02/12/25 (b) | | | 740,486 | |
| | 90,000 | | | CHS/Community Health Systems, Inc. 8.000%, 11/15/19 (b) | | | 87,920 | |
| | 100,000 | | | Senior Secured Notes 6.250%, 03/31/23 | | | 102,125 | |
| | 2,500,000 | | | Cosan Overseas, Ltd. (Cayman Islands) 8.250%, 11/29/49 | | | 2,523,750 | |
| | 1,551,867 | | | ENA Norte Trust (Panama) 4.950%, 04/25/23 | | | 1,606,183 | |
| | 155,000 | | | Express Scripts Holding Co. 4.500%, 02/25/26 | | | 161,369 | |
| | 50,000 | | | Gartner, Inc. 5.125%, 04/01/25 (a) | | | 51,875 | |
| | 100,000 | | | GW Honos Security Corp. (Canada) 8.750%, 05/15/25 (a) (c) | | | 101,875 | |
| | 130,000 | | | JBS USA Finance, Inc. 5.750%, 06/15/25 (a) | | | 134,875 | |
| | | | Kraft Heinz Foods Co. | | | | |
| | 295,000 | | | 1.600%, 06/30/17 | | | 295,063 | |
| | 265,000 | | | 2.000%, 07/02/18 | | | 265,758 | |
| | | | | | | | |
Principal Amount | | | | | Market
Value | |
| | | | Consumer Staples (continued) | | | | |
| | $45,000 | | | Kronos Acquisition Holding, Inc. Senior Unsecured Notes 9.000%, 08/15/23 (a) | | $ | 45,787 | |
| | 595,000 | | | Laboratory Corp. Senior Unsecured Notes 2.500%, 11/01/18 | | | 600,672 | |
| | 500,000 | | | MARB BondCo PLC (United Kingdom) 7.000%, 03/15/24 (a) (b) | | | 506,850 | |
| | 200,000 | | | Marfrig Holdings Europe BV (Netherlands) 8.000%, 06/08/23 (a) | | | 212,300 | |
| | 655,000 | | | PepsiCo, Inc. Senior Unsecured Notes 3.450%, 10/06/46 | | | 597,847 | |
| | 85,000 | | | Post Holdings, Inc. 5.500%, 03/01/25 (a) | | | 89,250 | |
| | 175,000 | | | Prime Security Services Borrower LLC Secured Notes 9.250%, 05/15/23 (a) | | | 191,625 | |
| | 90,000 | | | RegionalCare Hospital Partners Holdings, Inc. Senior Secured Notes 8.250%, 05/01/23 (a) | | | 96,199 | |
| | | | Revlon Consumer Products Corp. | | | | |
| | 195,000 | | | 5.750%, 02/15/21 | | | 195,000 | |
| | 50,000 | | | 6.250%, 08/01/24 (b) | | | 48,750 | |
| | 195,000 | | | Rite Aid Corp. 6.125%, 04/01/23 (a) (b) | | | 194,025 | |
| | 125,000 | | | Scientific Games International, Inc. Senior Secured Notes 7.000%, 01/01/22 (a) | | | 134,140 | |
| | 400,000 | | | Sigma Alimentos SA de CV (Mexico) Senior Unsecured Notes 4.125%, 05/02/26 | | | 395,000 | |
| | 590,000 | | | Smithfield Foods, Inc. 4.250%, 02/01/27 (a) | | | 603,234 | |
| | 135,000 | | | Spectrum Brands, Inc. 5.750%, 07/15/25 | | | 145,383 | |
| | 720,000 | | | The Kroger Co. Senior Unsecured Notes 3.400%, 04/15/22 | | | 740,489 | |
| | 85,000 | | | TreeHouse Foods, Inc. 6.000%, 02/15/24 (a) | | | 90,950 | |
| | 570,000 | | | Tyson Foods, Inc. 3.950%, 08/15/24 | | | 587,391 | |
| | 145,000 | | | Universal Hospital Services, Inc. Secured Notes 7.625%, 08/15/20 | | | 147,719 | |
| | 90,000 | | | Valeant Pharmaceuticals International, Inc. (Canada) Senior Secured Notes 7.000%, 03/15/24 (a) | | | 92,025 | |
| | 160,000 | | | Vizient, Inc. Senior Unsecured Notes 10.375%, 03/01/24 (a) | | | 183,600 | |
The accompanying notes are an integral part of these financial statements.
AMG Funds
| | |
| AMG Managers DoubleLine Core Plus Bond Fund | | April 30, 2017 |
| Schedule of Investments – continued | | |
| | | | | | | | |
Principal
Amount | | | | | Market
Value | |
| | | | Consumer Staples (continued) | | | | |
| | $135,000 | | | WellCare Health Plans, Inc. Senior Unsecured Notes 5.250%, 04/01/25 | | $ | 140,737 | |
| | 270,000 | | | Zimmer Biomet Holdings, Inc. Senior Unsecured Notes 2.700%, 04/01/20 | | | 273,157 | |
| | | | | | | | |
| | | | | | | 13,135,159 | |
| | | | | | | | |
| | | | Energy – 3.2% | | | | |
| | 170,000 | | | Apache Corp. Senior Unsecured Notes 4.750%, 04/15/43 | | | 173,692 | |
| | 1,000,000 | | | APT Pipelines, Ltd. (Australia) 4.250%, 07/15/27 (a) | | | 1,024,839 | |
| | | | BP Capital Markets PLC (United Kingdom) | | | | |
| | 24,000 | | | 3.588%, 04/14/27 | | | 24,530 | |
| | 570,000 | | | 3.723%, 11/28/28 | | | 587,074 | |
| | 1,500,000 | | | BPRL International Singapore Pte, Ltd. EMTN (Singapore) 4.375%, 01/18/27 | | | 1,552,308 | |
| | 195,000 | | | Chevron Corp. Senior Unsecured Notes 2.498%, 03/03/22 | | | 196,691 | |
| | 1,800,000 | | | CNOOC Finance 2015 USA LLC 3.500%, 05/05/25 | | | 1,795,090 | |
| | 620,000 | | | Enable Midstream Partners LP Senior Unsecured Notes 4.400%, 03/15/27 | | | 620,022 | |
| | | | Energy Transfer Partners LP Senior Unsecured Notes | | | | |
| | 400,000 | | | 4.750%, 01/15/26 | | | 418,675 | |
| | 70,000 | | | 4.200%, 04/15/27 | | | 70,911 | |
| | 25,000 | | | EP Energy 9.375%, 05/01/20 | | | 23,812 | |
| | 35,000 | | | Foresight Energy LLC / Foresight Energy Finance Corp. Secured Notes 11.500%, 04/01/23 (a) (b) | | | 33,337 | |
| | 52,000 | | | FTS International, Inc. Senior Secured Notes 6.250%, 05/01/22 | | | 45,240 | |
| | 50,000 | | | Halcon Resources Corp. 6.750%, 02/15/25 (a) (b) | | | 48,250 | |
| | 800,000 | | | Instituto Costarricense de Electricidad (Costa Rica) Senior Unsecured Notes 6.950%, 11/10/21 | | | 854,912 | |
| | 500,000 | | | Kinder Morgan Energy Partners LP, MTN 6.950%, 01/15/38 | | | 589,694 | |
| | 105,000 | | | MEG Energy Corp. (Canada) 7.000%, 03/31/24 (a) | | | 94,237 | |
| | 315,000 | | | Memorial Production Partners LP 6.875%, 08/01/22 (d) | | | 114,187 | |
| | | | | | | | |
Principal Amount | | | | | Market
Value | |
| | | | Energy (continued) | | | | |
| | $50,000 | | | Noble Holding International, Ltd. (Cayman Islands) 7.750%, 01/15/24 (b) | | $ | 45,875 | |
| | 140,000 | | | Occidental Petroleum Corp. Senior Unsecured Notes 3.400%, 04/15/26 | | | 141,820 | |
| | 1,800,000 | | | ONGC Videsh Vankorneft Pte, Ltd. (Singapore) 3.750%, 07/27/26 | | | 1,773,742 | |
| | 60,000 | | | PDC Energy, Inc. 6.125%, 09/15/24 (a) | | | 61,800 | |
| | 110,000 | | | Peabody Energy Corp. Senior Secured Notes 6.000%, 03/31/22 (a) (b) | | | 112,612 | |
| | 1,200,000 | | | Pertamina Persero PT, EMTN (Indonesia) Senior Unsecured Notes 5.625%, 05/20/43 | | | 1,238,794 | |
| | | | Petrobras Global Finance BV (Netherlands) | | | | |
| | 400,000 | | | 7.375%, 01/17/27 | | | 430,200 | |
| | 2,000,000 | | | 7.250%, 03/17/44 (b) | | | 1,999,333 | |
| | 340,000 | | | Petroleos Mexicanos (Mexico) 6.750%, 09/21/47 | | | 347,616 | |
| | 1,300,000 | | | Petronas Capital, Ltd. EMTN (Malaysia) 3.500%, 03/18/25 | | | 1,327,429 | |
| | 256,000 | | | Phillips 66 5.875%, 05/01/42 | | | 300,557 | |
| | 500,000 | | | Reliance Industries, Ltd. (India) Senior Unsecured Notes 4.125%, 01/28/25 | | | 513,706 | |
| | 100,000 | | | Sanchez Energy Corp. 6.125%, 01/15/23 (b) | | | 92,499 | |
| | 240,000 | | | Schlumberger Holdings Corp. Senior Unsecured Notes 2.350%, 12/21/18 (a) | | | 241,788 | |
| | 2,300,000 | | | Sinopec Group Overseas Development 2016, Ltd. (British Virgin Islands) 2.750%, 09/29/26 | | | 2,137,238 | |
| | 100,000 | | | SM Energy Senior Unsecured Notes 5.000%, 01/15/24 | | | 94,750 | |
| | 1,000,000 | | | Sunoco Logistics Partners 3.900%, 07/15/26 | | | 993,197 | |
| | | | | | | | |
| | | | | | | 20,120,457 | |
| | | | | | | | |
| | | | Financials – 6.8% | | | | |
| | 710,000 | | | Air Lease Corp. Senior Unsecured Notes 3.750%, 02/01/22 | | | 735,930 | |
| | | | Ally Financial, Inc. Senior Unsecured Notes | | | | |
| | 545,000 | | | 4.125%, 03/30/20 | | | 559,617 | |
| | 180,000 | | | 4.250%, 04/15/21 | | | 184,500 | |
The accompanying notes are an integral part of these financial statements.
AMG Funds
| | |
| AMG Managers DoubleLine Core Plus Bond Fund | | April 30, 2017 |
| Schedule of Investments – continued | | |
| | | | | | | | |
Principal
Amount | | | | | Market
Value | |
| | | | Financials (continued) | | | | |
| | | | American Express Credit Corp., MTN Senior Unsecured Notes | | | | |
| | $585,000 | | | 2.700%, 03/03/22 | | $ | 589,404 | |
| | 685,000 | | | 2.250%, 05/05/21 | | | 683,476 | |
| | 1,300,000 | | | American Tower Corp. Senior Unsecured Notes 4.400%, 02/15/26 | | | 1,367,752 | |
| | 275,000 | | | Anheuser-Busch InBev Finance, Inc. 4.900%, 02/01/46 | | | 301,566 | |
| | 225,000 | | | ASP AMC Merger Sub, Inc. Senior Unsecured Notes 8.000%, 05/15/25 (a) | | | 223,594 | |
| | 665,000 | | | Australia & New Zealand Banking Group, Ltd. EMTN (Australia) Senior Unsecured Notes 4.875%, 01/12/21 (a) | | | 722,283 | |
| | | | Banco de Reservas De La Republica Dominicana (Dominican Republic) Subordinated Notes | | | | |
| | 300,000 | | | 7.000%, 02/01/23 (a) (b) | | | 309,609 | |
| | 200,000 | | | 7.000%, 02/01/23 | | | 206,406 | |
| | 500,000 | | | Banco do Brasil SA (Brazil) 9.000%, 06/29/49 (a) (e) | | | 529,500 | |
| | 400,000 | | | Banco GNB Sudameris SA (Colombia) Subordinated Notes 6.500%, 04/03/27 (a) (e) | | | 413,180 | |
| | 1,700,000 | | | Banco Inbursa SA Institucion de Banca Multiple (Mexico) Senior Unsecured Notes 4.375%, 04/11/27 (a) | | | 1,670,250 | |
| | 500,000 | | | Banco Internacional del Peru SAA Interbank (Peru) 8.500%, 04/23/70 (e) | | | 550,625 | |
| | 1,500,000 | | | Banco Mercantil del Norte SA Subordinated Notes 5.750%, 10/04/31 (a) (e) | | | 1,476,750 | |
| | 700,000 | | | Banco Nacional de Costa Rica (Costa Rica) Senior Unsecured Notes 5.875%, 04/25/21 (a) | | | 725,004 | |
| | 1,200,000 | | | Banco Santander Mexico SA Institucion de Banca Multiple Grupo Financiero Santand (Mexico) Subordinated Notes 5.950%, 01/30/24 (b) (e) | | | 1,248,000 | |
| | | | Bank of America Corp. Senior Unsecured Notes | | | | |
| | 70,000 | | | 2.000%, 01/11/18 | | | 70,190 | |
| | 375,000 | | | 2.881%, 04/24/23 (e) | | | 374,928 | |
| | 455,000 | | | Bank of America Corp., MTN Senior Unsecured Notes 2.503%, 10/21/22 | | | 447,098 | |
| | 625,000 | | | Bank of Montreal, MTN Senior Unsecured Notes 1.900%, 08/27/21 | | | 615,022 | |
| | | | | | | | |
Principal
Amount | | | | | Market
Value | |
| | | | Financials (continued) | | | | |
| | $150,000 | | | Bantrab Senior Trust (Cayman Islands) Senior Secured Notes 9.000%, 11/14/20 | | $ | 142,545 | |
| | | | BBVA Bancomer SA (Cayman Islands) Subordinated Notes | | | | |
| | 1,000,000 | | | 6.008%, 05/17/22 (e) | | | 1,000,000 | |
| | 500,000 | | | 5.350%, 11/12/29 (e) | | | 492,500 | |
| | 300,000 | | | 5.350%, 11/12/29 (a) (e) | | | 295,500 | |
| | 546,000 | | | Boston Properties LP Senior Unsecured Notes 4.125%, 05/15/21 | | | 578,097 | |
| | | | CIMPOR Financial Operations BV (Netherlands) | | | | |
| | 200,000 | | | 5.750%, 07/17/24 (a) | | | 176,100 | |
| | 200,000 | | | 5.750%, 07/17/24 | | | 176,100 | |
| | | | Citigroup, Inc. Senior Unsecured Notes | | | | |
| | 510,000 | | | 2.700%, 03/30/21 | | | 513,652 | |
| | 375,000 | | | 2.750%, 04/25/22 | | | 374,385 | |
| | 925,000 | | | Commonwealth Bank of Australia (Australia) Senior Unsecured Notes 2.750%, 03/10/22 (a) | | | 933,180 | |
| | 500,000 | | | CorpGroup Banking SA (Chile) Senior Unsecured Notes 6.750%, 03/15/23 | | | 488,125 | |
| | 400,000 | | | Credito Real SAB de CV SOFOM ER (Mexico) Senior Unsecured Notes 7.250%, 07/20/23 (a) (b) | | | 418,500 | |
| | | | Crown Castle International Corp. Senior Unsecured Notes | | | | |
| | 600,000 | | | 3.700%, 06/15/26 | | | 603,173 | |
| | 775,000 | | | 4.000%, 03/01/27 | | | 798,730 | |
| | 60,000 | | | CyrusOne LP / CyrusOne Finance Corp. 5.000%, 03/15/24 (a) | | | 61,800 | |
| | 190,000 | | | ESH Hospitality, Inc. 5.250%, 05/01/25 (a) | | | 192,850 | |
| | 500,000 | | | GrupoSura Finance SA (Cayman Islands) 5.500%, 04/29/26 | | | 537,825 | |
| | 1,593,685 | | | Guanay Finance, Ltd. (Cayman Islands) Senior Secured Notes 6.000%, 12/15/20 | | | 1,633,528 | |
| | 145,000 | | | Icahn Enterprises LP/lcahn Enterprises Finance Corp. Senior Unsecured Notes 6.250%, 02/01/22 (a) | | | 151,162 | |
| | 1,900,000 | | | Industrial Senior Trust (Cayman Islands) 5.500%, 11/01/22 | | | 1,935,625 | |
| | 1,613,039 | | | Interoceanica IV Finance Senior Secured Notes 11/30/25 (f) | | | 1,314,626 | |
The accompanying notes are an integral part of these financial statements.
AMG Funds
| | |
| AMG Managers DoubleLine Core Plus Bond Fund | | April 30, 2017 |
| Schedule of Investments – continued | | |
| | | | | | | | |
Principal
Amount | | | | | Market
Value | |
| | | | Financials (continued) | | | | |
| | $590,000 | | | JPMorgan Chase & Co. Senior Unsecured Notes 2.972%, 01/15/23 | | $ | 593,597 | |
| | 570,000 | | | Subordinated Notes 4.250%, 10/01/27 | | | 590,858 | |
| | 909,000 | | | Liberty Mutual Group, Inc. 6.500%, 05/01/42 (a) | | | 1,150,040 | |
| | 700,000 | | | Magnesita Finance, Ltd. (British Virgin Islands) 8.625%, 04/29/49 | | | 700,000 | |
| | 55,000 | | | MGM Growth Properties Operating Partnership LP 5.625%, 05/01/24 | | | 59,606 | |
| | | | Morgan Stanley Senior Unsecured Notes | | | | |
| | 390,000 | | | 2.625%, 11/17/21 | | | 390,016 | |
| | 600,000 | | | 3.625%, 01/20/27 | | | 602,836 | |
| | 200,000 | | | Morgan Stanley, GMTN Senior Unsecured Notes 2.500%, 04/21/21 | | | 199,601 | |
| | 530,000 | | | MUFG Americas Holdings Corp. Senior Unsecured Notes 1.625%, 02/09/18 | | | 530,213 | |
| | 335,000 | | | National Rural Utilities Cooperative Finance Corp. 2.000%, 01/27/20 | | | 334,090 | |
| | 135,000 | | | Nationstar Mortgage LLC/Nationstar Capital Corp. 6.500%, 07/01/21 | | | 137,700 | |
| | 155,000 | | | Navient Corp. Senior Unsecured Notes 6.500%, 06/15/22 (b) | | | 160,425 | |
| | 380,000 | | | New York Life Global Funding Secured Notes 2.900%, 01/17/24 (a) | | | 384,142 | |
| | 85,000 | | | OPE KAG Finance Sub, Inc. Senior Unsecured Notes 7.875%, 07/31/23 (a) | | | 88,187 | |
| | 1,100,000 | | | Pontis IV, Ltd. (Cayman Islands) Senior Secured Notes 5.125%, 03/31/27 (a) | | | 1,094,500 | |
| | 300,000 | | | Royal Bank of Canada Senior Unsecured Notes 2.125%, 03/02/20 | | | 301,002 | |
| | 155,000 | | | Royal Bank of Canada, GMTN Senior Unsecured Notes 2.500%, 01/19/21 | | | 156,634 | |
| | 620,000 | | | Simon Property Group LP Senior Unsecured Notes 3.300%, 01/15/26 | | | 619,257 | |
| | | | State Street Corp. Senior Unsecured Notes | | | | |
| | 200,000 | | | 3.550%, 08/18/25 | | | 207,735 | |
| | 435,000 | | | 2.650%, 05/19/26 (b) | | | 421,830 | |
| | 150,000 | | | SUAM Finance BV (Netherlands) 4.875%, 04/17/24 | | | 158,325 | |
| | | | | | | | |
Principal
Amount | | | | | Market
Value | |
| | | | Financials (continued) | | | | |
| | | | Sumitomo Mitsui Financial Group, Inc. (Japan) Senior Unsecured Notes | | | | |
| | $430,000 | | | 2.934%, 03/09/21 | | $ | 436,290 | |
| | 445,000 | | | 2.058%, 07/14/21 | | | 437,498 | |
| | 1,000,000 | | | SURA Asset Management SA (Colombia) 4.375%, 04/11/27 (a) (b) | | | 1,004,200 | |
| | 595,000 | | | Synchrony Financial Senior Unsecured Notes 3.000%, 08/15/19 | | | 604,255 | |
| | 195,000 | | | Tempo Acquisition LLC / Tempo Acquisition Finance Corp. Senior Unsecured Notes 6.750%, 06/01/25 (a) (c) | | | 200,850 | |
| | | | The Goldman Sachs Group, Inc. Senior Unsecured Notes | | | | |
| | 360,000 | | | 2.350%, 11/15/21 | | | 355,226 | |
| | 235,000 | | | 3.000%, 04/26/22 | | | 237,154 | |
| | 605,000 | | | The PNC Financial Services Group, Inc. Senior Unsecured Notes 3.300%, 03/08/22 | | | 629,184 | |
| | 915,000 | | | The Toronto-Dominion Bank (Canada) Senior Unsecured Notes 1.800%, 07/13/21 | | | 898,625 | |
| | 595,000 | | | TIAA Asset Management Finance Co. LLC Senior Unsecured Notes 2.950%, 11/01/19 (a) | | | 604,998 | |
| | | | Wells Fargo & Co. Senior Unsecured Notes | | | | |
| | 565,000 | | | 3.069%, 01/24/23 | | | 571,932 | |
| | 275,000 | | | 3.000%, 04/22/26 | | | 266,322 | |
| | 580,000 | | | 3.000%, 10/23/26 | | | 559,238 | |
| | | | Westpac Banking Corp. Senior Unsecured Notes | | | | |
| | 375,000 | | | 2.600%, 11/23/20 | | | 378,647 | |
| | 255,000 | | | 2.000%, 08/19/21 | | | 250,163 | |
| | | | | | | | |
| | | | | | | 43,137,863 | |
| | | | | | | | |
| | | | Healthcare – 1.0% | | | | |
| | 583,000 | | | AbbVie, Inc. Senior Unsecured Notes 4.700%, 05/14/45 | | | 589,162 | |
| | 180,000 | | | Acadia Healthcare Co., Inc. 5.625%, 02/15/23 | | | 187,153 | |
| | 583,000 | | | Actavis Funding SCS (Luxembourg) 2.350%, 03/12/18 | | | 585,611 | |
| | 590,000 | | | Anthem, Inc. Senior Unsecured Notes 2.300%, 07/15/18 | | | 593,370 | |
| | 295,000 | | | AstraZeneca PLC Senior Unsecured Notes 2.375%, 11/16/20 | | | 297,265 | |
The accompanying notes are an integral part of these financial statements.
AMG Funds
| | |
| AMG Managers DoubleLine Core Plus Bond Fund | | April 30, 2017 |
| Schedule of Investments – continued | | |
| | | | | | | | |
Principal
Amount | | | | | Market
Value | |
| | | | Healthcare (continued) | | | | |
| | $565,000 | | | Cardinal Health, Inc. Senior Unsecured Notes 1.950%, 06/15/18 | | $ | 566,410 | |
| | | | Centene Corp. Senior Unsecured Notes | | | | |
| | 85,000 | | | 5.625%, 02/15/21 | | | 89,569 | |
| | 180,000 | | | 4.750%, 01/15/25 | | | 183,375 | |
| | 50,000 | | | DJO Finco Inc./ DJO Finance LLC/ DJO Finance Corp. Secured Notes 8.125%, 06/15/21 (a) | | | 44,750 | |
| | 230,000 | | | Envision Healthcare Corp. 6.250%, 12/01/24 (a) | | | 242,650 | |
| | 190,000 | | | inVentiv Group Holdings, Inc. 7.500%, 10/01/24 (a) | | | 197,125 | |
| | 90,000 | | | LifePoint Health, Inc. 5.375%, 05/01/24 (a) | | | 91,125 | |
| | 280,000 | | | MPH Acquisition Holdings LLC Senior Unsecured Notes 7.125%, 06/01/24 (a) | | | 301,700 | |
| | 700,000 | | | Mylan NV (Netherlands) 3.150%, 06/15/21 | | | 707,303 | |
| | 175,000 | | | Quintiles Transnational Corp. 4.875%, 05/15/23 (a) | | | 180,687 | |
| | 190,000 | | | Select Medical Corp. 6.375%, 06/01/21 | | | 195,225 | |
| | 615,000 | | | Shire Acquisitions Investments (Ireland) 2.875%, 09/23/23 | | | 603,800 | |
| | 605,000 | | | UnitedHealth Group, Inc. Senior Unsecured Notes 4.200%, 01/15/47 | | | 621,686 | |
| | | | | | | | |
| | | | | | | 6,277,966 | |
| | | | | | | | |
| | | | Industrials – 3.2% | | | | |
| | 150,000 | | | AECOM 5.125%, 03/15/27 (a) | | | 150,547 | |
| | 995,385 | | | Aeropuerto Internacional de Tocumen SA (Panama) Senior Secured Notes 5.750%, 10/09/23 | | | 1,079,992 | |
| | 300,000 | | | Aeropuertos Argentina 2000 SA (Argentina) Senior Secured Notes 6.875%, 02/01/27 (a) (c) | | | 317,400 | |
| | 280,000 | | | Air Medical Merger Sub Corp. Senior Unsecured Notes 6.375%, 05/15/23 (a) | | | 274,400 | |
| | 200,000 | | | Autoridad del Canal de Panama (Panama) Senior Unsecured Notes 4.950%, 07/29/35 | | | 219,000 | |
| | | | Avianca Holdings SA (Panama) | | | | |
| | 400,000 | | | 8.375%, 05/10/20 (a) | | | 396,600 | |
| | 800,000 | | | 8.375%, 05/10/20 (b) | | | 793,200 | |
| | 170,000 | | | Berry Plastics Corp. Secured Notes 5.500%, 05/15/22 | | | 177,863 | |
| | | | | | | | |
Principal
Amount | | | | | Market
Value | |
| | | | Industrials (continued) | | | | |
| | $85,000 | | | BlueLine Rental Finance Corp. Secured Notes 9.250%, 03/15/24 (a) | | $ | 88,931 | |
| | 91,000 | | | Builders FirstSource, Inc. Senior Secured Notes 5.625%, 09/01/24 (a) | | | 94,754 | |
| | 540,000 | | | Burlington Northern Santa Fe LLC Senior Unsecured Notes 4.550%, 09/01/44 | | | 580,129 | |
| | 160,000 | | | BWAY Holding Co. Senior Secured Notes 5.500%, 04/15/24 (a) | | | 162,200 | |
| | 415,000 | | | Chevron Corp. Senior Unsecured Notes 1.561%, 05/16/19 | | | 414,719 | |
| | 1,600,000 | | | CK Hutchison International 17, Ltd. (Cayman Islands) 3.500%, 04/05/27 (a) | | | 1,607,152 | |
| | 645,000 | | | CSX Corp. Senior Unsecured Notes 3.800%, 11/01/46 (b) | | | 609,004 | |
| | 299,000 | | | Delphi Automotive PLC 4.250%, 01/15/26 | | | 316,510 | |
| | 390,000 | | | Delphi Corp. 4.150%, 03/15/24 | | | 411,629 | |
| | 200,000 | | | Eldorado International Finance (Austria) 8.625%, 06/16/21 (a) | | | 173,500 | |
| | 1,150,000 | | | Empresa de Transporte de Pasajeros Metro SA (Chile) Senior Unsecured Notes 5.000%, 01/25/47 (a) | | | 1,230,626 | |
| | 300,000 | | | Express Scripts Holdings Co. 3.400%, 03/01/27 | | | 286,086 | |
| | 635,000 | | | FedEx Corp. 4.750%, 11/15/45 | | | 664,453 | |
| | 145,000 | | | Flex Acquisition Co., Inc. Senior Unsecured Notes 6.875%, 01/15/25 (a) | | | 149,622 | |
| | 185,000 | | | Gates Global LLC 6.000%, 07/15/22 (a) | | | 186,850 | |
| | 90,000 | | | Grinding Media, Inc./MC Grinding Media Canada, Inc. Senior Secured Notes 7.375%, 12/15/23 (a) | | | 96,237 | |
| | 200,000 | | | Grupo Posadas SAB de CV (Mexico) 7.875%, 06/30/22 (a) | | | 207,250 | |
| | 305,000 | | | John Deere Capital Corp. Senior Unsecured Notes 2.650%, 01/06/22 | | | 309,062 | |
| | 1,000,000 | | | Lima Metro Line 2 Finance (Cayman Islands) Senior Secured Notes 5.875%, 07/05/34 | | | 1,073,500 | |
| | 650,000 | | | Lockheed Martin Corp. Senior Unsecured Notes 4.700%, 05/15/46 | | | 717,034 | |
The accompanying notes are an integral part of these financial statements.
AMG Funds
| | |
| AMG Managers DoubleLine Core Plus Bond Fund | | April 30, 2017 |
| Schedule of Investments – continued | | |
| | | | | | | | |
Principal
Amount | | | | | Market
Value | |
| | | | Industrials (continued) | | | | |
| | $1,000,000 | | | Mexico City Airport Trust Senior Secured Notes 4.250%, 10/31/26 (a) | | $ | 1,012,500 | |
| | | | Novelis Corp. | | | | |
| | 120,000 | | | 6.250%, 08/15/24 (a) | | | 127,200 | |
| | 55,000 | | | 5.875%, 09/30/26 (a) | | | 56,650 | |
| | | | OAS Financial, Ltd. (British Virgin Islands) | | | | |
| | 400,000 | | | 8.875%, 04/29/49 (a) (d) | | | 24,000 | |
| | 600,000 | | | 8.875%, 04/29/49 (d) | | | 36,000 | |
| | 400,000 | | | Odebrecht Finance, Ltd. (Cayman Island) 7.125%, 06/26/42 | | | 183,000 | |
| | 300,000 | | | Penske Truck Leasing Co. LP / PTL Finance Corp. Senior Unsecured Notes 4.200%, 04/01/27 (a) | | | 308,228 | |
| | | | Pesquera Exalmar S.A.A. (Peru) Senior Unsecured Notes | | | | |
| | 200,000 | | | 7.375%, 01/31/20 (a) | | | 173,000 | |
| | 400,000 | | | 7.375%, 01/31/20 | | | 346,000 | |
| | 665,000 | | | Reynolds American, Inc. 4.000%, 06/12/22 | | | 704,708 | |
| | 135,000 | | | Reynolds Group Issuer, Inc. 7.000%, 07/15/24 (a) (b) | | | 145,547 | |
| | 400,000 | | | SBA Tower Trust 3.168%, 04/15/22 (a) (g) | | | 401,376 | |
| | 605,000 | | | Shell International Finance BV (Netherlands) 1.375%, 05/10/19 | | | 600,557 | |
| | 990,000 | | | Sydney Airport Finance Co Pty., Ltd. (Australia) Senior Secured Notes 3.375%, 04/30/25 (a) | | | 980,834 | |
| | 265,000 | | | Teva Pharmaceutical Finance Netherlands III (Netherlands) 2.800%, 07/21/23 | | | 255,578 | |
| | 357,000 | | | The Boeing Co. Senior Unsecured Notes 6.875%, 03/15/39 | | | 509,409 | |
| | 815,000 | | | Thermo Fisher Scientific, Inc. Senior Unsecured Notes 3.300%, 02/15/22 | | | 837,202 | |
| | 400,000 | | | Union Pacific Corp. Senior Unsecured Notes 3.000%, 04/15/27 | | | 400,997 | |
| | 450,000 | | | Waste Management, Inc. 4.100%, 03/01/45 | | | 458,505 | |
| | 190,000 | | | Williams Partners LP/ACMP Finance Corp. Senior Unsecured Notes | | | | |
| | | | 4.875%, 03/15/24 | | | 197,600 | |
| | | | | | | | |
| | | | | | | 20,547,141 | |
| | | | | | | | |
| | | | | | | | |
Principal
Amount | | | | | Market
Value | |
| | | | Information Technology – 1.3% | | | | |
| | $595,000 | | | Analog Devices, Inc. Senior Unsecured Notes 2.500%, 12/05/21 | | $ | 596,024 | |
| | 310,000 | | | Applied Materials, Inc. Senior Unsecured Notes 4.350%, 04/01/47 | | | 319,462 | |
| | 305,000 | | | Broadcom Corp./Broadcom Cayman Finance, Ltd. 3.625%, 01/15/24 (a) | | | 309,421 | |
| | 130,000 | | | Camelot Finance SA Senior Unsecured Notes 7.875%, 10/15/24 (a) | | | 139,750 | |
| | 160,000 | | | Cengage Learning, Inc. Senior Unsecured Notes 9.500%, 06/15/24 (a) (b) | | | 145,200 | |
| | 185,000 | | | Cincinnati Bell, Inc. 7.000%, 07/15/24 (a) | | | 196,285 | |
| | 540,000 | | | Cisco Systems, Inc. Senior Unsecured Notes 1.850%, 09/20/21 | | | 534,199 | |
| | 85,000 | | | CSC Holdings LLC Senior Unsecured Notes 5.250%, 06/01/24 | | | 86,221 | |
| | 195,000 | | | Diamond 1 Finance Corp./Diamond 2 Finance Corp. 7.125%, 06/15/24 (a) (b) | | | 215,645 | |
| | 500,000 | | | Empresa Nacional de Telecomunicaciones SA (Chile) Senior Unsecured Notes 4.875%, 10/30/24 | | | 520,877 | |
| | 530,000 | | | Fidelity National Information Services, Inc. Senior Unsecured Notes 3.625%, 10/15/20 | | | 552,896 | |
| | 130,000 | | | First Data Corp. 7.000%, 12/01/23 (a) | | | 139,711 | |
| | | | Secured Notes | | | | |
| | 135,000 | | | 5.750%, 01/15/24 (a) | | | 140,569 | |
| | 195,000 | | | Genesys Telecommunications Laboratories Inc. 10.000%, 11/30/24 (a) | | | 216,474 | |
| | | | Gray Television, Inc. | | | | |
| | 100,000 | | | 5.125%, 10/15/24 (a) | | | 100,500 | |
| | 135,000 | | | 5.875%, 07/15/26 (a) | | | 140,063 | |
| | 430,000 | | | Hewlett Packard Enterprise Co. Senior Unsecured Notes 3.600%, 10/15/20 | | | 445,802 | |
| | 210,000 | | | Informatica LLC Senior Unsecured Notes 7.125%, 07/15/23 (a) | | | 207,638 | |
| | 140,000 | | | Micron Technology Senior Unsecured Notes 5.250%, 08/01/23 (a) | | | 145,600 | |
| | 550,000 | | | Microsoft Corp. Senior Unsecured Notes 4.450%, 11/03/45 | | | 588,659 | |
The accompanying notes are an integral part of these financial statements.
AMG Funds
| | |
| AMG Managers DoubleLine Core Plus Bond Fund | | April 30, 2017 |
| Schedule of Investments – continued | | |
| | | | | | | | |
Principal Amount | | | | | Market
Value | |
| | | | Information Technology (continued) | |
| | $135,000 | | | Nexstar Escrow Corp. 5.625%, 08/01/24 (a) | | $ | 138,713 | |
| | 195,000 | | | Open Text Corp. (Canada) 5.875%, 06/01/26 (a) | | | 208,650 | |
| | | | Oracle Corp. Senior Unsecured Notes | | | | |
| | 510,000 | | | 1.900%, 09/15/21 | | | 505,289 | |
| | 480,000 | | | 4.125%, 05/15/45 | | | 478,997 | |
| | 180,000 | | | Sabre Global, Inc. Senior Secured Notes 5.250%, 11/15/23 (a) | | | 187,200 | |
| | 45,000 | | | Sinclair Television Group, Inc. 5.625%, 08/01/24 (a) | | | 46,906 | |
| | 130,000 | | | Solera LLC Senior Unsecured Notes 10.500%, 03/01/24 (a) | | | 149,013 | |
| | 280,000 | | | Sophia LP / Sophia Finance, Inc. Senior Unsecured Notes 9.000%, 09/30/23 (a) | | | 295,533 | |
| | 135,000 | | | Telesat Canada / Telesat LLC (Canada) 8.875%, 11/15/24 (a) | | | 148,838 | |
| | 70,000 | | | Western Digital Corp. Senior Secured Notes 7.375%, 04/01/23 (a) | | | 76,825 | |
| | | | | | | | |
| | | | | | | 7,976,960 | |
| | | | | | | | |
| | | | Materials – 0.4% | | | | |
| | 130,000 | | | Ashland LLC 4.750%, 08/15/22 | | | 136,013 | |
| | 1,360,000 | | | Georgia-Pacific LLC Senior Unsecured Notes 3.600%, 03/01/25 (a) | | | 1,400,759 | |
| | 600,000 | | | Grupo Idesa SA de CV (Mexico) 7.875%, 12/18/20 | | | 526,500 | |
| | 145,000 | | | Potash Corp. of Saskatchewan, Inc. (Canada) Senior Unsecured Notes 4.000%, 12/15/26 | | | 148,863 | |
| | 175,000 | | | Signode Industrial Group Lux SA 6.375%, 05/01/22 (a) | | | 181,144 | |
| | | | | | | | |
| | | | | | | 2,393,279 | |
| | | | | | | | |
| | | | Telecommunications – 2.2% | | | | |
| | 610,000 | | | AT&T, Inc. Senior Unsecured Notes 3.800%, 03/01/24 | | | 620,995 | |
| | 1,200,000 | | | Bharti Airtel, Ltd. (India) Senior Unsecured Notes 4.375%, 06/10/25 | | | 1,208,256 | |
| | 1,306,000 | | | British Telecommunications PLC (United Kingdom) Senior Unsecured Notes 5.950%, 01/15/18 | | | 1,345,725 | |
| | | | CCO Holdings LLC Senior Unsecured Notes | | | | |
| | 45,000 | | | 5.250%, 09/30/22 | | | 46,800 | |
| | 60,000 | | | 5.125%, 05/01/23 (a) | | | 62,775 | |
| | 25,000 | | | 5.125%, 05/01/27 (a) | | | 25,563 | |
| | | | | | | | |
Principal
Amount | | | | | Market
Value | |
| | | | Telecommunications (continued) | | | | |
| | $192,000 | | | Cequel Communications Holdings I LLC Senior Unsecured Notes 6.375%, 09/15/20 (a) | | $ | 198,361 | |
| | 575,000 | | | Charter Communications Operating LLC Senior Secured Notes 4.908%, 07/23/25 | | | 617,621 | |
| | 570,000 | | | Comcast Corp. 4.400%, 08/15/35 | | | 597,281 | |
| | 175,000 | | | CommScope, Inc. 5.000%, 06/15/21 (a) | | | 180,469 | |
| | | | Digicel Group, Ltd. (Bermuda) Senior Unsecured Notes | | | | |
| | 300,000 | | | 7.125%, 04/01/22 (a) | | | 252,027 | |
| | 1,700,000 | | | 7.125%, 04/01/22 | | | 1,434,800 | |
| | 140,000 | | | Embarq Corp. Senior Unsecured Notes 7.995%, 06/01/36 | | | 143,325 | |
| | 1,200,000 | | | Empresa Nacional de Telecomunicaciones SA (Chile) Senior Unsecured Notes 4.750%, 08/01/26 | | | 1,237,300 | |
| | 125,000 | | | Frontier Communications Senior Unsecured Notes 8.500%, 04/15/20 | | | 132,656 | |
| | | | Grupo Televisa SAB (Mexico) Senior Unsecured Notes | | | | |
| | 400,000 | | | 4.625%, 01/30/26 | | | 417,585 | |
| | 200,000 | | | 6.125%, 01/31/46 | | | 218,611 | |
| | 150,000 | | | Intelsat Jackson Holdings SA (Luxembourg) 5.500%, 08/01/23 | | | 128,813 | |
| | 90,000 | | | Senior Secured Notes 8.000%, 02/15/24 (a) | | | 97,313 | |
| | 295,000 | | | Level 3 Communications, Inc. Senior Unsecured Notes 5.750%, 12/01/22 | | | 307,906 | |
| | 885,000 | | | Omnicom Group, Inc. 3.600%, 04/15/26 | | | 893,419 | |
| | 1,600,000 | | | Ooredoo International Finance., Ltd. EMTN (Bermuda) 3.875%, 01/31/28 | | | 1,611,888 | |
| | 704,000 | | | Orange SA (France) Senior Unsecured Notes 2.750%, 02/06/19 | | | 712,837 | |
| | 190,000 | | | Sirius XM Radio, Inc. 5.375%, 07/15/26 (a) | | | 194,988 | |
| | 200,000 | | | Sixsigma Networks Mexico SA de CV (Mexico) 8.250%, 11/07/21 (a) | | | 201,000 | |
| | 285,000 | | | TEGNA, Inc. 4.875%, 09/15/21 (a) | | | 294,975 | |
| | 500,000 | | | TV Azteca SAB de CV, EMTN (Mexico) 7.625%, 09/18/20 | | | 496,500 | |
The accompanying notes are an integral part of these financial statements.
AMG Funds
| | |
| AMG Managers DoubleLine Core Plus Bond Fund | | April 30, 2017 |
| Schedule of Investments – continued | | |
| | | | | | | | |
Principal
Amount | | | | | Market
Value | |
| | | | Telecommunications (continued) | | | | |
| | $550,000 | | | Verizon Communications, Inc. Senior Unsecured Notes 4.400%, 11/01/34 | | $ | 527,909 | |
| | | | | | | | |
| | | | | | | 14,207,698 | |
| | | | | | | | |
| | | | Utilities – 4.2% | | | | |
| | 698,530 | | | Abengoa Transmision Sur SA (Peru) Senior Secured Notes 6.875%, 04/30/43 | | | 755,286 | |
| | 1,000,000 | | | AES Andres/Dominican Power Partners/Empresa Generadora De Electricidad IT (Netherlands) 7.950%, 05/11/26 (a) | | | 1,080,430 | |
| | 1,000,000 | | | AES Gener SA (Chile) Senior Unsecured Notes 5.000%, 07/14/25 | | | 1,031,593 | |
| | 1,300,000 | | | American Electric Power Co., Inc. Senior Unsecured Notes 2.950%, 12/15/22 | | | 1,321,957 | |
| | 775,000 | | | American Water Capital Corp. Senior Unsecured Notes 3.400%, 03/01/25 | | | 801,501 | |
| | 783,000 | | | Berkshire Hathaway Energy Co. Senior Unsecured Notes 6.500%, 09/15/37 | | | 1,034,966 | |
| | 95,000 | | | Calpine Corp. Senior Unsecured Notes 5.750%, 01/15/25 (b) | | | 92,388 | |
| | 1,500,000 | | | Comision Federal de Electricidad (Mexico) Senior Unsecured Notes 4.750%, 02/23/27 | | | 1,516,875 | |
| | 110,000 | | | Duke Energy Corp. Senior Unsecured Notes 3.750%, 09/01/46 | | | 101,174 | |
| | 465,000 | | | Duke Energy Progress LLC 4.150%, 12/01/44 | | | 480,000 | |
| | 1,100,000 | | | Empresa Electrica Guacolda SA (Chile) Senior Unsecured Notes 4.560%, 04/30/25 | | | 1,062,151 | |
| | 200,000 | | | Energuate Trust (Cayman Islands) 5.875%, 05/03/27 (a) (c) | | | 203,500 | |
| | 300,000 | | | Engie Energia Chile SA (Chile) Senior Unsecured Notes 4.500%, 01/29/25 | | | 310,120 | |
| | 1,000,000 | | | Eversource Energy Senior Unsecured Notes 2.750%, 03/15/22 | | | 1,009,360 | |
| | 1,420,000 | | | Exelon Corp. Senior Unsecured Notes 3.400%, 04/15/26 | | | 1,413,559 | |
| | 235,504 | | | Fermaca Enterprises S de RL de CV (Mexico) Senior Secured Notes 6.375%, 03/30/38 (a) | | | 245,218 | |
| | | | | | | | |
Principal
Amount | | | | | Market
Value | |
| | | | Utilities (continued) | | | | |
| | $720,000 | | | Fortis, Inc. Senior Unsecured Notes 2.100%, 10/04/21 (a) | | $ | 701,621 | |
| | 232,000 | | | GNL Quintero SA (Chile) Senior Unsecured Notes 4.634%, 07/31/29 | | | 242,150 | |
| | 1,200,000 | | | Great Plains Energy, Inc. Senior Unsecured Notes 3.900%, 04/01/27 | | | 1,216,440 | |
| | 2,200,000 | | | Israel Electric (Israel) Senior Secured Notes 5.000%, 11/12/24 (a) | | | 2,379,652 | |
| | 1,000,000 | | | ITC Holdings Corp. Senior Unsecured Notes 3.250%, 06/30/26 | | | 981,599 | |
| | 1,400,000 | | | National Gas Co. of Trinidad & Tobago, Ltd. (Trinidad) Senior Unsecured Notes 6.050%, 01/15/36 | | | 1,459,500 | |
| | 200,000 | | | NextEra Energy Capital Holdings, Inc. 3.550%, 05/01/27 | | | 201,053 | |
| | | | NGL Energy Partners LP / NGL Energy Finance Corp. | | | | |
| | 150,000 | | | 6.125%, 03/01/25 (a) | | | 141,000 | |
| | 90,000 | | | 7.500%, 11/01/23 (a) | | | 90,900 | |
| | 180,000 | | | NRG Energy, Inc. 7.250%, 05/15/26 | | | 184,950 | |
| | 800,000 | | | Pampa Energia SA (Argentina) Senior Unsecured Notes 7.500%, 01/24/27 (a) | | | 854,000 | |
| | 1,300,000 | | | Sierra Pacific Power Co. 2.600%, 05/01/26 | | | 1,257,100 | |
| | 20,000 | | | The Southern Co. Senior Unsecured Notes 1.850%, 07/01/19 | | | 19,909 | |
| | 830,000 | | | The Southern Co. Senior Unsecured Notes 2.450%, 09/01/18 | | | 836,844 | |
| | 300,000 | | | Transelec SA (Chile) Senior Unsecured Notes 4.625%, 07/26/23 (a) | | | 318,282 | |
| | 2,000,000 | | | Transportadora de Gas del Peru SA (Peru) Senior Unsecured Notes 4.250%, 04/30/28 (b) | | | 2,047,500 | |
| | 1,300,000 | | | Xcel Energy, Inc. Senior Unsecured Notes 3.300%, 06/01/25 | | | 1,312,181 | |
| | | | | | | | |
| | | | | | | 26,704,759 | |
| | | | | | | | |
| | | | Total Corporate Notes and Bonds
(Cost $167,525,716) | | | 168,810,962 | |
| | | | | | | | |
The accompanying notes are an integral part of these financial statements.
AMG Funds
| | |
| AMG Managers DoubleLine Core Plus Bond Fund | | April 30, 2017 |
| Schedule of Investments – continued | | |
| | | | | | | | |
Principal
Amount | | | | | Market
Value | |
| COLLATERALIZED MORTGAGE AND ASSET-
BACKED SECURITIES – 17.1% |
|
| | $1,665,172 | | | Alternative Loan Trust Series 2007-J2, Class 2A1 6.000%, 07/25/37 | | $ | 1,610,534 | |
| | 350,000 | | | Banc of America Commercial Mortgage Trust Series 2007-4, Class AM 6.103%, 02/10/51 (e) | | | 352,440 | |
| | 373,507 | | | Banc of America Funding Trust Series 2006-B, Class 7A1 3.541%, 03/20/36 (e) | | | 332,494 | |
| | 527,539 | | | Banc of America Funding Trust Series 2010-R9, Class 3A3 5.500%, 12/26/35 (a) | | | 449,575 | |
| | 630,000 | | | BBCMS Trust Series 2015-STP, Class D 4.427%, 09/10/28 (a) (e) | | | 634,892 | |
| | 7,949,018 | | | BBCMS Trust Series 2017-C1, Class XA 1.697%, 02/15/50 (e) (h) | | | 895,560 | |
| | 186,801 | | | Bear Stearns Asset Backed Securities I Trust Series 2004-AC2, Class 2A 5.000%, 05/25/34 | | | 185,797 | |
| | 450,000 | | | Bear Stearns Commercial Mortgage Securities Trust Series 2007-T26, Class AJ 5.566%, 01/12/45 (e) | | | 437,215 | |
| | 403,500 | | | CDGJ Commercial Mortage Trust Series 2014-BXCH, Class B 2.844%, 12/15/27 (a) (e) | | | 404,155 | |
| | 858,000 | | | CFCRE Commercial Mortage Trust Series 2016-C4, Class C 5.040%, 05/10/58 (e) | | | 890,063 | |
| | 940,000 | | | CFCRE Commercial Mortage Trust Series 2016-C7, Class A3 3.839%, 12/10/54 | | | 984,865 | |
| | 174,000 | | | Chicago Skyscraper Trust Series 2017-SKY, Class B 2.094%, 02/15/30 (a) (e) | | | 174,541 | |
| | 96,000 | | | Chicago Skyscraper Trust Series 2017-SKY, Class C 2.244%, 02/15/30 (a) (e) | | | 96,300 | |
| | 55,357 | | | Citicorp Mortgage Securities Trust Series 2007-2, Class 3A1 5.500%, 02/25/37 | | | 55,225 | |
| | 450,000 | | | Citigroup Commercial Mortgage Trust Series 2007-C6, Class AM 5.922%, 12/10/49 (e) | | | 455,921 | |
| | 873,659 | | | Citigroup Commercial Mortgage Trust Series 2012-GC8, Class XA 2.257%, 09/10/45 (a) (e) (h) | | | 54,930 | |
| | 350,000 | | | Citigroup Commercial Mortgage Trust Series 2013-SMP, Class C 2.738%, 01/12/30 (a) | | | 351,126 | |
| | | | | | | | |
Principal
Amount | | | | | Market
Value | |
| | $350,000 | | | Citigroup Commercial Mortgage Trust Series 2013-SMP, Class D 3.008%, 01/12/30 (a) (e) | | $ | 350,920 | |
| | 4,837,794 | | | Citigroup Commercial Mortgage Trust Series 2014-GC25, Class XA 1.207%, 10/10/47 (e) (h) | | | 299,905 | |
| | 440,700 | | | Citigroup Commercial Mortgage Trust Series 2015-GC27, Class D 4.576%, 02/10/48 (a) (e) | | | 360,514 | |
| | 780,000 | | | Citigroup Commercial Mortgage Trust Series 2015-GC31, Class C 4.199%, 06/10/48 (e) | | | 759,146 | |
| | 235,000 | | | Citigroup Commercial Mortgage Trust Series 2015-GC35, Class C 4.651%, 11/10/48 (e) | | | 236,317 | |
| | 7,475,137 | | | Citigroup Commercial Mortgage Trust Series 2015-GC35, Class XA 1.048%, 11/10/48 (e) (h) | | | 393,052 | |
| | 7,746,763 | | | Citigroup Commercial Mortgage Trust Series 2016-GC36, Class XA 1.503%, 02/10/49 (e) (h) | | | 678,259 | |
| | 5,495,555 | | | Citigroup Commercial Mortgage Trust Series 2016-P3, Class XA 1.875%, 04/15/49 (e) (h) | | | 607,951 | |
| | 6,727,632 | | | Citigroup Commercial Mortgage Trust Series 2016-P4, Class XA 2.171%, 07/10/49 (e) (h) | | | 884,528 | |
| | 756,000 | | | Citigroup Commercial Mortgage Trust Series 2016-P6, Class A5 3.720%, 12/10/49 (e) | | | 793,564 | |
| | 952,000 | | | Citigroup Commercial Mortgage Trust Series 2016-SMPL, Class D 3.520%, 09/10/31 (a) | | | 950,027 | |
| | 1,618,186 | | | Citigroup Mortgage Loan Trust Series 2006-AR2, Class 1A2 3.529%, 03/25/36 (e) | | | 1,588,908 | |
| | 1,750,000 | | | Citigroup Mortgage Loan Trust Series 2010-7, Class 11A1 5.414%, 07/25/36 (a) (e) | | | 1,801,825 | |
| | 300,000 | | | COBALT Commercial Mortgage Trust Series 2007-C2, Class AJFX 5.568%, 04/15/47 (e) | | | 303,862 | |
| | 453,000 | | | COMM Mortgage Trust Series 2016-DC2, Class C 4.643%, 02/10/49 (e) | | | 445,115 | |
| | 6,762,470 | | | COMM Mortgage Trust Series 2016-DC2, Class XA 1.075%, 02/10/49 (e) (h) | | | 464,756 | |
| | 780,000 | | | COMM Mortgage Trust Series 2016-GCT, Class E 3.577%, 08/10/29 (a) (e) | | | 757,313 | |
| | 54,779 | | | Commercial Mortgage Pass Through Certificates Series 2010-C1, Class XPA 1.724%, 07/10/46 (a) (e) (h) | | | 469 | |
| | 1,828,247 | | | Commercial Mortgage Pass Through Certificates Series 2012-CR3, Class XA 2.229%, 10/15/45 (e) (h) | | | 132,647 | |
The accompanying notes are an integral part of these financial statements.
AMG Funds
| | |
| AMG Managers DoubleLine Core Plus Bond Fund | | April 30, 2017 |
| Schedule of Investments – continued | | |
| | | | | | | | |
Principal
Amount | | | | | Market
Value | |
| | $20,211,394 | | | Commercial Mortgage Pass Through Certificates Series 2013-CR10, Class XA 1.077%, 08/10/46 (e) (h) | | $ | 700,808 | |
| | 300,000 | | | Commercial Mortgage Pass Through Certificates Series 2014-CR20, Class C 4.656%, 11/10/47 (e) | | | 299,739 | |
| | 350,000 | | | Commercial Mortgage Pass Through Certificates Series 2015-CR23, Class D 4.397%, 05/10/48 (e) | | | 271,252 | |
| | 470,000 | | | Commercial Mortgage Pass Through Certificates Series 2015-CR25, Class C 4.698%, 08/10/48 (e) | | | 476,744 | |
| | 600,000 | | | Commercial Mortgage Pass Through Certificates Series 2015-CR26, Class B 4.644%, 10/10/48 (e) | | | 612,962 | |
| | 8,319,913 | | | Commercial Mortgage Pass Through Certificates Series 2015-CR26, Class XA 1.202%, 10/10/48 (e) (h) | | | 530,162 | |
| | 585,000 | | | Commercial Mortgage Pass Through Certificates Series 2015-LC23, Class C 4.801%, 10/10/48 (e) | | | 608,170 | |
| | 9,079,826 | | | Commercial Mortgage Pass Through Certificates Series 2016-C3, Class XA 1.244%, 01/10/48 (e) (h) | | | 671,530 | |
| | 807,000 | | | Commercial Mortgage Pass Through Certificates Series 2016-CR28, Class C 4.802%, 02/10/49 (e) | | | 799,418 | |
| | 650,000 | | | Commercial Mortgage Trust Series 2007-GG11, Class AJ 6.236%, 12/10/49 (e) | | | 660,547 | |
| | 500,000 | | | Core Industrial Trust Series 2015-CALW, Class D 3.979%, 02/10/34 (a) (e) | | | 511,823 | |
| | 680,000 | | | Cosmopolitan Hotel Trust Series 2016-CSMO, Class C 3.644%, 11/15/33 (a) (e) | | | 689,280 | |
| | 1,002,625 | | | Countrywide Alternative Loan Trust Series 2005-86CB, Class A5 5.500%, 02/25/36 | | | 870,383 | |
| | 461,129 | | | Countrywide Alternative Loan Trust Series 2006-J1, Class 2A1 7.000%, 02/25/36 | | | 173,881 | |
| | 62,204 | | | Countrywide Alternative Loan Trust Series 2007-18CB, Class 2A17 6.000%, 08/25/37 | | | 55,840 | |
| | 262,258 | | | Countrywide Alternative Loan Trust Series 2007-23CB, Class A3 1.491%, 09/25/37 (e) | | | 165,461 | |
| | | | | | | | |
Principal
Amount | | | | | Market
Value | |
| $ | 250,413 | | | Countrywide Alternative Loan Trust Series 2007-23CB, Class A4 5.509%, 09/25/37 (e) (h) | | $ | 59,682 | |
| | 463,916 | | | Countrywide Home Loan Mortgage Pass Through Trust Series 2005-HYB8, Class 4A1 3.121%, 12/20/35 (e) | | | 424,108 | |
| | 1,192,883 | | | Countrywide Home Loan Mortgage Pass Through Trust Series 2007-14, Class A15 6.500%, 09/25/37 | | | 1,115,833 | |
| | 452,180 | | | Countrywide Home Loan Mortgage Pass Through Trust Series 2007-2, Class A13 6.000%, 03/25/37 | | | 395,556 | |
| | 88,436 | | | Countrywide Home Loan Mortgage Pass Through Trust Series 2007-7, Class A4 5.750%, 06/25/37 | | | 80,046 | |
| | 625,000 | | | Credit Suisse Commercial Mortgage Trust Series 2007-C4, Class A1AM 6.139%, 09/15/39 (e) | | | 627,449 | |
| | 1,380,009 | | | Credit Suisse First Boston Mortgage Securities Corp. Series 2005-9, Class 5A9 5.500%, 10/25/35 | | | 1,233,371 | |
| | 708,086 | | | Credit Suisse Mortgage Capital Certificates Series 2007-1, Class 5A4 6.000%, 02/25/37 | | | 604,451 | |
| | 6,977,441 | | | CSAIL Commercial Mortgage Trust Series 2016-C6, Class XA 1.977%, 01/15/49 (e) (h) | | | 792,227 | |
| | 3,291,570 | | | CSMC Trust Series 2013-IVR4, Class A11 3.485%, 07/25/43 (a) (e) | | | 3,283,185 | |
| | 3,291,570 | | | CSMC Trust Series 2013-IVR4, Class A2 3.000%, 07/25/43 (a) (e) | | | 3,228,183 | |
| | 534,000 | | | DBJPM Series 2016-C1, Class C 3.505%, 05/10/49 (e) | | | 509,238 | |
| | 7,686,075 | | | DBJPM Series 2016-C1, Class XA 1.656%, 05/10/49 (e) (h) | | | 776,932 | |
| | 569,000 | | | FHLMC Multifamily Structured Pass Through Certificates Series K050, Class A2 3.334%, 08/25/25 (e) | | | 596,965 | |
| | 766,000 | | | FHLMC Multifamily Structured Pass Through Certificates Series K053, Class A2 2.995%, 12/25/25 | | | 783,311 | |
| | 831,000 | | | FHLMC Multifamily Structured Pass Through Certificates Series K054, Class A2 2.745%, 01/25/26 | | | 832,607 | |
The accompanying notes are an integral part of these financial statements.
AMG Funds
| | |
| AMG Managers DoubleLine Core Plus Bond Fund | | April 30, 2017 |
| Schedule of Investments – continued | | |
| | | | | | | | |
Principal
Amount | | | | | Market
Value | |
| $ | 5,456,565 | | | FHLMC Multifamily Structured Pass Through Certificates Series K722, Class X1 1.442%, 03/25/23 (e) (h) | | $ | 344,731 | |
| | 2,790,754 | | | First Horizon Alternative Series 2006-AA7, Class A1 3.072%, 01/25/37 (e) | | | 2,379,366 | |
| | 2,489,792 | | | First Horizon Alternative Mortgage Securities Trust Series 2005-FA4, Class 1A6 5.500%, 06/25/35 | | | 2,292,184 | |
| | 1,316,992 | | | First Horizon Mortgage Pass-Through Trust Series 2006-2, Class 1A3 6.000%, 08/25/36 | | | 1,196,443 | |
| | 4,664,024 | | | Firstkey Mortgage Trust Series 2014-1, Class A8 3.500%, 11/25/44 (a) (e) | | | 4,752,657 | |
| | 391,000 | | | GS Mortgage Securities Trust Series 2014-GC26, Class C 4.661%, 11/10/47 (e) | | | 393,138 | |
| | 6,439,509 | | | GS Mortgage Securities Trust Series 2015-GC34, Class XA 1.521%, 10/10/48 (e) (h) | | | 543,196 | |
| | 10,705,763 | | | GS Mortgage Securities Trust Series 2015-GS1, Class XA 0.980%, 11/10/48 (e) (h) | | | 604,834 | |
| | 7,328,925 | | | GS Mortgage Securities Trust Series 2016-GS2, Class XA 1.821%, 05/10/49 (e) (h) | | | 794,322 | |
| | 387,208 | | | GSR Mortgage Loan Trust Series 2006-AR1, Class 3A1 3.505%, 01/25/36 (e) | | | 351,050 | |
| | 26,085 | | | HSI Asset Loan Obligation Trust Series 2007-2, Class 1A1 5.500%, 09/25/37 | | | 25,118 | |
| | 2,176,839 | | | JP Morgan Chase Commercial Mortgage Securities Trust Series 2006-A2, Class 2A1 3.334%, 04/25/36 (e) | | | 2,063,650 | |
| | 146,639 | | | JP Morgan Chase Commercial Mortgage Securities Trust Series 2006-LDP8, Class X 0.536%, 05/15/45 (e) (h) | | | 5 | |
| | 215,179 | | | JP Morgan Chase Commercial Mortgage Securities Trust Series 2006-LDP9, Class AM 5.372%, 05/15/47 | | | 215,076 | |
| | 350,000 | | | JP Morgan Chase Commercial Mortgage Securities Trust Series 2007-CB19, Class AM 5.933%, 02/12/49 (e) | | | 349,773 | |
| | 537,200 | | | JP Morgan Chase Commercial Mortgage Securities Trust Series 2007-CB20, Class AJ 6.370%, 02/12/51 (e) | | | 550,606 | |
| | | | | | | | |
Principal
Amount | | | | | Market
Value | |
| | $ 250,000 | | | JP Morgan Chase Commercial Mortgage Securities Trust Series 2007-LD12, Class AM 6.265%, 02/15/51 (e) | | $ | 252,772 | |
| | 609,978 | | | JP Morgan Chase Commercial Mortgage Securities Trust Series 2007-LDPX, Class AM 5.464%, 01/15/49 (e) | | | 609,684 | |
| | 788,406 | | | JP Morgan Chase Commercial Mortgage Securities Trust Series 2011-C4, Class XA 1.545%, 07/15/46 (a) (e) (h) | | | 17,777 | |
| | 1,794,573 | | | JP Morgan Chase Commercial Mortgage Securities Trust Series 2012-C8, Class XA 1.978%, 10/15/45 (e) (h) | | | 134,611 | |
| | 659,954 | | | JP Morgan Chase Commercial Mortgage Securities Trust Series 2012-CBX, Class XA 1.828%, 06/15/45 (e) (h) | | | 36,442 | |
| | 5,709,410 | | | JP Morgan Chase Commercial Mortgage Securities Trust Series 2014-C18, Class XA 1.227%, 02/15/47 (e) (h) | | | 256,979 | |
| | 300,000 | | | JP Morgan Chase Commercial Mortgage Securities Trust Series 2014-C21, Class C 4.816%, 08/15/47 (e) | | | 302,998 | |
| | 3,672,970 | | | JP Morgan Chase Commercial Mortgage Securities Trust Series 2014-C21, Class XA 1.242%, 08/15/47 (e) (h) | | | 215,344 | |
| | 330,824 | | | JP Morgan Chase Commercial Mortgage Securities Trust Series 2014-C23, Class C 4.608%, 09/15/47 (e) | | | 336,417 | |
| | 450,000 | | | JP Morgan Chase Commercial Mortgage Securities Trust Series 2014-C25, Class C 4.596%, 11/15/47 (e) | | | 449,343 | |
| | 6,460,189 | | | JP Morgan Chase Commercial Mortgage Securities Trust Series 2014-C25, Class XA 1.140%, 11/15/47 (e) (h) | | | 334,186 | |
| | 5,238,142 | | | JP Morgan Chase Commercial Mortgage Securities Trust Series 2014-C26, Class XA 1.308%, 01/15/48 (e) (h) | | | 280,937 | |
| | 300,000 | | | JP Morgan Chase Commercial Mortgage Securities Trust Series 2014-DSTY, Class A 3.429%, 06/10/27 (a) | | | 305,678 | |
| | 4,378,328 | | | JP Morgan Chase Commercial Mortgage Securities Trust Series 2015-C27, Class XA 1.507%, 02/15/48 (e) (h) | | | 302,137 | |
The accompanying notes are an integral part of these financial statements.
AMG Funds
| | |
| AMG Managers DoubleLine Core Plus Bond Fund | | April 30, 2017 |
| Schedule of Investments – continued | | |
| | | | | | | | |
Principal
Amount | | | | | Market
Value | |
| $ | 7,906,295 | | | JP Morgan Chase Commercial Mortgage Securities Trust Series 2015-C28, Class XA 1.332%, 10/15/48 (e) (h) | | $ | 457,464 | |
| | 650,000 | | | JP Morgan Chase Commercial Mortgage Securities Trust Series 2015-C32, Class C 4.818%, 11/15/48 (e) | | | 627,802 | |
| | 670,000 | | | JP Morgan Chase Commercial Mortgage Securities Trust Series 2015-C33, Class C 4.772%, 12/15/48 (e) | | | 682,547 | |
| | 8,334,598 | | | JP Morgan Chase Commercial Mortgage Securities Trust Series 2015-JP1, Class XA 1.304%, 01/15/49 (e) (h) | | | 484,842 | |
| | 320,000 | | | JP Morgan Chase Commercial Mortgage Securities Trust Series 2016-JP2, Class B 3.460%, 08/15/49 | | | 318,170 | |
| | 246,000 | | | JP Morgan Chase Commercial Mortgage Securities Trust Series 2016-JP2, Class C 3.947%, 08/15/49 (e) | | | 242,098 | |
| | 263,000 | | | JPMBB Commercial Mortgage Securities Trust Series 2015-C27, Class D 3.984%, 02/15/48 (a) (e) | | | 211,669 | |
| | 755,000 | | | JPMBB Commercial Mortgage Securities Trust Series 2016-C1, Class C 4.905%, 03/15/49 (e) | | | 790,942 | |
| | 7,704,051 | | | JPMDB Commercial Mortgage Securities Trust Series 2016-C2, Class XA 1.864%, 06/15/49 (e) (h) | | | 772,015 | |
| | 485,000 | | | LB Commercial Mortgage Trust Series 2007-C3, Class AMB 5.189%, 07/15/44 | | | 486,381 | |
| | 250,000 | | | LB Commercial Mortgage Trust Series 2007-C3, Class AMFL 6.206%, 07/15/44 (a) (e) | | | 250,933 | |
| | 747,000 | | | LB-UBS Commercial Mortgage Trust Series 2007-C7, Class AJ 6.456%, 09/15/45 (e) | | | 760,300 | |
| | 588,000 | | | LSTAR Commercial Mortgage Trust Series 2016-4, Class C 4.701%, 03/10/49 (a) (e) | | | 544,855 | |
| | 732,532 | | | Morgan Stanley Bank of America Merrill Lynch Trust Series 2012-C5, Class XA 1.710%, 08/15/45 (a) (e) (h) | | | 44,471 | |
| | 5,844,076 | | | Morgan Stanley Bank of America Merrill Lynch Trust Series 2014-C14, Class XA 1.405%, 02/15/47 (e) (h) | | | 266,814 | |
| | | | | | | | |
Principal
Amount | | | | | Market
Value | |
| $ | 300,000 | | | Morgan Stanley Bank of America Merrill Lynch Trust Series 2014-C18, Class C 4.634%, 10/15/47 (e) | | $ | 296,136 | |
| | 413,500 | | | Morgan Stanley Bank of America Merrill Lynch Trust Series 2014-C19, Class C 4.000%, 12/15/47 | | | 392,059 | |
| | 785,000 | | | Morgan Stanley Bank of America Merrill Lynch Trust Series 2015-C25, Class C 4.679%, 10/15/48 (e) | | | 810,855 | |
| | 800,000 | | | Morgan Stanley Bank of America Merrill Lynch Trust Series 2015-C26, Class D 3.060%, 10/15/48 (a) | | | 610,392 | |
| | 80,000 | | | Morgan Stanley Bank of America Merrill Lynch Trust Series 2015-C27, Class C 4.687%, 12/15/47 (e) | | | 77,588 | |
| | 8,464,748 | | | Morgan Stanley Bank of America Merrill Lynch Trust Series 2016-C28, Class XA 1.442%, 01/15/49 (e) (h) | | | 698,043 | |
| | 844,000 | | | Morgan Stanley Bank of America Merrill Lynch Trust Series 2016-C29, Class C 4.911%, 05/15/49 (e) | | | 879,427 | |
| | 787,000 | | | Morgan Stanley Bank of America Merrill Lynch Trust Series 2016-C32, Class A4 3.720%, 12/15/49 | | | 824,391 | |
| | 49,965 | | | Morgan Stanley Capital I Trust Series 2006-HQ8, Class AJ 5.627%, 03/12/44 (e) | | | 50,098 | |
| | 164,955 | | | Morgan Stanley Capital I Trust Series 2007-HQ11, Class AJ 5.508%, 02/12/44 (e) | | | 161,926 | |
| | 375,100 | | | Morgan Stanley Capital I Trust Series 2007-IQ16, Class AMA 6.257%, 12/12/49 (e) | | | 381,978 | |
| | 586,279 | | | Morgan Stanley Capital I Trust Series 2011-C1, Class XA 0.627%, 09/15/47 (a) (e) (h) | | | 7,207 | |
| | 250,000 | | | Morgan Stanley Capital I Trust Series 2014-CPT, Class E 3.560%, 07/13/29 (a) (e) | | | 249,813 | |
| | 350,000 | | | Morgan Stanley Capital I Trust Series 2014-MP, Class D 3.816%, 08/11/33 (a) (e) | | | 356,507 | |
| | 588,000 | | | Morgan Stanley Capital I Trust Series 2015-XLF2, Class AFSC 3.894%, 08/15/26 (a) (e) | | | 588,181 | |
| | 2,861,795 | | | Morgan Stanley Capital I Trust Series 2016-UB11, Class XA 1.817%, 08/15/49 (e) (h) | | | 302,742 | |
The accompanying notes are an integral part of these financial statements.
AMG Funds
| | |
| AMG Managers DoubleLine Core Plus Bond Fund | | April 30, 2017 |
| Schedule of Investments – continued | | |
| | | | | | | | |
Principal
Amount | | | | | Market
Value | |
| $ | 697,000 | | | Morgan Stanley Capital I Trust Series 2017-PRME, Class D 4.394%, 02/15/34 (a) (e) | | $ | 701,965 | |
| | 681,785 | | | Morgan Stanley Mortgage Loan Trust Series 2005-3AR, Class 2A2 3.317%, 07/25/35 (e) | | | 630,245 | |
| | 5,512,408 | | | Morgan Stanley Mortgage Loan Trust Series 2005-9AR, Class 2A 3.337%, 12/25/35 (e) | | | 4,740,900 | |
| | 1,391,879 | | | Morgan Stanley Mortgage Loan Trust Series 2007-14AR, Class 1A3 3.351%, 10/25/37 (e) | | | 1,211,148 | |
| | 946,000 | | | MSCG Trust Series 2016-SNR, Class C 5.205%, 11/15/34 (a) | | | 955,346 | |
| | 246,543 | | | Nomura Asset Acceptance Corp. Alternative Loan Trust Series 2005-AP3, Class A3 5.318%, 08/25/35 (e) | | | 153,423 | |
| | 2,302,038 | | | PR Mortgage Loan Trust Series 2014-1, Class APT 5.917%, 10/25/49 (e) | | | 2,289,738 | |
| | 1,258,827 | | | RALI Trust Series 2005-QA10, Class A31 4.110%, 09/25/35 (e) | | | 1,069,973 | |
| | 3,753,264 | | | RALI Trust Series 2006-QS7, Class A2 6.000%, 06/25/36 | | | 3,293,280 | |
| | 212,175 | | | Residential Asset Securitization Trust Series 2006-A6, Class 1A1 6.500%, 07/25/36 | | | 109,254 | |
| | 432,987 | | | Residential Asset Securitization Trust Series 2007-A1, Class A8 6.000%, 03/25/37 | | | 279,832 | |
| | 1,515,504 | | | Sequoia Mortgage Trust Series 2013-1, Class 2A1 1.855%, 02/25/43 (e) | | | 1,433,657 | |
| | 208,614 | | | Structured Adjustable Rate Mortgage Loan Trust Series 2006-1, Class 2A2 3.222%, 02/25/36 (e) | | | 182,482 | |
| | 1,815,946 | | | UBS-Barclays Commercial Mortgage Trust Series 2012-C3, Class XA 2.174%, 08/10/49 (a) (e) (h) | | | 132,033 | |
| | 977,000 | | | Wachovia Bank Commercial Series 2006-C26, Class AM 6.279%, 06/15/45 (e) | | | 986,555 | |
| | 500,000 | | | Wachovia Bank Commercial Mortgage Trust Series 2007-C32, Class AMFX 5.703%, 06/15/49 (a) | | | 508,713 | |
| | 374,590 | | | Wachovia Bank Commercial Mortgage Trust Series 2006-C28, Class AJ 5.632%, 10/15/48 (e) | | | 376,065 | |
| | | | | | | | |
Principal
Amount | | | | | Market
Value | |
| $ | 946,775 | | | Wachovia Bank Commercial Mortgage Trust Series 2007-C30, Class AJ 5.413%, 12/15/43 (e) | | $ | 959,794 | |
| | 300,000 | | | Wachovia Bank Commercial Mortgage Trust Series 2007-C33, Class AJ 6.179%, 02/15/51 (e) | | | 305,833 | |
| | 580,000 | | | Wachovia Bank Commercial Mortgage Trust Series 2007-C33, Class AM 6.179%, 02/15/51 (e) | | | 583,105 | |
| | 1,741,944 | | | Washington Mutual Mortgage Pass- Through Certificates WMALT Trust Series 2005-8, Class 2CB1 5.500%, 10/25/35 | | | 1,695,074 | |
| | 471,800 | | | Wells Fargo Commercial Mortgage Trust Series 2015-C26, Class D 3.586%, 02/15/48 (a) | | | 354,793 | |
| | 725,000 | | | Wells Fargo Commercial Mortgage Trust Series 2014-LC16, Class D 3.938%, 08/15/50 (a) | | | 610,809 | |
| | 512,000 | | | Wells Fargo Commercial Mortgage Trust Series 2014-LC18, Class B 3.959%, 12/15/47 | | | 525,152 | |
| | 400,000 | | | Wells Fargo Commercial Mortgage Trust Series 2015-C28, Class C 4.272%, 05/15/48 (e) | | | 383,496 | |
| | 585,000 | | | Wells Fargo Commercial Mortgage Trust Series 2015-C31, Class C 4.765%, 11/15/48 (e) | | | 603,258 | |
| | 8,405,565 | | | Wells Fargo Commercial Mortgage Trust Series 2015-C31, Class XA 1.260%, 11/15/48 (e) (h) | | | 583,594 | |
| | 480,000 | | | Wells Fargo Commercial Mortgage Trust Series 2015-LC22, Class C 4.692%, 09/15/58 (e) | | | 492,506 | |
| | 4,426,584 | | | Wells Fargo Commercial Mortgage Trust Series 2015-NXS1, Class XA 1.325%, 05/15/48 (e) (h) | | | 283,505 | |
| | 610,000 | | | Wells Fargo Commercial Mortgage Trust Series 2015-NXS3, Class C 4.638%, 09/15/57 (e) | | | 590,278 | |
| | 558,000 | | | Wells Fargo Commercial Mortgage Trust Series 2016-C32, Class C 4.879%, 01/15/59 (e) | | | 550,996 | |
The accompanying notes are an integral part of these financial statements.
AMG Funds
| | |
| AMG Managers DoubleLine Core Plus Bond Fund | | April 30, 2017 |
| Schedule of Investments – continued | | |
| | | | | | | | |
Principal Amount | | | | | Market
Value | |
| $ | 517,000 | | | Wells Fargo Commercial Mortgage Trust Series 2016-C33, Class C 3.896%, 03/15/59 | | $ | 506,197 | |
| | 5,314,649 | | | Wells Fargo Commercial Mortgage Trust Series 2016-C33, Class XA 1.974%, 03/15/59 (e) (h) | | | 590,405 | |
| | 6,312,266 | | | Wells Fargo Commercial Mortgage Trust Series 2016-NXS6, Class XA 1.806%, 11/15/49 (e) (h) | | | 666,094 | |
| | 261,171 | | | Wells Fargo Mortgage Backed Securities Trust Series 2007-13, Class A6 6.000%, 09/25/37 | | | 263,654 | |
| | 248,436 | | | Wells Fargo Mortgage Backed Securities Trust Series 2007-8, Class 1A16 6.000%, 07/25/37 | | | 246,223 | |
| | 754,256 | | | WF-RBS Commercial Mortgage Trust Series 2012-C8, Class XA 2.139%, 08/15/45 (a) (e) (h) | | | 56,750 | |
| | 1,345,798 | | | WF-RBS Commercial Mortgage Trust Series 2012-C9, Class XA 2.241%, 11/15/45 (a) (e) (h) | | | 100,566 | |
| | 6,213,078 | | | WFRBS Commercial Mortgage Trust Series 2014-C21, Class XA 1.300%, 08/15/47 (e) (h) | | | 358,428 | |
| | | | | | | | |
| | | | Total Collateralized Mortgage and Asset-Backed Securities
(Cost $110,359,282) | | | 108,301,074 | |
| | | | | | | | |
| U.S. GOVERNMENT AND AGENCY
OBLIGATIONS – 38.2% |
|
| | | | Fannie Mae – 9.9% | | | | |
| | 326,570 | | | 4.000%, 06/01/42 Pool # AB5459 | | | 341,609 | |
| | 3,258,124 | | | 3.000%, 03/01/45 Pool # AS4645 | | | 3,262,140 | |
| | 9,462,059 | | | 3.500%, 03/01/46 Pool # BC0281 | | | 9,755,570 | |
| | 486,967 | | | 3.500%, 12/01/31 Pool # MA0919 | | | 509,386 | |
| | 424,605 | | | 3.500%, 01/01/32 Pool # MA0949 | | | 444,152 | |
| | 83,567 | | | 4.500%, 03/01/42 Pool # MA1050 | | | 88,068 | |
| | 4,085,295 | | | 3.000%, 04/01/45 Pool # MA2248 | | | 4,067,854 | |
| | 182,613 | | | 4.000%, 09/01/31 Pool # MA3894 | | | 194,147 | |
| | 165,793 | | | 5.629%, 10/25/36 (e) (h) Series 2007-57, Class SX, REMIC | | | 30,576 | |
| | 269,397 | | | 4.809%, 09/25/36 (e) (h) Series 2009-86, Class CI, REMIC | | | 38,211 | |
| | | | | | | | |
Principal Amount | | | | | Market
Value | |
| | | | Fannie Mae (continued) | | | | |
| $ | 339,867 | | | 4.000%, 01/25/41 Series 2010-156, Class ZC, REMIC | | $ | 351,727 | |
| | 194,818 | | | 4.500%, 12/25/41 Series 2011-121, Class JP, REMIC | | | 208,372 | |
| | 511,691 | | | 4.000%, 03/25/41 Series 2011-18, Class UZ, REMIC | | | 545,625 | |
| | 1,173,726 | | | 3.500%, 10/25/42 Series 2012-105, Class Z, REMIC | | | 1,203,526 | |
| | 2,038,653 | | | 2.750%, 11/25/42 Series 2012-127, Class PA, REMIC | | | 2,030,818 | |
| | 4,312,494 | | | 3.500%, 03/25/42 Series 2012-20, Class ZT, REMIC | | | 4,414,185 | |
| | 1,837,600 | | | 4.000%, 04/25/42 Series 2012-31, Class Z, REMIC | | | 1,956,219 | |
| | 6,850,074 | | | 2.000%, 08/25/42 Series 2013-5, Class EZ, REMIC | | | 6,079,529 | |
| | 5,409,687 | | | 3.000%, 02/25/43 Series 2013-8, Class Z, REMIC | | | 5,205,407 | |
| | 5,388,916 | | | 3.000%, 11/25/44 Series 2014-73, Class CZ, REMIC | | | 5,044,770 | |
| | 6,273,984 | | | 3.000%, 01/25/45 Series 2015-9, Class HA, REMIC | | | 6,429,678 | |
| | 4,285,951 | | | 3.000%, 08/25/42 Series 2015-95, Class AP, REMIC | | | 4,364,888 | |
| | 5,606,236 | | | 3.000%, 05/25/46 Series 2016-24, Class NZ, REMIC | | | 5,279,039 | |
| | 757,000 | | | 2.702%, 02/25/26 Series 2016-M3, Class A2 | | | 752,819 | |
| | | | | | | | |
| | | | | | | 62,598,315 | |
| | | | | | | | |
| | | | Freddie Mac – 5.5% | | | | |
| | 3,290,360 | | | 3.000%, 03/15/44 Series 4316, Class BZ, REMIC | | | 3,094,606 | |
| | 26,951 | | | 5.000%, 07/01/35 Gold Pool # G01840 | | | 29,739 | |
| | 7,528 | | | 5.500%, 12/01/38 Gold Pool # G06172 | | | 8,358 | |
| | 5,294,886 | | | 3.500%, 02/01/45 Gold Pool # Q31596 | | | 5,450,952 | |
| | 139,360 | | | 4.000%, 10/01/41 Gold Pool # T60392 | | | 145,451 | |
| | 781,936 | | | 3.500%, 10/01/42 Gold Pool # T65110 | | | 800,435 | |
The accompanying notes are an integral part of these financial statements.
AMG Funds
| | |
| AMG Managers DoubleLine Core Plus Bond Fund | | April 30, 2017 |
| Schedule of Investments – continued | | |
| | | | | | | | |
Principal
Amount | | | | | Market
Value | |
| | | | Freddie Mac (continued) | | | | |
| $ | 3,419,986 | | | 3.000%, 07/01/45 Pool # G08653 | | $ | 3,418,983 | |
| | 4,299,044 | | | 3.000%, 08/01/45 Pool # G08658 | | | 4,297,782 | |
| | 362,053 | | | 5.000%, 12/15/34 Series 2909, Class Z, REMIC | | | 397,811 | |
| | 103,913 | | | 5.106%, 04/15/37 (e) (h) Series 3301, Class MS, REMIC | | | 14,215 | |
| | 43,684 | | | 5.006%, 11/15/37 (e) (h) Series 3382, Class SB, REMIC | | | 4,924 | |
| | 72,366 | | | 5.396%, 11/15/37 (e) (h) Series 3384, Class S, REMIC | | | 9,793 | |
| | 147,849 | | | 4.526%, 01/15/39 (e) (h) Series 3500, Class SA, REMIC | | | 15,681 | |
| | 174,235 | | | 5.500%, 08/15/36 Series 3626, Class AZ, REMIC | | | 189,760 | |
| | 1,075,070 | | | 4.000%, 12/15/38 Series 3738, Class BP, REMIC | | | 1,121,366 | |
| | 128,349 | | | 4.000%, 01/15/41 Series 3795, Class VZ, REMIC | | | 136,366 | |
| | 46,613 | | | 4.000%, 06/15/41 Series 3872, Class BA, REMIC | | | 48,198 | |
| | 243,020 | | | 4.000%, 07/15/41 Series 3888, Class ZG, REMIC | | | 258,855 | |
| | 431,209 | | | 4.500%, 07/15/41 Series 3894, Class ZA, REMIC | | | 457,331 | |
| | 521,298 | | | 3.500%, 11/15/41 Series 3957, Class DZ, REMIC | | | 530,837 | |
| | 558,667 | | | 4.000%, 11/15/41 Series 3957, Class HZ, REMIC | | | 586,041 | |
| | 903,021 | | | 7.871%, 01/15/41 (e) Series 3792, Class SE, REMIC | | | 985,035 | |
| | 2,205,120 | | | 4.000%, 03/15/42 Series 4016, Class KZ, REMIC | | | 2,372,138 | |
| | 4,664,925 | | | 4.506%, 07/15/42 (e) (h) Series 4075, Class S, REMIC | | | 639,935 | |
| | 3,040,624 | | | 2.250%, 03/15/38 Series 4215, Class KC, REMIC | | | 3,067,532 | |
| | 2,639,700 | | | 3.000%, 06/15/40 Series 4323, Class GA, REMIC | | | 2,719,128 | |
| | 3,687,942 | | | 3.000%, 01/15/41 Series 4511, Class QA, REMIC | | | 3,752,267 | |
| | | | | | | | |
| | | | | | | 34,553,519 | |
| | | | | | | | |
| | | | Ginnie Mae – 0.4% | | | | |
| | 27,169 | | | 26.047%, 03/20/34 (e) Series 2004-35, Class SA | | | 47,691 | |
| | 333,367 | | | 6.637%, 08/20/38 (e) (h) Series 2008-69, Class SB | | | 68,393 | |
| | 379,793 | | | 4.500%, 05/16/39 Series 2009-32, Class ZE | | | 406,356 | |
| | 423,926 | | | 4.500%, 05/20/39 Series 2009-35, Class DZ | | | 459,146 | |
| | 447,066 | | | 4.500%, 09/20/39 Series 2009-75, Class GZ | | | 477,699 | |
| | 112,569 | | | 5.805%, 03/20/39 (e) (h) Series 2010-98, Class IA | | | 12,948 | |
| | | | | | | | |
Principal
Amount | | | | | Market
Value | |
| | | | Ginnie Mae (continued) | | | | |
| $ | 766,096 | | | 4.457%, 06/20/41 (e) (h) Series 2011-89, Class SA | | $ | 101,286 | |
| | 3,090,264 | | | 5.257%, 10/20/44 (e) (h) Series 2014-156, Class PS | | | 516,323 | |
| | 3,012,464 | | | 5.157%, 07/20/43 (e) (h) Series 2014-5, Class PS | | | 427,224 | |
| | | | | | | | |
| | | | | | | 2,517,066 | |
| | | | | | | | |
| | | | U.S. Treasury Bonds – 3.3% | |
| | 21,600,000 | | | 2.750%, 11/15/42 | | | 20,849,897 | |
| | | | | | | | |
| | | | U.S. Treasury Inflation Index
Bonds – 0.9% | |
| | 3,089,491 | | | 0.125%, 07/15/26 | | | 3,033,945 | |
| | 2,950,647 | | | 1.000%, 02/15/46 | | | 3,017,597 | |
| | | | | | | | |
| | | | | | | 6,051,542 | |
| | | | | | | | |
| | | | U.S. Treasury Notes – 18.2% | |
| | 4,600,000 | | | 0.625%, 09/30/17 | | | 4,593,712 | |
| | 9,590,000 | | | 1.000%, 02/15/18 | | | 9,584,006 | |
| | 1,860,000 | | | 1.000%, 05/15/18 | | | 1,856,985 | |
| | 7,350,000 | | | 1.000%, 05/31/18 | | | 7,336,939 | |
| | 13,480,000 | | | 1.500%, 05/31/20 | | | 13,486,053 | |
| | 12,870,000 | | | 2.000%, 11/30/20 | | | 13,047,966 | |
| | 1,300,000 | | | 1.750%, 12/31/20 | | | 1,306,170 | |
| | 14,210,000 | | | 2.250%, 03/31/21 | | | 14,521,398 | |
| | 20,850,000 | | | 1.750%, 03/31/22 | | | 20,778,318 | |
| | 1,110,000 | | | 1.500%, 02/28/23 | | | 1,081,361 | |
| | 12,670,000 | | | 2.125%, 02/29/24 | | | 12,702,423 | |
| | 15,790,000 | | | 1.625%, 05/15/26 | | | 14,965,036 | |
| | | | | | | | |
| | | | | | | 115,260,367 | |
| | | | | | | | |
| | | | Total U.S. Government and Agency Obligations
(Cost $243,078,913) | | | 241,830,706 | |
| | | | | | | | |
| OTHER MORTGAGE AND ASSET-BACKED
SECURITIES – 9.4% |
|
| | 250,000 | | | Adams Mill CLO, Ltd. (Cayman Islands) Series 2014-1A, Class D1 4.658%, 07/15/26 (a) (e) | | | 246,893 | |
| | 250,000 | | | Adams Mill CLO, Ltd. (Cayman Islands) Series 2014-1A, Class E1 6.158%, 07/15/26 (a) (e) | | | 239,215 | |
| | 1,000,000 | | | ALM VII R, Ltd. (Cayman Islands) Series 2013-7RA, Class CR 5.198%, 10/15/28 (a) (e) | | | 1,017,030 | |
| | 500,000 | | | ALM XI, Ltd. (Cayman Islands) Series 2014-11A, Class C 4.658%, 10/17/26 (a) (e) | | | 501,645 | |
| | 1,000,000 | | | ALM XIV, Ltd. (Cayman Islands) Series 2014-14A, Class C 4.622%, 07/28/26 (a) (e) | | | 1,008,606 | |
| | 500,000 | | | ALM XIX, Ltd. (Cayman Islands) Series 2016-19A, Class B 4.158%, 07/15/28 (a) (e) | | | 504,762 | |
The accompanying notes are an integral part of these financial statements.
AMG Funds
| | |
| AMG Managers DoubleLine Core Plus Bond Fund | | April 30, 2017 |
| Schedule of Investments – continued | | |
| | | | | | | | |
Principal
Amount | | | | | Market
Value | |
| $ | 500,000 | | | ALM XIX, Ltd. (Cayman Islands) Series 2016-19A, Class C 5.508%, 07/15/28 (a) (e) | | $ | 508,992 | |
| | 500,000 | | | Apidos CLO XVI (Cayman Islands) Series 2013-16A, Class B 3.958%, 01/19/25 (a) (e) | | | 500,010 | |
| | 250,000 | | | Apidos CLO XVIII (Cayman Islands) Series 2014-18A, Class D 6.353%, 07/22/26 (a) (e) | | | 245,484 | |
| | 500,000 | | | Apidos CLO XX (Cayman Islands) Series 2015-20A, Class C 4.858%, 01/16/27 (a) (e) | | | 499,893 | |
| | 500,000 | | | Apidos CLO XXI (Cayman Islands) Series 2015-21A, Class C 4.708%, 07/18/27 (a) (e) | | | 502,047 | |
| | 500,000 | | | ARES XXVI CLO, Ltd. (Cayman Islands) Series 2013-1A, Class D 4.908%, 04/15/25 (a) (e) | | | 501,329 | |
| | 1,000,000 | | | Atrium IX (Cayman Islands) Series 9A, Class DR 4.605%, 05/28/30 (a) (e) | | | 997,610 | |
| | 40,966 | | | AVANT Loans Funding Trust Series 2016-B, Class A 3.920%, 08/15/19 (a) | | | 41,092 | |
| | 500,000 | | | Babson CLO, Ltd. (Cayman Islands) Series 2012-2A, Class CR 4.639%, 05/15/23 (a) (e) | | | 505,665 | |
| | 250,000 | | | Babson CLO, Ltd. (Cayman Islands) Series 2014-3A, Class E2 7.658%, 01/15/26 (a) (e) | | | 251,763 | |
| | 500,000 | | | Babson CLO, Ltd. (Cayman Islands) Series 2015-2A, Class D 4.956%, 07/20/27 (a) (e) | | | 496,691 | |
| | 250,000 | | | Babson CLO, Ltd. (Cayman Islands) Series 2015-IA, Class D1 4.606%, 04/20/27 (a) (e) | | | 250,083 | |
| | 367,783 | | | Bayview Financial Acquisition Trust Series 2007-A, Class 1A5 6.101%, 05/28/37 (i) | | | 370,053 | |
| | 984,375 | | | Blackbird Capital Aircraft Lease Securitization, Ltd. Series 2016-1A, Class B 5.682%, 12/16/41 (a) (i) | | | 1,006,548 | |
| | 250,000 | | | BlueMountain CLO, Ltd. (Cayman Islands) Series 2012-1A, Class E 6.656%, 07/20/23 (a) (e) | | | 251,334 | |
| | 1,000,000 | | | BlueMountain CLO, Ltd. (Cayman Islands) Series 2013-1A, Class CR 5.306%, 01/20/29 (a) (e) | | | 1,002,469 | |
| | 500,000 | | | BlueMountain CLO, Ltd. (Cayman Islands) Series 2015-2A, Class C 3.858%, 07/18/27 (a) (e) | | | 501,957 | |
| | 1,000,000 | | | BlueMountain CLO, Ltd. (Cayman Islands) Series 2015-2A, Class D 4.708%, 07/18/27 (a) (e) | | | 1,005,683 | |
| | | | | | | | |
Principal
Amount | | | | | Market
Value | |
| $ | 1,000,000 | | | BlueMountain CLO, Ltd. (Cayman Islands) Series 2016-2A, Class C 5.152%, 08/20/28 (a) (e) | | $ | 1,023,651 | |
| | 250,000 | | | Brookside Mill CLO, Ltd. (Cayman Islands) Series 2013-1A, Class D 4.208%, 04/17/25 (a) (e) | | | 245,500 | |
| | 250,000 | | | Brookside Mill CLO, Ltd. (Cayman Islands) Series 2013-1A, Class E 5.558%, 04/17/25 (a) (e) | | | 231,392 | |
| | 500,000 | | | Canyon Capital CLO, Ltd. (Cayman Islands) Series 2014-1A, Class B 3.820%, 04/30/25 (a) (e) | | | 500,534 | |
| | 2,278,712 | | | Castle Aircraft Securitiz Series 2015-1A, Class A 4.703%, 12/15/40 (a) | | | 2,334,490 | |
| | 250,000 | | | Catamaran CLO, Ltd. (Cayman Islands) Series 2015-1A, Class C1 4.253%, 04/22/27 (a) (e) | | | 250,301 | |
| | 871,400 | | | CLI Funding V LLC Series 2013-2A, Class NOTE 3.220%, 06/18/28 (a) | | | 844,009 | |
| | 2,318,192 | | | Credit Suisse Commercial Mortgage Trust Series 2015-PR2, Class A1 4.250%, 07/26/55 (a) (i) | | | 2,331,762 | |
| | 100,000 | | | Credit-Based Asset Servicing & Securitization LLC Series 2007-MX1, Class A4 6.231%, 12/25/36 (a) (i) | | | 101,487 | |
| | 750,000 | | | Dryden XXIV Senior Loan Fund (Cayman Islands) Series 2012-24RA, Class DR 4.739%, 11/15/23 (a) (e) | | | 744,361 | |
| | 250,000 | | | Eaton Vance CDO VIII, Ltd. (Cayman Islands) Series 2006-8A, Class B 1.689%, 08/15/22 (a) (e) | | | 250,091 | |
| | 727,416 | | | ECAF I, Ltd. Series 2015-1A, Class A1 3.473%, 06/15/40 (a) | | | 719,232 | |
| | 842,763 | | | Element Rail Leasing II LLC Series 2016-1A, Class A2 5.047%, 03/19/46 (a) | | | 869,306 | |
| | 250,000 | | | Flatiron CLO, Ltd. (Cayman Islands) Series 2014-1A, Class C 4.458%, 07/17/26 (a) (e) | | | 245,008 | |
| | 499,542 | | | FREMF Mortgage Trust Series 2016-KF22, Class B 6.041%, 07/25/23 (a) (e) | | | 505,306 | |
| | 500,000 | | | Galaxy XVIII CLO, Ltd. (Cayman Islands) Series 2014-18A, Class D1 4.858%, 10/15/26 (a) (e) | | | 500,000 | |
The accompanying notes are an integral part of these financial statements.
AMG Funds
| | |
| AMG Managers DoubleLine Core Plus Bond Fund | | April 30, 2017 |
| Schedule of Investments – continued | | |
| | | | | | | | |
Principal Amount | | | | | Market
Value | |
| $ | 1,000,000 | | | Galaxy XXII CLO, Ltd. (Cayman Islands) Series 2016-22A, Class D 5.608%, 07/16/28 (a) (e) | | $ | 1,005,252 | |
| | 996,875 | | | Global SC Finance II SRL (Barbados) Series 2014-1A, Class A1 3.190%, 07/17/29 (a) | | | 975,457 | |
| | 500,000 | | | Goldentree Loan Opportunities X, Ltd. (Cayman Islands) Series 2015-10A, Class D 4.506%, 07/20/27 (a) (e) | | | 496,218 | |
| | 757,000 | | | GSAA Home Equity Trust Series 2006-15, Class AF3B 5.933%, 09/25/36 (e) | | | 126,041 | |
| | 250,000 | | | Halcyon Loan Advisors Funding, Ltd. (Cayman Islands) Series 2013-2A, Class C 3.870%, 08/01/25 (a) (e) | | | 251,566 | |
| | 500,000 | | | LCM XII LP (Cayman Islands) Series 12A, Class DR 4.858%, 10/19/22 (a) (e) | | | 504,437 | |
| | 250,000 | | | LCM XIV LP (Cayman Islands) Series 14A, Class D 4.658%, 07/15/25 (a) (e) | | | 251,264 | |
| | 500,000 | | | LCM XV LP (Cayman Islands) Series 15A, Class C 4.152%, 08/25/24 (a) (e) | | | 500,590 | |
| | 1,000,000 | | | LCM XVIII LP (Cayman Islands) Series 19A, Class D 4.608%, 07/15/27 (a) (e) | | | 984,957 | |
| | 1,000,000 | | | Madison Park Funding IV, Ltd. (Cayman Islands) Series 2007-4A, Class A1B 1.456%, 03/22/21 (a) (e) | | | 984,584 | |
| | 350,000 | | | Madison Park Funding IV, Ltd. (Cayman Islands) Series 2007-4A, Class D 2.586%, 03/22/21 (a) (e) | | | 343,959 | |
| | 500,000 | | | Madison Park Funding XV, Ltd. (Cayman Islands) Series 2014-15A, Class CR 4.620%, 01/27/26 (a) (e) | | | 500,210 | |
| | 750,000 | | | Madison Park Funding, Ltd. (Cayman Islands) Series 2007-6A, Class C 2.167%, 07/26/21 (a) (e) | | | 732,567 | |
| | 500,000 | | | Magnetite IX, Ltd. (Cayman Islands) Series 2014-9A, Class B 4.156%, 07/25/26 (a) (e) | | | 501,097 | |
| | 918,376 | | | Mosaic Solar Loans LLC Series 2017-1A, Class A 4.450%, 06/20/42 (a) | | | 927,156 | |
| | 500,000 | | | MP CLO, VI LTD. (Cayman Islands) Series 2014-2A, Class DR 4.658%, 01/15/27 (a) (e) | | | 500,226 | |
| | 250,000 | | | Nomad CLO, Ltd. (Cayman Islands) Series 2013-1A, Class C 4.658%, 01/15/25 (a) (e) | | | 251,238 | |
| | | | | | | | |
Principal Amount | | | | | Market
Value | |
| $ | 250,000 | | | Nomad CLO, Ltd. (Cayman Islands) Series 2013-1A, Class B 4.108%, 01/15/25 (a) (e) | | $ | 251,289 | |
| | 250,000 | | | Octagon Investment Partners XVI, Ltd. (Cayman Islands) Series 2013-1A, Class D 4.508%, 07/17/25 (a) (e) | | | 250,098 | |
| | 250,000 | | | Octagon Investment Partners XVI, Ltd. (Cayman Islands) Series 2013-1A, Class E 5.658%, 07/17/25 (a) (e) | | | 233,301 | |
| | 1,000,000 | | | Octagon Investment Partners XX, Ltd. (Cayman Islands) Series 2014-1A, Class D 4.684%, 08/12/26 (a) (e) | | | 1,000,000 | |
| | 250,000 | | | Octagon Investment Partners XXI, Ltd. (Cayman Islands) Series 2014-1A, Class C 4.686%, 11/14/26 (a) (e) | | | 251,018 | |
| | 250,000 | | | Octagon Investment Partners XXII, Ltd. (Cayman Islands) Series 2014-1A, Class C2 4.653%, 11/25/25 (a) (e) | | | 250,666 | |
| | 250,000 | | | Octagon Investment Partners XXII, Ltd. (Cayman Islands) Series 2014-1A, Class D2 5.733%, 11/25/25 (a) (e) | | | 251,759 | |
| | 250,000 | | | Octagon Investment Partners XXVII, Ltd. (Cayman Islands) Series 2016-1A, Class C 4.158%, 07/15/27 (a) (e) | | | 250,472 | |
| | 500,000 | | | Octagon Investment Partners XXVII, Ltd. (Cayman Islands) Series 2016-1A, Class D 5.908%, 07/15/27 (a) (e) | | | 502,393 | |
| | 500,000 | | | Octagon Investment Partners XXX, Ltd. (Cayman islands) Series 2017-1A, Class C 4.535%, 03/17/30 (a) (e) | | | 497,215 | |
| | 250,000 | | | Octagon Investment Partners XXX, Ltd. (Cayman islands) Series 2017-1A, Class D 7.235%, 03/17/30 (a) (e) | | | 248,813 | |
| | 2,000,000 | | | OneMain Financial Issuance Trust Series 2015-1A, Class A 3.190%, 03/18/26 (a) | | | 2,022,413 | |
| | 701,000 | | | OneMain Financial Issuance Trust Series 2015-2A, Class A 2.570%, 07/18/25 (a) | | | 703,085 | |
| | 1,516,907 | | | SpringCastle America Funding LLC Series 2016-AA, Class A 3.050%, 04/25/29 (a) | | | 1,531,696 | |
| | 2,000,000 | | | Springleaf Funding Trust Series 2015-AA, Class A 3.160%, 11/15/24 (a) | | | 2,022,900 | |
| | 500,000 | | | Symphony CLO XI, Ltd. (Cayman Islands) Series 2013-11A, Class C 4.308%, 01/17/25 (a) (e) | | | 501,474 | |
The accompanying notes are an integral part of these financial statements.
AMG Funds
| | |
| AMG Managers DoubleLine Core Plus Bond Fund | | April 30, 2017 |
| Schedule of Investments – continued | | |
| | | | | | | | |
Principal Amount | | | | | Market
Value | |
| $ | 750,000 | | | Symphony CLO XIV, Ltd. (Cayman Islands) Series 2014-14A, Class D2 4.758%, 07/14/26 (a) (e) | | $ | 748,201 | |
| | 1,000,000 | | | TAL Advantage VI LLC Series 2017-1A, Class A 4.500%, 04/21/42 (a) | | | 1,028,288 | |
| | 1,000,000 | | | TCI-Cent CLO, Ltd. (Cayman Islands) Series 2016-1A, Class C 5.124%, 12/21/29 (a) (e) | | | 1,007,877 | |
| | 750,000 | | | TCI-Flatiron CLO, Ltd. (Cayman Islands) Series 2016-1A, Class C 4.208%, 07/17/28 (a) (e) | | | 760,672 | |
| | 1,000,000 | | | TCI-Symphony CLO, Ltd. (Cayman Islands) Series 2016-1A, Class D 4.719%, 10/13/29 (a) (e) | | | 1,001,146 | |
| | 250,000 | | | THL Credit Wind River CLO, Ltd. (Cayman Islands) Series 2013-1A, Class C 4.556%, 04/20/25 (a) (e) | | | 250,365 | |
| | 1,000,000 | | | THL Credit Wind River CLO, Ltd. (Cayman Islands) Series 2014-1A, Class DR 4.658%, 04/18/26 (a) (e) | | | 1,001,203 | |
| | 1,200,000 | | | THL Credit Wind River CLO, Ltd. (Cayman Islands) Series 2014-2A, Class D 5.058%, 07/15/26 (a) (e) | | | 1,204,770 | |
| | 500,000 | | | THL Credit Wind River CLO, Ltd. (Cayman Islands) Series 2016-1A, Class C 4.358%, 07/15/28 (a) (e) | | | 503,034 | |
| | 250,000 | | | THL Credit Wind River CLO, Ltd. (Cayman Islands) Series 2016-1A, Class D 5.808%, 07/15/28 (a) (e) | | | 252,407 | |
| | 3,714,377 | | | Towd Point Mortgage Trust Series 2015-6, Class A1B 2.750%, 04/25/55 (a) (e) | | | 3,736,622 | |
| | 990,084 | | | Trinity Rail Leasing 2010 Series 2010-1A, Class A 5.194%, 10/16/40 (a) | | | 1,025,409 | |
| | 130,173 | | | Venture VIII CDO, Ltd. (Cayman Islands) Series 2007-8A, Class A1A 1.433%, 07/22/21 (a) (e) | | | 129,436 | |
| | 443,653 | | | Venture XI CLO, Ltd. (Cayman Islands) Series 2012-11A, Class AR 2.336%, 11/14/22 (a) (e) | | | 444,407 | |
| | 1,000,000 | | | Westcott Park CLO, Ltd. (Cayman Islands) Series 2016-1A, Class D 5.506%, 07/20/28 (a) (e) | | | 1,018,500 | |
| | | | | | | | |
| | | | Total Other Mortgage and Asset-Backed Securities
(Cost $58,520,380) | | | 59,371,032 | |
| | | | | | | | |
| | | | | | | | |
Principal Amount | | | | | Market
Value | |
|
| | MUNICIPAL BONDS – 0.1% | |
| | | | Texas – 0.1% | | | | |
| $ | 380,000 | | | North Texas Municipal Water District Water System Revenue GO 5.000%, 09/01/35 | | $ | 439,747 | |
| | | | | | | | |
| | | | Total Municipal Bond
(Cost $432,590) | | | 439,747 | |
| | | | | | | | |
|
| | FOREIGN GOVERNMENT BONDS AND NOTES – 4.5% | |
| | 2,500,000 | | | Argentine Republic Government International Bond (Argentina) Senior Unsecured Notes 6.875%, 01/26/27 (b) | | | 2,647,500 | |
| | 2,000,000 | | | Brazilian Government International Bond (Brazil) Senior Unsecured Notes 5.625%, 01/07/41 | | | 1,996,600 | |
| | | | Chile Government International Bond (Chile) Senior Unsecured Notes | | | | |
| | 400,000 | | | 3.125%, 03/27/25 (b) | | | 409,000 | |
| | 1,400,000 | | | 3.125%, 01/21/26 | | | 1,431,500 | |
| | 500,000 | | | Colombia Government International Bond (Colombia) Senior Unsecured Notes 4.500%, 01/28/26 | | | 534,375 | |
| | 600,000 | | | Corp Financiera de Desarrollo SA (Peru) Senior Unsecured Notes 4.750%, 07/15/25 | | | 644,880 | |
| | 500,000 | | | Costa Rica Government Senior Unsecured Notes 9.995%, 08/01/20 | | | 587,935 | |
| | | | Dominican Republic International Bond Senior Unsecured Notes | | | | |
| | 400,000 | | | 5.500%, 01/27/25 | | | 416,660 | |
| | 2,800,000 | | | 5.950%, 01/25/27 (a) | | | 2,937,172 | |
| | 1,000,000 | | | 6.850%, 01/27/45 | | | 1,068,750 | |
| | | | Guatemala Government Bond (Guatemala) Senior Unsecured Notes | | | | |
| | 1,400,000 | | | 4.500%, 05/03/26 | | | 1,420,090 | |
| | 500,000 | | | 4.875%, 02/13/28 (b) | | | 521,260 | |
| | 2,200,000 | | | Korea International Bond (South Korea) Senior Unsecured Notes 2.750%, 01/19/27 | | | 2,162,545 | |
| | | | Mexico Government International Bond Senior Unsecured Notes | | | | |
| | 2,000,000 | | | 4.125%, 01/21/26 (b) | | | 2,072,000 | |
| | 2,316,000 | | | 4.150%, 03/28/27 | | | 2,384,206 | |
| | 400,000 | | | 4.750%, 03/08/44 | | | 396,600 | |
| | 2,700,000 | | | Panama Government International Bond (Panama) Senior Unsecured Notes 3.875%, 03/17/28 (b) | | | 2,790,990 | |
The accompanying notes are an integral part of these financial statements.
AMG Funds
| | |
| AMG Managers DoubleLine Core Plus Bond Fund | | April 30, 2017 |
| Schedule of Investments – continued | | |
| | | | | | | | |
Principal Amount | | | | | Market
Value | |
| $ | 1,300,000 | | | Perusahaan Penerbit SBSN Indonesia III (Indonesia) Senior Unsecured Notes 4.150%, 03/29/27 (a) | | $ | 1,326,000 | |
| | 1,200,000 | | | Philippine Government International Bond (Philippine) Senior Unsecured Notes 3.700%, 02/02/42 | | | 1,195,162 | |
| | 1,000,000 | | | Provincia de Buenos Aires (Argentina) Senior Unsecured Notes 7.875%, 06/15/27 (a) | | | 1,046,430 | |
| | 500,000 | | | Republic of Poland Government International Bond Senior Unsecured Notes 3.250%, 04/06/26 | | | 499,487 | |
| | | | The Korea Development Bank (South Korea) Senior Unsecured Notes | | | | |
| | 200,000 | | | 3.000%, 01/13/26 | | | 198,636 | |
| | 200,000 | | | 2.000%, 09/12/26 | | | 182,543 | |
| | | | | | | | |
| | | | Total Foreign Government Bonds and Notes (Cost $27,951,557) | | | 28,870,321 | |
| | | | | | | | |
| | |
Shares | | | | | | |
| | COMMON STOCKS – 0.1% | | | | |
| | | | Energy – 0.1% | | | | |
| | 864 | | | Sandridge Energy, Inc. | | | 15,915 | |
| | 3,600 | | | Energy XXI Gulf Coast, Inc. | | | 99,000 | |
| | 2,625 | | | Pacific Exploration and Production Corp. (Canada) | | | 77,359 | |
| | 5,996 | | | Pacific Exploration and Production Corp. (Canada) | | | 180,093 | |
| | | | | | | | |
| | | | Total Common Stocks
(Cost $448,428) | | | 372,367 | |
| | | | | | | | |
| | WARRANTS – 0.00%# | | | | |
| | | | Energy – 0.00% | | | | |
| | 1,106 | | | Energy XXI Gulf Coast, Inc. 12/30/21 (g) | | | 5,945 | |
| | | | | | | | |
| | | | Total Warrants
(Cost $5,530) | | | 5,945 | |
| | | | | | | | |
| | |
Principal
Amount | | | | | | |
| | SHORT TERM INVESTMENTS – 5.4% | | | | |
| | | | Repurchase Agreements – 2.3% (j) | |
| $ | 3,499,615 | | | Citigroup Global Markets, Inc., dated 04/28/17, due 05/01/17, 0.820% total to be received $3,499,854 (collateralized by various U.S. Government Agency Obligations, 0.000% - 11.500%, 05/01/17 - 06/01/53, totaling $3,569,607) | | | 3,499,615 | |
| | | | | | | | |
Principal
Amount | | | | | Market
Value | |
| | | | Repurchase Agreements (continued) | |
| $ | 736,422 | | | Deutsche Bank Securities, Inc., dated 04/28/17, due 05/01/17, 0.840% total to be received $736,474 (collateralized by various U.S. Government Agency Obligations, 1.375% - 2.500%, 12/31/18 - 09/09/49, totaling $751,151) | | $ | 736,422 | |
| | 3,499,615 | | | HSBC Securities USA, Inc., dated 04/28/17, due 05/01/17, 0.780% total to be received $3,499,842 (collateralized by various U.S. Government Agency Obligations, 0.000% - 0.000%, 08/15/27 - 08/15/40, totaling $3,569,613) | | | 3,499,615 | |
| | 3,499,615 | | | Merrill Lynch Pierce Fenner & Smith, Inc., dated 04/28/17, due 05/01/17, 0.810% total to be received $3,499,851 (collateralized by various U.S. Government Agency Obligations, 3.000% - 4.500%, 09/20/42 - 04/20/45, totaling $3,569,607) | | | 3,499,615 | |
| | 3,499,615 | | | RBC Dominion Securities, Inc., dated 04/28/17, due 05/01/17, 0.810% total to be received $3,499,851 (collateralized by various U.S. Government Agency Obligations, 0.125% - 7.000%, 07/15/17 - 07/01/55, totaling $3,569,607) | | | 3,499,615 | |
| | | | | | | | |
| | | | Total Repurchase Agreements
(Cost $14,734,882) | | | 14,734,882 | |
| | | | | | | | |
| | |
Shares | | | | | | |
| | | | Other Investment Companies – 3.1% | |
| | 1,065,845 | | | DoubleLine Floating Rate Fund (k) | | | 10,573,187 | |
| | 9,145,996 | | | Dreyfus Government Cash Management Fund, Institutional Class Shares, 0.69% * (l) | | | 9,145,996 | |
| | | | | | | | |
| | | | Total Short Term Investments
(Cost $34,563,242) | | | 34,454,065 | |
| | | | | | | | |
| Total Investments – 101.5%
(Cost $642,885,638)** | | | 642,456,219 | |
| | | | | | | | |
| | Net Other Assets and Liabilities – (1.5)% | | | (9,415,363 | ) |
| | | | | | | | |
| | Net Assets – 100.0% | | $ | 633,040,856 | |
| | | | | | | | |
The accompanying notes are an integral part of these financial statements.
AMG Funds
| | |
| AMG Managers DoubleLine Core Plus Bond Fund | | April 30, 2017 |
| Schedule of Investments – continued | | |
| * | Yield shown represents the April 30, 2017, seven-day average yield, which refers to the sum of the previous seven days’ dividends paid, expressed as an annual percentage. |
| ** | At April 30, 2017, the aggregate cost for Federal income tax purposes approximates the aggregate cost for book purposes. |
The aggregate gross unrealized appreciation and depreciation were as follows:
| | | | |
Gross unrealized appreciation | | $ | 9,518,118 | |
Gross unrealized depreciation | | | (9,947,537 | ) |
| | | | |
Net unrealized depreciation | | $ | (429,419 | ) |
| | | | |
| (a) | Securities exempt from registration under Rule 144A of the Securities Act of 1933, as amended. These securities are purchased in accordance with guidelines approved by the Board of Trustees and may only be resold, in transactions exempt from registration, to qualified institutional buyers. At April 30, 2017, these securities amounted to $135,220,231, or 21.4% of net assets. These securities have not been determined by the Subadviser to be illiquid securities. |
| (b) | Some or all of these securities were out on loan to various brokers as of April 30, 2017, amounting to $14,268,090 or 2.3% of net assets. |
| (c) | Delayed delivery security. |
| (e) | Variable rate bond. The interest rate shown reflects the rate in effect at April 30, 2017. |
| (g) | Securities with a total aggregate market value of $407,321, or 0.1% of net assets, were valued under fair value procedures established by the Funds’ Board of Trustees. |
| (h) | Interest only security. This type of security represents the right to receive the monthly interest payments on an underlying pool of mortgages. Payments of principal on the pool reduce the value of the “interest only” holding. |
| (i) | Step Coupon. Security becomes interest bearing at a future date. |
| (j) | Collateral received from brokers for securities lending was invested in these joint repurchase agreements. |
| (k) | Affiliated issuer. A summary of this affiliated investment for the six months ended April 30, 2017 is as follows: |
| | | | | | | | | | |
Beginning Market
Value | | Purchases
at Cost | | Proceeds
from
Sales | | Dividend
Income | | Realized
(Loss) | | Ending
Market
Value |
$7,837,407 | | $4,400,000 | | $(1,700,000) | | $138,009 | | $(29,383) | | $10,573,187 |
| (l) | Some of this security has been pledged as collateral for delayed delivery securities. |
| | |
| CDO | | Collateralized Debt Obligation |
| CLO | | Collateralized Loan Obligation |
| EMTN | | Euro Medium Term Note |
| GMTN | | Global Medium Term Note |
| GO | | General Obligation |
| LP | | Limited Partnership |
| MTN | | Medium Term Note |
| REMIC | | Real Estate Mortgage Investment Conduit |
| S&P | | Standard & Poor’s |
| | | | |
Rating*** | | | | |
U.S. Government and Agency Obligations | | | 37.6 | % |
Common Stock | | | 0.1 | % |
AAA | | | 3.6 | % |
AA | | | 4.3 | % |
A | | | 9.8 | % |
BBB | | | 17.7 | % |
BB | | | 6.5 | % |
B | | | 3.5 | % |
Lower then B | | | 5.5 | % |
Not Rated | | | 11.4 | % |
| | | | |
| | | 100 | % |
| | | | |
| *** | As a percentage of market value of fixed-income securities. |
Credit quality ratings shown above reflect the highest rating assigned by either Standard & Poor’s (“S&P”) or Moody’s Investors Service, Inc. (“Moody’s”). These rating agencies are independent, nationally recognized statistical rating organizations and are widely used. Investment grade ratings are credit ratings of BBB/Baa or higher. Below investment grade ratings are credit ratings of BB/Ba or lower. Investments designated N/R are not rated by either rating agency. Unrated investments do not necessarily indicate low credit quality. Credit quality ratings are subject to change.
The accompanying notes are an integral part of these financial statements.
AMG Funds
| | |
| AMG Managers Lake Partners LASSO Alternatives Fund | | April 30, 2017 |
| Schedule of Investments (unaudited) | | |
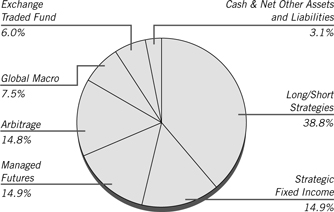
% of Net Assets
| | | | | | | | |
Shares | | | | | Market
Value | |
| | INVESTMENT COMPANIES – 92.4% | |
| | | | Long/Short Strategies – 38.8% | | | | |
| | 343,521 | | | 361 Global Long/Short Equity Fund-Class Y | | $ | 3,895,529 | |
| | 368,990 | | | Boston Partners Long/Short Equity Fund- Institutional Class * | | | 7,818,908 | |
| | 105 | | | Diamond Hill Long/Short Fund-Class I * | | | 2,739 | |
| | 97,607 | | | FPA Crescent Fund | | | 3,325,475 | |
| | 477,377 | | | MainStay U.S. Equity Opportunities Fund- Class I | | | 4,678,298 | |
| | 280,294 | | | Neuberger Berman US Equity Index Putwrite Strategy Fund-Institutional Class | | | 3,041,187 | |
| | 689,072 | | | Otter Creek Long/Short Opportunity Fund- Institutional Class * | | | 7,924,333 | |
| | | | | | | | |
| | | | | | | 30,686,469 | |
| | | | | | | | |
| | | | Strategic Fixed Income – 14.9% | | | | |
| | 495,390 | | | Metropolitan West Unconstrained Bond Fund-Class I | | | 5,895,139 | |
| | 535,821 | | | PIMCO Mortgage Opportunities Fund- Institutional Class | | | 5,899,392 | |
| | | | | | | | |
| | | | | | | 11,794,531 | |
| | | | | | | | |
| | | | Managed Futures – 14.9% | | | | |
| | 173,399 | | | 361 Managed Futures Fund-Class I * | | | 1,891,783 | |
| | 476,731 | | | Abbey Capital Futures Strategy Fund- Class I * | | | 5,406,126 | |
| | 435,324 | | | Credit Suisse Managed Futures Strategy Fund-Class I | | | 4,488,189 | |
| | | | | | | | |
| | | | | | | 11,786,098 | |
| | | | | | | | |
| | | | | | | | |
Shares | | | | | Market
Value | |
| | | | Arbitrage – 14.8% | | | | |
| | 297,181 | | | Calamos Market Neutral Income Fund-Class I | | $ | 3,890,096 | |
| | 366,281 | | | Kellner Merger Fund-Institutional Class | | | 3,893,567 | |
| | 378,915 | | | Touchstone Arbitrage Fund- Institutional class | | | 3,902,828 | |
| | | | | | | | |
| | | | | | | 11,686,491 | |
| | | | | | | | |
| | | | Global Macro – 7.5% | | | | |
| | 530,981 | | | Western Asset Macro Opportunities Fund-Class IS | | | 5,904,511 | |
| | | | | | | | |
| | | | Money Market – 1.5% | | | | |
| | 1,209,311 | | | Dreyfus Government Cash Management Fund, Institutional Class Shares, 0.69% ** | | | 1,209,311 | |
| | | | | | | | |
| | | | Total Investment Companies
(Cost $71,544,707) | | | 73,067,411 | |
| | | | | | | | |
| | EXCHANGE TRADED FUND – 6.0% | | | | |
| | | | Long/Short Strategies – 6.0% | | | | |
| | 79,760 | | | ProShares Large Cap Core Plus | | | 4,709,030 | |
| | | | | | | | |
| | | | Total Exchange Traded Fund
(Cost $4,022,344) | | | 4,709,030 | |
| | | | | | | | |
| Total Investments – 98.4%
(Cost $75,567,051)*** | | | 77,776,441 | |
| | | | | | | | |
| | Net Other Assets and Liabilities – 1.6% | | | 1,293,408 | |
| | | | | | | | |
| | Net Assets – 100.0% | | $ | 79,069,849 | |
| | | | | | | | |
| * | Non-income producing security. |
| ** | Yield shown represents the April 30, 2017, seven-day average yield, which refers to the sum of the previous seven days’ dividends paid, expressed as an annual percentage. |
| *** | At April 30, 2017, the aggregate cost for Federal income tax purposes approximates the aggregate cost for book purposes. The aggregate gross unrealized appreciation and depreciation were as follows: |
| | | | |
Gross unrealized appreciation | | $ | 3,278,837 | |
Gross unrealized depreciation | | | (1,069,447 | ) |
| | | | |
Net unrealized appreciation | | $ | 2,209,390 | |
| | | | |
The accompanying notes are an integral part of these financial statements.
AMG Funds
| | |
| AMG River Road Long-Short Fund | | April 30, 2017 |
| Schedule of Investments (unaudited) | | |
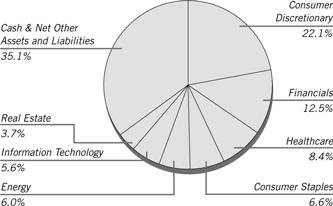
% of Net Assets
The chart represents total investments, including short sales in the Fund. Industrials, Materials, Utilities, Telecommunication Services and Exchange Traded Funds are (4.4)%, (1.1)%, (3.5)%, (3.4)%, and (1.8)%, respectively, and are represented in the pie chart by reducing Cash and Net Other Assets and Liabilities to 35.1%.
| | | | | | | | |
Shares | | | | | Market
Value | |
| | COMMON STOCKS – 83.3% | |
| | | | Consumer Discretionary – 29.4% | | | | |
| | 19,104 | | | Asbury Automotive Group, Inc. (a) * | | $ | 1,169,165 | |
| | 61,654 | | | Comcast Corp., Class A (a) | | | 2,416,220 | |
| | 21,888 | | | General Motors Co. (a) | | | 758,200 | |
| | 14,350 | | | L Brands, Inc. (a) | | | 757,824 | |
| | 45,929 | | | Liberty Media Corp-Liberty SiriusXM, Class C (a) * | | | 1,744,843 | |
| | 38,674 | | | Liberty Ventures, Class A (a) * | | | 2,082,595 | |
| | 7,976 | | | Polaris Industries, Inc. (a) | | | 680,034 | |
| | 7,792 | | | Ralph Lauren Corp. (a) | | | 628,970 | |
| | 23,214 | | | Target Corp. (a) | | | 1,296,502 | |
| | | | | | | | |
| | | | | | | 11,534,353 | |
| | | | | | | | |
| | | | Consumer Staples – 6.6% | | | | |
| | 16,987 | | | CVS Health Corp. (a) | | | 1,400,408 | |
| | 15,200 | | | Nestle SA, Sponsored ADR | | | | |
| | | | (Switzerland) (a) | | | 1,170,385 | |
| | | | | | | | |
| | | | | | | 2,570,793 | |
| | | | | | | | |
| | | | Energy – 6.0% | | | | |
| | 39,010 | | | Diamond Offshore Drilling (a) * | | | 562,524 | |
| | 23,426 | | | HollyFrontier Corp. (a) | | | 659,208 | |
| | 22,238 | | | Marathon Petroleum Corp. (a) | | | 1,132,804 | |
| | | | | | | | |
| | | | | | | 2,354,536 | |
| | | | | | | | |
| | | | Financials – 15.1% | | | | |
| | 14,250 | | | Berkshire Hathaway, Inc., Class B (a) * | | | 2,354,243 | |
| | 26,770 | | | The Blackstone Group LP (a) | | | 825,587 | |
| | 56,202 | | | FNFV Group (a) * | | | 769,967 | |
| | 25,316 | | | Oaktree Capital Group LLC, MLP (a) | | | 1,189,852 | |
| | 14,165 | | | Wells Fargo & Co. (a) | | | 762,644 | |
| | | | | | | | |
| | | | | | | 5,902,293 | |
| | | | | | | | |
| | | | | | | | |
Shares | | | | | Market
Value | |
| | | | Healthcare – 9.5% | | | | |
| | 3,268 | | | Allergan PLC (Ireland) (a) | | $ | 796,934 | |
| | 11,836 | | | DaVita, Inc. (a) * | | | 816,802 | |
| | 7,439 | | | McKesson Corp. (a) | | | 1,028,739 | |
| | 32,442 | | | Premier, Inc., Class A (a) * | | | 1,096,540 | |
| | | | | | | | |
| | | | | | | 3,739,015 | |
| | | | | | | | |
| | | | Industrials – 2.8% | | | | |
| | 5,745 | | | WW Grainger, Inc. (a) | | | 1,107,062 | |
| | | | | | | | |
| | | | Information Technology – 7.9% | |
| | 2,589 | | | Alphabet, Inc., Class C (a) * | | | 2,345,530 | |
| | 18,907 | | | Blackhawk Network Holdings, Inc. (a) * | | | 764,788 | |
| | | | | | | | |
| | | | | | | 3,110,318 | |
| | | | | | | | |
| | | | Real Estate – 6.0% | | | | |
| | 25,615 | | | Alexander & Baldwin, Inc. (a) | | | 1,178,546 | |
| | 21,254 | | | Iron Mountain, Inc., REIT (a) | | | 738,789 | |
| | 14,098 | | | Realogy Holdings Corp. (a) | | | 430,694 | |
| | | | | | | | |
| | | | | | | 2,348,029 | |
| | | | | | | | |
| | | | Total Common Stocks
(Cost $30,592,848) | | | 32,666,399 | |
| | | | | | | | |
| | INVESTMENT COMPANY – 66.3% | | | | |
| | 26,003,208 | | | Dreyfus Government Cash Management Fund, Institutional Class Shares, 0.69% ** | | | 26,003,208 | |
| | | | | | | | |
| | | | Total Investment Company
(Cost $26,003,208) | | | 26,003,208 | |
| | | | | | | | |
| Total Investments – 149.6%
(Cost $56,596,056)*** | | | 58,669,607 | |
| | | | | | | | |
| | SHORT SALES (b) – (32.6)% | | | | |
| | | | Common Stocks – (30.8)% | | | | |
| | | | Consumer Discretionary – (7.3)% | |
| | (1,924) | | | Brunswick Corp. | | | (109,186 | ) |
| | (27,779) | | | ClubCorp Holdings, Inc. | | | (373,628 | ) |
| | (5,002) | | | Cooper Tire & Rubber Co. | | | (191,577 | ) |
| | (2,525) | | | Delphi Automotive PLC (Jersey) | | | (203,010 | ) |
| | (7,715) | | | Hyatt Hotels Corp, Class A * | | | (428,183 | ) |
| | (10,822) | | | La-Z-Boy, Inc. | | | (301,934 | ) |
| | (17,477) | | | Michaels Co., Inc. * | | | (408,263 | ) |
| | (3,843) | | | Norwegian Cruise Line Holdings, Ltd. (Bermuda) * | | | (207,253 | ) |
| | (12,641) | | | Party City Holdco, Inc. * | | | (202,256 | ) |
| | (19,227) | | | Regal Entertainment Group, Class A | | | (424,340 | ) |
| | | | | | | | |
| | | | | | | (2,849,630 | ) |
| | | | | | | | |
| | | | Financials – (2.6)% | | | | |
| | (18,814) | | | AmTrust Financial Services, Inc. | | | (301,965 | ) |
| | (10,609) | | | Equitable Group, Inc. (Canada) | | | (283,596 | ) |
| | (11,933) | | | Genworth MI Canada, Inc. (Canada) | | | (296,347 | ) |
| | (26,014) | | | Home Capital Group, Inc. (Canada) | | | (153,220 | ) |
| | | | | | | | |
| | | | | | | (1,035,128 | ) |
| | | | | | | | |
The accompanying notes are an integral part of these financial statements.
AMG Funds
| | |
| AMG River Road Long-Short Fund | | April 30, 2017 |
| Schedule of Investments – continued | | |
| | | | | | | | |
Shares | | | | | Market
Value | |
| | | | Healthcare – (1.1)% | | | | |
| | (8,927) | | | Mallinckrodt PLC (Ireland) * | | $ | (418,855 | ) |
| | | | | | | | |
| | | | Industrials – (7.2)% | | | | |
| | (4,668) | | | American Airlines Group, Inc. | | | (198,950 | ) |
| | (3,094) | | | Caterpillar, Inc. | | | (316,392 | ) |
| | (15,125) | | | Echo Global Logistics, Inc. * | | | (283,594 | ) |
| | (8,427) | | | HNI Corp. | | | (394,047 | ) |
| | (12,198) | | | LSC Communications, Inc. | | | (315,562 | ) |
| | (29,358) | | | Quad/Graphics, Inc. | | | (770,941 | ) |
| | (2,233) | | | Snap-On, Inc. | | | (374,094 | ) |
| | (7,807) | | | Swift Transportation Co. * | | | (191,896 | ) |
| | | | | | | | |
| | | | | | | (2,845,476 | ) |
| | | | | | | | |
| | | | Information Technology – (2.3)% | |
| | (17,435) | | | HP, Inc. | | | (328,127 | ) |
| | (2,379) | | | International Business Machines Corp. | | | (381,330 | ) |
| | (3,980) | | | Netgear, Inc. * | | | (187,657 | ) |
| | | | | | | | |
| | | | | | | (897,114 | ) |
| | | | | | | | |
| | | | Materials – (1.1)% | | | | |
| | (5,451) | | | Ball Corp. | | | (419,127 | ) |
| | | | | | | | |
| | | | Real Estate – (2.3)% | | | | |
| | (6,029) | | | Boardwalk Real Estate Investment Trust, REIT (Canada) | | | (203,388 | ) |
| | (12,630) | | | Canadian Apartment Properties, REIT (Canada) | | | (313,379 | ) |
| | (27,199) | | | Pennsylvania Real Estate Investment Trust, REIT | | | (376,706 | ) |
| | | | | | | | |
| | | | | | | (893,473 | ) |
| | | | | | | | |
| | | | Telecommunication Services – (3.4)% | |
| | (18,808) | | | AT&T, Inc. | | | (745,361 | ) |
| | (24,231) | | | Consolidated Communications Holdings, Inc. | | | (573,548 | ) |
| | | | | | | | |
| | | | | | | (1,318,909 | ) |
| | | | | | | | |
| | | | Utilities – (3.5)% | | | | |
| | (5,057) | | | American Water Works Co., Inc. | | | (403,346 | ) |
| | (7,482) | | | Consolidated Edison, Inc. | | | (593,173 | ) |
| | (8,666) | | | Xcel Energy, Inc. | | | (390,403 | ) |
| | | | | | | | |
| | | | | | | (1,386,922 | ) |
| | | | | | | | |
| | | | Total Common Stocks
(Proceeds $12,298,515) | | | (12,064,634 | ) |
| | | | | | | | |
| | | | Exchange Traded Funds – (1.8)% | |
| | (48,270) | | | United States Natural Gas Fund LP * | | | (365,404 | ) |
| | (35,523) | | | United States Oil Fund LP * | | | (363,756 | ) |
| | | | | | | | |
| | | | Total Exchange Traded Fund
(Proceeds $745,974) | | | (729,160 | ) |
| | | | | | | | |
| Total Short Sales – (32.6)%
(Proceeds $13,044,489) | | | (12,793,794 | ) |
| | | | | | | | |
| | Net Other Assets and Liabilities – (17.0)% | | | (6,678,350 | ) |
| | | | | | | | |
| | Net Assets – 100.0% | | $ | 39,197,463 | |
| | | | | | | | |
| * | Non-income producing security. |
| ** | Yield shown represents the April 30, 2017, seven-day average yield, which refers to the sum of the previous seven days’ dividends paid, expressed as an annual percentage. |
| *** | At April 30, 2017, the aggregate cost for Federal income tax purposes approximates the aggregate cost for book purposes. |
The aggregate gross unrealized appreciation and depreciation were as follows:
| | | | |
Gross unrealized appreciation | | $ | 3,017,159 | |
Gross unrealized depreciation | | | (943,608 | ) |
| | | | |
Net unrealized appreciation | | $ | 2,073,551 | |
| | | | |
| (a) | Security position is either entirely or partially held in a segregated account as collateral for securities sold short. As of April 30, 2017, $30,454,206 in securities was segregated to cover short sales. |
| (b) | The Fund is contractually responsible to the lender for any dividends payable and interest accrued on securities while those securities are outstanding in short position. These dividends and interest amounts are recorded as an expense of the Fund. |
| | |
| ADR | | American Depositary Receipt |
| LP | | Limited Partnership |
| MLP | | Master Limited Partnership |
| REIT | | Real Estate Investment Trust |
The accompanying notes are an integral part of these financial statements.
AMG Funds
| | |
| AMG Managers Guardian Capital Global Dividend Fund | | April 30, 2017 |
| Schedule of Investments (unaudited) | | |
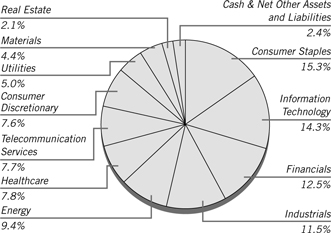
% of Net Assets
| | | | | | | | |
Shares | | | | | Market
Value | |
| | COMMON STOCKS – 97.6% | |
| | | | Australia – 1.4% | | | | |
| | 37,051 | | | Sydney Airport (a) | | $ | 191,364 | |
| | 11,400 | | | Westpac Banking Corp. (a) | | | 298,848 | |
| | | | | | | | |
| | | | | | | 490,212 | |
| | | | | | | | |
| | | | Belgium – 2.3% | | | | |
| | 6,803 | | | Anheuser-Busch InBev SA/NV, | | | | |
| | | | Sponsored ADR | | | 770,372 | |
| | | | | | | | |
| | | | Canada – 4.7% | | | | |
| | 5,645 | | | BCE, Inc. | | | 257,014 | |
| | 15,707 | | | Enbridge Income Fund Holdings, Inc. | | | 385,469 | |
| | 8,299 | | | Rogers Communications, Inc., Class B | | | 380,524 | |
| | 5,086 | | | Royal Bank of Canada | | | 348,257 | |
| | 7,340 | | | TELUS Corp. | | | 244,228 | |
| | | | | | | | |
| | | | | | | 1,615,492 | |
| | | | | | | | |
| | | | France – 4.9% | | | | |
| | 10,893 | | | AXA SA (a) | | | 290,627 | |
| | 4,480 | | | ICADE | | | 332,674 | |
| | 6,126 | | | SCOR SE (a) | | | 242,326 | |
| | 8,300 | | | TOTAL SA (a) | | | 426,066 | |
| | 1,566 | | | Unibail-Rodamco SE (a) | | | 384,519 | |
| | | | | | | | |
| | | | | | | 1,676,212 | |
| | | | | | | | |
| | | | Germany – 4.7% | | | | |
| | 7,842 | | | BASF SE (a) | | | 763,960 | |
| | 6,484 | | | Daimler AG (a) | | | 483,151 | |
| | 1,859 | | | Muenchener Rueckversicherungs- Gesellschaft AG in Muenchen (a) | | | 356,406 | |
| | | | | | | | |
| | | | | | | 1,603,517 | |
| | | | | | | | |
| | | | Ireland – 2.1% | | | | |
| | 2,779 | | | Accenture PLC, Class A | | | 337,093 | |
| | 4,454 | | | Medtronic PLC | | | 370,083 | |
| | | | | | | | |
| | | | | | | 707,176 | |
| | | | | | | | |
| | | | | | | | |
Shares | | | | | Market
Value | |
| | | | Japan – 1.6% | | | | |
| | 97,064 | | | Sojitz Corp. (a) | | $ | 246,764 | |
| | 2,600 | | | Tokyo Electron, Ltd. (a) | | | 315,623 | |
| | | | | | | | |
| | | | | | | 562,387 | |
| | | | | | | | |
| | | | Netherlands – 1.8% | | | | |
| | 11,683 | | | Unilever NV | | | 610,320 | |
| | | | | | | | |
| | | | New Zealand – 1.6% | | | | |
| | 212,055 | | | Spark New Zealand, Ltd. (a) | | | 537,399 | |
| | | | | | | | |
| | | | Norway – 0.7% | | | | |
| | 14,333 | | | Statoil ASA, Sponsored ADR | | | 235,491 | |
| | | | | | | | |
| | | | Singapore – 1.7% | | | | |
| | 2,623 | | | Broadcom, Ltd. | | | 579,185 | |
| | | | | | | | |
| | | | Spain – 2.8% | | | | |
| | 6,300 | | | Amadeus IT Group SA (a) | | | 340,007 | |
| | 28,671 | | | Ferrovial SA (a) | | | 609,907 | |
| | | | | | | | |
| | | | | | | 949,914 | |
| | | | | | | | |
| | | | Switzerland – 4.0% | | | | |
| | 2,461 | | | Chubb, Ltd. | | | 337,772 | |
| | 8,906 | | | Nestle SA (a) | | | 685,945 | |
| | 4,160 | | | Swiss Re AG (a) | | | 361,834 | |
| | | | | | | | |
| | | | | | | 1,385,551 | |
| | | | | | | | |
| | | | United Kingdom – 11.2% | | | | |
| | 5,437 | | | AstraZeneca PLC (a) | | | 325,620 | |
| | 22,391 | | | BAE Systems PLC (a) | | | 181,860 | |
| | 11,428 | | | British American Tobacco PLC, Sponsored ADR (b) | | | 777,561 | |
| | 14,092 | | | Imperial Brands PLC (a) | | | 690,134 | |
| | 39,909 | | | National Grid PLC (a) | | | 516,753 | |
| | 27,370 | | | Royal Dutch Shell PLC, Class A (a) | | | 710,758 | |
| | 17,147 | | | SSE PLC (a) | | | 308,893 | |
| | 12,650 | | | Vodafone Group PLC, Sponsored ADR | | | 331,304 | |
| | | | | | | | |
| | | | | | | 3,842,883 | |
| | | | | | | | |
| | | | United States – 52.1% | | | | |
| | 5,770 | | | AbbVie, Inc. | | | 380,474 | |
| | 2,037 | | | Air Products & Chemicals, Inc. | | | 286,199 | |
| | 6,810 | | | Altria Group, Inc. | | | 488,822 | |
| | 1,472 | | | Amgen, Inc. | | | 240,407 | |
| | 4,415 | | | Analog Devices, Inc. | | | 336,423 | |
| | 5,297 | | | Apple, Inc. | | | 760,914 | |
| | 12,538 | | | AT&T, Inc. | | | 496,881 | |
| | 3,253 | | | Automatic Data Processing, Inc. | | | 339,906 | |
| | 29,459 | | | Bank of America Corp. | | | 687,573 | |
| | 4,055 | | | Dr Pepper Snapple Group, Inc. | | | 371,641 | |
| | 3,266 | | | Duke Energy Corp. | | | 269,445 | |
| | 27,309 | | | Energy Transfer Equity LP | | | 509,586 | |
| | 8,906 | | | Enterprise Products Partners LP (b) | | | 243,312 | |
| | 12,111 | | | Great Plains Energy, Inc. | | | 358,364 | |
| | 5,359 | | | Illinois Tool Works, Inc. | | | 740,024 | |
| | 4,279 | | | Intel Corp. | | | 154,686 | |
| | 5,579 | | | Johnson & Johnson | | | 688,839 | |
| | 6,901 | | | JPMorgan Chase & Co. | | | 600,387 | |
| | 1,553 | | | Kimberly-Clark Corp. | | | 201,502 | |
The accompanying notes are an integral part of these financial statements.
AMG Funds
| | |
| AMG Managers Guardian Capital Global Dividend Fund | | April 30, 2017 |
| Schedule of Investments – continued | | |
| | | | | | | | |
Shares | | | | | Market
Value | |
| | | | United States (continued) | | | | |
| | 2,013 | | | Lockheed Martin Corp. | | $ | 542,403 | |
| | 2,525 | | | Macquarie Infrastructure Corp. | | | 205,459 | |
| | 3,265 | | | McDonald’s Corp. | | | 456,871 | |
| | 2,677 | | | Merck & Co., Inc. | | | 166,857 | |
| | 9,192 | | | Microsoft Corp. | | | 629,284 | |
| | 6,470 | | | ONEOK, Inc. (b) | | | 340,387 | |
| | 6,666 | | | Paychex, Inc. | | | 395,160 | |
| | 6,231 | | | Pfizer, Inc. | | | 211,356 | |
| | 6,875 | | | PPL Corp. | | | 262,006 | |
| | 3,199 | | | Raytheon Co. | | | 496,517 | |
| | 5,949 | | | Republic Services, Inc. | | | 374,728 | |
| | 7,259 | | | Reynolds American, Inc. | | | 468,206 | |
| | 9,805 | | | Six Flags Entertainment Corp. | | | 613,891 | |
| | 4,408 | | | Starbucks Corp. | | | 264,744 | |
| | 2,100 | | | Stryker Corp. | | | 286,377 | |
| | 6,617 | | | Targa Resources Corp. | | | 364,795 | |
| | 5,552 | | | Texas Instruments, Inc. | | | 439,607 | |
| | 7,188 | | | The Dow Chemical Co. | | | 451,406 | |
| | 1,839 | | | The Home Depot, Inc. | | | 287,068 | |
| | 1,937 | | | The Procter & Gamble Co. | | | 169,158 | |
| | 4,336 | | | The Walt Disney Co. | | | 501,242 | |
| | 7,910 | | | Verizon Communications, Inc. | | | 363,148 | |
| | 4,777 | | | Waste Management, Inc. | | | 347,670 | |
| | 14,190 | | | Wells Fargo & Co. | | | 763,990 | |
| | 4,408 | | | Xilinx, Inc. | | | 278,189 | |
| | | | | | | | |
| | | | | | | 17,835,904 | |
| | | | | | | | |
| | | | Total Common Stocks (Cost $30,788,160) | | | 33,402,015 | |
| | | | | | | | |
Principal
Amount | | | | | | |
| | SHORT TERM INVESTMENTS – 4.9% | |
| | | | Repurchase Agreements – 2.8% (c) | |
| | $967,374 | | | Cantor Fitzgerald Securities, Inc., dated 04/28/17, due 05/01/17, 0.840% total to be received $967,442 (collateralized by various U.S. Government Agency Obligations, 0.000% - 10.000%, 04/30/17 - 03/20/67, totaling $986,722) | | | 967,374 | |
| | | | | | | | |
| | | | Total Repurchase Agreements | | | 967,374 | |
| | | | | | | | |
Shares | | | | | | |
| | | | Other Investment Company – 2.1% | |
| | 723,863 | | | Dreyfus Government Cash Management Fund, Institutional Class Shares, 0.69%* | | | 723,863 | |
| | | | | | | | |
| | | | Total Short Term Investments (Cost $1,691,237) | | | 1,691,237 | |
| Total Investments – 102.5%
(Cost $32,479,397)** | | | 35,093,252 | |
| | | | | | | | |
| | Net Other Assets and Liabilities – (2.5)% | | | (864,988 | ) |
| | | | | | | | |
| | Net Assets – 100.0% | | $ | 34,228,264 | |
| | | | | |
| * | Yield shown represents the April 30, 2017, seven-day average yield, which refers to the sum of the previous seven days’ dividends paid, expressed as an annual percentage. |
| ** | At April 30, 2017, the aggregate cost for Federal income tax purposes approximates the aggregate cost for book purposes. |
The aggregate gross unrealized appreciation and depreciation were as follows:
| | | | |
Gross unrealized appreciation | | $ | 2,773,368 | |
Gross unrealized depreciation | | | (159,513 | ) |
| | | | |
Net unrealized appreciation | | $ | 2,613,855 | |
| | | | |
| (a) | Securities with a total aggregate market value of $9,268,764, or 27.1% of net assets, were valued under fair value procedures established by the Funds’ Board of Trustees. |
| (b) | Some or all of these securities were out on loan to various brokers as of April 30, 2017, amounting to $946,741, or 2.8% of net assets. |
| (c) | Collateral received from brokers for securities lending was invested in these joint repurchase agreements. |
| ADR | American Depositary Receipt |
The accompanying notes are an integral part of these financial statements.
AMG Funds
| | |
| AMG Managers Pictet International Fund | | April 30, 2017 |
| Schedule of Investments (unaudited) | | |

% of Net Assets
| | | | | | | | |
Shares | | | | | Market
Value | |
| | COMMON STOCKS – 97.0% | |
| | | | Australia – 3.2% | | | | |
| | 1,934,518 | | | Computershare, Ltd. (a) | | $ | 21,326,235 | |
| | 1,476,000 | | | Oil Search, Ltd. (a) | | | 7,964,414 | |
| | 4,366,149 | | | Primary Health Care, Ltd. (a) | | | 11,070,808 | |
| | 270,317 | | | REA Group, Ltd. (a) | | | 12,414,156 | |
| | | | | | | | |
| | | | | | | 52,775,613 | |
| | | | | | | | |
| | | | Belgium – 5.8% | | | | |
| | 499,315 | | | Ageas (a) | | | 20,444,909 | |
| | 465,960 | | | Anheuser-Busch InBev SA/NV (a) (c) | | | 52,546,524 | |
| | 645,443 | | | Ontex Group NV (a) | | | 21,535,298 | |
| | | | | | | | |
| | | | | | | 94,526,731 | |
| | | | | | | | |
| | | | Bermuda – 1.2% | | | | |
| | 479,200 | | | Jardine Strategic Holding, Ltd. (a) | | | 20,249,033 | |
| | | | | | | | |
| | | | Cayman Islands – 6.7% | | | | |
| | 2,667,248 | | | Cheung Kong Property Holdings, Ltd. (a) | | | 19,095,395 | |
| | 3,760,248 | | | CK Hutchison Holdings, Ltd. (a) | | | 46,955,298 | |
| | 721,513 | | | JD.com, Inc., ADR * | | | 25,303,461 | |
| | 8,563,200 | | | MGM China Holdings, Ltd. (a) | | | 19,479,462 | |
| | | | | | | | |
| | | | | | | 110,833,616 | |
| | | | | | | | |
| | | | Denmark – 1.9% | | | | |
| | 368,363 | | | DSV A/S (a) | | | 20,512,476 | |
| | 672,059 | | | Matas A/S (a) | | | 10,383,323 | |
| | | | | | | | |
| | | | | | | 30,895,799 | |
| | | | | | | | |
| | | | Finland – 2.1% | | | | |
| | 6,045,159 | | | Nokia OYJ (a) | | | 34,559,289 | |
| | | | | | | | |
| | | | | | | | |
Shares | | | | | Market
Value | |
| | | | France – 11.6% | | | | |
| | 6,031,878 | | | Bollore SA (a) | | $ | 24,543,315 | |
| | 23,921 | | | Bollore SA - New * (b) | | | 95,630 | |
| | 307,896 | | | Danone SA (a) | | | 21,548,408 | |
| | 1,326,554 | | | Elis SA (c) | | | 27,455,313 | |
| | 403,649 | | | Orpea (a) | | | 41,228,956 | |
| | 241,567 | | | Rubis SCA (a) | | | 24,541,243 | |
| | 453,559 | | | Vinci SA (a) | | | 38,660,758 | |
| | 637,704 | | | Vivendi SA (a) | | | 12,649,013 | |
| | | | | | | | |
| | | | | | | 190,722,636 | |
| | | | | | | | |
| | | | Germany – 1.2% | | | | |
| | 110,820 | | | Linde AG (a) | | | 19,913,111 | |
| | | | | | | | |
| | | | Hong Kong – 1.3% | | | | |
| | 37,064,309 | | | PCCW, Ltd. (a) | | | 20,925,559 | |
| | | | | | | | |
| | | | Israel – 1.5% | | | | |
| | 96,051 | | | Mizrahi Tefahot Bank, Ltd. (a) | | | 1,549,443 | |
| | 716,952 | | | Teva Pharmaceutical Industries, Ltd., Sponsored ADR | | | 22,641,344 | |
| | | | | | | | |
| | | | | | | 24,190,787 | |
| | | | | | | | |
| | | | Italy – 1.5% | | | | |
| | 2,695,186 | | | Banca Popolare dell’Emilia Romagna SC (a) (c) | | | 14,744,484 | |
| | 956,492 | | | Cerved Information Solutions SpA (a) | | | 10,211,723 | |
| | | | | | | | |
| | | | | | | 24,956,207 | |
| | | | | | | | |
| | | | Japan – 19.7% | | | | |
| | 350,600 | | | ABC-Mart, Inc. (a) | | | 19,489,740 | |
| | 653,400 | | | Asahi Group Holdings, Ltd. (a) | | | 24,687,879 | |
| | 710,400 | | | Bandai Namco Holdings, Inc. (a) | | | 22,297,037 | |
| | 232,300 | | | cocokara fine, Inc. (a) | | | 10,983,062 | |
| | 534,100 | | | CyberAgent, Inc. (a) | | | 16,594,394 | |
| | 746,100 | | | Fujitec Co., Ltd. (a) | | | 8,842,143 | |
| | 402,300 | | | Hoya Corp. (a) | | | 19,227,039 | |
| | 1,663,000 | | | Inpex Corp. (a) | | | 15,935,581 | |
| | 1,392,200 | | | Japan Tobacco, Inc. (a) | | | 46,326,528 | |
| | 293,600 | | | Miraca Holdings, Inc. (a) | | | 13,536,761 | |
| | 850,400 | | | NGK Spark Plug Co., Ltd. (a) | | | 18,442,967 | |
| | 1,537,000 | | | Rakuten, Inc. (a) | | | 15,745,110 | |
| | 409,400 | | | SoftBank Group Corp. (a) | | | 31,054,104 | |
| | 238,100 | | | Sohgo Security Services Co., Ltd (a) | | | 10,395,044 | |
| | 816,300 | | | Sompo Holdings, Inc. (a) | | | 30,848,400 | |
| | 572,400 | | | Sony Corp. (a) | | | 19,641,530 | |
| | | | | | | | |
| | | | | | | 324,047,319 | |
| | | | | | | | |
| | | | Luxembourg – 1.6% | | | | |
| | 481,185 | | | Millicom International Cellular SA, SDR (a) | | | 26,365,243 | |
| | | | | | | | |
| | | | Netherlands – 5.0% | | | | |
| | 243,105 | | | ASML Holding NV (a) (c) | | | 32,145,628 | |
| | 206,476 | | | Koninklijke DSM NV (a) | | | 14,775,071 | |
| | 1,312,920 | | | Royal Dutch Shell PLC, | | | | |
| | | | Class B (a) | | | 34,932,902 | |
| | | | | | | | |
| | | | | | | 81,853,601 | |
| | | | | | | | |
The accompanying notes are an integral part of these financial statements.
AMG Funds
| | |
| AMG Managers Pictet International Fund | | April 30, 2017 |
| Schedule of Investments – continued | | |
| | | | | | | | |
Shares | | | | | Market
Value | |
| | | | South Korea – 1.8% | | | | |
| | 153,719 | | | Hyundai Mobis (a) | | $ | 29,978,388 | |
| | | | | | | | |
| | | | Spain – 7.0% | | | | |
| | 5,740,506 | | | Banco Bilbao Vizcaya Argentaria SA (a) | | | 45,990,800 | |
| | 2,603,931 | | | Gestamp Automocion SA * | | | 15,799,106 | |
| | 1,146,632 | | | Grifols SA, ADR | | | 24,893,381 | |
| | 1,402,163 | | | Merlin Properties Socimi SA (a) | | | 16,581,316 | |
| | 2,530,820 | | | Obrascon Huarte Lain SA (a) | | | 11,047,059 | |
| | | | | | | | |
| | | | | | | 114,311,662 | |
| | | | | | | | |
| | | | Sweden – 1.3% | | | | |
| | 1,764,204 | | | Com Hem Holding AB | | | 21,969,641 | |
| | | | | | | | |
| | | | Switzerland – 5.0% | | | | |
| | 291,254 | | | Cie Financiere Richemont SA (a) | | | 24,336,754 | |
| | 512,166 | | | Nestle SA (a) | | | 39,447,286 | |
| | 1,025,654 | | | UBS Group AG (a) | | | 17,508,777 | |
| | | | | | | | |
| | | | | | | 81,292,817 | |
| | | | | | | | |
| | | | United Kingdom – 17.6% | | | | |
| | 8,483,823 | | | BBA Aviation PLC (a) | | | 34,224,022 | |
| | 499,671 | | | Dignity PLC | | | 16,134,077 | |
| | 1,691,496 | | | EI Group PLC * (a) | | | 3,063,803 | |
| | 2,450,385 | | | GlaxoSmithKline PLC (a) | | | 49,321,120 | |
| | 2,880,868 | | | Informa PLC (a) | | | 23,953,549 | |
| | 4,258,054 | | | Inmarsat PLC (a) | | | 45,032,831 | |
| | 508,694 | | | LivaNova PLC * (a) | | | 26,808,174 | |
| | 1,239,743 | | | Petrofac, Ltd. (a) | | | 13,065,711 | |
| | 1,057,541 | | | Prudential PLC (a) | | | 23,470,966 | |
| | 23,610 | | | Royal Dutch Shell PLC, Class A (a) | | | 613,116 | |
| | 2,824,995 | | | Saga PLC (a) | | | 7,668,309 | |
| | 3,100,717 | | | Standard Chartered PLC * (a) | | | 28,977,507 | |
| | 4,462,350 | | | William Hill PLC (a) | | | 16,954,485 | |
| | | | | | | | |
| | | | | | | 289,287,670 | |
| | | | | | | | |
| | | | Total Common Stocks (Cost $1,425,241,966) | | | 1,593,654,722 | |
| | | | | | | | |
Principal Amount | | | | | | |
| | SHORT TERM INVESTMENTS – 6.4% | |
| | | | Repurchase Agreements – 4.0% (d) | |
| | $15,613,259 | | | Cantor Fitzgerald Securities, Inc., dated 04/28/17, due 05/01/17, 0.840% total to be received $15,614,352 (collateralized by various U.S. Government Agency Obligations, 0.000% - 10.000%, 04/30/17 - 03/20/67, totaling $15,925,526) | | | 15,613,259 | |
| | 3,285,510 | | | Citibank N.A. dated 04/28/17, due 05/01/17, 0.800% total to be received $3,285,729 (collateralized by various U.S. Government Agency Obligations, 0.000% - 8.875%, 04/30/17 - 09/09/49, totaling $3,351,221) | | | 3,285,510 | |
| | | | | | | | |
Principal
Amount | | | | | Market
Value | |
| | | | Repurchase Agreements (continued) | |
| | $15,613,259 | | | Daiwa Capital Markets America, dated 04/28/17, due 05/01/17, 0.850% total to be received $15,614,365 (collateralized by various U.S. Government Agency Obligations, 0.000% - 6.500%, 05/18/17 - 12/01/51, totaling $15,925,524) | | $ | 15,613,259 | |
| | 15,613,259 | | | HSBC Securities USA, Inc., dated 04/28/17, due 05/01/17, 0.780% total to be received $15,614,274 (collateralized by various U.S. Government Agency Obligations, 0.000%, 08/15/27 - 08/15/40, totaling $15,925,549) | | | 15,613,259 | |
| | 15,613,259 | | | Nomura Securities International, Inc., dated 04/28/17, due 05/01/17, 0.830% total to be received $15,614,339 (collateralized by various U.S. Government Agency Obligations, 1.950% - 9.000%, 06/01/18 - 03/20/67, totaling $15,925,524) | | | 15,613,259 | |
| | | | | | | | |
| | | | Total Repurchase Agreements | | | 65,738,546 | |
| | | | | | | | |
| | | | Other Investment Company – 2.4% | |
| | 39,570,522 | | | Dreyfus Government Cash Management Fund, Institutional Class Shares, 0.69%** | | | 39,570,522 | |
| | | | | | | | |
| | | | Total Short Term Investments (Cost $105,309,068) | | | 105,309,068 | |
| | | | | | | | |
| Total Investments – 103.4%
(Cost $1,530,551,034)*** | | | 1,698,963,790 | |
| | | | | | | | |
| Net Other Assets and
Liabilities – (3.4)% | | | (55,742,129 | ) |
| | | | | | | | |
| | Net Assets – 100.0% | | $ | 1,643,221,661 | |
| | | | | |
| * | Non-income producing security. |
| ** | Yield shown represents the April 30, 2017, seven-day average yield, which refers to the sum of the previous seven days’ dividends paid, expressed as an annual percentage. |
| *** | At April 30, 2017, the aggregate cost for Federal income tax purposes approximates the aggregate cost for book purposes. |
The aggregate gross unrealized appreciation and depreciation were as follows:
| | | | |
Gross unrealized appreciation | | $ | 199,060,393 | |
Gross unrealized depreciation | | | (30,647,637 | ) |
| | | | |
Net unrealized appreciation | | $ | 168,412,756 | |
| | | | |
| (a) | Securities with a total aggregate market value of $1,439,362,769, or 87.6% of net assets, were valued under fair value procedures established by the Funds’ Board of Trustees. |
The accompanying notes are an integral part of these financial statements.
AMG Funds
| | |
| AMG Managers Pictet International Fund | | April 30, 2017 |
| Schedule of Investments – continued | | |
| (b) | These securities have been determined to be illiquid securities. At April 30, 2017, these securities amounted to $95,630, or less than 0.1% of net assets. |
| (c) | Some or all of these securities were out on loan to various brokers as of April 30, 2017, amounting to $62,702,224, or 3.8% of net assets. |
| (d) | Collateral received from brokers for securities lending was invested in these joint repurchase agreements. |
| ADR | American Depositary Receipt |
| SDR | Sponsored Depositary Receipt |
The accompanying notes are an integral part of these financial statements.
AMG Funds
| | |
| AMG Managers Value Partners Asia Dividend Fund | | April 30, 2017 |
| Schedule of Investments (unaudited) | | |
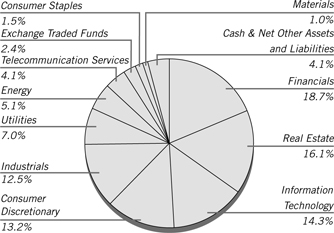
% of Net Assets
| | | | | | | | |
Shares | | | | | Market
Value | |
| | COMMON STOCKS – 81.5% | | | | |
| | | | China – 37.9% | | | | |
| | 46,000 | | | Agricultural Bank of China, Ltd., Class H (a) | | $ | 21,206 | |
| | 121,000 | | | Belle International Holdings, Ltd. | | | 98,003 | |
| | 26,000 | | | China Communications Construction Co., Ltd., Class H (a) | | | 35,700 | |
| | 493,000 | | | China Construction Bank Corp., Class H (a) | | | 400,150 | |
| | 44,000 | | | China Jinjiang Environment Holding Co., Ltd., Class H | | | 28,658 | |
| | 19,000 | | | China Life Insurance Co., Ltd., Class H (a) | | | 57,803 | |
| | 134,000 | | | China Lilang, Ltd. (a) | | | 84,296 | |
| | 63,000 | | | China Machinery Engineering Corp., Class H (a) | | | 46,960 | |
| | 60,000 | | | China Overseas Land & Investment, Ltd. (a) | | | 174,035 | |
| | 238,000 | | | China Power International Development, Ltd. (a) | | | 88,662 | |
| | 86,000 | | | China Resources Power Holdings Co., Ltd. (a) | | | 154,836 | |
| | 154,000 | | | China Sanjiang Fine Chemicals Co., Ltd. (a) | | | 49,984 | |
| | 94,000 | | | China State Construction International Holdings, Ltd. (a) | | | 170,335 | |
| | 87,963 | | | Chongqing Changan Automobile Co., Ltd., Class B (a) | | | 116,464 | |
| | 65,000 | | | Chongqing Rural Commerical Bank Co., Ltd., Class H (a) | | | 44,641 | |
| | 280,000 | | | CIFI Holdings Group Co., Ltd. (a) | | | 101,088 | |
| | 292,625 | | | Far East Consortium International, Ltd. (a) | | | 139,510 | |
| | 22,000 | | | Haitian International Holdings, Ltd. (a) | | | 53,874 | |
| | 114,000 | | | Hopefluent Group Holdings, Ltd. (a) | | | 34,415 | |
| | 66,500 | | | Intime Retail Group Co., Ltd. (a) | | | 84,128 | |
| | 386,000 | | | Jiangnan Group, Ltd. (a) | | | 49,585 | |
| | 188,000 | | | Longfor Properties Co., Ltd. (a) | | | 325,302 | |
| | 418,000 | | | PetroChina Co., Ltd., Class H (a) | | | 293,679 | |
| | | | | | | | |
Shares | | | | | Market
Value | |
| | | | China (continued) | | | | |
| | 32,500 | | | Ping An Ping An Insurance Group Co. of China Ltd., Class H (a) | | $ | 182,723 | |
| | 202,000 | | | Qingdao Port International Co., Ltd., Class H (a) | | | 107,535 | |
| | 164,000 | | | SITC International Holdings Co., Ltd. (a) | | | 117,477 | |
| | 106,000 | | | Springland International Holdings, Ltd. | | | 19,079 | |
| | 78,800 | | | Xinjiang Goldwind Science & Technology Co., Ltd., Class H (a) | | | 114,718 | |
| | 57,000 | | | Xtep International Holdings, Ltd. (a) | | | 22,699 | |
| | 68,500 | | | Yangtze Optical Fibre and Cable Joint Stock Co., Ltd., Class H (a) | | | 143,106 | |
| | 37,500 | | | Yangzijiang Shipbuilding Holdings, Ltd. (a) | | | 30,812 | |
| | 513 | | | ZTO Express Cayman, Inc., ADR * (b) | | | 7,146 | |
| | | | | | | | |
| | | | | | | 3,398,609 | |
| | | | | | | | |
| | | | Hong Kong – 13.6% | | | | |
| | 29,000 | | | BOC Hong Kong Holdings, Ltd. (a) | | | 119,177 | |
| | 12,500 | | | Cheung Kong Property Holdings, Ltd. (a) | | | 89,490 | |
| | 5,000 | | | Chow Sang Sang Holdings International, Ltd. (a) | | | 12,779 | |
| | 9,500 | | | CK Hutchison Holdings, Ltd. (a) | | | 118,629 | |
| | 60,000 | | | Convenience Retail Asia, Ltd. | | | 34,326 | |
| | 1,170,000 | | | CSI Properties, Ltd. (a) | | | 61,628 | |
| | 74,000 | | | EGL Holdings Co., Ltd. (a) | | | 13,021 | |
| | 188,000 | | | Far East Horizon, Ltd. (a) | | | 172,939 | |
| | 159,000 | | | FSE Engineering Holdings, Ltd. | | | 49,877 | |
| | 49,000 | | | Hui Xian Real Estate Investment Trust, REIT (a) | | | 21,940 | |
| | 170,000 | | | Hutchison Telecommunications Hong Kong Holdings, Ltd. (a) | | | 50,240 | |
| | 76,000 | | | Lee & Man Chemical Co., Ltd. | | | 37,129 | |
| | 184,000 | | | Nameson Holdings, Ltd. (a) | | | 37,806 | |
| | 227,049 | | | Oi Wah Pawnshop Credit Holdings, Ltd. (a) | | | 13,281 | |
| | 52,000 | | | Shimao Property Holdings, Ltd. (a) | | | 83,461 | |
| | 249,434 | | | Skyworth Digital Holdings, Ltd. (a) | | | 144,733 | |
| | 48,500 | | | SmarTone Telecommunications Holdings, Ltd. (a) | | | 67,923 | |
| | 144,000 | | | TK Group Holdings, Ltd. (a) | | | 48,111 | |
| | 160,000 | | | Wonderful Sky Financial Group Holdings, Ltd. (a) | | | 43,561 | |
| | | | | | | | |
| | | | | | | 1,220,051 | |
| | | | | | | | |
| | | | Indonesia – 4.8% | | | | |
| | 130,000 | | | Adhi Karya Persero (a) | | | 22,003 | |
| | 36,800 | | | Bank Negara Indonesia Persero (a) | | | 17,572 | |
| | 430,400 | | | Bank Pan Indonesia * (a) | | | 29,521 | |
| | 27,200 | | | Bank Rakyat Indonesia Persero (a) | | | 26,273 | |
| | 1,233,300 | | | Bekasi Fajar Industrial Estate (a) | | | 27,342 | |
| | 117,400 | | | Indosat * | | | 63,196 | |
| | 76,900 | | | Link Net | | | 31,155 | |
| | 265,700 | | | Media Nusantara Citra (a) | | | 36,343 | |
| | 851,300 | | | Metropolitan Land | | | 20,821 | |
| | 2,704,500 | | | Panin Financial * (a) | | | 47,421 | |
| | 279,100 | | | Perusahaan Gas Negara Persero (a) | | | 50,755 | |
The accompanying notes are an integral part of these financial statements.
AMG Funds
| | |
| AMG Managers Value Partners Asia Dividend Fund | | April 30, 2017 |
| Schedule of Investments – continued | | |
| | | | | | | | |
Shares | | | | | Market
Value | |
| | | | Indonesia (continued) | | | | |
| | 285,100 | | | Total Bangun Persada | | $ | 16,898 | |
| | 156,100 | | | XL Axiata * (a) | | | 37,538 | |
| | | | | | | | |
| | | | | | | 426,838 | |
| | | | | | | | |
| | | | Malaysia – 2.3% | | | | |
| | 36,500 | | | CB Industrial Product Holding Bhd (a) | | | 17,316 | |
| | 29,116 | | | CIMB Group Holdings (a) | | | 38,477 | |
| | 134,500 | | | Mah Sing Group | | | 46,166 | |
| | 23,100 | | | Tenaga Nasional (a) | | | 74,166 | |
| | 50,600 | | | UOA Development | | | 31,239 | |
| | | | | | | | |
| | | | | | | 207,364 | |
| | | | | | | | |
| | | | Philippines – 0.5% | | | | |
| | 51,200 | | | EEI Corp. | | | 10,350 | |
| | 22,570 | | | Metropolitan Bank & Trust Co. (a) | | | 38,130 | |
| | | | | | | | |
| | | | | | | 48,480 | |
| | | | | | | | |
| | | | Singapore – 3.8% | | | | |
| | 40,800 | | | AIMS AMP Capital Industrial, REIT | | | 40,737 | |
| | 62,900 | | | Asian Pay Television Trust | | | 23,185 | |
| | 38,639 | | | CapitaLand Retail China Trust, REIT | | | 43,972 | |
| | 64,082 | | | Croesus Retail Trust, REIT | | | 44,720 | |
| | 7,278 | | | DBS Group Holdings, Ltd. (a) | | | 100,512 | |
| | 103,700 | | | Ezion Holdings, Ltd. * (a) | | | 22,208 | |
| | 259,300 | | | IPS Securex Holdings, Ltd. | | | 25,426 | |
| | 77,300 | | | Viva Industrial Trust, REIT | | | 45,092 | |
| | | | | | | | |
| | | | | | | 345,852 | |
| | | | | | | | |
| | | | South Korea – 9.7% | | | | |
| | 1,205 | | | Amotech Co., Ltd. * (a) | | | 25,578 | |
| | 96 | | | E-Mart, Inc. (a) | | | 19,391 | |
| | 484 | | | Fila Korea, Ltd. (a) | | | 29,513 | |
| | 2,354 | | | KB Financial Group, Inc. (a) | | | 103,476 | |
| | 5,739 | | | Korea Electric Power Corp. (a) | | | 228,758 | |
| | 8,856 | | | LG Uplus Corp. (a) | | | 112,528 | |
| | 7,330 | | | Macquarie Korea Infrastructure Fund | | | 55,592 | |
| | 908 | | | Maeil Dairy Industry Co., Ltd. (a) | | | 43,116 | |
| | 314 | | | S-1 Corp. (a) | | | 26,924 | |
| | 81 | | | Samsung Electronics Co., Ltd. (a) | | | 158,795 | |
| | 1,693 | | | Sekonix Co., Ltd. (a) | | | 26,246 | |
| | 818 | | | SK Hynix, Inc. (a) | | | 38,751 | |
| | | | | | | | |
| | | | | | | 868,668 | |
| | | | | | | | |
| | | | Taiwan – 6.9% | | | | |
| | 11,343 | | | Advanced Semiconductor | | | | |
| | | | Engineering, Inc. (a) | | | 14,216 | |
| | 22,000 | | | Basso Industry Corp. (a) | | | 62,689 | |
| | 86,000 | | | CTBC Financial Holding Co., Ltd. (a) | | | 53,704 | |
| | 13,000 | | | FLEXium Interconnect, Inc. (a) | | | 48,243 | |
| | 28,000 | | | Fubon Financial Holding Co., Ltd. (a) | | | 43,832 | |
| | 22,000 | | | Kerry TJ Logistics Co., Ltd. (a) | | | 30,358 | |
| | 51,000 | | | King Yuan Electronics Co., Ltd. (a) | | | 46,039 | |
| | 500 | | | Largan Precision Co., Ltd. (a) | | | 83,035 | |
| | 5,000 | | | MediaTek, Inc. (a) | | | 35,941 | |
| | 33,000 | | | Taiwan Sakura Corp. (a) | | | 38,348 | |
| | | | | | | | |
Shares | | | | | Market
Value | |
| | | | Taiwan (continued) | | | | |
| | 25,000 | | | Taiwan Semiconductor Manufacturing Co., Ltd. (a) | | $ | 161,047 | |
| | | | | | | | |
| | | | | | | 617,452 | |
| | | | | | | | |
| | | | Thailand – 1.4% | | | | |
| | 210,000 | | | AP Thailand PCL | | | 48,193 | |
| | 700 | | | Kang Yong Electric PCL | | | 10,961 | |
| | 95,200 | | | Supalai PCL | | | 67,651 | |
| | | | | | | | |
| | | | | | | 126,805 | |
| | | | | | | | |
| | | | United States – 0.6% | | | | |
| | 1,551 | | | Yum China Holdings, Inc. * | | | 52,920 | |
| | | | | | | | |
| | | | Total Common Stocks (Cost $6,717,576) | | | 7,313,039 | |
| | | | | | | | |
| | PREFERRED STOCK – 7.5% | | | | |
| | | | South Korea – 7.5% | | | | |
| | 710 | | | Amorepacific Group | | | 37,625 | |
| | 1,294 | | | LG Corp. | | | 44,976 | |
| | 311 | | | Samsung Electronics Co., Ltd. (a) | | | 478,917 | |
| | 704 | | | Samsung Fire & Marine Insurance Co., Ltd. | | | 111,054 | |
| | | | | | | | |
| | | | Total Preferred Stock (Cost $534,319) | | | 672,572 | |
| | | | | | | | |
| | PARTICIPATION NOTES – 0.5% | | | | |
| | | | China – 0.5% | | | | |
| | 15,600 | | | Huayu Automotive Systems Co., Ltd. | | | 42,469 | |
| | | | | | | | |
| | | | Total Participation Notes (Cost $38,039) | | | 42,469 | |
| | | | | | | | |
| | WARRANTS – 2.4% | | | | |
| | | | China – 2.4% | | | | |
| | 10,350 | | | Midea Group Co., Ltd., Expiring 05/08/18 (HSBC Bank) | | | 50,505 | |
| | 33,500 | | | Midea Group Co., Ltd., Expiring 09/23/23 (HSBC Bank) | | | 163,470 | |
| | | | | | | | |
| | | | | | | 213,975 | |
| | | | | | | | |
| | | | Singapore – 0.00%# | | | | |
| | 18,520 | | | Ezion Holdings, Ltd., Expiring 04/24/20 * | | | 822 | |
| | | | | | | | |
| | | | Total Warrants (Cost $142,767) | | | 214,797 | |
| | | | | | | | |
| | EXCHANGE TRADED FUND – 2.4% | | | | |
| | | | United States – 2.4% | | | | |
| | 6,800 | | | iShares MSCI India | | | 218,144 | |
| | | | | | | | |
| | | | Total Exchange Traded Fund (Cost $189,834) | | | 218,144 | |
| | | | | | | | |
The accompanying notes are an integral part of these financial statements.
AMG Funds
| | |
| AMG Managers Value Partners Asia Dividend Fund | | April 30, 2017 |
| Schedule of Investments – continued | | |
| | | | | | | | |
Principal Amount | | | | | Market
Value | |
| | CORPORATE NOTES AND BONDS – 1.6% | |
| | | | Singapore – 1.6% | | | | |
| | $250,000 | | | Ezion Holdings, Ltd. | | $ | 141,104 | |
| | | | | | | | |
| | | | Total Corporate Notes and Bonds
(Cost $151,398) | | | 141,104 | |
| | | | | | | | |
| | SHORT TERM INVESTMENTS – 2.0% | |
| | | | Repurchase Agreements – 0.1% (c) | |
| | 5,378 | | | Nomura Securities International, Inc., dated 04/28/17, due 05/01/17, 0.800% total to be received $5,378 (collateralized by various U.S. Government Agency Obligations, 1.950% - 9.000%, 06/01/18 - 03/20/67, totaling $5,486) | | | 5,378 | |
| | | | | | | | |
Shares | | | | | | |
| | | | Other Investment Company – 1.9% | |
| | 178,204 | | | Dreyfus Government Cash Management Fund, Institutional Class Shares, 0.69%** | | | 178,204 | |
| | | | | | | | |
| | | | Total Short Term Investments (Cost $183,582) | | | 183,582 | |
| | | | | | | | |
| | | | Total Investments – 97.9% (Cost $7,957,515)*** | | | 8,785,707 | |
| | | | | | | | |
| | Net Other Assets and Liabilities – 2.1% | | | 191,752 | |
| | | | | | | | |
| | Net Assets – 100.0% | | $ | 8,977,459 | |
| | | | | |
| * | Non-income producing security. |
| ** | Yield shown represents the April 30, 2017, seven-day average yield, which refers to the sum of the previous seven days’ dividends paid, expressed as an annual percentage. |
| *** | At April 30, 2017, the aggregate cost for Federal income tax purposes approximates the aggregate cost for book purposes. |
The aggregate gross unrealized appreciation and depreciation were as follows:
| | | | |
Gross unrealized appreciation | | $ | 1,138,306 | |
Gross unrealized depreciation | | | (310,114 | ) |
| | | | |
Net unrealized appreciation | | $ | 828,192 | |
| | | | |
| (a) | Securities with a total aggregate market value of $6,839,464, or 76.2% of net assets, were valued under fair value procedures established by the Funds’ Board of Trustees. |
| (b) | Some or all of these securities were out on loan to various brokers as of April 30, 2017, amounting to $5,349, or 0.1% of net assets. |
| (c) | Collateral received from brokers for securities lending was invested in these joint repurchase agreements. |
| ADR | American Depository Receipt |
| MSCI | Morgan Stanley Capital International |
| PCL | Public Company Limited |
| REIT | Real Estate Investment Trust |
The accompanying notes are an integral part of these financial statements.
AMG Funds
| | |
| AMG Managers Montag & Caldwell Balanced Fund | | April 30, 2017 |
| Schedule of Investments (unaudited) | | |
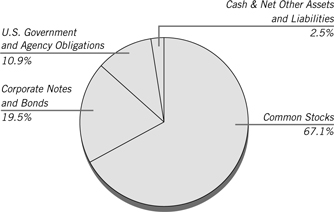
% of Net Assets
| | | | | | | | |
Shares | | | | | Market
Value | |
| | COMMON STOCKS – 67.1% | | | | |
| | | | Consumer Discretionary – 8.4% | | | | |
| | 5,700 | | | Dollar Tree, Inc. * | | $ | 471,789 | |
| | 8,100 | | | Starbucks Corp. | | | 486,486 | |
| | 345 | | | The Priceline Group, Inc. * | | | 637,153 | |
| | 4,900 | | | The TJX Cos, Inc. | | | 385,336 | |
| | | | | | | | |
| | | | | | | 1,980,764 | |
| | | | | | | | |
| | | | Consumer Staples – 18.7% | | | | |
| | 866 | | | Costco Wholesale Corp. | | | 153,732 | |
| | 10,200 | | | Mondelez International, Inc., Class A | | | 459,306 | |
| | 10,000 | | | Monster Beverage Corp. * | | | 453,800 | |
| | 5,000 | | | PepsiCo, Inc. | | | 566,400 | |
| | 5,500 | | | Philip Morris International, Inc. | | | 609,620 | |
| | 7,100 | | | The Coca-Cola Co. | | | 306,365 | |
| | 5,550 | | | The Estee Lauder Cos, Inc., Class A | | | 483,627 | |
| | 6,100 | | | The Kraft Heinz Co. | | | 551,379 | |
| | 5,100 | | | The Procter & Gamble Co. | | | 445,383 | |
| | 4,400 | | | Walgreens Boots Alliance, Inc. | | | 380,776 | |
| | | | | | | | |
| | | | | | | 4,410,388 | |
| | | | | | | | |
| | | | Financials – 4.6% | | | | |
| | 7,330 | | | Intercontinental Exchange, Inc. | | | 441,266 | |
| | 3,400 | | | S&P Global, Inc. | | | 456,246 | |
| | 4,600 | | | The Charles Schwab Corp. | | | 178,710 | |
| | | | | | | | |
| | | | | | | 1,076,222 | |
| | | | | | | | |
| | | | Healthcare – 13.4% | | | | |
| | 1,712 | | | Becton Dickinson & Co. | | | 320,093 | |
| | 3,800 | | | Celgene Corp. * | | | 471,390 | |
| | 4,600 | | | Danaher Corp. | | | 383,318 | |
| | 4,800 | | | Edwards Lifesciences Corp. * | | | 526,416 | |
| | 3,800 | | | Medtronic PLC (Ireland) | | | 315,742 | |
| | 3,114 | | | Thermo Fisher Scientific, Inc. | | | 514,838 | |
| | 3,590 | | | UnitedHealth Group, Inc. | | | 627,819 | |
| | | | | | | | |
| | | | | | | 3,159,616 | |
| | | | | | | | |
| | | | Industrials – 3.0% | | | | |
| | 6,400 | | | Fastenal Co. | | | 285,952 | |
| | 3,300 | | | Honeywell International, Inc. | | | 432,762 | |
| | | | | | | | |
| | | | | | | 718,714 | |
| | | | | | | | |
| | | | | | | | |
Shares | | | | | Market
Value | |
| | | | Information Technology – 18.5% | | | | |
| | 708 | | | Alphabet, Inc., Class A * | | $ | 654,560 | |
| | 4,000 | | | Apple, Inc. | | | 574,600 | |
| | 5,100 | | | Facebook, Inc., Class A * | | | 766,275 | |
| | 3,700 | | | Fidelity National Information Services, Inc. | | | 311,503 | |
| | 718 | | | FleetCor Technologies, Inc. * | | | 101,339 | |
| | 2,700 | | | MasterCard, Inc., Class A | | | 314,064 | |
| | 11,200 | | | Microsoft Corp. | | | 766,752 | |
| | 6,700 | | | Oracle Corp. | | | 301,232 | |
| | 6,500 | | | Visa, Inc., Class A | | | 592,930 | |
| | | | | | | | |
| | | | | | | 4,383,255 | |
| | | | | | | | |
| | | | Materials – 0.5% | | | | |
| | 800 | | | Air Products & Chemicals, Inc. | | | 112,400 | |
| | | | | | | | |
| | | | Total Common Stocks
(Cost $14,143,124) | | | 15,841,359 | |
| | | | | | | | |
Principal
Amount | | | | | | |
| | CORPORATE NOTES AND BONDS – 19.5% | |
| | | | Consumer Staples – 2.2% | | | | |
| | $250,000 | | | PepsiCo, Inc. Senior Unsecured Notes 5.000%, 06/01/18 | | | 259,639 | |
| | 250,000 | | | Wal-Mart Stores, Inc. Senior Unsecured Notes 3.250%, 10/25/20 | | | 262,355 | |
| | | | | | | | |
| | | | | | | 521,994 | |
| | | | | | | | |
| | | | Energy – 1.3% | | | | |
| | 300,000 | | | Chevron Corp. Senior Unsecured Notes 1.718%, 06/24/18 | | | 301,065 | |
| | | | | | | | |
| | | | Financials – 6.8% | | | | |
| | 225,000 | | | Berkshire Hathaway, Inc. Senior Unsecured Notes 3.125%, 03/15/26 | | | 227,173 | |
| | 200,000 | | | General Electric Co. Senior Unsecured Notes, MTN 4.375%, 09/16/20 | | | 215,296 | |
| | 275,000 | | | JPMorgan Chase & Co. Senior Unsecured Notes 4.350%, 08/15/21 | | | 295,232 | |
| | 300,000 | | | State Street Corp. Senior Unsecured Notes 2.550%, 08/18/20 | | | 306,192 | |
| | 250,000 | | | US Bancorp Subordinated Notes, MTN 2.950%, 07/15/22 | | | 253,880 | |
| | 300,000 | | | Wells Fargo & Co. Senior Unsecured Notes, MTN 2.150%, 01/30/20 | | | 301,092 | |
| | | | | | | | |
| | | | | | | 1,598,865 | |
| | | | | | | | |
The accompanying notes are an integral part of these financial statements.
AMG Funds
| | |
| AMG Managers Montag & Caldwell Balanced Fund | | April 30, 2017 |
| Schedule of Investments – continued | | |
| | | | | | | | |
Principal Amount | | | | | Market
Value | |
| | | | Healthcare – 2.7% | | | | |
| | $150,000 | | | Johnson & Johnson Senior Unsecured Notes 5.950%, 08/15/37 | | $ | 198,439 | |
| | 250,000 | | | Merck & Co., Inc. Senior Unsecured Notes 2.350%, 02/10/22 | | | 252,477 | |
| | 200,000 | | | Pfizer, Inc. Senior Unsecured Notes 1.100%, 05/15/17 | | | 200,008 | |
| | | | | | | | |
| | | | | | | 650,924 | |
| | | | | | | | |
| | | | Industrials – 1.3% | | | | |
| | 300,000 | | | United Parcel Service, Inc. Senior Unsecured Notes 3.125%, 01/15/21 | | | 311,184 | |
| | | | | | | | |
| | | | Information Technology – 5.2% | |
| | 300,000 | | | Alphabet, Inc. Senior Unsecured Notes 3.625%, 05/19/21 | | | 319,712 | |
| | 300,000 | | | Apple, Inc. Senior Unsecured Notes 1.000%, 05/03/18 | | | 299,312 | |
| | 300,000 | | | Oracle Corp. Senior Unsecured Notes 2.500%, 10/15/22 | | | 301,121 | |
| | 300,000 | | | QUALCOMM, Inc. Senior Unsecured Notes 2.250%, 05/20/20 | | | 302,053 | |
| | | | | | | | |
| | | | | | | 1,222,198 | |
| | | | | | | | |
| | | | Total Corporate Notes and Bonds | | | | |
| | | | (Cost $4,604,424) | | | 4,606,230 | |
| | | | | | | | |
| U.S. GOVERNMENT AND AGENCY
OBLIGATIONS – 10.9% | | | | |
| | | | Fannie Mae – 0.1% | | | | |
| | 7,771 | | | 7.500%, 02/01/35 Pool # 787557 | | | 8,454 | |
| | 2,701 | | | 7.500%, 04/01/35 Pool # 819231 | | | 2,834 | |
| | 9,833 | | | 6.000%, 11/01/35 Pool # 844078 | | | 11,145 | |
| | | | | | | | |
| | | | | | | 22,433 | |
| | | | | | | | |
| | | | Freddie Mac – 1.2% | | | | |
| | 275,000 | | | 1.000%, 09/29/17 | | | 275,013 | |
| | 3,606 | | | 5.500%, 12/01/20 Gold Pool # G11820 | | | 3,773 | |
| | | | | | | | |
| | | | | | | 278,786 | |
| | | | | | | | |
| | | | Ginnie Mae – 0.00%# | | | | |
| | 3,242 | | | 5.500%, 02/15/39 Pool # 698060 | | | 3,627 | |
| | | | | | | | |
| | | | U.S. Treasury Bonds – 4.5% | | | | |
| | 200,000 | | | 5.375%, 02/15/31 | | | 269,832 | |
| | 350,000 | | | 3.500%, 02/15/39 | | | 390,489 | |
| | 150,000 | | | 3.125%, 11/15/41 | | | 155,593 | |
| | 250,000 | | | 2.750%, 11/15/42 | | | 241,318 | |
| | | | | | | | |
| | | | | | | 1,057,232 | |
| | | | | | | | |
| | | | | | | | |
Principal Amount | | | | | Market Value | |
| | | | U.S. Treasury Notes – 5.1% | | | | |
| | $275,000 | | | 1.375%, 09/30/18 | | $ | 275,682 | |
| | 275,000 | | | 1.500%, 01/31/19 | | | 276,246 | |
| | 300,000 | | | 2.500%, 05/15/24 | | | 307,869 | |
| | 350,000 | | | 2.125%, 05/15/25 | | | 347,956 | |
| | | | | | | | |
| | | | | | | 1,207,753 | |
| | | | | | | | |
| | | | Total U.S. Government and Agency Obligations
(Cost $2,595,187) | | | 2,569,831 | |
| | | | | | | | |
Shares | | | | | | |
| | INVESTMENT COMPANY – 2.6% | | | | |
| | 620,335 | | | Dreyfus Government Cash Management Fund, Institutional Class Shares, 0.69%** | | | 620,335 | |
| | | | | | | | |
| | | | Total Investment Company
(Cost $620,335) | | | 620,335 | |
| | | | | | | | |
| Total Investments – 100.1%
(Cost $21,963,070)*** | | | 23,637,755 | |
| | | | | | | | |
| | Net Other Assets and Liabilities – (0.1)% | | | (12,959 | ) |
| | | | | | | | |
| | Net Assets – 100.0% | | $ | 23,624,796 | |
| | | | | | | | |
| * | Non-income producing security. |
| ** | Yield shown represents the April 30, 2017, seven-day average yield, which refers to the sum of the previous seven days’ dividends paid, expressed as an annual percentage. |
| *** | At April 30, 2017, the aggregate cost for Federal income tax purposes approximates the aggregate cost for book purposes. The aggregate gross unrealized appreciation and depreciation were as follows: |
| | | | |
Gross unrealized appreciation | | $ | 1,785,783 | |
Gross unrealized depreciation | | | (111,098 | ) |
| | | | |
Net unrealized appreciation | | $ | 1,674,685 | |
| | | | |
| | |
| MTN | | MediumTerm Note |
| S&P | | Standard& Poor’s |
| | | | |
| Rating (unaudited)**** | | | | |
Common Stocks | | | 68.8 | % |
U.S. Government and Agency Obligations | | | 11.2 | % |
Aaa | | | 0.9 | % |
Aa | | | 10.3 | % |
A | | | 8.8 | % |
| | | | |
| | | 100 | % |
| | | | |
| **** | As a percentage of market value excluding investment company. Credit quality ratings shown above reflect the highest rating assigned by either Standard & Poor’s (“S&P”) or Moody’s Investors Service, Inc. (“Moody’s”). These rating agencies are independent, nationally recognized statistical rating organizations and are widely used. Investment grade ratings are credit ratings of BBB/Baa or higher. Below investment grade ratings are credit ratings of BB/Ba or lower. Investments designated N/R are not rated by either rating agency. Unrated investments do not necessarily indicate low credit quality. Credit quality ratings are subject to change. |
The accompanying notes are an integral part of these financial statements.
AMG Funds
| | |
| | April 30, 2017 |
| Notes to Schedule of Investments (unaudited) | | |
The summary of each Fund’s investments that are measured at fair value by Level within the fair value hierarchy as of April 30, 2017 is as follows:
| | | | | | | | | | | | | | | | |
Funds | | Total
Value | | | Level 1
Quoted
Prices | | | Level 2
Significant
Observable
Inputs | | | Level 3
Significant
Unobservable
Inputs | |
AMG Managers Fairpointe Focused Equity Fund | | | | | | | | | | | | | | | | |
Assets | | | | | | | | | | | | | | | | |
Investments in Securities* | | $ | 7,145,965 | | | $ | 7,145,965 | | | $ | — | | | $ | — | |
| | | | | | | | | | | | | | | | |
AMG River Road Focused Absolute Value Fund | | | | | | | | | | | | | | | | |
Assets | | | | | | | | | | | | | | | | |
Common Stocks* | | $ | 18,643,139 | | | $ | 18,643,139 | | | $ | — | | | $ | — | |
Short-Term Investments | | | | | | | | | | | | | | | | |
Repurchase Agreements | | | 358,021 | | | | — | | | | 358,021 | | | | — | |
Other Investment Company* | | | 140,372 | | | | 140,372 | | | | — | | | | — | |
| | | | | | | | | | | | | | | | |
Total | | $ | 19,141,532 | | | $ | 18,783,511 | | | $ | 358,021 | | | $ | — | |
| | | | | | | | | | | | | | | | |
AMG Managers Montag & Caldwell Growth Fund | | | | | | | | | | | | | | | | |
Assets | | | | | | | | | | | | | | | | |
Investments in Securities* | | $ | 1,006,629,569 | | | $ | 1,006,629,569 | | | $ | — | | | $ | — | |
| | | | | | | | | | | | | | | | |
AMG River Road Dividend All Cap Value Fund | | | | | | | | | | | | | | | | |
Assets | | | | | | | | | | | | | | | | |
Common Stocks* | | $ | 919,885,158 | | | $ | 919,885,158 | | | $ | — | | | $ | — | |
Short-Term Investments | | | | | | | | | | | | | | | | |
Repurchase Agreements | | | 22,612,867 | | | | — | | | | 22,612,867 | | | | — | |
Other Investment Company* | | | 37,139,790 | | | | 37,139,790 | | | | — | | | | — | |
| | | | | | | | | | | | | | | | |
Total | | $ | 979,637,815 | | | $ | 957,024,948 | | | $ | 22,612,867 | | | $ | — | |
| | | | | | | | | | | | | | | | |
AMG River Road Dividend All Cap Value Fund II | | | | | | | | | | | | | | | | |
Assets | | | | | | | | | | | | | | | | |
Common Stocks* | | $ | 123,216,682 | | | $ | 123,216,682 | | | $ | — | | | $ | — | |
Short-Term Investments | | | | | | | | | | | | | | | | |
Repurchase Agreements | | | 1,174,348 | | | | — | | | | 1,174,348 | | | | — | |
Other Investment Company* | | | 1,251,758 | | | | 1,251,758 | | | | — | | | | — | |
| | | | | | | | | | | | | | | | |
Total | | $ | 125,642,788 | | | $ | 124,468,440 | | | $ | 1,174,348 | | | $ | — | |
| | | | | | | | | | | | | | | | |
AMG Managers Fairpointe Mid Cap Fund | | | | | | | | | | | | | | | | |
Assets | | | | | | | | | | | | | | | | |
Investments in Securities* | | $ | 4,138,469,315 | | | $ | 4,138,469,315 | | | $ | — | | | $ | — | |
| | | | | | | | | | | | | | | | |
AMG Managers Montag & Caldwell Mid Cap Growth Fund | | | | | | | | | | | | | | | | |
Assets | | | | | | | | | | | | | | | | |
Common Stocks* | | $ | 8,645,441 | | | $ | 8,645,441 | | | $ | — | | | $ | — | |
Short-Term Investments | | | | | | | | | | | | | | | | |
Repurchase Agreements | | | 423,918 | | | | — | | | | 423,918 | | | | — | |
Other Investment Company* | | | 509,965 | | | | 509,965 | | | | — | | | | — | |
| | | | | | | | | | | | | | | | |
Total | | $ | 9,579,324 | | | $ | 9,155,406 | | | $ | 423,918 | | | $ | — | |
| | | | | | | | | | | | | | | | |
AMG Managers LMCG Small Cap Growth Fund | | | | | | | | | | | | | | | | |
Assets | | | | | | | | | | | | | | | | |
Common Stocks* | | $ | 129,996,173 | | | $ | 129,996,173 | | | $ | — | | | $ | — | |
Rights | | | 996 | | | | — | | | | — | | | | 996 | |
Short-Term Investments | | | | | | | | | | | | | | | | |
Repurchase Agreements | | | 5,755,941 | | | | — | | | | 5,755,941 | | | | — | |
Other Investment Company* | | | 2,689,117 | | | | 2,689,117 | | | | — | | | | — | |
| | | | | | | | | | | | | | | | |
Total | | $ | 138,442,227 | | | $ | 132,685,290 | | | $ | 5,755,941 | | | $ | 996 | |
| | | | | | | | | | | | | | | | |
AMG River Road Select Value Fund | | | | | | | | | | | | | | | | |
Assets | | | | | | | | | | | | | | | | |
Common Stocks* | | $ | 40,062,655 | | | $ | 40,062,655 | | | $ | — | | | $ | — | |
Short-Term Investments | | | | | | | | | | | | | | | | |
Repurchase Agreements | | | 1,409,152 | | | | — | | | | 1,409,152 | | | | — | |
Other Investment Company* | | | 869,010 | | | | 869,010 | | | | — | | | | — | |
| | | | | | | | | | | | | | | | |
Total | | $ | 42,340,817 | | | $ | 40,931,665 | | | $ | 1,409,152 | | | $ | — | |
| | | | | | | | | | | | | | | | |
AMG Funds
| | |
| | April 30, 2017 |
| Notes to Schedule of Investments – continued | | |
| | | | | | | | | | | | | | | | |
Funds | | Total
Value | | | Level 1
Quoted
Prices | | | Level 2
Significant
Observable
Inputs | | | Level 3
Significant
Unobservable
Inputs | |
AMG River Road Small Cap Value Fund | | | | | | | | | | | | | | | | |
Common Stocks* | | $ | 279,752,947 | | | $ | 279,752,947 | | | $ | — | | | $ | — | |
Short-Term Investments | | | | | | | | | | | | | | | | |
Repurchase Agreements | | | 5,662,333 | | | | — | | | | 5,662,333 | | | | — | |
Other Investment Company* | | | 22,458,281 | | | | 22,458,281 | | | | — | | | | — | |
| | | | | | | | | | | | | | | | |
Total | | $ | 307,873,561 | | | $ | 302,211,228 | | | $ | 5,662,333 | | | $ | — | |
| | | | | | | | | | | | | | | | |
AMG Managers Silvercrest Small Cap Fund | | | | | | | | | | | | | | | | |
Common Stocks* | | $ | 249,339,883 | | | $ | 249,339,883 | | | $ | — | | | $ | — | |
Short-Term Investments | | | | | | | | | | | | | | | | |
Repurchase Agreements | | | 1,765,432 | | | | — | | | | 1,765,432 | | | | — | |
Other Investment Company* | | | 3,306,765 | | | | 3,306,765 | | | | — | | | | — | |
| | | | | | | | | | | | | | | | |
Total | | $ | 254,412,080 | | | $ | 252,646,648 | | | $ | 1,765,432 | | | $ | — | |
| | | | | | | | | | | | | | | | |
AMG GW&K U.S. Small Cap Growth Fund | | | | | | | | | | | | | | | | |
Assets | | | | | | | | | | | | | | | | |
Common Stocks* | | $ | 36,755,814 | | | $ | 36,755,814 | | | $ | — | | | $ | — | |
Short-Term Investments | | | | | | | | | | | | | | | | |
Repurchase Agreements | | | 1,458,663 | | | | — | | | | 1,458,663 | | | | — | |
Other Investment Company* | | | 721,165 | | | | 721,165 | | | | — | | | | — | |
| | | | | | | | | | | | | | | | |
Total | | $ | 38,935,642 | | | $ | 37,476,979 | | | $ | 1,458,663 | | | $ | — | |
| | | | | | | | | | | | | | | | |
AMG Managers DoubleLine Core Plus Bond Fund | | | | | | | | | | | | | | | | |
Assets | | | | | | | | | | | | | | | | |
Corporate Notes and Bonds** | | $ | 168,810,962 | | | $ | — | | | $ | 168,810,962 | | | $ | — | |
Collateralized Mortgage and Asset-Backed Securities | | | 108,301,074 | | | | — | | | | 108,301,074 | | | | — | |
U.S. Government and Agency Obligations** | | | 241,830,706 | | | | — | | | | 241,830,706 | | | | — | |
Other Mortgage and Asset-Backed Securities | | | 59,371,032 | | | | — | | | | 59,371,032 | | | | — | |
Municipal Bonds | | | 439,747 | | | | — | | | | 439,747 | | | | — | |
Foreign Government Notes and Bonds | | | 28,870,321 | | | | — | | | | 28,870,321 | | | | — | |
Common Stocks* | | | 372,367 | | | | 372,367 | | | | — | | | | — | |
Warrants | | | 5,945 | | | | — | | | | 5,945 | | | | — | |
Short-Term Investments | | | | | | | | | | | | | | | | |
Repurchase Agreements | | | 14,734,882 | | | | — | | | | 14,734,882 | | | | — | |
Other Investment Companies* | | | 19,719,183 | | | | 19,719,183 | | | | — | | | | — | |
| | | | | | | | | | | | | | | | |
Total | | $ | 642,456,219 | | | $ | 20,091,550 | | | $ | 622,364,669 | | | $ | — | |
| | | | | | | | | | | | | | | | |
AMG Managers Lake Partners LASSO Alternative Fund | | | | | | | | | | | | | | | | |
Assets | | | | | | | | | | | | | | | | |
Investments in Securities* | | $ | 77,776,441 | | | $ | 77,776,441 | | | $ | — | | | $ | — | |
| | | | | | | | | | | | | | | | |
AMG River Road Long-Short Fund | | | | | | | | | | | | | | | | |
Assets | | | | | | | | | | | | | | | | |
Investments in Securities* | | $ | 58,669,607 | | | $ | 58,669,607 | | | $ | — | | | $ | — | |
| | | | | | | | | | | | | | | | |
Total Assets | | | 58,669,607 | | | | 58,669,607 | | | | — | | | | — | |
| | | | | | | | | | | | | | | | |
Liabilities | | | | | | | | | | | | | | | | |
Common Stocks* | | | (12,064,634 | ) | | | (12,064,634 | ) | | | — | | | | — | |
Exchange Traded Funds | | | (729,160 | ) | | | (729,160 | ) | | | — | | | | — | |
| | | | | | | | | | | | | | | | |
Total Liabilities | | | (12,793,794 | ) | | | (12,793,794 | ) | | | — | | | | — | |
| | | | | | | | | | | | | | | | |
Total | | $ | 45,875,813 | | | $ | 45,875,813 | | | $ | — | | | $ | — | |
| | | | | | | | | | | | | | | | |
AMG Funds
| | |
| | April 30, 2017 |
| Notes to Schedule of Investments – continued | | |
| | | | | | | | | | | | | | | | |
Funds | | Total
Value | | | Level 1
Quoted
Prices | | | Level 2
Significant
Observable
Inputs | | | Level 3
Significant
Unobservable
Inputs | |
AMG Managers Guardian Capital Global Dividend Fund | | | | | | | | | | | | | | | | |
Assets | | | | | | | | | | | | | | | | |
Common Stocks | | | | | | | | | | | | | | | | |
Australia | | $ | 490,212 | | | $ | — | | | $ | 490,212 | | | $ | — | |
Belgium | | | 770,372 | | | | 770,372 | | | | — | | | | — | |
Canada | | | 1,615,492 | | | | 1,615,492 | | | | — | | | | — | |
France | | | 1,676,212 | | | | 332,674 | | | | 1,343,538 | | | | — | |
Germany | | | 1,603,517 | | | | — | | | | 1,603,517 | | | | — | |
Ireland | | | 707,176 | | | | 707,176 | | | | — | | | | — | |
Japan | | | 562,387 | | | | — | | | | 562,387 | | | | — | |
Netherlands | | | 610,320 | | | | 610,320 | | | | — | | | | — | |
New Zealand | | | 537,399 | | | | — | | | | 537,399 | | | | — | |
Norway | | | 235,491 | | | | 235,491 | | | | — | | | | — | |
Singapore | | | 579,185 | | | | 579,185 | | | | — | | | | — | |
Spain | | | 949,914 | | | | — | | | | 949,914 | | | | — | |
Switzerland | | | 1,385,551 | | | | 337,772 | | | | 1,047,779 | | | | — | |
United Kingdom | | | 3,842,883 | | | | 1,108,865 | | | | 2,734,018 | | | | — | |
United States | | | 17,835,904 | | | | 17,835,904 | | | | — | | | | — | |
| | | | | | | | | | | | | | | | |
Total Common Stocks | | | 33,402,015 | | | | 24,133,251 | | | | 9,268,764 | | | | — | |
Short-Term Investments | | | | | | | | | | | | | | | | |
Repurchase Agreements | | | 967,374 | | | | — | | | | 967,374 | | | | — | |
Other Investment Company* | | | 723,863 | | | | 723,863 | | | | — | | | | — | |
| | | | | | | | | | | | | | | | |
Total | | $ | 35,093,252 | | | $ | 24,857,114 | | | $ | 10,236,138 | | | $ | — | |
| | | | | | | | | | | | | | | | |
AMG Managers Pictet International Fund | | | | | | | | | | | | | | | | |
Assets | | | | | | | | | | | | | | | | |
Common Stocks | | | | | | | | | | | | | | | | |
Australia | | $ | 52,775,613 | | | $ | — | | | $ | 52,775,613 | | | $ | — | |
Belgium | | | 94,526,731 | | | | — | | | | 94,526,731 | | | | — | |
Bermuda | | | 20,249,033 | | | | — | | | | 20,249,033 | | | | — | |
Cayman Islands | | | 110,833,616 | | | | 25,303,461 | | | | 85,530,155 | | | | — | |
Denmark | | | 30,895,799 | | | | — | | | | 30,895,799 | | | | — | |
Finland | | | 34,559,289 | | | | — | | | | 34,559,289 | | | | — | |
France | | | 190,722,636 | | | | 27,550,943 | | | | 163,171,693 | | | | — | |
Germany | | | 19,913,111 | | | | — | | | | 19,913,111 | | | | — | |
Hong Kong | | | 20,925,559 | | | | — | | | | 20,925,559 | | | | — | |
Israel | | | 24,190,787 | | | | 22,641,344 | | | | 1,549,443 | | | | — | |
Italy | | | 24,956,207 | | | | — | | | | 24,956,207 | | | | — | |
Japan | | | 324,047,319 | | | | — | | | | 324,047,319 | | | | — | |
Luxembourg | | | 26,365,243 | | | | — | | | | 26,365,243 | | | | — | |
Netherlands | | | 81,853,601 | | | | — | | | | 81,853,601 | | | | — | |
South Korea | | | 29,978,388 | | | | — | | | | 29,978,388 | | | | — | |
Spain | | | 114,311,662 | | | | 40,692,487 | | | | 73,619,175 | | | | — | |
Sweden | | | 21,969,641 | | | | 21,969,641 | | | | — | | | | — | |
Switzerland | | | 81,292,817 | | | | — | | | | 81,292,817 | | | | — | |
United Kingdom | | | 289,287,670 | | | | 16,134,077 | | | | 273,153,593 | | | | — | |
| | | | | | | | | | | | | | | | |
Total Common Stocks | | | 1,593,654,722 | | | | 154,291,953 | | | | 1,439,362,769 | | | | — | |
Short-Term Investments | | | | | | | | | | | | | | | | |
Repurchase Agreements | | | 65,738,546 | | | | — | | | | 65,738,546 | | | | — | |
Other Investment Company* | | | 39,570,522 | | | | 39,570,522 | | | | — | | | | — | |
| | | | | | | | | | | | | | | | |
Total | | $ | 1,698,963,790 | | | $ | 193,862,475 | | | $ | 1,505,101,315 | | | $ | — | |
| | | | | | | | | | | | | | | | |
AMG Funds
| | |
| | April 30, 2017 |
| Notes to Schedule of Investments – continued | | |
| | | | | | | | | | | | | | | | |
Funds | | Total
Value | | | Level 1
Quoted
Prices | | | Level 2
Significant
Observable
Inputs | | | Level 3
Significant
Unobservable
Inputs | |
AMG Managers Value Partners Asia Dividend Fund | | | | | | | | | | | | | | | | |
Assets | | | | | | | | | | | | | | | | |
Common Stocks | | | | | | | | | | | | | | | | |
China | | $ | 3,398,609 | | | $ | 54,883 | | | $ | 3,343,726 | | | $ | — | |
Hong Kong | | | 1,220,051 | | | | 121,332 | | | | 1,098,719 | | | | — | |
Indonesia | | | 426,838 | | | | 132,070 | | | | 294,768 | | | | — | |
Malaysia | | | 207,364 | | | | 77,405 | | | | 129,959 | | | | — | |
Philippines | | | 48,480 | | | | 10,350 | | | | 38,130 | | | | — | |
Singapore | | | 345,852 | | | | 223,132 | | | | 122,720 | | | | — | |
South Korea | | | 868,668 | | | | 55,592 | | | | 769,960 | | | | 43,116 | |
Taiwan | | | 617,452 | | | | — | | | | 617,452 | | | | — | |
Thailand | | | 126,805 | | | | — | | | | 126,805 | | | | — | |
United States | | | 52,920 | | | | 52,920 | | | | — | | | | — | |
| | | | | | | | | | | | | | | | |
Total Common Stocks | | | 7,313,039 | | | | 727,684 | | | | 6,542,239 | | | | 43,116 | |
Corporate Notes and Bonds | | | | | | | | | | | | | | | | |
Singapore | | | 141,104 | | | | — | | | | 141,104 | | | | — | |
Preferred Stock | | | | | | | | | | | | | | | | |
South Korea | | | 672,572 | | | | 193,655 | | | | 478,917 | | | | — | |
Participation Notes | | | | | | | | | | | | | | | | |
China | | | 42,469 | | | | — | | | | 42,469 | | | | — | |
Warrants | | | | | | | | | | | | | | | | |
China | | | 213,975 | | | | — | | | | 213,975 | | | | — | |
Singapore | | | 822 | | | | 822 | | | | — | | | | — | |
Exchange Traded Fund | | | 218,144 | | | | 218,144 | | | | — | | | | — | |
Short-Term Investments | | | | | | | | | | | | | | | | |
Repurchase Agreements | | | 5,378 | | | | — | | | | 5,378 | | | | — | |
Other Investment Company* | | | 178,204 | | | | 178,204 | | | | — | | | | — | |
| | | | | | | | | | | | | | | | |
Total | | $ | 8,785,707 | | | $ | 1,318,509 | | | $ | 7,467,198 | | | $ | — | |
| | | | | | | | | | | | | | | | |
AMG Managers Montag & Caldwell Balanced Fund | | | | | | | | | | | | | | | | |
Assets | | | | | | | | | | | | | | | | |
Common Stocks* | | $ | 15,841,359 | | | $ | 15,841,359 | | | $ | — | | | $ | — | |
Corporate Notes and Bonds** | | | 4,606,230 | | | | — | | | | 4,606,230 | | | | — | |
U.S. Government and Agency Obligations** | | | 2,569,831 | | | | — | | | | 2,569,831 | | | | — | |
Investment Company* | | | 620,335 | | | | 620,335 | | | | — | | | | — | |
| | | | | | | | | | | | | | | | |
Total | | $ | 23,637,755 | | | $ | 16,461,694 | | | $ | 7,176,061 | | | $ | — | |
| | | | | | | | | | | | | | | | |
| * | All Common Stocks and Investment Companies are Level 1. Please refer to the respective Schedule of Investments for industry, sector or country breakout. |
| ** | All corporate notes and bonds and U.S. government and agency obligations held in the Funds are Level 2 securities. For a detailed breakout of the corporate notes and bonds and U.S. government and agency obligations; by major industry or agency classification, please refer to the respective Schedule of Investments. |
As of April 30, 2017, transfers between Level 1 and Level 2 are as follows:
| | | | | | | | |
Funds | | Transfer from
Level 1 to Level 2 | | | Transfer from
Level 2 to Level 1 | |
AMG Managers Guardian Capital Global Dividend Fund | | | — | | | $ | 332,674 | |
AMG Managers Pictet International Fund | | $ | 52,546,524 | | | | 49,520,583 | |
AMG Managers Value Partners Asia Dividend Fund | | | 74,166 | | | | 390,175 | |
The following table below is a reconciliation of investments in which significant unobservable inputs (Level 3) were used in determining fair value at April 30, 2017:
| | | | |
| AMG Managers Value Partners Asia Dividend Funds | | Common Stock | |
Balance as of October 31, 2016 | | $ | — | |
Change in unrealized appreciation (depreciation) | | | 10,539 | |
Transfers In | | | 32,577 | |
| | | | |
Balance as of April 30, 2017 | | $ | 43,116 | |
| | | | |
Net change in unrealized appreciation (depreciation) of investments still held at April 30, 2017 | | $ | 10,539 | |
| | | | |
As of April 30, 2017, there were no other Level 3 securities for which significant unobservable inputs or Investment Manager assumptions used in determining fair value except for AMG Managers LMCG Small Cap Growth Fund, which received rights at no cost as a result of a corporate action.
AMG Funds
| | |
| | April 30, 2017 |
| Statements of Assets and Liabilities (unaudited) | | |
| | | | | | | | |
| | | AMG Managers
Fairpointe
Focused
Equity Fund | | | AMG River Road
Focused Absolute
Value Fund | |
ASSETS: | | | | | | | | |
Investments at value1,2 | | $ | 7,145,965 | | | $ | 19,141,532 | |
Cash | | | — | | | | 2,403 | |
Receivables: | | | | | | | | |
Dividends, interest and other | | | 1,904 | | | | 5,547 | |
Fund shares sold | | | — | | | | 91,328 | |
Investments sold | | | 21,919 | | | | 328,878 | |
Receivable from Affiliate | | | 8,689 | | | | 5,667 | |
Prepaid expenses | | | 56 | | | | 96 | |
| | | | | | | | |
Total assets | | | 7,178,533 | | | | 19,575,451 | |
| | | | | | | | |
LIABILITIES: | | | | | | | | |
Payables: | | | | | | | | |
Payable upon return of securities loaned | | | — | | | | 358,021 | |
Investments purchased | | | 10,834 | | | | 328,680 | |
Fund shares redeemed | | | — | | | | — | |
Investment advisory and management fees | | | 4,298 | | | | 9,345 | |
Administration fees | | | 921 | | | | 2,336 | |
Distribution fees—Class N | | | 206 | | | | 159 | |
Distribution fees—Class R | | | — | | | | — | |
Shareholder servicing fees—Fund level | | | 479 | | | | 656 | |
Shareholder servicing fees—Class N | | | 66 | | | | 25 | |
Shareholder servicing fees—Class I | | | 425 | | | | 598 | |
Shareholder servicing fees—Class R | | | — | | | | — | |
Professional fees | | | 14,607 | | | | 11,946 | |
Custodian fees | | | 2,600 | | | | 7,900 | |
Transfer agent fees | | | 275 | | | | 344 | |
Registration fees | | | 15,165 | | | | 4,498 | |
Trustees fees | | | 123 | | | | 278 | |
Accrued expenses and other payables | | | 1,100 | | | | 10,899 | |
| | | | | | | | |
Total liabilities | | | 51,099 | | | | 735,685 | |
| | | | | | | | |
NET ASSETS | | $ | 7,127,434 | | | $ | 18,839,766 | |
| | | | | | | | |
| | |
NET ASSETS CONSIST OF: | | | | | | | | |
Paid-in capital | | $ | 5,996,568 | | | $ | 16,444,247 | |
Undistributed (distribution in excess of) net investment income | | | 13,371 | | | | (2,756 | ) |
Accumulated net realized gain (loss) on investments | | | (153,767 | ) | | | 721,222 | |
Net unrealized appreciation (depreciation) of investments | | | 1,271,262 | | | | 1,677,053 | |
| | | | | | | | |
TOTAL NET ASSETS | | $ | 7,127,434 | | | $ | 18,839,766 | |
| | | | | | | | �� |
Class N: | | | | | | | | |
Net Assets | | $ | 894,229 | | | $ | 774,738 | |
Shares of beneficial interest outstanding (unlimited authorization) | | | 78,419 | | | | 66,649 | |
Net asset value, offering and redemption price per share | | $ | 11.40 | | | $ | 11.62 | |
| | | | | | | | |
Class I: | | | | | | | | |
Net Assets | | $ | 6,233,205 | | | $ | 18,065,028 | |
Shares of beneficial interest outstanding (unlimited authorization) | | | 549,199 | | | | 1,550,577 | |
Net asset value, offering and redemption price per share | | $ | 11.35 | | | $ | 11.65 | |
| | | | | | | | |
Class R: | | | | | | | | |
Net Assets | | $ | — | | | $ | — | |
Shares of beneficial interest outstanding (unlimited authorization) | | | — | | | | — | |
Net asset value, offering and redemption price per share | | $ | — | | | $ | — | |
| | | | | | | | |
1 Investments at cost | | $ | 5,874,703 | | | $ | 17,464,479 | |
2 Includes securities on loan valued at | | | — | | | $ | 345,644 | |
The accompanying notes are an integral part of these financial statements.
| | | | | | | | | | | | | | | | | | | | | | | | | | |
AMG Managers
Montag & Caldwell
Growth Fund | | | AMG River Road
Dividend All
Cap Value Fund | | | AMG River Road
Dividend All
Cap Value Fund II | | | AMG Managers
Fairpointe
Mid Cap Fund | | | AMG Managers
Montag & Caldwell
Mid Cap
Growth Fund | | | AMG Managers
LMCG
Small Cap
Growth Fund | | | AMG River Road
Select Value
Fund | |
| $ | 1,006,629,569 | | | $ | 979,637,815 | | | $ | 125,642,788 | | | $ | 4,138,469,315 | | | $ | 9,579,324 | | | $ | 138,442,227 | | | $ | 42,340,817 | |
| | — | | | | — | | | | — | | | | — | | | | — | | | | 4 | | | | — | |
| | 228,658 | | | | 872,105 | | | | 100,331 | | | | 466,310 | | | | 2,786 | | | | 2,651 | | | | 2,095 | |
| | 860,016 | | | | 4,278,207 | | | | 225,627 | | | | 6,923,931 | | | | 115 | | | | 329,720 | | | | 37,515 | |
| | 2,294,104 | | | | — | | | | — | | | | 19,218,823 | | | | — | | | | 4,276,810 | | | | 308,830 | |
| | 5,045 | | | | 4,145 | | | | — | | | | 22,034 | | | | 4,490 | | | | 14,817 | | | | 2,443 | |
| | 8,972 | | | | 6,552 | | | | 914 | | | | 51,607 | | | | 61 | | | | 1,045 | | | | 2,782 | |
| | | | | | | | | | | | | | | | | | | | | | | | | | |
| | 1,010,026,364 | | | | 984,798,824 | | | | 125,969,660 | | | | 4,165,152,020 | | | | 9,586,776 | | | | 143,067,274 | | | | 42,694,482 | |
| | | | | | | | | | | | | | | | | | | | | | | | | | |
| | — | | | | 22,612,867 | | | | 1,174,348 | | | | — | | | | 423,918 | | | | 5,755,941 | | | | 1,409,152 | |
| | — | | | | — | | | | — | | | | 28,881,104 | | | | 141,997 | | | | 1,997,817 | | | | 285,297 | |
| | 4,441,172 | | | | 1,257,537 | | | | 242,925 | | | | 5,940,884 | | | | — | | | | 269,432 | | | | 7,030 | |
| | 545,001 | | | | 469,275 | | | | 61,705 | | | | 2,054,473 | | | | 5,465 | | | | 98,742 | | | | 24,591 | |
| | 124,048 | | | | 117,319 | | | | 15,426 | | | | 508,481 | | | | 1,093 | | | | 16,457 | | | | 4,918 | |
| | 78,031 | | | | 68,259 | | | | 750 | | | | 322,322 | | | | 913 | | | | 10,228 | | | | 1,065 | |
| | 2,287 | | | | — | | | | — | | | | — | | | | — | | | | — | | | | — | |
| | 122,945 | | | | 96,443 | | | | 8,150 | | | | 383,898 | | | | 813 | | | | 9,066 | | | | 2,322 | |
| | 18,727 | | | | 16,383 | | | | 180 | | | | 103,143 | | | | 183 | | | | 2,864 | | | | 256 | |
| | 30,617 | | | | 30,545 | | | | 5,991 | | | | 168,047 | | | | 182 | | | | 4,128 | | | | 1,711 | |
| | 229 | | | | — | | | | — | | | | — | | | | — | | | | — | | | | — | |
| | 11,720 | | | | 6,809 | | | | 14,870 | | | | — | | | | 14,585 | | | | 12,850 | | | | 14,415 | |
| | 84,236 | | | | 45,852 | | | | 11,100 | | | | 201,009 | | | | 4,293 | | | | 18,690 | | | | 9,953 | |
| | 92,380 | | | | 26,321 | | | | 9,728 | | | | 165,094 | | | | 701 | | | | 12,931 | | | | 5,627 | |
| | 14,624 | | | | 2,823 | | | | 7,587 | | | | — | | | | 1,288 | | | | 3,307 | | | | — | |
| | 17,434 | | | | 15,261 | | | | 1,933 | | | | 54,067 | | | | 126 | | | | 1,180 | | | | 556 | |
| | 133,447 | | | | 52,134 | | | | 9,657 | | | | 255,531 | | | | 1,379 | | | | 25,299 | | | | 4,128 | |
| | | | | | | | | | | | | | | | | | | | | | | | | | |
| | 5,716,898 | | | | 24,817,828 | | | | 1,564,350 | | | | 39,038,053 | | | | 596,936 | | | | 8,238,932 | | | | 1,771,021 | |
| | | | | | | | | | | | | | | | | | | | | | | | | | |
| $ | 1,004,309,466 | | | $ | 959,980,996 | | | $ | 124,405,310 | | | $ | 4,126,113,967 | | | $ | 8,989,840 | | | $ | 134,828,342 | | | $ | 40,923,461 | |
| | | | | | | | | | | | | | | | | | | | | | | | | | |
| $ | 782,601,985 | | | $ | 768,056,036 | | | $ | 103,298,359 | | | $ | 3,081,117,842 | | | $ | 7,386,014 | | | $ | 153,042,788 | | | $ | 31,719,148 | |
| | (2,104,494 | ) | | | (3,662,553 | ) | | | (328,979 | ) | | | (4,876,547 | ) | | | (106,164 | ) | | | (1,287,768 | ) | | | (109,131 | ) |
| | 34,213,615 | | | | 32,884,158 | | | | 4,977,027 | | | | 249,832,352 | | | | 424,772 | | | | (33,113,557 | ) | | | 3,334,057 | |
| | 189,598,360 | | | | 162,703,355 | | | | 16,458,903 | | | | 800,040,320 | | | | 1,285,218 | | | | 16,186,879 | | | | 5,979,387 | |
| | | | | | | | | | | | | | | | | | | | | | | | | | |
| $ | 1,004,309,466 | | | $ | 959,980,996 | | | $ | 124,405,310 | | | $ | 4,126,113,967 | | | $ | 8,989,840 | | | $ | 134,828,342 | | | $ | 40,923,461 | |
| | | | | | | | | | | | | | | | | | | | | | | | | | |
| $ | 384,338,419 | | | $ | 333,520,940 | | | $ | 3,628,393 | | | $ | 1,563,339,046 | | | $ | 4,504,684 | | | $ | 50,062,593 | | | $ | 5,274,233 | |
| | 20,065,644 | | | | 26,679,046 | | | | 253,733 | | | | 36,496,713 | | | | 428,101 | | | | 3,460,581 | | | | 666,997 | |
| $ | 19.15 | | | $ | 12.50 | | | $ | 14.30 | | | $ | 42.84 | | | $ | 10.52 | | | $ | 14.47 | | | $ | 7.91 | |
| | | | | | | | | | | | | | | | | | | | | | | | | | |
| $ | 614,839,956 | | | $ | 626,460,056 | | | $ | 120,776,917 | | | $ | 2,562,774,921 | | | $ | 4,485,156 | | | $ | 84,765,749 | | | $ | 35,649,228 | |
| | 32,009,231 | | | | 50,144,545 | | | | 8,438,629 | | | | 58,477,827 | | | | 424,172 | | | | 5,777,433 | | | | 4,434,437 | |
| $ | 19.21 | | | $ | 12.49 | | | $ | 14.31 | | | $ | 43.82 | | | $ | 10.57 | | | $ | 14.67 | | | $ | 8.04 | |
| | | | | | | | | | | | | | | | | | | | | | | | | | |
| $ | 5,131,091 | | | $ | — | | | $ | — | | | $ | — | | | $ | — | | | $ | — | | | $ | — | |
| | 273,955 | | | | — | | | | — | | | | — | | | | — | | | | — | | | | — | |
| $ | 18.73 | | | $ | — | | | $ | — | | | $ | — | | | $ | — | | | $ | — | | | $ | — | |
| | | | | | | | | | | | | | | | | | | | | | | | | | |
| $ | 817,031,209 | | | $ | 816,934,460 | | | $ | 109,183,885 | | | $ | 3,338,428,995 | | | $ | 8,294,106 | | | $ | 122,255,348 | | | $ | 36,361,430 | |
| | — | | | $ | 21,904,456 | | | $ | 1,131,073 | | | | — | | | $ | 408,459 | | | $ | 5,585,456 | | | $ | 1,363,682 | |
AMG Funds
| | |
| | April 30, 2017 |
| Statements of Assets and Liabilities – continued | | |
| | | | | | | | |
| | | AMG River Road
Small Cap
Value Fund | | | AMG Managers
Silvercrest
Small Cap
Fund | |
ASSETS: | | | | | | | | |
Investments at value1,2 | | $ | 307,873,561 | | | $ | 254,412,080 | |
Affiliated investment at value3 | | | — | | | | — | |
Foreign currency (Cost $1,647,680, $24,367, $569,632 and $274,672, respectively) | | | — | | | | — | |
Cash | | | — | | | | — | |
Segregated cash | | | — | | | | — | |
Receivables: | | | | | | | | |
Dividends, interest and other | | | 12,277 | | | | 52,865 | |
Fund shares sold | | | 558,921 | | | | 1,109,909 | |
Investments sold | | | 111,407 | | | | 1,621,318 | |
Receivable from Affiliate | | | 543 | | | | 9,743 | |
Prepaid expenses | | | 3,924 | | | | 1,804 | |
| | | | | | | | |
Total assets | | | 308,560,633 | | | | 257,207,719 | |
| | | | | | | | |
LIABILITIES: | | | | | | | | |
Payables: | | | | | | | | |
Payable upon return of securities loaned | | | 5,662,333 | | | | 1,765,432 | |
Due to Custodian | | | — | | | | — | |
Due to broker | | | — | | | | — | |
Interest and dividends on securities sold short | | | — | | | | — | |
Dividend distribution | | | — | | | | — | |
Investments purchased | | | — | | | | 832,019 | |
Fund shares redeemed | | | 403,669 | | | | 176,240 | |
Investment advisory and management fees | | | 197,594 | | | | 185,382 | |
Administration fees | | | 37,049 | | | | 30,897 | |
Distribution fees—Class N | | | 5,774 | | | | 5,306 | |
Shareholder servicing fees—Fund level | | | 46,785 | | | | 22,060 | |
Shareholder servicing fees—Class N | | | 2,078 | | | | 1,486 | |
Shareholder servicing fees—Class I | | | 20,151 | | | | 12,933 | |
Professional fees | | | 11,516 | | | | 12,134 | |
Custodian fees | | | 19,734 | | | | 16,558 | |
Transfer agent fees | | | 8,503 | | | | 5,567 | |
Registration fees | | | — | | | | 13,747 | |
Trustees fees | | | 4,655 | | | | 4,157 | |
Accrued expenses and other payables | | | 20,580 | | | | 16,666 | |
Securities sold short, at value (proceeds $13,044,489) | | | — | | | | — | |
| | | | | | | | |
Total liabilities | | | 6,440,421 | | | | 3,100,584 | |
| | | | | | | | |
NET ASSETS | | $ | 302,120,212 | | | $ | 254,107,135 | |
| | | | | | | | |
NET ASSETS CONSIST OF: | | | | | | | | |
Paid-in capital | | $ | 211,153,723 | | | $ | 205,804,020 | |
Undistributed (distribution in excess of) net investment income | | | (4,835 | ) | | | (75,750 | ) |
Accumulated net realized gain (loss) on investments, securities sold short, foreign currency transactions and capital gain distributions received | | | 24,844,656 | | | | 6,403,432 | |
Net unrealized appreciation (depreciation) of investments, securities sold short and translation of assets and liabilities in foreign currency | | | 66,126,668 | | | | 41,975,433 | |
| | | | | | | | |
TOTAL NET ASSETS | | $ | 302,120,212 | | | $ | 254,107,135 | |
| | | | | | | | |
Class N: | | | | | | | | |
Net Assets | | $ | 28,613,128 | | | $ | 26,238,982 | |
Shares of beneficial interest outstanding (unlimited authorization) | | | 2,047,667 | | | | 1,460,363 | |
Net asset value, offering and redemption price per share | | $ | 13.97 | | | $ | 17.97 | |
| | | | | | | | |
Class I: | | | | | | | | |
Net Assets | | $ | 273,507,084 | | | $ | 227,868,153 | |
Shares of beneficial interest outstanding (unlimited authorization) | | | 19,315,402 | | | | 12,588,937 | |
Net asset value, offering and redemption price per share | | $ | 14.16 | | | $ | 18.10 | |
| | | | | | | | |
Class Z: | | | | | | | | |
Net Assets | | $ | — | | | $ | — | |
Shares of beneficial interest outstanding (unlimited authorization) | | | — | | | | — | |
Net asset value, offering and redemption price per share | | $ | — | | | $ | — | |
| | | | | | | | |
1 Investments at cost | | $ | 241,746,893 | | | $ | 212,436,647 | |
2 Includes securities on loan valued at | | $ | 5,404,619 | | | $ | 1,560,750 | |
3 Affiliated investment at cost | | | — | | | | — | |
The accompanying notes are an integral part of these financial statements.
| | | | | | | | | | | | | | | | | | | | | | | | | | |
AMG GW&K
U.S. Small Cap
Growth Fund | | | AMG Managers
DoubleLine Core
Plus Bond
Fund | | | AMG Managers
Lake Partners
LASSO Alternatives
Fund | | | AMG
River Road
Long-Short
Fund | | | AMG Managers
Guardian
Capital Global
Dividend Fund | | | AMG Managers
Pictet
International
Fund | | | AMG Managers
Value Partners
Asia Dividend
Fund | |
| | | | | | |
| | | | | | |
| | | | | | |
| $ | 38,935,642 | | | $ | 631,883,032 | | | $ | 77,776,441 | | | $ | 58,669,607 | | | $ | 35,093,252 | | | $ | 1,698,963,790 | | | $ | 8,785,707 | |
| | — | | | | 10,573,187 | | | | — | | | | — | | | | — | | | | — | | | | — | |
| | — | | | | — | | | | — | | | | 1,603,038 | | | | 24,367 | | | | 569,189 | | | | 274,365 | |
| | 4,870 | | | | — | | | | — | | | | 4,121,060 | | | | 3,112 | | | | — | | | | — | |
| | — | | | | — | | | | — | | | | 2,000,000 | | | | — | | | | — | | | | — | |
| | 10,161 | | | | 4,226,033 | | | | 30,536 | | | | 85,140 | | | | 105,373 | | | | 7,397,272 | | | | 15,422 | |
| | 9,716 | | | | 3,470,251 | | | | 20,561 | | | | 3,076 | | | | 13,153 | | | | 3,629,645 | | | | — | |
| | 57,016 | | | | 1,272,759 | | | | 3,555,256 | | | | 804,049 | | | | — | | | | 4,873,497 | | | | 30,192 | |
| | 14,344 | | | | 45,387 | | | | 6,204 | | | | 6,830 | | | | 2,006 | | | | 7,210 | | | | 10,918 | |
| | 1,718 | | | | 4,665 | | | | 9,066 | | | | 380 | | | | 8,736 | | | | 8,376 | | | | 56 | |
| | | | | | | | | | | | | | | | | | | | | | | | | | |
| | 39,033,467 | | | | 651,475,314 | | | | 81,398,064 | | | | 67,293,180 | | | | 35,249,999 | | | | 1,715,448,979 | | | | 9,116,660 | |
| | | | | | | | | | | | | | | | | | | | | | | | | | |
| | 1,458,663 | | | | 14,734,882 | | | | — | | | | — | | | | 967,374 | | | | 65,738,546 | | | | 5,378 | |
| | — | | | | 5,180 | | | | 8 | | | | — | | | | — | | | | — | | | | 10,732 | |
| | — | | | | — | | | | — | | | | 13,394,854 | | | | — | | | | — | | | | — | |
| | — | | | | — | | | | — | | | | 54,403 | | | | — | | | | — | | | | — | |
| | — | | | | 511 | | | | — | | | | — | | | | — | | | | — | | | | — | |
| | 70,876 | | | | 1,290,024 | | | | 28,692 | | | | 1,687,747 | | | | 303 | | | | 3,155,965 | | | | 32,755 | |
| | 67,843 | | | | 1,602,229 | | | | 2,164,319 | | | | 80,027 | | | | — | | | | 1,447,766 | | | | — | |
| | 21,058 | | | | 242,412 | | | | 61,922 | | | | 27,431 | | | | 19,487 | | | | 1,048,666 | | | | 5,836 | |
| | 4,512 | | | | 80,804 | | | | 10,320 | | | | 4,841 | | | | 4,176 | | | | 196,625 | | | | 1,094 | |
| | 5,743 | | | | 45,016 | | | | 5,617 | | | | 1,529 | | | | 4 | | | | 58 | | | | — | |
| | 7,397 | | | | 62,444 | | | | 7,385 | | | | 3,533 | | | | 28 | | | | 176,317 | | | | — | |
| | 1,608 | | | | 14,405 | | | | 1,348 | | | | 489 | | | | — | | | | 16 | | | | — | |
| | 491 | | | | 28,690 | | | | 2,780 | | | | 2,093 | | | | — | | | | 91,742 | | | | — | |
| | 7,659 | | | | 18,451 | | | | 14,126 | | | | 19,739 | | | | 16,225 | | | | 3,191 | | | | 12,815 | |
| | 16,720 | | | | 205,817 | | | | 8,819 | | | | 13,118 | | | | 12,545 | | | | 216,927 | | | | 55,190 | |
| | 13,876 | | | | 30,827 | | | | 15,941 | | | | 2,768 | | | | 177 | | | | 107,448 | | | | 248 | |
| | — | | | | 11,841 | | | | — | | | | 4,357 | | | | — | | | | — | | | | 14,253 | |
| | — | | | | 10,637 | | | | 857 | | | | 609 | | | | 453 | | | | 27,417 | | | | 134 | |
| | 21,480 | | | | 50,288 | | | | 6,081 | | | | 4,385 | | | | 963 | | | | 16,634 | | | | 766 | |
| | — | | | | — | | | | — | | | | 12,793,794 | | | | — | | | | — | | | | — | |
| | | | | | | | | | | | | | | | | | | | | | | | | | |
| | 1,697,926 | | | | 18,434,458 | | | | 2,328,215 | | | | 28,095,717 | | | | 1,021,735 | | | | 72,227,318 | | | | 139,201 | |
| | | | | | | | | | | | | | | | | | | | | | | | | | |
| $ | 37,335,541 | | | $ | 633,040,856 | | | $ | 79,069,849 | | | $ | 39,197,463 | | | $ | 34,228,264 | | | $ | 1,643,221,661 | | | $ | 8,977,459 | |
| | | | | | | | | | | | | | | | | | | | | | | | | | |
| $ | 26,336,704 | | | $ | 640,028,180 | | | $ | 76,559,191 | | | $ | 40,183,278 | | | $ | 31,601,714 | | | $ | 1,441,152,910 | | | $ | 7,933,713 | |
| | (720,715 | ) | | | (1,259,808 | ) | | | (517,802 | ) | | | (1,123,158 | ) | | | 86,553 | | | | 5,614,073 | | | | (23,860 | ) |
| | 2,586,739 | | | | (5,298,097 | ) | | | 819,070 | | | | (2,141,896 | ) | | | (71,825 | ) | | | 28,025,596 | | | | 239,713 | |
| | 9,132,813 | | | | (429,419 | ) | | | 2,209,390 | | | | 2,279,239 | | | | 2,611,822 | | | | 168,429,082 | | | | 827,893 | |
| | | | | | | | | | | | | | | | | | | | | | | | | | |
| $ | 37,335,541 | | | $ | 633,040,856 | | | $ | 79,069,849 | | | $ | 39,197,463 | | | $ | 34,228,264 | | | $ | 1,643,221,661 | | | $ | 8,977,459 | |
| | | | | | | | | | | | | | | | | | | | | | | | | | |
| $ | 28,606,767 | | | $ | 204,029,598 | | | $ | 25,240,082 | | | $ | 7,345,146 | | | $ | 18,489 | | | $ | 289,822 | | | $ | 964,114 | |
| | 6,795,555 | | | | 19,185,511 | | | | 2,092,604 | | | | 617,036 | | | | 1,731 | | | | 27,589 | | | | 85,291 | |
| $ | 4.21 | | | $ | 10.63 | | | $ | 12.06 | | | $ | 11.90 | | | $ | 10.68 | | | $ | 10.50 | | | $ | 11.30 | |
| | | | | | | | | | | | | | | | | | | | | | | | | | |
| $ | 8,600,539 | | | $ | 429,011,258 | | | $ | 53,829,767 | | | $ | 31,852,317 | | | $ | 34,209,775 | | | $ | 1,642,931,839 | | | $ | 8,013,345 | |
| | 1,707,623 | | | | 40,361,725 | | | | 4,440,426 | | | | 2,646,369 | | | | 3,219,209 | | | | 156,692,471 | | | | 709,097 | |
| $ | 5.04 | | | $ | 10.63 | | | $ | 12.12 | | | $ | 12.04 | | | $ | 10.63 | | | $ | 10.49 | | | $ | 11.30 | |
| | | | | | | | | | | | | | | | | | | | | | | | | | |
| $ | 128,235 | | | $ | — | | | $ | — | | | $ | — | | | $ | — | | | $ | — | | | $ | — | |
| | 25,469 | | | | — | | | | — | | | | — | | | | — | | | | — | | | | — | |
| $ | 5.03 | | | $ | — | | | $ | — | | | $ | — | | | $ | — | | | $ | — | | | $ | — | |
| | | | | | | | | | | | | | | | | | | | | | | | | | |
| $ | 29,802,829 | | | $ | 632,203,274 | | | $ | 75,567,051 | | | $ | 56,596,056 | | | $ | 32,479,397 | | | $ | 1,530,551,034 | | | $ | 7,957,515 | |
| $ | 1,427,367 | | | $ | 14,268,090 | | | | — | | | | — | | | $ | 946,741 | | | $ | 62,702,224 | | | $ | 5,349 | |
| | — | | | $ | 10,682,364 | | | | — | | | | — | | | | — | | | | — | | | | — | |
AMG Funds
| | |
| | April 30, 2017 |
| Statements of Assets and Liabilities – continued | | |
| | | | |
| | | AMG Managers
Montag & Caldwell
Balanced Fund | |
| | |
| | |
ASSETS: | | | | |
Investments at value1 | | $ | 23,637,755 | |
Receivables: | | | | |
Dividends, interest and other | | | 59,627 | |
Fund shares sold | | | 501 | |
Receivable from Affiliate | | | 4,997 | |
Prepaid expenses | | | 169 | |
| | | | |
Total assets | | | 23,703,049 | |
| | | | |
LIABILITIES: | | | | |
Payables: | | | | |
Fund shares redeemed | | | 11,733 | |
Investment advisory and management fees | | | 12,499 | |
Administration fees | | | 2,885 | |
Distribution fees—Class N | | | 4,235 | |
Shareholder servicing fees—Fund level | | | 1,712 | |
Shareholder servicing fees—Class N | | | 1,023 | |
Shareholder servicing fees—Class I | | | 131 | |
Professional fees | | | 16,191 | |
Custodian fees | | | 9,024 | |
Transfer agent fees | | | 6,476 | |
Registration fees | | | 7,912 | |
Trustees fees | | | 353 | |
Accrued expenses and other payables | | | 4,079 | |
| | | | |
Total liabilities | | | 78,253 | |
| | | | |
NET ASSETS | | $ | 23,624,796 | |
| | | | |
NET ASSETS CONSIST OF: | | | | |
Paid-in capital | | $ | 21,905,029 | |
Undistributed (distribution in excess of) net investment income | | | (378,743 | ) |
Accumulated net realized gain on investments | | | 423,825 | |
Net unrealized appreciation (depreciation) of investments | | | 1,674,685 | |
| | | | |
TOTAL NET ASSETS | | $ | 23,624,796 | |
| | | | |
Class N: | | | | |
Net Assets | | $ | 20,924,183 | |
Shares of beneficial interest outstanding (unlimited authorization) | | | 964,221 | |
Net asset value, offering and redemption price per share | | $ | 21.70 | |
| | | | |
Class I: | | | | |
Net Assets | | $ | 2,700,613 | |
Shares of beneficial interest outstanding (unlimited authorization) | | | 124,881 | |
Net asset value, offering and redemption price per share | | $ | 21.63 | |
| | | | |
1 Investments at cost | | $ | 21,963,070 | |
The accompanying notes are an integral part of these financial statements.
This page intentionally left blank.
AMG Funds
| | |
| Statements of Operations (unaudited) | | |
| For the Six Months Ended April 30, 2017 | | |
| | | | | | | | |
| | | AMG Managers
Fairpointe
Focused
Equity Fund | | | AMG River Road
Focused Absolute
Value Fund | |
| | | |
| | | |
| | | |
INVESTMENT INCOME: | | | | | | | | |
Dividends | | $ | 65,330 | | | $ | 99,500 | |
Securities lending income | | | — | | | | 1,704 | |
Foreign taxes withheld | | | (139 | ) | | | — | |
| | | | | | | | |
Total investment income | | | 65,191 | | | | 101,204 | |
| | | | | | | | |
EXPENSES: | | | | | | | | |
Investment advisory fees and management fees | | | 28,096 | | | | 49,053 | |
Administrative fees | | | 6,021 | | | | 12,263 | |
Distribution fees—Class N | | | 1,184 | | | | 1,153 | |
Distribution fees—Class R | | | — | | | | — | |
Shareholder servicing fees—Class N | | | 379 | | | | 185 | |
Shareholder servicing fees—Class I | | | 2,832 | | | | 3,086 | |
Shareholder service fees—Class R | | | — | | | | — | |
Transfer agent fees | | | 186 | | | | 233 | |
Custodian fees | | | 1,530 | | | | 3,208 | |
Professional fees | | | 11,114 | | | | 9,175 | |
Registration fees | | | 20,376 | | | | 12,519 | |
Reports to shareholders | | | 671 | | | | 2,069 | |
Trustees fees and expenses | | | 321 | | | | 538 | |
Miscellanous | | | 740 | | | | 826 | |
| | | | | | | | |
Total expenses before offsets/reductions | | | 73,450 | | | | 94,308 | |
| | | | | | | | |
Expense reimbursements | | | (36,142 | ) | | | (31,838 | ) |
Expense reductions | | | — | | | | (1,738 | ) |
Fees waivers | | | — | | | | — | |
| | | | | | | | |
Net expenses | | | 37,308 | | | | 60,732 | |
| | | | | | | | |
NET INVESTMENT INCOME (LOSS) | | | 27,883 | | | | 40,472 | |
| | | | | | | | |
NET REALIZED AND UNREALIZED GAIN (LOSS) ON INVESTMENTS: | | | | | | | | |
Net realized gain (loss) on investments | | | (1,541 | ) | | | 804,413 | |
Net change in unrealized appreciation (depreciation) of investments | | | 1,293,983 | | | | 1,168,859 | |
| | | | | | | | |
NET REALIZED AND UNREALIZED GAIN ON INVESTMENTS | | | 1,292,442 | | | | 1,973,272 | |
| | | | | | | | |
NET INCREASE IN NET ASSETS RESULTING FROM OPERATIONS | | $ | 1,320,325 | | | $ | 2,013,744 | |
| | | | | | | | |
The accompanying notes are an integral part of these financial statements.
| | | | | | | | | | | | | | | | | | | | | | | | | | |
AMG Managers
Montag & Caldwell
Growth Fund | | | AMG River Road
Dividend All
Cap Value Fund | | | AMG River Road
Dividend All Cap
Value Fund II | | | AMG Managers
Fairpointe
Mid Cap Fund | | | AMG Managers
Montag & Caldwell
Mid Cap
Growth Fund | | | AMG Managers
LMCG
Small Cap
Growth Fund | | | AMG River Road
Select Value
Fund | |
| $ | 5,105,529 | | | $ | 12,112,956 | | | $ | 1,746,699 | | | $ | 19,363,863 | | | $ | 22,148 | | | $ | 417,371 | | | $ | 246,300 | |
| | — | | | | 88,993 | | | | 11,122 | | | | — | | | | 199 | | | | 6,039 | | | | 8,812 | |
| | — | | | | (52,327 | ) | | | (7,544 | ) | | | (58,932 | ) | | | (189 | ) | | | — | | | | — | |
| | | | | | | | | | | | | | | | | | | | | | | | | | |
| | 5,105,529 | | | | 12,149,622 | | | | 1,750,277 | | | | 19,304,931 | | | | 22,158 | | | | 423,410 | | | | 255,112 | |
| | | | | | | | | | | | | | | | | | | | | | | | | | |
| | 3,547,675 | | | | 2,745,941 | | | | 374,837 | | | | 12,024,922 | | | | 32,226 | | | | 584,906 | | | | 160,468 | |
| | 826,275 | | | | 686,485 | | | | 93,709 | | | | 2,975,238 | | | | 6,445 | | | | 97,484 | | | | 29,987 | |
| | 509,430 | | | | 399,122 | | | | 4,570 | | | | 1,921,408 | | | | 5,424 | | | | 25,450 | | | | 6,445 | |
| | 13,529 | | | | — | | | | — | | | | — | | | | — | | | | — | | | | — | |
| | 122,263 | | | | 95,789 | | | | 1,097 | | | | 614,851 | | | | 1,084 | | | | 18,248 | | | | 1,547 | |
| | 206,623 | | | | 178,805 | | | | 36,387 | | | | 971,943 | | | | 1,064 | | | | 23,353 | | | | 10,448 | |
| | 1,353 | | | | — | | | | — | | | | — | | | | — | | | | — | | | | — | |
| | 63,538 | | | | 15,964 | | | | 4,740 | | | | 105,215 | | | | 489 | | | | 10,012 | | | | 4,381 | |
| | 43,620 | | | | 25,666 | | | | 5,829 | | | | 108,757 | | | | 2,363 | | | | 9,576 | | | | 4,827 | |
| | 56,709 | | | | 38,767 | | | | 15,749 | | | | 128,408 | | | | 11,166 | | | | 14,837 | | | | 12,096 | |
| | 58,531 | | | | 23,140 | | | | 16,345 | | | | 39,579 | | | | 12,642 | | | | 17,494 | | | | 13,895 | |
| | 76,582 | | | | 19,179 | | | | 3,069 | | | | 159,798 | | | | 753 | | | | 14,681 | | | | 2,368 | |
| | 58,337 | | | | 38,035 | | | | 5,396 | | | | 165,657 | | | | 418 | | | | 5,861 | | | | 1,861 | |
| | 30,023 | | | | 18,373 | | | | 3,045 | | | | 80,074 | | | | 787 | | | | 3,434 | | | | 1,510 | |
| | | | | | | | | | | | | | | | | | | | | | | | | | |
| | 5,614,488 | | | | 4,285,266 | | | | 564,773 | | | | 19,295,850 | | | | 74,861 | | | | 825,336 | | | | 249,833 | |
| | | | | | | | | | | | | | | | | | | | | | | | | | |
| | — | | | | — | | | | — | | | | — | | | | (26,470 | ) | | | (88,893 | ) | | | (12,949 | ) |
| | (102,965 | ) | | | (8,167 | ) | | | (674 | ) | | | — | | | | (965 | ) | | | (8,907 | ) | | | (3,504 | ) |
| | (33,602 | ) | | | (24,256 | ) | | | — | | | | (128,927 | ) | | | — | | | | — | | | | — | |
| | | | | | | | | | | | | | | | | | | | | | | | | | |
| | 5,477,921 | | | | 4,252,843 | | | | 564,099 | | | | 19,166,923 | | | | 47,426 | | | | 727,536 | | | | 233,380 | |
| | | | | | | | | | | | | | | | | | | | | | | | | | |
| | (372,392 | ) | | | 7,896,779 | | | | 1,186,178 | | | | 138,008 | | | | (25,268 | ) | | | (304,126 | ) | | | 21,732 | |
| | | | | | | | | | | | | | | | | | | | | | | | | | |
| | 36,490,102 | | | | 34,805,437 | | | | 5,005,162 | | | | 250,331,075 | | | | 428,908 | | | | 1,868,093 | | | | 3,585,521 | |
| | 53,103,436 | | | | 50,389,277 | | | | 6,854,737 | | | | 423,335,698 | | | | 523,733 | | | | 19,628,954 | | | | 4,389,445 | |
| | 89,593,538 | | | | 85,194,714 | | | | 11,859,899 | | | | 673,666,773 | | | | 952,641 | | | | 21,497,047 | | | | 7,974,966 | |
| | | | | | | | | | | | | | | | | | | | | | | | | | |
| $ | 89,221,146 | | | $ | 93,091,493 | | | $ | 13,046,077 | | | $ | 673,804,781 | | | $ | 927,373 | | | $ | 21,192,921 | | | $ | 7,996,698 | |
| | | | | | | | | | | | | | | | | | | | | | | | | | |
AMG Funds
| | |
| Statements of Operations – continued | | |
| For the Six Months Ended April 30, 2017 | | |
| | | | | | | | |
| | | AMG River Road
Small Cap
Value Fund | | | AMG Managers
Silvercrest
Small Cap
Fund | |
INVESTMENT INCOME: | | | | | | | | |
Dividends | | $ | 1,607,802 | | | $ | 1,533,462 | |
Dividends from affiliated securities | | | — | | | | — | |
Securities lending income | | | 34,181 | | | | 1,105 | |
Interest Income | | | — | | | | — | |
Foreign taxes withheld | | | (24,087 | ) | | | — | |
| | | | | | | | |
Total investment income | | | 1,617,896 | | | | 1,534,567 | |
| | | | | | | | |
EXPENSES: | | | | | | | | |
Investment advisory fees and management fees | | | 1,175,607 | | | | 1,104,045 | |
Administrative fees | | | 220,427 | | | | 184,008 | |
Distribution fees—Class N | | | 32,121 | | | | 30,909 | |
Shareholder servicing fees—Class N | | | 11,564 | | | | 8,655 | |
Shareholder servicing fees—Class I | | | 120,692 | | | | 77,216 | |
Transfer agent fees | | | 5,353 | | | | 3,396 | |
Custodian fees | | | 10,741 | | | | 9,256 | |
Professional fees | | | 20,137 | | | | 17,866 | |
Registration fees | | | 14,622 | | | | 23,051 | |
Interest and dividend expense on securities sold-short | | | — | | | | — | |
Amortization of offering costs | | | — | | | | — | |
Reports to shareholders | | | 6,673 | | | | 6,470 | |
Trustees fees and expenses | | | 12,432 | | | | 9,663 | |
Miscellanous | | | 6,240 | | | | 4,963 | |
Repayment of prior reimbursement | | | — | | | | — | |
| | | | | | | | |
Total expenses before offsets/ reductions | | | 1,636,609 | | | | 1,479,498 | |
| | | | | | | | |
Expense reimbursements | | | — | | | | (37,864 | ) |
Expense reductions | | | (10,645 | ) | | | (37,507 | ) |
Fees waivers | | | (3,233 | ) | | | — | |
| | | | | | | | |
Net expenses | | | 1,622,731 | | | | 1,404,127 | |
| | | | | | | | |
NET INVESTMENT INCOME (LOSS) | | | (4,835 | ) | | | 130,440 | |
| | | | | | | | |
NET REALIZED AND UNREALIZED GAIN (LOSS) ON INVESTMENTS: | | | | | | | | |
Net realized gain (loss) on investments | | | 25,217,421 | | | | 6,870,302 | |
Net realized loss on securities sold short | | | — | | | | — | |
Net realized gain (loss) on foreign currency transactions | | | — | | | | — | |
Capital gain distributions received | | | — | | | | — | |
Net change in unrealized appreciation (depreciation) of investments | | | 25,701,774 | | | | 29,306,702 | |
Net change in unrealized appreciation (depreciation) of securities sold short | | | — | | | | — | |
Net change in unrealized appreciation (depreciation) of translation of assets and liabilities denominated in foreign currency | | | — | | | | — | |
| | | | | | | | |
NET REALIZED AND UNREALIZED GAIN (LOSS) ON INVESTMENTS | | | 50,919,195 | | | | 36,177,004 | |
| | | | | | | | |
NET INCREASE IN NET ASSETS RESULTING FROM OPERATIONS | | $ | 50,914,360 | | | $ | 36,307,444 | |
| | | | | | | | |
The accompanying notes are an integral part of these financial statements.
| | | | | | | | | | | | | | | | | | | | | | | | | | |
AMG GW&K
U.S. Small Cap
Growth Fund | | | AMG Managers
DoubleLine Core
Plus Bond Fund | | | AMG Managers
Lake Partners
LASSO Alternatives
Fund | | | AMG River Road
Long-Short
Fund | | | AMG Managers
Guardian
Capital Global
Dividend Fund | | | AMG Managers
Pictet
International
Fund | | | AMG Managers
Value Partners
Asia Dividend
Fund | |
| $ | 110,564 | | | $ | 32,700 | | | $ | 513,330 | | | $ | 299,520 | | | $ | 546,060 | | | $ | 16,402,353 | | | $ | 82,057 | |
| | — | | | | 138,009 | | | | — | | | | — | | | | — | | | | — | | | | — | |
| | 7,105 | | | | 17,698 | | | | — | | | | — | | | | 4,355 | | | | 78,895 | | | | 38 | |
| | — | | | | 13,128,768 | | | | 4 | | | | 7,141 | | | | 437 | | | | (6,474 | ) | | | 3,972 | |
| | (1,342 | ) | | | (40,483 | ) | | | — | | | | (5,682 | ) | | | (35,983 | ) | | | (1,135,682 | ) | | | (8,678 | ) |
| | | | | | | | | | | | | | | | | | | | | | | | | | |
| | 116,327 | | | | 13,276,692 | | | | 513,334 | | | | 300,979 | | | | 514,869 | | | | 15,339,092 | | | | 77,389 | |
| | | | | | | | | | | | | | | | | | | | | | | | | | |
| | 153,124 | | | | 1,502,315 | | | | 408,450 | | | | 209,282 | | | | 107,575 | | | | 5,712,934 | | | | 33,342 | |
| | 29,929 | | | | 500,772 | | | | 68,075 | | | | 33,430 | | | | 23,052 | | | | 1,071,175 | | | | 6,252 | |
| | 37,801 | | | | 323,555 | | | | 36,289 | | | | 10,205 | | | | 820 | | | | 258 | | | | — | |
| | 10,584 | | | | 103,538 | | | | 8,709 | | | | 3,266 | | | | — | | | | 72 | | | | — | |
| | 3,368 | | | | 163,540 | | | | 18,521 | | | | 14,563 | | | | — | | | | 499,809 | | | | — | |
| | 9,443 | | | | 13,525 | | | | 3,297 | | | | 1,804 | | | | 119 | | | | 88,856 | | | | 158 | |
| | 8,624 | | | | 106,711 | | | | 5,194 | | | | 8,043 | | | | 7,697 | | | | 124,320 | | | | 22,694 | |
| | 15,615 | | | | 42,599 | | | | 14,940 | | | | 15,789 | | | | 12,898 | | | | 49,774 | | | | 9,540 | |
| | 21,412 | | | | 43,707 | | | | 16,730 | | | | 17,940 | | | | 15,217 | | | | 61,953 | | | | 19,264 | |
| | — | | | | — | | | | — | | | | 413,612 | | | | — | | | | — | | | | — | |
| | — | | | | — | | | | — | | | | — | | | | — | | | | — | | | | 7,832 | |
| | 15,356 | | | | 34,927 | | | | 4,709 | | | | 2,503 | | | | 606 | | | | 25,428 | | | | 105 | |
| | 3,100 | | | | 30,260 | | | | 4,709 | | | | 2,060 | | | | 743 | | | | 50,589 | | | | 350 | |
| | 2,946 | | | | 13,813 | | | | 3,044 | | | | 1,574 | | | | 925 | | | | 23,923 | | | | 757 | |
| | — | | | | — | | | | — | | | | — | | | | — | | | | 120,411 | | | | — | |
| | | | | | | | | | | | | | | | | | | | | | | | | | |
| | 311,302 | | | | 2,879,262 | | | | 592,667 | | | | 734,071 | | | | 169,652 | | | | 7,829,502 | | | | 100,294 | |
| | | | | | | | | | | | | | | | | | | | | | | | | | |
| | (62,482 | ) | | | (232,254 | ) | | | (34,469 | ) | | | (22,970 | ) | | | (7,469 | ) | | | — | | | | (52,365 | ) |
| | (14,889 | ) | | | — | | | | — | | | | (4,356 | ) | | | — | | | | — | | | | — | |
| | — | | | | (37,263 | ) | | | — | | | | — | | | | — | | | | (39,277 | ) | | | — | |
| | | | | | | | | | | | | | | | | | | | | | | | | | |
| | 233,931 | | | | 2,609,745 | | | | 558,198 | | | | 706,745 | | | | 162,183 | | | | 7,790,225 | | | | 47,929 | |
| | | | | | | | | | | | | | | | | | | | | | | | | | |
| | (117,604 | ) | | | 10,666,947 | | | | (44,864 | ) | | | (405,766 | ) | | | 352,686 | | | | 7,548,867 | | | | 29,460 | |
| | | | | | | | | | | | | | | | | | | | | | | | | | |
| | 2,729,629 | | | | (5,150,345 | ) | | | 555,428 | | | | 2,691,531 | | | | 247,613 | | | | 31,918,030 | | | | 234,484 | |
| | — | | | | — | | | | — | | | | (1,283,338 | ) | | | — | | | | — | | | | — | |
| | — | | | | — | | | | — | | | | (43,973 | ) | | | 201 | | | | (614,878 | ) | | | 5,318 | |
| | — | | | | — | | | | 467,596 | | | | — | | | | — | | | | — | | | | — | |
| | 4,138,875 | | | | (1,011,555 | ) | | | 1,507,364 | | | | 2,402,708 | | | | 2,624,859 | | | | 141,498,193 | | | | 656,818 | |
| | — | | | | — | | | | — | | | | (53,309 | ) | | | — | | | | — | | | | — | |
| | — | | | | — | | | | — | | | | 29,334 | | | | (1,464 | ) | | | 129,359 | | | | (163 | ) |
| | | | | | | | | | | | | | | | | | | | | | | | | | |
| | 6,868,504 | | | | (6,161,900 | ) | | | 2,530,388 | | | | 3,742,953 | | | | 2,871,209 | | | | 172,930,704 | | | | 896,457 | |
| | | | | | | | | | | | | | | | | | | | | | | | | | |
| $ | 6,750,900 | | | $ | 4,505,047 | | | $ | 2,485,524 | | | $ | 3,337,187 | | | $ | 3,223,895 | | | $ | 180,479,571 | | | $ | 925,917 | |
| | | | | | | | | | | | | | | | | | | | | | | | | | |
AMG Funds
| | |
| Statements of Operations – continued | | |
| For the Six Months Ended April 30, 2017 | | |
| | | | |
| | | AMG Managers
Montag & Caldwell
Balanced Fund | |
INVESTMENT INCOME: | | | | |
Dividends | | $ | 93,897 | |
Securities lending income | | | 81 | |
Interest Income | | | 80,499 | |
| | | | |
Total investment income | | | 174,477 | |
| | | | |
EXPENSES: | | | | |
Investment advisory fees and management fees | | | 80,001 | |
Administrative fees | | | 18,462 | |
Distribution fees—Class N | | | 5,090 | |
Shareholder servicing fees—Class N | | | 6,572 | |
Shareholder servicing fees—Class I | | | 813 | |
Transfer agent fees | | | 4,768 | |
Custodian fees | | | 5,479 | |
Professional fees | | | 13,701 | |
Registration fees | | | 18,290 | |
Reports to shareholders | | | 2,539 | |
Trustees fees and expenses | | | 1,367 | |
Miscellanous | | | 1,195 | |
| | | | |
Total expenses before offsets/ reductions | | | 158,277 | |
| | | | |
Expense reimbursements | | | (17,801 | ) |
Expense reductions | | | (1,989 | ) |
| | | | |
Net expenses | | | 138,487 | |
| | | | |
NET INVESTMENT INCOME | | | 35,990 | |
| | | | |
NET REALIZED AND UNREALIZED GAIN ON INVESTMENTS: | | | | |
Net realized gain on investments | | | 470,365 | |
Net change in unrealized appreciation (depreciation) of investments | | | 677,069 | |
| | | | |
NET REALIZED AND UNREALIZED GAIN ON INVESTMENTS | | | 1,147,434 | |
| | | | |
NET INCREASE IN NET ASSETS RESULTING FROM OPERATIONS | | $ | 1,183,424 | |
| | | | |
The accompanying notes are an integral part of these financial statements.
This page intentionally left blank.
AMG Funds
| | |
| | |
| Statements of Changes in Net Assets | | |
| | | | | | | | | | | | | | | | |
| | | AMG Managers
Fairpointe Focused
Equity Fund | | | AMG
River Road Focused
Absolute Value Fund | |
| | | Six Months Ended
April 30, 2017
(unaudited) | | | Year Ended
October 31, 2016 | | | Six Months Ended
April 30, 2017
(unaudited) | | | Period Ended
October 31, 2016(a) | |
NET ASSETS at Beginning of Period | | $ | 7,034,740 | | | $ | 6,456,792 | | | $ | 11,800,969 | | | $ | — | |
| | | | | | | | | | | | | | | | |
Increase (decrease) in net assets from operations: | | | | | | | | | | | | | | | | |
Net investment income (loss) | | | 27,883 | | | | 66,906 | | | | 40,472 | | | | 62,755 | |
Net realized gain (loss) on investments | | | (1,541 | ) | | | (14,597 | ) | | | 804,413 | | | | 711,183 | |
Net change in unrealized appreciation (depreciation) of investments | | | 1,293,983 | | | | 297,720 | | | | 1,168,859 | | | | 508,194 | |
| | | | | | | | | | | | | | | | |
Net increase (decrease) in net assets from operations | | | 1,320,325 | | | | 350,029 | | | | 2,013,744 | | | | 1,282,132 | |
| | | | | | | | | | | | | | | | |
Distributions to shareholders from: | | | | | | | | | | | | | | | | |
Net investment income: | | | | | | | | | | | | | | | | |
Class N | | | (874 | ) | | | (21,065 | ) | | | (7,854 | ) | | | — | |
Class I | | | (68,181 | ) | | | (46,607 | ) | | | (112,912 | ) | | | — | |
Class R | | | — | | | | — | | | | — | | | | — | |
Net realized gain on investments: | | | | | | | | | | | | | | | | |
Class N | | | — | | | | — | | | | (66,646 | ) | | | — | |
Class I | | | — | | | | — | | | | (842,368 | ) | | | — | |
Class R | | | — | | | | — | | | | — | | | | — | |
| | | | | | | | | | | | | | | | |
Total distributions | | | (69,055 | ) | | | (67,672 | ) | | | (1,029,780 | ) | | | — | |
| | | | | | | | | | | | | | | | |
Capital share transactions: | | | | | | | | | | | | | | | | |
Net increase (decrease) from capital share transactions | | | (1,158,576 | ) | | | 295,591 | | | | 6,054,833 | | | | 10,518,837 | |
| | | | | | | | | | | | | | | | |
Total increase (decrease) in net assets | | | 92,694 | | | | 577,948 | | | | 7,038,797 | | | | 11,800,969 | |
| | | | | | | | | | | | | | | | |
NET ASSETS at End of Period | | $ | 7,127,434 | | | $ | 7,034,740 | | | $ | 18,839,766 | | | $ | 11,800,969 | |
| | | | | | | | | | | | | | | | |
Undistributed (distributions in excess of)net investment income | | $ | 13,371 | | | $ | 54,543 | | | $ | (2,756 | ) | | $ | 77,538 | |
| | | | | | | | | | | | | | | | |
| (a) | The commencement of investment operations for the AMG River Road Focused Absolute Value Fund was November 3, 2015. |
The accompanying notes are an integral part of these financial statements.
| | | | | | | | | | | | | | | | | | | | | | |
AMG Managers
Montag & Caldwell
Growth Fund | | | AMG River Road Dividend
All Cap Value Fund | | | AMG River Road Dividend
All Cap Value Fund II | |
Six Months Ended April 30, 2017
(unaudited) | | | Year Ended
October 31, 2016 | | | Six Months Ended
April 30, 2017
(unaudited) | | | Year Ended
October 31, 2016 | | | Six Months Ended
April 30, 2017
(unaudited) | | | Year Ended
October 31, 2016 | |
| $ | 1,344,784,586 | | | $ | 2,185,832,613 | | | $ | 850,861,237 | | | $ | 849,977,579 | | | $ | 117,925,990 | | | $ | 124,343,937 | |
| | | | | | | | | | | | | | | | | | | | | | |
| | (372,392 | ) | | | 6,345,072 | | | | 7,896,779 | | | | 17,015,871 | | | | 1,186,178 | | | | 2,615,674 | |
| | 36,490,102 | | | | 114,108,879 | | | | 34,805,437 | | | | 59,263,397 | | | | 5,005,162 | | | | 4,771,695 | |
| | 53,103,436 | | | | (147,303,621 | ) | | | 50,389,277 | | | | (25,544,317 | ) | | | 6,854,737 | | | | 1,173,678 | |
| | | | | | | | | | | | | | | | | | | | | | |
| | 89,221,146 | | | | (26,849,670 | ) | | | 93,091,493 | | | | 50,734,951 | | | | 13,046,077 | | | | 8,561,047 | |
| | | | | | | | | | | | | | | | | | | | | | |
| | (828,374 | ) | | | (2,341,331 | ) | | | (3,686,131 | ) | | | (4,651,630 | ) | | | (35,936 | ) | | | (57,390 | ) |
| | (4,913,845 | ) | | | (5,950,061 | ) | | | (7,498,821 | ) | | | (10,931,278 | ) | | | (1,321,114 | ) | | | (2,436,119 | ) |
| | (8,072 | ) | | | (3,417 | ) | | | — | | | | — | | | | — | | | | — | |
| | (39,690,379 | ) | | | (195,686,596 | ) | | | (20,724,974 | ) | | | (19,557,150 | ) | | | (139,259 | ) | | | (41,705 | ) |
| | (72,425,486 | ) | | | (256,099,119 | ) | | | (38,518,497 | ) | | | (49,288,884 | ) | | | (4,633,931 | ) | | | (1,625,842 | ) |
| | (535,608 | ) | | | (1,528,281 | ) | | | — | | | | — | | | | — | | | | — | |
| | | | | | | | | | | | | | | | | | | | | | |
| | (118,401,764 | ) | | | (461,608,805 | ) | | | (70,428,423 | ) | | | (84,428,942 | ) | | | (6,130,240 | ) | | | (4,161,056 | ) |
| | | | | | | | | | | | | | | | | | | | | | |
| | (311,294,502 | ) | | | (352,589,552 | ) | | | 86,456,689 | | | | 34,577,649 | | | | (436,517 | ) | | | (10,817,938 | ) |
| | | | | | | | | | | | | | | | | | | | | | |
| | (340,475,120 | ) | | | (841,048,027 | ) | | | 109,119,759 | | | | 883,658 | | | | 6,479,320 | | | | (6,417,947 | ) |
| | | | | | | | | | | | | | | | | | | | | | |
| $ | 1,004,309,466 | | | $ | 1,344,784,586 | | | $ | 959,980,996 | | | $ | 850,861,237 | | | $ | 124,405,310 | | | $ | 117,925,990 | |
| | | | | | | | | | | | | | | | | | | | | | |
| $ | (2,104,494 | ) | | $ | 4,018,189 | | | $ | (3,662,553 | ) | | $ | (374,380 | ) | | $ | (328,979 | ) | | $ | (158,107 | ) |
| | | | | | | | | | | | | | | | | | | | | | |
AMG Funds
| | |
| | |
| Statements of Changes in Net Assets – continued | | |
| | | | | | | | | | | | | | | | |
| | | AMG Managers
Fairpointe Mid Cap Fund | | | AMG Managers
Montag & Caldwell Mid Cap
Growth Fund | |
| | | Six Months Ended
April 30, 2017
(unaudited) | | | Year Ended
October 31, 2016 | | | Six Months Ended
April 30, 2017
(unaudited) | | | Year Ended
October 31, 2016 | |
NET ASSETS at Beginning of Period | | $ | 3,510,979,748 | | | $ | 4,700,395,942 | | | $ | 8,197,963 | | | $ | 11,053,000 | |
| | | | | | | | | | | | | | | | |
Increase in net assets from operations: | | | | | | | | | | | | | | | | |
Net investment income (loss) | | | 138,008 | | | | 22,055,241 | | | | (25,268 | ) | | | (50,872 | ) |
Net realized gain (loss) on investments | | | 250,331,075 | | | | 157,821,250 | | | | 428,908 | | | | 629,604 | |
Net change in unrealized appreciation (depreciation) of investments | | | 423,335,698 | | | | (27,081,901 | ) | | | 523,733 | | | | (611,887 | ) |
| | | | | | | | | | | | | | | | |
Net increase (decrease) in net assets from operations | | | 673,804,781 | | | | 152,794,590 | | | | 927,373 | | | | (33,155 | ) |
| | | | | | | | | | | | | | | | |
Distributions to shareholders from: | | | | | | | | | | | | | | | | |
Net investment income: | | | | | | | | | | | | | | | | |
Class N | | | (4,738,011 | ) | | | (5,351,086 | ) | | | (12,389 | ) | | | — | |
Class I | | | (13,394,059 | ) | | | (15,653,440 | ) | | | (22,879 | ) | | | — | |
Net realized gain on investments: | | | | | | | | | | | | | | | | |
Class N | | | (61,100,311 | ) | | | (95,369,480 | ) | | | (297,569 | ) | | | (556,661 | ) |
Class I | | | (96,561,948 | ) | | | (139,128,106 | ) | | | (291,792 | ) | | | (693,830 | ) |
| | | | | | | | | | | | | | | | |
Total distributions | | | (175,794,329 | ) | | | (255,502,112 | ) | | | (624,629 | ) | | | (1,250,491 | ) |
| | | | | | | | | | | | | | | | |
Capital share transactions: | | | | | | | | | | | | | | | | |
Net increase (decrease) from capital share transactions | | | 117,123,767 | | | | (1,086,708,672 | ) | | | 489,133 | | | | (1,571,391 | ) |
| | | | | | | | | | | | | | | | |
Total increase (decrease) in net assets | | | 615,134,219 | | | | (1,189,416,194 | ) | | | 791,877 | | | | (2,855,037 | ) |
| | | | | | | | | | | | | | | | |
NET ASSETS at End of Period | | $ | 4,126,113,967 | | | $ | 3,510,979,748 | | | $ | 8,989,840 | | | $ | 8,197,963 | |
| | | | | | | | | | | | | | | | |
Undistributed (distributions in excess of) net investment income | | $ | (4,876,547 | ) | | $ | 13,117,515 | | | $ | (106,164 | ) | | $ | (45,628 | ) |
| | | | | | | | | | | | | | | | |
The accompanying notes are an integral part of these financial statements.
| | | | | | | | | | | | | | | | | | | | | | |
AMG Managers
LMCG Small Cap
Growth Fund | | | AMG River Road
Select Value Fund | | | AMG River Road
Small Cap Value Fund | |
Six Months Ended
April 30, 2017
(unaudited) | | | Year Ended
October 31, 2016 | | | Six Months Ended
April 30, 2017
(unaudited) | | | Year Ended
October 31, 2016 | | | Six Months Ended
April 30, 2017
(unaudited) | | | Year Ended
October 31, 2016 | |
| $ | 111,836,379 | | | $ | 231,382,604 | | | $ | 39,854,402 | | | $ | 97,111,333 | | | $ | 268,518,060 | | | $ | 270,438,198 | |
| | | | | | | | | | | | | | | | | | | | | | |
| | (304,126 | ) | | | (1,188,638 | ) | | | 21,732 | | | | (124,066 | ) | | | (4,835 | ) | | | (219,950 | ) |
| | 1,868,093 | | | | (34,954,281 | ) | | | 3,585,521 | | | | 3,630,244 | | | | 25,217,421 | | | | 14,928,166 | |
| | 19,628,954 | | | | 2,727,088 | | | | 4,389,445 | | | | (1,228,248 | ) | | | 25,701,774 | | | | 3,659,498 | |
| | | | | | | | | | | | | | | | | | | | | | |
| | 21,192,921 | | | | (33,415,831 | ) | | | 7,996,698 | | | | 2,277,930 | | | | 50,914,360 | | | | 18,367,714 | |
| | | | | | | | | | | | | | | | | | | | | | |
| | — | | | | — | | | | (6,217 | ) | | | — | | | | — | | | | — | |
| | — | | | | — | | | | (124,646 | ) | | | (153,030 | ) | | | — | | | | — | |
| | — | | | | (26,929 | ) | | | (388,245 | ) | | | (697,557 | ) | | | (1,206,779 | ) | | | (1,286,224 | ) |
| | — | | | | (13,737 | ) | | | (2,623,776 | ) | | | (7,272,173 | ) | | | (13,057,218 | ) | | | (13,941,244 | ) |
| | | | | | | | | | | | | | | | | | | | | | |
| | — | | | | (40,666 | ) | | | (3,142,884 | ) | | | (8,122,760 | ) | | | (14,263,997 | ) | | | (15,227,468 | ) |
| | | | | | | | | | | | | | | | | | | | | | |
| | 1,799,042 | | | | (86,089,728 | ) | | | (3,784,755 | ) | | | (51,412,101 | ) | | | (3,048,211 | ) | | | (5,060,384 | ) |
| | | | | | | | | | | | | | | | | | | | | | |
| | 22,991,963 | | | | (119,546,225 | ) | | | 1,069,059 | | | | (57,256,931 | ) | | | 33,602,152 | | | | (1,920,138 | ) |
| | | | | | | | | | | | | | | | | | | | | | |
| $ | 134,828,342 | | | $ | 111,836,379 | | | $ | 40,923,461 | | | $ | 39,854,402 | | | $ | 302,120,212 | | | $ | 268,518,060 | |
| | | | | | | | | | | | | | | | | | | | | | |
| $ | (1,287,768 | ) | | $ | (983,642 | ) | | $ | (109,131 | ) | | $ | — | | | $ | (4,835 | ) | | $ | — | |
| | | | | | | | | | | | | | | | | | | | | | |
AMG Funds
| | |
| | |
| Statements of Changes in Net Assets – continued | | |
| | | | | | | | | | | | | | | | |
| | | AMG Managers
Silvercrest
Small Cap Fund | | | AMG GW&K
U.S. Small Cap Growth Fund | |
| | | Six Months Ended
April 30, 2017
(unaudited) | | | Year Ended
October 31, 2016 | | | Six Months Ended
April 30, 2017
(unaudited) | | | Year Ended
October 31, 2016 | |
NET ASSETS at Beginning of Period | | $ | 202,192,238 | | | $ | 164,463,697 | | | $ | 42,009,081 | | | $ | 548,685,895 | |
| | | | | | | | | | | | | | | | |
Increase (decrease) in net assets from operations: | | | | | | | | | | | | | | | | |
Net investment income (loss) | | | 130,440 | | | | 671,845 | | | | (117,604 | ) | | | (892,635 | ) |
Net realized gain (loss) on investments,securities sold short, capital gain distributions received and foreign currency transactions | | | 6,870,302 | | | | 1,621,595 | | | | 2,729,629 | | | | 57,625,496 | |
Net change in unrealized appreciation (depreciation) of investments, securities sold short and translation of assets and liabilities denominated in foreign currency | | | 29,306,702 | | | | 9,200,867 | | | | 4,138,875 | | | | (74,735,996 | ) |
| | | | | | | | | | | | | | | | |
Net increase (decrease) in net assets from operations | | | 36,307,444 | | | | 11,494,307 | | | | 6,750,900 | | | | (18,003,135 | ) |
| | | | | | | | | | | | | | | | |
Distributions to shareholders from: | | | | | | | | | | | | | | | | |
Net investment income: | | | | | | | | | | | | | | | | |
Class N | | | — | | | | (50,273 | ) | | | — | | | | — | |
Class I | | | (462,292 | ) | | | (577,200 | ) | | | — | | | | — | |
Net realized gain on investments: | | | | | | | | | | | | | | | | |
Class N | | | (172,909 | ) | | | (734,281 | ) | | | (44,633 | ) | | | (58,589,159 | ) |
Class I | | | (1,603,029 | ) | | | (5,513,361 | ) | | | (14,009 | ) | | | (97,356,917 | ) |
| | | | | | | | | | | | | | | | |
Total distributions | | | (2,238,230 | ) | | | (6,875,115 | ) | | | (58,642 | ) | | | (155,946,076 | ) |
| | | | | | | | | | | | | | | | |
Capital share transactions: | | | | | | | | | | | | | | | | |
Net increase (decrease) from capital share transactions | | | 17,845,683 | | | | 33,109,349 | | | | (11,365,798 | ) | | | (332,727,603 | ) |
| | | | | | | | | | | | | | | | |
Total increase (decrease) in net assets | | | 51,914,897 | | | | 37,728,541 | | | | (4,673,540 | ) | | | (506,676,814 | ) |
| | | | | | | | | | | | | | | | |
NET ASSETS at End of Period | | $ | 254,107,135 | | | $ | 202,192,238 | | | $ | 37,335,541 | | | $ | 42,009,081 | |
| | | | | | | | | | | | | | | | |
Undistributed (distributions in excess of) net investment income | | $ | (75,750 | ) | | $ | 256,102 | | | $ | (720,715 | ) | | $ | (603,111 | ) |
| | | | | | | | | | | | | | | | |
The accompanying notes are an integral part of these financial statements.
| | | | | | | | | | | | | | | | | | | | | | |
AMG Managers
DoubleLine Core Plus
Bond Fund | | | AMG Managers
Lake Partners
LASSO Alternatives Fund | | | AMG River Road
Long-Short Fund | |
Six Months Ended
April 30, 2017
(unaudited) | | | Year Ended
October 31, 2016 | | | Six Months Ended
April 30, 2017
(unaudited) | | | Year Ended
October 31, 2016 | | | Six Months Ended
April 30, 2017
(unaudited) | | | Year Ended
October 31, 2016 | |
| $ | 707,216,179 | | | $ | 492,337,589 | | | $ | 102,684,051 | | | $ | 209,739,030 | | | $ | 46,261,507 | | | $ | 77,070,545 | |
| | | | | | | | | | | | | | | | | | | | | | |
| | 10,666,947 | | | | 19,598,374 | | | | (44,864 | ) | | | 637,553 | | | | (405,766 | ) | | | (824,629 | ) |
| | (5,150,345 | ) | | | 7,058,091 | | | | 1,023,024 | | | | 679,033 | | | | 1,364,220 | | | | (765,605 | ) |
| | (1,011,555 | ) | | | 7,311,823 | | | | 1,507,364 | | | | (3,892,607 | ) | | | 2,378,733 | | | | 498,635 | |
| | | | | | | | | | | | | | | | | | | | | | |
| | 4,505,047 | | | | 33,968,288 | | | | 2,485,524 | | | | (2,576,021 | ) | | | 3,337,187 | | | | (1,091,599 | ) |
| | | | | | | | | | | | | | | | | | | | | | |
| | (4,569,287 | ) | | | (8,449,442 | ) | | | — | | | | — | | | | — | | | | — | |
| | (7,775,430 | ) | | | (11,766,309 | ) | | | — | | | | (335,854 | ) | | | — | | | | — | |
| | (566,979 | ) | | | — | | | | (123,358 | ) | | | (2,460,419 | ) | | | — | | | | (688,352 | ) |
| | (780,506 | ) | | | — | | | | (263,958 | ) | | | (8,718,084 | ) | | | — | | | | (1,158,800 | ) |
| | | | | | | | | | | | | | | | | | | | | | |
| | (13,692,202 | ) | | | (20,215,751 | ) | | | (387,316 | ) | | | (11,514,357 | ) | | | — | | | | (1,847,152 | ) |
| | | | | | | | | | | | | | | | | | | | | | |
| | (64,988,168 | ) | | | 201,126,053 | | | | (25,712,410 | ) | | | (92,964,601 | ) | | | (10,401,231 | ) | | | (27,870,287 | ) |
| | | | | | | | | | | | | | | | | | | | | | |
| | (74,175,323 | ) | | | 214,878,590 | | | | (23,614,202 | ) | | | (107,054,979 | ) | | | (7,064,044 | ) | | | (30,809,038 | ) |
| | | | | | | | | | | | | | | | | | | | | | |
| $ | 633,040,856 | | | $ | 707,216,179 | | | $ | 79,069,849 | | | $ | 102,684,051 | | | $ | 39,197,463 | | | $ | 46,261,507 | |
| | | | | | | | | | | | | | | | | | | | | | |
| $ | (1,259,808 | ) | | $ | 417,962 | | | $ | (517,802 | ) | | $ | (472,938 | ) | | $ | (1,123,158 | ) | | $ | (717,392 | ) |
| | | | | | | | | | | | | | | | | | | | | | |
AMG Funds
| | |
| | |
| Statements of Changes in Net Assets – continued | | |
| | | | | | | | | | | | | | | | |
| | | AMG Managers
Guardian Capital
Global Dividend Fund | | | AMG Managers
Pictet International Fund | |
| | | Six Months Ended
April 30, 2017
(unaudited) | | | Year Ended
October 31, 2016 | | | Six Months Ended
April 30, 2017
(unaudited) | | | Year Ended
October 31, 2016 | |
NET ASSETS at Beginning of Period | | $ | 28,983,684 | | | $ | 4,345,783 | | | $ | 1,336,181,126 | | | $ | 50,859,091 | |
| | | | | | | | | | | | | | | | |
Increase (decrease) in net assets from operations: | | | | | | | | | | | | | | | | |
Net investment income | | | 352,686 | | | | 122,429 | | | | 7,548,867 | | | | 15,997,232 | |
Net realized gain (loss) on investments and foreign currency transactions | | | 247,814 | | | | (201,443 | ) | | | 31,303,152 | | | | 26,038,832 | |
Net change in unrealized appreciation (depreciation) of investments and translation of assets and liabilities denominated in foreign currency | | | 2,623,395 | | | | (226,865 | ) | | | 141,627,552 | | | | 26,658,010 | |
| | | | | | | | | | | | | | | | |
Net increase (decrease) in net assets from operations | | | 3,223,895 | | | | (305,879 | ) | | | 180,479,571 | | | | 68,694,074 | |
| | | | | | | | | | | | | | | | |
Distributions to shareholders from: | | | | | | | | | | | | | | | | |
Net investment income: | | | | | | | | | | | | | | | | |
Class N | | | (5,076 | ) | | | (23,942 | ) | | | (946 | ) | | | (2,108 | ) |
Class I | | | (287,453 | ) | | | (95,299 | ) | | | (19,015,823 | ) | | | (384,729 | ) |
Net realized gain on investments: | | | | | | | | | | | | | | | | |
Class N | | | — | | | | — | | | | (2,722 | ) | | | (7,188 | ) |
Class I | | | — | | | | — | | | | (28,593,440 | ) | | | (581,130 | ) |
| | | | | | | | | | | | | | | | |
Total distributions | | | (292,529 | ) | | | (119,241 | ) | | | (47,612,931 | ) | | | (975,155 | ) |
| | | | | | | | | | | | | | | | |
Capital share transactions: | | | | | | | | | | | | | | | | |
Net increase (decrease) from capital share transactions | | | 2,313,214 | | | | 25,063,021 | | | | 174,173,895 | | | | 1,217,603,116 | |
| | | | | | | | | | | | | | | | |
Total increase (decrease) in net assets | | | 5,244,580 | | | | 24,637,901 | | | | 307,040,535 | | | | 1,285,322,035 | |
| | | | | | | | | | | | | | | | |
NET ASSETS at End of Period | | $ | 34,228,264 | | | $ | 28,983,684 | | | $ | 1,643,221,661 | | | $ | 1,336,181,126 | |
| | | | | | | | | | | | | | | | |
Undistributed (distributions in excess of) net investment income | | $ | 86,553 | | | $ | 26,396 | | | $ | 5,614,073 | | | $ | 17,081,975 | |
| | | | | | | | | | | | | | | | |
(a) The commencement of investment operations for the Value Partners Asia Dividend Fund is December 16, 2015.
The accompanying notes are an integral part of these financial statements.
| | | | | | | | | | | | | | |
AMG Managers
Value Partners
Asia Dividend Fund | | | AMG Managers
Montag & Caldwell
Balanced Fund | |
Six Months Ended
April 30, 2017
(unaudited) | | | Period Ended
October 31, 2016(a) | | | Six Months Ended
April 30, 2017
(unaudited) | | | Year Ended
October 31, 2016 | |
| $ | 8,090,881 | | | $ | — | | | $ | 28,464,037 | | | $ | 30,124,934 | |
| | | | | | | | | | | | | | |
| | | | | | | | | | | | | | |
| | 29,460 | | | | 198,128 | | | | 35,990 | | | | 168,860 | |
| | 239,802 | | | | 271,025 | | | | 470,365 | | | | 2,160,564 | |
| | 656,655 | | | | 171,238 | | | | 677,069 | | | | (1,925,238 | ) |
| | | | | | | | | | | | | | |
| | 925,917 | | | | 640,391 | | | | 1,183,424 | | | | 404,186 | |
| | | | | | | | | | | | | | |
| | | | | | | | | | | | | | |
| | | | | | | | | | | | | | |
| | (14,089 | ) | | | (15,227 | ) | | | (79,281 | ) | | | (207,163 | ) |
| | (129,981 | ) | | | (150,172 | ) | | | (10,115 | ) | | | (27,438 | ) |
| | (22,865 | ) | | | — | | | | (1,915,882 | ) | | | (1,154,068 | ) |
| | (203,640 | ) | | | — | | | | (232,384 | ) | | | (170,597 | ) |
| | | | | | | | | | | | | | |
| | (370,575 | ) | | | (165,399 | ) | | | (2,237,662 | ) | | | (1,559,266 | ) |
| | | | | | | | | | | | | | |
| | | | | | | | | | | | | | |
| | 331,236 | | | | 7,615,889 | | | | (3,785,003 | ) | | | (505,817 | ) |
| | | | | | | | | | | | | | |
| | 886,578 | | | | 8,090,881 | | | | (4,839,241 | ) | | | (1,660,897 | ) |
| | | | | | | | | | | | | | |
| $ | 8,977,459 | | | $ | 8,090,881 | | | $ | 23,624,796 | | | $ | 28,464,037 | |
| | | | | | | | | | | | | | |
| $ | (23,860 | ) | | $ | 90,750 | | | $ | (378,743 | ) | | $ | (325,337 | ) |
| | | | | | | | | | | | | | |
AMG Funds
| | |
| Statement of Cash Flows (unaudited) | | |
| For the Six Months Ended April 30, 2017 | | |
| | | | |
| | | AMG
River Road
Long-Short
Fund | |
CASH FLOWS PROVIDED BY OPERATING ACTIVITIES: | | | | |
Net increase in net assets resulting from operations | | $ | 3,337,187 | |
ADJUSTMENTS TO RECONCILE NET INCREASE IN NET ASSETS RESULTING | | | | |
FROM OPERATIONS TO NET CASH PROVIDED BY OPERATING ACTIVITIES: | | | | |
Purchases of long-term investment securities | | | (40,412,149 | ) |
Proceeds from disposition of long-term investment securities | | | 58,821,394 | |
Proceeds from securities sold short | | | 19,522,060 | |
Purchases to cover securities sold short | | | (21,989,281 | ) |
Proceeds from investment distributions | | | 131,228 | |
Net purchases of short-term securities | | | (5,728,908 | ) |
Net realized gain on investments | | | (2,691,531 | ) |
Net realized loss from securities sold short | | | 1,283,338 | |
Net realized loss from foreign currency transactions | | | 43,973 | |
Net change in unrealized appreciation (depreciation) on investments | | | (2,402,708 | ) |
Net change in unrealized appreciation (depreciation) on securities sold short | | | 53,309 | |
Net change in unrealized appreciation (depreciation) on foreign currency translations of assets and liabilities | | | (29,334 | ) |
Decrease in segregated cash | | | 1,839,023 | |
Decrease in dividends, interest and other receivables | | | 6,909 | |
Increase in receivable from Affiliate | | | (6,830 | ) |
Increase in prepaid expenses | | | (211 | ) |
Increase in due to broker payable | | | 1,972,298 | |
Increase in interest and dividends on securities sold short payable | | | 37,971 | |
Decrease in investment advisory and management fees payable | | | (21,164 | ) |
Decrease in administration fees payable | | | (954 | ) |
Decrease in distribution fees payable | | | (399 | ) |
Decrease in shareholder servicing fees payable | | | (3,447 | ) |
Decrease in professional fees payable | | | (10,368 | ) |
Increase in custodian fees payable | | | 6,731 | |
Decrease in transfer agent fees payable | | | (2,796 | ) |
Decrease in registration fees payable | | | (15,477 | ) |
Decrease in trustees fees payable | | | (295 | ) |
Decrease in accrued expenses and other payables | | | (1,061 | ) |
| | | | |
Net cash provided by operating activities | | | 13,738,508 | |
| | | | |
Effect of exchange rate changes on foreign currency | | | (14,640 | ) |
CASH FLOWS FROM FINANCING ACTIVITIES: | | | | |
Proceeds from sale of shares | | | 6,512,537 | |
Cost of shares repurchased | | | (16,982,346 | ) |
| | | | |
Net cash used in financing activities | | | (10,469,809 | ) |
| | | | |
Net increase in cash | | | 3,254,059 | |
CASH: | | | | |
Beginning of period | | | 2,470,039 | |
| | | | |
End of period | | $ | 5,724,098 | |
| | | | |
The accompanying notes are an integral part of these financial statements.
AMG Funds
| | |
| AMG Managers Fairpointe Focused Equity Fund – Class N | | April 30, 2017 |
| Financial Highlights | | |
| | | | | | | | | | | | |
| | | For the
Six Months
Ended
04/30/17
(unaudited) | | | Year
Ended
10/31/16 | | | Period
Ended
10/31/15(a) | |
Net Asset Value, Beginning of Period | | $ | 9.65 | | | $ | 9.33 | | | $ | 10.00 | |
| | | | | | | | | | | | |
Income from Investment Operations: | | | | | | | | | | | | |
Net investment income (b) | | | 0.02 | | | | 0.08 | | | | 0.06 | |
Net realized and unrealized gain (loss) on investments | | | 1.75 | | | | 0.33 | | | | (0.73 | ) |
| | | | | | | | | | | | |
Total from investment operations | | | 1.77 | | | | 0.41 | | | | (0.67 | ) |
| | | | | | | | | | | | |
Less Distributions: | | | | | | | | | | | | |
Distributions from and in excess of net investment income | | | (0.02 | ) | | | (0.09 | ) | | | — | |
| | | | | | | | | | | | |
Total distributions | | | (0.02 | ) | | | (0.09 | ) | | | — | |
| | | | | | | | | | | | |
Net increase (decrease) in net asset value | | | 1.75 | | | | 0.32 | | | | (0.67 | ) |
| | | | | | | | | | | | |
Net Asset Value, End of Period | | $ | 11.40 | | | $ | 9.65 | | | $ | 9.33 | |
| | | | | | | | | | | | |
Total Return (c) | | | 18.30 | %(d) | | | 4.43 | % | | | (6.70 | )%(d) |
Ratios/Supplemental Data: | | | | | | | | | | | | |
Net Assets, End of Period (in 000’s) | | $ | 894 | | | $ | 546 | | | $ | 2,295 | |
Ratios of expenses to average net assets: | | | | | | | | | | | | |
Before expense reimbursement and/or fee waiver | | | 2.12 | %(e) | | | 2.63 | % | | | 3.78 | %(e) |
After expense reimbursement and/or fee waiver | | | 1.15 | %(e) | | | 1.15 | %(f) | | | 1.15 | %(e) |
Ratios of net investment income (loss) to average net assets: | | | | | | | | | | | | |
Before expense reimbursement and/or fee waiver | | | (0.52 | )%(e) | | | (0.61 | )% | | | (1.93 | )%(e) |
After expense reimbursement and/or fee waiver | | | 0.45 | %(e) | | | 0.87 | % | | | 0.70 | %(e) |
Portfolio Turnover | | | 22 | %(d) | | | 31 | % | | | 1 | %(d)(g) |
| (a) | The commencement of investment operations for AMG Managers Fairpointe Focused Equity Fund Class N shares was December 23, 2014. |
| (b) | Per share numbers have been calculated using average shares. |
| (c) | The total return is calculated using the published Net Asset Value. |
| (f) | Effective October 1, 2016, the Fund’s expense cap was reduced to 0.82% from 1.15%. The expense ratio shown reflects the weighted average expense ratio for the full fiscal year ended October 31, 2016. (See Note F) |
| (g) | Portfolio turnover rate excludes securities received from processing a subscription in-kind. |
The accompanying notes are an integral part of these financial statements.
AMG Funds
| | |
| AMG Managers Fairpointe Focused Equity Fund – Class I | | April 30, 2017 |
| Financial Highlights | | |
| | | | | | | | | | | | |
| | | For the
Six Months
Ended
04/30/17
(unaudited) | | | Year
Ended
10/31/16 | | | Period
Ended
10/31/15(a) | |
Net Asset Value, Beginning of Period | | $ | 9.67 | | | $ | 9.35 | | | $ | 10.00 | |
| | | | | | | | | | | | |
Income from Investment Operations: | | | | | | | | | | | | |
Net investment income (b) | | | 0.04 | | | | 0.10 | | | | 0.08 | |
Net realized and unrealized gain (loss) on investments | | | 1.74 | | | | 0.32 | | | | (0.73 | ) |
| | | | | | | | | | | | |
Total from investment operations | | | 1.78 | | | | 0.42 | | | | (0.65 | ) |
| | | | | | | | | | | | |
Less Distributions: | | | | | | | | | | | | |
Distributions from and in excess of net investment income | | | (0.10 | ) | | | (0.10 | ) | | | — | |
| | | | | | | | | | | | |
Total distributions | | | (0.10 | ) | | | (0.10 | ) | | | — | |
| | | | | | | | | | | | |
Net increase (decrease) in net asset value | | | 1.68 | | | | 0.32 | | | | (0.65 | ) |
| | | | | | | | | | | | |
Net Asset Value, End of Period | | $ | 11.35 | | | $ | 9.67 | | | $ | 9.35 | |
| | | | | | | | | | | | |
Total Return (c) | | | 18.49 | %(d) | | | 4.65 | % | | | (6.50 | )%(d) |
Ratios/Supplemental Data: | | | | | | | | | | | | |
Net Assets, End of Period (in 000’s) | | $ | 6,233 | | | $ | 6,489 | | | $ | 4,162 | |
Ratios of expenses to average net assets: | | | | | | | | | | | | |
Before expense reimbursement and/or fee waiver | | | 1.79 | %(e) | | | 2.51 | % | | | 3.53 | %(e) |
After expense reimbursement and/or fee waiver | | | 0.90 | %(e) | | | 0.90 | %(f) | | | 0.90 | %(e) |
Ratios of net investment income (loss) to average net assets: | | | | | | | | | | | | |
Before expense reimbursement and/or fee waiver | | | (0.16 | )%(e) | | | (0.52 | )% | | | (1.68 | )%(e) |
After expense reimbursement and/or fee waiver | | | 0.73 | %(e) | | | 1.10 | % | | | 0.95 | %(e) |
Portfolio Turnover | | | 22 | %(d) | | | 31 | % | | | 1 | %(d)(g) |
| (a) | The commencement of investment operations for AMG Managers Fairpointe Focused Equity Fund Class I shares was December 23, 2014. |
| (b) | Per share numbers have been calculated using average shares. |
| (c) | The total return is calculated using the published Net Asset Value. |
| (f) | Effective October 1, 2016, the Fund’s expense cap was reduced to 0.82% from 0.90%. The expense ratio shown reflects the weighted average expense ratio for the full fiscal year ended October 31, 2016. (See Note F) |
| (g) | Portfolio turnover rate excludes securities received from processing a subscription in-kind. |
The accompanying notes are an integral part of these financial statements.
AMG Funds
| | |
| AMG River Road Focused Absolute Value Fund – Class N | | April 30, 2017 |
| Financial Highlights | | |
| | | | | | | | |
| | | For the
Six Months
Ended
04/30/17
(unaudited) | | | Period
Ended
10/31/16(a) | |
Net Asset Value, Beginning of Period | | $ | 10.85 | | | $ | 10.00 | |
| | | | | | | | |
Income from Investment Operations: | | | | | | | | |
Net investment income (b) | | | 0.01 | | | | 0.04 | |
Net realized and unrealized gain on investments | | | 1.58 | | | | 0.81 | |
| | | | | | | | |
Total from investment operations | | | 1.59 | | | | 0.85 | |
| | | | | | | | |
Less Distributions: | | | | | | | | |
Distributions from and in excess of net investment income | | | (0.09 | ) | | | — | |
Distributions from net realized gain on investments | | | (0.73 | ) | | | — | |
| | | | | | | | |
Total distributions | | | (0.82 | ) | | | — | |
| | | | | | | | |
Net increase in net asset value | | | 0.77 | | | | 0.85 | |
| | | | | | | | |
Net Asset Value, End of Period | | $ | 11.62 | | | $ | 10.85 | |
| | | | | | | | |
Total Return(c) | | | 14.95 | %(d) | | | 8.50 | %(d) |
Ratios/Supplemental Data: | | | | | | | | |
Net Assets, End of Period (in 000’s) | | $ | 775 | | | $ | 489 | |
Ratios of expenses to average net assets: | | | | | | | | |
Before expense reimbursement and/or fee waiver | | | 1.39 | %(e) | | | 3.15 | %(e) |
After expense reimbursement and/or fee waiver | | | 0.98 | %(e)(h) | | | 1.12 | %(e)(f) |
Ratios of net investment income (loss) to average net assets: | | | | | | | | |
Before expense reimbursement and/or fee waiver | | | (0.18 | )%(e) | | | (1.64 | )%(e) |
After expense reimbursement and/or fee waiver | | | 0.23 | %(e) | | | 0.39 | %(e) |
Portfolio Turnover | | | 66 | %(d) | | | 146 | %(d)(g) |
| (a) | The commencement of investment operations for AMG River Road Focused Absolute Value Fund Class N shares was November 3, 2015. |
| (b) | Per share numbers have been calculated using average shares. |
| (c) | The total return is calculated using the published Net Asset Value. |
| (f) | Effective October 1, 2016, the Fund’s expense cap was reduced to 0.71% from 1.00%. The expense ratio shown reflects the weighted average expense ratio for the full fiscal year ended October 31, 2016. (See Note F) |
| (g) | Portfolio turnover rate excludes securities delivered from processing a subscription in-kind. |
| (h) | Includes reduction from brokerage recapture amounting to 0.02%. |
The accompanying notes are an integral part of these financial statements.
AMG Funds
| | |
| AMG River Road Focused Absolute Value Fund – Class I | | April 30, 2017 |
| Financial Highlights | | |
| | | | | | | | |
| | | For the
Six Months
Ended
04/30/17
(unaudited) | | | Period
Ended
10/31/16(a) | |
Net Asset Value, Beginning of Period | | $ | 10.88 | | | $ | 10.00 | |
| | | | | | | | |
Income from Investment Operations: | | | | | | | | |
Net investment income (b) | | | 0.03 | | | | 0.08 | |
Net realized and unrealized gain on investments | | | 1.57 | | | | 0.80 | |
| | | | | | | | |
Total from investment operations | | | 1.60 | | | | 0.88 | |
| | | | | | | | |
Less Distributions: | | | | | | | | |
Distributions from and in excess of net investment income | | | (0.10 | ) | | | — | |
Distributions from net realized gain on investments | | | (0.73 | ) | | | — | |
| | | | | | | | |
Total distributions | | | (0.83 | ) | | | — | |
| | | | | | | | |
Net increase in net asset value | | | 0.77 | | | | 0.88 | |
| | | | | | | | |
Net Asset Value, End of Period | | $ | 11.65 | | | $ | 10.88 | |
| | | | | | | | |
Total Return(c) | | | 15.05 | %(d) | | | 8.80 | %(d) |
Ratios/Supplemental Data: | | | | | | | | |
Net Assets, End of Period (in 000’s) | | $ | 18,065 | | | $ | 11,312 | |
Ratios of expenses to average net assets: | | | | | | | | |
Before expense reimbursement and/or fee waiver | | | 1.14 | %(e) | | | 2.90 | %(e) |
After expense reimbursement and/or fee waiver | | | 0.73 | %(e)(h) | | | 0.75 | %(e)(f) |
Ratios of net investment income (loss) to average net assets: | | | | | | | | |
Before expense reimbursement and/or fee waiver | | | 0.10 | %(e) | | | (1.35 | )%(e) |
After expense reimbursement and/or fee waiver | | | 0.51 | %(e) | | | 0.81 | %(e) |
Portfolio Turnover | | | 66 | %(d) | | | 146 | %(d)(g) |
| (a) | The commencement of investment operations for AMG River Road Focused Absolute Value Fund Class I shares was November 3, 2015. |
| (b) | Per share numbers have been calculated using average shares. |
| (c) | The total return is calculated using the published Net Asset Value. |
| (f) | Effective October 1, 2016, the Fund’s expense cap was reduced to 0.71% from 0.75%. The expense ratio shown reflects the weighted average expense ratio for the full fiscal year ended October 31, 2016. (See Note F) |
| (g) | Portfolio turnover rate excludes securities delivered from processing a subscription in-kind. |
| (h) | Includes reduction from brokerage recapture amounting to 0.02%. |
The accompanying notes are an integral part of these financial statements.
AMG Funds
| | |
| AMG Managers Montag & Caldwell Growth Fund – Class N | | April 30, 2017 |
| Financial Highlights | | |
| | | | | | | | | | | | | | | | | | | | | | | | |
| | | For the
Six Months
Ended
04/30/17
(unaudited) | | | Year
Ended
10/31/16 | | | Year
Ended
10/13/15 | | | Year
Ended
10/31/14 | | | Year
Ended
10/31/13 | | | Year
Ended
10/31/12 | |
Net Asset Value, Beginning of Period | | $ | 19.56 | | | $ | 26.67 | | | $ | 29.59 | | | $ | 28.68 | | | $ | 25.31 | | | $ | 24.72 | |
| | | | | | | | | | | | | | | | | | | | | | | | |
Income from Investment Operations: | | | | | | | | | | | | | | | | | | | | | | | | |
Net investment income (loss) (a) | | | (0.02 | ) | | | 0.05 | | | | 0.07 | | | | 0.10 | | | | 0.23 | | | | 0.15 | |
Net realized and unrealized gain (loss) on investments | | | 1.59 | | | | (0.33 | ) | | | 2.06 | | | | 2.93 | | | | 5.07 | | | | 2.45 | |
| | | | | | | | | | | | | | | | | | | | | | | | |
Total from investment operations | | | 1.57 | | | | (0.28 | ) | | | 2.13 | | | | 3.03 | | | | 5.30 | | | | 2.60 | |
| | | | | | | | | | | | | | | | | | | | | | | | |
Less Distributions: | | | | | | | | | | | | | | | | | | | | | | | | |
Distributions from and in excess of net investment income | | | (0.04 | ) | | | (0.08 | ) | | | (0.05 | ) | | | (0.16 | ) | | | (0.22 | ) | | | (0.13 | ) |
Distributions from net realized gain on investments | | | (1.94 | ) | | | (6.75 | ) | | | (5.00 | ) | | | (1.96 | ) | | | (1.71 | ) | | | (1.88 | ) |
| | | | | | | | | | | | | | | | | | | | | | | | |
Total distributions | | | (1.98 | ) | | | (6.83 | ) | | | (5.05 | ) | | | (2.12 | ) | | | (1.93 | ) | | | (2.01 | ) |
| | | | | | | | | | | | | | | | | | | | | | | | |
Net increase (decrease) in net asset value | | | (0.41 | ) | | | (7.11 | ) | | | (2.92 | ) | | | 0.91 | | | | 3.37 | | | | 0.59 | |
| | | | | | | | | | | | | | | | | | | | | | | | |
Net Asset Value, End of Period | | $ | 19.15 | | | $ | 19.56 | | | $ | 26.67 | | | $ | 29.59 | | | $ | 28.68 | | | $ | 25.31 | |
| | | | | | | | | | | | | | | | | | | | | | | | |
Total Return (b) | | | 8.84 | %(c) | | | (1.77 | )% | | | 7.93 | % | | | 10.98 | % | | | 22.61 | % | | | 11.40 | % |
Ratios/Supplemental Data: | | | | | | | | | | | | | | | | | | | | | | | | |
Net Assets, End of Period (in 000’s) | | $ | 384,338 | | | $ | 519,008 | | | $ | 835,725 | | | $ | 1,344,317 | | | $ | 2,190,074 | | | $ | 1,908,663 | |
Ratios of expenses to average net assets: | | | | | | | | | | | | | | | | | | | | | | | | |
Before expense reimbursement and/or fee waiver | | | 1.17 | %(d) | | | 1.12 | % | | | 1.05 | % | | | 1.03 | % | | | 1.04 | % | | | 1.05 | % |
After expense reimbursement and/or fee waiver | | | 1.15 | %(d)(e) | | | 1.12 | % | | | 1.05 | % | | | 1.03 | % | | | 1.04 | % | | | 1.05 | % |
Ratios of net investment income (loss) to average net assets: | | | | | | | | | | | | | | | | | | | | | | | | |
Before expense reimbursement and/or fee waiver | | | (0.25 | )%(d) | | | 0.25 | % | | | 0.28 | % | | | 0.34 | % | | | 0.88 | % | | | 0.60 | % |
After expense reimbursement and/or fee waiver | | | (0.23 | )%(d) | | | 0.25 | % | | | 0.28 | % | | | 0.34 | % | | | 0.88 | % | | | 0.60 | % |
Portfolio Turnover | | | 25 | %(c) | | | 64 | % | | | 12 | % | | | 47 | % | | | 51 | % | | | 46 | % |
| (a) | Per share numbers have been calculated using average shares. |
| (b) | The total return is calculated using the published Net Asset Value. |
| (e) | Includes reduction from brokerage recapture amounting to 0.02%. |
The accompanying notes are an integral part of these financial statements.
AMG Funds
| | |
| AMG Managers Montag & Caldwell Growth Fund – Class I | | April 30, 2017 |
| Financial Highlights | | |
| | | | | | | | | | | | | | | | | | | | | | | | |
| | | For the
Six Months
Ended
04/30/17
(unaudited) | | | Year
Ended
10/31/16 | | | Year
Ended
10/31/15 | | | Year
Ended
10/31/14 | | | Year
Ended
10/31/13 | | | Year
Ended
10/31/12 | |
Net Asset Value, Beginning of Period | | $ | 19.70 | | | $ | 26.82 | | | $ | 29.80 | | | $ | 28.87 | | | $ | 25.46 | | | $ | 24.85 | |
| | | | | | | | | | | | | | | | | | | | | | | | |
Income from Investment Operations: | | | | | | | | | | | | | | | | | | | | | | | | |
Net investment income (a) | | | 0.00 | (b) | | | 0.10 | | | | 0.14 | | | | 0.17 | | | | 0.30 | | | | 0.21 | |
Net realized and unrealized gain (loss) on investments | | | 1.59 | | | | (0.31 | ) | | | 2.06 | | | | 2.96 | | | | 5.10 | | | | 2.47 | |
| | | | | | | | | | | | | | | | | | | | | | | | |
Total from investment operations | | | 1.59 | | | | (0.21 | ) | | | 2.20 | | | | 3.13 | | | | 5.40 | | | | 2.68 | |
| | | | | | | | | | | | | | | | | | | | | | | | |
Less Distributions: | | | | | | | | | | | | | | | | | | | | | | | | |
Distributions from and in excess of net investment income | | | (0.13 | ) | | | (0.16 | ) | | | (0.18 | ) | | | (0.24 | ) | | | (0.28 | ) | | | (0.19 | ) |
Distributions from net realized gain on investments | | | (1.95 | ) | | | (6.75 | ) | | | (5.00 | ) | | | (1.96 | ) | | | (1.71 | ) | | | (1.88 | ) |
| | | | | | | | | | | | | | | | | | | | | | | | |
Total distributions | | | (2.08 | ) | | | (6.91 | ) | | | (5.18 | ) | | | (2.20 | ) | | | (1.99 | ) | | | (2.07 | ) |
| | | | | | | | | | | | | | | | | | | | | | | | |
Net increase (decrease) in net asset value | | | (0.49 | ) | | | (7.12 | ) | | | (2.98 | ) | | | 0.93 | | | | 3.41 | | | | 0.61 | |
| | | | | | | | | | | | | | | | | | | | | | | | |
Net Asset Value, End of Period | | $ | 19.21 | | | $ | 19.70 | | | $ | 26.82 | | | $ | 29.80 | | | $ | 28.87 | | | $ | 25.46 | |
| | | | | | | | | | | | | | | | | | | | | | | | |
Total Return (c) | | | 8.97 | %(d) | | | (1.51 | )% | | | 8.21 | % | | | 11.26 | % | | | 22.95 | % | | | 11.67 | % |
Ratios/Supplemental Data: | | | | | | | | | | | | | | | | | | | | | | | | |
Net Assets, End of Period (in 000’s) | | $ | 614,840 | | | $ | 820,318 | | | $ | 1,344,231 | | | $ | 2,784,650 | | | $ | 3,035,623 | | | $ | 2,406,145 | |
Ratios of expenses to average net assets: | | | | | | | | | | | | | | | | | | | | | | | | |
Before expense reimbursement and/or fee waiver | | | 0.92 | %(e) | | | 0.87 | % | | | 0.80 | % | | | 0.78 | % | | | 0.79 | % | | | 0.80 | % |
After expense reimbursement and/or fee waiver | | | 0.90 | %(e)(f) | | | 0.87 | % | | | 0.80 | % | | | 0.78 | % | | | 0.79 | % | | | 0.80 | % |
Ratios of net investment income to average net assets: | | | | | | | | | | | | | | | | | | | | | | | | |
Before expense reimbursement and/or fee waiver | | | 0.01 | %(e) | | | 0.50 | % | | | 0.53 | % | | | 0.59 | % | | | 1.13 | % | | | 0.85 | % |
After expense reimbursement and/or fee waiver | | | 0.03 | %(e) | | | 0.50 | % | | | 0.53 | % | | | 0.59 | % | | | 1.13 | % | | | 0.85 | % |
Portfolio Turnover | | | 25 | %(d) | | | 64 | % | | | 12 | % | | | 47 | % | | | 51 | % | | | 46 | % |
| (a) | Per share numbers have been calculated using average shares. |
| (b) | Less than $0.005 per share. |
| (c) | The total return is calculated using the published Net Asset Value. |
| (f) | Includes reduction from brokerage recapture amounting to 0.02%. |
The accompanying notes are an integral part of these financial statements.
AMG Funds
| | |
| AMG Managers Montag & Caldwell Growth Fund – Class R | | April 30, 2017 |
| Financial Highlights | | |
| | | | | | | | | | | | | | | | | | | | | | | | |
| | | For the
Six Months
Ended
04/30/17
(unaudited) | | | Year
Ended
10/31/16 | | | Year
Ended
10/31/15 | | | Year
Ended
10/31/14 | | | Year
Ended
10/31/13 | | | Year
Ended
10/31/12 | |
Net Asset Value, Beginning of Period | | $ | 19.14 | | | $ | 26.22 | | | $ | 29.21 | | | $ | 28.33 | | | $ | 25.02 | | | $ | 24.45 | |
| | | | | | | | | | | | | | | | | | | | | | | | |
Income from Investment Operations: | | | | | | | | | | | | | | | | | | | | | | | | |
Net investment income (loss) (a) | | | (0.05 | ) | | | (0.00 | )(b) | | | 0.01 | | | | 0.03 | | | | 0.16 | | | | 0.09 | |
Net realized and unrealized gain (loss) on investments | | | 1.57 | | | | (0.31 | ) | | | 2.01 | | | | 2.91 | | | | 5.01 | | | | 2.43 | |
| | | | | | | | | | | | | | | | | | | | | | | | |
Total from investment operations | | | 1.52 | | | | (0.31 | ) | | | 2.02 | | | | 2.94 | | | | 5.17 | | | | 2.52 | |
| | | | | | | | | | | | | | | | | | | | | | | | |
Less Distributions: | | | | | | | | | | | | | | | | | | | | | | | | |
Distributions from and in excess of net investment income | | | (0.03 | ) | | | (0.02 | ) | | | (0.01 | ) | | | (0.10 | ) | | | (0.15 | ) | | | (0.07 | ) |
Distributions from net realized gain on investments | | | (1.90 | ) | | | (6.75 | ) | | | (5.00 | ) | | | (1.96 | ) | | | (1.71 | ) | | | (1.88 | ) |
| | | | | | | | | | | | | | | | | | | | | | | | |
Total distributions | | | (1.93 | ) | | | (6.77 | ) | | | (5.01 | ) | | | (2.06 | ) | | | (1.86 | ) | | | (1.95 | ) |
| | | | | | | | | | | | | | | | | | | | | | | | |
Net increase (decrease) in net asset value | | | (0.41 | ) | | | (7.08 | ) | | | (2.99 | ) | | | 0.88 | | | | 3.31 | | | | 0.57 | |
| | | | | | | | | | | | | | | | | | | | | | | | |
Net Asset Value, End of Period | | $ | 18.73 | | | $ | 19.14 | | | $ | 26.22 | | | $ | 29.21 | | | $ | 28.33 | | | $ | 25.02 | |
| | | | | | | | | | | | | | | | | | | | | | | | |
Total Return (c) | | | 8.72 | %(d) | | | (2.02 | )% | | | 7.66 | % | | | 10.74 | % | | | 22.30 | % | | | 11.10 | % |
Ratios/Supplemental Data: | | | | | | | | | | | | | | | | | | | | | | | | |
Net Assets, End of Period (in 000’s) | | $ | 5,131 | | | $ | 5,458 | | | $ | 5,877 | | | $ | 7,701 | | | $ | 10,099 | | | $ | 8,771 | |
Ratios of expenses to average net assets: | | | | | | | | | | | | | | | | | | | | | | | | |
Before expense reimbursement and/or fee waiver | | | 1.41 | %(e) | | | 1.37 | % | | | 1.30 | % | | | 1.28 | % | | | 1.29 | % | | | 1.30 | % |
After expense reimbursement and/or fee waiver | | | 1.39 | %(e)(f) | | | 1.37 | % | | | 1.30 | % | | | 1.28 | % | | | 1.29 | % | | | 1.30 | % |
Ratios of net investment income (loss) to average net assets: | | | | | | | | | | | | | | | | | | | | | | | | |
Before expense reimbursement and/or fee waiver | | | (0.58 | )%(e) | | | (0.02 | )% | | | 0.03 | % | | | 0.09 | % | | | 0.63 | % | | | 0.35 | % |
After expense reimbursement and/or fee waiver | | | (0.56 | )%(e) | | | (0.02 | )% | | | 0.03 | % | | | 0.09 | % | | | 0.63 | % | | | 0.35 | % |
Portfolio Turnover | | | 25 | %(d) | | | 64 | % | | | 12 | % | | | 47 | % | | | 51 | % | | | 46 | % |
| (a) | Per share numbers have been calculated using average shares. |
| (b) | Less than $(0.005) per share. |
| (c) | The total return is calculated using the published Net Asset Value. |
| (f) | Includes reduction from brokerage recapture amounting to 0.02%. |
The accompanying notes are an integral part of these financial statements.
AMG Funds
| | |
| AMG River Road Dividend All Cap Value Fund – Class N | | April 30, 2017 |
| Financial Highlights | | |
| | | | | | | | | | | | | | | | | | | | | | | | |
| | | For the
Six Months
Ended
04/30/17
(unaudited) | | | Year
Ended
10/31/16 | | | Year
Ended
10/31/15 | | | Year
Ended
10/31/14 | | | Year
Ended
10/31/13 | | | Year
Ended
10/31/12 | |
Net Asset Value, Beginning of Period | | $ | 12.18 | | | $ | 12.67 | | | $ | 14.05 | | | $ | 13.99 | | | $ | 11.67 | | | $ | 10.68 | |
| | | | | | | | | | | | | | | | | | | | | | | | |
Income from Investment Operations: | | | | | | | | | | | | | | | | | | | | | | | | |
Net investment income | | | 0.10 | (a) | | | 0.24 | (a) | | | 0.21 | | | | 0.42 | | | | 0.30 | | | | 0.31 | (a) |
Net realized and unrealized gain (loss) on investments | | | 1.23 | | | | 0.65 | | | | (0.20 | ) | | | 0.89 | | | | 2.73 | | | | 1.05 | |
| | | | | | | | | | | | | | | | | | | | | | | | |
Total from investment operations | | | 1.33 | | | | 0.89 | | | | 0.01 | | | | 1.31 | | | | 3.03 | | | | 1.36 | |
| | | | | | | | | | | | | | | | | | | | | | | | |
Less Distributions: | | | | | | | | | | | | | | | | | | | | | | | | |
Distributions from and in excess of net investment income | | | (0.15 | ) | | | (0.22 | ) | | | (0.22 | ) | | | (0.44 | ) | | | (0.27 | ) | | | (0.30 | ) |
Distributions from net realized gain on investments | | | (0.86 | ) | | | (1.16 | ) | | | (1.17 | ) | | | (0.81 | ) | | | (0.44 | ) | | | (0.07 | ) |
| | | | | | | | | | | | | | | | | | | | | | | | |
Total distributions | | | (1.01 | ) | | | (1.38 | ) | | | (1.39 | ) | | | (1.25 | ) | | | (0.71 | ) | | | (0.37 | ) |
| | | | | | | | | | | | | | | | | | | | | | | | |
Net increase (decrease) in net asset value | | | 0.32 | | | | (0.49 | ) | | | (1.38 | ) | | | 0.06 | | | | 2.32 | | | | 0.99 | |
| | | | | | | | | | | | | | | | | | | | | | | | |
Net Asset Value, End of Period | | $ | 12.50 | | | $ | 12.18 | | | $ | 12.67 | | | $ | 14.05 | | | $ | 13.99 | | | $ | 11.67 | |
| | | | | | | | | | | | | | | | | | | | | | | | |
Total Return (b) | | | 10.96 | %(c) | | | 7.88 | % | | | (0.23 | )% | | | 9.89 | % | | | 27.47 | % | | | 12.96 | % |
Ratios/Supplemental Data: | | | | | | | | | | | | | | | | | | | | | | | | |
Net Assets, End of Period (in 000’s) | | $ | 333,521 | | | $ | 295,797 | | | $ | 214,789 | | | $ | 349,937 | | | $ | 449,130 | | | $ | 338,166 | |
Ratios of expenses to average net assets: | | | | | | | | | | | | | | | | | | | | | | | | |
Before expense reimbursement and/or fee waiver | | | 1.10 | %(d) | | | 1.10 | % | | | 1.10 | % | | | 1.09 | % | | | 1.09 | % | | | 1.12 | % |
After expense reimbursement and/or fee waiver | | | 1.09 | %(d) | | | 1.10 | %(e) | | | 1.10 | % | | | 1.09 | % | | | 1.09 | % | | | 1.12 | % |
Ratios of net investment income to average net assets: | | | | | | | | | | | | | | | | | | | | | | | | |
Before expense reimbursement and/or fee waiver | | | 1.55 | %(d) | | | 2.00 | % | | | 1.62 | % | | | 2.96 | % | | | 2.38 | % | | | 2.74 | % |
After expense reimbursement and/or fee waiver | | | 1.56 | %(d) | | | 2.00 | % | | | 1.62 | % | | | 2.96 | % | | | 2.38 | % | | | 2.74 | % |
Portfolio Turnover | | | 15 | %(c) | | | 47 | % | | | 27 | % | | | 32 | % | | | 35 | % | | | 28 | % |
| (a) | Per share numbers have been calculated using average shares. |
| (b) | The total return is calculated using the published Net Asset Value. |
| (e) | Effective October 1, 2016, the Fund’s expense cap was reduced to 0.99% from 1.30%. The expense ratio shown reflects the weighted average expense ratio for the full fiscal year ended October 31, 2016. (See Note F) |
The accompanying notes are an integral part of these financial statements.
AMG Funds
| | |
| AMG River Road Dividend All Cap Value Fund – Class I | | April 30, 2017 |
| Financial Highlights | | |
| | | | | | | | | | | | | | | | | | | | | | | | |
| | | For the
Six Months
Ended
04/30/17
(unaudited) | | | Year
Ended
10/31/16 | | | Year
Ended
10/31/15 | | | Year
Ended
10/31/14 | | | Year
Ended
10/31/13 | | | Year
Ended
10/31/12 | |
Net Asset Value, Beginning of Period | | $ | 12.17 | | | $ | 12.66 | | | $ | 14.04 | | | $ | 13.98 | | | $ | 11.66 | | | $ | 10.67 | |
| | | | | | | | | | | | | | | | | | | | | | | | |
Income from Investment Operations: | | | | | | | | | | | | | | | | | | | | | | | | |
Net investment income | | | 0.11 | (a) | | | 0.28 | (a) | | | 0.25 | | | | 0.44 | | | | 0.34 | | | | 0.34 | (a) |
Net realized and unrealized gain (loss) on investments | | | 1.23 | | | | 0.64 | | | | (0.20 | ) | | | 0.90 | | | | 2.72 | | | | 1.05 | |
| | | | | | | | | | | | | | | | | | | | | | | | |
Total from investment operations | | | 1.34 | | | | 0.92 | | | | 0.05 | | | | 1.34 | | | | 3.06 | | | | 1.39 | |
| | | | | | | | | | | | | | | | | | | | | | | | |
Less Distributions: | | | | | | | | | | | | | | | | | | | | | | | | |
Distributions from and in excess of net investment income | | | (0.16 | ) | | | (0.25 | ) | | | (0.26 | ) | | | (0.47 | ) | | | (0.30 | ) | | | (0.33 | ) |
Distributions from net realized gain on investments | | | (0.86 | ) | | | (1.16 | ) | | | (1.17 | ) | | | (0.81 | ) | | | (0.44 | ) | | | (0.07 | ) |
| | | | | | | | | | | | | | | | | | | | | | | | |
Total distributions | | | (1.02 | ) | | | (1.41 | ) | | | (1.43 | ) | | | (1.28 | ) | | | (0.74 | ) | | | (0.40 | ) |
| | | | | | | | | | | | | | | | | | | | | | | | |
Net increase (decrease) in net asset value | | | 0.32 | | | | (0.49 | ) | | | (1.38 | ) | | | 0.06 | | | | 2.32 | | | | 0.99 | |
| | | | | | | | | | | | | | | | | | | | | | | | |
Net Asset Value, End of Period | | $ | 12.49 | | | $ | 12.17 | | | $ | 12.66 | | | $ | 14.04 | | | $ | 13.98 | | | $ | 11.66 | |
| | | | | | | | | | | | | | | | | | | | | | | | |
Total Return (b) | | | 11.08 | %(c) | | | 8.15 | % | | | 0.02 | % | | | 10.18 | % | | | 27.81 | % | | | 13.25 | % |
Ratios/Supplemental Data: | | | | | | | | | | | | | | | | | | | | | | | | |
Net Assets, End of Period (in 000’s) | | $ | 626,460 | | | $ | 555,064 | | | $ | 635,189 | | | $ | 788,322 | | | $ | 779,859 | | | $ | 586,043 | |
Ratios of expenses to average net assets: | | | | | | | | | | | | | | | | | | | | | | | | |
Before expense reimbursement and/or fee waiver | | | 0.85 | %(d) | | | 0.85 | % | | | 0.85 | % | | | 0.84 | % | | | 0.84 | % | | | 0.87 | % |
After expense reimbursement and/or fee waiver | | | 0.84 | %(d) | | | 0.85 | %(e) | | | 0.85 | % | | | 0.84 | % | | | 0.84 | % | | | 0.87 | % |
Ratios of net investment income to average net assets: | | | | | | | | | | | | | | | | | | | | | | | | |
Before expense reimbursement and/or fee waiver | | | 1.81 | %(d) | | | 2.30 | % | | | 1.87 | % | | | 3.21 | % | | | 2.63 | % | | | 2.99 | % |
After expense reimbursement and/or fee waiver | | | 1.82 | %(d) | | | 2.30 | % | | | 1.87 | % | | | 3.21 | % | | | 2.63 | % | | | 2.99 | % |
Portfolio Turnover | | | 15 | %(c) | | | 47 | % | | | 27 | % | | | 32 | % | | | 35 | % | | | 28 | % |
| (a) | Per share numbers have been calculated using average shares. |
| (b) | The total return is calculated using the published Net Asset Value. |
| (e) | Effective October 1, 2016, the Fund’s expense cap was reduced to 0.99% from 1.05%. The expense ratio shown reflects the weighted average expense ratio for the full fiscal year ended October 31, 2016. (See Note F) |
The accompanying notes are an integral part of these financial statements.
AMG Funds
| | |
| AMG River Road Dividend All Cap Value Fund II – Class N | | April 30, 2017 |
| Financial Highlights | | |
| | | | | | | | | | | | | | | | | | | | | | | | |
| | | For the
Six Months
Ended
04/30/17
(unaudited) | | | Year
Ended
10/31/16 | | | Year
Ended
10/31/15 | | | Year
Ended
10/31/14 | | | Year
Ended
10/31/13 | | | Period
Ended
10/31/12(a) | |
Net Asset Value, Beginning of Period | | $ | 13.52 | | | $ | 12.99 | | | $ | 13.69 | | | $ | 12.89 | | | $ | 10.44 | | | $ | 10.00 | |
| | | | | | | | | | | | | | | | | | | | | | | | |
Income from Investment Operations: | | | | | | | | | | | | | | | | | | | | | | | | |
Net investment income | | | 0.12 | (b) | | | 0.26 | (b) | | | 0.22 | (b) | | | 0.36 | | | | 0.22 | | | | 0.09 | (b) |
Net realized and unrealized gain (loss) on investments | | | 1.36 | | | | 0.71 | | | | (0.26 | ) | | | 0.96 | | | | 2.46 | | | | 0.41 | |
| | | | | | | | | | | | | | | | | | | | | | | | |
Total from investment operations | | | 1.48 | | | | 0.97 | | | | (0.04 | ) | | | 1.32 | | | | 2.68 | | | | 0.50 | |
| | | | | | | | | | | | | | | | | | | | | | | | |
Less Distributions: | | | | | | | | | | | | | | | | | | | | | | | | |
Distributions from and in excess of net investment income | | | (0.14 | ) | | | (0.25 | ) | | | (0.23 | ) | | | (0.38 | ) | | | (0.23 | ) | | | (0.06 | ) |
Distributions from net realized gain on investments | | | (0.56 | ) | | | (0.19 | ) | | | (0.43 | ) | | | (0.14 | ) | | | (0.00 | )(c) | | | — | |
| | | | | | | | | | | | | | | | | | | | | | | | |
Total distributions | | | (0.70 | ) | | | (0.44 | ) | | | (0.66 | ) | | | (0.52 | ) | | | (0.23 | ) | | | (0.06 | ) |
| | | | | | | | | | | | | | | | | | | | | | | | |
Net increase (decrease) in net asset value | | | 0.78 | | | | 0.53 | | | | (0.70 | ) | | | 0.80 | | | | 2.45 | | | | 0.44 | |
| | | | | | | | | | | | | | | | | | | | | | | | |
Net Asset Value, End of Period | | $ | 14.30 | | | $ | 13.52 | | | $ | 12.99 | | | $ | 13.69 | | | $ | 12.89 | | | $ | 10.44 | |
| | | | | | | | | | | | | | | | | | | | | | | | |
Total Return (d) | | | 10.98 | %(e) | | | 7.61 | % | | | (0.47 | )% | | | 10.46 | % | | | 25.99 | % | | | 5.09 | %(e) |
Ratios/Supplemental Data: | | | | | | | | | | | | | | | | | | | | | | | | |
Net Assets, End of Period (in 000’s) | | $ | 3,628 | | | $ | 3,394 | | | $ | 2,930 | | | $ | 7,037 | | | $ | 3,634 | | | $ | 1,049 | |
Ratios of expenses to average net assets: | | | | | | | | | | | | | | | | | | | | | | | | |
Before expense reimbursement and/or fee waiver, or recoupment | | | 1.15 | %(f) | | | 1.18 | % | | | 1.15 | % | | | 1.17 | % | | | 1.37 | % | | | 4.99 | %(f) |
After expense reimbursement and/or fee waiver, or recoupment | | | 1.15 | %(f) | | | 1.18 | %(g) | | | 1.15 | % | | | 1.25 | % | | | 1.30 | % | | | 1.30 | %(f) |
Ratios of net investment income (loss) to average net assets: | | | | | | | | | | | | | | | | | | | | | | | | |
Before expense reimbursement and/or fee waiver, or recoupment | | | 1.65 | %(f) | | | 1.99 | % | | | 1.62 | % | | | 2.81 | % | | | 1.68 | % | | | (1.24 | )%(f) |
After expense reimbursement and/or fee waiver, or recoupment | | | 1.65 | %(f) | | | 1.99 | % | | | 1.62 | % | | | 2.72 | % | | | 1.76 | % | | | 2.45 | %(f) |
Portfolio Turnover | | | 16 | %(e) | | | 34 | % | | | 35 | % | | | 29 | % | | | 28 | % | | | 6 | %(e)(h) |
| (a) | The commencement of investment operations for AMG River Road Dividend All Cap Value Fund II Class N shares was June 26, 2012. |
| (b) | Per share numbers have been calculated using average shares. |
| (c) | Less than $(0.005) per share. |
| (d) | The total return is calculated using the published Net Asset Value. |
| (g) | Effective October 1, 2016, the Fund’s expense cap was reduced to 0.99% from 1.30%. The expense ratio shown reflects the weighted average expense ratio for the full fiscal year ended October 31, 2016. (See Note F) |
| (h) | Portfolio turnover excludes securities received from processing a subscription in-kind. |
The accompanying notes are an integral part of these financial statements.
AMG Funds
| | |
| AMG River Road Dividend All Cap Value Fund II – Class I | | April 30, 2017 |
| Financial Highlights | | |
| | | | | | | | | | | | | | | | | | | | | | | | |
| | | For the
Six Months
Ended
04/30/17
(unaudited) | | | Year
Ended
10/31/16 | | | Year
Ended
10/31/15 | | | Year
Ended
10/31/14 | | | Year
Ended
10/31/13 | | | Period
Ended
10/31/12(a) | |
Net Asset Value, Beginning of Period | | $ | 13.53 | | | $ | 13.00 | | | $ | 13.69 | | | $ | 12.89 | | | $ | 10.45 | | | $ | 10.00 | |
| | | | | | | | | | | | | | | | | | | | | | | | |
Income from Investment Operations: | | | | | | | | | | | | | | | | | | | | | | | | |
Net investment income | | | 0.14 | (b) | | | 0.29 | (b) | | | 0.25 | (b) | | | 0.39 | | | | 0.25 | | | | 0.10 | (b) |
Net realized and unrealized gain (loss) on investments | | | 1.36 | | | | 0.71 | | | | (0.25 | ) | | | 0.96 | | | | 2.45 | | | | 0.42 | |
| | | | | | | | | | | | | | | | | | | | | | | | |
Total from investment operations | | | 1.50 | | | | 1.00 | | | | — | | | | 1.35 | | | | 2.70 | | | | 0.52 | |
| | | | | | | | | | | | | | | | | | | | | | | | |
Less Distributions: | | | | | | | | | | | | | | | | | | | | | | | | |
Distributions from and in excess of net investment income | | | (0.16 | ) | | | (0.28 | ) | | | (0.26 | ) | | | (0.41 | ) | | | (0.26 | ) | | | (0.07 | ) |
Distributions from net realized gain on investments | | | (0.56 | ) | | | (0.19 | ) | | | (0.43 | ) | | | (0.14 | ) | | | (0.00 | )(c) | | | — | |
| | | | | | | | | | | | | | | | | | | | | | | | |
Total distributions | | | (0.72 | ) | | | (0.47 | ) | | | (0.69 | ) | | | (0.55 | ) | | | (0.26 | ) | | | (0.07 | ) |
| | | | | | | | | | | | | | | | | | | | | | | | |
Net increase (decrease) in net asset value | | | 0.78 | | | | 0.53 | | | | (0.69 | ) | | | 0.80 | | | | 2.44 | | | | 0.45 | |
| | | | | | | | | | | | | | | | | | | | | | | | |
Net Asset Value, End of Period | | $ | 14.31 | | | $ | 13.53 | | | $ | 13.00 | | | $ | 13.69 | | | $ | 12.89 | | | $ | 10.45 | |
| | | | | | | | | | | | | | | | | | | | | | | | |
Total Return (d) | | | 11.09 | %(e) | | | 7.87 | % | | | (0.13 | )% | | | 10.73 | % | | | 26.30 | % | | | 5.17 | %(e) |
Ratios/Supplemental Data: | | | | | | | | | | | | | | | | | | | | | | | | |
Net Assets, End of Period (in 000’s) | | $ | 120,777 | | | $ | 114,532 | | | $ | 121,414 | | | $ | 125,660 | | | $ | 86,240 | | | $ | 9,370 | |
Ratios of expenses to average net assets: | | | | | | | | | | | | | | | | | | | | | | | | |
Before expense reimbursement and/or fee waiver, or recoupment | | | 0.90 | %(f) | | | 0.93 | % | | | 0.90 | % | | | 0.92 | % | | | 1.12 | % | | | 4.74 | %(f) |
After expense reimbursement and/or fee waiver, or recoupment | | | 0.90 | %(f) | | | 0.93 | %(g) | | | 0.90 | % | | | 1.00 | % | | | 1.05 | % | | | 1.05 | %(f) |
Ratios of net investment income (loss) to average net assets: | | | | | | | | | | | | | | | | | | | | | | | | |
Before expense reimbursement and/or fee waiver, or recoupment | | | 1.91 | %(f) | | | 2.24 | % | | | 1.87 | % | | | 3.06 | % | | | 1.93 | % | | | (0.99 | )%(f) |
After expense reimbursement and/or fee waiver, or recoupment | | | 1.91 | %(f) | | | 2.24 | % | | | 1.87 | % | | | 2.97 | % | | | 2.01 | % | | | 2.70 | %(f) |
Portfolio Turnover | | | 16 | %(e) | | | 34 | % | | | 35 | % | | | 29 | % | | | 28 | % | | | 6 | %(e)(h) |
| (a) | The commencement of investment operations for AMG River Road Dividend All Cap Value Fund II Class I shares was June 26, 2012. |
| (b) | Per share numbers have been calculated using average shares. |
| (c) | Less than $(0.005) per share. |
| (d) | The total return is calculated using the published Net Asset Value. |
| (g) | Effective October 1, 2016, the Fund’s expense cap was reduced to 0.99% from 1.05%. The expense ratio shown reflects the weighted average expense ratio for the full fiscal year ended October 31, 2016. (See Note F) |
| (h) | Portfolio turnover excludes securities received from processing a subscription in-kind. |
The accompanying notes are an integral part of these financial statements.
AMG Funds
| | |
| AMG Managers Fairpointe Mid Cap Fund – Class N | | April 30, 2017 |
| Financial Highlights | | |
| | | | | | | | | | | | | | | | | | | | | | | | |
| | | For the
Six Months
Ended
04/30/17
(unaudited) | | | Year
Ended
10/31/16 | | | Year
Ended
10/31/15 | | | Year
Ended
10/31/14 | | | Year
Ended
10/31/13 | | | Year
Ended
10/31/12 | |
Net Asset Value, Beginning of Period | | $ | 37.48 | | | $ | 37.56 | | | $ | 46.89 | | | $ | 45.40 | | | $ | 32.79 | | | $ | 29.76 | |
| | | | | | | | | | | | | | | | | | | | | | | | |
Income from Investment Operations: | | | | | | | | | | | | | | | | | | | | | | | | |
Net investment income (loss) | | | (0.03 | )(a) | | | 0.16 | (a) | | | 0.12 | | | | (0.06 | ) | | | 0.17 | | | | 0.16 | |
Net realized and unrealized gain (loss) on investments | | | 7.23 | | | | 1.92 | | | | (1.83 | ) | | | 5.82 | | | | 13.48 | | | | 3.13 | |
| | | | | | | | | | | | | | | | | | | | | | | | |
Total from investment operations | | | 7.20 | | | | 2.08 | | | | (1.71 | ) | | | 5.76 | | | | 13.65 | | | | 3.29 | |
| | | | | | | | | | | | | | | | | | | | | | | | |
Less Distributions: | | | | | | | | | | | | | | | | | | | | | | | | |
Distributions from and in excess of net investment income | | | (0.13 | ) | | | (0.11 | ) | | | (0.04 | ) | | | — | | | | (0.30 | ) | | | (0.05 | ) |
Distributions from net realized gain on investments | | | (1.71 | ) | | | (2.05 | ) | | | (7.58 | ) | | | (4.27 | ) | | | (0.74 | ) | | | (0.21 | ) |
| | | | | | | | | | | | | | | | | | | | | | | | |
Total distributions | | | (1.84 | ) | | | (2.16 | ) | | | (7.62 | ) | | | (4.27 | ) | | | (1.04 | ) | | | (0.26 | ) |
| | | | | | | | | | | | | | | | | | | | | | | | |
Net increase (decrease) in net asset value | | | 5.36 | | | | (0.08 | ) | | | (9.33 | ) | | | 1.49 | | | | 12.61 | | | | 3.03 | |
| | | | | | | | | | | | | | | | | | | | | | | | |
Net Asset Value, End of Period | | $ | 42.84 | | | $ | 37.48 | | | $ | 37.56 | | | $ | 46.89 | | | $ | 45.40 | | | $ | 32.79 | |
| | | | | | | | | | | | | | | | | | | | | | | | |
Total Return (b) | | | 19.32 | %(c) | | | 6.01 | % | | | (5.02 | )% | | | 13.32 | % | | | 42.88 | % | | | 11.15 | % |
Ratios/Supplemental Data: | | | | | | | | | | | | | | | | | | | | | | | | |
Net Assets, End of Period (in 000’s) | | $ | 1,563,339 | | | $ | 1,374,982 | | | $ | 1,861,753 | | | $ | 2,432,815 | | | $ | 2,370,432 | | | $ | 1,561,510 | |
Ratios of expenses to average net assets: | | | | | | | | | | | | | | | | | | | | | | | | |
Before expense reimbursement and/or fee waiver | | | 1.13 | %(d) | | | 1.12 | % | | | 1.11 | % | | | 1.10 | % | | | 1.11 | % | | | 1.11 | %(e) |
After expense reimbursement and/or fee waiver | | | 1.12 | %(d) | | | 1.12 | % | | | 1.11 | % | | | 1.10 | % | | | 1.11 | % | | | 1.11 | %(e) |
Ratios of net investment income (loss) to average net assets: | | | | | | | | | | | | | | | | | | | | | | | | |
Before expense reimbursement and/or fee waiver | | | (0.14 | )%(d) | | | 0.44 | % | | | 0.27 | % | | | (0.12 | )% | | | 0.42 | % | | | 0.50 | % |
After expense reimbursement and/or fee waiver | | | (0.13 | )%(d) | | | 0.44 | % | | | 0.27 | % | | | (0.12 | )% | | | 0.42 | % | | | 0.50 | % |
Portfolio Turnover | | | 17 | %(c) | | | 24 | % | | | 32 | % | | | 50 | % | | | 37 | % | | | 28 | %(f) |
| (a) | Per share numbers have been calculated using average shares. |
| (b) | The total return is calculated using the published Net Asset Value. |
| (e) | Ratios of expenses to average net assets include interest expense of less than 0.005% for the fiscal year ended October 31, 2012, which is not included under the contractual expense limitation. The interest expense is a result of utilizing the line of credit, as discussed in Note H in the Notes to the Financial Statements. |
| (f) | Portfolio turnover rate excludes securities delivered from processing a redemption in-kind. |
The accompanying notes are an integral part of these financial statements.
AMG Funds
| | |
| AMG Managers Fairpointe Mid Cap Fund – Class I | | April 30, 2017 |
| Financial Highlights | | |
| | | | | | | | | | | | | | | | | | | | | | | | |
| | | For the
Six Months
Ended
04/30/17
(unaudited) | | | Year
Ended
10/31/16 | | | Year
Ended
10/31/15 | | | Year
Ended
10/31/14 | | | Year
Ended
10/31/13 | | | Year
Ended
10/31/12 | |
Net Asset Value, Beginning of Period | | $ | 38.39 | | | $ | 38.44 | | | $ | 47.74 | | | $ | 46.10 | | | $ | 33.28 | | | $ | 30.20 | |
| | | | | | | | | | | | | | | | | | | | | | | | |
Income from Investment Operations: | | | | | | | | | | | | | | | | | | | | | | | | |
Net investment income | | | 0.02 | (a) | | | 0.25 | (a) | | | 0.23 | | | | 0.05 | | | | 0.28 | | | | 0.24 | |
Net realized and unrealized gain (loss) on investments | | | 7.40 | | | | 1.98 | | | | (1.89 | ) | | | 5.92 | | | | 13.67 | | | | 3.18 | |
| | | | | | | | | | | | | | | | | | | | | | | | |
Total from investment operations | | | 7.42 | | | | 2.23 | | | | (1.66 | ) | | | 5.97 | | | | 13.95 | | | | 3.42 | |
| | | | | | | | | | | | | | | | | | | | | | | | |
Less Distributions: | | | | | | | | | | | | | | | | | | | | | | | | |
Distributions from and in excess of net investment income | | | (0.24 | ) | | | (0.23 | ) | | | (0.06 | ) | | | (0.06 | ) | | | (0.39 | ) | | | (0.13 | ) |
Distributions from net realized gain on investment | | | (1.75 | ) | | | (2.05 | ) | | | (7.58 | ) | | | (4.27 | ) | | | (0.74 | ) | | | (0.21 | ) |
| | | | | | | | | | | | | | | | | | | | | | | | |
Total distributions | | | (1.99 | ) | | | (2.28 | ) | | | (7.64 | ) | | | (4.33 | ) | | | (1.13 | ) | | | (0.34 | ) |
| | | | | | | | | | | | | | | | | | | | | | | | |
Net increase (decrease) in net asset value | | | 5.43 | | | | (0.05 | ) | | | (9.30 | ) | | | 1.64 | | | | 12.82 | | | | 3.08 | |
| | | | | | | | | | | | | | | | | | | | | | | | |
Net Asset Value, End of Period | | $ | 43.82 | | | $ | 38.39 | | | $ | 38.44 | | | $ | 47.74 | | | $ | 46.10 | | | $ | 33.28 | |
| | | | | | | | | | | | | | | | | | | | | | | | |
Total Return (b) | | | 19.48 | %(c) | | | 6.26 | % | | | (4.78 | )% | | | 13.61 | % | | | 43.23 | % | | | 11.46 | % |
Ratios/Supplemental Data: | | | | | | | | | | | | | | | | | | | | | | | | |
Net Assets, End of Period (in 000’s) | | $ | 2,562,775 | | | $ | 2,135,998 | | | $ | 2,838,642 | | | $ | 3,531,114 | | | $ | 2,521,876 | | | $ | 1,464,222 | |
Ratios of expenses to average net assets: | | | | | | | | | | | | | | | | | | | | | | | | |
Before expense reimbursement and/or fee waiver | | | 0.88 | %(d) | | | 0.87 | % | | | 0.86 | % | | | 0.85 | % | | | 0.86 | % | | | 0.86 | %(e) |
After expense reimbursement and/or fee waiver | | | 0.87 | %(d) | | | 0.87 | % | | | 0.86 | % | | | 0.85 | % | | | 0.86 | % | | | 0.86 | %(e) |
Ratios of net investment income to average net assets: | | | | | | | | | | | | | | | | | | | | | | | | |
Before expense reimbursement and/or fee waiver | | | 0.09 | %(d) | | | 0.68 | % | | | 0.52 | % | | | 0.13 | % | | | 0.67 | % | | | 0.75 | % |
After expense reimbursement and/or fee waiver | | | 0.10 | %(d) | | | 0.68 | % | | | 0.52 | % | | | 0.13 | % | | | 0.67 | % | | | 0.75 | % |
Portfolio Turnover | | | 17 | %(c) | | | 24 | % | | | 32 | % | | | 50 | % | | | 37 | % | | | 28 | %(f) |
| (a) | Per share numbers have been calculated using average shares. |
| (b) | The total return is calculated using the published Net Asset Value. |
| (e) | Ratios of expenses to average net assets include interest expense of less than 0.005% for the fiscal year ended October 31, 2012, which is not included under the contractual expense limitation. The interest expense is a result of utilizing the line of credit, as discussed in Note H in the Notes to the Financial Statements. |
| (f) | Portfolio turnover rate excludes securities delivered from processing a redemption in-kind. |
The accompanying notes are an integral part of these financial statements.
AMG Funds
| | |
| AMG Managers Montag & Caldwell Mid Cap Growth Fund – Class N | | April 30, 2017 |
| Financial Highlights | | |
| | | | | | | | | | | | | | | | | | | | | | | | |
| | | For the
Six Months
Ended
04/30/17
(unaudited) | | | Year
Ended
10/31/16 | | | Year
Ended
10/31/15 | | | Year
Ended
10/31/14 | | | Year
Ended
10/31/13 | | | Year
Ended
10/31/12 | |
Net Asset Value, Beginning of Period | | $ | 10.19 | | | $ | 11.57 | | | $ | 11.99 | | | $ | 12.77 | | | $ | 10.36 | | | $ | 9.71 | |
| | | | | | | | | | | | | | | | | | | | | | | | |
Income from Investment Operations: | | | | | | | | | | | | | | | | | | | | | | | | |
Net investment loss | | | (0.04 | )(a) | | | (0.07 | )(a) | | | (0.08 | ) | | | (0.06 | )(a) | | | (0.07 | ) | | | (0.07 | )(a) |
Net realized and unrealized gain on investments | | | 1.17 | | | | 0.02 | | | | 0.65 | | | | 1.20 | | | | 2.58 | | | | 0.72 | |
| | | | | | | | | | | | | | | | | | | | | | | | |
Total from investment operations | | | 1.13 | | | | (0.05 | ) | | | 0.57 | | | | 1.14 | | | | 2.51 | | | | 0.65 | |
| | | | | | | | | | | | | | | | | | | | | | | | |
Less Distributions: | | | | | | | | | | | | | | | | | | | | | | | | |
Distributions from net investment income | | | (0.03 | ) | | | — | | | | — | | | | — | | | | — | | | | — | |
Distributions from net realized gain on investments | | | (0.77 | ) | | | (1.33 | ) | | | (0.99 | ) | | | (1.92 | ) | | | (0.10 | ) | | | — | |
| | | | | | | | | | | | | | | | | | | | | | | | |
Total distributions | | | (0.80 | ) | | | (1.33 | ) | | | (0.99 | ) | | | (1.92 | ) | | | (0.10 | ) | | | — | |
| | | | | | | | | | | | | | | | | | | | | | | | |
Net increase (decrease) in net asset value | | | 0.33 | | | | (1.38 | ) | | | (0.42 | ) | | | (0.78 | ) | | | 2.41 | | | | 0.65 | |
| | | | | | | | | | | | | | | | | | | | | | | | |
Net Asset Value, End of Period | | $ | 10.52 | | | $ | 10.19 | | | $ | 11.57 | | | $ | 11.99 | | | $ | 12.77 | | | $ | 10.36 | |
| | | | | | | | | | | | | | | | | | | | | | | | |
Total Return (b) | | | 11.27 | %(c) | | | (0.60 | )% | | | 4.81 | % | | | 9.75 | % | | | 24.51 | % | | | 6.70 | % |
Ratios/Supplemental Data: | | | | | | | | | | | | | | | | | | | | | | | | |
Net Assets, End of Period (in 000’s) | | $ | 4,505 | | | $ | 4,216 | | | $ | 4,890 | | | $ | 7,633 | | | $ | 11,402 | | | $ | 7,369 | |
Ratios of expenses to average net assets: | | | | | | | | | | | | | | | | | | | | | | | | |
Before expense reimbursement and/or fee waiver | | | 1.87 | %(d) | | | 2.12 | % | | | 2.10 | % | | | 2.16 | % | | | 1.85 | % | | | 2.50 | % |
After expense reimbursement and/or fee waiver | | | 1.23 | %(d)(g) | | | 1.25 | %(f) | | | 1.25 | % | | | 1.25 | % | | | 1.25 | % | | | 1.25 | %(e) |
Ratios of net investment loss to average net assets: | | | | | | | | | | | | | | | | | | | | | | | | |
Before expense reimbursement and/or fee waiver | | | (1.35 | )%(d) | | | (1.51 | )% | | | (1.46 | )% | | | (1.45 | )% | | | (1.18 | )% | | | (1.88 | )% |
After expense reimbursement and/or fee waiver | | | (0.71 | )%(d) | | | (0.64 | )% | | | (0.60 | )% | | | (0.55 | )% | | | (0.58 | )% | | | (0.63 | )% |
Portfolio Turnover | | | 32 | %(c) | | | 39 | % | | | 58 | % | | | 33 | % | | | 74 | % | | | 37 | % |
| (a) | Per share numbers have been calculated using average shares. |
| (b) | The total return is calculated using the published Net Asset Value. |
| (e) | Effective February 29, 2012, the Investment Manager removed the voluntary expense limitation and replaced it with a contractual expense limitation of 1.25%. |
| (f) | Effective October 1, 2016, the Fund’s expense cap was reduced to 0.95% from 1.25%. The expense ratio shown reflects the weighted average expense ratio for the full fiscal year ended October 31, 2016. (See Note F) |
| (g) | Includes reduction from brokerage recapture amounting to 0.02%. |
The accompanying notes are an integral part of these financial statements.
AMG Funds
| | |
| AMG Managers Montag & Caldwell Mid Cap Growth Fund – Class I | | April 30, 2017 |
| Financial Highlights | | |
| | | | | | | | | | | | | | | | |
| | | For the
Six Months
Ended
04/30/17
(unaudited) | | | Year
Ended
10/31/16 | | | Year
Ended
10/31/15 | | | Period
Ended
10/31/14(a) | |
Net Asset Value, Beginning of Period | | $ | 10.25 | | | $ | 11.61 | | | $ | 12.00 | | | $ | 11.36 | |
| | | | | | | | | | | | | | | | |
Income from Investment Operations: | | | | | | | | | | | | | | | | |
Net investment loss | | | (0.02 | )(b) | | | (0.04 | )(b) | | | (0.04 | ) | | | (0.04 | )(b) |
Net realized and unrealized gain on investments | | | 1.20 | | | | 0.01 | | | | 0.64 | | | | 0.68 | |
| | | | | | | | | | | | | | | | |
Total from investment operations | | | 1.18 | | | | (0.03 | ) | | | 0.60 | | | | 0.64 | |
| | | | | | | | | | | | | | | | |
Less Distributions: | | | | | | | | | | | | | | | | |
Distributions from net investment income | | | (0.06 | ) | | | — | | | | — | | | | — | |
Distributions from net realized gain on investments | | | (0.80 | ) | | | (1.33 | ) | | | (0.99 | ) | | | — | |
| | | | | | | | | | | | | | | | |
Total distributions | | | (0.86 | ) | | | (1.33 | ) | | | (0.99 | ) | | | — | |
| | | | | | | | | | | | | | | | |
Net increase (decrease) in net asset value | | | 0.32 | | | | (1.36 | ) | | | (0.39 | ) | | | 0.64 | |
| | | | | | | | | | | | | | | | |
Net Asset Value, End of Period | | $ | 10.57 | | | $ | 10.25 | | | $ | 11.61 | | | $ | 12.00 | |
| | | | | | | | | | | | | | | | |
Total Return (c) | | | 11.45 | %(d) | | | (0.41 | )% | | | 5.08 | % | | | 5.63 | %(d) |
Ratios/Supplemental Data: | | | | | | | | | | | | | | | | |
Net Assets, End of Period (in 000’s) | | $ | 4,485 | | | $ | 3,982 | | | $ | 6,163 | | | $ | 3,867 | |
Ratios of expenses to average net assets: | | | | | | | | | | | | | | | | |
Before expense reimbursement and/or fee waiver | | | 1.62 | %(e) | | | 1.86 | % | | | 1.85 | % | | | 2.27 | %(e) |
After expense reimbursement and/or fee waiver | | | 0.98 | %(e)(g) | | | 1.00 | %(f) | | | 1.00 | % | | | 1.00 | %(e) |
Ratios of net investment loss to average net assets: | | | | | | | | | | | | | | | | |
Before expense reimbursement and/or fee waiver | | | (1.10 | )%(e) | | | (1.24 | )% | | | (1.21 | )% | | | (1.95 | )%(e) |
After expense reimbursement and/or fee waiver | | | (0.46 | )%(e) | | | (0.38 | )% | | | (0.35 | )% | | | (0.68 | )%(e) |
Portfolio Turnover | | | 32 | %(d) | | | 39 | % | | | 58 | % | | | 33 | %(d) |
| (a) | The commencement of investment operations for AMG Managers Montag & Caldwell Mid Cap Growth Fund Class I shares was May 13, 2014. |
| (b) | Per share numbers have been calculated using average shares. |
| (c) | The total return is calculated using the published Net Asset Value. |
| (f) | Effective October 1, 2016, the Fund’s expense cap was reduced to 0.95% from 1.00%. The expense ratio shown reflects the weighted average expense ratio for the full fiscal year ended October 31, 2016. (See Note F) |
| (g) | Includes reduction from brokerage recapture amounting to 0.02%. |
The accompanying notes are an integral part of these financial statements.
AMG Funds
| | |
| AMG Managers LMCG Small Cap Growth Fund – Class N | | April 30, 2017 |
| Financial Highlights | | |
| | | | | | | | | | | | | | | | | | | | | | | | |
| | | For the
Six Months
Ended
04/30/17
(unaudited) | | | Year
Ended
10/31/16 | | | Year
Ended
10/31/15 | | | Year
Ended
10/31/14 | | | Year
Ended
10/31/13 | | | Year
Ended
10/31/12 | |
Net Asset Value, Beginning of Period | | $ | 12.19 | | | $ | 14.47 | | | $ | 14.76 | | | $ | 14.71 | | | $ | 11.42 | | | $ | 9.95 | |
| | | | | | | | | | | | | | | | | | | | | | | | |
Income from Investment Operations: | | | | | | | | | | | | | | | | | | | | | | | | |
Net investment income (loss) (a) | | | (0.03 | ) | | | (0.11 | ) | | | (0.15 | ) | | | (0.13 | ) | | | 0.00 | (b) | | | (0.12 | ) |
Net realized and unrealized gain (loss) on investments | | | 2.31 | | | | (2.17 | ) | | | 0.40 | | | | 2.21 | | | | 4.18 | | | | 1.59 | |
| | | | | | | | | | | | | | | | | | | | | | | | |
Total from investment operations | | | 2.28 | | | | (2.28 | ) | | | 0.25 | | | | 2.08 | | | | 4.18 | | | | 1.47 | |
| | | | | | | | | | | | | | | | | | | | | | | | |
Less Distributions: | | | | | | | | | | | | | | | | | | | | | | | | |
Distributions from net realized gain on investments | | | — | | | | (0.00 | )(b) | | | (0.54 | ) | | | (2.03 | ) | | | (0.89 | ) | | | — | |
| | | | | | | | | | | | | | | | | | | | | | | | |
Total distributions | | | — | | | | (0.00 | )(b) | | | (0.54 | ) | | | (2.03 | ) | | | (0.89 | ) | | | — | |
| | | | | | | | | | | | | | | | | | | | | | | | |
Net increase (decrease) in net asset value | | | 2.28 | | | | (2.28 | ) | | | (0.29 | ) | | | 0.05 | | | | 3.29 | | | | 1.47 | |
| | | | | | | | | | | | | | | | | | | | | | | | |
Net Asset Value, End of Period | | $ | 14.47 | | | $ | 12.19 | | | $ | 14.47 | | | $ | 14.76 | | | $ | 14.71 | | | $ | 11.42 | |
| | | | | | | | | | | | | | | | | | | | | | | | |
Total Return (c) | | | 18.70 | %(d) | | | (15.74 | )% | | | 1.65 | % | | | 15.18 | % | | | 39.31 | % | | | 14.77 | % |
Ratios/Supplemental Data: | | | | | | | | | | | | | | | | | | | | | | | | |
Net Assets, End of Period (in 000’s) | | $ | 50,063 | | | $ | 53,816 | | | $ | 154,394 | | | $ | 37,099 | | | $ | 32,045 | | | $ | 5,659 | |
Ratios of expenses to average net assets: | | | | | | | | | | | | | | | | | | | | | | | | |
Before expense reimbursement and/or fee waiver | | | 1.34 | %(e) | | | 1.51 | % | | | 1.53 | % | | | 1.67 | % | | | 2.03 | % | | | 2.86 | % |
After expense reimbursement and/or fee waiver | | | 1.18 | %(e)(i) | | | 1.35 | %(f) | | | 1.35 | % | | | 1.35 | % | | | 1.35 | % | | | 1.35 | % |
Ratios of net investment income (loss) to average net assets: | | | | | | | | | | | | | | | | | | | | | | | | |
Before expense reimbursement and/or fee waiver | | | (0.59 | )%(e) | | | (1.00 | )% | | | (1.18 | )% | | | (1.22 | )% | | | (0.66 | )% | | | (2.68 | )% |
After expense reimbursement and/or fee waiver | | | (0.44 | )%(e) | | | (0.84 | )% | | | (1.00 | )% | | | (0.90 | )% | | | 0.02 | % | | | (1.17 | )% |
Portfolio Turnover | | | 68 | %(d) | | | 138 | % | | | 79 | % | | | 144 | % | | | 186 | %(g) | | | 168 | %(h) |
| (a) | Per share numbers have been calculated using average shares. |
| (b) | Less than $0.005 or $(0.005) per share. |
| (c) | The total return is calculated using the published Net Asset Value. |
| (f) | Effective October 1, 2016, the Fund’s expense cap was reduced to 1.03% from 1.35%. The expense ratio shown reflects the weighted average expense ratio for the full fiscal year ended October 31, 2016. (See Note F) |
| (g) | Portfolio turnover rate excludes securities received from the reorganization. |
| (h) | Portfolio turnover rate excludes securities delivered from processing a redemption in-kind. |
| (i) | Includes reduction from brokerage recapture amounting to 0.01%. |
The accompanying notes are an integral part of these financial statements.
AMG Funds
| | |
| AMG Managers LMCG Small Cap Growth Fund – Class I | | April 30, 2017 |
| Financial Highlights | | |
| | | | | | | | | | | | | | | | | | | | | | | | |
| | | For the
Six Months
Ended
04/30/17
(unaudited) | | | Year
Ended
10/31/16 | | | Year
Ended
10/31/15 | | | Year
Ended
10/31/14 | | | Year
Ended
10/31/13 | | | Year
Ended
10/31/12 | |
Net Asset Value, Beginning of Period | | $ | 12.36 | | | $ | 14.64 | | | $ | 14.89 | | | $ | 14.81 | | | $ | 11.46 | | | $ | 9.97 | |
| | | | | | | | | | | | | | | | | | | | | | | | |
Income from Investment Operations: | | | | | | | | | | | | | | | | | | | | | | | | |
Net investment income (loss) (a) | | | (0.04 | ) | | | (0.08 | ) | | | (0.12 | ) | | | (0.09 | ) | | | 0.04 | | | | (0.10 | ) |
Net realized and unrealized gain (loss) on investments | | | 2.35 | | | | (2.20 | ) | | | 0.41 | | | | 2.23 | | | | 4.20 | | | | 1.59 | |
| | | | | | | | | | | | | | | | | | | | | | | | |
Total from investment operations | | | 2.31 | | | | (2.28 | ) | | | 0.29 | | | | 2.14 | | | | 4.24 | | | | 1.49 | |
| | | | | | | | | | | | | | | | | | | | | | | | |
Less Distributions: | | | | | | | | | | | | | | | | | | | | | | | | |
Distributions from and in excess of net investment income | | | — | | | | — | | | | — | | | | (0.03 | ) | | | — | | | | — | |
Distributions from net realized gain on investments | | | — | | | | (0.00 | )(b) | | | (0.54 | ) | | | (2.03 | ) | | | (0.89 | ) | | | — | |
| | | | | | | | | | | | | | | | | | | | | | | | |
Total distributions | | | — | | | | (0.00 | )(b) | | | (0.54 | ) | | | (2.06 | ) | | | (0.89 | ) | | | — | |
| | | | | | | | | | | | | | | | | | | | | | | | |
Net increase (decrease) in net asset value | | | 2.31 | | | | (2.28 | ) | | | (0.25 | ) | | | 0.08 | | | | 3.35 | | | | 1.49 | |
| | | | | | | | | | | | | | | | | | | | | | | | |
Net Asset Value, End of Period | | $ | 14.67 | | | $ | 12.36 | | | $ | 14.64 | | | $ | 14.89 | | | $ | 14.81 | | | $ | 11.46 | |
| | | | | | | | | | | | | | | | | | | | | | | | |
Total Return (c) | | | 18.77 | %(d) | | | (15.56 | )% | | | 1.91 | % | | | 15.51 | % | | | 39.72 | % | | | 14.95 | % |
Ratios/Supplemental Data: | | | | | | | | | | | | | | | | | | | | | | | | |
Net Assets, End of Period (in 000’s) | | $ | 84,766 | | | $ | 58,020 | | | $ | 76,989 | | | $ | 15,083 | | | $ | 8,496 | | | $ | 755 | |
Ratios of expenses to average net assets: | | | | | | | | | | | | | | | | | | | | | | | | |
Before expense reimbursement and/or fee waiver | | | 1.23 | %(e) | | | 1.25 | % | | | 1.28 | % | | | 1.42 | % | | | 1.78 | % | | | 2.61 | % |
After expense reimbursement and/or fee waiver | | | 1.08 | %(e)(i) | | | 1.10 | %(f) | | | 1.10 | % | | | 1.10 | % | | | 1.10 | % | | | 1.10 | % |
Ratios of net investment income (loss) to average net assets: | | | | | | | | | | | | | | | | | | | | | | | | |
Before expense reimbursement and/or fee waiver | | | (0.64 | )%(e) | | | (0.74 | )% | | | (0.93 | )% | | | (0.97 | )% | | | (0.41 | )% | | | (2.43 | )% |
After expense reimbursement and/or fee waiver | | | (0.49 | )%(e) | | | (0.59 | )% | | | (0.75 | )% | | | (0.65 | )% | | | 0.27 | % | | | (0.92 | )% |
Portfolio Turnover | | | 68 | %(d) | | | 138 | % | | | 79 | % | | | 144 | % | | | 186 | %(g) | | | 168 | %(h) |
| (a) | Per share numbers have been calculated using average shares. |
| (b) | Less than $0.005 or $(0.005) per share. |
| (c) | The total return is calculated using the published Net Asset Value. |
| (f) | Effective October 1, 2016, the Fund’s expense cap was reduced to 1.03% from 1.10%. The expense ratio shown reflects the weighted average expense ratio for the full fiscal year ended October 31, 2016. (See Note F) |
| (g) | Portfolio turnover rate excludes securities received from the reorganization. |
| (h) | Portfolio turnover rate excludes securities delivered from processing a redemption in-kind. |
| (i) | Includes reduction from brokerage recapture amounting to 0.01%. |
The accompanying notes are an integral part of these financial statements.
AMG Funds
| | |
| AMG River Road Select Value Fund – Class N | | April 30, 2017 |
| Financial Highlights | | |
| | | | | | | | | | | | | | | | | | | | | | | | |
| | | For the
Six Months
Ended
04/30/17
(unaudited) | | | Year
Ended
10/31/16 | | | Year
Ended
10/31/15 | | | Year
Ended
10/31/14 | | | Year
Ended
10/31/13 | | | Year
Ended
10/31/12 | |
Net Asset Value, Beginning of Period | | $ | 7.04 | | | $ | 7.63 | | | $ | 8.77 | | | $ | 10.28 | | | $ | 8.50 | | | $ | 9.54 | |
| | | | | | | | | | | | | | | | | | | | | | | | |
Income from Investment Operations: | | | | | | | | | | | | | | | | | | | | | | | | |
Net investment income (loss) (a) | | | (0.00 | )(b) | | | (0.04 | ) | | | (0.04 | ) | | | (0.03 | ) | | | 0.07 | | | | 0.01 | |
Net realized and unrealized gain on investments | | | 1.46 | | | | 0.56 | | | | 0.33 | | | | 0.03 | | | | 2.34 | | | | 1.01 | |
| | | | | | | | | | | | | | | | | | | | | | | | |
Total from investment operations | | | 1.46 | | | | 0.52 | | | | 0.29 | | | | — | | | | 2.41 | | | | 1.02 | |
| | | | | | | | | | | | | | | | | | | | | | | | |
Less Distributions: | | | | | | | | | | | | | | | | | | | | | | | | |
Distributions from net investment income | | | (0.01 | ) | | | — | | | | — | | | | (0.02 | ) | | | (0.12 | ) | | | — | |
Distributions from net realized gain on investments | | | (0.58 | ) | | | (1.11 | ) | | | (1.43 | ) | | | (1.49 | ) | | | (0.51 | ) | | | (2.06 | ) |
| | | | | | | | | | | | | | | | | | | | | | | | |
Total distributions | | | (0.59 | ) | | | (1.11 | ) | | | (1.43 | ) | | | (1.51 | ) | | | (0.63 | ) | | | (2.06 | ) |
| | | | | | | | | | | | | | | | | | | | | | | | |
Net increase (decrease) in net asset value | | | 0.87 | | | | (0.59 | ) | | | (1.14 | ) | | | (1.51 | ) | | | 1.78 | | | | (1.04 | ) |
| | | | | | | | | | | | | | | | | | | | | | | | |
Net Asset Value, End of Period | | $ | 7.91 | | | $ | 7.04 | | | $ | 7.63 | | | $ | 8.77 | | | $ | 10.28 | | | $ | 8.50 | |
| | | | | | | | | | | | | | | | | | | | | | | | |
Total Return (c) | | | 21.27 | %(d) | | | 8.55 | % | | | 3.26 | % | | | (0.23 | )% | | | 30.44 | % | | | 12.87 | % |
Ratios/Supplemental Data: | | | | | | | | | | | | | | | | | | | | | | | | |
Net Assets, End of Period (in 000’s) | | $ | 5,274 | | | $ | 4,942 | | | $ | 5,038 | | | $ | 8,388 | | | $ | 19,099 | | | $ | 6,270 | |
Ratios of expenses to average net assets: | | | | | | | | | | | | | | | | | | | | | | | | |
Before expense reimbursement and/or fee waiver, or recoupment | | | 1.47 | %(e) | | | 1.62 | % | | | 1.49 | % | | | 1.45 | % | | | 1.46 | % | | | 1.43 | %(f) |
After expense reimbursement and/or fee waiver, or recoupment | | | 1.38 | %(e)(h) | | | 1.50 | %(g) | | | 1.49 | % | | | 1.45 | % | | | 1.46 | % | | | 1.43 | %(f) |
Ratios of net investment income (loss) to average net assets: | | | | | | | | | | | | | | | | | | | | | | | | |
Before expense reimbursement and/or fee waiver, or recoupment | | | (0.19 | )%(e) | | | (0.65 | )% | | | (0.52 | )% | | | (0.36 | )% | | | 0.78 | % | | | 0.07 | % |
After expense reimbursement and/or fee waiver, or recoupment | | | (0.10 | )%(e) | | | (0.52 | )% | | | (0.52 | )% | | | (0.36 | )% | | | 0.78 | % | | | 0.07 | % |
Portfolio Turnover | | | 28 | %(d) | | | 65 | % | | | 59 | % | | | 64 | % | | | 71 | % | | | 39 | % |
| (a) | Per share numbers have been calculated using average shares. |
| (b) | Less than $0.005 or $(0.005) per share. |
| (c) | The total return is calculated using the published Net Asset Value. |
| (f) | Ratios of expenses to average net assets include interest expense of less than 0.005% for the fiscal year ended October 31, 2012, which is not included under the contractual expense limitation. The interest expense is a result of utilizing the line of credit, as discussed in Note H in the Notes to the Financial Statements. |
| (g) | Effective October 1, 2016, the Fund’s expense cap was reduced to 1.19% from 1.50%. The expense ratio shown reflects the weighted average expense ratio for the full fiscal year ended October 31, 2016. (See Note F) |
| (h) | Includes reduction from brokerage recapture amounting to 0.02%. |
The accompanying notes are an integral part of these financial statements.
AMG Funds
| | |
| AMG River Road Select Value Fund – Class I | | April 30, 2017 |
| Financial Highlights | | |
| | | | | | | | | | | | | | | | | | | | | | | | |
| | | For the
Six Months
Ended
04/30/17
(unaudited) | | | Year
Ended
10/31/16 | | | Year
Ended
10/31/15 | | | Year
Ended
10/31/14 | | | Year
Ended
10/31/13 | | | Year
Ended
10/31/12 | |
Net Asset Value, Beginning of Period | | $ | 7.16 | | | $ | 7.76 | | | $ | 8.88 | | | $ | 10.38 | | | $ | 8.58 | | | $ | 9.59 | |
| | | | | | | | | | | | | | | | | | | | | | | | |
Income from Investment Operations: | | | | | | | | | | | | | | | | | | | | | | | | |
Net investment income (loss) (a) | | | 0.01 | | | | (0.02 | ) | | | (0.02 | ) | | | (0.01 | ) | | | 0.10 | | | | 0.03 | |
Net realized and unrealized gain on investments | | | 1.49 | | | | 0.55 | | | | 0.33 | | | | 0.04 | | | | 2.36 | | | | 1.02 | |
| | | | | | | | | | | | | | | | | | | | | | | | |
Total from investment operations | | | 1.50 | | | | 0.53 | | | | 0.31 | | | | 0.03 | | | | 2.46 | | | | 1.05 | |
| | | | | | | | | | | | | | | | | | | | | | | | |
Less Distributions: | | | | | | | | | | | | | | | | | | | | | | | | |
Distributions from net investment income | | | (0.03 | ) | | | (0.02 | ) | | | — | | | | (0.04 | ) | | | (0.15 | ) | | | — | |
Distributions from net realized gain on investments | | | (0.59 | ) | | | (1.11 | ) | | | (1.43 | ) | | | (1.49 | ) | | | (0.51 | ) | | | (2.06 | ) |
| | | | | | | | | | | | | | | | | | | | | | | | |
Total distributions | | | (0.62 | ) | | | (1.13 | ) | | | (1.43 | ) | | | (1.53 | ) | | | (0.66 | ) | | | (2.06 | ) |
| | | | | | | | | | | | | | | | | | | | | | | | |
Net increase (decrease) in net asset value | | | 0.88 | | | | (0.60 | ) | | | (1.12 | ) | | | (1.50 | ) | | | 1.80 | | | | (1.01 | ) |
| | | | | | | | | | | | | | | | | | | | | | | | |
Net Asset Value, End of Period | | $ | 8.04 | | | $ | 7.16 | | | $ | 7.76 | | | $ | 8.88 | | | $ | 10.38 | | | $ | 8.58 | |
| | | | | | | | | | | | | | | | | | | | | | | | |
Total Return (b) | | | 21.49 | %(c) | | | 8.64 | % | | | 3.60 | % | | | 0.00 | % | | | 30.74 | % | | | 13.18 | % |
Ratios/Supplemental Data: | | | | | | | | | | | | | | | | | | | | | | | | |
Net Assets, End of Period (in 000’s) | | $ | 35,649 | | | $ | 34,913 | | | $ | 92,073 | | | $ | 176,166 | | | $ | 198,220 | | | $ | 156,510 | |
Ratios of expenses to average net assets: | | | | | | | | | | | | | | | | | | | | | | | | |
Before expense reimbursement and/or fee waiver, or recoupment | | | 1.22 | %(d) | | | 1.38 | % | | | 1.24 | % | | | 1.20 | % | | | 1.21 | % | | | 1.18 | %(e) |
After expense reimbursement and/or fee waiver, or recoupment | | | 1.13 | %(d)(g) | | | 1.25 | %(f) | | | 1.24 | % | | | 1.20 | % | | | 1.21 | % | | | 1.18 | %(e) |
Ratios of net investment income (loss) to average net assets: | | | | | | | | | | | | | | | | | | | | | | | | |
Before expense reimbursement and/or fee waiver, or recoupment | | | 0.06 | %(d) | | | (0.37 | )% | | | (0.27 | )% | | | (0.11 | )% | | | 1.03 | % | | | 0.32 | % |
After expense reimbursement and/or fee waiver, or recoupment | | | 0.14 | %(d) | | | (0.24 | )% | | | (0.27 | )% | | | (0.11 | )% | | | 1.03 | % | | | 0.32 | % |
Portfolio Turnover | | | 28 | %(c) | | | 65 | % | | | 59 | % | | | 64 | % | | | 71 | % | | | 39 | % |
| (a) | Per share numbers have been calculated using average shares. |
| (b) | The total return is calculated using the published Net Asset Value. |
| (e) | Ratios of expenses to average net assets include interest expense of less than 0.005% for the fiscal year ended October 31, 2012, which is not included under the contractual expense limitation. The interest expense is a result of utilizing the line of credit, as discussed in Note H in the Notes to the Financial Statements. |
| (f) | Effective October 1, 2016, the Fund’s expense cap was reduced to 1.19% from 1.25%. The expense ratio shown reflects the weighted average expense ratio for the full fiscal year ended October 31, 2016. (See Note F) |
| (g) | Includes reduction from brokerage recapture amounting to 0.02%. |
The accompanying notes are an integral part of these financial statements.
AMG Funds
| | |
| AMG River Road Small Cap Value Fund – Class N | | April 30, 2017 |
| Financial Highlights | | |
| | | | | | | | | | | | | | | | | | | | | | | | |
| | | For the
Six Months
Ended
04/30/17
(unaudited) | | | Year
Ended
10/31/16 | | | Year
Ended
10/31/15 | | | Year
Ended
10/31/14 | | | Year
Ended
10/31/13 | | | Year
Ended
10/31/12 | |
Net Asset Value, Beginning of Period | | $ | 12.29 | | | $ | 12.20 | | | $ | 13.53 | | | $ | 17.05 | | | $ | 13.56 | | | $ | 12.20 | |
| | | | | | | | | | | | | | | | | | | | | | | | |
Income from Investment Operations: | | | | | | | | | | | | | | | | | | | | | | | | |
Net investment income (loss) | | | (0.02 | )(a) | | | (0.04 | )(a) | | | (0.06 | )(a) | | | (0.04 | )(a) | | | 0.16 | | | | 0.03 | (a) |
Net realized and unrealized gain on investments | | | 2.36 | | | | 0.85 | | | | 0.72 | | | | 0.14 | | | | 3.98 | | | | 1.33 | |
| | | | | | | | | | | | | | | | | | | | | | | | |
Total from investment operations | | | 2.34 | | | | 0.81 | | | | 0.66 | | | | 0.10 | | | | 4.14 | | | | 1.36 | |
| | | | | | | | | | | | | | | | | | | | | | | | |
Less Distributions: | | | | | | | | | | | | | | | | | | | | | | | | |
Distributions from and in excess of net investment income | | | — | | | | — | | | | — | | | | (0.04 | ) | | | (0.22 | ) | | | — | |
Distributions from net realized gain on investments | | | (0.66 | ) | | | (0.72 | ) | | | (1.99 | ) | | | (3.58 | ) | | | (0.43 | ) | | | — | |
| | | | | | | | | | | | | | | | | | | | | | | | |
Total distributions | | | (0.66 | ) | | | (0.72 | ) | | | (1.99 | ) | | | (3.62 | ) | | | (0.65 | ) | | | — | |
| | | | | | | | | | | | | | | | | | | | | | | | |
Net increase (decrease) in net asset value | | | 1.68 | | | | 0.09 | | | | (1.33 | ) | | | (3.52 | ) | | | 3.49 | | | | 1.36 | |
| | | | | | | | | | | | | | | | | | | | | | | | |
Net Asset Value, End of Period | | $ | 13.97 | | | $ | 12.29 | | | $ | 12.20 | | | $ | 13.53 | | | $ | 17.05 | | | $ | 13.56 | |
| | | | | | | | | | | | | | | | | | | | | | | | |
Total Return (b) | | | 19.25 | %(c) | | | 7.22 | % | | | 5.15 | % | | | (0.05 | )% | | | 31.98 | % | | | 11.15 | % |
Ratios/Supplemental Data: | | | | | | | | | | | | | | | | | | | | | | | | |
Net Assets, End of Period (in 000’s) | | $ | 28,613 | | | $ | 21,765 | | | $ | 25,246 | | | $ | 49,049 | | | $ | 56,793 | | | $ | 49,154 | |
Ratios of expenses to average net assets: | | | | | | | | | | | | | | | | | | | | | | | | |
Before expense reimbursement and/or fee waiver | | | 1.34 | %(d) | | | 1.34 | % | | | 1.34 | % | | | 1.33 | % | | | 1.34 | % | | | 1.37 | % |
After expense reimbursement and/or fee waiver | | | 1.33 | %(d)(e) | | | 1.34 | % | | | 1.34 | % | | | 1.33 | % | | | 1.34 | % | | | 1.37 | % |
Ratios of net investment income (loss) to average net assets: | | | | | | | | | | | | | | | | | | | | | | | | |
Before expense reimbursement and/or fee waiver | | | (0.28 | )%(d) | | | (0.32 | )% | | | (0.45 | )% | | | (0.26 | )% | | | 1.03 | % | | | 0.22 | % |
After expense reimbursement and/or fee waiver | | | (0.27 | )%(d) | | | (0.31 | )% | | | (0.45 | )% | | | (0.26 | )% | | | 1.03 | % | | | 0.22 | % |
Portfolio Turnover | | | 25 | %(c) | | | 57 | % | | | 61 | % | | | 66 | % | | | 56 | % | | | 27 | % |
| (a) | Per share numbers have been calculated using average shares. |
| (b) | The total return is calculated using the published Net Asset Value. |
| (e) | Includes reduction of brokerage recapture amounting to 0.01%. |
The accompanying notes are an integral part of these financial statements.
AMG Funds
| | |
| AMG River Road Small Cap Value Fund – Class I | | April 30, 2017 |
Financial Highlights | | |
| | | | | | | | | | | | | | | | | | | | | | | | |
| | | For the
Six Months
Ended
04/30/17
(unaudited) | | | Year
Ended
10/31/16 | | | Year
Ended
10/31/15 | | | Year
Ended
10/31/14 | | | Year
Ended
10/31/13 | | | Year
Ended
10/31/12 | |
Net Asset Value, Beginning of Period | | $ | 12.44 | | | $ | 12.31 | | | $ | 13.60 | | | $ | 17.13 | | | $ | 13.62 | | | $ | 12.22 | |
| | | | | | | | | | | | | | | | | | | | | | | | |
Income from Investment Operations: | | | | | | | | | | | | | | | | | | | | | | | | |
Net investment income (loss) | | | 0.00 | (a)(b) | | | (0.01 | )(a) | | | (0.03 | )(a) | | | (0.00 | )(a)(b) | | | 0.19 | | | | 0.06 | (a) |
Net realized and unrealized gain on investments | | | 2.39 | | | | 0.86 | | | | 0.73 | | | | 0.13 | | | | 4.01 | | | | 1.34 | |
| | | | | | | | | | | | | | | | | | | | | | | | |
Total from investment operations | | | 2.39 | | | | 0.85 | | | | 0.70 | | | | 0.13 | | | | 4.20 | | | | 1.40 | |
| | | | | | | | | | | | | | | | | | | | | | | | |
Less Distributions: | | | | | | | | | | | | | | | | | | | | | | | | |
Distributions from and in excess of net investment income | | | — | | | | — | | | | — | | | | (0.08 | ) | | | (0.26 | ) | | | — | |
Distributions from net realized gain on investments | | | (0.67 | ) | | | (0.72 | ) | | | (1.99 | ) | | | (3.58 | ) | | | (0.43 | ) | | | — | |
| | | | | | | | | | | | | | | | | | | | | | | | |
Total distributions | | | (0.67 | ) | | | (0.72 | ) | | | (1.99 | ) | | | (3.66 | ) | | | (0.69 | ) | | | — | |
| | | | | | | | | | | | | | | | | | | | | | | | |
Net increase (decrease) in net asset value | | | 1.72 | | | | 0.13 | | | | (1.29 | ) | | | (3.53 | ) | | | 3.51 | | | | 1.40 | |
| | | | | | | | | | | | | | | | | | | | | | | | |
Net Asset Value, End of Period | | $ | 14.16 | | | $ | 12.44 | | | $ | 12.31 | | | $ | 13.60 | | | $ | 17.13 | | | $ | 13.62 | |
| | | | | | | | | | | | | | | | | | | | | | | | |
Total Return (c) | | | 19.42 | %(d) | | | 7.50 | % | | | 5.45 | % | | | 0.16 | % | | | 32.36 | % | | | 11.46 | % |
Ratios/Supplemental Data: | | | | | | | | | | | | | | | | | | | | | | | | |
Net Assets, End of Period (in 000’s) | | $ | 273,507 | | | $ | 246,753 | | | $ | 245,192 | | | $ | 250,173 | | | $ | 252,804 | | | $ | 240,075 | |
Ratios of expenses to average net assets: | | | | | | | | | | | | | | | | | | | | | | | | |
Before expense reimbursement and/or fee waiver | | | 1.09 | %(e) | | | 1.09 | % | | | 1.09 | % | | | 1.08 | % | | | 1.09 | % | | | 1.12 | % |
After expense reimbursement and/or fee waiver | | | 1.08 | %(e)(f) | | | 1.09 | % | | | 1.09 | % | | | 1.08 | % | | | 1.09 | % | | | 1.12 | % |
Ratios of net investment income (loss) to average net assets: | | | | | | | | | | | | | | | | | | | | | | | | |
Before expense reimbursement and/or fee waiver | | | 0.01 | %(e) | | | (0.07 | )% | | | (0.20 | )% | | | (0.01 | )% | | | 1.28 | % | | | 0.47 | % |
After expense reimbursement and/or fee waiver | | | 0.02 | %(e) | | | (0.06 | )% | | | (0.20 | )% | | | (0.01 | )% | | | 1.28 | % | | | 0.47 | % |
Portfolio Turnover | | | 25 | %(d) | | | 57 | % | | | 61 | % | | | 66 | % | | | 56 | % | | | 27 | % |
| (a) | Per share numbers have been calculated using average shares. |
| (b) | Less than $0.005 or $(0.005) per share. |
| (c) | The total return is calculated using the published Net Asset Value. |
| (f) | Includes reduction from brokerage recapture amounting to 0.01%. |
The accompanying notes are an integral part of these financial statements.
AMG Funds
| | |
| AMG Managers Silvercrest Small Cap Fund – Class N | | April 30, 2017 |
| Financial Highlights | | |
| | | | | | | | | | | | | | | | | | | | | | | | |
| | | For the
Six Months
Ended
04/30/17
(unaudited) | | | Year
Ended
10/31/16 | | | Year
Ended
10/31/15 | | | Year
Ended
10/31/14 | | | Year
Ended
10/31/13 | | | Period
Ended
10/31/12(a) | |
Net Asset Value, Beginning of Period | | $ | 15.43 | | | $ | 15.20 | | | $ | 15.20 | | | $ | 14.54 | | | $ | 10.90 | | | $ | 10.00 | |
| | | | | | | | | | | | | | | | | | | | | | | | |
Income from Investment Operations: | | | | | | | | | | | | | | | | | | | | | | | | |
Net investment income (loss) | | | (0.01 | )(b) | | | 0.02 | (b) | | | 0.01 | (b) | | | 0.01 | | | | 0.01 | (b) | | | 0.01 | |
Net realized and unrealized gain on investments | | | 2.68 | | | | 0.80 | | | | 0.31 | | | | 1.16 | | | | 3.77 | | | | 0.89 | |
| | | | | | | | | | | | | | | | | | | | | | | | |
Total from investment operations | | | 2.67 | | | | 0.82 | | | | 0.32 | | | | 1.17 | | | | 3.78 | | | | 0.90 | |
| | | | | | | | | | | | | | | | | | | | | | | | |
Less Distributions: | | | | | | | | | | | | | | | | | | | | | | | | |
Distributions from and in excess of net investment income | | | — | | | | (0.04 | ) | | | (0.02 | ) | | | (0.00 | )(c) | | | (0.11 | ) | | | — | |
Distributions from net realized gain on investments | | | (0.13 | ) | | | (0.55 | ) | | | (0.30 | ) | | | (0.51 | ) | | | (0.03 | ) | | | — | |
| | | | | | | | | | | | | | | | | | | | | | | | |
Total distributions | | | (0.13 | ) | | | (0.59 | ) | | | (0.32 | ) | | | (0.51 | ) | | | (0.14 | ) | | | — | |
| | | | | | | | | | | | | | | | | | | | | | | | |
Net increase in net asset value | | | 2.54 | | | | 0.23 | | | | 0.00 | (c) | | | 0.66 | | | | 3.64 | | | | 0.90 | |
| | | | | | | | | | | | | | | | | | | | | | | | |
Net Asset Value, End of Period | | $ | 17.97 | | | $ | 15.43 | | | $ | 15.20 | | | $ | 15.20 | | | $ | 14.54 | | | $ | 10.90 | |
| | | | | | | | | | | | | | | | | | | | | | | | |
Total Return (d) | | | 17.28 | %(e) | | | 5.73 | % | | | 2.14 | % | | | 8.18 | % | | | 35.09 | % | | | 9.00 | %(e) |
Ratios/Supplemental Data: | | | | | | | | | | | | | | | | | | | | | | | | |
Net Assets, End of Period (in 000’s) | | $ | 26,239 | | | $ | 20,228 | | | $ | 19,061 | | | $ | 6,673 | | | $ | 4,049 | | | $ | 750 | |
Ratios of expenses to average net assets: | | | | | | | | | | | | | | | | | | | | | | | | |
Before expense reimbursement and/or fee waiver | | | 1.43 | %(f) | | | 1.45 | % | | | 1.47 | % | | | 1.61 | % | | | 2.05 | % | | | 5.10 | %(f) |
After expense reimbursement and/or fee waiver | | | 1.37 | %(f)(i) | | | 1.40 | %(g) | | | 1.40 | % | | | 1.40 | % | | | 1.40 | % | | | 1.40 | %(f) |
Ratios of net investment income (loss) to average net assets: | | | | | | | | | | | | | | | | | | | | | | | | |
Before expense reimbursement and/or fee waiver | | | (0.18 | )%(f) | | | 0.11 | % | | | (0.03 | )% | | | (0.17 | )% | | | (0.61 | )% | | | (3.51 | )%(f) |
After expense reimbursement and/or fee waiver | | | (0.12 | )%(f) | | | 0.16 | % | | | 0.04 | % | | | 0.04 | % | | | 0.04 | % | | | 0.19 | %(f) |
Portfolio Turnover | | | 14 | %(e) | | | 32 | % | | | 36 | % | | | 32 | % | | | 37 | % | | | 26 | %(e)(h) |
| (a) | The commencement of investment operations for AMG Managers Silvercrest Small Cap Fund Class N shares was December 26, 2011. |
| (b) | Per share numbers have been calculated using average shares. |
| (c) | Less than $(0.005) per share. |
| (d) | The total return is calculated using the published Net Asset Value. |
| (g) | Effective October 1, 2016, the Fund’s expense cap was reduced to 1.08% from 1.40%. The expense ratio shown reflects the weighted average expense ratio for the full fiscal year ended October 31, 2016. (See Note F) |
| (h) | Portfolio turnover rate excludes securities delivered from processing a redemption in-kind. |
| (i) | Includes reduction from brokerage recapture amounting to 0.03%. |
The accompanying notes are an integral part of these financial statements.
AMG Funds
| | |
| AMG Managers Silvercrest Small Cap Fund – Class I | | April 30, 2017 |
| Financial Highlights | | |
| | | | | | | | | | | | | | | | | | | | | | | | |
| | | For the
Six Months
Ended
04/30/17
(unaudited) | | | Year
Ended
10/31/16 | | | Year
Ended
10/31/15 | | | Year
Ended
10/31/14 | | | Year
Ended
10/31/13 | | | Period
Ended
10/31/12(a) | |
Net Asset Value, Beginning of Period | | $ | 15.56 | | | $ | 15.30 | | | $ | 15.27 | | | $ | 14.59 | | | $ | 10.93 | | | $ | 10.00 | |
| | | | | | | | | | | | | | | | | | | | | | | | |
Income from Investment Operations: | | | | | | | | | | | | | | | | | | | | | | | | |
Net investment income | | | 0.01 | (b) | | | 0.06 | (b) | | | 0.04 | (b) | | | 0.05 | | | | 0.04 | (b) | | | 0.03 | |
Net realized and unrealized gain on investments | | | 2.70 | | | | 0.81 | | | | 0.32 | | | | 1.17 | | | | 3.78 | | | | 0.90 | |
| | | | | | | | | | | | | | | | | | | | | | | | |
Total from investment operations | | | 2.71 | | | | 0.87 | | | | 0.36 | | | | 1.22 | | | | 3.82 | | | | 0.93 | |
| | | | | | | | | | | | | | | | | | | | | | | | |
Less Distributions: | | | | | | | | | | | | | | | | | | | | | | | | |
Distributions from and in excess of net investment income | | | (0.04 | ) | | | (0.06 | ) | | | (0.03 | ) | | | (0.03 | ) | | | (0.13 | ) | | | — | |
Distributions from net realized gain on investments | | | (0.13 | ) | | | (0.55 | ) | | | (0.30 | ) | | | (0.51 | ) | | | (0.03 | ) | | | — | |
| | | | | | | | | | | | | | | | | | | | | | | | |
Total distributions | | | (0.17 | ) | | | (0.61 | ) | | | (0.33 | ) | | | (0.54 | ) | | | (0.16 | ) | | | — | |
| | | | | | | | | | | | | | | | | | | | | | | | |
Net increase in net asset value | | | 2.54 | | | | 0.26 | | | | 0.03 | | | | 0.68 | | | | 3.66 | | | | 0.93 | |
| | | | | | | | | | | | | | | | | | | | | | | | |
Net Asset Value, End of Period | | $ | 18.10 | | | $ | 15.56 | | | $ | 15.30 | | | $ | 15.27 | | | $ | 14.59 | | | $ | 10.93 | |
| | | | | | | | | | | | | | | | | | | | | | | | |
Total Return (c) | | | 17.38 | %(d) | | | 6.04 | % | | | 2.37 | % | | | 8.47 | % | | | 35.39 | % | | | 9.30 | %(d) |
Ratios/Supplemental Data: | | | | | | | | | | | | | | | | | | | | | | | | |
Net Assets, End of Period (in 000’s) | | $ | 227,868 | | | $ | 181,964 | | | $ | 145,402 | | | $ | 62,215 | | | $ | 29,219 | | | $ | 4,962 | |
Ratios of expenses to average net assets: | | | | | | | | | | | | | | | | | | | | | | | | |
Before expense reimbursement and/or fee waiver | | | 1.18 | %(e) | | | 1.21 | % | | | 1.22 | % | | | 1.36 | % | | | 1.80 | % | | | 4.85 | %(e) |
After expense reimbursement and/or fee waiver | | | 1.12 | %(e)(h) | | | 1.15 | %(f) | | | 1.15 | % | | | 1.15 | % | | | 1.15 | % | | | 1.15 | %(e) |
Ratios of net investment income (loss) to average net assets: | | | | | | | | | | | | | | | | | | | | | | | | |
Before expense reimbursement and/or fee waiver | | | 0.07 | %(e) | | | 0.34 | % | | | 0.22 | % | | | 0.08 | % | | | (0.36 | )% | | | (3.26 | )%(e) |
After expense reimbursement and/or fee waiver | | | 0.13 | %(e) | | | 0.40 | % | | | 0.29 | % | | | 0.29 | % | | | 0.29 | % | | | 0.44 | %(e) |
Portfolio Turnover | | | 14 | %(d) | | | 32 | % | | | 36 | % | | | 32 | % | | | 37 | % | | | 26 | %(d)(g) |
| (a) | The commencement of investment operations for AMG Managers Silvercrest Small Cap Fund Class I shares was December 26, 2011. |
| (b) | Per share numbers have been calculated using average shares. |
| (c) | The total return is calculated using the published Net Asset Value. |
| (f) | Effective October 1, 2016, the Fund’s expense cap was reduced to 1.08% from 1.15%. The expense ratio shown reflects the weighted average expense ratio for the full fiscal year ended October 31, 2016. (See Note F) |
| (g) | Portfolio turnover rate excludes securities delivered from processing a redemption in-kind. |
| (h) | Includes reduction of brokerage recapture amounting to 0.03%. |
The accompanying notes are an integral part of these financial statements.
AMG Funds
| | |
| AMG GW&K U.S. Small Cap Growth Fund – Class N | | April 30, 2017 |
| Financial Highlights | | |
| | | | | | | | | | | | | | | | | | | | | | | | |
| | | Six Months
Ended
04/30/17
(unaudited) | | | Year
Ended
10/31/16 | | | Year
Ended
10/31/15 | | | Year
Ended
10/31/14 | | | Year
Ended
10/31/13 | | | Year
Ended
10/31/12 | |
Net Asset Value, Beginning of Period | | $ | 3.58 | | | $ | 18.59 | | | $ | 22.07 | | | $ | 24.06 | | | $ | 20.52 | | | $ | 20.57 | |
| | | | | | | | | | | | | | | | | | | | | | | | |
Income from Investment Operations: | | | | | | | | | | | | | | | | | | | | | | | | |
Net investment loss (a) | | | (0.01 | ) | | | (0.06 | ) | | | (0.12 | ) | | | (0.13 | ) | | | (0.03 | ) | | | (0.12 | ) |
Net realized and unrealized gain (loss) on investments | | | 0.65 | | | | (0.62 | ) | | | (0.62 | ) | | | 0.30 | | | | 5.55 | | | | 2.09 | |
| | | | | | | | | | | | | | | | | | | | | | | | |
Total from investment operations | | | 0.64 | | | | (0.68 | ) | | | (0.74 | ) | | | 0.17 | | | | 5.52 | | | | 1.97 | |
| | | | | | | | | | | | | | | | | | | | | | | | |
Less Distributions: | | | | | | | | | | | | | | | | | | | | | | | | |
Distributions from net realized gain on investments | | | (0.01 | ) | | | (14.33 | ) | | | (2.74 | ) | | | (2.16 | ) | | | (1.98 | ) | | | (2.02 | ) |
| | | | | | | | | | | | | | | | | | | | | | | | |
Total distributions | | | (0.01 | ) | | | (14.33 | ) | | | (2.74 | ) | | | (2.16 | ) | | | (1.98 | ) | | | (2.02 | ) |
| | | | | | | | | | | | | | | | | | | | | | | | |
Net increase (decrease) in net asset value | | | 0.63 | | | | (15.01 | ) | | | (3.48 | ) | | | (1.99 | ) | | | 3.54 | | | | (0.05 | ) |
| | | | | | | | | | | | | | | | | | | | | | | | |
Net Asset Value, End of Period | | $ | 4.21 | | | $ | 3.58 | | | $ | 18.59 | | | $ | 22.07 | | | $ | 24.06 | | | $ | 20.52 | |
| | | | | | | | | | | | | | | | | | | | | | | | |
Total Return (b) | | | 17.77 | %(c) | | | (4.39 | )% | | | (4.12 | )% | | | 0.57 | % | | | 29.52 | % | | | 10.70 | % |
Ratios/Supplemental Data: | | | | | | | | | | | | | | | | | | | | | | | | |
Net Assets, End of Period (in 000’s) | | $ | 28,607 | | | $ | 30,977 | | | $ | 241,283 | | | $ | 336,350 | | | $ | 533,627 | | | $ | 389,125 | |
Ratios of expenses to average net assets: | | | | | | | | | | | | | | | | | | | | | | | | |
Before expense reimbursement and/or fee waiver | | | 1.62 | %(d) | | | 1.39 | % | | | 1.31 | % | | | 1.31 | % | | | 1.31 | % | | | 1.28 | %(f) |
After expense reimbursement and/or fee waiver | | | 1.24 | %(d)(e)(i) | | | 1.36 | %(e) | | | 1.31 | % | | | 1.31 | % | | | 1.31 | % | | | 1.28 | %(f) |
Ratios of net investment loss to average net assets: | | | | | | | | | | | | | | | | | | | | | | | | |
Before expense reimbursement and/or fee waiver | | | (1.04 | )%(d) | | | (0.81 | )% | | | (0.58 | )% | | | (0.57 | )% | | | (0.16 | )% | | | (0.59 | )% |
After expense reimbursement and/or fee waiver | | | (0.66 | )%(d) | | | (0.76 | )% | | | (0.58 | )% | | | (0.57 | )% | | | (0.16 | )% | | | (0.59 | )% |
Portfolio Turnover | | | 8 | %(c) | | | 106 | %(g) | | | 65 | % | | | 70 | % | | | 71 | %(g)(h) | | | 48 | %(g) |
| (a) | Per share numbers have been calculated using average shares. |
| (b) | The total return is calculated using the published Net Asset Value. |
| (e) | Effective October 1, 2016, the Fund’s expense cap was reduced to 1.03% from 1.35%. On January 12, 2016, the Investment Manager agreed to an expense cap of 1.35%. The expense ratio shown reflects the weighted average expense ratio for the full fiscal year ended October 31, 2016. (See Note F) |
| (f) | Ratios of expenses to average net assets include interest expense of less than 0.005% for the fiscal year ended October 31, 2012, which is not included under the contractual expense limitation. The interest expense is a result of utilizing the line of credit, as discussed in Note H in the Notes to the Financial Statements. |
| (g) | Portfolio turnover rate excludes securities delivered from processing a redemption in-kind. |
| (h) | Portfolio turnover rate excludes securities received from processing a subscription in-kind. |
| (i) | Includes reduction of brokerage recapture amounting to 0.08%. |
The accompanying notes are an integral part of these financial statements.
AMG Funds
| | |
| AMG GW&K U.S. Small Cap Growth Fund – Class I | | April 30, 2017 |
| Financial Highlights | | |
| | | | | | | | | | | | | | | | | | | | | | | | |
| | | Six Months
Ended
04/30/17
(unaudited) | | | Year
Ended
10/31/16 | | | Year
Ended
10/31/15 | | | Year
Ended
10/31/14 | | | Year
Ended
10/31/13 | | | Year
Ended
10/31/12 | |
Net Asset Value, Beginning of Period | | $ | 4.27 | | | $ | 19.30 | | | $ | 22.76 | | | $ | 24.69 | | | $ | 20.96 | | | $ | 20.91 | |
| | | | | | | | | | | | | | | | | | | | | | | | |
Income from Investment Operations: | | | | | | | | | | | | | | | | | | | | | | | | |
Net investment income (loss) (a) | | | (0.01 | ) | | | (0.05 | ) | | | (0.07 | ) | | | (0.07 | ) | | | 0.02 | | | | (0.07 | ) |
Net realized and unrealized gain (loss) on investments | | | 0.79 | | | | (0.65 | ) | | | (0.65 | ) | | | 0.30 | | | | 5.69 | | | | 2.14 | |
| | | | | | | | | | | | | | | | | | | | | | | | |
Total from investment operations | | | 0.78 | | | | (0.70 | ) | | | (0.72 | ) | | | 0.23 | | | | 5.71 | | | | 2.07 | |
| | | | | | | | | | | | | | | | | | | | | | | | |
Less Distributions: | | | | | | | | | | | | | | | | | | | | | | | | |
Distributions from net realized gain on investments | | | (0.01 | ) | | | (14.33 | ) | | | (2.74 | ) | | | (2.16 | ) | | | (1.98 | ) | | | (2.02 | ) |
| | | | | | | | | | | | | | | | | | | | | | | | |
Total distributions | | | (0.01 | ) | | | (14.33 | ) | | | (2.74 | ) | | | (2.16 | ) | | | (1.98 | ) | | | (2.02 | ) |
| | | | | | | | | | | | | | | | | | | | | | | | |
Net increase (decrease) in net asset value | | | 0.77 | | | | (15.03 | ) | | | (3.46 | ) | | | (1.93 | ) | | | 3.73 | | | | 0.05 | |
| | | | | | | | | | | | | | | | | | | | | | | | |
Net Asset Value, End of Period | | $ | 5.04 | | | $ | 4.27 | | | $ | 19.30 | | | $ | 22.76 | | | $ | 24.69 | | | $ | 20.96 | |
| | | | | | | | | | | | | | | | | | | | | | | | |
Total Return (b) | | | 18.20 | %(c) | | | (4.27 | )% | | | (3.93 | )% | | | 0.86 | % | | | 29.84 | % | | | 10.98 | % |
Ratios/Supplemental Data: | | | | | | | | | | | | | | | | | | | | | | | | |
Net Assets, End of Period (in 000’s) | | $ | 8,601 | | | $ | 11,032 | | | $ | 307,403 | | | $ | 469,518 | | | $ | 792,172 | | | $ | 635,663 | |
Ratios of expenses to average net assets: | | | | | | | | | | | | | | | | | | | | | | | | |
Before expense reimbursement and/or fee waiver | | | 1.37 | %(d) | | | 1.16 | % | | | 1.06 | % | | | 1.06 | % | | | 1.06 | % | | | 1.03 | %(f) |
After expense reimbursement and/or fee waiver | | | 0.96 | %(d)(e)(i) | | | 1.11 | %(e) | | | 1.06 | % | | | 1.06 | % | | | 1.06 | % | | | 1.03 | %(f) |
Ratios of net investment income (loss) to average net assets: | | | | | | | | | | | | | | | | | | | | | | | | |
Before expense reimbursement and/or fee waiver | | | (0.77 | )%(d) | | | (0.57 | )% | | | (0.33 | )% | | | (0.32 | )% | | | 0.09 | % | | | (0.34 | )% |
After expense reimbursement and/or fee waiver | | | (0.36 | )%(d) | | | (0.53 | )% | | | (0.33 | )% | | | (0.32 | )% | | | 0.09 | % | | | (0.34 | )% |
Portfolio Turnover | | | 8 | %(c) | | | 106 | %(g) | | | 65 | % | | | 70 | % | | | 71 | %(g)(h) | | | 48 | %(g) |
| (a) | Per share numbers have been calculated using average shares. |
| (b) | The total return is calculated using the published Net Asset Value. |
| (e) | Effective October 1, 2016, the Fund’s expense cap was reduced to 1.03% from 1.10%. On January 12, 2016, the Investment Manager agreed to an expense cap of 1.10%. The expense ratio shown reflects the weighted average expense ratio for the full fiscal year ended October 31, 2016. (See Note F) |
| (f) | Ratios of expenses to average net assets include interest expense of less than 0.005% for the fiscal year ended October 31, 2012, which is not included under the contractual expense limitation. The interest expense is a result of utilizing the line of credit, as discussed in Note H in the Notes to the Financial Statements. |
| (g) | Portfolio turnover rate excludes securities delivered from processing a redemption in-kind. |
| (h) | Portfolio turnover rate excludes securities received from processing a subscription in-kind. |
| (i) | Includes reduction of brokerage recapture amounting to 0.08%. |
The accompanying notes are an integral part of these financial statements.
AMG Funds
| | |
| AMG GW&K U.S. Small Cap Growth Fund – Class Z | | April 30, 2017 |
| Financial Highlights | | |
| | | | |
| | | Period
Ended
04/30/17(a)
(unaudited) | |
Net Asset Value, Beginning of Period | | $ | 4.85 | |
| | | | |
Income from Investment Operations: | | | | |
Net investment loss (b) | | | (0.01 | ) |
Net realized and unrealized gain on investments | | | 0.19 | |
| | | | |
Total from investment operations | | | 0.18 | |
| | | | |
Net increase in net asset value | | | 0.18 | |
| | | | |
Net Asset Value, End of Period | | $ | 5.03 | |
| | | | |
Total Return (c) | | | 3.71 | %(d) |
Ratios/Supplemental Data: | | | | |
Net Assets, End of Period (in 000’s) | | $ | 128 | |
Ratios of expenses to average net assets: | | | | |
Before expense reimbursement and/or fee waiver | | | 1.36 | %(e) |
After expense reimbursement and/or fee waiver | | | 0.88 | %(e)(f) |
Ratios of net investment loss to average net assets: | | | | |
Before expense reimbursement and/or fee waiver | | | (0.69 | )%(e) |
After expense reimbursement and/or fee waiver | | | (0.20 | )%(e) |
Portfolio Turnover | | | 8 | %(d) |
| (a) | The commencement of operations for Class Z was February 24, 2017. |
| (b) | Per share numbers have been calculated using average shares. |
| (c) | The total return is calculated using the published Net Asset Value. |
| (f) | Includes reductions of brokerage recapture amounting to 0.02%. |
The accompanying notes are an integral part of these financial statements.
AMG Funds
| | |
| AMG Managers DoubleLine Core Plus Bond Fund – Class N | | April 30, 2017 |
| Financial Highlights | | |
| | | | | | | | | | | | | | | | | | | | | | | | |
| | | For the
Six Months
Ended
04/30/17
(unaudited) | | | Year
Ended
10/31/16 | | | Year
Ended
10/31/15 | | | Year
Ended
10/31/14 | | | Year
Ended
10/31/13 | | | Year
Ended
10/31/12 | |
Net Asset Value, Beginning of Period | | $ | 10.77 | | | $ | 10.60 | | | $ | 10.86 | | | $ | 10.65 | | | $ | 11.10 | | | $ | 10.44 | |
| | | | | | | | | | | | | | | | | | | | | | | | |
Income from Investment Operations: | | | | | | | | | | | | | | | | | | | | | | | | |
Net investment income | | | 0.16 | (a) | | | 0.31 | (a) | | | 0.38 | | | | 0.40 | | | | 0.30 | | | | 0.33 | (a) |
Net realized and unrealized gain (loss) on investments | | | (0.09 | ) | | | 0.17 | | | | (0.27 | ) | | | 0.22 | | | | (0.33 | ) | | | 0.72 | |
| | | | | | | | | | | | | | | | | | | | | | | | |
Total from investment operations | | | 0.07 | | | | 0.48 | | | | 0.11 | | | | 0.62 | | | | (0.03 | ) | | | 1.05 | |
| | | | | | | | | | | | | | | | | | | | | | | | |
Less Distributions: | | | | | | | | | | | | | | | | | | | | | | | | |
Distributions from and in excess of net investment income | | | (0.19 | ) | | | (0.31 | ) | | | (0.37 | ) | | | (0.41 | ) | | | (0.36 | ) | | | (0.37 | ) |
Distributions from net realized gain on investments | | | (0.02 | ) | | | — | | | | — | | | | — | | | | (0.06 | ) | | | (0.02 | ) |
| | | | | | | | | | | | | | | | | | | | | | | | |
Total distributions | | | (0.21 | ) | | | (0.31 | ) | | | (0.37 | ) | | | (0.41 | ) | | | (0.42 | ) | | | (0.39 | ) |
| | | | | | | | | | | | | | | | | | | | | | | | |
Net increase (decrease) in net asset value | | | (0.14 | ) | | | 0.17 | | | | (0.26 | ) | | | 0.21 | | | | (0.45 | ) | | | 0.66 | |
| | | | | | | | | | | | | | | | | | | | | | | | |
Net Asset Value, End of Period | | $ | 10.63 | | | $ | 10.77 | | | $ | 10.60 | | | $ | 10.86 | | | $ | 10.65 | | | $ | 11.10 | |
| | | | | | | | | | | | | | | | | | | | | | | | |
Total Return (b) | | | 0.66 | %(c) | | | 4.62 | % | | | 1.04 | % | | | 5.96 | % | | | (0.28 | )% | | | 10.25 | % |
Ratios/Supplemental Data: | | | | | | | | | | | | | | | | | | | | | | | | |
Net Assets, End of Period (in 000’s) | | $ | 204,030 | | | $ | 308,703 | | | $ | 188,286 | | | $ | 49,147 | | | $ | 66,368 | | | $ | 71,546 | |
Ratios of expenses to average net assets: | | | | | | | | | | | | | | | | | | | | | | | | |
Before expense reimbursement and/or fee waiver | | | 1.02 | %(d) | | | 1.02 | % | | | 1.05 | % | | | 1.08 | % | | | 1.04 | % | | | 1.35 | % |
After expense reimbursement and/or fee waiver | | | 0.94 | %(d) | | | 0.94 | %(e) | | | 0.94 | % | | | 0.94 | % | | | 0.94 | % | | | 0.94 | % |
Ratios of net investment income to average net assets: | | | | | | | | | | | | | | | | | | | | | | | | |
Before expense reimbursement and/or fee waiver | | | 2.94 | %(d) | | | 2.76 | % | | | 3.21 | % | | | 3.58 | % | | | 2.66 | % | | | 2.59 | % |
After expense reimbursement and/or fee waiver | | | 3.02 | %(d) | | | 2.84 | % | | | 3.32 | % | | | 3.72 | % | | | 2.77 | % | | | 3.01 | % |
Portfolio Turnover | | | 48 | %(c) | | | 78 | % | | | 59 | % | | | 117 | % | | | 125 | % | | | 119 | % |
| (a) | Per share numbers have been calculated using average shares. |
| (b) | The total return is calculated using the published Net Asset Value. |
| (e) | Effective October 1, 2016, the Fund’s expense cap was reduced to 0.61% from 0.94%. The expense ratio shown reflects the weighted average expense ratio for the full fiscal year ended October 31, 2016. (See Note F) |
The accompanying notes are an integral part of these financial statements.
AMG Funds
| | |
| AMG Managers DoubleLine Core Plus Bond Fund – Class I | | April 30, 2017 |
| Financial Highlights | | |
| | | | | | | | | | | | | | | | | | | | | | | | |
| | | For the
Six Months
Ended
04/30/17
(unaudited) | | | Year
Ended
10/31/16 | | | Year
Ended
10/31/15 | | | Year
Ended
10/31/14 | | | Year
Ended
10/31/13 | | | Year
Ended
10/31/12 | |
Net Asset Value, Beginning of Period | | $ | 10.76 | | | $ | 10.60 | | | $ | 10.86 | | | $ | 10.65 | | | $ | 11.10 | | | $ | 10.44 | |
| | | | | | | | | | | | | | | | | | | | | | | | |
Income from Investment Operations: | | | | | | | | | | | | | | | | | | | | | | | | |
Net investment income | | | 0.17 | (a) | | | 0.33 | (a) | | | 0.41 | | | | 0.44 | | | | 0.33 | | | | 0.35 | (a) |
Net realized and unrealized gain (loss) on investments | | | (0.08 | ) | | | 0.17 | | | | (0.27 | ) | | | 0.21 | | | | (0.33 | ) | | | 0.73 | |
| | | | | | | | | | | | | | | | | | | | | | | | |
Total from investment operations | | | 0.09 | | | | 0.50 | | | | 0.14 | | | | 0.65 | | | | — | | | | 1.08 | |
| | | | | | | | | | | | | | | | | | | | | | | | |
Less Distributions: | | | | | | | | | | | | | | | | | | | | | | | | |
Distributions from and in excess of net investment income | | | (0.20 | ) | | | (0.34 | ) | | | (0.40 | ) | | | (0.44 | ) | | | (0.39 | ) | | | (0.40 | ) |
Distributions from net realized gain on investments | | | (0.02 | ) | | | — | | | | — | | | | — | | | | (0.06 | ) | | | (0.02 | ) |
| | | | | | | | | | | | | | | | | | | | | | | | |
Total distributions | | | (0.22 | ) | | | (0.34 | ) | | | (0.40 | ) | | | (0.44 | ) | | | (0.45 | ) | | | (0.42 | ) |
| | | | | | | | | | | | | | | | | | | | | | | | |
Net increase (decrease) in net asset value | | | (0.13 | ) | | | 0.16 | | | | (0.26 | ) | | | 0.21 | | | | (0.45 | ) | | | 0.66 | |
| | | | | | | | | | | | | | | | | | | | | | | | |
Net Asset Value, End of Period | | $ | 10.63 | | | $ | 10.76 | | | $ | 10.60 | | | $ | 10.86 | | | $ | 10.65 | | | $ | 11.10 | |
| | | | | | | | | | | | | | | | | | | | | | | | |
Total Return (b) | | | 0.88 | %(c) | | | 4.79 | % | | | 1.28 | % | | | 6.22 | % | | | (0.03 | )% | | | 10.52 | % |
Ratios/Supplemental Data: | | | | | | | | | | | | | | | | | | | | | | | | |
Net Assets, End of Period (in 000’s) | | $ | 429,011 | | | $ | 398,514 | | | $ | 304,051 | | | $ | 158,198 | | | $ | 110,018 | | | $ | 105,335 | |
Ratios of expenses to average net assets: | | | | | | | | | | | | | | | | | | | | | | | | |
Before expense reimbursement and/or fee waiver | | | 0.77 | %(d) | | | 0.77 | % | | | 0.80 | % | | | 0.83 | % | | | 0.79 | % | | | 1.10 | % |
After expense reimbursement and/or fee waiver | | | 0.69 | %(d) | | | 0.69 | %(e) | | | 0.69 | % | | | 0.69 | % | | | 0.69 | % | | | 0.69 | % |
Ratios of net investment income to average net assets: | | | | | | | | | | | | | | | | | | | | | | | | |
Before expense reimbursement and/or fee waiver | | | 3.22 | %(d) | | | 3.02 | % | | | 3.46 | % | | | 3.83 | % | | | 2.91 | % | | | 2.84 | % |
After expense reimbursement and/or fee waiver | | | 3.31 | %(d) | | | 3.11 | % | | �� | 3.57 | % | | | 3.97 | % | | | 3.02 | % | | | 3.26 | % |
Portfolio Turnover | | | 48 | %(c) | | | 78 | % | | | 59 | % | | | 117 | % | | | 125 | % | | | 119 | % |
| (a) | Per share numbers have been calculated using average shares. |
| (b) | The total return is calculated using the published Net Asset Value. |
| (e) | Effective October 1, 2016, the Fund’s expense cap was reduced to 0.61% from 0.69%. The expense ratio shown reflects the weighted average expense ratio for the full fiscal year ended October 31, 2016. (See Note F) |
The accompanying notes are an integral part of these financial statements.
AMG Funds
| | |
| AMG Managers Lake Partners LASSO Alternatives Fund – Class N | | April 30, 2017 |
| Financial Highlights | | |
| | | | | | | | | | | | | | | | | | | | | | | | |
| | | Six Months
Ended
04/30/17
(unaudited) | | | Year
Ended
10/31/16 | | | Year
Ended
10/31/15 | | | Year
Ended
10/31/14 | | | Year
Ended
10/31/13 | | | Year
Ended
10/31/12 | |
Net Asset Value, Beginning of Period | | $ | 11.81 | | | $ | 12.76 | | | $ | 13.64 | | | $ | 13.34 | | | $ | 12.39 | | | $ | 11.94 | |
| | | | | | | | | | | | | | | | | | | | | | | | |
Income from Investment Operations: | | | | | | | | | | | | | | | | | | | | | | | | |
Net investment income (loss) (a) | | | (0.02 | ) | | | 0.02 | | | | (0.04 | ) | | | (0.07 | ) | | | 0.00 | (b) | | | 0.04 | |
Net realized and unrealized gain (loss) on investments | | | 0.32 | | | | (0.17 | ) | | | (0.34 | ) | | | 0.50 | (c) | | | 1.11 | | | | 0.59 | |
| | | | | | | | | | | | | | | | | | | | | | | | |
Total from investment operations | | | 0.30 | | | | (0.15 | ) | | | (0.38 | ) | | | 0.43 | | | | 1.11 | | | | 0.63 | |
| | | | | | | | | | | | | | | | | | | | | | | | |
Less Distributions: | | | | | | | | | | | | | | | | | | | | | | | | |
Distributions from and in excess of net investment income | | | — | | | | — | | | | (0.00 | )(b) | | | (0.09 | ) | | | (0.16 | ) | | | (0.18 | ) |
Distributions from net realized gain on investments | | | (0.05 | ) | | | (0.80 | ) | | | (0.50 | ) | | | (0.04 | ) | | | — | | | | — | |
| | | | | | | | | | | | | | | | | | | | | | | | |
Total distributions | | | (0.05 | ) | | | (0.80 | ) | | | (0.50 | ) | | | (0.13 | ) | | | (0.16 | ) | | | (0.18 | ) |
| | | | | | | | | | | | | | | | | | | | | | | | |
Net increase (decrease) in net asset value | | | 0.25 | | | | (0.95 | ) | | | (0.88 | ) | | | 0.30 | | | | 0.95 | | | | 0.45 | |
| | | | | | | | | | | | | | | | | | | | | | | | |
Net Asset Value, End of Period | | $ | 12.06 | | | $ | 11.81 | | | $ | 12.76 | | | $ | 13.64 | | | $ | 13.34 | | | $ | 12.39 | |
| | | | | | | | | | | | | | | | | | | | | | | | |
Total Return (d) | | | 2.53 | %(e) | | | (1.18 | )% | | | (2.87 | )% | | | 3.27 | % | | | 9.05 | % | | | 5.34 | % |
Ratios/Supplemental Data: | | | | | | | | | | | | | | | | | | | | | | | | |
Net Assets, End of Period (in 000’s) | | $ | 25,240 | | | $ | 32,630 | | | $ | 40,667 | | | $ | 44,386 | | | $ | 54,388 | | | $ | 33,719 | |
Ratios of expenses to average net assets: | | | | | | | | | | | | | | | | | | | | | | | | |
Before earnings credit, expense reimbursement and/or fee waiver, or recoupment (f) | | | 1.48 | %(g) | | | 1.47 | % | | | 1.43 | %(h) | | | 1.41 | % | | | 1.43 | %(i) | | | 1.41 | %(i)(j) |
After earnings credit, expense reimbursement and/or fee waiver, or recoupment (f) | | | 1.40 | %(g) | | | 1.40 | %(k) | | | 1.41 | %(h) | | | 1.43 | % | | | 1.45 | %(i) | | | 1.45 | %(i)(j) |
Ratios of net investment income (loss) to average net assets: | | | | | | | | | | | | | | | | | | | | | | | | |
Before earnings credit, expense reimbursement and/or fee waiver, or recoupment | | | (0.35 | )%(g) | | | 0.06 | % | | | (0.33 | )% | | | (0.51 | )% | | | (0.00 | )%(b) | | | 0.36 | %(j) |
After earnings credit, expense reimbursement and/or fee waiver, or recoupment | | | (0.28 | )%(g) | | | 0.13 | % | | | (0.31 | )% | | | (0.53 | )% | | | (0.03 | )% | | | 0.32 | %(j) |
Portfolio Turnover | | | 16 | %(e) | | | 30 | % | | | 73 | % | | | 46 | % | | | 44 | % | | | 46 | % |
| (a) | Per share numbers have been calculated using average shares. |
| (b) | Less than ($0.005) or $0.005 per share or less than 0.005%. |
| (c) | Includes capital contribution of less than $0.005 per share. |
| (d) | The total return is calculated using the published Net Asset Value. |
| (f) | Does not include expenses of the underlying funds in which the Fund invests. |
| (h) | Effective February 28, 2015, the contractual expense limitation was decreased from 1.45% to 1.40%, excluding interest, taxes, investment-related costs (such as brokerage commissions), extraordinary expenses and acquired fund fees and expenses. |
| (i) | Ratios of expenses to average net assets includes Earnings Credits of less than 0.005% for each of the fiscal years ended October 31, 2013 and October 31, 2012, which is not included under the contractual expense limitation. |
| (j) | Ratios of expenses and net investment income to average net assets include an advisory fee waiver of less than 0.005% for the fiscal year ended October 31, 2012. |
| (k) | Effective October 1, 2016, the Fund’s expense cap was reduced to 1.09% from 1.40%. The expense ratio shown reflects the weighted average expense ratio for the full fiscal year ended October 31, 2016. (See Note F) |
The accompanying notes are an integral part of these financial statements.
AMG Funds
| | |
| AMG Managers Lake Partners LASSO Alternatives Fund – Class I | | April 30, 2017 |
| Financial Highlights | | |
| | | | | | | | | | | | | | | | | | | | | | | | |
| | | Six Months
Ended
04/30/17
(unaudited) | | | Year
Ended
10/31/16 | | | Year
Ended
10/31/15 | | | Year
Ended
10/31/14 | | | Year
Ended
10/31/13 | | | Year
Ended
10/31/12 | |
Net Asset Value, Beginning of Period | | $ | 11.86 | | | $ | 12.81 | | | $ | 13.69 | | | $ | 13.38 | | | $ | 12.42 | | | $ | 11.97 | |
| | | | | | | | | | | | | | | | | | | | | | | | |
Income from Investment Operations: | | | | | | | | | | | | | | | | | | | | | | | | |
Net investment income (loss) (a) | | | (0.00 | )(b) | | | 0.07 | | | | (0.01 | ) | | | (0.04 | ) | | | 0.03 | | | | 0.07 | |
Net realized and unrealized gain (loss) on investments | | | 0.31 | | | | (0.19 | ) | | | (0.33 | )(c) | | | 0.51 | (c) | | | 1.11 | | | | 0.59 | |
| | | | | | | | | | | | | | | | | | | | | | | | |
Total from investment operations | | | 0.31 | | | | (0.12 | ) | | | (0.34 | ) | | | 0.47 | | | | 1.14 | | | | 0.66 | |
| | | | | | | | | | | | | | | | | | | | | | | | |
Less Distributions: | | | | | | | | | | | | | | | | | | | | | | | | |
Distributions from and in excess of net investment income | | | — | | | | (0.03 | ) | | | (0.04 | ) | | | (0.12 | ) | | | (0.18 | ) | | | (0.21 | ) |
Distributions from net realized gain on investments | | | (0.05 | ) | | | (0.80 | ) | | | (0.50 | ) | | | (0.04 | ) | | | — | | | | — | |
| | | | | | | | | | | | | | | | | | | | | | | | |
Total distributions | | | (0.05 | ) | | | (0.83 | ) | | | (0.54 | ) | | | (0.16 | ) | | | (0.18 | ) | | | (0.21 | ) |
| | | | | | | | | | | | | | | | | | | | | | | | |
Net increase (decrease) in net asset value | | | 0.26 | | | | (0.95 | ) | | | (0.88 | ) | | | 0.31 | | | | 0.96 | | | | 0.45 | |
| | | | | | | | | | | | | | | | | | | | | | | | |
Net Asset Value, End of Period | | $ | 12.12 | | | $ | 11.86 | | | $ | 12.81 | | | $ | 13.69 | | | $ | 13.38 | | | $ | 12.42 | |
| | | | | | | | | | | | | | | | | | | | | | | | |
Total Return (d) | | | 2.61 | %(e) | | | (0.91 | )% | | | (2.62 | )% | | | 3.56 | % | | | 9.31 | % | | | 5.56 | % |
Ratios/Supplemental Data: | | | | | | | | | | | | | | | | | | | | | | | | |
Net Assets, End of Period (in 000’s) | | $ | 53,830 | | | $ | 70,054 | | | $ | 169,072 | | | $ | 477,157 | | | $ | 416,475 | | | $ | 253,343 | |
Ratios of expenses to average net assets: | | | | | | | | | | | | | | | | | | | | | | | | |
Before earnings credit, expense reimbursement and/or fee waiver, or recoupment (f) | | | 1.23 | %(g) | | | 1.22 | % | | | 1.18 | %(h) | | | 1.16 | % | | | 1.18 | %(i) | | | 1.16 | %(i)(j) |
After earnings credit, expense reimbursement and/or fee waiver, or recoupment (f) | | | 1.15 | %(g) | | | 1.15 | %(k) | | | 1.16 | %(h) | | | 1.18 | % | | | 1.20 | %(i) | | | 1.20 | %(i)(j) |
Ratios of net investment income (loss) to average net assets: | | | | | | | | | | | | | | | | | | | | | | | | |
Before earnings credit, expense reimbursement and/or fee waiver, or recoupment | | | (0.09 | )%(g) | | | 0.49 | % | | | (0.08 | )% | | | (0.26 | )% | | | 0.25 | % | | | 0.61 | %(j) |
After earnings credit, expense reimbursement and/or fee waiver, or recoupment | | | (0.02 | )%(g) | | | 0.57 | % | | | (0.06 | )% | | | (0.28 | )% | | | 0.22 | % | | | 0.57 | %(j) |
Portfolio Turnover | | | 16 | %(e) | | | 30 | % | | | 73 | % | | | 46 | % | | | 44 | % | | | 46 | % |
| (a) | Per share numbers have been calculated using average shares. |
| (b) | Less than $0.005 or $(0.005) per share. |
| (c) | Includes capital contribution of less than $0.005 per share. |
| (d) | The total return is calculated using the published Net Asset Value. |
| (f) | Does not include expenses of the underlying funds in which the Fund invests. |
| (h) | Effective February 28, 2015, the contractual expense limitation was decreased from 1.20% to 1.15%, excluding interest, taxes, investment-related costs (such as brokerage commissions), extraordinary expenses and acquired fund fees and expenses. |
| (i) | Ratios of expenses to average net assets include Earnings Credits of less than 0.005% for each of the fiscal years ended October 31, 2013 and October 31, 2012, which is not included under the contractual expense limitation. |
| (j) | Ratios of expenses and net investment income to average net assets include advisory fee waiver of less than 0.005% for the fiscal year ended October 31, 2012. |
| (k) | Effective October 1, 2016, the Fund’s expense cap was reduced to 1.09% from 1.15%. The expense ratio shown reflects the weighted average expense ratio for the full fiscal year ended October 31, 2016. (See Note F) |
The accompanying notes are an integral part of these financial statements.
AMG Funds
| | |
| AMG River Road Long-Short Fund – Class N | | April 30, 2017 |
| Financial Highlights | | |
| | | | | | | | | | | | | | | | | | | | | | | | |
| | | For the
Six Months
Ended
04/30/17
(unaudited) | | | Year
Ended
10/31/16 | | | Year
Ended
10/31/15 | | | Year
Ended
10/31/14 | | | Year
Ended
10/31/13 | | | Year
Ended
10/31/12 | |
Net Asset Value, Beginning of Period | | $ | 11.04 | | | $ | 11.48 | | | $ | 11.35 | | | $ | 12.02 | | | $ | 10.73 | | | $ | 9.91 | |
| | | | | | | | | | | | | | | | | | | | | | | | |
Income from Investment Operations: | | | | | | | | | | | | | | | | | | | | | | | | |
Net investment loss | | | (0.12 | )(a) | | | (0.19 | )(a) | | | (0.14 | )(a) | | | (0.19 | ) | | | (0.17 | )(a) | | | (0.18 | ) |
Net realized and unrealized gain (loss) on investments | | | 0.98 | | | | 0.13 | | | | 0.57 | | | | (0.19 | ) | | | 2.02 | | | | 1.00 | |
| | | | | | | | | | | | | | | | | | | | | | | | |
Total from investment operations | | | 0.86 | | | | (0.06 | ) | | | 0.43 | | | | (0.38 | ) | | | 1.85 | | | | 0.82 | |
| | | | | | | | | | | | | | | | | | | | | | | | |
Less Distributions: | | | | | | | | | | | | | | | | | | | | | | | | |
Distributions from net realized gain on investments | | | — | | | | (0.38 | ) | | | (0.30 | ) | | | (0.29 | ) | | | (0.56 | ) | | | — | |
| | | | | | | | | | | | | | | | | | | | | | | | |
Total distributions | | | — | | | | (0.38 | ) | | | (0.30 | ) | | | (0.29 | ) | | | (0.56 | ) | | | — | |
| | | | | | | | | | | | | | | | | | | | | | | | |
Net increase (decrease) in net asset value | | | 0.86 | | | | (0.44 | ) | | | 0.13 | | | | (0.67 | ) | | | 1.29 | | | | 0.82 | |
| | | | | | | | | | | | | | | | | | | | | | | | |
Net Asset Value, End of Period | | $ | 11.90 | | | $ | 11.04 | | | $ | 11.48 | | | $ | 11.35 | | | $ | 12.02 | | | $ | 10.73 | |
| | | | | | | | | | | | | | | | | | | | | | | | |
Total Return (b) | | | 7.88 | %(c) | | | (0.52 | )% | | | 3.79 | % | | | (3.27 | )% | | | 18.14 | % | | | 8.17 | % |
Ratios/Supplemental Data: | | | | | | | | | | | | | | | | | | | | | | | | |
Net Assets, End of Period (in 000’s) | | $ | 7,345 | | | $ | 8,713 | | | $ | 27,983 | | | $ | 109,140 | | | $ | 108,966 | | | $ | 7,506 | |
Ratios of expenses to average net assets: | | | | | | | | | | | | | | | | | | | | | | | | |
Before expense reimbursement and/or fee waiver, or recoupment including interest and dividend expense for securities sold short | | | 3.50 | %(d) | | | 3.62 | % | | | 2.87 | % | | | 2.53 | % | | | 2.54 | % | | | 5.03 | % |
After expense reimbursement and/or fee waiver, or recoupment including interest and dividend expense for securities sold short | | | 3.38 | %(d)(e)(f) | | | 3.46 | %(g) | | | 2.89 | % | | | 2.58 | % | | | 2.38 | % | | | 3.11 | % |
After expense reimbursement and/or fee waiver, or recoupment excluding interest and dividend expense for securities sold short | | | 1.52 | %(d)(e)(f) | | | 1.70 | %(g) | | | 1.70 | % | | | 1.70 | % | | | 1.70 | % | | | 1.70 | % |
Ratios of net investment loss to average net assets: | | | | | | | | | | | | | | | | | | | | | | | | |
Before expense reimbursement and/or fee waiver, or recoupment | | | (2.17 | )%(d) | | | (1.91 | )% | | | (1.16 | )% | | | (1.55 | )% | | | (1.62 | )% | | | (3.63 | )% |
After expense reimbursement and/or fee waiver, or recoupment | | | (2.04 | )%(d) | | | (1.75 | )% | | | (1.19 | )% | | | (1.59 | )% | | | (1.46 | )% | | | (1.71 | )% |
Portfolio Turnover | | | 98 | %(c) | | | 298 | % | | | 279 | % | | | 303 | % | | | 291 | % | | | 278 | % |
| (a) | Per share numbers have been calculated using average shares. |
| (b) | The total return is calculated using the published Net Asset Value. |
| (e) | Effective February 27, 2017, the Fund’s expense cap was reduced to 1.12% from 1.37%. The expense ratio shown reflects the weighted average expense ratio for the six months ended April 30, 2017 (See Note F). |
| (f) | Includes reduction from brokerage recapture amounting to 0.02%. |
| (g) | Effective October 1, 2016, the Fund’s expense cap was reduced to 1.37% from 1.70%. The expense ratio shown reflects the weighted average expense ratio for the full fiscal year ended October 31, 2016. (See Note F) |
The accompanying notes are an integral part of these financial statements.
AMG Funds
| | |
| AMG River Road Long-Short Fund – Class I | | April 30, 2017 |
| Financial Highlights | | |
| | | | | | | | | | | | | | | | | | | | |
| | | For the
Six Months
Ended
04/30/17
(unaudited) | | | Year
Ended
10/31/16 | | | Year
Ended
10/31/15 | | | Year
Ended
10/31/14 | | | Period
Ended
10/31/13(a) | |
Net Asset Value, Beginning of Period | | $ | 11.15 | | | $ | 11.56 | | | $ | 11.40 | | | $ | 12.05 | | | $ | 10.96 | |
| | | | | | | | | | | | | | | | | | | | |
Income from Investment Operations: | | | | | | | | | | | | | | | | | | | | |
Net investment loss | | | (0.10 | )(b) | | | (0.18 | )(b) | | | (0.11 | )(b) | | | (0.16 | ) | | | (0.10 | )(b) |
Net realized and unrealized gain (loss) on investments | | | 0.99 | | | | 0.15 | | | | 0.57 | | | | (0.20 | ) | | | 1.19 | |
| | | | | | | | | | | | | | | | | | | | |
Total from investment operations | | | 0.89 | | | | (0.03 | ) | | | 0.46 | | | | (0.36 | ) | | | 1.09 | |
| | | | | | | | | | | | | | | | | | | | |
Less Distributions: | | | | | | | | | | | | | | | | | | | | |
Distributions from net realized gain on investments | | | — | | | | (0.38 | ) | | | (0.30 | ) | | | (0.29 | ) | | | — | |
| | | | | | | | | | | | | | | | | | | | |
Total distributions | | | — | | | | (0.38 | ) | | | (0.30 | ) | | | (0.29 | ) | | | — | |
| | | | | | | | | | | | | | | | | | | | |
Net increase (decrease) in net asset value | | | 0.89 | | | | (0.41 | ) | | | 0.16 | | | | (0.65 | ) | | | 1.09 | |
| | | | | | | | | | | | | | | | | | | | |
Net Asset Value, End of Period | | $ | 12.04 | | | $ | 11.15 | | | $ | 11.56 | | | $ | 11.40 | | | $ | 12.05 | |
| | | | | | | | | | | | | | | | | | | | |
Total Return (c) | | | 7.98 | %(d) | | | (0.24 | )% | | | 4.04 | % | | | (3.01 | )% | | | 9.85 | %(d) |
Ratios/Supplemental Data: | | | | | | | | | | | | | | | | | | | | |
Net Assets, End of Period (in 000’s) | | $ | 31,852 | | | $ | 37,549 | | | $ | 49,088 | | | $ | 110,271 | | | $ | 71,175 | |
Ratios of expenses to average net assets: | | | | | | | | | | | | | | | | | | | | |
Before expense reimbursement and/or fee waiver, or recoupment including interest and dividend expense for securities sold short | | | 3.25 | %(e) | | | 3.39 | % | | | 2.62 | % | | | 2.28 | % | | | 2.20 | %(e) |
After expense reimbursement and/or fee waiver, or recoupment including interest and dividend expense for securities sold short | | | 3.12 | %(e)(f)(g) | | | 3.24 | %(h) | | | 2.64 | % | | | 2.33 | % | | | 2.10 | %(e) |
After expense reimbursement and/or fee waiver, or recoupment excluding interest and dividend expense for securities sold short | | | 1.27 | %(e)(f)(g) | | | 1.45 | %(h) | | | 1.45 | % | | | 1.45 | % | | | 1.45 | %(e) |
Ratios of net investment loss to average net assets: | | | | | | | | | | | | | | | | | | | | |
Before expense reimbursement and/or fee waiver, or recoupment | | | (1.89 | )%(e) | | | (1.81 | )% | | | (0.91 | )% | | | (1.30 | )% | | | (1.44 | )%(e) |
After expense reimbursement and/or fee waiver, or recoupment | | | (1.77 | )%(e) | | | (1.67 | )% | | | (0.94 | )% | | | (1.34 | )% | | | (1.33 | )%(e) |
Portfolio Turnover | | | 98 | %(d) | | | 298 | % | | | 279 | % | | | 303 | % | | | 291 | %(d) |
| (a) | The commencement of investment operations for AMG River Road Long-Short Fund Class I shares was March 1, 2013. |
| (b) | Per share numbers have been calculated using average shares. |
| (c) | The total return is calculated using the published Net Asset Value. |
| (f) | Effective February 27, 2017, the Fund’s expense cap was reduced to 1.12% from 1.37%. The expense ratio reflects the weighted average expense ratio for the six months ended April 30, 2017 (See Note F). |
| (g) | Includes reduction from brokerage recapture amounting to 0.02%. |
| (h) | Effective October 1, 2016, the Fund’s expense cap was reduced to 1.37% from 1.45%. The expense ratio shown reflects the weighted average expense ratio for the full fiscal year ended October 31, 2016. (See Note F) |
The accompanying notes are an integral part of these financial statements.
AMG Funds
| | |
| AMG Managers Guardian Capital Global Dividend Fund – Class N | | April 30, 2017 |
| Financial Highlights | | |
| | | | | | | | | | | | | | | | |
| | | For the
Six Months
Ended
04/30/17
(unaudited) | | | Year
Ended
10/31/16 | | | Year
Ended
10/31/15 | | | Period
Ended
10/31/14(a) | |
Net Asset Value, Beginning of Period | | $ | 9.67 | | | $ | 10.30 | | | $ | 10.51 | | | $ | 10.00 | |
| | | | | | | | | | | | | | | | |
Income from Investment Operations: | | | | | | | | | | | | | | | | |
Net investment income | | | 0.08 | (b) | | | 0.22 | (b) | | | 0.24 | | | | 0.13 | |
Net realized and unrealized gain (loss) on investments | | | 0.98 | | | | (0.62 | ) | | | (0.23 | ) | | | 0.49 | |
| | | | | | | | | | | | | | | | |
Total from investment operations | | | 1.06 | | | | (0.40 | ) | | | 0.01 | | | | 0.62 | |
| | | | | | | | | | | | | | | | |
Less Distributions: | | | | | | | | | | | | | | | | |
Distributions from and in excess of net investment income | | | (0.05 | ) | | | (0.23 | ) | | | (0.22 | ) | | | (0.11 | ) |
| | | | | | | | | | | | | | | | |
Total Distributions | | | (0.05 | ) | | | (0.23 | ) | | | (0.22 | ) | | | (0.11 | ) |
| | | | | | | | | | | | | | | | |
Net increase (decrease) in net asset value | | | 1.01 | | | | (0.63 | ) | | | (0.21 | ) | | | 0.51 | |
| | | | | | | | | | | | | | | | |
Net Asset Value, End of Period | | $ | 10.68 | | | $ | 9.67 | | | $ | 10.30 | | | $ | 10.51 | |
| | | | | | | | | | | | | | | | |
Total Return (c) | | | 10.99 | %(d) | | | (3.91 | )% | | | 0.07 | % | | | 6.17 | %(d) |
Ratios/Supplemental Data: | | | | | | | | | | | | | | | | |
Net Assets, End of Period (in 000’s) | | $ | 18 | | | $ | 997 | | | $ | 1,054 | | | $ | 1,052 | |
Ratios of expenses to average net assets: | | | | | | | | | | | | | | | | |
Before expense reimbursement and/or fee waiver | | | 1.33 | %(e) | | | 3.34 | % | | | 4.10 | % | | | 5.21 | %(e) |
After expense reimbursement and/or fee waiver | | | 1.30 | %(e) | | | 1.30 | %(f) | | | 1.30 | % | | | 1.30 | %(e) |
Ratios of net investment income (loss) to average net assets: | | | | | | | | | | | | | | | | |
Before expense reimbursement and/or fee waiver | | | 1.56 | %(e) | | | 0.20 | % | | | (0.53 | )% | | | (1.74 | )%(e) |
After expense reimbursement and/or fee waiver | | | 1.60 | %(e) | | | 2.24 | % | | | 2.28 | % | | | 2.17 | %(e) |
Portfolio Turnover | | | 24 | %(d) | | | 36 | % | | | 28 | % | | | 16 | %(d) |
| (a) | The commencement of investment operations for AMG Managers Guardian Capital Global Dividend Fund Class N shares was April 11, 2014. |
| (b) | Per share numbers have been calculated using average shares. |
| (c) | The total return is calculated using the published Net Asset Value. |
| (f) | Effective October 1, 2016, the Fund’s expense cap was reduced to 1.05% from 1.30%. The expense ratio shown reflects the weighted average expense ratio for the full fiscal year ended October 31, 2016. (See Note F) |
The accompanying notes are an integral part of these financial statements.
AMG Funds
| | |
| AMG Managers Guardian Capital Global Dividend Fund – Class I | | April 30, 2017 |
| Financial Highlights | | |
| | | | | | | | | | | | | | | | |
| | | For the
Six Months
Ended
04/30/17
(unaudited) | | | Year
Ended
10/31/16 | | | Year
Ended
10/31/15 | | | Period
Ended
10/31/14(a) | |
Net Asset Value, Beginning of Period | | $ | 9.65 | | | $ | 10.28 | | | $ | 10.52 | | | $ | 10.00 | |
| | | | | | | | | | | | | | | | |
Income from Investment Operations: | | | | | | | | | | | | | | | | |
Net investment income | | | 0.12 | (b) | | | 0.23 | (b) | | | 0.27 | | | | 0.14 | |
Net realized and unrealized gain (loss) on investments | | | 0.96 | | | | (0.60 | ) | | | (0.25 | ) | | | 0.50 | |
| | | | | | | | | | | | | | | | |
Total from investment operations | | | 1.08 | | | | (0.37 | ) | | | 0.02 | | | | 0.64 | |
| | | | | | | | | | | | | | | | |
Less Distributions: | | | | | | | | | | | | | | | | |
Distributions from and in excess of net investment income | | | (0.10 | ) | | | (0.26 | ) | | | (0.26 | ) | | | (0.12 | ) |
| | | | | | | | | | | | | | | | |
Total Distributions | | | (0.10 | ) | | | (0.26 | ) | | | (0.26 | ) | | | (0.12 | ) |
| | | | | | | | | | | | | | | | |
Net increase (decrease) in net asset value | | | 0.98 | | | | (0.63 | ) | | | (0.24 | ) | | | 0.52 | |
| | | | | | | | | | | | | | | | |
Net Asset Value, End of Period | | $ | 10.63 | | | $ | 9.65 | | | $ | 10.28 | | | $ | 10.52 | |
| | | | | | | | | | | | | | | | |
Total Return (c) | | | 11.18 | %(d) | | | (3.68 | )% | | | 0.14 | % | | | 6.39 | %(d) |
Ratios/Supplemental Data: | | | | | | | | | | | | | | | | |
Net Assets, End of Period (in 000’s) | | $ | 34,210 | | | $ | 27,986 | | | $ | 3,292 | | | $ | 3,211 | |
Ratios of expenses to average net assets: | | | | | | | | | | | | | | | | |
Before expense reimbursement and/or fee waiver | | | 1.10 | %(e) | | | 2.82 | % | | | 3.85 | % | | | 4.96 | %(e) |
After expense reimbursement and/or fee waiver | | | 1.05 | %(e) | | | 1.05 | %(f) | | | 1.05 | % | | | 1.05 | %(e) |
Ratios of net investment income (loss) to average net assets: | | | | | | | | | | | | | | | | |
Before expense reimbursement and/or fee waiver | | | 2.26 | %(e) | | | 0.55 | % | | | (0.28 | )% | | | (1.49 | )%(e) |
After expense reimbursement and/or fee waiver | | | 2.31 | %(e) | | | 2.32 | % | | | 2.52 | % | | | 2.42 | %(e) |
Portfolio Turnover | | | 24 | %(d) | | | 36 | % | | | 28 | % | | | 16 | %(d) |
| (a) | The commencement of investment operations for AMG Managers Guardian Capital Global Dividend Fund Class I shares was April 11, 2014. |
| (b) | Per share numbers have been calculated using average shares. |
| (c) | The total return is calculated using the published Net Asset Value. |
| (f) | Effective October 1, 2016, the Fund’s expense cap was reduced to 1.05% from 1.30%. The expense ratio shown reflects the weighted average expense ratio for the full fiscal year ended October 31, 2016. (See Note F) |
The accompanying notes are an integral part of these financial statements.
AMG Funds
| | |
| AMG Managers Pictet International Fund – Class N | | April 30, 2017 |
| Financial Highlights | | |
| | | | | | | | | | | | | | | | |
| | | For the
Six Months
Ended
04/30/17
(unaudited) | | | Year
Ended
10/31/16 | | | Year
Ended
10/31/15 | | | Period
Ended
10/31/14(a) | |
Net Asset Value, Beginning of Period | | $ | 9.61 | | | $ | 9.56 | | | $ | 9.34 | | | $ | 10.00 | |
| | | | | | | | | | | | | | | | |
Income from Investment Operations: | | | | | | | | | | | | | | | | |
Net investment income | | | 0.05 | (b) | | | 0.13 | (b) | | | 0.10 | (b) | | | 0.09 | |
Net realized and unrealized gain (loss) on investments | | | 1.11 | | | | 0.00 | (c) | | | 0.17 | (d) | | | (0.75 | ) |
| | | | | | | | | | | | | | | | |
Total from investment operations | | | 1.16 | | | | 0.13 | | | | 0.27 | | | | (0.66 | ) |
| | | | | | | | | | | | | | | | |
Less Distributions: | | | | | | | | | | | | | | | | |
Distributions from and in excess of net investment income | | | (0.07 | ) | | | (0.02 | ) | | | (0.03 | ) | | | — | |
Distributions from net realized gain on investments | | | (0.20 | ) | | | (0.06 | ) | | | (0.02 | ) | | | — | |
| | | | | | | | | | | | | | | | |
Total distributions | | | (0.27 | ) | | | (0.08 | ) | | | (0.05 | ) | | | — | |
| | | | | | | | | | | | | | | | |
Net increase (decrease) in net asset value | | | 0.89 | | | | 0.05 | | | | 0.22 | | | | (0.66 | ) |
| | | | | | | | | | | | | | | | |
Net Asset Value, End of Period | | $ | 10.50 | | | $ | 9.61 | | | $ | 9.56 | | | $ | 9.34 | |
| | | | | | | | | | | | | | | | |
Total Return (e) | | | 12.62 | %(f) | | | 1.42 | %(g) | | | 3.02 | % | | | (6.60 | )%(f) |
Ratios/Supplemental Data: | | | | | | | | | | | | | | | | |
Net Assets, End of Period (in 000’s) | | $ | 290 | | | $ | 131 | | | $ | 1,056 | | | $ | 984 | |
Ratios of expenses to average net assets: | | | | | | | | | | | | | | | | |
Before expense reimbursement and/or fee waiver, or recoupment | | | 1.34 | %(h) | | | 1.41 | % | | | 1.92 | % | | | 3.26 | %(h) |
After expense reimbursement and/or fee waiver, or recoupment | | | 1.34 | %(h) | | | 1.40 | %(i) | | | 1.40 | % | | | 1.40 | %(h) |
Ratios of net investment income (loss) to average net assets: | | | | | | | | | | | | | | | | |
Before expense reimbursement and/or fee waiver, or recoupment | | | 1.02 | %(h) | | | 1.88 | % | | | 0.53 | % | | | (0.25 | )%(h) |
After expense reimbursement and/or fee waiver, or recoupment | | | 1.04 | %(h) | | | 1.88 | % | | | 1.06 | % | | | 1.61 | %(h) |
Portfolio Turnover | | | 20 | %(f) | | | 38 | % | | | 53 | % | | | 26 | %(f) |
| (a) | The commencement of investment operations for AMG Managers Pictet International Fund Class N shares was April 11, 2014. |
| (b) | Per share numbers have been calculated using average shares. |
| (c) | Less than $0.005 per share. |
| (d) | Includes capital contribution of $0.01 per share. |
| (e) | The total return is calculated using the published Net Asset Value. |
| (g) | The total return would have been 1.32% had the capital contribution not been included. |
| (i) | Effective October 1, 2016, the Fund’s expense cap was reduced to 1.08% from 1.40%. The expense ratio shown reflects the weighted average expense ratio for the full fiscal year ended October 31, 2016. (See Note F) |
The accompanying notes are an integral part of these financial statements.
AMG Funds
| | |
| AMG Managers Pictet International Fund – Class I | | April 30, 2017 |
| Financial Highlights | | |
| | | | | | | | | | | | | | | | |
| | | For the
Six Months
Ended
04/30/17
(unaudited) | | | Year
Ended
10/31/16 | | | Year
Ended
10/31/15 | | | Period
Ended
10/31/14(a) | |
Net Asset Value, Beginning of Period | | $ | 9.65 | | | $ | 9.60 | | | $ | 9.36 | | | $ | 10.00 | |
| | | | | | | | | | | | | | | | |
Income from Investment Operations: | | | | | | | | | | | | | | | | |
Net investment income | | | 0.05 | (b) | | | 0.15 | (b) | | | 0.12 | (b) | | | 0.10 | |
Net realized and unrealized gain (loss) on investments | | | 1.14 | | | | 0.00 | (c) | | | 0.19 | (d) | | | (0.74 | ) |
| | | | | | | | | | | | | | | | |
Total from investment operations | | | 1.19 | | | | 0.15 | | | | 0.31 | | | | (0.64 | ) |
| | | | | | | | | | | | | | | | |
Less Distributions: | | | | | | | | | | | | | | | | |
Distributions from and in excess of net investment income | | | (0.14 | ) | | | (0.04 | ) | | | (0.05 | ) | | | — | |
Distributions from net realized gain on investments | | | (0.21 | ) | | | (0.06 | ) | | | (0.02 | ) | | | — | |
| | | | | | | | | | | | | | | | |
Total distributions | | | (0.35 | ) | | | (0.10 | ) | | | (0.07 | ) | | | — | |
| | | | | | | | | | | | | | | | |
Net increase (decrease) in net asset value | | | 0.84 | | | | 0.05 | | | | 0.24 | | | | (0.64 | ) |
| | | | | | | | | | | | | | | | |
Net Asset Value, End of Period | | $ | 10.49 | | | $ | 9.65 | | | $ | 9.60 | | | $ | 9.36 | |
| | | | | | | | | | | | | | | | |
Total Return (e) | | | 12.73 | %(f) | | | 1.67 | %(g) | | | 3.43 | % | | | (6.40 | )%(f) |
Ratios/Supplemental Data: | | | | | | | | | | | | | | | | |
Net Assets, End of Period (in 000’s) | | $ | 1,642,932 | | | $ | 1,336,050 | | | $ | 49,803 | | | $ | 8,467 | |
Ratios of expenses to average net assets: | | | | | | | | | | | | | | | | |
Before expense reimbursement and/or fee waiver, or recoupment | | | 1.10 | %(h) | | | 1.15 | % | | | 1.67 | % | | | 3.01 | %(h) |
After expense reimbursement and/or fee waiver, or recoupment | | | 1.09 | %(h) | | | 1.15 | %(i) | | | 1.15 | % | | | 1.15 | %(h) |
Ratios of net investment income to average net assets: | | | | | | | | | | | | | | | | |
Before expense reimbursement and/or fee waiver, or recoupment | | | 1.05 | %(h) | | | 2.13 | % | | | 0.78 | % | | | 0.00 | %(h)(c) |
After expense reimbursement and/or fee waiver, or recoupment | | | 1.06 | %(h) | | | 2.13 | % | | | 1.31 | % | | | 1.86 | %(h) |
Portfolio Turnover | | | 20 | %(f) | | | 38 | % | | | 53 | % | | | 26 | %(f) |
| (a) | The commencement of investment operations for AMG Managers Pictet International Fund Class I shares was April 11, 2014. |
| (b) | Per share numbers have been calculated using average shares. |
| (c) | Less than $0.005 per share or less than 0.005%. |
| (d) | Includes capital contribution of $0.01 per share. |
| (e) | The total return is calculated using the published Net Asset Value. |
| (g) | The total return would have been 1.57% had the capital contribution not been included. |
| (i) | Effective October 1, 2016, the Fund’s expense cap was reduced to 1.08% from 1.15%. The expense ratio shown reflects the weighted average expense ratio for the full fiscal year ended October 31, 2016. (See Note F) |
The accompanying notes are an integral part of these financial statements.
AMG Funds
| | |
| AMG Managers Value Partners Asia Dividend Fund – Class N | | April 30, 2017 |
| Financial Highlights | | |
| | | | | | | | |
| | | For the
Six Months
Ended
04/30/17
(unaudited) | | | Period
Ended
10/31/16(a) | |
Net Asset Value, Beginning of Period | | $ | 10.63 | | | $ | 10.00 | |
| | | | | | | | |
Income from Investment Operations: | | | | | | | | |
Net investment income (b) | | | 0.04 | | | | 0.24 | |
Net realized and unrealized gain on investments | | | 1.11 | | | | 0.59 | |
| | | | | | | | |
Total from investment operations | | | 1.15 | | | | 0.83 | |
| | | | | | | | |
Less Distributions: | | | | | | | | |
Distributions from and in excess of net investment income | | | (0.18 | ) | | | (0.20 | ) |
Distributions from net realized gain on investments | | | (0.30 | ) | | | — | |
| | | | | | | | |
Total distributions | | | (0.48 | ) | | | (0.20 | ) |
| | | | | | | | |
Net increase in net asset value | | | 0.67 | | | | 0.63 | |
| | | | | | | | |
Net Asset Value, End of Period | | $ | 11.30 | | | $ | 10.63 | |
| | | | | | | | |
Total Return (c) | | | 11.53 | %(d) | | | 8.39 | %(d) |
Ratios/Supplemental Data: | | | | | | | | |
Net Assets, End of Period (in 000’s) | | $ | 964 | | | $ | 808 | |
Ratios of expenses to average net assets: | | | | | | | | |
Before expense reimbursement and/or fee waiver | | | 2.41 | %(e) | | | 4.18 | %(e) |
After expense reimbursement and/or fee waiver | | | 1.15 | %(e) | | | 1.40 | %(e)(f) |
Ratios of net investment income (loss) to average net assets: | | | | | | | | |
Before expense reimbursement and/or fee waiver | | | (0.57 | )%(e) | | | (0.05 | )%(e) |
After expense reimbursement and/or fee waiver | | | 0.69 | %(e) | | | 2.74 | %(e) |
Portfolio Turnover | | | 34 | %(d) | | | 51 | %(d) |
| (a) | The commencement of investment operations for AMG Managers Value Partners Asia Dividend Fund Class N shares was December 16, 2015. |
| (b) | Per share numbers have been calculated using average shares. |
| (c) | The total return is calculated using the published Net Asset Value. |
| (f) | Effective October 1, 2016, the Fund’s expense cap was reduced to 1.15% from 1.40%. The expense ratio shown reflects the weighted average expense ratio for the full fiscal period ended October 31, 2016. (See Note F) |
The accompanying notes are an integral part of these financial statements.
AMG Funds
| | |
| AMG Managers Value Partners Asia Dividend Fund – Class I | | April 30, 2017 |
| Financial Highlights | | |
| | | | | | | | |
| | | For the
Six Months
Ended
04/30/17
(unaudited) | | | Period
Ended
10/31/16(a) | |
Net Asset Value, Beginning of Period | | $ | 10.63 | | | $ | 10.00 | |
| | | | | | | | |
Income from Investment Operations: | | | | | | | | |
Net investment income (b) | | | 0.04 | | | | 0.27 | |
Net realized and unrealized gain on investments | | | 1.12 | | | | 0.58 | |
| | | | | | | | |
Total from investment operations | | | 1.16 | | | | 0.85 | |
| | | | | | | | |
Less Distributions: | | | | | | | | |
Distribution from and in excess of net investment income | | | (0.19 | ) | | | (0.22 | ) |
Distributions from net realized gain on investments | | | (0.30 | ) | | | — | |
| | | | | | | | |
Total distributions | | | (0.49 | ) | | | (0.22 | ) |
| | | | | | | | |
Net increase in net asset value | | | 0.67 | | | | 0.63 | |
| | | | | | | | |
Net Asset Value, End of Period | | $ | 11.30 | | | $ | 10.63 | |
| | | | | | | | |
Total Return (c) | | | 11.60 | %(d) | | | 8.60 | %(d) |
Ratios/Supplemental Data: | | | | | | | | |
Net Assets, End of Period (in 000’s) | | $ | 8,013 | | | $ | 7,283 | |
Ratios of expenses to average net assets: | | | | | | | | |
Before expense reimbursement and/or fee waiver | | | 2.41 | %(e) | | | 3.94 | %(e) |
After expense reimbursement and/or fee waiver | | | 1.15 | %(e) | | | 1.15 | %(e) |
Ratios of net investment income (loss) to average net assets: | | | | | | | | |
Before expense reimbursement and/or fee waiver | | | (0.55 | )%(e) | | | 0.20 | %(e) |
After expense reimbursement and/or fee waiver | | | 0.71 | %(e) | | | 2.99 | %(e) |
Portfolio Turnover | | | 34 | %(d) | | | 51 | %(d) |
| (a) | The commencement of investment operations for AMG Managers Value Partners Asia Dividend Fund Class I shares was December 16, 2015. |
| (b) | Per share numbers have been calculated using average shares. |
| (c) | The total return is calculated using the published Net Asset Value. |
The accompanying notes are an integral part of these financial statements.
AMG Funds
| | |
| AMG Managers Montag & Caldwell Balanced Fund – Class N | | April 30, 2017 |
| Financial Highlights | | |
| | | | | | | | | | | | | | | | | | | | | | | | |
| | | For the
Six Months
Ended
04/30/17
(unaudited) | | | Year
Ended
10/31/16 | | | Year
Ended
10/31/15 | | | Year
Ended
10/31/14 | | | Year
Ended
10/31/13 | | | Year
Ended
10/31/12 | |
Net Asset Value, Beginning of Period | | $ | 22.58 | | | $ | 23.83 | | | $ | 24.68 | | | $ | 23.81 | | | $ | 21.46 | | | $ | 20.09 | |
| | | | | | | | | | | | | | | | | | | | | | | | |
Income from Investment Operations: | | | | | | | | | | | | | | | | | | | | | | | | |
Net investment income (a) | | | 0.03 | | | | 0.11 | | | | 0.10 | | | | 0.12 | | | | 0.21 | | | | 0.16 | |
Net realized and unrealized gain (loss) on investments | | | 1.05 | | | | (0.17 | ) | | | 1.31 | | | | 1.70 | | | | 2.43 | | | | 1.45 | |
| | | | | | | | | | | | | | | | | | | | | | | | |
Total from investment operations | | | 1.08 | | | | (0.06 | ) | | | 1.41 | | | | 1.82 | | | | 2.64 | | | | 1.61 | |
| | | | | | | | | | | | | | | | | | | | | | | | |
Less Distributions: | | | | | | | | | | | | | | | | | | | | | | | | |
Distributions from and in excess of net investment income | | | (0.08 | ) | | | (0.15 | ) | | | (0.18 | ) | | | (0.21 | ) | | | (0.29 | ) | | | (0.24 | ) |
Distributions from net realized gain on investments | | | (1.88 | ) | | | (1.04 | ) | | | (2.08 | ) | | | (0.74 | ) | | | — | | | | — | |
| | | | | | | | | | | | | | | | | | | | | | | | |
Total distributions | | | (1.96 | ) | | | (1.19 | ) | | | (2.26 | ) | | | (0.95 | ) | | | (0.29 | ) | | | (0.24 | ) |
| | | | | | | | | | | | | | | | | | | | | | | | |
Net increase (decrease) in net asset value | | | (0.88 | ) | | | (1.25 | ) | | | (0.85 | ) | | | 0.87 | | | | 2.35 | | | | 1.37 | |
| | | | | | | | | | | | | | | | | | | | | | | | |
Net Asset Value, End of Period | | $ | 21.70 | | | $ | 22.58 | | | $ | 23.83 | | | $ | 24.68 | | | $ | 23.81 | | | $ | 21.46 | |
| | | | | | | | | | | | | | | | | | | | | | | | |
Total Return (b) | | | 5.31 | %(c) | | | (0.28 | )% | | | 6.01 | % | | | 7.83 | % | | | 12.40 | % | | | 8.03 | % |
Ratios/Supplemental Data: | | | | | | | | | | | | | | | | | | | | | | | | |
Net Assets, End of Period (in 000’s) | | $ | 20,424 | | | $ | 25,373 | | | $ | 26,607 | | | $ | 20,446 | | | $ | 22,425 | | | $ | 31,536 | |
Ratios of expenses to average net assets: | | | | | | | | | | | | | | | | | | | | | | | | |
Before expense reimbursement and/or fee waiver | | | 1.29 | %(d) | | | 1.31 | % | | | 1.44 | % | | | 1.43 | % | | | 1.37 | % | | | 1.42 | % |
After expense reimbursement and/or fee waiver | | | 1.13 | %(d)(f) | | | 1.20 | %(e) | | | 1.20 | % | | | 1.20 | % | | | 1.20 | % | | | 1.22 | % |
Ratios of net investment income to average net assets: | | | | | | | | | | | | | | | | | | | | | | | | |
Before expense reimbursement and/or fee waiver | | | 0.13 | %(d) | | | 0.35 | % | | | 0.19 | % | | | 0.26 | % | | | 0.77 | % | | | 0.57 | % |
After expense reimbursement and/or fee waiver | | | 0.29 | %(d) | | | 0.46 | % | | | 0.43 | % | | | 0.50 | % | | | 0.94 | % | | | 0.77 | % |
Portfolio Turnover | | | 21 | %(c) | | | 85 | % | | | 36 | % | | | 27 | % | | | 35 | % | | | 35 | % |
| (a) | Per share numbers have been calculated using average shares. |
| (b) | The total return is calculated using the published Net Asset Value. |
| (e) | Effective October 1, 2016, the Fund’s expense cap was reduced to 1.04% from 1.35%. The expense ratio shown reflects the weighted average expense ratio for the full fiscal year ended October 31, 2016. (See Note F) |
| (f) | Includes reduction from brokerage recapture amounting to 0.02%. |
The accompanying notes are an integral part of these financial statements.
AMG Funds
| | |
| AMG Managers Montag & Caldwell Balanced Fund – Class I | | April 30, 2017 |
| Financial Highlights | | |
| | | | | | | | | | | | | | | | | | | | | | | | |
| | | For the
Six Months
Ended
04/30/17
(unaudited) | | | Year
Ended
10/31/16 | | | Year
Ended
10/31/15 | | | Year
Ended
10/31/14 | | | Year
Ended
10/31/13 | | | Year
Ended
10/31/12 | |
Net Asset Value, Beginning of Period | | $ | 22.50 | | | $ | 23.75 | | | $ | 24.60 | | | $ | 23.76 | | | $ | 21.41 | | | $ | 20.05 | |
| | | | | | | | | | | | | | | | | | | | | | | | |
Income from Investment Operations: | | | | | | | | | | | | | | | | | | | | | | | | |
Net investment income (a) | | | 0.03 | | | | 0.13 | | | | 0.12 | | | | 0.14 | | | | 0.23 | | | | 0.19 | |
Net realized and unrealized gain (loss) on investments | | | 1.06 | | | | (0.17 | ) | | | 1.31 | | | | 1.70 | | | | 2.43 | | | | 1.44 | |
| | | | | | | | | | | | | | | | | | | | | | | | |
Total from investment operations | | | 1.09 | | | | (0.04 | ) | | | 1.43 | | | | 1.84 | | | | 2.66 | | | | 1.63 | |
| | | | | | | | | | | | | | | | | | | | | | | | |
Less Distributions: | | | | | | | | | | | | | | | | | | | | | | | | |
Distributions from and in excess of net investment income | | | (0.08 | ) | | | (0.17 | ) | | | (0.20 | ) | | | (0.26 | ) | | | (0.31 | ) | | | (0.27 | ) |
Distributions from net realized gain on investments | | | (1.88 | ) | | | (1.04 | ) | | | (2.08 | ) | | | (0.74 | ) | | | — | | | | — | |
| | | | | | | | | | | | | | | | | | | | | | | | |
Total distributions | | | (1.96 | ) | | | (1.21 | ) | | | (2.28 | ) | | | (1.00 | ) | | | (0.31 | ) | | | (0.27 | ) |
| | | | | | | | | | | | | | | | | | | | | | | | |
Net increase (decrease) in net asset value | | | (0.87 | ) | | | (1.25 | ) | | | (0.85 | ) | | | 0.84 | | | | 2.35 | | | | 1.36 | |
| | | | | | | | | | | | | | | | | | | | | | | | |
Net Asset Value, End of Period | | $ | 21.63 | | | $ | 22.50 | | | $ | 23.75 | | | $ | 24.60 | | | $ | 23.76 | | | $ | 21.41 | |
| | | | | | | | | | | | | | | | | | | | | | | | |
Total Return (b) | | | 5.36 | %(c) | | | (0.19 | )% | | | 6.13 | % | | | 7.92 | % | | | 12.53 | % | | | 8.14 | % |
| | | | | | |
Ratios/Supplemental Data: | | | | | | | | | | | | | | | | | | | | | | | | |
Net Assets, End of Period (in 000’s) | | $ | 2,701 | | | $ | 3,091 | | | $ | 3,518 | | | $ | 1,934 | | | $ | 1,839 | | | $ | 1,930 | |
Ratios of expenses to average net assets: | | | | | | | | | | | | | | | | | | | | | | | | |
Before expense reimbursement and/or fee waiver | | | 1.25 | %(d) | | | 1.22 | % | | | 1.34 | % | | | 1.33 | % | | | 1.27 | % | | | 1.30 | % |
After expense reimbursement and/or fee waiver | | | 1.08 | %(d)(f) | | | 1.10 | %(e) | | | 1.10 | % | | | 1.10 | % | | | 1.10 | % | | | 1.10 | % |
Ratios of net investment income to average net assets: | | | | | | | | | | | | | | | | | | | | | | | | |
Before expense reimbursement and/or fee waiver | | | 0.17 | %(d) | | | 0.43 | % | | | 0.29 | % | | | 0.36 | % | | | 0.87 | % | | | 0.69 | % |
After expense reimbursement and/or fee waiver | | | 0.33 | %(d) | | | 0.55 | % | | | 0.53 | % | | | 0.60 | % | | | 1.04 | % | | | 0.89 | % |
Portfolio Turnover | | | 21 | %(c) | | | 85 | % | | | 36 | % | | | 27 | % | | | 35 | % | | | 35 | % |
| (a) | Per share numbers have been calculated using average shares. |
| (b) | The total return is calculated using the published Net Asset Value. |
| (e) | Effective October 1, 2016, the Fund’s expense cap was reduced to 1.04% from 1.10%. The expense ratio shown reflects the weighted average expense ratio for the full fiscal year ended October 31, 2016. (See Note F) |
| (f) | Includes reduction from brokerage recapture amounting to 0.02%. |
The accompanying notes are an integral part of these financial statements.
AMG Funds
| | |
| | April 30, 2017 |
| Notes to Financial Statements (unaudited) | | |
Note (A) Summary of Significant Accounting Policies: AMG Funds IV (the “Trust”), is an open-end management investment company, organized as a Delaware Statutory Trust, and registered under the Investment Company Act of 1940, as amended (the “1940 Act”). Currently, the Trust consists of a number of different funds, (each a “Fund” and collectively, the “Funds”), each having distinct investment management objectives, strategies, risks and policies. Included in this report are:
Funds
AMG Managers Fairpointe Focused Equity Fund (the “Fairpointe Focused Equity”)
AMG River Road Focused Absolute Value Fund (the “River Road Focused Absolute Value”)
AMG Managers Montag & Caldwell Growth Fund (the “Montag & Caldwell Growth”)
AMG River Road Dividend All Cap Value Fund (the “River Road Dividend All Cap Value”)
AMG River Road Dividend All Cap Value Fund II (the “River Road Dividend All Cap Value II”)
AMG Managers Fairpointe Mid Cap Fund (the “Fairpointe Mid Cap”)
AMG Managers Montag & Caldwell Mid Cap Growth Fund (the “Montag & Caldwell Mid Cap Growth”)
AMG Managers LMCG Small Cap Growth Fund (the “LMCG Small Cap Growth”)
AMG River Road Select Value Fund (the “River Road Select Value”)
AMG River Road Small Cap Value Fund (the “River Road Small Cap Value”)
AMG Managers Silvercrest Small Cap Fund (the “Silvercrest Small Cap”)
AMG GW&K U.S. Small Cap Growth Fund (“GW&K U.S. Small Cap Growth”)
AMG Managers DoubleLine Core Plus Bond Fund (the “DoubleLine Core Plus Bond”)
AMG Managers Lake Partners LASSO Alternatives Fund (the “Lake Partners LASSO Alternatives”)
AMG River Road Long-Short Fund (the “River Road Long-Short”)
AMG Managers Guardian Capital Global Dividend Fund (the “Guardian Capital Global Dividend”)
AMG Managers Pictet International Fund (the “Pictet International”)
AMG Managers Value Partners Asia Dividend Fund (the “Value Partners Asia Dividend”)
AMG Managers Montag & Caldwell Balanced Fund (the “Montag & Caldwell Balanced”)
Each Fund, except Montag & Caldwell Growth and GW&K U.S. Small Cap Growth, is authorized to issue two classes of shares (Class N shares and Class I shares). Montag & Caldwell Growth is authorized to issue three classes of shares (Class N shares, Class I shares and Class R shares). GW&K U.S. Small Cap Growth is authorized to issue three classes of shares (Class N shares, Class I shares and Class Z shares). Each class represents an interest in the same assets of the respective Fund. Although all share classes generally have identical voting rights, each share class votes separately when required by law. Different share classes may pay different amounts to the extent the net asset value per share and/or the expenses of such share classes differ. Each share class has its own expense structure. Please refer to a current prospectus for additional information on each share class.
The Funds’ financial statements are prepared in accordance with accounting principles generally accepted in the United States of America (“U.S. GAAP”), including accounting and reporting guidance pursuant to Accounting Standards Codification Topic 946 applicable to investment companies. U.S. GAAP requires management to make estimates and assumptions that affect the reported amounts of assets and liabilities and disclosure of contingent assets and liabilities at the date of the financial statements and the reported amounts of income and expenses during the reporting period. Actual results could differ from those estimates and such differences could be material. The following is a summary of significant accounting policies followed by the Funds in the preparation of their financial statements:
(1) Valuation of Investments: Equity securities, including short positions, traded on a national securities exchange or reported on the NASDAQ national market system (“NMS”) are valued at the last quoted sales price on the primary exchange or, if applicable, the NASDAQ official closing price or the official closing price of the relevant exchange or, lacking any sales, at the last quoted bid price or the mean between the last quoted bid and ask prices (the “exchange mean price”). Equity securities traded in the over-the-counter market (other than NMS securities) are valued at the exchange mean price. Foreign equity securities (securities principally traded in markets other than U.S. markets) are valued at the official closing price on the primary exchange or, for markets that either do not offer an official closing price or where the official closing price may not be representative of the overall market, the last quoted sale price.
Fixed income securities purchased with a remaining maturity exceeding 60 days are valued at the evaluated bid price or the mean price provided by an authorized pricing service or, if an evaluated price is not available, by reference to other securities which are considered comparable in credit rating, interest rate, due date and other features (generally referred to as “matrix pricing”) or other similar pricing methodologies. Investments in certain mortgage-backed and stripped mortgage-backed securities, preferred stocks, convertible securities, derivatives and other debt securities not traded on an organized securities market are valued on the basis of valuations provided by dealers or by a pricing service which uses information with respect to transactions in such securities and various relationships between such securities and yield to maturity in determining value.
Fixed income securities purchased with a remaining maturity of 60 days or less are valued at amortized cost, provided that the amortized cost value is approximately the same as the fair value of the security valued without the use of amortized cost. Investments in other open-end regulated investment companies are valued at their end of day net asset value per share.
The Funds’ portfolio investments are generally valued based on independent market quotations or prices or, if none, “evaluative” or other market based valuations provided by third-party pricing services approved by the Board of Trustees of the Trust (the “Board”). Under certain circumstances, the value of
AMG Funds
| | |
| | April 30, 2017 |
| Notes to Financial Statements – continued | | |
certain Fund portfolio investments (including derivatives) may be based on an evaluation of fair value, pursuant to procedures established by and under the general supervision of the Board. The Valuation Committee, which is comprised of the Independent Trustees of the Board, and the Pricing Committee, which is comprised of representatives from AMG Funds LLC (the “Investment Manager”) are the committees appointed by the Board to make fair value determinations. Each Fund may use the fair value of a portfolio investment to calculate its net asset value (“NAV”) in the event that the market quotation, price or market based valuation for the portfolio investment is not readily available or otherwise not determinable pursuant to the Board’s valuation procedures, if the Investment Manager or the Pricing Committee believes the quotation, price or market based valuation to be unreliable, or in certain other circumstances. When determining the fair value of an investment, the Pricing Committee and, if required under the Trust’s securities valuation procedures, the Valuation Committee, seeks to determine the price that the Fund might reasonably expect to receive from current sale of that portfolio investment in an arms-length transaction. Fair value determinations shall be based upon consideration of all available facts and information, including, but not limited to (i) attributes specific to the investment; (ii) fundamental and analytical data relating to the investment; and (iii) the value of other comparable securities or relevant financial instruments, including derivative securities, traded on other markets or among dealers.
The values assigned to fair value portfolio investments are based on available information and do not necessarily represent amounts that might ultimately be realized in the future, since such amounts depend on future developments inherent in long-term investments. Because of the inherent uncertainty of valuation, those estimated values may differ significantly from the values that would have been used had a ready market for the investments existed, and the differences could be material. The Board will be presented with a quarterly report showing as of the most recent quarter end, all outstanding securities fair valued by the Fund, including a comparison with the prior quarter end and the percentage of the Fund that the security represents at each quarter end.
With respect to foreign equity securities and certain foreign fixed income securities, the Board has adopted a policy that securities held in a Fund that can be fair valued by the applicable fair value pricing service are fair valued on each business day provided that each individual price exceeds a pre-established confidence level.
U.S. GAAP defines fair value as the price that a fund would receive to sell an asset or pay to transfer a liability in an orderly transaction between market participants at the measurement date. U.S. GAAP also establishes a framework for measuring fair value, and a three-level hierarchy for fair value measurements based upon the transparency of inputs to the valuation of an asset or liability. Inputs may be observable or unobservable and refer broadly to the assumptions that market participants would use in pricing the asset or liability. Observable inputs reflect the assumptions market participants would use in pricing the asset or liability based on market data obtained from sources
independent of the Funds. Unobservable inputs reflect the Funds’ own assumptions about the assumptions that market participants would use in pricing the asset or liability developed based on the best information available in the circumstances. Each investment is assigned a level based upon the observability of the inputs which are significant to the overall valuation. The three tier hierarchy of inputs is summarized below:
| | • Level 1 – | unadjusted quoted prices in active markets for identical assets or liabilities |
| | • Level 2 – | other significant observable inputs (including quoted prices for similar securities, interest rates, prepayment speeds, credit risk, etc.) |
| | • Level 3 – | significant unobservable inputs (including the Funds’ own assumptions in determining the fair value of investments) |
The inputs or methodologies used for valuing investments may not necessarily be an indication of the risk associated with investing in those investments. Transfers between different levels of the fair value disclosure hierarchy are deemed to have occurred as of the end of the reporting period.
(2) Investment Companies: Lake Partners LASSO Alternatives primarily invests, and certain other Funds in this Trust, may invest in securities of other investment companies, including open-end funds, closed end funds and exchange-traded funds (“ETFs”). Open-end funds are investment companies that issue new shares continuously and redeem shares daily. Closed-end funds are investment companies that typically issue a fixed number of shares that trade on a securities exchange or over-the-counter. An ETF is an investment company. Typically, an ETF seeks to track the performance of an index by holding in its portfolio shares of all the companies, or a representative sample of the companies, that are components of a particular index; however, some ETFs are actively managed. ETFs are traded on securities exchanges based on their market values. The risks of investment in other investment companies typically reflect the risks of the types of securities in which investment companies invest. Investments in ETFs and closed-end funds are subject to the additional risk that shares of the fund may trade at a premium or discount to their NAV per share. When a Fund invests in another investment company, shareholders of the Fund bear their proportionate shares of the other investment company’s fees and expenses, as well as their share of the Fund’s fees and expenses. The Trust has obtained an exemptive order from the Securities and Exchange Commission (“SEC”) that allows the Funds to invest in both affiliated and unaffiliated investment companies in excess of the limits of the 1940 Act, subject to the terms and conditions of such order. Prior to its investment in shares of an unaffiliated investment company in excess of the limits of the 1940 Act, the Trust, on behalf of a Fund, and the underlying fund must execute an agreement that is designed to ensure that each party understands the terms and conditions of the order and agrees to fulfill its responsibilities under the order. For the six months ended April 30, 2017, Lake Partners LASSO Alternatives relied on such exemptive order.
AMG Funds
| | |
| | April 30, 2017 |
| Notes to Financial Statements – continued | | |
(3) Repurchase Agreements and Joint Repurchase Agreements: The Funds may enter into third-party repurchase agreements for temporary cash management purposes and joint repurchase agreements for reinvestment of cash collateral on securities lending transactions under the securities lending program offered by The Bank of New York Mellon (“BNYM”) (the “Program”) (collectively, “Repurchase Agreements”). The value of the underlying collateral, including accrued interest, must equal or exceed the value of the Repurchase Agreements during the term of the agreement. For joint repurchase agreements, the Funds participate on a pro rata basis with other clients of BNYM in its share of the underlying collateral under such joint repurchase agreements and in its share of proceeds from any repurchase or other disposition of the underlying collateral. The underlying collateral for all Repurchase Agreements is held in safekeeping by the Funds’ custodian or at the Federal Reserve Bank. If the seller defaults and the value of the collateral declines, or if bankruptcy proceedings commence with respect to the seller of the security, realization of the collateral by the Funds may be delayed or limited. Pursuant to the Program, the Funds are indemnified for such losses by BNYM on joint repurchase agreements.
At April 30, 2017, the market value of Repurchase Agreements outstanding is as follows:
| | | | |
| | | Market Value | |
River Road Focused Absolute Value | | $ | 358,021 | |
River Road Dividend All Cap Value | | | 22,612,867 | |
River Road Dividend All Cap Value II | | | 1,174,348 | |
Montag & Caldwell Mid Cap Growth | | | 423,918 | |
LMCG Small Cap Growth | | | 5,755,941 | |
River Road Select Value | | | 1,409,152 | |
River Road Small Cap Value | | | 5,662,333 | |
Silvercrest Small Cap | | | 1,765,432 | |
GW&K U.S. Small Cap Growth | | | 1,458,663 | |
DoubleLine Core Plus Bond | | | 14,734,882 | |
Guardian Capital Global Dividend | | | 967,374 | |
Pictet International | | | 65,738,546 | |
Value Partners Asia Dividend | | | 5,378 | |
(4) Securities Transacted on a When Issued Basis: DoubleLine Core Plus Bond may enter into To-Be-Announced (“TBA”) sale commitments to hedge their portfolio positions or to sell mortgage-backed securities they own under delayed delivery arrangements. Proceeds of TBA sale commitments are not received until the contractual settlement date. During the time a TBA sale commitment is outstanding, equivalent deliverable securities, with the same counterparty, or an offsetting TBA purchase commitment deliverable on or before the sale commitment date, are held as “cover” for the transaction. Unsettled TBA sale commitments are valued at the current market value of the underlying securities according to the procedures described under “Valuation of Investments,” in footnote A1 above.
Each contract is marked-to-market daily and the change in market value is recorded by the Funds as an unrealized gain or loss. If the TBA sale commitment is closed through the acquisition of an offsetting purchase commitment, the Funds realize a gain or loss. If the Funds deliver securities under the commitment, the Funds realize a gain or a loss from the sale of the securities based upon the unit price established at the date the commitment was entered into.
(5) Mortgage-Backed Securities: Montag & Caldwell Balanced and DoubleLine Core Plus Bond may invest in mortgage-backed securities (“MBS”). These securities represent interests in pools of mortgage loans and they provide holders with payments consisting of both principal and interest as the mortgages in the underlying mortgage pools are paid. The timely payment of principal and interest on MBS issued or guaranteed by Ginnie Mae (formerly known as the Government National Mortgage Association) is backed by Ginnie Mae and the full faith and credit of the U.S. government. MBS issued by U.S. government agencies or instrumentalities other than Ginnie Mae are not “full faith and credit” obligations. Certain obligations, such as those issued by the Federal Home Loan Banks, Fannie Mae (formerly known as the Federal National Mortgage Association) and Fred-die Mac (formerly known as the Federal Home Loan Mortgage Corporation) are supported only by the credit of the issuer. MBS issued by private issuers are not government securities and are not guaranteed by any government agency. They are secured by the underlying collateral of the private issuer. Yields on privately issued MBS tend to be higher than those of government-backed issues. However, risk of loss due to default and sensitivity to interest rate fluctuations are also higher. Montag & Caldwell Balanced and DoubleLine Core Plus Bond may also invest in collateralized mortgage obligations (“CMOs”), collateralized loan obligations (“CLOs”) and real estate mortgage investment conduits (“REMICs”). A CMO and/or REMIC is a bond that is collateralized by a pool of MBS. A CLO is a bond that is collateralized by a financial institution’s receivables from loans. These MBS pools are divided into classes with each class having its own characteristics. The different classes are retired in sequence as the underlying mortgages are repaid.
(6) Delayed Delivery Transactions and When-Issued Securities: DoubleLine Core Plus Bond may enter into securities transactions on a delayed delivery or when issued basis. Payment and delivery may take place after the customary settlement period for that security. The price of the underlying securities and the date when the securities will be delivered and paid for are fixed at the time the transaction is negotiated. During the time a delayed delivery sell is outstanding, the contract is marked to market daily and equivalent deliverable securities are held for the transaction. The value of the securities purchased on a delayed delivery or when-issued basis are identified as such in the Fund’s Schedule of Investments. With respect to purchase commitments, the Fund identifies securities as segregated in its records with a value at least equal to the amount of the commitment. Delayed delivery or when-issued securities that have been purchased from and sold to different brokers are reflected as an investment in securities and a forward sale commitment in the Fund’s Statement of Assets and Liabilities. For financial reporting purposes, the Funds do not offset the receivable and payable for delayed delivery investments purchased and sold on TBA commitments. Losses may arise due to changes in the value of the underlying securities or if the counterparty does not perform under the contract, or if the issuer does not issue the securities due to political, economic, or other factors.
(7) Stripped Securities: DoubleLine Core Plus Bond may invest in stripped securities (“STRIPS”) for hedging purposes to protect the
AMG Funds
| | |
| | April 30, 2017 |
| Notes to Financial Statements – continued | | |
Fund’s portfolio against interest rate fluctuations. Interest-only STRIPS will most likely move differently than typical fixed-income securities in relation to changes in interest rates. STRIPS are usually structured with two classes that receive different proportions of the interest and principal distributions from a pool of underlying assets. A common type of STRIP will have one class receiving all of the interest from the underlying assets (“interest-only” or “IO” class), while the other class will receive the entire principal (“principal only” or “PO” class). However, in some instances, one class will receive some of the interest and most of the principal while the other class will receive most of the interest and the remainder of the principal. STRIPS are unusually volatile in response to changes in interest rates. The yield to maturity on an IO class of STRIPS is extremely sensitive not only to changes in prevailing interest rates but also to the rate of principal payments (including prepayments) on the underlying assets. A rapid rate of principal prepayments may have a measurably adverse effect on the Fund’s yield to maturity to the extent it invests in IOs. Conversely, POs tend to increase in value if prepayments are greater than anticipated and decline if prepayments are slower than anticipated. Thus, if the underlying assets experience greater than anticipated repayments of principal, the Fund may fail to fully recover its initial investment in these securities, even if the STRIPS were rated of the highest credit quality by Standard & Poor’s Corporation or Moody’s Investors Service, Inc. These risks are managed by investing in a variety of such securities and by using certain hedging techniques. In addition the secondary market for STRIPS may be less liquid than that of other mortgage-backed or asset-backed securities, potentially limiting the Fund’s ability to buy or sell those securities at any particular time.
(8) Securities Sold Short and Due to/from Brokers: River Road Long-Short utilizes short sales as part of its overall portfolio management strategy. A short sale involves the sale of a security that is borrowed from a broker or other financial institution. A gain, limited to the price at which the Fund sold the security short, or a loss, unlimited in size, will be recognized upon closing a short sale. Short sales expose the Fund to the risk that it will be required to acquire, convert or exchange securities to replace the borrowed securities at a time when the securities sold short have appreciated in value, thus resulting in a loss to the Fund. The Fund must segregate liquid assets, or otherwise cover its position in a permissible manner. The Investment Manager determines the liquidity of assets, in accordance with procedures established by the Board. Cash segregated as collateral for short sales is shown in the Statement of Assets and Liabilities as segregated cash. Security positions segregated as collateral for short sales are included in unaffiliated investments at value in the Statement of Assets and Liabilities.
Due to/from brokers represents cash balances on deposit with, or cash balances owed to, Bank of America Merrill Lynch (the “Prime Broker”). When the Fund has cash balances on deposit with the Prime Broker, the Fund is subject to credit risk should the Prime Broker be unable to meet their obligations to the Fund; and when the Fund has cash balances owed to the Prime Broker, the amount is payable upon demand and the Fund must segregate liquid assets.
The Fund has entered into a Special Custody Agreement with the Prime Broker for securities sold short, which provides the right, in the event of default (including bankruptcy or insolvency) for the non-defaulting party to liquidate the collateral and calculate net exposure to the defaulting party or request additional collateral. For financial reporting purposes, the Fund does not offset financial assets and financial liabilities that are subject to a Special Custody Agreement in the Statement of Assets and Liabilities. As of April 30, 2017, the value of securities sold short was $12,793,794 and the Fund owed the Prime Broker $13,394,854 relating to margin; which both were collateralized with cash of $2,000,000 and securities worth $30,454,206.
(9) Forward Foreign Currency Contracts: A forward foreign currency contract is an agreement between a fund and another party to buy or sell a currency at a set price at a future date. The market value of the contract will fluctuate with changes in currency exchange rates. The contract is marked-to-market daily, and the change in market value is recorded as an unrealized gain or loss. Gain or loss is realized on the settlement date. Risks may arise upon entering into these contracts from the potential inability of counterparties to meet the terms of their contracts and from unanticipated movements in the value of a foreign currency relative to the U.S. dollar.
During the six months ended April 30, 2017, the Funds did not invest in forward foreign currency contracts.
(10) Security Transactions: Security transactions are accounted for as of trade date. Realized gains and losses on securities sold are determined on the basis of identified cost.
(11) Investment Income and Expenses: Dividend income and expenses are recorded on the ex-dividend date. Dividends from foreign securities are recorded on the ex-dividend date, and if after the fact, as soon as the Fund becomes aware of the ex-dividend date except for Korean securities where dividends are recorded on confirmation date. Interest income and expenses, which includes amortization of premium and accretion of discount on debt securities, is accrued as earned. Dividend and interest income on foreign securities is recorded gross of any withholding tax. Non-cash dividends included in dividend income, if any, are reported at the fair market value of the securities received. Upon notification from issuers, distributions received from a real estate investment trust (“REIT”) may be designated as a reduction of cost of investments and/or realized gain. Other income and expenses are recorded on an accrual basis. Expenses that cannot be directly attributed to a Fund are apportioned among the Funds in the Trust and other trusts within the AMG Funds family of mutual funds (collectively, the “AMG Funds family”) based upon their relative average net assets or number of shareholders. Investment income, realized and unrealized capital gains and losses, the common expenses of each Fund, and certain Fund level expense reductions, if any, are allocated on a pro-rata basis to each class based on the relative net assets of each class to the total net assets of each Fund.
AMG Funds
| | |
| | April 30, 2017 |
| Notes to Financial Statements – continued | | |
Certain Funds had certain portfolio trades directed to various brokers under a brokerage recapture program. Credits received from the brokerage recapture program are earned and paid on a monthly basis, and are recorded as expense offsets, which serve to reduce the Fund’s overall expense ratio. For the six months ended April 30, 2017, the impact on the expense ratios, if any, were as follows:
| | | | | | | | |
| | | Reduction | | | Expense
Ratio | |
River Road Focused Absolute Value | | $ | 1,738 | | | | 0.021 | % |
Montag & Caldwell Growth | | | 102,965 | | | | 0.019 | % |
River Road Dividend All Cap Value | | | 8,167 | | | | 0.002 | % |
River Road Dividend All Cap Value II | | | 674 | | | | 0.001 | % |
Montag & Caldwell Mid Cap Growth | | | 965 | | | | 0.022 | % |
LMCG Small Cap Growth | | | 8,907 | | | | 0.014 | % |
River Road Select Value | | | 3,504 | | | | 0.018 | % |
River Road Small Cap Value | | | 10,645 | | | | 0.007 | % |
Silvercrest Small Cap | | | 37,507 | | | | 0.031 | % |
GW&K U.S. Small Cap Growth | | | 14,889 | | | | 0.075 | % |
River Road Long-Short | | | 4,356 | | | | 0.020 | % |
Montag & Caldwell Balanced | | | 1,989 | | | | 0.016 | % |
(12) Foreign Securities: Certain Funds invest in securities of foreign entities and in instruments denominated in foreign currencies which involve risks not typically associated with investments in domestic securities. Non-domestic securities carry special risks, such as exposure to currency fluctuations, less developed or less efficient trading markets, political instability, a lack of company information, differing auditing and legal standards, and, potentially, less liquidity. A Fund’s investments in emerging markets countries are exposed to additional risks. A Fund’s performance will be influenced by political, social and economic factors affecting companies in emerging markets countries. Emerging markets countries generally have economic structures that are less diverse and mature, and political systems that are less stable, than those of developed countries. Realized gains in certain countries may be subject to foreign taxes at the Fund level and would pay such foreign taxes at the appropriate rate for each jurisdiction.
(13) Foreign Currency Translation: The books and records of the Funds are maintained in U.S. dollars. The values of investments, assets and liabilities denominated in currencies other than U.S. dollars are translated into U.S. dollars based upon current foreign exchange rates. Purchases and sales of foreign investments, income and expenses are converted into U.S. dollars based on currency exchange rates prevailing on the respective dates of such transactions. Net realized and unrealized gain (loss) on foreign currency transactions represent: (1) foreign exchange gains and losses from the sale and holdings of foreign currencies; (2) gains and losses between trade date and settlement date on investment securities transactions and forward foreign currency contracts; and (3) gains and losses from the difference between amounts of interest and dividends recorded and the amounts actually received.
The Funds do not isolate the net realized and unrealized gain or loss resulting from changes in exchange rates from the fluctuations in market prices of securities held. Such fluctuations are included with the net realized and unrealized gain or loss on investments.
(14) Federal Income Taxes: Each Fund currently qualifies as an investment company and intends to comply with the requirements under Subchapter M of the Internal Revenue Code of 1986, as amended, to distribute substantially all of its taxable income and gains to its shareholders and to meet certain diversification and income requirements with respect to investment companies. Therefore, no provision for federal income or excise tax is included in the accompanying financial statements.
Additionally, based on each Fund’s understanding of the tax rules and rates related to income, gains and transactions for the foreign jurisdictions in which it invests, each Fund will provide for foreign taxes and, where appropriate, deferred foreign taxes.
Management has analyzed the Funds’ tax positions taken on federal income tax returns as of October 31, 2016 and for all open tax years (generally, the three prior taxable years), and has concluded that no provision for federal income tax is required in the Funds’ financial statements. Additionally, Management is not aware of any tax position for which it is reasonably possible that the total amounts of unrecognized tax benefits will change materially in the next twelve months.
Net capital losses incurred may be carried forward for an unlimited time period, and retain their tax character as either short-term or long-term capital losses.
AMG Funds
| | |
| | April 30, 2017 |
| Notes to Financial Statements – continued | | |
At April 30, 2017, the following Funds had accumulated net realized capital loss carryovers from securities transactions for federal income tax purposes as shown in the following chart. These amounts may be used to offset future realized capital gains, if any, through the expiration dates listed or in the case of post-enactment losses, for an unlimited time period.
| | | | | | | | | | | | |
| | | Capital Loss Carryovers: | |
| | | Post Enactment
Short-Term | | | Post Enactment
Long-Term | | | Total | |
Fairpointe Focused Equity | | $ | 138,622 | | | $ | 8,883 | | | $ | 147,505 | |
LMCG Small Cap Growth | | | 30,255,640 | | | | 4,173,478 | | | | 34,429,118 | |
Guardian Capital Global Dividend | | | 247,545 | | | | 57,327 | | | | 304,872 | |
River Road Long-Short | | | 2,659,289 | | | | 450,310 | | | | 3,109,599 | |
(15) Organizational and Offering Costs: The Investment Manager incurred and directly paid organizational and offering costs on behalf of the Value Partners Asia Dividend in the amount of $64,933, which was repaid by the Fund for the full amount thereof. Offering costs in the amount of $7,832 were expensed. Offering costs of $61,441 were amortized on the straight-line method over a period of one year from the commencement of operations.
(16) Commitments and Contingencies: Under the Trust’s organizational documents, its trustees and officers are indemnified against certain liabilities arising out of the performance of their duties to the Trust. In addition, in the normal course of business, the Funds may enter into contracts and agreements that contain a variety of representations and warranties which provide general indemnifications. The maximum exposure to the Funds under these arrangements is unknown, as this would involve future claims that may be made against a Fund that have not yet occurred. However, based on experience, the Funds had no prior claims or losses and expect the risks of loss to be remote.
Note (B) Dividends from Net Investment Income and Distributions of Capital Gains: Dividends and distributions to shareholders are recorded on the ex-dividend date. River Road Dividend All Cap Value, River Road Dividend All Cap Value II and DoubleLine Core Plus Bond distribute dividends from net investment income to shareholders monthly and net realized gains from investment transactions, if any, are generally distributed annually, usually in December.
Guardian Capital Global Dividend, Value Partners Asia Dividend and Montag & Caldwell Balanced distribute dividends from net investment income to shareholders quarterly and net realized gains from investment transactions, if any, are generally distributed annually, usually in December.
The following Funds distribute dividends from net investment income to shareholders annually and net realized gains from investment transactions, if any, are generally distributed annually, usually in December: Fairpointe Focused Equity, River Road
Focused Absolute Value, Montag & Caldwell Growth, Fairpointe Mid Cap, Montag & Caldwell Mid Cap Growth, LMCG Small Cap Growth, River Road Select Value, River Road Small Cap Value, Silvercrest Small Cap, GW&K U.S. Small Cap Growth, Lake Partners LASSO Alternatives, River Road Long-Short and Pictet International.
Distributions are determined in accordance with federal income tax regulations, which may differ from net investment income and net realized capital gains for financial statement purposes (U.S. GAAP). Differences may be permanent or temporary. Permanent differences are reclassified among capital accounts in the financial statements to reflect their tax character. Permanent book and tax basis differences, if any, relating to shareholder distributions will result in reclassifications to paid-in capital. Temporary differences arise when certain items of income, expense and gain or loss are recognized in different periods for financial statement and tax purposes; these differences will reverse at some time in the future. Permanent differences are primarily due to net operating losses, gains/losses not recognized from security sales in connection with redemptions in-kind, expiration of CLCF, paydowns, tax adjustments on passive foreign investment companies sold, redesignation of dividends paid by a fund, distributions received from regulated investment companies, distributions in excess of net investment income paid by a fund, and expenses disallowed for tax purposes. Temporary differences are primarily due to differences between book and tax treatment of losses for excise tax purposes, wash sale loss deferrals, amortization, contribution in-kind, mark-to-market of passive foreign investment companies, gains/losses on foreign currency, and partnerships.
Note (C) Shares of Beneficial Interest: The Trust’s Declaration of Trust authorizes for each Fund the issuance of an unlimited number of shares of beneficial interest, without par value. Each Fund records sales and repurchases of its capital stock on the trade date. The cost of securities contributed to the Funds in connection with the issuance of shares is based on the valuation of those securities in accordance with the Funds’ policy on investment valuation.
AMG Funds
| | |
| | April 30, 2017 |
| Notes to Financial Statements – continued | | |
For the six months ended April 30, 2017 (unaudited) and the fiscal year ended October 31, 2016, the capital stock transactions by class for the Funds were as follows:
| | | | | | | | | | | | | | | | | | | | | | | | | | | | | | | | | | | | | | | | | | | | | | | | |
| | | Fairpointe Focused Equity | | | River Road Focused Absolute Value | | | Montag & Caldwell Growth | |
| | | 2017 | | | 2016 | | | 2017 | | | 2016 (a) | | | 2017 | | | 2016 | |
| | | Shares | | | Amount | | | Shares | | | Amount | | | Shares | | | Amount | | | Shares | | | Amount | | | Shares | | | Amount | | | Shares | | | Amount | |
Class N: | | | | | | | | | | | | | | | | | | | | | | | | | | | | | | | | | | | | | | | | | | | | | | | | |
Proceeds from sale of shares | | | 83,911 | | | $ | 911,797 | | | | 17,363 | | | $ | 149,301 | | | | 67,049 | | | $ | 779,069 | | | | 79,891 | | | $ | 823,215 | (b) | | | 1,225,722 | | | $ | 22,688,589 | | | | 6,885,996 | | | $ | 138,793,971 | |
Reinvestment of distributions | | | 81 | | | | 874 | | | | 2,394 | | | | 21,065 | | | | 6,633 | | | | 74,093 | | | | — | | | | — | | | | 2,190,601 | | | | 38,861,264 | | | | 9,531,891 | | | | 192,258,234 | |
Cost of shares repurchased | | | (62,161 | ) | | | (692,583 | ) | | | (209,166 | ) | | | (2,022,877 | ) | | | (52,081 | ) | | | (593,289 | ) | | | (34,843 | ) | | | (376,833 | ) | | | (9,878,162 | ) | | | (188,543,805 | ) | | | (21,230,999 | ) | | | (438,292,746 | ) |
| | | | | | | | | | | | | | | | | | | | | | | | | | | | | | | | | | | | | | | | | | | | | | | | |
Net increase (decrease) | | | 21,831 | | | $ | 220,088 | | | | (189,409 | ) | | $ | (1,852,511 | ) | | | 21,601 | | | $ | 259,873 | | | | 45,048 | | | $ | 446,382 | | | | (6,461,839 | ) | | $ | (126,993,952 | ) | | | (4,813,112 | ) | | $ | (107,240,541 | ) |
| | | | | | | | | | | | | | | | | | | | | | | | | | | | | | | | | | | | | | | | | | | | | | | | |
Class I: | | | | | | | | | | | | | | | | | | | | | | | | | | | | | | | | | | | | | | | | | | | | | | | | |
Proceeds from sale of shares | | | 173,272 | | | $ | 1,943,690 | | | | 220,622 | | | $ | 2,101,495 | | | | 636,757 | | | $ | 7,243,766 | | | | 1,211,166 | | | $ | 11,864,367 | (b) | | | 3,187,653 | | | $ | 59,565,813 | | | | 16,816,934 | | | $ | 343,661,135 | |
Reinvestment of distributions | | | 6,396 | | | | 68,181 | | | | 5,296 | | | | 46,607 | | | | 81,254 | | | | 908,301 | | | | — | | | | — | | | | 3,487,749 | | | | 61,975,608 | | | | 9,866,673 | | | | 199,997,475 | |
Cost of shares repurchased | | | (301,539 | ) | | | (3,390,535 | ) | | | — | | | | — | | | | (207,325 | ) | | | (2,357,107 | ) | | | (171,275 | ) | | | (1,791,912 | ) | | | (16,312,401 | ) | | | (305,603,276 | ) | | | (35,152,702 | ) | | | (790,240,872 | ) |
| | | | | | | | | | | | | | | | | | | | | | | | | | | | | | | | | | | | | | | | | | | | | | | | |
Net increase (decrease) | | | (121,871 | ) | | $ | (1,378,664 | ) | | | 225,918 | | | $ | 2,148,102 | | | | 510,686 | | | $ | 5,794,960 | | | | 1,039,891 | | | $ | 10,072,455 | | | | (9,636,999 | ) | | $ | (184,061,855 | ) | | | (8,469,095 | ) | | $ | (246,582,262 | ) |
| | | | | | | | | | | | | | | | | | | | | | | | | | | | | | | | | | | | | | | | | | | | | | | | |
Class R: | | | | | | | | | | | | | | | | | | | | | | | | | | | | | | | | | | | | | | | | | | | | | | | | |
Proceeds from sale of shares | | | — | | | | — | | | | — | | | | — | | | | — | | | | — | | | | — | | | | — | | | | 19,235 | | | $ | 349,247 | | | | 61,438 | | | $ | 1,369,978 | |
Reinvestment of distributions | | | — | | | | — | | | | — | | | | — | | | | — | | | | — | | | | — | | | | — | | | | 27,054 | | | | 469,668 | | | | 66,520 | | | | 1,315,758 | |
Cost of shares repurchased | | | — | | | | — | | | | — | | | | — | | | | — | | | | — | | | | — | | | | — | | | | (57,492 | ) | | | (1,057,610 | ) | | | (66,927 | ) | | | (1,452,485 | ) |
| | | | | | | | | | | | | | | | | | | | | | | | | | | | | | | | | | | | | | | | | | | | | | | | |
Net increase (decrease) | | | — | | | | — | | | | — | | | | — | | | | — | | | | — | | | | — | | | | — | | | | (11,203 | ) | | $ | (238,695 | ) | | | 61,031 | | | $ | 1,233,251 | |
| | | | | | | | | | | | | | | | | | | | | | | | | | | | | | | | | | | | | | | | | | | | | | | | |
| | | |
| | | River Road Dividend All Cap Value | | | River Road Dividend All Cap Value II | | | Fairpointe Mid Cap | |
| | | 2017 | | | 2016 | | | 2017 | | | 2016 | | | 2017 | | | 2016 | |
| | | Shares | | | Amount | | | Shares | | | Amount | | | Shares | | | Amount | | | Shares | | | Amount | | | Shares | | | Amount | | | Shares | | | Amount | |
Class N: | | | | | | | | | | | | | | | | | | | | | | | | | | | | | | | | | | | | | | | | | | | | | | | | |
Proceeds from sale of shares | | | 4,891,601 | | | $ | 62,220,502 | | | | 13,306,940 | | | $ | 160,818,056 | | | | 18,179 | | | $ | 262,224 | | | | 54,504 | | | $ | 731,061 | | | | 4,878,784 | | | $ | 206,496,073 | | | | 6,721,809 | | | $ | 235,715,950 | |
Reinvestment of distributions | | | 1,942,998 | | | | 24,183,464 | | | | 2,090,827 | | | | 23,932,444 | | | | 12,323 | | | | 175,195 | | | | 7,583 | | | | 98,773 | | | | 1,525,543 | | | | 63,599,870 | | | | 2,786,316 | | | | 96,573,724 | |
Cost of shares repurchased | | | (4,445,447 | ) | | | (55,932,657 | ) | | | (8,055,733 | ) | | | (95,895,185 | ) | | | (27,861 | ) | | | (400,166 | ) | | | (36,513 | ) | | | (472,861 | ) | | | (6,596,984 | ) | | | (278,660,080 | ) | | | (22,391,843 | ) | | | (793,563,705 | ) |
| | | | | | | | | | | | | | | | | | | | | | | | | | | | | | | | | | | | | | | | | | | | | | | | |
Net increase (decrease) | | | 2,389,152 | | | $ | 30,471,309 | | | | 7,342,034 | | | $ | 88,855,315 | | | | 2,641 | | | $ | 37,253 | | | | 25,574 | | | $ | 356,973 | | | | (192,657 | ) | | $ | (8,564,137 | ) | | | (12,883,718 | ) | | $ | (461,274,031 | ) |
| | | | | | | | | | | | | | | | | | | | | | | | | | | | | | | | | | | | | | | | | | | | | | | | |
Class I: | | | | | | | | | | | | | | | | | | | | | | | | | | | | | | | | | | | | | | | | | | | | | | | | |
Proceeds from sale of shares | | | 7,920,999 | | | $ | 99,846,305 | | | | 11,327,948 | | | $ | 136,478,192 | | | | 685,375 | | | $ | 9,827,948 | | | | 1,028,192 | | | $ | 13,465,509 | | | | 10,606,048 | | | $ | 461,331,599 | | | | 18,281,929 | | | $ | 662,488,962 | |
Reinvestment of distributions | | | 3,378,796 | | | | 42,029,006 | | | | 4,402,905 | | | | 50,321,034 | | | | 411,133 | | | | 5,850,777 | | | | 288,126 | | | | 3,759,968 | | | | 2,326,071 | | | | 99,113,891 | | | | 3,759,518 | | | | 133,199,701 | |
Cost of shares repurchased | | | (6,774,561 | ) | | | (85,889,931 | ) | | | (20,268,357 | ) | | | (241,076,892 | ) | | | (1,125,188 | ) | | | (16,152,495 | ) | | | (2,187,747 | ) | | | (28,400,388 | ) | | | (10,092,101 | ) | | | (434,757,586 | ) | | | (40,242,836 | ) | | | (1,421,123,304 | ) |
| | | | | | | | | | | | | | | | | | | | | | | | | | | | | | | | | | | | | | | | | | | | | | | | |
Net increase (decrease) | | | 4,525,234 | | | $ | 55,985,380 | | | | (4,537,504 | ) | | $ | (54,277,666 | ) | | | (28,680 | ) | | $ | (473,770 | ) | | | (871,429 | ) | | $ | (11,174,911 | ) | | | 2,840,018 | | | $ | 125,687,904 | | | | (18,201,389 | ) | | $ | (625,434,641 | ) |
| | | | | | | | | | | | | | | | | | | | | | | | | | | | | | | | | | | | | | | | | | | | | | | | |
| | | |
| | | Montag & Caldwell Mid Cap Growth | | | LMCG Small Cap Growth | | | River Road Select Value | |
| | | 2017 | | | 2016 | | | 2017 | | | 2016 | | | 2017 | | | 2016 | |
| | | Shares | | | Amount | | | Shares | | | Amount | | | Shares | | | Amount | | | Shares | | | Amount | | | Shares | | | Amount | | | Shares | | | Amount | |
Class N: | | | | | | | | | | | | | | | | | | | | | | | | | | | | | | | | | | | | | | | | | | | | | | | | |
Proceeds from sale of shares | | | 8,185 | | | $ | 82,588 | | | | 12,426 | | | $ | 122,976 | | | | 143,723 | | | $ | 1,972,208 | | | | 1,114,051 | | | $ | 14,417,787 | | | | 48,512 | | | $ | 366,019 | | | | 141,827 | | | $ | 960,698 | |
Reinvestment of distributions | | | 31,174 | | | | 308,929 | | | | 53,656 | | | | 553,193 | | | | — | | | | — | | | | 1,863 | | | | 26,618 | | | | 47,035 | | | | 349,944 | | | | 100,813 | | | | 635,124 | |
Cost of shares repurchased | | | (25,129 | ) | | | (260,809 | ) | | | (74,744 | ) | | | (736,302 | ) | | | (1,096,983 | ) | | | (14,952,088 | ) | | | (7,368,417 | ) | | | (92,674,265 | ) | | | (130,771 | ) | | | (983,713 | ) | | | (200,434 | ) | | | (1,392,341 | ) |
| | | | | | | | | | | | | | | | | | | | | | | | | | | | | | | | | | | | | | | | | | | | | | | | |
Net increase (decrease) | | | 14,230 | | | $ | 130,708 | | | | (8,662 | ) | | $ | (60,133 | ) | | | (953,260 | ) | | $ | (12,979,880 | ) | | | (6,252,503 | ) | | $ | (78,229,860 | ) | | | (35,224 | ) | | $ | (267,750 | ) | | | 42,206 | | | $ | 203,481 | |
| | | | | | | | | | | | | | | | | | | | | | | | | | | | | | | | | | | | | | | | | | | | | | | | |
Class I: | | | | | | | | | | | | | | | | | | | | | | | | | | | | | | | | | | | | | | | | | | | | | | | | |
Proceeds from sale of shares | | | 15,388 | | | $ | 158,373 | | | | 11,713 | | | $ | 120,040 | | | | 2,581,115 | | | $ | 35,320,033 | | | | 3,981,494 | | | $ | 51,076,318 | | | | 109,822 | | | $ | 838,510 | | | | 412,100 | | | $ | 2,938,365 | |
Reinvestment of distributions | | | 31,625 | | | | 314,672 | | | | 67,037 | | | | 693,830 | | | | — | | | | — | | | | 738 | | | | 10,674 | | | | 356,000 | | | | 2,691,359 | | | | 1,133,203 | | | | 7,252,502 | |
Cost of shares repurchased | | | (11,333 | ) | | | (114,620 | ) | | | (221,127 | ) | | | (2,325,128 | ) | | | (1,498,072 | ) | | | (20,541,111 | ) | | | (4,547,748 | ) | | | (58,946,860 | ) | | | (905,296 | ) | | | (7,046,874 | ) | | | (8,536,883 | ) | | | (61,806,449 | ) |
| | | | | | | | | | | | | | | | | | | | | | | | | | | | | | | | | | | | | | | | | | | | | | | | |
Net increase (decrease) | | | 35,680 | | | $ | 358,425 | | | | (142,377 | ) | | $ | (1,511,258 | ) | | | 1,083,043 | | | $ | 14,778,922 | | | | (565,516 | ) | | $ | (7,859,868 | ) | | | (439,474 | ) | | $ | (3,517,005 | ) | | | (6,991,580 | ) | | $ | (51,615,582 | ) |
| | | | | | | | | | | | | | | | | | | | | | | | | | | | | | | | | | | | | | | | | | | | | | | | |
AMG Funds
| | |
| | April 30, 2017 |
| Notes to Financial Statements – continued | | |
| | | | | | | | | | | | | | | | | | | | | | | | | | | | | | | | | | | | | | | | | | | | | | | | |
| | | River Road Small Cap Value | | | Silvercrest Small Cap | | | GW&K U.S. Small Cap Growth | |
| | | 2017 | | | 2016 | | | 2017 | | | 2016 | | | 2017 | | | 2016 | |
| | | Shares | | | Amount | | | Shares | | | Amount | | | Shares | | | Amount | | | Shares | | | Amount | | | Shares | | | Amount | | | Shares | | | Amount | |
Class N: | | | | | | | | | | | | | | | | | | | | | | | | | | | | | | | | | | | | | | | | | | | | | | | | |
Proceeds from sale of shares | | | 525,668 | | | $ | 7,062,125 | | | | 471,028 | | | $ | 5,575,217 | | | | 405,788 | | | $ | 7,022,597 | | | | 361,591 | | | $ | 5,273,540 | | | | 596,965 | | | $ | 2,357,684 | | | | 1,153,211 | | | $ | 7,338,783 | |
Reinvestment of distributions | | | 89,002 | | | | 1,200,640 | | | | 114,605 | | | | 1,280,134 | | | | 9,537 | | | | 172,909 | | | | 55,211 | | | | 784,554 | | | | 11,295 | | | | 43,938 | | | | 10,933,982 | | | | 56,843,888 | |
Cost of shares repurchased | | | (337,371 | ) | | | (4,539,182 | ) | | | (884,374 | ) | | | (10,279,537 | ) | | | (265,831 | ) | | | (4,689,772 | ) | | | (359,930 | ) | | | (5,188,836 | ) | | | (2,473,858 | ) | | | (9,781,819 | ) | | | (16,404,588 | ) | | | (207,677,409 | ) |
| | | | | | | | | | | | | | | | | | | | | | | | | | | | | | | | | | | | | | | | | | | | | | | | |
Net increase (decrease) | | | 277,299 | | | $ | 3,723,583 | | | | (298,741 | ) | | $ | (3,424,186 | ) | | | 149,494 | | | $ | 2,505,734 | | | | 56,872 | | | $ | 869,258 | | | | (1,865,598 | ) | | $ | (7,380,197 | ) | | | (4,317,395 | ) | | $ | (143,494,738 | ) |
| | | | | | | | | | | | | | | | | | | | | | | | | | | | | | | | | | | | | | | | | | | | | | | | |
Class I: | | | | | | | | | | | | | | | | | | | | | | | | | | | | | | | | | | | | | | | | | | | | | | | | |
Proceeds from sale of shares | | | 2,154,846 | | | $ | 29,368,464 | | | | 3,313,689 | | | $ | 38,510,584 | | | | 2,668,093 | | | $ | 46,922,519 | | | | 3,803,977 | | | $ | 55,865,834 | | | | 89,352 | | | $ | 412,637 | | | | 2,555,143 | | | $ | 28,714,382 | |
Reinvestment of distributions | | | 928,654 | | | | 12,685,426 | | | | 1,196,902 | | | | 13,501,050 | | | | 113,141 | | | | 2,064,810 | | | | 425,913 | | | | 6,090,561 | | | | 2,888 | | | | 13,402 | | | | 14,542,368 | | | | 88,178,272 | |
Cost of shares repurchased | | | (3,599,442 | ) | | | (48,825,684 | ) | | | (4,595,113 | ) | | | (53,647,832 | ) | | | (1,888,323 | ) | | | (33,647,380 | ) | | | (2,034,956 | ) | | | (29,716,304 | ) | | | (966,491 | ) | | | (4,534,548 | ) | | | (30,445,627 | ) | | | (306,125,519 | )(c) |
| | | | | | | | | | | | | | | | | | | | | | | | | | | | | | | | | | | | | | | | | | | | | | | | |
Net increase (decrease) | | | (515,942 | ) | | $ | (6,771,794 | ) | | | (84,522 | ) | | $ | (1,636,198 | ) | | | 892,911 | | | $ | 15,339,949 | | | | 2,194,934 | | | $ | 32,240,091 | | | | (874,251 | ) | | $ | (4,108,509 | ) | | | (13,348,116 | ) | | $ | (189,232,865 | ) |
| | | | | | | | | | | | | | | | | | | | | | | | | | | | | | | | | | | | | | | | | | | | | | | | |
Class Z: (d) | | | | | | | | | | | | | | | | | | | | | | | | | | | | | | | | | | | | | | | | | | | | | | | | |
Proceeds from sale of shares | | | — | | | | — | | | | — | | | | — | | | | — | | | | — | | | | — | | | | — | | | | 35,771 | | | $ | 172,252 | | | | — | | | | — | |
Reinvestment of distributions | | | — | | | | — | | | | — | | | | — | | | | — | | | | — | | | | — | | | | — | | | | — | | | | — | | | | — | | | | — | |
Cost of shares repurchased | | | — | | | | — | | | | — | | | | — | | | | — | | | | — | | | | — | | | | — | | | | (10,301 | ) | | | (49,344 | ) | | | — | | | | — | |
| | | | | | | | | | | | | | | | | | | | | | | | | | | | | | | | | | | | | | | | | | | | | | | | |
Net increase | | | — | | | | — | | | | — | | | | — | | | | | | | | — | | | | — | | | | — | | | | 25,470 | | | $ | 122,908 | | | | — | | | | — | |
| | | | | | | | | | | | | | | | | | | | | | | | | | | | | | | | | | | | | | | | | | | | | | | | |
| | | |
| | | DoubleLine Core Plus Bond | | | Lake Partners LASSO Alternatives | | | River Road Long-Short | |
| | | 2017 | | | 2016 | | | 2017 | | | 2016 | | | 2017 | | | 2016 | |
| | | Shares | | | Amount | | | Shares | | | Amount | | | Shares | | | Amount | | | Shares | | | Amount | | | Shares | | | Amount | | | Shares | | | Amount | |
Class N: | | | | | | | | | | | | | | | | | | | | | | | | | | | | | | | | | | | | | | | | | | | | | | | | |
Proceeds from sale of shares | | | 4,128,059 | | | $ | 43,617,524 | | | | 22,657,884 | | | $ | 238,831,911 | | | | 246,279 | | | $ | 2,964,453 | | | | 489,315 | | | $ | 5,828,383 | | | | 103,189 | | | $ | 1,198,993 | | | | 104,231 | | | $ | 1,143,023 | |
Reinvestment of distributions | | | 486,047 | | | | 5,108,984 | | | | 783,701 | | | | 8,367,108 | | | | 10,180 | | | | 122,769 | | | | 206,436 | | | | 2,444,199 | | | | — | | | | — | | | | 61,918 | | | | 683,579 | |
Cost of shares repurchased | | | (14,094,239 | ) | | | (148,873,425 | ) | | | (12,532,368 | ) | | | (133,778,257 | ) | | | (925,994 | ) | | | (11,082,077 | ) | | | (1,121,075 | ) | | | (13,344,999 | ) | | | (275,498 | ) | | | (3,184,455 | ) | | | (1,814,546 | ) | | | (19,872,053 | ) |
| | | | | | | | | | | | | | | | | | | | | | | | | | | | | | | | | | | | | | | | | | | | | | | | |
Net increase (decrease) | | | (9,480,133 | ) | | $ | (100,146,917 | ) | | | 10,909,217 | | | $ | 113,420,762 | | | | (669,535 | ) | | $ | (7,994,855 | ) | | | (425,324 | ) | | $ | (5,072,417 | ) | | | (172,309 | ) | | $ | (1,985,462 | ) | | | (1,648,397 | ) | | $ | (18,045,451 | ) |
| | | | | | | | | | | | | | | | | | | | | | | | | | | | | | | | | | | | | | | | | | | | | | | | |
Class I: | | | | | | | | | | | | | | | | | | | | | | | | | | | | | | | | | | | | | | | | | | | | | | | | |
Proceeds from sale of shares | | | 11,539,882 | | | $ | 121,995,560 | | | | 20,257,212 | | | $ | 215,384,722 | | | | 791,113 | | | $ | 9,491,997 | | | | 1,608,291 | | | $ | 19,329,625 | | | | 451,024 | | | $ | 5,283,071 | | | | 2,591,251 | | | $ | 28,866,703 | |
Reinvestment of distributions | | | 721,536 | | | | 7,588,219 | | | | 977,499 | | | | 10,425,030 | | | | 10,176 | | | | 123,226 | | | | 384,769 | | | | 4,563,357 | | | | — | | | | — | | | | 102,909 | | | | 1,144,342 | |
Cost of shares repurchased | | | (8,920,809 | ) | | | (94,425,030 | ) | | | (12,902,219 | ) | | | (138,104,461 | ) | | | (2,268,226 | ) | | | (27,332,778 | ) | | | (9,289,112 | ) | | | (111,785,166 | ) | | | (1,173,254 | ) | | | (13,698,840 | ) | | | (3,571,926 | ) | | | (39,835,881 | ) |
| | | | | | | | | | | | | | | | | | | | | | | | | | | | | | | | | | | | | | | | | | | | | | | | |
Net increase (decrease) | | | 3,340,609 | | | $ | 35,158,749 | | | | 8,332,492 | | | $ | 87,705,291 | | | | (1,466,937 | ) | | $ | (17,717,555 | ) | | | (7,296,052 | ) | | $ | (87,892,184 | ) | | | (722,230 | ) | | $ | (8,415,769 | ) | | | (877,766 | ) | | $ | (9,824,836 | ) |
| | | | | | | | | | | | | | | | | | | | | | | | | | | | | | | | | | | | | | | | | | | | | | | | |
| | | |
| | | Guardian Capital Global Dividend | | | Pictet International | | | Value Partners Asia Dividend | |
| | | 2017 | | | 2016 | | | 2017 | | | 2016 | | | 2017 | | | 2016(f) | |
| | | Shares | | | Amount | | | Shares | | | Amount | | | Shares | | | Amount | | | Shares | | | Amount | | | Shares | | | Amount | | | Shares | | | Amount | |
Class N: | | | | | | | | | | | | | | | | | | | | | | | | | | | | | | | | | | | | | | | | | | | | | | | | |
Proceeds from sale of shares | | | 353 | | | $ | 3,570 | | | | 1,166 | | | $ | 11,595 | | | | 16,173 | | | $ | 154,612 | | | | 7,362 | | | $ | 68,989 | | | | 7,632 | | | $ | 83,281 | | | | 75,011 | | | $ | 750,122 | |
Reinvestment of distributions | | | 14 | | | | 140 | | | | 69 | | | | 692 | | | | 396 | | | | 3,668 | | | | 97 | | | | 915 | | | | 2,662 | | | | 26,006 | | | | 1,033 | | | | 10,659 | |
Cost of shares repurchased | | | (101,786 | ) | | | (1,064,621 | ) | | | (409 | ) | | | (3,920 | ) | | | (2,604 | ) | | | (25,065 | ) | | | (104,219 | ) | | | (979,005 | ) | | | (1,046 | ) | | | (11,586 | ) | | | (1 | ) | | | (11 | ) |
Capital contribution | | | — | | | | — | | | | — | | | | — | | | | — | | | | — | | | | — | | | | 96 | (e) | | | — | | | | — | | | | — | | | | — | |
| | | | | | | | | | | | | | | | | | | | | | | | | | | | | | | | | | | | | | | | | | | | | | | | |
Net increase (decrease) | | | (101,419 | ) | | $ | (1,060,911 | ) | | | 826 | | | $ | 8,367 | | | | 13,965 | | | $ | 133,215 | | | | (96,760 | ) | | $ | (909,005 | ) | | | 9,248 | | | $ | 97,701 | | | | 76,043 | | | $ | 760,770 | |
| | | | | | | | | | | | | | | | | | | | | | | | | | | | | | | | | | | | | | | | | | | | | | | | |
Class I: | | | | | | | | | | | | | | | | | | | | | | | | | | | | | | | | | | | | | | | | | | | | | | | | |
Proceeds from sale of shares | | | 303,365 | | | $ | 3,210,794 | | | | 2,574,130 | | | $ | 24,999,875 | | | | 29,782,564 | | | $ | 286,604,181 | | | | 146,143,544 | | | $ | 1,339,299,965 | | | | — | | | | — | | | | 675,001 | | | $ | 6,750,010 | |
Reinvestment of distributions | | | 20,014 | | | | 204,918 | | | | 6,791 | | | | 67,637 | | | | 1,273,736 | | | | 11,756,504 | | | | 7,456 | | | | 70,238 | | | | 23,903 | | | $ | 233,535 | | | | 10,194 | | | | 105,120 | |
Cost of shares repurchased | | | (3,967 | ) | | | (41,587 | ) | | | (1,319 | ) | | | (12,858 | ) | | | (12,864,648 | ) | | | (124,320,005 | ) | | | (12,838,794 | ) | | | (121,477,160 | ) | | | — | | | | — | | | | (1 | ) | | | (11 | ) |
Capital contribution | | | — | | | | — | | | | — | | | | — | | | | — | | | | — | | | | — | | | | 619,078 | (e) | | | — | | | | — | | | | — | | | | — | |
| | | | | | | | | | | | | | | | | | | | | | | | | | | | | | | | | | | | | | | | | | | | | | | | |
Net increase | | | 319,412 | | | $ | 3,374,125 | | | | 2,579,602 | | | $ | 25,054,654 | | | | 18,191,652 | | | $ | 174,040,680 | | | | 133,312,206 | | | $ | 1,218,512,121 | | | | 23,903 | | | $ | 233,535 | | | | 685,194 | | | $ | 6,855,119 | |
| | | | | | | | | | | | | | | | | | | | | | | | | | | | | | | | | | | | | | | | | | | | | | | | |
| | | | | | | | | | | | | | | | |
| | | Montag & Caldwell Balanced | |
| | | 2017 | | | 2016 | |
| | | Shares | | | Amount | | | Shares | | | Amount | |
Class N: | | | | | | | | | | | | | | | | |
Proceeds from sale of shares | | | 32,825 | | | $ | 705,628 | | | | 813,318 | | | $ | 18,188,595 | |
Reinvestment of distributions | | | 94,670 | | | | 1,937,879 | | | | 58,085 | | | | 1,325,502 | |
Cost of shares repurchased | | | (287,050 | ) | | | (6,148,046 | ) | | | (864,228 | ) | | | (19,777,162 | ) |
| | | | | | | | | | | | | | | | |
Net increase (decrease) | | | (159,555 | ) | | $ | (3,504,539 | ) | | | 7,175 | | | $ | (263,065 | ) |
| | | | | | | | | | | | | | | | |
Class I: | | | | | | | | | | | | | | | | |
Proceeds from sale of shares | | | 8,938 | | | $ | 186,351 | | | | 54,898 | | | $ | 1,259,171 | |
Reinvestment of distributions | | | 7,861 | | | | 160,352 | | | | 4,977 | | | | 113,182 | |
Cost of shares repurchased | | | (29,286 | ) | | | (627,167 | ) | | | (70,649 | ) | | | (1,615,105 | ) |
| | | | | | | | | | | | | | | | |
Net decrease | | | (12,487 | ) | | $ | (280,464 | ) | | | (10,774 | ) | | $ | (242,752 | ) |
| | | | | | | | | | | | | | | | |
| (a) | The commencement of investment operations for River Road Focused Absolute Value was November 3, 2015. |
| (b) | River Road Focused Absolute Value had a subscription in-kind in the amount of $3,663,463 on November 3, 2015. The subscription was comprised of securities, cash and dividends accrued in the amounts of $3,632,219, $26,056 and $5,188, respectively. |
| (c) | GW&K U.S. Small Cap Growth had a redemption in-kind on December 1, 2015, in the amount of $142,509,610. The redemption was comprised of securities and cash in the amount of $134,464,305 and $8,045,305, respectively. |
| (d) | The commencement of investment operations for the GW&K U.S. Small Cap Growth Class Z was February 27, 2017. |
| (e) | See Note (F) Agreements and Transactions With Affiliates. |
| (f) | The commencement of investment operations for the Value Partners Asia Dividend was December 16, 2015. |
AMG Funds
| | |
| | April 30, 2017 |
| Notes to Financial Statements – continued | | |
At April 30, 2017, certain affiliated and unaffiliated shareholders of record, including omnibus accounts, individually or collectively held greater than 10% of the net assets of the Funds as follows:
| | | | | | | | | | | | | | | | | | |
| | | Number of
Shareholders | | | Collectively
Own | | | | | Number of
Shareholders | | | Collectively
Own | |
Fairpointe Focused Equity | | | 2 | | | | 85 | % | | Silvercrest Small Cap | | | 3 | | | | 48 | % |
River Road Focused Absolute Value | | | 2 | | | | 83 | % | | GW&K U.S. Small Cap Growth | | | 2 | | | | 37 | % |
Montag & Caldwell Growth | | | 3 | | | | 55 | % | | DoubleLine Core Plus Bond | | | 2 | | | | 60 | % |
River Road Dividend All Cap Value | | | 3 | | | | 66 | % | | Lake Partners LASSO Alternatives | | | 3 | | | | 70 | % |
River Road Dividend All Cap Value II | | | 3 | | | | 80 | % | | River Road Long-Short | | | 3 | | | | 81 | % |
Fairpointe Mid Cap | | | 3 | | | | 60 | % | | Guardian Capital Global Dividend | | | 2 | | | | 90 | % |
Montag & Caldwell Mid Cap Growth | | | 4 | | | | 76 | % | | Pictet International | | | 1 | | | | 18 | % |
LMCG Small Cap Growth | | | 3 | | | | 51 | % | | Value Partners Asia Dividend | | | 1 | | | | 99 | % |
River Road Select Value | | | 4 | | | | 77 | % | | Montag & Caldwell Balanced | | | 1 | | | | 11 | % |
River Road Small Cap Value | | | 3 | | | | 79 | % | | | | | | | | | | |
Transactions by these shareholders may have a material impact on their respective Fund.
Note (D) Investment Transactions: Purchases and proceeds from sales and maturities of investment securities (other than short-term investments) for the six months ended April 30, 2017 were as follows:
| | | | | | | | | | | | | | | | |
| | | Aggregate Purchases | | | Proceeds from Sales | |
| | | U.S. Government | | | Other | | | U.S. Government | | | Other | |
Fairpointe Focused Equity | | $ | — | | | $ | 1,689,192 | | | $ | — | | | $ | 2,997,206 | |
River Road Focused Absolute Value | | | — | | | | 15,605,051 | | | | — | | | | 10,619,093 | |
Montag & Caldwell Growth | | | — | | | | 264,818,295 | | | | — | | | | 625,957,946 | |
River Road Dividend All Cap Value | | | — | | | | 153,176,057 | | | | — | | | | 135,193,339 | |
River Road Dividend All Cap Value II | | | — | | | | 19,537,942 | | | | — | | | | 24,274,483 | |
Fairpointe Mid Cap | | | — | | | | 632,275,857 | | | | — | | | | 787,293,674 | |
Montage & Caldwell Mid Cap Growth | | | — | | | | 2,678,056 | | | | — | | | | 2,609,263 | |
LMCG Small Cap Growth | | | — | | | | 86,702,768 | | | | — | | | | 89,208,190 | |
River Road Select Value | | | — | | | | 11,050,224 | | | | — | | | | 17,267,532 | |
River Road Small Cap Value | | | — | | | | 67,204,509 | | | | — | | | | 80,534,037 | |
Silvercrest Small Cap | | | — | | | | 51,982,406 | | | | — | | | | 33,159,700 | |
GW&K U.S. Small Cap Growth | | | — | | | | 3,146,514 | | | | — | | | | 14,697,193 | |
DoubleLine Core Plus Bond | | | 168,065,098 | | | | 141,942,742 | | | | 224,609,006 | | | | 141,891,410 | |
Lake Partners LASSO Alternative | | | — | | | | 14,530,914 | | | | — | | | | 36,758,439 | |
River Road Long-Short | | | — | | | | 39,238,820 | | | | — | | | | 55,022,599 | |
Guardian Capital Global Dividend | | | — | | | | 8,922,738 | | | | — | | | | 7,340,461 | |
Pictet International | | | — | | | | 398,237,981 | | | | — | | | | 284,243,314 | |
Value Partners Asia Dividend | | | — | | | | 2,731,868 | | | | — | | | | 2,704,608 | |
Montag & Caldwell Balanced | | | 240,791 | | | | 4,769,916 | | | | 764,920 | | | | 10,033,605 | |
Note (E) Redemption Fees: In accordance with the prospectus, certain Funds may assess a redemption fee on a Fund’s share redemptions and exchanges within specified time periods. The redemption fees are indicated in the following table for the six months ended April 30, 2017 and are included in the Cost of Shares Repurchased in the Statements of Changes in Net Assets:
| | | | | | | | |
Fund Name | | Time Period | | | Amount | |
Pictet International | | | 2% Within 90 Days | | | $ | 8,344 | |
Value Partners Asia Dividend | | | 2% Within 90 Days | | | | 207 | |
Note (F) Agreements and Transactions with Affiliates: For each of the Funds, the Trust has entered into an investment advisory agreement under which the Investment Manager, a subsidiary and the U.S. retail distribution arm of Affiliated Managers Group, Inc. (“AMG”), serves as investment manager to the Funds and is responsible for the Funds’ overall administration and operations. The Investment Manager selects one or more subadvisors for the Funds (subject to Board approval) and monitors each subadvisor’s investment performance, security holdings and investment strategies. The investment portfolios of River Road Focused Absolute Value, River Road Dividend All Cap Value, River Road Dividend All Cap Value II, River Road Select Value, River Road Small Cap Value and River Road Long-Short are managed by River Road Asset Management, LLC. The investment portfolio of GW&K U.S. Small Cap Growth is managed by GW&K Investment Management, LLC. AMG indirectly owns a majority interest in River Road Asset Management, LLC and GW&K Investment Management, LLC. The investment portfolio of Value Partners Asia Dividend is managed by Value Partners Hong Kong Limited. AMG indirectly owns a minority interest in Value Partners Hong Kong Limited. Prior to October 1, 2016, Aston Asset Management, LLC (“Aston”), a wholly-owned subsidiary of the Investment Manager, served as investment manager to each of the Funds under a similar investment management agreement. On October 1, 2016, Aston merged with and into the Investment Manager.
AMG Funds
| | |
| | April 30, 2017 |
| Notes to Financial Statements – continued | | |
Investment management fees are paid directly by the Funds to the Investment Manager based on average daily net assets. The investment management fee rates are reflected in the table below.
The Investment Manager is contractually obligated to waive management fees and/or reimburse ordinary operating expenses, not including interest, taxes, brokerage commissions, other investment-related costs, shareholder servicing fees, distribution and service (12b-1) fees, extraordinary expenses, such as litigation and other expenses not incurred in the ordinary course of the Fund’s business, and acquired fund fees and expenses, through February 28, 2018, to the extent that operating expenses exceed the expense cap (as shown in the table below) based on the Fund’s average daily net assets (the “Operating Expense Limit”). Prior to February 28, 2018, the arrangement may be amended or terminated only by a vote of the Board.
The investment management fees and contractual expense limitations for the six months ended April 30, 2017 were as follows:
| | | | | | | | | | | | | | | | |
| | | | | | | | | | Contractual | |
| | | | | Investment | | | | | Expense Limitations | |
| | | Investment | | Management Fees Prior to | | Contractual | | | Prior to 10/01/2016 | |
Fund Name | | Management Fees | | 10/1/2016 | | Expense Limitation (a) | | | Class N | | | Class I | |
Fairpointe Focused Equity | | 0.70% | | 0.80% | | | 0.82 | % | | | 1.15 | % | | | 0.90 | % |
River Road Focused Absolute Value (b) | | 0.60% | | 0.70% | | | 0.71 | % | | | 1.00 | % | | | 0.75 | % |
Montag & Caldwell Growth | | 0.70% on first $800,000,000 | | 0.80% on first $800,000,000 | | | | | | | | | | | | |
| | 0.50% over $800,000,000 | | 0.60% over $800,000,000 up to $6 billion | | | | | | | | | | | | |
| | 0.45% over $6 billion up to $12 billion | | 0.55% over $6 billion up to $12 billion | | | | | | | | | | | | |
| | 0.40% over $12 billion | | 0.50% over $12 billion | | | N/A | | | | N/A | | | | N/A | |
River Road Dividend All Cap Value | | 0.60% | | 0.70% | | | 0.99 | % | | | 1.30 | % | | | 1.05 | % |
River Road Dividend All Cap Value II | | 0.60% | | 0.70% | | | 0.99 | % | | | 1.30 | % | | | 1.05 | % |
Fairpointe Mid Cap | | 0.70% on first $100,000,000 | | 0.80% on first $100,000,000 | | | | | | | | | | | | |
| | 0.65% next $300,000,000 | | 0.75% next $300,000,000 | | | | | | | | | | | | |
| | 0.60% over $400,000,000 | | 0.70% over $400,000,000 | | | N/A | | | | N/A | | | | N/A | |
Montag & Caldwell Mid Cap Growth | | 0.75% | | 0.85% | | | 0.95 | % | | | 1.25 | % | | | 1.00 | % |
LMCG Small Cap Growth | | 0.90% | | 1.00% | | | 1.03 | % | | | 1.35 | % | | | 1.10 | % |
River Road Select Value | | 0.75%(c) | | 1.00% | | | 1.04 | %(c) | | | 1.50 | % | | | 1.25 | % |
River Road Small Cap Value | | 0.80% | | 0.90% | | | N/A | | | | N/A | | | | N/A | |
Silvercrest Small Cap | | 0.90% | | 1.00% | | | 1.08 | % | | | 1.40 | % | | | 1.15 | % |
GW&K U.S. Small Cap Growth (d) | | 0.70%(e) | | 0.90% | | | 0.90 | %(e) | | | 1.35 | % | | | 1.10 | % |
DoubleLine Core Plus Bond | | 0.45% | | 0.55% | | | 0.61 | % | | | 0.94 | % | | | 0.69 | % |
Lake Partners LASSO Alternatives | | 0.90% | | 1.00% | | | 1.09 | % | | | 1.40 | % | | | 1.15 | % |
River Road Long-Short | | 0.85%(f) | | 1.20% | | | 1.12 | %(f) | | | 1.70 | % | | | 1.45 | % |
Guardian Capital Global Dividend | | 0.70% | | 0.80% | | | 1.05 | % | | | 1.30 | % | | | 1.05 | % |
Pictet International | | 0.80% | | 0.90% | | | 1.08 | % | | | 1.40 | % | | | 1.15 | % |
Value Partners Asia Dividend (g) | | 0.80% | | 0.90% | | | 1.15 | % | | | 1.40 | % | | | 1.15 | % |
Montag & Caldwell Balanced | | 0.65% | | 0.75% | | | 1.04 | % | | | 1.35 | % | | | 1.10 | % |
| (a) | The expense limitation is at the fund level and excludes shareholder servicing fees and 12b-1 fees. |
| (b) | The commencement of investment operations for River Road Focused Absolute Value was November 3, 2015. |
| (c) | Prior to January 1, 2017, the investment management fee and Operating Expense Limit was 0.90% and 1.19%, respectively. |
| (d) | Effective January 12, 2016, the Investment Manager has agreed to a contractual expense limitation. |
| (e) | Prior to February 27, 2017, the investment management fee and Operating Expense Limit was 0.80% and 1.03%, respectively. |
| (f) | Prior to January 1, 2017, the investment management fee and Operating Expense Limit was 1.10% and 1.37%, respectively. |
| (g) | The commencement of investment operations for Value Partners Asia Dividend was December 16, 2015. |
For a period of up to three years from the end of the fiscal year during which fees were waived or expenses were reimbursed (the “Recovery Period”), the Investment Manager is entitled to be reimbursed by the Fund for such fees waived and expenses reimbursed from the commencement of operations through the completion of the first three full fiscal years to the extent that the Fund’s total annual operating expenses, not including
interest, taxes, brokerage commissions, other investment-related costs, shareholder servicing fees, distribution and service (12b-1) fees, extraordinary expenses, such as litigation and other expenses not incurred in the ordinary course of the Fund’s business, and acquired fund fees and expenses, are at or below the Operating Expense Limit during the Recovery Period.
AMG Funds
| | |
| | April 30, 2017 |
| Notes to Financial Statements – continued | | |
The cumulative reimbursement amounts as of April 30, 2017 that are entitled to be recouped for each Fund are as follows:
| | | | | | | | | | | | | | | | |
| | | Expiration | |
| | | 2017 | | | 2018 | | | 2019 | | | 2020 | |
Fairpointe Focused Equity | | | N/A | | | $ | 128,683 | | | $ | 103,052 | | | $ | 36,142 | |
River Road Focused Absolute Value | | | N/A | | | | N/A | | | | 170,129 | | | | 31,838 | |
River Road Dividend All Cap Value II | | | — | | | | — | | | | N/A | | | | N/A | |
LMCG Small Cap Growth | | $ | 131,012 | | | | N/A | | | | N/A | | | | N/A | |
Silvercrest Small Cap | | | 108,554 | | | | 77,805 | | | | N/A | | | | N/A | |
DoubleLine Core Plus Bond | | | 183,865 | | | | N/A | | | | N/A | | | | N/A | |
River Road Long-Short | | | — | | | | N/A | | | | N/A | | | | N/A | |
Guardian Capital Global Dividend | | | 89,764 | | | | 122,164 | | | | 96,649 | | | | 7,469 | |
Pictet International | | | — | | | | — | | | | — | | | | — | |
Value Partners Asia Dividend | | | N/A | | | | N/A | | | | 186,218 | | | | 52,365 | |
Through the six months ended April 30, 2017, the Investment Manager recaptured prior year fee waivers and expense reimbursements of $120,411 from Pictet International.
During the fiscal year ended October 31, 2016, the following Fund was reimbursed by the Investment Manager and its subadviser for losses incurred on executed transactions not meeting the Fund’s investment guidelines and the cost of correcting the Fund’s net asset value:
| | | | |
| | | Capital Contribution | |
Pictet International | | $ | 619,174 | |
Administration. The Trust, on behalf of the Funds, has entered into an amended and restated Administration Agreement under which the Investment Manager serves as the Funds’ administrator (the “Administrator”) and is responsible for all non-portfolio management aspects of managing the Funds’ operations, including administration and shareholder services to each Fund, as further described in each Fund’s prospectus. Effective October 1, 2016, each Fund pays a fee to the Administrator at the rate of 0.15% per annum of the Fund’s average daily net assets for this service. Prior to October 1, 2016, under the terms of the prior administration agreement between the Trust and Aston, the Funds’ administration fees were accrued daily and paid monthly, based on a specified percentage of average daily net assets of the Trust, and a base fee was charged at a fixed annual rate of $12,000 per Fund. The asset-based fee was allocated to each Fund based on the relative net assets of each Fund. The asset-based administration fee arrangement prior to October 1, 2016 was as follows:
| | | | |
Administration Fees at Trust Level | | Annual Rate | |
First $ 7.4 billion | | | 0.0437 | % |
Over $ 7.4 billion | | | 0.0412 | % |
The Investment Manager has agreed, through at least October 1, 2018, to waive a portion of the administrative fee in an amount equal to 0.0061% of the average daily net assets of Montag & Caldwell Growth, 0.0053% of the average daily net assets of River Road Dividend All Cap Value, 0.0065% of the average daily net assets of Fairpointe Mid Cap, 0.0022% of the average daily net assets of River Road Small Cap Value, 0.0052% of the average daily net assets of DoubleLine Core Plus Bond and 0.0055% of the average daily net assets of Pictet International.
Distribution Services. The Funds are distributed by AMG Distributors, Inc. (the “Distributor”), a wholly owned subsidiary of the Investment Manager. Prior to October 1, 2016, the Funds’ distributor was Foreside Funds Distributors LLC. The Distributor serves as the distributor and underwriter for each Fund and is a registered broker-dealer and member of the Financial Industry Regulatory Authority, Inc. (“FINRA”). Shares of each Fund will be continuously offered and will be sold directly to prospective purchasers and through brokers, dealers or other financial intermediaries who have executed selling agreements with the Distributor. Generally the Distributor bears all or a portion of the expenses of providing services pursuant to the distribution agreement, including the payment of the expenses relating to the distribution of prospectuses for sales purposes and any advertising or sales literature.
The Trust has adopted a distribution and service plan (the “Plan”) with respect to the Class N shares and Class R shares, in accordance with the requirements of Rule 12b-1 under the 1940 Act and the requirements of the applicable rules of FINRA regarding asset based sales charges. Pursuant to the Plan, each Fund may make payments to the Distributor for its expenditures in financing any activity primarily intended to result in the sale of each such class of the Fund’s shares and for maintenance and personal service provided to existing shareholders of that class. The Plan authorizes payments to the Distributor of 0.25% and 0.50% annually of each Fund’s average daily net assets attributable to the Class N shares and Class R shares, respectively. The Plan further provides for periodic payments by the Trust or the Distributor to brokers, dealers and other financial intermediaries for providing shareholder services and for promotional and other sales related costs. The portion of payments made under the plan by Class R shares of Montag & Caldwell Growth for shareholder servicing may not exceed an annual rate of 0.25% of the average daily net asset value of Class R shares of that class owned by clients of such broker, dealer or financial intermediary. The Funds made payments to the previous distributor at the same rates.
Shareholder Servicing Fees. For each of the Class N, Class I and Class R shares, the Board has approved reimbursement payments to the Investment Manager for shareholder servicing expenses (“shareholder servicing fees”) incurred. Shareholder servicing fees include payments to each financial intermediary such as broker-dealers (including fund supermarket platforms), bank, and trust companies that provide shareholder recordkeeping, account servicing and other services. The Class N, Class I and Class R shares may reimburse the Investment Manager for the actual amount incurred up to a maximum annual rate of 0.15% of each respective Class’s average daily net asset value.
Prior to October 1, 2016, the Funds were authorized to reimburse Aston for shareholder servicing payments made to certain financial intermediaries at an annual rate of up to 0.09% of eligible assets of each Fund, which are allocated on a pro-rata basis to each class based on relative net assets of each class based on the relative net assets of each class to the total net assets of each Fund.
AMG Funds
| | |
| | April 30, 2017 |
| Notes to Financial Statements – continued | | |
The Investment Manager has agreed, through at least October 1, 2017, to waive a portion of shareholder servicing fees paid by the various share classes of each Fund, as necessary, to ensure the total net expense ratio for each share class of each Fund does not increase due to the changes in the methodology of shareholder servicing reimbursements described above.
The impact on the annualized expense ratios for the six months ended April 30, 2017, were as follows:
| | | | |
Fund | | Actual
Amount
Incurred | |
Fairpointe Focused Equity | | | | |
Class N | | | 0.08 | % |
Class I | | | 0.08 | % |
River Road Focused Absolute Value | | | | |
Class N | | | 0.04 | % |
Class I | | | 0.04 | % |
Montag & Caldwell Growth | | | | |
Class N | | | 0.06 | % |
Class I | | | 0.06 | % |
Class R | | | 0.05 | % |
River Road Dividend All Cap Value | | | | |
Class N | | | 0.06 | % |
Class I | | | 0.06 | % |
River Road Dividend All Cap Value II | | | | |
Class N | | | 0.06 | % |
Class I | | | 0.06 | % |
Fairpointe Mid Cap | | | | |
Class N | | | 0.08 | % |
Class I | | | 0.08 | % |
Montag & Caldwell Mid Cap Growth | | | | |
Class N | | | 0.05 | % |
Class I | | | 0.05 | % |
LMCG Small Cap Growth | | | | |
Class N | | | 0.07 | % |
Class I | | | 0.06 | % |
River Road Select Value | | | | |
Class N | | | 0.06 | % |
Class I | | | 0.06 | % |
River Road Small Cap Value | | | | |
Class N | | | 0.09 | % |
Class I | | | 0.09 | % |
Silvercrest Small Cap | | | | |
Class N | | | 0.07 | % |
Class I | | | 0.07 | % |
GW&K U.S. Small Cap Growth | | | | |
Class N | | | 0.07 | % |
Class I | | | 0.07 | % |
DoubleLine Core Plus Bond | | | | |
Class N | | | 0.08 | % |
Class I | | | 0.08 | % |
Lake Partners LASSO Alternatives | | | | |
Class N | | | 0.06 | % |
Class I | | | 0.06 | % |
River Road Long-Short | | | | |
Class N | | | 0.08 | % |
Class I | | | 0.08 | % |
Pictet International | | | | |
Class N | | | 0.07 | % |
Class I | | | 0.07 | % |
Montag & Caldwell Balanced | | | | |
Class N | | | 0.06 | % |
Class I | | | 0.06 | % |
Trustees. The Board provides supervision of the affairs of the Trust and, other Trusts within the AMG Funds family. The Trustees of the Trust who are not affiliated with the Investment Manager receive an annual retainer and per meeting fees for regular, special and telephonic meetings, and they are reimbursed for out-of-pocket expenses incurred while carrying out their duties as Board members. The Chairman of the Board and the Audit Committee Chair receive additional annual retainers. Certain Trustees and Officers of the Funds are Officers and/or Directors of AMG, the Distributor or the Investment Manager.
InterFund Loans. The SEC granted an exemptive order that permits GW&K U.S. Small Cap Growth and certain other funds in the AMG Funds family to lend and borrow money for certain temporary purposes directly to and from other eligible funds in the AMG Funds family. Participation in this interfund lending program is voluntary for both the borrowing and lending funds, and an interfund loan is only made if it benefits each participating fund. The Administrator manages the program according to procedures approved by the Board, and the Board monitors the operation of the program. An interfund loan must comply with certain conditions set out in the exemptive order, which are designed to assure fairness and protect all participating funds. GW&K U.S. Small Cap Growth did not borrow from nor lend to any other fund in the AMG Funds family.
Note (G) Portfolio Securities Loaned: The Funds participate in the Program providing for the lending of securities to qualified brokers. Securities lending income includes earnings of such temporary cash investments, plus or minus any rebate to a borrower. These earnings (after any rebate) are then divided between BNYM, as a fee for its services under the Program, and the Funds, according to agreed-upon rates. Collateral on all securities loaned is accepted in cash and is maintained at a minimum level of 102% (105% in the case of certain foreign securities) of the market value, plus interest, if applicable, of investments on loan. It is the Funds’ policy to obtain additional collateral from or return excess collateral to the borrower by the end of the next business day, following the valuation date of the securities loaned. Therefore, the value of the collateral held may be temporarily less than the value of the securities on loan. Lending securities entails a risk of loss to the Funds if and to the extent that the market value of the securities loaned were to increase and the borrower did not increase the collateral accordingly, and the borrower fails to return the securities. Under the terms of the Program, the Funds are indemnified for such losses by BNYM. Cash collateral is held in a separate omnibus account managed by BNYM, who is authorized to exclusively enter into joint repurchase agreements. BNYM bears the risk of any deficiency in the amount of the cash collateral available for return to the borrower due to any loss on the collateral invested. At April 30, 2017, the value of the securities loaned and cash collateral received, were as follows:
| | | | | | | | |
| | | Securities
Loaned | | | Cash Collateral
Received | |
River Road Focused Absolute Value | | $ | 345,644 | | | $ | 358,021 | |
River Road Dividend All Cap Value | | | 21,904,456 | | | | 22,612,867 | |
River Road Dividend All Cap Value II | | | 1,131,073 | | | | 1,174,348 | |
AMG Funds
| | |
| | April 30, 2017 |
| Notes to Financial Statements – continued | | |
| | | | | | | | |
| | | Securities
Loaned | | | Cash Collateral
Received | |
Montag & Caldwell Mid Cap Growth | | $ | 408,459 | | | $ | 423,918 | |
LMCG Small Cap Growth | | | 5,585,456 | | | | 5,755,941 | |
River Road Select Value | | | 1,363,682 | | | | 1,409,152 | |
River Road Small Cap Value | | | 5,404,619 | | | | 5,662,333 | |
Silvercrest Small Cap | | | 1,560,750 | | | | 1,765,432 | |
GW&K U.S. Small Cap Growth | | | 1,427,367 | | | | 1,458,663 | |
DoubleLine Core Plus Bond | | | 14,268,090 | | | | 14,734,882 | |
Guardian Capital Global Dividend | | | 946,741 | | | | 967,374 | |
Pictet International | | | 62,702,224 | | | | 65,738,546 | |
Managers Value Partners Asia Dividend | | | 5,349 | | | | 5,378 | |
Note (H) Credit Agreement: Effective July 6, 2010, and as amended July 29, 2015 and July 27, 2016, the Trust entered into a Credit Agreement with The Bank of New York Mellon (the “Bank”) which provides the Trust with a revolving line of credit facility of up to $50 million. The facility is shared by each Fund of the Trust and is available for temporary, emergency purposes including liquidity needs in meeting redemptions. The interest rate on outstanding Alternate Base Rate Loans is equal to the greater of the Prime Rate plus 1.25%, or 0.50% plus the Federal Funds Effective Rate plus 1.25%. The interest rate on outstanding Overnight Loans is equal
to the greater of the Federal Funds Effective Rate plus 1.25%, or the One-Month LIBOR Rate plus 1.25%. Effective July 27, 2016, the Trust pays a commitment fee on the unutilized commitment amount of 0.175% per annum, which is allocated to the Funds based on average daily net assets and included in Miscellaneous Expense on the Statement of Operations. Prior to July 27, 2016, the Trust paid a commitment fee of 0.15% per annum. The Funds did not utilize the line of credit during the six months ended April 30, 2017.
Note (I) Master Netting Agreements: The Funds may enter into master netting agreements with their counterparties for the securities lending program and Repurchase Agreements, which provide the right, in the event of default (including bankruptcy or insolvency) for the non-defaulting party to liquidate the collateral and calculate net exposure to the defaulting party or request additional collateral. For financial reporting purposes, the Funds do not offset financial assets and financial liabilities that are subject to master netting agreements in the Statement of Assets and Liabilities. For securities lending transactions, see Note G.
The following table is a summary of the Funds’ open Repurchase Agreements that are subject to a master netting agreement as of April 30, 2017:
| | | | | | | | | | | | | | | | |
| | | | | | Gross Amount Not Offset in the
Statement of Assets and Liabilities | | | | |
| | | Net Amounts of Assets
Presented in the Statement of
Assets and Liabilities | | | Financial
Instruments
Collateral | | | Cash
Collateral
Received | | | Net Amount | |
River Road Focused Absolute Value | | | | | | | | | | | | | | | | |
Royal Bank of Scotland PLC | | $ | 358,021 | | | $ | 358,021 | | | | — | | | | — | |
| | | | | | | | | | | | | | | | |
River Road Dividend All Cap Value | | | | | | | | | | | | | | | | |
Cantor Fitzgerald Securities, Inc. | | $ | 5,370,665 | | | $ | 5,370,665 | | | | — | | | | — | |
Citibank N.A. | | | 1,130,207 | | | | 1,130,207 | | | | — | | | | — | |
Daiwa Capital Markets America | | | 5,370,665 | | | | 5,370,665 | | | | — | | | | — | |
Deutsche Bank Securities, Inc. | | | 5,370,665 | | | | 5,370,665 | | | | — | | | | — | |
Nomura Securities International, Inc. | | | 5,370,665 | | | | 5,370,665 | | | | — | | | | — | |
| | | | | | | | | | | | | | | | |
Total | | $ | 22,612,867 | | | $ | 22,612,867 | | | | — | | | | — | |
| | | | | | | | | | | | | | | | |
River Road Dividend All Cap Value II | | | | | | | | | | | | | | | | |
Citibank N.A. | | $ | 174,348 | | | $ | 174,348 | | | | — | | | | — | |
Merrill Lynch Pierce Fenner & Smith, Inc. | | | 1,000,000 | | | | 1,000,000 | | | | — | | | | — | |
| | | | | | | | | | | | | | | | |
Total | | $ | 1,174,348 | | | $ | 1,174,348 | | | | — | | | | — | |
| | | | | | | | | | | | | | | | |
Montag & Caldwell Mid Cap Growth | | | | | | | | | | | | | | | | |
Royal Bank of Scotland PLC | | $ | 423,918 | | | $ | 423,918 | | | | — | | | | — | |
| | | | | | | | | | | | | | | | |
LMCG Small Cap Growth | | | | | | | | | | | | | | | | |
Deutsche Bank Securities, Inc. | | $ | 1,367,066 | | | $ | 1,367,066 | | | | — | | | | — | |
Citigroup Global Markets, Inc. | | | 1,367,066 | | | | 1,367,066 | | | | — | | | | — | |
JP Morgan Securities LLC | | | 287,677 | | | | 287,677 | | | | — | | | | — | |
Merrill Lynch, Pierce, Fenner & Smith, Inc. | | | 1,367,066 | | | | 1,367,066 | | | | — | | | | — | |
RBC Dominion Securities, Inc. | | | 1,367,066 | | | | 1,367,066 | | | | — | | | | — | |
| | | | | | | | | | | | | | | | |
Total | | $ | 5,755,941 | | | $ | 5,755,941 | | | | — | | | | — | |
| | | | | | | | | | | | | | | | |
River Road Select Value | | | | | | | | | | | | | | | | |
Merrill Lynch, Pierce, Fenner & Smith, Inc. | | $ | 1,000,000 | | | $ | 1,000,000 | | | | — | | | | — | |
Royal Bank of Scotland PLC | | | 409,152 | | | | 409,152 | | | | — | | | | — | |
| | | | | | | | | | | | | | | | |
Total | | $ | 1,409,152 | | | $ | 1,409,152 | | | | — | | | | — | |
| | | | | | | | | | | | | | | | |
AMG Funds
| | |
| | April 30, 2017 |
| Notes to Financial Statements – continued | | |
| | | | | | | | | | | | | | | | |
| | | | | | Gross Amount Not Offset in the
Statement of Assets and Liabilities | | | | |
| | | Net Amounts of Assets
Presented in the Statement of
Assets and Liabilities | | | Financial
Instruments
Collateral | | | Cash
Collateral
Received | | | Net Amount | |
River Road Small Cap Value | | | | | | | | | | | | | | | | |
Cantor Fitzgerald Securities, Inc. | | $ | 1,344,834 | | | $ | 1,344,834 | | | | — | | | | — | |
Citigroup Global Markets, Inc. | | | 282,997 | | | | 282,997 | | | | — | | | | — | |
Daiwa Capital Markets America | | | 1,344,834 | | | | 1,344,834 | | | | — | | | | — | |
HSBC Securities USA, Inc. | | | 1,344,834 | | | | 1,344,834 | | | | — | | | | — | |
Nomura Securities International, Inc. | | | 1,344,834 | | | | 1,344,834 | | | | — | | | | — | |
| | | | | | | | | | | | | | | | |
Total | | $ | 5,662,333 | | | $ | 5,662,333 | | | | — | | | | — | |
| | | | | | | | | | | | | | | | |
Silvercrest Small Cap | | | | | | | | | | | | | | | | |
Citigroup Global Markets, Inc. | | $ | 1,000,000 | | | $ | 1,000,000 | | | | — | | | | — | |
Royal Bank of Scotland PLC | | | 765,432 | | | | 765,432 | | | | — | | | | — | |
| | | | | | | | | | | | | | | | |
Total | | $ | 1,765,432 | | | $ | 1,765,432 | | | | — | | | | — | |
| | | | | | | | | | | | | | | | |
GW&K U.S. Small Cap Growth | | | | | | | | | | | | | | | | |
Cantor Fitzgerald Securities, Inc. | | $ | 1,000,000 | | | $ | 1,000,000 | | | | — | | | | — | |
Daiwa Capital Markets America | | | 458,663 | | | | 458,663 | | | | — | | | | — | |
| | | | | | | | | | | | | | | | |
Total | | $ | 1,458,663 | | | $ | 1,458,663 | | | | — | | | | — | |
| | | | | | | | | | | | | | | | |
DoubleLine Core Plus Bond | | | | | | | | | | | | | | | | |
Citigroup Global Markets, Inc. | | $ | 3,499,615 | | | $ | 3,499,615 | | | | — | | | | — | |
Deutsche Bank Securities, Inc. | | | 736,422 | | | | 736,422 | | | | — | | | | — | |
HSBC Securities USA, Inc. | | | 3,499,615 | | | | 3,499,615 | | | | — | | | | — | |
Merrill Lynch Pierce Fenner & Smith, Inc. | | | 3,499,615 | | | | 3,499,615 | | | | — | | | | — | |
RBC Dominion Securities, Inc. | | | 3,499,615 | | | | 3,499,615 | | | | — | | | | — | |
| | | | | | | | | | | | | | | | |
Total | | $ | 14,734,882 | | | $ | 14,734,882 | | | | — | | | | — | |
| | | | | | | | | | | | | | | | |
Guardian Capital Global Dividend | | | | | | | | | | | | | | | | |
Cantor Fitzgerald Securities, Inc. | | $ | 967,374 | | | $ | 967,374 | | | | — | | | | — | |
| | | | | | | | | | | | | | | | |
Pictet International | | | | | | | | | | | | | | | | |
Cantor Fitzgerald Securities, Inc. | | $ | 15,613,259 | | | $ | 15,613,259 | | | | — | | | | — | |
Citibank N.A. | | | 3,285,510 | | | | 3,285,510 | | | | — | | | | — | |
Daiwa Capital Markets America | | | 15,613,259 | | | | 15,613,259 | | | | — | | | | — | |
HSBC Securities USA, Inc. | | | 15,613,259 | | | | 15,613,259 | | | | — | | | | — | |
Nomura Securities International, Inc. | | | 15,613,259 | | | | 15,613,259 | | | | — | | | | — | |
| | | | | | | | | | | | | | | | |
Total | | $ | 65,738,546 | | | $ | 65,738,546 | | | | — | | | | — | |
| | | | | | | | | | | | | | | | |
Value Partners Asia Dividend | | | | | | | | | | | | | | | | |
Nomura Securities International, Inc. | | $ | 5,378 | | | $ | 5,378 | | | | — | | | | — | |
| | | | | | | | | | | | | | | | |
Note (J) Regulatory Events:
On October 13, 2016, the SEC amended existing rules intended to modernize reporting and disclosure of information. These amendments relate to Regulation S-X which sets forth the form and content of financial statements. Management is evaluating the implications of adopting these amendments and their impact on the financial statements and accompanying notes.
Note (K) Subsequent Events: No material events or transactions occurred through the issuance of the Funds’ financial statements, which require additional disclosure in or adjustment of the Funds’ financial statements.
AMG Funds
| | |
| | April 30, 2017 |
| Additional Information (unaudited) | | |
About Your Fund’s Expenses: As a shareholder of a Fund, you may incur two types of costs: (1) transaction costs, which may include sales charges (loads) on purchase payments; redemption fees; and exchange fees; and (2) ongoing costs, including management fees; distribution (12b-1) fees; and other Fund expenses. This example is intended to help you understand your ongoing costs (in dollars) of investing in the Fund and to compare these costs with the ongoing costs of investing in other mutual funds. The example is based on $1,000 invested at the beginning of the period and held for the entire period as indicated below.
Actual Expenses: The first line of the following table provides information about the actual account values and actual expenses. You may use the information in this line, together with the amount you invested, to estimate the expenses that you paid over the period. Simply divide your account value by $1,000 (for example, an $8,600 account value divided by $1,000 = 8.6), then multiply the result by the number in the first line under the heading entitled “Expenses Paid During Period” to estimate the expenses you paid on your account during this period.
Hypothetical Example for Comparison Purposes: The second line of the following table provides information about hypothetical account values and hypothetical expenses based on the Fund’s actual expense ratio and an assumed annual rate of return of 5% before expenses, which is not the Fund’s actual return. The hypothetical account values and expenses may not be used to estimate the actual ending account balance or expenses you paid for the period. You may use this information to compare the ongoing costs of investing in the Fund and other funds by comparing this 5% hypothetical example with the 5% hypothetical examples that appear in the shareholder reports of other funds.
Please note that the expenses shown in the table are meant to highlight your ongoing costs only and do not reflect any transactional costs, such as sales charges (loads), redemption fees, or exchange fees. Therefore, the second line of the table is useful in comparing ongoing costs only, and will not help you determine the relative total costs of owning different funds.
AMG Funds
| | |
| | April 30, 2017 |
| Additional Information (unaudited) – continued | | |
| | | | | | | | | | | | | | | | |
| | | Beginning
Account
Value
11/01/16 | | | Ending
Account
Value
04/30/17 | | | Expense
Ratio(1) | | | Expenses
Paid During
Period(2) | |
Fairpointe Focused Equity | |
Actual Return | | | | | | | | | | | | | | | | |
Class N | | $ | 1,000 | | | $ | 1,183.00 | | | | 1.15 | % | | $ | 6.22 | |
Class I | | | 1,000 | | | | 1,184.90 | | | | 0.90 | % | | | 4.88 | |
Hypothetical 5% Return | | | | | | | | | | | | | | | | |
Class N | | $ | 1,000 | | | $ | 1,019.09 | | | | 1.15 | % | | $ | 5.76 | |
Class I | | | 1,000 | | | | 1,020.33 | | | | 0.90 | % | | | 4.51 | |
River Road Focused Absolute Value | |
Actual Return | | | | | | | | | | | | | | | | |
Class N | | $ | 1,000 | | | $ | 1,149.50 | | | | 1.00 | % | | $ | 5.33 | |
Class I | | | 1,000 | | | | 1,150.50 | | | | 0.75 | % | | | 4.00 | |
Hypothetical 5% Return | | | | | | | | | | | | | | | | |
Class N | | $ | 1,000 | | | $ | 1,019.84 | | | | 1.00 | % | | $ | 5.01 | |
Class I | | | 1,000 | | | | 1,021.08 | | | | 0.75 | % | | | 3.76 | |
Montag & Caldwell Growth | |
Actual Return | | | | | | | | | | | | | | | | |
Class N | | $ | 1,000 | | | $ | 1,088.40 | | | | 1.17 | % | | $ | 6.06 | |
Class I | | | 1,000 | | | | 1,089.70 | | | | 0.92 | % | | | 4.77 | |
Class R | | | 1,000 | | | | 1,087.20 | | | | 1.41 | % | | | 7.30 | |
Hypothetical 5% Return | | | | | | | | | | | | | | | | |
Class N | | $ | 1,000 | | | $ | 1,018.99 | | | | 1.17 | % | | $ | 5.86 | |
Class I | | | 1,000 | | | | 1,020.23 | | | | 0.92 | % | | | 4.61 | |
Class R | | | 1,000 | | | | 1,017.80 | | | | 1.41 | % | | | 7.05 | |
River Road Dividend All Cap Value | |
Actual Return | | | | | | | | | | | | | | | | |
Class N | | $ | 1,000 | | | $ | 1,109.60 | | | | 1.09 | % | | $ | 5.70 | |
Class I | | | 1,000 | | | | 1,110.80 | | | | 0.84 | % | | | 4.40 | |
Hypothetical 5% Return | | | | | | | | | | | | | | | | |
Class N | | $ | 1,000 | | | $ | 1,019.39 | | | | 1.09 | % | | $ | 5.46 | |
Class I | | | 1,000 | | | | 1,020.63 | | | | 0.84 | % | | | 4.21 | |
River Road Dividend All Cap Value II | |
Actual Return | | | | | | | | | | | | | | | | |
Class N | | $ | 1,000 | | | $ | 1,109.80 | | | | 1.15 | % | | $ | 6.02 | |
Class I | | | 1,000 | | | | 1,110.90 | | | | 0.90 | % | | | 4.71 | |
Hypothetical 5% Return | | | | | | | | | | | | | | | | |
Class N | | $ | 1,000 | | | $ | 1,019.09 | | | | 1.15 | % | | $ | 5.76 | |
Class I | | | 1,000 | | | | 1,020.33 | | | | 0.90 | % | | | 4.51 | |
Fairpointe Mid Cap | |
Actual Return | | | | | | | | | | | | | | | | |
Class N | | $ | 1,000 | | | $ | 1,193.20 | | | | 1.12 | % | | $ | 6.09 | |
Class I | | | 1,000 | | | | 1,194.80 | | | | 0.87 | % | | | 4.73 | |
Hypothetical 5% Return | | | | | | | | | | | | | | | | |
Class N | | $ | 1,000 | | | $ | 1,019.24 | | | | 1.12 | % | | $ | 5.61 | |
Class I | | | 1,000 | | | | 1,020.48 | | | | 0.87 | % | | | 4.36 | |
Montag & Caldwell Mid Cap Growth | |
Actual Return | | | | | | | | | | | | | | | | |
Class N | | $ | 1,000 | | | $ | 1,112.70 | | | | 1.25 | % | | $ | 6.55 | |
Class I | | | 1,000 | | | | 1,114.50 | | | | 1.00 | % | | | 5.24 | |
Hypothetical 5% Return | | | | | | | | | | | | | | | | |
Class N | | $ | 1,000 | | | $ | 1,018.60 | | | | 1.25 | % | | $ | 6.26 | |
Class I | | | 1,000 | | | | 1,019.84 | | | | 1.00 | % | | | 5.01 | |
LMCG Small Cap Growth | |
Actual Return | | | | | | | | | | | | | | | | |
Class N | | $ | 1,000 | | | $ | 1,187.00 | | | | 1.20 | % | | $ | 6.51 | |
Class I | | | 1,000 | | | | 1,187.70 | | | | 1.09 | % | | | 5.91 | |
Hypothetical 5% Return | | | | | | | | | | | | | | | | |
Class N | | $ | 1,000 | | | $ | 1,018.84 | | | | 1.20 | % | | $ | 6.01 | |
Class I | | | 1,000 | | | | 1,019.39 | | | | 1.09 | % | | | 5.46 | |
| | | | | | | | | | | | | | | | |
| | | Beginning
Account
Value
11/01/16 | | | Ending
Account
Value
04/30/17 | | | Expense
Ratio(1) | | | Expenses
Paid During
Period(2) | |
River Road Select Value | |
Actual Return | | | | | | | | | | | | | | | | |
Class N | | $ | 1,000 | | | $ | 1,212.70 | | | | 1.40 | % | | $ | 7.68 | |
Class I | | | 1,000 | | | | 1,214.90 | | | | 1.15 | % | | | 6.32 | |
Hypothetical 5% Return | | | | | | | | | | | | | | | | |
Class N | | $ | 1,000 | | | $ | 1,017.85 | | | | 1.40 | % | | $ | 7.00 | |
Class I | | | 1,000 | | | | 1,019.09 | | | | 1.15 | % | | | 5.76 | |
River Road Small Cap Value | |
Actual Return | | | | | | | | | | | | | | | | |
Class N | | $ | 1,000 | | | $ | 1,192.50 | | | | 1.34 | % | | $ | 7.28 | |
Class I | | | 1,000 | | | | 1,194.20 | | | | 1.09 | % | | | 5.93 | |
Hypothetical 5% Return | | | | | | | | | | | | | | | | |
Class N | | $ | 1,000 | | | $ | 1,018.15 | | | | 1.34 | % | | $ | 6.71 | |
Class I | | | 1,000 | | | | 1,019.39 | | | | 1.09 | % | | | 5.46 | |
Silvercrest Small Cap | |
Actual Return | | | | | | | | | | | | | | | | |
Class N | | $ | 1,000 | | | $ | 1,172.80 | | | | 1.40 | % | | $ | 7.54 | |
Class I | | | 1,000 | | | | 1,173.80 | | | | 1.15 | % | | | 6.20 | |
Hypothetical 5% Return | | | | | | | | | | | | | | | | |
Class N | | $ | 1,000 | | | $ | 1,017.85 | | | | 1.40 | % | | $ | 7.00 | |
Class I | | | 1,000 | | | | 1,019.09 | | | | 1.15 | % | | | 5.76 | |
GW&K U.S. Small Cap (3) | |
Actual Return | | | | | | | | | | | | | | | | |
Class N | | $ | 1,000 | | | $ | 1,177.70 | | | | 1.31 | % | | $ | 7.07 | |
Class I | | | 1,000 | | | | 1,182.00 | | | | 1.06 | % | | | 5.73 | |
Class Z | | | 1,000 | | | | 1,037.10 | | | | 0.90 | % | | | 1.58 | |
Hypothetical 5% Return | | | | | | | | | | | | | | | | |
Class N | | $ | 1,000 | | | $ | 1,018.30 | | | | 1.31 | % | | $ | 6.56 | |
Class I | | | 1,000 | | | | 1,019.54 | | | | 1.06 | % | | | 5.31 | |
Class I | | | 1,000 | | | | 1,020.33 | | | | 0.90 | % | | | 4.51 | |
DoubleLine Core Plus Fixed Income | |
Actual Return | | | | | | | | | | | | | | | | |
Class N | | $ | 1,000 | | | $ | 1,006.60 | | | | 0.93 | % | | $ | 4.63 | |
Class I | | | 1,000 | | | | 1,008.80 | | | | 0.68 | % | | | 3.39 | |
Hypothetical 5% Return | | | | | | | | | | | | | | | | |
Class N | | $ | 1,000 | | | $ | 1,020.18 | | | | 0.93 | % | | $ | 4.66 | |
Class I | | | 1,000 | | | | 1,021.42 | | | | 0.68 | % | | | 3.41 | |
Lake Partners LASSO Alternatives | |
Actual Return | | | | | | | | | | | | | | | | |
Class N | | $ | 1,000 | | | $ | 1,025.30 | | | | 1.40 | % | | $ | 7.03 | |
Class I | | | 1,000 | | | | 1,026.10 | | | | 1.15 | % | | | 5.78 | |
Hypothetical 5% Return | | | | | | | | | | | | | | | | |
Class N | | $ | 1,000 | | | $ | 1,017.85 | | | | 1.40 | % | | $ | 7.00 | |
Class I | | | 1,000 | | | | 1,019.09 | | | | 1.15 | % | | | 5.76 | |
River Road Long-Short (4) | | | | | | | | | | | | | | | | |
Actual Return | | | | | | | | | | | | | | | | |
Class N | | $ | 1,000 | | | $ | 1,078.80 | | | | 1.54 | % | | $ | 7.94 | |
Class I | | | 1,000 | | | | 1,079.80 | | | | 1.29 | % | | | 6.65 | |
Hypothetical 5% Return | | | | | | | | | | | | | | | | |
Class N | | $ | 1,000 | | | $ | 1,017.16 | | | | 1.54 | % | | $ | 7.70 | |
Class I | | | 1,000 | | | | 1,018.40 | | | | 1.29 | % | | | 6.46 | |
Guardian Capital Global Dividend | |
Actual Return | | | | | | | | | | | | | | | | |
Class N | | $ | 1,000 | | | $ | 1,109.90 | | | | 1.30 | % | | $ | 6.80 | |
Class I | | | 1,000 | | | | 1,111.80 | | | | 1.05 | % | | | 5.50 | |
Hypothetical 5% Return | | | | | | | | | | | | | | | | |
Class N | | $ | 1,000 | | | $ | 1,018.35 | | | | 1.30 | % | | $ | 6.51 | |
Class I | | | 1,000 | | | | 1,019.59 | | | | 1.05 | % | | | 5.26 | |
AMG Funds
| | |
| | April 30, 2017 |
| Additional Information (unaudited) – continued | | |
| | | | | | | | | | | | | | | | |
| | | Beginning
Account
Value
11/01/16 | | | Ending
Account
Value
04/30/17 | | | Expense
Ratio(1) | | | Expenses
Paid During
Period(2) | |
Pictet International | |
Actual Return | | | | | | | | | | | | | | | | |
Class N | | $ | 1,000 | | | $ | 1,126.20 | | | | 1.34 | % | | $ | 7.06 | |
Class I | | | 1,000 | | | | 1,127.30 | | | | 1.09 | % | | | 5.75 | |
Hypothetical 5% Return | | | | | | | | | | | | | | | | |
Class N | | $ | 1,000 | | | $ | 1,018.15 | | | | 1.34 | % | | $ | 6.71 | |
Class I | | | 1,000 | | | | 1,019.39 | | | | 1.09 | % | | | 5.46 | |
Value Partners Asia Dividend | |
Actual Return | | | | | | | | | | | | | | | | |
Class N | | $ | 1,000 | | | $ | 1,115.30 | | | | 1.15 | % | | $ | 6.03 | |
Class I | | | 1,000 | | | | 1,116.00 | | | | 1.15 | % | | | 6.03 | |
Hypothetical 5% Return | | | | | | | | | | | | | | | | |
Class N | | $ | 1,000 | | | $ | 1,019.09 | | | | 1.15 | % | | $ | 5.76 | |
Class I | | | 1,000 | | | | 1,019.09 | | | | 1.15 | % | | | 5.76 | |
Montag & Caldwell Balanced | |
Actual Return | | | | | | | | | | | | | | | | |
Class N | | $ | 1,000 | | | $ | 1,053.10 | | | | 1.15 | % | | $ | 5.85 | |
Class I | | | 1,000 | | | | 1,053.60 | | | | 1.10 | % | | | 5.60 | |
Hypothetical 5% Return | | | | | | | | | | | | | | | | |
Class N | | $ | 1,000 | | | $ | 1,019.09 | | | | 1.15 | % | | $ | 5.76 | |
Class I | | | 1,000 | | | | 1,019.34 | | | | 1.10 | % | | | 5.51 | |
| (1) | Annualized, based on the Fund’s most recent fiscal half-year expenses. |
| (2) | Expenses are equal to the Fund’s annualized expense ratio multiplied by the average account value over the period, multiplied by the number of days in the most recent fiscal half-year (181) or partial year, if applicable, for the actual return and multiplied by the most recent fiscal year for the hypothetical 5% return, then divided by 365. Expense ratios do not include interest expense, if applicable. |
| (3) | The commencement of investment operations for GW&K U.S. Small Cap Class Z was February 27, 2017. |
| (4) | Excludes interest expense and dividends on short positions. If included, your annualized expense ratios would be 3.40% and 3.15% for Class N and Class I, respectively, and your actual and hypothetical expenses paid during the period would be $17.52 and $16.24, and $16.93 and $15.69 for Class N and Class I, respectively. |
This page intentionally left blank.
This page intentionally left blank.
This page intentionally left blank.

INVESTMENT MANAGER AND ADMINISTRATOR
AMG Funds LLC
600 Steamboat Road, Suite 300.
Greenwich, CT 06830
(800) 835-3879
DISTRIBUTOR
AMG Distributors, Inc.
600 Steamboat Road, Suite 300.
Greenwich, CT 06830
(800) 835-3879
CUSTODIAN
The Bank of New York Mellon
2 Hanson Place
Brooklyn, NY 11217
LEGAL COUNSEL
Ropes & Gray LLP
Prudential Tower, 800 Boylston Street
Boston, MA 02199-3600
TRANSFER AGENT
BNY Mellon Investment Servicing (US) Inc.
Attn: AMG Funds
P.O. Box 9769
Providence, RI 02940
(800) 548-4539
This report is prepared for the Funds’ shareholders. It is authorized for distribution to prospective investors only when preceded or accompanied by an effective prospectus. To receive a free copy of the prospectus or Statement of Additional Information, which includes additional information about Fund Trustees, please contact us by calling 800.835.3879. Distributed by AMG Distributors, Inc., member FINRA/SIPC.
Current net asset values per share for each Fund are available on the Funds’ website at www.amgfunds.com.
A description of the policies and procedures each Fund uses to vote its proxies is available: (i) without charge, upon request, by calling 800.835.3879, or (ii) on the Securities and Exchange Commission’s (SEC) Web site at www.sec.gov. For information regarding each Fund’s proxy voting record for the 12-month period ended June 30, call 800.835.3879 or visit the SEC Web site at www.sec.gov.
The Funds file their complete schedule of portfolio holdings with the SEC for the first and third quarters of each fiscal year on Form N-Q. The Funds’ Forms N-Q are available on the SEC’s website at www.sec.gov. A Fund’s Forms N-Q may be reviewed and copied at the SEC’s Public Reference Room in Washington, DC. Information on the operation of the Public Reference Room may be obtained by calling 1-800-SEC-0330. To review a complete list of the Funds’ portfolio holdings, or to view the most recent quarterly holdings report, semiannual report, or annual report, please visit www.amgfunds.com.
AFFILIATE SUBADVISED FUNDS
BALANCED FUNDS
AMG Chicago Equity Partners
Balanced
Chicago Equity Partners, LLC
AMG FQ Global Risk-Balanced
First Quadrant, L.P.
EQUITY FUNDS
AMG Chicago Equity Partners Small
Cap Value
Chicago Equity Partners, LLC
AMG FQ Tax-Managed U.S. Equity AMG FQ U.S. Equity
First Quadrant, L.P.
AMG Frontier Small Cap Growth
Frontier Capital Management Company,
LLC
AMG GW&K Small Cap Core
AMG GW&K Small/Mid Cap
AMG GW&K U.S. Small Cap Growth
GW&K Investment Management, LLC
AMG Renaissance International
Equity
AMG Renaissance Large Cap Growth
The Renaissance Group LLC
AMG River Road Dividend All Cap
Value
AMG River Road Dividend All Cap
Value II
AMG River Road Focused Absolute
Value
AMG River Road Long-Short
AMG River Road Select Value
AMG River Road Small Cap Value
River Road Asset Management, LLC
AMG SouthernSun Small Cap
AMG SouthernSun Global
Opportunities
AMG SouthernSun U.S. Equity
SouthernSun Asset Management, LLC
AMG Systematic Large Cap Value
AMG Systematic Mid Cap Value
Systematic Financial Management, L.P.
AMG TimesSquare All Cap Growth
AMG TimesSquare Emerging
Markets Small Cap
AMG TimesSquare International
Small Cap
AMG TimesSquare Mid Cap Growth
AMG TimesSquare Small Cap Growth
TimesSquare Capital Management, LLC
AMG Trilogy Emerging Markets
Equity
AMG Trilogy Emerging Wealth Equity
AMG Trilogy Global Equity
AMG Trilogy International Small Cap
Trilogy Global Advisors, L.P.
AMG Yacktman
AMG Yacktman Focused
AMG Yacktman Focused Fund -
Security Selection Only
AMG Yacktman Special Opportunities
Yacktman Asset Management LP
FIXED INCOME FUNDS
AMG GW&K Core Bond
AMG GW&K Enhanced Core Bond
AMG GW&K Municipal Bond
AMG GW&K Municipal Enhanced
Yield
GW&K Investment Management, LLC
OPEN-ARCHITECTURE FUNDS
ALTERNATIVE FUNDS
AMG Managers Lake Partners
LASSO Alternative
Lake Partners, Inc.
BALANCED FUNDS
AMG Managers Montag & Caldwell
Balanced
Montag & Caldwell, LLC
EQUITY FUNDS
AMG Managers Brandywine
AMG Managers Brandywine
Advisors Mid Cap Growth
AMG Managers Brandywine Blue
Friess Associates, LLC
AMG Managers Cadence Capital
Appreciation
AMG Managers Cadence Emerging
Companies
AMG Managers Cadence Mid Cap
Cadence Capital Management, LLC
AMG Managers CenterSquare Real
Estate
CenterSquare Investment Management,
Inc.
AMG Managers Emerging
Opportunities
Lord, Abbett & Co. LLC
WEDGE Capital Management L.L.P.
Next Century Growth Investors LLC
RBC Global Asset Management (U.S.)
Inc.
AMG Managers Essex Small/Micro
Cap Growth
Essex Investment Management Co., LLC
AMG Managers Fairpointe Focused
Equity
AMG Managers Fairpointe Mid Cap
Fairpointe Capital LLC
AMG Managers Guardian Capital
Global Dividend
Guardian Capital LP
AMG Managers LMCG Small Cap
Growth
LMCG Investments, LLC
AMG Managers Montag & Caldwell
Growth
AMG Managers Montag & Caldwell
Mid Cap Growth
Montag & Caldwell, LLC
AMG Managers Pictet International
Pictet Asset Management Limited
AMG Managers Silvercrest Small Cap
Silvercrest Asset Management Group
LLC
AMG Managers Skyline Special
Equities
Skyline Asset Management, L.P.
AMG Managers Special Equity
Ranger Investment Management, L.P. Lord, Abbett & Co. LLC
Smith Asset Management Group, L.P. Federated MDTA LLC
AMG Managers Value Partners Asia
Dividend
Value Partners Hong Kong Limited
FIXED INCOME FUNDS
AMG Managers Amundi
Intermediate Government
AMG Managers Amundi Short
Duration Government
Amundi Smith Breeden LLC
AMG Managers Doubleline Core Plus
Bond
DoubleLine Capital LP
AMG Managers Global Income
Opportunity
AMG Managers Loomis Sayles Bond
Loomis, Sayles & Co., L.P.
| | |
SAR082-0417 | | | www.amgfunds.com |
Not applicable for the semi-annual shareholder report.
| Item 3. | AUDIT COMMITTEE FINANCIAL EXPERT |
Not applicable for the semi-annual shareholder report.
| Item 4. | PRINCIPAL ACCOUNTANT FEES AND SERVICES |
Not applicable for the semi-annual shareholder report.
| Item 5. | AUDIT COMMITTEE OF LISTED REGISTRANTS |
Not applicable.
| Item 6. | SCHEDULE OF INVESTMENTS |
The schedule of investments in unaffiliated issuers as of the close of the reporting period is included as part of the shareholder report contained in Item 1 hereof.
| Item 7. | DISCLOSURE OF PROXY VOTING POLICIES AND PROCEDURES FOR CLOSED-END MANAGEMENT INVESTMENT COMPANIES |
Not applicable.
| Item 8. | PORTFOLIO MANAGERS OF CLOSED-END MANAGEMENT INVESTMENT COMPANIES |
Not applicable.
| Item 9. | PURCHASES OF EQUITY SECURITIES BY CLOSED-END MANAGEMENT INVESTMENT COMPANIES AND AFFILIATED PURCHASERS |
Not applicable.
| Item 10. | SUBMISSION OF MATTERS TO A VOTE OF SECURITY HOLDERS |
Not applicable.
| Item 11. | CONTROLS AND PROCEDURES |
| | (a) | The registrant’s principal executive and principal financial officers have concluded, based on their evaluation of the registrant’s disclosure controls and procedures as of a date within 90 days of the filing date of this report, that the registrant’s disclosure controls and procedures are reasonably designed to ensure that information required to be disclosed by the registrant on Form N-CSR is recorded, processed, summarized and reported within the required time periods and that information required to be disclosed by the registrant in the reports that it files or submits on Form N-CSR is accumulated and communicated to the registrant’s management, including its principal executive and principal financial officers, as appropriate to allow timely decisions regarding required disclosure. |
| | (b) | There were no changes in the registrant’s internal control over financial reporting during the registrant’s second fiscal quarter of the period covered by this report that have materially affected, or are reasonably likely to materially affect, the internal control over financial reporting. |
| | |
| |
| (a)(1) | | Not applicable. |
| |
| (a)(2) | | Certifications pursuant to Rule 30a-2(a) under the Investment Company Act of 1940 - Filed herewith. |
| |
| (a)(3) | | Not applicable. |
| |
| (b) | | Certifications pursuant to Rule 30a-2(b) under the Investment Company Act of 1940 - Filed herewith. |
SIGNATURES
Pursuant to the requirements of the Securities Exchange Act of 1934 and the Investment Company Act of 1940, the registrant has duly caused this report to be signed on its behalf by the undersigned, thereunto duly authorized.
AMG FUNDS IV
| | |
| By: | | /s/ Jeffrey T. Cerutti |
| | Jeffrey T. Cerutti, Principal Executive Officer |
Date: July 5, 2017
Pursuant to the requirements of the Securities Exchange Act of 1934 and the Investment Company Act of 1940, this report has been signed below by the following persons on behalf of the registrant and in the capacities and on the dates indicated.
| | |
| By: | | /s/ Jeffrey T. Cerutti |
| | Jeffrey T. Cerutti, Principal Executive Officer |
|
Date: July 5, 2017 |
| |
| By: | | /s/ Donald S. Rumery |
| | Donald S. Rumery, Principal Financial Officer |
|
Date: July 5, 2017 |