UNITED STATES
SECURITIES AND EXCHANGE COMMISSION
Washington, D.C. 20549
FORM N-CSR
CERTIFIED SHAREHOLDER REPORT OF REGISTERED MANAGEMENT
INVESTMENT COMPANIES
Investment Company Act file number 811-08004
Aston Funds
(Exact name of registrant as specified in charter)
120 North LaSalle Street, 25th Floor
Chicago, IL 60602
(Address of principal executive offices) (Zip code)
Stuart D. Bilton, President
Aston Funds
120 North LaSalle Street, 25th Floor
Chicago, IL 60602
(Name and address of agent for service)
Registrant’s telephone number, including area code: (312) 268-1400
Date of fiscal year end: October 31
Date of reporting period: April 30, 2014
Form N-CSR is to be used by management investment companies to file reports with the Commission not later than 10 days after the transmission to stockholders of any report that is required to be transmitted to stockholders under Rule 30e-1 under the Investment Company Act of 1940 (17 CFR 270.30e-1). The Commission may use the information provided on Form N-CSR in its regulatory, disclosure review, inspection, and policymaking roles.
A registrant is required to disclose the information specified by Form N-CSR, and the Commission will make this information public. A registrant is not required to respond to the collection of information contained in Form N-CSR unless the Form displays a currently valid Office of Management and Budget (“OMB”) control number. Please direct comments concerning the accuracy of the information collection burden estimate and any suggestions for reducing the burden to Secretary, Securities and Exchange Commission, 100 F Street, NE, Washington, DC 20549. The OMB has reviewed this collection of information under the clearance requirements of 44 U.S.C. § 3507.
Item 1. Reports to Stockholders.
The Report to Shareholders is attached herewith.

Semi Annual Report 2014
April 30, 2014
Class N, I & R Shares
Equity
Fixed Income
Alternative
International
Sector
Balanced
This Privacy Statement is not part of the Semi Annual Report
PRIVACY STATEMENT
At Aston Funds, we appreciate the privacy concerns and expectations of our customers and we have established the following policies to maintain the privacy of information you share with us.
INFORMATION WE COLLECT
We collect and retain nonpublic personal information about you that may include:
| | • | | Information we receive on your account applications or other forms such as your name, address, financial information and/or social security number; |
| | • | | Information we receive about your mutual fund transactions, such as purchases, sales, exchanges and account balances; and |
| | • | | Information we collect through the use of Internet “cookies” when you access our website. Cookies are software files we use to track which of our sites you visit. |
INFORMATION WE MAY SHARE
We do not sell any of your nonpublic personal information to third parties. We may share the information we collect with affiliates or with non-affiliated third parties only when those parties are acting on our behalf in servicing your account, or as required by law. These third parties may include:
| | • | | Administrative service providers who, for example, process transactions for your account, print checks or prepare account statements; |
| | • | | Companies that provide services for us to help market our products to you; and |
| | • | | Governmental or other legal agencies, as required by law |
When information is shared with third parties, they are legally obligated to maintain the confidentiality of the information and to limit their use of it to servicing your account, except as permitted or required by law.
CONFIDENTIALITY AND SECURITY
We restrict access to your nonpublic personal information to authorized employees who need to access such information in order to provide services or products to you. We maintain physical, electronic and procedural safeguards to protect your nonpublic personal information.
As previously mentioned, we may collect information through the use of Internet “cookies” on our Web site. In addition, in order to provide you with access to your account via the web, it is necessary for us to collect certain nonpublic personal information such as your name, social security number and account information. Special measures such as data encryption and authentication apply to all nonpublic personal information and communications on our Web site.
APPLICABILITY
Our privacy policies apply only to those individual investors who have a direct customer relationship with us. If you are an individual shareholder of record of any of the Funds, the Funds consider you to be their customer. Shareholders purchasing or owning shares of any of the Funds through their bank, broker, or other financial institution should also consult that financial institution’s privacy policies.
Aston Funds values your business. We understand the importance of maintaining the integrity of your personal information and are committed to keeping your trust. Please contact us at 800-992-8151 if you have any questions concerning our policy, or visit us at www.astonfunds.com for additional copies of this policy.
This page intentionally left blank.
Aston Funds
Large Cap
ASTON/Montag & Caldwell Growth Fund
ASTON/TAMRO Diversified Equity Fund
ASTON/Herndon Large Cap Value Fund
ASTON/Cornerstone Large Cap Value Fund
Equity Income
ASTON/River Road Dividend All Cap Value Fund
ASTON/River Road Dividend All Cap Value Fund II
Mid Cap
ASTON/Fairpointe Mid Cap Fund
ASTON/Montag & Caldwell Mid Cap Growth Fund
Table of Contents
Small Cap
ASTON/LMCG Small Cap Growth Fund
ASTON/Silvercrest Small Cap Fund
ASTON/TAMRO Small Cap Fund
ASTON/River Road Select Value Fund
ASTON/River Road Small Cap Value Fund
ASTON/River Road Independent Value Fund
Fixed Income
ASTON/DoubleLine Core Plus Fixed Income Fund ASTON/TCH Fixed Income Fund
Alternative
ASTON/Lake Partners LASSO Alternatives Fund
ASTON/Anchor Capital Enhanced Equity Fund
ASTON/River Road Long-Short Fund
International
ASTON/Barings International Fund
ASTON/Guardian Capital Global Dividend Fund
ASTON/LMCG Emerging Markets Fund
ASTON/Pictet International Fund
Sector
ASTON/Harrison Street Real Estate Fund
Balanced
ASTON/Montag & Caldwell Balanced Fund
This report is submitted for general information to the shareholders of the funds. It is not authorized for distribution to prospective investors in the funds unless preceded or accompanied by an effective prospectus which includes details regarding the funds’ objectives, policies, expenses and other information.
Aston Funds are distributed by Foreside Funds Distributors LLC, 400 Berwyn Park, 899 Cassatt Road, Berwyn, PA 19312
Shareholder Services 800-992-8151 • www.astonfunds.com
NOT FDIC INSURED • NO BANK GUARANTEE • MAY LOSE VALUE
| | |
| |
| | As of April 30, 2014 |
| |
| Performance Summary (unaudited) | | |
| | | | | | | | | | | | | | | | | | | | | | | | | | | | | | | | | | | | |
| | | | | | | | | Average Annual Total Returns | | | | | | | | | | | | | |
| | | Class | | | Six Month Total Return (a) | | | One Year | | | Five Year | | | Ten Year | | | Since Inception | | | Total Expense Ratio (b) | | | Net Expense Ratio (b) | | | Inception Date | |
| Equity | | | | | | | | | | | | | | | | | | | | | | | | | | | | | | | | | | | | |
ASTON/Montag & Caldwell Growth Fund | | | N | | | | 4.65 | % | | | 12.19 | % | | | 14.73 | % | | | 6.98 | % | | | 9.17 | % | | | 1.05 | % | | | 1.05 | % | | | 11/02/94 | |
| | | I | | | | 4.76 | | | | 12.47 | | | | 15.02 | | | | 7.25 | | | | 7.63 | | | | 0.80 | | | | 0.80 | | | | 06/28/96 | |
| | | R | | | | 4.52 | | | | 11.91 | | | | 14.45 | | | | 6.72 | | | | 7.50 | | | | 1.30 | | | | 1.30 | | | | 12/31/02 | |
| | | | | | | | | |
ASTON/TAMRO Diversified Equity Fund (c) | | | N | | | | 6.19 | | | | 17.64 | | | | 16.89 | | | | 7.45 | | | | 6.60 | | | | 1.46 | | | | 1.20 | | | | 11/30/00 | |
| | | I | | | | 6.38 | | | | 17.98 | | | | NA | | | | NA | | | | 14.98 | | | | 1.21 | | | | 0.95 | | | | 03/02/12 | |
| | | | | | | | | |
ASTON/Herndon Large Cap Value Fund (c) | | | N | | | | 9.75 | | | | 19.41 | | | | NA | | | | NA | | | | 13.59 | | | | 1.31 | | | | 1.31 | | | | 03/31/10 | |
| | | I | | | | 9.87 | | | | 19.71 | | | | NA | | | | NA | | | | 13.08 | | | | 1.06 | | | | 1.06 | | | | 03/02/11 | |
| | | | | | | | | |
ASTON/Cornerstone Large Cap Value Fund (c) | | | N | | | | 8.67 | | | | 19.83 | | | | 17.18 | | | | 8.01 | | | | 8.19 | | | | 1.49 | | | | 1.31 | | | | 01/04/93 | |
| | | I | | | | 8.68 | | | | 20.10 | | | | 17.47 | | | | NA | | | | 7.44 | | | | 1.24 | | | | 1.06 | | | | 09/20/05 | |
| | | | | | | | | |
ASTON/River Road Dividend All Cap Value Fund | | | N | | | | 3.94 | | | | 13.42 | | | | 17.75 | | | | NA | | | | 8.48 | | | | 1.10 | | | | 1.10 | | | | 06/28/05 | |
| | | I | | | | 4.07 | | | | 13.66 | | | | 18.03 | | | | NA | | | | 6.04 | | | | 0.85 | | | | 0.85 | | | | 06/28/07 | |
| | | | | | | | | |
ASTON/River Road Dividend All Cap Value Fund II (c) | | | N | | | | 3.95 | | | | 12.98 | | | | NA | | | | NA | | | | 18.91 | | | | 1.38 | | | | 1.31 | | | | 06/27/12 | |
| | | I | | | | 4.07 | | | | 13.25 | | | | NA | | | | NA | | | | 19.19 | | | | 1.13 | | | | 1.06 | | | | 06/27/12 | |
| | | | | | | | | |
ASTON/Fairpointe Mid Cap Fund | | | N | | | | 10.52 | | | | 30.74 | | | | 24.74 | | | | 11.29 | | | | 13.37 | | | | 1.12 | | | | 1.12 | | | | 09/19/94 | |
| | | I | | | | 10.66 | | | | 31.04 | | | | 25.05 | | | | NA | | | | 11.42 | | | | 0.87 | | | | 0.87 | | | | 07/06/04 | |
| | | | | | | | | |
ASTON/Montag & Caldwell Mid Cap Growth Fund (c) | | | N | | | | 4.90 | | | | 18.34 | | | | 18.23 | | | | NA | | | | 4.80 | | | | 1.86 | | | | 1.26 | | | | 11/02/07 | |
| | | | | | | | | |
ASTON/LMCG Small Cap Growth Fund (c) | | | N | | | | 2.77 | | | | 21.14 | | | | NA | | | | NA | | | | 15.13 | | | | 2.04 | | | | 1.36 | | | | 11/03/10 | |
| | | I | | | | 2.86 | | | | 21.39 | | | | NA | | | | NA | | | | 10.22 | | | | 1.79 | | | | 1.11 | | | | 06/01/11 | |
| | | | | | | | | |
ASTON/Silvercrest Small Cap Fund (c) | | | N | | | | 2.55 | | | | 20.15 | | | | NA | | | | NA | | | | 19.21 | | | | 2.06 | | | | 1.41 | | | | 12/27/11 | |
| | | I | | | | 2.65 | | | | 20.39 | | | | NA | | | | NA | | | | 19.51 | | | | 1.81 | | | | 1.16 | | | | 12/27/11 | |
| | | | | | | | | |
ASTON/TAMRO Small Cap Fund | | | N | | | | -4.53 | | | | 8.14 | | | | 16.86 | | | | 8.44 | | | | 10.73 | | | | 1.31 | | | | 1.31 | | | | 11/30/00 | |
| | | I | | | | -4.42 | | | | 8.36 | | | | 17.14 | | | | NA | | | | 8.51 | | | | 1.06 | | | | 1.06 | | | | 01/04/05 | |
| | | | | | | | | |
ASTON/River Road Select Value Fund | | | N | | | | 0.11 | | | | 10.78 | | | | 15.43 | | | | NA | | | | 5.12 | | | | 1.47 | | | | 1.47 | | | | 03/29/07 | |
| | | I | | | | 0.22 | | | | 11.03 | | | | 15.76 | | | | NA | | | | 4.82 | | | | 1.22 | | | | 1.22 | | | | 06/28/07 | |
| | | | | | | | | |
ASTON/River Road Small Cap Value Fund | | | N | | | | 1.43 | | | | 14.30 | | | | 15.15 | | | | NA | | | | 7.69 | | | | 1.37 | | | | 1.37 | | | | 06/28/05 | |
| | | I | | | | 1.56 | | | | 14.60 | | | | 15.44 | | | | NA | | | | 4.64 | | | | 1.12 | | | | 1.12 | | | | 12/13/06 | |
| | | | | | | | | |
ASTON/River Road Independent Value Fund (c) | | | N | | | | 2.12 | | | | 6.39 | | | | NA | | | | NA | | | | 7.03 | | | | 1.48 | | | | 1.47 | | | | 12/31/10 | |
| | | I | | | | 2.19 | | | | 6.63 | | | | NA | | | | NA | | | | 5.10 | | | | 1.23 | | | | 1.22 | | | | 06/01/11 | |
| | | | | | | | | |
| Fixed Income | | | | | | | | | | | | | | | | | | | | | | | | | | | | | | | | | | | | |
ASTON/DoubleLine Core Plus Fixed Income Fund (c) | | | N | | | | 2.65 | | | | 0.24 | | | | NA | | | | NA | | | | 6.39 | | | | 1.05 | | | | 0.95 | | | | 07/18/11 | |
| | | I | | | | 2.78 | | | | 0.50 | | | | NA | | | | NA | | | | 6.65 | | | | 0.80 | | | | 0.70 | | | | 07/18/11 | |
| | | | | | | | | |
ASTON/TCH Fixed Income Fund (c) | | | N | | | | 2.93 | | | | 0.55 | | | | 8.37 | | | | 5.75 | | | | 5.90 | | | | 1.13 | | | | 0.95 | | | | 12/13/93 | |
| | | I | | | | 3.06 | | | | 0.75 | | | | 8.55 | | | | 5.97 | | | | 6.19 | | | | 0.88 | | | | 0.70 | | | | 07/31/00 | |
| | |
| |
| | As of April 30, 2014 |
| |
| Performance Summary (unaudited) – continued | | |
| | | | | | | | | | | | | | | | | | | | | | | | | | | | | | | | | | | | |
| | | | | | | | | Average Annual Total Returns | | | | | | | | | | | | | |
| | | Class | | | Six Month Total Return (a) | | | One Year | | | Five Year | | | Ten Year | | | Since Inception | | | Total Expense Ratio (b) | | | Net Expense Ratio (b) | | | Inception Date | |
| Alternative | | | | | | | | | | | | | | | | | | | | | | | | | | | | | | | | | | | | |
ASTON/Lake Partners LASSO Alternatives Fund (c) | | | N | | | | 3.35 | % | | | 5.24 | % | | | NA | % | | | NA | % | | | 5.49 | % | | | 3.22 | % | | | 3.22 | % | | | 03/03/10 | |
| | | I | | | | 3.49 | | | | 5.46 | | | | 7.62 | | | | NA | | | | 7.81 | | | | 2.97 | | | | 2.97 | | | | 04/01/09 | |
| | | | | | | | | |
ASTON/Anchor Capital Enhanced Equity Fund (c) | | | N | | | | 0.91 | | | | 6.01 | | | | 10.32 | | | | NA | | | | 4.67 | | | | 1.23 | | | | 1.23 | | | | 01/15/08 | |
| | | I | | | | 1.03 | | | | 6.26 | | | | NA | | | | NA | | | | 7.26 | | | | 0.98 | | | | 0.98 | | | | 03/03/10 | |
| | | | | | | | | |
ASTON/River Road Long-Short Fund (c) | | | N | | | | -1.99 | | | | 5.47 | | | | NA | | | | NA | | | | 7.52 | | | | 2.59 | | | | 2.43 | | | | 05/04/11 | |
| | | I | | | | -1.82 | | | | 5.83 | | | | NA | | | | NA | | | | 6.71 | | | | 2.34 | | | | 2.18 | | | | 03/04/13 | |
| | | | | | | | | |
| International | | | | | | | | | | | | | | | | | | | | | | | | | | | | | | | | | | | | |
ASTON/Barings International Fund (c) | | | N | | | | 1.71 | | | | 9.57 | | | | NA | | | | NA | | | | 6.97 | | | | 1.67 | | | | 1.40 | | | | 03/03/10 | |
| | | I | | | | 1.96 | | | | 9.98 | | | | 11.02 | | | | NA | | | | -2.10 | | | | 1.42 | | | | 1.15 | | | | 11/02/07 | |
| | | | | | | | | |
ASTON/Guardian Capital Global Dividend Fund (c) | | | N | | | | NA | | | | NA | | | | NA | | | | NA | | | | 3.50 | (d) | | | 5.15 | | | | 1.31 | | | | 04/14/14 | |
| | | I | | | | NA | | | | NA | | | | NA | | | | NA | | | | 3.50 | (d) | | | 4.90 | | | | 1.06 | | | | 04/14/14 | |
| | | | | | | | | |
ASTON/LMCG Emerging Markets Fund (c) | | | N | | | | -3.82 | | | | -7.00 | | | | NA | | | | NA | | | | -6.60 | | | | 7.31 | | | | 1.72 | | | | 03/28/13 | |
| | | I | | | | -3.63 | | | | -6.63 | | | | NA | | | | NA | | | | -6.25 | | | | 7.06 | | | | 1.47 | | | | 03/28/13 | |
| | | | | | | | | |
ASTON/Pictet International Fund (c) | | | N | | | | NA | | | | NA | | | | NA | | | | NA | | | | 1.90 | (d) | | | 2.47 | | | | 1.41 | | | | 04/14/14 | |
| | | I | | | | NA | | | | NA | | | | NA | | | | NA | | | | 1.90 | (d) | | | 2.22 | | | | 1.16 | | | | 04/14/14 | |
| | | | | | | | | |
| Sector | | | | | | | | | | | | | | | | | | | | | | | | | | | | | | | | | | | | |
ASTON/Harrison Street Real Estate Fund (c) | | | N | | | | 4.50 | | | | -3.06 | | | | 22.02 | | | | 9.42 | | | | 8.70 | | | | 2.22 | | | | 1.37 | | | | 12/30/97 | |
| | | I | | | | 4.61 | | | | -2.83 | | | | 22.30 | | | | NA | | | | 5.88 | | | | 1.37 | | | | 1.12 | | | | 09/20/05 | |
| | | | | | | | | |
| Balanced | | | | | | | | | | | | | | | | | | | | | | | | | | | | | | | | | | | | |
ASTON/Montag & Caldwell Balanced Fund (c) | | | N | | | | 3.27 | | | | 6.78 | | | | 10.26 | | | | 5.68 | | | | 7.68 | | | | 1.53 | | | | 1.36 | | | | 11/02/94 | |
| | | I | | | | 3.33 | | | | 6.90 | | | | 10.40 | | | | 5.86 | | | | 4.15 | | | | 1.28 | | | | 1.11 | | | | 12/31/98 | |
The performance data quoted represents past performance. Past performance does not guarantee future results. Investment return and principal value will fluctuate so that an investor’s shares, upon redemption may be worth more or less than their original cost. Current performance may be lower or higher than the performance data quoted. For performance data current to the most recent month-end, please visit our website at www.astonfunds.com.
Performance figures do not reflect the deduction of taxes that a shareholder would pay on Fund distributions or redemptions of Fund shares.
| (b) | | The expense ratios presented above may vary from the expense ratios presented in other sections of this report that are based on expenses incurred during the period covered by this report. |
| (c) | | Certain expenses were subsidized or recouped. If these subsidies or recoupment were not in effect, the returns would have been lower or higher, respectively. The Adviser is contractually obligated to waive management fees and/or reimburse expenses through February 28, 2015 for the Funds, other than Guardian Capital Global Dividend Fund and Pictet International Fund, with respect to which the Advisor is contractually obligated to waive management fees and/or reimburse expenses through April 9, 2015. |
| (d) | | Returns are cumulative since inception and are not annualized. |
The stocks of small- and mid-cap companies may be subject to a higher degree of market risk because they tend to be more volatile and less liquid. Bond and balanced funds have the same interest rate, high yield, and credit risks associated with the underlying bonds in the portfolio, all of which could reduce a fund’s value. By selling covered call options, a fund limits its opportunity to profit from an increase in the price of the underlying stock above the exercise price, but continues to bear the risk of a decline in the stock. Sector funds may be subject to a higher degree of market risk because of concentration in a specific industry sector. International investing may include the risk of social and political instability, market illiquidity and currency volatility. Emerging markets securities tend to be more volatile and less liquid than securities traded in developed countries. Hedged mutual funds may use derivative instruments, short selling, leveraging and investing in commodities, commodity-linked instruments and non-U.S. companies that involve significant risks.
| | |
| |
| ASTON/Montag & Caldwell Growth Fund | | April 30, 2014 |
| |
| Schedule of Investments (unaudited) | | |
| | | | | | | | |
Shares | | | | | Market Value | |
|
| | COMMON STOCKS – 92.50% | |
| | |
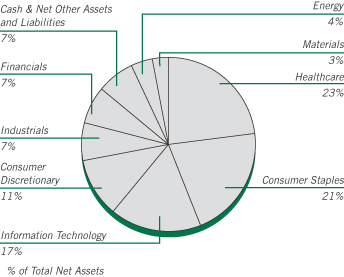
| | | | Consumer Discretionary – 10.63% | | | | |
| | 1,070,000 | | | NIKE, Class B | | $ | 78,056,500 | |
| | 55,000 | | | Priceline.com * | | | 63,676,250 | |
| | 560,000 | | | Ralph Lauren | | | 84,767,200 | |
| | 1,730,000 | | | Starbucks | | | 122,172,600 | |
| | 1,550,000 | | | TJX | | | 90,179,000 | |
| | 923,500 | | | Yum! Brands | | | 71,100,265 | |
| | | | | | | | |
| | | | | | | 509,951,815 | |
| | | | | | | | |
| |
| | | | Consumer Staples – 20.85% | |
| | 2,330,800 | | | Colgate-Palmolive | | | 156,862,840 | |
| | 612,800 | | | Costco Wholesale | | | 70,888,704 | |
| | 2,000,000 | | | Estee Lauder, Class A | | | 145,140,000 | |
| | 5,210,000 | | | Mondelez International, Class A | | | 185,736,500 | |
| | 1,290,800 | | | PepsiCo | | | 110,866,812 | |
| | 2,173,300 | | | Procter & Gamble | | | 179,405,915 | |
| | 2,231,300 | | | Walgreen | | | 151,505,270 | |
| | | | | | | | |
| | | | | | | 1,000,406,041 | |
| | | | | | | | |
| |
| | | | Energy – 4.46% | |
| | 1,850,000 | | | Occidental Petroleum | | | 177,137,500 | |
| | 360,000 | | | Schlumberger | | | 36,558,000 | |
| | | | | | | | |
| | | | | | | 213,695,500 | |
| | | | | | | | |
| |
| | | | Financials – 6.58% | |
| | 1,550,000 | | | American Express | | | 135,516,500 | |
| | 670,000 | | | State Street | | | 43,255,200 | |
| | 2,760,000 | | | Wells Fargo | | | 137,006,400 | |
| | | | | | | | |
| | | | | | | 315,778,100 | |
| | | | | | | | |
| |
| | | | Healthcare – 23.09% | |
| | 3,806,100 | | | Abbott Laboratories | | | 147,448,314 | |
| | 1,015,700 | | | Allergan | | | 168,443,688 | |
| | | | | | | | |
Shares | | | | | Market Value | |
| | |
| | | | Healthcare (continued) | | | | |
| | 1,400,000 | | | AmerisourceBergen | | $ | 91,252,000 | |
| | 580,556 | | | Biogen Idec * | | | 166,689,238 | |
| | 2,569,500 | | | Gilead Sciences * | | | 201,680,055 | |
| | 998,085 | | | McKesson | | | 168,866,001 | |
| | 621,300 | | | Stryker | | | 48,306,075 | |
| | 1,008,400 | | | Thermo Fisher Scientific | | | 114,957,600 | |
| | | | | | | | |
| | | | | | | 1,107,642,971 | |
| | | | | | | | |
| |
| | | | Industrials – 6.87% | |
| | 3,884,500 | | | General Electric | | | 104,454,205 | |
| | 375,658 | | | Union Pacific | | | 71,536,553 | |
| | 1,560,000 | | | United Parcel Service, Class B | | | 153,660,000 | |
| | | | | | | | |
| | | | | | | 329,650,758 | |
| | | | | | | | |
| |
| | | | Information Technology – 16.88% | |
| | 1,259,900 | | | Accenture, Class A (Ireland) | | | 101,069,178 | |
| | 2,850,000 | | | eBay * | | | 147,715,500 | |
| | 181,891 | | | Google, Class A * | | | 97,289,858 | |
| | 85,000 | | | Google, Class C * | | | 44,766,100 | |
| | 5,350,000 | | | Juniper Networks * | | | 132,091,500 | |
| | 1,950,000 | | | QUALCOMM | | | 153,484,500 | |
| | 658,749 | | | Visa, Class A | | | 133,469,135 | |
| | | | | | | | |
| | | | | | | 809,885,771 | |
| | | | | | | | |
| |
| | | | Materials – 3.14% | |
| | 1,360,000 | | | Monsanto | | | 150,552,000 | |
| | | | | | | | |
| | |
| | | | Total Common Stocks
(Cost $3,664,586,709) | | | 4,437,562,956 | |
| | | | | | | | |
| |
| | INVESTMENT COMPANY – 6.86% | | | | |
| | |
| | 329,413,091 | | | BlackRock Liquidity Funds
TempCash Portfolio | | | 329,413,091 | |
| | | | | | | | |
| | |
| | | | Total Investment Company
(Cost $329,413,091) | | | 329,413,091 | |
| | | | | | | | |
| Total Investments – 99.36%
(Cost $3,993,999,800)** | | | 4,766,976,047 | |
| | | | | | | | |
| Net Other Assets and Liabilities ��� 0.64% | | | 30,549,294 | |
| | | | | | | | |
| Net Assets – 100.00% | | $ | 4,797,525,341 | |
| | | | | | | | |
| * | | Non-income producing security. |
| ** | | At April 30, 2014, cost is identical for book and Federal income tax purposes. |
| | | | |
Gross unrealized appreciation | | $ | 796,241,835 | |
Gross unrealized depreciation | | | (23,265,588 | ) |
| | | | |
Net unrealized appreciation | | $ | 772,976,247 | |
| | | | |
See accompanying Notes to Financial Statements.
| | |
| |
| ASTON/TAMRO Diversified Equity Fund | | April 30, 2014 |
| |
| Schedule of Investments (unaudited) | | |
| | | | | | | | |
Shares | | | | | Market
Value | |
|
| | COMMON STOCKS – 98.62% | |
| | |
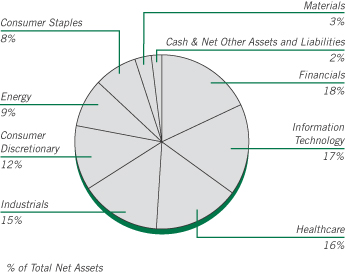
| | | | Consumer Discretionary – 11.63% | | | | |
| | 5,184 | | | Amazon.com * | | $ | 1,576,610 | |
| | 22,621 | | | CarMax * | | | 990,347 | |
| | 9,924 | | | Home Depot | | | 789,057 | |
| | 7,829 | | | Keurig Green Mountain | | | 733,421 | |
| | 16,339 | | | Macy’s | | | 938,349 | |
| | 484 | | | NVR * | | | 521,268 | |
| | 12,781 | | | Red Robin Gourmet Burgers * | | | 868,852 | |
| | | | | | | | |
| | | | | | | 6,417,904 | |
| | | | | | | | |
| | |
| | | | Consumer Staples – 8.03% | | | | |
| | 9,266 | | | Constellation Brands, Class A * | | | 739,797 | |
| | 24,672 | | | Mondelez International, Class A | | | 879,557 | |
| | 15,588 | | | Sysco | | | 567,871 | |
| | 17,886 | | | United Natural Foods * | | | 1,234,671 | |
| | 14,916 | | | Walgreen | | | 1,012,796 | |
| | | | | | | | |
| | | | | | | 4,434,692 | |
| | | | | | | | |
| | |
| | | | Energy – 9.21% | | | | |
| | 8,682 | | | Continental Resources * | | | 1,202,631 | |
| | 10,475 | | | Kinder Morgan | | | 342,113 | |
| | 5,585 | | | Occidental Petroleum | | | 534,764 | |
| | 7,986 | | | Phillips 66 | | | 664,595 | |
| | 13,402 | | | Range Resources | | | 1,212,211 | |
| | 37,768 | | | Ultra Petroleum (Canada) * | | | 1,125,486 | |
| | | | | | | | |
| | | | | | | 5,081,800 | |
| | | | | | | | |
| | |
| | | | Financials – 17.68% | | | | |
| | 13,260 | | | American Express | | | 1,159,322 | |
| | 25,181 | | | American International Group | | | 1,337,866 | |
| | 13,761 | | | American Tower, REIT | | | 1,149,319 | |
| | 18,595 | | | Bank of the Ozarks | | | 1,113,840 | |
| | 8,391 | | | Berkshire Hathaway, Class B * | | | 1,081,180 | |
| | 23,943 | | | Citigroup | | | 1,147,109 | |
| | | | | | | | |
Shares | | | | | Market
Value | |
| | |
| | | | Financials (continued) | | | | |
| | 46,170 | | | FirstMerit | | $ | 895,236 | |
| | 22,361 | | | Ocwen Financial Corp * | | | 847,482 | |
| | 18,032 | | | Portfolio Recovery Associates * | | | 1,030,529 | |
| | | | | | | | |
| | | | | | | 9,761,883 | |
| | | | | | | | |
| | |
| | | | Healthcare – 16.39% | | | | |
| | 6,152 | | | Allergan | | | 1,020,248 | |
| | 4,717 | | | Athenahealth * | | | 583,210 | |
| | 41,715 | | | Auxilium Pharmaceuticals * | | | 939,005 | |
| | 15,047 | | | DaVita HealthCare Partners * | | | 1,042,757 | |
| | 22,441 | | | DexCom * | | | 727,986 | |
| | 12,781 | | | Edwards Lifesciences * | | | 1,041,268 | |
| | 15,460 | | | Express Scripts * | | | 1,029,327 | |
| | 22,447 | | | Gilead Sciences * | | | 1,761,865 | |
| | 8,903 | | | Johnson & Johnson | | | 901,785 | |
| | | | | | | | |
| | | | | | | 9,047,451 | |
| | | | | | | | |
| | |
| | | | Industrials – 15.21% | | | | |
| | 39,845 | | | American Airlines Group * | | | 1,397,364 | |
| | 8,632 | | | Boeing | | | 1,113,701 | |
| | 15,014 | | | Chicago Bridge & Iron (Netherlands) | | | 1,202,171 | |
| | 16,343 | | | Cintas | | | 963,093 | |
| | 16,951 | | | Colfax * | | | 1,220,133 | |
| | 12,673 | | | Danaher | | | 929,945 | |
| | 4,155 | | | Middleby * | | | 1,049,054 | |
| | 9,129 | | | Spirit Airlines * | | | 518,892 | |
| | | | | | | | |
| | | | | | | 8,394,353 | |
| | | | | | | | |
| | |
| | | | Information Technology – 17.11% | | | | |
| | 6,299 | | | Baidu, SP ADR * | | | 969,101 | |
| | 42,949 | | | Cisco Systems | | | 992,551 | |
| | 25,254 | | | Facebook, Class A * | | | 1,509,684 | |
| | 1,110 | | | Google, Class A * | | | 593,717 | |
| | 1,110 | | | Google, Class C * | | | 584,593 | |
| | 29,792 | | | Hewlett-Packard | | | 984,924 | |
| | 16,031 | | | Pandora Media * | | | 375,446 | |
| | 14,970 | | | QUALCOMM | | | 1,178,289 | |
| | 19,451 | | | Seagate Technology (Ireland) | | | 1,022,734 | |
| | 29,982 | | | Skyworks Solutions * | | | 1,230,761 | |
| | | | | | | | |
| | | | | | | 9,441,800 | |
| | | | | | | | |
| | |
| | | | Materials – 3.36% | | | | |
| | 4,269 | | | CF Industries Holdings | | | 1,046,631 | |
| | 7,283 | | | Monsanto | | | 806,228 | |
| | | | | | | | |
| | | | | | | 1,852,859 | |
| | | | | | | | |
| | |
| | | | Total Common Stocks
(Cost $42,206,971) | | | 54,432,742 | |
| | | | | | | | |
See accompanying Notes to Financial Statements.
| | |
| |
| ASTON/TAMRO Diversified Equity Fund | | April 30, 2014 |
| |
| Schedule of Investments (unaudited) – continued | | |
| | | | | | | | |
Shares | | | | | Market
Value | |
| |
| | INVESTMENT COMPANY – 1.65% | | | | |
| | |
| | 911,216 | | | BlackRock Liquidity Funds
TempCash Portfolio | | $ | 911,216 | |
| | | | | | | | |
| | |
| | | | Total Investment Company
(Cost $911,216) | | | 911,216 | |
| | | | | | | | |
| Total Investments – 100.27%
(Cost $43,118,187)** | | | 55,343,958 | |
| | | | | | | | |
| Net Other Assets and Liabilities – (0.27)% | | | (147,563 | ) |
| | | | | | | | |
| Net Assets – 100.00% | | $ | 55,196,395 | |
| | | | | | | | |
| * | | Non-income producing security. |
| ** | | At April 30, 2014, cost is identical for book and Federal income tax purposes. |
| | | | |
Gross unrealized appreciation | | $ | 13,495,745 | |
Gross unrealized depreciation | | | (1,269,974 | ) |
| | | | |
Net unrealized appreciation | | $ | 12,225,771 | |
| | | | |
| REIT | | Real Estate Investment Trust |
| SP ADR | | Sponsored American Depositary Receipt |
See accompanying Notes to Financial Statements.
| | |
| |
| ASTON/Herndon Large Cap Value Fund | | April 30, 2014 |
| |
| Schedule of Investments (unaudited) | | |
| | | | | | | | |
Shares | | | | | Market
Value | |
|
| | COMMON STOCKS – 95.04% | |
| | |
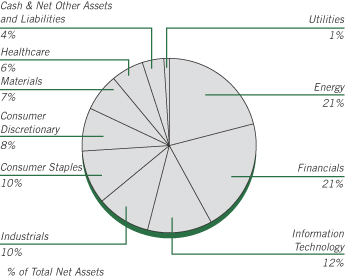
| | | | Consumer Discretionary – 7.84% | | | | |
| | 45,833 | | | Coach | | $ | 2,046,443 | |
| | 37,562 | | | Ross Stores | | | 2,557,221 | |
| | 71,335 | | | TJX | | | 4,150,270 | |
| | 36,184 | | | Yum! Brands | | | 2,785,806 | |
| | | | | | | | |
| | | | | | | 11,539,740 | |
| | | | | | | | |
| | |
| | | | Consumer Staples – 9.76% | | | | |
| | 85,808 | | | Altria Group | | | 3,441,759 | |
| | 57,205 | | | Campbell Soup | | | 2,602,255 | |
| | 54,104 | | | Colgate-Palmolive | | | 3,641,199 | |
| | 29,981 | | | Kellogg | | | 2,003,630 | |
| | 31,359 | | | Philip Morris International | | | 2,678,999 | |
| | | | | | | | |
| | | | | | | 14,367,842 | |
| | | | | | | | |
| | |
| | | | Energy – 20.67% | | | | |
| | 32,049 | | | Apache | | | 2,781,853 | |
| | 31,704 | | | Chevron | | | 3,979,486 | |
| | 21,366 | | | ConocoPhillips | | | 1,587,707 | |
| | 24,467 | | | Continental Resources * | | | 3,389,170 | |
| | 30,670 | | | Exxon Mobil | | | 3,140,915 | |
| | 63,409 | | | HollyFrontier | | | 3,334,679 | |
| | 46,522 | | | Marathon Petroleum | | | 4,324,220 | |
| | 41,698 | | | Murphy Oil | | | 2,644,904 | |
| | 61,341 | | | Oasis Petroleum * | | | 2,852,970 | |
| | 32,049 | | | SM Energy | | | 2,375,792 | |
| | | | | | | | |
| | | | | | | 30,411,696 | |
| | | | | | | | |
| | |
| | | | Financials – 20.60% | | | | |
| | 63,409 | | | Aflac | | | 3,977,013 | |
| | 145,427 | | | American Capital Agency, REIT | | | 3,302,647 | |
| | 96,836 | | | Apartment Investment & Management,
Class A, REIT | | | 2,985,454 | |
| | | | | | | | |
Shares | | | | | Market
Value | |
| | |
| | | | Financials (continued) | | | | |
| | 77,193 | | | CBOE Holdings | | $ | 4,119,018 | |
| | 64,098 | | | Discover Financial Services | | | 3,583,078 | |
| | 69,956 | | | Eaton Vance | | | 2,523,313 | |
| | 38,596 | | | McGraw-Hill | | | 2,853,402 | |
| | 111,654 | | | SLM | | | 2,875,091 | |
| | 60,652 | | | Waddell & Reed Financial, Class A | | | 4,090,977 | |
| | | | | | | | |
| | | | | | | 30,309,993 | |
| | | | | | | | |
| | |
| | | | Healthcare – 6.09% | | | | |
| | 36,529 | | | Baxter International | | | 2,658,946 | |
| | 75,125 | | | Mylan * | | | 3,814,848 | |
| | 24,812 | | | United Therapeutics * | | | 2,481,448 | |
| | | | | | | | |
| | | | | | | 8,955,242 | |
| | | | | | | | |
| | |
| | | | Industrials – 10.19% | | | | |
| | 3,790 | | | Caterpillar | | | 399,467 | |
| | 9,649 | | | Copa Holdings SA, Class A (Panama) | | | 1,305,317 | |
| | 59,618 | | | Joy Global | | | 3,599,735 | |
| | 25,846 | | | Lockheed Martin | | | 4,242,362 | |
| | 34,806 | | | Rockwell Collins | | | 2,702,686 | |
| | 27,913 | | | United Parcel Service, Class B | | | 2,749,431 | |
| | | | | | | | |
| | | | | | | 14,998,998 | |
| | | | | | | | |
| | |
| | | | Information Technology – 12.31% | | | | |
| | 7,236 | | | Apple | | | 4,269,891 | |
| | 17,919 | | | International Business Machines | | | 3,520,546 | |
| | 85,119 | | | Microsoft | | | 3,438,808 | |
| | 42,042 | | | NeuStar, Class A * | | | 1,081,320 | |
| | 44,455 | | | Western Digital | | | 3,917,819 | |
| | 118,547 | | | Western Union | | | 1,881,341 | |
| | | | | | | | |
| | | | | | | 18,109,725 | |
| | | | | | | | |
| | |
| | | | Materials – 6.65% | | | | |
| | 11,372 | | | CF Industries Holdings | | | 2,788,074 | |
| | 36,184 | | | LyondellBasell Industries NV, Class A, (Netherlands) | | | 3,347,020 | |
| | 8,270 | | | Newmarket | | | 3,079,086 | |
| | 18,953 | | | Southern Copper | | | 571,243 | |
| | | | | | | | |
| | | | | | | 9,785,423 | |
| | | | | | | | |
| | |
| | | | Utilities – 0.93% | | | | |
| | 94,768 | | | AES | | | 1,369,398 | |
| | | | | | | | |
| | |
| | | | Total Common Stocks
(Cost $119,086,211) | | | 139,848,057 | |
| | | | | | | | |
See accompanying Notes to Financial Statements.
| | |
| |
| ASTON/Herndon Large Cap Value Fund | | April 30, 2014 |
| |
| Schedule of Investments (unaudited) – continued | | |
| | | | | | | | |
Shares | | | | | Market
Value | |
| |
| | INVESTMENT COMPANY – 4.70% | | | | |
| | |
| | 6,916,272 | | | BlackRock Liquidity Funds
TempCash Portfolio | | $ | 6,916,272 | |
| | | | | | | | |
| | |
| | | | Total Investment Company
(Cost $6,916,272) | | | 6,916,272 | |
| | | | | | | | |
| Total Investments – 99.74%
(Cost $126,002,483)** | | | 146,764,329 | |
| | | | | | | | |
| Net Other Assets and Liabilities – 0.26% | | | 383,648 | |
| | | | | | | | |
| Net Assets – 100.00% | | $ | 147,147,977 | |
| | | | | | | | |
| * | | Non-income producing security. |
| ** | | At April 30, 2014, cost is identical for book and Federal income tax purposes. |
| | | | |
Gross unrealized appreciation | | $ | 22,841,595 | |
Gross unrealized depreciation | | | (2,079,749 | ) |
| | | | |
Net unrealized appreciation | | $ | 20,761,846 | |
| | | | |
| REIT | | Real Estate Investment Trust |
See accompanying Notes to Financial Statements.
| | |
| |
| ASTON/Cornerstone Large Cap Value Fund | | April 30, 2014 |
| |
| Schedule of Investments (unaudited) | | |
| | | | | | | | |
Shares | | | | | Market
Value | |
|
| | COMMON STOCKS – 97.11% | |
| | |
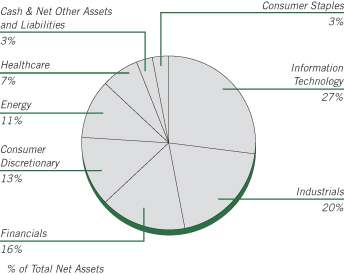
| | | | Consumer Discretionary – 12.87% | | | | |
| | 57,485 | | | Bed Bath & Beyond * | | $ | 3,571,542 | |
| | 69,850 | | | Gap | | | 2,745,105 | |
| | 57,175 | | | Hasbro | | | 3,159,491 | |
| | 116,425 | | | Mattel | | | 4,565,606 | |
| | | | | | | | |
| | | | | | | 14,041,744 | |
| | | | | | | | |
| | |
| | | | Consumer Staples – 3.57% | | | | |
| | 48,925 | | | Wal-Mart Stores | | | 3,899,811 | |
| | | | | | | | |
| |
| | | | Energy – 10.70% | |
| | 35,950 | | | Chevron | | | 4,512,443 | |
| | 33,025 | | | Exxon Mobil | | | 3,382,090 | |
| | 48,125 | | | Royal Dutch Shell PLC, ADR | | | 3,789,363 | |
| | | | | | | | |
| | | | | | | 11,683,896 | |
| | | | | | | | |
| | |
| | | | Financials – 15.81% | | | | |
| | 38,500 | | | ACE (Switzerland) | | | 3,939,320 | |
| | 46,875 | | | Capital One Financial | | | 3,464,063 | |
| | 64,550 | | | Citigroup | | | 3,092,591 | |
| | 59,550 | | | JPMorgan Chase | | | 3,333,609 | |
| | 103,175 | | | Unum Group | | | 3,427,474 | |
| | | | | | | | |
| | | | | | | 17,257,057 | |
| | | | | | | | |
| | |
| | | | Healthcare – 6.59% | | | | |
| | 52,475 | | | Baxter International | | | 3,819,655 | |
| | 33,300 | | | Johnson & Johnson | | | 3,372,957 | |
| | | | | | | | |
| | | | | | | 7,192,612 | |
| | | | | | | | |
| | |
| | | | Industrials – 20.03% | | | | |
| | 22,625 | | | 3M | | | 3,146,911 | |
| | 26,525 | | | Cummins | | | 4,001,296 | |
| | 66,325 | | | Emerson Electric | | | 4,522,039 | |
| | 8,320 | | | Grainger (W.W.) | | | 2,116,608 | |
| | | | | | | | |
Shares | | | | | Market
Value | |
| | |
| | | | Industrials (continued) | | | | |
| | 37,150 | | | Norfolk Southern | | $ | 3,511,790 | |
| | 35,950 | | | Parker Hannifin | | | 4,561,336 | |
| | | | | | | | |
| | | | | | | 21,859,980 | |
| | | | | | | | |
| | |
| | | | Information Technology – 27.54% | | | | |
| | 4,100 | | | Apple | | | 2,419,369 | |
| | 142,290 | | | EMC | | | 3,671,082 | |
| | 2,390 | | | Google, Class A * | | | 1,278,363 | |
| | 2,005 | | | Google, Class C * | | | 1,055,953 | |
| | 122,775 | | | Intel | | | 3,276,865 | |
| | 11,255 | | | International Business Machines | | | 2,211,270 | |
| | 92,550 | | | Microsoft | | | 3,739,020 | |
| | 112,150 | | | Oracle | | | 4,584,692 | |
| | 54,225 | | | QUALCOMM | | | 4,268,050 | |
| | 40,250 | | | Western Digital | | | 3,547,233 | |
| | | | | | | | |
| | | | | | | 30,051,897 | |
| | | | | | | | |
| | |
| | | | Total Common Stocks
(Cost $95,342,386) | | | 105,986,997 | |
| | | | | | | | |
| |
| | INVESTMENT COMPANY – 2.80% | | | | |
| | |
| | 3,055,848 | | | BlackRock Liquidity Funds
TempCash Portfolio | | | 3,055,848 | |
| | | | | | | | |
| | |
| | | | Total Investment Company
(Cost $3,055,848) | | | 3,055,848 | |
| | | | | | | | |
| Total Investments – 99.91%
(Cost $98,398,234)** | | | 109,042,845 | |
| | | | | | | | |
| Net Other Assets and Liabilities – 0.09% | | | 94,801 | |
| | | | | | | | |
| Net Assets – 100.00% | | $ | 109,137,646 | |
| | | | | | | | |
| * | | Non-income producing security. |
| ** | | At April 30, 2014, cost is identical for book and federal income tax purposes. |
| | | | |
Gross unrealized appreciation | | $ | 11,138,005 | |
Gross unrealized depreciation | | | (493,394 | ) |
| | | | |
Net unrealized appreciation | | $ | 10,644,611 | |
| | | | |
| ADR | | American Depositary Receipt |
See accompanying Notes to Financial Statements.
| | |
| |
| ASTON/River Road Dividend All Cap Value Fund | | April 30, 2014 |
| |
| Schedule of Investments (unaudited) | | |
| | | | | | | | |
Shares | | | | | Market
Value | |
|
| | COMMON STOCKS – 97.84% | |
| | |
| | | | Consumer Discretionary – 16.33% | | | | |
| | 510,605 | | | Bob Evans Farms | | $ | 23,932,056 | |
| | 446,015 | | | Cinemark Holdings | | | 13,210,964 | |
| | 348,650 | | | Coach | | | 15,567,223 | |
| | 331,595 | | | Darden Restaurants | | | 16,483,587 | |
| | 484,515 | | | Hasbro | | | 26,774,299 | |
| | 459,900 | | | Kohl’s | | | 25,197,921 | |
| | 677,690 | | | National CineMedia | | | 10,294,111 | |
| | 540,150 | | | Shaw Communications, Class B (Canada) | | | 13,087,834 | |
| | 1,263,035 | | | Staples | | | 15,787,937 | |
| | 350,345 | | | Target | | | 21,633,804 | |
| | 576,665 | | | Thomson Reuters (Canada) | | | 20,863,740 | |
| | | | | | | | |
| | | | | | | 202,833,476 | |
| | | | | | | | |
| | |
| | | | Consumer Staples – 13.30% | | | | |
| | 565,575 | | | Dr Pepper Snapple Group | | | 31,344,167 | |
| | 159,800 | | | Energizer Holdings | | | 17,848,062 | |
| | 219,905 | | | Kimberly-Clark | | | 24,684,336 | |
| | 294,235 | | | Molson Coors Brewing, Class B | | | 17,645,273 | |
| | 261,075 | | | PepsiCo | | | 22,423,732 | |
| | 190,730 | | | Procter & Gamble | | | 15,744,761 | |
| | 616,655 | | | Sysco | | | 22,464,742 | |
| | 163,215 | | | Wal-Mart Stores | | | 13,009,868 | |
| | | | | | | | |
| | | | | | | 165,164,941 | |
| | | | | | | | |
| | |
| | | | Energy – 9.44% | | | | |
| | 169,985 | | | Chevron | | | 21,336,517 | |
| | 309,550 | | | Ensco, Class A (United Kingdom) | | | 15,616,797 | |
| | 587,150 | | | Memorial Production Partners LP | | | 13,762,796 | |
| | 349,240 | | | Occidental Petroleum | | | 33,439,730 | |
| | 149,990 | | | Transmontaigne Partners LP | | | 6,854,543 | |
| | | | | | | | |
Shares | | | | | Market
Value | |
| | |
| | | | Energy – (continued) | | | | |
| | 508,165 | | | Williams Partners LP | | $ | 26,211,151 | |
| | | | | | | | |
| | | | | | | 117,221,534 | |
| | | | | | | | |
| | |
| | | | Financials – 13.52% | | | | |
| | 64,485 | | | BlackRock | | | 19,409,985 | |
| | 310,545 | | | CME Group | | | 21,859,263 | |
| | 411,905 | | | Compass Diversified Holdings | | | 7,616,123 | |
| | 529,675 | | | Geo Group, REIT | | | 17,760,003 | |
| | 46,613 | | | OneBeacon Insurance Group, Class A (Bermuda) | | | 719,705 | |
| | 196,425 | | | PartnerRe (Bermuda) | | | 20,703,195 | |
| | 346,240 | | | PNC Financial Services Group | | | 29,098,010 | |
| | 831,128 | | | Sabra Health Care, REIT | | | 24,908,906 | |
| | 68,650 | | | Safety Insurance Group | | | 3,687,191 | |
| | 542,055 | | | U.S. Bancorp | | | 22,105,003 | |
| | | | | | | | |
| | | | | | | 167,867,384 | |
| | | | | | | | |
| | |
| | | | Healthcare – 4.11% | | | | |
| | 151,360 | | | Becton, Dickinson | | | 17,108,221 | |
| | 516,827 | | | Owens & Minor | | | 17,334,378 | |
| | 295,585 | | | Quest Diagnostics | | | 16,532,069 | |
| | | | | | | | |
| | | | | | | 50,974,668 | |
| | | | | | | | |
| | |
| | | | Industrials – 12.56% | | | | |
| | 210,725 | | | ABM Industries | | | 5,708,540 | |
| | 516,980 | | | ADT | | | 15,633,475 | |
| | 668,470 | | | Aircastle (Berumda) | | | 11,745,018 | |
| | 299,605 | | | Emerson Electric | | | 20,427,069 | |
| | 267,725 | | | General Dynamics | | | 29,302,501 | |
| | 597,619 | | | Iron Mountain | | | 16,996,284 | |
| | 129,415 | | | Norfolk Southern | | | 12,233,600 | |
| | 527,325 | | | Republic Services | | | 18,503,834 | |
| | 257,705 | | | United Parcel Service, Class B | | | 25,383,943 | |
| | | | | | | | |
| | | | | | | 155,934,264 | |
| | | | | | | | |
| | |
| | | | Information Technology – 14.79% | | | | |
| | 578,105 | | | CA | | | 17,424,085 | |
| | 1,536,675 | | | Corning | | | 32,131,874 | |
| | 1,479,685 | | | Intel | | | 39,492,793 | |
| | 353,695 | | | j2 Global | | | 16,397,300 | |
| | 722,745 | | | Microsoft | | | 29,198,898 | |
| | 365,425 | | | QUALCOMM | | | 28,762,602 | |
| | 1,280,020 | | | Western Union | | | 20,313,917 | |
| | | | | | | | |
| | | | | | | 183,721,469 | |
| | | | | | | | |
| | |
| | | | Materials – 3.64% | | | | |
| | 344,480 | | | Bemis | | | 13,861,875 | |
| | 60,607 | | | Compass Minerals International | | | 5,551,601 | |
| | 167,925 | | | Innophos Holdings | | | 9,477,687 | |
| | 315,230 | | | Nucor | | | 16,313,153 | |
| | | | | | | | |
| | | | | | | 45,204,316 | |
| | | | | | | | |
| | |
| | | | Telecommunication Services – 6.14% | | | | |
| | 134,800 | | | Atlantic Tele-Network | | | 7,976,116 | |
| | 672,395 | | | Rogers Communications, Class B (Canada) | | | 26,707,529 | |
See accompanying Notes to Financial Statements.
| | |
| |
| ASTON/River Road Dividend All Cap Value Fund | | April 30, 2014 |
| |
| Schedule of Investments (unaudited) – continued | | |
| | | | | | | | |
Shares | | | | | Market
Value | |
| |
| | | | Telecommunication Services (continued) | |
| | 645,630 | | | Verizon Communications | | $ | 30,170,290 | |
| | 299,596 | | | Vodafone Group, SP ADR (United Kingdom) | | | 11,372,664 | |
| | | | | | | | |
| | | | | | | 76,226,599 | |
| | | | | | | | |
| | |
| | | | Utilities – 4.01% | | | | |
| | 357,895 | | | AmeriGas Partners LP | | | 16,599,170 | |
| | 450,925 | | | National Fuel Gas | | | 33,206,117 | |
| | | | | | | | |
| | | | | | | 49,805,287 | |
| | | | | | | | |
| | |
| | | | Total Common Stocks
(Cost $994,441,751) | | | 1,214,953,938 | |
| | | | | | | | |
| |
| | INVESTMENT COMPANY – 2.12% | | | | |
| | |
| | 26,390,240 | | | BlackRock Liquidity Funds
TempCash Portfolio | | | 26,390,240 | |
| | | | | | | | |
| | |
| | | | Total Investment Company
(Cost $26,390,240) | | | 26,390,240 | |
| | | | | | | | |
| Total Investments – 99.96%
(Cost $1,020,831,991)* | | | 1,241,344,178 | |
| | | | | | | | |
| Net Other Assets and Liabilities – 0.04% | | | 467,948 | |
| | | | | | | | |
| Net Assets – 100.00% | | $ | 1,241,812,126 | |
| | | | | | | | |
| * | | At April 30, 2014, cost is identical for book and Federal income tax purposes. |
| | | | |
Gross unrealized appreciation | | $ | 235,028,977 | |
Gross unrealized depreciation | | | (14,516,790 | ) |
| | | | |
Net unrealized appreciation | | $ | 220,512,187 | |
| | | | |
| REIT | | Real Estate Investment Trust |
| SP ADR | | Sponsored American Depositary Receipt |
See accompanying Notes to Financial Statements.
| | |
| |
| ASTON/River Road Dividend All Cap Value Fund II | | April 30, 2014 |
| |
| Schedule of Investments (unaudited) | | |
| | | | | | | | |
Shares | | | | | Market
Value | |
|
| | COMMON STOCKS – 97.27% | |
| | |
| | | | Consumer Discretionary – 15.78% | | | | |
| | 25,108 | | | Bob Evans Farms | | $ | 1,176,811 | |
| | 43,022 | | | Cinemark Holdings | | | 1,274,312 | |
| | 34,204 | | | Coach | | | 1,527,209 | |
| | 33,445 | | | Darden Restaurants | | | 1,662,551 | |
| | 47,045 | | | Hasbro | | | 2,599,707 | |
| | 44,972 | | | Kohl’s | | | 2,464,016 | |
| | 52,879 | | | Shaw Communications, Class B (Canada) | | | 1,281,258 | |
| | 122,045 | | | Staples | | | 1,525,563 | |
| | 34,314 | | | Target | | | 2,118,890 | |
| | 56,621 | | | Thomson Reuters (Canada) | | | 2,048,548 | |
| | | | | | | | |
| | | | | | | 17,678,865 | |
| | | | | | | | |
| | |
| | | | Consumer Staples – 14.34% | | | | |
| | 54,649 | | | Dr Pepper Snapple Group | | | 3,028,647 | |
| | 15,635 | | | Energizer Holdings | | | 1,746,273 | |
| | 21,398 | | | Kimberly-Clark | | | 2,401,926 | |
| | 29,054 | | | Molson Coors Brewing, Class B | | | 1,742,368 | |
| | 25,653 | | | PepsiCo | | | 2,203,336 | |
| | 18,119 | | | Procter & Gamble | | | 1,495,723 | |
| | 60,274 | | | Sysco | | | 2,195,782 | |
| | 15,759 | | | Wal-Mart Stores | | | 1,256,150 | |
| | | | | | | | |
| | | | | | | 16,070,205 | |
| | | | | | | | |
| | |
| | | | Energy – 9.01% | | | | |
| | 16,860 | | | Chevron | | | 2,116,266 | |
| | 29,066 | | | Ensco, Class A (United Kingdom) | | | 1,466,380 | |
| | 25,779 | | | Memorial Production Partners LP | | | 604,260 | |
| | 34,841 | | | Occidental Petroleum | | | 3,336,026 | |
| | 49,814 | | | Williams Partners LP | | | 2,569,406 | |
| | | | | | | | |
| | | | | | | 10,092,338 | |
| | | | | | | | |
| | | | | | | | |
Shares | | | | | Market
Value | |
| | |
| | | | Financials – 11.09% | | | | |
| | 5,673 | | | BlackRock | | $ | 1,707,572 | |
| | 30,118 | | | CME Group | | | 2,120,006 | |
| | 51,203 | | | Geo Group, REIT | | | 1,716,837 | |
| | 18,766 | | | PartnerRe (Bermuda) | | | 1,977,936 | |
| | 33,143 | | | PNC Financial Services Group | | | 2,785,338 | |
| | 52,075 | | | U.S. Bancorp | | | 2,123,619 | |
| | | | | | | | |
| | | | | | | 12,431,308 | |
| | | | | | | | |
| | |
| | | | Healthcare – 4.11% | | | | |
| | 14,679 | | | Becton, Dickinson | | | 1,659,167 | |
| | 39,835 | | | Owens & Minor | | | 1,336,066 | |
| | 28,835 | | | Quest Diagnostics | | | 1,612,742 | |
| | | | | | | | |
| | | | | | | 4,607,975 | |
| | | | | | | | |
| | |
| | | | Industrials – 13.39% | | | | |
| | 21,523 | | | ABM Industries | | | 583,058 | |
| | 50,656 | | | ADT | | | 1,531,837 | |
| | 58,421 | | | Aircastle (Bermuda) | | | 1,026,457 | |
| | 27,404 | | | Emerson Electric | | | 1,868,405 | |
| | 25,830 | | | General Dynamics | | | 2,827,094 | |
| | 57,784 | | | Iron Mountain | | | 1,643,377 | |
| | 12,946 | | | Norfolk Southern | | | 1,223,785 | |
| | 52,660 | | | Republic Services | | | 1,847,839 | |
| | 24,914 | | | United Parcel Service, Class B | | | 2,454,029 | |
| | | | | | | | |
| | | | | | | 15,005,881 | |
| | | | | | | | |
| | |
| | | | Information Technology – 16.06% | | | | |
| | 55,526 | | | CA | | | 1,673,554 | |
| | 152,933 | | | Corning | | | 3,197,829 | |
| | 147,357 | | | Intel | | | 3,932,958 | |
| | 31,607 | | | j2 Global | | | 1,465,301 | |
| | 70,644 | | | Microsoft | | | 2,854,018 | |
| | 36,523 | | | QUALCOMM | | | 2,874,725 | |
| | 125,604 | | | Western Union | | | 1,993,335 | |
| | | | | | | | |
| | | | | | | 17,991,720 | |
| | | | | | | | |
| | |
| | | | Materials – 3.48% | | | | |
| | 32,562 | | | Bemis | | | 1,310,295 | |
| | 5,753 | | | Compass Minerals International | | | 526,975 | |
| | 9,667 | | | Innophos Holdings | | | 545,605 | |
| | 29,178 | | | Nucor | | | 1,509,962 | |
| | | | | | | | |
| | | | | | | 3,892,837 | |
| | | | | | | | |
| | |
| | | | Telecommunication Services – 6.01% | | | | |
| | 66,811 | | | Rogers Communications, Class B (Canada) | | | 2,653,733 | |
| | 63,930 | | | Verizon Communications | | | 2,987,449 | |
| | 28,781 | | | Vodafone Group SP ADR | | | 1,092,527 | |
| | | | | | | | |
| | | | | | | 6,733,709 | |
| | | | | | | | |
See accompanying Notes to Financial Statements.
| | |
| |
| ASTON/River Road Dividend All Cap Value Fund II | | April 30, 2014 |
| |
| Schedule of Investments (unaudited) – continued | | |
| | | | | | | | |
Shares | | | | | Market
Value | |
| | |
| | | | Utilities – 4.00% | | | | |
| | 25,255 | | | AmeriGas Partners LP | | $ | 1,171,327 | |
| | 45,011 | | | National Fuel Gas | | | 3,314,610 | |
| | | | | | | | |
| | | | | | | 4,485,937 | |
| | | | | | | | |
| | |
| | | | Total Common Stocks
(Cost $100,196,434) | | | 108,990,775 | |
| | | | | | | | |
| |
| | INVESTMENT COMPANY – 4.77% | | | | |
| | |
| | 5,347,988 | | | BlackRock Liquidity Funds
TempCash Portfolio | | | 5,347,988 | |
| | | | | | | | |
| | |
| | | | Total Investment Company
(Cost $5,347,988) | | | 5,347,988 | |
| | | | | | | | |
| Total Investments – 102.04%
(Cost $105,544,422)* | | | 114,338,763 | |
| | | | | | | | |
| Net Other Assets and Liabilities – (2.04)% | | | (2,284,408 | ) |
| | | | | | | | |
| Net Assets – 100.00% | | $ | 112,054,355 | |
| | | | | | | | |
| * | | At April 30, 2014, cost is identical for book and Federal income tax purposes. |
| | | | |
Gross unrealized appreciation | | $ | 10,658,345 | |
Gross unrealized depreciation | | | (1,864,004 | ) |
| | | | |
Net unrealized appreciation | | $ | 8,794,341 | |
| | | | |
| REIT | | Real Estate Investment Trust |
| SP ADR | | Sponsored American Depositary Receipt |
See accompanying Notes to Financial Statements.
| | |
| |
| ASTON/Fairpointe Mid Cap Fund | | April 30, 2014 |
| |
| Schedule of Investments (unaudited) | | |

| | | | | | | | |
Shares | | | | | Market
Value | |
|
| | COMMON STOCKS – 95.43% | |
| | |
| | | | Consumer Discretionary – 21.37% | | | | |
| | 634,000 | | | BorgWarner | | $ | 39,396,760 | |
| | 6,284,800 | | | Cooper Tire & Rubber | | | 158,062,720 | |
| | 3,066,300 | | | DeVry | | | 138,075,488 | |
| | 3,593,500 | | | Gannett | | | 97,635,395 | |
| | 8,029,768 | | | Interpublic Group | | | 139,878,559 | |
| | 991,600 | | | Lear | | | 82,362,296 | |
| | 3,042,500 | | | Mattel | | | 119,311,638 | |
| | 9,275,454 | | | New York Times, Class A | | | 149,149,300 | |
| | 2,586,798 | | | Scholastic | | | 85,131,522 | |
| | 14,284,300 | | | Staples | | | 178,553,750 | |
| | | | | | | | |
| | | | | | | 1,187,557,428 | |
| | | | | | | | |
| | |
| | | | Consumer Staples – 3.53% | | | | |
| | 1,143,900 | | | Bunge | | | 91,111,635 | |
| | 1,749,286 | | | Molson Coors Brewing, Class B | | | 104,904,681 | |
| | | | | | | | |
| | | | | | | 196,016,316 | |
| | | | | | | | |
| | |
| | | | Energy – 4.88% | | | | |
| | 2,970,192 | | | FMC Technologies * | | | 168,409,886 | |
| | 14,212,100 | | | McDermott International * | | | 102,753,483 | |
| | | | | | | | |
| | | | | | | 271,163,369 | |
| | | | | | | | |
| | |
| | | | Financials – 5.89% | | | | |
| | 1,137,800 | | | Cincinnati Financial | | | 55,456,372 | |
| | 1,532,185 | | | Eaton Vance | | | 55,265,913 | |
| | 1,657,400 | | | Northern Trust | | | 99,858,350 | |
| | 2,347,200 | | | Raymond James Financial | | | 116,655,840 | |
| | | | | | | | |
| | | | | | | 327,236,475 | |
| | | | | | | | |
| | |
| | | | Healthcare – 10.43% | | | | |
| | 1,062,719 | | | Charles River Laboratories * | | | 57,089,265 | |
| | 1,927,900 | | | Edwards Lifesciences * | | | 157,066,013 | |
| | | | | | | | |
Shares | | | | | Market
Value | |
| | |
| | | | Healthcare (continued) | | | | |
| | 2,841,295 | | | Hospira * | | $ | 130,131,311 | |
| | 1,969,300 | | | Quest Diagnostics | | | 110,142,949 | |
| | 1,572,300 | | | Varian Medical Systems * | | | 125,076,465 | |
| | | | | | | | |
| | | | | | | 579,506,003 | |
| | | | | | | | |
| | |
| | | | Industrials – 16.07% | | | | |
| | 3,163,300 | | | AGCO | | | 176,195,810 | |
| | 2,781,100 | | | Con-way | | | 118,141,128 | |
| | 885,644 | | | ManpowerGroup | | | 72,038,283 | |
| | 3,352,400 | | | Owens Corning | | | 136,945,540 | |
| | 4,287,035 | | | Polypore International * | | | 148,674,374 | |
| | 3,935,600 | | | Werner Enterprises | | | 100,751,360 | |
| | 3,721,800 | | | Xylem | | | 139,902,462 | |
| | | | | | | | |
| | | | | | | 892,648,957 | |
| | | | | | | | |
| | |
| | | | Information Technology – 27.17% | | | | |
| | 2,418,800 | | | Akamai Technologies * | | | 128,365,716 | |
| | 2,726,500 | | | Citrix Systems * | | | 161,708,715 | |
| | 2,308,300 | | | Cree * | | | 108,882,511 | |
| | 753,600 | | | FactSet Research Systems | | | 80,258,400 | |
| | 680,300 | | | First Solar * | | | 45,913,447 | |
| | 773,100 | | | Harris | | | 56,838,312 | |
| | 3,584,148 | | | Itron * | | | 136,197,624 | |
| | 7,540,200 | | | Jabil Circuit | | | 130,143,852 | |
| | 6,327,200 | | | Juniper Networks * | | | 156,218,568 | |
| | 1,858,000 | | | Lexmark International, Class A | | | 79,894,000 | |
| | 10,114,000 | | | Nuance Communications * | | | 162,734,260 | |
| | 6,643,300 | | | NVIDIA | | | 122,701,751 | |
| | 3,354,218 | | | Unisys * | | | 81,742,293 | |
| | 838,400 | | | Zebra Technologies, Class A * | | | 58,218,496 | |
| | | | | | | | |
| | | | | | | 1,509,817,945 | |
| | | | | | | | |
| | |
| | | | Materials – 6.09% | | | | |
| | 9,500,000 | | | Alcoa | | | 127,965,000 | |
| | 432,400 | | | FMC | | | 33,294,800 | |
| | 658,600 | | | Sigma-Aldrich | | | 63,363,906 | |
| | 4,370,800 | | | United States Steel | | | 113,728,216 | |
| | | | | | | | |
| | | | | | | 338,351,922 | |
| | | | | | | | |
| | |
| | | | Total Common Stocks
(Cost $4,109,024,240) | | | 5,302,298,415 | |
| | | | | | | | |
| |
| | INVESTMENT COMPANY – 4.61% | | | | |
| | |
| | 256,314,516 | | | BlackRock Liquidity Funds
TempCash Portfolio | | | 256,314,516 | |
| | | | | | | | |
| | |
| | | | Total Investment Company
(Cost $256,314,516) | | | 256,314,516 | |
| | | | | | | | |
| Total Investments – 100.04%
(Cost $4,365,338,756)** | | | 5,558,612,931 | |
| | | | | | | | |
| Net Other Assets and Liabilities – (0.04)% | | | (2,329,908 | ) |
| | | | | | | | |
| Net Assets – 100.00% | | $ | 5,556,283,023 | |
| | | | | | | | |
See accompanying Notes to Financial Statements.
| | |
| |
| ASTON/Fairpointe Mid Cap Fund | | April 30, 2014 |
| |
| Schedule of Investments (unaudited) – continued | | |
| * | | Non-income producing security. |
| ** | | At April 30, 2014, cost is identical for book and Federal income tax purposes. |
| | | | |
Gross unrealized appreciation | | $ | 1,267,485,162 | |
Gross unrealized depreciation | | | (74,210,987 | ) |
| | | | |
Net unrealized appreciation | | $ | 1,193,274,175 | |
| | | | |
See accompanying Notes to Financial Statements.
| | |
| |
| ASTON/Montag & Caldwell Mid Cap Growth Fund | | April 30, 2014 |
| |
| Schedule of Investments (unaudited) | | |
| | | | | | | | |
Shares | | Market Value | |
| | | | | | | | |
|
| | COMMON STOCKS – 96.49% | |
| | |
| | | | Consumer Discretionary – 28.04% | | | | |
| | 4,430 | | | BorgWarner | | $ | 275,280 | |
| | 3,790 | | | Dick’s Sporting Goods | | | 199,582 | |
| | 5,000 | | | Dollar Tree * | | | 260,350 | |
| | 3,800 | | | Dunkin’ Brands Group | | | 172,938 | |
| | 2,600 | | | Harman International Industries | | | 284,986 | |
| | 8,090 | | | LKQ * | | | 235,581 | |
| | 4,830 | | | Marriott International, Class A | | | 279,802 | |
| | 2,230 | | | Michael Kors Holdings (Hong Kong) * | | | 203,376 | |
| | 2,040 | | | O’Reilly Automotive * | | | 303,532 | |
| | 974 | | | Panera Bread, Class A * | | | 148,993 | |
| | 2,070 | | | PVH | | | 259,930 | |
| | 989 | | | Ralph Lauren | | | 149,705 | |
| | 3,880 | | | Ross Stores | | | 264,150 | |
| | 2,250 | | | Tractor Supply | | | 151,290 | |
| | | | | | | | |
| | | | 3,189,495 | |
| | | | | | | | |
| | | | Consumer Staples – 6.08% | | | | |
| | 4,040 | | | Church & Dwight | | | 278,800 | |
| | 2,120 | | | Mead Johnson Nutrition | | | 187,111 | |
| | 3,360 | | | Monster Beverage * | | | 224,986 | |
| | | | | | | | |
| | | | 690,897 | |
| | | | | | | | |
| | | | Energy – 3.70% | | | | |
| | 897 | | | Core Laboratories (Netherlands) | | | 168,349 | |
| | 3,440 | | | Oceaneering International | | | 252,083 | |
| | | | | | | | |
| | | | 420,432 | |
| | | | | | | | |
| | | | Financials – 8.86% | | | | |
| | 6,490 | | | First Republic Bank | | | 329,432 | |
| | 897 | | | IntercontinentalExchange | | | 183,383 | |
| | 5,160 | | | Raymond James Financial | | | 256,452 | |
| | 2,010 | | | Signature Bank New York NY * | | | 238,828 | |
| | | | | | | | |
| | | | 1,008,095 | |
| | | | | | | | |
| | | | | | | | |
Shares | | Market Value | |
| | |
| | | | Healthcare – 10.61% | | | | |
| | 1,950 | | | Henry Schein * | | $ | 222,749 | |
| | 1,970 | | | IDEXX Laboratories * | | | 249,087 | |
| | 2,880 | | | MEDNAX * | | | 170,640 | |
| | 1,837 | | | Perrigo (Ireland) | | | 266,108 | |
| | 2,580 | | | Quintiles Transnational Holdings * | | | 121,595 | |
| | 3,540 | | | ResMed | | | 176,469 | |
| | | | | | | | |
| | | | 1,206,648 | |
| | | | | | | | |
| | |
| | | | Industrials – 20.71% | | | | |
| | 5,575 | | | AMETEK | | | 293,914 | |
| | 6,130 | | | Donaldson | | | 258,012 | |
| | 1,950 | | | IHS, Class A * | | | 235,229 | |
| | 2,650 | | | J.B. Hunt Transport Services | | | 201,665 | |
| | 2,580 | | | Jacobs Engineering Group * | | | 148,866 | |
| | 7,660 | | | Robert Half International | | | 343,168 | |
| | 1,130 | | | Roper Industries | | | 157,014 | |
| | 2,400 | | | Stericycle * | | | 279,456 | |
| | 3,470 | | | Verisk Analytics, Class A * | | | 208,512 | |
| | 3,080 | | | Wabtec | | | 229,614 | |
| | | | | | | | |
| | | | 2,355,450 | |
| | | | | | | | |
| | |
| | | | Information Technology – 18.49% | | | | |
| | 2,100 | | | Amphenol, Class A | | | 200,235 | |
| | 1,740 | | | ANSYS * | | | 132,779 | |
| | 2,070 | | | F5 Networks * | | | 217,702 | |
| | 2,570 | | | FactSet Research Systems | | | 273,705 | |
| | 12,300 | | | Juniper Networks * | | | 303,687 | |
| | 3,624 | | | Teradata * | | | 164,747 | |
| | 7,280 | | | Trimble Navigation * | | | 279,770 | |
| | 3,120 | | | WEX * | | | 299,426 | |
| | 4,890 | | | Xilinx | | | 230,759 | |
| | | | | | | | |
| | | | | | | 2,102,810 | |
| | | | | | | | |
| | |
| | | | Total Common Stocks
(Cost $9,051,631) | | | 10,973,827 | |
| | | | | | | | |
|
| | INVESTMENT COMPANY – 2.64% | |
| | |
| | 300,253 | | | BlackRock Liquidity Funds TempCash Portfolio | | | 300,253 | |
| | | | | | | | |
| | |
| | | | Total Investment Company
(Cost $300,253) | | | 300,253 | |
| | | | | | | | |
| Total Investments – 99.13%
(Cost $9,351,884)** | | | 11,274,080 | |
| | | | | | | | |
| Net Other Assets and Liabilities – 0.87% | | | 99,481 | |
| | | | | | | | |
| Net Assets – 100.00% | | $ | 11,373,561 | |
| | | | | | | | |
| * | | Non-income producing security. |
| ** | | At April 30, 2014, cost is identical for book and Federal income tax purposes. |
| | | | |
Gross unrealized appreciation | | $ | 2,009,654 | |
Gross unrealized depreciation | | | (87,458 | ) |
| | | | |
Net unrealized appreciation | | $ | 1,922,196 | |
| | | | |
See accompanying Notes to Financial Statements.
| | |
| |
| ASTON/LMCG Small Cap Growth Fund | | April 30, 2014 |
| |
| Schedule of Investments (unaudited) | | |
| | | | | | | | |
Shares | | | | | Market
Value | |
|
| | COMMON STOCKS – 96.72% | |
| | |
| | | | Consumer Discretionary – 23.13% | | | | |
| | 2,881 | | | Asbury Automotive Group * | | $ | 177,873 | |
| | 13,851 | | | Brunswick | | | 556,672 | |
| | 26,701 | | | Burlington Stores * | | | 693,959 | |
| | 6,982 | | | Del Frisco’s Restaurant Group * | | | 181,602 | |
| | 12,406 | | | Hibbett Sports * | | | 668,063 | |
| | 14,435 | | | Life Time Fitness * | | | 692,880 | |
| | 21,799 | | | Lithia Motors, Class A | | | 1,619,230 | |
| | 3,104 | | | Lumber Liquidators Holdings * | | | 270,545 | |
| | 195,978 | | | Office Depot * | | | 801,550 | |
| | 15,252 | | | Red Robin Gourmet Burgers * | | | 1,036,831 | |
| | 29,806 | | | SeaWorld Entertainment | | | 895,968 | |
| | 8,529 | | | Sinclair Broadcast Group, Class A | | | 227,980 | |
| | 8,454 | | | Sotheby’s | | | 355,575 | |
| | 12,431 | | | Vitamin Shoppe * | | | 595,196 | |
| | | | | | | | |
| | | | | | | 8,773,924 | |
| | | | | | | | |
| | |
| | | | Consumer Staples – 2.57% | | | | |
| | 106,254 | | | Fairway Group Holdings * | | | 736,340 | |
| | 3,073 | | | Susser Holdings * | | | 237,789 | |
| | | | | | | | |
| | | | | | | 974,129 | |
| | | | | | | | |
| | |
| | | | Energy – 4.65% | | | | |
| | 15,518 | | | Goodrich Petroleum * | | | 390,278 | |
| | 5,635 | | | Gulfport Energy * | | | 415,130 | |
| | 56,109 | | | Halcon Resources * | | | 309,722 | |
| | 50,915 | | | Kodiak Oil & Gas (Canada) * | | | 647,130 | |
| | | | | | | | |
| | | | | | | 1,762,260 | |
| | | | | | | | |
| | |
| | | | Financials – 3.27% | | | | |
| | 17,396 | | | Geo Group, REIT | | | 583,288 | |
| | 19,571 | | | JGWPT Holdings, Class A * | | | 277,321 | |
| | | | | | | | |
Shares | | | | | Market
Value | |
| | |
| | | | Financials (continued) | | | | |
| | 33,692 | | | WisdomTree Investments * | | $ | 380,383 | |
| | | | | | | | |
| | | | | | | 1,240,992 | |
| | | | | | | | |
| | |
| | | | Healthcare – 18.05% | | | | |
| | 9,015 | | | Acadia Pharmaceuticals * | | | 181,472 | |
| | 6,519 | | | Aegerion Pharmaceuticals * | | | 288,531 | |
| | 6,009 | | | Align Technology * | | | 302,793 | |
| | 7,721 | | | Alnylam Pharmaceuticals * | | | 382,421 | |
| | 3,436 | | | athenahealth * | | | 424,827 | |
| | 41,052 | | | Community Health Systems * | | | 1,555,460 | |
| | 6,696 | | | ICON PLC (Ireland) * | | | 259,604 | |
| | 1,187 | | | Intercept Pharmaceuticals * | | | 313,510 | |
| | 11,126 | | | InterMune * | | | 356,922 | |
| | 7,217 | | | Isis Pharmaceuticals * | | | 192,044 | |
| | 8,319 | | | Medidata Solutions * | | | 302,063 | |
| | 276,603 | | | Merge Healthcare * | | | 630,655 | |
| | 26,976 | | | PAREXEL International * | | | 1,223,362 | |
| | 3,172 | | | Puma Biotechnology * | | | 239,613 | |
| | 2,836 | | | WellCare Health Plans * | | | 191,345 | |
| | | | | | | | |
| | | | | | | 6,844,622 | |
| | | | | | | | |
| | |
| | | | Industrials – 12.14% | | | | |
| | 2,760 | | | Acuity Brands | | | 343,813 | |
| | 27,640 | | | Continental Building Products * | | | 469,880 | |
| | 17,053 | | | Herman Miller | | | 525,744 | |
| | 8,861 | | | Hexcel | | | 369,415 | |
| | 60,563 | | | Kforce * | | | 1,400,217 | |
| | 15,215 | | | Korn/Ferry International * | | | 441,996 | |
| | 3,804 | | | Trex * | | | 298,690 | |
| | 8,566 | | | Woodward | | | 384,014 | |
| | 13,614 | | | XPO Logistics * | | | 369,484 | |
| | | | | | | | |
| | | | | | | 4,603,253 | |
| | | | | | | | |
| | |
| | | | Information Technology – 28.16% | | | | |
| | 27,824 | | | Aruba Networks * | | | 550,080 | |
| | 10,608 | | | Cardtronics * | | | 355,156 | |
| | 1,760 | | | CoStar Group * | | | 283,166 | |
| | 36,238 | | | ExlService Holdings * | | | 1,025,354 | |
| | 13,754 | | | Fleetmatics Group PLC (Ireland) * | | | 413,033 | |
| | 8,276 | | | Fortinet * | | | 181,906 | |
| | 30,977 | | | Global Eagle Entertainment * | | | 341,676 | |
| | 25,490 | | | Heartland Payment Systems | | | 1,043,561 | |
| | 8,806 | | | Imperva * | | | 201,481 | |
| | 229,588 | | | Internap Network Services * | | | 1,542,831 | |
| | 5,252 | | | Netscout Systems * | | | 204,618 | |
| | 9,925 | | | Qlik Technologies * | | | 218,152 | |
| | 50,919 | | | Synchronoss Technologies * | | | 1,549,974 | |
| | 5,287 | | | Ultimate Software Group * | | | 632,484 | |
| | 55,513 | | | Vantiv, Class A * | | | 1,707,025 | |
| | 9,705 | | | Varonis Systems * | | | 245,245 | |
| | 4,214 | | | WebMD Health * | | | 185,795 | |
| | | | | | | | |
| | | | | | | 10,681,537 | |
| | | | | | | | |
See accompanying Notes to Financial Statements.
| | |
| |
| ASTON/LMCG Small Cap Growth Fund | | April 30, 2014 |
| |
| Schedule of Investments (unaudited) – continued | | |
| | | | | | | | |
Shares | | | | | Market
Value | |
| | |
| | | | Materials – 3.60% | | | | |
| | 39,854 | | | Boise Cascade * | | $ | 997,147 | |
| | 2,969 | | | Martin Marietta Materials | | | 369,136 | |
| | | | | | | | |
| | | | | | | 1,366,283 | |
| | | | | | | | |
| | |
| | | | Telecommunication Services – 1.15% | | | | |
| | 12,636 | | | Cogent Communications Group | | | 435,563 | |
| | | | | | | | |
| | |
| | | | Total Common Stocks
(Cost $36,934,012) | | | 36,682,563 | |
| | | | | | | | |
| |
| | WARRANTS – 0.00% | | | | |
| |
| | | | Energy – 0.00% | |
| | 11,820 | | | Magnum Hunter Resources, Strike Price $8.50, Expiration 04/15/16 | | | 0 | |
| | | | | | | | |
| | |
| | | | Total Warrants
(Cost $—) | | | 0 | |
| | | | | | | | |
| |
| | INVESTMENT COMPANY – 4.41% | | | | |
| | 1,670,533 | | | BlackRock Liquidity Funds TempCash Portfolio | | | 1,670,533 | |
| | | | | | | | |
| | |
| | | | Total Investment Company
(Cost $1,670,533) | | | 1,670,533 | |
| | | | | | | | |
| Total Investments – 101.13%
(Cost $38,604,545)** | | | 38,353,096 | |
| | | | | | | | |
| Net Other Assets and Liabilities – (1.13)% | | | (428,407 | ) |
| | | | | | | | |
| Net Assets – 100.00% | | $ | 37,924,689 | |
| | | | | | | | |
| * | | Non-income producing security. |
| ** | | At April 30, 2014, cost is identical for book and Federal income tax purposes. |
| | | | |
Gross unrealized appreciation | | $ | 2,552,048 | |
Gross unrealized depreciation | | | (2,803,497 | ) |
| | | | |
Net unrealized depreciation | | $ | (251,449 | ) |
| | | | |
| REIT | | Real Estate Investment Trust |
See accompanying Notes to Financial Statements.
| | |
| |
| ASTON/Silvercrest Small Cap Fund | | April 30, 2014 |
| |
| Schedule of Investments (unaudited) | | |
| | | | | | | | |
Shares | | | | | Market
Value | |
|
| | COMMON STOCKS – 98.99% | |
| | |
| | | | Consumer Discretionary – 6.99% | | | | |
| | 34,650 | | | Hillenbrand | | $ | 1,053,360 | |
| | 40,890 | | | La-Z-Boy | | | 990,765 | |
| | 15,470 | | | Lithia Motors, Class A | | | 1,149,112 | |
| | 42,280 | | | ReachLocal * | | | 422,800 | |
| | | | | | | | |
| | | | | | | 3,616,037 | |
| | | | | | | | |
| | |
| | | | Consumer Staples – 4.00% | | | | |
| | 9,814 | | | J & J Snack Foods | | | 918,590 | |
| | 12,144 | | | Lancaster Colony | | | 1,152,223 | |
| | | | | | | | |
| | | | 2,070,813 | |
| | | | | | | | |
| | |
| | | | Energy – 6.43% | | | | |
| | 16,430 | | | Bonanza Creek Energy * | | | 798,827 | |
| | 30,870 | | | Forum Energy Technologies * | | | 921,778 | |
| | 29,250 | | | Matador Resources * | | | 840,060 | |
| | 16,159 | | | Rosetta Resources * | | | 764,967 | |
| | | | | | | | |
| | | | | | | 3,325,632 | |
| | | | | | | | |
| | |
| | | | Financials – 22.01% | | | | |
| | 47,700 | | | BancorpSouth | | | 1,114,272 | |
| | 11,470 | | | Bank of the Ozarks | | | 687,053 | |
| | 63,810 | | | CVB Financial | | | 922,693 | |
| | 18,928 | | | EastGroup Properties, REIT | | | 1,197,196 | |
| | 47,264 | | | Horace Mann Educators | | | 1,421,228 | |
| | 11,909 | | | Iberiabank | | | 749,076 | |
| | 32,913 | | | Independent Bank/Rockland MA | | | 1,221,731 | |
| | 14,464 | | | Mid-America Apartment Communities, REIT | | | 1,007,418 | |
| | 25,070 | | | PacWest Bancorp | | | 987,006 | |
| | 34,890 | | | Pebblebrook Hotel Trust, REIT | | | 1,201,612 | |
| | 18,600 | | | Stifel Financial * | | | 869,922 | |
| | | | | | | | |
| | | | | | | 11,379,207 | |
| | | | | | | | |
| | | | | | | | |
Shares | | | | | Market
Value | |
| | |
| | | | Healthcare – 10.72% | | | | |
| | 12,097 | | | Analogic | | $ | 908,243 | |
| | 31,240 | | | Cambrex * | | | 640,108 | |
| | 19,430 | | | Greatbatch * | | | 894,363 | |
| | 13,214 | | | ICU Medical * | | | 737,077 | |
| | 17,930 | | | Integra LifeSciences Holdings * | | | 817,249 | |
| | 18,930 | | | STERIS | | | 909,586 | |
| | 14,636 | | | West Pharmaceutical Services | | | 634,910 | |
| | | | | | | | |
| | | | | | | 5,541,536 | |
| | | | | | | | |
| | |
| | | | Industrials – 22.58% | | | | |
| | 32,135 | | | Altra Holdings | | | 1,097,732 | |
| | 19,543 | | | Applied Industrial Technologies | | | 936,501 | |
| | 17,910 | | | Beacon Roofing Supply * | | | 637,238 | |
| | 90,320 | | | CBIZ * | | | 774,042 | |
| | 21,506 | | | EMCOR Group | | | 989,061 | |
| | 37,600 | | | EnerNOC * | | | 887,360 | |
| | 51,420 | | | Knoll | | | 935,330 | |
| | 18,529 | | | MSA Safety | | | 977,405 | |
| | 10,877 | | | Standex International | | | 645,767 | |
| | 23,810 | | | United Stationers | | | 893,589 | |
| | 31,259 | | | US Ecology | | | 1,395,714 | |
| | 14,350 | | | Watts Water Technologies, Class A | | | 763,420 | |
| | 36,550 | | | Wesco Aircraft Holdings * | | | 740,503 | |
| | | | | | | | |
| | | | | | | 11,673,662 | |
| | | | | | | | |
| | |
| | | | Information Technology – 13.31% | | | | |
| | 11,429 | | | ACI Worldwide * | | | 653,167 | |
| | 72,970 | | | Entegris * | | | 809,237 | |
| | 6,997 | | | FEI | | | 556,401 | |
| | 14,195 | | | Littelfuse | | | 1,285,357 | |
| | 49,630 | | | M/A-COM Technology Solutions Holdings * | | | 869,021 | |
| | 40,920 | | | Mentor Graphics | | | 847,044 | |
| | 31,015 | | | MKS Instruments | | | 873,072 | |
| | 69,690 | | | Vishay Intertechnology | | | 990,992 | |
| | | | | | | | |
| | | | | | | 6,884,291 | |
| | | | | | | | |
| | |
| | | | Materials – 6.26% | | | | |
| | 14,642 | | | HB Fuller | | | 678,364 | |
| | 43,233 | | | PH Glatfelter | | | 1,103,306 | |
| | 13,549 | | | Sensient Technologies | | | 732,323 | |
| | 12,460 | | | Stepan | | | 720,562 | |
| | | | | | | | |
| | | | | | | 3,234,555 | |
| | | | | | | | |
| | |
| | | | Utilities – 6.69% | | | | |
| | 23,243 | | | MGE Energy | | | 888,347 | |
| | 22,270 | | | ONE Gas | | | 814,637 | |
| | 24,369 | | | Portland General Electric | | | 815,630 | |
| | 25,653 | | | UIL Holdings | | | 942,235 | |
| | | | | | | | |
| | | | | | | 3,460,849 | |
| | | | | | | | |
| | |
| | | | Total Common Stocks
(Cost $47,737,556) | | | 51,186,582 | |
| | | | | | | | |
See accompanying Notes to Financial Statements.
| | |
| |
| ASTON/Silvercrest Small Cap Fund | | April 30, 2014 |
| |
| Schedule of Investments (unaudited) – continued | | |
| | | | | | | | |
Shares | | | | | Market
Value | |
| |
| | INVESTMENT COMPANY – 1.34% | | | | |
| | 691,700 | | | BlackRock Liquidity Funds
TempCash Portfolio | | $ | 691,700 | |
| | | | | | | | |
| | |
| | | | Total Investment Company
(Cost $691,700) | | | 691,700 | |
| | | | | | | | |
| Total Investments – 100.33%
(Cost $48,425,831)** | | | 51,878,282 | |
| | | | | | | | |
| Net Other Assets and Liabilities – (0.33)% | | | (172,395 | ) |
| | | | | | | | |
| Net Assets – 100.00% | | $ | 51,705,887 | |
| | | | | | | | |
| * | | Non-income producing security. |
| ** | | At April 30, 2014 cost is identical for book and Federal income tax purposes. |
| | | | |
Gross unrealized appreciation | | $ | 4,184,268 | |
Gross unrealized depreciation | | | (731,817 | ) |
| | | | |
Net unrealized appreciation | | $ | 3,452,451 | |
| | | | |
| REIT | | Real Estate Investment Trust |
See accompanying Notes to Financial Statements.
| | |
| |
| ASTON/TAMRO Small Cap Fund | | April 30, 2014 |
| |
| Schedule of Investments (unaudited) | | |
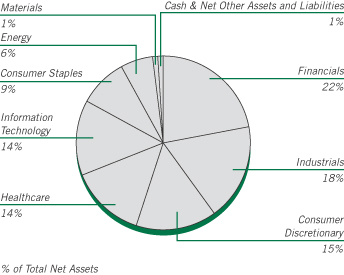
| | | | | | | | |
Shares | | | | | Market
Value | |
| |
| | COMMON STOCKS – 98.47% | | | | |
| | |
| | | | Consumer Discretionary – 15.39% | | | | |
| | 606,008 | | | Five Below * | | $ | 24,428,183 | |
| | 882,635 | | | Francesca’s Holdings * | | | 14,439,910 | |
| | 507,495 | | | Grand Canyon Education * | | | 21,883,185 | |
| | 493,517 | | | Monro Muffler Brake | | | 27,834,360 | |
| | 446,634 | | | Pool | | | 26,360,340 | |
| | 2,663,883 | | | Quiksilver * | | | 17,102,130 | |
| | 346,141 | | | Red Robin Gourmet Burgers * | | | 23,530,666 | |
| | 893,269 | | | Texas Roadhouse | | | 22,099,475 | |
| | | | | | | | |
| | | | | | | 177,678,249 | |
| | | | | | | | |
| | |
| | | | Consumer Staples – 8.80% | | | | |
| | 557,664 | | | Diamond Foods * | | | 17,047,788 | |
| | 281,940 | | | Sanderson Farms | | | 23,195,204 | |
| | 575,696 | | | Tootsie Roll Industries (a) | | | 16,228,870 | |
| | 216,770 | | | TreeHouse Foods * | | | 16,223,067 | |
| | 418,489 | | | United Natural Foods * | | | 28,888,296 | |
| | | | | | | | |
| | | | | | | 101,583,225 | |
| | | | | | | | |
| | |
| | | | Energy – 5.99% | | | | |
| | 483,076 | | | Carrizo Oil & Gas * | | | 26,578,842 | |
| | 93,249 | | | Geospace Technologies * | | | 5,420,564 | |
| | 201,744 | | | SEACOR Holdings * | | | 16,823,432 | |
| | 308,736 | | | Unit * | | | 20,361,139 | |
| | | | | | | | |
| | | | | | | 69,183,977 | |
| | | | | | | | |
| | |
| | | | Financials – 22.36% | | | | |
| | 504,320 | | | Bank of the Ozarks | | | 30,208,768 | |
| | 150,594 | | | BofI Holding * | | | 12,139,382 | |
| | 1,154,192 | | | Colony Financial, REIT | | | 25,103,676 | |
| | 496,876 | | | First Cash Financial Services * | | | 24,232,643 | |
| | 1,098,195 | | | FirstMerit | | | 21,294,001 | |
| | 917,037 | | | Glacier Bancorp | | | 23,531,169 | |
| | 435,948 | | | Greenhill | | | 21,862,792 | |
| | | | | | | | |
Shares | | | | | Market
Value | |
| | |
| | | | Financials (continued) | | | | |
| | 413,867 | | | Hanover Insurance Group (The) | | $ | 24,190,526 | |
| | 712,399 | | | LaSalle Hotel Properties, REIT | | | 23,566,159 | |
| | 415,082 | | | Portfolio Recovery Associates * | | | 23,721,936 | |
| | 485,425 | | | Stifel Financial * | | | 22,703,327 | |
| | 76,918 | | | World Acceptance * | | | 5,584,247 | |
| | | | | | | | |
| | | | | | | 258,138,626 | |
| | | | | | | | |
| | |
| | | | Healthcare – 13.90% | | | | |
| | 282,360 | | | Analogic | | | 21,199,589 | |
| | 1,151,090 | | | Auxilium Pharmaceuticals * | | | 25,911,036 | |
| | 948,691 | | | Bruker * | | | 19,599,956 | |
| | 418,000 | | | Cepheid * | | | 18,174,640 | |
| | 112,575 | | | Clovis Oncology * | | | 6,086,930 | |
| | 906,967 | | | DexCom * | | | 29,422,009 | |
| | 1,244,296 | | | HMS Holdings * | | | 20,120,266 | |
| | 195,502 | | | Ligand Pharmaceuticals * | | | 12,349,861 | |
| | 432,295 | | | Tandem Diabetes Care * | | | 7,595,423 | |
| | | | | | | | |
| | | | | | | 160,459,710 | |
| | | | | | | | |
| | |
| | | | Industrials – 17.91% | | | | |
| | 342,147 | | | Advisory Board * | | | 19,591,337 | |
| | 234,630 | | | Applied Industrial Technologies | | | 11,243,470 | |
| | 482,841 | | | Barnes Group | | | 18,599,035 | |
| | 152,382 | | | Chart Industries * | | | 10,395,500 | |
| | 247,133 | | | Corporate Executive Board | | | 17,057,120 | |
| | 460,090 | | | Franklin Electric | | | 17,791,680 | |
| | 1,477,756 | | | Hawaiian Holdings * | | | 21,353,574 | |
| | 402,090 | | | Landstar System | | | 25,327,649 | |
| | 175,786 | | | Polypore International * | | | 6,096,258 | |
| | 306,734 | | | Proto Labs * | | | 18,569,676 | |
| | 716,107 | | | TrueBlue * | | | 19,155,862 | |
| | 1,614,837 | | | Wabash National * | | | 21,574,222 | |
| | | | | | | | |
| | | | | | | 206,755,383 | |
| | | | | | | | |
| | |
| | | | Information Technology – 13.62% | | | | |
| | 559,628 | | | Cavium * | | | 23,711,438 | |
| | 352,670 | | | CommVault Systems * | | | 17,069,228 | |
| | 231,374 | | | Diodes * | | | 6,101,332 | |
| | 639,451 | | | Manhattan Associates * | | | 20,161,890 | |
| | 242,416 | | | Microsemi * | | | 5,701,624 | |
| | 315,588 | | | OpenTable * | | | 21,194,890 | |
| | 328,888 | | | Synaptics * | | | 20,440,389 | |
| | 267,074 | | | Tyler Technologies * | | | 21,806,592 | |
| | 628,628 | | | VeriFone Systems * | | | 21,021,320 | |
| | | | | | | | |
| | | | | | | 157,208,703 | |
| | | | | | | | |
| | |
| | | | Materials – 0.50% | | | | |
| | 221,045 | | | Kraton Performance Polymers * | | | 5,758,222 | |
| | | | | | | | |
| | |
| | | | Total Common Stocks
(Cost $891,222,479) | | | 1,136,766,095 | |
| | | | | | | | |
See accompanying Notes to Financial Statements.
| | |
| |
| ASTON/TAMRO Small Cap Fund | | April 30, 2014 |
| |
| Schedule of Investments (unaudited) – continued | | |
| | | | | | | | |
Shares | | | | | Market
Value | |
| |
| | INVESTMENT COMPANY – 0.76% | | | | |
| | 8,724,963 | | | BlackRock Liquidity Funds
TempCash Portfolio | | $ | 8,724,963 | |
| | | | | | | | |
| | |
| | | | Total Investment Company
(Cost $8,724,963) | | | 8,724,963 | |
| | | | | | | | |
| Total Investments – 99.23%
(Cost $899,947,442)** | | | 1,145,491,058 | |
| | | | | | | | |
| Net Other Assets and Liabilities – 0.77% | | | 8,913,479 | |
| | | | | | | | |
| Net Assets – 100.00% | | $ | 1,154,404,537 | |
| | | | | | | | |
| * | | Non-income producing security. |
| ** | | At April 30, 2014, cost is identical for book and Federal income tax purposes. |
| | | | |
Gross unrealized appreciation | | $ | 287,274,200 | |
Gross unrealized depreciation | | | (41,730,584 | ) |
| | | | |
Net unrealized appreciation | | $ | 245,543,616 | |
| | | | |
| (a) | | This security has been determined by the Subadviser to be an illiquid security. At April 30, 2014, this security amounted to $16,228,870 or 1.41% of net assets. |
| REIT | | Real Estate Investment Trust |
See accompanying Notes to Financial Statements.
| | |
| |
| ASTON/River Road Select Value Fund | | April 30, 2014 |
| |
| Schedule of Investments (unaudited) | | |
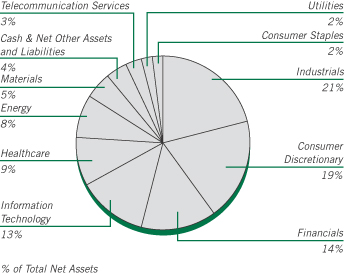
| | | | | | | | |
Shares | | | | | Market
Value | |
|
| | COMMON STOCKS – 96.68% | |
| | |
| | | | Consumer Discretionary – 19.19% | | | | |
| | 98,350 | | | Abercrombie & Fitch, Class A | | $ | 3,615,346 | |
| | 282,800 | | | Ascena Retail Group * | | | 4,864,160 | |
| | 48,800 | | | Ascent Capital Group, Class A * | | | 3,355,976 | |
| | 54,020 | | | Big Lots * | | | 2,133,790 | |
| | 68,290 | | | Bob Evans Farms | | | 3,200,752 | |
| | 55,690 | | | Children’s Place Retail Stores | | | 2,673,120 | |
| | 260,290 | | | International Game Technology | | | 3,266,640 | |
| | 100,420 | | | International Speedway, Class A | | | 3,157,205 | |
| | 38,710 | | | Madison Square Garden, Class A * | | | 2,113,566 | |
| | 74,330 | | | Murphy USA * | | | 3,159,025 | |
| | 51,970 | | | Outerwall * | | | 3,604,120 | |
| | 174,360 | | | Pep Boys—Manny, Moe, & Jack * | | | 1,781,959 | |
| | 41,670 | | | Rent-A-Center | | | 1,217,181 | |
| | 110,380 | | | Stage Stores | | | 2,117,088 | |
| | | | | | | | |
| | | | | | | 40,259,928 | |
| | | | | | | | |
| | |
| | | | Consumer Staples – 2.11% | | | | |
| | 34,280 | | | Industrias Bachoco, SP ADR (Mexico) | | | 1,511,748 | |
| | 45,526 | | | Ingles Markets, Class A | | | 1,046,643 | |
| | 76,970 | | | Village Super Market, Class A | | | 1,861,904 | |
| | | | | | | | |
| | | | | | | 4,420,295 | |
| | | | | | | | |
| | |
| | | | Energy – 8.23% | | | | |
| | 207,910 | | | Denbury Resources | | | 3,497,046 | |
| | 385,699 | | | Miller Energy Resources * | | | 1,859,069 | |
| | 82,038 | | | Nuverra Environmental Solutions (Canada) * | | | 1,395,466 | |
| | 185,650 | | | Ocean Rig UDW (Cyprus) * | | | 3,063,225 | |
| | 218,700 | | | TETRA Technologies * | | | 2,733,750 | |
| | 185,774 | | | Vaalco Energy * | | | 1,712,836 | |
| | 141,100 | | | WPX Energy * | | | 3,002,608 | |
| | | | | | | | |
| | | | | | | 17,264,000 | |
| | | | | | | | |
| | | | | | | | |
Shares | | | | | Market
Value | |
| | |
| | | | Financials – 14.40% | | | | |
| | 8,595 | | | Alleghany * | | $ | 3,506,588 | |
| | 80,664 | | | Capital Southwest | | | 2,831,306 | |
| | 106,720 | | | Dime Community Bancshares | | | 1,739,536 | |
| | 154,450 | | | Forest City Enterprises, Class A * | | | 2,920,649 | |
| | 117,254 | | | Geo Group, REIT | | | 3,931,527 | |
| | 116,820 | | | Hilltop Holdings * | | | 2,609,759 | |
| | 23,800 | | | Navigators Group * | | | 1,355,886 | |
| | 150,830 | | | PICO Holdings * | | | 3,506,798 | |
| | 13,125 | | | White Mountains Insurance Group (Bermuda) | | | 7,825,913 | |
| | | | | | | | |
| | | | | | | 30,227,962 | |
| | | | | | | | |
| | |
| | | | Healthcare – 8.76% | | | | |
| | 17,508 | | | Bio-Rad Laboratories, Class A * | | | 2,157,161 | |
| | 78,377 | | | Ensign Group | | | 3,331,023 | |
| | 19,560 | | | ICU Medical * | | | 1,091,057 | |
| | 76,345 | | | Myriad Genetics * | | | 3,222,522 | |
| | 131,720 | | | Nordion (Canada) * | | | 1,525,318 | |
| | 43,740 | | | Orthofix International (Curacao) * | | | 1,320,948 | |
| | 131,900 | | | Owens & Minor | | | 4,423,926 | |
| | 27,460 | | | STERIS | | | 1,319,453 | |
| | | | | | | | |
| | | | | | | 18,391,408 | |
| | | | | | | | |
| | |
| | | | Industrials – 20.77% | | | | |
| | 176,900 | | | ADT | | | 5,349,456 | |
| | 351,940 | | | Air Transport Services Group * | | | 2,755,690 | |
| | 131,660 | | | Aircastle (Bermuda) | | | 2,313,266 | |
| | 155,344 | | | Brink’s | | | 3,951,951 | |
| | 64,580 | | | Cubic | | | 3,063,029 | |
| | 71,450 | | | Forward Air | | | 3,160,233 | |
| | 28,501 | | | Heartland Express | | | 620,182 | |
| | 110,470 | | | Insperity | | | 3,541,668 | |
| | 47,570 | | | Korn/Ferry International * | | | 1,381,909 | |
| | 117,243 | | | Marten Transport | | | 2,750,521 | |
| | 136,890 | | | Progressive Waste Solutions (Canada) | | | 3,336,009 | |
| | 108,123 | | | SP Plus * | | | 2,640,364 | |
| | 38,960 | | | UniFirst | | | 3,749,510 | |
| | 199,960 | | | UTi Worldwide | | | 1,957,608 | |
| | 117,540 | | | Werner Enterprises | | | 3,009,024 | |
| | | | | | | | |
| | | | | | | 43,580,420 | |
| | | | | | | | |
| | |
| | | | Information Technology – 12.54% | | | | |
| | 167,478 | | | Blackhawk Network Holdings * | | | 4,017,797 | |
| | 211,480 | | | Convergys | | | 4,555,279 | |
| | 159,720 | | | CSG Systems International | | | 4,210,219 | |
| | 31,120 | | | Dolby Laboratories, Class A * | | | 1,240,132 | |
| | 10,490 | | | DST Systems | | | 967,073 | |
| | 30,970 | | | j2 Global | | | 1,435,769 | |
| | 130,784 | | | NeuStar, Class A * | | | 3,363,764 | |
| | 195,999 | | | Rovi * | | | 4,368,818 | |
| | 108,440 | | | Sykes Enterprises * | | | 2,146,028 | |
| | | | | | | | |
| | | | | | | 26,304,879 | |
| | | | | | | | |
| | |
| | | | Materials – 5.33% | | | | |
| | 194,380 | | | American Vanguard | | | 3,461,908 | |
| | 322,880 | | | AuRico Gold (Canada) | | | 1,343,181 | |
See accompanying Notes to Financial Statements.
| | |
| |
| ASTON/River Road Select Value Fund | | April 30, 2014 |
| |
| Schedule of Investments (unaudited) – continued | | |
| | | | | | | | |
Shares | | | | | Market
Value | |
| | |
| | | | Materials (continued) | | | | |
| | 47,270 | | | Innophos Holdings | | $ | 2,667,919 | |
| | 80,310 | | | Intrepid Potash * | | | 1,309,053 | |
| | 91,961 | | | Kraton Performance Polymers * | | | 2,395,584 | |
| | | | | | | | |
| | | | | | | 11,177,645 | |
| | | | | | | | |
| | |
| | | | Telecommunication Services – 2.90% | | | | |
| | 31,650 | | | Atlantic Tele-Network | | | 1,872,731 | |
| | 155,150 | | | Telephone & Data Systems | | | 4,218,529 | |
| | | | | | | | |
| | | | | | | 6,091,260 | |
| | | | | | | | |
| | |
| | | | Utilities – 2.45% | | | | |
| | 69,900 | | | National Fuel Gas | | | 5,147,436 | |
| | | | | | | | |
| | |
| | | | Total Common Stocks
(Cost $180,666,248) | | | 202,865,233 | |
| | | | | | | | |
| |
| | INVESTMENT COMPANY – 3.84% | | | | |
| | |
| | 8,050,769 | | | BlackRock Liquidity Funds
TempCash Portfolio | | | 8,050,769 | |
| | | | | | | | |
| | |
| | | | Total Investment Company
(Cost $8,050,769) | | | 8,050,769 | |
| | | | | | | | |
| Total Investments – 100.52%
(Cost $188,717,017)** | | | 210,916,002 | |
| | | | | | | | |
| Net Other Assets and Liabilities – (0.52)% | | | (1,092,324 | ) |
| | | | | | | | |
| Net Assets – 100.00% | | $ | 209,823,678 | |
| | | | | | | | |
| * | | Non-income producing security. |
| ** | | At April 30, 2014, cost is identical for book and Federal income tax purposes. |
| | | | |
Gross unrealized appreciation | | $ | 28,458,684 | |
Gross unrealized depreciation | | | (6,259,699 | ) |
| | | | |
Net unrealized appreciation | | $ | 22,198,985 | |
| | | | |
| REIT | | Real Estate Investment Trust |
| SP ADR | | Sponsored American Depositary Receipt |
See accompanying Notes to Financial Statements.
| | |
| |
| ASTON/River Road Small Cap Value Fund | | April 30, 2014 |
| |
| Schedule of Investments (unaudited) | | |
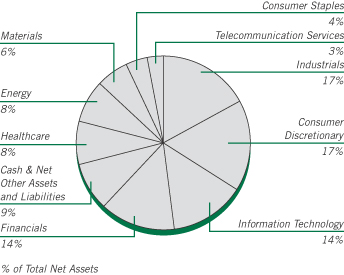
| | | | | | | | |
Shares | | | | | Market
Value | |
|
| | COMMON STOCKS – 90.92% | |
| | |
| | | | Consumer Discretionary – 16.99% | | | | |
| | 139,310 | | | Abercrombie & Fitch, Class A | | $ | 5,121,036 | |
| | 359,078 | | | Ascena Retail Group * | | | 6,176,142 | |
| | 79,544 | | | Ascent Capital Group, Class A * | | | 5,470,241 | |
| | 81,060 | | | Big Lots * | | | 3,201,870 | |
| | 100,180 | | | Bob Evans Farms | | | 4,695,437 | |
| | 83,560 | | | Children’s Place Retail Stores | | | 4,010,880 | |
| | 151,710 | | | International Speedway, Class A | | | 4,769,762 | |
| | 121,699 | | | Monarch Casino & Resort * | | | 1,952,052 | |
| | 113,420 | | | Murphy USA * | | | 4,820,350 | |
| | 90,750 | | | Outerwall * | | | 6,293,513 | |
| | 244,700 | | | Pep Boys – Manny, Moe, & Jack * | | | 2,500,834 | |
| | 52,619 | | | Rent-A-Center | | | 1,537,001 | |
| | 163,080 | | | Stage Stores | | | 3,127,874 | |
| | | | | | | | |
| | | | | | | 53,676,992 | |
| | | | | | | | |
| | |
| | | | Consumer Staples – 3.61% | | | | |
| | 71,820 | | | Industrias Bachoco, SP ADR (Mexico) | | | 3,167,262 | |
| | 213,369 | | | Ingles Markets, Class A | | | 4,905,353 | |
| | 137,281 | | | Village Super Market, Class A | | | 3,320,827 | |
| | | | | | | | |
| | | | | | | 11,393,442 | |
| | | | | | | | |
| | |
| | | | Energy – 8.18% | | | | |
| | 623,483 | | | Evolution Petroleum (a) | | | 7,357,099 | |
| | 682,488 | | | Miller Energy Resources * | | | 3,289,592 | |
| | 125,310 | | | Nuverra Environmental Solutions (Canada) * | | | 2,131,523 | |
| | 240,990 | | | Ocean Rig UDW (Cyprus) * | | | 3,976,335 | |
| | 44,051 | | | PHI * | | | 1,973,485 | |
| | 325,429 | | | TETRA Technologies * | | | 4,067,863 | |
| | 329,595 | | | Vaalco Energy * | | | 3,038,866 | |
| | | | | | | | |
| | | | | | | 25,834,763 | |
| | | | | | | | |
| | | | | | | | |
Shares | | | | | Market
Value | |
| | |
| | | | Financials – 14.19% | | | | |
| | 76,820 | | | 1st Source | | $ | 2,265,422 | |
| | 139,334 | | | Capital Southwest | | | 4,890,623 | |
| | 200,482 | | | Dime Community Bancshares | | | 3,267,857 | |
| | 16,765 | | | First Citizens BancShares, Class A | | | 3,770,281 | |
| | 195,285 | | | Geo Group, REIT | | | 6,547,906 | |
| | 174,120 | | | Hilltop Holdings * | | | 3,889,841 | |
| | 40,397 | | | Navigators Group * | | | 2,301,417 | |
| | 228,505 | | | PICO Holdings * | | | 5,312,741 | |
| | 28,538 | | | Tompkins Financial | | | 1,345,281 | |
| | 18,838 | | | White Mountains Insurance Group (Bermuda) | | | 11,232,346 | |
| | | | | | | | |
| | | | | | | 44,823,715 | |
| | | | | | | | |
| | |
| | | | Healthcare – 7.69% | | | | |
| | 103,272 | | | Ensign Group | | | 4,389,060 | |
| | 30,919 | | | ICU Medical * | | | 1,724,662 | |
| | 117,632 | | | Myriad Genetics * | | | 4,965,247 | |
| | 335,740 | | | Nordion (Canada) * | | | 3,887,869 | |
| | 62,607 | | | Orthofix International (Curacao) * | | | 1,890,731 | |
| | 156,080 | | | Owens & Minor | | | 5,234,923 | |
| | 45,570 | | | STERIS | | | 2,189,639 | |
| | | | | | | | |
| | | | | | | 24,282,131 | |
| | | | | | | | |
| | |
| | | | Industrials – 17.58% | | | | |
| | 560,669 | | | Air Transport Services Group * | | | 4,390,038 | |
| | 171,480 | | | Aircastle (Bermuda) | | | 3,012,904 | |
| | 237,064 | | | Brink’s | | | 6,030,908 | |
| | 82,197 | | | Cubic | | | 3,898,604 | |
| | 83,670 | | | Forward Air | | | 3,700,724 | |
| | 96,610 | | | Heartland Express | | | 2,102,234 | |
| | 137,718 | | | Insperity | | | 4,415,239 | |
| | 58,700 | | | Korn/Ferry International * | | | 1,705,235 | |
| | 178,819 | | | Marten Transport | | | 4,195,094 | |
| | 208,430 | | | Progressive Waste Solutions (Canada) | | | 5,079,439 | |
| | 164,093 | | | SP Plus * | | | 4,007,151 | |
| | 57,103 | | | UniFirst | | | 5,495,593 | |
| | 317,430 | | | UTi Worldwide (British Virgin Islands) | | | 3,107,640 | |
| | 172,030 | | | Werner Enterprises | | | 4,403,968 | |
| | | | | | | | |
| | | | | | | 55,544,771 | |
| | | | | | | | |
| | |
| | | | Information Technology – 14.11% | | | | |
| | 251,151 | | | Blackhawk Network Holdings * | | | 6,025,112 | |
| | 132,985 | | | Computer Services (a) | | | 4,587,982 | |
| | 302,320 | | | Convergys | | | 6,511,973 | |
| | 207,040 | | | CSG Systems International | | | 5,457,574 | |
| | 23,357 | | | DST Systems | | | 2,153,282 | |
| | 167,743 | | | Electro Rent | | | 2,709,049 | |
| | 63,600 | | | Heartland Payment Systems | | | 2,603,784 | |
| | 186,330 | | | NeuStar, Class A * | | | 4,792,408 | |
| | 272,540 | | | Rovi * | | | 6,074,917 | |
| | 184,193 | | | Sykes Enterprises * | | | 3,645,179 | |
| | | | | | | | |
| | | | | | | 44,561,260 | |
| | | | | | | | |
| | |
| | | | Materials – 5.87% | | | | |
| | 296,470 | | | American Vanguard | | | 5,280,131 | |
| | 340,610 | | | AuRico Gold (Canada) | | | 1,416,938 | |
See accompanying Notes to Financial Statements.
| | |
| |
| ASTON/River Road Small Cap Value Fund | | April 30, 2014 |
| |
| Schedule of Investments (unaudited) – continued | | |
| | | | | | | | |
Shares | | | | | Market
Value | |
| | |
| | | | Materials (continued) | | | | |
| | 80,930 | | | Innophos Holdings | | $ | 4,567,689 | |
| | 176,630 | | | Intrepid Potash * | | | 2,879,069 | |
| | 168,790 | | | Kraton Performance Polymers * | | | 4,396,979 | |
| | | | | | | | |
| | | | | | | 18,540,806 | |
| | | | | | | | |
| | |
| | | | Telecommunication Services – 2.70% | | | | |
| | 47,120 | | | Atlantic Tele-Network | | | 2,788,090 | |
| | 211,490 | | | Telephone & Data Systems | | | 5,750,413 | |
| | | | | | | | |
| | | | | | | 8,538,503 | |
| | | | | | | | |
| | |
| | | | Total Common Stocks
(Cost $222,991,807) | | | 287,196,383 | |
| | | | | | | | |
| |
| | INVESTMENT COMPANY – 9.10% | | | | |
| | 28,743,187 | | | BlackRock Liquidity Funds
TempFund Portfolio | | | 28,743,187 | |
| | | | | | | | |
| | |
| | | | Total Investment Company
(Cost $28,743,187) | | | 28,743,187 | |
| | | | | | | | |
| Total Investments – 100.02%
(Cost $251,734,994)** | | | 315,939,570 | |
| | | | | | | | |
| Net Other Assets and Liabilities – (0.02)% | | | (72,963 | ) |
| | | | | | | | |
| Net Assets – 100.00% | | $ | 315,866,607 | |
| | | | | | | | |
| * | | Non-income producing security. |
| ** | | At April 30, 2014, cost is identical for book and Federal income tax purposes. |
| | | | |
Gross unrealized appreciation | | $ | 69,940,695 | |
Gross unrealized depreciation | | | (5,736,119 | ) |
| | | | |
Net unrealized appreciation | | $ | 64,204,576 | |
| | | | |
| (a) | | These securities have been determined by the Subadviser to be illiquid securities. At April 30, 2014, these securities amounted to $11,945,081 or 3.78 % of net assets. |
| REIT | | Real Estate Investment Trust |
| SP ADR | | Sponsored American Depositary Receipt |
See accompanying Notes to Financial Statements.
| | |
| |
| ASTON/River Road Independent Value Fund | | April 30, 2014 |
| |
| Schedule of Investments (unaudited) | | |
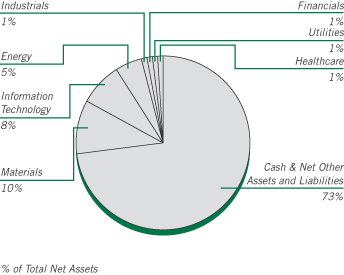
| | | | | | | | |
Shares | | | | | Market
Value | |
|
| | COMMON STOCKS – 26.91% | |
| | |
| | | | Consumer Staples – 0.05% | | | | |
| | 47,760 | | | Cott (Canada) | | $ | 387,811 | |
| | | | | | | | |
| | |
| | | | Energy – 5.25% | | | | |
| | 50,108 | | | Contango Oil & Gas * | | | 2,407,188 | |
| | 582,308 | | | QEP Resources | | | 17,871,032 | |
| | 860,106 | | | WPX Energy * | | | 18,303,056 | |
| | | | | | | | |
| | | | | | �� | 38,581,276 | |
| | | | | | | | |
| | |
| | | | Financials – 1.28% | | | | |
| | 139,978 | | | Baldwin & Lyons, Class B | | | 3,640,828 | |
| | 149,855 | | | Potlatch, REIT | | | 5,728,957 | |
| | | | | | | | |
| | | | | | | 9,369,785 | |
| | | | | | | | |
| | |
| | | | Healthcare – 0.43% | | | | |
| | 93,196 | | | Owens & Minor | | | 3,125,794 | |
| | | | | | | | |
| | |
| | | | Industrials – 1.49% | | | | |
| | 318,272 | | | FTI Consulting * | | | 10,916,729 | |
| | | | | | | | |
| | |
| | | | Information Technology – 8.09% | | | | |
| | 243,307 | | | Benchmark Electronics * | | | 5,639,856 | |
| | 435,622 | | | Convergys | | | 9,383,298 | |
| | 455,633 | | | CSG Systems International | | | 12,010,486 | |
| | 286,459 | | | EPIQ Systems | | | 3,663,811 | |
| | 167,381 | | | Mantech International, Class A | | | 4,992,975 | |
| | 1,197,486 | | | Sykes Enterprises * | | | 23,698,248 | |
| | | | | | | | |
| | | | | | | 59,388,674 | |
| | | | | | | | |
| | |
| | | | Materials – 9.45% | | | | |
| | 5,621,677 | | | AuRico Gold (Canada) | | | 23,386,176 | |
| | 2,455,625 | | | New Gold (Canada) * | | | 12,450,019 | |
| | 2,125,775 | | | Pan American Silver (Canada) | | | 27,550,044 | |
| | 608,399 | | | Silver Standard Resources (Canada) * | | | 6,029,234 | |
| | | | | | | | |
| | | | | | | 69,415,473 | |
| | | | | | | | |
| | | | | | | | |
Shares | | | | | Market
Value | |
| | |
| | | | Utilities – 0.87% | | | | |
| | 262,237 | | | Empire District Electric | | $ | 6,377,604 | |
| | | | | | | | |
| | |
| | | | Total Common Stocks
(Cost $183,584,675) | | | 197,563,146 | |
| | | | | | | | |
| |
| | INVESTMENT COMPANY – 72.37% | | | | |
| | |
| | 531,305,290 | | | BlackRock Liquidity Funds Treasury Trust Fund Portfolio | | | 531,305,290 | |
| | | | | | | | |
| | |
| | | | Total Investment Company
(Cost $531,305,290) | | | 531,305,290 | |
| | | | | | | | |
| Total Investments – 99.28%
(Cost $714,892,418)** | | | 728,868,436 | |
| | | | | | | | |
| Net Other Assets and Liabilities – 0.72% | | | 5,271,065 | |
| | | | | | | | |
| Net Assets – 100.00% | | $ | 734,139,501 | |
| | | | | | | | |
| * | | Non-income producing security. |
| ** | | At April 30, 2014, cost is identical for book and Federal income tax purposes. |
| | | | |
Gross unrealized appreciation | | $ | 19,562,277 | |
Gross unrealized depreciation | | | (5,586,259 | ) |
| | | | |
Net unrealized appreciation | | $ | 13,976,018 | |
| | | | |
| REIT | | Real Estate Investment Trust |
See accompanying Notes to Financial Statements.
| | |
| |
| ASTON/DoubleLine Core Plus Fixed Income Fund | | April 30, 2014 |
| |
| Schedule of Investments (unaudited) | | |
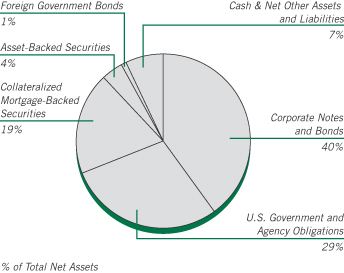
At April 30, 2014, 29% of the Total Net Assets of the Fund were comprised of securities of issuers located outside the United States.
| | | | | | | | |
Par Value | | | | | Market
Value | |
| | | | | | | | |
|
| | CORPORATE NOTES AND BONDS – 40.15% | |
| | |
| | | | Consumer Discretionary – 2.38% | | | | |
| $ | 45,000 | | | American Axle & Manufacturing
6.625%, 10/15/22 | | $ | 48,994 | |
| | 200,000 | | | Automotores Gildemeister SA (Chile)
8.250%, 05/24/21 | | | 138,000 | |
| | 45,000 | | | Cinemark USA
7.375%, 06/15/21 | | | 50,175 | |
| | 300,000 | | | Cosan Luxembourg SA (Luxembourg)
5.000%, 03/14/23 (a) | | | 285,750 | |
| | 195,000 | | | DIRECTV Holdings
4.450%, 04/01/24 | | | 198,144 | |
| | 295,000 | | | Ford Motor
Senior Unsecured Notes
7.450%, 07/16/31 | | | 385,602 | |
| | 45,000 | | | Goodyear Tire & Rubber
7.000%, 05/15/22 | | | 49,838 | |
| | 45,000 | | | Gray Television
7.500%, 10/01/20 | | | 48,600 | |
| | 600,000 | | | Grupo Idesa SA de CV (Mexico)
7.875%, 12/18/20 (a) | | | 632,250 | |
| | 50,000 | | | Hawk Acquisition Sub
Secured Notes
4.250%, 10/15/20 (a) | | | 49,400 | |
| | 210,000 | | | Macy’s Retail Holdings
2.875%, 02/15/23 | | | 199,259 | |
| | 175,000 | | | Mattel
Senior Unsecured Notes
2.500%, 11/01/16 | | | 180,827 | |
| | 45,000 | | | MGM Resorts International
6.625%, 12/15/21 | | | 49,570 | |
| | | | | | | | |
Par Value | | | | | Market
Value | |
| | | | | | | | |
| | |
| | | | Consumer Discretionary (continued) | | | | |
| $ | 30,000 | | | NCL (Bermuda)
5.000%, 02/15/18 | | $ | 31,125 | |
| | 45,000 | | | Sally Holdings
5.750%, 06/01/22 | | | 48,038 | |
| | 50,000 | | | Smithfield Foods
Senior Unsecured Notes
5.875%, 08/01/21 (a) | | | 52,688 | |
| | 205,000 | | | Teva Pharmaceutical Finance Co BV (Cook Islands)
2.950%, 12/18/22 | | | 195,516 | |
| | 45,000 | | | Toll Brothers Finance
5.875%, 02/15/22 | | | 48,488 | |
| | 50,000 | | | WCI Communities
Unsecured Notes
6.875%, 08/15/21 (a) | | | 51,625 | |
| | 230,000 | | | Wynn Las Vegas
7.750%, 08/15/20 | | | 255,323 | |
| | | | | | | | |
| | | | | | | 2,999,212 | |
| | | | | | | | |
| | |
| | | | Consumer Staples – 3.57% | | | | |
| | 415,000 | | | Altria Group
2.850%, 08/09/22 | | | 395,545 | |
| | 150,000 | | | Camposol SA
9.875%, 02/02/17 (a) | | | 155,250 | |
| | 175,000 | | | Coca-Cola
Senior Unsecured Notes
1.800%, 09/01/16 | | | 179,470 | |
| | 400,000 | | | Corp Azucarera del Peru SA
6.375%, 08/02/22 | | | 367,000 | |
| | 200,000 | | | Corp Lindley SA (Peru)
Senior Unsecured Notes
4.625%, 04/12/23 (a) | | | 193,200 | |
| | | | Corp Pesquera Inca SAC (Peru) | | | | |
| | 200,000 | | | 9.000%, 02/10/17 | | | 209,500 | |
| | 100,000 | | | 9.000%, 02/10/17 (a) | | | 104,750 | |
| | 200,000 | | | Diageo Capital (United Kingdom)
1.500%, 05/11/17 | | | 202,376 | |
| | | | Glencore Funding | | | | |
| | 95,000 | | | 2.500%, 01/15/19 (a) | | | 93,018 | |
| | 200,000 | | | 3.125%, 04/29/19 (a) | | | 201,000 | |
| | 153,000 | | | Kellogg
Senior Unsecured Notes
7.450%, 04/01/31 | | | 193,707 | |
| | 285,000 | | | Kroger
Senior Unsecured Notes
3.400%, 04/15/22 | | | 284,639 | |
| | 200,000 | | | Maestro Peru SA
6.750%, 09/26/19 | | | 183,500 | |
| | | | Minerva Luxembourg SA (Luxembourg) | | | | |
| | 400,000 | | | 7.750%, 01/31/23 | | | 412,500 | |
| | 300,000 | | | 8.750%, 12/29/49 (a) (b) | | | 299,325 | |
| | 45,000 | | | Post Holdings
7.375%, 02/15/22 (a) | | | 48,263 | |
| | 50,000 | | | Revlon Consumer Products
5.750%, 02/15/21 | | | 50,625 | |
See accompanying Notes to Financial Statements.
| | |
| |
| ASTON/DoubleLine Core Plus Fixed Income Fund | | April 30, 2014 |
| |
| Schedule of Investments (unaudited) – continued | | |
| | | | | | | | |
Par Value | | | | | Market
Value | |
| | | | | | | | |
| | |
| | | | Consumer Staples (continued) | | | | |
| $ | 50,000 | | | Reynolds Group Issuer
Senior Secured Notes,
5.750%, 10/15/20 | | $ | 52,250 | |
| | 45,000 | | | Safway Group Holding
Secured Notes
7.000%, 05/15/18 (a) | | | 47,925 | |
| | 50,000 | | | Service Corp International
Senior Unsecured Notes,
5.375%, 01/15/22 | | | 51,250 | |
| | 365,000 | | | Tyson Foods
4.500%, 06/15/22 | | | 386,853 | |
| | | | Wal-Mart Stores
Senior Unsecured Notes | | | | |
| | 225,000 | | | 3.250%, 10/25/20 | | | 235,589 | |
| | 145,000 | | | 3.300%, 04/22/24 | | | 144,899 | |
| | | | | | | | |
| | | | | | | 4,492,434 | |
| | | | | | | | |
| | |
| | | | Energy – 4.93% | | | | |
| | 50,000 | | | Atlas Pipeline Partners
4.750%, 11/15/21 | | | 47,750 | |
| | | | BP Capital Markets (United Kingdom) | | | | |
| | 80,000 | | | 4.750%, 03/10/19 | | | 89,606 | |
| | 100,000 | | | 2.500%, 11/06/22 | | | 94,623 | |
| | 150,000 | | | ConocoPhillips
6.500%, 02/01/39 | | | 201,773 | |
| | | | Devon Energy
Senior Unsecured Notes | | | | |
| | 200,000 | | | 6.300%, 01/15/19 | | | 234,339 | |
| | 130,000 | | | 4.000%, 07/15/21 | | | 137,066 | |
| | 200,000 | | | Gazprom Neft OAO Via GPN Capital SA (Luxemburg)
Senior Unsecured Notes
6.000%, 11/27/23 (a) | | | 181,500 | |
| | 900,000 | | | Gazprom OAO Via Gaz Capital SA (Luxembourg)
Senior Unsecured Notes
4.950%, 02/06/28 | | | 744,750 | |
| | 160,000 | | | Halliburton
Senior Unsecured Notes
6.150%, 09/15/19 | | | 190,462 | |
| | 150,000 | | | Kinder Morgan Energy Partners
Senior Unsecured Notes
6.950%, 01/15/38 | | | 182,357 | |
| | 160,000 | | | Marathon Petroleum
Senior Secured Notes
5.125%, 03/01/21 | | | 179,589 | |
| | 45,000 | | | Newfield Exploration
Senior Unsecured Notes
5.750%, 01/30/22 | | | 48,488 | |
| | 45,000 | | | Oasis Petroleum
6.875%, 03/15/22 (a) | | | 49,050 | |
| | 200,000 | | | Oleoducto Central SA
Senior Unsecured Notes,)
4.000%, 05/07/21 (a) | | | 198,734 | |
| | 176,000 | | | ONEOK Partners
6.125%, 02/01/41 | | | 203,156 | |
| | | | | | | | |
Par Value | | | | | Market
Value | |
| | | | | | | | |
| | |
| | | | Energy (continued) | | | | |
| | | | Pacific Rubiales Energy (Canada) | | | | |
| $ | 250,000 | | | 7.250%, 12/12/21 | | $ | 274,375 | |
| | 750,000 | | | 5.125%, 03/28/23 | | | 728,438 | |
| | 355,000 | | | Pemex Project Funding Master Trust
6.625%, 06/15/35 | | | 399,375 | |
| | 165,000 | | | Phillips 66
5.875%, 05/01/42 | | | 196,033 | |
| | 50,000 | | | Regency Energy Partners
5.500%, 04/15/23 | | | 50,875 | |
| | 500,000 | | | Reliance Industries
Senior Unsecured Notes,
5.875%, 02/28/49 | | | 475,250 | |
| | 200,000 | | | Rosneft Oil Co via Rosneft International Finance (Ireland)
Senior Unsecured Notes
4.199%, 03/06/22 | | | 168,000 | |
| | 40,000 | | | SM Energy
Senior Unsecured Notes
5.000%, 01/15/24 (a) | | | 39,400 | |
| | 210,000 | | | TransCanada PipeLines
Senior Unsecured Notes,
4.625%, 03/01/34 | | | 220,331 | |
| | 600,000 | | | Transportadora de Gas Internacional SA ESP (Colombia)
Senior Unsecured Notes,
5.700%, 03/20/22 | | | 641,250 | |
| | 45,000 | | | Ultra Petroleum (Canada)
Senior Unsecured Notes
5.750%, 12/15/18 (a) | | | 47,475 | |
| | 150,000 | | | Valero Energy
6.125%, 02/01/20 | | | 176,274 | |
| | | | | | | | |
| | | | | | | 6,200,319 | |
| | | | | | | | |
| | |
| | | | Financials – 10.64% | | | | |
| | 300,000 | | | Agromercantil Senior Trust
6.250%, 04/10/19 (a) | | | 306,375 | |
| | | | American Express Credit
Senior Unsecured Notes | | | | |
| | 225,000 | | | 2.125%, 07/27/18 | | | 228,063 | |
| | 145,000 | | | 2.125%, 03/18/19 | | | 145,239 | |
| | 375,000 | | | Australia & New Zealand Banking Group (Australia)
Senior Unsecured Notes
4.875%, 01/12/21 (a) | | | 417,820 | |
| | | | Banco de Bogota SA (Colombia) | | | | |
| | 400,000 | | | 5.375%, 02/19/23 | | | 407,500 | |
| | 400,000 | | | 5.375%, 02/19/23 (a) | | | 407,500 | |
| | 200,000 | | | Banco de Credito del Peru (Peru)
6.125%, 04/24/27 (a) (b) | | | 210,400 | |
| | 400,000 | | | Banco do Brasil SA/Cayman Islands (Belize)
8.500%, 10/20/99 (b) | | | 460,000 | |
| | 250,000 | | | Banco GNB Sudameris SA (Colombia)
7.500%, 07/30/22 | | | 265,000 | |
See accompanying Notes to Financial Statements.
| | |
| |
| ASTON/DoubleLine Core Plus Fixed Income Fund | | April 30, 2014 |
| |
| Schedule of Investments (unaudited) – continued | | |
| | | | | | | | |
Par Value | | | | | Market
Value | |
| | | | | | | | |
| | |
| | | | Financials (continued) | | | | |
| | | | Banco Internacional del Peru SAA (Peru) | | | | |
| $ | 200,000 | | | 6.625%, 03/19/29 (a) (b) | | $ | 205,750 | |
| | 300,000 | | | 8.500%, 04/23/70 (b) | | | 319,494 | |
| | 150,000 | | | Banco Regional SAECA (Paraguay)
Senior Unsecured Notes
8.125%, 01/24/19 (a) | | | 161,437 | |
| | 400,000 | | | Bank of Montreal (Canada)
Senior Unsecured Notes
1.400%, 09/11/17 | | | 400,409 | |
| | 150,000 | | | Bantrab Senior Trust
Senior Secured Notes,
9.000%, 11/14/20 | | | 150,187 | |
| | 200,000 | | | BB&T
Senior Unsecured Notes
2.250%, 02/01/19 | | | 200,802 | |
| | 600,000 | | | BBVA Bancomer SA (Grand Cayman)
6.008%, 05/17/22 | | | 620,250 | |
| | 175,000 | | | Boston Properties
Senior Unsecured Notes, REIT
4.125%, 05/15/21 | | | 186,326 | |
| | | | Cementos Progreso Trust (Cayman Islands) | | | | |
| | 200,000 | | | 7.125%, 11/06/23 | | | 213,000 | |
| | 300,000 | | | 7.125%, 11/06/23 (a) | | | 319,500 | |
| | 50,000 | | | CIT Group
Senior Unsecured Notes
5.000%, 08/15/22 | | | 51,312 | |
| | 300,000 | | | Comcel Trust (Cayman Islands)
6.875%, 02/06/24 (a) | | | 314,625 | |
| | | | CorpGroup Banking SA (Chile)
Senior Unsecured Notes | | | | |
| | 250,000 | | | 6.750%, 03/15/23 (a) | | | 247,430 | |
| | 250,000 | | | 6.750%, 03/15/23 | | | 247,518 | |
| | 200,000 | | | Credito Real SAB de CV
Senior Unsecured Notes,
7.500%, 03/13/19 (a) | | | 211,000 | |
| | 350,000 | | | General Electric Capital
Senior Unsecured Notes
2.900%, 01/09/17 | | | 366,874 | |
| | 125,000 | | | Goldman Sachs Group
Senior Unsecured Notes
5.750%, 01/24/22 | | | 142,801 | |
| | 900,000 | | | Grupo Aval (Cayman Islands)
4.750%, 09/26/22 | | | 882,000 | |
| | 50,000 | | | Icahn Enterprises
4.875%, 03/15/19 (a) | | | 50,813 | |
| | | | Industrial Senior Trust (Cayman Islands) | | | | |
| | 300,000 | | | 5.500%, 11/01/22 (a) | | | 290,625 | |
| | 500,000 | | | 5.500%, 11/01/22 | | | 484,375 | |
| | | | JPMorgan Chase
Senior Unsecured Notes | | | | |
| | 225,000 | | | 4.500%, 01/24/22 | | | 243,765 | |
| | 150,000 | | | 3.250%, 09/23/22 | | | 148,421 | |
| | 375,000 | | | Korea Development Bank (South Korea)
Senior Unsecured Notes
4.375%, 08/10/15 | | | 392,349 | |
| | 224,000 | | | Liberty Mutual Group
6.500%, 05/01/42 (a) | | | 272,982 | |
| | | | | | | | |
Par Value | | | | | Market
Value | |
| | | | | | | | |
| | |
| | | | Financials (continued) | | | | |
| $ | 200,000 | | | Magnesita Finance
8.625%, 04/29/49 | | $ | 192,880 | |
| | 400,000 | | | MetLife
Senior Unsecured Notes
4.125%, 08/13/42 | | | 383,238 | |
| | 225,000 | | | Morgan Stanley
Senior Unsecured Notes
3.750%, 02/25/23 | | | 225,524 | |
| | 25,000 | | | MPT Operating Partnership, REIT
6.375%, 02/15/22 | | | 26,938 | |
| | 345,000 | | | National Rural Utilities Cooperative Finance
10.375%, 11/01/18 | | | 466,883 | |
| | 50,000 | | | Nuveen Investments
Senior Unsecured Notes
9.500%, 10/15/20 (a) | | | 59,875 | |
| | 200,000 | | | Oversea-Chinese Banking
4.000%, 10/15/24 (a) (b) | | | 199,335 | |
| | | | PNC Funding | | | | |
| | 86,000 | | | 4.375%, 08/11/20 | | | 93,790 | |
| | 275,000 | | | 3.300%, 03/08/22 | | | 278,986 | |
| | 25,000 | | | Realogy Group
4.500%, 04/15/19 (a) | | | 25,250 | |
| | | | Simon Property Group, REIT
Senior Unsecured Notes | | | | |
| | 75,000 | | | 5.650%, 02/01/20 | | | 87,428 | |
| | 110,000 | | | 4.375%, 03/01/21 | | | 120,485 | |
| | 100,000 | | | SUAM Finance
4.875%, 04/17/24 (a) | | | 100,250 | |
| | 800,000 | | | VTB Bank OJSC Via VTB Capital SA (Luxembourg)
6.950%, 10/17/22 | | | 770,000 | |
| | | | Wells Fargo
Senior Unsecured Notes | | | | |
| | 275,000 | | | 4.600%, 04/01/21 | | | 305,001 | |
| | 75,000 | | | 3.500%, 03/08/22 | | | 77,082 | |
| | | | | | | | |
| | | | | | | 13,384,887 | |
| | | | | | | | |
| | |
| | | | Healthcare – 2.04% | | | | |
| | 45,000 | | | Alere
6.500%, 06/15/20 | | | 47,475 | |
| | 85,000 | | | Baxter International
Senior Unsecured Notes
3.200%, 06/15/23 | | | 83,295 | |
| | 280,000 | | | Becton Dickinson
Senior Unsecured Notes
3.125%, 11/08/21 | | | 285,968 | |
| | 45,000 | | | Biomet
6.500%, 08/01/20 | | | 49,444 | |
| | 200,000 | | | Celgene
Senior Unsecured Notes
3.250%, 08/15/22 | | | 197,444 | |
| | 600,000 | | | CFR International SpA
5.125%, 12/06/22 | | | 596,303 | |
| | 240,000 | | | Covidien International Finance SA (Luxembourg)
2.950%, 06/15/23 | | | 231,079 | |
See accompanying Notes to Financial Statements.
| | |
| |
| ASTON/DoubleLine Core Plus Fixed Income Fund | | April 30, 2014 |
| |
| Schedule of Investments (unaudited) – continued | | |
| | | | | | | | |
Par Value | | | | | Market
Value | |
| | | | | | | | |
| | |
| | | | Healthcare (continued) | | | | |
| $ | 45,000 | | | DaVita HealthCare Partners
5.750%, 08/15/22 | | $ | 47,813 | |
| | 35,000 | | | Forest Laboratories
Senior Unsecured Notes
4.375%, 02/01/19 (a) | | | 37,275 | |
| | 280,000 | | | Gilead Sciences
Senior Unsecured Notes,
3.700%, 04/01/24 | | | 284,589 | |
| | 25,000 | | | HCA
Senior Secured Notes,
3.750%, 03/15/19 | | | 25,250 | |
| | 35,000 | | | IASIS Healthcare
8.375%, 05/15/19 | | | 37,275 | |
| | 180,000 | | | Novartis Capital
3.400%, 05/06/24 | | | 182,011 | |
| | 50,000 | | | Select Medical
6.375%, 06/01/21 | | | 51,750 | |
| | 45,000 | | | Valeant Pharmaceuticals International (Canada)
Senior Unsecured Notes
7.500%, 07/15/21 (a) | | | 50,400 | |
| | 360,000 | | | WellPoint
Senior Unsecured Notes
2.300%, 07/15/18 | | | 363,466 | |
| | | | | | | | |
| | | | | | | 2,570,837 | |
| | | | | | | | |
| | |
| | | | Industrials – 6.91% | | | | |
| | 150,000 | | | Aeropuerto Internacional de Tocumen SA
5.750%, 10/09/23 (c) | | | 153,375 | |
| | 400,000 | | | Avianca Holdings SA
8.375%, 05/10/20 (a) | | | 419,000 | |
| | 50,000 | | | Avis Budget Car Rental
5.500%, 04/01/23 | | | 50,750 | |
| | 185,000 | | | Boeing
Senior Unsecured Notes
6.875%, 03/15/39 | | | 259,637 | |
| | 195,000 | | | Burlington Northern Santa Fe
Senior Unsecured Notes
3.000%, 03/15/23 | | | 188,661 | |
| | 600,000 | | | Cencosud SA (Colombia)
4.875%, 01/20/23 (a) | | | 588,896 | |
| | 150,000 | | | Daimler Finance North America
1.125%, 03/10/17 (a) | | | 149,943 | |
| | 50,000 | | | Dana Holding
Senior Unsecured Notes,
5.375%, 09/15/21 | | | 51,875 | |
| | 180,000 | | | Delphi
4.150%, 03/15/24 | | | 184,472 | |
| | | | ESAL GmbH (American Samoa) | | | | |
| | 800,000 | | | 6.250%, 02/05/23 (a) | | | 768,000 | |
| | 200,000 | | | 6.250%, 02/05/23 | | | 192,000 | |
| | 200,000 | | | Ferreycorp SAA (Peru)
4.875%, 04/26/20 (a) | | | 195,000 | |
| | 800,000 | | | Fresnillo (United Kingdom)
Senior Unsecured Notes
5.500%, 11/13/23 (a) | | | 824,000 | |
| | | | | | | | |
Par Value | | | | | Market
Value | |
| | | | | | | | |
| | |
| | | | Industrials (continued) | | | | |
| $ | 100,000 | | | Grupo Elektra SAB DE CV (Mexico)
7.250%, 08/06/18 | | $ | 104,750 | |
| | 700,000 | | | Grupo KUO SAB De CV (Mexico)
6.250%, 12/04/22 | | | 712,250 | |
| | 45,000 | | | HD Supply
7.500%, 07/15/20 | | | 48,938 | |
| | 50,000 | | | Hexion US Finance
Senior Secured Notes
6.625%, 04/15/20 | | | 52,188 | |
| | 175,000 | | | Illinois Tool Works
Senior Unsecured Notes
3.375%, 09/15/21 | | | 180,669 | |
| | 45,000 | | | Louisiana-Pacific
7.500%, 06/01/20 | | | 49,950 | |
| | 45,000 | | | Manitowoc
8.500%, 11/01/20 | | | 50,738 | |
| | 150,000 | | | Metalsa SA de CV
4.900%, 04/24/23 | | | 142,125 | |
| | 200,000 | | | Minsur SA (Peru)
Senior Unsecured Notes
6.250%, 02/07/24 (a) | | | 212,500 | |
| | | | OAS Financial (Belize) | | | | |
| | 200,000 | | | 8.875%, 04/29/49 | | | 193,500 | |
| | 400,000 | | | 8.875%, 12/29/49 (a) (b) | | | 387,000 | |
| | | | Odebrecht Finance (Cayman Island) | | | | |
| | 400,000 | | | 7.125%, 06/26/42 | | | 409,000 | |
| | 500,000 | | | 7.500%, 09/29/49 | | | 515,000 | |
| | | | Pesquera Exalmar S.A.A. (Peru)
Senior Unsecured Notes | | | | |
| | 200,000 | | | 7.375%, 01/31/20 (a) | | | 185,250 | |
| | 400,000 | | | 7.375%, 01/31/20 | | | 370,500 | |
| | 45,000 | | | RR Donnelley & Sons
Senior Unsecured Notes
7.875%, 03/15/21 | | | 51,750 | |
| | 200,000 | | | SMU SA (Colombia)
7.750%, 02/08/20 (a) | | | 143,000 | |
| | | | Southwest Airlines
Senior Unsecured Notes | | | | |
| | 26,000 | | | 5.750%, 12/15/16 | | | 28,805 | |
| | 225,000 | | | 5.125%, 03/01/17 | | | 246,413 | |
| | 44,000 | | | Spectrum Brands
6.625%, 11/15/22 | | | 48,290 | |
| | 45,000 | | | Terex
6.000%, 05/15/21 | | | 48,375 | |
| | 45,000 | | | United Rentals North America
7.625%, 04/15/22 | | | 50,850 | |
| | 150,000 | | | United Technologies
Senior Unsecured Notes
3.100%, 06/01/22 | | | 151,731 | |
| | 230,000 | | | Waste Management
6.125%, 11/30/39 | | | 285,023 | |
| | | | | | | | |
| | | | | | | 8,694,204 | |
| | | | | | | | |
| | |
| | | | Information Technology – 1.04% | | | | |
| | 45,000 | | | Activision Blizzard
5.625%, 09/15/21 (a) | | | 48,094 | |
See accompanying Notes to Financial Statements.
| | |
| |
| ASTON/DoubleLine Core Plus Fixed Income Fund | | April 30, 2014 |
| |
| Schedule of Investments (unaudited) – continued | | |
| | | | | | | | |
Par Value | | | | | Market
Value | |
| | | | | | | | |
| | |
| | | | Information Technology (continued) | | | | |
| $ | 175,000 | | | Arrow Electronics
Senior Unsecured Notes
3.375%, 11/01/15 | | $ | 181,129 | |
| | 45,000 | | | Equinix
Senior Unsecured Notes
7.000%, 07/15/21 | | | 50,389 | |
| | 215,000 | | | Microsoft
Senior Unsecured Notes
2.125%, 11/15/22 | | | 200,656 | |
| | 240,000 | | | Motorola Solutions
Senior Unsecured Notes
6.000%, 11/15/17 | | | 273,963 | |
| | | | Oracle
Senior Unsecured Notes | | | | |
| | 200,000 | | | 1.200%, 10/15/17 | | | 199,338 | |
| | 175,000 | | | 2.375%, 01/15/19 | | | 178,090 | |
| | 175,000 | | | Xerox
Senior Unsecured Notes
4.250%, 02/15/15 | | | 180,129 | |
| | | | | | | | |
| | | | | | | 1,311,788 | |
| | | | | | | | |
| | |
| | | | Materials – 4.31% | | | | |
| | 600,000 | | | Alfa Bank OJSC Via Alfa Bond Issuance (Iran)
7.500%, 09/26/19 | | | 588,000 | |
| | 50,000 | | | Ashland
4.750%, 08/15/22 | | | 49,625 | |
| | 200,000 | | | Braskem America Finance
7.125%, 07/22/41 | | | 199,750 | |
| | 300,000 | | | Braskem Finance
7.375%, 10/29/49 | | | 305,250 | |
| | 800,000 | | | Cia Minera Milpo SAA (Peru)
Senior Unsecured Notes
4.625%, 03/28/23 (a) | | | 767,000 | |
| | 200,000 | | | Dow Chemical
Senior Unsecured Notes
3.000%, 11/15/22 | | | 192,707 | |
| | 185,000 | | | Ecolab
Senior Unsecured Notes
1.000%, 08/09/15 | | | 185,930 | |
| | 800,000 | | | Mexichem SAB de CV (Mexico)
6.750%, 09/19/42 | | | 813,000 | |
| | 200,000 | | | OCP SA
Senior Unsecured Notes
5.625%, 04/25/24 (a) | | | 200,500 | |
| | 400,000 | | | Polyus Gold International (Jersey)
5.625%, 04/29/20 (a) | | | 371,000 | |
| | 50,000 | | | Sealed Air
6.500%, 12/01/20 (a) | | | 55,500 | |
| | 400,000 | | | Southern Copper
Senior Unsecured Notes
5.250%, 11/08/42 | | | 359,784 | |
| | | | | | | | |
Par Value | | | | | Market
Value | |
| | |
| | | | Materials (continued) | | | | |
| | | | Vedanta Resources PLC (United Kingdom)
Senior Unsecured Notes | | | | |
| | $ 500,000 | | | 8.250%, 06/07/21 | | $ | 532,188 | |
| | 800,000 | | | 7.125%, 05/31/23 (a) | | | 799,000 | |
| | | | | | | | |
| | | | | | | 5,419,234 | |
| | | | | | | | |
| | | | | | | | |
| | |
| | | | Telecommunications – 2.25% | | | | |
| | 185,000 | | | AT&T
Senior Unsecured Notes
5.350%, 09/01/40 | | | 193,442 | |
| | 100,000 | | | B Communications
Senior Secured Notes,
7.375%, 02/15/21 (a) | | | 106,250 | |
| | 321,000 | | | British Telecom (United Kingdom)
Senior Unsecured Notes
5.950%, 01/15/18 | | | 367,480 | |
| | 200,000 | | | Columbus International
7.375%, 03/30/21 (a) | | | 209,750 | |
| | 5,000 | | | Deutsche Telekom International Finance BV (Netherlands)
8.750%, 06/15/30 | | | 7,245 | |
| | 300,000 | | | Digicel Group
7.125%, 04/01/22 (a) | | | 302,250 | |
| | 50,000 | | | Intelsat Luxembourg SA (Luxemburg)
7.750%, 06/01/21 | | | 52,313 | |
| | 255,000 | | | Koninklijke KPN NV (Netherlands)
Senior Unsecured Notes
8.375%, 10/01/30 | | | 347,586 | |
| | 200,000 | | | Orange SA (France)
Senior Unsecured Notes
2.750%, 09/14/16 | | | 207,949 | |
| | 50,000 | | | SBA Communications
Senior Unsecured Notes
5.625%, 10/01/19 | | | 52,688 | |
| | 200,000 | | | Telefonica Celular del Paraguay SA (Paraguay)
Senior Unsecured Notes
6.750%, 12/13/22 (a) | | | 210,500 | |
| | 300,000 | | | TV Azteca SAB de CV (Mexico)
7.625%, 09/18/20 | | | 320,625 | |
| | 175,000 | | | Verizon Communications
Senior Unsecured Notes
2.500%, 09/15/16 | | | 181,237 | |
| | 300,000 | | | VimpelCom Holdings BV (Netherlands)
5.950%, 02/13/23 (a) | | | 271,500 | |
| | | | | | | | |
| | | | | | | 2,830,815 | |
| | | | | | | | |
| | |
| | | | Utilities – 2.08% | | | | |
| | 600,000 | | | Abengoa Transmision Sur
Senior Secured Notes
6.875%, 04/30/43 (a) | | | 626,250 | |
| | 500,000 | | | AES Andres Dominicana (Cayman Island)
Senior Secured Notes
9.500%, 11/12/20 | | | 535,000 | |
See accompanying Notes to Financial Statements.
| | |
| |
| ASTON/DoubleLine Core Plus Fixed Income Fund | | April 30, 2014 |
| |
| Schedule of Investments (unaudited) – continued | | |
| | | | | | | | |
Par Value | | | | | Market Value | |
| | |
| | | | Utilities (continued) | | | | |
| $ | 300,000 | | | AES El Salvador Trust II
6.750%, 03/28/23 | | $ | 288,000 | |
| | 175,000 | | | Duke Energy
Senior Unsecured Notes
3.550%, 09/15/21 | | | 181,567 | |
| | 200,000 | | | Instituto Costarricense de Electricidad (Costa Rica)
Senior Unsecured Notes
6.950%, 11/10/21 (a) | | | 210,500 | |
| | | | | | | | |
| | 200,000 | | | Mexico Generadora de Energia S de rl (Mexico)
Senior Secured Notes
5.500%, 12/06/32 | | | 197,500 | |
| | 225,000 | | | Midamerican Energy Holdings
Senior Unsecured Notes
6.500%, 09/15/37 | | | 287,906 | |
| | 275,000 | | | Southern Power
Senior Unsecured Notes
4.875%, 07/15/15 | | | 288,261 | |
| | | | | | | | |
| | | | | | | 2,614,984 | |
| | | | | | | | |
| | |
| | | | Total Corporate Notes and Bonds
(Cost $50,570,651) | | | 50,518,714 | |
| | | | | | | | |
|
| | COLLATERALIZED MORTGAGE-BACKED SECURITIES – 19.22% | |
| | |
| | 1,072,000 | | | American General Mortgage Loan Trust
Series 2010-1A, Class A3
5.650%, 03/25/58 (a) (b) | | | 1,108,602 | |
| | 100,000 | | | BAMLL Commercial Mortgage Securities Trust
Series 2012-CLRN, Class B
1.752%, 08/15/29 (a) (b) | | | 100,085 | |
| | 100,000 | | | BAMLL Commercial Mortgage Securities Trust
Series 2012-CLRN, Class D
2.852%, 08/15/29 (a) (b) | | | 100,264 | |
| | 350,000 | | | Banc of America Commercial Mortgage Trust
Series 2007-4, Class AM
6.015%, 02/10/51 (b) | | | 393,876 | |
| | 768,769 | | | Banc of America Funding
Series 2010-R9, Class 3A3
5.500%, 12/26/35 (a) | | | 629,989 | |
| | 790,407 | | | Banc of America Funding
Series 2006-B, Class 7A1
5.563%, 03/20/36 (b) | | | 749,603 | |
| | 651,416 | | | Banc of America Funding
Series 2012-R4, Class A
0.411%, 03/04/39 (a) (b) | | | 637,716 | |
| | 405,618 | | | Bear Stearns Asset Backed Securities I Trust
Series 2004-AC2, Class 2A
5.000%, 05/25/34 | | | 410,098 | |
| | 196,843 | | | Citicorp Mortgage Securities Trust
Series 2007-2, Class 3A1
5.500%, 02/25/37 | | | 196,867 | |
| | | | | | | | |
Par Value | | | | | Market
Value | |
| $ | 350,000 | | | Citigroup Commercial Mortgage Trust
Series 2013-SMP, Class C
2.738%, 01/12/18 (a) | | $ | 354,393 | |
| | 350,000 | | | Citigroup Commercial Mortgage Trust
Series 2013-SMP, Class D
3.008%, 01/12/18 (a) (b) | | | 351,812 | |
| | 979,755 | | | Citigroup Commercial Mortgage Trust
Series 2012-GC8, Class XA
2.393%, 09/10/45 (a) (b) | | | 109,923 | |
| | | | | | | | |
| | 6,519,774 | | | Citigroup/Deutsche Bank Commercial Mortgage Trust
Series 2007-CD5, Class XP
0.306%, 11/15/44 (a) (b) | | | 7,830 | |
| | 340,000 | | | Citigroup/Deutsche Bank Commercial Mortgage Trust
Series 2007-CD4, Class AMFX
5.366%, 12/11/49 (b) | | | 358,272 | |
| | 1,963,560 | | | Commercial Mortgage Pass Through Certificates
Series 2012-CR3, Class XA
2.349%, 10/15/45 (b) | | | 240,543 | |
| | 165,507 | | | Commercial Mortgage Pass Through Certificates
Series 2010-C1, Class XPA
2.485%, 07/10/46 (a) (b) | | | 5,319 | |
| | 1,792,665 | | | Countrywide Alternative Loan Trust
Series 2005-86CB, Class A5
5.500%, 02/25/36 | | | 1,579,261 | |
| | 545,750 | | | Countrywide Alternative Loan Trust
Series 2006-J1, Class 2A1
7.000%, 02/25/36 | | | 239,789 | |
| | 109,250 | | | Countrywide Alternative Loan Trust
Series 2007-18CB, Class 2A17
6.000%, 08/25/37 | | | 93,613 | |
| | 421,365 | | | Countrywide Alternative Loan Trust
Series 2007-23CB, Class A3
0.652%, 09/25/37 (b) | | | 301,942 | |
| | 402,334 | | | Countrywide Alternative Loan Trust
Series 2007-23CB, Class A4
6.348%, 09/25/37 (b) (d) | | | 88,737 | |
| | 1,420,078 | | | Countrywide Home Loan Mortgage Pass Through Trust
Series 2007-12, Class A9
5.750%, 08/25/37 | | | 1,363,008 | |
| | 969,348 | | | Countrywide Home Loan Mortgage Pass Through Trust
Series 2005-HYB8, Class 4A1
4.395%, 12/20/35 (b) | | | 834,252 | |
| | 852,743 | | | Countrywide Home Loan Mortgage Pass Through Trust
Series 2007-2, Class A13
6.000%, 03/25/37 | | | 781,500 | |
| | 194,320 | | | Countrywide Home Loan Mortgage Pass Through Trust
Series 2007-7, Class A4
5.750%, 06/25/37 | | | 179,344 | |
See accompanying Notes to Financial Statements.
| | |
| |
| ASTON/DoubleLine Core Plus Fixed Income Fund | | April 30, 2014 |
| |
| Schedule of Investments (unaudited) – continued | | |
| | | | | | | | |
Par Value | | | | | Market
Value | |
| $ | 275,000 | | | Credit Suisse Commercial Mortgage Trust
Series 2006-C4, Class AM
5.509%, 09/15/39 | | $ | 296,698 | |
| | 75,997 | | | Credit Suisse First Boston Mortgage Securities
Series 1998-C2, Class F
6.750%, 11/15/30 (a) (b) | | | 78,494 | |
| | 2,187,274 | | | Credit Suisse First Boston Mortgage Securities
Series 1997-C2, Class AX
0.341%, 01/17/35 (b) | | | 809 | |
| | | | | | | | |
| | 147,759 | | | Credit Suisse Mortgage Capital Certificates
Series 2006-TF2A, Class A2
0.322%, 10/15/21 (a) (b) | | | 147,279 | |
| | 221,306 | | | Credit Suisse Mortgage Capital Certificates
Series 2009-13R, Class 2A1
6.000%, 01/26/37 (a) | | | 230,802 | |
| | 1,255,674 | | | Credit Suisse Mortgage Capital Certificates
Series 2007-1, Class 5A4
6.000%, 02/25/37 | | | 1,105,075 | |
| | 250,000 | | | Credit Suisse Mortgage Capital Certificates
Series 2009-RR2, Class IQB
5.695%, 04/16/49 (a) (b) | | | 269,508 | |
| | 200,000 | | | DBRR Trust
Series 2012-EZ1, Class B
1.393%, 09/25/45 (a) (c) | | | 200,060 | |
| | 150,000 | | | Del Coronado Trust
Series 2013-HDC, Class D
2.103%, 03/15/26 (a) (b) | | | 149,317 | |
| | 150,000 | | | Del Coronado Trust
Series 2013-HDC, Class E
2.803%, 03/15/26 (a) (b) | | | 148,502 | |
| | 100,000 | | | GE Capital Commercial Mortgage
Series 2005-C2, Class B
5.113%, 05/10/43 (b) | | | 103,266 | |
| | 350,000 | | | GS Mortgage Securities Trust
Series 2006-GG6, Class AJ
5.755%, 04/10/38 (b) | | | 358,697 | |
| | 898,740 | | | GSR Mortgage Loan Trust
Series 2006-AR1, Class 3A1
2.824%, 01/25/36 (b) | | | 796,344 | |
| | 88,981 | | | HSI Asset Loan Obligation Trust
Series 2007-2, Class 1A1
5.500%, 09/15/37 | | | 89,717 | |
| | 300,000 | | | JP Morgan Chase Commercial Mortgage Securities
Series 2012-PHH, Class A
1.818%, 10/15/25 (a) (b) | | | 301,041 | |
| | 250,000 | | | JP Morgan Chase Commercial Mortgage Securities Trust
Series 2005-CB12 , Class B
5.144%, 09/01/37 | | | 246,921 | |
| | 2,092,642 | | | JP Morgan Chase Commercial Mortgage Securities Trust
Series 2006-LDP8, Class X
0.727%, 05/15/45 (b) | | | 23,557 | |
| | | | | | | | |
Par Value | | | | | Market
Value | |
| $ | 970,132 | | | JP Morgan Chase Commercial Mortgage Securities Trust
Series 2012-CBX, Class XA
2.171%, 06/01/45 (b) | | $ | 93,235 | |
| | 2,392,626 | | | JP Morgan Chase Commercial Mortgage Securities Trust
Series 2012-C8, Class XA
2.301%, 10/15/45 (b) | | | 268,969 | |
| | 1,219,542 | | | JP Morgan Chase Commercial Mortgage Securities Trust
Series 2011-C4, Class XA
1.680%, 07/15/46 (a) (b) | | | 63,127 | |
| | | | | | | | |
| | 350,000 | | | JP Morgan Chase Commercial Mortgage Securities Trust
Series 2007-CB19 Class AM
5.895%, 02/12/49 (b) | | | 381,285 | |
| | 250,000 | | | JP Morgan Chase Commercial Mortgage Securities Trust
Series 2007-LD12, Class AM
6.207%, 02/15/51 (b) | | | 278,681 | |
| | 250,000 | | | LB Commercial Mortgage Trust
Series 2007-C3, Class AMFL
6.080%, 07/15/44 (a) (b) | | | 279,549 | |
| | 350,000 | | | LB-UBS Commercial Mortgage Trust
Series 2007-C1, Class AJ
5.484%, 02/15/40 | | | 364,729 | |
| | 350,000 | | | Merrill Lynch Mortgage Trust
Series 2006-C2, Class AJ
5.802%, 08/12/43 (b) | | | 355,511 | |
| | 250,000 | | | ML-CFC Commercial Mortgage Trust
Series 2007-5, Class AM
5.419%, 08/21/48 | | | 266,670 | |
| | 977,883 | | | Morgan Stanley Bank of America Merrill Lynch Trust
Series 2012-C5, Class XA
2.034%, 08/15/45 (a) (b) | | | 90,879 | |
| | 250,000 | | | Morgan Stanley Bank of America Merrill Lynch Trust
Series 2014-C14, Class D
4.997%, 02/15/47 (a) (b) | | | 233,413 | |
| | 300,000 | | | Morgan Stanley Capital I Trust
Series 2007-HQ11, Class AJ
5.508%, 02/12/44 (b) | | | 318,100 | |
| | 300,000 | | | Morgan Stanley Capital I Trust
Series 2006-HQ8, Class AJ
5.678%, 03/12/44 (b) | | | 314,084 | |
| | 250,000 | | | Morgan Stanley Capital I Trust
Series 2007-IQ13, Class AM
5.406%, 03/15/44 | | | 273,915 | |
| | 1,433,392 | | | Morgan Stanley Capital I Trust
Series 2011-C1, Class XA
1.094%, 09/15/47 (a) (b) | | | 31,078 | |
| | 1,272,372 | | | Morgan Stanley Mortgage Loan Trust
Series 2005-3AR, Class 2A2
3.031%, 07/25/35 (b) | | | 1,169,456 | |
| | 200,000 | | | Morgan Stanley Re-REMIC Trust
Series 2010-HQ4, Class AJ
4.970%, 04/15/40 (a) | | | 202,316 | |
See accompanying Notes to Financial Statements.
| | |
| |
| ASTON/DoubleLine Core Plus Fixed Income Fund | | April 30, 2014 |
| |
| Schedule of Investments (unaudited) – continued | | |
| | | | | | | | |
Par Value | | | | | Market Value | |
| $ | 300,000 | | | Nomura Asset Acceptance Corp Alternative Loan Trust
Series 2005-AP3, Class A3
5.318%, 08/25/35 (b) | | $ | 234,266 | |
| | 252,710 | | | Residential Asset Securitization Trust
Series 2006-A6, Class 1A1
6.500%, 07/25/36 | | | 169,117 | |
| | 608,252 | | | Residential Asset Securitization Trust
Series 2007-A1, Class A8
6.000%, 03/25/37 | | | 485,663 | |
| | | | | | | | |
| | 86,431 | | | RREF
Series 2013-LT2, Class A
2.833%, 05/22/28 (a) | | | 86,420 | |
| | 24,210 | | | SMA Issuer I
Series 2012-LV1, Class A
3.500%, 08/20/25 (a) | | | 24,210 | |
| | 432,696 | | | Structured Adjustable Rate Mortgage Loan Trust
Series 2006-1, Class 2A2
2.441%, 02/25/36 (b) | | | 382,382 | |
| | 1,946,949 | | | UBS-Barclays Commercial Mortgage Trust
Series 2012-C3, Class XA
2.323%, 08/10/49 (a) (b) | | | 235,011 | |
| | 350,000 | | | Wachovia Bank Commercial Mortgage Trust
Series 2007-C30, Class AMFL
0.351%, 12/15/43 (a) (b) | | | 333,704 | |
| | 612,558 | | | Wells Fargo Mortgage Backed Securities Trust
Series 2007-8, Class 1A16
6.000%, 07/25/37 | | | 612,129 | |
| | 572,036 | | | Wells Fargo Mortgage Backed Securities Trust
Series 2007-13, Class A6
6.000%, 09/25/37 | | | 588,094 | |
| | 979,058 | | | WF-RBS Commercial Mortgage Trust
Series 2012-C8, Class XA
2.384%, 08/15/45 (a) (b) | | | 111,735 | |
| | 1,458,932 | | | WF-RBS Commercial Mortgage Trust
Series 2012-C9, Class XA
2.402%, 11/15/45 (a) (b) | | | 178,334 | |
| | | | | | | | |
| | |
| | | | Total Collateralized Mortgage-Backed Securities
(Cost $22,372,347) | | | 24,188,787 | |
| | | | | | | | |
|
| | U.S. GOVERNMENT OBLIGATIONS – 11.46% | |
| | |
| | | | U.S. Treasury Bonds – 1.75% | | | | |
| | 2,080,000 | | | 3.750%, 08/15/41 | | | 2,206,100 | |
| | |
| | | | U.S. Treasury Notes – 9.71% | | | | |
| | 910,000 | | | 1.500%, 01/31/19 | | | 905,094 | |
| | 3,000,000 | | | 1.000%, 08/31/19 | | | 2,876,016 | |
| | 2,820,000 | | | 1.875%, 06/30/20 | | | 2,794,112 | |
| | | | | | | | |
Par Value | | | | | Market Value | |
| | |
| | | | U.S. Treasury Notes (continued) | | | | |
| $ | 3,790,000 | | | 1.625%, 08/15/22 | | $ | 3,548,683 | |
| | 2,070,000 | | | 2.750%, 11/15/23 | | | 2,091,994 | |
| | | | | | | | |
| | | | | | | 12,215,899 | |
| | | | | | | | |
| | |
| | | | Total U.S. Government Obligations
(Cost $14,468,076) | | | 14,421,999 | |
| | | | | | | | |
|
| | AGENCY COLLATERALIZED MORTGAGE OBLIGATIONS – 10.34% | |
| | |
| | | | Fannie Mae – 4.29% | | | | |
| | 600,310 | | | 5.648%, 09/25/36 (b) (d)
Series 2009-86, Class CI, REMIC | | | 68,332 | |
| | 350,244 | | | 6.468%, 10/25/36 (b) (d)
Series 2007-57, Class SX, REMIC | | | 56,339 | |
| | | | | | | | |
| | 301,495 | | | 4.000%, 01/25/41
Series 2010-156, Class ZC, REMIC | | | 265,918 | |
| | 453,920 | | | 4.000%, 03/25/41
Series 2011-18, Class UZ, REMIC | | | 453,337 | |
| | 69,977 | | | 8.997%, 09/25/41 (b)
Series 2011-88, Class SB, REMIC | | | 69,276 | |
| | 623,028 | | | 4.500%, 12/25/41
Series 2011-121, Class JP, REMIC | | | 645,613 | |
| | 1,078,664 | | | 3.500%, 03/25/42
Series 2012-20, Class ZT, REMIC | | | 990,243 | |
| | 1,630,130 | | | 4.000%, 04/25/42
Series 2012-31, Class Z, REMIC | | | 1,610,190 | |
| | 1,056,896 | | | 3.500%, 10/25/42
Series 2012-105, Class Z, REMIC | | | 922,035 | |
| | 425,075 | | | 1.500%, 02/25/43
Series 2013-6, Class ZH, REMIC | | | 316,785 | |
| | | | | | | | |
| | | | | | | 5,398,068 | |
| | | | | | | | |
| | |
| | | | Freddie Mac – 3.91% | | | | |
| | 796,562 | | | 5.000%, 12/15/34
Series 2909, Class Z, REMIC | | | 875,289 | |
| | 413,658 | | | 5.500%, 08/15/36
Series 3626, Class AZ, REMIC | | | 454,976 | |
| | 250,959 | | | 5.948%, 04/15/37 (b) (d)
Series 3301, Class MS, REMIC | | | 32,635 | |
| | 159,227 | | | 5.848%, 11/15/37 (b) (d)
Series 3382, Class SB, REMIC | | | 18,672 | |
| | 157,057 | | | 6.238%, 11/15/37 (b) (d)
Series 3384, Class S, REMIC | | | 20,902 | |
| | 1,500,000 | | | 4.000%, 12/15/38
Series 3738, Class BP, REMIC | | | 1,565,747 | |
| | 507,586 | | | 5.368%, 01/15/39 (b) (d)
Series 3500, Class SA, REMIC | | | 59,487 | |
| | 113,858 | | | 4.000%, 01/15/41
Series 3795, Class VZ, REMIC | | | 114,292 | |
| | 124,745 | | | 4.000%, 06/15/41
Series 3872, Class BA, REMIC | | | 130,607 | |
| | 223,215 | | | 4.000%, 07/15/41
Series 3888, Class ZG, REMIC | | | 222,347 | |
| | 395,962 | | | 4.500%, 07/15/41
Series 3894, Class ZA, REMIC | | | 427,373 | |
| | 14,901 | | | 9.257%, 09/15/41 (b)
Series 3924, Class US, REMIC | | | 14,302 | |
See accompanying Notes to Financial Statements.
| | |
| |
| ASTON/DoubleLine Core Plus Fixed Income Fund | | April 30, 2014 |
| |
| Schedule of Investments (unaudited) – continued | | |
| | | | | | | | |
Par Value | | | | | Market Value | |
| | |
| | | | Freddie Mac (continued) | | | | |
| $ | 544,065 | | | 3.500%, 11/15/41
Series 3957, Class DZ, REMIC | | $ | 514,614 | |
| | 495,592 | | | 4.000%, 11/15/41
Series 3957, Class HZ, REMIC | | | 466,085 | |
| | | | | | | | |
| | | | | | | 4,917,328 | |
| | | | | | | | |
| |
| | | | Government National Mortgage Association – 2.14% | |
| | 49,950 | | | 31.511%, 03/20/34 (b)
Series 2004-35, Class SA | | | 80,919 | |
| | 724,352 | | | 7.478%, 08/20/38 (b) (d)
Series 2008-69, Class SB | | | 132,435 | |
| | 560,065 | | | 5.916%, 03/20/39 (b) (d)
Series 2010-98, Class IA | | | 60,573 | |
| | | | | | | | |
| | 832,471 | | | 4.500%, 05/16/39
Series 2009-32, Class ZE | | | 876,313 | |
| | 623,560 | | | 4.500%, 05/20/39
Series 2009-35, Class DZ | | | 670,313 | |
| | 614,293 | | | 4.500%, 09/20/39
Series 2009-75, Class GZ | | | 652,677 | |
| | 1,772,144 | | | 5.298%, 06/20/41 (b) (d)
Series 2011-89, Class SA | | | 224,078 | |
| | | | | | | | |
| | | | | | | 2,697,308 | |
| | | | | | | | |
| | |
| | | | Total Agency Collateralized Mortgage Obligations
(Cost $13,270,865) | | | 13,012,704 | |
| | | | | | | | |
|
| | U.S. GOVERNMENT MORTGAGE-BACKED SECURITIES – 7.02% | |
| | |
| | | | Fannie Mae – 4.10% | | | | |
| | 374,153 | | | 4.000%, 09/01/31
Pool # MA3894 | | | 398,237 | |
| | 887,369 | | | 3.500%, 12/01/31
Pool # MA0919 | | | 923,643 | |
| | 780,762 | | | 3.500%, 01/01/32
Pool # MA0949 | | | 812,686 | |
| | 1,899,042 | | | 3.000%, 06/01/33
Pool # MA1459 | | | 1,912,468 | |
| | 369,245 | | | 4.500%, 03/01/42
Pool # MA1050 | | | 392,637 | |
| | 691,175 | | | 4.000%, 06/01/42
Pool # AB5459 | | | 720,466 | |
| | | | | | | | |
| | | | | | | 5,160,137 | |
| | | | | | | | |
| | |
| | | | Freddie Mac – 2.92% | | | | |
| | 1,833,003 | | | 3.000%, 01/01/33
Gold Pool # C91594 | | | 1,852,794 | |
| | 59,336 | | | 5.000%, 07/01/35
Gold Pool # G01840 | | | 65,261 | |
| | 20,565 | | | 5.500%, 12/01/38
Gold Pool # G06172 | | | 22,670 | |
| | | | | | | | |
Par Value | | | | | Market
Value | |
| | |
| | | | Freddie Mac (continued) | | | | |
| $ | 354,910 | | | 4.000%, 10/01/41
Gold Pool # T60392 | | $ | 369,132 | |
| | 1,352,629 | | | 3.500%, 10/01/42
Gold Pool # T65110 | | | 1,362,410 | |
| | | | | | | | |
| | | | | | | 3,672,267 | |
| | | | | | | | |
| | |
| | | | Total U.S. Government Mortgage-Backed Securities
(Cost $8,987,304) | | | 8,832,404 | |
| | | | | | | | |
|
| | ASSET-BACKED SECURITIES – 4.27% | |
| | |
| | 250,000 | | | ALM IV (Cayman Islands)
Series 2011-A4, Class C
2.976%, 07/18/22 (a) (b) | | | 248,229 | |
| | 250,000 | | | ARES CLO (Cayman Islands)
Series 2012-2A, Class D
4.927%, 10/12/23 (a) (b) | | | 250,684 | |
| | | | | | | | |
| | 500,000 | | | ARES XXVI CLO (Cayman Islands)
Series 2013-1A, Class D
3.977%, 04/15/25 (a) (b) | | | 488,211 | |
| | 1,237,947 | | | Bayview Financial Acquisition Trust
Series 2007-A, Class 1A5
6.101%, 05/01/37 (e) | | | 1,245,077 | |
| | 250,000 | | | BlueMountain CLO (Cayman Islands)
Series 2012-1A, Class E
5.728%, 07/20/23 (a) (b) | | | 245,606 | |
| | | | Brookside Mill CLO (Cayman Islands)
Series 2013-1A, Class D | | | | |
| | 250,000 | | | 3.276%, 04/17/25 (a) (b) | | | 234,952 | |
| | | | Series 2013-1A, Class E | | | | |
| | 250,000 | | | 4.626%, 04/17/25 (a) (b) | | | 224,276 | |
| | 100,000 | | | Credit-Based Asset Servicing and Securitization
Series 2007-MX1, Class A4
6.231%, 12/25/36 (e) | | | 78,451 | |
| | 250,000 | | | Goldentree Loan Opportunities VI (Cayman Islands)
Series 2012-6A, Class D
4.426%, 04/17/22 (a) (b) | | | 249,996 | |
| | 757,000 | | | GSAA Home Equity Trust
Series 2006-15, Class AF3B
5.933%, 09/25/36 (b) | | | 186,994 | |
| | 250,000 | | | LCM X (Cayman Islands)
Series 11A, Class D
4.178%, 04/19/22 (a) (b) | | | 248,635 | |
| | | | Nomad CLO (Cayman Islands)
Series 2013-1A, Class B | | | | |
| | 250,000 | | | 3.177%, 01/15/25 (a) (b) | | | 248,583 | |
| | | | Series 2013-1A, Class C | | | | |
| | 250,000 | | | 3.727%, 01/15/25 (a) (b) | | | 242,194 | |
| | | | Octagon Investment Partners XVI (Cayman Islands)
Series 2013-1A, Class D | | | | |
| | 250,000 | | | 3.576%, 07/17/25 (a) (b) | | | 241,166 | |
| | | | Series 2013-1A, Class E | | | | |
| | 250,000 | | | 4.726%, 07/17/25 (a) (b) | | | 226,508 | |
See accompanying Notes to Financial Statements.
| | |
| |
| ASTON/DoubleLine Core Plus Fixed Income Fund | | April 30, 2014 |
| |
| Schedule of Investments (unaudited) – continued | | |
| | | | | | | | |
Par Value | | | | | Market Value | |
| $ | 244,091 | | | Residential Asset Mortgage Products
Series 2006-RS5, Class A3
0.322%, 09/25/36 (b) | | $ | 234,235 | |
| | 250,000 | | | WhiteHorse III (Cayman Islands)
Series 2006-1A, Class B1L
2.075%, 05/01/18 (a) (b) | | | 245,740 | |
| | 250,000 | | | Wind River CLO
Series 2013-1A, Class C
3.628%, 04/20/25 (a) (b) | | | 235,710 | |
| | | | | | | | |
| | |
| | | | Total Asset-Backed Securities
(Cost $5,341,850) | | | 5,375,247 | |
| | | | | | | | |
| | | | | | | | |
|
| | FOREIGN GOVERNMENT BONDS – 0.70% | |
| | |
| | 360,000 | | | Corp Andina de Fomento
Senior Unsecured Notes
3.750%, 01/15/16 | | | 377,989 | |
| | 300,000 | | | Mexico Government International Bond
Senior Unsecured Notes
4.000%, 10/02/23 | | | 307,875 | |
| | 200,000 | | | Republic of Costa Rica
Unsecured Notes
7.000%, 04/04/44 (a) | | | 199,500 | |
| | | | | | | | |
| | |
| | | | Total Foreign Government Bonds
(Cost $869,378) | | | 885,364 | |
| | | | | | | | |
Shares | | | | | | |
|
| | INVESTMENT COMPANIES – 5.66% | |
| | 4,590,290 | | | BlackRock Liquidity Funds
TempCash Portfolio | | | 4,590,290 | |
| | 250,173 | | | DoubleLine Floating Rate Fund | | | 2,531,755 | |
| | | | | | | | |
| | |
| | | | Total Investment Companies
(Cost $7,107,035) | | | 7,122,045 | |
| | | | | | | | |
| Total Investments – 98.82%
(Cost $122,987,506)* | | | 124,357,264 | |
| | | | | | | | |
| Net Other Assets and Liabilities – 1.18% | | | 1,483,544 | |
| | | | | | | | |
| Net Assets – 100.00% | | $ | 125,840,808 | |
| | | | | | | | |
| * | | At April 30, 2014, cost is identical for book and Federal income tax purposes |
| | | | |
Gross unrealized appreciation | | $ | 3,160,745 | |
Gross unrealized depreciation | | | (1,790,987 | ) |
| | | | |
Net unrealized appreciation | | $ | 1,369,758 | |
| | | | |
| (a) | | Securities exempt from registration under Rule 144A of the Securities Act of 1933, as amended. These securities are purchased in accordance with guidelines approved by the Fund’s Board of Trustees and may only be resold, in transactions exempt from registration, to qualified institutional buyers. At April 30, 2014, these securities amounted to $25,372,440 or 20.16% of net assets. These securities have not been determined by the Subadviser to be illiquid securities. |
| (b) | | Variable rate bond. The interest rate shown reflects the rate in effect at April 30, 2014. |
| (c) | | Securities with a total aggregate market value of $353,435 or 0.28% of net assets, were valued under the fair value procedures approved by the Fund’s Board of Trustees. |
| (d) | | Interest only security. This type of security represents the right to receive the monthly interest payments on an underlying pool of mortgages. Payments of principal on the pool reduce the value of the “interest only” holding. |
| (e) | | Step Coupon. Security becomes interest bearing at a future date. |
| REIT | | Real Estate Investment Trust |
| REMIC | | Real Estate Mortgage Investment Conduit |
| | | | |
Portfolio Composition | | | | |
U.S. Government Obligations | | | 17% | |
U.S. Government Agency Obligations | | | 11% | |
Corporate Notes and Bonds | | | | |
(S&P Ratings) | | | | |
AAA | | | 2% | |
AA | | | 4% | |
A | | | 10% | |
BBB | | | 21% | |
BB | | | 15% | |
B | | | 4% | |
Lower than B | | | 11% | |
Not Rated | | | 5% | |
| | | | |
| | | 100% | |
| | | | |
See accompanying Notes to Financial Statements.
| | |
| |
| ASTON/TCH Fixed Income Fund | | April 30, 2014 |
| |
| Schedule of Investments (unaudited) | | |
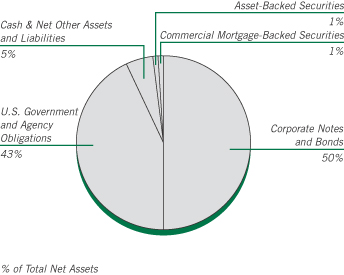
| | | | | | | | |
Par Value | | | | | Market
Value | |
| |
| | CORPORATE NOTES AND BONDS – 49.64% | | | | |
| | |
| | | | Consumer Discretionary – 4.09% | | | | |
| | $350,000 | | | ADT
Senior Unsecured Notes
4.875%, 07/15/42 | | $ | 290,063 | |
| | 300,000 | | | HJ Heinz Finance Co. (a)
7.125%, 08/01/39 | | | 325,500 | |
| | 865,000 | | | L Brands
Senior Unsecured Notes
7.600%, 07/15/37 | | | 927,713 | |
| | 100,000 | | | Macy’s Retail Holdings
7.875%, 07/15/15 (b) | | | 108,342 | |
| | 500,000 | | | Whirlpool, MTN
Senior Unsecured Notes
8.600%, 05/01/14 | | | 500,000 | |
| | | | | | | | |
| | | | | | | 2,151,618 | |
| | | | | | | | |
| | |
| | | | Consumer Staples – 0.80% | | | | |
| | 65,000 | | | Altria Group
10.200%, 02/06/39 | | | 108,822 | |
| | 150,000 | | | PepsiCo
Senior Unsecured Notes
7.900%, 11/01/18 | | | 188,115 | |
| | 100,000 | | | Reynolds American
7.750%, 06/01/18 | | | 120,510 | |
| | | | | | | | |
| | | | | | | 417,447 | |
| | | | | | | | |
| | |
| | | | Energy – 6.31% | | | | |
| | | | Chesapeake Energy | | | | |
| | 250,000 | | | 6.625%, 08/15/20 | | | 282,187 | |
| | 250,000 | | | 6.125%, 02/15/21 | | | 275,000 | |
| | 250,000 | | | Energy Transfer Partners
Senior Unsecured Notes
9.000%, 04/15/19 | | | 319,650 | |
| | | | | | | | |
Par Value | | | | | Market
Value | |
| | |
| | | | Energy (continued) | | | | |
| | $250,000 | | | Hess
Senior Unsecured Notes
8.125%, 02/15/19 | | $ | 315,145 | |
| | 250,000 | | | KazMunayGas National (Kazakhstan)
Senior Unsecured Notes
5.750%, 04/30/43 (a) | | | 227,518 | |
| | 400,000 | | | Kinder Morgan Energy Partners
Senior Unsecured Notes
9.000%, 02/01/19 | | | 512,205 | |
| | 250,000 | | | Pride International
6.875%, 08/15/20 | | | 300,933 | |
| | 250,000 | | | Rockies Express Pipeline
Senior Unsecured Notes
6.875%, 04/15/40 (a) | | | 233,750 | |
| | 250,000 | | | Valero Energy
9.375%, 03/15/19 | | | 326,743 | |
| | 400,000 | | | Weatherford International (Bermuda)
9.625%, 03/01/19 | | | 525,302 | |
| | | | | | | | |
| | | | | | | 3,318,433 | |
| | | | | | | | |
| | |
| | | | Financials – 13.88% | | | | |
| | 250,000 | | | AFLAC
Senior Unsecured Notes
8.500%, 05/15/19 | | | 323,623 | |
| | 450,000 | | | American Financial Group
Senior Unsecured Notes
9.875%, 06/15/19 | | | 589,722 | |
| | 250,000 | | | Banco Bradesco SA/Cayman Islands (Brazil)
Subordinated Notes
5.750%, 03/01/22 (a) | | | 261,563 | |
| | 250,000 | | | Bancolombia SA (Colombia)
Senior Unsecured Notes
5.950%, 06/03/21 | | | 271,875 | |
| | | | Subordinated Notes | | | | |
| | 250,000 | | | 5.125%, 09/11/22 | | | 249,063 | |
| | 250,000 | | | Barrick North America Finance
5.700%, 05/30/41 | | | 249,828 | |
| | | | Blackstone Holdings Finance | | | | |
| | 150,000 | | | 6.625%, 08/15/19 (a) (d) | | | 177,888 | |
| | 250,000 | | | 6.250%, 08/15/42 (a) (d) | | | 299,823 | |
| | 250,000 | | | Bunge Ltd Finance
8.500%, 06/15/19 | | | 312,286 | |
| | 250,000 | | | Discover Bank
Subordinated Notes
7.000%, 04/15/20 | | | 299,420 | |
| | 800,000 | | | Goldman Sachs Capital I
6.345%, 02/15/34 | | | 847,446 | |
| | 400,000 | | | Itau Unibanco Holding SA (Brazil)
Subordinated Notes
5.500%, 08/06/22 (a) | | | 404,000 | |
| | | | Jefferies Group
Senior Unsecured Notes | | | | |
| | 200,000 | | | 8.500%, 07/15/19 | | | 247,440 | |
| | 250,000 | | | 6.500%, 01/20/43 | | | 268,618 | |
See accompanying Notes to Financial Statements.
| | |
| |
| ASTON/TCH Fixed Income Fund | | April 30, 2014 |
| |
| Schedule of Investments (unaudited) – continued | | |
| | | | | | | | |
Par Value | | | | | Market
Value | |
| | |
| | | | Financials (continued) | | | | |
| | $200,000 | | | Leucadia National
Senior Unsecured Notes
5.500%, 10/18/23 | | $ | 210,717 | |
| | 300,000 | | | Marsh & McLennan
Senior Unsecured Notes
9.250%, 04/15/19 | | | 391,689 | |
| | 750,000 | | | Merrill Lynch, MTN
Senior Unsecured Notes
6.875%, 04/25/18 | | | 884,259 | |
| | 250,000 | | | Nomura Holdings (Japan), MTN
Senior Unsecured Notes
1.683%, 09/13/16 (c) | | | 254,584 | |
| | 250,000 | | | Royal Bank of Canada (Canada), GMTN
Senior Unsecured Notes
0.925%, 10/30/14 (c) | | | 250,844 | |
| | 500,000 | | | Wells Fargo
Senior Unsecured Notes
1.155%, 06/26/15 (c) | | | 504,532 | |
| | | | | | | | |
| | | | | | | 7,299,220 | |
| | | | | | | | |
| | |
| | | | Healthcare – 2.57% | | | | |
| | 310,000 | | | Endo Health Solutions
7.000%, 07/15/19 | | | 334,800 | |
| | 250,000 | | | Humana
Senior Unsecured Notes
8.150%, 06/15/38 | | | 361,210 | |
| | 500,000 | | | Lorillard Tobacco
8.125%, 05/01/40 | | | 656,326 | |
| | | | | | | | |
| | | | | | | 1,352,336 | |
| | | | | | | | |
| | |
| | | | Industrials – 4.46% | | | | |
| | 250,000 | | | FedEx
Senior Notes
8.000%, 01/15/19 | | | 312,942 | |
| | 200,000 | | | Jaguar Land Rover Automotive (United Kingdom)
4.125%, 12/15/18 (a) | | | 207,500 | |
| | 500,000 | | | Mexichem SAB de CV (Mexico)
6.750%, 09/19/42 (a) | | | 508,125 | |
| | 200,000 | | | Nissan Motor Acceptance (a) (c)
0.935%, 09/26/16 | | | 201,401 | |
| | 500,000 | | | Southern Copper
Senior Unsecured Notes
7.500%, 07/27/35 | | | 572,749 | |
| | 250,000 | | | Vale SA (Brazil)
Senior Unsecured Notes
5.625%, 09/11/42 | | | 242,829 | |
| | 250,000 | | | Waste Management
7.375%, 03/11/19 | | | 301,409 | |
| | | | | | | | |
| | | | | | | 2,346,955 | |
| | | | | | | | |
| | | | | | | | |
Par Value | | | | | Market
Value | |
| | |
| | | | Information Technology – 2.87% | | | | |
| | $490,000 | | | DIRECTV Holdings / DIRECTV Financing
6.350%, 03/15/40 | | $ | 544,550 | |
| | 150,000 | | | Hewlett-Packard
Senior Unsecured Notes
1.167%, 01/14/19 (c) | | | 150,518 | |
| | 150,000 | | | Netflix Inc. (a)
Senior Unsecured Notes,
5.750%, 03/01/24 | | | 156,000 | |
| | 600,000 | | | Telecom Italia Capital SA (Luxembourg)
7.721%, 06/04/38 | | | 660,000 | |
| | | | | | | | |
| | | | | | | 1,511,068 | |
| | | | | | | | |
| | |
| | | | Materials – 5.30% | | | | |
| | 100,000 | | | Allegheny Technologies
Senior Unsecured Notes
5.875%, 08/15/23 | | | 106,380 | |
| | 400,000 | | | ArcelorMittal (Luxembourg)
Senior Unsecured Notes
7.500%, 10/15/39 (b) | | | 421,000 | |
| | 500,000 | | | Braskem America Finance
7.125%, 07/22/41 (a) | | | 499,375 | |
| | 250,000 | | | Dow Chemical (The)
Senior Unsecured Notes
8.550%, 05/15/19 | | | 320,783 | |
| | 250,000 | | | GTL TRADE FINANCE (a)
7.250%, 04/16/44 | | | 255,313 | |
| | 250,000 | | | International Paper
Senior Unsecured Notes
8.700%, 06/15/38 | | | 369,684 | |
| | 550,000 | | | Rio Tinto Finance (Australia)
8.950%, 05/01/14 | | | 550,000 | |
| | 250,000 | | | Teck Resources (Canada)
6.250%, 07/15/41 | | | 264,398 | |
| | | | | | | | |
| | | | | | | 2,786,933 | |
| | | | | | | | |
| | |
| | | | Telecommunication Services – 5.89% | | | | |
| | | | CenturyLink
Senior Unsecured Notes | | | | |
| | 500,000 | | | 7.600%, 09/15/39 | | | 492,813 | |
| | 500,000 | | | 7.650%, 03/15/42 | | | 491,250 | |
| | 400,000 | | | Expedia
5.950%, 08/15/20 | | | 444,094 | |
| | 350,000 | | | Frontier Communications
Senior Unsecured Notes
9.000%, 08/15/31 | | | 364,000 | |
| | 500,000 | | | Telefonica Europe BV (Netherlands)
8.250%, 09/15/30 | | | 666,618 | |
| | 100,000 | | | Verizon Communications
Senior Unsecured Notes
1.763%, 09/15/16 (c) | | | 102,969 | |
| | 500,000 | | | Windstream
7.500%, 06/01/22 | | | 536,250 | |
| | | | | | | | |
| | | | | | | 3,097,994 | |
| | | | | | | | |
See accompanying Notes to Financial Statements.
| | |
| |
| ASTON/TCH Fixed Income Fund | | April 30, 2014 |
| |
| Schedule of Investments (unaudited) – continued | | |
| | | | | | | | |
Par Value | | | | | Market
Value | |
| | |
| | | | Utilities – 3.47% | | | | |
| | $500,000 | | | Dubai Electricity & Water Authority (United Arab Emirates)
Senior Unsecured Notes
8.500%, 04/22/15 (a) | | $ | 536,600 | |
| | 450,000 | | | FPL Group Capital
7.875%, 12/15/15 | | | 499,782 | |
| | 150,000 | | | Pacific Gas & Electric
Senior Unsecured Notes
8.250%, 10/15/18 | | | 186,572 | |
| | 450,000 | | | Sempra Energy
Senior Unsecured Notes
9.800%, 02/15/19 | | | 598,505 | |
| | | | | | | | |
| | | | | | | 1,821,459 | |
| | | | | | | | |
| | |
| | | | Total Corporate Notes and Bonds
(Cost $23,158,876) | | | 26,103,463 | |
| | | | | | | | |
|
| | U.S. GOVERNMENT AND AGENCY OBLIGATIONS – 43.14% | |
| | |
| | | | Fannie Mae – 7.75% | | | | |
| | 188,613 | | | 6.000%, 11/01/17,
Pool # 662854 | | | 201,358 | |
| | 55,621 | | | 6.000%, 04/01/18,
Pool # 725175 | | | 58,400 | |
| | 171,772 | | | 5.500%, 11/01/18,
Pool # 748886 | | | 183,906 | |
| | 59,764 | | | 4.500%, 06/01/19,
Pool # 747860 | | | 63,560 | |
| | 309,971 | | | 6.000%, 01/01/21,
Pool # 850787 | | | 338,902 | |
| | 105,397 | | | 6.000%, 09/01/32,
Pool # 847899 | | | 117,859 | |
| | 82,288 | | | 6.000%, 02/01/34,
Pool # 771952 | | | 92,878 | |
| | 78,706 | | | 7.500%, 02/01/35,
Pool # 787557 | | | 90,405 | |
| | 18,843 | | | 7.500%, 04/01/35,
Pool # 819231 | | | 20,226 | |
| | 136,803 | | | 6.000%, 11/01/35,
Pool # 844078 | | | 152,771 | |
| | 119,072 | | | 5.000%, 05/01/36,
Pool # 745581 | | | 131,004 | |
| | 67,674 | | | 6.000%, 12/01/36,
Pool # 888029 | | | 75,949 | |
| | 95,899 | | | 5.500%, 06/01/37,
Pool # 918778 | | | 106,257 | |
| | 94,218 | | | 6.500%, 10/01/37,
Pool # 888890 | | | 106,137 | |
| | 278,860 | | | 5.500%, 03/01/38,
Pool # 962344 | | | 308,196 | |
| | 259,640 | | | 4.000%, 02/01/41,
Pool # AE0949 | | | 272,642 | |
| | 224,101 | | | 4.000%, 02/01/41,
Pool # AH5695 | | | 235,393 | |
| | 961,408 | | | 3.000%, 03/01/43,
Pool # AB8615 | | | 937,772 | |
| | | | | | | | |
Par Value | | | | | Market
Value | |
| | |
| | | | Fannie Mae (continued) | | | | |
| | $572,770 | | | 3.500%, 05/01/43,
Pool # AB9512 | | $ | 582,877 | |
| | | | | | | | |
| | | | | | | 4,076,492 | |
| | | | | | | | |
| | |
| | | | Freddie Mac – 13.46% | | | | |
| | 301,158 | | | 5.500%, 11/01/20,
Gold Pool # G18083 | | | 328,637 | |
| | 61,565 | | | 5.500%, 12/01/20,
Gold Pool # G11820 | | | 67,186 | |
| | 43,237 | | | 6.000%, 10/01/35,
Gold Pool # A47772 | | | 48,149 | |
| | 99,710 | | | 5.500%, 05/01/37,
Gold Pool # A60048 | | | 109,842 | |
| | 196,871 | | | 5.500%, 09/01/37,
Gold Pool # G03202 | | | 216,904 | |
| | 158,145 | | | 5.000%, 02/01/38,
Gold Pool # A73409 | | | 172,962 | |
| | 418,682 | | | 5.000%, 04/01/38,
Gold Pool # G04334 | | | 460,227 | |
| | 241,724 | | | 4.000%, 12/01/39,
Gold Pool # G06935 | | | 253,454 | |
| | 121,365 | | | 4.000%, 05/01/41,
Gold Pool # Q00870 | | | 127,256 | |
| | 733,056 | | | 4.000%, 11/01/41,
Gold Pool # Q04550 | | | 768,803 | |
| | 953,039 | | | 3.000%, 04/01/43,
Gold Pool # V80006 | | | 931,614 | |
| | 958,905 | | | 3.000%, 05/01/43,
Gold Pool # G08525 | | | 936,146 | |
| | 882,790 | | | 3.500%, 10/01/43,
Gold Pool # G08554 | | | 898,053 | |
| | 344,874 | | | 3.500%, 11/01/43,
Gold Pool # G08557 | | | 350,837 | |
| | 790,397 | | | 3.500%, 01/01/44,
Gold Pool # G08562 | | | 804,062 | |
| | 596,400 | | | 3.500%, 02/01/44,
Gold Pool # G08572 | | | 606,711 | |
| | | | | | | | |
| | | | | | | 7,080,843 | |
| | | | | | | | |
| | | | Government National Mortgage Association – 1.91% | |
| | 143,797 | | | 5.000%, 05/20/37,
Pool # 782156 | | | 158,579 | |
| | 283,496 | | | 5.000%, 08/20/37,
Pool # 4015 | | | 312,543 | |
| | 249,356 | | | 6.000%, 07/20/38,
Pool # 4195 | | | 282,816 | |
| | 162,392 | | | 5.500%, 08/20/38,
Pool # 4215 | | | 173,813 | |
| | 67,751 | | | 6.000%, 01/15/39,
Pool # 698036 | | | 76,101 | |
| | | | | | | | |
| | | | | | | 1,003,852 | |
| | | | | | | | |
| | | | U.S. Treasury Inflation Index Bonds – 5.79% | |
| | 1,633,140 | | | 1.375%, 07/15/18 | | | 1,779,293 | |
| | 1,120,690 | | | 1.750%, 01/15/28 | | | 1,263,797 | |
| | | | | | | | |
| | | | | | | 3,043,090 | |
| | | | | | | | |
See accompanying Notes to Financial Statements.
| | |
| |
| ASTON/TCH Fixed Income Fund | | April 30, 2014 |
| |
| Schedule of Investments (unaudited) – continued | | |
| | | | | | | | |
Par Value | | | | | Market
Value | |
| | |
| | | | U.S. Treasury Notes – 14.23% | | | | |
| | $1,500,000 | | | 4.000%, 02/15/15 | | $ | 1,546,407 | |
| | 1,000,000 | | | 4.125%, 05/15/15 | | | 1,041,660 | |
| | 1,000,000 | | | 2.125%, 05/31/15 | | | 1,021,641 | |
| | 1,500,000 | | | 2.000%, 01/31/16 | | | 1,544,472 | |
| | 500,000 | | | 2.000%, 04/30/16 | | | 515,762 | |
| | 350,000 | | | 2.000%, 11/30/20 | | | 346,678 | |
| | 1,500,000 | | | 2.000%, 11/15/21 | | | 1,464,141 | |
| | | | | | | | |
| | | | | | | 7,480,761 | |
| | | | | | | | |
| | |
| | | | Total U.S. Government and Agency Obligations
(Cost $22,177,003) | | | 22,685,038 | |
| | | | | | | | |
| |
| | ASSET-BACKED SECURITIES – 1.35% | | | | |
| | |
| | 26,413 | | | Ford Credit Auto Owner Trust
Series 2010-A, Class A4
2.150%, 06/15/15 | | | 26,434 | |
| | 218,441 | | | Hyundai Auto Receivables Trust
Series 2010-A, Class A4
2.450%, 12/15/16 | | | 220,153 | |
| | 460,200 | | | Volkswagen Auto Loan Enhanced Trust
2011-1, Class A4
1.980%, 09/20/17 | | | 463,567 | |
| | | | | | | | |
| | |
| | | | Total Asset-Backed Securities
(Cost $711,497) | | | 710,154 | |
| | | | | | | | |
|
| | COMMERCIAL MORTGAGE-BACKED SECURITY – 0.59% | |
| | |
| | 275,000 | | | Bear Stearns Commercial Mortgage Securities
Series 2007-T28, Class A4
5.742%, 09/11/42 (c) | | | 309,312 | |
| | | | | | | | |
| | |
| | | | Total Commercial Mortgage-Backed Security
(Cost $190,619) | | | 309,312 | |
| | | | | | | | |
| |
| | INVESTMENT COMPANY – 4.46% | | | | |
| | 2,345,664 | | | BlackRock Liquidity Funds
TempCash Portfolio | | | 2,345,664 | |
| | | | | | | | |
| | |
| | | | Total Investment Company
(Cost $2,345,664) | | | 2,345,664 | |
| | | | | | | | |
| Total Investments – 99.18%
(Cost $48,583,659) * | | | 52,153,631 | |
| | | | | | | | |
| Net Other Assets and Liabilities – 0.82% | | | 430,256 | |
| | | | | | | | |
| Net Assets – 100.00% | | $ | 52,583,887 | |
| | | | | | | | |
| * | | At April 30, 2014, cost is identical for book and Federal income tax purposes. |
| | | | |
Gross unrealized appreciation | | $ | 3,797,717 | |
Gross unrealized depreciation | | | (227,745 | ) |
| | | | |
Net unrealized appreciation | | $ | 3,569,972 | |
| | | | |
| (a) | | Securities exempt from registration under Rule 144A of the Securities Act of 1933, as amended. These securities are purchased in accordance with guidelines approved by the Fund’s Board of Trustees and may only be resold, in transactions exempt from registration, to qualified institutional buyers. At April 30, 2014, these securities amounted to $4,294,356 or 8.17% of net assets. These securities have been determined by the Subadviser to be liquid securities. |
| (b) | | Step Coupon. A bond that pays an initial coupon rate for the first period and then a higher coupon rate for the following periods until maturity. The coupon rate shown will be accrual rate until maturity. |
| (c) | | Variable rate bond. The interest rate shown reflects the rate in effect at April 30, 2014. |
| (d) | | S&P credit ratings are used in the absence of a rating by Moody’s Investors, Inc. |
| GMTN | | Global Medium Term Note |
| | | | | | |
Portfolio Composition | | | | |
U.S. Government and Agency Obligations | | | 43% | |
Asset-Backed Securities | | | 1% | |
Commercial Mortgage-Backed Securities | | | 1% | |
Investment Company | | | 5% | |
Corporate Notes and Bonds | | | | |
(Moody’s Ratings (d)) | | | | |
Aa | | | 1% | |
A | | | 3% | |
Baa | | | 29% | |
Ba | | | 12% | |
B | | | 2% | |
NR | | | 3% | |
| | | | | | |
| | | | | 100% | |
| | | | | | |
See accompanying Notes to Financial Statements.
| | |
| |
| ASTON/Lake Partners LASSO Alternatives Fund | | April 30, 2014 |
| |
| Schedule of Investments (unaudited) | | |
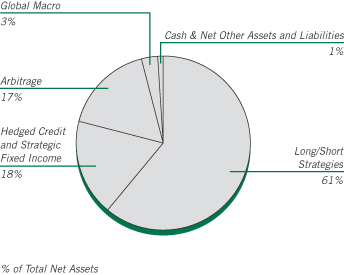
| | | | | | | | |
Shares | | | | | Market Value | |
|
| | INVESTMENT COMPANIES – 99.94% | |
| | |
| | | | Long/Short Strategies – 61.30% | | | | |
| | 2,492,515 | | | Blackrock Global Long/Short Equity Fund-IS | | $ | 28,314,974 | |
| | 2,222,623 | | | Convergence Core Plus Fund | | | 39,295,975 | |
| | 1,186,364 | | | Driehaus Emerging Markets Small Cap Growth Fund | | | 15,909,136 | |
| | 1,586,035 | | | FPA Crescent Fund-I | | | 53,243,192 | |
| | 1,884,923 | | | Gotham Absolute Return Fund | | | 25,352,216 | |
| | 280,311 | | | Putnam Equity Spectrum Fund | | | 11,966,456 | |
| | 2,389,527 | | | Robeco Boston Partners Long/Short Equity Fund- IS | | | 53,262,559 | |
| | 4,578,596 | | | The Weitz Funds—Partners III Opportunity Fund | | | 75,821,547 | |
| | | | | | | | |
| | | | | | | 303,166,055 | |
| | | | | | | | |
| |
| | | | Hedged Credit and Strategic Fixed Income – 18.38% | |
| | 2,147,079 | | | Avenue Credit Strategies Fund | | | 25,228,180 | |
| | 1,491,087 | | | BlackRock Global Long/Short Credit Fund-INS | | | 16,297,580 | |
| | 2,636 | | | Driehaus Active Income Fund | | | 28,368 | |
| | 2,464 | | | Driehaus Select Credit Fund | | | 25,083 | |
| | 623,730 | | | Guggenheim—Macro Opportunities Fund | | | 16,896,852 | |
| | 1,379,398 | | | Metropolitan West Unconstrained Bond Fund | | | 16,401,047 | |
| | 1,363,650 | | | Scout Unconstrained Bond Fund | | | 16,009,246 | |
| | | | | | | | |
| | | | | | | 90,886,356 | |
| | | | | | | | |
| | |
| | | | Arbitrage – 17.08% | | | | |
| | 1,915,394 | | | Calamos Market Neutral Income Fund | | | 24,651,120 | |
| | 1,675,372 | | | Driehaus Event Driven Fund | | | 18,244,806 | |
| | 3,875,861 | | | Touchstone Merger Arbitrage Fund | | | 41,587,986 | |
| | | | | | | | |
| | | | | | | 84,483,912 | |
| | | | | | | | |
| | | | | | | | |
Shares | | | | | Market Value | |
| | |
| | | | Global Macro – 2.62% | | | | |
| | 1,173,743 | | | John Hancock Funds II—Global Absolute Return Strategies Fund | | $ | 12,969,857 | |
| | | | | | | | |
| | |
| | | | Money Market – 0.54% | | | | |
| | 2,682,018 | | | Blackrock Liquidity Funds Treasury Trust Fund Portfolio | | | 2,682,018 | |
| | | | | | | | |
| | |
| | | | Total Investment Companies
(Cost $460,099,137) | | | 494,188,198 | |
| | | | | | | | |
| Total Investments – 99.94%
(Cost $460,099,137)* | | | 494,188,198 | |
| | | | | | | | |
| Net Other Assets and Liabilities – 0.08% | | | 401,175 | |
| | | | | | | | |
| Net Assets – 100.00% | | $ | 494,589,373 | |
| | | | | | | | |
| * | | At April 30, 2014, cost is identical for book and Federal income tax purposes. |
| | | | |
Gross unrealized appreciation | | $ | 36,862,035 | |
Gross unrealized depreciation | | | (2,652,571 | ) |
| | | | |
Net unrealized appreciation | | $ | 34,209,464 | |
| | | | |
See accompanying Notes to Financial Statements.
| | |
| |
| ASTON/Anchor Capital Enhanced Equity Fund | | April 30, 2014 |
| |
| Schedule of Investments (unaudited) | | |
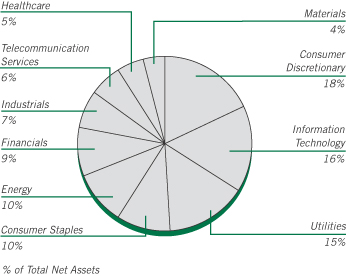
| | | | | | | | |
Shares | | | | | Market Value | |
|
| | COMMON STOCKS – 100.21% | |
| | |
| | | | Consumer Discretionary – 18.13% | | | | |
| | 125,000 | | | Coach (a) | | $ | 5,581,250 | |
| | 390,000 | | | Ford Motor (a) | | | 6,298,500 | |
| | 195,000 | | | General Motors (a) | | | 6,723,600 | |
| | 109,200 | | | Kohl’s (a) | | | 5,983,068 | |
| | 30,000 | | | Mattel (a) | | | 1,176,450 | |
| | 600,000 | | | Staples (a) | | | 7,500,000 | |
| | | | | | | | |
| | | | | | | 33,262,868 | |
| | | | | | | | |
| | |
| | | | Consumer Staples – 9.93% | | | | |
| | 200,000 | | | ConAgra Foods (a) | | | 6,102,000 | |
| | 110,000 | | | Dr Pepper Snapple Group (a) | | | 6,096,200 | |
| | 70,000 | | | PepsiCo (a) | | | 6,012,300 | |
| | | | | | | | |
| | | | | | | 18,210,500 | |
| | | | | | | | |
| | |
| | | | Energy – 9.74% | | | | |
| | 29,000 | | | Anadarko Petroleum (a) | | | 2,871,580 | |
| | 61,000 | | | Apache (a) | | | 5,294,800 | |
| | 75,000 | | | Devon Energy (a) | | | 5,250,000 | |
| | 33,000 | | | Occidental Petroleum (a) | | | 3,159,750 | |
| | 30,000 | | | Transocean Ltd. (Switzerland) (a) | | | 1,292,100 | |
| | | | | | | | |
| | | | | | | 17,868,230 | |
| | | | | | | | |
| | |
| | | | Financials – 9.27% | | | | |
| | 145,000 | | | BB&T (a) | | | 5,412,850 | |
| | 170,000 | | | Hartford Financial Services Group (a) | | | 6,097,900 | |
| | 600,000 | | | Huntington Bancshares (a) | | | 5,496,000 | |
| | | | | | | | |
| | | | | | | 17,006,750 | |
| | | | | | | | |
| | | | | | | | |
Shares | | | | | Market
Value | |
| | |
| | | | Healthcare – 5.00% | | | | |
| | 40,000 | | | Abbott Laboratories (a) | | $ | 1,549,600 | |
| | 12,000 | | | Laboratory Corp. of America
Holdings * (a) | | | 1,184,400 | |
| | 115,000 | | | Quest Diagnostics (a) | | | 6,431,950 | |
| | | | | | | | |
| | | | | | | 9,165,950 | |
| | | | | | | | |
| | |
| | | | Industrials – 6.58% | | | | |
| | 185,000 | | | ADT (a) | | | 5,594,400 | |
| | 65,000 | | | Deere (a) | | | 6,067,100 | |
| | 15,000 | | | General Electric (a) | | | 403,350 | |
| | | | | | | | |
| | | | | | | 12,064,850 | |
| | | | | | | | |
| | |
| | | | Information Technology – 16.41% | | | | |
| | 275,000 | | | Cisco Systems (a) | | | 6,355,250 | |
| | 340,000 | | | Corning (a) | | | 7,109,400 | |
| | 175,000 | | | EMC | | | 4,515,000 | |
| | 280,000 | | | Intel (a) | | | 7,473,200 | |
| | 115,000 | | | Microsoft (a) | | | 4,646,000 | |
| | | | | | | | |
| | | | | | | 30,098,850 | |
| | | | | | | | |
| | |
| | | | Materials – 3.56% | | | | |
| | 355,000 | | | Alcoa (a) | | | 4,781,850 | |
| | 10,000 | | | Dow Chemical (a) | | | 499,000 | |
| | 50,000 | | | Huntsman (a) | | | 1,252,500 | |
| | | | | | | | |
| | | | | | | 6,533,350 | |
| | | | | | | | |
| | |
| | | | Telecommunication Services – 6.31% | | | | |
| | 180,000 | | | AT&T (a) | | | 6,426,000 | |
| | 147,700 | | | CenturyLink (a) | | | 5,156,207 | |
| | | | | | | | |
| | | | | | | 11,582,207 | |
| | | | | | | | |
| | |
| | | | Utilities – 15.28% | | | | |
| | 87,000 | | | Entergy (a) | | | 6,307,500 | |
| | 180,000 | | | Exelon (a) | | | 6,305,400 | |
| | 155,000 | | | FirstEnergy (a) | | | 5,231,250 | |
| | 170,000 | | | PPL (a) | | | 5,667,800 | |
| | 110,000 | | | Public Service Enterprise Group (a) | | | 4,506,700 | |
| | | | | | | | |
| | | | | | | 28,018,650 | |
| | | | | | | | |
| | |
| | | | Total Common Stocks
(Cost $172,354,137) | | | 183,812,205 | |
| | | | | | | | |
Number of Contracts | | | | | | |
| |
| | PURCHASED OPTIONS – 0.47% | | | | |
| | | | SPDR S&P 500 ETF Trust | | | | |
| | 2,000 | | | Strike @ $163 Exp 6/14 | | | 50,000 | |
| | 2,000 | | | Strike @ $164 Exp 6/14 | | | 72,000 | |
| | 3,000 | | | Strike @ $165 Exp 6/14 | | | 126,000 | |
| | 3,000 | | | Strike @ $166 Exp 6/14 | | | 135,000 | |
| | 4,000 | | | Strike @ $167 Exp 6/14 | | | 216,000 | |
See accompanying Notes to Financial Statements.
| | |
| |
| ASTON/Anchor Capital Enhanced Equity Fund | | April 30, 2014 |
| |
| Schedule of Investments (unaudited) – continued | | |
| | | | | | | | |
Number of Contracts | | | | | Market
Value | |
| | | | SPDR S&P 500 ETF Trust (continued) | | | | |
| | 2,300 | | | Strike @ $168 Exp 6/14 | | $ | 133,400 | |
| | 2,300 | | | Strike @ $169 Exp 6/14 | | | 126,500 | |
| | | | | | | | |
| | | | | | | 858,900 | |
| | | | | | | | |
| | |
| | | | Total Purchased Options
(Cost $1,630,346) | | | 858,900 | |
| | | | | | | | |
| | |
Shares | | | | | | |
| |
| | INVESTMENT COMPANY – 2.79% | | | | |
| | 5,120,969 | | | BlackRock Liquidity Funds TempCash Portfolio | | | 5,120,969 | |
| | | | | | | | |
| | |
| | | | Total Investment Company
(Cost $5,120,969) | | | 5,120,969 | |
| | | | | | | | |
| Total Investments – 103.47%
(Cost $179,105,452)** | | | 189,792,074 | |
| | | | | | | | |
| Net Other Assets and Liabilities – (3.47)% | | | (6,365,220 | ) |
| | | | | | | | |
| Net Assets – 100.00% | | $ | 183,426,854 | |
| | | | | | | | |
| * | | Non-income producing security. |
| ** | | At April 30, 2014, cost is identical for book and Federal income tax purposes. |
| | | | |
Gross unrealized appreciation | | $ | 17,775,638 | |
Gross unrealized depreciation | | | (7,089,016 | ) |
| | | | |
Net unrealized appreciation | | $ | 10,686,622 | |
| | | | |
| (a) | | Security position is either partially or entirely pledged as collateral for written options. |
| SPDR | | Standard & Poor’s Depositary Receipt |
Transactions in written call options for the period ended April 30, 2014 were as follows:
| | | | |
| Contracts | | Number of
Contracts | | Premium |
| Outstanding, October 31, 2013 | | 58,830 | | $ 4,160,902 |
| Call Options Written | | 136,342 | | 12,219,748 |
| Call Options Closed or Expired | | (143,333) | | (11,031,557) |
| Call Options Exercised | | (50) | | (9,650) |
| | | | |
| Outstanding, April 30, 2014 | | 51,789 | | $ 5,339,443 |
| | | | |
Premiums received and value of written call equity options outstanding as of April 30, 2014.
| | | | | | | | | | | | |
Number of Contracts | | | Description | | Premium
Received | | | Market
Value | |
| | 400 | | | Abbott Laboratories
Strike @ $42 Exp 1/15 | | | $ 33,803 | | | | $ 39,600 | |
| | | |
| | | | ADT | | | | | | | | |
| | 750 | | | Strike @ $35 Exp 1/15 | | | 85,269 | | | | 75,000 | |
| | 1,100 | | | Strike @ $40 Exp 1/15 | | | 77,074 | | | | 33,000 | |
| | | | | | | | | | | | |
Number of
Contracts | | | Description | | Premium
Received | | | Market
Value | |
| | | | Alcoa | | | | | | | | |
| | 3,350 | | | Strike @ $12 Exp 1/15 | | $ | 419,998 | | | $ | 700,150 | |
| | 200 | | | Strike @ $15 Exp 1/15 | | | 12,792 | | | | 14,000 | |
| | | |
| | | | Anadarko Pertoleum | | | | | | | | |
| | 290 | | | Strike @ $92.50
Exp 1/15 | | | 127,070 | | | | 350,175 | |
| | | |
| | | | Apache | | | | | | | | |
| | 610 | | | Strike @ $90 Exp 1/15 | | | 247,984 | | | | 280,600 | |
| | | |
| | | | AT&T | | | | | | | | |
| | 1,000 | | | Strike @ $37 Exp 1/15 | | | 60,753 | | | | 89,000 | |
| | 500 | | | Strike @ $38 Exp 1/15 | | | 25,499 | | | | 29,500 | |
| | | |
| | | | BB&T | | | | | | | | |
| | 1,450 | | | Strike @ $37 Exp 1/15 | | | 333,434 | | | | 303,775 | |
| | | |
| | | | CenturyLink | | | | | | | | |
| | 1,477 | | | Strike @ $38 Exp 1/15 | | | 75,789 | | | | 91,574 | |
| | | |
| | | | Cisco Systems | | | | | | | | |
| | 500 | | | Strike @ $25 Exp 1/15 | | | 34,279 | | | | 38,500 | |
| | 2,250 | | | Strike @ $27 Exp 1/15 | | | 77,875 | | | | 76,500 | |
| | | |
| | | | Coach | | | | | | | | |
| | 1,000 | | | Strike @ $52.50
Exp 1/15 | | | 126,167 | | | | 100,000 | |
| | 250 | | | Strike @ $55 Exp 1/15 | | | 52,614 | | | | 16,250 | |
| | | |
| | | | ConAgra | | | | | | | | |
| | 2,000 | | | Strike @ $35 Exp 1/15 | | | 65,227 | | | | 55,000 | |
| | | |
| | | | Corning | | | | | | | | |
| | 1,900 | | | Strike @ $20 Exp 1/15 | | | 287,922 | | | | 385,700 | |
| | 1,500 | | | Strike @ $22 Exp 1/15 | | | 131,438 | | | | 166,500 | |
| | | |
| | | | Deere | | | | | | | | |
| | 350 | | | Strike @ $95 Exp 1/15 | | | 84,583 | | | | 154,875 | |
| | 300 | | | Strike @ $97.5
Exp 1/15 | | | 59,507 | | | | 105,000 | |
| | | |
| | | | Devon Energy | | | | | | | | |
| | 250 | | | Strike @ $72.5
Exp 1/15 | | | 50,214 | | | | 100,000 | |
| | 500 | | | Strike @ $75 Exp 1/15 | | | 74,529 | | | | 145,500 | |
| | | |
| | | | Dow Chemical | | | | | | | | |
| | 100 | | | Strike @ $43 Exp 9/14 | | | 39,170 | | | | 69,600 | |
| | | |
| | | | Dr Pepper Snapple Group | | | | | | | | |
| | 150 | | | Strike @ $50 Exp 8/14 | | | 35,693 | | | | 83,250 | |
| | 230 | | | Strike @ $50 Exp 5/14 | | | 28,952 | | | | 117,300 | |
| | 670 | | | Strike @ $55 Exp 11/14 | | | 143,740 | | | | 169,175 | |
| | 50 | | | Strike @ $60 Exp 11/14 | | | 2,948 | | | | 4,250 | |
| | | |
| | | | Entergy | | | | | | | | |
| | 870 | | | Strike @ $70 Exp 1/15 | | | 104,473 | | | | 415,860 | |
| | | |
| | | | Exelon | | | | | | | | |
| | 300 | | | Strike @ $35 Exp 1/15 | | | 16,788 | | | | 55,500 | |
| | 1,500 | | | Strike @ $37 Exp 1/15 | | | 77,189 | | | | 142,500 | |
| | | |
| | | | FirstEnergy | | | | | | | | |
| | 1,550 | | | Strike @ $38 Exp 1/15 | | | 81,118 | | | | 77,500 | |
See accompanying Notes to Financial Statements.
| | |
| |
| ASTON/Anchor Capital Enhanced Equity Fund | | April 30, 2014 |
| |
| Schedule of Investments (unaudited) – continued | | |
| | | | | | | | | | | | |
Number of
Contracts | | | Description | | Premium
Received | | | Market
Value | |
| | | | Ford Motor | | | | | | | | |
| | 900 | | | Strike @ $17 Exp 12/14 | | $ | 55,963 | | | $ | 62,100 | |
| | 3,000 | | | Strike @ $20 Exp 1/15 | | | 64,878 | | | | 57,000 | |
| | | |
| | | | General Electric | | | | | | | | |
| | 150 | | | Strike @ $27 Exp 12/14 | | | 12,294 | | | | 17,850 | |
| | | | General Motors | | | | | | | | |
| | 600 | | | Strike @ $40 Exp 1/15 | | | 87,374 | | | | 57,600 | |
| | 100 | | | Strike @ $41 Exp 1/15 | | | 9,096 | | | | 7,850 | |
| | 500 | | | Strike @ $42 Exp 1/15 | | | 55,869 | | | | 31,000 | |
| | | |
| | | | Hartford Financial Services | | | | | | | | |
| | 1,700 | | | Strike @ $40 Exp 1/15 | | | 235,573 | | | | 164,900 | |
| | | |
| | | | Huntington Bancshares | | | | | | | | |
| | 500 | | | Strike @ $10 Exp 1/15 | | | 39,979 | | | | 17,000 | |
| | 4,650 | | | Strike @ $12 Exp 1/15 | | | 82,764 | | | | 34,875 | |
| | | |
| | | | Huntsman | | | | | | | | |
| | 500 | | | Strike @ $22 Exp 8/14 | | | 102,136 | | | | 170,000 | |
| | | |
| | | | Intel | | | | | | | | |
| | 2,000 | | | Strike @ $32 Exp 1/15 | | | 37,920 | | | | 44,000 | |
| | 800 | | | Strike @ $35 Exp 1/15 | | | 9,668 | | | | 6,400 | |
| | | |
| | | | Kohl’s | | | | | | | | |
| | 924 | | | Strike @ $55 Exp 1/15 | | | 373,659 | | | | 351,120 | |
| | 168 | | | Strike @ $57.5 Exp 1/15 | | | 42,281 | | | | 47,460 | |
| | | |
| | | | Laboratory Corp. of America Holdings | | | | | | | | |
| | 50 | | | Strike @ $110 Exp 11/14 | | | 16,498 | | | | 10,250 | |
| | 70 | | | Strike @ $115 Exp 11/14 | | | 13,677 | | | | 8,225 | |
| | | |
| | | | Mattel | | | | | | | | |
| | 300 | | | Strike @ $40 Exp 10/14 | | | 30,224 | | | | 40,500 | |
| | | |
| | | | Microsoft | | | | | | | | |
| | 300 | | | Strike @ $35 Exp 10/14 | | | 87,630 | | | | 168,000 | |
| | 500 | | | Strike @ $37 Exp 10/14 | | | 103,796 | | | | 202,500 | |
| | 248 | | | Strike @ $38 Exp 1/15 | | | 81,213 | | | | 96,720 | |
| | 102 | | | Strike @ $38 Exp 10/14 | | | 20,192 | | | | 34,170 | |
| | | |
| | | | Occidental Petroleum | | | | | | | | |
| | 150 | | | Strike @ $105 Exp 1/15 | | | 39,149 | | | | 40,350 | |
| | 110 | | | Strike @ $95 Exp 8/14 | | | 27,830 | | | | 45,650 | |
| | 70 | | | Strike @ $97.50
Exp 8/14 | | | 13,510 | | | | 21,140 | |
| | | |
| | | | PepsiCo | | | | | | | | |
| | 350 | | | Strike @ $82.5
Exp 10/14 | | | 69,415 | | | | 166,250 | |
| | 100 | | | Strike @ $85 Exp 1/15 | | | 25,095 | | | | 39,400 | |
| | 250 | | | Strike @ $87.50
Exp 1/15 | | | 53,880 | | | | 70,750 | |
| | | |
| | | | PPL | | | | | | | | |
| | 400 | | | Strike @ $32 Exp 7/14 | | | 21,085 | | | | 60,000 | |
| | 1,300 | | | Strike @ $35 Exp 1/15 | | | 57,147 | | | | 84,500 | |
| | | |
| | | | Public Service Enterprise | | | | | | | | |
| | 100 | | | Strike @ $35 Exp 6/15 | | | 7,995 | | | | 61,000 | |
| | 1,000 | | | Strike @ $35 Exp 9/14 | | | 156,248 | | | | 610,000 | |
| | | | | | | | | | | | |
Number of
Contracts | | | Description | | Premium
Received | | | Market
Value | |
| | | | Quest Diagnostics | | | | | | | | |
| | 200 | | | Strike @ $65 Exp 1/15 | | | $ 19,558 | | | | $ 17,000 | |
| | 950 | | | Strike @ $65 Exp 11/14 | | | 145,622 | | | | 73,625 | |
| | | |
| | | | Staples | | | | | | | | |
| | 500 | | | Strike @ $15 Exp 1/15 | | | 17,480 | | | | 20,000 | |
| | 100 | | | Strike @ $15 Exp 12/14 | | | 3,896 | | | | 3,750 | |
| | 500 | | | Strike @ $17 Exp 9/14 | | | 13,570 | | | | 2,500 | |
| | | |
| | | | Transocean | | | | | | | | |
| | 200 | | | Strike @ $50 Exp 8/14 | | | 17,592 | | | | 6,500 | |
| | 100 | | | Strike @ $55 Exp 8/14 | | | 13,796 | | | | 900 | |
| | | | | | | | �� | | | | |
| | | |
| | | | Total Written Call Options | | | $5,339,443 | | | | $7,437,969 | |
| | | | | | | | | | | | |
See accompanying Notes to Financial Statements.
| | |
| |
| ASTON/River Road Long-Short Fund | | April 30, 2014 |
| |
| Schedule of Investments (unaudited) | | |
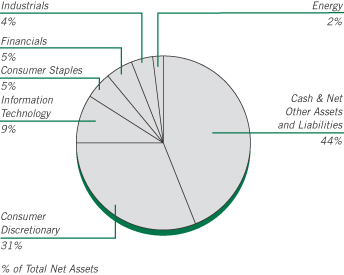
The chart represents total investments in the Fund. Materials, Telecommunication Services, and Exchange Traded Funds are negative 1.49%, 1.91%, and 2.42% respectively and cannot be represented in the pie chart format.
| | | | | | | | |
Shares | | | | | Market
Value | |
|
| | COMMON STOCKS – 76.51% | |
| | |
| | | | Consumer Discretionary – 36.76% | | | | |
| | 328,962 | | | Ascena Retail Group * (a) | | $ | 5,658,146 | |
| | 140,084 | | | Coach | | | 6,254,751 | |
| | 191,102 | | | Comcast, Class A (a) | | | 9,891,440 | |
| | 133,282 | | | General Motors (a) | | | 4,595,563 | |
| | 481,549 | | | International Game Technology (a) | | | 6,043,440 | |
| | 161,275 | | | International Speedway, Class A (a) | | | 5,070,486 | |
| | 204,592 | | | Liberty Interactive Corporation, Class A * (a) | | | 5,945,444 | |
| | 50,868 | | | Liberty Media, Class A * (a) | | | 6,598,088 | |
| | 80,140 | | | Lvmh Moet Hennessy Louis Vuitton SA, ADR (a) | | | 3,143,732 | |
| | 307,657 | | | News, Class A * (a) | | | 5,236,322 | |
| | 205,751 | | | Quebecor, Class B | | | 4,852,574 | |
| | 71,960 | | | Target (a) | | | 4,443,530 | |
| | 113,567 | | | Time Warner | | | 7,547,663 | |
| | 26,679 | | | Tribune, Class A * (a) | | | 2,074,292 | |
| | | | | | | | |
| | | | | | | 77,355,471 | |
| | | | | | | | |
| |
| | | | Consumer Staples – 6.45% | |
| | 110,993 | | | Molson Coors Brewing, Class B (a) | | | 6,656,250 | |
| | 89,485 | | | Nestle, SP ADR (a) | | | 6,906,452 | |
| | | | | | | | |
| | | | | | | 13,562,702 | |
| | | | | | | | |
| |
| | | | Energy – 3.20% | |
| | 37,203 | | | Devon Energy (a) | | | 2,604,210 | |
| | 43,097 | | | Occidental Petroleum (a) | | | 4,126,538 | |
| | | | | | | | |
| | | | | | | 6,730,748 | |
| | | | | | | | |
| | | | | | | | |
Shares | | | | | Market
Value | |
| |
| | | | Financials – 6.51% | |
| | 56,578 | | | Berkshire Hathaway, Class B * (a) | | $ | 7,290,075 | |
| | 10,751 | | | White Mountains Insurance Group (a) | | | 6,410,391 | |
| | | | | | | | |
| | | | | | | 13,700,466 | |
| | | | | | | | |
| | |
| | | | Industrials – 10.04% | | | | |
| | 145,584 | | | ADT (a) | | | 4,402,460 | |
| | 203,157 | | | Brink’s | | | 5,168,314 | |
| | 183,731 | | | Expeditors International of Washington (a) | | | 7,577,066 | |
| | 132,401 | | | Spirit AeroSystems Holdings, Class A * (a) | | | 3,976,002 | |
| | | | | | | | |
| | | | | | | 21,123,842 | |
| | | | | | | | |
| |
| | | | Information Technology – 11.52% | |
| | 149,644 | | | Blackhawk Network Holdings * (a) | | | 3,589,960 | |
| | 121,085 | | | eBay * (a) | | | 6,275,836 | |
| | 108,238 | | | Microsoft (a) | | | 4,372,815 | |
| | 114,252 | | | Oracle (a) | | | 4,670,622 | |
| | 67,831 | | | QUALCOMM (a) | | | 5,338,978 | |
| | | | | | | | |
| | | | | | | 24,248,211 | |
| | | | | | | | |
| |
| | | | Utilities – 2.03% | |
| | 58,039 | | | National Fuel Gas (a) | | | 4,273,992 | |
| | | | | | | | |
| | |
| | | | Total Common Stocks
(Cost $158,427,211) | | | 160,995,432 | |
| | | | | | | | |
| |
| | INVESTMENT COMPANY – 32.09% | | | | |
| | |
| | 67,511,454 | | | BlackRock Liquidity Funds
TempCash Portfolio | | | 67,511,454 | |
| | | | | | | | |
| | |
| | | | Total Investment Company
(Cost $67,511,454) | | | 67,511,454 | |
| | | | | | | | |
| Total Investments – 108.60%
(Cost $225,938,665)** | | | 228,506,886 | |
| | | | | | | | |
| $46,821,667 in cash and $94,257,293 in securities was segregated or
on deposit with a prime broker to cover short sales as of April 30, 2014
and are included in “Net Other Assets and Liabilities”. |
|
|
| | SHORT SALES – (24.21)% | |
| | |
| | | | Consumer Discretionary – (5.31)% | | | | |
| | (42,139) | | | Best Buy | | | (1,092,664 | ) |
| | (22,695) | | | Cabela’s * | | | (1,489,019 | ) |
| | (69,719) | | | D.R. Horton | | | (1,553,339 | ) |
| | (46,547) | | | Leggett & Platt | | | (1,529,534 | ) |
| | (33,658) | | | Life Time Fitness * | | | (1,615,584 | ) |
| | (21,581) | | | Scholastic | | | (710,231 | ) |
| | (39,892) | | | Tile Shop Holdings * | | | (562,278 | ) |
| | (13,641) | | | Whirlpool | | | (2,092,257 | ) |
| | (21,613) | | | Zumiez * | | | (528,438 | ) |
| | | | | | | | |
| | | | | | | (11,173,344 | ) |
| | | | | | | | |
| | |
| | | | Consumer Staples – (1.08)% | | | | |
| | (143,440) | | | Dean Foods | | | (2,272,090 | ) |
| | | | | | | | |
| | | | | | | (2,272,090 | ) |
| | | | | | | | |
See accompanying Notes to Financial Statements.
| | |
| |
| ASTON/River Road Long-Short Fund | | April 30, 2014 |
| |
| Schedule of Investments (unaudited) – continued | | |
| | | | | | | | |
Shares | | | | | Market
Value | |
| | |
| | | | Energy – (0.72)% | | | | |
| | (33,556) | | | Gulfmark Offshore | | $ | (1,510,356 | ) |
| | | | | | | | |
| | | | | | | (1,510,356 | ) |
| | | | | | | | |
| | |
| | | | Financials – (1.87)% | | | | |
| | (42,372) | | | Amtrust Financial Services | | | (1,638,525 | ) |
| | (48,179) | | | Mercury General | | | (2,305,847 | ) |
| | | | | | | | |
| | | | | | | (3,944,372 | ) |
| | | | | | | | |
| | |
| | | | Industrials – (6.44)% | | | | |
| | (253,540) | | | ACCO Brands * | | | (1,554,200 | ) |
| | (75,548) | | | Albany International, Class A | | | (2,718,217 | ) |
| | (17,688) | | | Caterpillar | | | (1,864,315 | ) |
| | (40,657) | | | Con-way | | | (1,727,109 | ) |
| | (71,882) | | | Quad Graphics | | | (1,556,245 | ) |
| | (93,516) | | | RR Donnelley & Sons | | | (1,645,882 | ) |
| | (38,347) | | | TAL International Group | | | (1,617,476 | ) |
| | (30,119) | | | Tetra Tech * | | | (863,512 | ) |
| | | | | | | | |
| | | | | | | (13,546,956 | ) |
| | | | | | | | |
| | |
| | | | Information Technology – (2.96)% | | | | |
| | (11,594) | | | 3D Systems * | | | (548,860 | ) |
| | (50,044) | | | Aruba Networks * | | | (989,370 | ) |
| | (37,735) | | | Electronic Arts * | | | (1,067,901 | ) |
| | (61,865) | | | RealPage * | | | (1,098,104 | ) |
| | (10,755) | | | Stratasys * | | | (1,041,837 | ) |
| | (32,564) | | | Teradata * | | | (1,480,359 | ) |
| | | | | | | | |
| | | | | | | (6,226,431 | ) |
| | | | | | | | |
| | |
| | | | Materials – (1.49)% | | | | |
| | (94,792) | | | ArcelorMittal, ADR | | | (1,540,370 | ) |
| | (70,424) | | | Teck Resources, Class B (Canada) | | | (1,603,554 | ) |
| | | | | | | | |
| | | | (3,143,924 | ) |
| | | | | | | | |
| |
| | | | Telecommunication Services – (1.91)% | |
| | (82,759) | | | CenturyLink | | | (2,889,117 | ) |
| | (56,475) | | | Consolidated Communications Holdings | | | (1,124,982 | ) |
| | | | | | | | |
| | | | (4,014,099 | ) |
| | | | | | | | |
| | |
| | | | Utilities – (2.43)% | | | | |
| | (44,204) | | | Hawaiian Electric Industries | | | (1,060,454 | ) |
| | (33,758) | | | South Jersey Industries | | | (1,939,397 | ) |
| | (57,447) | | | UIL Holdings | | | (2,110,028 | ) |
| | | | | | | | |
| | | | (5,109,879 | ) |
| | | | | | | | |
| | |
| | | | Total Common Stocks
(Proceeds $49,591,704) | | | (50,941,451 | ) |
| | | | | | | | |
| |
| | EXCHANGE TRADED FUNDS – (2.42)% | | | | |
| | |
| | (75,450) | | | United States Natural Gas Fund LP * | | | (2,003,198 | ) |
| | (84,907) | | | United States Oil Fund LP * | | | (3,083,822 | ) |
| | | | | | | | |
| | |
| | | | Total Exchange Traded Funds
(Proceeds $5,007,105) | | | (5,087,020 | ) |
| | | | | | | | |
| Total Short Sales – (26.63)%
(Proceeds $54,598,809) | | | (56,028,471 | ) |
| | | | | | | | |
| Net Other Assets and Liabilities – 18.03% | | | 37,933,914 | |
| | | | | | | | |
| Net Assets – 100.00% | | $ | 210,412,329 | |
| | | | | | | | |
| * | | Non-income producing security. |
| ** | | At April 30, 2014, cost is identical for book and Federal income tax purposes. |
| | | | |
Gross unrealized appreciation | | $ | 5,397,736 | |
Gross unrealized depreciation | | | (2,829,515 | ) |
| | | | |
Net unrealized appreciation | | $ | 2,568,221 | |
| | | | |
| (a) | | Security position is either entirely or partially held in a segregated account as collateral for securities sold short. |
| ADR | | American Depositary Receipt |
| SP ADR | | Sponsored American Depositary Receipt |
See accompanying Notes to Financial Statements.
| | |
| |
| ASTON/Barings International Fund | | April 30, 2014 |
| |
| Schedule of Investments (unaudited) | | |
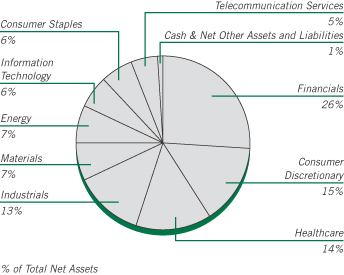
| | | | | | | | |
Shares | | | | | Market Value | |
|
| | COMMON STOCKS – 98.67% | |
| | |
| | | | Australia – 0.65% | | | | |
| | 19,560 | | | Amcor | | | $ 186,981 | |
| | |
| | | | France – 12.42% | | | | |
| | 2,950 | | | Air Liquide | | | 421,955 | |
| | 14,738 | | | AXA | | | 383,887 | |
| | 4,864 | | | BNP Paribas | | | 365,137 | |
| | 4,212 | | | Sanofi | | | 455,910 | |
| | 3,880 | | | Scor SE | | | 141,597 | |
| | 11,371 | | | SES | | | 428,227 | |
| | 5,587 | | | Societe Generale | | | 347,250 | |
| | 8,685 | | | Total | | | 620,288 | |
| | 5,711 | | | Vinci | | | 430,544 | |
| | | | | | | | |
| | | | | | | 3,594,795 | |
| | | | | | | | |
| | |
| | | | Germany – 12.30% | | | | |
| | 3,307 | | | Adidas | | | 352,952 | |
| | 3,865 | | | Bayer | | | 536,210 | |
| | 3,395 | | | Bayerische Motoren Werke | | | 424,752 | |
| | 4,578 | | | Daimler | | | 423,821 | |
| | 6,832 | | | Deutsche Boerse | | | 500,363 | |
| | 3,344 | | | Fresenius | | | 508,234 | |
| | 1,521 | | | Muenchener Rueckversicherungs-Gesellschaft | �� | | 351,235 | |
| | 5,761 | | | SAP | | | 463,885 | |
| | | | | | | | |
| | | | | | | 3,561,452 | |
| | | | | | | | |
| | |
| | | | Hong Kong – 2.02% | | | | |
| | 47,800 | | | AIA Group | | | 231,819 | |
| | 34,800 | | | HSBC Holdings | | | 353,030 | |
| | | | | | | | |
| | | | | | | 584,849 | |
| | | | | | | | |
| | |
| | | | Italy – 1.23% | | | | |
| | 39,848 | | | UniCredit | | | 356,023 | |
| | | | | | | | |
| | | | | | | | |
Shares | | | | | Market Value | |
| | |
| | | | Japan – 21.69% | | | | |
| | 6,100 | | | Aisin Seiki | | | $ 215,396 | |
| | 31,000 | | | Astellas Pharma | | | 344,765 | |
| | 8,800 | | | Denso | | | 400,427 | |
| | 4,600 | | | East Japan Railway | | | 335,343 | |
| | 1,300 | | | FANUC | | | 233,971 | |
| | 51,000 | | | Hitachi | | | 362,664 | |
| | 24,000 | | | Hitachi Metals | | | 325,368 | |
| | 55,000 | | | Isuzu Motors | | | 319,020 | |
| | 14,500 | | | Japan Tobacco | | | 475,982 | |
| | 8,000 | | | JGC | | | 259,011 | |
| | 7,800 | | | KDDI | | | 415,196 | |
| | 3,000 | | | Kyocera | | | 141,057 | |
| | 15,700 | | | Mitsubishi | | | 280,722 | |
| | 37,000 | | | Mitsubishi Electric | | | 420,903 | |
| | 57,100 | | | Mitsubishi UFJ Financial Group | | | 302,716 | |
| | 71,000 | | | Sumitomo Mitsui Trust Holdings | | | 292,375 | |
| | 8,200 | | | Takeda Pharmaceutical | | | 367,991 | |
| | 12,200 | | | Tokio Marine Holdings | | | 359,311 | |
| | 7,900 | | | Toyota Motor | | | 426,238 | |
| | | | | | | | |
| | | | | | | 6,278,456 | |
| | | | | | | | |
| | |
| | | | Mexico – 0.62% | | | | |
| | 12,522 | | | Fresnillo | | | 180,024 | |
| | | | | | | | |
| | |
| | | | Netherlands – 5.71% | | | | |
| | 5,267 | | | Airbus Group NV | | | 361,631 | |
| | 17,437 | | | Koninklijke Ahold NV | | | 336,377 | |
| | 11,783 | | | Koninklijke Philips NV | | | 377,210 | |
| | 14,561 | | | Royal Dutch Shell, Class A | | | 576,642 | |
| | | | | | | | |
| | | | | | | 1,651,860 | |
| | | | | | | | |
| | |
| | | | Norway – 0.86% | | | | |
| | 5,276 | | | Yara International | | | 249,053 | |
| | | | | | | | |
| | |
| | | | Singapore – 2.39% | | | | |
| | 24,000 | | | DBS Group Holdings | | | 324,288 | |
| | 43,700 | | | Keppel | | | 367,042 | |
| | | | | | | | |
| | | | | | | 691,330 | |
| | | | | | | | |
| | |
| | | | South Korea – 1.63% | | | | |
| | 248 | | | Samsung Electronics | | | 322,330 | |
| | 838 | | | SK Holdings | | | 148,412 | |
| | | | | | | | |
| | | | | | | 470,742 | |
| | | | | | | | |
| | |
| | | | Spain – 0.48% | | | | |
| | 19,042 | | | Banco Popular Espanol | | | 140,015 | |
| | | | | | | | |
| | |
| | | | Switzerland – 8.18% | | | | |
| | 13,219 | | | Credit Suisse Group | | | 419,213 | |
| | 7,805 | | | Julius Baer Group | | | 364,931 | |
| | 1,965 | | | Roche Holding | | | 576,037 | |
| | 606 | | | Syngenta | | | 240,031 | |
| | 18,297 | | | UBS | | | 382,530 | |
| | 1,343 | | | Zurich Financial Services | | | 384,695 | |
| | | | | | | | |
| | | | | | | 2,367,437 | |
| | | | | | | | |
See accompanying Notes to Financial Statements.
| | |
| |
| ASTON/Barings International Fund | | April 30, 2014 |
| |
| Schedule of Investments (unaudited) – continued | | |
| | | | | | | | |
Shares | | | | | Market Value | |
| | |
| | | | Taiwan – 1.40% | | | | |
| | 20,200 | | | Taiwan Semiconductor Manufacturing, SP ADR | | | $ 406,020 | |
| | | | | | | | |
| | |
| | | | United Kingdom – 27.09% | | | | |
| | 19,803 | | | Admiral Group | | | 467,424 | |
| | 19,433 | | | AMEC | | | 405,210 | |
| | 5,654 | | | AstraZeneca | | | 445,233 | |
| | 81,945 | | | Barclays | | | 348,932 | |
| | 23,643 | | | BG Group | | | 478,225 | |
| | 11,923 | | | BHP Billiton | | | 386,308 | |
| | 7,971 | | | British American Tobacco | | | 459,865 | |
| | 86,807 | | | BT Group | | | 540,089 | |
| | 12,329 | | | Experian | | | 236,472 | |
| | 66,842 | | | GKN | | | 433,365 | |
| | 15,141 | | | GlaxoSmithKline | | | 417,203 | |
| | 17,449 | | | Prudential | | | 400,224 | |
| | 1,680 | | | Randgold Resources | | | 135,585 | |
| | 4,939 | | | Reckitt Benckiser Group | | | 398,185 | |
| | 68,683 | | | Resolution | | | 345,920 | |
| | 24,795 | | | Rolls-Royce Holdings | | | 439,568 | |
| | 3,322,530 | | | Rolls-Royce Holdings,
C Shares * (a) (b) | | | 5,610 | |
| | 9,232 | | | Shire | | | 526,536 | |
| | 105,015 | | | Vodafone Group | | | 397,079 | |
| | 26,936 | | | WPP | | | 579,396 | |
| | | | | | | | |
| | | | | | | 7,846,429 | |
| | | | | | | | |
| | |
| | | | Total Common Stocks
(Cost $25,184,643) | | | 28,565,466 | |
| | | | | | | | |
|
| | INVESTMENT COMPANY – 0.43% | |
| | |
| | 124,916 | | | BlackRock Liquidity Funds TempCash Portfolio | | | 124,916 | |
| | | | | | | | |
| | |
| | | | Total Investment Company
(Cost $124,916) | | | 124,916 | |
| | | | | | | | |
| Total Investments – 99.12%
(Cost $25,309,559)** | | | 28,690,382 | |
| | | | | | | | |
| Net Other Assets and Liabilities – 0.88% | | | 256,007 | |
| | | | | | | | |
| Net Assets – 100.00% | | | $28,946,389 | |
| | | | | | | | |
| * | | Non-income producing security. |
| ** | | At April 30, 2014, cost is identical for book and Federal income tax purposes. |
| (a) | | This security has been determined by the Subadviser to be an illiquid security. At April 30, 2014, this security amounted to $5,610 or 0.02% of net assets. |
| (b) | | Security with a total aggregate market value of $5,610 or 0.02% of net assets was valued under the fair value procedures approved by the Fund’s Board of Trustees. |
| | | | |
Gross unrealized appreciation | | $ | 4,474,516 | |
Gross unrealized depreciation | | | (1,093,693 | ) |
| | | | |
Net unrealized appreciation | | $ | 3,380,823 | |
| | | | |
| SP ADR | | Sponsored American Depositary Receipt |
See accompanying Notes to Financial Statements.
| | |
| |
| ASTON/Guardian Capital Global Dividend Fund | | April 30, 2014 |
| |
| Schedule of Investments (unaudited) | | |
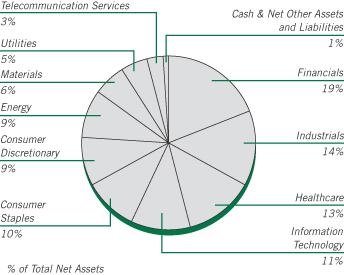
| | | | | | | | |
Shares | | | | | Market
Value | |
|
| | COMMON STOCKS – 98.94% | |
| | |
| | | | Australia – 4.68% | | | | |
| | 2,300 | | | Australia & New Zealand Banking Group | | $ | 73,652 | |
| | 300 | | | Commonwealth Bank of Australia | | | 21,989 | |
| | 1,100 | | | Sonic Healthcare | | | 18,088 | |
| | 8,400 | | | Telstra | | | 40,735 | |
| | 1,200 | | | Westpac Banking | | | 39,152 | |
| | | | | | | | |
| | | | | | | 193,616 | |
| | | | | | | | |
| | |
| | | | Belgium – 0.52% | | | | |
| | 500 | | | Ageas | | | 21,493 | |
| | | | | | | | |
| | |
| | | | Bermuda – 1.17% | | | | |
| | 1,370 | | | Seadrill | | | 48,251 | |
| | | | | | | | |
| | |
| | | | Canada – 2.53% | | | | |
| | 700 | | | Davis & Henderson | | | 20,271 | |
| | 610 | | | Keyera | | | 40,572 | |
| | 690 | | | Pembina Pipeline | | | 27,114 | |
| | 520 | | | Westshore Terminals Investment | | | 16,899 | |
| | | | | | | | |
| | | | | | | 104,856 | |
| | | | | | | | |
| | |
| | | | Finland – 1.13% | | | | |
| | 3,200 | | | Stora Enso | | | 32,608 | |
| | 800 | | | UPM-Kymmene | | | 13,984 | |
| | | | | | | | |
| | | | | | | 46,592 | |
| | | | | | | | |
| | |
| | | | France – 5.85% | | | | |
| | 2,600 | | | AXA | | | 67,723 | |
| | 1,400 | | | Electricite de France | | | 53,695 | |
| | 500 | | | Neopost | | | 40,968 | |
| | 800 | | | Total | | | 57,137 | |
| | 300 | | | Vinci | | | 22,617 | |
| | | | | | | | |
| | | | | | | 242,140 | |
| | | | | | | | |
| | | | | | | | |
Shares | | | | | Market
Value | |
| | |
| | | | Germany – 6.10% | | | | |
| | 500 | | | BASF | | $ | 57,873 | |
| | 300 | | | Bayer | | | 41,620 | |
| | 400 | | | Daimler | | | 37,031 | |
| | 1,900 | | | Deutsche Telekom | | | 31,856 | |
| | 100 | | | Muenchener Rueckversicherungs-
Gesellschaft | | | 23,092 | |
| | 1,400 | | | ProSiebenSat.1 Media | | | 61,211 | |
| | | | | | | | |
| | | | | | | 252,683 | |
| | | | | | | | |
| | |
| | | | Ireland – 1.59% | | | | |
| | 1,250 | | | Seagate Technology | | | 65,725 | |
| | | | | | | | |
| | |
| | | | Spain – 2.74% | | | | |
| | 3,140 | | | Banco Santander, SP ADR | | | 31,274 | |
| | 3,700 | | | Ferrovial | | | 82,131 | |
| | | | | | | | |
| | | | | | | 113,405 | |
| | | | | | | | |
| | |
| | | | Sweden – 1.85% | | | | |
| | 4,200 | | | Skandinaviska Enskilda Banken AB | | | 57,844 | |
| | 700 | | | Swedbank AB, Class A | | | 18,592 | |
| | | | | | | | |
| | | | | | | 76,436 | |
| | | | | | | | |
| | |
| | | | Switzerland – 5.29% | | | | |
| | 400 | | | Adecco | | | 33,428 | |
| | 910 | | | Garmin | | | 51,961 | |
| | 1,000 | | | Nestle | | | 77,207 | |
| | 650 | | | Novartis, ADR | | | 56,511 | |
| | | | | | | | |
| | | | | | | 219,107 | |
| | | | | | | | |
| | |
| | | | United Kingdom – 10.21% | | | | |
| | 600 | | | AstraZeneca | | | 47,248 | |
| | 3,300 | | | BAE Systems | | | 22,287 | |
| | 270 | | | British American Tobacco, SP ADR | | | 31,055 | |
| | 660 | | | GlaxoSmithKline, SP ADR | | | 36,544 | |
| | 1,000 | | | Imperial Tobacco Group | | | 43,172 | |
| | 7,800 | | | Legal & General Group | | | 27,893 | |
| | 3,900 | | | National Grid | | | 55,345 | |
| | 1,120 | | | Prudential, ADR | | | 51,733 | |
| | 9,200 | | | Resolution | | | 46,336 | |
| | 500 | | | Royal Dutch Shell, Class A | | | 19,813 | |
| | 1,600 | | | SSE | | | 41,197 | |
| | | | | | | | |
| | | | | | | 422,623 | |
| | | | | | | | |
| | |
| | | | United States – 55.28% | | | | |
| | 1,090 | | | AbbVie | | | 56,767 | |
| | 440 | | | Air Products & Chemicals | | | 51,709 | |
| | 1,320 | | | Altria Group | | | 52,945 | |
| | 740 | | | Ameren | | | 30,569 | |
| | 100 | | | Apple | | | 59,009 | |
| | 1,979 | | | AT&T | | | 70,650 | |
| | 860 | | | Automatic Data Processing | | | 67,046 | |
| | 230 | | | Chevron | | | 28,870 | |
| | 430 | | | ConocoPhillips | | | 31,953 | |
| | 1,400 | | | CSX | | | 39,508 | |
| | 1,390 | | | Dow Chemical | | | 69,361 | |
| | 490 | | | Dr Pepper Snapple Group | | | 27,156 | |
See accompanying Notes to Financial Statements.
| | |
| |
| ASTON/Guardian Capital Global Dividend Fund | | April 30, 2014 |
| |
| Schedule of Investments (unaudited) – continued | | |
| | | | | | | | |
Shares | | | | | Market
Value | |
| | |
| | | | United States (continued) | | | | |
| | 420 | | | Duke Energy | | $ | 31,286 | |
| | 830 | | | Eaton | | | 60,291 | |
| | 880 | | | Emerson Electric | | | 59,998 | |
| | 390 | | | Exxon Mobil | | | 39,940 | |
| | 3,030 | | | Fifth Third Bancorp | | | 62,448 | |
| | 560 | | | General Dynamics | | | 61,292 | |
| | 220 | | | Genuine Parts | | | 19,166 | |
| | 850 | | | Illinois Tool Works | | | 72,446 | |
| | 760 | | | Intel | | | 20,284 | |
| | 900 | | | Johnson & Johnson | | | 91,161 | |
| | 1,230 | | | JPMorgan Chase | | | 68,855 | |
| | 270 | | | Kimberly-Clark | | | 30,308 | |
| | 900 | | | KLA-Tencor | | | 57,591 | |
| | 360 | | | Lockheed Martin | | | 59,090 | |
| | 1,330 | | | Lorillard | | | 79,029 | |
| | 330 | | | Macy’s | | | 18,952 | |
| | 220 | | | McDonald’s | | | 22,304 | |
| | 730 | | | Medtronic | | | 42,939 | |
| | 1,200 | | | Merck | | | 70,272 | |
| | 1,250 | | | Microsoft | | | 50,500 | |
| | 540 | | | Newell Rubbermaid | | | 16,259 | |
| | 3,880 | | | Old Republic International | | | 64,253 | |
| | 290 | | | Omnicom Group | | | 19,627 | |
| | 1,880 | | | Pfizer | | | 58,806 | |
| | 330 | | | Philip Morris International | | | 28,192 | |
| | 370 | | | Procter & Gamble | | | 30,544 | |
| | 590 | | | Reynolds American | | | 33,294 | |
| | 1,380 | | | Six Flags Entertainment | | | 55,393 | |
| | 3,490 | | | Spirit Realty Capital, REIT | | | 37,587 | |
| | 1,570 | | | Texas Instruments | | | 71,357 | |
| | 360 | | | Valero Energy | | | 20,581 | |
| | 480 | | | VF | | | 29,323 | |
| | 740 | | | Waste Management | | | 32,893 | |
| | 1,540 | | | Wells Fargo | | | 76,446 | |
| | 1,210 | | | Williams | | | 51,026 | |
| | 290 | | | Wynn Resorts | | | 59,128 | |
| | | | | | | | |
| | | | | | | 2,288,404 | |
| | | | | | | | |
| | |
| | | | Total Common Stocks
(Cost $3,963,759) | | | 4,095,331 | |
| | | | | | | | |
| | | | | | | | |
Shares | | | | | Market
Value | |
|
| | INVESTMENT COMPANY – 0.92% | |
| | |
| | 38,184 | | | BlackRock Liquidity Funds
TempCash Portfolio | | $ | 38,184 | |
| | | | | | | | |
| | |
| | | | Total Investment Company
(Cost $38,184) | | | 38,184 | |
| | | | | | | | |
| Total Investments – 99.86%
(Cost $4,001,943)* | | | 4,133,515 | |
| | | | | | | | |
| Net Other Assets and Liabilities – 0.14% | | | 5,825 | |
| | | | | | | | |
| Net Assets – 100.00% | | $ | 4,139,340 | |
| | | | | | | | |
| * | | At April 30, 2014, cost is identical for book and federal income tax purposes. |
| | | | |
Gross unrealized appreciation | | $ | 148,380 | |
Gross unrealized depreciation | | | (16,808 | ) |
| | | | |
Net unrealized appreciation | | $ | 131,572 | |
| | | | |
| ADR | | American Depositary Receipt |
| REIT | | Real Estate Investment Trust |
| SP ADR | | Sponsored American Depositary Receipt |
See accompanying Notes to Financial Statements.
| | |
| |
| ASTON/LMCG Emerging Markets Fund | | April 30, 2014 |
| |
| Schedule of Investments (unaudited) | | |
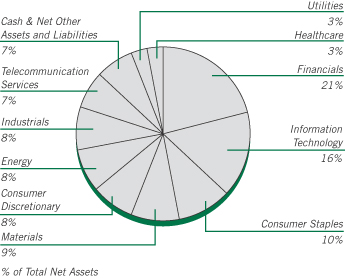
| | | | | | | | |
Shares | | | | | Market Value | |
|
| | COMMON STOCKS – 92.57% | |
| | |
| | | | Brazil – 9.98% | | | | |
| | 4,900 | | | AMBEV SA | | $ | 35,708 | |
| | 3,700 | | | Banco do Brasil SA | | | 38,977 | |
| | 4,200 | | | Braskem, Preference A | | | 28,610 | |
| | 545 | | | Cia Brasileira de Distribuicao Grupo Pao de Acucar, SP ADR | | | 25,919 | |
| | 4,200 | | | Cyrela Brazil Realty SA Empreendimentos e Participacoes | | | 25,448 | |
| | 5,300 | | | Gerdau, Preference | | | 31,827 | |
| | 4,900 | | | Hypermarcas | | | 36,150 | |
| | 10,300 | | | JBS | | | 35,615 | |
| | 2,400 | | | Porto Seguro SA | | | 35,251 | |
| | 10,800 | | | Suzano Papel e Celulose, Preference A | | | 34,922 | |
| | 1,600 | | | Ultrapar Participacoes SA | | | 39,911 | |
| | 3,305 | | | Vale, SP ADR | | | 39,230 | |
| | | | | | | | |
| | | | | | | 407,568 | |
| | | | | | | | |
| | | | Chile – 0.63% | | | | |
| | 1,599 | | | Enersis, SP ADR | | | 25,744 | |
| | | | | | | | |
| | |
| | | | China – 9.60% | | | | |
| | 46,000 | | | Angang Steel, Class H * | | | 27,886 | |
| | 153,000 | | | Bank of China, Class H | | | 67,294 | |
| | 54,000 | | | China CITIC Bank, Class H | | | 32,179 | |
| | 55,000 | | | China Construction Bank, Class H | | | 37,953 | |
| | 33,000 | | | China Railway Construction, Class H | | | 27,284 | |
| | 69,000 | | | Chongqing Rural Commercial Bank, Class H | | | 30,259 | |
| | 73,000 | | | Evergrande Real Estate, Class H | | | 32,579 | |
| | 32,000 | | | Huaneng Power International, Class H | | | 31,245 | |
| | 46,000 | | | Industrial and Commercial Bank of China, Class H | | | 27,412 | |
| | 800 | | | Tencent Holdings | | | 49,860 | |
| | 826 | | | WuXi PharmaTech Cayman, ADR * | | | 28,084 | |
| | | | | | | | |
| | | | | | | 392,035 | |
| | | | | | | | |
| | | | | | | | |
Shares | | | | | Market Value | |
| | |
| | | | Egypt – 0.58% | | | | |
| | 4,727 | | | Commercial International Bank SAE, GDR | | $ | 23,777 | |
| | | | | | | | |
| | |
| | | | Hong Kong – 5.66% | | | | |
| | 4,000 | | | China Mobile | | | 38,024 | |
| | 74,000 | | | China Power International Development | | | 26,630 | |
| | 48,000 | | | China Resources Cement Holdings | | | 33,309 | |
| | 22,000 | | | COSCO Pacific | | | 29,455 | |
| | 264,000 | | | GOME Electrical Appliances Holding | | | 49,715 | |
| | 250,000 | | | REXlot Holdings | | | 26,442 | |
| | 14,000 | | | Shimao Property Holdings | | | 27,628 | |
| | | | | | | | |
| | | | | | | 231,203 | |
| | | | | | | | |
| | |
| | | | India – 4.15% | | | | |
| | 1,036 | | | ICICI Bank, SP ADR | | | 44,206 | |
| | 1,659 | | | Reliance Industries, GDR | | | 51,429 | |
| | 1,106 | | | Tata Motors, SP ADR | | | 41,387 | |
| | 2,700 | | | Wipro, ADR | | | 32,292 | |
| | | | | | | | |
| | | | | | | 169,314 | |
| | | | | | | | |
| | |
| | | | Indonesia – 4.70% | | | | |
| | 332,800 | | | Adaro Energy Tbk PT | | | 34,110 | |
| | 97,800 | | | Bank Negara Indonesia Persero Tbk | | | 40,731 | |
| | 53,900 | | | Bank Rakyat Indonesia Persero Tbk PT | | | 46,154 | |
| | 60,600 | | | Indofood Sukses Makmur Tbk PT | | | 36,953 | |
| | 161,100 | | | Perusahaan Perkebunan London Sumatra Tbk PT | | | 34,139 | |
| | | | | | | | |
| | | | | | | 192,087 | |
| | | | | | | | |
| | |
| | | | Malaysia – 3.45% | | | | |
| | 13,500 | | | AMMB Holdings | | | 29,683 | |
| | 22,400 | | | DiGi.Com | | | 38,002 | |
| | 16,900 | | | IJM | | | 33,019 | |
| | 23,300 | | | Malaysia Building Society | | | 16,126 | |
| | 49,770 | | | YTL Power International * | | | 23,929 | |
| | | | | | | | |
| | | | | | | 140,759 | |
| | | | | | | | |
| | |
| | | | Mexico – 3.22% | | | | |
| | 68,800 | | | America Movil | | | 69,364 | |
| | 3,300 | | | Gruma, Class B * | | | 29,184 | |
| | 5,500 | | | Grupo Aeroportuario del Pacifico | | | 33,107 | |
| | | | | | | | |
| | | | | | | 131,655 | |
| | | | | | | | |
| | |
| | | | Philippines – 3.26% | | | | |
| | 48,800 | | | Alliance Global Group | | | 34,099 | |
| | 16,970 | | | BDO Unibank | | | 33,594 | |
| | 15,770 | | | Metropolitan Bank & Trust | | | 29,962 | |
| | 10,840 | | | Universal Robina | | | 35,501 | |
| | | | | | | | |
| | | | | | | 133,156 | |
| | | | | | | | |
| | |
| | | | Poland – 0.95% | | | | |
| | 2,841 | | | Powszechna Kasa Oszczednosci Bank
Polski | | | 38,942 | |
| | | | | | | | |
| | |
| | | | Russia – 3.00% | | | | |
| | 6,694 | | | Gazprom, SP ADR | | | 48,327 | |
| | 635 | | | Lukoil, SP ADR | | | 33,602 | |
See accompanying Notes to Financial Statements.
| | |
| |
| ASTON/LMCG Emerging Markets Fund | | April 30, 2014 |
| |
| Schedule of Investments (unaudited) – continued | | |
| | | | | | | | |
Shares | | | | | Market Value | |
| | |
| | | | Russia (continued) | | | | |
| | 3,089 | | | Sberbank, ADR | | $ | 25,892 | |
| | 426 | | | Tatneft, SP ADR | | | 14,612 | |
| | | | | | | | |
| | | | | | | 122,433 | |
| | | | | | | | |
| | |
| | | | South Africa – 10.71% | | | | |
| | 1,603 | | | African Rainbow Minerals | | | 30,125 | |
| | 3,246 | | | Barloworld | | | 35,362 | |
| | 2,291 | | | Kumba Resources | | | 31,223 | |
| | 2,660 | | | Liberty Holdings | | | 31,865 | |
| | 5,378 | | | Mediclinic International | | | 37,573 | |
| | 1,619 | | | Mondi | | | 26,931 | |
| | 3,341 | | | MTN Group | | | 66,947 | |
| | 15,351 | | | Netcare | | | 37,208 | |
| | 622 | | | Sasol | | | 34,900 | |
| | 7,652 | | | Steinhoff International Holdings | | | 39,720 | |
| | 1,293 | | | Tiger Brands | | | 34,553 | |
| | 2,619 | | | Vodacom Group | | | 31,230 | |
| | | | | | | | |
| | | | | | | 437,637 | |
| | | | | | | | |
| | |
| | | | South Korea – 17.40% | | | | |
| | 35 | | | Amorepacific | | | 45,219 | |
| | 177 | | | E-Mart | | | 40,426 | |
| | 584 | | | Hankook Tire | | | 33,741 | |
| | 1,000 | | | Hanwha | | | 29,082 | |
| | 316 | | | Hyundai Motor | | | 70,338 | |
| | 2,680 | | | Industrial Bank of Korea | | | 32,939 | |
| | 72 | | | KCC | | | 35,815 | |
| | 1,410 | | | LG Display * | | | 37,457 | |
| | 447 | | | LS | | | 34,997 | |
| | 139 | | | Samsung Electronics | | | 180,661 | |
| | 1,250 | | | Shinhan Financial Group | | | 54,437 | |
| | 152 | | | SK Holdings | | | 26,920 | |
| | 1,510 | | | SK Hynix * | | | 58,673 | |
| | 145 | | | SK Telecom | | | 29,960 | |
| | | | | | | | |
| | | | | | | 710,665 | |
| | | | | | | | |
| | |
| | | | Taiwan – 10.69% | | | | |
| | 34,000 | | | Advanced Semiconductor Engineering | | | 39,407 | |
| | 77,000 | | | Au Optronics * | | | 29,068 | |
| | 6,000 | | | Catcher Technology | | | 50,566 | |
| | 14,000 | | | Cheng Uei Precision Industry | | | 28,141 | |
| | 22,000 | | | Hon Hai Precision Industry | | | 63,090 | |
| | 21,000 | | | Pou Chen | | | 26,704 | |
| | 17,000 | | | Ruentex Development | | | 30,062 | |
| | 73,000 | | | Sinopac Financial Holdings | | | 32,514 | |
| | 16,000 | | | Taiwan Semiconductor Manufacturing | | | 62,786 | |
| | 23,740 | | | Uni-President Enterprises | | | 40,172 | |
| | 79,000 | | | United Microelectronics | | | 34,140 | |
| | | | | | | | |
| | | | | | | 436,650 | |
| | | | | | | | |
| | |
| | | | Thailand – 2.24% | | | | |
| | 6,000 | | | PTT Exploration & Production | | | 29,574 | |
| | 15,600 | | | PTT Global Chemical | | | 33,625 | |
| | 279,100 | | | Quality Houses | | | 28,117 | |
| | | | | | | | |
| | | | | | | 91,316 | |
| | | | | | | | |
| | | | | | | | |
Shares | | | | | Market Value | |
| | |
| | | | Turkey – 2.35% | | | | |
| | 25,021 | | | Eregli Demir ve Celik Fabrikalari TAS | | $ | 34,720 | |
| | 8,764 | | | Turk Hava Yollari | | | 28,015 | |
| | 5,685 | | | Turkcell Iletisim Hizmetleri * | | | 33,116 | |
| | | | | | | | |
| | | | | | | 95,851 | |
| | | | | | | | |
| | |
| | | | Total Common Stocks
(Cost $3,708,672) | | | 3,780,792 | |
| | | | | | | | |
|
| | EXCHANGE TRADED FUNDS – 5.28% | |
| | |
| | | | United States – 5.28% | | | | |
| | 623 | | | iPath MSCI India Index Fund * | | | 38,190 | |
| | 2,550 | | | iShares MSCI Emerging Markets Index
Fund | | | 105,392 | |
| | 2,737 | | | iShares MSCI India | | | 72,202 | |
| | | | | | | | |
| | | | | | | 215,784 | |
| | | | | | | | |
| | |
| | | | Total Exchange Traded Funds
(Cost $194,285) | | | 215,784 | |
| | | | | | | | |
|
| | RIGHTS – 0.00% | |
| | |
| | | | Brazil – 0.00% | | | | |
| | 7 | | | AMBEV SA | | | 1 | |
| | | | | | | | |
| | |
| | | | Total Rights
(Cost $-) | | | 1 | |
| | | | | | | | |
|
| | INVESTMENT COMPANY – 2.20% | |
| | |
| | 89,829 | | | BlackRock Liquidity Funds
TempCash Portfolio | | | 89,829 | |
| | | | | | | | |
| | |
| | | | Total Investment Company
(Cost $89,829) | | | 89,829 | |
| | | | | | | | |
| Total Investments – 100.05%
(Cost $3,992,786)** | | $ | 4,086,406 | |
| | | | | | | | |
| Net Other Assets and Liabilities – (0.05)% | | | (2,220 | ) |
| | | | | | | | |
| Net Assets – 100.00% | | $ | 4,084,186 | |
| | | | | | | | |
| * | | Non-income producing security. |
| ** | | At April 30, 2014, cost is identical for book and Federal income tax purposes. |
| | | | |
Gross unrealized appreciation | | $ | 361,986 | |
Gross unrealized depreciation | | | (268,366 | ) |
| | | | |
Net unrealized appreciation | | $ | 93,620 | |
| | | | |
| ADR | | American Depositary Receipt |
| GDR | | Global Depositary Receipt |
| SP ADR | | Sponsored American Depositary Receipt |
See accompanying Notes to Financial Statements.
| | |
| |
| ASTON/Pictet International Fund | | April 30, 2014 |
| |
| Schedule of Investments (unaudited) | | |
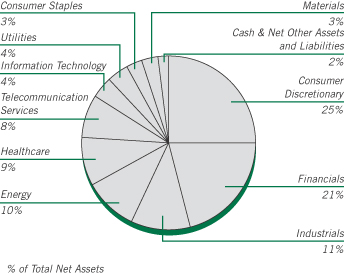
| | | | | | | | |
Shares | | | | | Market Value | |
| |
| | COMMON STOCKS – 95.99% | | | | |
| | |
| | | | Australia – 4.16% | | | | |
| | 11,193 | | | ALS | | $ | 77,987 | |
| | 17,965 | | | Asciano | | | 90,290 | |
| | 7,872 | | | Computershare | | | 90,316 | |
| | 19,629 | | | Fortescue Metals Group | | | 92,088 | |
| | 11,702 | | | UGL | | | 73,380 | |
| | | | | | | | |
| | | | | | | 424,061 | |
| | | | | | | | |
| | |
| | | | Austria – 2.27% | | | | |
| | 3,491 | | | Erste Group Bank | | | 117,158 | |
| | 3,631 | | | Raiffeisen Bank International | | | 114,602 | |
| | | | | | | | |
| | | | | | | 231,760 | |
| | | | | | | | |
| | |
| | | | Belgium – 1.87% | | | | |
| | 1,823 | | | Ageas | | | 78,365 | |
| | 3,516 | | | ThromboGenics * | | | 111,851 | |
| | | | | | | | |
| | | | | | | 190,216 | |
| | | | | | | | |
| | |
| | | | Bermuda – 2.32% | | | | |
| | 2,400 | | | Jardine Matheson Holdings | | | 149,520 | |
| | 15,402 | | | Odfjell Drilling | | | 87,059 | |
| | | | | | | | |
| | | | | | | 236,579 | |
| | | | | | | | |
| | |
| | | | Cayman Islands – 0.96% | | | | |
| | 28,000 | | | MGM China Holdings | | | 97,511 | |
| | | | | | | | |
| | |
| | | | Denmark – 4.38% | | | | |
| | 2,243 | | | Carlsberg , Class B | | | 224,092 | |
| | 4,827 | | | H Lundbeck | | | 140,683 | |
| | 2,986 | | | Matas * | | | 81,865 | |
| | | | | | | | |
| | | | | | | 446,640 | |
| | | | | | | | |
| | | | | | | | |
Shares | | | | | Market Value | |
| | |
| | | | France – 3.65% | | | | |
| | 1,503 | | | Orpea | | $ | 109,222 | |
| | 840 | | | Rubiis | | | 59,760 | |
| | 3,259 | | | Societe Generale | | | 202,557 | |
| | | | | | | | |
| | | | | | | 371,539 | |
| | | | | | | | |
| | |
| | | | Germany – 5.01% | | | | |
| | 933 | | | Allianz | | | 161,605 | |
| | 1,370 | | | Bayer | | | 190,067 | |
| | 1,977 | | | SAP | | | 159,191 | |
| | | | | | | | |
| | | | | | | 510,863 | |
| | | | | | | | |
| | |
| | | | Hong Kong – 4.82% | | | | |
| | 32,200 | | | AIA Group | | | 156,163 | |
| | 13,000 | | | Hutchison Whampoa | | | 177,739 | |
| | 294,000 | | | PCCW | | | 156,993 | |
| | | | | | | | |
| | | | | | | 490,895 | |
| | | | | | | | |
| | |
| | | | Italy – 4.37% | | | | |
| | 8,499 | | | Astaldi | | | 91,970 | |
| | 13,774 | | | Snam | | | 82,782 | |
| | 34,177 | | | UnipolSai | | | 125,461 | |
| | 10,860 | | | World Duty Free * | | | 145,468 | |
| | | | | | | | |
| | | | | | | 445,681 | |
| | | | | | | | |
| | |
| | | | Japan – 21.01% | | | | |
| | 4,500 | | | Accordia Golf | | | 57,661 | |
| | 3,400 | | | Daiichikosho | | | 98,041 | |
| | 800 | | | Daito Trust Construction | | | 81,303 | |
| | 5,200 | | | Fuji Media Holdings | | | 87,536 | |
| | 2,400 | | | GMO Internet | | | 21,151 | |
| | 20,500 | | | Inpex | | | 298,371 | |
| | 7,600 | | | Japan Tobacco | | | 249,480 | |
| | 2,400 | | | Miraca Holdings | | | 103,996 | |
| | 2,300 | | | MISUMI Group | | | 55,928 | |
| | 7,100 | | | Mitsubishi | | | 126,951 | |
| | 2,900 | | | Nippon Telegraph & Telephone | | | 160,580 | |
| | 11,600 | | | NKSJ Holdings | | | 289,220 | |
| | 6,700 | | | Sony | | | 117,439 | |
| | 3,900 | | | Sumitomo Mitsui Financial Group | | | 153,848 | |
| | 1,900 | | | Temp Holdings | | | 48,376 | |
| | 1,900 | | | Tsuruha Holdings | | | 191,050 | |
| | | | | | | | |
| | | | | | | 2,140,931 | |
| | | | | | | | |
| | |
| | | | Malaysia – 0.98% | | | | |
| | 33,200 | | | Genting | | | 99,636 | |
| | | | | | | | |
| | |
| | | | Netherlands – 1.07% | | | | |
| | 1,582 | | | Airbus Group | | | 108,620 | |
| | | | | | | | |
| | |
| | | | New Zealand – 1.53% | | | | |
| | 53,306 | | | Mighty River Power | | | 106,870 | |
| | 14,431 | | | Trade Me Group | | | 49,153 | |
| | | | | | | | |
| | | | | | | 156,023 | |
| | | | | | | | |
See accompanying Notes to Financial Statements.
| | |
| |
| ASTON/Pictet International Fund | | April 30, 2014 |
| |
| Schedule of Investments (unaudited) – continued | | |
| | | | | | | | |
Shares | | | | | Market Value | |
| | | | Papua New Guinea – 0.90% | | | | |
| | 11,139 | | | Oil Search | | $ | 91,995 | |
| | | | | | | | |
| | |
| | | | Philippines – 0.80% | | | | |
| | 713,000 | | | Metro Pacific Investments | | | 81,088 | |
| | | | | | | | |
| | |
| | | | Portugal – 3.92% | | | | |
| | 14,281 | | | Galp Energia | | | 247,362 | |
| | 21,064 | | | ZON OPTIMUS | | | 151,931 | |
| | | | | | | | |
| | | | | | | 399,293 | |
| | | | | | | | |
| | |
| | | | Singapore – 2.67% | | | | |
| | 57,000 | | | First Resources | | | 116,846 | |
| | 1,567 | | | Millicom International Cellular, SP ADR | | | 154,960 | |
| | | | | | | | |
| | | | | | | 271,806 | |
| | | | | | | | |
| | |
| | | | Spain – 2.59% | | | | |
| | 14,917 | | | Distribuidora Internacional de Alimentacion | | | 133,235 | |
| | 4,260 | | | Enagas | | | 131,204 | |
| | | | | | | | |
| | | | | | | 264,439 | |
| | | | | | | | |
| | |
| | | | Sweden – 2.35% | | | | |
| | 1,931 | | | Modern Times Group, Class B | | | 85,737 | |
| | 12,742 | | | Telefonaktiebolaget LM Ericsson, Class B | | | 153,832 | |
| | | | | | | | |
| | | | | | | 239,569 | |
| | | | | | | | |
| | |
| | | | Switzerland – 10.12% | | | | |
| | 1,618 | | | Cie Financiere Richemont | | | 164,172 | |
| | 5,160 | | | Gategroup Holding | | | 160,645 | |
| | 3,537 | | | Nestle | | | 273,082 | |
| | 755 | | | Roche Holding | | | 221,327 | |
| | 1,146 | | | Transocean | | | 48,869 | |
| | 7,784 | | | UBS | | | 162,738 | |
| | | | | | | | |
| | | | | | | 1,030,833 | |
| | | | | | | | |
| | |
| | | | United Kingdom – 14.24% | | | | |
| | 13,459 | | | BBA Aviation | | | 70,445 | |
| | 8,033 | | | BG Group | | | 162,483 | |
| | 29,200 | | | Enterprise Inns * | | | 67,296 | |
| | 21,196 | | | HSBC Holdings | | | 216,190 | |
| | 16,735 | | | Inmarsat | | | 205,698 | |
| | 9,996 | | | Jazztel * | | | 153,379 | |
| | 3,348 | | | Rio Tinto | | | 182,272 | |
| | 7,179 | | | Standard Chartered | | | 155,330 | |
| | 6,364 | | | Tullow Oil | | | 94,555 | |
| | 24,041 | | | William Hill | | | 143,975 | |
| | | | | | | | |
| | | | | | | 1,451,623 | |
| | | | | | | | |
| | |
| | | | Total Common Stocks
(Cost $9,599,695) | | | 9,781,601 | |
| | | | | | | | |
| | | | | | | | |
Shares | | | | | Market Value | |
| |
| | PREFERRED STOCK – 1.65% | | | | |
| | |
| | | | Germany – 1.65% | | | | |
| | 624 | | | Volkswagen | | $ | 168,033 | |
| | | | | | | | |
| | | | | | | 168,033 | |
| | | | | | | | |
| | |
| | | | Total Preferred Stock
(Cost $165,923) | | | 168,033 | |
| | | | | | | | |
| |
| | INVESTMENT COMPANY – 0.08% | | | | |
| | |
| | 8,683 | | | BlackRock Liquidity Funds TempCash Portfolio | | | 8,683 | |
| | | | | | | | |
| | |
| | | | Total Investment Company
(Cost $8,683) | | | 8,683 | |
| | | | | | | | |
| Total Investments – 97.72%
(Cost $9,774,302)** | | | 9,958,317 | |
| | | | | | | | |
| Net Other Assets and Liabilities – 2.28% | | | 232,344 | |
| | | | | | | | |
| Net Assets – 100.00% | | $ | 10,190,661 | |
| | | | | | | | |
| * | | Non-income producing security. |
| ** | | At April 30, 2014, cost is identical for book and Federal income tax purposes. |
| | | | |
Gross unrealized appreciation | | $ | 287,853 | |
Gross unrealized depreciation | | | (103,838 | ) |
| | | | |
Net unrealized appreciation | | $ | 184,015 | |
| | | | |
| SP ADR | | Sponsored American Depositary Receipt |
See accompanying Notes to Financial Statements.
| | |
| |
| ASTON/Harrison Street Real Estate Fund | | April 30, 2014 |
| |
| Schedule of Investments (unaudited) | | |
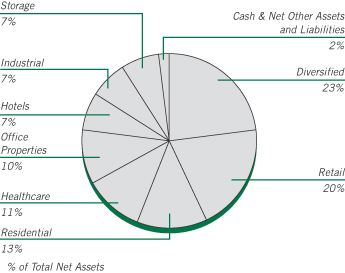
| | | | | | | | |
Shares | | | | | Market
Value | |
| |
| | COMMON STOCKS – 98.10% | | | | |
| | |
| | | | Diversified – 22.97% | | | | |
| | 10,125 | | | Crown Castle International | | $ | 736,391 | |
| | 14,840 | | | DuPont Fabros Technology | | | 359,573 | |
| | 7,060 | | | EPR Properties | | | 378,487 | |
| | 12,212 | | | Liberty Property Trust | | | 457,950 | |
| | 5,600 | | | Potlatch | | | 214,088 | |
| | 16,977 | | | Weyerhaeuser | | | 506,763 | |
| | 4,665 | | | WP Carey | | | 286,804 | |
| | | | | | | | |
| | | | | | | 2,940,056 | |
| | | | | | | | |
| | |
| | | | Healthcare – 10.99% | | | | |
| | 8,245 | | | Health Care, REIT | | | 520,177 | |
| | 11,600 | | | LTC Properties | | | 448,108 | |
| | 14,601 | | | Sabra Health Care, REIT | | | 437,592 | |
| | | | | | | | |
| | | | | | | 1,405,877 | |
| | | | | | | | |
| | |
| | | | Hotels – 7.07% | | | | |
| | 13,051 | | | Chesapeake Lodging Trust | | | 352,246 | |
| | 2,470 | | | Starwood Hotels & Resorts Worldwide | | | 189,326 | |
| | 33,710 | | | Strategic Hotels & Resorts * | | | 363,731 | |
| | | | | | | | |
| | | | | | | 905,303 | |
| | | | | | | | |
| | |
| | | | Industrial – 7.00% | | | | |
| | 13,938 | | | Prologis | | | 566,301 | |
| | 14,025 | | | STAG Industrial | | | 330,008 | |
| | | | | | | | |
| | | | | | | 896,309 | |
| | | | | | | | |
| | |
| | | | Office Properties – 10.37% | | | | |
| | 29,400 | | | American Realty Capital Properties | | | 384,846 | |
| | 4,400 | | | Boston Properties | | | 515,416 | |
| | 4,079 | | | SL Green Realty | | | 427,112 | |
| | | | | | | | |
| | | | | | | 1,327,374 | |
| | | | | | | | |
| | | | | | | | |
Shares | | | | | Market
Value | |
| | |
| | | | Residential – 13.35% | | | | |
| | 5,635 | | | Camden Property Trust | | $ | 385,941 | |
| | 9,780 | | | Equity Residential | | | 581,323 | |
| | 5,000 | | | Mid-America Apartment Communities | | | 348,250 | |
| | 15,223 | | | UDR | | | 393,667 | |
| | | | | | | | |
| | | | | | | 1,709,181 | |
| | | | | | | | |
| | |
| | | | Retail – 19.58% | | | | |
| | 18,610 | | | General Growth Properties | | | 427,472 | |
| | 15,900 | | | Kimco Realty | | | 364,428 | |
| | 14,624 | | | Ramco-Gershenson Properties Trust | | | 241,004 | |
| | 16,085 | | | Retail Opportunity Investments | | | 251,569 | |
| | 7,055 | | | Simon Property Group | | | 1,221,926 | |
| | | | | | | | |
| | | | | | | 2,506,399 | |
| | | | | | | | |
| | |
| | | | Storage – 6.77% | | | | |
| | 3,550 | | | Public Storage | | | 623,061 | |
| | 3,200 | | | Sovran Self Storage | | | 242,880 | |
| | | | | | | | |
| | | | | | | 865,941 | |
| | | | | | | | |
| | |
| | | | Total Common Stocks
(Cost $12,056,712) | | | 12,556,440 | |
| | | | | | | | |
| Total Investments – 98.10%
(Cost $12,056,712)** | | $ | 12,556,440 | |
| | | | | | | | |
| Net Other Assets and Liabilities – 1.90% | | | 243,737 | |
| | | | | | | | |
| Net Assets – 100.00% | | $ | 12,800,177 | |
| | | | | | | | |
| * | | Non-income producing security. |
| ** | | At April 30, 2014, cost is identical for book and federal income tax purposes. |
| | | | |
Gross unrealized appreciation | | $ | 573,288 | |
Gross unrealized depreciation | | | (73,560 | ) |
| | | | |
Net unrealized appreciation | | $ | 499,728 | |
| | | | |
| REIT | | Real Estate Investment Trust |
See accompanying Notes to Financial Statements.
| | |
| |
| ASTON/Montag & Caldwell Balanced Fund | | April 30, 2014 |
| |
| Schedule of Investments (unaudited) | | |
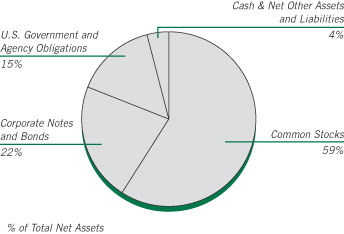
| | | | | | | | |
Shares | | | | | Market Value | |
| |
| | COMMON STOCKS – 59.01% | | | | |
| | |
| | | | Consumer Discretionary – 6.87% | | | | |
| | 3,400 | | | NIKE, Class B | | $ | 248,030 | |
| | 176 | | | Priceline.com * | | | 203,763 | |
| | 1,858 | | | Ralph Lauren | | | 281,244 | |
| | 5,200 | | | Starbucks | | | 367,223 | |
| | 4,950 | | | TJX | | | 287,991 | |
| | 2,700 | | | Yum! Brands | | | 207,873 | |
| | | | | | | | |
| | | | | | | 1,596,124 | |
| | | | | | | | |
| | |
| | | | Consumer Staples – 13.61% | | | | |
| | 7,800 | | | Colgate-Palmolive | | | 524,940 | |
| | 2,300 | | | Costco Wholesale | | | 266,064 | |
| | 7,100 | | | Estee Lauder, Class A | | | 515,247 | |
| | 15,750 | | | Mondelez International, Class A | | | 561,488 | |
| | 3,720 | | | PepsiCo | | | 319,511 | |
| | 6,350 | | | Procter & Gamble | | | 524,193 | |
| | 6,600 | | | Walgreen | | | 448,140 | |
| | | | | | | | |
| | | | | | | 3,159,583 | |
| | | | | | | | |
| | |
| | | | Energy – 2.75% | | | | |
| | 5,500 | | | Occidental Petroleum | | | 526,625 | |
| | 1,100 | | | Schlumberger | | | 111,705 | |
| | | | | | | | |
| | | | | | | 638,330 | |
| | | | | | | | |
| | |
| | | | Financials – 4.30% | | | | |
| | 4,900 | | | American Express | | | 428,407 | |
| | 2,200 | | | State Street | | | 142,032 | |
| | 8,600 | | | Wells Fargo | | | 426,904 | |
| | | | | | | | |
| | | | | | | 997,343 | |
| | | | | | | | |
| | |
| | | | Healthcare – 14.10% | | | | |
| | 11,250 | | | Abbott Laboratories | | | 435,825 | |
| | 3,050 | | | Allergan | | | 505,812 | |
| | 4,250 | | | AmerisourceBergen | | | 277,015 | |
| | 1,712 | | | Biogen Idec * | | | 491,549 | |
| | 7,500 | | | Gilead Sciences * | | | 588,675 | |
| | | | | | | | |
Shares | | | | | Market Value | |
| | |
| | | | Healthcare (continued) | | | | |
| | 2,887 | | | McKesson | | $ | 488,452 | |
| | 1,850 | | | Stryker | | | 143,838 | |
| | 3,000 | | | Thermo Fisher Scientific | | | 342,000 | |
| | | | | | | | |
| | | | | | | 3,273,166 | |
| | | | | | | | |
| | |
| | | | Industrials – 4.44% | | | | |
| | 12,500 | | | General Electric | | | 336,125 | |
| | 1,112 | | | Union Pacific | | | 211,758 | |
| | 4,900 | | | United Parcel Service, Class B | | | 482,650 | |
| | | | | | | | |
| | | | | | | 1,030,533 | |
| | | | | | | | |
| | |
| | | | Information Technology – 10.72% | | | | |
| | 3,650 | | | Accenture, Class A (Ireland) | | | 292,803 | |
| | 8,800 | | | eBay * | | | 456,104 | |
| | 529 | | | Google, Class A * | | | 282,952 | |
| | 278 | | | Google, Class C * | | | 146,411 | |
| | 16,300 | | | Juniper Networks * | | | 402,447 | |
| | 6,500 | | | QUALCOMM | | | 511,615 | |
| | 1,960 | | | Visa, Class A | | | 397,116 | |
| | | | | | | | |
| | | | | | | 2,489,448 | |
| | | | | | | | |
| | |
| | | | Materials – 2.22% | | | | |
| | 4,650 | | | Monsanto | | | 514,755 | |
| | | | | | | | |
| | |
| | | | Total Common Stocks
(Cost $10,965,244) | | | 13,699,282 | |
| | | | | | | | |
| | |
Par Value | | | | | | |
| |
| | CORPORATE NOTES AND BONDS – 21.92% | | | | |
| | |
| | | | Consumer Staples – 4.57% | | | | |
| | $300,000 | | | Coca-Cola
Senior Unsecured Notes
5.350%, 11/15/17 | | | 342,782 | |
| | 325,000 | | | PepsiCo
Senior Unsecured Notes
5.000%, 06/01/18 | | | 366,489 | |
| | 350,000 | | | Wal-Mart Stores
Senior Unsecured Notes
3.200%, 05/15/14 | | | 350,330 | |
| | | | | | | | |
| | | | | | | 1,059,601 | |
| | | | | | | | |
| | |
| | | | Financials – 7.38% | | | | |
| | 300,000 | | | General Electric Capital
Senior Unsecured Notes, MTN
4.375%, 09/16/20 | | | 328,662 | |
| | 300,000 | | | Goldman Sachs Group
Senior Unsecured Notes
3.625%, 02/07/16 | | | 313,832 | |
| | 350,000 | | | JPMorgan Chase
Senior Unsecured Notes
4.350%, 08/15/21 | | | 377,155 | |
| | 350,000 | | | U.S. Bancorp
Subordinated Notes, MTN
2.950%, 07/15/22 | | | 339,341 | |
See accompanying Notes to Financial Statements.
| | |
| |
| ASTON/Montag & Caldwell Balanced Fund | | April 30, 2014 |
| |
| Schedule of Investments (unaudited) – continued | | |
| | | | | | | | |
| | |
Par Value | | | | | Market Value | |
| | |
| | | | Financials (continued) | | | | |
| | $350,000 | | | Wells Fargo
Senior Unsecured Notes, MTN, Series 1
3.750%, 10/01/14 | | $ | 354,993 | |
| | | | | | | | |
| | | | | | | 1,713,983 | |
| | | | | | | | |
| | |
| | | | Healthcare – 3.02% | | | | |
| | 250,000 | | | Johnson & Johnson
Senior Unsecured Notes
5.950%, 08/15/37 | | | 317,844 | |
| | 375,000 | | | Medtronic
Senior Unsecured Notes
3.000%, 03/15/15 | | | 383,965 | |
| | | | | | | | |
| | | | | | | 701,809 | |
| | | | | | | | |
| | |
| | | | Industrials – 1.67% | | | | |
| | 375,000 | | | United Parcel Service
Senior Unsecured Notes
3.125%, 01/15/21 | | | 387,526 | |
| | | | | | | | |
| | |
| | | | Information Technology – 5.28% | | | | |
| | 300,000 | | | Apple
Senior Unsecured Notes
1.000%, 05/03/18 | | | 293,188 | |
| | 300,000 | | | Cisco Systems
Senior Unsecured Notes
5.500%, 02/22/16 | | | 326,919 | |
| | 300,000 | | | Google
Senior Unsecured Notes
3.625%, 05/19/21 | | | 319,101 | |
| | 300,000 | | | Oracle
Senior Unsecured Notes
2.500%, 10/15/22 | | | 286,754 | |
| | | | | | | | |
| | | | | | | 1,225,962 | |
| | | | | | | | |
| | |
| | | | Total Corporate Notes and Bonds
(Cost $4,975,680) | | | 5,088,881 | |
| | | | | | | | |
|
| | U.S. GOVERNMENT AND AGENCY OBLIGATIONS – 14.56% | |
| | |
| | | | Fannie Mae – 0.19% | | | | |
| | 12,339 | | | 7.500%, 02/01/35, Pool # 787557 | | | 14,173 | |
| | 2,955 | | | 7.500%, 04/01/35, Pool # 819231 | | | 3,172 | |
| | 24,339 | | | 6.000%, 11/01/35, Pool # 844078 | | | 27,180 | |
| | | | | | | | |
| | | | | | | 44,525 | |
| | | | | | | | |
| | |
| | | | Freddie Mac – 1.66% | | | | |
| | 10,949 | | | 5.500%, 12/01/20, Gold Pool # G11820 | | | 11,948 | |
| | 375,000 | | | 1.000%, 09/29/17 | | | 373,638 | |
| | | | | | | | |
| | | | | | | 385,586 | |
| | | | | | | | |
| | |
| | | | Government National Mortgage Association – 0.04% | | | | |
| | 8,828 | | | 5.500%, 02/15/39, Pool # 698060 | | | 9,816 | |
| | | | | | | | |
| | | | | | | | |
| | |
Par Value | | | | | Market Value | |
| | |
| | | | U.S. Treasury Bonds – 4.04% | | | | |
| | $300,000 | | | 5.375%, 02/15/31 | | $ | 387,586 | |
| | 400,000 | | | 3.500%, 02/15/39 | | | 408,000 | |
| | 150,000 | | | 3.125%, 11/15/41 | | | 141,797 | |
| | | | | | | | |
| | | | | | | 937,383 | |
| | | | | | | | |
| | |
| | | | U.S. Treasury Notes – 8.63% | | | | |
| | 325,000 | | | 4.000%, 02/15/15 | | | 335,055 | |
| | 275,000 | | | 0.250%, 02/15/15 | | | 275,360 | |
| | 300,000 | | | 4.500%, 02/15/16 | | | 322,494 | |
| | 325,000 | | | 2.625%, 04/30/16 | | | 339,384 | |
| | 325,000 | | | 4.625%, 02/15/17 | | | 359,633 | |
| | 375,000 | | | 2.125%, 08/15/21 | | | 370,620 | |
| | | | | | | | |
| | | | | | | 2,002,546 | |
| | | | | | | | |
| | |
| | | | Total U.S. Government and Agency Obligations
(Cost $3,335,925) | | | 3,379,856 | |
| | | | | | | | |
| | |
Shares | | | | | | |
|
| | INVESTMENT COMPANY – 6.41% | |
| | |
| | 1,487,666 | | | BlackRock Liquidity Funds TempCash Portfolio | | | 1,487,666 | |
| | | | | | | | |
| | |
| | | | Total Investment Company
(Cost $1,487,666) | | | 1,487,666 | |
| | | | | | | | |
| Total Investments – 101.90%
(Cost $20,764,515)** | | $ | 23,655,685 | |
| | | | | | | | |
| Net Other Assets and Liabilities – (1.90)% | | | (440,749 | ) |
| | | | | | | | |
| Net Assets – 100.00% | | $ | 23,214,936 | |
| | | | | | | | |
| * | | Non-income producing security. |
| ** | | At April 30, 2014, cost is identical for book and Federal income tax purposes. |
| | | | |
Gross unrealized appreciation | | $ | 3,010,710 | |
Gross unrealized depreciation | | | (119,540 | ) |
| | | | |
Net unrealized appreciation | | $ | 2,891,170 | |
| | | | |
| | | | |
Portfolio Composition | | | | |
Common Stocks | | | 59% | |
U.S. Government and Agency Obligations | | | 15% | |
Investment Company | | | 4% | |
Corporate Notes and Bonds | | | | |
(Moody’s Ratings) | | | | |
Aaa | | | 2% | |
Aa | | | 7% | |
A | | | 12% | |
Baa | | | 1% | |
| | | | |
| | | 100% | |
| | | | |
See accompanying Notes to Financial Statements.
This page intentionally left blank.
| | |
| |
| | April 30, 2014 |
| |
| Statements of Assets and Liabilities (unaudited) | | |
| | | | | | | | |
| | |
| | | Montag & Caldwell
Growth Fund | | | TAMRO
Diversified
Equity Fund | |
| | |
ASSETS: | | | | | | | | |
Investments: | | | | | | | | |
Investments at cost | | $ | 3,993,999,800 | | | $ | 43,118,187 | |
Net unrealized appreciation (depreciation) | | | 772,976,247 | | | | 12,225,771 | |
| | | | | | | | |
Total investments at value | | | 4,766,976,047 | | | | 55,343,958 | |
Receivables: | | | | | | | | |
Dividends and interest | | | 4,943,195 | | | | 9,503 | |
Dividend reclaims | | | — | | | | — | |
Fund shares sold | | | 3,779,833 | | | | 17,526 | |
Investments sold | | | 35,840,778 | | | | 186,892 | |
Other assets | | | 82,087 | | | | 821 | |
| | | | | | | | |
Total assets | | | 4,811,621,940 | | | | 55,558,700 | |
| | | | | | | | |
| | |
LIABILITIES: | | | | | | | | |
Payables: | | | | | | | | |
Due to custodian | | | — | | | | — | |
Dividend distribution | | | — | | | | — | |
Investments purchased | | | — | | | | 199,514 | |
Fund shares redeemed | | | 10,175,818 | | | | 100,993 | |
Due to Adviser, net (Note G) | | | 2,502,561 | | | | 28,412 | |
Administration fees (Note G) | | | 188,840 | | | | 3,925 | |
Distribution fees (Note G) | | | 85,126 | | | | 1,090 | |
Audit and tax fees | | | 14,625 | | | | 8,650 | |
Custodian fees | | | 21,338 | | | | 474 | |
Transfer agent fees | | | 836,430 | | | | 13,793 | |
Accrued expenses and other payables | | | 271,861 | | | | 5,454 | |
| | | | | | | | |
Total liabilities | | | 14,096,599 | | | | 362,305 | |
| | | | | | | | |
NET ASSETS | | $ | 4,797,525,341 | | | $ | 55,196,395 | |
| | | | | | | | |
| | |
NET ASSETS CONSIST OF: | | | | | | | | |
Paid in capital | | $ | 3,551,583,173 | | | $ | 41,808,905 | |
Accumulated undistributed (distribution in excess of) net investment income (loss) | | | 6,129,782 | | | | (93,994 | ) |
Accumulated net realized gain (loss) on investments | | | 466,836,139 | | | | 1,255,713 | |
Net unrealized appreciation (depreciation) on investments. | | | 772,976,247 | | | | 12,225,771 | |
| | | | | | | | |
TOTAL NET ASSETS | | $ | 4,797,525,341 | | | $ | 55,196,395 | |
| | | | | | | | |
Class N: | | | | | | | | |
Net Assets | | $ | 2,052,125,618 | | | $ | 26,430,727 | |
Shares of beneficial interest outstanding (unlimited authorization) | | | 73,543,384 | | | | 1,529,340 | |
NET ASSET VALUE Offering and redemption price per share
(Net Assets/Shares Outstanding) | | $ | 27.90 | | | $ | 17.28 | |
| | | | | | | | |
Class I: | | | | | | | | |
Net Assets | | $ | 2,735,727,897 | | | $ | 28,765,668 | |
Shares of beneficial interest outstanding (unlimited authorization) | | | 97,480,001 | | | | 1,660,415 | |
NET ASSET VALUE Offering and redemption price per share
(Net Assets/Shares Outstanding) | | $ | 28.06 | | | $ | 17.32 | |
| | | | | | | | |
Class R: | | | | | | | | |
Net Assets | | $ | 9,671,826 | | | $ | — | |
Shares of beneficial interest outstanding (unlimited authorization) | | | 350,755 | | | | — | |
NET ASSET VALUE Offering and redemption price per share
(Net Assets/Shares Outstanding) | | $ | 27.57 | | | $ | — | |
| | | | | | | | |
See accompanying Notes to Financial Statements.
| | | | | | | | | | | | | | | | | | | | | | | | | | |
| | | | | | |
Herndon
Large Cap
Value Fund | | | Cornerstone
Large Cap
Value Fund | | | River Road
Dividend All
Cap Value Fund | | | River Road
Dividend All
Cap Value Fund II | | | Fairpointe
Mid Cap
Fund | | | Montag & Caldwell
Mid Cap
Growth Fund | | | LMCG
Small Cap
Growth Fund | |
| | | | | | |
| | | | | | | | | | | | | | | | | | | | | | | | | | |
| | | | | | | | | | | | | | | | | | | | | | | | | | |
| $ | 126,002,483 | | | $ | 98,398,234 | | | $ | 1,020,831,991 | | | $ | 105,544,422 | | | $ | 4,365,338,756 | | | $ | 9,351,884 | | | $ | 38,604,545 | |
| | 20,761,846 | | | | 10,644,611 | | | | 220,512,187 | | | | 8,794,341 | | | | 1,193,274,175 | | | | 1,922,196 | | | | (251,449 | ) |
| | | | | | | | | | | | | | | | | | | | | | | | | | |
| | 146,764,329 | | | | 109,042,845 | | | | 1,241,344,178 | | | | 114,338,763 | | | | 5,558,612,931 | | | | 11,274,080 | | | | 38,353,096 | |
| | | | | | | | | | | | | | | | | | | | | | | | | | |
| | 108,924 | | | | 59,527 | | | | 2,068,000 | | | | 188,083 | | | | 987,373 | | | | 1,844 | | | | 381 | |
| | — | | | | 5,317 | | | | 9,544 | | | | — | | | | — | | | | — | | | | — | |
| | 507,335 | | | | 386,159 | | | | 933,040 | | | | 226,227 | | | | 7,592,157 | | | | 33 | | | | 7,564 | |
| | — | | | | — | | | | 184,454 | | | | — | | | | 74,126,294 | | | | 245,083 | | | | 810,534 | |
| | 11,352 | | | | 1,005 | | | | 18,919 | | | | 1,339 | | | | 85,040 | | | | 177 | | | | 590 | |
| | | | | | | | | | | | | | | | | | | | | | | | | | |
| | 147,391,940 | | | | 109,494,853 | | | | 1,244,558,135 | | | | 114,754,412 | | | | 5,641,403,795 | | | | 11,521,217 | | | | 39,172,165 | |
| | | | | | | | | | | | | | | | | | | | | | | | | | |
| | | | | | |
| | | | | | | | | | | | | | | | | | | | | | | | | | |
| | | | | | | | | | | | | | | | | | | | | | | | | | |
| | — | | | | — | | | | — | | | | — | | | | 31,521,338 | | | | — | | | | — | |
| | — | | | | — | | | | 216,071 | | | | 6,028 | | | | — | | | | — | | | | — | |
| | — | | | | 232,142 | | | | — | | | | 2,329,252 | | | | 43,013,041 | | | | 120,239 | | | | 772,759 | |
| | 77,049 | | | | 461 | | | | 1,472,205 | | | | 222,264 | | | | 5,784,502 | | | | — | | | | 423,238 | |
| | 127,138 | | | | 69,128 | | | | 713,915 | | | | 106,895 | | | | 3,196,765 | | | | 2,639 | | | | 22,075 | |
| | 7,037 | | | | 5,334 | | | | 49,675 | | | | 5,928 | | | | 211,464 | | | | 2,173 | | | | 3,383 | |
| | 2,007 | | | | 867 | | | | 18,582 | | | | 268 | | | | 104,691 | | | | 467 | | | | 1,275 | |
| | 8,838 | | | | 10,166 | | | | 10,811 | | | | 10,166 | | | | 14,625 | | | | 8,650 | | | | 8,839 | |
| | 1,741 | | | | 7,955 | | | | 4,843 | | | | 1,898 | | | | 15,503 | | | | 2,053 | | | | 1,502 | |
| | 15,533 | | | | 18,730 | | | | 211,496 | | | | 7,812 | | | | 1,036,102 | | | | 4,636 | | | | 10,959 | |
| | 4,620 | | | | 12,424 | | | | 48,411 | | | | 9,546 | | | | 222,741 | | | | 6,799 | | | | 3,446 | |
| | | | | | | | | | | | | | | | | | | | | | | | | | |
| | 243,963 | | | | 357,207 | | | | 2,746,009 | | | | 2,700,057 | | | | 85,120,772 | | | | 147,656 | | | | 1,247,476 | |
| | | | | | | | | | | | | | | | | | | | | | | | | | |
| $ | 147,147,977 | | | $ | 109,137,646 | | | $ | 1,241,812,126 | | | $ | 112,054,355 | | | $ | 5,556,283,023 | | | $ | 11,373,561 | | | $ | 37,924,689 | |
| | | | | | | | | | | | | | | | | | | | | | | | | | |
| | | | | | |
| | | | | | | | | | | | | | | | | | | | | | | | | | |
| $ | 120,527,130 | | | $ | 120,503,408 | | | $ | 956,739,738 | | | $ | 100,447,798 | | | $ | 3,686,403,951 | | | $ | 9,108,040 | | | $ | 36,252,868 | |
| | 367,560 | | | | 90,942 | | | | 5,817,938 | | | | 202,083 | | | | (4,685,581 | ) | | | (36,171 | ) | | | (138,331 | ) |
| | 5,491,441 | | | | (22,101,315 | ) | | | 58,742,263 | | | | 2,610,133 | | | | 681,290,478 | | | | 379,496 | | | | 2,061,601 | |
| | 20,761,846 | | | | 10,644,611 | | | | 220,512,187 | | | | 8,794,341 | | | | 1,193,274,175 | | | | 1,922,196 | | | | (251,449 | ) |
| | | | | | | | | | | | | | | | | | | | | | | | | | |
| $ | 147,147,977 | | | $ | 109,137,646 | | | $ | 1,241,812,126 | | | $ | 112,054,355 | | | $ | 5,556,283,023 | | | $ | 11,373,561 | | | $ | 37,924,689 | |
| | | | | | | | | | | | | | | | | | | | | | | | | | |
| | | | | | | | | | | | | | | | | | | | | | | | | | |
| $ | 49,335,057 | | | $ | 21,405,775 | | | $ | 454,582,501 | | | $ | 6,591,509 | | | $ | 2,549,270,585 | | | $ | 11,373,561 | | | $ | 30,799,940 | |
| | 3,329,863 | | | | 1,439,944 | | | | 33,610,314 | | | | 505,075 | | | | 55,741,582 | | | | 992,702 | | | | 2,338,749 | |
$ |
14.82 |
| | $ | 14.87 | | | $ | 13.53 | | | $ | 13.05 | | | $ | 45.73 | | | $ | 11.46 | | | $ | 13.17 | |
| | | | | | | | | | | | | | | | | | | | | | | | | | |
| | | | | | | | | | | | | | | | | | | | | | | | | | |
| $ | 97,812,920 | | | $ | 87,731,871 | | | $ | 787,229,625 | | | $ | 105,462,846 | | | $ | 3,007,012,438 | | | $ | — | | | $ | 7,124,749 | |
| | 6,592,355 | | | | 5,894,320 | | | | 58,240,815 | | | | 8,079,469 | | | | 64,660,921 | | | | — | | | | 537,194 | |
$ |
14.84 |
| | $ | 14.88 | | | $ | 13.52 | | | $ | 13.05 | | | $ | 46.50 | | | $ | — | | | $ | 13.26 | |
| | | | | | | | | | | | | | | | | | | | | | | | | | |
| | | | | | | | | | | | | | | | | | | | | | | | | | |
| $ | — | | | $ | — | | | $ | — | | | $ | — | | | $ | — | | | $ | — | | | $ | — | |
| | — | | | | — | | | | — | | | | — | | | | — | | | | — | | | | — | |
$ |
— |
| | $ | — | | | $ | — | | | $ | — | | | $ | — | | | $ | — | | | $ | — | |
| | | | | | | | | | | | | | | | | | | | | | | | | | |
See accompanying Notes to Financial Statements.
| | |
| |
| | April 30, 2014 |
| |
| Statements of Assets and Liabilities (unaudited) – continued | | |
| | | | | | | | |
| | |
| | | Silvercrest
Small Cap
Fund | | | TAMRO
Small Cap
Fund | |
| | |
ASSETS: | | | | | | | | |
Investments: | | | | | | | | |
Investments at cost | | $ | 48,425,831 | | | $ | 899,947,442 | |
Affiliated investment at cost | | | — | | | | — | |
Net unrealized appreciation | | | 3,452,451 | | | | 245,543,616 | |
| | | | | | | | |
Total investments at value | | | 51,878,282 | | | | 1,145,491,058 | |
Receivables: | | | | | | | | |
Dividends and interest | | | 13,971 | | | | 18 | |
Fund shares sold | | | 432 | | | | 4,584,608 | |
Investments sold | | | 699,278 | | | | 20,905,640 | |
Other assets | | | 507 | | | | 20,232 | |
| | | | | | | | |
Total assets | | | 52,592,470 | | | | 1,171,001,556 | |
| | | | | | | | |
| | |
LIABILITIES: | | | | | | | | |
Payables: | | | | | | | | |
Due to custodian | | | 249,920 | | | | 1,968,740 | |
Dividend distribution | | | — | | | | — | |
Investments purchased | | | 510,377 | | | | 6,201,348 | |
Fund shares redeemed | | | 60,326 | | | | 7,062,722 | |
Due to Adviser, net (Note G) | | | 33,469 | | | | 893,649 | |
Administration fees (Note G) | | | 3,647 | | | | 48,858 | |
Distribution fees (Note G) | | | 167 | | | | 19,049 | |
Audit and tax fees | | | 8,650 | | | | 10,355 | |
Custodian fees | | | 3,619 | | | | 6,792 | |
Transfer agent fees | | | 13,782 | | | | 310,420 | |
Accrued expenses and other payables | | | 2,626 | | | | 75,086 | |
Call options written, at value (premiums received $5,339,443) | | | — | | | | — | |
| | | | | | | | |
Total liabilities | | | 886,583 | | | | 16,597,019 | |
| | | | | | | | |
NET ASSETS | | $ | 51,705,887 | | | $ | 1,154,404,537 | |
| | | | | | | | |
| | |
NET ASSETS CONSIST OF: | | | | | | | | |
Paid in capital | | $ | 46,637,692 | | | $ | 852,210,534 | |
Accumulated undistributed (distribution in excess of) net investment income (loss) | | | 2,017 | | | | (2,450,167 | ) |
Accumulated net realized gain (loss) on investments, purchased options,, written options, and capital gain distributions received | | | 1,613,727 | | | | 59,100,554 | |
Net unrealized appreciation on investments, purchased options and written options | | | 3,452,451 | | | | 245,543,616 | |
| | | | | | | | |
TOTAL NET ASSETS | | $ | 51,705,887 | | | $ | 1,154,404,537 | |
| | | | | | | | |
Class N: | | | | | | | | |
Net Assets | | $ | 3,973,442 | | | $ | 455,736,461 | |
Shares of beneficial interest outstanding (unlimited authorization) | | | 275,833 | | | | 21,758,068 | |
NET ASSET VALUE Offering and redemption price per share
(Net Assets/Shares Outstanding) | | $ | 14.41 | | | $ | 20.95 | |
| | | | | | | | |
Class I: | | | | | | | | |
Net Assets | | $ | 47,732,445 | | | $ | 698,668,076 | |
Shares of beneficial interest outstanding (unlimited authorization) | | | 3,302,770 | | | | 32,391,650 | |
NET ASSET VALUE Offering and redemption price per share
(Net Assets/Shares Outstanding) | | $ | 14.45 | | | $ | 21.57 | |
| | | | | | | | |
See accompanying Notes to Financial Statements.
| | | | | | | | | | | | | | | | | | | | | | | | | | |
| | | | | | |
River Road
Select Value
Fund | | | River Road
Small Cap
Value Fund | | | River Road
Independent
Value Fund | | | DoubleLine Core
Plus Fixed
Income Fund | | | TCH Fixed
Income Fund | | | Lake Partners
LASSO
Alternatives Fund | | | Anchor Capital
Enhanced Equity
Fund | |
| | | | | | |
| | | | | | | | | | | | | | | | | | | | | | | | | | |
| | | | | | | | | | | | | | | | | | | | | | | | | | |
| $ | 188,717,017 | | | $ | 251,734,994 | | | $ | 714,892,418 | | | $ | 120,470,761 | | | $ | 48,583,659 | | | $ | 459,978,734 | | | $ | 179,105,452 | |
| | — | | | | — | | | | — | | | | 2,516,745 | | | | — | | | | — | | | | — | |
| | 22,198,985 | | | | 64,204,576 | | | | 13,976,018 | | | | 1,369,758 | | | | 3,569,972 | | | | 34,209,464 | | | | 10,686,622 | |
| | | | | | | | | | | | | | | | | | | | | | | | | | |
| | 210,916,002 | | | | 315,939,570 | | | | 728,868,436 | | | | 124,357,264 | | | | 52,153,631 | | | | 494,188,198 | | | | 189,792,074 | |
| | | | | | | | | | | | | | | | | | | | | | | | | | |
| | 37,419 | | | | 8,602 | | | | 25,796 | | | | 989,060 | | | | 516,094 | | | | 108,385 | | | | 275,984 | |
| | 97,263 | | | | 153,795 | | | | 4,766,201 | | | | 55,974 | | | | 12,562 | | | | 1,104,809 | | | | 608,706 | |
| | 1,955,183 | | | | 4,362,789 | | | | 2,237,461 | | | | 1,120,754 | | | | 3,353 | | | | — | | | | 1,225,865 | |
| | 5,284 | | | | 5,004 | | | | 26,931 | | | | 2,626 | | | | 873 | | | | 13,182 | | | | 2,529 | |
| | | | | | | | | | | | | | | | | | | | | | | | | | |
| | 213,011,151 | | | | 320,469,760 | | | | 735,924,825 | | | | 126,525,678 | | | | 52,686,513 | | | | 495,414,574 | | | | 191,905,158 | |
| | | | | | | | | | | | | | | | | | | | | | | | | | |
| | | | | | |
| | | | | | | | | | | | | | | | | | | | | | | | | | |
| | | | | | | | | | | | | | | | | | | | | | | | | | |
| | 370,948 | | | | 2,292,777 | | | | — | | | | 18,259 | | | | 3,358 | | | | — | | | | — | |
| | — | | | | — | | | | — | | | | 67,304 | | �� | | 7,506 | | | | — | | | | — | |
| | 1,915,122 | | | | 1,496,268 | | | | — | | | | 198,734 | | | | — | | | | 108,384 | | | | 654,943 | |
| | 650,941 | | | | 421,738 | | | | 916,601 | | | | 274,068 | | | | 33,542 | | | | 153,486 | | | | 199,057 | |
| | 176,241 | | | | 237,794 | | | | 596,666 | | | | 37,999 | | | | 13,131 | | | | 443,735 | | | | 104,893 | |
| | 10,278 | | | | 14,393 | | | | 29,535 | | | | 26,565 | | | | 9,883 | | | | 20,391 | | | | 9,498 | |
| | 687 | | | | 2,267 | | | | 12,685 | | | | 1,756 | | | | 1,796 | | | | 1,982 | | | | 4,353 | |
| | 10,166 | | | | 10,166 | | | | 8,650 | | | | 7,038 | | | | 10,861 | | | | 9,618 | | | | 9,617 | |
| | 3,500 | | | | 4,330 | | | | 3,706 | | | | 8,821 | | | | 1,923 | | | | 1,591 | | | | 11,154 | |
| | 37,680 | | | | 101,102 | | | | 170,687 | | | | 21,893 | | | | 13,092 | | | | 70,198 | | | | 30,835 | |
| | 11,910 | | | | 22,318 | | | | 46,794 | | | | 22,433 | | | | 7,534 | | |
| 15,816
|
| | | 15,985 | |
| | — | | | | — | | | | — | | | | — | | | | — | | | | — | | | | 7,437,969 | |
| | | | | | | | | | | | | | | | | | | | | | | | | | |
| | 3,187,473 | | | | 4,603,153 | | | | 1,785,324 | | | | 684,870 | | | | 102,626 | | | | 825,201 | | | | 8,478,304 | |
| | | | | | | | | | | | | | | | | | | | | | | | | | |
| $ | 209,823,678 | | | $ | 315,866,607 | | | $ | 734,139,501 | | | $ | 125,840,808 | | | $ | 52,583,887 | | | $ | 494,589,373 | | | $ | 183,426,854 | |
| | | | | | | | | | | | | | | | | | | | | | | | | | |
| | | | | | |
| | | | | | | | | | | | | | | | | | | | | | | | | | |
| $ | 173,051,479 | | | $ | 228,819,548 | | | $ | 699,786,291 | | | $ | 129,380,499 | | | $ | 53,753,608 | | | $ | 454,080,031 | | | $ | 177,413,366 | |
| | (1,226,498 | ) | | | (1,606,641 | ) | | | (3,018,839 | ) | | | (783,887 | ) | | | 132,335 | | | | (4,330,187 | ) | | | 215,433 | |
| 15,799,712 | | | | 24,449,124 | | | | 23,396,031 | | | | (4,125,562 | ) | | | (4,872,028 | ) | | | 10,630,065 | | | | (2,790,041 | ) |
| | 22,198,985 | | | | 64,204,576 | | | | 13,976,018 | | | | 1,369,758 | | | | 3,569,972 | | | | 34,209,464 | | | | 8,588,096 | |
| | | | | | | | | | | | | | | | | | | | | | | | | | |
| $ | 209,823,678 | | | $ | 315,866,607 | | | $ | 734,139,501 | | | $ | 125,840,808 | | | $ | 52,583,887 | | | $ | 494,589,373 | | | $ | 183,426,854 | |
| | | | | | | | | | | | | | | | | | | | | | | | | | |
| | | | | | | | | | | | | | | | | | | | | | | | | | |
| $ | 16,553,703 | | | $ | 54,747,024 | | | $ | 308,274,312 | | | $ | 42,693,348 | | | $ | 43,449,574 | | | $ | 46,953,764 | | | $ | 106,019,566 | |
| | 1,878,476 | | | | 3,987,739 | | | | 27,382,609 | | | | 3,982,213 | | | | 4,031,296 | | | | 3,439,470 | | | | 11,286,694 | |
| | | | | | | | | | | | | | | | | | | | | | | | | | |
| $ | 8.81 | | | $ | 13.73 | | | $ | 11.26 | | | $ | 10.72 | | | $ | 10.78 | | | $ | 13.65 | | | $ | 9.39 | |
| | | | | | | | | | | | | | | | | | | | | | | | | | |
| | | | | | | | | | | | | | | | | | | | | | | | | | |
| $ | 193,269,975 | | | $ | 261,119,583 | | | $ | 425,865,189 | | | $ | 83,147,460 | | | $ | 9,134,313 | | | $ | 447,635,609 | | | $ | 77,407,288 | |
| | 21,713,337 | | | | 18,942,101 | | | | 37,549,586 | | | | 7,755,965 | | | | 847,389 | | | | 32,710,134 | | | | 8,232,255 | |
| | | | | | | | | | | | | | | | | | | | | | | | | | |
| $ | 8.90 | | | $ | 13.79 | | | $ | 11.34 | | | $ | 10.72 | | | $ | 10.78 | | | $ | 13.68 | | | $ | 9.40 | |
| | | | | | | | | | | | | | | | | | | | | | | | | | |
See accompanying Notes to Financial Statements.
| | |
| |
| | April 30, 2014 |
| |
| Statements of Assets and Liabilities (unaudited) – continued | | |
| | | | | | | | |
| | |
| | | River Road
Long-Short
Fund | | | Barings
International
Fund | |
| | | | | | | | |
| | |
ASSETS: | | | | | | | | |
Investments: | | | | | | | | |
Investments at cost | | $ | 225,938,665 | | | $ | 25,309,559 | |
Net unrealized appreciation | | | 2,568,221 | | | | 3,380,823 | |
| | | | | | | | |
Total investments at value | | | 228,506,886 | | | | 28,690,382 | |
Foreign currency (Cost $4,767, $30,849, $3,566, $499, $293,965, respectively) | | | 4,791 | | | | 30,945 | |
Cash | | | 818,769 | | | | 6,673 | |
Segregated Cash (Note B-5) | | | 46,821,667 | | | | — | |
Receivables: | | | | | | | | |
Dividends and interest | | | 220,110 | | | | 152,742 | |
Dividend reclaims | | | — | | | | 108,510 | |
Fund shares sold | | | 437,338 | | | | — | |
Investments sold | | | 948,842 | | | | 60,028 | |
Due from Adviser, net (Note G) | | | — | | | | — | |
Deferred offering costs (Note B-13) | | | — | | | | — | |
Other assets | | | 6,989 | | | | 648 | |
| | | | | | | | |
Total assets | | | 277,765,392 | | | | 29,049,928 | |
| | | | | | | | |
| | |
LIABILITIES: | | | | | | | | |
Payables: | | | | | | | | |
Due to custodian | | | — | | | | — | |
Interest and dividends on securities sold short | | | 41,473 | | | | — | |
Investments purchased | | | 10,253,355 | | | | 38,965 | |
Fund shares redeemed | | | 707,283 | | | | — | |
Due to Adviser, net (Note G) | | | 241,218 | | | | 12,008 | |
Administration fees (Note G) | | | 9,298 | | | | 8,776 | |
Distribution fees (Note G) | | | 4,117 | | | | 20 | |
Audit and tax fees | | | 9,808 | | | | 10,166 | |
Custodian fees | | | 1,315 | | | | 23,604 | |
Transfer agent fees | | | 42,404 | | | | 4,226 | |
Offering costs (Note B-13) | | | — | | | | — | |
Accrued expenses and other payables | | | 14,321 | | | | 5,774 | |
Securities sold short, at value (proceeds $54,598,809) | | | 56,028,471 | | | | — | |
| | | | | | | | |
Total liabilities | | | 67,353,063 | | | | 103,539 | |
| | | | | | | | |
NET ASSETS | | $ | 210,412,329 | | | $ | 28,946,389 | |
| | | | | | | | |
| | |
NET ASSETS CONSIST OF: | | | | | | | | |
Paid in capital | | $ | 209,410,170 | | | $ | 23,114,865 | |
Accumulated undistributed (distribution in excess of) net investment income (loss) | | | (1,166,703 | ) | | | 412,339 | |
Accumulated net realized gain (loss) on investments, securities sold short and foreign currency transactions | | | 1,030,279 | | | | 2,033,512 | |
Net unrealized appreciation on investments, securities sold short and translation of assets and liabilities denominated in foreign currency | | | 1,138,583 | | | | 3,385,673 | |
| | | | | | | | |
TOTAL NET ASSETS | | $ | 210,412,329 | | | $ | 28,946,389 | |
| | | | | | | | |
Class N: | | | | | | | | |
Net Assets | | $ | 99,996,366 | | | $ | 493,960 | |
Shares of beneficial interest outstanding (unlimited authorization) | | | 8,691,870 | | | | 67,714 | |
NET ASSET VALUE Offering and redemption price per share
(Net Assets/Shares Outstanding) | | $ | 11.50 | | | $ | 7.29 | |
| | | | | | | | |
Class I: | | | | | | | | |
Net Assets | | $ | 110,415,963 | | | $ | 28,452,429 | |
Shares of beneficial interest outstanding (unlimited authorization) | | | 9,567,440 | | | | 3,896,612 | |
NET ASSET VALUE Offering and redemption price per share
(Net Assets/Shares Outstanding) | | $ | 11.54 | | | $ | 7.30 | |
| | | | | | | | |
See accompanying Notes to Financial Statements.
| | | | | | | | | | | | | | | | | | | | | | |
| | | | | | |
Guardian
Capital Global
Dividend Fund | | | LMCG
Emerging
Markets Fund | | | Pictet
International
Fund | | | Harrison Street
Real Estate
Fund | | | Montag & Caldwell
Balanced Fund | | | | | |
| | | | | | | | | | | | | | | | | | | | | | |
| | | | | | |
| | | | | | | | | | | | | | | | | | | | | | |
| | | | | | | | | | | | | | | | | | | | | | |
| $ | 4,001,943 | | | $ | 3,992,786 | | | $ | 9,774,302 | | | $ | 12,056,712 | | | $ | 20,764,515 | | | | | |
| | 131,572 | | | | 93,620 | | | | 184,015 | | | | 499,728 | | | | 2,891,170 | | | | | |
| | | | | | | | | | | | | | | | | | | | | | |
| | 4,133,515 | | | | 4,086,406 | | | | 9,958,317 | | | | 12,556,440 | | | | 23,655,685 | | | | | |
| | 3,572 | | | | 500 | | | | 295,140 | | | | — | | | | — | | | | | |
| | — | | | | — | | | | — | | | | — | | | | — | | | | | |
| | — | | | | — | | | | — | | | | — | | | | — | | | | | |
| | | | | | | | | | | | | | | | | | | | | | |
| | 3,593 | | | | 5,951 | | | | 4,497 | | | | 8,586 | | | | 82,739 | | | | | |
| | 588 | | | | — | | | | 454 | | | | 2,336 | | | | — | | | | | |
| | — | | | | — | | | | — | | | | 7,842 | | | | 1,101 | | | | | |
| | 98 | | | | — | | | | — | | | | 852,260 | | | | 83,081 | | | | | |
| | 8,334 | | | | 6,232 | | | | 6,730 | | | | — | | | | — | | | | | |
| | 66,740 | | | | — | | | | 66,740 | | | | — | | | | — | | | | | |
| | — | | | | 7,961 | | | | — | | | | 194 | | | | 398 | | | | | |
| | | | | | | | | | | | | | | | | | | | | | |
| | 4,216,440 | | | | 4,107,050 | | | | 10,331,878 | | | | 13,427,658 | | | | 23,823,004 | | | | | |
| | | | | | | | | | | | | | | | | | | | | | |
| | | | | | |
| | | | | | | | | | | | | | | | | | | | | | |
| | | | | | | | | | | | | | | | | | | | | | |
| | — | | | | — | | | | — | | | | 586,336 | | | | — | | | | | |
| | — | | | | — | | | | — | | | | — | | | | — | | | | | |
| | — | | | | — | | | | 62,299 | | | | — | | | | — | | | | | |
| | — | | | | — | | | | — | | | | 1,705 | | | | 567,218 | | | | | |
| | — | | | | — | | | | — | | | | 805 | | | | 9,898 | | | | | |
| | 1,479 | | | | 5,430 | | | | 2,102 | | | | 2,056 | | | | 3,457 | | | | | |
| | 42 | | | | 27 | | | | 42 | | | | 522 | | | | 361 | | | | | |
| | 1,831 | | | | 8,327 | | | | 1,831 | | | | 9,294 | | | | 10,861 | | | | | |
| | 1,164 | | | | 3,830 | | | | 2,282 | | | | 1,491 | | | | 795 | | | | | |
| | 1,160 | | | | 3,918 | | | | 1,146 | | | | 7,063 | | | | 7,377 | | | | | |
| | 70,000 | | | | — | | | | 70,000 | | | | — | | | | — | | | | | |
| | 1,424 | | | | 1,332 | | | | 1,515 | | | | 18,209 | | | | 8,101 | | | | | |
| | — | | | | — | | | | — | | | | — | | | | — | | | | | |
| | | | | | | | | | | | | | | | | | | | | | |
| | 77,100 | | | | 22,864 | | | | 141,217 | | | | 627,481 | | | | 608,068 | | | | | |
| | | | | | | | | | | | | | | | | | | | | | |
| $ | 4,139,340 | | | $ | 4,084,186 | | | $ | 10,190,661 | | | $ | 12,800,177 | | | $ | 23,214,936 | | | | | |
| | | | | | | | | | | | | | | | | | | | | | |
| | | | | | |
| | | | | | | | | | | | | | | | | | | | | | |
| $ | 4,000,020 | | | $ | 4,384,072 | | | $ | 10,000,020 | | | $ | 24,433,320 | | | $ | 19,510,860 | | | | | |
| | 5,646 | | | | (14,841 | ) | | | 4,090 | | | | 34,919 | | | | (275,295 | ) | | | | |
| | | | | | |
| | 2,083 | | | | (378,669 | ) | | | 1,422 | | | | (12,167,757 | ) | | | 1,088,201 | | | | | |
| | | | | | |
| | 131,591 | | | | 93,624 | | | | 185,129 | | | | 499,695 | | | | 2,891,170 | | | | | |
| | | | | | | | | | | | | | | | | | | | | | |
| $ | 4,139,340 | | | $ | 4,084,186 | | | $ | 10,190,661 | | | $ | 12,800,177 | | | $ | 23,214,936 | | | | | |
| | | | | | | | | | | | | | | | | | | | | | |
| | | | | | | | | | | | | | | | | | | | | | |
| $ | 1,034,750 | | | $ | 665,377 | | | $ | 1,018,968 | | | $ | 12,322,777 | | | $ | 21,487,960 | | | | | |
| | 100,001 | | | | 72,777 | | | | 100,001 | | | | 1,057,080 | | | | 904,969 | | | | | |
| | | | | | |
| $ | 10.35 | | | $ | 9.14 | | | $ | 10.19 | | | $ | 11.66 | | | $ | 23.74 | | | | | |
| | | | | | | | | | | | | | | | | | | | | | |
| | | | | | | | | | | | | | | | | | | | | | |
| $ | 3,104,590 | | | $ | 3,418,809 | | | $ | 9,171,693 | | | $ | 477,400 | | | $ | 1,726,976 | | | | | |
| | 300,001 | | | | 373,384 | | | | 900,001 | | | | 41,200 | | | | 72,960 | | | | | |
| | | | | | |
| $ | 10.35 | | | $ | 9.16 | | | $ | 10.19 | | | $ | 11.59 | | | $ | 23.67 | | | | | |
| | | | | | | | | | | | | | | | | | | | | | |
See accompanying Notes to Financial Statements.
| | |
| |
| For the Six Months Ended April 30, 2014 | | |
| |
| Statements of Operations (unaudited) | | |
| | | | | | | | |
| | |
| | | Montag & Caldwell
Growth Fund | | | TAMRO
Diversified
Equity Fund | |
INVESTMENT INCOME: | | | | | | | | |
Dividends | | $ | 35,812,542 | | | $ | 213,481 | |
Less: foreign taxes withheld | | | — | | | | (333 | ) |
| | | | | | | | |
Total investment income | | | 35,812,542 | | | | 213,148 | |
| | | | | | | | |
EXPENSES: | | | | | | | | |
Investment advisory fees (Note G) | | | 16,091,849 | | | | 224,211 | |
Distribution expenses (Note G)(a) | | | 2,722,479 | | | | 33,806 | |
Transfer agent fees | | | 1,991,904 | | | | 37,638 | |
Administration fees (Note G) | | | 1,143,473 | | | | 20,246 | |
Custodian fees | | | 67,067 | | | | 2,543 | |
Audit and tax fees | | | 15,844 | | | | 8,990 | |
Legal fees | | | 52,033 | | | | 549 | |
Registration expenses | | | 62,784 | | | | 14,522 | |
Reports to shareholder expense | | | 178,788 | | | | 1,495 | |
Trustees fees and related expenses (Note G) | | | 146,386 | | | | 1,554 | |
Other expenses | | | 95,743 | | | | 3,367 | |
| | | | | | | | |
Total expenses before waivers/reimbursements | | | 22,568,350 | | | | 348,921 | |
| | | | | | | | |
Less: Investment advisory fees waived (Note G) | | | — | | | | (48,866 | ) |
Plus: Expenses recouped (Note G) | | | — | | | | — | |
| | | | | | | | |
Net expenses | | | 22,568,350 | | | | 300,055 | |
| | | | | | | | |
NET INVESTMENT INCOME (LOSS) | | | 13,244,192 | | | | (86,907 | ) |
| | | | | | | | |
NET REALIZED AND UNREALIZED GAIN (LOSS) ON INVESTMENTS: | | | | | | | | |
Net realized gain on investments | | | 481,887,542 | | | | 1,297,998 | |
Net change in unrealized appreciation (depreciation) on investments | | | (256,997,862 | ) | | | 2,178,474 | |
| | | | | | | | |
NET REALIZED AND UNREALIZED GAIN ON INVESTMENTS | | | 224,889,680 | | | | 3,476,472 | |
| | | | | | | | |
| | |
NET INCREASE IN NET ASSETS FROM OPERATIONS | | $ | 238,133,872 | | | $ | 3,389,565 | |
| | | | | | | | |
| (a) | Distribution expense is incurred at the Class N level for all funds except Montag & Caldwell Growth Fund. The distribution expense for Class N and R of the Montag & Caldwell Growth Fund is $2,697,789 and $24,690, respectively. |
See accompanying Notes to Financial Statements.
| | | | | | | | | | | | | | | | | | | | | | | | | | |
| | | | | | |
Herndon
Large Cap
Value Fund | | | Cornerstone
Large Cap
Value Fund | | | River Road
Dividend All
Cap Value Fund | | | River Road
Dividend All Cap
Value Fund II | | | Fairpointe
Mid Cap
Fund | | | Montag & Caldwell
Mid Cap
Growth Fund | | | LMCG
Small Cap
Growth Fund | |
| | | | | | | | | | | | | | | | | | | | | | | | | | |
| $ | 1,498,672 | | | $ | 755,108 | | | $ | 29,445,073 | | | $ | 2,407,087 | | | $ | 22,124,193 | | | $ | 35,839 | | | $ | 134,985 | |
| | — | | | | (10,378 | ) | | | (160,544 | ) | | | (14,198 | ) | | | — | | | | (137 | ) | | | — | |
| | | | | | | | | | | | | | | | | | | | | | | | | | |
| | 1,498,672 | | | | 744,730 | | | | 29,284,529 | | | | 2,392,889 | | | | 22,124,193 | | | | 35,702 | | | | 134,985 | |
| | | | | | | | | | | | | | | | | | | | | | | | | | |
| | | | | | | | | | | | | | | | | | | | | | | | | | |
| | 529,905 | | | | 320,458 | | | | 4,276,700 | | | | 345,034 | | | | 18,231,965 | | | | 48,873 | | | | 206,687 | |
| | 57,115 | | | | 27,256 | | | | 564,950 | | | | 6,451 | | | | 3,076,446 | | | | 14,375 | | | | 41,176 | |
| | 40,266 | | | | 44,993 | | | | 409,680 | | | | 30,156 | | | | 2,011,664 | | | | 9,678 | | | | 29,731 | |
| | 37,022 | | | | 24,911 | | | | 280,122 | | | | 29,752 | | | | 1,157,926 | | | | 10,185 | | | | 17,233 | |
| | 4,247 | | | | 14,587 | | | | 16,023 | | | | 4,356 | | | | 62,591 | | | | 3,780 | | | | 3,901 | |
| | 9,113 | | | | 10,728 | | | | 11,150 | | | | 10,728 | | | | 15,844 | | | | 8,990 | | | | 9,113 | |
| | 1,218 | | | | 606 | | | | 12,035 | | | | 871 | | | | 49,324 | | | | 118 | | | | 418 | |
| | 16,768 | | | | 16,462 | | | | 24,056 | | | | 16,311 | | | | 53,576 | | | | 8,715 | | | | 16,019 | |
| | 2,426 | | | | 1,473 | | | | 21,184 | | | | 1,560 | | | | 177,928 | | | | 252 | | | | 1,969 | |
| | 3,524 | | | | 1,885 | | | | 34,046 | | | | 2,554 | | | | 138,956 | | | | 321 | | | | 1,158 | |
| | 4,494 | | | | 3,501 | | | | 23,795 | | | | 3,865 | | | | 74,956 | | | | 2,404 | | | | 3,107 | |
| | | | | | | | | | | | | | | | | | | | | | | | | | |
| | 706,098 | | | | 466,860 | | | | 5,673,741 | | | | 451,638 | | | | 25,051,176 | | | | 107,691 | | | | 330,512 | |
| | | | | | | | | | | | | | | | | | | | | | | | | | |
| | — | | | | (19,003 | ) | | | — | | | | — | | | | — | | | | (35,818 | ) | | | (61,982 | ) |
| | 46,517 | | | | — | | | | — | | | | 72,364 | | | | — | | | | — | | | | — | |
| | | | | | | | | | | | | | | | | | | | | | | | | | |
| | 752,615 | | | | 447,857 | | | | 5,673,741 | | | | 524,002 | | | | 25,051,176 | | | | 71,873 | | | | 268,530 | |
| | | | | | | | | | | | | | | | | | | | | | | | | | |
| | 746,057 | | | | 296,873 | | | | 23,610,788 | | | | 1,868,887 | | | | (2,926,983 | ) | | | (36,171 | ) | | | (133,545 | ) |
| | | | | | | | | | | | | | | | | | | | | | | | | | |
| | | | | | | | | | | | | | | | | | | | | | | | | | |
| | 6,303,283 | | | | 2,627,916 | | | | 56,621,444 | | | | 2,618,709 | | | | 682,412,515 | | | | 432,074 | | | | 3,764,890 | |
| | 5,120,571 | | | | 3,801,757 | | | | (31,670,372 | ) | | | (430,888 | ) | | | (159,148,869 | ) | | | 155,900 | | | | (2,394,505 | ) |
| | | | | | | | | | | | | | | | | | | | | | | | | | |
| | 11,423,854 | | | | 6,429,673 | | | | 24,951,072 | | | | 2,187,821 | | | | 523,263,646 | | | | 587,974 | | | | 1,370,385 | |
| | | | | | | | | | | | | | | | | | | | | | | | | | |
| | | | | | |
| $ | 12,169,911 | | | $ | 6,726,546 | | | $ | 48,561,860 | | | $ | 4,056,708 | | | $ | 520,336,663 | | | $ | 551,803 | | | $ | 1,236,840 | |
| | | | | | | | | | | | | | | | | | | | | | | | | | |
See accompanying Notes to Financial Statements.
| | |
| |
| For the Six Months Ended April 30, 2014 | | |
| |
| Statements of Operations (unaudited) – continued | | |
| | | | | | | | |
| | |
| | | Silvercrest
Small Cap
Fund | | | TAMRO
Small Cap
Fund | |
| | | | | | | | |
INVESTMENT INCOME: | | | | | | | | |
Dividends | | $ | 311,478 | | | $ | 5,004,658 | |
Dividends from affiliated security | | | — | | | | — | |
Less: foreign taxes withheld | | | — | | | | (10,653 | ) |
Interest | | | — | | | | — | |
| | | | | | | | |
Total investment income | | | 311,478 | | | | 4,994,005 | |
| | | | | | | | |
EXPENSES: | | | | | | | | |
Investment advisory fees (Note G) | | | 214,307 | | | | 5,748,829 | |
Distribution expenses (Note G) | | | 5,755 | | | | 639,471 | |
Transfer agent fees | | | 28,583 | | | | 529,401 | |
Administration fees (Note G) | | | 17,244 | | | | 292,769 | |
Custodian fees | | | 6,547 | | | | 20,658 | |
Audit and tax fees | | | 8,990 | | | | 10,851 | |
Legal fees | | | 327 | | | | 13,456 | |
Registration expenses | | | 22,066 | | | | 24,754 | |
Reports to shareholder expense | | | 543 | | | | 45,360 | |
Trustees fees and related expenses (Note G) | | | 980 | | | | 36,496 | |
Other expenses | | | 2,995 | | | | 25,844 | |
| | | | | | | | |
Total expenses before waivers/reimbursements | | | 308,337 | | | | 7,387,889 | |
| | | | | | | | |
Less: Investment advisory fees waived (Note G) | | | (56,130 | ) | | | — | |
Less: Earnings credit (Note 1) | | | — | | | | — | |
Plus: Expenses recouped (Note G) | | | — | | | | — | |
| | | | | | | | |
Net expenses | | | 252,207 | | | | 7,387,889 | |
| | | | | | | | |
NET INVESTMENT INCOME (LOSS) | | | 59,271 | | | | (2,393,884 | ) |
| | | | | | | | |
NET REALIZED AND UNREALIZED GAIN (LOSS) ON INVESTMENTS: | | | | | | | | |
Net realized gain (loss) from non-affiliated securities | | | 1,632,273 | | | | 62,615,952 | |
Net realized gain from affiliated securities | | | — | | | | — | |
Net realized loss on purchased options | | | — | | | | — | |
Net realized loss on written options | | | — | | | | — | |
Capital gain distributions received | | | — | | | | — | |
Net change in unrealized appreciation (depreciation) on investments | | | (1,068,541 | ) | | | (114,078,937 | ) |
Net change in unrealized appreciation (depreciation) on purchased options | | | — | | | | — | |
Net change in unrealized appreciation (depreciation) on written options | | | — | | | | — | |
| | | | | | | | |
NET REALIZED AND UNREALIZED GAIN (LOSS) ON INVESTMENTS | | | 563,732 | | | | (51,462,985 | ) |
| | | | | | | | |
| | |
NET INCREASE (DECREASE) IN NET ASSETS FROM OPERATIONS | | $ | 623,003 | | | $ | (53,856,869 | ) |
| | | | | | | | |
See accompanying Notes to Financial Statements.
| | | | | | | | | | | | | | | | | | | | | | | | | | |
| | | | | | |
River Road
Select Value
Fund | | | River Road
Small Cap
Value Fund | | | River Road
Independent
Value Fund | | | DoubleLine Core
Plus Fixed Income
Fund | | | TCH
Fixed Income
Fund | | | Lake Partners
LASSO
Alternatives Fund | | | Anchor Capital
Enhanced Equity
Fund | |
| | | | | | | | | | | | | | | | | | | | | | | | | | |
| | | | | | | | | | | | | | | | | | | | | | | | | | |
| $ | 1,115,454 | | | $ | 1,653,243 | | | $ | 1,735,806 | | | $ | 785 | | | $ | 4,372 | | | $ | 2,560,765 | | | $ | 2,582,945 | |
| | — | | | | — | | | | — | | | | 68,976 | | | | — | | | | — | | | | — | |
| | (4,737 | ) | | | (6,332 | ) | | | (118,001 | ) | | | — | | | | (165 | ) | | | — | | | | — | |
| | — | | | | — | | | | — | | | | 3,180,648 | | | | 1,154,401 | | | | — | | | | — | |
| | | | | | | | | | | | | | | | | | | | | | | | | | |
| | 1,110,717 | | | | 1,646,911 | | | | 1,617,805 | | | | 3,250,409 | | | | 1,158,608 | | | | 2,560,765 | | | | 2,582,945 | |
| | | | | | | | | | | | | | | | | | | | | | | | | | |
| | | | | | | | | | | | | | | | | | | | | | | | | | |
| | 1,072,289 | | | | 1,445,441 | | | | 3,610,961 | | | | 402,016 | | | | 145,078 | | | | 2,391,555 | | | | 579,015 | |
| | 22,740 | | | | 70,686 | | | | 401,850 | | | | 56,404 | | | | 54,976 | | | | 64,680 | | | | 125,535 | |
| | 106,150 | | | | 148,673 | | | | 334,045 | | | | 68,904 | | | | 32,635 | | | | 196,642 | | | | 83,305 | |
| | 55,975 | | | | 79,671 | | | | 168,000 | | | | 72,858 | | | | 28,723 | | | | 113,499 | | | | 46,144 | |
| | 6,770 | | | | 8,688 | | | | 11,515 | | | | 16,914 | | | | 4,445 | | | | 5,702 | | | | 32,656 | |
| | 10,728 | | | | 10,727 | | | | 8,990 | | | | 19,751 | | | | 13,074 | | | | 10,105 | | | | 10,105 | |
| | 2,138 | | | | 3,027 | | | | 7,257 | | | | 1,815 | | | | 581 | | | | 4,859 | | | | 1,627 | |
| | 17,548 | | | | 20,801 | | | | 23,673 | | | | 17,827 | | | | 16,014 | | | | 33,507 | | | | 19,167 | |
| | 7,291 | | | | 6,531 | | | | 33,679 | | | | 9,930 | | | | 1,372 | | | | 10,972 | | | | 9,638 | |
| | 6,005 | | | | 8,777 | | | | 20,005 | | | | 4,593 | | | | 1,497 | | | | 13,279 | | | | 4,377 | |
| | 6,185 | | | | 7,943 | | | | 15,623 | | | | 4,991 | | | | 3,283 | | | | 8,895 | | | | 4,765 | |
| | | | | | | | | | | | | | | | | | | | | | | | | | |
| | 1,313,819 | | | | 1,810,965 | | | | 4,635,598 | | | | 676,003 | | | | 301,678 | | | | 2,853,695 | | | | 916,334 | |
| | | | | | | | | | | | | | | | | | | | | | | | | | |
| | — | | | | — | | | | (8,924 | ) | | | (115,252 | ) | | | (64,694 | ) | | | — | | | | — | |
| | — | | | | — | | | | (30,229 | ) | | | — | | | | — | | | | — | | | | — | |
| | — | | | | — | | | | — | | | | — | | | | — | | | | 80,851 | | | | — | |
| | | | | | | | | | | | | | | | | | | | | | | | | | |
| | 1,313,819 | | | | 1,810,965 | | | | 4,596,445 | | | | 560,751 | | | | 236,984 | | | | 2,934,546 | | | | 916,334 | |
| | | | | | | | | | | | | | | | | | | | | | | | | | |
| | (203,102 | ) | | | (164,054 | ) | | | (2,978,640 | ) | | | 2,689,658 | | | | 921,624 | | | | (373,781 | ) | | | 1,666,611 | |
| | | | | | | | | | | | | | | | | | | | | | | | | | |
| | | | | | | | | | | | | | | | | | | | | | | | | | |
| | 16,533,322 | | | | 25,738,969 | | | | 31,636,981 | | | | (1,017,981 | ) | | | (23,659 | ) | | | 50,685 | | | | 6,952,811 | |
| | — | | | | — | | | | — | | | | 16,745 | | | | — | | | | — | | | | — | |
| | — | | | | — | | | | — | | | | — | | | | — | | | | — | | | | (5,758,032 | ) |
| | — | | | | — | | | | — | | | | — | | | | — | | | | — | | | | (2,931,307 | ) |
| | — | | | | — | | | | — | | | | — | | | | — | | | | 10,679,156 | | | | — | |
| | (15,725,190 | ) | | | (20,501,268 | ) | | | (13,045,674 | ) | | | 1,805,067 | | | | 638,007 | | | | 6,326,217 | | | | 1,652,039 | |
| | — | | | | — | | | | — | | | | — | | | | — | | | | — | | | | 371,518 | |
| | — | | | | — | | | | — | | | | — | | | | — | | | | — | | | | 261,902 | |
| | | | | | | | | | | | | | | | | | | | | | | | | | |
| | 808,132 | | | | 5,237,701 | | | | 18,591,307 | | | | 803,831 | | | | 614,348 | | | | 17,056,058 | | | | 548,931 | |
| | | | | | | | | | | | | | | | | | | | | | | | | | |
| | | | | | |
| $ | 605,030 | | | $ | 5,073,647 | | | $ | 15,612,667 | | | $ | 3,493,489 | | | $ | 1,535,972 | | | $ | 16,682,277 | | | $ | 2,215,542 | |
| | | | | | | | | | | | | | | | | | | | | | | | | | |
See accompanying Notes to Financial Statements.
| | |
| |
| For the Six Months Ended April 30, 2014 | | |
| |
| Statements of Operations (unaudited) – continued | | |
| | | | | | | | |
| | |
| | | River Road
Long-Short
Fund | | | Barings
International
Fund | |
| | | | | | | | |
INVESTMENT INCOME: | | | | | | | | |
Dividends | | $ | 1,366,913 | | | $ | 624,306 | |
Less: foreign taxes withheld | | | (50,994 | ) | | | (26,048 | ) |
Interest | | | — | | | | — | |
| | | | | | | | |
Total investment income | | | 1,315,919 | | | | 598,258 | |
| | | | | | | | |
EXPENSES: | | | | | | | | |
Investment advisory fees (Note G) | | | 1,237,811 | | | | 160,091 | |
Distribution expenses (Note G) | | | 140,493 | | | | 599 | |
Transfer agent fees | | | 101,702 | | | | 15,685 | |
Administration fees (Note G) | | | 53,354 | | | | 26,892 | |
Custodian fees | | | 10,095 | | | | 44,901 | |
Audit and tax fees | | | 10,230 | | | | 10,728 | |
Legal fees | | | 1,658 | | | | 379 | |
Registration expenses | | | 14,206 | | | | 15,469 | |
Interest and dividend expense on securities sold-short | | | 818,927 | | | | — | |
Amortization of offering costs (Note B-13) | | | — | | | | — | |
Reports to shareholder expense | | | 9,446 | | | | 514 | |
Trustees fees and related expenses (Note G) | | | 5,400 | | | | 1,078 | |
Other expenses | | | 5,212 | | | | 3,087 | |
| | | | | | | | |
Total expenses before waivers/reimbursements | | | 2,408,534 | | | | 279,423 | |
| | | | | | | | |
Less: Investment advisory fees waived (Note G) | | | — | | | | (94,719 | ) |
Less: Expenses reimbursed (Note G) | | | — | | | | — | |
Plus: Expenses recouped (Note G) | | | 46,575 | | | | — | |
| | | | | | | | |
Net expenses | | | 2,455,109 | | | | 184,704 | |
| | | | | | | | |
NET INVESTMENT INCOME (LOSS) | | | (1,139,190 | ) | | | 413,554 | |
| | | | | | | | |
NET REALIZED AND UNREALIZED GAIN (LOSS) ON INVESTMENTS: | | | | | | | | |
Net realized gain (loss) on investments | | | 8,189,110 | | | | 2,199,191 | |
Net realized loss on securities sold short | | | (6,858,025 | ) | | | — | |
Net realized gain (loss) on foreign currency transactions | | | (6,740 | ) | | | (7,230 | ) |
Net change in unrealized appreciation (depreciation) on investments | | | (4,826,978 | ) | | | (1,872,821 | ) |
Net change in unrealized appreciation (depreciation) on securities sold short | | | (40,411 | ) | | | — | |
Net change in unrealized appreciation (depreciation) on translation of assets and liabilities denominated in foreign currency | | | 24 | | | | 2,617 | |
| | | | | | | | |
NET REALIZED AND UNREALIZED GAIN (LOSS) ON INVESTMENTS | | | (3,543,020 | ) | | | 321,757 | |
| | | | | | | | |
| | |
NET INCREASE (DECREASE) IN NET ASSETS FROM OPERATIONS | | $ | (4,682,210 | ) | | $ | 735,311 | |
| | | | | | | | |
| (a) | The inception date for the Guardian Capital Global Dividend Fund and Pictet International Fund is April 14, 2014. |
See accompanying Notes to Financial Statements.
| | | | | | | | | | | | | | | | | | |
| | | | |
Guardian
Capital Global
Dividend Fund(a) | | | LMCG
Emerging
Markets Fund | | | Pictet
International
Fund(a) | | | Harrison Street
Real Estate
Fund | | | Montag & Caldwell
Balanced Fund | |
| | | | | | | | | | | | | | | | | | |
| | | | | | | | | | | | | | | | | | |
| $ | 8,544 | | | $ | 41,601 | | | $ | 10,209 | | | $ | 122,442 | | | $ | 110,309 | |
| | (804 | ) | | | (4,331 | ) | | | (596 | ) | | | — | | | | — | |
| | 9 | | | | — | | | | — | | | | — | | | | 96,996 | |
| | | | | | | | | | | | | | | | | | |
| | 7,749 | | | | 37,270 | | | | 9,613 | | | | 122,442 | | | | 207,305 | |
| | | | | | | | | | | | | | | | | | |
| | | | | | | | | | | | | | | | | | |
| | 1,512 | | | | 20,275 | | | | 4,230 | | | | 64,260 | | | | 90,057 | |
| | 118 | | | | 800 | | | | 118 | | | | 15,473 | | | | 11,105 | |
| | 1,160 | | | | 11,959 | | | | 1,145 | | | | 18,778 | | | | 20,117 | |
| | 1,479 | | | | 14,800 | | | | 2,102 | | | | 10,076 | | | | 14,673 | |
| | 1,164 | | | | 12,273 | | | | 2,282 | | | | 2,565 | | | | 1,796 | |
| | 1,831 | | | | 14,322 | | | | 1,831 | | | | 9,412 | | | | 13,074 | |
| | 5 | | | | 40 | | | | 19 | | | | 135 | | | | 241 | |
| | 1,166 | | | | 14,146 | | | | 1,170 | | | | 14,663 | | | | 14,938 | |
| | — | | | | — | | | | — | | | | — | | | | — | |
| | 3,260 | | | | 29,147 | | | | 3,260 | | | | — | | | | — | |
| | 7 | | | | 58 | | | | 26 | | | | 1,097 | | | | 834 | |
| | 13 | | | | 106 | | | | 52 | | | | 349 | | | | 671 | |
| | 234 | | | | 2,521 | | | | 248 | | | | 12,555 | | | | 2,843 | |
| | | | | | | | | | | | | | | | | | |
| | 11,949 | | | | 120,447 | | | | 16,483 | | | | 149,363 | | | | 170,349 | |
| | | | | | | | | | | | | | | | | | |
| | (1,512 | ) | | | (20,275 | ) | | | (4,230 | ) | | | (61,919 | ) | | | (27,162 | ) |
| | (8,334 | ) | | | (72,339 | ) | | | (6,730 | ) | | | — | | | | — | |
| | — | | | | — | | | | — | | | | — | | | | — | |
| | | | | | | | | | | | | | | | | | |
| | 2,103 | | | | 27,833 | | | | 5,523 | | | | 87,444 | | | | 143,187 | |
| | | | | | | | | | | | | | | | | | |
| | 5,646 | | | | 9,437 | | | | 4,090 | | | | 34,998 | | | | 64,118 | |
| | | | | | | | | | | | | | | | | | |
| | | | | | | | | | | | | | | | | | |
| | (1,110 | ) | | | (145,190 | ) | | | 4,428 | | | | 86,359 | | | | 1,141,642 | |
| | — | | | | — | | | | — | | | | — | | | | — | |
| | 3,193 | | | | (2,207 | ) | | | (3,006 | ) | | | (148 | ) | | | — | |
| | 131,572 | | | | 3,889 | | | | 184,015 | | | | 426,345 | | | | (414,976 | ) |
| | — | | | | — | | | | — | | | | — | | | | — | |
| | | | | | | | | | | | | | | | | | |
| | 19 | | | | 222 | | | | 1,114 | | | | (16 | ) | | | — | |
| | | | | | | | | | | | | | | | | | |
| | 133,674 | | | | (143,286 | ) | | | 186,551 | | | | 512,540 | | | | 726,666 | |
| | | | | | | | | | | | | | | | | | |
| | | | |
| $ | 139,320 | | | $ | (133,849 | ) | | $ | 190,641 | | | $ | 547,538 | | | $ | 790,784 | |
| | | | | | | | | | | | | | | | | | |
See accompanying Notes to Financial Statements.
| | |
| |
| | |
| |
| Statements of Changes in Net Assets | | |
| | | | | | | | | | | | | | | | |
| | |
| | | Montag & Caldwell
Growth Fund | | | TAMRO Diversified
Equity Fund | |
| | | Six Months Ended
April 30, 2014
(unaudited) | | | Year Ended
October 31,
2013 | | | Six Months Ended
April 30, 2014
(unaudited) | | | Year Ended
October 31,
2013 | |
NET ASSETS at Beginning of Period | | $ | 5,235,796,676 | | | $ | 4,323,578,881 | | | $ | 55,677,027 | | | $ | 22,548,977 | |
| | | | | | | | | | | | | | | | |
Increase in net assets from operations: | | | | | | | | | | | | | | | | |
Net investment income (loss) | | | 13,244,192 | | | | 48,828,411 | | | | (86,907 | ) | | | 60,993 | |
Net realized gain on investments | | | 481,887,542 | | | | 355,430,426 | | | | 1,297,998 | | | | 1,715,984 | |
Net change in unrealized appreciation (depreciation) on investments | | | (256,997,862 | ) | | | 562,807,119 | | | | 2,178,474 | | | | 5,679,740 | |
| | | | | | | | | | | | | | | | |
Net increase in net assets from operations | | | 238,133,872 | | | | 967,065,956 | | | | 3,389,565 | | | | 7,456,717 | |
| | | | | | | | | | | | | | | | |
Distributions to shareholders from: | | | | | | | | | | | | | | | | |
Net investment income: | | | | | | | | | | | | | | | | |
Class N | | | (12,394,334 | ) | | | (16,441,713 | ) | | | — | | | | (44,731 | ) |
Class I | | | (24,280,948 | ) | | | (26,011,984 | ) | | | (21,488 | ) | | | (2,691 | ) |
Class R | | | (34,093 | ) | | | (54,774 | ) | | | — | | | | — | |
Net realized gain on investments: | | | | | | | | | | | | | | | | |
Class N | | | (147,918,291 | ) | | | (127,477,429 | ) | | | (786,608 | ) | | | (25,121 | ) |
Class I | | | (202,241,647 | ) | | | (157,688,991 | ) | | | (844,736 | ) | | | (682 | ) |
Class R | | | (700,844 | ) | | | (604,214 | ) | | | — | | | | — | |
| | | | | | | | | | | | | | | | |
Total distributions | | | (387,570,157 | ) | | | (328,279,105 | ) | | | (1,652,832 | ) | | | (73,225 | ) |
| | | | | | | | | | | | | | | | |
Capital share transactions: | | | | | | | | | | | | | | | | |
Proceeds from sales of shares: | | | | | | | | | | | | | | | | |
Class N | | | 108,780,523 | | | | 404,653,774 | | | | 1,880,651 | | | | 4,026,762 | |
Class I | | | 308,195,635 | | | | 843,422,410 | | | | 1,849,605 | | | | 30,561,715 | |
Class R | | | 762,020 | | | | 2,159,268 | | | | — | | | | — | |
Proceeds from reinvestment of distributions: | | | | | | | | | | | | | | | | |
Class N | | | 156,933,268 | | | | 140,514,488 | | | | 725,967 | | | | 68,008 | |
Class I | | | 167,592,669 | | | | 139,367,182 | | | | 864,408 | | | | 3,373 | |
Class R | | | 580,630 | | | | 504,660 | | | | — | | | | — | |
Cost of shares redeemed: | | | | | | | | | | | | | | | | |
Class N | | | (342,609,553 | ) | | | (539,421,701 | ) | | | (3,803,665 | ) | | | (4,531,450 | ) |
Class I | | | (687,568,260 | ) | | | (715,137,195 | ) | | | (3,734,331 | ) | | | (4,383,850 | ) |
Class R | | | (1,501,982 | ) | | | (2,631,942 | ) | | | — | | | | — | |
| | | | | | | | | | | | | | | | |
Net increase (decrease) from capital share transactions | | | (288,835,050 | ) | | | 273,430,944 | | | | (2,217,365 | ) | | | 25,744,558 | |
| | | | | | | | | | | | | | | | |
Total increase (decrease) in net assets | | | (438,271,335 | ) | | | 912,217,795 | | | | (480,632 | ) | | | 33,128,050 | |
| | | | | | | | | | | | | | | | |
NET ASSETS at End of Period | | $ | 4,797,525,341 | | | $ | 5,235,796,676 | | | $ | 55,196,395 | | | $ | 55,677,027 | |
| | | | | | | | | | | | | | | | |
Undistributed (distributions in excess of) net investment income (loss) | | $ | 6,129,782 | | | $ | 29,594,965 | | | $ | (93,994 | ) | | $ | 14,401 | |
| | | | | | | | | | | | | | | | |
See accompanying Notes to Financial Statements.
| | | | | | | | | | | | | | | | | | | | | | |
| | |
Herndon Large Cap
Value Fund | | | Cornerstone Large Cap
Value Fund | | | River Road Dividend
All Cap Value Fund | |
Six Months Ended
April 30, 2014
(unaudited) | | | Year Ended
October 31,
2013 | | | Six Months Ended
April 30, 2014
(unaudited) | | | Year Ended
October 31,
2013 | | | Six Months Ended
April 30, 2014
(unaudited) | | | Year Ended
October 31,
2013 | |
| $ | 122,395,081 | | | $ | 55,406,952 | | | $ | 62,648,378 | | | $ | 26,502,868 | | | $ | 1,228,988,525 | | | $ | 924,209,368 | |
| | | | | | | | | | | | | | | | | | | | | | |
| | | | | | | | | | | | | | | | | | | | | | |
| | 746,057 | | | | 1,202,686 | | | | 296,873 | | | | 339,606 | | | | 23,610,788 | | | | 26,855,750 | |
| | 6,303,283 | | | | 2,027,557 | | | | 2,627,916 | | | | 3,586,687 | | | | 56,621,444 | | | | 71,272,919 | |
|
5,120,571 |
| | | 14,781,516 | | | | 3,801,757 | | | | 5,212,950 | | | | (31,670,372 | ) | | | 159,132,800 | |
| | | | | | | | | | | | | | | | | | | | | | |
| | 12,169,911 | | | | 18,011,759 | | | | 6,726,546 | | | | 9,139,243 | | | | 48,561,860 | | | | 257,261,469 | |
| | | | | | | | | | | | | | | | | | | | | | |
| | | | | | | | | | | | | | | | | | | | | | |
| | | | | | | | | | | | | | | | | | | | | | |
| | (300,533 | ) | | | (435,807 | ) | | | (102,489 | ) | | | (213,973 | ) | | | (6,190,152 | ) | | | (8,135,227 | ) |
| | (733,243 | ) | | | (712,891 | ) | | | (297,744 | ) | | | (61,387 | ) | | | (11,571,746 | ) | | | (15,660,122 | ) |
| | — | | | | — | | | | — | | | | — | | | | — | | | | — | |
| | | | | | | | | | | | | | | | | | | | | | |
| | (829,848 | ) | | | (431,437 | ) | | | — | | | | — | | | | (26,590,807 | ) | | | (12,882,031 | ) |
| | (1,561,843 | ) | | | (650,587 | ) | | | — | | | | — | | | | (45,069,967 | ) | | | (21,478,515 | ) |
| | — | | | | — | | | | — | | | | — | | | | — | | | | — | |
| | | | | | | | | | | | | | | | | | | | | | |
| | (3,425,467 | ) | | | (2,230,722 | ) | | | (400,233 | ) | | | (275,360 | ) | | | (89,422,672 | ) | | | (58,155,895 | ) |
| | | | | | | | | | | | | | | | | | | | | | |
| | | | | | | | | | | | | | | | | | | | | | |
| | | | | | | | | | | | | | | | | | | | | | |
| | 7,539,265 | | | | 21,511,589 | | | | 2,454,000 | | | | 6,812,232 | | | | 36,079,343 | | | | 65,379,486 | |
| | 16,920,762 | | | | 42,373,328 | | | | 46,110,794 | | | | 31,748,633 | | | | 78,075,954 | | | | 198,076,860 | |
| | — | | | | — | | | | — | | | | — | | | | — | | | | — | |
| | | | | | | | | | | | | | | | | | | | | | |
| | 1,130,230 | | | | 867,244 | | | | 97,214 | | | | 205,857 | | | | 32,575,126 | | | | 20,850,811 | |
| | 2,099,431 | | | | 959,131 | | | | 290,077 | | | | 60,827 | | | | 36,789,631 | | | | 26,813,238 | |
| | — | | | | — | | | | — | | | | — | | | | — | | | | — | |
| | | | | | | | | | | | | | | | | | | | | | |
| | (4,278,331 | ) | | | (6,933,068 | ) | | | (6,909,735 | ) | | | (9,246,465 | ) | | | (47,676,407 | ) | | | (48,451,006 | ) |
| | (7,402,905 | ) | | | (7,571,132 | ) | | | (1,879,395 | ) | | | (2,299,457 | ) | | | (82,159,234 | ) | | | (156,995,806 | ) |
| | — | | | | — | | | | — | | | | — | | | | — | | | | — | |
| | | | | | | | | | | | | | | | | | | | | | |
|
16,008,452 |
| | | 51,207,092 | | | | 40,162,955 | | | | 27,281,627 | | | | 53,684,413 | | | | 105,673,583 | |
| | | | | | | | | | | | | | | | | | | | | | |
| | 24,752,896 | | | | 66,988,129 | | | | 46,489,268 | | | | 36,145,510 | | | | 12,823,601 | | | | 304,779,157 | |
| | | | | | | | | | | | | | | | | | | | | | |
| $ | 147,147,977 | | | $ | 122,395,081 | | | $ | 109,137,646 | | | $ | 62,648,378 | | | $ | 1,241,812,126 | | | $ | 1,228,988,525 | |
| | | | | | | | | | | | | | | | | | | | | | |
$ |
367,560 |
| | $ | 655,279 | | | $ | 90,942 | | | $ | 194,302 | | | $ | 5,817,938 | | | $ | (30,952 | ) |
| | | | | | | | | | | | | | | | | | | | | | |
See accompanying Notes to Financial Statements.
| | |
| |
| | |
| |
| Statements of Changes in Net Assets – continued | | |
| | | | | | | | | | | | | | | | |
| | |
| | | River Road Dividend
All Cap Value Fund II | | | Fairpointe Mid Cap Fund | |
| | | Six Months Ended
April 30, 2014
(unaudited) | | | Year Ended
October 31,
2013 | | | Six Months Ended
April 30, 2014
(unaudited) | | | Year Ended
October 31,
2013 | |
NET ASSETS at Beginning of Period | | $ | 89,873,662 | | | $ | 10,419,240 | | | $ | 4,892,248,060 | | | $ | 3,025,731,632 | |
| | | | | | | | | | | | | | | | |
Increase in net assets from operations: | | | | | | | | | | | | | | | | |
Net investment income (loss) | | | 1,868,887 | | | | 959,154 | | | | (2,926,983 | ) | | | 21,074,863 | |
Net realized gain on investments | | | 2,618,709 | | | | 1,009,469 | | | | 682,412,515 | | | | 458,514,910 | |
Net change in unrealized appreciation (depreciation) on investments | | | (430,888 | ) | | | 9,272,582 | | | | (159,148,869 | ) | | | 865,571,634 | |
| | | | | | | | | | | | | | | | |
Net increase in net assets from operations | | | 4,056,708 | | | | 11,241,205 | | | | 520,336,663 | | | | 1,345,161,407 | |
| | | | | | | | | | | | | | | | |
Distributions to shareholders from: | | | | | | | | | | | | | | | | |
Net investment income: | | | | | | | | | | | | | | | | |
Class N | | | (84,007 | ) | | | (39,408 | ) | | | — | | | | (14,340,582 | ) |
Class I | | | (1,602,896 | ) | | | (923,962 | ) | | | (3,375,463 | ) | | | (17,097,297 | ) |
Net realized gain on investments: | | | | | | | | | | | | | | | | |
Class N | | | (43,196 | ) | | | (484 | ) | | | (223,568,950 | ) | | | (34,919,881 | ) |
Class I | | | (981,977 | ) | | | (6,506 | ) | | | (234,479,219 | ) | | | (32,705,189 | ) |
| | | | | | | | | | | | | | | | |
Total distributions | | | (2,712,076 | ) | | | (970,360 | ) | | | (461,423,632 | ) | | | (99,062,949 | ) |
| | | | | | | | | | | | | | | | |
Capital share transactions: | | | | | | | | | | | | | | | | |
Proceeds from sales of shares: | | | | | | | | | | | | | | | | |
Class N | | | 3,347,589 | | | | 2,923,816 | | | | 296,891,730 | | | | 718,022,853 | |
Class I | | | 21,711,550 | | | | 70,639,727 | | | | 668,947,757 | | | | 934,002,570 | |
Proceeds from reinvestment of distributions: | | | | | | | | | | | | | | | | |
Class N | | | 126,649 | | | | 39,064 | | | | 215,069,467 | | | | 47,067,455 | |
Class I | | | 2,322,601 | | | | 826,079 | | | | 170,521,263 | | | | 34,143,433 | |
Cost of shares redeemed: | | | | | | | | | | | | | | | | |
Class N | | | (596,076 | ) | | | (807,796 | ) | | | (355,271,309 | ) | | | (578,805,723 | ) |
Class I | | | (6,076,252 | ) | | | (4,437,313 | ) | | | (391,036,976 | ) | | | (534,012,618 | ) |
Issued due to merger: (a) | | | | | | | | | | | | | | | | |
Class N | | | — | | | | — | | | | — | | | | — | |
Class I | | | — | | | | — | | | | — | | | | — | |
| | | | | | | | | | | | | | | | |
Net increase from capital share transactions | | | 20,836,061 | | | | 69,183,577 | | | | 605,121,932 | | | | 620,417,970 | |
| | | | | | | | | | | | | | | | |
Total increase (decrease) in net assets | | | 22,180,693 | | | | 79,454,422 | | | | 664,034,963 | | | | 1,866,516,428 | |
| | | | | | | | | | | | | | | | |
NET ASSETS at End of Period | | $ | 112,054,355 | | | $ | 89,873,662 | | | $ | 5,556,283,023 | | | $ | 4,892,248,060 | |
| | | | | | | | | | | | | | | | |
Undistributed (distributions in excess of)
net investment income (loss) | | $ | 202,083 | | | $ | 20,099 | | | $ | (4,685,581 | ) | | $ | 1,616,865 | |
| | | | | | | | | | | | | | | | |
| (a) | Effective April 22, 2013, the LMCG Small Cap Growth Fund received capital shares of the corresponding classes of Aston Small Cap Fund as part of the merger of the Aston Small Cap Fund with, and into, the LMCG Small Cap Growth Fund, in a complete liquidation and termination of the Aston Small Cap Fund. |
See accompanying Notes to Financial Statements.
| | | | | | | | | | | | | | | | | | | | | | |
| | |
Montag & Caldwell
Mid Cap Growth Fund | | | LMCG Small Cap
Growth Fund | | | Silvercrest
Small Cap Fund | |
Six Months Ended
April 30, 2014
(unaudited) | | | Year Ended
October 31,
2013 | | | Six Months Ended
April 30, 2014
(unaudited) | | | Year Ended
October 31,
2013 | | | Six Months Ended
April 30, 2014
(unaudited) | | | Year Ended
October 31,
2013 | |
| $ | 11,402,187 | | | $ | 7,368,950 | | | $ | 40,540,640 | | | $ | 6,413,230 | | | $ | 33,267,442 | | | $ | 5,711,567 | |
| | | | | | | | | | | | | | | | | | | | | | |
| | | | | | | | | | | | | | | | | | | | | | |
| | (36,171 | ) | | | (71,220 | ) | | | (133,545 | ) | | | 14,671 | | | | 59,271 | | | | 46,230 | |
| | 432,074 | | | | 1,788,900 | | | | 3,764,890 | | | | 5,887,360 | | | | 1,632,273 | | | | 1,218,605 | |
|
155,900 |
| | | 893,311 | | | | (2,394,505 | ) | | | 1,825,778 | | | | (1,068,541 | ) | | | 4,409,811 | |
| | | | | | | | | | | | | | | | | | | | | | |
| | 551,803 | | | | 2,610,991 | | | | 1,236,840 | | | | 7,727,809 | | | | 623,003 | | | | 5,674,646 | |
| | | | | | | | | | | | | | | | | | | | | | |
| | | | | | | | | | | | | | | | | | | | | | |
| | | | | | | | | | | | | | | | | | | | | | |
| | — | | | | — | | | | — | | | | — | | | | (229 | ) | | | (9,878 | ) |
| | — | | | | — | | | | (14,282 | ) | | | — | | | | (56,178 | ) | | | (78,421 | ) |
| | | | | | | | | | | | | | | | | | | | | | |
| | (1,708,527 | ) | | | (92,399 | ) | | | (4,374,487 | ) | | | (425,537 | ) | | | (146,801 | ) | | | (2,878 | ) |
| | — | | | | — | | | | (1,139,027 | ) | | | (58,662 | ) | | | (1,082,382 | ) | | | (19,730 | ) |
| | | | | | | | | | | | | | | | | | | | | | |
| | (1,708,527 | ) | | | (92,399 | ) | | | (5,527,796 | ) | | | (484,199 | ) | | | (1,285,590 | ) | | | (110,907 | ) |
| | | | | | | | | | | | | | | | | | | | | | |
| | | | | | | | | | | | | | | | | | | | | | |
| | | | | | | | | | | | | | | | | | | | | | |
| | 273,062 | | | | 6,618,730 | | | | 2,007,834 | | | | 5,855,202 | | | | 1,706,078 | | | | 4,010,938 | |
| | — | | | | — | | | | 1,011,886 | | | | 6,748,727 | | | | 19,763,882 | | | | 20,994,880 | |
| | | | | | | | | | | | | | | | | | | | | | |
| | 1,673,347 | | | | 81,176 | | | | 4,189,553 | | | | 425,537 | | | | 147,030 | | | | 12,756 | |
| | — | | | | — | | | | 1,140,513 | | | | 58,662 | | | | 1,138,560 | | | | 98,151 | |
| | | | | | | | | | | | | | | | | | | | | | |
| | (818,311 | ) | | | (5,185,261 | ) | | | (3,996,402 | ) | | | (4,777,656 | ) | | | (1,889,817 | ) | | | (1,427,987 | ) |
| | — | | | | — | | | | (2,678,379 | ) | | | (1,271,372 | ) | | | (1,764,701 | ) | | | (1,696,602 | ) |
| | | | | | | | | | | | | | | | | | | | | | |
| | — | | | | — | | | | — | | | | 18,799,852 | | | | — | | | | — | |
| | — | | | | — | | | | — | | | | 1,044,848 | | | | — | | | | — | |
| | | | | | | | | | | | | | | | | | | | | | |
| | 1,128,098 | | | | 1,514,645 | | | | 1,675,005 | | | | 26,883,800 | | | | 19,101,032 | | | | 21,992,136 | |
| | | | | | | | | | | | | | | | | | | | | | |
| | (28,626 | ) | | | 4,033,237 | | | | (2,615,951 | ) | | | 34,127,410 | | | | 18,438,445 | | | | 27,555,875 | |
| | | | | | | | | | | | | | | | | | | | | | |
| $ | 11,373,561 | | | $ | 11,402,187 | | | $ | 37,924,689 | | | $ | 40,540,640 | | | $ | 51,705,887 | | | $ | 33,267,442 | |
| | | | | | | | | | | | | | | | | | | | | | |
$ |
(36,171 |
) | | $ | — | | | $ | (138,331 | ) | | $ | 9,496 | | | $ | 2,017 | | | $ | (847 | ) |
| | | | | | | | | | | | | | | | | | | | | | |
See accompanying Notes to Financial Statements.
| | |
| |
| | |
| |
| Statements of Changes in Net Assets – continued | | |
| | | | | | | | | | | | | | | | |
| | |
| | | TAMRO
Small Cap Fund | | | River Road
Select Value Fund | |
| | | Six Months Ended
April 30, 2014
(unaudited) | | | Year Ended
October 31,
2013 | | | Six Months Ended
April 30, 2014
(unaudited) | | | Year Ended
October 31,
2013 | |
| | | | | | | | | | | | | | | | |
NET ASSETS at Beginning of Period | | $ | 1,325,799,376 | | | $ | 1,024,788,083 | | | $ | 217,318,502 | | | $ | 162,779,864 | |
| | | | | | | | | | | | | | | | |
Increase (decrease) in net assets from operations: | | | | | | | | | | | | | | | | |
Net investment income (loss) | | | (2,393,884 | ) | | | (56,283 | ) | | | (203,102 | ) | | | 1,930,612 | |
Net realized gain (loss) on investments | | | 62,615,952 | | | | 124,824,787 | | | | 16,533,322 | | | | 31,063,046 | |
Net change in unrealized appreciation (depreciation) on investments | | | (114,078,937 | ) | | | 169,676,168 | | | | (15,725,190 | ) | | | 16,377,768 | |
| | | | | | | | | | | | | | | | |
Net increase (decrease) in net assets from operations | | | (53,856,869 | ) | | | 294,444,672 | | | | 605,030 | | | | 49,371,426 | |
| | | | | | | | | | | | | | | | |
Distributions to shareholders from: | | | | | | | | | | | | | | | | |
Net investment income: | | | | | | | | | | | | | | | | |
Class N | | | — | | | | — | | | | (30,708 | ) | | | (95,581 | ) |
Class I | | | — | | | | — | | | | (702,475 | ) | | | (2,552,798 | ) |
Net realized gain on investments: | | | | | | | | | | | | | | | | |
Class N | | | (47,504,175 | ) | | | (36,352,900 | ) | | | (2,748,771 | ) | | | (391,684 | ) |
Class I | | | (68,914,775 | ) | | | (59,453,402 | ) | | | (28,381,897 | ) | | | (8,873,103 | ) |
| | | | | | | | | | | | | | | | |
Total distributions | | | (116,418,950 | ) | | | (95,806,302 | ) | | | (31,863,851 | ) | | | (11,913,166 | ) |
| | | | | | | | | | | | | | | | |
Capital share transactions: | | | | | | | | | | | | | | | | |
Proceeds from sales of shares: | | | | | | | | | | | | | | | | |
Class N | | | 32,638,653 | | | | 146,473,113 | | | | 1,051,287 | | | | 14,915,498 | |
Class I | | | 82,430,054 | | | | 191,669,363 | (a) | | | 14,833,490 | | | | 56,912,818 | |
Proceeds from reinvestment of distributions: | | | | | | | | | | | | | | | | |
Class N | | | 44,495,639 | | | | 35,759,291 | | | | 2,654,599 | | | | 459,196 | |
Class I | | | 55,420,970 | | | | 43,230,709 | | | | 28,799,580 | | | | 10,087,922 | |
Cost of shares redeemed: | | | | | | | | | | | | | | | | |
Class N | | | (86,438,000 | ) | | | (117,639,649 | ) | | | (3,525,670 | ) | | | (5,019,206 | ) |
Class I | | | (129,666,336 | ) | | | (197,119,904 | )(b) | | | (20,049,289 | ) | | | (60,275,850 | ) |
| | | | | | | | | | | | | | | | |
Net increase (decrease) from capital share transactions | | | (1,119,020 | ) | | | 102,372,923 | | | | 23,763,997 | | | | 17,080,378 | |
| | | | | | | | | | | | | | | | |
Total increase (decrease) in net assets | | | (171,394,839 | ) | | | 301,011,293 | | | | (7,494,824 | ) | | | 54,538,638 | |
| | | | | | | | | | | | | | | | |
NET ASSETS at End of Period | | $ | 1,154,404,537 | | | $ | 1,325,799,376 | | | $ | 209,823,678 | | | $ | 217,318,502 | |
| | | | | | | | | | | | | | | | |
Distributions in excess of net investment income (loss) | | $ | (2,450,167 | ) | | $ | (56,283 | ) | | $ | (1,226,498 | ) | | $ | (290,213 | ) |
| | | | | | | | | | | | | | | | |
| (a) | TAMRO Small Cap Fund had a subscription-in-kind in the amount of $2,677,538 on April 25, 2013. The subscription was comprised of securities, cash and dividends accrued in the amounts of $2,657,373, $19,712 and $453, respectively. |
| (b) | TAMRO Small Cap Fund had a redemption-in-kind in the amount of 52,573,290 on January 15, 2013. The redemption was comprised of securities and cash in the amount of $51,794,423 and $778,867, respectively. |
| (c) | River Road Independent Value Fund had a subscription-in-kind in the amount of $597,548 on March 27, 2013. The subscription was composed of securities, cash, and dividends accrued in the amounts of $258,478, $338,808 and $262, respectively. |
See accompanying Notes to Financial Statements.
| | | | | | | | | | | | | | | | | | | | | | |
| | |
River Road
Small Cap Value Fund | | | River Road
Independent Value Fund | | | DoubleLine Core Plus
Fixed Income Fund | |
Six Months Ended
April 30, 2014
(unaudited) | | | Year Ended
October 31,
2013 | | | Six Months Ended
April 30, 2014
(unaudited) | | | Year Ended
October 31,
2013 | | | Six Months Ended
April 30, 2014
(unaudited) | | | Year Ended
October 31,
2013 | |
| | | | | | | | | | | | | | | | | | | | | | |
| $ | 309,597,171 | | | $ | 289,229,188 | | | $ | 725,355,861 | | | $ | 700,649,463 | | | $ | 176,385,864 | | | $ | 176,881,578 | |
| | | | | | | | | | | | | | | | | | | | | | |
| | | | | | | | | | | | | | | | | | | | | | |
| | (164,054 | ) | | | 3,915,268 | | | | (2,978,640 | ) | | | (3,289,548 | ) | | | 2,689,658 | | | | 6,027,184 | |
| | 25,738,969 | | | | 66,663,383 | | | | 31,636,981 | | | | 32,206,753 | | | | (1,001,236 | ) | | | (2,244,975 | ) |
| | | | | |
| | (20,501,268 | ) | | | 17,066,486 | | | | (13,045,674 | ) | | | 16,741,054 | | | | 1,805,067 | | | | (5,562,851 | ) |
| | | | | | | | | | | | | | | | | | | | | | |
| | | | | |
| | 5,073,647 | | | | 87,645,137 | | | | 15,612,667 | | | | 45,658,259 | | | | 3,493,489 | | | | (1,780,642 | ) |
| | | | | | | | | | | | | | | | | | | | | | |
| | | | | | | | | | | | | | | | | | | | | | |
| | | | | | | | | | | | | | | | | | | | | | |
| | (125,993 | ) | | | (768,062 | ) | | | — | | | | — | | | | (845,547 | ) | | | (2,744,975 | ) |
| | (1,180,379 | ) | | | (4,548,794 | ) | | | — | | | | — | | | | (2,044,005 | ) | | | (4,353,733 | ) |
| | | | | | | | | | | | | | | | | | | | | | |
| | (12,061,338 | ) | | | (1,497,083 | ) | | | (13,027,499 | ) | | | (20,379,878 | ) | | | — | | | | (491,620 | ) |
| | (54,042,337 | ) | | | (7,569,096 | ) | | | (15,234,386 | ) | | | (19,173,208 | ) | | | — | | | | (597,665 | ) |
| | | | | | | | | | | | | | | | | | | | | | |
| | (67,410,047 | ) | | | (14,383,035 | ) | | | (28,261,885 | ) | | | (39,553,086 | ) | | | (2,889,552 | ) | | | (8,187,993 | ) |
| | | | | | | | | | | | | | | | | | | | | | |
| | | | | | | | | | | | | | | | | | | | | | |
| | | | | | | | | | | | | | | | | | | | | | |
| | 7,735,945 | | | | 8,370,448 | | | | 44,271,254 | | | | 134,123,913 | | | | 5,119,257 | | | | 53,008,348 | |
| | 35,576,075 | | | | 61,492,823 | | | | 91,238,208 | | | | 133,619,629 | (c) | | | 25,572,201 | | | | 60,045,064 | |
| | | | | | | | | | | | | | | | | | | | | | |
| | 12,142,608 | | | | 2,244,845 | | | | 12,978,719 | | | | 20,310,806 | | | | 790,454 | | | | 3,178,568 | |
| | 55,057,909 | | | | 12,089,609 | | | | 14,687,638 | | | | 18,660,298 | | | | 1,720,439 | | | | 4,306,487 | |
| | | | | | | | | | | | | | | | | | | | | | |
| | (10,592,293 | ) | | | (15,330,517 | ) | | | (82,009,545 | ) | | | (178,942,382 | ) | | | (29,659,234 | ) | | | (57,207,650 | ) |
| | (31,314,408 | ) | | | (121,761,327 | ) | | | (59,733,416 | ) | | | (109,171,039 | ) | | | (54,692,110 | ) | | | (53,857,896 | ) |
| | | | | | | | | | | | | | | | | | | | | | |
| | | | | |
| | 68,605,836 | | | | (52,894,119 | ) | | | 21,432,858 | | | | 18,601,225 | | | | (51,148,993 | ) | | | 9,472,921 | |
| | | | | | | | | | | | | | | | | | | | | | |
| | 6,269,436 | | | | 20,367,983 | | | | 8,783,640 | | | | 24,706,398 | | | | (50,545,056 | ) | | | (495,714 | ) |
| | | | | | | | | | | | | | | | | | | | | | |
| $ | 315,866,607 | | | $ | 309,597,171 | | | $ | 734,139,501 | | | $ | 725,355,861 | | | $ | 125,840,808 | | | $ | 176,385,864 | |
| | | | | | | | | | | | | | | | | | | | | | |
| | | | | |
| $ | (1,606,641 | ) | | $ | (136,215 | ) | | $ | (3,018,839 | ) | | $ | (40,199 | ) | | $ | (783,887 | ) | | $ | (583,993 | ) |
| | | | | | | | | | | | | | | | | | | | | | |
See accompanying Notes to Financial Statements.
| | |
| |
| | |
| |
| Statements of Changes in Net Assets – continued | | |
| | | | | | | | | | | | | | | | |
| | |
| | | TCH Fixed Income Fund | | | Lake Partners
LASSO Alternatives Fund | |
| | | Six Months Ended
April 30, 2014
(unaudited) | | | Year Ended
October 31,
2013 | | | Six Months Ended
April 30, 2014
(unaudited) | | | Year Ended
October 31,
2013 | |
| | | | | | | | | | | | | | | | |
NET ASSETS at Beginning of Period | | $ | 54,512,660 | | | $ | 70,167,760 | | | $ | 470,862,793 | | | $ | 287,061,601 | |
| | | | | | | | | | | | | | | | |
Increase (decrease) in net assets from operations: | | | | | | | | | | | | | | | | |
Net investment income (loss) | | | 921,624 | | | | 2,419,293 | | | | (373,781 | ) | | | 726,304 | |
Net realized gain (loss) on investments, purchased options, written options, capital gain distributions, securities sold short and foreign currency transactions | | | (23,659 | ) | | | 1,655,009 | | | | 10,729,841 | | | | 10,013,103 | |
Net change in unrealized appreciation (depreciation) on investments, purchased options, written options, securities sold short and translation of assets and liabilities denominated in foreign currency | | | 638,007 | | | | (4,215,928 | ) | | | 6,326,217 | | | | 19,339,867 | |
| | | | | | | | | | | | | | | | |
Net increase (decrease) in net assets from operations | | | 1,535,972 | | | | (141,626 | ) | | | 16,682,277 | | | | 30,079,274 | |
| | | | | | | | | | | | | | | | |
Distributions to shareholders from: | | | | | | | | | | | | | | | | |
Net investment income: | | | | | | | | | | | | | | | | |
Class N | | | (822,208 | ) | | | (2,291,411 | ) | | | (378,809 | ) | | | (472,420 | ) |
Class I | | | (176,134 | ) | | | (422,043 | ) | | | (3,788,207 | ) | | | (3,732,874 | ) |
Net realized gain on investments: | | | | | | | | | | | | | | | | |
Class N | | | — | | | | — | | | | (186,666 | ) | | | — | |
Class I | | | — | | | | — | | | | (1,404,331 | ) | | | — | |
| | | | | | | | | | | | | | | | |
Total distributions | | | (998,342 | ) | | | (2,713,454 | ) | | | (5,758,013 | ) | | | (4,205,294 | ) |
| | | | | | | | | | | | | | | | |
Capital share transactions: | | | | | | | | | | | | | | | | |
Proceeds from sales of shares: | | | | | | | | | | | | | | | | |
Class N | | | 3,104,056 | | | | 10,518,750 | | | | 13,783,529 | | | | 54,094,179 | |
Class I | | | 1,515,675 | | | | 1,280,566 | | | | 71,791,395 | | | | 218,417,490 | |
Proceeds from reinvestment of distributions: | | | | | | | | | | | | | | | | |
Class N | | | 779,544 | | | | 2,192,348 | | | | 544,810 | | | | 452,219 | |
Class I | | | 171,248 | | | | 381,111 | | | | 4,429,761 | | | | 3,236,441 | |
Cost of shares redeemed: | | | | | | | | | | | | | | | | |
Class N | | | (6,652,613 | ) | | | (24,265,442 | ) | | | (22,959,205 | ) | | | (36,923,554 | ) |
Class I | | | (1,384,313 | ) | | | (2,907,353 | ) | | | (54,787,974 | ) | | | (81,349,563 | ) |
| | | | | | | | | | | | | | | | |
Net increase (decrease) from capital share transactions | | | (2,466,403 | ) | | | (12,800,020 | ) | | | 12,802,316 | | | | 157,927,212 | |
| | | | | | | | | | | | | | | | |
Total increase (decrease) in net assets | | | (1,928,773 | ) | | | (15,655,100 | ) | | | 23,726,580 | | | | 183,801,192 | |
| | | | | | | | | | | | | | | | |
NET ASSETS at End of Period | | $ | 52,583,887 | | | $ | 54,512,660 | | | $ | 494,589,373 | | | $ | 470,862,793 | |
| | | | | | | | | | | | | | | | |
Undistributed (distributions in excess of)
net investment income (loss) | | $ | 132,335 | | | $ | 209,053 | | | $ | (4,330,187 | ) | | $ | 210,610 | |
| | | | | | | | | | | | | | | | |
See accompanying Notes to Financial Statements.
| | | | | | | | | | | | | | | | | | | | | | |
| | |
Anchor Capital
Enhanced Equity Fund | | | River Road
Long-Short Fund | | | Barings
International Fund | |
Six Months Ended
April 30, 2014
(unaudited) | | | Year Ended
October 31,
2013 | | | Six Months Ended
April 30, 2014
(unaudited) | | | Year Ended
October 31,
2013 | | | Six Months Ended
April 30, 2014
(unaudited) | | | Year Ended
October 31,
2013 | |
| | | | | | | | | | | | | | | | | | | | | | |
| | $159,761,924 | | | $ | 177,809,320 | | | $ | 180,141,159 | | | $ | 7,506,387 | | | $ | 37,984,420 | | | $ | 62,083,656 | |
| | | | | | | | | | | | | | | | | | | | | | |
| | | | | | | | | | | | | | | | | | | | | | |
| | 1,666,611 | | | | 3,514,668 | | | | (1,139,190 | ) | | | (809,545 | ) | | | 413,554 | | | | 1,002,932 | |
| (1,736,528 | ) | | | (786,086 | ) | | | 1,324,345 | | | | 5,513,861 | | | | 2,191,961 | | | | 2,555,143 | |
| 2,285,459 | | | | 14,675,574 | | | | (4,867,365 | ) | | | 5,963,396 | | | | (1,870,204 | ) | | | 4,150,508 | |
| | | | | | | | | | | | | | | | | | | | | | |
| 2,215,542 | | | | 17,404,156 | | | | (4,682,210 | ) | | | 10,667,712 | | | | 735,311 | | | | 7,708,583 | |
| | | | | | | | | | | | | | | | | | | | | | |
| | | | | | | | | | | | | | | | | | | | | | |
| | | | | | | | | | | | | | | | | | | | | | |
| | (915,811 | ) | | | (2,040,791 | ) | | | — | | | | — | | | | (10,891 | ) | | | (5,702 | ) |
| | (676,799 | ) | | | (1,460,057 | ) | | | — | | | | — | | | | (988,215 | ) | | | (986,921 | ) |
| | | | | | | | | | | | | | | | | | | | | | |
| | — | | | | (1,672,759 | ) | | | (2,911,026 | ) | | | (437,571 | ) | | | (28,909 | ) | | | (5,125 | ) |
| | — | | | | (1,243,698 | ) | | | (2,032,930 | ) | | | — | | | | (2,374,297 | ) | | | (754,174 | ) |
| | | | | | | | | | | | | | | | | | | | | | |
| | (1,592,610 | ) | | | (6,417,305 | ) | | | (4,943,956 | ) | | | (437,571 | ) | | | (3,402,312 | ) | | | (1,751,922 | ) |
| | | | | | | | | | | | | | | | | | | | | | |
| | | | | | | | | | | | | | | | | | | | | | |
| | | | | | | | | | | | | | | | | | | | | | |
| | 18,255,002 | | | | 44,682,440 | | | | 39,873,109 | | | | 110,536,773 | | | | 17,097 | | | | 17,634 | |
| | 32,661,525 | | | | 35,763,522 | | | | 50,200,573 | | | | 72,413,856 | | | | 3,506,501 | | | | 10,658,884 | |
| | | | | | | | | | | | | | | | | | | | | | |
| | 905,117 | | | | 3,679,250 | | | | 2,838,180 | | | | 437,571 | | | | 39,800 | | | | 10,574 | |
| | 543,012 | | | | 1,901,112 | | | | 1,960,122 | | | | — | | | | 3,362,512 | | | | 1,523,863 | |
| | | | | | | | | | | | | | | | | | | | | | |
| | (15,017,006 | ) | | | (59,806,848 | ) | | | (46,073,927 | ) | | | (16,146,675 | ) | | | (8,781 | ) | | | (30,668 | ) |
| | (14,305,652 | ) | | | (55,253,723 | ) | | | (8,900,721 | ) | | | (4,836,894 | ) | | | (13,288,159 | ) | | | (42,236,184 | ) |
| | | | | | | | | | | | | | | | | | | | | | |
| 23,041,998 | | | | (29,034,247 | ) | | | 39,897,336 | | | | 162,404,631 | | | | (6,371,030 | ) | | | (30,055,897 | ) |
| | | | | | | | | | | | | | | | | | | | | | |
| | 23,664,930 | | | | (18,047,396 | ) | | | 30,271,170 | | | | 172,634,772 | | | | (9,038,031 | ) | | | (24,099,236 | ) |
| | | | | | | | | | | | | | | | | | | | | | |
| $ | 183,426,854 | | | $ | 159,761,924 | | | $ | 210,412,329 | | | $ | 180,141,159 | | | $ | 28,946,389 | | | $ | 37,984,420 | |
| | | | | | | | | | | | | | | | | | | | | | |
| | | | | |
| $ | 215,433 | | | $ | 141,432 | | | $ | (1,166,703 | ) | | $ | (27,513 | ) | | $ | 412,339 | | | $ | 997,891 | |
| | | | | | | | | | | | | | | | | | | | | | |
See accompanying Notes to Financial Statements.
| | |
| |
| | |
| |
| Statements of Changes in Net Assets – continued | | |
| | | | | | | | | | | | |
| | |
| | | Guardian
Capital Global
Dividend Fund | | | LMCG Emerging
Markets Fund | |
| | | Period Ended
April 30, 2014(a)
(unaudited) | | | Six Months Ended
April 30, 2014
(unaudited) | | | Period Ended
October 31,
2013(b) | |
| | | | | | | | | | | | |
NET ASSETS at Beginning of Period | | $ | — | | | $ | 3,981,658 | | | $ | — | |
| | | | | | | | | | | | |
Increase (decrease) in net assets from operations: | | | | | | | | | | | | |
Net investment income | | | 5,646 | | | | 9,437 | | | | 35,615 | |
Net realized gain (loss) on investments and foreign currency transactions | | | 2,083 | | | | (147,397 | ) | | | (241,096 | ) |
Net change in unrealized appreciation (depreciation) on investments and translation of assets and liabilities denominated in foreign currency | | | 131,591 | | | | 4,111 | | | | 89,513 | |
| | | | | | | | | | | | |
Net increase (decrease) in net assets from operations | | | 139,320 | | | | (133,849 | ) | | | (115,968 | ) |
| | | | | | | | | | | | |
Distributions to shareholders from: | | | | | | | | | | | | |
Net investment income: | | | | | | | | | | | | |
Class N | | | — | | | | (9,940 | ) | | | — | |
Class I | | | — | | | | (54,634 | ) | | | — | |
Net realized gain on investments: | | | | | | | | | | | | |
Class N | | | — | | | | — | | | | — | |
Class I | | | — | | | | — | | | | — | |
| | | | | | | | | | | | |
Total distributions | | | — | | | | (64,574 | ) | | | — | |
| | | | | | | | | | | | |
Capital share transactions: | | | | | | | | | | | | |
Proceeds from sales of shares: | | | | | | | | | | | | |
Class N | | | 1,000,010 | | | | 18,756 | | | | 697,622 | |
Class I | | | 3,000,010 | | | | 220,396 | | | | 3,400,004 | |
Proceeds from reinvestment of distributions: | | | | | | | | | | | | |
Class N | | | — | | | | 9,940 | | | | — | |
Class I | | | — | | | | 54,634 | | | | — | |
Cost of shares redeemed: | | | | | | | | | | | | |
Class N | | | — | | | | (2,775 | ) | | | — | |
Class I | | | — | | | | — | | | | — | |
Capital Contribution (Note G): | | | | | | | | | | | | |
Class N | | | — | | | | — | | | | — | |
Class I | | | — | | | | — | | | | — | |
| | | | | | | | | | | | |
Net increase (decrease) from capital share transactions | | | 4,000,020 | | | | 300,951 | | | | 4,097,626 | |
| | | | | | | | | | | | |
Total increase (decrease) in net assets | | | 4,139,340 | | | | 102,528 | | | | 3,981,658 | |
| | | | | | | | | | | | |
NET ASSETS at End of Period | | $ | 4,139,340 | | | $ | 4,084,186 | | | $ | 3,981,658 | |
| | | | | | | | | | | | |
Undistributed (distributions in excess of) net investment income | | $ | 5,646 | | | $ | (14,841 | ) | | $ | 40,296 | |
| | | | | | | | | | | | |
| (a) | The inception date for the Guardian Capital Global Dividend Fund is April 14, 2014. |
| (b) | The inception date for the LMCG Emerging Markets Fund is March 28, 2013. |
| (c) | The inception date for the Pictet International Fund is April 14, 2014. |
See accompanying Notes to Financial Statements.
| | | | | | | | | | | | | | | | | | |
| | |
Pictet
International Fund | | | Harrison Street
Real Estate Fund | | | Montag & Caldwell
Balanced Fund | |
Period Ended
April 30, 2014(c)
(unaudited) | | | Six Months Ended
April 30, 2014
(unaudited) | | | Year Ended
October 31,
2013 | | | Six Months Ended
April 30, 2014
(unaudited) | | | Year Ended
October 31,
2013 | |
| | | | | | | | | | | | | | | | | | |
| $ | — | | | $ | 13,625,155 | | | $ | 10,546,604 | | | $ | 24,264,373 | | | $ | 33,466,255 | |
| | | | | | | | | | | | | | | | | | |
| | | | | | | | | | | | | | | | | | |
| | 4,090 | | | | 34,998 | | | | 186,826 | | | | 64,118 | | | | 257,113 | |
| | 1,422 | | | | 86,211 | | | | 1,055,690 | | | | 1,141,642 | | | | 2,639,428 | |
| | | | |
| | 185,129 | | | | 426,329 | | | | (505,953 | ) | | | (414,976 | ) | | | 325,469 | |
| | | | | | | | | | | | | | | | | | |
| | 190,641 | | | | 547,538 | | | | 736,563 | | | | 790,784 | | | | 3,222,010 | |
| | | | | | | | | | | | | | | | | | |
| | | | | | | | | | | | | | | | | | |
| | | | | | | | | | | | | | | | | | |
| | — | | | | (140,263 | ) | | | (162,129 | ) | | | (99,185 | ) | | | (342,684 | ) |
| | — | | | | (7,305 | ) | | | (2,875 | ) | | | (10,267 | ) | | | (24,117 | ) |
| | | | | | | | | | | | | | | | | | |
| | — | | | | — | | | | — | | | | (686,237 | ) | | | — | |
| | — | | | | — | | | | — | | | | (54,424 | ) | | | — | |
| | | | | | | | | | | | | | | | | | |
| | — | | | | (147,568 | ) | | | (165,004 | ) | | | (850,113 | ) | | | (366,801 | ) |
| | | | | | | | | | | | | | | | | | |
| | | | | | | | | | | | | | | | | | |
| | | | | | | | | | | | | | | | | | |
| | 1,000,010 | | | | 2,046,319 | | | | 10,524,296 | | | | 786,321 | | | | 2,507,724 | |
| | 9,000,010 | | | | 36,205 | | | | 375,294 | | | | 118,856 | | | | 150,496 | |
| | | | | | | | | | | | | | | | | | |
| | — | | | | 136,039 | | | | 153,598 | | | | 765,021 | | | | 333,389 | |
| | — | | | | 4,230 | | | | 1,904 | | | | 27,768 | | | | 10,537 | |
| | | | | | | | | | | | | | | | | | |
| | — | | | | (3,341,406 | ) | | | (8,524,363 | ) | | | (2,434,625 | ) | | | (14,627,334 | ) |
| | — | | | | (106,335 | ) | | | (23,833 | ) | | | (253,449 | ) | | | (431,903 | ) |
| | | | | | | | | | | | | | | | | | |
| | — | | | | — | | | | 93 | | | | — | | | | — | |
| | — | | | | — | | | | 3 | | | | — | | | | — | |
| | | | | | | | | | | | | | | | | | |
| | 10,000,020 | | | | (1,224,948 | ) | | | 2,506,992 | | | | (990,108 | ) | | | (12,057,091 | ) |
| | | | | | | | | | | | | | | | | | |
| | 10,190,661 | | | | (824,978 | ) | | | 3,078,551 | | | | (1,049,437 | ) | | | (9,201,882 | ) |
| | | | | | | | | | | | | | | | | | |
| $ | 10,190,661 | | | $ | 12,800,177 | | | $ | 13,625,155 | | | $ | 23,214,936 | | | $ | 24,264,373 | |
| | | | | | | | | | | | | | | | | | |
| $ | 4,090 | | | $ | 34,919 | | | $ | 147,489 | | | $ | (275,295 | ) | | $ | (229,961 | ) |
| | | | | | | | | | | | | | | | | | |
See accompanying Notes to Financial Statements.
| | |
| |
| ASTON/Montag & Caldwell Growth Fund – Class N | | April 30, 2014 |
| |
| Financial Highlights | | |
| | | | | | | | | | | | | | | | | | | | | | | | |
| | | Six Months
Ended
04/30/14
(unaudited) | | | Year
Ended
10/31/13 | | | Year
Ended
10/31/12 | | | Year
Ended
10/31/11 | | | Year
Ended
10/31/10 | | | Year
Ended
10/31/09 | |
Net Asset Value, Beginning of Period | | $ | 28.68 | | | $ | 25.31 | | | $ | 24.72 | | | $ | 22.92 | | | $ | 20.87 | | | $ | 18.84 | |
| | | | | | | | | | | | | | | | | | | | | | | | |
Income from Investment Operations: | | | | | | | | | | | | | | | | | | | | | | | | |
Net investment income | | | 0.05 | | | | 0.23 | (a) | | | 0.15 | (a) | | | 0.14 | (a) | | | 0.12 | (a) | | | 0.08 | (a) |
Net realized and unrealized gain on investments | | | 1.29 | | | | 5.07 | | | | 2.45 | | | | 1.83 | | | | 2.01 | (b) | | | 2.61 | |
| | | | | | | | | | | | | | | | | | | | | | | | |
Total from investment operations | | | 1.34 | | | | 5.30 | | | | 2.60 | | | | 1.97 | | | | 2.13 | | | | 2.69 | |
| | | | | | | | | | | | | | | | | | | | | | | | |
Less Distributions: | | | | | | | | | | | | | | | | | | | | | | | | |
Distributions from and in excess of net investment income | | | (0.16 | ) | | | (0.22 | ) | | | (0.13 | ) | | | (0.13 | ) | | | (0.08 | ) | | | (0.06 | ) |
Distributions from net realized gain on investments | | | (1.96 | ) | | | (1.71 | ) | | | (1.88 | ) | | | (0.04 | ) | | | — | | | | (0.60 | ) |
| | | | | | | | | | | | | | | | | | | | | | | | |
Total distributions | | | (2.12 | ) | | | (1.93 | ) | | | (2.01 | ) | | | (0.17 | ) | | | (0.08 | ) | | | (0.66 | ) |
| | | | | | | | | | | | | | | | | | | | | | | | |
Net increase (decrease) in net asset value | | | (0.78 | ) | | | 3.37 | | | | 0.59 | | | | 1.80 | | | | 2.05 | | | | 2.03 | |
| | | | | | | | | | | | | | | | | | | | | | | | |
Net Asset Value, End of Period | | $ | 27.90 | | | $ | 28.68 | | | $ | 25.31 | | | $ | 24.72 | | | $ | 22.92 | | | $ | 20.87 | |
| | | | | | | | | | | | | | | | | | | | | | | | |
Total Return (c) | | | 4.65 | %(d) | | | 22.61 | % | | | 11.40 | % | | | 8.56 | % | | | 10.20 | % | | | 15.08 | % |
| | | | | | |
Ratios/Supplemental Data: | | | | | | | | | | | | | | | | | | | | | | | | |
Net Assets, End of Period (in 000’s) | | $ | 2,052,126 | | | $ | 2,190,074 | | | $ | 1,908,663 | | | $ | 1,683,183 | | | $ | 1,506,075 | | | $ | 1,277,346 | |
Ratios of expenses to average net assets: | | | | | | | | | | | | | | | | | | | | | | | | |
Before expense reimbursement and/or fee waiver by Adviser | | | 1.03 | %(e) | | | 1.04 | % | | | 1.05 | % | | | 1.06 | % | | | 1.08 | %(f) | | | 1.11 | % |
After expense reimbursement and/or fee waiver by Adviser | | | 1.03 | %(e) | | | 1.04 | % | | | 1.05 | % | | | 1.06 | % | | | 1.08 | %(f) | | | 1.11 | % |
Ratios of net investment income to average net assets: | | | | | | | | | | | | | | | | | | | | | | | | |
Before expense reimbursement and/or fee waiver by Adviser | | | 0.38 | %(e) | | | 0.88 | % | | | 0.60 | % | | | 0.59 | % | | | 0.56 | % | | | 0.41 | % |
After expense reimbursement and/or fee waiver by Adviser | | | 0.38 | %(e) | | | 0.88 | % | | | 0.60 | % | | | 0.59 | % | | | 0.56 | % | | | 0.41 | % |
Portfolio Turnover | | | 25.49 | %(d) | | | 50.57 | % | | | 46.42 | % | | | 63.48 | % | | | 57.39 | %(g) | | | 35.09 | %(h) |
| | (a) | The selected per share data was calculated using the weighted average shares outstanding method for the period. |
| | (b) | Includes payments by affiliates of less than $0.005 per share. |
| | (c) | The total return is calculated using the Net Asset Value used for trading at the close of business at period end. |
| | (f) | Ratios of expenses to average net assets include interest expense of less than 0.005% for the year ended October 31, 2010. The interest expense is from utilizing the line of credit as discussed in Note H to the Financial Statements. |
| | (g) | Portfolio turnover rate excludes securities received from a reorganization. |
| | (h) | Portfolio turnover rate excludes securities received from processing a subscription-in-kind. |
See accompanying Notes to Financial Statements.
| | |
| |
| ASTON/Montag & Caldwell Growth Fund – Class I | | April 30, 2014 |
| |
| Financial Highlights | | |
| | | | | | | | | | | | | | | | | | | | | | | | |
| | | Six Months
Ended
04/30/14
(unaudited) | | | Year
Ended
10/31/13 | | | Year
Ended
10/31/12 | | | Year
Ended
10/31/11 | | | Year
Ended
10/31/10 | | | Year
Ended
10/31/09 | |
Net Asset Value, Beginning of Period | | $ | 28.87 | | | $ | 25.46 | | | $ | 24.85 | | | $ | 23.05 | | | $ | 20.97 | | | $ | 18.94 | |
| | | | | | | | | | | | | | | | | | | | | | | | |
Income from Investment Operations: | | | | | | | | | | | | | | | | | | | | | | | | |
Net investment income | | | 0.10 | | | | 0.30 | (a) | | | 0.21 | (a) | | | 0.21 | (a) | | | 0.18 | (a) | | | 0.12 | (a) |
Net realized and unrealized gain on investments | | | 1.29 | | | | 5.10 | | | | 2.47 | | | | 1.82 | | | | 2.02 | (b) | | | 2.62 | |
| | | | | | | | | | | | | | | | | | | | | | | | |
Total from investment operations | | | 1.39 | | | | 5.40 | | | | 2.68 | | | | 2.03 | | | | 2.20 | | | | 2.74 | |
| | | | | | | | | | | | | | | | | | | | | | | | |
Less Distributions: | | | | | | | | | | | | | | | | | | | | | | | | |
Distributions from and in excess of net investment income | | | (0.24 | ) | | | (0.28 | ) | | | (0.19 | ) | | | (0.19 | ) | | | (0.12 | ) | | | (0.11 | ) |
Distributions from net realized gain on investments | | | (1.96 | ) | | | (1.71 | ) | | | (1.88 | ) | | | (0.04 | ) | | | — | | | | (0.60 | ) |
| | | | | | | | | | | | | | | | | | | | | | | | |
Total distributions | | | (2.20 | ) | | | (1.99 | ) | | | (2.07 | ) | | | (0.23 | ) | | | (0.12 | ) | | | (0.71 | ) |
| | | | | | | | | | | | | | | | | | | | | | | | |
Net increase (decrease) in net asset value | | | (0.81 | ) | | | 3.41 | | | | 0.61 | | | | 1.80 | | | | 2.08 | | | | 2.03 | |
| | | | | | | | | | | | | | | | | | | | | | | | |
Net Asset Value, End of Period | | $ | 28.06 | | | $ | 28.87 | | | $ | 25.46 | | | $ | 24.85 | | | $ | 23.05 | | | $ | 20.97 | |
| | | | | | | | | | | | | | | | | | | | | | | | |
Total Return (c) | | | 4.76 | %(d) | | | 22.95 | % | | | 11.67 | % | | | 8.82 | % | | | 10.49 | % | | | 15.36 | % |
| | | | | | |
Ratios/Supplemental Data: | | | | | | | | | | | | | | | | | | | | | | | | |
Net Assets, End of Period (in 000’s) | | $ | 2,735,728 | | | $ | 3,035,623 | | | $ | 2,406,145 | | | $ | 1,749,183 | | | $ | 1,528,981 | | | $ | 1,205,637 | |
Ratios of expenses to average net assets: | | | | | | | | | | | | | | | | | | | | | | | | |
Before expense reimbursement and/or fee waiver by Adviser | | | 0.78 | %(e) | | | 0.79 | % | | | 0.80 | % | | | 0.81 | % | | | 0.83 | %(f) | | | 0.86 | % |
After expense reimbursement and/or fee waiver by Adviser | | | 0.78 | %(e) | | | 0.79 | % | | | 0.80 | % | | | 0.81 | % | | | 0.83 | %(f) | | | 0.86 | % |
Ratios of net investment income to average net assets: | | | | | | | | | | | | | | | | | | | | | | | | |
Before expense reimbursement and/or fee waiver by Adviser | | | 0.63 | %(e) | | | 1.13 | % | | | 0.85 | % | | | 0.84 | % | | | 0.81 | % | | | 0.66 | % |
After expense reimbursement and/or fee waiver by Adviser | | | 0.63 | %(e) | | | 1.13 | % | | | 0.85 | % | | | 0.84 | % | | | 0.81 | % | | | 0.66 | % |
Portfolio Turnover | | | 25.49 | %(d) | | | 50.57 | % | | | 46.42 | % | | | 63.48 | % | | | 57.39 | %(g) | | | 35.09 | %(h) |
| | (a) | The selected per share data was calculated using the weighted average shares outstanding method for the period. |
| | (b) | Includes payments by affiliates of less than $0.005 per share. |
| | (c) | The total return is calculated using the Net Asset Value used for trading at the close of business at period end. |
| | (f) | Ratios of expenses to average net assets include interest expense of less than 0.005% for the year ended October 31, 2010. The interest expense is from utilizing the line of credit as discussed in Note H to the Financial Statements. |
| | (g) | Portfolio turnover rate excludes securities received from a reorganization. |
| | (h) | Portfolio turnover rate excludes securities received from processing a subscription-in-kind. |
See accompanying Notes to Financial Statements.
| | |
| |
| ASTON/Montag & Caldwell Growth Fund – Class R | | April 30, 2014 |
| |
| Financial Highlights | | |
| | | | | | | | | | | | | | | | | | | | | | | | |
| | | Six Months
Ended
04/30/14
(unaudited) | | | Year
Ended
10/31/13 | | | Year
Ended
10/31/12 | | | Year
Ended
10/31/11 | | | Year
Ended
10/31/10 | | | Year
Ended
10/31/09 | |
Net Asset Value, Beginning of Period | | $ | 28.33 | | | $ | 25.02 | | | $ | 24.45 | | | $ | 22.70 | | | $ | 20.73 | | | $ | 18.69 | |
| | | | | | | | | | | | | | | | | | | | | | | | |
Income from Investment Operations: | | | | | | | | | | | | | | | | | | | | | | | | |
Net investment income | | | 0.02 | | | | 0.16 | (a) | | | 0.09 | (a) | | | 0.08 | (a) | | | 0.07 | (a) | | | 0.03 | (a) |
Net realized and unrealized gain on investments | | | 1.28 | | | | 5.01 | | | | 2.43 | | | | 1.80 | | | | 1.98 | (b) | | | 2.61 | |
| | | | | | | | | | | | | | | | | | | | | | | | |
Total from investment operations | | | 1.30 | | | | 5.17 | | | | 2.52 | | | | 1.88 | | | | 2.05 | | | | 2.64 | |
| | | | | | | | | | | | | | | | | | | | | | | | |
Less Distributions: | | | | | | | | | | | | | | | | | | | | | | | | |
Distributions from and in excess of net investment income | | | (0.10 | ) | | | (0.15 | ) | | | (0.07 | ) | | | (0.09 | ) | | | (0.08 | ) | | | — | |
Distributions from net realized gain on investments | | | (1.96 | ) | | | (1.71 | ) | | | (1.88 | ) | | | (0.04 | ) | | | — | | | | (0.60 | ) |
| | | | | | | | | | | | | | | | | | | | | | | | |
Total distributions | | | (2.06 | ) | | | (1.86 | ) | | | (1.95 | ) | | | (0.13 | ) | | | (0.08 | ) | | | (0.60 | ) |
| | | | | | | | | | | | | | | | | | | | | | | | |
Net increase (decrease) in net asset value | | | (0.76 | ) | | | 3.31 | | | | 0.57 | | | | 1.75 | | | | 1.97 | | | | 2.04 | |
| | | | | | | | | | | | | | | | | | | | | | | | |
Net Asset Value, End of Period | | $ | 27.57 | | | $ | 28.33 | | | $ | 25.02 | | | $ | 24.45 | | | $ | 22.70 | | | $ | 20.73 | |
| | | | | | | | | | | | | | | | | | | | | | | | |
Total Return (c) | | | 4.52 | %(d) | | | 22.30 | % | | | 11.10 | % | | | 8.29 | % | | | 9.90 | % | | | 14.87 | % |
| | | | | | |
Ratios/Supplemental Data: | | | | | | | | | | | | | | | | | | | | | | | | |
Net Assets, End of Period (in 000’s) | | $ | 9,672 | | | $ | 10,099 | | | $ | 8,771 | | | $ | 8,654 | | | $ | 7,292 | | | $ | 3,840 | |
Ratios of expenses to average net assets: | | | | | | | | | | | | | | | | | | | | | | | | |
Before expense reimbursement and/or fee waiver by Adviser | | | 1.28 | %(e) | | | 1.29 | % | | | 1.30 | % | | | 1.31 | % | | | 1.33 | %(f) | | | 1.36 | % |
After expense reimbursement and/or fee waiver
by Adviser | | | 1.28 | %(e) | | | 1.29 | % | | | 1.30 | % | | | 1.31 | % | | | 1.33 | %(f) | | | 1.36 | % |
Ratios of net investment income to average net assets: | | | | | | | | | | | | | | | | | | | | | | | | |
Before expense reimbursement and/or fee waiver by Adviser | | | 0.13 | %(e) | | | 0.63 | % | | | 0.35 | % | | | 0.34 | % | | | 0.31 | % | | | 0.16 | % |
After expense reimbursement and/or fee waiver
by Adviser | | | 0.13 | %(e) | | | 0.63 | % | | | 0.35 | % | | | 0.34 | % | | | 0.31 | % | | | 0.16 | % |
Portfolio Turnover | | | 25.49 | %(d) | | | 50.57 | % | | | 46.42 | % | | | 63.48 | % | | | 57.39 | %(g) | | | 35.09 | %(h) |
| | (a) | The selected per share data was calculated using the weighted average shares outstanding method for the period. |
| | (b) | Includes payments by affiliates of less than $0.005 per share. |
| | (c) | The total return is calculated using the Net Asset Value used for trading at the close of business at period end. |
| | (f) | Ratios of expenses to average net assets include interest expense of less than 0.005% for the year ended October 31, 2010. The interest expense is from utilizing the line of credit as discussed in Note H to the Financial Statements. |
| | (g) | Portfolio turnover rate excludes securities received from a reorganization. |
| | (h) | Portfolio turnover rate excludes securities received from processing a subscription-in-kind. |
See accompanying Notes to Financial Statements.
| | |
| |
| ASTON/TAMRO Diversified Equity Fund – Class N | | April 30, 2014 |
| |
| Financial Highlights | | |
| | | | | | | | | | | | | | | | | | | | | | | | |
| | | Six Months
Ended
04/30/14
(unaudited) | | | Year
Ended
10/31/13 | | | Year
Ended
10/31/12 | | | Year
Ended
10/31/11 | | | Year
Ended
10/31/10 | | | Year
Ended
10/31/09 | |
Net Asset Value, Beginning of Period | | $ | 16.75 | | | $ | 13.52 | | | $ | 12.34 | | | $ | 11.83 | | | $ | 9.72 | | | $ | 8.34 | |
| | | | | | | | | | | | | | | | | | | | | | | | |
Income from Investment Operations: | | | | | | | | | | | | | | | | | | | | | | | | |
Net investment income (loss) | | | (0.04 | ) | | | 0.01 | (a) | | | — | (b) | | | (0.02 | ) | | | — | (b) | | | — | (b) |
Net realized and unrealized gain on investments | | | 1.07 | | | | 3.27 | | | | 1.44 | | | | 0.53 | | | | 2.13 | | | | 1.42 | |
| | | | | | | | | | | | | | | | | | | | | | | | |
Total from investment operations | | | 1.03 | | | | 3.28 | | | | 1.44 | | | | 0.51 | | | | 2.13 | | | | 1.42 | |
| | | | | | | | | | | | | | | | | | | | | | | | |
Less Distributions: | | | | | | | | | | | | | | | | | | | | | | | | |
Distributions from and in excess of net investment income | | | — | | | | (0.03 | ) | | | — | | | | — | | | | (0.02 | ) | | | (0.04 | ) |
Distributions from net realized gain on investments | | | (0.50 | ) | | | (0.02 | ) | | | (0.26 | ) | | | — | | | | — | | | | — | |
| | | | | | | | | | | | | | | | | | | | | | | | |
Total distributions | | | (0.50 | ) | | | (0.05 | ) | | | (0.26 | ) | | | — | | | | (0.02 | ) | | | (0.04 | ) |
| | | | | | | | | | | | | | | | | | | | | | | | |
Net increase in net asset value . | | | 0.53 | | | | 3.23 | | | | 1.18 | | | | 0.51 | | | | 2.11 | | | | 1.38 | |
| | | | | | | | | | | | | | | | | | | | | | | | |
Net Asset Value, End of Period | | $ | 17.28 | | | $ | 16.75 | | | $ | 13.52 | | | $ | 12.34 | | | $ | 11.83 | | | $ | 9.72 | |
| | | | | | | | | | | | | | | | | | | | | | | | |
Total Return (c) | | | 6.19 | %(d) | | | 24.29 | % | | | 11.94 | % | | | 4.31 | % | | | 21.95 | % | | | 17.13 | % |
| | | | | | |
Ratios/Supplemental Data: | | | | | | | | | | | | | | | | | | | | | | | | |
Net Assets, End of Period (in 000’s) | | $ | 26,431 | | | $ | 26,797 | | | $ | 21,980 | | | $ | 24,354 | | | $ | 15,670 | | | $ | 10,486 | |
Ratios of expenses to average net assets: | | | | | | | | | | | | | | | | | | | | | | | | |
Before expense reimbursement and/or fee waiver
by Adviser | | | 1.37 | %(e) | | | 1.46 | % | | | 1.68 | %(f) | | | 1.62 | %(f) | | | 1.63 | % | | | 1.95 | % |
After expense reimbursement and/or fee waiver
by Adviser | | | 1.20 | %(e) | | | 1.20 | % | | | 1.20 | %(f) | | | 1.20 | %(f) | | | 1.20 | % | | | 1.20 | % |
Ratios of net investment income (loss) to average net assets: | | | | | | | | | | | | | | | | | | | | | | | | |
Before expense reimbursement and/or fee waiver
by Adviser | | | (0.61 | )%(e) | | | (0.19 | )% | | | (0.47 | )% | | | (0.63 | )% | | | (0.45 | )% | | | (0.77 | )% |
After expense reimbursement and/or fee waiver
by Adviser | | | (0.44 | )%(e) | | | 0.07 | % | | | — | %(b) | | | (0.21 | )% | | | (0.02 | )% | | | (0.02 | )% |
Portfolio Turnover | | | 26.06 | %(d) | | | 79.61 | % | | | 52.56 | % | | | 65.96 | % | | | 81.75 | % | | | 85.49 | % |
| | (a) | The selected per share data was calculated using the weighted average shares outstanding method for the period. |
| | (b) | Represents less than $(0.005) per share or less than (0.005)%. |
| | (c) | The total return is calculated using the Net Asset Value used for trading at the close of business at period end. |
| | (f) | Ratios of expenses to average net assets include interest expenses of less than 0.005% for each of the years ended October 31, 2012 and October 31, 2011, which are not included in the contractual expense limitation. The interest expense is from utilizing the line of credit as discussed in Note H to the Financial Statements. |
See accompanying Notes to Financial Statements.
| | |
| |
| ASTON/TAMRO Diversified Equity Fund – Class I | | April 30, 2014 |
| |
| Financial Highlights | | |
| | | | | | | | | | | | |
| | | Six Months
Ended
04/30/14
(unaudited) | | | Year
Ended
10/31/13 | | | Period
Ended
10/31/12(a) | |
Net Asset Value, Beginning of Period | | $ | 16.78 | | | $ | 13.55 | | | $ | 13.27 | |
| | | | | | | | | | | | |
Income from Investment Operations: | | | | | | | | | | | | |
Net investment income (loss) | | | (0.02 | ) | | | 0.05 | (b) | | | (0.05 | ) |
Net realized and unrealized gain on investments | | | 1.07 | | | | 3.26 | | | | 0.33 | |
| | | | | | | | | | | | |
Total from investment operations | | | 1.05 | | | | 3.31 | | | | 0.28 | |
| | | | | | | | | | | | |
Less Distributions: | | | | | | | | | | | | |
Distributions from and in excess of net investment income | | | (0.01 | ) | | | (0.06 | ) | | | — | |
Distributions from net realized gain on investments | | | (0.50 | ) | | | (0.02 | ) | | | — | |
| | | | | | | | | | | | |
Total Distributions | | | (0.51 | ) | | | (0.08 | ) | | | — | |
| | | | | | | | | | | | |
Net increase in net asset value | | | 0.54 | | | | 3.23 | | | | 0.28 | |
| | | | | | | | | | | | |
Net Asset Value, End of Period | | $ | 17.32 | | | $ | 16.78 | | | $ | 13.55 | |
| | | | | | | | | | | | |
Total Return (c) | | | 6.38 | %(d) | | | 24.64 | % | | | 2.04 | %(d) |
| | | |
Ratios/Supplemental Data: | | | | | | | | | | | | |
Net Assets, End of Period (in 000’s) | | $ | 28,766 | | | $ | 28,880 | | | $ | 569 | |
Ratios of expenses to average net assets: | | | | | | | | | | | | |
Before expense reimbursement and/or fee waiver by Adviser | | | 1.12 | %(e) | | | 1.21 | % | | | 1.45 | %(e)(f) |
After expense reimbursement and/or fee waiver by Adviser | | | 0.95 | %(e) | | | 0.95 | % | | | 0.95 | %(e)(f) |
Ratios of net investment income (loss) to average net assets: | | | | | | | | | | | | |
Before expense reimbursement and/or fee waiver by Adviser | | | (0.36 | )%(e) | | | 0.06 | % | | | (1.11 | )%(e) |
After expense reimbursement and/or fee waiver by Adviser | | | (0.19 | )%(e) | | | 0.32 | % | | | (0.61 | )%(e) |
Portfolio Turnover | | | 26.06 | %(d) | | | 79.61 | % | | | 52.56 | %(d) |
| | (a) | The inception date for the TAMRO Diversified Equity Fund Class I shares is March 2, 2012. |
| | (b) | The selected per share data was calculated using the weighted average shares outstanding method for the period. |
| | (c) | The total return is calculated using the Net Asset Value used for trading at the close of business at period end. |
| | (f) | Ratios of expenses to average net assets include interest expense of less than 0.005% for the period ended October 31, 2012, which is not included in the contractual expense limitation. The interest expense is from utilizing the line of credit as discussed in Note H to the Financial Statements. |
See accompanying Notes to Financial Statements.
| | |
| |
| ASTON/Herndon Large Cap Value Fund – Class N | | April 30, 2014 |
| |
| Financial Highlights | | |
| | | | | | | | | | | | | | | | | | | | |
| | | Six Months
Ended
04/30/14
(unaudited) | | | Year
Ended
10/31/13 | | | Year
Ended
10/31/12 | | | Year
Ended
10/31/11 | | | Period
Ended
10/31/10(a) | |
Net Asset Value, Beginning of Period | | $ | 13.84 | | | $ | 11.73 | | | $ | 11.31 | | | $ | 10.39 | | | $ | 10.00 | |
| | | | | | | | | | | | | | | | | | | | |
Income from Investment Operations: | | | | | | | | | | | | | | | | | | | | |
Net investment income | | | 0.07 | | | | 0.15 | (b) | | | 0.18 | (b) | | | 0.12 | (b) | | | 0.03 | |
Net realized and unrealized gain on investments | | | 1.27 | | | | 2.40 | | | | 0.91 | | | | 0.81 | | | | 0.36 | |
| | | | | | | | | | | | | | | | | | | | |
Total from investment operations | | | 1.34 | | | | 2.55 | | | | 1.09 | | | | 0.93 | | | | 0.39 | |
| | | | | | | | | | | | | | | | | | | | |
Less Distributions: | | | | | | | | | | | | | | | | | | | | |
Distributions from and in excess of net investment income | | | (0.10 | ) | | | (0.22 | ) | | | (0.11 | ) | | | (0.01 | ) | | | — | |
Distributions from net realized gain on investments | | | (0.26 | ) | | | (0.22 | ) | | | (0.56 | ) | | | — | | | | — | |
| | | | | | | | | | | | | | | | | | | | |
Total distributions | | | (0.36 | ) | | | (0.44 | ) | | | (0.67 | ) | | | (0.01 | ) | | | — | |
| | | | | | | | | | | | | | | | | | | | |
Net increase in net asset value | | | 0.98 | | | | 2.11 | | | | 0.42 | | | | 0.92 | | | | 0.39 | |
| | | | | | | | | | | | | | | | | | | | |
Net Asset Value, End of Period | | $ | 14.82 | | | $ | 13.84 | | | $ | 11.73 | | | $ | 11.31 | | | $ | 10.39 | |
| | | | | | | | | | | | | | | | | | | | |
Total Return (c) | | | 9.75 | %(d) | | | 22.58 | % | | | 10.39 | % | | | 9.09 | % | | | 3.90 | %(d) |
| | | | | |
Ratios/Supplemental Data: | | | | | | | | | | | | | | | | | | | | |
Net Assets, End of Period (in 000’s) | | $ | 49,335 | | | $ | 41,861 | | | $ | 20,832 | | | $ | 6,089 | | | $ | 1,472 | |
Ratios of expenses to average net assets: | | | | | | | | | | | | | | | | | | | | |
Before expense reimbursement and/or fee waiver, or recoupment by Adviser | | | 1.23 | %(e) | | | 1.27 | % | | | 1.41 | % | | | 2.38 | % | | | 13.84 | %(e) |
After expense reimbursement and/or fee waiver, or recoupment by Adviser | | | 1.30 | %(e) | | | 1.30 | % | | | 1.30 | % | | | 1.30 | % | | | 1.30 | %(e) |
Ratios of net investment income (loss) to average net assets: | | | | | | | | | | | | | | | | | | | | |
Before expense reimbursement and/or fee waiver, or recoupment by Adviser | | | 1.03 | %(e) | | | 1.24 | % | | | 1.44 | % | | | (0.05 | )% | | | (11.94 | )%(e) |
After expense reimbursement and/or fee waiver, or recoupment by Adviser | | | 0.96 | %(e) | | | 1.21 | % | | | 1.55 | % | | | 1.03 | % | | | 0.60 | %(e) |
Portfolio Turnover | | | 28.62 | %(d) | | | 69.51 | % | | | 80.56 | % | | | 189.70 | % | | | 38.64 | %(d) |
| | (a) | The inception date for the Herndon Large Cap Value Fund Class N shares is March 31, 2010. |
| | (b) | The selected per share data was calculated using the weighted average shares outstanding method for the period. |
| | (c) | The total return is calculated using the Net Asset Value used for trading at the close of business at period end. |
See accompanying Notes to Financial Statements.
| | |
| |
| ASTON/Herndon Large Cap Value Fund – Class I | | April 30, 2014 |
| |
| Financial Highlights | | |
| | | | | | | | | | | | | | | | |
| | | Six Months
Ended
04/30/14
(unaudited) | | | Year
Ended
10/31/13 | | | Year
Ended
10/31/12 | | | Period
Ended
10/31/11(a) | |
Net Asset Value, Beginning of Period | | $ | 13.87 | | | $ | 11.75 | | | $ | 11.33 | | | $ | 11.48 | |
| | | | | | | | | | | | | | | | |
Income from Investment Operations: | | | | | | | | | | | | | | | | |
Net investment income | | | 0.08 | | | | 0.19 | (b) | | | 0.21 | (b) | | | 0.10 | (b) |
Net realized and unrealized gain (loss) on investments | | | 1.27 | | | | 2.39 | | | | 0.91 | | | | (0.25 | ) |
| | | | | | | | | | | | | | | | |
Total from investment operations | | | 1.35 | | | | 2.58 | | | | 1.12 | | | | (0.15 | ) |
| | | | | | | | | | | | | | | | |
Less Distributions: | | | | | | | | | | | | | | | | |
Distributions from and in excess of net investment income | | | (0.12 | ) | | | (0.24 | ) | | | (0.14 | ) | | | — | |
Distributions from net realized gain on investments | | | (0.26 | ) | | | (0.22 | ) | | | (0.56 | ) | | | — | |
| | | | | | | | | | | | | | | | |
Total distributions | | | (0.38 | ) | | | (0.46 | ) | | | (0.70 | ) | | | — | |
| | | | | | | | | | | | | | | | |
Net increase (decrease) in net asset value | | | 0.97 | | | | 2.12 | | | | 0.42 | | | | (0.15 | ) |
| | | | | | | | | | | | | | | | |
Net Asset Value, End of Period | | $ | 14.84 | | | $ | 13.87 | | | $ | 11.75 | | | $ | 11.33 | |
| | | | | | | | | | | | | | | | |
Total Return (c) | | | 9.87 | %(d) | | | 22.94 | % | | | 10.69 | % | | | (1.31 | )%(d) |
| | | | |
Ratios/Supplemental Data: | | | | | | | | | | | | | | | | |
Net Assets, End of Period (in 000’s) | | $ | 97,813 | | | $ | 80,534 | | | $ | 34,575 | | | $ | 11,881 | |
Ratios of expenses to average net assets: | | | | | | | | | | | | | | | | |
Before expense reimbursement and/or fee waiver, or recoupment by Adviser | | | 0.98 | %(e) | | | 1.02 | % | | | 1.16 | % | | | 2.13 | %(e) |
After expense reimbursement and/or fee waiver, or recoupment by Adviser | | | 1.05 | %(e) | | | 1.05 | % | | | 1.05 | % | | | 1.05 | %(e) |
Ratios of net investment income to average net assets: | | | | | | | | | | | | | | | | |
Before expense reimbursement and/or fee waiver, or recoupment by Adviser | | | 1.28 | %(e) | | | 1.49 | % | | | 1.69 | % | | | 0.20 | %(e) |
After expense reimbursement and/or fee waiver, or recoupment by Adviser | | | 1.21 | %(e) | | | 1.46 | % | | | 1.80 | % | | | 1.28 | %(e) |
Portfolio Turnover | | | 28.62 | %(d) | | | 69.51 | % | | | 80.56 | % | | | 189.70 | %(d) |
| | (a) | The inception date for the Herndon Large Cap Value Fund Class I shares is March 2, 2011. |
| | (b) | The selected per share data was calculated using the weighted average shares outstanding method for the period. |
| | (c) | The total return is calculated using the Net Asset Value used for trading at the close of business at period end. |
See accompanying Notes to Financial Statements.
| | |
| |
| ASTON/Cornerstone Large Cap Value Fund – Class N | | April 30, 2014 |
| |
| Financial Highlights | | |
| | | | | | | | | | | | | | | | | | | | | | | | |
| | | Six Months
Ended
04/30/14
(unaudited) | | | Year
Ended
10/31/13 | | | Year
Ended
10/31/12 | | | Year
Ended
10/31/11 | | | Year
Ended
10/31/10 | | | Year
Ended
10/31/09 | |
Net Asset Value, Beginning of Period | | $ | 13.74 | | | $ | 11.04 | | | $ | 10.04 | | | $ | 9.20 | | | $ | 8.31 | | | $ | 9.07 | |
| | | | | | | | | | | | | | | | | | | | | | | | |
Income from Investment Operations: | | | | | | | | | | | | | | | | | | | | | | | | |
Net investment income | | | 0.04 | | | | 0.09 | (a) | | | 0.10 | (a) | | | 0.12 | (a) | | | 0.13 | | | | 0.15 | |
Net realized and unrealized gain on investments | | | 1.15 | | | | 2.72 | | | | 0.94 | | | | 0.83 | | | | 0.89 | | | | 0.41 | |
| | | | | | | | | | | | | | | | | | | | | | | | |
Total from investment operations | | | 1.19 | | | | 2.81 | | | | 1.04 | | | | 0.95 | | | | 1.02 | | | | 0.56 | |
| | | | | | | | | | | | | | | | | | | | | | | | |
Less Distributions: | | | | | | | | | | | | | | | | | | | | | | | | |
Distributions from and in excess of net investment income | | | (0.06 | ) | | | (0.11 | ) | | | (0.04 | ) | | | (0.11 | ) | | | (0.13 | ) | | | (0.15 | ) |
Distributions from net realized gain on
investments | | | — | | | | — | | | | — | | | | — | | | | — | | | | (1.17 | ) |
| | | | | | | | | | | | | | | | | | | | | | | | |
Total distributions | | | (0.06 | ) | | | (0.11 | ) | | | (0.04 | ) | | | (0.11 | ) | | | (0.13 | ) | | | (1.32 | ) |
| | | | | | | | | | | | | | | | | | | | | | | | |
Net increase (decrease) in net asset value | | | 1.13 | | | | 2.70 | | | | 1.00 | | | | 0.84 | | | | 0.89 | | | | (0.76 | ) |
| | | | | | | | | | | | | | | | | | | | | | | | |
Net Asset Value, End of Period | | $ | 14.87 | | | $ | 13.74 | | | $ | 11.04 | | | $ | 10.04 | | | $ | 9.20 | | | $ | 8.31 | |
| | | | | | | | | | | | | | | | | | | | | | | | |
Total Return (b) | | | 8.67 | %(c) | | | 25.72 | % | | | 10.43 | % | | | 10.44 | % | | | 12.37 | % | | | 8.60 | % |
| | | | | | |
Ratios/Supplemental Data: | | | | | | | | | | | | | | | | | | | | | | | | |
Net Assets, End of Period (in 000’s) | | $ | 21,406 | | | $ | 23,913 | | | $ | 21,105 | | | $ | 24,631 | | | $ | 19,984 | | | $ | 20,173 | |
Ratios of expenses to average net assets: | | | | | | | | | | | | | | | | | | | | | | | | |
Before expense reimbursement and/or fee waiver by Adviser | | | 1.35 | %(d) | | | 1.48 | % | | | 1.58 | % | | | 1.61 | % | | | 1.19 | %(f) | | | 1.21 | % |
After expense reimbursement and/or fee waiver by Adviser | | | 1.30 | %(d) | | | 1.30 | % | | | 1.26 | %(e) | | | 1.14 | %(e) | | | 1.07 | %(f) | | | 1.07 | %(g) |
Ratios of net investment income to average net assets: | | | | | | | | | | | | | | | | | | | | | | | | |
Before expense reimbursement and/or fee waiver by Adviser | | | 0.51 | %(d) | | | 0.53 | % | | | 0.60 | % | | | 0.80 | % | | | 1.32 | % | | | 1.77 | % |
After expense reimbursement and/or fee waiver by Adviser | | | 0.56 | %(d) | | | 0.71 | % | | | 0.92 | % | | | 1.27 | % | | | 1.44 | % | | | 1.91 | % |
Portfolio Turnover | | | 13.17 | %(c) | | | 58.24 | % | | | 58.21 | % | | | 59.07 | %(h) | | | 37.44 | % | | | 39.00 | % |
| | (a) | The selected per share data was calculated using the weighted average shares outstanding method for the period. |
| | (b) | The total return is calculated using the Net Asset Value used for trading at the close of business at period end. |
| | (e) | Effective March 22, 2011, the Adviser changed the voluntary expense limitation from 1.07% to 1.19%. Subsequently, on February 29, 2012, the Adviser removed the voluntary expense limitation and replaced it with a contractual expense limitation of 1.30%. |
| | (f) | Ratios of expenses to average net assets include interest expense of less than 0.005% for the year ended October 31, 2010, which is not included in the contractual expense limitation. The interest expense is from utilizing the line of credit, as discussed in Note H to the Financial Statements. |
| | (g) | The contractual expense limitation of 1.07%, which excludes interest, taxes, investment-related costs (such as brokerage commissions), extraordinary expenses and acquired fund fees and expenses, was removed by the Adviser and replaced with a voluntary expense limitation of 1.07% effective March 1, 2009. Voluntary expense waivers can be terminated by the Adviser at any time. |
| | (h) | Portfolio turnover rate excludes securities delivered from processing a redemption-in-kind. |
See accompanying Notes to Financial Statements.
| | |
| |
| ASTON/Cornerstone Large Cap Value Fund – Class I | | April 30, 2014 |
| |
| Financial Highlights | | |
| | | | | | | | | | | | | | | | | | | | | | | | |
| | | Six Months
Ended
04/30/14
(unaudited) | | | Year
Ended
10/31/13 | | | Year
Ended
10/31/12 | | | Year
Ended
10/31/11 | | | Year
Ended
10/31/10 | | | Year
Ended
10/31/09 | |
Net Asset Value, Beginning of Period | | $ | 13.78 | | | $ | 11.07 | | | $ | 10.05 | | | $ | 9.19 | | | $ | 8.31 | | | $ | 9.06 | |
| | | | | | | | | | | | | | | | | | | | | | | | |
Income from Investment Operations: | | | | | | | | | | | | | | | | | | | | | | | | |
Net investment income | | | 0.06 | | | | 0.12 | (a) | | | 0.11 | (a) | | | 0.16 | (a) | | | 0.15 | | | | 0.17 | |
Net realized and unrealized gain on investments | | | 1.13 | | | | 2.73 | | | | 0.96 | | | | 0.84 | | | | 0.88 | | | | 0.42 | |
| | | | | | | | | | | | | | | | | | | | | | | | |
Total from investment operations | | | 1.19 | | | | 2.85 | | | | 1.07 | | | | 1.00 | | | | 1.03 | | | | 0.59 | |
| | | | | | | | | | | | | | | | | | | | | | | | |
Less Distributions: | | | | | | | | | | | | | | | | | | | | | | | | |
Distributions from and in excess of net investment income | | | (0.09 | ) | | | (0.14 | ) | | | (0.05 | ) | | | (0.14 | ) | | | (0.15 | ) | | | (0.17 | ) |
Distributions from net realized gain on
investments | | | — | | | | — | | | | — | | | | — | | | | — | | | | (1.17 | ) |
| | | | | | | | | | | | | | | | | | | | | | | | |
Total distributions | | | (0.09 | ) | | | (0.14 | ) | | | (0.05 | ) | | | (0.14 | ) | | | (0.15 | ) | | | (1.34 | ) |
| | | | | | | | | | | | | | | | | | | | | | | | |
Net increase (decrease) in net asset value | | | 1.10 | | | | 2.71 | | | | 1.02 | | | | 0.86 | | | | 0.88 | | | | (0.75 | ) |
| | | | | | | | | | | | | | | | | | | | | | | | |
Net Asset Value, End of Period | | $ | 14.88 | | | $ | 13.78 | | | $ | 11.07 | | | $ | 10.05 | | | $ | 9.19 | | | $ | 8.31 | |
| | | | | | | | | | | | | | | | | | | | | | | | |
Total Return (b) | | | 8.68 | %(c) | | | 26.08 | % | | | 10.66 | % | | | 10.95 | % | | | 12.53 | % | | | 9.01 | % |
| | | | | | |
Ratios/Supplemental Data: | | | | | | | | | | | | | | | | | | | | | | | | |
Net Assets, End of Period (in 000’s) | | $ | 87,732 | | | $ | 38,735 | | | $ | 5,397 | | | $ | 126 | | | $ | 204,051 | | | $ | 205,580 | |
Ratios of expenses to average net assets: | | | | | | | | | | | | | | | | | | | | | | | | |
Before expense reimbursement and/or fee waiver by Adviser | | | 1.10 | %(d) | | | 1.23 | % | | | 1.33 | % | | | 1.36 | % | | | 0.94 | %(f) | | | 0.96 | % |
After expense reimbursement and/or fee waiver by Adviser | | | 1.05 | %(d) | | | 1.05 | % | | | 1.01 | %(e) | | | 0.89 | %(e) | | | 0.82 | %(f) | | | 0.82 | %(g) |
Ratios of net investment income to average net assets: | | | | | | | | | | | | | | | | | | | | | | | | |
Before expense reimbursement and/or fee waiver by Adviser | | | 0.76 | %(d) | | | 0.78 | % | | | 0.85 | % | | | 1.05 | % | | | 1.57 | % | | | 2.02 | % |
After expense reimbursement and/or fee waiver by Adviser | | | 0.81 | %(d) | | | 0.96 | % | | | 1.17 | % | | | 1.52 | % | | | 1.69 | % | | | 2.16 | % |
Portfolio Turnover | | | 13.17 | %(c) | | | 58.24 | % | | | 58.21 | % | | | 59.07 | %(h) | | | 37.44 | % | | | 39.00 | % |
| | (a) | The selected per share data was calculated using the weighted average shares outstanding method for the period. |
| | (b) | The total return is calculated using the Net Asset Value used for trading at the close of business at period end. |
| | (e) | Effective March 22, 2011, the Adviser changed the voluntary expense limitation from 0.82% to 0.94%. Subsequently, on February 29, 2012, the Adviser removed the voluntary expense limitation and replaced it with a contractual expense limitation of 1.05%. |
| | (f) | Ratios of expense to average net assets included interest expense of less than 0.005% for the year ended October 31, 2010, which is not included in the contractual expense limitation. The interest expense is from utilizing the line of credit, as discussed in Note H to the Financial Statements. |
| | (g) | The contractual expense limitation of 0.82%, which excludes interest, taxes, investment-related costs (such as brokerage commissions), extraordinary expenses and acquired fund fees and expenses, was removed by the Adviser and replaced with a voluntary expense limitation of 0.82% effective March 1, 2009. Voluntary expense waivers can be terminated by the Adviser at any time. |
| | (h) | Portfolio turnover rate excludes securities delivered from processing a redemption-in-kind. |
See accompanying Notes to Financial Statements.
| | |
| |
| ASTON/River Road Dividend All Cap Value Fund – Class N | | April 30, 2014 |
| |
| Financial Highlights | | |
| | | | | | | | | | | | | | | | | | | | | | | | |
| | | Six Months
Ended
04/30/14
(unaudited) | | | Year
Ended
10/31/13 | | | Year
Ended
10/31/12 | | | Year
Ended
10/31/11 | | | Year
Ended
10/31/10 | | | Year
Ended
10/31/09 | |
Net Asset Value, Beginning of Period | | $ | 13.99 | | | $ | 11.67 | | | $ | 10.68 | | | $ | 10.23 | | | $ | 8.58 | | | $ | 8.43 | |
| | | | | | | | | | | | | | | | | | | | | | | | |
Income from Investment Operations: | | | | | | | | | | | | | | | | | | | | | | | | |
Net investment income | | | 0.26 | | | | 0.30 | | | | 0.31 | (a) | | | 0.29 | (a) | | | 0.26 | (a) | | | 0.26 | (a) |
Net realized and unrealized gain on investments | | | 0.28 | | | | 2.73 | | | | 1.05 | | | | 0.42 | | | | 1.62 | | | | 0.08 | |
| | | | | | | | | | | | | | | | | | | | | | | | |
Total from investment operations | | | 0.54 | | | | 3.03 | | | | 1.36 | | | | 0.71 | | | | 1.88 | | | | 0.34 | |
| | | | | | | | | | | | | | | | | | | | | | | | |
Less Distributions: | | | | | | | | | | | | | | | | | | | | | | | | |
Distributions from and in excess of net investment income | | | (0.19 | ) | | | (0.27 | ) | | | (0.30 | ) | | | (0.26 | ) | | | (0.23 | ) | | | (0.19 | ) |
Distributions from net realized gain on investments | | | (0.81 | ) | | | (0.44 | ) | | | (0.07 | ) | | | — | | | | — | | | | — | |
| | | | | | | | | | | | | | | | | | | | | | | | |
Total distributions | | | (1.00 | ) | | | (0.71 | ) | | | (0.37 | ) | | | (0.26 | ) | | | (0.23 | ) | | | (0.19 | ) |
| | | | | | | | | | | | | | | | | | | | | | | | |
Net increase (decrease) in net asset value | | | (0.46 | ) | | | 2.32 | | | | 0.99 | | | | 0.45 | | | | 1.65 | | | | 0.15 | |
| | | | | | | | | | | | | | | | | | | | | | | | |
Net Asset Value, End of Period | | $ | 13.53 | | | $ | 13.99 | | | $ | 11.67 | | | $ | 10.68 | | | $ | 10.23 | | | $ | 8.58 | |
| | | | | | | | | | | | | | | | | | | | | | | | |
Total Return (b) | | | 3.94 | %(c) | | | 27.47 | % | | | 12.96 | % | | | 6.94 | % | | | 22.20 | % | | | 4.33 | % |
| | | | | | |
Ratios/Supplemental Data: | | | | | | | | | | | | | | | | | | | | | | | | |
Net Assets, End of Period (in 000’s) | | $ | 454,583 | | | $ | 449,130 | | | $ | 338,166 | | | $ | 301,290 | | | $ | 135,544 | | | $ | 81,842 | |
Ratios of expenses to average net assets: | | | | | | | | | | | | | | | | | | | | | | | | |
Before expense reimbursement and/or fee waiver by Adviser | | | 1.09 | %(d) | | | 1.09 | % | | | 1.12 | % | | | 1.12 | % | | | 1.14 | % | | | 1.21 | % |
After expense reimbursement and/or fee waiver by Adviser | | | 1.09 | %(d) | | | 1.09 | % | | | 1.12 | % | | | 1.12 | % | | | 1.14 | % | | | 1.21 | % |
Ratios of net investment income to average net assets: | | | | | | | | | | | | | | | | | | | | | | | | |
Before expense reimbursement and/or fee waiver by Adviser | | | 3.71 | %(d) | | | 2.38 | % | | | 2.74 | % | | | 2.70 | % | | | 2.69 | % | | | 3.36 | % |
After expense reimbursement and/or fee waiver by Adviser | | | 3.71 | %(d) | | | 2.38 | % | | | 2.74 | % | | | 2.70 | % | | | 2.69 | % | | | 3.36 | % |
Portfolio Turnover | | | 12.88 | %(c) | | | 35.18 | % | | | 28.17 | % | | | 24.65 | % | | | 29.92 | % | | | 47.34 | % |
| | (a) | The selected per share data was calculated using the weighted average shares outstanding method for the period. |
| | (b) | The total return is calculated using the Net Asset Value used for trading at the close of business at period end. |
See accompanying Notes to Financial Statements.
| | |
| |
| ASTON/River Road Dividend All Cap Value Fund – Class I | | April 30, 2014 |
| |
| Financial Highlights | | |
| | | | | | | | | | | | | | | | | | | | | | | | |
| | | Six Months
Ended
04/30/14
(unaudited) | | | Year
Ended
10/31/13 | | | Year
Ended
10/31/12 | | | Year
Ended
10/31/11 | | | Year
Ended
10/31/10 | | | Year
Ended
10/31/09 | |
Net Asset Value, Beginning of Period | | $ | 13.98 | | | $ | 11.66 | | | $ | 10.67 | | | $ | 10.22 | | | $ | 8.57 | | | $ | 8.42 | |
| | | | | | | | | | | | | | | | | | | | | | | | |
Income from Investment Operations: | | | | | | | | | | | | | | | | | | | | | | | | |
Net investment income | | | 0.26 | | | | 0.34 | | | | 0.34 | (a) | | | 0.32 | (a) | | | 0.28 | (a) | | | 0.29 | (a) |
Net realized and unrealized gain on investments | | | 0.29 | | | | 2.72 | | | | 1.05 | | | | 0.42 | | | | 1.63 | | | | 0.07 | |
| | | | | | | | | | | | | | | | | | | | | | | | |
Total from investment operations | | | 0.55 | | | | 3.06 | | | | 1.39 | | | | 0.74 | | | | 1.91 | | | | 0.36 | |
| | | | | | | | | | | | | | | | | | | | | | | | |
Less Distributions: | | | | | | | | | | | | | | | | | | | | | | | | |
Distributions from and in excess of net investment income | | | (0.20 | ) | | | (0.30 | ) | | | (0.33 | ) | | | (0.29 | ) | | | (0.26 | ) | | | (0.21 | ) |
Distributions from net realized gain on investments | | | (0.81 | ) | | | (0.44 | ) | | | (0.07 | ) | | | — | | | | — | | | | — | |
| | | | | | | | | | | | | | | | | | | | | | | | |
Total distributions | | | (1.01 | ) | | | (0.74 | ) | | | (0.40 | ) | | | (0.29 | ) | | | (0.26 | ) | | | (0.21 | ) |
| | | | | | | | | | | | | | | | | | | | | | | | |
Net increase (decrease) in net asset value . | | | (0.46 | ) | | | 2.32 | | | | 0.99 | | | | 0.45 | | | | 1.65 | | | | 0.15 | |
| | | | | | | | | | | | | | | | | | | | | | | | |
Net Asset Value, End of Period | | $ | 13.52 | | | $ | 13.98 | | | $ | 11.66 | | | $ | 10.67 | | | $ | 10.22 | | | $ | 8.57 | |
| | | | | | | | | | | | | | | | | | | | | | | | |
Total Return (b) | | | 4.07 | %(c) | | | 27.81 | % | | | 13.25 | % | | | 7.21 | % | | | 22.53 | % | | | 4.59 | % |
| | | | | | |
Ratios/Supplemental Data: | | | | | | | | | | | | | | | | | | | | | | | | |
Net Assets, End of Period (in 000’s) | | $ | 787,230 | | | $ | 779,859 | | | $ | 586,043 | | | $ | 318,863 | | | $ | 137,629 | | | $ | 77,185 | |
Ratios of expenses to average net assets: | | | | | | | | | | | | | | | | | | | | | | | | |
Before expense reimbursement and/or fee waiver by Adviser | | | 0.84 | %(d) | | | 0.84 | % | | | 0.87 | % | | | 0.87 | % | | | 0.89 | % | | | 0.96 | % |
After expense reimbursement and/or fee waiver by Adviser | | | 0.84 | %(d) | | | 0.84 | % | | | 0.87 | % | | | 0.87 | % | | | 0.89 | % | | | 0.96 | % |
Ratios of net investment income to average net assets: | | | | | | | | | | | | | | | | | | | | | | | | |
Before expense reimbursement and/or fee waiver by Adviser | | | 3.96 | %(d) | | | 2.63 | % | | | 2.99 | % | | | 2.95 | % | | | 2.94 | % | | | 3.61 | % |
After expense reimbursement and/or fee waiver by Adviser | | | 3.96 | %(d) | | | 2.63 | % | | | 2.99 | % | | | 2.95 | % | | | 2.94 | % | | | 3.61 | % |
Portfolio Turnover | | | 12.88 | %(c) | | | 35.18 | % | | | 28.17 | % | | | 24.65 | % | | | 29.92 | % | | | 47.34 | % |
| | (a) | The selected per share data was calculated using the weighted average shares outstanding method for the period. |
| | (b) | The total return is calculated using the Net Asset Value used for trading at the close of business at period end. |
See accompanying Notes to Financial Statements.
| | |
| |
| ASTON/River Road Dividend All Cap Value Fund II – Class N | | April 30, 2014 |
| |
| Financial Highlights | | |
| | | | | | | | | | | | |
| | | Six Months
Ended
04/30/14
(unaudited) | | | Year
Ended
10/31/13 | | | Period
Ended
10/31/12(a) | |
Net Asset Value, Beginning of Period | | $ | 12.89 | | | $ | 10.44 | | | $ | 10.00 | |
| | | | | | | | | | | | |
Income from Investment Operations: | | | | | | | | | | | | |
Net investment income | | | 0.21 | | | | 0.22 | | | | 0.09 | (b) |
Net realized and unrealized gain on investments | | | 0.29 | | | | 2.46 | | | | 0.41 | |
| | | | | | | | | | | | |
Total from investment operations | | | 0.50 | | | | 2.68 | | | | 0.50 | |
| | | | | | | | | | | | |
Less Distributions: | | | | | | | | | | | | |
Distributions from and in excess of net investment income | | | (0.20 | ) | | | (0.23 | ) | | | (0.06 | ) |
Distributions from net realized gain on investments | | | (0.14 | ) | | | — | (c) | | | — | |
| | | | | | | | | | | | |
Total distributions | | | (0.34 | ) | | | (0.23 | ) | | | (0.06 | ) |
| | | | | | | | | | | | |
Net increase in net asset value | | | 0.16 | | | | 2.45 | | | | 0.44 | |
| | | | | | | | | | | | |
Net Asset Value, End of Period | | $ | 13.05 | | | $ | 12.89 | | | $ | 10.44 | |
| | | | | | | | | | | | |
Total Return (d) | | | 3.95 | %(e) | | | 25.99 | % | | | 5.09 | %(e) |
| | | |
Ratios/Supplemental Data: | | | | | | | | | | | | |
Net Assets, End of Period (in 000’s) | | $ | 6,592 | | | $ | 3,634 | | | $ | 1,049 | |
Ratios of expenses to average net assets: | | | | | | | | | | | | |
Before expense reimbursement and/or fee waiver, or recoupment by Adviser | | | 1.15 | %(f) | | | 1.37 | % | | | 4.99 | %(f) |
After expense reimbursement and/or fee waiver, or recoupment by Adviser | | | 1.30 | %(f) | | | 1.30 | % | | | 1.30 | %(f) |
Ratios of net investment income (loss) to average net assets: | | | | | | | | | | | | |
Before expense reimbursement and/or fee waiver, or recoupment by Adviser | | | 3.70 | %(f) | | | 1.68 | % | | | (1.24 | )%(f) |
After expense reimbursement and/or fee waiver, or recoupment by Adviser | | | 3.55 | %(f) | | | 1.76 | % | | | 2.45 | %(f) |
Portfolio Turnover | | | 11.35 | %(e) | | | 27.80 | % | | | 5.58 | %(e)(g) |
| | (a) | The inception date for the River Road Dividend All Cap Value Fund II Class N shares is June 27, 2012. |
| | (b) | The selected per share data was calculated using the weighted average shares outstanding method for the period. |
| | (c) | Represents less than $(0.005) per share. |
| | (d) | The total return is calculated using the Net Asset Value used for trading at the close of business at period end. |
| | (g) | Portfolio turnover excludes securities received from processing a subscription-in-kind. |
See accompanying Notes to Financial Statements.
| | |
| |
| ASTON/River Road Dividend All Cap Value Fund II – Class I | | April 30, 2014 |
| |
| Financial Highlights | | |
| | | | | | | | | | | | |
| | | Six Months
Ended
04/30/14
(unaudited) | | | Year
Ended
10/31/13 | | | Period
Ended
10/31/12(a) | |
Net Asset Value, Beginning of Period | | $ | 12.89 | | | $ | 10.45 | | | $ | 10.00 | |
| | | | | | | | | | | | |
Income from Investment Operations: | | | | | | | | | | | | |
Net investment income | | | 0.24 | | | | 0.25 | | | | 0.10 | (b) |
Net realized and unrealized gain on investments | | | 0.28 | | | | 2.45 | | | | 0.42 | |
| | | | | | | | | | | | |
Total from investment operations | | | 0.52 | | | | 2.70 | | | | 0.52 | |
| | | | | | | | | | | | |
Less Distributions: | | | | | | | | | | | | |
Distributions from and in excess of net investment income | | | (0.22 | ) | | | (0.26 | ) | | | (0.07 | ) |
Distributions from net realized gain on investments | | | (0.14 | ) | | | — | (c) | | | — | |
| | | | | | | | | | | | |
Total distributions | | | (0.36 | ) | | | (0.26 | ) | | | (0.07 | ) |
| | | | | | | | | | | | |
Net increase in net asset value | | | 0.16 | | | | 2.44 | | | | 0.45 | |
| | | | | | | | | | | | |
Net Asset Value, End of Period | | $ | 13.05 | | | $ | 12.89 | | | $ | 10.45 | |
| | | | | | | | | | | | |
Total Return (d) | | | 4.07 | %(e) | | | 26.30 | % | | | 5.17 | %(e) |
| | | |
Ratios/Supplemental Data: | | | | | | | | | | | | |
Net Assets, End of Period (in 000’s) | | $ | 105,463 | | | $ | 86,240 | | | $ | 9,370 | |
Ratios of expenses to average net assets: | | | | | | | | | | | | |
Before expense reimbursement and/or fee waiver, or recoupment by Adviser | | | 0.90 | %(f) | | | 1.12 | % | | | 4.74 | %(f) |
After expense reimbursement and/or fee waiver, or recoupment by Adviser | | | 1.05 | %(f) | | | 1.05 | % | | | 1.05 | %(f) |
Ratios of net investment income (loss) to average net assets: | | | | | | | | | | | | |
Before expense reimbursement and/or fee waiver, or recoupment by Adviser | | | 3.95 | %(f) | | | 1.93 | % | | | (0.99 | )%(f) |
After expense reimbursement and/or fee waiver, or recoupment by Adviser | | | 3.80 | %(f) | | | 2.01 | % | | | 2.70 | %(f) |
Portfolio Turnover | | | 11.35 | %(e) | | | 27.80 | % | | | 5.58 | %(e)(g) |
| | (a) | The inception date for the River Road Dividend All Cap Value Fund II Class I shares is June 27, 2012. |
| | (b) | The selected per share data was calculated using the weighted average shares outstanding method for the period. |
| | (c) | Represents less than $(0.005) per share. |
| | (d) | The total return is calculated using the Net Asset Value used for trading at the close of business at period end. |
| | (g) | Portfolio turnover excludes securities received from processing a subscription-in-kind. |
See accompanying Notes to Financial Statements.
| | |
| |
| ASTON/Fairpointe Mid Cap Fund – Class N | | April 30, 2014 |
| |
| Financial Highlights | | |
| | | | | | | | | | | | | | | | | | | | | | | | |
| | | Six Months
Ended
04/30/14
(unaudited) | | | Year
Ended
10/31/13 | | | Year
Ended
10/31/12 | | | Year
Ended
10/31/11 | | | Year
Ended
10/31/10 | | | Year
Ended
10/31/09 | |
Net Asset Value, Beginning of Period | | $ | 45.40 | | | $ | 32.79 | | | $ | 29.76 | | | $ | 29.04 | | | $ | 22.73 | | | $ | 17.25 | |
| | | | | | | | | | | | | | | | | | | | | | | | |
Income from Investment Operations: | | | | | | | | | | | | | | | | | | | | | | | | |
Net investment income (loss) | | | (0.05 | ) | | | 0.17 | | | | 0.16 | | | | 0.06 | (a) | | | 0.01 | | | | 0.09 | |
Net realized and unrealized gain on investments | | | 4.65 | | | | 13.48 | | | | 3.13 | | | | 0.82 | | | | 6.35 | | | | 5.82 | |
| | | | | | | | | | | | | | | | | | | | | | | | |
Total from investment operations | | | 4.60 | | | | 13.65 | | | | 3.29 | | | | 0.88 | | | | 6.36 | | | | 5.91 | |
| | | | | | | | | | | | | | | | | | | | | | | | |
Less Distributions: | | | | | | | | | | | | | | | | | | | | | | | | |
Distributions from and in excess of net investment income | | | — | | | | (0.30 | ) | | | (0.05 | ) | | | (0.08 | ) | | | (0.05 | ) | | | (0.14 | ) |
Distributions from net realized gain on investments | | | (4.27 | ) | | | (0.74 | ) | | | (0.21 | ) | | | (0.08 | ) | | | — | | | | (0.29 | ) |
| | | | | | | | | | | | | | | | | | | | | | | | |
Total distributions | | | (4.27 | ) | | | (1.04 | ) | | | (0.26 | ) | | | (0.16 | ) | | | (0.05 | ) | | | (0.43 | ) |
| | | | | | | | | | | | | | | | | | | | | | | | |
Net increase in net asset value | | | 0.33 | | | | 12.61 | | | | 3.03 | | | | 0.72 | | | | 6.31 | | | | 5.48 | |
| | | | | | | | | | | | | | | | | | | | | | | | |
Net Asset Value, End of Period | | $ | 45.73 | | | $ | 45.40 | | | $ | 32.79 | | | $ | 29.76 | | | $ | 29.04 | | | $ | 22.73 | |
| | | | | | | | | | | | | | | | | | | | | | | | |
Total Return (b) | | | 10.52 | %(c) | | | 42.88 | % | | | 11.15 | % | | | 2.98 | % | | | 28.01 | % | | | 35.60 | % |
| | | | | | |
Ratios/Supplemental Data: | | | | | | | | | | | | | | | | | | | | | | | | |
Net Assets, End of Period (in 000’s) | | $ | 2,549,271 | | | $ | 2,370,432 | | | $ | 1,561,510 | | | $ | 1,502,266 | | | $ | 1,469,354 | | | $ | 842,233 | |
Ratios of expenses to average net assets: | | | | | | | | | | | | | | | | | | | | | | | | |
Before expense reimbursement and/or fee waiver by Adviser | | | 1.10 | %(d) | | | 1.11 | % | | | 1.11 | %(e) | | | 1.14 | %(e) | | | 1.14 | %(e) | | | 1.20 | %(e) |
After expense reimbursement and/or fee waiver by Adviser | | | 1.10 | %(d) | | | 1.11 | % | | | 1.11 | %(e) | | | 1.14 | %(e) | | | 1.14 | %(e) | | | 1.20 | %(e) |
Ratios of net investment income (loss) to average net assets: | | | | | | | | | | | | | | | | | | | | | | | | |
Before expense reimbursement and/or fee waiver by Adviser | | | (0.24 | )%(d) | | | 0.42 | % | | | 0.50 | % | | | 0.21 | % | | | — | %(f) | | | 0.46 | % |
After expense reimbursement and/or fee waiver by Adviser | | | (0.24 | )%(d) | | | 0.42 | % | | | 0.50 | % | | | 0.21 | % | | | — | %(f) | | | 0.46 | % |
Portfolio Turnover | | | 26.80 | %(c) | | | 36.98 | % | | | 28.06 | %(g) | | | 11.20 | % | | | 13.82 | % | | | 17.72 | % |
| | (a) | The selected per share data was calculated using the weighted average shares outstanding method for the period. |
| | (b) | The total return is calculated using the Net Asset Value used for trading at the close of business at period end. |
| | (e) | Ratios of expenses to average net assets include interest expenses of less than 0.005% for each of the years ended October 31, 2012, October 31, 2011, October 31, 2010 and October 31, 2009, which are not included in the contractual expense limitation. The interest expenses are from utilizing the line of credit, as discussed in Note H to the Financial Statements. |
| | (f) | Represents less than 0.005%. |
| | (g) | Portfolio turnover rate excludes securities delivered from processing a redemption-in-kind. |
See accompanying Notes to Financial Statements.
| | |
| |
| ASTON/Fairpointe Mid Cap Fund – Class I | | April 30, 2014 |
| |
| Financial Highlights | | |
| | | | | | | | | | | | | | | | | | | | | | | | |
| | | Six Months
Ended
04/30/14
(unaudited) | | | Year
Ended
10/31/13 | | | Year
Ended
10/31/12 | | | Year
Ended
10/31/11 | | | Year
Ended
10/31/10 | | | Year
Ended
10/31/09 | |
Net Asset Value, Beginning of Period | | $ | 46.10 | | | $ | 33.28 | | | $ | 30.20 | | | $ | 29.41 | | | $ | 23.00 | | | $ | 17.47 | |
| | | | | | | | | | | | | | | | | | | | | | | | |
Income from Investment Operations: | | | | | | | | | | | | | | | | | | | | | | | | |
Net investment income | | | — | (a) | | | 0.28 | | | | 0.24 | | | | 0.14 | (b) | | | 0.07 | | | | 0.13 | |
Net realized and unrealized gain on investments | | | 4.73 | | | | 13.67 | | | | 3.18 | | | | 0.82 | | | | 6.43 | | | | 5.89 | |
| | | | | | | | | | | | | | | | | | | | | | | | |
Total from investment operations | | | 4.73 | | | | 13.95 | | | | 3.42 | | | | 0.96 | | | | 6.50 | | | | 6.02 | |
| | | | | | | | | | | | | | | | | | | | | | | | |
Less Distributions: | | | | | | | | | | | | | | | | | | | | | | | | |
Distributions from and in excess of net investment income | | | (0.06 | ) | | | (0.39 | ) | | | (0.13 | ) | | | (0.09 | ) | | | (0.09 | ) | | | (0.20 | ) |
Distributions from net realized gain on investment | | | (4.27 | ) | | | (0.74 | ) | | | (0.21 | ) | | | (0.08 | ) | | | — | | | | (0.29 | ) |
| | | | | | | | | | | | | | | | | | | | | | | | |
Total distributions | | | (4.33 | ) | | | (1.13 | ) | | | (0.34 | ) | | | (0.17 | ) | | | (0.09 | ) | | | (0.49 | ) |
| | | | | | | | | | | | | | | | | | | | | | | | |
Net increase in net asset value | | | 0.40 | | | | 12.82 | | | | 3.08 | | | | 0.79 | | | | 6.41 | | | | 5.53 | |
| | | | | | | | | | | | | | | | | | | | | | | | |
Net Asset Value, End of Period | | $ | 46.50 | | | $ | 46.10 | | | $ | 33.28 | | | $ | 30.20 | | | $ | 29.41 | | | $ | 23.00 | |
| | | | | | | | | | | | | | | | | | | | | | | | |
Total Return (c) | | | 10.66 | %(d) | | | 43.23 | % | | | 11.46 | % | | | 3.22 | % | | | 28.31 | % | | | 35.97 | % |
| | | | | | |
Ratios/Supplemental Data: | | | | | | | | | | | | | | | | | | | | | | | | |
Net Assets, End of Period (in 000’s) | | $ | 3,007,012 | | | $ | 2,521,876 | | | $ | 1,464,222 | | | $ | 1,339,223 | | | $ | 499,651 | | | $ | 150,953 | |
Ratios of expenses to average net assets: | | | | | | | | | | | | | | | | | | | | | | | | |
Before expense reimbursement and/or fee waiver by Adviser | | | 0.85 | %(e) | | | 0.86 | % | | | 0.86 | %(f) | | | 0.89 | %(f) | | | 0.89 | %(f) | | | 0.95 | %(f) |
After expense reimbursement and/or fee waiver by Adviser | | | 0.85 | %(e) | | | 0.86 | % | | | 0.86 | %(f) | | | 0.89 | %(f) | | | 0.89 | %(f) | | | 0.95 | %(f) |
Ratios of net investment income to average net assets: | | | | | | | | | | | | | | | | | | | | | | | | |
Before expense reimbursement and/or fee waiver by Adviser | | | 0.01 | %(e) | | | 0.67 | % | | | 0.75 | % | | | 0.46 | % | | | 0.25 | % | | | 0.71 | % |
After expense reimbursement and/or fee waiver by Adviser | | | 0.01 | %(e) | | | 0.67 | % | | | 0.75 | % | | | 0.46 | % | | | 0.25 | % | | | 0.71 | % |
Portfolio Turnover | | | 26.80 | %(d) | | | 36.98 | % | | | 28.06 | %(g) | | | 11.20 | % | | | 13.82 | % | | | 17.72 | % |
| | (a) | Represents less than $0.005 per share. |
| | (b) | The selected per share data was calculated using the weighted average shares outstanding method for the period. |
| | (c) | The total return is calculated using the Net Asset Value used for trading at the close of business at period end. |
| | (f) | Ratios of expenses to average net assets include interest expenses of less than 0.005% for each of the years ended October 31, 2012, October 31, 2011, October 31, 2010 and October 31, 2009, which are not included in the contractual expense limitation. The interest expenses are from utilizing the line of credit, as discussed in Note H to the Financial Statements. |
| | (g) | Portfolio turnover rate excludes securities delivered from processing a redemption-in-kind. |
See accompanying Notes to Financial Statements.
| | |
| |
| ASTON/Montag & Caldwell Mid Cap Growth Fund – Class N | | April 30, 2014 |
| |
| Financial Highlights | | |
| | | | | | | | | | | | | | | | | | | | | | | | |
| | | Six Months
Ended
04/30/14
(unaudited) | | | Year
Ended
10/31/13 | | | Year
Ended
10/31/12 | | | Year
Ended
10/31/11 | | | Year
Ended
10/31/10 | | | Year
Ended
10/31/09 | |
Net Asset Value, Beginning of Period | | $ | 12.77 | | | $ | 10.36 | | | $ | 9.71 | | | $ | 8.51 | | | $ | 6.83 | | | $ | 5.85 | |
| | | | | | | | | | | | | | | | | | | | | | | | |
Income from Investment Operations: | | | | | | | | | | | | | | | | | | | | | | | | |
Net investment loss | | | (0.04 | ) | | | (0.07 | ) | | | (0.07 | )(a) | | | (0.07 | ) | | | (0.04 | ) | | | (0.04 | ) |
Net realized and unrealized gain on investments | | | 0.65 | | | | 2.58 | | | | 0.72 | | | | 1.27 | | | | 1.74 | | | | 1.02 | |
| | | | | | | | | | | | | | | | | | | | | | | | |
Total from investment operations | | | 0.61 | | | | 2.51 | | | | 0.65 | | | | 1.20 | | | | 1.70 | | | | 0.98 | |
| | | | | | | | | | | | | | | | | | | | | | | | |
Less Distributions: | | | | | | | | | | | | | | | | | | | | | | | | |
Distributions from and in excess of net investment income | | | — | | | | — | | | | — | | | | — | | | | (0.02 | ) | | | — | |
Distributions from net realized gain on investments | | | (1.92 | ) | | | (0.10 | ) | | | — | | | | — | | | | — | | | | — | |
| | | | | | | | | | | | | | | | | | | | | | | | |
Total distributions | | | (1.92 | ) | | | (0.10 | ) | | | — | | | | — | | | | (0.02 | ) | | | — | |
| | | | | | | | | | | | | | | | | | | | | | | | |
Net increase in net asset value | | | 1.31 | | | | 2.41 | | | | 0.65 | | | | 1.20 | | | | 1.68 | | | | 0.98 | |
| | | | | | | | | | | | | | | | | | | | | | | | |
Net Asset Value, End of Period | | $ | 11.46 | | | $ | 12.77 | | | $ | 10.36 | | | $ | 9.71 | | | $ | 8.51 | | | $ | 6.83 | |
| | | | | | | | | | | | | | | | | | | | | | | | |
Total Return (b) | | | 4.90 | %(c) | | | 24.51 | % | | | 6.70 | % | | | 14.10 | % | | | 24.85 | % | | | 16.75 | % |
| | | | | | |
Ratios/Supplemental Data: | | | | | | | | | | | | | | | | | | | | | | | | |
Net Assets, End of Period (in 000’s) | | $ | 11,374 | | | $ | 11,402 | | | $ | 7,369 | | | $ | 4,507 | | | $ | 3,399 | | | $ | 2,959 | |
Ratios of expenses to average net assets: | | | | | | | | | | | | | | | | | | | | | | | | |
Before expense reimbursement and/or fee waiver by Adviser | | | 1.87 | %(d) | | | 1.85 | % | | | 2.50 | % | | | 3.07 | % | | | 3.55 | % | | | 5.02 | % |
After expense reimbursement and/or fee waiver by Adviser | | | 1.25 | %(d) | | | 1.25 | % | | | 1.25 | %(e) | | | 1.39 | %(e) | | | 1.40 | % | | | 1.40 | % |
Ratios of net investment loss to average net assets: | | | | | | | | | | | | | | | | | | | | | | | | |
Before expense reimbursement and/or fee waiver by Adviser | | | (1.25 | )%(d) | | | (1.18 | )% | | | (1.88 | )% | | | (2.39 | )% | | | (2.75 | )% | | | (4.13 | )% |
After expense reimbursement and/or fee waiver by Adviser | | | (0.63 | )%(d) | | | (0.58 | )% | | | (0.63 | )% | | | (0.71 | )% | | | (0.60 | )% | | | (0.51 | )% |
Portfolio Turnover | | | 14.67 | %(c) | | | 74.24 | % | | | 36.60 | % | | | 29.31 | % | | | 31.49 | % | | | 54.37 | % |
| | (a) | The selected per share data was calculated using the weighted average shares outstanding method for the period. |
| | (b) | The total return is calculated using the Net Asset Value used for trading at the close of business at period end. |
| | (e) | For the period November 1, 2010 through September 29, 2011, the Adviser contractually waived management fees and/or reimbursed expenses so that the net expense ratio did not exceed 1.40%, excluding interest, taxes, investment-related costs (such as brokerage commissions), extraordinary expenses and acquired fund fees and expenses. Effective September 30, 2011, the Adviser implemented a voluntary expense limitation of 1.25%. Subsequently, on February 29, 2012, the Adviser removed the voluntary expense limitation and replaced it with a contractual expense limitation of 1.25%. |
See accompanying Notes to Financial Statements.
| | |
| |
| ASTON/LMCG Small Cap Growth Fund – Class N | | April 30, 2014 |
| |
| Financial Highlights | | |
| | | | | | | | | | | | | | | | |
| | | Six Months
Ended
04/30/14
(unaudited) | | | Year
Ended
10/31/13 | | | Year
Ended
10/31/12 | | | Period
Ended
10/31/11(a) | |
| | | | |
| | | | |
| | | | |
Net Asset Value, Beginning of Period | | $ | 14.71 | | | $ | 11.42 | | | $ | 9.95 | | | $ | 10.00 | |
| | | | | | | | | | | | | | | | |
Income from Investment Operations: | | | | | | | | | | | | | | | | |
Net investment income (loss) | | | (0.05 | ) | | | — | (b)(c) | | | (0.12 | )(c) | | | (0.04 | ) |
Net realized and unrealized gain (loss) on investments | | | 0.54 | | | | 4.18 | | | | 1.59 | | | | (0.01 | ) |
| | | | | | | | | | | | | | | | |
Total from investment operations | | | 0.49 | | | | 4.18 | | | | 1.47 | | | | (0.05 | ) |
| | | | | | | | | | | | | | | | |
Less Distributions: | | | | | | | | | | | | | | | | |
Distributions from net realized gains on investments | | | (2.03 | ) | | | (0.89 | ) | | | — | | | | — | |
| | | | | | | | | | | | | | | | |
Total distributions | | | (2.03 | ) | | | (0.89 | ) | | | — | | | | — | |
| | | | | | | | | | | | | | | | |
Net increase (decrease) in net asset value | | | (1.54 | ) | | | 3.29 | | | | 1.47 | | | | (0.05 | ) |
| | | | | | | | | | | | | | | | |
Net Asset Value, End of Period | | $ | 13.17 | | | $ | 14.71 | | | $ | 11.42 | | | $ | 9.95 | |
| | | | | | | | | | | | | | | | |
Total Return (d) | | | 2.77 | %(e) | | | 39.31 | % | | | 14.77 | % | | | (0.50 | )%(e) |
| | | | |
Ratios/Supplemental Data: | | | | | | | | | | | | | | | | |
Net Assets, End of Period (in 000’s) | | $ | 30,800 | | | $ | 32,045 | | | $ | 5,659 | | | $ | 5,411 | |
Ratios of expenses to average net assets: | | | | | | | | | | | | | | | | |
Before expense reimbursement and/or fee waiver by Adviser | | | 1.65 | %(f) | | | 2.03 | % | | | 2.86 | % | | | 8.27 | %(f) |
After expense reimbursement and/or fee waiver by Adviser | | | 1.35 | %(f) | | | 1.35 | % | | | 1.35 | % | | | 1.35 | %(f) |
Ratios of net investment income (loss) to average net assets: | | | | | | | | | | | | | | | | |
Before expense reimbursement and/or fee waiver by Adviser | | | (1.00 | )%(f) | | | (0.66 | )% | | | (2.68 | )% | | | (8.14 | )%(f) |
After expense reimbursement and/or fee waiver by Adviser | | | (0.70 | )%(f) | | | 0.02 | % | | | (1.17 | )% | | | (1.21 | )%(f) |
Portfolio Turnover | | | 78.31 | %(e) | | | 186.40 | %(g) | | | 168.05 | %(h) | | | 205.85 | %(e) |
| | (a) | The inception date for the LMCG Small Cap Growth Fund Class N shares is November 3, 2010. |
| | (b) | Represents less than $0.005 per share. |
| | (c) | The selected per share data was calculated using the weighted average shares outstanding method for the period. |
| | (d) | The total return is calculated using the Net Asset Value used for trading at the close of business at period end. |
| | (g) | Portfolio turnover rate excludes securities received from a reorganization. |
| | (h) | Portfolio turnover rate excludes securities delivered from processing a redemption-in-kind. |
See accompanying Notes to Financial Statements.
| | |
| |
| ASTON/LMCG Small Cap Growth Fund – Class I | | April 30, 2014 |
| |
| Financial Highlights | | |
| | | | | | | | | | | | | | | | |
| | | Six Months
Ended
04/30/14
(unaudited) | | | Year
Ended
10/31/13 | | | Year
Ended
10/31/12 | | | Period
Ended
10/31/11(a) | |
| | | | |
| | | | |
| | | | |
Net Asset Value, Beginning of Period | | $ | 14.81 | | | $ | 11.46 | | | $ | 9.97 | | | $ | 12.40 | |
| | | | | | | | | | | | | | | | |
Income from Investment Operations: | | | | | | | | | | | | | | | | |
Net investment income (loss) | | | (0.03 | ) | | | 0.04 | (b) | | | (0.10 | )(b) | | | (0.04 | ) |
Net realized and unrealized gain (loss) on investments | | | 0.54 | | | | 4.20 | | | | 1.59 | | | | (2.39 | ) |
| | | | | | | | | | | | | | | | |
Total from investment operations | | | 0.51 | | | | 4.24 | | | | 1.49 | | | | (2.43 | ) |
| | | | | | | | | | | | | | | | |
Less Distributions: | | | | | | | | | | | | | | | | |
Distributions from and in excess of net investment income | | | (0.03 | ) | | | — | | | | — | | | | — | |
Distributions from net realized gains on investments | | | (2.03 | ) | | | (0.89 | ) | | | — | | | | — | |
| | | | | | | | | | | | | | | | |
Total distributions | | | (2.06 | ) | | | (0.89 | ) | | | — | | | | — | |
| | | | | | | | | | | | | | | | |
Net increase (decrease) in net asset value | | | (1.55 | ) | | | 3.35 | | | | 1.49 | | | | (2.43 | ) |
| | | | | | | | | | | | | | | | |
Net Asset Value, End of Period | | $ | 13.26 | | | $ | 14.81 | | | $ | 11.46 | | | $ | 9.97 | |
| | | | | | | | | | | | | | | | |
Total Return (c) | | | 2.86 | %(d) | | | 39.72 | % | | | 14.95 | % | | | (19.60 | )%(d) |
| | | | |
Ratios/Supplemental Data: | | | | | | | | | | | | | | | | |
Net Assets, End of Period (in 000’s) | | $ | 7,125 | | | $ | 8,496 | | | $ | 755 | | | $ | 2,551 | |
Ratios of expenses to average net assets: | | | | | | | | | | | | | | | | |
Before expense reimbursement and/or fee waiver by Adviser | | | 1.40 | %(e) | | | 1.78 | % | | | 2.61 | % | | | 6.25 | %(e) |
After expense reimbursement and/or fee waiver by Adviser | | | 1.10 | %(e) | | | 1.10 | % | | | 1.10 | % | | | 1.10 | %(e) |
Ratios of net investment income (loss) to average net assets: | | | | | | | | | | | | | | | | |
Before expense reimbursement and/or fee waiver by Adviser | | | (0.75 | )%(e) | | | (0.41 | )% | | | (2.43 | )% | | | (6.11 | )%(e) |
After expense reimbursement and/or fee waiver by Adviser | | | (0.45 | )%(e) | | | 0.27 | % | | | (0.92 | )% | | | (0.96 | )%(e) |
Portfolio Turnover | | | 78.31 | %(d) | | | 186.40 | %(f) | | | 168.05 | %(g) | | | 205.85 | %(d) |
| | (a) | The inception date for the LMCG Small Cap Growth Fund Class I shares is June 1, 2011. |
| | (b) | The selected per share data was calculated using the weighted average shares outstanding method for the period. |
| | (c) | The total return is calculated using the Net Asset Value used for trading at the close of business at period end. |
| | (f) | Portfolio turnover rate excludes securities received from a reorganization. |
| | (g) | Portfolio turnover rate excludes securities delivered from processing a redemption-in-kind. |
See accompanying Notes to Financial Statements.
| | |
| |
| ASTON/Silvercrest Small Cap Fund – Class N | | April 30, 2014 |
| |
| Financial Highlights | | |
| | | | | | | | | | | | |
| | | Six Months
Ended
04/30/14
(unaudited) | | | Year
Ended
10/31/13 | | | Period
Ended
10/31/12(a) | |
| | | |
| | | |
| | | |
Net Asset Value, Beginning of Period | | $ | 14.54 | | | $ | 10.90 | | | $ | 10.00 | |
| | | | | | | | | | | | |
Income from Investment Operations: | | | | | | | | | | | | |
Net investment income | | | — | (b) | | | 0.01 | (c) | | | 0.01 | |
Net realized and unrealized gain on investments | | | 0.38 | | | | 3.77 | | | | 0.89 | |
| | | | | | | | | | | | |
Total from investment operations | | | 0.38 | | | | 3.78 | | | | 0.90 | |
| | | | | | | | | | | | |
Less Distributions: | | | | | | | | | | | | |
Distributions from and in excess of net investment income | | | — | (b) | | | (0.11 | ) | | | — | |
Distributions from net realized gains on investments | | | (0.51 | ) | | | (0.03 | ) | | | — | |
| | | | | | | | | | | | |
Total distributions | | | (0.51 | ) | | | (0.14 | ) | | | — | |
| | | | | | | | | | | | |
Net increase (decrease) in net asset value | | | (0.13 | ) | | | 3.64 | | | | 0.90 | |
| | | | | | | | | | | | |
Net Asset Value, End of Period | | $ | 14.41 | | | $ | 14.54 | | | $ | 10.90 | |
| | | | | | | | | | | | |
Total Return (d) | | | 2.55 | %(e) | | | 35.09 | % | | | 9.00 | %(e) |
| | | |
Ratios/Supplemental Data: | | | | | | | | | | | | |
Net Assets, End of Period (in 000’s) | | $ | 3,973 | | | $ | 4,049 | | | $ | 750 | |
Ratios of expenses to average net assets: | | | | | | | | | | | | |
Before expense reimbursement and/or fee waiver by Adviser | | | 1.66 | %(f) | | | 2.05 | % | | | 5.10 | %(f) |
After expense reimbursement and/or fee waiver by Adviser | | | 1.40 | %(f) | | | 1.40 | % | | | 1.40 | %(f) |
Ratios of net investment income (loss) to average net assets: | | | | | | | | | | | | |
Before expense reimbursement and/or fee waiver by Adviser | | | (0.21 | )%(f) | | | (0.61 | )% | | | (3.51 | )%(f) |
After expense reimbursement and/or fee waiver by Adviser | | | 0.05 | %(f) | | | 0.04 | % | | | 0.19 | %(f) |
Portfolio Turnover | | | 22.66 | %(e) | | | 36.82 | % | | | 26.22 | %(e)(g) |
| | (a) | The inception date for the Silvercrest Small Cap Fund Class N shares is December 27, 2011. |
| | (b) | Represents less than $0.005 per share. |
| | (c) | The selected per share data was calculated using the weighted average shares outstanding method for the period. |
| | (d) | The total return is calculated using the Net Asset Value used for trading at the close of business at period end. |
| | (g) | Portfolio turnover rate excludes securities delivered from processing a redemption-in-kind. |
See accompanying Notes to Financial Statements.
| | |
| |
| ASTON/Silvercrest Small Cap Fund – Class I | | April 30, 2014 |
| |
| Financial Highlights | | |
| | | | | | | | | | | | |
| | | Six Months
Ended
04/30/14
(unaudited) | | | Year
Ended
10/31/13 | | | Period
Ended
10/31/12(a) | |
| | | |
| | | |
| | | |
Net Asset Value, Beginning of Period | | $ | 14.59 | | | $ | 10.93 | | | $ | 10.00 | |
| | | | | | | | | | | | |
Income from Investment Operations: | | | | | | | | | | | | |
Net investment income | | | 0.03 | | | | 0.04 | (b) | | | 0.03 | |
Net realized and unrealized gain on investments | | | 0.37 | | | | 3.78 | | | | 0.90 | |
| | | | | | | | | | | | |
Total from investment operations | | | 0.40 | | | | 3.82 | | | | 0.93 | |
| | | | | | | | | | | | |
Less Distributions: | | | | | | | | | | | | |
Distributions from and in excess of net investment income | | | (0.03 | ) | | | (0.13 | ) | | | — | |
Distributions from net realized gains on investments | | | (0.51 | ) | | | (0.03 | ) | | | — | |
| | | | | | | | | | | | |
Total distributions | | | (0.54 | ) | | | (0.16 | ) | | | — | |
| | | | | | | | | | | | |
Net increase (decrease) in net asset value | | | (0.14 | ) | | | 3.66 | | | | 0.93 | |
| | | | | | | | | | | | |
Net Asset Value, End of Period | | $ | 14.45 | | | $ | 14.59 | | | $ | 10.93 | |
| | | | | | | | | | | | |
Total Return (c) | | | 2.65 | %(d) | | | 35.39 | % | | | 9.30 | %(d) |
| | | |
Ratios/Supplemental Data: | | | | | | | | | | | | |
Net Assets, End of Period (in 000’s) | | $ | 47,732 | | | $ | 29,219 | | | $ | 4,962 | |
Ratios of expenses to average net assets: | | | | | | | | | | | | |
Before expense reimbursement and/or fee waiver by Adviser | | | 1.41 | %(e) | | | 1.80 | % | | | 4.85 | %(e) |
After expense reimbursement and/or fee waiver by Adviser | | | 1.15 | %(e) | | | 1.15 | % | | | 1.15 | %(e) |
Ratios of net investment income (loss) to average net assets: | | | | | | | | | | | | |
Before expense reimbursement and/or fee waiver by Adviser | | | 0.04 | %(e) | | | (0.36 | )% | | | (3.26 | )%(e) |
After expense reimbursement and/or fee waiver by Adviser | | | 0.30 | %(e) | | | 0.29 | % | | | 0.44 | %(e) |
Portfolio Turnover | | | 22.66 | %(d) | | | 36.82 | % | | | 26.22 | %(d)(f) |
| | (a) | The inception date for the Silvercrest Small Cap Fund Class I shares is December 27, 2011. |
| | (b) | The selected per share data was calculated using the weighted average shares outstanding method for the period. |
| | (c) | The total return is calculated using the Net Asset Value used for trading at the close of business at period end. |
| | (f) | Portfolio turnover rate excludes securities delivered from processing a redemption-in-kind. |
See accompanying Notes to Financial Statements.
| | |
| |
| ASTON/TAMRO Small Cap Fund – Class N | | April 30, 2014 |
| |
| Financial Highlights | | |
| | | | | | | | | | | | | | | | | | | | | | | | |
| | | Six Months
Ended
04/30/14
(unaudited) | | | Year
Ended
10/31/13 | | | Year
Ended
10/31/12 | | | Year
Ended
10/31/11 | | | Year
Ended
10/31/10 | | | Year
Ended
10/31/09 | |
Net Asset Value, Beginning of Period | | $ | 24.06 | | | $ | 20.52 | | | $ | 20.57 | | | $ | 19.42 | | | $ | 14.67 | | | $ | 13.64 | |
| | | | | | | | | | | | | | | | | | | | | | | | |
Income from Investment Operations: | | | | | | | | | | | | | | | | | | | | | | | | |
Net investment loss | | | (0.06 | ) | | | (0.03 | )(a) | | | (0.12 | )(a) | | | (0.15 | )(a) | | | (0.08 | )(a) | | | (0.05 | )(a) |
Net realized and unrealized gain (loss) on investments | | | (0.89 | ) | | | 5.55 | | | | 2.09 | | | | 1.75 | | | | 4.83 | | | | 1.08 | |
| | | | | | | | | | | | | | | | | | | | | | | | |
Total from investment operations | | | (0.95 | ) | | | 5.52 | | | | 1.97 | | | | 1.60 | | | | 4.75 | | | | 1.03 | |
| | | | | | | | | | | | | | | | | | | | | | | | |
Less Distributions: | | | | | | | | | | | | | | | | | | | | | | | | |
Distributions from net realized gain on investments | | | (2.16 | ) | | | (1.98 | ) | | | (2.02 | ) | | | (0.45 | ) | | | — | | | | — | |
| | | | | | | | | | | | | | | | | | | | | | | | |
Total distributions | | | (2.16 | ) | | | (1.98 | ) | | | (2.02 | ) | | | (0.45 | ) | | | — | | | | — | |
| | | | | | | | | | | | | | | | | | | | | | | | |
Net increase (decrease) in net asset value | | | (3.11 | ) | | | 3.54 | | | | (0.05 | ) | | | 1.15 | | | | 4.75 | | | | 1.03 | |
| | | | | | | | | | | | | | | | | | | | | | | | |
Net Asset Value, End of Period | | $ | 20.95 | | | $ | 24.06 | | | $ | 20.52 | | | $ | 20.57 | | | $ | 19.42 | | | $ | 14.67 | |
| | | | | | | | | | | | | | | | | | | | | | | | |
Total Return (b) | | | (4.53 | )%(c) | | | 29.52 | % | | | 10.70 | % | | | 8.16 | % | | | 32.29 | % | | | 7.63 | % |
| | | | | | |
Ratios/Supplemental Data: | | | | | | | | | | | | | | | | | | | | | | | | |
Net Assets, End of Period (in 000’s) | | $ | 455,736 | | | $ | 533,627 | | | $ | 389,125 | | | $ | 375,969 | | | $ | 335,809 | | | $ | 241,524 | |
Ratios of expenses to average net assets: | | | | | | | | | | | | | | | | | | | | | | | | |
Before expense reimbursement and/or fee waiver by Adviser | | | 1.31 | %(d) | | | 1.31 | % | | | 1.28 | %(e) | | | 1.29 | % | | | 1.34 | % | | | 1.37 | % |
After expense reimbursement and/or fee waiver by Adviser | | | 1.31 | %(d) | | | 1.31 | % | | | 1.28 | %(e) | | | 1.29 | % | | | 1.34 | % | | | 1.36 | %(f) |
Ratios of net investment loss to average net assets: | | | | | | | | | | | | | | | | | | | | | | | | |
Before expense reimbursement and/or fee waiver by Adviser | | | (0.52 | )%(d) | | | (0.16 | )% | | | (0.59 | )% | | | (0.69 | )% | | | (0.49 | )% | | | (0.41 | )% |
After expense reimbursement and/or fee waiver by Adviser | | | (0.52 | )%(d) | | | (0.16 | )% | | | (0.59 | )% | | | (0.69 | )% | | | (0.49 | )% | | | (0.40 | )% |
Portfolio Turnover | | | 37.71 | %(c) | | | 71.28 | %(g)(h) | | | 48.22 | %(g) | | | 47.25 | % | | | 62.13 | % | | | 89.92 | % |
| | (a) | The selected per share data was calculated using the weighted average shares outstanding method for the period. |
| | (b) | The total return is calculated using the Net Asset Value used for trading at the close of business at period end. |
| | (e) | Ratios of expenses to average net assets include interest expense of less than 0.005% for the year ended October 31, 2012, which is not included in the contractual expense limitation. The interest expense is from utilizing the line of credit, as discussed in Note H to the Financial Statements. |
| | (f) | The Adviser removed the contractual expense limitation of 1.30%, excluding interest, taxes, investment-related costs (such as brokerage commissions), extraordinary expenses and acquired fund fees and expenses, effective March 1, 2009. |
| | (g) | Portfolio turnover rate excludes securities delivered from processing redemptions-in-kind. |
| | (h) | Portfolio turnover rate excludes securities received from processing a subscription-in-kind. |
See accompanying Notes to Financial Statements.
| | |
| |
| ASTON/TAMRO Small Cap Fund – Class I | | April 30, 2014 |
| |
| Financial Highlights | | |
| | | | | | | | | | | | | | | | | | | | | | | | |
| | | Six Months
Ended
04/30/14
(unaudited) | | | Year
Ended
10/31/13 | | | Year
Ended
10/31/12 | | | Year
Ended
10/31/11 | | | Year
Ended
10/31/10 | | | Year
Ended
10/31/09 | |
| | | | | | | | | | | | | | | | | | | | | | | | |
Net Asset Value, Beginning of Period | | $ | 24.69 | | | $ | 20.96 | | | $ | 20.91 | | | $ | 19.69 | | | $ | 14.87 | | | $ | 13.79 | |
| | | | | | | | | | | | | | | | | | | | | | | | |
Income from Investment Operations: | | | | | | | | | | | | | | | | | | | | | | | | |
Net investment income (loss) | | | (0.03 | ) | | | 0.02 | (a) | | | (0.07 | )(a) | | | (0.09 | )(a) | | | (0.04 | )(a) | | | (0.02 | )(a) |
Net realized and unrealized gain (loss) on investments | | | (0.93 | ) | | | 5.69 | | | | 2.14 | | | | 1.76 | | | | 4.87 | | | | 1.12 | |
| | | | | | | | | | | | | | | | | | | | | | | | |
Total from investment operations | | | (0.96 | ) | | | 5.71 | | | | 2.07 | | | | 1.67 | | | | 4.83 | | | | 1.10 | |
| | | | | | | | | | | | | | | | | | | | | | | | |
Less Distributions: | | | | | | | | | | | | | | | | | | | | | | | | |
Distributions from and in excess of net investment income | | | — | | | | — | | | | — | | | | — | | | | (0.01 | ) | | | (0.02 | ) |
Distributions from net realized gain on investments | | | (2.16 | ) | | | (1.98 | ) | | | (2.02 | ) | | | (0.45 | ) | | | — | | | | — | |
| | | | | | | | | | | | | | | | | | | | | | | | |
Total distributions | | | (2.16 | ) | | | (1.98 | ) | | | (2.02 | ) | | | (0.45 | ) | | | (0.01 | ) | | | (0.02 | ) |
| | | | | | | | | | | | | | | | | | | | | | | | |
Net increase (decrease) in net asset value | | | (3.12 | ) | | | 3.73 | | | | 0.05 | | | | 1.22 | | | | 4.82 | | | | 1.08 | |
| | | | | | | | | | | | | | | | | | | | | | | | |
Net Asset Value, End of Period | | $ | 21.57 | | | $ | 24.69 | | | $ | 20.96 | | | $ | 20.91 | | | $ | 19.69 | | | $ | 14.87 | |
| | | | | | | | | | | | | | | | | | | | | | | | |
Total Return (b) | | | (4.42 | )%(c) | | | 29.84 | % | | | 10.98 | % | | | 8.40 | % | | | 32.62 | % | | | 7.94 | % |
| | | | | | |
Ratios/Supplemental Data: | | | | | | | | | | | | | | | | | | | | | | | | |
Net Assets, End of Period (in 000’s) | | $ | 698,668 | | | $ | 792,172 | | | $ | 635,663 | | | $ | 625,315 | | | $ | 549,627 | | | $ | 515,592 | |
Ratios of expenses to average net assets: | | | | | | | | | | | | | | | | | | | | | | | | |
Before expense reimbursement and/or fee waiver by Adviser | | | 1.06 | %(d) | | | 1.06 | % | | | 1.03 | %(e) | | | 1.04 | % | | | 1.09 | % | | | 1.12 | % |
After expense reimbursement and/or fee waiver by Adviser | | | 1.06 | %(d) | | | 1.06 | % | | | 1.03 | %(e) | | | 1.04 | % | | | 1.09 | % | | | 1.11 | %(f) |
Ratios of net investment income (loss) to average net assets: | | | | | | | | | | | | | | | | | | | | | | | | |
Before expense reimbursement and/or fee waiver by Adviser | | | (0.27 | )%(d) | | | 0.09 | % | | | (0.34 | )% | | | (0.44 | )% | | | (0.24 | )% | | | (0.16 | )% |
After expense reimbursement and/or fee waiver by Adviser | | | (0.27 | )%(d) | | | 0.09 | % | | | (0.34 | )% | | | (0.44 | )% | | | (0.24 | )% | | | (0.15 | )% |
Portfolio Turnover | | | 37.71 | %(c) | | | 71.28 | %(g)(h) | | | 48.22 | %(g) | | | 47.25 | % | | | 62.13 | % | | | 89.92 | % |
| | (a) | The selected per share data was calculated using the weighted average shares outstanding method for the period. |
| | (b) | The total return is calculated using the Net Asset Value used for trading at the close of business at period end. |
| | (e) | Ratios of expenses to average net assets include interest expense of less than 0.005% for the year ended October 31, 2012, which is not included in the contractual expense limitation. The interest expense is from utilizing the line of credit, as discussed in Note H to the Financial Statements. |
| | (f) | The Adviser removed the contractual expense limitation of 1.05%, excluding interest, taxes, investment-related costs (such as brokerage commissions), extraordinary expenses and acquired fund fees and expenses, effective March 1, 2009. |
| | (g) | Portfolio turnover rate excludes securities delivered from processing redemptions-in-kind. |
| | (h) | Portfolio turnover rate excludes securities received from processing a subscription-in-kind. |
See accompanying Notes to Financial Statements.
| | |
| |
| ASTON/River Road Select Value Fund – Class N | | April 30, 2014 |
| |
| Financial Highlights | | |
| | | | | | | | | | | | | | | | | | | | | | | | |
| | | Six Months
Ended
04/30/14
(unaudited) | | | Year
Ended
10/31/13 | | | Year
Ended
10/31/12 | | | Year
Ended
10/31/11 | | | Year
Ended
10/31/10 | | | Year
Ended
10/31/09 | |
| | | | | | | | | | | | | | | | | | | | | | | | |
Net Asset Value, Beginning of Period | | $ | 10.28 | | | $ | 8.50 | | | $ | 9.54 | | | $ | 9.01 | | | $ | 7.71 | | | $ | 7.13 | |
| | | | | | | | | | | | | | | | | | | | | | | | |
Income from Investment Operations: | | | | | | | | | | | | | | | | | | | | | | | | |
Net investment income (loss) | | | (0.02 | ) | | | 0.07 | (a) | | | 0.01 | (a) | | | (0.02 | )(a) | | | 0.02 | (a) | | | — | (a)(b) |
Net realized and unrealized gain on investments | | | 0.06 | | | | 2.34 | | | | 1.01 | | | | 0.66 | | | | 1.28 | | | | 0.59 | |
| | | | | | | | | | | | | | | | | | | | | | | | |
Total from investment operations | | | 0.04 | | | | 2.41 | | | | 1.02 | | | | 0.64 | | | | 1.30 | | | | 0.59 | |
| | | | | | | | | | | | | | | | | | | | | | | | |
Less Distributions: | | | | | | | | | | | | | | | | | | | | | | | | |
Distributions from net investment income | | | (0.02 | ) | | | (0.12 | ) | | | — | | | | (0.03 | ) | | | — | | | | (0.01 | ) |
Distributions from net realized gains on investments | | | (1.49 | ) | | | (0.51 | ) | | | (2.06 | ) | | | (0.08 | ) | | | — | | | | — | |
| | | | | | | | | | | | | | | | | | | | | | | | |
Total distributions | | | (1.51 | ) | | | (0.63 | ) | | | (2.06 | ) | | | (0.11 | ) | | | — | | | | (0.01 | ) |
| | | | | | | | | | | | | | | | | | | | | | | | |
Net increase (decrease) in net asset value | | | (1.47 | ) | | | 1.78 | | | | (1.04 | ) | | | 0.53 | | | | 1.30 | | | | 0.58 | |
| | | | | | | | | | | | | | | | | | | | | | | | |
Net Asset Value, End of Period | | $ | 8.81 | | | $ | 10.28 | | | $ | 8.50 | | | $ | 9.54 | | | $ | 9.01 | | | $ | 7.71 | |
| | | | | | | | | | | | | | | | | | | | | | | | |
Total Return (c) | | | 0.11 | %(d) | | | 30.44 | % | | | 12.87 | % | | | 7.12 | % | | | 16.86 | % | | | 8.33 | % |
| | | | | | |
Ratios/Supplemental Data: | | | | | | | | | | | | | | | | | | | | | | | | |
Net Assets, End of Period (in 000’s) | | $ | 16,554 | | | $ | 19,099 | | | $ | 6,270 | | | $ | 13,160 | | | $ | 52,522 | | | $ | 41,801 | |
Ratios of expenses to average net assets: | | | | | | | | | | | | | | | | | | | | | | | | |
Before expense reimbursement and/or fee waiver, or recoupment by Adviser | | | 1.45 | %(e) | | | 1.46 | % | | | 1.43 | %(f) | | | 1.42 | %(f) | | | 1.41 | %(f) | | | 1.44 | % |
After expense reimbursement and/or fee waiver, or recoupment by Adviser | | | 1.45 | %(e) | | | 1.46 | % | | | 1.43 | %(f) | | | 1.42 | %(f) | | | 1.43 | %(f) | | | 1.50 | % |
Ratios of net investment income (loss) to average net assets: | | | | | | | | | | | | | | | | | | | | | | | | |
Before expense reimbursement and/or fee waiver, or recoupment by Adviser | | | (0.42 | )%(e) | | | 0.78 | % | | | 0.07 | % | | | (0.18 | )% | | | 0.31 | % | | | 0.04 | % |
After expense reimbursement and/or fee waiver, or recoupment by Adviser | | | (0.42 | )%(e) | | | 0.78 | % | | | 0.07 | % | | | (0.18 | )% | | | 0.29 | % | | | (0.02 | )% |
Portfolio Turnover | | | 34.35 | %(d) | | | 71.01 | % | | | 38.84 | % | | | 48.22 | % | | | 53.73 | % | | | 44.09 | % |
| | (a) | The selected per share data was calculated using the weighted average shares outstanding method for the period. |
| | (b) | Represents less than $(0.005) per share. |
| | (c) | The total return is calculated using the Net Asset Value used for trading at the close of business at period end. |
| | (f) | Ratios of expenses to average net assets include interest expenses of less than 0.005% for each of the years ended October 31, 2012, October 31, 2011 and October 31, 2010, which are not included in the contractual expense limitation. The interest expenses are from utilizing the line of credit as discussed in Note H to the Financial Statements. |
See accompanying Notes to Financial Statements.
| | |
| |
| ASTON/River Road Select Value Fund – Class I | | April 30, 2014 |
| |
| Financial Highlights | | |
| | | | | | | | | | | | | | | | | | | | | | | | |
| | | Six Months
Ended
04/30/14
(unaudited) | | | Year
Ended
10/31/13 | | | Year
Ended
10/31/12 | | | Year
Ended
10/31/11 | | | Year
Ended
10/31/10 | | | Year
Ended
10/31/09 | |
| | | | | | | | | | | | | | | | | | | | | | | | |
Net Asset Value, Beginning of Period | | $ | 10.38 | | | $ | 8.58 | | | $ | 9.59 | | | $ | 9.04 | | | $ | 7.73 | | | $ | 7.14 | |
| | | | | | | | | | | | | | | | | | | | | | | | |
Income from Investment Operations: | | | | | | | | | | | | | | | | | | | | | | | | |
Net investment income (loss) | | | — | (a) | | | 0.10 | (b) | | | 0.03 | (b) | | | 0.01 | (b) | | | 0.05 | (b) | | | 0.02 | (b) |
Net realized and unrealized gain on investments | | | 0.05 | | | | 2.36 | | | | 1.02 | | | | 0.67 | | | | 1.28 | | | | 0.59 | |
| �� | | | | | | | | | | | | | | | | | | | | | | | |
Total from investment operations | | | 0.05 | | | | 2.46 | | | | 1.05 | | | | 0.68 | | | | 1.33 | | | | 0.61 | |
| | | | | | | | | | | | | | | | | | | | | | | | |
Less Distributions: | | | | | | | | | | | | | | | | | | | | | | | | |
Distributions from net investment income | | | (0.04 | ) | | | (0.15 | ) | | | — | | | | (0.05 | ) | | | (0.02 | ) | | | (0.02 | ) |
Distributions from net realized gains on investments | | | (1.49 | ) | | | (0.51 | ) | | | (2.06 | ) | | | (0.08 | ) | | | — | | | | — | |
| | | | | | | | | | | | | | | | | | | | | | | | |
Total distributions | | | (1.53 | ) | | | (0.66 | ) | | | (2.06 | ) | | | (0.13 | ) | | | (0.02 | ) | | | (0.02 | ) |
| | | | | | | | | | | | | | | | | | | | | | | | |
Net increase (decrease) in net asset value | | | (1.48 | ) | | | 1.80 | | | | (1.01 | ) | | | 0.55 | | | | 1.31 | | | | 0.59 | |
| | | | | | | | | | | | | | | | | | | | | | | | |
Net Asset Value, End of Period | | $ | 8.90 | | | $ | 10.38 | | | $ | 8.58 | | | $ | 9.59 | | | $ | 9.04 | | | $ | 7.73 | |
| | | | | | | | | | | | | | | | | | | | | | | | |
Total Return (c) | | | 0.22 | %(d) | | | 30.74 | % | | | 13.18 | % | | | 7.56 | % | | | 17.19 | % | | | 8.52 | % |
| | | | | | |
Ratios/Supplemental Data: | | | | | | | | | | | | | | | | | | | | | | | | |
Net Assets, End of Period (in 000’s) | | $ | 193,270 | | | $ | 198,220 | | | $ | 156,510 | | | $ | 130,527 | | | $ | 163,232 | | | $ | 167,334 | |
Ratios of expenses to average net assets: | | | | | | | | | | | | | | | | | | | | | | | | |
Before expense reimbursement and/or fee waiver, or recoupment by Adviser | | | 1.20 | %(e) | | | 1.21 | % | | | 1.18 | %(f) | | | 1.17 | %(f) | | | 1.16 | %(f) | | | 1.19 | % |
After expense reimbursement and/or fee waiver, or recoupment by Adviser | | | 1.20 | %(e) | | | 1.21 | % | | | 1.18 | %(f) | | | 1.17 | %(f) | | | 1.18 | %(f) | | | 1.25 | % |
Ratios of net investment income (loss) to average net assets: | | | | | | | | | | | | | | | | | | | | | | | | |
Before expense reimbursement and/or fee waiver, or recoupment by Adviser | | | (0.17 | )%(e) | | | 1.03 | % | | | 0.32 | % | | | 0.07 | % | | | 0.56 | % | | | 0.29 | % |
After expense reimbursement and/or fee waiver, or recoupment by Adviser | | | (0.17 | )%(e) | | | 1.03 | % | | | 0.32 | % | | | 0.07 | % | | | 0.54 | % | | | 0.23 | % |
Portfolio Turnover | | | 34.35 | %(d) | | | 71.01 | % | | | 38.84 | % | | | 48.22 | % | | | 53.73 | % | | | 44.09 | % |
| | (a) | Represents less than $(0.005) per share. |
| | (b) | The selected per share data was calculated using the weighted average shares outstanding method for the period. |
| | (c) | The total return is calculated using the Net Asset Value used for trading at the close of business at period end. |
| | (f) | Ratios of expenses to average net assets include interest expenses of less than 0.005% for each of the years ended October 31, 2012, October 31, 2011 and October 31, 2010, which are not included in the contractual expense limitation. The interest expenses are from utilizing the line of credit, as discussed in Note H to the Financial Statements. |
See accompanying Notes to Financial Statements.
| | |
| |
| ASTON/River Road Small Cap Value Fund – Class N | | April 30, 2014 |
| |
| Financial Highlights | | |
| | | | | | | | | | | | | | | | | | | | | | | | |
| | | Six Months
Ended
04/30/14
(unaudited) | | | Year
Ended
10/31/13 | | | Year
Ended
10/31/12 | | | Year
Ended
10/31/11 | | | Year
Ended
10/31/10 | | | Year
Ended
10/31/09 | |
| | | | | | | | | | | | | | | | | | | | | | | | |
Net Asset Value, Beginning of Period | | $ | 17.05 | | | $ | 13.56 | | | $ | 12.20 | | | $ | 11.60 | | | $ | 10.22 | | | $ | 9.30 | |
| | | | | | | | | | | | | | | | | | | | | | | | |
Income from Investment Operations: | | | | | | | | | | | | | | | | | | | | | | | | |
Net investment income (loss) | | | (0.02 | )(a) | | | 0.16 | | | | 0.03 | (a) | | | (0.03 | ) | | | 0.03 | | | | 0.01 | |
Net realized and unrealized gain on investments | | | 0.32 | | | | 3.98 | | | | 1.33 | | | | 0.67 | | | | 1.36 | | | | 0.92 | |
| | | | | | | | | | | | | | | | | | | | | | | | |
Total from investment operations | | | 0.30 | | | | 4.14 | | | | 1.36 | | | | 0.64 | | | | 1.39 | | | | 0.93 | |
| | | | | | | | | | | | | | | | | | | | | | | | |
Less Distributions: | | | | | | | | | | | | | | | | | | | | | | | | |
Distributions from and in excess of net investment income | | | (0.04 | ) | | | (0.22 | ) | | | — | | | | (0.04 | ) | | | (0.01 | ) | | | (0.01 | ) |
Distributions from net realized gain on investments | | | (3.58 | ) | | | (0.43 | ) | | | — | | | | — | | | | — | | | | — | |
| | | | | | | | | | | | | | | | | | | | | | | | |
Total distributions | | | (3.62 | ) | | | (0.65 | ) | | | — | | | | (0.04 | ) | | | (0.01 | ) | | | (0.01 | ) |
| | | | | | | | | | | | | | | | | | | | | | | | |
Net increase (decrease) in net asset value | | | (3.32 | ) | | | 3.49 | | | | 1.36 | | | | 0.60 | | | | 1.38 | | | | 0.92 | |
| | | | | | | | | | | | | | | | | | | | | | | | |
Net Asset Value, End of Period | | $ | 13.73 | | | $ | 17.05 | | | $ | 13.56 | | | $ | 12.20 | | | $ | 11.60 | | | $ | 10.22 | |
| | | | | | | | | | | | | | | | | | | | | | | | |
| | | | | | |
Total Return (b) | | | 1.43 | %(c) | | | 31.98 | % | | | 11.15 | % | | | 5.46 | % | | | 13.60 | % | | | 9.99 | % |
| | | | | | |
Ratios/Supplemental Data: | | | | | | | | | | | | | | | | | | | | | | | | |
Net Assets, End of Period (in 000’s) | | $ | 54,747 | | | $ | 56,793 | | | $ | 49,154 | | | $ | 91,347 | | | $ | 213,326 | | | $ | 216,221 | |
Ratios of expenses to average net assets: | | | | | | | | | | | | | | | | | | | | | | | | |
Before expense reimbursement and/or fee waiver by Adviser | | | 1.33 | %(d) | | | 1.34 | % | | | 1.37 | % | | | 1.37 | %(e) | | | 1.39 | %(e) | | | 1.40 | % |
After expense reimbursement and/or fee waiver by Adviser | | | 1.33 | %(d) | | | 1.34 | % | | | 1.37 | % | | | 1.37 | %(e) | | | 1.39 | %(e) | | | 1.40 | %(f) |
Ratios of net investment income (loss) to average net assets: | | | | | | | | | | | | | | | | | | | | | | | | |
Before expense reimbursement and/or fee waiver by Adviser | | | (0.31 | )%(d) | | | 1.03 | % | | | 0.22 | % | | | (0.13 | )% | | | 0.27 | % | | | 0.05 | % |
After expense reimbursement and/or fee waiver by Adviser | | | (0.31 | )%(d) | | | 1.03 | % | | | 0.22 | % | | | (0.13 | )% | | | 0.27 | % | | | 0.05 | % |
Portfolio Turnover | | | 29.83 | %(c) | | | 56.08 | % | | | 26.95 | % | | | 42.29 | % | | | 51.05 | % | | | 35.83 | % |
| | (a) | The selected per share data was calculated using the weighted average shares outstanding method for the period. |
| | (b) | The total return is calculated using the Net Asset Value used for trading at the close of business at period end. |
| | (e) | Ratios of expenses to average net assets include interest expenses of less than 0.005% for each of the years ended October 31, 2011 and October 31, 2010, which are not included in the contractual expense limitation. The interest expenses are from utilizing the line of credit, as discussed in Note H to the Financial Statements. |
| | (f) | The Adviser removed the contractual expense limitation of 1.50%, excluding interest, taxes, investment-related costs (such as brokerage commissions), extraordinary expenses and acquired fund fees and expenses, effective March 1, 2009. |
See accompanying Notes to Financial Statements.
| | |
| |
| ASTON/River Road Small Cap Value Fund – Class I | | April 30, 2014 |
| |
| Financial Highlights | | |
| | | | | | | | | | | | | | | | | | | | | | | | |
| | | Six Months
Ended
04/30/14
(unaudited) | | | Year
Ended
10/31/13 | | | Year
Ended
10/31/12 | | | Year
Ended
10/31/11 | | | Year
Ended
10/31/10 | | | Year
Ended
10/31/09 | |
| | | | | | | | | | | | | | | | | | | | | | | | |
Net Asset Value, Beginning of Period | | $ | 17.13 | | | $ | 13.62 | | | $ | 12.22 | | | $ | 11.62 | | | $ | 10.24 | | | $ | 9.32 | |
| | | | | | | | | | | | | | | | | | | | | | | | |
Income from Investment Operations: | | | | | | | | | | | | | | | | | | | | | | | | |
Net investment income (loss) | | | — | (a)(b) | | | 0.19 | | | | 0.06 | (a) | | | 0.01 | | | | 0.06 | | | | 0.03 | |
Net realized and unrealized gain on investments | | | 0.32 | | | | 4.01 | | | | 1.34 | | | | 0.65 | | | | 1.35 | | | | 0.92 | |
| | | | | | | | | | | | | | | | | | | | | | | | |
Total from investment operations | | | 0.32 | | | | 4.20 | | | | 1.40 | | | | 0.66 | | | | 1.41 | | | | 0.95 | |
| | | | | | | | | | | | | | | | | | | | | | | | |
Less Distributions: | | | | | | | | | | | | | | | | | | | | | | | | |
Distributions from and in excess of net investment income | | | (0.08 | ) | | | (0.26 | ) | | | — | | | | (0.06 | ) | | | (0.03 | ) | | | (0.03 | ) |
Distributions from net realized gain on investments | | | (3.58 | ) | | | (0.43 | ) | | | — | | | | — | | | | — | | | | — | |
| | | | | | | | | | | | | | | | | | | | | | | | |
Total distributions | | | (3.66 | ) | | | (0.69 | ) | | | — | | | | (0.06 | ) | | | (0.03 | ) | | | (0.03 | ) |
| | | | | | | | | | | | | | | | | | | | | | | | |
Net increase (decrease) in net asset value | | | (3.34 | ) | | | 3.51 | | | | 1.40 | | | | 0.60 | | | | 1.38 | | | | 0.92 | |
| | | | | | | | | | | | | | | | | | | | | | | | |
Net Asset Value, End of Period | | $ | 13.79 | | | $ | 17.13 | | | $ | 13.62 | | | $ | 12.22 | | | $ | 11.62 | | | $ | 10.24 | |
| | | | | | | | | | | | | | | | | | | | | | | | |
Total Return (c) | | | 1.56 | %(d) | | | 32.36 | % | | | 11.46 | % | | | 5.70 | % | | | 13.80 | % | | | 10.31 | % |
| | | | | | |
Ratios/Supplemental Data: | | | | | | | | | | | | | | | | | | | | | | | | |
Net Assets, End of Period (in 000’s) | | $ | 261,120 | | | $ | 252,804 | | | $ | 240,075 | | | $ | 246,141 | | | $ | 255,344 | | | $ | 282,542 | |
Ratios of expenses to average net assets: | | | | | | | | | | | | | | | | | | | | | | | | |
Before expense reimbursement and/or fee waiver by Adviser | | | 1.08 | %(e) | | | 1.09 | % | | | 1.12 | % | | | 1.12 | %(f) | | | 1.14 | %(f) | | | 1.15 | % |
After expense reimbursement and/or fee waiver by Adviser | | | 1.08 | %(e) | | | 1.09 | % | | | 1.12 | % | | | 1.12 | %(f) | | | 1.14 | %(f) | | | 1.15 | %(g) |
Ratios of net investment income (loss) to average net assets: | | | | | | | | | | | | | | | | | | | | | | | | |
Before expense reimbursement and/or fee waiver by Adviser | | | (0.06 | )%(e) | | | 1.28 | % | | | 0.47 | % | | | 0.12 | % | | | 0.52 | % | | | 0.30 | % |
After expense reimbursement and/or fee waiver by Adviser | | | (0.06 | )%(e) | | | 1.28 | % | | | 0.47 | % | | | 0.12 | % | | | 0.52 | % | | | 0.30 | % |
Portfolio Turnover | | | 29.83 | %(d) | | | 56.08 | % | | | 26.95 | % | | | 42.29 | % | | | 51.05 | % | | | 35.83 | % |
| | (a) | The selected per share data was calculated using the weighted average shares outstanding method for the period. |
| | (b) | Represents less than $(0.005) per share. |
| | (c) | The total return is calculated using the Net Asset Value used for trading at the close of business at period end. |
| | (f) | Ratios of expenses to average net assets include interest expenses of less than 0.005% for each of the years ended October 31, 2011 and October 31, 2010, which are not included in the contractual expense limitation. The interest expenses are from utilizing the line of credit, as discussed in Note H to the Financial Statements. |
| | (g) | The Adviser removed the contractual expense limitation of 1.25%, excluding interest, taxes, investment-related costs (such as brokerage commissions), extraordinary expenses and acquired fund fees and expenses, effective March 1, 2009. |
See accompanying Notes to Financial Statements.
| | |
| |
| ASTON/River Road Independent Value Fund – Class N | | April 30, 2014 |
| |
| Financial Highlights | | |
| | | | | | | | | | | | | | | | |
| | | Six Months
Ended
04/30/14
(unaudited) | | | Year
Ended
10/31/13 | | | Year
Ended
10/31/12 | | | Period
Ended
10/31/11(a) | |
Net Asset Value, Beginning of Period | | $ | 11.47 | | | $ | 11.42 | | | $ | 10.75 | | | $ | 10.00 | |
| | | | | | | | | | | | | | | | |
Income from Investment Operations: | | | | | | | | | | | | | | | | |
Net investment loss | | | (0.06 | ) | | | (0.07 | ) | | | (0.09 | )(b) | | | (0.07 | )(b) |
Net realized and unrealized gain on investments | | | 0.30 | | | | 0.75 | | | | 0.88 | | | | 0.82 | |
| | | | | | | | | | | | | | | | |
Total from investment operations | | | 0.24 | | | | 0.68 | | | | 0.79 | | | | 0.75 | |
| | | | | | | | | | | | | | | | |
Less Distributions: | | | | | | | | | | | | | | | | |
Distributions from net realized gain on investments | | | (0.45 | ) | | | (0.63 | ) | | | (0.12 | ) | | | — | |
| | | | | | | | | | | | | | | | |
Total distributions | | | (0.45 | ) | | | (0.63 | ) | | | (0.12 | ) | | | — | |
| | | | | | | | | | | | | | | | |
Net increase (decrease) in net asset value | | | (0.21 | ) | | | 0.05 | | | | 0.67 | | | | 0.75 | |
| | | | | | | | | | | | | | | | |
Net Asset Value, End of Period | | $ | 11.26 | | | $ | 11.47 | | | $ | 11.42 | | | $ | 10.75 | |
| | | | | | | | | | | | | | | | |
Total Return (c) | | | 2.12 | %(d) | | | 6.37 | % | | | 7.41 | % | | | 7.50 | %(d) |
| | | | |
Ratios/Supplemental Data: | | | | | | | | | | | | | | | | |
Net Assets, End of Period (in 000’s) | | $ | 308,274 | | | $ | 339,088 | | | $ | 362,416 | | | $ | 306,223 | |
Ratios of expenses to average net assets: | | | | | | | | | | | | | | | | |
Before earnings credit, expense reimbursement and/or fee waiver by Adviser | | | 1.42 | %(e)(f) | | | 1.43 | %(f) | | | 1.44 | %(f) | | | 1.59 | %(e) |
After earnings credit, expense reimbursement and/or fee waiver Adviser | | | 1.41 | %(e)(f) | | | 1.41 | %(f) | | | 1.42 | %(f) | | | 1.42 | %(e) |
Ratios of net investment loss to average net assets: | | | | | | | | | | | | | | | | |
Before earnings credit, expense reimbursement and/or fee waiver by Adviser | | | (0.97 | )%(e) | | | (0.61 | )% | | | (0.81 | )% | | | (0.98 | )%(e) |
After earnings credit, expense reimbursement and/or fee waiver Adviser | | | (0.96 | )%(e) | | | (0.59 | )% | | | (0.79 | )% | | | (0.80 | )%(e) |
Portfolio Turnover | | | 43.18 | %(d) | | | 82.24 | %(g) | | | 141.17 | % | | | 105.69 | %(d) |
| | (a) | The inception date for the River Road Independent Value Fund Class N shares is December 31, 2010. |
| | (b) | The selected per share data was calculated using the weighted average shares outstanding method for the period. |
| | (c) | The total return is calculated using the Net Asset Value used for trading at the close of business at period end. |
| | (f) | Ratios of expenses to average net assets include Earnings Credits of 0.01% for the six months ended April 30, 2014 and year ended October 31, 2013 and less than 0.005% for the year ended October 31, 2012, which are not included in the contractual expense limitation. See Note I to the Financial Statements. |
| | (g) | Portfolio turnover rate excludes securities received from processing a subscription-in-kind. |
See accompanying Notes to Financial Statements.
| | |
| |
| ASTON/River Road Independent Value Fund – Class I | | April 30, 2014 |
| |
| Financial Highlights | | |
| | | | | | | | | | | | | | | | |
| | | Six Months
Ended
04/30/14
(unaudited) | | | Year
Ended
10/31/13 | | | Year
Ended
10/31/12 | | | Period
Ended
10/31/11(a) | |
Net Asset Value, Beginning of Period | | $ | 11.54 | | | $ | 11.46 | | | $ | 10.75 | | | $ | 10.92 | |
| | | | | | | | | | | | | | | | |
Income from Investment Operations: | | | | | | | | | | | | | | | | |
Net investment loss | | | (0.04 | ) | | | (0.04 | ) | | | (0.06 | )(b) | | | (0.02 | )(b) |
Net realized and unrealized gain (loss) on investments | | | 0.29 | | | | 0.75 | | | | 0.89 | | | | (0.15 | ) |
| | | | | | | | | | | | | | | | |
Total from investment operations | | | 0.25 | | | | 0.71 | | | | 0.83 | | | | (0.17 | ) |
| | | | | | | | | | | | | | | | |
Less Distributions: | | | | | | | | | | | | | | | | |
Distributions from net realized gain on investments | | | (0.45 | ) | | | (0.63 | ) | | | (0.12 | ) | | | — | |
| | | | | | | | | | | | | | | | |
Total distributions | | | (0.45 | ) | | | (0.63 | ) | | | (0.12 | ) | | | — | |
| | | | | | | | | | | | | | | | |
Net increase (decrease) in net asset value | | | (0.20 | ) | | | 0.08 | | | | 0.71 | | | | (0.17 | ) |
| | | | | | | | | | | | | | | | |
Net Asset Value, End of Period | | $ | 11.34 | | | $ | 11.54 | | | $ | 11.46 | | | $ | 10.75 | |
| | | | | | | | | | | | | | | | |
Total Return (c) | | | 2.19 | %(d) | | | 6.62 | % | | | 7.68 | % | | | (1.47 | )%(d) |
| | | | |
Ratios/Supplemental Data: | | | | | | | | | | | | | | | | |
Net Assets, End of Period (in 000’s) | | $ | 425,865 | | | $ | 386,268 | | | $ | 338,234 | | | $ | 85,478 | |
Ratios of expenses to average net assets: | | | | | | | | | | | | | | | | |
Before earnings credit, expense reimbursement and/or fee waiver by Adviser | | | 1.17 | %(e)(f) | | | 1.18 | %(f) | | | 1.19 | %(f) | | | 1.34 | %(e) |
After earnings credit, expense reimbursement and/or fee waiver by Adviser | | | 1.16 | %(e)(f) | | | 1.16 | %(f) | | | 1.17 | %(f) | | | 1.17 | %(e) |
Ratios of net investment loss to average net assets: | | | | | | | | | | | | | | | | |
Before earnings credit, expense reimbursement and/or fee waiver by Adviser | | | (0.72 | )%(e) | | | (0.36 | )% | | | (0.56 | )% | | | (0.73 | )%(e) |
After earnings credit, expense reimbursement and/or fee waiver, or recoupment by Adviser | | | (0.71 | )%(e) | | | (0.34 | )% | | | (0.54 | )% | | | (0.55 | )%(e) |
Portfolio Turnover | | | 43.18 | %(d) | | | 82.24 | %(g) | | | 141.17 | % | | | 105.69 | %(d) |
| | (a) | The inception date for the River Road Independent Value Fund Class I shares is June 1, 2011. |
| | (b) | The selected per share data was calculated using the weighted average shares outstanding method for the period. |
| | (c) | The total return is calculated using the Net Asset Value used for trading at the close of business at period end. |
| | (f) | Ratios of expenses to average net assets include Earnings Credits of 0.01% for the six months ended April 30, 2014 and year ended October 31, 2013 and less than 0.005% for the year ended October 31, 2012, which are not included in the contractual expense limitation. See Note I to the Financial Statements. |
| | (g) | Portfolio turnover rate excludes securities received from processing a subscription-in-kind. |
See accompanying Notes to Financial Statements.
| | |
| |
| ASTON/DoubleLine Core Plus Fixed Income Fund – Class N | | April 30, 2014 |
| |
| Financial Highlights | | |
| | | | | | | | | | | | | | | | |
| | | Six Months
Ended
04/30/14
(unaudited) | | | Year
Ended
10/31/13 | | | Year
Ended
10/31/12 | | | Period
Ended
10/31/11(a) | |
Net Asset Value, Beginning of Period | | $ | 10.65 | | | $ | 11.10 | | | $ | 10.44 | | | $ | 10.00 | |
| | | | | | | | | | | | | | | | |
Income from Investment Operations: | | | | | | | | | | | | | | | | |
Net investment income | | | 0.18 | | | | 0.30 | | | | 0.33 | (b) | | | 0.12 | (b) |
Net realized and unrealized gain (loss) on investments | | | 0.10 | | | | (0.33 | ) | | | 0.72 | | | | 0.41 | |
| | | | | | | | | | | | | | | | |
Total from investment operations | | | 0.28 | | | | (0.03 | ) | | | 1.05 | | | | 0.53 | |
| | | | | | | | | | | | | | | | |
Less Distributions: | | | | | | | | | | | | | | | | |
Distributions from and in excess of net investment income | | | (0.21 | ) | | | (0.36 | ) | | | (0.37 | ) | | | (0.09 | ) |
Distributions from net realized gain on investments | | | — | | | | (0.06 | ) | | | (0.02 | ) | | | — | |
| | | | | | | | | | | | | | | | |
Total distributions | | | (0.21 | ) | | | (0.42 | ) | | | (0.39 | ) | | | (0.09 | ) |
| | | | | | | | | | | | | | | | |
Net increase (decrease) in net asset value | | | 0.07 | | | | (0.45 | ) | | | 0.66 | | | | 0.44 | |
| | | | | | | | | | | | | | | | |
Net Asset Value, End of Period | | $ | 10.72 | | | $ | 10.65 | | | $ | 11.10 | | | $ | 10.44 | |
| | | | | | | | | | | | | | | | |
Total Return (c) | | | 2.65 | %(d) | | | (0.28 | )% | | | 10.25 | % | | | 5.33 | %(d) |
| | | | |
Ratios/Supplemental Data: | | | | | | | | | | | | | | | | |
Net Assets, End of Period (in 000’s) | | $ | 42,693 | | | $ | 66,368 | | | $ | 71,546 | | | $ | 22,657 | |
Ratios of expenses to average net assets: | | | | | | | | | | | | | | | | |
Before expense reimbursement and/or fee waiver by Adviser | | | 1.10 | %(e) | | | 1.04 | % | | | 1.35 | % | | | 3.16 | %(e) |
After expense reimbursement and/or fee waiver by Adviser | | | 0.94 | %(e) | | | 0.94 | % | | | 0.94 | % | | | 0.94 | %(e) |
Ratios of net investment income to average net assets: | | | | | | | | | | | | | | | | |
Before expense reimbursement and/or fee waiver by Adviser | | | 3.35 | %(e) | | | 2.66 | % | | | 2.59 | % | | | 1.63 | %(e) |
After expense reimbursement and/or fee waiver by Adviser | | | 3.51 | %(e) | | | 2.77 | % | | | 3.01 | % | | | 3.85 | %(e) |
Portfolio Turnover | | | 36.26 | %(d) | | | 125.07 | % | | | 118.67 | % | | | 38.49 | %(d) |
| | (a) | The inception date for the DoubleLine Core Plus Fixed Income Fund Class N shares is July 18, 2011. |
| | (b) | The selected per share data was calculated using the weighted average shares outstanding method for the period. |
| | (c) | The total return is calculated using the Net Asset Value used for trading at the close of business at period end. |
See accompanying Notes to Financial Statements.
| | |
| |
| ASTON/DoubleLine Core Plus Fixed Income Fund – Class I | | April 30, 2014 |
| |
| Financial Highlights | | |
| | | | | | | | | | | | | | | | |
| | | Six Months
Ended
04/30/14
(unaudited) | | | Year
Ended
10/31/13 | | | Year
Ended
10/31/12 | | | Period
Ended
10/31/11(a) | |
Net Asset Value, Beginning of Period | | $ | 10.65 | | | $ | 11.10 | | | $ | 10.44 | | | $ | 10.00 | |
| | | | | | | | | | | | | | | | |
Income from Investment Operations: | | | | | | | | | | | | | | | | |
Net investment income | | | 0.19 | | | | 0.33 | | | | 0.35 | (b) | | | 0.13 | (b) |
Net realized and unrealized gain (loss) on investments | | | 0.10 | | | | (0.33 | ) | | | 0.73 | | | | 0.41 | |
| | | | | | | | | | | | | | | | |
Total from investment operations | | | 0.29 | | | | — | | | | 1.08 | | | | 0.54 | |
| | | | | | | | | | | | | | | | |
Less Distributions: | | | | | | | | | | | | | | | | |
Distributions from and in excess of net investment income | | | (0.22 | ) | | | (0.39 | ) | | | (0.40 | ) | | | (0.10 | ) |
Distributions from net realized gain on investments | | | — | | | | (0.06 | ) | | | (0.02 | ) | | | — | |
| | | | | | | | | | | | | | | | |
Total distributions | | | (0.22 | ) | | | (0.45 | ) | | | (0.42 | ) | | | (0.10 | ) |
| | | | | | | | | | | | | | | | |
Net increase (decrease) in net asset value | | | 0.07 | | | | (0.45 | ) | | | 0.66 | | | | 0.44 | |
| | | | | | | | | | | | | | | | |
Net Asset Value, End of Period | | $ | 10.72 | | | $ | 10.65 | | | $ | 11.10 | | | $ | 10.44 | |
| | | | | | | | | | | | | | | | |
Total Return (c) | | | 2.78 | %(d) | | | (0.03 | )% | | | 10.52 | % | | | 5.38 | %(d) |
| | | | |
Ratios/Supplemental Data: | | | | | | | | | | | | | | | | |
Net Assets, End of Period (in 000’s) | | $ | 83,147 | | | $ | 110,018 | | | $ | 105,335 | | | $ | 4,486 | |
Ratios of expenses to average net assets: | | | | | | | | | | | | | | | | |
Before expense reimbursement and/or fee waiver by Adviser | | | 0.85 | %(e) | | | 0.79 | % | | | 1.10 | % | | | 2.91 | %(e) |
After expense reimbursement and/or fee waiver by Adviser | | | 0.69 | %(e) | | | 0.69 | % | | | 0.69 | % | | | 0.69 | %(e) |
Ratios of net investment income to average net assets: | | | | | | | | | | | | | | | | |
Before expense reimbursement and/or fee waiver by Adviser | | | 3.60 | %(e) | | | 2.91 | % | | | 2.84 | % | | | 1.88 | %(e) |
After expense reimbursement and/or fee waiver by Adviser | | | 3.76 | %(e) | | | 3.02 | % | | | 3.26 | % | | | 4.10 | %(e) |
Portfolio Turnover | | | 36.26 | %(d) | | | 125.07 | % | | | 118.67 | % | | | 38.49 | %(d) |
| | (a) | The inception date for the DoubleLine Core Plus Fixed Income Fund Class I shares is July 18, 2011. |
| | (b) | The selected per share data was calculated using the weighted average shares outstanding method for the period. |
| | (c) | The total return is calculated using the Net Asset Value used for trading at the close of business at period end. |
See accompanying Notes to Financial Statements.
| | |
| |
| ASTON/TCH Fixed Income Fund – Class N | | April 30, 2014 |
| |
| Financial Highlights | | |
| | | | | | | | | | | | | | | | | | | | | | | | |
| | | Six Months
Ended
04/30/14
(unaudited) | | | Year
Ended
10/31/13 | | | Year
Ended
10/31/12 | | | Year
Ended
10/31/11 | | | Year
Ended
10/31/10 | | | Year
Ended
10/31/09 | |
Net Asset Value, Beginning of Period | | $ | 10.67 | | | $ | 11.11 | | | $ | 10.59 | | | $ | 10.49 | | | $ | 10.02 | | | $ | 8.60 | |
| | | | | | | | | | | | | | | | | | | | | | | | |
Income from Investment Operations: | | | | | | | | | | | | | | | | | | | | | | | | |
Net investment income | | | 0.18 | (a) | | | 0.40 | (a) | | | 0.45 | (a) | | | 0.47 | (a) | | | 0.50 | (a) | | | 0.49 | (a) |
Net realized and unrealized gain (loss) on investments | | | 0.13 | | | | (0.39 | ) | | | 0.56 | | | | 0.10 | | | | 0.47 | | | | 1.44 | |
| | | | | | | | | | | | | | | | | | | | | | | | |
Total from investment operations | | | 0.31 | | | | 0.01 | | | | 1.01 | | | | 0.57 | | | | 0.97 | | | | 1.93 | |
| | | | | | | | | | | | | | | | | | | | | | | | |
Less Distributions: | | | | | | | | | | | | | | | | | | | | | | | | |
Distributions from and in excess of net investment income | | | (0.20 | ) | | | (0.45 | ) | | | (0.49 | ) | | | (0.47 | ) | | | (0.50 | ) | | | (0.51 | ) |
| | | | | | | | | | | | | | | | | | | | | | | | |
Total distributions | | | (0.20 | ) | | | (0.45 | ) | | | (0.49 | ) | | | (0.47 | ) | | | (0.50 | ) | | | (0.51 | ) |
| | | | | | | | | | | | | | | | | | | | | | | | |
Net increase (decrease) in net asset value | | | 0.11 | | | | (0.44 | ) | | | 0.52 | | | | 0.10 | | | | 0.47 | | | | 1.42 | |
| | | | | | | | | | | | | | | | | | | | | | | | |
Net Asset Value, End of Period | | $ | 10.78 | | | $ | 10.67 | | | $ | 11.11 | | | $ | 10.59 | | | $ | 10.49 | | | $ | 10.02 | |
| | | | | | | | | | | | | | | | | | | | | | | | |
Total Return (b) | | | 2.93 | %(c) | | | 0.13 | % | | | 9.74 | % | | | 5.62 | % | | | 9.98 | % | | | 22.99 | % |
| | | | | | |
Ratios/Supplemental Data: | | | | | | | | | | | | | | | | | | | | | | | | |
Net Assets, End of Period (in 000’s) | | $ | 43,450 | | | $ | 45,771 | | | $ | 59,772 | | | $ | 62,346 | | | $ | 46,274 | | | $ | 47,008 | |
Ratios of expenses to average net assets: | | | | | | | | | | | | | | | | | | | | | | | | |
Before expense reimbursement and/or fee waiver by Adviser | | | 1.19 | %(d) | | | 1.02 | % | | | 1.02 | % | | | 1.14 | % | | | 0.98 | % | | | 0.96 | % |
After expense reimbursement and/or fee waiver by Adviser | | | 0.94 | %(d) | | | 0.84 | % | | | 0.86 | % | | | 0.88 | %(e) | | | 0.62 | % | | | 0.61 | % |
Ratios of net investment income to average net assets: | | | | | | | | | | | | | | | | | | | | | | | | |
Before expense reimbursement and/or fee waiver by Adviser | | | 3.21 | %(d) | | | 3.49 | % | | | 4.03 | % | | | 4.20 | % | | | 4.51 | % | | | 4.93 | % |
After expense reimbursement and/or fee waiver by Adviser | | | 3.45 | %(d) | | | 3.67 | % | | | 4.19 | % | | | 4.46 | % | | | 4.87 | % | | | 5.28 | % |
Portfolio Turnover | | | 14.54 | %(c) | | | 53.77 | % | | | 57.43 | % | | | 37.51 | % | | | 23.92 | % | | | 40.81 | % |
| | (a) | The selected per share data was calculated using the weighted average shares outstanding method for the period. |
| | (b) | The total return is calculated using the Net Asset Value used for trading at the close of business at period end. |
| | (e) | Effective March 1, 2011, the contractual expense limitation was increased from 0.74% to 0.94%, excluding interest, taxes, investment-related costs (such as brokerage commissions), extraordinary expenses and acquired fund fees and expenses. |
See accompanying Notes to Financial Statements.
| | |
| |
| ASTON/TCH Fixed Income Fund – Class I | | April 30, 2014 |
| |
| Financial Highlights | | |
| | | | | | | | | | | | | | | | | | | | | | | | |
| | | Six Months
Ended
04/30/14
(unaudited) | | | Year
Ended
10/31/13 | | | Year
Ended
10/31/12 | | | Year
Ended
10/31/11 | | | Year
Ended
10/31/10 | | | Year
Ended
10/31/09 | |
Net Asset Value, Beginning of Period | | $ | 10.67 | | | $ | 11.11 | | | $ | 10.59 | | | $ | 10.49 | | | $ | 10.02 | | | $ | 8.60 | |
| | | | | | | | | | | | | | | | | | | | | | | | |
Income from Investment Operations: | | | | | | | | | | | | | | | | | | | | | | | | |
Net investment income | | | 0.20 | (a) | | | 0.42 | (a) | | | 0.47 | (a) | | | 0.49 | (a) | | | 0.51 | (a) | | | 0.50 | (a) |
Net realized and unrealized gain (loss) on investments | | | 0.12 | | | | (0.39 | ) | | | 0.55 | | | | 0.11 | | | | 0.48 | | | | 1.44 | |
| | | | | | | | | | | | | | | | | | | | | | | | |
Total from investment operations | | | 0.32 | | | | 0.03 | | | | 1.02 | | | | 0.60 | | | | 0.99 | | | | 1.94 | |
| | | | | | | | | | | | | | | | | | | | | | | | |
Less Distributions: | | | | | | | | | | | | | | | | | | | | | | | | |
Distributions from and in excess of net investment income | | | (0.21 | ) | | | (0.47 | ) | | | (0.50 | ) | | | (0.50 | ) | | | (0.52 | ) | | | (0.52 | ) |
| | | | | | | | | | | | | | | | | | | | | | | | |
Total distributions | | | (0.21 | ) | | | (0.47 | ) | | | (0.50 | ) | | | (0.50 | ) | | | (0.52 | ) | | | (0.52 | ) |
| | | | | | | | | | | | | | | | | | | | | | | | |
Net increase (decrease) in net asset value . | | | 0.11 | | | | (0.44 | ) | | | 0.52 | | | | 0.10 | | | | 0.47 | | | | 1.42 | |
| | | | | | | | | | | | | | | | | | | | | | | | |
Net Asset Value, End of Period | | $ | 10.78 | | | $ | 10.67 | | | $ | 11.11 | | | $ | 10.59 | | | $ | 10.49 | | | $ | 10.02 | |
| | | | | | | | | | | | | | | | | | | | | | | | |
Total Return (b) | | | 3.06 | %(c) | | | 0.28 | % | | | 9.93 | % | | | 5.89 | % | | | 10.11 | % | | | 23.14 | % |
| | | | | | |
Ratios/Supplemental Data: | | | | | | | | | | | | | | | | | | | | | | | | |
Net Assets, End of Period (in 000’s) | | $ | 9,134 | | | $ | 8,742 | | | $ | 10,396 | | | $ | 10,423 | | | $ | 14,881 | | | $ | 20,276 | |
Ratios of expenses to average net assets: | | | | | | | | | | | | | | | | | | | | | | | | |
Before expense reimbursement and/or fee waiver by Adviser | | | 0.94 | %(d) | | | 0.87 | % | | | 0.85 | % | | | 0.89 | % | | | 0.85 | % | | | 0.84 | % |
After expense reimbursement and/or fee waiver
by Adviser | | | 0.69 | %(d) | | | 0.69 | % | | | 0.69 | % | | | 0.63 | %(e) | | | 0.49 | % | | | 0.49 | % |
Ratios of net investment income to average net assets: | | | | | | | | | | | | | | | | | | | | | | | | |
Before expense reimbursement and/or fee waiver by
Adviser | | | 3.46 | %(d) | | | 3.64 | % | | | 4.20 | % | | | 4.45 | % | | | 4.64 | % | | | 5.05 | % |
After expense reimbursement and/or fee waiver by Adviser | | | 3.70 | %(d) | | | 3.82 | % | | | 4.36 | % | | | 4.71 | % | | | 5.00 | % | | | 5.40 | % |
Portfolio Turnover | | | 14.54 | %(c) | | | 53.77 | % | | | 57.43 | % | | | 37.51 | % | | | 23.92 | % | | | 40.81 | % |
| | (a) | The selected per share data was calculated using the weighted average shares outstanding method for the period. |
| | (b) | The total return is calculated using the Net Asset Value used for trading at the close of business at period end. |
| | (e) | Effective March 1, 2011, the contractual expense limitation was increased from 0.49% to 0.69%, excluding interest, taxes, investment-related costs (such as brokerage commissions), extraordinary expenses and acquired fund fees and expenses. |
See accompanying Notes to Financial Statements.
| | |
| |
| ASTON/Lake Partners LASSO Alternatives Fund – Class N | | April 30, 2014 |
| |
| Financial Highlights | | |
| | | | | | | | | | | | | | | | | | | | |
| | | Six Months
Ended
04/30/14
(unaudited) | | | Year
Ended
10/31/13 | | | Year
Ended
10/31/12 | | | Year
Ended
10/31/11 | | | Period
Ended
10/31/10(a) | |
Net Asset Value, Beginning of Period | | $ | 13.34 | | | $ | 12.39 | | | $ | 11.94 | | | $ | 11.97 | | | $ | 11.48 | |
| | | | | | | | | | | | | | | | | | | | |
Income from Investment Operations: | | | | | | | | | | | | | | | | | | | | |
Net investment income (loss) | | | (0.03 | )(b) | | | — | (b)(c) | | | 0.04 | (b) | | | (0.01 | )(b) | | | 0.04 | (b) |
Net realized and unrealized gain on investments | | | 0.47 | | | | 1.11 | | | | 0.59 | | | | 0.13 | | | | 0.45 | |
| | | | | | | | | | | | | | | | | | | | |
Total from investment operations | | | 0.44 | | | | 1.11 | | | | 0.63 | | | | 0.12 | �� | | | 0.49 | |
| | | | | | | | | | | | | | | | | | | | |
Less Distributions: | | | | | | | | | | | | | | | | | | | | |
Distributions from and in excess of net investment income | | | (0.09 | ) | | | (0.16 | ) | | | (0.18 | ) | | | (0.08 | ) | | | — | |
Distributions from capital gains | | | (0.04 | ) | | | — | | | | — | | | | (0.07 | ) | | | — | |
| | | | | | | | | | | | | | | | | | | | |
Total distributions | | | (0.13 | ) | | | (0.16 | ) | | | (0.18 | ) | | | (0.15 | ) | | | — | |
| | | | | | | | | | | | | | | | | | | | |
Net increase (decrease) in net asset value | | | 0.31 | | | | 0.95 | | | | 0.45 | | | | (0.03 | ) | | | 0.49 | |
| | | | | | | | | | | | | | | | | | | | |
Net Asset Value, End of Period | | $ | 13.65 | | | $ | 13.34 | | | $ | 12.39 | | | $ | 11.94 | | | $ | 11.97 | |
| | | | | | | | | | | | | | | | | | | | |
Total Return (d) | | | 3.35 | %(e) | | | 9.05 | % | | | 5.34 | % | | | 0.92 | % | | | 4.27 | %(e) |
| | | | | |
Ratios/Supplemental Data: | | | | | | | | | | | | | | | | | | | | |
Net Assets, End of Period (in 000’s) | | $ | 46,954 | | | $ | 54,388 | | | $ | 33,719 | | | $ | 17,626 | | | $ | 8,296 | |
Ratios of expenses to average net assets: | | | | | | | | | | | | | | | | | | | | |
Before earnings credit, expense reimbursement and/or fee waiver, or recoupment by Adviser (f) | | | 1.42 | %(g) | | | 1.43 | %(h) | | | 1.41 | %(h)(i) | | | 1.53 | % | | | 2.19 | %(g) |
After earnings credit, expense reimbursement and/or fee waiver, or recoupment by Adviser (f) | | | 1.45 | %(g) | | | 1.45 | %(h) | | | 1.45 | %(h)(i) | | | 1.45 | % | | | 1.45 | %(g)(j) |
Ratios of net investment income (loss) to average net assets: | | | | | | | | | | | | | | | | | | | | |
Before earnings credit, expense reimbursement and/or fee waiver, or recoupment by Adviser | | | (0.35 | )%(g) | | | — | %(c) | | | 0.36 | %(i) | | | (0.17 | )% | | | (0.25 | )%(g) |
After earnings credit, expense reimbursement and/or fee waiver, or recoupment by Adviser | | | (0.38 | )%(g) | | | (0.03 | )% | | | 0.32 | %(i) | | | (0.10 | )% | | | 0.49 | %(g) |
Portfolio Turnover | | | 18.58 | %(e) | | | 43.55 | % | | | 45.60 | % | | | 79.77 | % | | | 116.68 | %(e) |
| | (a) | The inception date for the Lake Partners LASSO Alternatives Fund Class N shares is March 3, 2010. |
| | (b) | The selected per share data was calculated using the weighted average shares outstanding method for the period. |
| | (c) | Represents less than $0.005 per share or less than 0.005%. |
| | (d) | The total return is calculated using the Net Asset Value used for trading at the close of business at period end. |
| | (f) | Does not include expenses of the underlying funds in which the Fund invests. |
| | (h) | Ratios of expenses to average net assets include Earnings Credits of less than 0.005% for each of the years ended October 31, 2013 and October 31, 2012, which are not included in the contractual expense limitation. See Note I to the Financial Statements. |
| | (i) | Ratios of expenses and net investment income to average net assets include advisory fee waiver of less than 0.005% for the year ended October 31, 2012. |
| | (j) | Effective March 30, 2010, the contractual expense limitation was decreased from 1.60% to 1.45%, excluding interest, taxes, investment-related costs (such as brokerage commissions), extraordinary expenses and acquired fund fees and expenses. |
See accompanying Notes to Financial Statements.
| | |
| |
| ASTON/Lake Partners LASSO Alternatives Fund – Class I | | April 30, 2014 |
| |
| Financial Highlights | | |
| | | | | | | | | | | | | | | | | | | | | | | | |
| | | Six
Months
Ended
04/30/14
(unaudited) | | | Year
Ended
10/31/13 | | | Year
Ended
10/31/12 | | | Year
Ended
10/31/11 | | | Year
Ended
10/31/10 | | | Period
Ended
10/31/09(a) | |
| | | | | | | | | | | | | | | | | | | | | | | | |
Net Asset Value, Beginning of Period | | $ | 13.38 | | | $ | 12.42 | | | $ | 11.97 | | | $ | 11.98 | | | $ | 11.15 | | | $ | 10.00 | |
| | | | | | | | | | | | | | | | | | | | | | | | |
Income from Investment Operations: | | | | | | | | | | | | | | | | | | | | | | | | |
Net investment income (loss) | | | (0.01 | )(b) | | | 0.03 | (b) | | | 0.07 | (b) | | | 0.02 | (b) | | | 0.08 | (b) | | | — | (c) |
Net realized and unrealized gain on investments | | | 0.47 | | | | 1.11 | | | | 0.59 | | | | 0.13 | | | | 0.89 | | | | 1.15 | |
| | | | | | | | | | | | | | | | | | | | | | | | |
Total from investment operations | | | 0.46 | | | | 1.14 | | | | 0.66 | | | | 0.15 | | | | 0.97 | | | | 1.15 | |
| | | | | | | | | | | | | | | | | | | | | | | | |
Less Distributions: | | | | | | | | | | | | | | | | | | | | | | | | |
Distributions from and in excess of net investment income | | | (0.12 | ) | | | (0.18 | ) | | | (0.21 | ) | | | (0.09 | ) | | | (0.07 | ) | | | — | |
Distributions from net realized gain on investments | | | (0.04 | ) | | | — | | | | — | | | | (0.07 | ) | | | (0.07 | ) | | | — | |
| | | | | | | | | | | | | | | | | | | | | | | | |
Total distributions | | | (0.16 | ) | | | (0.18 | ) | | | (0.21 | ) | | | (0.16 | ) | | | (0.14 | ) | | | — | |
| | | | | | | | | | | | | | | | | | | | | | | | |
Net increase (decrease) in net asset value | | | 0.30 | | | | 0.96 | | | | 0.45 | | | | (0.01 | ) | | | 0.83 | | | | 1.15 | |
| | | | | | | | | | | | | | | | | | | | | | | | |
Net Asset Value, End of Period | | $ | 13.68 | | | $ | 13.38 | | | $ | 12.42 | | | $ | 11.97 | | | $ | 11.98 | | | $ | 11.15 | |
| | | | | | | | | | | | | | | | | | | | | | | | |
Total Return (d) | | | 3.49 | %(e) | | | 9.31 | % | | | 5.56 | % | | | 1.22 | % | | | 8.74 | % | | | 11.50 | %(e) |
| | | | | | |
Ratios/Supplemental Data: | | | | | | | | | | | | | | | | | | | | | | | | |
Net Assets, End of Period (in 000’s) | | $ | 447,636 | | | $ | 416,475 | | | $ | 253,343 | | | $ | 189,999 | | | $ | 19,723 | | | $ | 1,845 | |
Ratios of expenses to average net assets: | | | | | | | | | | | | | | | | | | | | | | | | |
Before earnings credit, expense reimbursement and/or fee waiver, or recoupment by Adviser (f) | | | 1.17 | %(g) | | | 1.18 | %(h) | | | 1.16 | %(h)(i) | | | 1.28 | % | | | 2.32 | % | | | 18.16 | %(g) |
After earnings credit, expense reimbursement and/or fee waiver, or recoupment by Adviser (f) | | | 1.20 | %(g) | | | 1.20 | %(h) | | | 1.20 | %(h)(i) | | | 1.20 | % | | | 1.24 | %(j) | | | 1.35 | %(g) |
Ratios of net investment income (loss) to average net assets: | | | | | | | | | | | | | | | | | | | | | | | | |
Before earnings credit, expense reimbursement and/or fee waiver, or recoupment by Adviser | | | (0.10 | )%(g) | | | 0.25 | % | | | 0.61 | %(i) | | | 0.08 | % | | | (0.41 | )% | | | (16.92 | )%(g) |
After earnings credit, expense reimbursement and/or fee waiver, or recoupment by Adviser | | | (0.13 | )%(g) | | | 0.22 | % | | | 0.57 | %(i) | | | 0.15 | % | | | 0.67 | % | | | (0.11 | )%(g) |
Portfolio Turnover | | | 18.58 | %(e) | | | 43.55 | % | | | 45.60 | % | | | 79.77 | % | | | 116.68 | % | | | 65.93 | %(e) |
| | (a) | The inception date for the Lake Partners LASSO Alternatives Fund Class I shares is April 1, 2009. |
| | (b) | The selected per share data was calculated using the weighted average shares outstanding method for the period. |
| | (c) | Represents less than $(0.005) per share. |
| | (d) | The total return is calculated using the Net Asset Value used for trading at the close of business at period end. |
| | (f) | Does not include expenses of the underlying funds in which the Fund invests. |
| | (h) | Ratios of expenses to average net assets include Earnings Credits of less than 0.005% for each of the years ended October 31, 2013 and October 31, 2012, which are not included in the contractual expense limitation. See Note I to the Financial Statements. |
| | (i) | Ratios of expenses and net investment income to average net assets include advisory fee waiver of less than 0.005% for the year ended October 31, 2012. |
| | (j) | Effective March 30, 2010, the contractual expense limitation was decreased from 1.35% to 1.20%, excluding interest, taxes, investment-related costs (such as brokerage commissions), extraordinary expenses and acquired fund fees and expenses. |
See accompanying Notes to Financial Statements.
| | |
| |
| ASTON/Anchor Capital Enhanced Equity Fund – Class N | | April 30, 2014 |
| |
| Financial Highlights | | |
| | | | | | | | | | | | | | | | | | | | | | | | |
| | | Six Months
Ended
04/30/14
(unaudited) | | | Year
Ended
10/31/13 | | | Year
Ended
10/31/12 | | | Year
Ended
10/31/11 | | | Year
Ended
10/31/10 | | | Year
Ended
10/31/09 | |
| | | | | | | | | | | | | | | | | | | | | | | | |
Net Asset Value, Beginning of Period | | $ | 9.39 | | | $ | 8.68 | | | $ | 9.61 | | | $ | 9.41 | | | $ | 8.57 | | | $ | 8.09 | |
| | | | | | | | | | | | | | | | | | | | | | | | |
Income from Investment Operations: | | | | | | | | | | | | | | | | | | | | | | | | |
Net investment income | | | 0.08 | | | | 0.20 | | | | 0.16 | | | | 0.14 | | | | 0.10 | | | | 0.11 | |
Net realized and unrealized gain on investments | | | — | (a) | | | 0.86 | | | | 0.11 | | | | 0.56 | | | | 0.84 | | | | 1.02 | |
| | | | | | | | | | | | | | | | | | | | | | | | |
Total from investment operations | | | 0.08 | | | | 1.06 | | | | 0.27 | | | | 0.70 | | | | 0.94 | | | | 1.13 | |
| | | | | | | | | | | | | | | | | | | | | | | | |
Less Distributions: | | | | | | | | | | | | | | | | | | | | | | | | |
Distributions from and in excess of net investment income | | | (0.08 | ) | | | (0.20 | ) | | | (0.16 | ) | | | (0.13 | ) | | | (0.10 | ) | | | (0.13 | ) |
Distributions from net realized gain on investments | | | — | | | | (0.15 | ) | | | (1.04 | ) | | | (0.37 | ) | | | — | | | | (0.52 | ) |
| | | | | | | | | | | | | | | | | | | | | | | | |
Total distributions | | | (0.08 | ) | | | (0.35 | ) | | | (1.20 | ) | | | (0.50 | ) | | | (0.10 | ) | | | (0.65 | ) |
| | | | | | | | | | | | | | | | | | | | | | | | |
Net increase (decrease) in net asset value | | | — | | | | 0.71 | | | | (0.93 | ) | | | 0.20 | | | | 0.84 | | | | 0.48 | |
| | | | | | | | | | | | | | | | | | | | | | | | |
Net Asset Value, End of Period | | $ | 9.39 | | | $ | 9.39 | | | $ | 8.68 | | | $ | 9.61 | | | $ | 9.41 | | | $ | 8.57 | |
| | | | | | | | | | | | | | | | | | | | | | | | |
Total Return (b) | | | 0.91 | %(c) | | | 12.60 | % | | | 3.12 | % | | | 7.69 | % | | | 11.05 | % | | | 15.86 | % |
| | | | | | |
Ratios/Supplemental Data: | | | | | | | | | | | | | | | | | | | | | | | | |
Net Assets, End of Period (in 000’s) | | $ | 106,020 | | | $ | 101,663 | | | $ | 106,191 | | | $ | 48,365 | | | $ | 46,423 | | | $ | 22,552 | |
Ratios of expenses to average net assets: | | | | | | | | | | | | | | | | | | | | | | | | |
Before earnings credit, expense reimbursement and/or fee waiver, or recoupment by Adviser | | | 1.21 | %(d) | | | 1.23 | %(e) | | | 1.22 | %(e)(f) | | | 1.24 | %(f) | | | 1.37 | % | | | 2.11 | % |
After earnings credit, expense reimbursement and/or fee waiver, or recoupment by Adviser | | | 1.21 | %(d) | | | 1.23 | %(e) | | | 1.27 | %(e)(f) | | | 1.33 | %(f) | | | 1.40 | % | | | 1.25 | %(g) |
Ratios of net investment income to average net assets: | | | | | | | | | | | | | | | | | | | | | | | | |
Before earnings credit, expense reimbursement and/or fee waiver, or recoupment by Adviser | | | 1.92 | %(d) | | | 2.24 | % | | | 1.82 | % | | | 1.51 | % | | | 1.20 | % | | | 0.55 | % |
After earnings credit, expense reimbursement and/or fee waiver, or recoupment by Adviser | | | 1.92 | %(d) | | | 2.24 | % | | | 1.78 | % | | | 1.41 | % | | | 1.17 | % | | | 1.41 | % |
Portfolio Turnover | | | 21.80 | %(c) | | | 77.70 | % | | | 56.33 | % | | | 87.37 | % | | | 41.33 | % | | | 51.56 | % |
| | (a) | Represents less than $0.005 per share. |
| | (b) | The total return is calculated using the Net Asset Value used for trading at the close of business at period end. |
| | (e) | Ratios of expenses to average net assets include Earnings Credits of less than 0.005% for each of the years ended October 31, 2013 and October 31, 2012, which are not included in the contractual expense limitation. See Note I to the Financial Statements. |
| | (f) | Ratios of expenses to average net assets include interest expenses of less than 0.005% for each of the years ended October 31, 2012 and October 31, 2011, which are not included in the contractual expense limitation. The interest expenses are from utilizing the line of credit as discussed in Note H to the Financial Statements. |
| | (g) | Effective June 1, 2009, due to the change in Subadviser, the contractual expense limitation was increased from 1.10% to 1.40%, excluding interest, taxes, investment-related costs (such as brokerage commissions), extraordinary expenses and acquired fund fees and expenses. |
See accompanying Notes to Financial Statements.
| | |
| |
| ASTON/Anchor Capital Enhanced Equity Fund – Class I | | April 30, 2014 |
| |
| Financial Highlights | | |
| | | | | | | | | | | | | | | | | | | | |
| | | Six Months
Ended
04/30/14
(unaudited) | | | Year
Ended
10/31/13 | | | Year
Ended
10/31/12 | | | Year
Ended
10/31/11 | | | Period
Ended
10/31/10(a) | |
| | | | | | | | | | | | | | | | | | | | |
Net Asset Value, Beginning of Period | | $ | 9.40 | | | $ | 8.69 | | | $ | 9.62 | | | $ | 9.41 | | | $ | 9.04 | |
| | | | | | | | | | | | | | | | | | | | |
Income from Investment Operations: | | | | | | | | | | | | | | | | | | | | |
Net investment income | | | 0.10 | | | | 0.22 | | | | 0.18 | | | | 0.16 | | | | 0.09 | |
Net realized and unrealized gain on investments | | | — | (b) | | | 0.86 | | | | 0.11 | | | | 0.57 | | | | 0.37 | |
| | | | | | | | | | | | | | | | | | | | |
Total from investment operations | | | 0.10 | | | | 1.08 | | | | 0.29 | | | | 0.73 | | | | 0.46 | |
| | | | | | | | | | | | | | | | | | | | |
Less Distributions: | | | | | | | | | | | | | | | | | | | | |
Distributions from and in excess of net investment income | | | (0.10 | ) | | | (0.22 | ) | | | (0.18 | ) | | | (0.15 | ) | | | (0.09 | ) |
Distributions from net realized gain on investments | | | — | | | | (0.15 | ) | | | (1.04 | ) | | | (0.37 | ) | | | — | |
| | | | | | | | | | | | | | | | | | | | |
Total distributions | | | (0.10 | ) | | | (0.37 | ) | | | (1.22 | ) | | | (0.52 | ) | | | (0.09 | ) |
| | | | | | | | | | | | | | | | | | | | |
Net increase (decrease) in net asset value | | | — | | | | 0.71 | | | | (0.93 | ) | | | 0.21 | | | | 0.37 | |
| | | | | | | | | | | | | | | | | | | | |
Net Asset Value, End of Period | | $ | 9.40 | | | $ | 9.40 | | | $ | 8.69 | | | $ | 9.62 | | | $ | 9.41 | |
| | | | | | | | | | | | | | | | | | | | |
Total Return (c) | | | 1.03 | %(d) | | | 12.88 | % | | | 3.46 | % | | | 7.97 | % | | | 5.10 | %(d) |
| | | | | |
Ratios/Supplemental Data: | | | | | | | | | | | | | | | | | | | | |
Net Assets, End of Period (in 000’s) | | $ | 77,407 | | | $ | 58,099 | | | $ | 71,618 | | | $ | 64,840 | | | $ | 46,140 | |
Ratios of expenses to average net assets: | | | | | | | | | | | | | | | | | | | | |
Before earnings credit, expense reimbursement and/or fee waiver, or recoupment by Adviser | | | 0.96 | %(e) | | | 0.98 | %(f) | | | 0.97 | %(f)(g) | | | 0.99 | %(g) | | | 1.10 | %(e) |
After earnings credit, expense reimbursement and/or fee waiver, or recoupment by Adviser | | | 0.96 | %(e) | | | 0.98 | %(f) | | | 1.02 | %(f)(g) | | | 1.08 | %(g) | | | 1.15 | %(e) |
Ratios of net investment income to average net assets: | | | | | | | | | | | | | | | | | | | | |
Before earnings credit, expense reimbursement and/or fee waiver, or recoupment by Adviser | | | 2.17 | %(e) | | | 2.49 | % | | | 2.07 | % | | | 1.76 | % | | | 1.37 | %(e) |
After earnings credit, expense reimbursement and/or fee waiver, or recoupment by Adviser | | | 2.17 | %(e) | | | 2.49 | % | | | 2.03 | % | | | 1.66 | % | | | 1.32 | %(e) |
Portfolio Turnover | | | 21.80 | %(d) | | | 77.70 | % | | | 56.33 | % | | | 87.37 | % | | | 41.33 | %(d) |
| | (a) | The inception date for the Anchor Capital Enhanced Equity Fund Class I shares is March 3, 2010. |
| | (b) | Represents less than $0.005 per share. |
| | (c) | The total return is calculated using the Net Asset Value used for trading at the close of business at period end. |
| | (f) | Ratios of expenses to average net assets include Earnings Credits of less than 0.005% for each of the years ended October 31, 2013 and October 31, 2012, which are not included in the contractual expense limitation. See Note I to the Financial Statements. |
| | (g) | Ratios of expenses to average net assets include interest expenses of less than 0.005% for each of the years ended October 31, 2012 and October 31, 2011, which are not included in the contractual expense limitation. The interest expenses are from utilizing the line of credit as discussed in Note H to the Financial Statements. |
See accompanying Notes to Financial Statements.
| | |
| |
| ASTON/River Road Long-Short Fund – Class N | | April 30, 2014 |
| |
| Financial Highlights | | |
| | | | | | | | | | | | | | | | |
| | | Six Months
Ended
04/30/14
(unaudited) | | | Year
Ended
10/31/13 | | | Year
Ended
10/31/12 | | | Period
Ended
10/31/11(a) | |
| | | | | | | | | | | | | | | | |
Net Asset Value, Beginning of Period | | $ | 12.02 | | | $ | 10.73 | | | $ | 9.91 | | | $ | 10.00 | |
| | | | | | | | | | | | | | | | |
Income from Investment Operations: | | | | | | | | | | | | | | | | |
Net investment loss | | | (0.08 | ) | | | (0.17 | )(b) | | | (0.18 | ) | | | (0.04 | )(b) |
Net realized and unrealized gain (loss) on investments | | | (0.15 | ) | | | 2.02 | | | | 1.00 | | | | (0.05 | ) |
| | | | | | | | | | | | | | | | |
Total from investment operations | | | (0.23 | ) | | | 1.85 | | | | 0.82 | | | | (0.09 | ) |
| | | | | | | | | | | | | | | | |
Less Distributions: | | | | | | | | | | | | | | | | |
Distributions from net realized gain on investments | | | (0.29 | ) | | | (0.56 | ) | | | — | | | | — | |
| | | | | | | | | | | | | | | | |
Total distributions | | | (0.29 | ) | | | (0.56 | ) | | | — | | | | — | |
| | | | | | | | | | | | | | | | |
Net increase (decrease) in net asset value | | | (0.52 | ) | | | 1.29 | | | | 0.82 | | | | (0.09 | ) |
| | | | | | | | | | | | | | | | |
Net Asset Value, End of Period | | $ | 11.50 | | | $ | 12.02 | | | $ | 10.73 | | | $ | 9.91 | |
| | | | | | | | | | | | | | | | |
Total Return (c) | | | (1.99 | )%(d) | | | 18.14 | % | | | 8.17 | % | | | (0.80 | )%(d) |
| | | | |
Ratios/Supplemental Data: | | | | | | | | | | | | | | | | |
Net Assets, End of Period (in 000’s) | | $ | 99,996 | | | $ | 108,966 | | | $ | 7,506 | | | $ | 4,594 | |
Ratios of expenses to average net assets: | | | | | | | | | | | | | | | | |
Before expense reimbursement and/or fee waiver, or recoupment by Adviser, including interest and dividend expense for securities sold short | | | 2.45 | %(e) | | | 2.54 | % | | | 5.03 | % | | | 8.68 | %(e) |
After expense reimbursement and/or fee waiver, or recoupment by Adviser, including interest and dividend expense for securities sold short | | | 2.49 | %(e) | | | 2.38 | % | | | 3.11 | % | | | 2.72 | %(e) |
After expense reimbursement and/or fee waiver, or recoupment by Adviser, excluding interest and dividend expense for securities sold short | | | 1.70 | %(e) | | | 1.70 | % | | | 1.70 | % | | | 1.70 | %(e) |
Ratios of net investment loss to average net assets: | | | | | | | | | | | | | | | | |
Before expense reimbursement and/or fee waiver, or recoupment by Adviser | | | (1.17 | )%(e) | | | (1.62 | )% | | | (3.63 | )% | | | (6.80 | )%(e) |
After expense reimbursement and/or fee waiver, or recoupment by Adviser | | | (1.22 | )%(e) | | | (1.46 | )% | | | (1.71 | )% | | | (0.84 | )%(e) |
Portfolio Turnover | | | 157.71 | %(d) | | | 291.36 | % | | | 277.72 | % | | | 127.32 | %(d) |
| | (a) | The inception date for the River Road Long-Short Fund Class N shares is May 4, 2011. |
| | (b) | The selected per share data was calculated using the weighted average shares outstanding method for the period. |
| | (c) | The total return is calculated using the Net Asset Value used for trading at the close of business at period end. |
See accompanying Notes to Financial Statements.
| | |
| |
| ASTON/River Road Long-Short Fund – Class I | | April 30, 2014 |
| |
| Financial Highlights | | |
| | | | | | | | |
| | | Six Months
Ended
04/30/14
(unaudited) | | | Period
Ended
10/31/13(a) | |
Net Asset Value, Beginning of Period | | $ | 12.05 | | | $ | 10.96 | |
| | | | | | | | |
Income from Investment Operations: | | | | | | | | |
Net investment loss | | | (0.05 | ) | | | (0.10 | )(b) |
Net realized and unrealized gain on investments | | | (0.17 | ) | | | 1.19 | |
| | | | | | | | |
Total from investment operations | | | (0.22 | ) | | | 1.09 | |
| | | | | | | | |
Less Distributions | | | | | | | | |
Distributions from net realized gain on investments | | | (0.29 | ) | | | — | |
| | | | | | | | |
Total distributions | | | (0.29 | ) | | | — | |
| | | | | | | | |
Net increase (decrease) in net asset value | | | (0.51 | ) | | | 1.09 | |
| | | | | | | | |
Net Asset Value, End of Period | | $ | 11.54 | | | $ | 12.05 | |
| | | | | | | | |
Total Return (c) | | | (1.82 | )%(d) | | | 9.85 | %(d) |
| | |
Ratios/Supplemental Data: | | | | | | | | |
Net Assets, End of Period (in 000’s) | | $ | 110,416 | | | $ | 71,175 | |
Ratios of expenses to average net assets: | | | | | | | | |
Before expense reimbursement and/or fee waiver, or recoupment by Adviser, including interest and
dividend expense for securities sold short | | | 2.20 | %(e) | | | 2.20 | %(e) |
After expense reimbursement and/or fee waiver, or recoupment by Adviser, including interest and
dividend expense for securities sold short | | | 2.24 | %(e) | | | 2.10 | %(e) |
After expense reimbursement and/or fee waiver, or recoupment by Adviser, excluding interest and
dividend expense for securities sold short | | | 1.45 | %(e) | | | 1.45 | %(e) |
Ratios of net investment loss to average net assets: | | | | | | | | |
Before expense reimbursement and/or fee waiver, or recoupment by Adviser | | | (0.92 | )%(e) | | | (1.44 | )%(e) |
After expense reimbursement and/or fee waiver, or recoupment by Adviser | | | (0.97 | )%(e) | | | (1.33 | )%(e) |
Portfolio Turnover | | | 157.71 | %(d) | | | 291.36 | %(d) |
| | (a) | The inception date for the River Road Long-Short Fund Class I shares is March 4, 2013. |
| | (b) | The selected per share data was calculated using the weighted average shares outstanding method for the period. |
| | (c) | The total return is calculated using the Net Asset Value used for trading at the close of business at period end. |
See accompanying Notes to Financial Statements.
| | |
| |
| ASTON/Barings International Fund – Class N | | April 30, 2014 |
| |
| Financial Highlights | | |
| | | | | | | | | | | | | | | | | | | | |
| | | Six Months
Ended
04/30/14
(unaudited) | | | Year
Ended
10/31/13 | | | Year
Ended
10/31/12 | | | Year
Ended
10/31/11 | | | Period
Ended
10/31/10(a) | |
Net Asset Value, Beginning of Period | | $ | 7.81 | | | $ | 6.87 | | | $ | 6.81 | | | $ | 7.24 | | | $ | 6.48 | |
| | | | | | | | | | | | | | | | | | | | |
Income from Investment Operations: | | | | | | | | | | | | | | | | | | | | |
Net investment income | | | 0.09 | | | | 0.11 | (b) | | | 0.10 | (b) | | | 0.07 | (b) | | | 0.06 | (b) |
Net realized and unrealized gain (loss) on investments | | | 0.05 | | | | 1.00 | | | | 0.17 | | | | (0.37 | ) | | | 0.70 | |
| | | | | | | | | | | | | | | | | | | | |
Total from investment operations | | | 0.14 | | | | 1.11 | | | | 0.27 | | | | (0.30 | ) | | | 0.76 | |
| | | | | | | | | | | | | | | | | | | | |
Less Distributions: | | | | | | | | | | | | | | | | | | | | |
Distributions from and in excess of net investment income | | | (0.18 | ) | | | (0.09 | ) | | | (0.04 | ) | | | (0.13 | ) | | | — | |
Distributions from net realized gain on investments | | | (0.48 | ) | | | (0.08 | ) | | | (0.17 | ) | | | — | | | | — | |
| | | | | | | | | | | | | | | | | | | | |
Total distributions | | | (0.66 | ) | | | (0.17 | ) | | | (0.21 | ) | | | (0.13 | ) | | | — | |
| | | | | | | | | | | | | | | | | | | | |
Net increase (decrease) in net asset value | | | (0.52 | ) | | | 0.94 | | | | 0.06 | | | | (0.43 | ) | | | 0.76 | |
| | | | | | | | | | | | | | | | | | | | |
Net Asset Value, End of Period | | $ | 7.29 | | | $ | 7.81 | | | $ | 6.87 | | | $ | 6.81 | | | $ | 7.24 | |
| | | | | | | | | | | | | | | | | | | | |
Total Return (c) | | | 1.71 | %(d) | | | 16.64 | % | | | 4.28 | % | | | (4.22 | )% | | | 11.73 | %(d) |
| | | | | |
Ratios/Supplemental Data: | | | | | | | | | | | | | | | | | | | | |
Net Assets, End of Period (in 000’s) | | $ | 494 | | | $ | 477 | | | $ | 421 | | | $ | 393 | | | $ | 184 | |
Ratios of expenses to average net assets: | | | | | | | | | | | | | | | | | | | | |
Before expense reimbursement and/or fee waiver by Adviser | | | 1.99 | %(e) | | | 1.67 | % | | | 1.60 | % | | | 1.68 | % | | | 1.72 | %(e) |
After expense reimbursement and/or fee waiver by Adviser | | | 1.40 | %(e) | | | 1.40 | % | | | 1.40 | % | | | 1.40 | %(f) | | | 1.40 | %(e) |
Ratios of net investment income to average net assets: | | | | | | | | | | | | | | | | | | | | |
Before expense reimbursement and/or fee waiver by Adviser | | | 1.75 | %(e) | | | 1.26 | % | | | 1.30 | % | | | 0.76 | % | | | 1.07 | %(e) |
After expense reimbursement and/or fee waiver by Adviser | | | 2.34 | %(e) | | | 1.53 | % | | | 1.50 | % | | | 1.04 | % | | | 1.39 | %(e) |
Portfolio Turnover | | | 26.72 | %(d) | | | 55.78 | % | | | 33.48 | % | | | 58.96 | % | | | 65.32 | %(d) |
| | (a) | The inception date for the Barings International Fund Class N shares is March 3, 2010. |
| | (b) | The selected per share data was calculated using the weighted average shares outstanding method for the period. |
| | (c) | The total return is calculated using the Net Asset Value used for trading at the close of business at period end. |
| | (f) | For the period November 1, 2010 through February 28, 2011, the Adviser implemented a voluntary expense limitation of 1.40%. Effective March 1, 2011, the contractual expense limitation was decreased from 1.50% to 1.40%, excluding interest, taxes, investment-related costs (such as brokerage commissions), extraordinary expenses and acquired fund fees and expenses. |
See accompanying Notes to Financial Statements.
| | |
| |
| ASTON/Barings International Fund – Class I | | April 30, 2014 |
| |
| Financial Highlights | | |
| | | | | | | | | | | | | | | | | | | | | | | | |
| | | Six Months
Ended
04/30/14
(unaudited) | | | Year
Ended
10/31/13 | | | Year
Ended
10/31/12 | | | Year
Ended
10/31/11 | | | Year
Ended
10/31/10 | | | Year
Ended
10/31/09 | |
| | | | | | | | | | | | | | | | | | | | | | | | |
Net Asset Value, Beginning of Period | | $ | 7.82 | | | $ | 6.89 | | | $ | 6.82 | | | $ | 7.26 | | | $ | 6.44 | | | $ | 5.08 | |
| | | | | | | | | | | | | | | | | | | | | | | | |
Income from Investment Operations: | | | | | | | | | | | | | | | | | | | | | | | | |
Net investment income | | | 0.10 | | | | 0.13 | (a) | | | 0.12 | (a) | | | 0.09 | (a) | | | 0.06 | (a) | | | 0.10 | (a) |
Net realized and unrealized gain (loss) on investments | | | 0.06 | | | | 0.99 | | | | 0.18 | | | | (0.38 | ) | | | 0.78 | | | | 1.27 | (b) |
| | | | | | | | | | | | | | | | | | | | | | | | |
Total from investment operations | | | 0.16 | | | | 1.12 | | | | 0.30 | | | | (0.29 | ) | | | 0.84 | | | | 1.37 | |
| | | | | | | | | | | | | | | | | | | | | | | | |
Less Distributions: | | | | | | | | | | | | | | | | | | | | | | | | |
Distributions from and in excess of net investment income | | | (0.20 | ) | | | (0.11 | ) | | | (0.06 | ) | | | (0.15 | ) | | | (0.02 | ) | | | (0.01 | ) |
Distributions from net realized gain on investments | | | (0.48 | ) | | | (0.08 | ) | | | (0.17 | ) | | | — | | | | — | | | | — | |
| | | | | | | | | | | | | | | | | | | | | | | | |
Total distributions | | | (0.68 | ) | | | (0.19 | ) | | | (0.23 | ) | | | (0.15 | ) | | | (0.02 | ) | | | (0.01 | ) |
| | | | | | | | | | | | | | | | | | | | | | | | |
Net increase (decrease) in net asset value | | | (0.52 | ) | | | 0.93 | | | | 0.07 | | | | (0.44 | ) | | | 0.82 | | | | 1.36 | |
| | | | | | | | | | | | | | | | | | | | | | | | |
Net Asset Value, End of Period | | $ | 7.30 | | | $ | 7.82 | | | $ | 6.89 | | | $ | 6.82 | | | $ | 7.26 | | | $ | 6.44 | |
| | | | | | | | | | | | | | | | | | | | | | | | |
Total Return (c) | | | 1.96 | %(d) | | | 16.72 | % | | | 4.72 | % | | | (4.09 | )% | | | 12.89 | % | | | 27.11 | % |
| | | | | | |
Ratios/Supplemental Data: | | | | | | | | | | | | | | | | | | | | | | | | |
Net Assets, End of Period (in 000’s) | | $ | 28,452 | | | $ | 37,507 | | | $ | 61,662 | | | $ | 52,390 | | | $ | 47,985 | | | $ | 28,277 | |
Ratios of expenses to average net assets: | | | | | | | | | | | | | | | | | | | | | | | | |
Before expense reimbursement and/or fee waiver by Adviser | | | 1.74 | %(e) | | | 1.42 | % | | | 1.35 | % | | | 1.43 | % | | | 1.47 | % | | | 2.01 | % |
After expense reimbursement and/or fee waiver by Adviser | | | 1.15 | %(e) | | | 1.15 | % | | | 1.15 | % | | | 1.15 | %(f) | | | 1.15 | % | | | 1.15 | % |
Ratios of net investment income to average net assets: | | | | | | | | | | | | | | | | | | | | | | | | |
Before expense reimbursement and/or fee waiver by Adviser | | | 2.00 | %(e) | | | 1.51 | % | | | 1.55 | % | | | 1.01 | % | | | 0.63 | % | | | 0.80 | % |
After expense reimbursement and/or fee waiver by Adviser | | | 2.59 | %(e) | | | 1.78 | % | | | 1.75 | % | | | 1.29 | % | | | 0.95 | % | | | 1.66 | % |
Portfolio Turnover | | | 26.72 | %(d) | | | 55.78 | % | | | 33.48 | % | | | 58.96 | % | | | 65.32 | % | | | 115.51 | % |
| | (a) | The selected per share data was calculated using the weighted average shares outstanding method for the period. |
| | (b) | Includes payments by affiliates of less than $0.005 per share. |
| | (c) | The total return is calculated using the Net Asset Value used for trading at the close of business at period end. |
| | (f) | For the period November 1, 2010 through February 28, 2011, the Adviser implemented a voluntary expense limitation of 1.15%. Effective March 1, 2011, the contractual expense limitation was decreased from 1.25% to 1.15%, excluding interest, taxes, investment-related costs (such as brokerage commissions), extraordinary expenses and acquired fund fees and expenses. |
See accompanying Notes to Financial Statements.
| | |
| |
| ASTON/Guardian Capital Global Dividend Fund – Class N | | April 30, 2014 |
| |
| Financial Highlights | | |
| | | | |
| | | Period
Ended
04/30/14(a)
(unaudited) | |
Net Asset Value, Beginning of Period | | $ | 10.00 | |
| | | | |
Income from Investment Operations: | | | | |
Net investment income | | | 0.01 | |
Net realized and unrealized gain on investments | | | 0.34 | |
| | | | |
Total from investment operations | | | 0.35 | |
| | | | |
Net increase in net asset value | | | 10.35 | |
| | | | |
Net Asset Value, End of Period | | $ | 10.35 | |
| | | | |
Total Return (b) | | | 3.50 | %(c) |
| |
Ratios/Supplemental Data: | | | | |
Net Assets, End of Period (in 000’s) | | $ | 1,035 | |
Ratios of expenses to average net assets: | | | | |
Before expense reimbursement and/or fee waiver by Adviser | | | 6.51 | %(d) |
After expense reimbursement and/or fee waiver by Adviser | | | 1.30 | %(d) |
Ratios of net investment income (loss) to average net assets: | | | | |
Before expense reimbursement and/or fee waiver by Adviser | | | (2.41 | )%(d) |
After expense reimbursement and/or fee waiver by Adviser | | | 2.80 | %(d) |
Portfolio Turnover | | | 4.05 | %(c) |
| | (a) | The inception date for the Guardian Capital Global Dividend Fund Class N shares is April 14, 2014. |
| | (b) | The total return is calculated using the Net Asset Value used for trading at the close of business at period end. |
See accompanying Notes to Financial Statements.
| | |
| |
| ASTON/Guardian Capital Global Dividend Fund – Class I | | April 30, 2014 |
| |
| Financial Highlights | | |
| | | | |
| | | Period
Ended
04/30/14(a)
(unaudited) | |
| | | | |
Net Asset Value, Beginning of Period | | $ | 10.00 | |
| | | | |
Income from Investment Operations: | | | | |
Net investment income | | | 0.01 | |
Net realized and unrealized gain on investments | | | 0.34 | |
| | | | |
Total from investment operations | | | 0.35 | |
| | | | |
Net increase in net asset value | | | 10.35 | |
| | | | |
Net Asset Value, End of Period | | $ | 10.35 | |
| | | | |
Total Return (b) | | | 3.50 | %(c) |
| |
Ratios/Supplemental Data: | | | | |
Net Assets, End of Period (in 000’s) | | $ | 3,105 | |
Ratios of expenses to average net assets: | | | | |
Before expense reimbursement and/or fee waiver by Adviser | | | 6.26 | %(d) |
After expense reimbursement and/or fee waiver by Adviser | | | 1.05 | %(d) |
Ratios of net investment income (loss) to average net assets: | | | | |
Before expense reimbursement and/or fee waiver by Adviser | | | (2.16 | )%(d) |
After expense reimbursement and/or fee waiver by Adviser | | | 3.05 | %(d) |
Portfolio Turnover | | | 4.05 | %(c) |
| | (a) | The inception date for the Guardian Capital Global Dividend Fund Class I shares is April 14, 2014. |
| | (b) | The total return is calculated using the Net Asset Value used for trading at the close of business at period end. |
See accompanying Notes to Financial Statements.
| | |
| |
| ASTON/LMCG Emerging Markets Fund – Class N | | April 30, 2014 |
| |
| Financial Highlights | | |
| | | | | | | | |
| | | Six Months
Ended
04/30/14
(unaudited) | | | Period
Ended
10/31/13(a) | |
Net Asset Value, Beginning of Period | | $ | 9.65 | | | $ | 10.00 | |
| | | | | | | | |
Income from Investment Operations: | | | | | | | | |
Net investment income | | | 0.01 | | | | 0.08 | (b) |
Net realized and unrealized loss on investments | | | (0.38 | ) | | | (0.43 | ) |
| | | | | | | | |
Total from investment operations | | | (0.37 | ) | | | (0.35 | ) |
| | | | | | | | |
Less Distributions: | | | | | | | | |
Distributions from and in excess of net investment | | | (0.14 | ) | | | — | |
| | | | | | | | |
Total distributions | | | (0.14 | ) | | | — | |
| | | | | | | | |
Net decrease in net asset value | | | (0.51 | ) | | | (0.35 | ) |
| | | | | | | | |
Net Asset Value, End of Period | | $ | 9.14 | | | $ | 9.65 | |
| | | | | | | | |
Total Return (c) | | | (3.82 | )%(d) | | | (3.50 | )%(d) |
| | |
Ratios/Supplemental Data: | | | | | | | | |
Net Assets, End of Period (in 000’s) | | $ | 665 | | | $ | 675 | |
Ratios of expenses to average net assets: | | | | | | | | |
Before expense reimbursement and/or fee waiver by Adviser | | | 6.45 | %(e) | | | 7.24 | %(e) |
After expense reimbursement and/or fee waiver by Adviser | | | 1.65 | %(e) | | | 1.65 | %(e) |
Ratios of net investment income (loss) to average net assets: | | | | | | | | |
Before expense reimbursement and/or fee waiver by Adviser | | | (4.52 | )%(e) | | | (4.13 | )%(e) |
After expense reimbursement and/or fee waiver by Adviser | | | 0.28 | %(e) | | | 1.46 | %(e) |
Portfolio Turnover | | | 32.14 | %(d) | | | 101.96 | %(d) |
| | (a) | The inception date for the LMCG Emerging Markets Fund Class N shares is March 28, 2013. |
| | (b) | The selected per share data was calculated using the weighted average shares outstanding method for the period. |
| | (c) | The total return is calculated using the Net Asset Value used for trading at the close of business at period end. |
See accompanying Notes to Financial Statements.
| | |
| |
| ASTON/LMCG Emerging Markets Fund – Class I | | April 30, 2014 |
| |
| Financial Highlights | | |
| | | | | | | | |
| | | Six Months
Ended
04/30/14
(unaudited) | | | Period
Ended
10/31/13 (a)
| |
| | | | | | | | |
Net Asset Value, Beginning of Period | | $ | 9.67 | | | $ | 10.00 | |
| | | | | | | | |
Income from Investment Operations: | | | | | | | | |
Net investment income | | | 0.03 | | | | 0.10 | (b) |
Net realized and unrealized loss on investments | | | (0.38 | ) | | | (0.43 | ) |
| | | | | | | | |
Total from investment operations | | | (0.35 | ) | | | (0.33 | ) |
| | | | | | | | |
Less Distributions: | | | | | | | | |
Distributions from and in excess of net investment | | | (0.16 | ) | | | — | |
| | | | | | | | |
Total distributions | | | (0.16 | ) | | | — | |
| | | | | | | | |
Net decrease in net asset value | | | (0.51 | ) | | | (0.33 | ) |
| | | | | | | | |
Net Asset Value, End of Period | | | 9.16 | | | $ | 9.67 | |
| | | | | | | | |
Total Return (c) | | | (3.63 | )%(d) | | | (3.30 | )%(d) |
| | |
Ratios/Supplemental Data: | | | | | | | | |
Net Assets, End of Period (in 000’s) | | $ | 3,419 | | | $ | 3,307 | |
Ratios of expenses to average net assets: | | | | | | | | |
Before expense reimbursement and/or fee waiver by Adviser | | | 6.20 | %(e) | | | 6.99 | %(e) |
After expense reimbursement and/or fee waiver by Adviser | | | 1.40 | %(e) | | | 1.40 | %(e) |
Ratios of net investment income (loss) to average net assets: | | | | | | | | |
Before expense reimbursement and/or fee waiver by Adviser | | | (4.27 | )%(e) | | | (3.88 | )%(e) |
After expense reimbursement and/or fee waiver by Adviser | | | 0.53 | %(e) | | | 1.71 | %(e) |
Portfolio Turnover | | | 32.14 | %(d) | | | 101.96 | %(d) |
| | (a) | The inception date for the LMCG Emerging Markets Fund Class I shares is March 28, 2013. |
| | (b) | The selected per share data was calculated using the weighted average shares outstanding method for the period. |
| | (c) | The total return is calculated using the Net Asset Value used for trading at the close of business at period end. |
See accompanying Notes to Financial Statements.
| | |
| |
| ASTON/Pictet International Fund – Class N | | April 30, 2014 |
| |
| Financial Highlights | | |
| | | | |
| | | Period
Ended
04/30/14(a)
(unaudited) | |
Net Asset Value, Beginning of Period | | $ | 10.00 | |
| | | | |
Income from Investment Operations: | | | | |
Net investment income | | | — | (b) |
Net realized and unrealized gain on investments | | | 0.19 | |
| | | | |
Total from investment operations | | | 0.19 | |
| | | | |
Net increase in net asset value | | | 0.19 | |
| | | | |
Net Asset Value, End of Period | | $ | 10.19 | |
| | | | |
Total Return (c) | | | 1.90 | %(d) |
| |
Ratios/Supplemental Data: | | | | |
Net Assets, End of Period (in 000’s) | | $ | 1,019 | |
Ratios of expenses to average net assets: | | | | |
Before expense reimbursement and/or fee waiver by Adviser | | | 3.73 | %(e) |
After expense reimbursement and/or fee waiver by Adviser | | | 1.40 | %(e) |
Ratios of net investment income (loss) to average net assets: | | | | |
Before expense reimbursement and/or fee waiver by Adviser | | | (1.69 | )%(e) |
After expense reimbursement and/or fee waiver by Adviser | | | 0.64 | %(e) |
Portfolio Turnover | | | 1.54 | %(d) |
| | (a) | The inception date for the Pictet International Fund Class N shares is April 14, 2014. |
| | (b) | Represents less than $0.005 per share. |
| | (c) | The total return is calculated using the Net Asset Value used for trading at the close of business at period end. |
See accompanying Notes to Financial Statements.
| | |
| |
| ASTON/Pictet International Fund – Class I | | April 30, 2014 |
| |
| Financial Highlights | | |
| | | | |
| | | Period
Ended
04/30/14(a)
(unaudited) | |
| | | | |
Net Asset Value, Beginning of Period | | $ | 10.00 | |
| | | | |
Income from Investment Operations: | | | | |
Net investment income | | | — | (b) |
Net realized and unrealized gain on investments | | | 0.19 | |
| | | | |
Total from investment operations | | | 0.19 | |
| | | | |
Net increase in net asset value | | | 0.19 | |
| | | | |
Net Asset Value, End of Period | | $ | 10.19 | |
| | | | |
Total Return (c) | | | 1.90 | %(d) |
| |
Ratios/Supplemental Data: | | | | |
Net Assets, End of Period (in 000’s) | | $ | 9,172 | |
Ratios of expenses to average net assets: | | | | |
Before expense reimbursement and/or fee waiver by Adviser | | | 3.48 | %(e) |
After expense reimbursement and/or fee waiver by Adviser | | | 1.15 | %(e) |
Ratios of net investment income (loss) to average net assets: | | | | |
Before expense reimbursement and/or fee waiver by Adviser | | | (1.44 | )%(e) |
After expense reimbursement and/or fee waiver by Adviser | | | 0.90 | %(e) |
Portfolio Turnover | | | 1.54 | %(d) |
| | (a) | The inception date for the Pictet International Fund Class I shares is April 14, 2014. |
| | (b) | Represents less than $0.005 per share. |
| | (c) | The total return is calculated using the Net Asset Value used for trading at the close of business at period end. |
See accompanying Notes to Financial Statements.
| | |
| |
| ASTON/Harrison Street Real Estate Fund – Class N | | April 30, 2014 |
| |
| Financial Highlights | | |
| | | | | | | | | | | | | | | | | | | | | | | | |
| | | Six Months
Ended
04/30/14
(unaudited) | | | Year
Ended
10/31/13 | | | Year
Ended
10/31/12 | | | Year
Ended
10/31/11 | | | Year
Ended
10/31/10 | | | Year
Ended
10/31/09 | |
| | | | | | | | | | | | | | | | | | | | | | | | |
Net Asset Value, Beginning of Period | | $ | 11.29 | | | $ | 10.49 | | | $ | 8.97 | | | $ | 8.16 | | | $ | 5.77 | | | $ | 6.08 | |
| | | | | | | | | | | | | | | | | | | | | | | | |
Income from Investment Operations: | | | | | | | | | | | | | | | | | | | | | | | | |
Net investment income | | | 0.03 | (a) | | | 0.17 | (a) | | | 0.15 | (a) | | | 0.15 | (a) | | | 0.14 | (a) | | | 0.15 | (a) |
Net realized and unrealized gain (loss) on investments | | | 0.47 | | | | 0.79 | (b) | | | 1.44 | | | | 0.79 | | | | 2.36 | | | | (0.28 | ) |
| | | | | | | | | | | | | | | | | | | | | | | | |
Total from investment operations | | | 0.50 | | | | 0.96 | | | | 1.59 | | | | 0.94 | | | | 2.50 | | | | (0.13 | ) |
| | | | | | | | | | | | | | | | | | | | | | | | |
Less Distributions: | | | | | | | | | | | | | | | | | | | | | | | | |
Distributions from and in excess of net investment income | | | (0.13 | ) | | | (0.16 | ) | | | (0.07 | ) | | | (0.13 | ) | | | (0.11 | ) | | | (0.18 | ) |
| | | | | | | | | | | | | | | | | | | | | | | | |
Total distributions | | | (0.13 | ) | | | (0.16 | ) | | | (0.07 | ) | | | (0.13 | ) | | | (0.11 | ) | | | (0.18 | ) |
| | | | | | | | | | | | | | | | | | | | | | | | |
Net increase (decrease) in net asset value . | | | 0.37 | | | | 0.80 | | | | 1.52 | | | | 0.81 | | | | 2.39 | | | | (0.31 | ) |
| | | | | | | | | | | | | | | | | | | | | | | | |
Net Asset Value, End of Period | | $ | 11.66 | | | $ | 11.29 | | | $ | 10.49 | | | $ | 8.97 | | | $ | 8.16 | | | $ | 5.77 | |
| | | | | | | | | | | | | | | | | | | | | | | | |
Total Return (c) | | | 4.50 | %(d) | | | 9.30 | % | | | 17.85 | % | | | 11.66 | % | | | 43.77 | % | | | (1.44 | )% |
| | | | | | |
Ratios/Supplemental Data: | | | | | | | | | | | | | | | | | | | | | | | | |
Net Assets, End of Period (in 000’s) | | $ | 12,323 | | | $ | 13,093 | | | $ | 10,381 | | | $ | 6,287 | | | $ | 6,158 | | | $ | 4,011 | |
Ratios of expenses to average net assets: | | | | | | | | | | | | | | | | | | | | | | | | |
Before expense reimbursement and/or fee waiver by Adviser | | | 2.33 | %(e) | | | 2.22 | % | | | 2.36 | % | | | 1.61 | %(f) | | | 1.68 | %(f) | | | 1.94 | % |
After expense reimbursement and/or fee waiver by Adviser | | | 1.37 | %(e) | | | 1.37 | % | | | 1.37 | % | | | 1.29 | %(f) | | | 1.37 | %(f) | | | 1.37 | % |
Ratios of net investment income (loss) to average net assets: | | | | | | | | | | | | | | | | | | | | | | | | |
Before expense reimbursement and/or fee waiver by Adviser | | | (0.43 | )%(e) | | | 0.67 | % | | | 0.53 | % | | | 1.36 | % | | | 1.65 | % | | | 2.55 | % |
After expense reimbursement and/or fee waiver by Adviser | | | 0.54 | %(e) | | | 1.52 | % | | | 1.52 | % | | | 1.68 | % | | | 1.96 | % | | | 3.12 | % |
Portfolio Turnover | | | 94.59 | %(d) | | | 159.14 | % | | | 86.62 | %(g) | | | 143.86 | % | | | 75.30 | % | | | 139.76 | % |
| | (a) | The selected per share data was calculated using the weighted average shares outstanding method for the period. |
| | (b) | Includes capital contribution of less than $0.005 per share. |
| | (c) | The total return is calculated using the Net Asset Value used for trading at the close of business at period end. |
| | (f) | Ratios of expenses to average net assets include interest expenses of less than 0.005% for each of the years ended October 31, 2011 and October 31, 2010, which are not included in the contractual expense limitation. The interest expenses are from utilizing the line of credit as discussed in Note H to the Financial Statements. |
| | (g) | Portfolio turnover rate excludes securities delivered from processing a redemption-in-kind. |
See accompanying Notes to Financial Statements.
| | |
| |
| ASTON/Harrison Street Real Estate Fund – Class I | | April 30, 2014 |
| |
| Financial Highlights | | |
| | | | | | | | | | | | | | | | | | | | | | | | |
| | | Six Months
Ended
04/30/14
(unaudited) | | | Year
Ended
10/31/13 | | | Year
Ended
10/31/12 | | | Year
Ended
10/31/11 | | | Year
Ended
10/31/10 | | | Year
Ended
10/31/09 | |
| | | | | | | | | | | | | | | | | | | | | | | | |
Net Asset Value, Beginning of Period | | $ | 11.24 | | | $ | 10.44 | | | $ | 8.92 | | | $ | 8.12 | | | $ | 5.74 | | | $ | 6.08 | |
| | | | | | | | | | | | | | | | | | | | | | | | |
Income from Investment Operations: | | | | | | | | | | | | | | | | | | | | | | | | |
Net investment income | | | 0.04 | (a) | | | 0.20 | (a) | | | 0.15 | (a) | | | 0.16 | (a) | | | 0.16 | (a) | | | 0.16 | (a) |
Net realized and unrealized gain (loss) on investments | | | 0.46 | | | | 0.79 | (b) | | | 1.46 | | | | 0.79 | | | | 2.34 | | | | (0.28 | ) |
| | | | | | | | | | | | | | | | | | | | | | | | |
Total from investment operations | | | 0.50 | | | | 0.99 | | | | 1.61 | | | | 0.95 | | | | 2.50 | | | | (0.12 | ) |
| | | | | | | | | | | | | | | | | | | | | | | | |
Less Distributions: | | | | | | | | | | | | | | | | | | | | | | | | |
Distributions from and in excess of net investment income | | | (0.15 | ) | | | (0.19 | ) | | | (0.09 | ) | | | (0.15 | ) | | | (0.12 | ) | | | (0.22 | ) |
| | | | | | | | | | | | | | | | | | | | | | | | |
Total distributions | | | (0.15 | ) | | | (0.19 | ) | | | (0.09 | ) | | | (0.15 | ) | | | (0.12 | ) | | | (0.22 | ) |
| | | | | | | | | | | | | | | | | | | | | | | | |
Net increase (decrease) in net asset value | | | 0.35 | | | | 0.80 | | | | 1.52 | | | | 0.80 | | | | 2.38 | | | | (0.34 | ) |
| | | | | | | | | | | | | | | | | | | | | | | | |
Net Asset Value, End of Period | | $ | 11.59 | | | $ | 11.24 | | | $ | 10.44 | | | $ | 8.92 | | | $ | 8.12 | | | $ | 5.74 | |
| | | | | | | | | | | | | | | | | | | | | | | | |
Total Return (c) | | | 4.61 | %(d) | | | 9.58 | % | | | 18.16 | % | | | 11.82 | % | | | 44.14 | % | | | (1.27 | )% |
| | | | | | |
Ratios/Supplemental Data: | | | | | | | | | | | | | | | | | | | | | | | | |
Net Assets, End of Period (in 000’s) | | $ | 477 | | | $ | 532 | | | $ | 166 | | | $ | 32,925 | | | $ | 29,425 | | | $ | 21,905 | |
Ratios of expenses to average net assets: | | | | | | | | | | | | | | | | | | | | | | | | |
Before expense reimbursement and/or fee waiver by Adviser | | | 2.08 | %(e) | | | 1.97 | % | | | 2.11 | % | | | 1.44 | %(f) | | | 1.43 | %(f) | | | 1.69 | % |
After expense reimbursement and/or fee waiver by Adviser | | | 1.12 | %(e) | | | 1.12 | % | | | 1.12 | % | | | 1.12 | %(f) | | | 1.12 | %(f) | | | 1.12 | % |
Ratios of net investment income (loss) to average net assets: | | | | | | | | | | | | | | | | | | | | | | | | |
Before expense reimbursement and/or fee waiver by Adviser | | | (0.18 | )%(e) | | | 0.92 | % | | | 0.78 | % | | | 1.53 | % | | | 1.90 | % | | | 2.80 | % |
After expense reimbursement and/or fee waiver by Adviser | | | 0.79 | %(e) | | | 1.77 | % | | | 1.77 | % | | | 1.85 | % | | | 2.21 | % | | | 3.37 | % |
Portfolio Turnover | | | 94.59 | %(d) | | | 159.14 | % | | | 86.62 | %(g) | | | 143.86 | % | | | 75.30 | % | | | 139.76 | % |
| | (a) | The selected per share data was calculated using the weighted average shares outstanding method for the period. |
| | (b) | Includes capital contribution of less than $0.005 per share. |
| | (c) | The total return is calculated using the Net Asset Value used for trading at the close of business at period end. |
| | (f) | Ratios of expenses to average net assets include interest expenses of less than 0.005% for each of the years ended October 31, 2011 and October 31, 2010, which are not included in the contractual expense limitation. The interest expenses are from utilizing the line of credit as discussed in Note H to the Financial Statements. |
| | (g) | Portfolio turnover rate excludes securities delivered from processing a redemption-in-kind. |
See accompanying Notes to Financial Statements.
| | |
| |
| ASTON/Montag & Caldwell Balanced Fund – Class N | | April 30, 2014 |
| |
| Financial Highlights | | |
| | | | | | | | | | | | | | | | | | | | | | | | |
| | | Six Months
Ended
04/30/14
(unaudited) | | | Year
Ended
10/31/13 | | | Year
Ended
10/31/12 | | | Year
Ended
10/31/11 | | | Year
Ended
10/31/10 | | | Year
Ended
10/31/09 | |
| | | | | | | | | | | | | | | | | | | | | | | | |
Net Asset Value, Beginning of Period | | $ | 23.81 | | | $ | 21.46 | | | $ | 20.09 | | | $ | 19.13 | | | $ | 17.73 | | | $ | 15.61 | |
| | | | | | | | | | | | | | | | | | | | | | | | |
Income from Investment Operations: | | | | | | | | | | | | | | | | | | | | | | | | |
Net investment income | | | 0.06 | | | | 0.21 | (a) | | | 0.16 | (a) | | | 0.15 | (a) | | | 0.21 | (a) | | | 0.21 | (a) |
Net realized and unrealized gain on investments | | | 0.72 | | | | 2.43 | | | | 1.45 | | | | 1.03 | | | | 1.47 | | | | 2.15 | |
| | | | | | | | | | | | | | | | | | | | | | | | |
Total from investment operations | | | 0.78 | | | | 2.64 | | | | 1.61 | | | | 1.18 | | | | 1.68 | | | | 2.36 | |
| | | | | | | | | | | | | | | | | | | | | | | | |
Less Distributions: | | | | | | | | | | | | | | | | | | | | | | | | |
Distributions from and in excess of net investment income | | | (0.11 | ) | | | (0.29 | ) | | | (0.24 | ) | | | (0.22 | ) | | | (0.28 | ) | | | (0.24 | ) |
Distribution from net realized gain on investments | | | (0.74 | ) | | | — | | | | — | | | | — | | | | — | | | | — | |
| | | | | | | | | | | | | | | | | | | | | | | | |
Total distributions | | | (0.85 | ) | | | (0.29 | ) | | | (0.24 | ) | | | (0.22 | ) | | | (0.28 | ) | | | (0.24 | ) |
| | | | | | | | | | | | | | | | | | | | | | | | |
Net increase (decrease) in net asset value | | | (0.07 | ) | | | 2.35 | | | | 1.37 | | | | 0.96 | | | | 1.40 | | | | 2.12 | |
| | | | | | | | | | | | | | | | | | | | | | | | |
Net Asset Value, End of Period | | $ | 23.74 | | | $ | 23.81 | | | $ | 21.46 | | | $ | 20.09 | | | $ | 19.13 | | | $ | 17.73 | |
| | | | | | | | | | | | | | | | | | | | | | | | |
Total Return (b) | | | 3.27 | %(c) | | | 12.40 | % | | | 8.03 | % | | | 6.20 | % | | | 9.54 | % | | | 15.32 | % |
| | | | | | |
Ratios/Supplemental Data: | | | | | | | | | | | | | | | | | | | | | | | | |
Net Assets, End of Period (in 000’s) | | $ | 21,488 | | | $ | 22,425 | | | $ | 31,536 | | | $ | 23,315 | | | $ | 29,194 | | | $ | 14,938 | |
Ratios of expenses to average net assets: | | | | | | | | | | | | | | | | | | | | | | | | |
Before expense reimbursement and/or fee waiver by Adviser | | | 1.43 | %(d) | | | 1.37 | % | | | 1.42 | % | | | 1.57 | %(e) | | | 1.38 | % | | | 1.73 | % |
After expense reimbursement and/or fee waiver by Adviser | | | 1.20 | %(d) | | | 1.20 | % | | | 1.22 | % | | | 1.35 | %(e) | | | 1.13 | % | | | 1.26 | % |
Ratios of net investment income to average net assets: | | | | | | | | | | | | | | | | | | | | | | | | |
Before expense reimbursement and/or fee waiver by Adviser | | | 0.30 | %(d) | | | 0.77 | % | | | 0.57 | % | | | 0.53 | % | | | 0.89 | % | | | 0.81 | % |
After expense reimbursement and/or fee waiver by Adviser | | | 0.53 | %(d) | | | 0.94 | % | | | 0.77 | % | | | 0.76 | % | | | 1.15 | % | | | 1.28 | % |
Portfolio Turnover | | | 12.32 | %(c) | | | 34.62 | % | | | 35.48 | % | | | 40.31 | % | | | 51.68 | %(f) | | | 38.72 | % |
| | (a) | The selected per share data was calculated using the weighted average shares outstanding method for the period. |
| | (b) | The total return is calculated using the Net Asset Value used for trading at the close of business at period end. |
| | (e) | Ratios of expenses to average net assets include interest expense of less than 0.005% for the year ended October 31, 2011, which is not included in the voluntary expense limitation. The interest expense is from utilizing the line of credit as discussed in Note H to the Financial Statements. |
| | (f) | Portfolio turnover rate excludes securities received from a reorganization. |
See accompanying Notes to Financial Statements.
| | |
| |
| ASTON/Montag & Caldwell Balanced Fund – Class I | | April 30, 2014 |
| |
| Financial Highlights | | |
| | | | | | | | | | | | | | | | | | | | | | | | |
| | | Six Months
Ended
04/30/14
(unaudited) | | | Year
Ended
10/31/13 | | | Year
Ended
10/31/12 | | | Year
Ended
10/31/11 | | | Year
Ended
10/31/10 | | | Year
Ended
10/31/09 | |
| | | | | | | | | | | | | | | | | | | | | | | | |
Net Asset Value, Beginning of Period | | $ | 23.76 | | | $ | 21.41 | | | $ | 20.05 | | | $ | 19.08 | | | $ | 17.68 | | | $ | 15.57 | |
| | | | | | | | | | | | | | | | | | | | | | | | |
Income from Investment Operations: | | | | | | | | | | | | | | | | | | | | | | | | |
Net investment income | | | 0.06 | | | | 0.23 | (a) | | | 0.19 | (a) | | | 0.20 | (a) | | | 0.22 | (a) | | | 0.23 | (a) |
Net realized and unrealized gain on investments | | | 0.73 | | | | 2.43 | | | | 1.44 | | | | 1.04 | | | | 1.46 | | | | 2.16 | |
| | | | | | | | | | | | | | | | | | | | | | | | |
Total from investment operations | | | 0.79 | | | | 2.66 | | | | 1.63 | | | | 1.24 | | | | 1.68 | | | | 2.39 | |
| | | | | | | | | | | | | | | | | | | | | | | | |
Less Distributions: | | | | | | | | | | | | | | | | | | | | | | | | |
Distributions from and in excess of net investment income | | | (0.14 | ) | | | (0.31 | ) | | | (0.27 | ) | | | (0.27 | ) | | | (0.28 | ) | | | (0.28 | ) |
Distribution from net realized gain on investments | | | (0.74 | ) | | | — | | | | — | | | | — | | | | — | | | | — | |
| | | | | | | | | | | | | | | | | | | | | | | | |
Total distributions | | | (0.88 | ) | | | (0.31 | ) | | | (0.27 | ) | | | (0.27 | ) | | | (0.28 | ) | | | (0.28 | ) |
| | | | | | | | | | | | | | | | | | | | | | | | |
Net increase (decrease) in net asset value | | | (0.09 | ) | | | 2.35 | | | | 1.36 | | | | 0.97 | | | | 1.40 | | | | 2.11 | |
| | | | | | | | | | | | | | | | | | | | | | | | |
Net Asset Value, End of Period | | $ | 23.67 | | | $ | 23.76 | | | $ | 21.41 | | | $ | 20.05 | | | $ | 19.08 | | | $ | 17.68 | |
| | | | | | | | | | | | | | | | | | | | | | | | |
Total Return (b) | | | 3.33 | %(c) | | | 12.53 | % | | | 8.14 | % | | | 6.52 | % | | | 9.57 | % | | | 15.53 | % |
| | | | | | |
Ratios/Supplemental Data: | | | | | | | | | | | | | | | | | | | | | | | | |
Net Assets, End of Period (in 000’s) | | $ | 1,727 | | | $ | 1,839 | | | $ | 1,930 | | | $ | 1,415 | | | $ | 1,362 | | | $ | 1,149 | |
Ratios of expenses to average net assets: | | | | | | | | | | | | | | | | | | | | | | | | |
Before expense reimbursement and/or fee waiver by Adviser | | | 1.33 | %(d) | | | 1.27 | % | | | 1.30 | % | | | 1.32 | %(e) | | | 1.35 | % | | | 1.57 | % |
After expense reimbursement and/or fee waiver by Adviser | | | 1.10 | %(d) | | | 1.10 | % | | | 1.10 | % | | | 1.10 | %(e) | | | 1.10 | % | | | 1.10 | % |
Ratios of net investment income to average net assets: | | | | | | | | | | | | | | | | | | | | | | | | |
Before expense reimbursement and/or fee waiver by Adviser | | | 0.40 | %(d) | | | 0.87 | % | | | 0.69 | % | | | 0.79 | % | | | 0.92 | % | | | 0.97 | % |
After expense reimbursement and/or fee waiver by Adviser | | | 0.63 | %(d) | | | 1.04 | % | | | 0.89 | % | | | 1.02 | % | | | 1.17 | % | | | 1.44 | % |
Portfolio Turnover | | | 12.32 | %(c) | | | 34.62 | % | | | 35.48 | % | | | 40.31 | % | | | 51.68 | %(f) | | | 38.72 | % |
| | (a) | The selected per share data was calculated using the weighted average shares outstanding method for the period. |
| | (b) | The total return is calculated using the Net Asset Value used for trading at the close of business at period end. |
| | (e) | Ratios of expenses to average net assets include interest expense of less than 0.005% for the year ended October 31, 2011, which is not included in the voluntary expense limitation. The interest expense is from utilizing the line of credit as discussed in Note H to the Financial Statements. |
| | (f) | Portfolio turnover rate includes securities received from a reorganization. |
See accompanying Notes to Financial Statements.
| | |
| |
| | April 30, 2014 |
| |
| Notes to Financial Statements (unaudited) | | |
Note (A) Fund Organization: Aston Funds (the “Trust”) was organized as a Delaware statutory trust under a Declaration of Trust dated September 10, 1993. The Trust is registered under the Investment Company Act of 1940, as amended (the “1940 Act”) as an open-end management investment company with 25 separate portfolios (each, a “Fund” and collectively, the “Funds”) as of April 30, 2014.
Aston Asset Management, LP (“Aston” or the “Adviser”), the investment adviser and the administrator, manages each Fund by retaining one or more subadvisers (each, a “Subadviser”) to manage each Fund’s portfolio on a subadvisory basis. The following 25 portfolios of the Trust are included in these financial statements:
|
| ASTON/Montag & Caldwell Growth Fund (the “M&C Growth Fund”) |
ASTON/TAMRO Diversified Equity Fund (the “TAMRO Diversified Equity Fund”) |
ASTON/Herndon Large Cap Value Fund
(the “Herndon Large Cap Value Fund”) |
ASTON/Cornerstone Large Cap Value Fund
(the “Cornerstone Large Cap Value Fund”) |
ASTON/River Road Dividend All Cap Value Fund
(the “River Road Dividend All Cap Value Fund”) |
ASTON/River Road Dividend All Cap Value Fund II
(the “River Road Dividend All Cap Value Fund II”) |
| ASTON/Fairpointe Mid Cap Fund (the “Fairpointe Mid Cap Fund”) |
ASTON/Montag & Caldwell Mid Cap Growth Fund
(the “M&C Mid Cap Growth Fund”) |
ASTON/LMCG Small Cap Growth Fund
(the “LMCG Small Cap Growth Fund”) |
| ASTON/Silvercrest Small Cap Fund (the “Silvercrest Small Cap Fund”) |
| ASTON/TAMRO Small Cap Fund (the “TAMRO Small Cap Fund”) |
ASTON/River Road Select Value Fund
(the “River Road Select Value Fund”) |
ASTON/River Road Small Cap Value Fund
(the “River Road Small Cap Value Fund”) |
ASTON/River Road Independent Value Fund
(the “River Road Independent Value Fund”) |
ASTON/DoubleLine Core Plus Fixed Income Fund
(the “DoubleLine Core Plus Fixed Income Fund”) |
| ASTON/TCH Fixed Income Fund (the “TCH Fixed Income Fund”) |
ASTON/Lake Partners LASSO Alternatives Fund
(the “Lake Partners LASSO Alternatives Fund”) |
ASTON/Anchor Capital Enhanced Equity Fund
(the “Anchor Capital Enhanced Equity Fund”) |
| ASTON/River Road Long-Short Fund (the “River Road Long-Short Fund”) |
| ASTON/Barings International Fund (the “Barings International Fund”) |
ASTON/Guardian Capital Global Dividend Fund
(the “Guardian Capital Global Dividend Fund”) |
ASTON/LMCG Emerging Markets Fund
(the “LMCG Emerging Markets Fund”) |
| ASTON/Pictet International Fund (the “Pictet International Fund”) |
ASTON/Harrison Street Real Estate Fund (the “Harrison Street Real Estate Fund”) |
| ASTON/Montag & Caldwell Balanced Fund (the “M&C Balanced Fund”) |
M&C Growth Fund is authorized to issue three classes of shares (Class N shares, Class I shares and Class R shares). The following Funds are each authorized to issue two classes of shares (Class N shares and Class I shares): TAMRO Diversified Equity Fund, Herndon Large Cap Value Fund, Cornerstone Large Cap Value Fund, River Road Dividend All Cap Value Fund, River Road Dividend All Cap Value Fund II, Fairpointe Mid Cap Fund, LMCG Small Cap Growth Fund, Silvercrest Small Cap Fund, TAMRO Small Cap Fund, River Road Select Value Fund, River Road Small Cap Value Fund, River Road Independent Value Fund, DoubleLine Core Plus Fixed Income Fund, TCH Fixed Income Fund, Lake Partners LASSO Alternatives Fund, Anchor Capital Enhanced Equity Fund, River Road Long-Short Fund, Barings International Fund, Guardian Capital Global Dividend Fund, LMCG Emerging Markets Fund, Pictet International Fund, Harrison Street Real Estate Fund and M&C Balanced Fund. The M&C Mid Cap Growth Fund is authorized to issue Class N shares and Class I shares, but only offered Class N shares during the six months ended April 30, 2014. Each class of shares is substantially the same except that certain classes of shares bear class specific expenses that include distribution and services fees. TAMRO Small Cap Fund, River Road Dividend All Cap Value Fund, Fairpointe Mid Cap Fund and River Road Independent Value Fund are closed to new investors until further notice.
The investment objectives of the Funds are as follows:
| | |
M&C Growth Fund Long-term capital appreciation and, secondarily, current income, by investing primarily in common stocks and convertible securities. |
TAMRO Diversified Equity Fund Long-term capital appreciation. |
Herndon Large Cap Value Fund Long-term capital appreciation. |
Cornerstone Large Cap Value Fund Total return through long-term capital appreciation and current income. |
River Road Dividend All Cap Value Fund High current income and, secondarily, long-term capital appreciation. |
River Road Dividend All Cap Value Fund II Long-term capital appreciation and high current income. |
Fairpointe Mid Cap Fund Long-term total return through capital appreciation by investing primarily in common and preferred stocks and convertible securities. |
M&C Mid Cap Growth Fund Long-term capital appreciation, and secondarily, current income, by investing primarily in common stocks and convertible securities. |
LMCG Small Cap Growth Fund Long-term capital appreciation. |
Silvercrest Small Cap Fund Long-term capital appreciation. |
TAMRO Small Cap Fund Long-term capital appreciation. |
River Road Select Value Fund Long-term capital appreciation. |
River Road Small Cap Value Fund Long-term capital appreciation. |
| | |
| |
| | April 30, 2014 |
| |
| Notes to Financial Statements (unaudited) – continued | | |
| | |
River Road Independent Value Fund Long-term total return. |
DoubleLine Core Plus Fixed Income Fund Maximize total return. |
TCH Fixed Income Fund High current income consistent with prudent risk of capital. |
Lake Partners LASSO Alternatives Fund Long term total return with reduced correlation to the conventional stock and bond markets. |
Anchor Capital Enhanced Equity Fund Total return through a combination of a high level of current income and capital appreciation. |
River Road Long-Short Fund Absolute return while minimizing volatility over a full market cycle. |
Barings International Fund Total return. |
Guardian Capital Global Dividend Fund Long-term capital appreciation and current income. |
LMCG Emerging Markets Fund Long-term capital appreciation. |
Pictet International Fund Capital appreciation. |
Harrison Street Real Estate Fund Total return through a combination of growth and income. |
M&C Balanced Fund Long-term total return. |
Note (B) Significant Accounting Policies: The following is a summary of the significant accounting policies consistently followed by each Fund in the preparation of its financial statements. These policies are in conformity with U.S. generally accepted accounting principles (“U.S. GAAP”).
(1) Security Valuation: Equity securities, closed-end funds, exchange-traded funds, index options traded on a national securities exchange, and over-the-counter securities listed on the NASDAQ National Market System are valued at the last sale price or the NASDAQ Official Closing Price (“NOCP”), if applicable. If no last sale price or NOCP, if applicable, is reported, the mean of the last bid and asked prices may be used. Fixed income securities, except short-term investments, are valued on the basis of mean prices provided by an independent pricing service when such prices are believed by the Adviser to reflect the current market value of such securities, in accordance with guidelines adopted by the Board of Trustees. The pricing service provider may employ methodologies that utilize actual market transactions, broker-dealer supplied valuations, or other electronic data processing techniques. Such techniques generally consider factors such as composite security prices, yields, maturities, call features, credit ratings and developments relating to specific securities, in arriving at valuations. If accurate market quotations are not available, securities are valued at fair values in accordance with guidelines adopted by the Board of Trustees. Short-term investments, that is, those with maturities of 60 days or less, are valued at amortized cost, which approximates fair market value. Repurchase agreements are valued at
cost. Investments in money market funds and other mutual funds are valued at the underlying fund’s net asset value (“NAV”) at the date of valuation. Foreign securities are valued at the last sales price on the primary exchange where the security is traded. Under the fair valuation procedures adopted by the Board of Trustees, the Funds may utilize the services of an independent pricing service to determine fair value prices for foreign securities held by Barings International Fund, Guardian Capital Global Dividend Fund, LMCG Emerging Markets Fund and Pictet International Fund, if certain market events occur.
Certain Funds invest in securities of other investment companies, including open-end funds, closed-end funds and exchange-traded funds (“ETFs”). Open-end funds are investment companies that issue new shares continuously and redeem shares daily. Closed-end funds are investment companies that typically issue a fixed number of shares that trade on a securities exchange or over-the-counter. An ETF is an investment company. Typically, an ETF seeks to track the performance of an index by holding in its portfolio shares of all the companies, or a representative sample of the companies, that are components of a particular index. ETFs are traded on a securities exchange based on their market values. The risks of investment in other investment companies typically reflect the risks of the types of securities in which investment companies invest. Investments in ETFs and closed-end funds are subject to the additional risk that shares of the fund may trade at a premium or discount to their NAV per share. When a Fund invests in another investment company, shareholders of the Fund bear their proportionate shares of the other investment company’s fees and expenses, including operating, registration, trustee, licensing and marketing, as well as their shares of the Fund’s fees and expenses.
Fair Value Measurements - The inputs and valuation techniques used to measure fair value of the Funds’ net assets are summarized into three levels as described in the hierarchy below:
| | |
•Level 1 – | | unadjusted quoted prices in active markets for identical assets or liabilities |
•Level 2 – | | other significant observable inputs (including quoted prices for similar securities, interest rates, prepayment speeds, credit risk, etc.) |
•Level 3 – | | significant unobservable inputs (including the Funds’ own assumptions in determining the fair value of investments) |
| | |
| |
| | April 30, 2014 |
| |
| Notes to Financial Statements (unaudited) – continued | | |
The inputs or methodology used for valuing securities are not necessarily an indication of the risk associated with investing in those securities. Transfers in and out of the levels are recognized at the market value at the end of the period. The summary of each Fund’s investments that are measured at fair value by Level within the fair value hierarchy as of April 30, 2014 is as follows:
| | | | | | | | | | | | | | | | |
Funds | | Total
Value at
04/30/14 | | | Level 1
Quoted
Prices | | | Level 2
Significant
Observable
Inputs | | | Level 3
Significant
Unobservable
Inputs | |
| M&C Growth Fund | | | | | | | | | | | | | | | | |
| Assets | | | | | | | | | | | | | | | | |
Investments in Securities* | | $ | 4,766,976,047 | | | $ | 4,766,976,047 | | | $ | — | | | $ | — | |
| | | | | | | | | | | | | | | | |
| TAMRO Diversified Equity Fund | | | | | | | | | | | | | | | | |
| Assets | | | | | | | | | | | | | | | | |
Investments in Securities* | | $ | 55,343,958 | | | $ | 55,343,958 | | | $ | — | | | $ | — | |
| | | | | | | | | | | | | | | | |
| Herndon Large Cap Value Fund | | | | | | | | | | | | | | | | |
| Assets | | | | | | | | | | | | | | | | |
Investments in Securities* | | $ | 146,764,329 | | | $ | 146,764,329 | | | $ | — | | | $ | — | |
| | | | | | | | | | | | | | | | |
| Cornerstone Large Cap Value Fund | | | | | | | | | | | | | | | | |
| Assets | | | | | | | | | | | | | | | | |
Investments in Securities* | | $ | 109,042,845 | | | $ | 109,042,845 | | | $ | — | | | $ | — | |
| | | | | | | | | | | | | | | | |
| River Road Dividend All Cap Value Fund | | | | | | | | | | | | | | | | |
| Assets | | | | | | | | | | | | | | | | |
Investments in Securities* | | $ | 1,241,344,178 | | | $ | 1,241,344,178 | | | $ | — | | | $ | — | |
| | | | | | | | | | | | | | | | |
| River Road Dividend All Cap Value Fund II | | | | | | | | | | | | | | | | |
| Assets | | | | | | | | | | | | | | | | |
Investments in Securities* | | $ | 114,338,763 | | | $ | 114,338,763 | | | $ | — | | | $ | — | |
| | | | | | | | | | | | | | | | |
| Fairpointe Mid Cap Fund | | | | | | | | | | | | | | | | |
| Assets | | | | | | | | | | | | | | | | |
Investments in Securities* | | $ | 5,558,612,931 | | | $ | 5,558,612,931 | | | $ | — | | | $ | — | |
| | | | | | | | | | | | | | | | |
| M&C Mid Cap Growth Fund | | | | | | | | | | | | | | | | |
| Assets | | | | | | | | | | | | | | | | |
Investments in Securities* | | $ | 11,274,080 | | | $ | 11,274,080 | | | $ | — | | | $ | — | |
| | | | | | | | | | | | | | | | |
| LMCG Small Cap Growth Fund | | | | | | | | | | | | | | | | |
| Assets | | | | | | | | | | | | | | | | |
Investment in Securities* | | $ | 38,353,096 | | | $ | 38,353,096 | | | $ | — | | | $ | — | |
| | | | | | | | | | | | | | | | |
| Silvercrest Small Cap Fund | | | | | | | | | | | | | | | | |
| Assets | | | | | | | | | | | | | | | | |
Investments in Securities* | | $ | 51,878,282 | | | $ | 51,878,282 | | | $ | — | | | $ | — | |
| | | | | | | | | | | | | | | | |
| TAMRO Small Cap Fund | | | | | | | | | | | | | | | | |
| Assets | | | | | | | | | | | | | | | | |
Common Stocks | | | | | | | | | | | | | | | | |
Consumer Discretionary | | $ | 177,678,249 | | | $ | 177,678,249 | | | $ | — | | | $ | — | |
Consumer Staples | | | 101,583,225 | | | | 85,354,355 | | | | 16,228,870 | | | | — | |
Energy | | | 69,183,977 | | | | 69,183,977 | | | | — | | | | — | |
Financials | | | 258,138,626 | | | | 258,138,626 | | | | — | | | | — | |
Healthcare | | | 160,459,710 | | | | 160,459,710 | | | | — | | | | — | |
Industrials | | | 206,755,383 | | | | 206,755,383 | | | | — | | | | — | |
Information Technology | | | 157,208,703 | | | | 157,208,703 | | | | — | | | | — | |
Materials | | | 5,758,222 | | | | 5,758,222 | | | | — | | | | — | |
| | | | | | | | | | | | | | | | |
Total Common Stocks | | | 1,136,766,095 | | | | 1,120,537,225 | | | | 16,228,870 | | | | — | |
| | | | | | | | | | | | | | | | |
Investment Company* | | | 8,724,963 | | | | 8,724,963 | | | | — | | | | — | |
| | | | | | | | | | | | | | | | |
Total | | $ | 1,145,491,058 | | | $ | 1,129,262,188 | | | $ | 16,228,870 | | | $ | — | |
| | | | | | | | | | | | | | | | |
| River Road Select Value Fund | | | | | | | | | | | | | | | | |
| Assets | | | | | | | | | | | | | | | | |
Investments in Securities* | | $ | 210,916,002 | | | $ | 210,916,002 | | | $ | — | | | $ | — | |
| | | | | | | | | | | | | | | | |
| | |
| |
| | April 30, 2014 |
| |
| Notes to Financial Statements (unaudited) – continued | | |
| | | | | | | | | | | | | | | | |
Funds | | Total
Value at
04/30/14 | | | Level 1
Quoted
Prices | | | Level 2
Significant
Observable
Inputs | | | Level 3
Significant
Unobservable
Inputs | |
| River Road Small Cap Value Fund | | | | | | | | | | | | | | | | |
| Assets | | | | | | | | | | | | | | | | |
Common Stocks | | | | | | | | | | | | | | | | |
Consumer Discretionary | | $ | 53,676,992 | | | $ | 53,676,992 | | | $ | — | | | $ | — | |
Consumer Staples | | | 11,393,442 | | | | 11,393,442 | | | | — | | | | — | |
Energy | | | 25,834,763 | | | | 18,477,664 | | | | 7,357,099 | | | | — | |
Financials | | | 44,823,715 | | | | 44,823,715 | | | | — | | | | — | |
Healthcare | | | 24,282,131 | | | | 24,282,131 | | | | — | | | | — | |
Industrials | | | 55,544,771 | | | | 55,544,771 | | | | — | | | | — | |
Information Technology | | | 44,561,260 | | | | 39,973,278 | | | | 4,587,982 | | | | — | |
Materials | | | 18,540,806 | | | | 18,540,806 | | | | — | | | | — | |
Telecommunication Services | | | 8,538,503 | | | | 8,538,503 | | | | — | | | | — | |
| | | | | | | | | | | | | | | | |
Total Common Stocks | | | 287,196,383 | | | | 275,251,302 | | | | 11,945,081 | | | | — | |
| | | | | | | | | | | | | | | | |
Investment Company* | | | 28,743,187 | | | | 28,743,187 | | | | — | | | | — | |
| | | | | | | | | | | | | | | | |
Total | | $ | 315,939,570 | | | $ | 303,994,489 | | | $ | 11,945,081 | | | $ | — | |
| | | | | | | | | | | | | | | | |
| River Road Independent Value Fund | | | | | | | | | | | | | | | | |
| Assets | | | | | | | | | | | | | | | | |
Investments in Securities* | | $ | 728,868,436 | | | $ | 728,868,436 | | | $ | — | | | $ | — | |
| | | | | | | | | | | | | | | | |
| DoubleLine Core Plus Fixed Income Fund | | | | | | | | | | | | | | | | |
| Assets | | | | | | | | | | | | | | | | |
Corporate Notes and Bonds | | $ | 50,518,714 | | | $ | — | | | $ | 50,518,714 | | | $ | — | |
Collateralized Mortgage-Backed Securities | | | 24,188,787 | | | | — | | | | 24,188,787 | | | | — | |
U.S. Government Obligations | | | 14,421,999 | | | | — | | | | 14,421,999 | | | | — | |
Agency Collateralized Mortgage Obligations | | | 13,012,704 | | | | — | | | | 13,012,704 | | | | — | |
U.S. Government Mortgage-Backed Securities | | | 8,832,404 | | | | — | | | | 8,832,404 | | | | — | |
Asset-Backed Securities | | | 5,375,247 | | | | — | | | | 5,375,247 | | | | — | |
Foreign Government Bonds | | | 885,364 | | | | — | | | | 885,364 | | | | — | |
Investment Company* | | | 7,122,045 | | | | 7,122,045 | | | | — | | | | — | |
| | | | | | | | | | | | | | | | |
Total | | $ | 124,357,264 | | | $ | 7,122,045 | | | $ | 117,235,219 | | | $ | — | |
| | | | | | | | | | | | | | | | |
| TCH Fixed Income Fund | | | | | | | | | | | | | | | | |
| Assets | | | | | | | | | | | | | | | | |
Corporate Notes and Bonds | | $ | 26,103,463 | | | $ | — | | | $ | 26,103,463 | | | $ | — | |
U.S. Government and Agency Obligations | | | 22,685,038 | | | | — | | | | 22,685,038 | | | | — | |
Asset-Backed Securities | | | 710,154 | | | | — | | | | 710,154 | | | | — | |
Commercial Mortgage-Backed Security | | | 309,312 | | | | — | | | | 309,312 | | | | — | |
Investment Company* | | | 2,345,664 | | | | 2,345,664 | | | | — | | | | — | |
| | | | | �� | | | | | | | | | | | |
Total | | $ | 52,153,631 | | | $ | 2,345,664 | | | $ | 49,807,967 | | | $ | — | |
| | | | | | | | | | | | | | | | |
| Lake Partners LASSO Alternative Fund | | | | | | | | | | | | | | | | |
| Assets | | | | | | | | | | | | | | | | |
Investments in Securities* | | $ | 494,188,198 | | | $ | 494,188,198 | | | $ | — | | | $ | — | |
| | | | | | | | | | | | | | | | |
| Anchor Capital Enhanced Equity Fund | | | | | | | | | | | | | | | | |
| Assets | | | | | | | | | | | | | | | | |
Common Stocks* | | $ | 183,812,205 | | | $ | 183,812,205 | | | $ | — | | | $ | — | |
Derivatives | | | | | | | | | | | | | | | | |
Equity Contracts | | | 858,900 | | | | 858,900 | | | | — | | | | — | |
Investment Company* | | | 5,120,969 | | | | 5,120,969 | | | | — | | | | — | |
| | | | | | | | | | | | | | | | |
Total Assets | | | 189,792,074 | | | | 189,792,074 | | | | — | | | | — | |
| | | | | | | | | | | | | | | | |
| Liabilities | | | | | | | | | | | | | | | | |
Derivatives | | | | | | | | | | | | | | | | |
Equity Covered Call Contracts | | | (7,437,969 | ) | | | (7,437,969 | ) | | | — | | | | — | |
| | | | | | | | | | | | | | | | |
Total Liabilities | | | (7,437,969 | ) | | | (7,437,969 | ) | | | — | | | | — | |
| | | | | | | | | | | | | | | | |
Total | | $ | 182,354,105 | | | $ | 182,354,105 | | | $ | — | | | $ | — | |
| | | | | | | | | | | | | | | | |
| | |
| |
| | April 30, 2014 |
| |
| Notes to Financial Statements (unaudited) – continued | | |
| | | | | | | | | | | | | | | | |
Funds | | Total
Value at
04/30/14 | | | Level 1
Quoted
Prices | | | Level 2
Significant
Observable
Inputs | | | Level 3
Significant
Unobservable
Inputs | |
| River Road Long-Short Fund | | | | | | | | | | | | | | | | |
| Assets | | | | | | | | | | | | | | | | |
Investments in Securities* | | $ | 228,506,886 | | | $ | 228,506,886 | | | $ | — | | | $ | — | |
| | | | | | | | | | | | | | | | |
Total Assets | | | 228,506,886 | | | | 228,506,886 | | | | — | | | | — | |
| | | | | | | | | | | | | | | | |
| Liabilities | | | | | | | | | | | | | | | | |
Securities Sold Short* | | $ | (56,028,471 | ) | | $ | (56,028,471 | ) | | $ | — | | | $ | — | |
| | | | | | | | | | | | | | | | |
Total Liabilities | | | (56,028,471 | ) | | | (56,028,471 | ) | | | — | | | | — | |
| | | | | | | | | | | | | | | | |
Total | | $ | 172,478,415 | | | $ | 172,478,415 | | | $ | — | | | $ | — | |
| | | | | | | | | | | | | | | | |
| Barings International Fund | | | | | | | | | | | | | | | | |
| Assets | | | | | | | | | | | | | | | | |
Common Stocks | | $ | 28,559,856 | | | $ | 28,559,856 | | | $ | — | | | $ | — | |
Preferred Stock | | | 5,610 | | | | — | | | | — | | | | 5,610 | |
Investment Company* | | | 124,916 | | | | 124,916 | | | | — | | | | — | |
| | | | | | | | | | | | | | | | |
Total | | $ | 28,690,382 | | | $ | 28,684,772 | | | $ | — | | | $ | 5,610 | |
| | | | | | | | | | | | | | | | |
| Guardian Capital Global Dividend Fund | | | | | | | | | | | | | | | | |
| Assets | | | | | | | | | | | | | | | | |
Investments in Securities* | | $ | 4,133,515 | | | $ | 4,133,515 | | | $ | — | | | $ | — | |
| | | | | | | | | | | | | | | | |
| LMCG Emerging Markets Fund | | | | | | | | | | | | | | | | |
| Assets | | | | | | | | | | | | | | | | |
Common Stocks | | $ | 3,780,792 | | | $ | 3,780,792 | | | $ | — | | | $ | — | |
Exchange Traded Funds | | | 215,784 | | | | 215,784 | | | | — | | | | — | |
Rights | | | 1 | | | | — | | | | 1 | | | | — | |
| | | | | | | | | | | | | | | | |
Investment Company* | | | 89,829 | | | | 89,829 | | | | — | | | | — | |
| | | | | | | | | | | | | | | | |
Total | | $ | 4,086,406 | | | $ | 4,086,405 | | | $ | 1 | | | $ | — | |
| | | | | | | | | | | | | | | | |
| ASTON/Pictet International Fund | | | | | | | | | | | | | | | | |
| Assets | | | | | | | | | | | | | | | | |
Investments in Securities* | | $ | 9,958,317 | | | $ | 9,958,317 | | | $ | — | | | $ | — | |
| | | | | | | | | | | | | | | | |
| Harrison Street Real Estate Fund | | | | | | | | | | | | | | | | |
| Assets | | | | | | | | | | | | | | | | |
Investments in Securities* | | $ | 12,556,440 | | | $ | 12,556,440 | | | $ | — | | | $ | — | |
| | | | | | | | | | | | | | | | |
| M&C Balanced Fund | | | | | | | | | | | | | | | | |
| Assets | | | | | | | | | | | | | | | | |
Common Stocks* | | $ | 13,699,282 | | | $ | 13,699,282 | | | $ | — | | | $ | — | |
Corporate Notes and Bonds | | | 5,088,881 | | | | — | | | | 5,088,881 | | | | — | |
U.S. Government and Agency Obligations | | | 3,379,856 | | | | — | | | | 3,379,856 | | | | — | |
Investment Company* | | | 1,487,666 | | | | 1,487,666 | | | | — | | | | — | |
| | | | | | | | | | | | | | | | |
Total | | $ | 23,655,685 | | | $ | 15,186,948 | | | $ | 8,468,737 | | | $ | — | |
| | | | | | | | | | | | | | | | |
| * | | All Common Stocks and Investment Companies are Level 1. Please refer to the Schedule of Investments for industry, sector or country breakout. |
At the end of each fiscal quarter, management evaluates the Level 2 and 3 assets and liabilities for changes in liquidity, including but not limited to: whether a broker is willing to execute at a quoted price, the depth and consistency of prices from third party services, and the existence of contemporaneous, observable trades in the market. Additionally, management evaluates the Level 1 and 2 assets and liabilities on a quarterly basis for changes in listings or delistings on national exchanges. Due to the inherent uncertainty of determining the fair values of investments that do not have readily available market values, the fair values of the Funds’ investments may fluctuate from period to period. Additionally, the fair values of investments may differ significantly from the values that would have been used had a ready market existed for such investments and may differ materially from the values the Funds may
ultimately realize upon the disposition of such investments. Further, such investments may be subject to legal and other restrictions on resale or they may be otherwise less liquid than publicly-traded securities.
Barings International Fund, Guardian Capital Global Dividend Fund, LMCG Emerging Markets Fund, and Pictet International Fund may utilize an external pricing service to fair value certain foreign securities if certain market events occur. Such fair valuations are categorized as Level 2 in the hierarchy. Because such market events were not deemed to have occurred at April 30, 2014, Barings International Fund, Guardian Capital Global Dividend Fund, LMCG Emerging Markets Fund and Pictet International Fund did not utilize the external pricing service adjustments.
| | |
| |
| | April 30, 2014 |
| |
| Notes to Financial Statements (unaudited) – continued | | |
Certain securities that were held at April 30, 2014 and since the beginning of the fiscal year in River Road Dividend All Cap Value Fund, River Road Small Cap Value Fund and River Road Independent Value Fund had changes in liquidity assessments which resulted in a transfer between levels. Transfers between Levels, if any, are recognized as of the last day of the fiscal quarter in which the event or change in circumstances that resulted in reclassification occurred.
| | | | | | | | |
Funds | | Transfer from
Level 1 to Level 2 | | | Transfer from
Level 2 to Level 1 | |
| River Road Dividend All Cap Value Fund | | $ | — | | | $ | 3,687,191 | |
| River Road Small Cap Value Fund | | | 4,587,982 | | | | 6,488,089 | |
| River Road Independent Value Fund | | | — | | | | 27,339,076 | |
Level 3 holdings were valued using internal valuation techniques that took into consideration factors including previous experience with similar securities of the same issuer, conversion ratio and security terms.
The following is a reconciliation of Level 3 holdings for which significant unobservable inputs were used in determining fair value as of April 30, 2014:
| | | | |
| Barings International Fund | | | Common Stocks | |
| | | | |
Fair Value, beginning of period | | $ | 4,485 | |
Purchases | | | 5,590 | |
Sales | | | (4,599 | ) |
Net realized gains | | | 76 | |
Change in unrealized appreciation (depreciation) | | | 58 | |
| | | | |
Fair Value, end of period | | $ | 5,610 | |
| | | | |
Change in net unrealized appreciation (depreciation)
on Level 3 holdings held at end of period | | $ | 20 | |
| | | | |
(2) Repurchase Agreements: Each Fund may enter into repurchase agreements with financial institutions deemed to be creditworthy by the Fund’s Adviser or Subadviser, subject to the seller’s agreement to repurchase and the Fund’s agreement to sell such securities at a mutually agreed upon price. Securities purchased subject to repurchase agreements are deposited with the Fund’s custodian and, pursuant to the terms of the repurchase agreement, must have an aggregate market value greater than or equal to the repurchase price plus accrued interest at all times. If the value of the underlying securities falls below the value of the repurchase price plus accrued interest, the Fund will require the seller to deposit additional collateral by the next business day. If the request for additional collateral is not met, or the seller defaults on its repurchase obligation, the Fund has the right to sell the underlying securities at market value and may claim any resulting loss against the seller. As of and during the year ended April 30, 2014, the Funds did not hold any repurchase agreements.
(3) When Issued/Delayed Delivery Securities: Each Fund may purchase and sell securities on a “when issued” or “delayed delivery” basis, with settlement to occur at a later date. The value of any security so purchased is subject to market fluctuations during the applicable period. The Funds segregate assets
having an aggregate value at least equal to the amount of when issued or delayed delivery purchase commitments until payment is made. During the six months ended April 30, 2014, DoubleLine Core Plus Fixed Income Fund and TCH Fixed Income Fund owned delayed delivery securities. At April 30, 2014, no delayed delivery securities were held.
(4) Mortgage-Backed Securities: M&C Balanced Fund, DoubleLine Core Plus Fixed Income Fund and TCH Fixed Income Fund may invest in mortgage-backed securities (“MBS”). These securities represent interests in pools of mortgage loans and they provide shareholders with payments consisting of both principal and interest as the mortgages in the underlying mortgage pools are paid. The timely payment of principal and interest on MBS issued or guaranteed by Ginnie Mae (formerly known as the Government National Mortgage Association) is backed by Ginnie Mae and the full faith and credit of the U.S. government. MBS issued by U.S. government agencies or instrumentalities other than Ginnie Mae are not “full faith and credit” obligations. Certain obligations, such as those issued by the Federal Home Loan Banks, Fannie Mae (formerly known as the Federal National Mortgage Association) and Freddie Mac (formerly known as the Federal Home Loan Mortgage Corporation) are supported only by the credit of the issuer. MBS issued by private issuers are not government securities and are not directly guaranteed by any government agency. They are secured by the underlying collateral of the private issuer. Yields on privately issued MBS tend to be higher than those of government-backed issues. However, risk of loss due to default and sensitivity to interest rate fluctuations are also higher. M&C Balanced Fund, DoubleLine Core Plus Fixed Income Fund and TCH Fixed Income Fund may also invest in collateralized mortgage obligations (“CMOs”), collateralized loan obligations (“CLOs”) and real estate mortgage investment conduits (“REMICs”). A CMO and/or REMIC is a bond that is collateralized by a pool of MBS. A CLO is a bond that is collateralized by a financial institution’s receivables from loans. These MBS pools are divided into classes with each class having its own characteristics. The different classes are retired in sequence as the underlying mortgages are repaid.
(5) Securities Sold Short: River Road Long-Short Fund utilizes short sales as part of its overall portfolio management strategy. A short sale involves the sale of a security that is borrowed from a broker or other institution. A gain, limited to the price at which the Fund sold the security short, or a loss, unlimited in size, will be recognized upon closing a short sale. Short sales expose the Fund to the risk that it will be required to acquire, convert or exchange securities to replace the borrowed securities at a time when the securities sold short have appreciated in value, thus resulting in a loss to the Fund. The Fund making a short sale must segregate liquid assets, or otherwise cover its position in a permissible manner. The Subadviser determines the liquidity of assets, in accordance with procedures established by the Board of Trustees. Cash segregated for short sales is shown in the Statement of Assets and Liabilities as segregated cash as collateral. Security positions segregated as collateral for short sales are included in the Total Investments on the Statement of Assets and Liabilities.
| | |
| |
| | April 30, 2014 |
| |
| Notes to Financial Statements (unaudited) – continued | | |
(6) Options Contracts: In the normal course of pursuing its investment objectives, certain Funds are subject to price volatility risk. Certain Funds may write and/or purchase call and put options on securities for hedging purposes, to seek capital appreciation, to mitigate risk and/or to increase exposure. Writing put options or purchasing call options tends to increase a Fund’s exposure to the underlying instrument. Writing call options or purchasing put options tends to decrease a Fund’s exposure to the underlying instrument. When a Fund writes or purchases a call or put option, an amount equal to the premium received or paid by the Fund is included in a Fund’s Statement of Assets and Liabilities as a liability or an investment and subsequently adjusted to the current market value based on the quoted daily settlement price of the option written or purchased. Premiums received or paid from writing or purchasing options that expire unexercised are treated by the Fund on the expiration date as realized gains or losses. The difference between the premium and the amount paid or received on a closing purchase or sale transaction, including brokerage commissions, is also treated as a realized gain or loss. If an option is exercised, the premium paid or received is added to the cost of the purchase or proceeds from the sale in determining whether the Fund has realized a gain or loss on investment transactions. If the Fund writes a covered call option, the Fund forgoes, in exchange for the premium, the opportunity to profit during the option period from an increase in the market value of the underlying security above the exercise price. If the Fund writes a put option, it accepts the risk of a decline in the market value of the underlying security below the exercise price. There is the risk a Fund may not be able to enter into a closing transaction because of an illiquid market. The risk associated with purchasing put and call options is limited to the premium paid. Options were traded during the period in Anchor Capital Enhanced Equity Fund. See the Schedule of Investments for open options contracts held by Anchor Capital Enhanced Equity Fund at April 30, 2014. As of and during the six months ended April 30, 2014, the average* volume of derivative activities were as follows:
| | | | | | | | |
Funds | | Purchased
Options
(Cost) | | | Written
Options
(Premiums Received) | |
| Anchor Capital Enhanced Equity Fund | | $ | 1,549,929 | | | $ | 4,452,652 | |
| * | estimate based on quarter-end holdings |
(7) Forward Foreign Currency Contracts: In the normal course of pursuing their investment objectives, certain Funds are subject to foreign investment and currency risk. Certain Funds may enter into forward foreign currency contracts (“forward contracts”) for purposes of hedging, duration management, as a substitute for securities, to increase returns, for currency hedging or risk management, or to otherwise help achieve a Fund’s investment goal. These contracts are marked-to-market daily at the applicable exchange rates. A Fund records realized gains or losses at the time the forward contract is closed. A forward contract is extinguished through a closing transaction or upon delivery of the currency or entering an offsetting contract. Risks may arise upon entering these contracts from the potential inability of a counterparty to meet the terms of its contracts and from unanticipated movements in the value of a foreign currency rela-
tive to the U.S. dollar or other currencies. During the six months ended April 30, 2014, the Funds did not enter into any forward foreign currency contracts.
(8) Disclosures about Derivative Instruments: The following is a table summarizing the fair value of derivatives held at April 30, 2014, by primary risk exposure:
| | | | | | | | |
| | | Asset Derivative
Investments Value | | | Liability Derivative
Investments Value | |
Fund | | Equity
Contracts (a) | | | Equity
Contracts(a) | |
| | | | | | | | |
| Anchor Capital Enhanced Equity Fund | | $ | 858,900 | | | $ | (7,437,969 | ) |
| (a) | Statement of Assets and Liabilities location: Total investments at value for purchased options and call options written, at value for written options. |
The effect of derivative instruments on the Statement of Operations for the six months ended April 30, 2014:
| | | | | | | | |
| | | Amount of
Realized Gain (Loss)
on Derivatives | | | Change in Unrealized
Appreciation
(Depreciation)
on Derivatives | |
Fund | | Equity
Contracts(a) | | | Equity
Contracts(b) | |
| Anchor Capital Enhanced Equity Fund | | $ | (8,689,339 | ) | | $ | 633,420 | |
| (a) | Statement of Operations location: Net realized loss on purchased options and net realized loss on written option. |
| (b) | Statement of Operations location: Net change in unrealized appreciation (depreciation) on purchased options and net change in unrealized appreciation (depreciation) on written options. |
(9) Investment Income and Securities Transactions: Dividend income is recorded on the ex-dividend date, except for certain dividends from foreign securities where the ex-dividend date may have passed, which are recorded as soon as a Fund is informed of the ex-dividend date. Interest income is accrued daily. Dividend income and interest income are recorded in the Statement of Operations as investment income. Premiums and discounts are amortized or accreted on an effective yield method on fixed income securities. The Funds may be subject to foreign taxes on income, gains on investments, securities transactions or currency repatriation, some of which may be recoverable in part. The Funds will accrue such taxes and reclaims as applicable, based upon their current interpretation of tax rules and regulations that exist in the markets in which the Funds invest. Transactions in securities are accounted for on a trade date basis. The cost of securities sold is determined using the identified cost method for the Fairpointe Mid Cap Fund and first in first out (“FIFO”) method for all other Funds.
(10) Foreign Currency: Foreign currencies, investments and other assets and liabilities are translated into U.S. dollars at the exchange rates at the close of the regular trading session on the New York Stock Exchange. Fluctuations in the value of the foreign currencies and other assets and liabilities resulting from changes in exchange rates are recorded as unrealized foreign currency gains (losses). Realized gains (losses) and unrealized appreciation (depreciation) on investment securities and income and expenses are translated on the
| | |
| |
| | April 30, 2014 |
| |
| Notes to Financial Statements (unaudited) – continued | | |
respective dates of such transactions. The effects of changes in foreign currency exchange rates on investments in securities are segregated from the effects of changes in market prices of those securities, and are included with the net realized and net change in unrealized gain or loss on investment securities on the Statement of Operations.
(11) Federal Income Taxes: The Funds have elected to be treated as “regulated investment companies” under Subchapter M of
the Internal Revenue Code of 1986, as amended, and to distribute substantially all of their respective net taxable income. Accordingly, no provisions for federal income taxes have been made in the accompanying financial statements. The Funds intend to utilize provisions of the federal income tax laws, which allow them to carry a realized capital loss forward for eight years following the year of the loss and offset such losses against any future realized capital gains.
At October 31, 2013, the following Funds had available realized capital loss carryforwards to offset future net capital gains through the fiscal year ended:
| | | | | | | | | | | | | | | | | | | | | | | | | | | | |
| | | Capital Loss Carryforwards: | |
Fund | | 2014 | | | 2016 | | | 2017 | | | 2018 | | | No Expiration
Short Term* | | | No Expiration
Long Term* | | | Total | |
| | | | | | | | | | | | | | | | | | | | | | | | | | | | |
| M&C Growth Fund | | $ | — | | | $ | — | | | $ | 8,908,833 | | | $ | — | | | $ | — | | | $ | — | | | $ | 8,908,833 | |
| Cornerstone Large Cap Value Fund | | | — | | | | — | | | | 17,809,802 | | | | 6,819,813 | | | | — | | | | — | | | | 24,629,615 | |
| LMCG Small Cap Growth Fund | | | — | | | | 1,684,815 | ** | | | — | | | | — | | | | — | | | | — | | | | 1,684,815 | |
| DoubleLine Core Plus Fixed Income Fund | | | — | | | | — | | | | — | | | | — | | | | 2,919,807 | | | | — | | | | 2,919,807 | |
| TCH Fixed Income Fund | | | 922,672 | | | | 2,654,917 | | | | 1,270,780 | | | | — | | | | — | | | | — | | | | 4,848,369 | |
| Anchor Capital Enhanced Equity Fund | | | — | | | | — | | | | — | | | | — | | | | 1,021,730 | | | | — | | | | 1,021,730 | |
| LMCG Emerging Markets Fund | | | — | | | | — | | | | — | | | | — | | | | 219,304 | | | | — | | | | 219,304 | |
| Harrison Street Real Estate Fund | | | — | | | | 921,876 | | | | 11,228,100 | | | | — | | | | — | | | | — | | | | 12,149,976 | |
| * | On December 22, 2010, the Regulated Investment Company Modernization Act of 2010 (the “Modernization Act”) was signed into law. Under the Modernization Act the Funds are permitted to carry forward capital losses incurred for an unlimited period. However, any losses incurred during those future taxable years will be required to be utilized prior to the losses incurred in pre-enactment taxable years. As a result of this ordering rule, pre-enactment capital loss carryforwards may be more likely to expire unused. Additionally, post-enactment capital losses that are carried forward will retain their character as either short-term or long-term capital losses rather than being considered all short-term as under previous law. |
| ** | This capital loss carryforward amount was acquired in the reorganization of the Aston Small Cap Fund into the LMCG Small Cap Growth Fund on April 19, 2013. The Fund’s ability to utilize the capital loss carryforwards is limited under Internal Revenue Service regulations. |
Management has analyzed the Funds’ tax positions for all open tax years (current and prior three tax years) and has concluded that no provision for federal, state, or international income tax is required in the Funds’ financial statements. The Funds’ federal income and excise tax returns for tax years for which the applicable statutes of limitations have not expired are subject to examination by the Internal Revenue Service.
(12) Multi-Class Operations: Each class offered by a Fund that is authorized to offer multiple classes of shares has equal rights as to the Fund’s net assets.
Income, fund and trust level expenses, and realized and unrealized capital gains and losses, if any, are allocated to each class of shares based on the relative net assets of each class. Class specific expenses are allocated to each class.
(13) Offering Costs: Certain costs were incurred in connection with the offering of the following Funds, as disclosed in the table below. The costs associated have been capitalized and are being amortized on a straight-line basis over twelve months based on the commencement date of the Funds, stated below.
| | | | | | | | |
Fund | | Inception Date | | | Original
Offering Costs | |
| Guardian Capital Global Dividend Fund | | | April 14, 2014 | | | $ | 70,000 | |
| LMCG Emerging Markets Fund | | | March 28, 2013 | | | | 72,373 | |
| Pictet International Fund | | | April 14, 2014 | | | | 70,000 | |
(14) Use of Estimates: The preparation of financial statements in conformity with U.S. GAAP requires management to make estimates and assumptions that affect the reported amounts of assets and liabilities and disclosure of contingent assets and liabilities at the date of the financial statements and the reported amounts of revenues and expenses during the reporting period. Actual results could differ from those estimates.
(15) Commitments and Contingencies: In the normal course of business, the Trust enters into contracts on behalf of the Funds that contain a variety of provisions for general indemnifications. Each Fund’s maximum exposure under these arrangements is unknown, as this would involve future claims that may be made against each Fund that are not known at this time. However, based on experience, the Funds believe the risk of loss is remote.
Note (C) Dividends from Net Investment Income and Distributions of Capital Gains: Dividends and distributions to shareholders are recorded on the ex-dividend date. River Road Dividend All Cap
| | |
| |
| | April 30, 2014 |
| |
| Notes to Financial Statements (unaudited) – continued | | |
Value Fund, River Road Dividend All Cap Value Fund II, DoubleLine Core Plus Fixed Income Fund and TCH Fixed Income Fund distribute dividends from net investment income to shareholders monthly and net realized gains from investment transactions, if any, are generally distributed annually, usually in December.
Anchor Capital Enhanced Equity Fund, Guardian Capital Global Dividend Fund, and M&C Balanced Fund distribute dividends from net investment income to shareholders quarterly and net realized gains from investment transactions, if any, are generally distributed annually, usually in December.
The following Funds distribute dividends from net investment income to shareholders annually and net realized gains from investment transactions, if any, are generally distributed annually, usually in December: M&C Growth Fund, TAMRO Diversified Equity Fund, Herndon Large Cap Value Fund, Cornerstone Large Cap Value Fund, Fairpointe Mid Cap Fund, M&C Mid Cap Growth Fund, LMCG Small Cap Growth Fund, Silvercrest Small Cap Fund, TAMRO Small Cap Fund, River Road Select Value Fund, River Road Small Cap Value Fund, River Road Independent Value Fund, Lake Partners LASSO Alternatives Fund, River Road Long-Short Fund, Barings International Fund, LMCG Emerging Markets Fund, Pictet International Fund and Harrison Street Real Estate Fund.
Dividends and distributions are automatically reinvested in additional Fund shares on ex-date at that day’s ending NAV for the respective Fund for those shareholders who have elected the reinvestment option.
Differences in dividends per share between classes of the following Funds are due to different class expenses: M&C Growth Fund, TAMRO Diversified Equity Fund, Herndon Large Cap Value Fund, Cornerstone Large Cap Value Fund, River Road Dividend All Cap Value Fund, River Road Dividend All Cap Value
Fund II, Fairpointe Mid Cap Fund, LMCG Small Cap Growth Fund, Silvercrest Small Cap Fund, TAMRO Small Cap Fund, River Road Select Value Fund, River Road Small Cap Value Fund, River Road Independent Value Fund, DoubleLine Core Plus Fixed Income Fund, TCH Fixed Income Fund, Lake Partners LASSO Alternatives Fund, Anchor Capital Enhanced Equity Fund, Guardian Capital Global Dividend Fund, River Road Long-Short Fund, Barings International Fund, LMCG Emerging Markets Fund, Pictet International Fund, Harrison Street Real Estate Fund and M&C Balanced Fund.
Net investment income and realized gains and losses for federal income tax purposes may differ from those reported on the financial statements because of temporary and permanent book and tax basis differences. Permanent differences, such as redesignation of dividends paid, partnership reclasses, disallowed expenses, reclass of short-term gain to ordinary income, write off of capital loss carryovers, merger reclasses, in-kind distribution for redemptions, adjustment for Real Estate Investment Trusts, return of capital adjustments, premium reversals, paydown reclasses, undistributed capital gains received, passive foreign investment company reclasses, foreign currency reclasses, and net operating loss reclasses are reclassified among capital accounts in the financial statements to reflect their character. Temporary differences, such as deferrals on losses relating to wash sales transactions, amortization of offering costs, premium amortization, current year dividends payable, passive foreign investment company adjustments and capital loss carryovers, arise when income, expenses, gains or losses are recognized in different periods for financial statement and tax purposes; these differences will reverse at some time in the future.
Distributions from net realized gains for book purposes may include short-term capital gains, which are classified as ordinary income for tax purposes.
The tax character of distributions paid during the fiscal years ended 2013 and 2012 was as follows:
| | | | | | | | | | | | | | | | |
| | | Distributions Paid in 2013 | | | Distributions Paid in 2012 | |
| | | Ordinary Income | | | Long-Term
Capital Gains | | | Ordinary Income | | | Long-Term
Capital Gains | |
| | | | | | | | | | | | | | | | |
| M&C Growth Fund | | $ | 53,175,678 | | | $ | 275,103,427 | | | $ | 22,081,432 | | | $ | 257,690,139 | |
| TAMRO Diversified Equity Fund | | | 47,422 | | | | 25,803 | | | | — | | | | 473,355 | |
| Herndon Large Cap Value Fund | | | 2,225,740 | | | | 4,982 | | | | 1,044,862 | | | | 124,149 | |
| Cornerstone Large Cap Value Fund | | | 275,360 | | | | — | | | | 110,939 | | | | — | |
| River Road Dividend All Cap Value Fund | | | 31,709,319 | | | | 26,566,474 | | | | 22,890,654 | | | | 4,651,009 | |
| River Road Dividend All Cap Value Fund II | | | 964,010 | | | | — | | | | 42,004 | | | | — | |
| Fairpointe Mid Cap Fund | | | 33,005,046 | | | | 66,057,903 | | | | 8,163,228 | | | | 18,767,770 | |
| M&C Mid Cap Growth Fund | | | — | | | | 92,399 | | | | — | | | | — | |
| LMCG Small Cap Growth Fund | | | 436,931 | | | | 47,268 | | | | — | | | | — | |
| Silvercrest Small Cap Fund | | | 110,190 | | | | 717 | | | | — | | | | — | |
| TAMRO Small Cap Fund | | | 18,818,417 | | | | 76,987,885 | | | | — | | | | 97,192,931 | |
| River Road Select Value Fund | | | 3,212,685 | | | | 8,700,481 | | | | 1,196,413 | | | | 28,132,801 | |
| River Road Small Cap Value Fund | | | 5,316,856 | | | | 9,066,179 | | | | — | | | | — | |
| River Road Independent Value Fund | | | 39,553,086 | | | | — | | | | 5,597,522 | | | | 100,643 | |
| DoubleLine Core Plus Fixed Income Fund | | | 8,127,489 | | | | 22,764 | | | | 3,389,167 | | | | — | |
| TCH Fixed Income Fund | | | 2,721,001 | | | | — | | | | 3,234,814 | | | | — | |
| Lake Partners LASSO Alternatives Fund | | | 4,205,294 | | | | — | | | | 3,680,936 | | | | — | |
| Anchor Capital Enhanced Equity Fund | | | 5,860,687 | | | | 556,618 | | | | 12,244,228 | | | | 2,409,141 | |
| River Road Long-Short Fund | | | 415,810 | | | | 21,761 | | | | — | | | | — | |
| Barings International Fund | | | 1,201,521 | | | | 550,401 | | | | 509,770 | | | | 1,380,720 | |
| Harrison Street Real Estate Fund | | | 165,004 | | | | — | | | | 47,575 | | | | — | |
| M&C Balanced Fund | | | 366,801 | | | | — | | | | 331,475 | | | | — | |
| | |
| |
| | April 30, 2014 |
| |
| Notes to Financial Statements (unaudited) – continued | | |
As of October 31, 2013, the most recent tax year end, the components of distributable earnings on a tax basis were as follows:
| | | | | | | | | | | | | | | | | | | | |
| | | | | | | | | | | | | | | | | | | | |
| | | Accumulated
Capital and
Other Losses | | | Undistributed
Ordinary Income | | | Undistributed
Long-Term Gain | | | Unrealized
Appreciation
(Depreciation) | | | Total | |
| M&C Growth Fund | | $ | (8,908,833 | ) | | $ | 38,528,779 | | | $ | 341,917,731 | | | $ | 1,023,840,776 | | | $ | 1,395,378,453 | |
| TAMRO Diversified Equity Fund | | | — | | | | 14,401 | | | | 1,631,267 | | | | 10,005,089 | | | | 11,650,757 | |
| Herndon Large Cap Value Fund | | | — | | | | 3,040,210 | | | | 6,009 | | | | 14,830,184 | | | | 17,876,403 | |
| Cornerstone Large Cap Value Fund | | | (24,629,615 | ) | | | 194,302 | | | | — | | | | 6,743,238 | | | | (17,692,075 | ) |
| River Road Dividend All Cap Value Fund | | | — | | | | 8,243,688 | | | | 64,849,047 | | | | 253,141,279 | | | | 326,234,014 | |
| River Road Dividend All Cap Value Fund II | | | — | | | | 1,061,195 | | | | 86,668 | | | | 9,133,055 | | | | 10,280,918 | |
| Fairpointe Mid Cap Fund | | | — | | | | 1,616,865 | | | | 458,042,243 | | | | 1,351,306,933 | | | | 1,810,966,041 | |
| M&C Mid Cap Growth Fund | | | — | | | | 26,432 | | | | 1,654,448 | | | | 1,741,365 | | | | 3,422,245 | |
| LMCG Small Cap Growth Fund | | | (1,684,815 | ) | | | 4,567,509 | | | | 960,053 | | | | 2,124,807 | | | | 5,967,554 | |
| Silvercrest Small Cap Fund | | | — | | | | 677,353 | | | | 562,115 | | | | 4,502,700 | | | | 5,742,168 | |
| TAMRO Small Cap Fund | | | (56,283 | ) | | | — | | | | 114,044,766 | | | | 358,481,339 | | | | 472,469,822 | |
| River Road Select Value Fund | | | — | | | | 4,930,269 | | | | 26,823,530 | | | | 36,277,221 | | | | 68,031,020 | |
| River Road Small Cap Value Fund | | | — | | | | 10,535,946 | | | | 56,871,739 | | | | 81,975,774 | | | | 149,383,459 | |
| River Road Independent Value Fund | | | — | | | | 27,424,159 | | | | 832,772 | | | | 18,785,696 | | | | 47,042,627 | |
| DoubleLine Core Plus Fixed Income Fund | | | (2,919,807 | ) | | | 97,083 | | | | — | | | | (1,108,072 | ) | | | (3,930,796 | ) |
| TCH Fixed Income Fund | | | (4,848,369 | ) | | | 15,970 | | | | — | | | | 3,134,329 | | | | (1,698,070 | ) |
| Lake Partners LASSO Alternatives Fund | | | — | | | | 210,610 | | | | 1,588,681 | | | | 27,785,787 | | | | 29,585,078 | |
| Anchor Capital Enhanced Equity Fund | | | (1,021,730 | ) | | | 141,432 | | | | — | | | | 6,270,854 | | | | 5,390,556 | |
| River Road Long-Short Fund | | | — | | | | 4,908,263 | | | | 28,009 | | | | 5,719,566 | | | | 10,655,838 | |
| Barings International Fund | | | — | | | | 2,456,896 | | | | 943,531 | | | | 5,098,098 | | | | 8,498,525 | |
| LMCG Emerging Markets Fund | | | (219,304 | ) | | | 48,938 | | | | — | | | | 77,545 | | | | (92,821 | ) |
| Harrison Street Real Estate Fund | | | (12,149,976 | ) | | | 147,489 | | | | — | | | | (30,626 | ) | | | (12,033,113 | ) |
| M&C Balanced Fund | | | — | | | | 24,140 | | | | 740,661 | | | | 2,998,604 | | | | 3,763,405 | |
Note (D) Shares of Beneficial Interest: Each Fund is authorized to issue an unlimited number of shares of beneficial interest with no par value. Share transactions of the Funds were as follows:
Six Months Ended April 30, 2014
| | | | | | | | | | | | | | | | |
Class N | | Sold | | | Proceeds From
Reinvestment
of Distributions | | | Redeemed | | | Net Increase
(Decrease) in
Shares Outstanding | |
| M&C Growth Fund | | | 3,824,896 | | | | 5,582,826 | | | | (12,228,721 | ) | | | (2,820,999 | ) |
| TAMRO Diversified Equity Fund | | | 109,362 | | | | 42,330 | | | | (221,826 | ) | | | (70,134 | ) |
| Herndon Large Cap Value Fund | | | 525,096 | | | | 78,379 | | | | (297,753 | ) | | | 305,722 | |
| Cornerstone Large Cap Value Fund | | | 171,377 | | | | 6,617 | | | | (477,865 | ) | | | (299,871 | ) |
| River Road Dividend All Cap Value Fund | | | 2,660,863 | | | | 2,408,782 | | | | (3,556,310 | ) | | | 1,513,335 | |
| River Road Dividend All Cap Value Fund II | | | 259,658 | | | | 9,742 | | | | (46,250 | ) | | | 223,150 | |
| Fairpointe Mid Cap Fund | | | 6,577,733 | | | | 4,903,545 | | | | (7,950,376 | ) | | | 3,530,902 | |
| M&C Mid Cap Growth Fund | | | 23,310 | | | | 147,172 | | | | (70,409 | ) | | | 100,073 | |
| LMCG Small Cap Growth Fund | | | 139,242 | | | | 304,695 | | | | (283,967 | ) | | | 159,970 | |
| Silvercrest Small Cap Fund | | | 116,362 | | | | 9,961 | | | | (128,952 | ) | | | (2,629 | ) |
| TAMRO Small Cap Fund | | | 1,422,782 | | | | 1,983,755 | | | | (3,829,956 | ) | | | (423,419 | ) |
| River Road Select Value Fund | | | 111,119 | | | | 295,283 | | | | (385,356 | ) | | | 21,046 | |
| River Road Small Cap Value Fund | | | 524,958 | | | | 871,062 | | | | (738,907 | ) | | | 657,113 | |
| River Road Independent Value Fund | | | 3,902,614 | | | | 1,167,150 | | | | (7,239,030 | ) | | | (2,169,266 | ) |
| DoubleLine Core Plus Fixed Income Fund | | | 481,299 | | | | 74,460 | | | | (2,805,129 | ) | | | (2,249,370 | ) |
| TCH Fixed Income Fund | | | 291,305 | | | | 73,142 | | | | (624,368 | ) | | | (259,921 | ) |
| Lake Partners LASSO Alternatives Fund | | | 1,025,400 | | | | 40,597 | | | | (1,703,807 | ) | | | (637,810 | ) |
| Anchor Capital Enhanced Equity Fund | | | 1,979,793 | | | | 97,721 | | | | (1,619,708 | ) | | | 457,806 | |
| River Road Long-Short Fund | | | 3,376,271 | | | | 238,102 | | | | (3,985,545 | ) | | | (371,172 | ) |
| Barings International Fund | | | 2,340 | | | | 5,415 | | | | (1,163 | ) | | | 6,592 | |
| Guardian Capital Global Dividend Fund (a) | | | 100,001 | | | | — | | | | — | | | | 100,001 | |
| LMCG Emerging Markets Fund | | | 2,121 | | | | 1,079 | | | | (313 | ) | | | 2,887 | |
| Pictet International Fund (b) | | | 100,001 | | | | — | | | | — | | | | 100,001 | |
| Harrison Street Real Estate Fund | | | 184,428 | | | | 12,654 | | | | (299,911 | ) | | | (102,829 | ) |
| M&C Balanced Fund | | | 33,365 | | | | 32,212 | | | | (102,271 | ) | | | (36,694 | ) |
| | |
| |
| | April 30, 2014 |
| |
| Notes to Financial Statements (unaudited) – continued | | |
| | | | | | | | | | | | | | | | |
Class I | | Sold | | | Proceeds From
Reinvestment
of Distributions | | | Redeemed | | | Net Increase
(Decrease) in
Shares Outstanding | |
M&C Growth Fund | | | 10,930,107 | | | | 5,932,472 | | | | (24,542,126 | ) | | | (7,679,547 | ) |
TAMRO Diversified Equity Fund | | | 107,044 | | | | 50,315 | | | | (217,744 | ) | | | (60,385 | ) |
Herndon Large Cap Value Fund | | | 1,164,671 | | | | 145,491 | | | | (523,905 | ) | | | 786,257 | |
Cornerstone Large Cap Value Fund | | | 3,193,157 | | | | 19,747 | | | | (130,139 | ) | | | 3,082,765 | |
River Road Dividend All Cap Value Fund | | | 5,820,875 | | | | 2,721,956 | | | | (6,067,487 | ) | | | 2,475,344 | |
River Road Dividend All Cap Value Fund II | | | 1,685,385 | | | | 178,465 | | | | (473,670 | ) | | | 1,390,180 | |
Fairpointe Mid Cap Fund | | | 14,721,493 | | | | 3,826,779 | | | | (8,587,392 | ) | | | 9,960,880 | |
LMCG Small Cap Growth Fund | | | 71,549 | | | | 82,467 | | | | (190,623 | ) | | | (36,607 | ) |
Sillvercrest Small Cap Fund | | | 1,343,964 | | | | 76,930 | | | | (120,546 | ) | | | 1,300,348 | |
TAMRO Small Cap Fund | | | 3,538,826 | | | | 2,400,215 | | | | (5,637,844 | ) | | | 301,197 | |
River Road Select Value Fund | | | 1,610,918 | | | | 3,175,257 | | | | (2,169,973 | ) | | | 2,616,202 | |
River Road Small Cap Value Fund | | | 2,402,853 | | | | 3,935,519 | | | | (2,157,314 | ) | | | 4,181,058 | |
River Road Independent Value Fund | | | 8,009,348 | | | | 1,311,396 | | | | (5,238,532 | ) | | | 4,082,212 | |
DoubleLine Core Plus Fixed Income Fund | | | 2,417,033 | | | | 162,240 | | | | (5,153,578 | ) | | | (2,574,305 | ) |
TCH Fixed Income Fund | | | 141,855 | | | | 16,058 | | | | (130,028 | ) | | | 27,885 | |
Lake Partners LASSO Alternatives Fund | | | 5,327,961 | | | | 329,595 | | | | (4,063,776 | ) | | | 1,593,780 | |
Anchor Capital Enhanced Equity Fund | | | 3,539,331 | | | | 58,622 | | | | (1,548,256 | ) | | | 2,049,697 | |
| River Road Long-Short Fund | | | 4,257,354 | | | | 164,164 | | | | (763,128 | ) | | | 3,658,390 | |
Barings International Fund | | | 455,286 | | | | 457,485 | | | | (1,810,318 | ) | | | (897,547 | ) |
| Guardian Capital Global Dividend Fund (a) | | | 300,001 | | | | — | | | | — | | | | 300,001 | |
LMCG Emerging Markets Fund | | | 25,561 | | | | 5,932 | | | | — | | | | 31,493 | |
| Pictet International Fund (b) | | | 900,001 | | | | — | | | | — | | | | 900,001 | |
Harrison Street Real Estate Fund | | | 3,186 | | | | 396 | | | | (9,749 | ) | | | (6,167 | ) |
M&C Balanced Fund | | | 5,022 | | | | 1,173 | | | | (10,642 | ) | | | (4,447 | ) |
| (a) | The inception date for the Guardian Capital Global Dividend Fund Class N and I is April 14, 2014. |
| (b) | The inception date for the Pictet International Fund Class N and I is April 14, 2014. |
| | | | | | | | | | | | | | | | |
Class R | | Sold | | | Proceeds From
Reinvestment of
Distributions | | | Redeemed | | | Net
Decrease in
Shares Outstanding | |
| M&C Growth Fund | | | 27,210 | | | | 20,886 | | | | (53,792 | ) | | | (5,696 | ) |
Year Ended October 31, 2013
| | | | | | | | | | | | | | | | |
Class N | | Sold | | | Proceeds From
Reinvestment
of Distributions | | | Redeemed | | | Net Increase
(Decrease) in
Shares Outstanding | |
| M&C Growth Fund | | | 15,308,565 | | | | 5,984,433 | | | | (20,341,948 | ) | | | 951,050 | |
| TAMRO Diversified Equity Fund | | | 272,293 | | | | 5,056 | | | | (303,307 | ) | | | (25,958 | ) |
| Herndon Large Cap Value Fund | | | 1,724,473 | | | | 77,295 | | | | (553,437 | ) | | | 1,248,331 | |
| Cornerstone Large Cap Value Fund | | | 556,632 | | | | 18,800 | | | | (747,212 | ) | | | (171,780 | ) |
| River Road Dividend All Cap Value Fund | | | 5,156,129 | | | | 1,828,175 | | | | (3,861,426 | ) | | | 3,122,878 | |
| River Road Dividend All Cap Value Fund II | | | 254,219 | | | | 3,387 | | | | (76,152 | ) | | | 181,454 | |
| Fairpointe Mid Cap Fund | | | 18,070,132 | | | | 1,435,859 | | | | (14,913,034 | ) | | | 4,592,957 | |
| M&C Mid Cap Growth Fund | | | 597,270 | | | | 7,828 | | | | (423,852 | ) | | | 181,246 | |
| LMCG Small Cap Growth Fund | | | 2,004,046 | | | | 38,933 | | | | (359,721 | ) | | | 1,683,258 | |
| Silvercrest Small Cap Fund | | | 314,297 | | | | 1,162 | | | | (105,758 | ) | | | 209,701 | |
| TAMRO Small Cap Fund | | | 6,816,406 | | | | 1,892,026 | | | | (5,489,343 | ) | | | 3,219,089 | |
| River Road Select Value Fund | | | 1,588,871 | | | | 56,761 | | | | (525,762 | ) | | | 1,119,870 | |
| River Road Small Cap Value Fund | | | 544,887 | | | | 169,935 | | | | (1,009,533 | ) | | | (294,711 | ) |
| River Road Independent Value Fund | | | 11,980,826 | | | | 1,889,378 | | | | (16,056,650 | ) | | | (2,186,446 | ) |
| DoubleLine Core Plus Fixed Income Fund | | | 4,823,072 | | | | 292,494 | | | | (5,329,639 | ) | | | (214,073 | ) |
| TCH Fixed Income Fund | | | 953,216 | | | | 201,498 | | | | (2,241,661 | ) | | | (1,086,947 | ) |
| Lake Partners LASSO Alternatives Fund | | | 4,155,866 | | | | 36,352 | | | | (2,837,160 | ) | | | 1,355,058 | |
| Anchor Capital Enhanced Equity Fund | | | 4,989,293 | | | | 427,532 | | | | (6,819,244 | ) | | | (1,402,419 | ) |
| River Road Long-Short Fund | | | 9,748,334 | | | | 42,565 | | | | (1,427,562 | ) | | | 8,363,337 | |
| Barings International Fund | | | 2,509 | | | | 1,555 | | | | (4,238 | ) | | | (174 | ) |
| LMCG Emerging Markets Fund (a) | | | 69,890 | | | | — | | | | — | | | | 69,890 | |
| Harrison Street Real Estate Fund | | | 926,494 | | | | 14,559 | | | | (770,368 | ) | | | 170,685 | |
| M&C Balanced Fund | | | 112,753 | | | | 15,050 | | | | (655,765 | ) | | | (527,962 | ) |
| (a) | LMCG Emerging Markets Fund began issuing Class N shares on March 28, 2013. |
| | |
| |
| | April 30, 2014 |
| |
| Notes to Financial Statements (unaudited) – continued | | |
| | | | | | | | | | | | | | | | |
Class I | | Sold | | | Proceeds From
Reinvestment
of Distributions | | | Redeemed | | | Net Increase
(Decrease) in
Shares Outstanding | |
M&C Growth Fund | | | 31,773,722 | | | | 5,907,893 | | | | (27,016,572 | ) | | | 10,665,043 | |
TAMRO Diversified Equity Fund | | | 1,954,469 | | | | 251 | | | | (275,939 | ) | | | 1,678,781 | |
Herndon Large Cap Value Fund | | | 3,369,141 | | | | 85,484 | | | | (592,116 | ) | | | 2,862,509 | |
Cornerstone Large Cap Value Fund | | | 2,506,727 | | | | 5,555 | | | | (188,320 | ) | | | 2,323,962 | |
River Road Dividend All Cap Value Fund | | | 15,887,474 | | | | 2,343,933 | | | | (12,706,308 | ) | | | 5,525,099 | |
River Road Dividend All Cap Value Fund II | | | 6,086,481 | | | | 70,708 | | | | (364,705 | ) | | | 5,792,484 | |
Fairpointe Mid Cap Fund | | | 23,358,073 | | | | 1,027,797 | | | | (13,678,107 | ) | | | 10,707,763 | |
LMCG Small Cap Growth Fund | | | 595,578 | | | | 5,342 | | | | (92,943 | ) | | | 507,977 | |
Sillvercrest Small Cap Fund | | | 1,662,372 | | | | 8,931 | | | | (122,970 | ) | | | 1,548,333 | |
TAMRO Small Cap Fund (a) | | | 8,715,782 | | | | 2,234,145 | | | | (9,190,853 | ) | | | 1,759,074 | |
River Road Select Value Fund | | | 6,134,305 | | | | 1,237,782 | | | | (6,524,564 | ) | | | 847,523 | |
River Road Small Cap Value Fund | | | 3,987,576 | | | | 913,112 | | | | (7,768,151 | ) | | | (2,867,463 | ) |
River Road Independent Value Fund (b) | | | 11,939,790 | | | | 1,729,407 | | | | (9,727,757 | ) | | | 3,941,440 | |
DoubleLine Core Plus Fixed Income Fund | | | 5,482,743 | | | | 397,260 | | | | (5,039,350 | ) | | | 840,653 | |
TCH Fixed Income Fund | | | 116,289 | | | | 35,075 | | | | (267,227 | ) | | | (115,863 | ) |
Lake Partners LASSO Alternatives Fund | | | 16,747,896 | | | | 259,746 | | | | (6,288,030 | ) | | | 10,719,612 | |
Anchor Capital Enhanced Equity Fund | | | 4,030,307 | | | | 220,773 | | | | (6,308,808 | ) | | | (2,057,728 | ) |
| River Road Long-Short Fund (c) | | | 6,329,701 | | | | — | | | | (420,651 | ) | | | 5,909,050 | |
Barings International Fund | | | 1,521,858 | | | | 224,097 | | | | (5,907,075 | ) | | | (4,161,120 | ) |
LMCG Emerging Markets Fund (d) | | | 341,891 | | | | — | | | | — | | | | 341,891 | |
Harrison Street Real Estate Fund | | | 33,502 | | | | 181 | | | | (2,189 | ) | | | 31,494 | |
M&C Balanced Fund | | | 6,701 | | | | 473 | | | | (19,931 | ) | | | (12,757 | ) |
| (a) | TAMRO Small Cap Fund had a subscription-in-kind in the amount of $2,677,538 on April 25, 2013. The subscription was comprised of securities, cash and dividends accrued in the amounts of $2,657,373, $19,712 and $453, respectively. The Fund also had a redemption-in-kind in the amount of $52,573,290 on January 15, 2013. The redemption was comprised of securities and cash in the amounts of $51,794,423 and $778,867, respectively. |
| (b) | River Road Independent Value Fund had a subscription-in-kind in the amount of $597,549 on March 27, 2013. The subscription was comprised of securities, cash and dividends accrued in the amounts of $258,478, $338,808 and $262, respectively. |
| (c) | The inception date for the River Road Long-Short Fund Class I shares is March 4, 2013. |
| (d) | The inception date for the LMCG Emerging Markets Fund Class I shares is March 28, 2013. |
| | | | | | | | | | | | | | | | |
Class R | | Sold | | | Proceeds From
Reinvestment of
Distributions | | | Redeemed | | | Net
Increase in
Shares Outstanding | |
| M&C Growth Fund | | | 83,728 | | | | 21,706 | | | | (99,541 | ) | | | 5,893 | |
Note (E) Investment Transactions: Aggregate purchases and proceeds from sales and maturities of investment securities (other than short-term investments) for the six months ended April 30, 2014 were as follows:
| | | | | | | | | | | | | | | | |
| | | Aggregate Purchases | | | Proceeds from Sales | |
| | | U.S. Government | | | Other | | | U.S. Government | | | Other | |
| M&C Growth Fund | | $ | — | | | $ | 1,250,757,485 | | | $ | — | | | $ | 2,055,601,622 | |
| TAMRO Diversified Equity Fund | | | — | | | | 14,548,560 | | | | — | | | | 19,151,313 | |
| Herndon Large Cap Value Fund | | | — | | | | 48,945,000 | | | | — | | | | 36,894,146 | |
| Cornerstone Large Cap Value Fund | | | — | | | | 50,475,230 | | | | — | | | | 10,460,018 | |
| River Road Dividend All Cap Value Fund | | | — | | | | 160,246,623 | | | | — | | | | 154,677,231 | |
| River Road Dividend All Cap Value Fund II | | | — | | | | 30,468,612 | | | | — | | | | 10,870,020 | |
| Fairpointe Mid Cap Fund | | | — | | | | 1,360,149,145 | | | | — | | | | 1,402,855,518 | |
| M&C Mid Cap Growth Fund | | | — | | | | 1,646,746 | | | | — | | | | 2,159,329 | |
| LMCG Small Cap Growth Fund | | | — | | | | 31,306,512 | | | | — | | | | 34,355,585 | |
| Silvercrest Small Cap Fund | | | — | | | | 27,251,613 | | | | — | | | | 9,521,557 | |
| TAMRO Small Cap Fund | | | — | | | | 480,193,210 | | | | — | | | | 602,074,263 | |
| River Road Select Value Fund | | | — | | | | 70,701,227 | | | | — | | | | 72,578,579 | |
| River Road Small Cap Value Fund | | | — | | | | 91,877,496 | | | | — | | | | 86,787,477 | |
| River Road Independent Value Fund | | | — | | | | 98,018,935 | | | | — | | | | 175,779,918 | |
| DoubleLine Core Plus Fixed Income Fund | | | 34,315,492 | | | | 71,490,347 | | | | 49,346,962 | | | | 108,201,111 | |
| TCH Fixed Income Fund | | | 5,522,882 | | | | 1,804,452 | | | | 1,263,362 | | | | 7,721,239 | |
| Lake Partners LASSO Alternatives Fund | | | — | | | | 107,299,696 | | | | — | | | | 88,784,770 | |
| Anchor Capital Enhanced Equity Fund | | | — | | | | 49,861,309 | | | | — | | | | 36,149,267 | |
| River Road Long-Short Fund | | | — | | | | 275,777,269 | | | | — | | | | 248,159,121 | |
Barings International Fund | | | — | | | | 8,737,797 | | | | — | | | | 17,172,761 | |
| Guardian Capital Global Dividend Fund | | | — | | | | 4,047,737 | | | | — | | | | 82,869 | |
LMCG Emerging Markets Fund | | | — | | | | 1,418,462 | | | | — | | | | 1,245,342 | |
| Pictet International Fund | | | — | | | | 9,837,908 | | | | — | | | | 76,718 | |
Harrison Street Real Estate Fund | | | — | | | | 12,022,720 | | | | — | | | | 13,189,103 | |
M&C Balanced Fund | | | — | | | | 2,859,800 | | | | 5,918 | | | | 4,909,388 | |
| | |
| |
| | April 30, 2014 |
| |
| Notes to Financial Statements (unaudited) – continued | | |
Note (F) Redemption Fees: In accordance with the prospectus, certain Funds may assess a redemption fee on Fund share redemptions and exchanges within specified time periods. The redemption fees are indicated in the following table for the six months ended April 30, 2014 and are included in the Cost of Shares Redeemed on the Statements of Changes in Net Assets:
| | | | | | |
Fund Name | | Time Period | | Amount | |
| Barings International Fund | | 2% Within 90 Days | | $ | — | |
| Guardian Capital Dividend Fund | | 2% Within 90 Days | | | — | |
| Harrison Street Real Estate Fund | | 2% Within 90 Days | | | 1,522 | |
| LMCG Emerging Markets Fund | | 2% Within 90 Days | | | — | |
| Pictet International Fund | | 2% Within 90 Days | | | — | |
Note (G) Advisory, Administration, Distribution Services and Trustee Agreements:
Advisory. Aston serves as investment adviser and administrator to the Funds. Under the terms of the investment advisory agreement for the Funds (the “Investment Advisory Agreement”), fees are accrued daily and paid monthly, at specified annual rates of average daily net assets. The factors considered by the Board of Trustees in approving the current Investment Advisory Agreement are included in the Funds’ annual or semi-annual report to shareholders covering the period during which the approval occurred.
Certain Funds are subject to an expense limitation agreement with the Adviser, pursuant to which annual ordinary operating expenses for Class N and Class I shareholders are capped at certain specified annual rates of average daily net assets. There are no contractual expense limitations for Class R shareholders.
The contractual expense limitations for the Funds are effective through February 28, 2015, except as noted below. The advisory rates and contractual expense limitations for the six months ended April 30, 2014 were as follows:
| | | | | | |
| | | | | Contractual Expense Limitations |
Fund Name | | Advisory Fees | | Class N | | Class I |
| M&C Growth Fund | | 0.80% on first $800,000,000 | | | | |
| | 0.60% over $800,000,000 up to $6 billion | | | | |
| | 0.55% over $6 billion up to $12 billion
0.50% over $12 billion | | N/A | | N/A |
| TAMRO Diversified Equity Fund | | 0.80% | | 1.20% | | 0.95% |
| Herndon Large Cap Value Fund | | 0.80% | | 1.30%(a) | | 1.05%(a) |
| Cornerstone Large Cap Value Fund | | 0.80% | | 1.30% | | 1.05% |
| River Road Dividend All Cap Value Fund | | 0.70% | | 1.30% | | 1.05% |
| River Road Dividend All Cap Value Fund II | | 0.70% | | 1.30%(a) | | 1.05%(a) |
| Fairpointe Mid Cap Fund | | 0.80% on first $100,000,000 | | | | |
| | 0.75% next $300,000,000 | | | | |
| | 0.70% over $400,000,000 | | N/A | | N/A |
| M&C Mid Cap Growth Fund | | 0.85% | | 1.25%(a) | | N/A |
| LMCG Small Cap Growth Fund | | 1.00% | | 1.35%(a) | | 1.10%(a) |
| Silvercrest Small Cap Growth | | 1.00% | | 1.40%(a) | | 1.15%(a) |
| TAMRO Small Cap Fund | | 0.90% | | N/A | | N/A |
| River Road Select Value Fund | | 1.00% | | 1.50%(a) | | 1.25%(a) |
| River Road Small Cap Value Fund | | 0.90% | | N/A | | N/A |
| River Road Independent Value Fund | | 1.00% | | 1.42%(a) | | 1.17%(a) |
| DoubleLine Core Plus Fixed Income Fund | | 0.55% | | 0.94%(a) | | 0.69%(a) |
| TCH Fixed Income Fund | | 0.55% | | 0.94% | | 0.69% |
| Lake Partners LASSO Alternatives Fund | | 1.00% | | 1.45%(a) | | 1.20%(a) |
| Anchor Capital Enhanced Equity Fund | | 0.70% | | 1.40% | | 1.15% |
| River Road Long-Short Fund | | 1.20% | | 1.70%(a) | | 1.45%(a) |
| Barings International Fund | | 1.00% | | 1.40%(a) | | 1.15%(a) |
| Guardian Capital Global Dividend Fund (b) | | 0.80% | | 1.30%(a) | | 1.05%(a) |
| LMCG Emerging Markets Fund | | 1.05% | | 1.65%(a) | | 1.40%(a) |
| Pictet International Fund (c) | | 0.90% | | 1.40%(a) | | 1.15%(a) |
| Harrison Street Real Estate Fund | | 1.00% | | 1.37% | | 1.12% |
| M&C Balanced Fund | | 0.75% | | 1.35% | | 1.10% |
| (a) | Pursuant to a contractual expense reimbursement agreement between the Adviser and the Trust, with respect to the Fund for a period up to three years from the end of the fiscal year end during which fees were waived or expenses were reimbursed, the Adviser is entitled to be reimbursed by the Fund for previously waived fees and reimbursed expenses, from commencement of operations through the completion of the first three full fiscal years to the extent that the Fund’s expense ratio (not including interest, taxes, other investment-related costs (such as brokerage commissions), extraordinary expenses and acquired fund fees and expenses) remains below the operating expense cap after such reimbursement. The contractual expense limitation is in effect through February 28, 2015 for the Funds except for Guardian Capital Global Dividend Fund and Pictet International Fund, which is through April 9, 2014. |
| (b) | The inception date for the Guardian Capital Global Dividend Fund Class N and Class I is April 14, 2014. |
| (c) | The inception date for the Pictet International Fund Class N and Class I is April 14, 2014. |
| | |
| |
| | April 30, 2014 |
| |
| Notes to Financial Statements (unaudited) – continued | | |
Pursuant to a contractual expense reimbursement agreement between the Adviser and the Trust, for a period of up to three years from the fiscal year end during which the Advisor waived its advisory fees or reimbursed expenses for each of Herndon Large Cap Value Fund-Classes N and I, River Road Dividend All Cap Value Fund II-Classes N and I, M&C Mid Cap Growth Fund-Class N, LMCG Small Cap Growth Fund-Classes N and I, Silvercrest Small Cap Fund-Classes N and I, River Road Select Value Fund-Classes N and I, River Road Independent Value Fund-Classes N and I, DoubleLine Core Plus Fixed Income Fund-Classes N and I, Lake Partners LASSO Alternatives Fund-Classes N and I, River Road Long-Short Fund-Classes N and I, Barings International Fund-Classes N and I, Guardian Capital Global Dividend Fund-Classes N and I, LMCG Emerging Markets Fund-Classes N and I, and Pictet International Fund-Classes N and I, the Adviser is entitled to be reimbursed by each Fund for such previously waived fees and reimbursed expenses from commencement of operations through the completion of the first three full fiscal years, to the extent that each Fund’s expense ratio (not including interest, taxes, other investment-related costs (such as brokerage commissions), extraordinary expenses and acquired fund fees and expenses) remains below the operating expense cap after such reimbursement.
The cumulative reimbursement amounts as of April 30, 2014 that are entitled to be recouped for each Fund are as follows:
| | | | | | | | | | | | | | | | |
| | | Expiration | |
| | | 2014 | | | 2015 | | | 2016 | | | 2017 | |
| Herndon Large Cap Value Fund | | | 83,299 | | | | 42,793 | | | | — | | | | N/A | |
| River Road Dividend All Cap Value Fund II | | | N/A | | | | — | | | | 23,514 | | | | — | |
| M&C Mid Cap Growth Fund | | | 72,010 | | | | N/A | | | | N/A | | | | N/A | |
| LMCG Small Cap Growth Fund | | | 190,704 | | | | 123,269 | | | | 157,143 | | | | 61,982 | |
| Silvercrest Small Cap Fund | | | N/A | | | | 147,166 | | | | 116,435 | | | | 56,129 | |
| River Road Select Value Fund | | | — | | | | N/A | | | | N/A | | | | N/A | |
| River Road Independent Value Fund | | | 244,471 | | | | 143,528 | | | | 59,855 | | | | 8,925 | |
| DoubleLine Core Plus Fixed Income Fund | | | 105,633 | | | | 389,195 | | | | 205,067 | | | | 105,522 | |
| Lake Partners LASSO Alternatives Fund | | | 6,963 | | | | — | | | | N/A | | | | N/A | |
| River Road Long-Short Fund | | | 50,533 | | | | 110,750 | | | | 76,699 | | | | — | |
| Barings International Fund | | | 147,896 | | | | N/A | | | | N/A | | | | N/A | |
| Guardian Capital Global Dividend Fund (1) | | | N/A | | | | N/A | | | | N/A | | | | 9,846 | |
| LMCG Emerging Markets Fund | | | N/A | | | | N/A | | | | 119,333 | | | | 92,614 | |
| Pictet International Fund (1) | | | N/A | | | | N/A | | | | N/A | | | | 10,960 | |
| | | | | | | | | | | | | | | | |
| Total | | $ | 901,509 | | | $ | 956,701 | | | $ | 758,046 | | | $ | 345,978 | |
| | | | | | | | | | | | | | | | |
| (1) | The Fund commenced operations in the current fiscal year. |
Through the six months ended April 30, 2014, the Adviser is eligible to recapture prior year fee waivers and expense reimbursements of $46,517 from Herndon Large Cap Value Fund, $72,364 from River Road Dividend All Cap Value Fund II, $80,851 from Lake Partners LASSO Alternatives Fund and $46,575 from River Road Long-Short Fund.
The Adviser manages each Fund by retaining one or more Subadvisers to manage each Fund, as follows:
| | |
| Fund | | Subadviser |
M&C Growth Fund | | Montag & Caldwell, LLC |
TAMRO Diversified Equity Fund | | TAMRO Capital Partners LLC |
Herndon Large Cap Value Fund | | Herndon Capital Management, LLC |
Cornerstone Large Cap Value Fund | | Cornerstone Investment Partners, LLC |
River Road Dividend All Cap Value Fund | | River Road Asset Management, LLC |
River Road Dividend All Cap Value Fund II | | River Road Asset Management, LLC |
Fairpointe Mid Cap Fund | | Fairpointe Capital LLC |
M&C Mid Cap Growth Fund | | Montag & Caldwell, LLC |
LMCG Small Cap Growth Fund | | Lee Munder Capital Group, LLC |
Silvercrest Small Cap Fund | | Silvercrest Asset Management Group LLC |
TAMRO Small Cap Fund | | TAMRO Capital Partners LLC |
River Road Select Value Fund | | River Road Asset Management, LLC |
River Road Small Cap Value Fund | | River Road Asset Management, LLC |
River Road Independent Value Fund | | River Road Asset Management, LLC |
DoubleLine Core Plus Fixed Income Fund | | DoubleLine Capital LP |
TCH Fixed Income Fund | | Taplin, Canida & Habacht, LLC |
Lake Partners LASSO Alternatives Fund | | Lake Partners, Inc. |
Anchor Capital Enhanced Equity Fund | | Anchor Capital Advisors LLC |
River Road Long-Short Fund | | River Road Asset Management, LLC |
Barings International Fund | | Baring International Investment Limited |
Guardian Capital Global Dividend Fund | | Guardian Capital LP |
LMCG Emerging Markets Fund | | Lee Munder Capital Group, LLC |
Pictet International Fund | | Pictet Asset Management Limited |
Harrison Street Real Estate Fund | | Harrison Street Securities, LLC |
M&C Balanced Fund | | Montag & Caldwell, LLC |
Subadvisory fees are paid monthly by Aston. The factors considered by the Board of Trustees in approving the current sub-investment advisory agreements for the Funds (each, a “Sub-Investment Advisory Agreement”) are included in the additional information section of the Funds’ annual or semi-annual report to shareholders covering the period in which such approval occurred.
Matters Related to AMG. Effective May 30, 2014, Aston became an indirect, wholly-owned subsidiary of Affiliated Managers Group, Inc. (“AMG”), the interests in which are held by AMG through its wholly-owned subsidiary, AMG Funds LLC (the “Transaction”). As part of the Transaction, Aston was converted to a Delaware limited liability company and changed its name to “Aston Asset Management, LLC.”
As required by the 1940 Act, the investment advisory agreement for each Fund provides for its automatic termination in the event of its assignment, which in turn causes the automatic termination of the subadvisory agreement. The completion of the Transaction constituted an “assignment” as that term is defined under the 1940 Act, of each Fund’s then current investment advisory agreement. At an in-person meeting held on December 18-19, 2013, (and March 20, 2014 with respect to the Guardian Global Dividend Fund and Pictet International Fund) the Board of Trustees (the “Board”), including all of the
| | |
| |
| | April 30, 2014 |
| |
| Notes to Financial Statements (unaudited) – continued | | |
trustees who are not “interested persons” of the Trust, as defined in the 1940 act, approved a new investment advisory agreement and subadvisory agreements with respect to each Fund on substantially the same terms as currently in effect, including the fee rates payable under the agreements. In addition, the new investment advisory agreement was approved by the shareholders of each Fund other than Harrison Street Real Estate Fund and TAMRO Diversified Equity Fund at the Funds’ special meeting of shareholders held on April 17, 2014; by the shareholders of Harrison Street Real Estate Fund at the reconvened special meeting of shareholders held on April 30, 2014; and by the shareholders of TAMRO Diversified Equity Fund at the reconvened special meeting of shareholders held on May 28, 2014.
The new Investment Advisory Agreement and Sub-Investment Advisory Agreement(s) with respect to each Fund took effect on May 30, 2014.
River Road Transaction. River Road Asset Management, LLC (“River Road”) serves as the subadviser to the River Road Dividend All Cap Value Fund, River Road Dividend All Cap Value Fund II, River Road Independent Value Fund, River Road Long-Short Fund, River Road Select Value Fund and River Road Small Cap Value Fund (each, a “River Road Fund” and collectively, the “River Road Funds”) pursuant to sub-investment advisory agreements between Aston and River Road. River Road is a wholly-owned subsidiary of Aviva Investors North America Holdings, Inc. which is an indirect subsidiary of Aviva, plc (“Aviva”). On March 27, 2014, AMG, the parent company of Aston, entered into a definitive agreement to acquire Aviva’s equity interest in River Road (the “River Road Transaction”). Following the River Road Transaction, AMG will hold an indirect, majority equity interest in River Road, and River Road’s existing management team will hold a substantial minority equity interest in River Road. The River Road Transaction will not result in any material changes in River Road’s management, personnel or investment processes, the way in which River Road manages the River Road Funds or the fees and expenses of the River Road Funds.
As required by the 1940 Act, the current sub-investment advisory agreement for each Fund provides for its automatic termination in the event of its assignment. The completion of the River Road Transaction and the related issuance of equity to management will be deemed to constitute an “assignment,” as that term is defined in the 1940 Act. In anticipation of the River Road Transaction, the Board met in-person on March 20, 2014 and approved a new sub-investment advisory agreement with respect to each River Road Fund on substantially the same terms as currently in effect, including the fee rates payable under the agreements.
The River Road Transaction is expected to close during the second or third quarter of 2014, subject to the satisfaction or waiver of certain conditions. Upon the closing of the transaction, River Road will continue to manage the River Road Funds, and the investment objectives and principal investment strategies of the River Road Funds will remain the same. If the River Road Transaction does not close, the current sub-investment advisory
agreement for each River Road Fund will remain in full force and effect.
A discussion regarding the Board’s basis for approving the investment advisory and sub-investment advisory agreements, as applicable, in connection with the Transaction and the River Road Transaction, respectively, are available in the additional information section of this semi-annual report.
Administration. Under the terms of the administration agreement between the Trust and Aston, the Funds’ administrator (the “Administration Agreement”), administration fees are accrued daily and paid monthly, based on a specified percentage of average daily net assets of the Trust, and base fees are fixed at an annual rate of $12,000 per Fund. The fee is allocated to each Fund based on the relative net assets of the Trust. Administration expenses also include pricing agent fees and compliance-related expenses. The administration fee arrangement is as follows:
| | |
Administration Fees at Trust Level | | Annual Rate |
| |
| First $7.4 billion | | 0.0437% |
| Over $7.4 billion | | 0.0412% |
BNY Mellon Investment Servicing (US) Inc. (“BNY Mellon”) provides certain administrative services to the Funds pursuant to a Sub-administration and Accounting Services Agreement between Aston and BNY Mellon (the “Sub-Administration Agreement”). Under the terms of the Sub-Administration Agreement, sub-administration fees (inclusive of tax services fees), which are paid by Aston, are accrued daily and paid monthly, at a rate of 0.0167% of average daily net assets of the Trust and a base fee at an annual rate of $12,000 per Fund. The fees may be subject to an annual increase by BNY Mellon, in an amount not to exceed the cumulative percentage increase in the Consumer Price Index for All Urban Consumers (CPI-U) U.S. City Average, all items (unadjusted) published since the last such increase in fees. The last such annual increase, of 1.7%, was effective October 1, 2013.
Distribution Services. Foreside Funds Distributors LLC (the “Distributor”) serves as principal underwriter and distributor of the Funds’ shares. Pursuant to Rule 12b-1 distribution and service plans (the “Plans”) adopted by the Funds, with respect to Class N shares and Class R shares, the Funds pay certain expenses associated with the distribution of their shares. Under the Plans, each Fund may pay actual expenses not exceeding, on an annual basis, 0.25% of each participating Fund’s Class N average daily net assets and 0.50% of each participating Fund’s Class R average daily net assets. The Class I shares do not have Rule 12b-1 plans. Effective January 1, 2012, and ending October 31, 2013, the TCH Fixed Income Fund 12b-1 fee was reduced to 0.15%. Effective January 1, 2012 M&C Balanced Fund reduced its 12b-1 fees to 0.10%.
Trustees. The Trustees of the Trust who are not affiliated with the Adviser or Subadviser receive an annual retainer and per
| | |
| |
| | April 30, 2014 |
| |
| Notes to Financial Statements (unaudited) – continued | | |
meeting fees, and they are reimbursed for out-of-pocket expenses for each meeting of the Board of Trustees they attend. The Chairman of the Board and Committee Chairs receive additional retainers. No officer or employee of the Adviser, of a Subadviser, or of their affiliates receives any compensation from the Funds for acting as a Trustee of the Trust. The officers of the Trust receive no compensation directly from the Funds for performing the duties of their offices, except that the Funds compensate the Administrator for providing an officer to serve as the Funds’ Chief Compliance Officer. The aggregate remuneration paid to the Trustees during the six months ended April 30, 2014 was $406,500.
Note (H) Credit Agreement: Effective July 6, 2010 and as amended August 30, 2013, the Trust entered into a Credit Agreement with The Bank of New York Mellon (the “Bank”) which provides the Trust with a revolving line of credit facility of up to $50 million. The facility is shared by each series of the Trust and is available for temporary, emergency purposes including liquidity needs in meeting redemptions. The interest rate on outstanding Alternate Base Rate Loans is equal to the greater of the Prime Rate plus 1.25% or 0.50% plus the Federal Funds Effective Rate plus 1.25%. The interest rate on outstanding Overnight Loans is equal to the greater of the Federal Funds Effective Rate plus 1.25% or the One Month LIBOR Rate plus 1.25%. The Trust pays a commitment fee on the unutilized commitment amount of 0.12% per annum. The Funds did not utilize the line of credit during the six months ended April 30, 2014.
Note (I) Fully FDIC-insured Uninvested Deposit Balance Program: Effective July 3, 2012, the Trust entered into a program under which cash that was then held in custody and trust accounts by the Bank, as custodian for the Trust, would be held in non-interest bearing transaction accounts at the Bank that were fully covered by the FDIC. River Road Independent Value Fund, Lake Partners LASSO Alternatives Fund and Anchor Capital Enhanced Equity Fund accrued Earnings Credits to offset the
Funds’ respective custody and transfer agency fees (including overdraft charges) based on the specified Earnings Credit Rate. The Earnings Credit Rate was 8 basis points on positive balances, subject to adjustment by the Bank. The term of this agreement was June 1, 2012 through December 31, 2012. At April 30, 2014, the Funds accrued Earnings Credits are as follows:
| | | | |
Fund | | Earnings
Credit to Custody
and Transfer
Agency Fees | |
| River Road Independent Value Fund | | $ | 30,229 | |
| Lake Partners LASSO Alternatives Fund | | | — | |
| Anchor Capital Enhanced Equity Fund | | | — | |
Note (J) Significant Concentrations: Certain Funds may invest a significant percentage of their assets in securities of foreign issuers. These investments may involve certain considerations and risks not typically associated with investments in the United States as a result of, among other factors, the possibility of future political and economic developments and the level of governmental supervision and regulation of securities markets in the respective countries. Some countries in which the Funds invest may require government approval for repatriation of investment income, capital or the proceeds for sales of securities by foreign investors. In addition, if there is deterioration in a country’s balance of payments or for other reasons, a country may impose temporary restrictions on foreign capital remittances abroad. In addition, changes in currency exchange rates will affect the value of investments denominated in a foreign currency, as well as investment income derived from those securities.
Note (K) Subsequent Events: Management has evaluated the impact of all subsequent events on the Funds through the date the financial statements were issued, and has determined that there were no subsequent events requiring recognition or disclosure in the financial statements.
| | |
| |
| | April 30, 2014 |
| |
| Additional Information (unaudited) | | |
Form N-Q: The Trust files complete schedules of portfolio holdings for the Funds with the Securities and Exchange Commission (the “SEC”) for the Trust’s first and third quarters of each fiscal year on Form N-Q. The Trust’s Form N-Q are available on the SEC’s website at www.sec.gov and are available for review and copying at the SEC’s Public Reference Room in Washington, DC. Information on the operations of the Public Reference Room may be obtained by calling the SEC at 202-942-8090.
Proxy Voting: The Trust’s Proxy Voting Policies and Procedures, used to determine how to vote proxies relating to portfolio securities, are included in the Trust’s Statement of Additional Information, which is available (i) upon request, without charge, by calling 800-992-8151; (ii) on Aston Funds’ website at www. astonfunds.com; and (iii) on the SEC’s website at www.sec.gov. The Funds’ Proxy Voting Record for the most recent twelve-month period ended June 30 is available without charge (i) on the Funds’ website at www.astonfunds.com; and (ii) on the SEC’s website at www.sec.gov.
Shareholder Voting Results: A combined Special Meeting of the Shareholders of the Trust with respect to the Funds listed below was held on April 17, 2014 for the following purposes:
| | (1) | To elect Trustees to the Board of the Trust (“Proposal 1”); |
| | (2) | To approve a new Investment Advisory Agreement between the Trust, on behalf of each Fund, and Aston Asset Management, LLC (“Proposal 2”); |
| | (3) | To approve a modified Manager-of-Managers Structure under any Applicable Exemptive Order or Future Rule (“Proposal 3”). |
The shareholders meeting was reconvened with respect to Proposals 2 and 3 for each of the Harrison Street Real Estate Fund and TAMRO Diversified Equity Fund on April 24, 2014 and again on April 30, 2014. The meeting was reconvened again with respect to Proposals 2 and 3 for TAMRO Diversified Equity Fund on May 28, 2014. All proposals were approved by the shareholders for all applicable Funds. The results of the voting are as follows:
Proposal 1: Election of Trustees
| | | | | | | | |
| | | Number of
Shares Voting | |
| | | For | | | Withheld | |
| Bruce B. Bingham | | | 539,983,843.052 | | | | 5,544,629.247 | |
| Christine C. Carsman | | | 538,202,285.971 | | | | 7,326,186.328 | |
| William E. Chapman, II | | | 539,818,757.180 | | | | 5,709,715.119 | |
| Edward J. Kaier | | | 539,921,036.679 | | | | 5,607,435.620 | |
| Kurt Keilhacker | | | 539,975,047.022 | | | | 5,553,425.277 | |
| Steven J. Paggioli | | | 539,930,200.852 | | | | 5,598,271.447 | |
| Richard F. Powers, III | | | 539,877,654.435 | | | | 5,650,817.864 | |
| Eric P. Rakowski | | | 539,931,823.606 | | | | 5,596,648.693 | |
| Victoria Sassine | | | 540,389,099.427 | | | | 5,139,372.872 | |
| Thomas R. Schneeweis | | | 539,791,067.136 | | | | 5,737,405.163 | |
Proposal 2: Approval of New Investment Advisory Agreement with Aston Asset Management, LLC
| | | | | | | | | | | | |
| | | For | | | Against | | | Abstain | |
| ASTON/Anchor Capital Enhanced Equity Fund | | | 9,373,836.748 | | | | 111,096.622 | | | | 146,304.403 | |
| ASTON/Barings International Fund | | | 2,064,075.819 | | | | 2,311.663 | | | | 0.000 | |
| ASTON/Cornerstone Large Cap Value Fund | | | 3,855,375.278 | | | | 51,185.068 | | | | 194,425.075 | |
| ASTON/DoubleLine Core Plus Fixed Income Fund | | | 10,660,540.450 | | | | 85,588.691 | | | | 74,092.719 | |
| ASTON/Harrison Street Real Estate Fund | | | 647,396.208 | | | | 27,217.979 | | | | 14,187.181 | |
| ASTON/Fairpointe Mid Cap Fund | | | 63,695,805.751 | | | | 407,304.247 | | | | 1,371,104.904 | |
| ASTON/Herndon Large Cap Value Fund | | | 4,961,845.602 | | | | 65,675.466 | | | | 16,171.300 | |
| ASTON/Lake Partners LASSO Alternatives Fund | | | 25,139,645.161 | | | | 120,939.641 | | | | 147,835.389 | |
| ASTON/LMCG Emerging Markets Fund | | | 217,374.758 | | | | 0.000 | | | | 0.000 | |
| ASTON/LMCG Small Cap Growth Fund | | | 1,811,171.027 | | | | 21,796.797 | | | | 16,483.767 | |
| ASTON/Montag & Caldwell Balanced Fund | | | 490,632.273 | | | | 35,115.610 | | | | 25,667.998 | |
| ASTON/Montag & Caldwell Growth Fund | | | 133,929,922.008 | | | | 774,445.879 | | | | 1,916,811.584 | |
| ASTON/Montag & Caldwell Mid Cap Growth Fund | | | 599,187.571 | | | | 4,758.202 | | | | 0.000 | |
| ASTON/River Road Dividend All Cap Value Fund | | | 63,409,703.092 | | | | 623,230.980 | | | | 1,025,593.250 | |
| ASTON/River Road Dividend All Cap Value Fund II | | | 4,226,614.618 | | | | 12,392.638 | | | | 42,583.701 | |
| ASTON/River Road Independent Value Fund | | | 37,581,968.810 | | | | 463,961.181 | | | | 291,284.414 | |
| ASTON/River Road Long-Short Fund | | | 11,642,333.724 | | | | 54,498.000 | | | | 104,897.000 | |
| ASTON/River Road Select Value Fund | | | 9,351,274.587 | | | | 25,986.722 | | | | 35,779.021 | |
| ASTON/River Road Small Cap Value Fund | | | 18,009,616.322 | | | | 152,610.836 | | | | 22,204.361 | |
| ASTON/Silvercrest Small Cap Fund | | | 1,313,567.258 | | | | 7,832.680 | | | | 92,707.751 | |
| ASTON/TAMRO Diversified Equity Fund | | | 1,869,228.476 | | | | 14,138.443 | | | | 11,354.637 | |
| ASTON/TAMRO Small Cap Fund | | | 46,629,484.827 | | | | 76,702.977 | | | | 397,154.576 | |
| ASTON/TCH Fixed Income Fund | | | 3,596,092.566 | | | | 20,405.977 | | | | 22,036.194 | |
Proposal 3: Approval of a Modified Manager–of–Managers Structure Under any Applicable Exemptive Order or Future Rule
| | | | | | | | | | | | |
| | | For | | | Against | | | Abstain | |
| ASTON/Anchor Capital Enhanced Equity Fund | | | 8,849,041.567 | | | | 587,532.731 | | | | 194,660.474 | |
| ASTON/Barings International Fund | | | 2,064,075.819 | | | | 2,311.663 | | | | 0.000 | |
| ASTON/Cornerstone Large Cap Value Fund | | | 3,629,504.168 | | | | 278,539.346 | | | | 192,941.908 | |
| ASTON/DoubleLine Core Plus Fixed Income Fund | | | 9,970,460.409 | | | | 781,435.111 | | | | 68,323.339 | |
| ASTON/Fairpointe Mid Cap Fund | | | 62,697,860.622 | | | | 1,330,050.921 | | | | 1,445,878.359 | |
| ASTON/Harrison Street Real Estate Fund | | | 619,984.011 | | | | 48,623.567 | | | | 20,192.790 | |
| ASTON/Herndon Large Cap Value Fund | | | 4,950,774.221 | | | | 74,850.345 | | | | 18,065.803 | |
| ASTON/Lake Partners LASSO Alternatives Fund | | | 25,001,843.138 | | | | 234,778.790 | | | | 171,796.262 | |
| ASTON/LMCG Emerging Markets Fund | | | 217,374.758 | | | | 0.000 | | | | 0.000 | |
| ASTON/LMCG Small Cap Growth Fund | | | 1,770,552.225 | | | | 54,669.172 | | | | 24,229.193 | |
| ASTON/Montag & Caldwell Balanced Fund | | | 462,544.432 | | | | 55,360.658 | | | | 33,510.791 | |
| ASTON/Montag & Caldwell Growth Fund | | | 131,938,029.067 | | | | 2,632,026.392 | | | | 2,051,120.012 | |
| ASTON/Montag & Caldwell Mid Cap Growth Fund | | | 557,921.665 | | | | 46,025.108 | | | | 0.000 | |
| ASTON/River Road Dividend All Cap Value Fund | | | 62,930,723.206 | | | | 1,266,751.820 | | | | 861,047.296 | |
| ASTON/River Road Dividend All Cap Value Fund II | | | 4,199,352.237 | | | | 41,134.887 | | | | 41,101.833 | |
| ASTON/River Road Independent Value Fund | | | 37,034,649.167 | | | | 962,562.842 | | | | 339,989.396 | |
| ASTON/River Road Long-Short Fund | | | 11,047,630.724 | | | | 614,346.000 | | | | 139,752.000 | |
| ASTON/River Road Select Value Fund | | | 9,299,772.452 | | | | 70,114.115 | | | | 43,152.763 | |
| ASTON/River Road Small Cap Value Fund | | | 17,918,689.155 | | | | 226,128.298 | | | | 39,609.067 | |
| ASTON/Silvercrest Small Cap Fund | | | 1,385,156.477 | | | | 26,085.597 | | | | 2,865.616 | |
| ASTON/TAMRO Diversified Equity Fund | | | 1,835,823.596 | | | | 47,146.656 | | | | 11,750.304 | |
| ASTON/TAMRO Small Cap Fund | | | 45,851,691.539 | | | | 465,463.830 | | | | 786,181.011 | |
| ASTON/TCH Fixed Income Fund | | | 3,567,423.626 | | | | 40,512.845 | | | | 30,597.266 | |
CONSIDERATIONS OF THE BOARD OF TRUSTEES IN APPROVING THE NEW SUB-INVESTMENT ADVISORY AGREEMENTS FOR ASTON/RIVER ROAD DIVIDEND ALL CAP VALUE FUND, ASTON/RIVER ROAD DIVIDEND ALL CAP VALUE FUND II, ASTON/RIVER ROAD INDEPENDENT VALUE FUND, ASTON/RIVER ROAD LONG-SHORT FUND, ASTON/RIVER ROAD SELECT VALUE FUND AND ASTON/RIVER ROAD SMALL CAP VALUE FUND IN CONNECTION WITH THE RIVER ROAD TRANSACTION
At an in-person meeting on March 20, 2014, the Board of Trustees (the “Board”) of Aston Funds (the “Trust”), including the trustees who are not “interested persons,” as defined in Section 2(a)(19) of the Investment Company Act of 1940, as
| | |
| |
| | April 30, 2014 |
| |
| Additional Information (unaudited) – continued | | |
amended (the “Independent Trustees”), considered the approval of new Sub-Investment Advisory Agreements (each, a “New Sub-Investment Advisory Agreement” and collectively, the “New Sub-Investment Advisory Agreements”) between Aston Asset Management, LP (including any successor thereto, “Aston”) and River Road Asset Management, LLC (“River Road”) with respect to the ASTON/River Road Dividend All Cap Value Fund, ASTON/River Road Dividend All Cap Value Fund II, ASTON/River Road Independent Value Fund, ASTON/River Road Long-Short Fund, ASTON/River Road Select Value Fund and ASTON/River Road Small Cap Value Fund (each, a “River Road Fund” and collectively, the “River Road Funds”).
The circumstance giving rise to the Board’s consideration of the New Sub-Investment Advisory Agreements was the anticipated execution of a definitive purchase agreement between Affiliated Managers Group, Inc. (“AMG”), the parent company of Aston, and Aviva Investors North America Holdings, Inc., an indirect subsidiary of Aviva plc (collectively, “Aviva”) and the parent company of River Road, whereby AMG will acquire all of Aviva’s equity interest in River Road (the “River Road Transaction”), immediately following which the management team of River Road will be issued equity interests in River Road.
The Board, including the Independent Trustees, considered information about the River Road Transaction provided by AMG and River Road. The Board noted that, upon completion of the River Road Transaction, River Road would become an affiliate of Aston, the investment adviser to each of the River Road Funds. The Board also considered that the completion of the River Road Transaction would be deemed to result in the “assignment” of the sub-investment advisory agreements then in effect for each River Road Fund, causing those agreements to automatically terminate.
In anticipation of the termination of the current sub-investment advisory agreements in connection with the River Road Transaction, the Board, including the Independent Trustees, determined that the terms of the New Sub-Investment Advisory Agreements between Aston, on behalf of each River Road Fund, and River Road are fair and reasonable, and the Board approved each New Sub-Investment Advisory Agreement as being in the best interests of the applicable River Road Fund.
In determining whether to approve the New Sub-Investment Advisory Agreement for each River Road Fund in connection with the River Road Transaction and whether to recommend the approval of the New Sub-Investment Advisory Agreements to shareholders, the Board received information and made inquiries into all matters deemed relevant and considered the following factors, among others:
| | • | | Based on information provided by AMG and River Road, the River Road Transaction is not expected to affect the nature, extent and quality of services to be provided by River Road or to result in a change to River Road management or any River Road Fund’s portfolio management team. River Road is expected to retain operational and investment autonomy following the River Road Transaction. |
| | • | | Based on information provided by AMG and River Road, the terms of the River Road Transaction are designed to retain key personnel through substantial equity ownership and long-term employment agreements. |
| | • | | Based on information provided by AMG and River Road, the River Road Funds may benefit from River Road’s access to AMG’s assistance in strategic matters and operations. |
| | • | | The terms of the New Sub-Investment Advisory Agreement with respect to each River Road Fund are identical to the terms of the Current Sub-Investment Advisory Agreement for such River Road Fund except for the date of effectiveness and initial term, and the services provided by River Road and compensation payable to River Road will remain the same. |
| | • | | The River Road Funds will not bear any of the costs relating to the River Road Transaction, including the costs of preparing, printing and mailing a proxy statement to shareholders of the River Road Funds and related solicitation expenses, including the cost of engaging a proxy solicitor. |
The Board considered that it had approved the annual renewal of the current sub-investment advisory agreements pursuant to an extensive process that had concluded at the December 19, 2013 Board meeting. The Board also determined that it was appropriate to take into consideration the extensive information received throughout the year regarding performance and operating results of the River Road Funds, given the continuity of portfolio management expected following the River Road Transaction. The Board concluded, based upon all of these considerations, along with the conclusions the Board reached with respect to the most recent approval of the renewal of the current sub-investment advisory agreement for each River Road Fund, that it need not reconsider all of the factors that it would typically consider in connection with an initial contract approval or contract renewal.
Based upon its evaluation of all information and factors it deemed relevant, and assisted by the advice of independent legal counsel, the Board, including all of the Independent Trustees, concluded that the terms of the New Sub-Investment Advisory Agreements, including the proposed subadvisory fees, were fair and reasonable, and that the New Sub-Investment Advisory Agreement between Aston and River Road, on behalf of each River Road Fund, should be approved.
CONSIDERATIONS OF THE BOARD OF TRUSTEES IN CONNECTION WITH THE APPROVAL OF THE INVESTMENT ADVISORY AGREEMENTS FOR ASTON/GUARDIAN CAPITAL GLOBAL DIVIDEND FUND AND ASTON/PICTET INTERNATIONAL FUND
At an in-person meeting on March 20, 2014, the Board of Trustees (the “Board”) of Aston Funds (the “Trust”), including the trustees who are not “interested persons,” as defined in Section 2(a)(19) of the Investment Company Act of 1940, as
| | |
| |
| | April 30, 2014 |
| |
| Additional Information (unaudited) – continued | | |
amended (the “Independent Trustees”), determined that the terms of the Investment Advisory Agreement between the Trust and Aston Asset Management, LP (including any successor thereto, “Aston”) with respect to the ASTON/Guardian Capital Global Dividend Fund and the ASTON/Pictet International Fund (each, a “New Fund” and collectively, the “New Funds”) are fair and reasonable and approved the Investment Advisory Agreement for each New Fund as being in the best interests of the New Fund. In making such determinations, the Board, including the Independent Trustees, considered materials received and discussions held with respect to the approval of the Investment Advisory Agreements at the March 20, 2014 meeting and prior meetings. The Independent Trustees met separately from the Trustees of the Trust who are “interested persons” of the Trust as defined in Section 2(a)(19) of the Investment Company Act of 1940, as amended, and any officers of Aston or its affiliates to consider approval of the Investment Advisory Agreements with respect to the New Funds and were assisted by independent legal counsel in their deliberations.
In evaluating the Investment Advisory Agreement on behalf of each New Fund, the Board reviewed information regarding: (1) the nature, quality and extent of the services to be provided to the New Fund; (2) the investment advisory fees to be charged and estimated total expense ratio of the New Fund compared to a peer group of funds; (3) fee waivers or expenses to be reimbursed by Aston and/or the New Fund’s subadviser; and (4) potential benefits to be received by Aston or its affiliates from Aston’s relationship with the New Fund. In considering the Investment Advisory Agreement on behalf of each New Fund, the Board, including the Independent Trustees, did not identify any single factor or group of factors as all-important or controlling, but considered all factors together. The following summary does not detail all the matters considered.
Nature, Quality and Extent of Services. The Board considered the nature, quality and extent of services to be provided by Aston, including investment advisory services and administrative services. The Board considered that Aston is a manager-of-managers, and that in its role as investment adviser to each New Fund it intends to delegate the day-to-day responsibility for managing the New Fund’s investments to a subadviser. Accordingly, the Board considered Aston’s capabilities and processes with respect to the selection and monitoring of subadvisers on an ongoing basis, as well as information regarding the composition, experience and role of its Investment Committee. In this regard, the Board noted the responsibilities and experience of Aston personnel, the resources made available to such personnel, the ability of Aston to attract and retain high quality personnel and the organizational depth and stability of Aston.
In addition to investment advisory services, the Board considered the quality of other services provided by Aston including oversight of service providers, regulatory administration and Board support, fund administration and operational support, compliance services, shareholder servicing and platform management and distribution- and marketing-related services. The Board also considered the nature and quality of services provided by Aston with respect to other series of the Trust. On the basis of this
evaluation, the Board concluded that the nature, quality and extent of services to be provided by Aston are expected to be satisfactory.
Fees and Expenses. The Board considered each New Fund’s proposed management fee rate and total net expense ratio after contractual expense reimbursements and fee waivers. As a part of this analysis, the Board compared the proposed investment advisory fees and total net expenses to those of a relevant peer group for each New Fund. The Board concluded that the proposed investment advisory fees were reasonable and appropriate in light of the nature, quality and extent of services to be provided by Aston.
Costs and Profitability. With respect to the costs of services to be provided and profits expected to be realized by Aston, the Board considered the resources involved in managing each New Fund in light of Aston’s business model as well as fee waivers or expenses to be reimbursed under an Expense Reimbursement Agreement with Aston. The Board noted that, with respect to each New Fund, Aston and the applicable subadviser each will bear a portion of any fee waivers or expense reimbursements. Because the New Funds have not yet commenced operations, profitability information was not available. However, based upon projected asset size and the impact of fee waivers or expenses to be reimbursed by Aston, the Board concluded that profitability was not expected to be unreasonable.
Economies of Scale. The Board considered the extent to which economies of scale would be realized as each New Fund grows. The Board considered the potential asset size of the New Funds, as well as the terms of the Expense Reimbursement Agreement, and concluded that at this time the potential for economies of scale are limited.
Other Benefits to the Investment Adviser. The Board considered the nature and amount of fees to be paid by each New Fund for services to be provided by Aston for administration services. The Board noted that Aston currently does not intend to manage the New Funds directly, and therefore, will not benefit from the use of “soft” commission dollars to pay for research and brokerage services. The Board concluded that any other benefits to be received by the Adviser from its relationship with the New Funds were not expected to be unreasonable.
Conclusion. Based upon its evaluation of all material factors and assisted by the advice of independent legal counsel, the Board, including all of the Independent Trustees, concluded that the terms of the Investment Advisory Agreement for each New Fund, including the proposed investment advisory fee, were fair and reasonable, and that the Investment Advisory Agreement on behalf of each New Fund should be approved.
| | |
| |
| | April 30, 2014 |
| |
| Additional Information (unaudited) – continued | | |
CONSIDERATIONS OF THE BOARD OF TRUSTEES IN CONNECTION WITH THE APPROVAL OF THE SUB-INVESTMENT ADVISORY AGREEMENT FOR ASTON/GUARDIAN CAPITAL GLOBAL DIVIDEND FUND
At an in-person meeting on March 20, 2014, the Board of Trustees (the “Board”) of Aston Funds (the “Trust”), including the trustees who are not “interested persons,” as defined in Section 2(a)(19) of the Investment Company Act of 1940, as amended (the “Independent Trustees”), considered the approval of a Sub-Investment Advisory Agreement (the “Sub-Investment Advisory Agreement”) between Aston Asset Management, LP (including any successor thereto, “Aston”) and Guardian Capital LP (“Guardian Capital”) with respect to the ASTON/Guardian Capital Global Dividend Fund (the “New Fund”). The Board considered information provided and discussions held at the March 20, 2014 meeting and at prior meetings. The Independent Trustees met separately from the Trustees who are “interested persons” of the Trust as defined in Section 2(a)(19) of the Investment Company Act of 1940, as amended, and any officers of Aston, Guardian Capital or their respective affiliates to consider approval of the Sub-Investment Advisory Agreement and were assisted by independent legal counsel in their deliberations.
Among the matters considered by the Board, including the Independent Trustees, in connection with its approval of the Sub-Investment Advisory Agreement were the following:
Nature, Quality and Extent of Services. The Board considered the nature, quality and extent of services expected to be provided under the Sub-Investment Advisory Agreement. The Board considered the reputation, qualifications and background of Guardian Capital and its operational and compliance infrastructures. The Board also considered information provided regarding Guardian Capital’s investment approach, the experience and skills of senior management and investment personnel of Guardian Capital, the resources made available to such personnel, the ability of Guardian Capital to attract and retain high-quality personnel and the organizational depth of Guardian Capital. On the basis of this evaluation, the Board concluded that the nature, quality and extent of services to be provided by Guardian Capital are expected to be satisfactory.
Fees, Profitability and Economies of Scale. The Board considered the subadvisory fee rate under the Sub-Investment Advisory Agreement as well as the overall management fee structure of the New Fund, noting that the subadvisory fee rate is fifty percent (50%) of the investment advisory fee less certain third party payments, fee waivers and expense reimbursements incurred by Aston. The Board considered that the subadvisory fee rate had been negotiated at arm’s length between Aston and Guardian Capital, an unaffiliated third party, and that Aston would compensate Guardian Capital from the investment advisory fees it receives from the New Fund. As part of its review of the investment advisory agreement with Aston, the Board considered whether there will be economies of scale with respect to the overall fee structure of the New Fund and whether the New Fund will benefit from any economies of scale.
The Board determined that profitability information with respect to Guardian Capital was not material to its considerations in light of the fee model used by Aston and the unaffiliated status of Guardian Capital. The Board concluded that the proposed subadvisory fee rate was reasonable in light of the nature, quality and extent of services to be provided and that economies of scale were limited at this time.
Other Benefits to the Subadviser. The Board also considered the character and amount of other incidental benefits expected to be received by Guardian Capital and its affiliates. The Board considered potential benefits to Guardian Capital from the use of “soft dollars” to pay for research services generated by parties other than the executing broker-dealer. The Board concluded that the subadvisory fees were reasonable taking into account any other benefits expected to be received by Guardian Capital from its relationship with the New Fund.
Conclusion. Based on all of the information considered and the conclusions reached, the Board determined that the terms of the Sub-Investment Advisory Agreement are fair and reasonable, and that the approval of the Sub-Investment Advisory Agreement is in the best interests of the New Fund. No single factor was determinative in the Board’s analysis.
CONSIDERATIONS OF THE BOARD OF TRUSTEES IN CONNECTION WITH THE APPROVAL OF THE SUB-INVESTMENT ADVISORY AGREEMENT FOR ASTON/PICTET INTERNATIONAL FUND
At an in-person meeting on March 20, 2014, the Board of Trustees (the “Board”) of Aston Funds (the “Trust”), including the trustees who are not “interested persons,” as defined in Section 2(a)(19) of the Investment Company Act of 1940, as amended (the “Independent Trustees”), considered the approval of a Sub-Investment Advisory Agreement (the “Sub-Investment Advisory Agreement”) between Aston Asset Management, LP (including any successor thereto, “Aston”) and Pictet Asset Management Limited (“PAM”) with respect to the ASTON/Pictet International Fund (the “New Fund”). The Board considered information provided and discussions held at the March 20, 2014 meeting and at prior meetings. The Independent Trustees met separately from the Trustees who are “interested persons” of the Trust as defined in Section 2(a)(19) of the Investment Company Act of 1940, as amended, and any officers of Aston, PAM or their respective affiliates to consider approval of the Sub-Investment Advisory Agreement and were assisted by independent legal counsel in their deliberations.
Among the matters considered by the Board, including the Independent Trustees, in connection with its approval of the Sub-Investment Advisory Agreement were the following:
Nature, Quality and Extent of Services. The Board considered the nature, quality and extent of services expected to be provided under the Sub-Investment Advisory Agreement. The Board considered the reputation, qualifications and background of PAM and its operational and compliance infrastructures. The Board also considered information provided regarding PAM’s
| | |
| |
| | April 30, 2014 |
| |
| Additional Information (unaudited) – continued | | |
investment approach, the experience and skills of senior management and investment personnel of PAM, the resources made available to such personnel, the ability of PAM to attract and retain high-quality personnel and the organizational depth of PAM. On the basis of this evaluation, the Board concluded that the nature, quality and extent of services to be provided by PAM are expected to be satisfactory.
Fees, Profitability and Economies of Scale. The Board considered the subadvisory fee rate under the Sub-Investment Advisory Agreement as well as the overall management fee structure of the New Fund, noting that the subadvisory fee rate is fifty percent (50%) of the investment advisory fee less certain fee waivers and expense reimbursements incurred by Aston. The Board considered that the subadvisory fee rate had been negotiated at arm’s length between Aston and PAM, an unaffiliated third party, and that Aston would compensate PAM from the investment advisory fees it receives from the New Fund. As part of its review of the investment advisory agreement with Aston, the Board considered whether there will be economies of scale with respect to the overall fee structure of the New Fund and whether the New Fund will benefit from any economies of scale.
The Board determined that profitability information with respect to PAM was not material to its considerations in light of the fee model used by Aston and the unaffiliated status of PAM. The Board concluded that the proposed subadvisory fee rate was reasonable in light of the nature, quality and extent of services to be provided and that economies of scale were limited at this time.
Other Benefits to the Subadviser. The Board also considered the character and amount of other incidental benefits expected to be received by PAM and its affiliates. The Board considered potential benefits to PAM from the use of “soft dollars” to pay for research services generated by parties other than the executing broker-dealer. The Board concluded that the subadvisory fees were reasonable taking into account any other benefits expected to be received by PAM from its relationship with the New Fund.
Conclusion. Based on all of the information considered and the conclusions reached, the Board determined that the terms of the Sub-Investment Advisory Agreement are fair and reasonable, and that the approval of the Sub-Investment Advisory Agreement is in the best interests of the New Fund. No single factor was determinative in the Board’s analysis.
CONSIDERATIONS OF THE BOARD OF TRUSTEES IN CONNECTION WITH THE APPROVAL OF THE NEW INVESTMENT ADVISORY AGREEMENT AND SUB-INVESTMENT ADVISORY AGREEMENTS FOR ASTON/GUARDIAN CAPITAL GLOBAL DIVIDEND FUND AND ASTON/PICTET INTERNATIONAL FUND IN CONNECTION WITH THE TRANSACTION
At an in-person meeting on March 20, 2014, the Board of Trustees (the “Board”) of Aston Funds (the “Trust”), including the trustees who are not “interested persons,” as defined in Section 2(a)(19) of the Investment Company Act of 1940, as amended (the “Independent Trustees”), considered the terms of
(1) a new investment advisory agreement (the “New Advisory Agreement”) between Aston Asset Management, LLC (currently known as Aston Asset Management, LP) (“Aston”) and the Trust on behalf of the ASTON/Guardian Capital Global Dividend Fund (the “Guardian Fund”) and the ASTON/Pictet International Fund (the “Pictet Fund”) (each of the Guardian Fund and the Pictet Fund, a “New Fund” and collectively, the “New Funds”), (2) a new sub-investment advisory agreement (the “New Guardian Sub-Investment Advisory Agreement”) between Aston and Guardian Capital LP (“Guardian Capital”) with respect to the Guardian Fund, and (3) a new sub-investment advisory agreement (the “New Pictet Sub-Investment Advisory Agreement”) (each of the New Guardian Sub-Investment Advisory Agreement and the New Pictet Sub-Investment Advisory Agreement, a “New Sub-Investment Advisory Agreement” and collectively, the “New Sub-Investment Advisory Agreements”) between Aston and Pictet Asset Management Limited (“PAM”) with respect to the Pictet Fund.
The circumstance giving rise to the Board’s consideration of the New Advisory Agreement was the exercise by Affiliated Managers Group, Inc. (“AMG”) of its call option with respect to the outstanding equity of Aston that is not currently owned by AMG and the related restructuring of Aston (collectively, the “Restructuring Transaction”). The Board, including the Independent Trustees, considered information about the Restructuring Transaction provided by Aston and AMG, including information provided at the December 18-19, 2013 meeting of the Board with respect to the approval of a new investment advisory agreement for other series of the Trust in connection with the Restructuring Transaction.
The Board noted that, upon completion of the Restructuring Transaction, Aston would be converted from a limited partnership to a limited liability company and that Aston would be a wholly-owned subsidiary of Managers Investment Group LLC (which would be rebranded as “AMG Funds LLC”), a wholly-owned subsidiary of AMG. The Board considered that the completion of the Restructuring Transaction, if it occurs after the initial investment advisory agreement for each New Fund takes effect, may be deemed to result in the “assignment” of each of the initial investment advisory agreement and the initial sub-investment advisory agreement for each New Fund, causing those agreements to automatically terminate.
In anticipation of the termination of the initial investment advisory agreement and each initial sub-investment advisory agreement in connection with the Restructuring Transaction, the Board, including the Independent Trustees, determined that the terms of the New Advisory Agreement between the Trust, on behalf of each New Fund, and Aston, the New Guardian Sub-Investment Advisory Agreement between Aston and Guardian Capital with respect to the Guardian Fund and the New Pictet Sub-Investment Advisory Agreement between Aston and PAM with respect to the Pictet Fund are fair and reasonable, and the Board approved the New Advisory Agreement and each New Sub-Investment Advisory Agreement as being in the best interests of the New Funds.
| | |
| |
| | April 30, 2014 |
| |
| Additional Information (unaudited) – continued | | |
In determining whether to approve the New Advisory Agreement and the applicable New Sub-Investment Advisory Agreement for each New Fund in connection with the Restructuring Transaction and whether to recommend the approval of the New Advisory Agreement to each New Fund’s sole shareholder, the Board received information and made inquiries into all matters deemed relevant and considered the following factors, among others:
| | • | | Based on representations from AMG and Aston, the Restructuring Transaction is not expected to affect the nature, extent and quality of services to be provided by Aston, Guardian Capital or PAM, nor is the Restructuring Transaction expected to result in any changes to either New Fund’s portfolio management. |
| | • | | Based on representations from AMG and Aston, neither AMG nor Aston has any present intention to make any material changes in the operations of either New Fund or its service providers, except for such changes which the Board discussed and determined to be consistent with the best interests of each New Fund and its shareholders. |
| | • | | Based on information provided by AMG and Aston, each New Fund may benefit over time as a result of economies from the greater scale of the combined organization, greater leverage with respect to third-party mutual fund platforms and stronger negotiating power with third-party vendors. |
| | • | | The terms of the New Advisory Agreement and each New Sub-Investment Advisory Agreement are substantially the same as the initial investment advisory agreement and the initial sub-investment advisory agreement, respectively, for each New Fund and the investment advisory and sub-investment advisory fee rates for each New Fund will remain the same. |
| | • | | Neither New Fund will bear any of the costs relating to the Restructuring Transaction. |
The Board considered that it had previously approved an initial investment advisory agreement and an initial sub-investment advisory agreement for each New Fund pursuant to an extensive process at its March 20, 2014 meeting. The Board concluded, based upon all of these considerations, along with the conclusions the Board reached with respect to the approval of the initial investment advisory agreement and the initial sub-investment advisory agreement for each New Fund, that it need not reconsider all of the factors that it would typically consider in connection with an initial contract approval or contract renewal.
Based upon its evaluation of all information and factors it deemed relevant, and assisted by the advice of independent legal counsel, the Board, including all of the Independent Trustees, concluded that the terms of the New Advisory Agreement and the New Sub-Investment Advisory Agreement, including the proposed investment advisory and subadvisory fees, respectively, for each New Fund were fair and reasonable, and that each of the New Advisory Agreement and the New Sub-Investment Advisory Agreement for each New Fund should be approved.
CONSIDERATIONS OF THE BOARD OF TRUSTEES IN CONNECTION WITH THE ANNUAL RENEWAL OF INVESTMENT ADVISORY AGREEMENT AND SUB-INVESTMENT ADVISORY AGREEMENTS
The Board of Trustees (the “Board”) of Aston Funds (the “Trust”), including the trustees who are not “interested persons” as defined in Section 2(a)(9) of the Investment Company Act of 1940, as amended (the “Independent Trustees”), is responsible for approving the Investment Advisory Agreement (the “Investment Advisory Agreement”) between the Trust and Aston Asset Management, LP (“Aston” or the “Adviser”) with respect to each series of the Trust and the Sub-Investment Advisory Agreements between Aston and each sub-adviser (each, a “Sub-Advisory Agreement” and collectively, the “Sub-Advisory Agreements”) and approving the periodic continuance of such agreements. Pursuant to the Investment Company Act of 1940, as amended, (the “1940 Act”) the Board is required to consider the continuation of the Investment Advisory Agreement and Sub-Advisory Agreements on an annual basis following the initial term of each agreement. Accordingly, the Board considered the continuance of the Investment Advisory Agreement with respect to each series of the Trust for which the term ends in December 2013 and each Sub-Advisory Agreement with a term ending in December 2013, as set forth in Exhibit A-1 (collectively, the “Advisory Agreements”), at an in-person meeting held in December 2013, and the Board determined to continue the Advisory Agreements for an additional one-year period. Each series of the Trust for which an Advisory Agreement is being continued is referred to as a “Fund” or a “Renewal Fund.”
The Board, including the Independent Trustees, considered materials received and discussions held with respect to the continuation of the Advisory Agreements at in-person meetings held in September 2013 and December 2013 (the “Meetings”). The Board requested and received a broad range of information relating to the Renewal Funds, the Adviser and the applicable sub-adviser (each, a “Sub-Adviser” and collectively the “Sub-Advisers”). As discussed in more detail below, the information provided included, among other things, a review of performance, including Fund performance assessments against peer groups and appropriate benchmarks compiled by an independent mutual fund data provider, a comparison of Fund fees and expenses relative to a peer expense group compiled by an independent mutual fund data provider, and an assessment with respect to the Adviser and each Sub-Adviser of the organizational structure, investment philosophy and process, operational matters and compliance matters. With respect to the Adviser, the materials also included a review of information regarding the Adviser’s business and fee model, an analysis of the Adviser’s profitability with comparisons to prior years and an assessment of the services provided by the Adviser. As a result of its review of the materials provided and discussions held at the Meetings, the Board presented the Adviser with questions and the Adviser responded.
The materials and information prepared and provided in connection with the annual review of the Advisory Agreements supplement the information and analysis provided to the Board
| | |
| |
| | April 30, 2014 |
| |
| Additional Information (unaudited) – continued | | |
during the year. In this regard, throughout the year, the Board regularly reviews the performance of, and various services provided by, the Adviser, Sub-Advisers and other service providers to the Trust. The Board also meets with key investment personnel managing the Fund portfolios at a special investment meeting held in February of each year, and on an as-needed basis throughout the year. At quarterly meetings, the Board reviews reports on, among other things, Fund performance, changes in investment process, policies and strategies, operational matters, and compliance and regulatory matters. The Board also reviewed information provided by counsel to the Trust describing applicable law and the Board’s duties in reviewing the Advisory Agreements. The Independent Trustees met separately from the Trustees who are “interested persons” of the Trust as defined in Section 2(a)(9) of the 1940 Act and any officers of Aston, the Sub-Advisers or their affiliates to consider the continuation of the Advisory Agreements and were assisted by independent legal counsel in their deliberations.
In considering the continuation of the Advisory Agreements, the Board, including the Independent Trustees, did not identify any single factor or group of factors as all-important or controlling, but considered all factors together including (a) the nature, extent, and quality of services provided by the Adviser and Sub-Advisers, (b) the investment performance of the Renewal Funds, (c) management fees, gross and net expenses, and contractual expense limitations with respect to the Renewal Funds, (d) the extent of any economies of scale, (e) benefits derived by the Adviser or Sub-Advisers from their relationships with the Trust and (f) other factors. The principal factors considered by the Board and its conclusions are summarized below.
Nature, Quality and Extent of Services. The Board considered the nature, quality and extent of services provided by the Adviser and Sub-Advisers. In light of the manager-of-managers structure employed by the Adviser, the Board recognized that the Adviser is responsible for the selection and oversight of the Sub-Advisers and that the Sub-Advisers provide day-to-day portfolio management services. In addition to performance information (as described in more detail below), the Board considered information regarding Aston’s business and fee model, investment committee structure, and investment processes and philosophy with respect to the selection and ongoing monitoring of the investment performance of the Sub-Advisers. In this regard, the Board noted the responsibilities and experience of Aston personnel, the resources made available to such personnel, the ability of Aston to attract and retain high-quality personnel and the organizational depth and stability of Aston. With respect to the Sub-Advisers, the Board considered information provided regarding the experience and skills of senior management and investment personnel of each Sub-Adviser, the resources made available to such personnel, the ability of each Sub-Adviser to attract and retain high-quality personnel, and the organizational depth and stability of each Sub-Adviser, as well as information regarding recent changes in ownership or key personnel, if any, and the impact of such changes on the services provided. The Board also considered the Adviser’s evaluation of each Sub-Adviser’s performance including, where applicable, performance attribution analysis.
In addition to advisory services, the Board considered the nature, quality and extent of other services provided by Aston including oversight of service providers, regulatory administration and Board support, fund administration and operational support, compliance services, shareholder servicing and platform management, and distribution- and marketing-related services. Given the importance of compliance, the Board also considered the Adviser’s and Trust’s compliance program, including reports from the Chief Compliance Officer received throughout the year regarding the compliance policies and procedures of the Trust, Adviser, Sub-Advisers and other service providers; the resources dedicated to compliance; and the record of compliance with the policies and procedures.
Performance. The Board reviewed reports that contained historical performance data for each Renewal Fund for various periods as well as information comparing such performance to the performance of a peer group of other mutual funds compiled by an independent provider of mutual fund data based on Morningstar categories (the “Performance Peer Group”) and to recognized benchmarks. In this regard, the Board reviewed performance information for the one-, three-, five- and ten-year periods ended June 30, 2013 (in each case, as available with respect to each Renewal Fund) compared to the performance of the Fund’s Performance Peer Group and benchmark index or indices over the periods presented. While the Board is cognizant of each Fund’s performance relative to the Performance Peer Group and the benchmark index or indices, the Board evaluated performance in light of the respective Fund’s investment objective and policies and the investment strategy of the applicable Sub-Adviser. With respect to Funds that the Board considers to have underperformed the Performance Peer Group and/or benchmark index or indices from time to time, the Board considered the Adviser’s assessment of whether performance was consistent with the Sub-Adviser’s investment strategy and was satisfactory over time, and, if applicable, steps taken by the Adviser to monitor or address such circumstances.
With respect to ASTON/Anchor Capital Enhanced Equity Fund, the Board also considered that the Morningstar long-short category assigned to the Fund was an imperfect match for the Fund’s covered call strategy. With respect to ASTON/Cornerstone Large Cap Value Fund, ASTON/Harrison Street Real Estate Fund and ASTON/LMCG Small Cap Growth Fund, the Board also considered that each Fund had undergone a change of Sub-Adviser within the last two years and that the performance information reflected the performance of a previous Sub-Adviser for some of the periods presented. With respect to ASTON/River Road Independent Value Fund, ASTON/River Road Long-Short Fund, ASTON/River Road All Cap Value Fund II and ASTON/DoubleLine Core Plus Fixed Income Fund, the Board also considered that the Funds had recently commenced operations and that the performance information reflected information for the one-year period ended June 30, 2013 only.
On the basis of this evaluation and its ongoing review of operations, the Board concluded that the nature, quality and extent of services provided by the Adviser was satisfactory. The Board
| | |
| |
| | April 30, 2014 |
| |
| Additional Information (unaudited) – continued | | |
also concluded that the nature, quality and extent of services provided by each Sub-Adviser was satisfactory over time taking into account the Sub-Adviser’s tenure, short-term and long-term performance and an assessment of whether such performance was consistent with the Sub-Adviser’s investment style.
Fees and Expenses. The Board considered the fee structure under the Sub-Advisory Agreements, noting that the subadvisory fee rate generally is fifty per percent (50%) of management fees less certain third party payments, fee waivers and expense reimbursement incurred by the Adviser. The Board considered that the subadvisory fee rates were negotiated at arm’s length between Aston and each Sub-Adviser, each an unaffiliated third party, and that Aston would compensate each Sub-Adviser from its own fees.
The Board evaluated the management fees and expenses of each Renewal Fund reviewing, among other things, each Fund’s gross management fees, net management fees, gross total expense ratio, and net total expense ratio, both on an absolute basis and as compared to fee and expense information of a relevant peer group compiled by an independent mutual fund data provider based on Morningstar categories (the “Peer Expense Group”). As a part of this analysis, the Board also considered advisory fees waived or expenses reimbursed by Aston pursuant to contractual expense limitation or reimbursement agreements and the applicable Sub-Adviser’s obligation to contribute to such waiver or reimbursement as set forth in the Sub-Advisory Agreements. With respect to ASTON/DoubleLine Core Plus Fixed Income Fund, the Board also considered the Sub-Adviser’s obligation to waive its sub-advisory fees to the extent of advisory fees earned by the Sub-Adviser with respect to assets of the Fund allocated to a proprietary fund and the Adviser’s obligation to reduce its fee in a corresponding amount.
With respect to ASTON/Anchor Capital Enhanced Equity Fund, ASTON Barings International Fund, ASTON/Fairpointe Mid Cap Fund, ASTON/Montag & Caldwell Growth Fund, ASTON/River Road Dividend All Cap Value Fund and ASTON/TCH Fixed Income Fund, the Board considered that gross management fees, net management fees, net operating expense and net total expenses were within a reasonable range of Peer Expense Group averages. With respect to ASTON/Montag & Caldwell Balanced Fund, ASTON/River Road Dividend All Cap Value Fund II and ASTON/River Road Long-Short Fund, the Board considered that gross management fees, net management fees and net total expenses were within a reasonable range of Peer Expense Group averages; the Board noted net operating expenses of each Fund were higher than the applicable Peer Expense Group average due to the small asset sizes of the Funds relative to the applicable peer group.
With respect to the ASTON/Cornerstone Large Cap Value Fund, the Board considered that while net management fees was higher than the Peer Expense Group average, the gross management fee of the Fund was less than the Peer Expense Group average and median and the net operating expenses and net total expenses of the Fund were within a reasonable range of the Peer Expense Group averages. With respect to ASTON/DoubleLine Core Plus
Fixed Income Fund, the Board considered the high-quality investment management firm engaged as Sub-Adviser along with the gross management fees and net management fees which were higher than the Peer Expense Group averages. The Board also considered that, the net operating expenses and net total expenses of the Fund were within a reasonable range of the Peer Expense Group averages. With respect to ASTON/Herndon Large Cap Value Fund, the Board considered that while the net management fee was higher than the Peer Expense Group average, gross management fee and net total expenses and net operating expenses for the Fund were within a reasonable range of the Peer Expense Group averages. With respect to ASTON/Harrison Street Real Estate Fund, ASTON/LMCG Small Cap Growth Fund, and ASTON/Silvercrest Small Cap Fund, the Board considered that while gross management fees and net operating expenses were higher than Peer Expense Group averages, net total expenses for these Funds were within a reasonable range of Peer Expense Group averages and that, due to the relatively small sizes of the Funds, the Adviser had waived all or substantially all of its management fees during the last fiscal year. With respect to ASTON/Lake Partners LASSO Alternatives Fund, the Board considered that while gross and net management fees were higher than the Peer Expense Group average, the relatively small size of the Peer Expense Group and the inclusion of indirect expenses of underlying funds made comparisons more difficult. With respect to ASTON/Montag & Caldwell Mid Cap Growth Fund, the Board considered that while the gross management fee was higher than the Peer Expense Group average due to low asset levels, the net total expenses for the Fund were within a reasonable range of the Peer Expense Group average. With respect to ASTON/River Road Independent Value Fund, ASTON/River Road Small Cap Value Fund, ASTON/River Road Select Value Fund, and ASTON/TAMRO Small Cap Fund, the Board considered that while gross and net management fees were higher than Peer Expense Group averages (or at or near the high end of Peer Expense Group averages for ASTON/River Road Select Value Fund), net total expenses and net operating expenses were within a reasonable range of Peer Expense Group averages. With respect to ASTON/TAMRO Diversified Equity Fund, the Board considered that although the net management fee was higher than the Peer Expense Group average, the Fund’s net management fee was within a reasonable range of the Peer Expense Group median and the gross management fee, net operating expenses and net total expenses were within a reasonable range of the Peer Expense Group averages.
With respect to ASTON/Fairpointe Mid Cap Fund, ASTON/LMCG Small Cap Growth Fund, ASTON/TAMRO Small Cap Fund, ASTON/River Road Dividend All Cap Value Fund, ASTON/River Road Independent Value Fund, ASTON/River Road Small Cap Value Fund, ASTON/River Road Select Value Fund, ASTON/River Road Dividend All Cap Value Fund II and ASTON Silvercrest Small Cap Fund, the Board also considered the capacity constraints and resulting limits on asset growth with respect to the Funds’ strategies. With respect to ASTON/River Road Long-Short Fund, the Board considered that the inclusion of dividend and interest expense in total expenses from short sales made the total expense comparison more difficult.
| | |
| |
| | April 30, 2014 |
| |
| Additional Information (unaudited) – continued | | |
The Board considered that the ASTON/Lake Partners LASSO Alternatives Fund invests primarily in other investment companies (a “Fund-of-Funds”). The Board noted that the Fund-of-Funds historically has invested in underlying funds outside of the Aston Funds complex. Accordingly, the Board determined, with respect to the Fund-of-Funds, that the management fees charged are based on services provided that are in addition to, rather than duplicative of, services provided under the advisory contract of the underlying funds in which the Fund-of-Funds may invest.
The Board also considered the advisory fees charged by Aston and the Sub-Advisers to separate account clients and, in the case of certain Sub-Advisers, other mutual funds. The Board considered that the fee rates charged to the Renewal Funds and separately managed account clients vary because of the different services involved and the additional regulatory and compliance requirements, among other things, associated with registered investment companies such as the Renewal Funds. Accordingly, the Board considered the differences in product types, including differences in the services provided, the structure and operations, product distribution and costs thereof, investor profiles, account sizes and regulatory requirements. The Board noted that the range of services provided to the Renewal Funds (as discussed above) is much more extensive than those provided to separate accounts.
On the basis of the information provided, the Board concluded that advisory and subadvisory fees were reasonable and appropriate in light of the nature, quality and extent of services provided.
Costs and Profitability. The Board considered certain financial information and statistics related to the costs of providing advisory services and the profitability of Aston’s Advisory Agreements in light of Aston’s business model, as well as fee waivers or expenses to be reimbursed, where applicable, including comparative information for the prior two years. The Board noted that for certain Renewal Funds, Aston and the Sub-Adviser will each bear 50% of any fee waivers or expense reimbursements and for other Renewal Funds, the Sub-Adviser is not responsible for contributing to expense reimbursements. The Board considered that the information was provided by Aston and was subject to a number of estimates and allocation decisions. Because the Board recognized the inherently subjective nature of profitability analysis, this information was utilized as an approximate rather than a definitive measure of profitability. The Board considered that Aston must be able to compensate its employees at competitive rates in order to attract and retain high-quality personnel to provide high-quality services to the Funds.
Based on the information provided, the Board concluded that the profits realized by Aston in connection with the management of the Funds were not unreasonable. The Board determined that profitability information with respect to the Sub-Advisers was not material to its considerations in light of the fee model used by Aston and the unaffiliated status of all Sub-Advisers.
Economies of Scale. The Board considered whether there are economies of scale with respect to the management of the Renewal Funds and whether the Renewal Funds benefit from any economies of scale. The Board considered the size of the Renewal Funds, any breakpoints in fees, and the nature of the asset class and any capacity limits. The Board noted that the Investment Advisory Agreement with Aston with respect to ASTON/Fairpointe Mid Cap Fund and ASTON/Montag & Caldwell Growth Fund contains breakpoints based on average daily net assets. The Board concluded that the management fee schedules for the ASTON/Fairpointe Mid Cap Fund and the ASTON/Montag & Caldwell Growth Fund reflect an appropriate level of sharing of economies of scale. The Board determined that economies of scale were limited for the other Renewal Funds at this time due to their asset size and/or capacity constraints with respect to the investment strategy of the applicable Sub-Adviser.
Other Benefits to the Adviser and Sub-Advisers. The Board considered the character and amount of other incidental benefits received by Aston as a result of its relationship with the Funds. The Board considered the nature and amount of fees to be paid by the Funds for administration services provided by Aston, and payments under the Funds’ Rule 12b-1 distribution and services plans. The Board also took into account other businesses that the Adviser has, or may develop, with Sub-Advisers to the Funds with respect to the separately managed accounts of certain Sub-Advisers, including the compensation received by Aston for client solicitation or support services provided in connection with such products. The Board noted that Aston does not manage any of the Funds directly and therefore will not benefit from the use of “soft” commission dollars to pay for research and brokerage services. The Board concluded that any incidental benefits to be received by Aston from its relationship with the Funds are expected to be reasonable and that the management fees were reasonable, taking into account any other benefits to be received by the Adviser.
The Board also considered the character and amount of other incidental benefits received by the Sub-Advisers and their affiliates as a result of their association with the Funds. The Board considered information provided regarding potential benefits to certain Sub-Advisers from the use of “soft dollars” to pay for research services generated by parties other than the executing broker-dealer. The Board also noted other business relationships with Aston and certain Sub-Advisers with respect to separately managed accounts. The Board concluded that the subadvisory fees were reasonable, taking into account any other benefits to be received by the Sub-Advisers from their relationship with the Funds.
Conclusion. Based upon its evaluation of all material factors and assisted by the advice of independent legal counsel, the Board, including all of the Independent Trustees, concluded that the terms of the Advisory Agreements including the advisory fees were fair and reasonable, and that the continuation of the Advisory Agreements with respect to each Renewal Fund for an additional one-year period should be approved.
| | |
| |
| | April 30, 2014 |
| |
| Additional Information (unaudited) – continued | | |
CONSIDERATIONS OF THE BOARD OF TRUSTEES IN APPROVING THE NEW INVESTMENT ADVISORY AGREEMENTS IN CONNECTION WITH THE TRANSACTION
At an in-person meeting held on December 18-19, 2013, the Board of Trustees (the “Board”) of Aston Funds (the “Trust”), including all of the Independent Trustees, considered the terms of a new investment advisory agreement (the “New Advisory Agreement”) between Aston Asset Management, LLC (currently known as Aston Asset Management, LP) (“Aston”) and the Trust on behalf of ASTON/Anchor Capital Enhanced Equity Fund, ASTON/Barings International Fund, ASTON/Cornerstone Large Cap Value Fund, ASTON/DoubleLine Core Plus Fixed Income Fund, ASTON/Fairpointe Mid Cap Fund, ASTON/Harrison Street Real Estate Fund, ASTON/Herndon Large Cap Value Fund, ASTON/Lake Partners LASSO Alternatives Fund, ASTON/LMCG Emerging Markets Fund, ASTON/LMCG Small Cap Growth Fund, ASTON/Montag & Caldwell Balanced Fund, ASTON/Montag & Caldwell Growth Fund, ASTON/Montag & Caldwell Mid Cap Growth Fund, ASTON/River Road Dividend All Cap Value Fund, ASTON/River Road Dividend All Cap Value Fund II, ASTON/River Road Independent Value Fund, ASTON/River Road Long-Short Fund, ASTON/River Road Select Value Fund, ASTON/River Road Small Cap Value Fund, ASTON/Silvercrest Small Cap Fund, ASTON/TAMRO Diversified Equity Fund, ASTON/TAMRO Small Cap Fund and ASTON/TCH Fixed Income Fund (each, a “Fund” and collectively, the “Funds”).
The circumstance giving rise to the Board’s consideration of the New Advisory Agreement was the exercise by Affiliated Managers Group, Inc. (“AMG”) of its call option with respect to the outstanding equity of Aston that is not currently owned by AMG and the related restructuring of Aston (collectively, the “Restructuring Transaction”). The Independent Trustees met in executive session to consider the proposals in connection with the Restructuring Transaction. The Board considered information about the Restructuring Transaction that had been provided by Aston and AMG. The Board noted that, upon completion of the Restructuring Transaction, Aston would be converted from a limited partnership to a limited liability company and that Aston would be a wholly owned subsidiary of Managers Investment Group LLC (“Managers”), a wholly owned subsidiary of AMG. The Board considered that the completion of the Restructuring Transaction may be deemed to result in the “assignment” of the investment advisory agreement then in effect for each Fund, causing that agreement to automatically terminate.
In anticipation of the termination of the current investment advisory agreements in connection with the Restructuring Transaction, the Board, including the Independent Trustees, determined that the terms of the New Advisory Agreement between the Trust, on behalf of each Fund, and Aston are fair and reasonable, and the Board approved each New Advisory Agreement as being in the best interests of each Fund. The Independent Trustees met separately from the “interested” Trustees of the Trust to consider the approval of the New Advisory Agreement with respect to each Fund and were assisted by independent legal counsel in their deliberations.
In determining whether to approve the New Advisory Agreement for each Fund in connection with the Restructuring Transaction and whether to recommend the approval of the New Investment Advisory Agreement to shareholders, the Board received information and made inquiries into all matters deemed relevant and considered the following factors, among others:
| | • | | Based on representations from Aston and AMG, the Restructuring Transaction is not expected to affect the nature, extent and quality of services to be provided by Aston, nor is the Restructuring Transaction expected to result in any changes to the subadvisers of the Funds. |
| | • | | Based on representations from Aston and AMG, neither Aston nor AMG has any present intention to make any material changes in the operations of the Funds or their service providers, except for such changes which the Board discussed and determined to be consistent with the best interests of the Funds and their shareholders. |
| | • | | Based on information provided by Aston and AMG, the Funds may benefit over time as a result of economies from the greater scale of the combined organization, greater leverage with respect to third-party mutual fund platforms and stronger negotiating power with third-party vendors. |
| | • | | The terms of each New Investment Advisory Agreement with Aston were substantially the same as the then-current investment advisory agreement, and the investment advisory fee rate would remain the same. The expense limitation and reimbursement agreements in effect for each Fund would not change as a result of the Restructuring Transaction. |
| | • | | The Funds will not bear any of the costs relating to the Restructuring Transaction, including the costs of preparing, printing and mailing a proxy statement to shareholders of the Funds and related solicitation expenses. |
The Board considered that it had renewed the current investment advisory agreements pursuant to an extensive process that concluded at its December 19, 2013 meeting, or pursuant to an extensive initial contract approval process in the last year. The Board also determined that it was appropriate to take into consideration the extensive information received throughout the year regarding performance and operating results of the Funds, given the continuity of portfolio management expected following the Restructuring Transaction. The Board concluded, based upon all of these considerations, along with the conclusions the Board reached with respect to the most recent approval or renewal of the current investment advisory agreement, that it need not reconsider all of the factors that it would typically consider in connection with an initial contract approval or contract renewal.
Based upon its evaluation of all information and factors it deemed relevant and assisted by the advice of independent legal counsel, the Board, including all of the Independent Trustees, concluded that the terms of the New Advisory Agreement, including the proposed advisory fees, were fair and
| | |
| |
| | April 30, 2014 |
| |
| Additional Information (unaudited) – continued | | |
reasonable, and that the New Advisory Agreement between Aston and the Trust on behalf of each Fund should be approved.
CONSIDERATIONS OF THE BOARD OF TRUSTEES IN APPROVING THE NEW SUB-INVESTMENT ADVISORY AGREEMENTS IN CONNECTION WITH THE TRANSACTION
At an in-person meeting held on December 18-19, 2013, the Board of Trustees (the “Board”) of Aston Funds (the “Trust”), including all of the Independent Trustees, considered whether to approve new sub-investment advisory agreements between Aston Asset Management, LLC (currently known as Aston Asset Management, LP) (“Aston”) and the following subadvisers (each, a “Subadviser” and collectively, the “Subadvisers”) on behalf of the following funds (each, a “Fund” and collectively, the “Funds”):
| | |
Subadviser | | Fund |
Anchor Capital Advisors LLC | | ASTON/Anchor Capital Enhanced Equity Fund |
| |
Baring International Investment Limited | | ASTON/Barings International Fund |
| |
Cornerstone Investment Partners, LLC | | ASTON/Cornerstone Large Cap Value Fund |
| |
DoubleLine Capital LP | | ASTON/DoubleLine Core Plus Fixed Income Fund |
| |
Fairpointe Capital LLC | | ASTON/Fairpointe Mid Cap Fund |
| |
Harrison Street Securities, LLC | | ASTON/Harrison Street Real Estate Fund |
| |
Herndon Capital Management, LLC | | ASTON/Herndon Large Cap Value Fund |
| |
Lake Partners, Inc. | | ASTON/Lake Partners LASSO Alternatives Fund |
| |
Lee Munder Capital Group, LLC | | ASTON/LMCG Emerging Markets Fund ASTON/LMCG Small Cap Growth Fund |
| |
Montag & Caldwell, LLC | | ASTON/Montag & Caldwell Growth Fund ASTON/Montag & Caldwell Mid Cap Growth Fund ASTON/Montag & Caldwell Balanced Fund |
| |
River Road Asset Management, LLC | | ASTON/River Road Dividend All Cap Value Fund ASTON/River Road Dividend All Cap Value Fund II ASTON/River Road Select Value Fund ASTON/River Road Small Cap Value Fund ASTON/River Road Independent Value Fund ASTON/River Road Long-Short Fund |
| |
Silvercrest Asset Management Group LLC | | ASTON/Silvercrest Small Cap Fund |
| | |
Subadviser | | Fund |
| |
TAMRO Capital Partners LLC | | ASTON/TAMRO Diversified Equity Fund ASTON/TAMRO Small Cap Fund |
| |
Taplin, Canida & Habacht LLC | | ASTON/TCH Fixed Income Fund |
The Board considered that the completion of the Restructuring Transaction may be deemed to result in the “assignment” of the current investment advisory agreement for each Fund, causing the agreements to automatically terminate, which will cause each sub-investment advisory agreement to automatically terminate upon its terms. In anticipation of the termination of the sub-investment advisory agreements, the Board, including the Independent Trustees, determined that the approval of a new sub-investment advisory agreement is in the best interests of each Fund. The Independent Trustees met separately from the “interested” Trustees of the Trust to consider the approval of the sub-investment advisory agreements with respect to each Fund and were assisted by independent legal counsel in their deliberations.
In determining whether to approve new sub-investment advisory agreements with respect to each Fund, the Board considered that the Restructuring Transaction relates solely to Aston and would have no impact on the nature, extent and quality of services provided by the Subadvisers. The Board also considered that the terms of the sub-investment advisory agreements, including the fees payable to the Subadvisers, would not change in connection with the Restructuring Transaction. The Board also considered that the Funds will not bear any of the costs relating to the Restructuring Transaction, including the costs of preparing, printing and mailing a proxy statement to shareholders of the Funds and related solicitation expenses. The Board considered that it had recently approved or renewed each sub-investment advisory agreement pursuant to an extensive annual renewal process that concluded at its December 2013 meeting or pursuant to an extensive initial contract approval process in the last year. The Board also determined that it was appropriate to take into consideration the extensive information received throughout the year regarding performance and operating results of the Funds. The Board concluded, based upon all of these considerations, along with the conclusions the Board reached with respect to the most recent approval or renewal of each sub-investment advisory agreement, that it need not reconsider all of the factors that it would typically consider in connection with an initial contract approval or contract renewal.
Based upon its evaluation of all information and factors it deemed relevant and assisted by the advice of independent legal counsel, the Board, including all of the Independent Trustees, concluded that a new sub-investment advisory agreement between Aston and the current sub-adviser with respect to each Fund should be approved.
Disclosure of Fund Expenses: We believe it is important for you to understand the impact of fees regarding your investment. All mutual funds have operating expenses. As a shareholder of a mutual fund, you incur ongoing costs, which include costs for
| | |
| |
| | April 30, 2014 |
| |
| Additional Information (unaudited) – continued | | |
portfolio management, administrative services, and shareholder reports (like this one), among others. Operating expenses, which are deducted from a fund’s gross income, directly reduce the investment return of the fund. A fund’s expenses are expressed as a percentage of its average daily net assets. This figure is known as the expense ratio. The following examples are intended to help you understand the ongoing fees (in dollars) of investing in your Fund and to compare these costs with those of other mutual funds. The examples are based on an investment of $1,000 made at the beginning of the period shown and held for the entire period.
The below table illustrates each Fund’s costs in two ways:
Actual Fund Return: This section helps you to estimate the actual expenses, after any applicable fee waivers, that you paid over the period. The “Ending Account Value” shown is derived from the Fund’s actual return for the past six-month period, the “Expense Ratio” column shows the period’s annualized expense ratio, and the “Expenses Paid During Period” column shows the dollar amount that would have been paid by an investor who started with $1,000 in the Fund at the beginning of the period. You may use the information here, together with your account value, to estimate the expenses that you paid over the period. To do so, simply divide your account value by $1,000 (for example, an $8,600 account value divided by $1,000 = 8.6), then multiply the result by the number given for your Fund in the first line under the heading entitled “Expenses Paid During Period.”
Hypothetical 5% Return: This section is intended to help you compare your Fund’s costs with those of other mutual funds. It assumes that the Fund had an annual return of 5% before expenses, but that the expense ratio is unchanged. In this case, because the return used is not the Fund’s actual return, the results do not apply to your investment. This example is useful in making comparisons to other mutual funds because the SEC requires all mutual funds to calculate expenses based on an assumed 5% annual return. You can assess your Fund’s costs by comparing this hypothetical example with the hypothetical examples that appear in shareholder reports of other funds.
Please note that the expenses shown in the table are meant to highlight and help you compare your ongoing costs only and do not reflect any transactional costs such as sales charges (loads) and redemption fees, which are described in the prospectus. If these costs were applied to your account, your costs would be higher.
| | | | | | | | | | | | | | | | |
| | | Beginning
Account
Value
11/1/13 | | | Ending
Account
Value
4/30/14 | | | Expense
Ratio(1) | | | Expenses
Paid During
Period(2) | |
| Montag & Caldwell Growth Fund | | | | | | | | | |
Actual Fund Return | | | | | | | | | | | | | | | | |
Class N | | | $1,000 | | | | $1,046.50 | | | | 1.03% | | | | $5.23 | |
Class I | | | 1,000 | | | | 1,047.60 | | | | 0.78% | | | | 3.96 | |
Class R | | | 1,000 | | | | 1,045.20 | | | | 1.28% | | | | 6.49 | |
Hypothetical 5% Return | | | | | | | | | | | | | | | | |
Class N | | | $1,000 | | | | $1,019.69 | | | | 1.03% | | | | $5.16 | |
Class I | | | 1,000 | | | | 1,020.93 | | | | 0.78% | | | | 3.91 | |
Class R | | | 1,000 | | | | 1,018.45 | | | | 1.28% | | | | 6.41 | |
| | | | | | | | | | | | | | | | |
| | | Beginning
Account
Value
11/1/13 | | | Ending
Account
Value
4/30/14 | | | Expense
Ratio(1) | | | Expenses
Paid During
Period(2) | |
| TAMRO Diversified Equity Fund | | | | | | | | | |
Actual Fund Return | | | | | | | | | | | | | | | | |
Class N | | | $1,000 | | | | $1,061.90 | | | | 1.20% | | | | $6.13 | |
Class I | | | 1,000 | | | | 1,063.80 | | | | 0.95% | | | | 4.86 | |
Hypothetical 5% Return | | | | | | | | | | | | | | | | |
Class N | | | $1,000 | | | | $1,018.84 | | | | 1.20% | | | | $6.01 | |
Class I | | | 1,000 | | | | 1,020.08 | | | | 0.95% | | | | 4.76 | |
| Herndon Large Cap Value Fund | | | | | | | | | |
Actual Fund Return | | | | | | | | | | | | | | | | |
Class N | | | $1,000 | | | | $1,097.50 | | | | 1.30% | | | | $6.76 | |
Class I | | | 1,000 | | | | 1,098.70 | | | | 1.05% | | | | 5.46 | |
Hypothetical 5% Return | | | | | | | | | | | | | | | | |
Class N | | | $1,000 | | | | $1,018.35 | | | | 1.30% | | | | $6.51 | |
Class I | | | 1,000 | | | | 1,019.59 | | | | 1.05% | | | | 5.26 | |
| Cornerstone Large Cap Value Fund | | | | | | | | | |
Actual Fund Return | | | | | | | | | | | | | | | | |
Class N | | | $1,000 | | | | $1,086.70 | | | | 1.30% | | | | $6.73 | |
Class I | | | 1,000 | | | | 1,086.80 | | | | 1.05% | | | | 5.43 | |
Hypothetical 5% Return | | | | | | | | | | | | | | | | |
Class N | | | $1,000 | | | | $1,018.35 | | | | 1.30% | | | | $6.51 | |
Class I | | | 1,000 | | | | 1,019.59 | | | | 1.05% | | | | 5.26 | |
| River Road Dividend All Cap Value Fund | | | | | | | | | |
Actual Fund Return | | | | | | | | | | | | | | | | |
Class N | | | $1,000 | | | | $1,039.40 | | | | 1.09% | | | | $5.51 | |
Class I | | | 1,000 | | | | 1,040.70 | | | | 0.84% | | | | 4.25 | |
Hypothetical 5% Return | | | | | | | | | | | | | | | | |
Class N | | | $1,000 | | | | $1,019.39 | | | | 1.09% | | | | $5.46 | |
Class I | | | 1,000 | | | | 1,020.63 | | | | 0.84% | | | | 4.21 | |
| River Road Dividend All Cap Value Fund II | | | | | |
Actual Fund Return | | | | | | | | | | | | | | | | |
Class N | | | $1,000 | | | | $1,039.50 | | | | 1.30% | | | | $6.57 | |
Class I | | | 1,000 | | | | 1,040.70 | | | | 1.05% | | | | 5.31 | |
Hypothetical 5% Return | | | | | | | | | | | | | | | | |
Class N | | | $1,000 | | | | $1,018.35 | | | | 1.30% | | | | $6.51 | |
Class I | | | 1,000 | | | | 1,019.59 | | | | 1.05% | | | | 5.26 | |
| Fairpointe Mid Cap Fund | | | | | | | | | |
Actual Fund Return | | | | | | | | | | | | | | | | |
Class N | | | $1,000 | | | | $1,105.20 | | | | 1.10% | | | | $5.74 | |
Class I | | | 1,000 | | | | 1,106.60 | | | | 0.85% | | | | 4.44 | |
Hypothetical 5% Return | | | | | | | | | | | | | | | | |
Class N | | | $1,000 | | | | $1,019.34 | | | | 1.10% | | | | $5.51 | |
Class I | | | 1,000 | | | | 1,020.58 | | | | 0.85% | | | | 4.26 | |
| Montag & Caldwell Mid Cap Growth Fund | | | | | | | | | |
Actual Fund Return | | | | | | | | | | | | | | | | |
Class N | | | $1,000 | | | | $1,049.00 | | | | 1.25% | | | | $6.35 | |
Hypothetical 5% Return | | | | | | | | | | | | | | | | |
Class N | | | $1,000 | | | | $1,018.60 | | | | 1.25% | | | | $6.26 | |
| LMCG Small Cap Growth Fund | | | | | | | | | |
Actual Fund Return | | | | | | | | | | | | | | | | |
Class N | | | $1,000 | | | | $1,027.70 | | | | 1.35% | | | | $6.79 | |
Class I | | | 1,000 | | | | 1,028.60 | | | | 1.10% | | | | 5.53 | |
Hypothetical 5% Return | | | | | | | | | | | | | | | | |
Class N | | | $1,000 | | | | $1,018.10 | | | | 1.35% | | | | $6.76 | |
Class I | | | 1,000 | | | | 1,019.34 | | | | 1.10% | | | | 5.51 | |
| Silvercrest Small Cap Fund | | | | | | | | | |
Actual Fund Return | | | | | | | | | | | | | | | | |
Class N | | | $1,000 | | | | $1,025.50 | | | | 1.40% | | | | $7.03 | |
Class I | | | 1,000 | | | | 1,026.50 | | | | 1.15% | | | | 5.78 | |
Hypothetical 5% Return | | | | | | | | | | | | | | | | |
Class N | | | $1,000 | | | | $1,017.85 | | | | 1.40% | | | | $7.00 | |
Class I | | | 1,000 | | | | 1,019.09 | | | | 1.15% | | | | 5.76 | |
| | |
| |
| | April 30, 2014 |
| |
| Additional Information (unaudited) – continued | | |
| | | | | | | | | | | | | | | | |
| | | Beginning
Account
Value
11/1/13 | | | Ending
Account
Value
4/30/14 | | | Expense
Ratio(1) | | | Expenses
Paid During
Period(2) | |
| TAMRO Small Cap Fund | | | | | | | | | |
Actual Fund Return | | | | | | | | | | | | | | | | |
Class N | | | $1,000 | | | | $954.70 | | | | 1.31% | | | | $6.35 | |
Class I | | | 1,000 | | | | 955.80 | | | | 1.06% | | | | 5.14 | |
Hypothetical 5% Return | | | | | | | | | | | | | | | | |
Class N | | | $1,000 | | | | $1,018.30 | | | | 1.31% | | | | $6.56 | |
Class I | | | 1,000 | | | | 1,019.54 | | | | 1.06% | | | | 5.31 | |
| River Road Select Value Fund | | | | | | | | | |
Actual Fund Return | | | | | | | | | | | | | | | | |
Class N | | | $1,000 | | | | $1,001.10 | | | | 1.45% | | | | $7.19 | |
Class I | | | 1,000 | | | | 1,002.20 | | | | 1.20% | | | | 5.96 | |
Hypothetical 5% Return | | | | | | | | | | | | | | | | |
Class N | | | $1,000 | | | | $1,017.60 | | | | 1.45% | | | | $7.25 | |
Class I | | | 1,000 | | | | 1,018.84 | | | | 1.20% | | | | 6.01 | |
| River Road Small Cap Value Fund | | | | | | | | | |
Actual Fund Return | | | | | | | | | | | | | | | | |
Class N | | | $1,000 | | | | $1,014.30 | | | | 1.33% | | | | $6.64 | |
Class I | | | 1,000 | | | | 1,015.60 | | | | 1.08% | | | | 5.40 | |
Hypothetical 5% Return | | | | | | | | | | | | | | | | |
Class N | | | $1,000 | | | | $1,018.20 | | | | 1.33% | | | | $6.66 | |
Class I | | | 1,000 | | | | 1,019.44 | | | | 1.08% | | | | 5.41 | |
| River Road Independent Value Fund(3) | | | | | | | | | |
Actual Fund Return | | | | | | | | | | | | | | | | |
Class N | | | $1,000 | | | | $1,021.20 | | | | 1.42% | | | | $7.12 | |
Class I | | | 1,000 | | | | 1,021.90 | | | | 1.17% | | | | 5.87 | |
Hypothetical 5% Return | | | | | | | | | | | | | | | | |
Class N | | | $1,000 | | | | $1,017.75 | | | | 1.42% | | | | $7.10 | |
Class I | | | 1,000 | | | | 1,018.99 | | | | 1.17% | | | | 5.86 | |
| DoubleLine Core Plus Fixed Income Fund | | | | | | | | | |
Actual Fund Return | | | | | | | | | | | | | | | | |
Class N | | | $1,000 | | | | $1,026.50 | | | | 0.94% | | | | $4.72 | |
Class I | | | 1,000 | | | | 1,027.80 | | | | 0.69% | | | | 3.47 | |
Hypothetical 5% Return | | | | | | | | | | | | | | | | |
Class N | | | $1,000 | | | | $1,020.13 | | | | 0.94% | | | | $4.71 | |
Class I | | | 1,000 | | | | 1,021.37 | | | | 0.69% | | | | 3.46 | |
| TCH Fixed Income Fund | | | | | | | | | |
Actual Fund Return | | | | | | | | | | | | | | | | |
Class N | | | $1,000 | | | | $1,029.30 | | | | 0.94% | | | | $4.73 | |
Class I | | | 1,000 | | | | 1,030.60 | | | | 0.69% | | | | 3.47 | |
Hypothetical 5% Return | | | | | | | | | | | | | | | | |
Class N | | | $1,000 | | | | $1,020.13 | | | | 0.94% | | | | $4.71 | |
Class I | | | 1,000 | | | | 1,021.37 | | | | 0.69% | | | | 3.46 | |
| Lake Partners LASSO Alternatives Fund(3) | | | | | |
Actual Fund Return | | | | | | | | | | | | | | | | |
Class N | | | $1,000 | | | | $1,033.50 | | | | 1.45% | | | | $7.31 | |
Class I | | | 1,000 | | | | 1,034.90 | | | | 1.20% | | | | 6.05 | |
Hypothetical 5% Return | | | | | | | | | | | | | | | | |
Class N | | | $1,000 | | | | $1,017.60 | | | | 1.45% | | | | $7.25 | |
Class I | | | 1,000 | | | | 1,018.84 | | | | 1.20% | | | | 6.01 | |
| Anchor Capital Enhanced Equity Fund(3) | | | | | | | | | |
Actual Fund Return | | | | | | | | | | | | | | | | |
Class N | | | $1,000 | | | | $1,009.10 | | | | 1.21% | | | | $6.03 | |
Class I | | | 1,000 | | | | 1,010.30 | | | | 0.96% | | | | 4.79 | |
Hypothetical 5% Return | | | | | | | | | | | | | | | | |
Class N | | | $1,000 | | | | $1,018.79 | | | | 1.21% | | | | $6.06 | |
Class I | | | 1,000 | | | | 1,020.03 | | | | 0.96% | | | | 4.81 | |
| River Road Long-Short Fund(4) | | | | | | | | | |
Actual Fund Return | | | | | | | | | | | | | | | | |
Class N | | | $1,000 | | | | $980.10 | | | | 1.70% | | | | $8.35 | |
Class I | | | 1,000 | | | | 981.80 | | | | 1.45% | | | | 7.12 | |
Hypothetical 5% Return | | | | | | | | | | | | | | | | |
Class N | | | $1,000 | | | | $1,016.36 | | | | 1.70% | | | | $8.50 | |
Class I | | | 1,000 | | | | 1,017.60 | | | | 1.45% | | | | 7.25 | |
| | | | | | | | | | | | | | | | |
| | | Beginning
Account
Value
11/1/13 | | | Ending
Account
Value
4/30/14 | | | Expense
Ratio(1) | | | Expenses
Paid During
Period(2) | |
| Barings International Fund | | | | | | | | | |
Actual Fund Return | | | | | | | | | | | | | | | | |
Class N | | | $1,000 | | | | $1,017.10 | | | | 1.40% | | | | $7.00 | |
Class I | | | 1,000 | | | | 1,019.60 | | | | 1.15% | | | | 5.76 | |
Hypothetical 5% Return | | | | | | | | | | | | | | | | |
Class N | | | $1,000 | | | | $1,017.85 | | | | 1.40% | | | | $7.00 | |
Class I | | | 1,000 | | | | 1,019.09 | | | | 1.15% | | | | 5.76 | |
| Guardian Capital Global Dividend Fund(5) | | | | | | | | | |
Actual Fund Return | | | | | | | | | | | | | | | | |
Class N | | | $1,000 | | | | $1,035.00 | | | | 1.30% | | | | $0.62 | |
Class I | | | 1,000 | | | | 1,035.00 | | | | 1.05% | | | | 0.50 | |
Hypothetical 5% Return | | | | | | | | | | | | | | | | |
Class N | | | $1,000 | | | | $1,018.35 | | | | 1.30% | | | | $6.51 | |
Class I | | | 1,000 | | | | 1,019.59 | | | | 1.05% | | | | 5.26 | |
| LMCG Emerging Markets Fund | | | | | | | | | |
Actual Fund Return | | | | | | | | | | | | | | | | |
Class N | | | $1,000 | | | | $961.80 | | | | 1.65% | | | | $8.03 | |
Class I | | | 1,000 | | | | 963.70 | | | | 1.40% | | | | 6.82 | |
Hypothetical 5% Return | | | | | | | | | | | | | | | | |
Class N | | | $1,000 | | | | $1,016.61 | | | | 1.65% | | | | $8.25 | |
Class I | | | 1,000 | | | | 1,017.85 | | | | 1.40% | | | | 7.00 | |
| Pictet International Fund(6) | | | | | | | | | |
Actual Fund Return | | | | | | | | | | | | | | | | |
Class N | | | $1,000 | | | | $1,019.00 | | | | 1.40% | | | | $0.66 | |
Class I | | | 1,000 | | | | 1,019.00 | | | | 1.15% | | | | 0.54 | |
Hypothetical 5% Return | | | | | | | | | | | | | | | | |
Class N | | | $1,000 | | | | $1,017.85 | | | | 1.40% | | | | $7.00 | |
Class I | | | 1,000 | | | | 1,019.09 | | | | 1.15% | | | | 5.76 | |
| Harrison Street Real Estate Fund | | | | | | | | | |
Actual Fund Return | | | | | | | | | | | | | | | | |
Class N | | | $1,000 | | | | $1,045.00 | | | | 1.37% | | | | $6.95 | |
Class I | | | 1,000 | | | | 1,046.10 | | | | 1.12% | | | | 5.68 | |
Hypothetical 5% Return | | | | | | | | | | | | | | | | |
Class N | | | $1,000 | | | | $1,018.00 | | | | 1.37% | | | | $6.85 | |
Class I | | | 1,000 | | | | 1,019.24 | | | | 1.12% | | | | 5.61 | |
| Montag & Caldwell Balanced Fund | | | | | | | | | |
Actual Fund Return | | | | | | | | | | | | | | | | |
Class N | | | $1,000 | | | | $1,032.70 | | | | 1.20% | | | | $6.05 | |
Class I | | | 1,000 | | | | 1,033.30 | | | | 1.10% | | | | 5.55 | |
Hypothetical 5% Return | | | | | | | | | | | | | | | | |
Class N | | | $1,000 | | | | $1,018.84 | | | | 1.20% | | | | $6.01 | |
Class I | | | 1,000 | | | | 1,019.34 | | | | 1.10% | | | | 5.51 | |
| (1) | Annualized, based on the Fund’s most recent fiscal half-year expenses. |
| (2) | Expenses are equal to the Fund’s annualized expense ratio multiplied by the average account value over the period, multiplied by the number of days in the most recent fiscal half-year (181) or partial year, if applicable, for the actual return and multiplied by the most recent fiscal half-year for the hypothetical 5% return, then divided by 365. Expense ratios do not include interest expense, if applicable. |
| (3) | Earnings Credit did not affect the six months expense ratio for the six months ended April 30, 2014, except for the River Road Independent Value Fund. If included, your annualized expense ratios for the River Road Independent Value Fund would be 1.41% and 1.16% for Class N and Class I, respectively and your actual and hypothetical expenses paid during the period would be $7.07 and $7.05 and $5.82 and $5.81 for Class N and Class I, respectively. |
| (4) | Excludes interest expense and dividends on short positions. If included, your annualized expense ratios would be 2.49% and 2.24% for Class N and Class I, respectively and your actual and hypothetical expenses paid during the period would be $12.22 and $12.42 and $11.01 and $11.18 for Class N and Class I, respectively. |
| (5) | The inception date for the Guardian Capital Global Dividend Fund Class N and I is April 14, 2014. |
| (6) | The inception date for the Pictet International Fund Class N and I is April 14, 2014. |
Aston Funds
ADVISER
Aston Asset Management, LP
120 N. LaSalle Street, 25th Floor
Chicago, IL 60602
SUBADVISERS
Anchor Capital Advisors LLC
One Post Office Square, Suite 3850
Boston, MA 02109
Baring International Investment Limited
155 Bishopsgate
London, EC2M 3XY UK
Cornerstone Investment Partners, LLC
Phipps Tower
3438 Peachtree Road NE, Suite 900
Atlanta, GA 30326
DoubleLine Capital LP
333 South Grand Avenue, Suite 1800
Los Angeles, CA 90071
Fairpointe Capital LLC
One North Franklin, Suite 3300
Chicago, IL 60606
Guardian Capital LP
199 Bay Street, Suite 3100
Toronto, ON, M5L 1E8
Harrison Street Securities, LLC
71 South Wacker Drive, Suite 3575
Chicago, IL 60606
Herndon Capital Management, LLC
191 Peachtree Street, NE, Suite 2500
Atlanta, GA 30303
Lake Partners, Inc.
4 High Ridge Park, Suite 300
Stamford, CT 06905
Lee Munder Capital Group, LLC
200 Clarendon Street, 28th Floor
Boston, MA 02116
SUBADVISERS - continued
Montag & Caldwell, LLC
3455 Peachtree Road NE, Suite 1200
Atlanta, GA 30326
Pictet Asset Management Limited
120 London Wall
London, EC2Y 5ET UK
River Road Asset Management, LLC
Meidinger Tower, Suite 1600
462 South Fourth Street
Louisville, KY 40202
Silvercrest Asset Management Group LLC
1330 Avenue of the Americas, 38th Floor
New York, NY 10019
TAMRO Capital Partners LLC
1701 Duke St., Suite 250
Alexandria, VA 22314
Taplin, Canida & Habacht LLC
1001 Brickell Bay Drive, Suite 2100
Miami, FL 33131
SHAREHOLDER SERVICES
Aston Funds
P.O. Box 9765
Providence, RI 02940
DISTRIBUTOR
Foreside Funds Distributors LLC
400 Berwyn Park
899 Cassatt Road
Berwyn, PA 19312
OFFICERS
Stuart D. Bilton, President and Chief Executive Officer
Gerald F. Dillenburg, Senior Vice President and Secretary, Chief Operating Officer and Chief Compliance Officer
Laura M. Curylo, Treasurer and Chief Financial Officer
Juli A. Braun, Assistant Treasurer
Michael A. Cozzi, Assistant Treasurer
James A. Dimmick, Assistant Secretary
Marc J. Peirce, Assistant Secretary
Diana R. Podgorny, Assistant Secretary
CUSTODIAN
The Bank of New York Mellon
One Wall Street
New York, New York 10286
LEGAL COUNSEL
Vedder Price P.C.
222 N. LaSalle Street
Chicago, IL 60601
INDEPENDENT REGISTERED PUBLIC ACCOUNTING FIRM
Ernst & Young LLP
155 N. Wacker Drive
Chicago, IL 60606
THE STATEMENT OF ADDITIONAL INFORMATION INCLUDES ADDITIONAL INFORMATION ABOUT FUND TRUSTEES AND IS AVAILABLE UPON REQUEST WITHOUT CHARGE BY CALLING 800-992-8151.
This page intentionally left blank.
Guide to Shareholder Benefits
We’re delighted to offer all Aston Funds shareholders a variety of services and convenient options. To receive more information about any of these benefits, simply call an Investor Services Associate Monday through Friday, 9 a.m. – 7 p.m. Eastern Time.
THE EASY WAY TO ADD TO YOUR ACCOUNT: START AN AUTOMATIC INVESTMENT PLAN
For Class N shareholders, systematic investing is an easy, effortless way to help reach any investment goal. Just choose a fixed amount, and we’ll automatically deduct it from your checking or savings account on a regular schedule and invest it in your Aston Funds account. Periodic investment plans involve continuous investments in securities regardless of price. You should consider your financial ability to continue to purchase shares through periods of both high and low price levels. This plan does not assure a profit and does not protect against loss in declining markets.
COMPOUND YOUR EARNINGS WITH AUTOMATIC DIVIDEND REINVESTMENT
By automatically reinvesting dividends into your Fund account, profits have the opportunity to mount. Monthly and quarterly dividends and annual capital gain distributions are reinvested at no charge.
ACCESS INFORMATION AND MAKE TRANSACTIONS ONLINE AT OUR WEBSITE
You can open a new account, access account balances, view statements, obtain fund information, and make transactions online 24 hours a day, 7 days a week.
| | |
| | www.astonfunds.com |
| |
| | Our Automated Shareholder Services Line Is at Your Service 24 Hours a Day |
| | 800-992-8151 |
Investor Services
Associates are available to assist you Monday – Friday 9 a.m. to 7 p.m., Eastern Time. Or, call any time, day or night, for automated account information to make exchanges or check fund performance.

Aston Funds
P.O. Box 9765
Providence, RI 02940
ATSEM 14
Item 2. Code of Ethics.
Not applicable.
Item 3. Audit Committee Financial Expert.
Not applicable.
Item 4. Principal Accountant Fees and Services.
Not applicable.
Item 5. Audit Committee of Listed registrants.
Not applicable.
Item 6. Investments.
| (a) | Schedule of Investments in securities of unaffiliated issuers as of the close of the reporting period is included as part of the report to shareholders filed under Item 1 of this form. |
| Item 7. | Disclosure of Proxy Voting Policies and Procedures for Closed-End Management Investment Companies. |
Not applicable.
Item 8. Portfolio Managers of Closed-End Management Investment Companies.
Not applicable.
| Item 9. | Purchases of Equity Securities by Closed-End Management Investment Company and Affiliated Purchasers. |
Not applicable.
Item 10. Submission of Matters to a Vote of Security Holders.
There have been no material changes to the procedures by which the shareholders may recommend nominees to the registrant’s board of directors, where those changes were implemented after the registrant last provided disclosure in response to the requirements of Item 407(c)(2)(iv) of Regulation S-K (17 CFR 229.407) (as required by Item 22(b)(15) of Schedule 14A (17 CFR 240.14a-101)), or this Item.
Item 11. Controls and Procedures.
| | (a) | The registrant’s principal executive and principal financial officers, or persons performing similar functions, have concluded that the registrant’s disclosure controls and procedures (as defined in Rule 30a-3(c) under the Investment Company Act of 1940, as amended (the “1940 Act”) (17 CFR 270.30a-3(c))) are effective, as of a date within 90 days of the filing date of the report that includes the disclosure required by this paragraph, based on their evaluation of these controls and procedures required by Rule 30a-3(b) under the 1940 Act (17 CFR 270.30a-3(b)) and Rules 13a-15(b) or 15d-15(b) under the Securities Exchange Act of 1934, as amended (17 CFR 240.13a-15(b) or 240.15d-15(b)). |
| | (b) | There were no changes in the registrant’s internal control over financial reporting (as defined in Rule 30a-3(d) under the 1940 Act (17 CFR 270.30a-3(d)) that occurred during the registrant’s second fiscal quarter of the period covered by this report that has materially affected, or is reasonably likely to materially affect, the registrant’s internal control over financial reporting. |
Item 12. Exhibits.
| | (a)(2) | Certifications pursuant to Rule 30a-2(a) under the 1940 Act and Section 302 of the Sarbanes-Oxley Act of 2002 are attached hereto. |
| | (b) | Certifications pursuant to Rule 30a-2(b) under the 1940 Act and Section 906 of the Sarbanes-Oxley Act of 2002 are attached hereto. |
SIGNATURES
Pursuant to the requirements of the Securities Exchange Act of 1934 and the Investment Company Act of 1940, the registrant has duly caused this report to be signed on its behalf by the undersigned, thereunto duly authorized.
| | | | |
| | |
By (Signature and Title)* | | /s/ Stuart D. Bilton | | |
| | Stuart D. Bilton, Chief Executive Officer and President | | |
| | (principal executive officer) | | |
Pursuant to the requirements of the Securities Exchange Act of 1934 and the Investment Company Act of 1940, this report has been signed below by the following persons on behalf of the registrant and in the capacities and on the dates indicated.
| | | | |
By (Signature and Title)* | | /s/ Stuart D. Bilton | | |
| | Stuart D. Bilton, Chief Executive Officer and President | | |
| | (principal executive officer) | | |
| | | | |
By (Signature and Title)* | | /s/ Laura M. Curylo | | |
| | Laura M. Curylo, Treasurer and Chief Financial Officer | | |
| | (principal financial officer) | | |
* Print the name and title of each signing officer under his or her signature.