UNITED STATES
SECURITIES AND EXCHANGE COMMISSION
Washington, D.C. 20549
FORM N-CSR
CERTIFIED SHAREHOLDER REPORT OF REGISTERED MANAGEMENT
INVESTMENT COMPANIES
Investment Company Act file number 811-08004
Aston Funds
(Exact name of registrant as specified in charter)
120 North LaSalle Street, 25th Floor
Chicago, IL 60602
(Address of principal executive offices) (Zip code)
Jeffrey T. Cerutti, President, Chief Executive Officer and Principal Executive Officer
Aston Funds
120 North LaSalle Street, 25th Floor
Chicago, IL 60602
(Name and address of agent for service)
Registrant’s telephone number, including area code: (312) 268-1400
Date of fiscal year end: October 31
Date of reporting period: April 30, 2016
Form N-CSR is to be used by management investment companies to file reports with the Commission not later than 10 days after the transmission to stockholders of any report that is required to be transmitted to stockholders under Rule 30e-1 under the Investment Company Act of 1940 (17 CFR 270.30e-1). The Commission may use the information provided on Form N-CSR in its regulatory, disclosure review, inspection, and policymaking roles.
A registrant is required to disclose the information specified by Form N-CSR, and the Commission will make this information public. A registrant is not required to respond to the collection of information contained in Form N-CSR unless the Form displays a currently valid Office of Management and Budget (“OMB”) control number. Please direct comments concerning the accuracy of the information collection burden estimate and any suggestions for reducing the burden to Secretary, Securities and Exchange Commission, 100 F Street, NE, Washington, DC 20549. The OMB has reviewed this collection of information under the clearance requirements of 44 U.S.C. § 3507.
Item 1. Reports to Stockholders.
The Report to Shareholders is attached herewith.

Semi Annual Report 2016
April 30, 2016
Class N, I & R Shares
Equity
Fixed Income
Alternative
International
Sector
Balanced
This Privacy Statement is not part of the Semi Annual Report
PRIVACY STATEMENT
At Aston Funds, we appreciate the privacy concerns and expectations of our customers and we have established the following policies to maintain the privacy of information you share with us.
INFORMATION WE COLLECT
We collect and retain nonpublic personal information about you that may include:
| | • | | Information we receive on your account applications or other forms such as your name, address, financial information and/or social security number; |
| | • | | Information we receive about your mutual fund transactions, such as purchases, sales, exchanges and account balances; and |
| | • | | Information we collect through the use of Internet “cookies” when you access our website. Cookies are software files we use to track which of our sites you visit. |
INFORMATION WE MAY SHARE
We do not sell any of your nonpublic personal information to third parties. We may share the information we collect with affiliates or with non-affiliated third parties only when those parties are acting on our behalf in servicing your account, or as required by law. These third parties may include:
| | • | | Administrative service providers who, for example, process transactions for your account, print checks or prepare account statements; |
| | • | | Companies that provide services for us to help market our products to you; and |
| | • | | Governmental or other legal agencies, as required by law |
When information is shared with third parties, they are legally obligated to maintain the confidentiality of the information and to limit their use of it to servicing your account, except as permitted or required by law.
CONFIDENTIALITY AND SECURITY
We restrict access to your nonpublic personal information to authorized employees who need to access such information in order to provide services or products to you. We maintain physical, electronic and procedural safeguards to protect your nonpublic personal information.
As previously mentioned, we may collect information through the use of Internet “cookies” on our Web site. In addition, in order to provide you with access to your account via the web, it is necessary for us to collect certain nonpublic personal information such as your name, social security number and account information. Special measures such as data encryption and authentication apply to all nonpublic personal information and communications on our Web site.
APPLICABILITY
Our privacy policies apply only to those individual investors who have a direct customer relationship with us. If you are an individual shareholder of record of any of the Funds, the Funds consider you to be their customer. Shareholders purchasing or owning shares of any of the Funds through their bank, broker, or other financial institution should also consult that financial institution’s privacy policies.
Aston Funds values your business. We understand the importance of maintaining the integrity of your personal information and are committed to keeping your trust. Please contact us at 800-992-8151 if you have any questions concerning our policy, or visit us at www.astonfunds.com for additional copies of this policy.
This page intentionally left blank.
Aston Funds
Large Cap Funds
ASTON/Cornerstone Large Cap Value Fund
ASTON/Fairpointe Focused Equity Fund
ASTON/River Road Focused Absolute Value Fund
ASTON/Herndon Large Cap Value Fund
ASTON/Montag & Caldwell Growth Fund
Equity Income Funds
ASTON/River Road Dividend All Cap Value Fund
ASTON/River Road Dividend All Cap Value Fund II
Mid Cap Funds
ASTON/Fairpointe Mid Cap Fund
ASTON/Montag & Caldwell Mid Cap Growth Fund
Table of Contents
Small Cap Funds
ASTON/LMCG Small Cap Growth Fund
ASTON/River Road Independent Value Fund
ASTON/River Road Select Value Fund
ASTON/River Road Small Cap Value Fund
ASTON/Silvercrest Small Cap Fund
ASTON Small Cap Fund
(formerly, ASTON/TAMRO Small Cap Fund)
Fixed Income Funds
ASTON/DoubleLine Core Plus Fixed Income Fund ASTON/TCH Fixed Income Fund
Alternative Funds
ASTON/Anchor Capital Enhanced Equity Fund
ASTON/Lake Partners LASSO Alternatives Fund
ASTON/River Road Long-Short Fund
International Funds
ASTON/Barings International Fund
ASTON/Guardian Capital Global Dividend Fund
ASTON/LMCG Emerging Markets Fund
ASTON/Pictet International Fund
ASTON/Value Partners Asia Dividend Fund
Sector Fund
ASTON/Harrison Street Real Estate Fund
Balanced Fund
ASTON/Montag & Caldwell Balanced Fund
This report is submitted for general information to the shareholders of the funds. It is not authorized for distribution to prospective investors in the funds unless preceded or accompanied by an effective prospectus which includes details regarding the funds’ objectives, policies, expenses and other information.
Aston Funds are distributed by Foreside Funds Distributors LLC, 400 Berwyn Park, 899 Cassatt Road, Berwyn, PA 19312
Shareholder Services 800-992-8151 • www.astonfunds.com
NOT FDIC INSURED • NO BANK GUARANTEE • MAY LOSE VALUE
| | |
| |
| | As of April 30, 2016 |
| |
| Performance Summary (unaudited) | | |
| | | | | | | | | | | | | | | | | | | | | | | | | | | | | | | | | | | | |
| | | | | | | | | Average Annual Total Returns | | | | | | | | | | | | | |
| | | Class | | | Six Month Total Return (a) | | | One Year | | | Five Year | | | Ten Year | | | Since Inception | | | Total Expense Ratio (b) | | | Net Expense Ratio (b) | | | Inception Date | |
| Equity | | | | | | | | | | | | | | | | | | | | | | | | | | | | | | | | | | | | |
ASTON/Cornerstone Large Cap Value Fund (c) | | | N | | | | -0.96 | | | | -9.91 | | | | 5.64 | | | | 4.29 | | | | 7.07 | | | | 1.19 | % | | | 1.15 | % | | | 01/04/93 | |
| | | I | | | | -0.85 | | | | -9.66 | | | | 5.91 | | | | 4.56 | | | | 5.20 | | | | 0.94 | | | | 0.90 | | | | 09/20/05 | |
| | | | | | | | | |
ASTON/Fairpointe Focused Equity Fund (c) | | | N | | | | -0.98 | | | | -11.68 | | | | NA | | | | NA | | | | -5.70 | | | | 3.02 | | | | 1.16 | | | | 12/24/14 | |
| | | I | | | | -0.87 | | | | -11.47 | | | | NA | | | | NA | | | | -5.47 | | | | 2.77 | | | | 0.91 | | | | 12/24/14 | |
| | | | | | | | | |
ASTON/River Road Focused Absolute Value Fund (c) | | | N | | | | NA | | | | NA | | | | NA | | | | NA | | | | 1.30 | (d) | | | 4.25 | | | | 1.01 | | | | 11/03/15 | |
| | | I | | | | NA | | | | NA | | | | NA | | | | NA | | | | 1.40 | (d) | | | 4.00 | | | | 0.76 | | | | 11/03/15 | |
| | | | | | | | | |
ASTON/Herndon Large Cap Value Fund (c) | | | N | | | | -5.29 | | | | -11.99 | | | | 4.64 | | | | NA | | | | 7.16 | | | | 1.16 | | | | 1.14 | | | | 03/31/10 | |
| | | I | | | | -5.16 | | | | -11.81 | | | | 4.90 | | | | NA | | | | 5.86 | | | | 0.91 | | | | 0.89 | | | | 03/02/11 | |
| | | | | | | | | |
ASTON/Montag & Caldwell Growth Fund | | | N | | | | -2.28 | | | | 2.21 | | | | 8.97 | | | | 7.01 | | | | 8.85 | | | | 1.06 | | | | 1.06 | | | | 11/02/94 | |
| | | I | | | | -2.16 | | | | 2.51 | | | | 9.24 | | | | 7.29 | | | | 7.47 | | | | 0.81 | | | | 0.81 | | | | 06/28/96 | |
| | | R | | | | -2.38 | | | | 2.02 | | | | 8.71 | | | | 6.76 | | | | 7.20 | | | | 1.31 | | | | 1.31 | | | | 12/31/02 | |
| | | | | | | | | |
ASTON/River Road Dividend All Cap Value Fund | | | N | | | | 5.68 | | | | 1.74 | | | | 9.74 | | | | 7.15 | | | | 7.95 | | | | 1.10 | | | | 1.10 | | | | 06/28/05 | |
| | | I | | | | 5.81 | | | | 1.99 | | | | 10.02 | | | | NA | | | | 6.00 | | | | 0.85 | | | | 0.85 | | | | 06/28/07 | |
| | | | | | | | | |
ASTON/River Road Dividend All Cap Value II Fund | | | N | | | | 5.50 | | | | 1.70 | | | | NA | | | | NA | | | | 11.81 | | | | 1.15 | | | | 1.15 | | | | 06/27/12 | |
| | | I | | | | 5.63 | | | | 1.96 | | | | NA | | | | NA | | | | 12.10 | | | | 0.90 | | | | 0.90 | | | | 06/27/12 | |
| | | | | | | | | |
ASTON/Fairpointe Mid Cap Fund | | | N | | | | 1.46 | | | | -10.06 | | | | 8.52 | | | | 9.32 | | | | 12.00 | | | | 1.11 | | | | 1.11 | | | | 09/19/94 | |
| | | I | | | | 1.59 | | | | -9.84 | | | | 8.79 | | | | 9.60 | | | | 9.34 | | | | 0.86 | | | | 0.86 | | | | 07/06/04 | |
| | | | | | | | | |
ASTON/Montag & Caldwell Mid Cap Growth Fund (c) | | | N | | | | -0.02 | | | | -2.13 | | | | 7.28 | | | | NA | | | | 4.78 | | | | 2.11 | | | | 1.26 | | | | 11/02/07 | |
| | | I | | | | 0.08 | | | | -1.95 | | | | NA | | | | NA | | | | 5.50 | | | | 1.86 | | | | 1.01 | | | | 05/14/14 | |
| | | | | | | | | |
ASTON/LMCG Small Cap Growth Fund (c) | | | N | | | | -15.53 | | | | -20.63 | | | | 4.54 | | | | NA | | | | 8.60 | | | | 1.54 | | | | 1.36 | | | | 11/03/10 | |
| | | I | | | | -15.49 | | | | -20.44 | | | | NA | | | | NA | | | | 5.23 | | | | 1.29 | | | | 1.11 | | | | 06/01/11 | |
| | | | | | | | | |
ASTON/River Road Independent Value Fund (c) | | | N | | | | 8.49 | | | | 4.17 | | | | 3.18 | | | | NA | | | | 4.61 | | | | 1.48 | | | | 1.46 | | | | 12/31/10 | |
| | | I | | | | 8.69 | | | | 4.41 | | | | NA | | | | NA | | | | 3.39 | | | | 1.23 | | | | 1.21 | | | | 06/01/11 | |
| | | | | | | | | |
ASTON/River Road Select Value Fund (c) | | | N | | | | 3.62 | | | | 1.49 | | | | 7.78 | | | | NA | | | | 4.71 | | | | 1.52 | | | | 1.52 | | | | 03/29/07 | |
| | | I | | | | 3.78 | | | | 1.81 | | | | 8.09 | | | | NA | | | | 4.54 | | | | 1.27 | | | | 1.27 | | | | 06/28/07 | |
| | | | | | | | | |
ASTON/River Road Small Cap Value Fund | | | N | | | | 1.11 | | | | 1.03 | | | | 7.40 | | | | 4.90 | | | | 6.69 | | | | 1.39 | | | | 1.39 | | | | 06/28/05 | |
| | | I | | | | 1.27 | | | | 1.36 | | | | 7.68 | | | | NA | | | | 4.21 | | | | 1.14 | | | | 1.14 | | | | 12/13/06 | |
| | | | | | | | | |
ASTON/Silvercrest Small Cap Fund (c) | | | N | | | | -0.99 | | | | -0.92 | | | | NA | | | | NA | | | | 11.60 | | | | 1.47 | | | | 1.40 | | | | 12/27/11 | |
| | | I | | | | -0.85 | | | | -0.65 | | | | NA | | | | NA | | | | 11.89 | | | | 1.22 | | | | 1.15 | | | | 12/27/11 | |
| | | | | | | | | |
ASTON Small Cap Fund (c) | | | N | | | | -6.94 | | | | -12.35 | | | | 2.35 | | | | 4.43 | | | | 8.83 | | | | 1.42 | | | | 1.42 | | | | 11/30/00 | |
| | | I | | | | -6.84 | | | | -12.16 | | | | 2.59 | | | | 4.68 | | | | 6.42 | | | | 1.17 | | | | 1.17 | | | | 01/04/05 | |
| | | | | | | | | |
| Fixed Income | | | | | | | | | | | | | | | | | | | | | | | | | | | | | | | | | | | | |
ASTON/Doubleline Core Plus Fixed Income Fund (c) | | | N | | | | 2.05 | | | | 1.18 | | | | NA | | | | NA | | | | 5.03 | | | | 1.08 | | | | 0.97 | | | | 07/18/11 | |
| | | I | | | | 2.08 | | | | 1.33 | | | | NA | | | | NA | | | | 5.27 | | | | 0.83 | | | | 0.72 | | | | 07/18/11 | |
| | | | | | | | | |
ASTON/TCH Fixed Income Fund (c) | | | N | | | | 2.36 | | | | -0.68 | | | | 3.76 | | | | 5.58 | | | | 5.51 | | | | 1.19 | | | | 0.95 | | | | 12/13/93 | |
| | | I | | | | 2.49 | | | | -0.43 | | | | 3.98 | | | | 5.80 | | | | 5.63 | | | | 0.94 | | | | 0.70 | | | | 07/31/00 | |
| | |
| |
| | As of April 30, 2016 |
| |
| Performance Summary (unaudited) – continued | | |
| | | | | | | | | | | | | | | | | | | | | | | | | | | | | | | | | | | | |
| | | | | | | | | Average Annual Total Returns | | | | | | | | | | | | | |
| | | Class | | | Six Month Total Return (a) | | | One Year | | | Five Year | | | Ten Year | | | Since Inception | | | Total Expense Ratio (b) | | | Net Expense Ratio (b) | | | Inception Date | |
| Alternative | | | | | | | | | | | | | | | | | | | | | | | | | | | | | | | | | | | | |
ASTON/Anchor Capital Enhanced Equity Fund | | | N | | | | 0.54 | | | | -4.59 | | | | 3.38 | | | | NA | | | | 3.58 | | | | 1.19 | % | | | 1.19 | % | | | 01/15/08 | |
| | | I | | | | 0.68 | | | | -4.33 | | | | 3.64 | | | | NA | | | | 5.01 | | | | 0.94 | | | | 0.94 | | | | 03/03/10 | |
| | | | | | | | | |
ASTON/Lake Partners LASSO Alternatives Fund (c) | | | N | | | | -1.59 | | | | -4.58 | | | | 1.27 | | | | NA | | | | 2.91 | | | | 3.21 | | | | 3.18 | | | | 03/03/10 | |
| | | I | | | | -1.50 | | | | -4.34 | | | | 1.51 | | | | NA | | | | 4.94 | | | | 2.96 | | | | 2.93 | | | | 04/01/09 | |
| | | | | | | | | |
ASTON/River Road Long-Short Fund (c) | | | N | | | | -1.60 | | | | -2.11 | | | | NA | | | | NA | | | | 4.61 | | | | 2.93 | | | | 2.93 | | | | 05/04/11 | |
| | | I | | | | -1.50 | | | | -1.92 | | | | NA | | | | NA | | | | 2.82 | | | | 2.68 | | | | 2.68 | | | | 03/04/13 | |
| | | | | | | | | |
| International | | | | | | | | | | | | | | | | | | | | | | | | | | | | | | | | | | | | |
ASTON/Barings International Fund (c) | | | N | | | | -4.06 | | | | -7.49 | | | | 0.69 | | | | NA | | | | 3.96 | | | | 2.11 | | | | 1.40 | | | | 03/03/10 | |
| | | I | | | | -3.95 | | | | -7.23 | | | | 0.96 | | | | NA | | | | -2.04 | | | | 1.86 | | | | 1.15 | | | | 11/02/07 | |
| | | | | | | | | |
ASTON/Guardian Capital Global Dividend Fund (c) | | | N | | | | -1.31 | | | | -3.88 | | | | NA | | | | NA | | | | 2.35 | | | | 3.55 | | | | 1.30 | | | | 04/14/14 | |
| | | I | | | | -1.10 | | | | -3.50 | | | | NA | | | | NA | | | | 2.59 | | | | 3.30 | | | | 1.05 | | | | 04/14/14 | |
| | | | | | | | | |
ASTON/LMCG Emerging Markets Fund (c) | | | N | | | | -2.83 | | | | -21.87 | | | | NA | | | | NA | | | | -7.65 | | | | 6.31 | | | | 1.47 | | | | 03/28/13 | |
| | | I | | | | -2.67 | | | | -21.68 | | | | NA | | | | NA | | | | -7.35 | | | | 6.06 | | | | 1.22 | | | | 03/28/13 | |
| | | | | | | | | |
ASTON/Pictet International Fund (c) | | | N | | | | 0.15 | | | | -3.87 | | | | NA | | | | NA | | | | -1.79 | | | | 1.82 | | | | 1.40 | | | | 04/14/14 | |
| | | I | | | | 0.20 | | | | -3.62 | | | | NA | | | | NA | | | | -1.48 | | | | 1.57 | | | | 1.15 | | | | 04/14/14 | |
| | | | | | | | | |
ASTON/Value Partners Asia Dividend Fund (c) | | | N | | | | NA | | | | NA | | | | NA | | | | NA | | | | 1.50 | (d) | | | 3.74 | | | | 1.41 | | | | 12/16/15 | |
| | | I | | | | NA | | | | NA | | | | NA | | | | NA | | | | 1.50 | (d) | | | 3.49 | | | | 1.16 | | | | 12/16/15 | |
| | | | | | | | | |
| Sector | | | | | | | | | | | | | | | | | | | | | | | | | | | | | | | | | | | | |
ASTON/Harrison Street Real Estate Fund (c) | | | N | | | | 5.48 | | | | 8.63 | | | | 8.37 | | | | 5.18 | | | | 8.64 | | | | 2.20 | | | | 1.37 | | | | 12/30/97 | |
| | | I | | | | 5.60 | | | | 8.85 | | | | 8.63 | | | | 5.43 | | | | 6.35 | | | | 1.95 | | | | 1.12 | | | | 09/20/05 | |
| | | | | | | | | |
| Balanced | | | | | | | | | | | | | | | | | | | | | | | | | | | | | | | | | | | | |
ASTON/Montag & Caldwell Balanced Fund (c) | | | N | | | | -0.38 | | | | 2.87 | | | | 6.48 | | | | 5.96 | | | | 7.43 | | | | 1.60 | | | | 1.36 | | | | 11/02/94 | |
| | | I | | | | -0.33 | | | | 2.97 | | | | 6.61 | | | | 6.12 | | | | 4.26 | | | | 1.35 | | | | 1.11 | | | | 12/31/98 | |
The performance data quoted represents past performance. Past performance does not guarantee future results. Investment return and principal value will fluctuate so that an investor’s shares, upon redemption may be worth more or less than their original cost. Current performance may be lower or higher than the performance data quoted. For performance data current to the most recent month-end, please visit our website at www.astonfunds.com.
Performance figures do not reflect the deduction of taxes that a shareholder would pay on Fund distributions or redemptions of Fund shares.
| (b) | | The expense ratios presented above may vary from the expense ratios presented in other sections of this report that are based on expenses incurred during the period covered by this report. |
| (c) | | Certain expenses were subsidized or recouped. If these subsidies or recoupment were not in effect, the returns would have been lower or higher, respectively. The Adviser is contractually obligated to waive management fees and/or reimburse expenses through February 28, 2017. |
| (d) | | Returns are cumulative since inception and are not annualized. |
The stocks of small- and mid-cap companies may be subject to a higher degree of market risk because they tend to be more volatile and less liquid. Bond and balanced funds have the same interest rate, high yield, and credit risks associated with the underlying bonds in the portfolio, all of which could reduce a fund’s value. By selling covered call options, a fund limits its opportunity to profit from an increase in the price of the underlying stock above the exercise price, but continues to bear the risk of a decline in the stock. Sector funds may be subject to a higher degree of market risk because of concentration in a specific industry sector. International investing may include the risk of social and political instability, market illiquidity and currency volatility. Emerging markets securities tend to be more volatile and less liquid than securities traded in developed countries. Hedged mutual funds may use derivative instruments, short selling, leveraging and investing in commodities, commodity-linked instruments and non-U.S. companies that involve significant risks.
| | |
| |
| ASTON/Cornerstone Large Cap Value Fund | | April 30, 2016 |
| |
| Schedule of Investments (unaudited) | | |
| | | | | | | | |
Shares | | | | | Market
Value | |
| |
| | COMMON STOCKS – 96.56% | | | | |
| | |
| | | | Consumer Discretionary – 14.06% | | | | |
| | 62,875 | | | BorgWarner | | $ | 2,258,470 | |
| | 20,200 | | | Dollar General | | | 1,654,582 | |
| | 88,475 | | | Gap | | | 2,050,850 | |
| | 71,500 | | | Magna International (Canada) | | | 3,004,430 | |
| | 37,325 | | | VF | | | 2,353,341 | |
| | | | | | | | |
| | | | | | | 11,321,673 | |
| | | | | | | | |
| | |
| | | | Energy – 7.54% | | | | |
| | 31,375 | | | Chevron | | | 3,205,898 | |
| | 83,775 | | | Ensco, Class A (United Kingdom) | | | 1,001,949 | |
| | 35,275 | | | Royal Dutch Shell, Class A SP ADR | | | 1,865,695 | |
| | | | | | | | |
| | | | | | | 6,073,542 | |
| | | | | | | | |
| | |
| | | | Financials – 29.89% | | | | |
| | 21,725 | | | Chubb (Switzerland) | | | 2,560,509 | |
| | 27,025 | | | American Express | | | 1,768,246 | |
| | 44,150 | | | Capital One Financial | | | 3,196,019 | |
| | 63,250 | | | Citigroup | | | 2,927,210 | |
| | 59,050 | | | JPMorgan Chase | | | 3,731,960 | |
| | 45,450 | | | Lincoln National | | | 1,974,802 | |
| | 31,450 | | | PNC Financial Services Group | | | 2,760,681 | |
| | 38,475 | | | State Street | | | 2,396,992 | |
| | 64,750 | | | U.S. Bancorp | | | 2,764,177 | |
| | | | | | | | |
| | | | | | | 24,080,596 | |
| | | | | | | | |
| | |
| | | | Healthcare – 4.93% | | | | |
| | 35,450 | | | Johnson & Johnson | | | 3,973,236 | |
| | | | | | | | |
| | |
| | | | Industrials – 19.72% | | | | |
| | 20,800 | | | Boeing | | | 2,803,840 | |
| | 25,500 | | | Cummins | | | 2,984,265 | |
| | 29,050 | | | Honeywell International | | | 3,319,543 | |
| | 25,100 | | | Norfolk Southern | | | 2,261,761 | |
| | | | | | | | |
Shares | | | | | Market
Value | |
| | |
| | | | Industrials (continued) | | | | |
| | 21,175 | | | Parker-Hannifin | | $ | 2,456,723 | |
| | 8,780 | | | WW Grainger | | | 2,059,086 | |
| | | | | | | | |
| | | | | | | 15,885,218 | |
| | | | | | | | |
| | |
| | | | Information Technology – 20.42% | | | | |
| | 4,430 | | | Alphabet, Class A * | | | 3,135,908 | |
| | 19,048 | | | Apple | | | 1,785,560 | |
| | 126,275 | | | Cisco Systems | | | 3,471,300 | |
| | 68,925 | | | Microsoft | | | 3,437,290 | |
| | 88,725 | | | Oracle | | | 3,536,578 | |
| | 26,475 | | | Western Digital | | | 1,081,901 | |
| | | | | | | | |
| | | | | | | 16,448,537 | |
| | | | | | | | |
| | |
| | | | Total Common Stocks
(Cost $84,513,312) | | | 77,782,802 | |
| | | | | | | | |
| |
| | INVESTMENT COMPANY – 3.89% | | | | |
| | |
| | 3,135,184 | �� | | BlackRock Liquidity Funds TempFund Portfolio | | | 3,135,184 | |
| | | | | | | | |
| | |
| | | | Total Investment Company
(Cost $3,135,184) | | | 3,135,184 | |
| | | | | | | | |
| Total Investments – 100.45%
(Cost $87,648,496)** | | | 80,917,986 | |
| | | | | | | | |
| Net Other Assets and Liabilities – (0.45)% | | | (360,400 | ) |
| | | | | | | | |
| Net Assets – 100.00% | | $ | 80,557,586 | |
| | | | | | | | |
| * | | Non-income producing security. |
| ** | | At April 30, 2016, the aggregate cost for Federal income tax purposes approximates the aggregate cost for book purposes. The aggregate gross unrealized appreciation and depreciation were as follows: |
| | | | |
Gross unrealized appreciation | | $ | 2,289,277 | |
Gross unrealized depreciation | | | (9,019,787 | ) |
| | | | |
Net unrealized depreciation | | $ | (6,730,510 | ) |
| | | | |
| SP ADR | | Sponsored American Depositary Receipt |
See accompanying Notes to Financial Statements.
| | |
| |
| ASTON/Fairpointe Focused Equity Fund | | April 30, 2016 |
| |
| Schedule of Investments (unaudited) | | |
| | | | | | | | |
Shares | | | | | Market
Value | |
| |
| | COMMON STOCKS – 98.98% | | | | |
| | |
| | | | Consumer Discretionary – 24.69% | | | | |
| | 11,000 | | | 21st Century Fox, Class A | | $ | 332,860 | |
| | 4,100 | | | Carnival | | | 201,105 | |
| | 11,800 | | | Discovery Communications, Class C * | | | 316,004 | |
| | 3,200 | | | Interpublic Group | | | 73,408 | |
| | 4,700 | | | Liberty Interactive, Class A * | | | 123,140 | |
| | 17,900 | | | News, Class A | | | 222,318 | |
| | 5,700 | | | Scholastic | | | 207,366 | |
| | 15,800 | | | Staples | | | 161,160 | |
| | | | | | | | |
| | | | | | | 1,637,361 | |
| | | | | | | | |
| | |
| | | | Consumer Staples – 10.04% | | | | |
| | 2,300 | | | PepsiCo | | | 236,808 | |
| | 4,200 | | | Unilever, SP ADR (Great Britain) | | | 188,412 | |
| | 3,600 | | | Wal-Mart Stores | | | 240,732 | |
| | | | | | | | |
| | | | | | | 665,952 | |
| | | | | | | | |
| | |
| | | | Energy – 11.54% | | | | |
| | 3,600 | | | Apache | | | 195,840 | |
| | 2,800 | | | Baker Hughes | | | 135,408 | |
| | 8,500 | | | BP, SP ADR (Great Britain) | | | 285,430 | |
| | 13,400 | | | Transocean (Switzerland) | | | 148,472 | |
| | | | | | | | |
| | | | | | | 765,150 | |
| | | | | | | | |
| | |
| | | | Financials – 7.75% | | | | |
| | 6,700 | | | Legg Mason | | | 215,137 | |
| | 4,200 | | | Northern Trust | | | 298,536 | |
| | | | | | | | |
| | | | | | | 513,673 | |
| | | | | | | | |
| | |
| | | | Healthcare – 7.40% | | | | |
| | 4,600 | | | Boston Scientific * | | | 100,832 | |
| | 4,600 | | | Hologic * | | | 154,514 | |
| | 2,900 | | | Varian Medical Systems * | | | 235,422 | |
| | | | | | | | |
| | | | | | | 490,768 | |
| | | | | | | | |
| | | | | | | | |
Shares | | | | | Market
Value | |
| | |
| | | | Industrials – 9.94% | | | | |
| | 3,200 | | | AGCO | | $ | 171,104 | |
| | 3,800 | | | Fluor | | | 207,708 | |
| | 12,000 | | | Kennametal | | | 280,560 | |
| | | | | | | | |
| | | | | | | 659,372 | |
| | | | | | | | |
| | |
| | | | Information Technology – 20.28% | | | | |
| | 8,400 | | | Cisco Systems | | | 230,916 | |
| | 9,300 | | | Cree * | | | 227,943 | |
| | 4,100 | | | EMC | | | 107,051 | |
| | 17,900 | | | Hewlett Packard Enterprise | | | 298,214 | |
| | 21,000 | | | HP | | | 257,670 | |
| | 8,800 | | | Teradata * | | | 222,640 | |
| | | | | | | | |
| | | | | | | 1,344,434 | |
| | | | | | | | |
| | |
| | | | Materials – 7.34% | | | | |
| | 5,800 | | | FMC | | | 250,908 | |
| | 6,800 | | | Greif, Class A | | | 235,960 | |
| | | | | | | | |
| | | | | | | 486,868 | |
| | | | | | | | |
| | |
| | | | Total Common Stocks
(Cost $6,848,146) | | | 6,563,578 | |
| | | | | | | | |
| |
| | INVESTMENT COMPANY – 2.34% | | | | |
| | |
| | 155,179 | | | BlackRock Liquidity Funds TempFund Portfolio | | | 155,179 | |
| | | | | | | | |
| | |
| | | | Total Investment Company
(Cost $155,179) | | | 155,179 | |
| | | | | | | | |
| Total Investments – 101.32%
(Cost $7,003,325)** | | | 6,718,757 | |
| | | | | | | | |
| Net Other Assets and Liabilities – (1.32)% | | | (87,473 | ) |
| | | | | | | | |
| Net Assets – 100.00% | | $ | 6,631,284 | |
| | | | | | | | |
| * | | Non-income producing security. |
| ** | | At April 30, 2016, the aggregate cost for Federal income tax purposes approximates the aggregate cost for book purposes. The aggregate gross unrealized appreciation and depreciation were as follows: |
| | | | |
Gross unrealized appreciation | | $ | 286,061 | |
Gross unrealized depreciation | | | (570,629 | ) |
| | | | |
Net unrealized depreciation | | $ | (284,568 | ) |
| | | | |
| SP ADR | | Sponsored American Depositary Receipt |
See accompanying Notes to Financial Statements.
| | |
| |
| ASTON/River Road Focused Absolute Value Fund | | April 30, 2016 |
| |
| Schedule of Investments (unaudited) | | |
| | | | | | | | |
Shares | | | | | Market
Value | |
| |
| | COMMON STOCKS – 84.64% | | | | |
| | |
| | | | Consumer Discretionary – 20.70% | | | | |
| | 4,967 | | | Comcast, Class A | | $ | 301,795 | |
| | 5,103 | | | Kohl’s | | | 226,063 | |
| | 4,438 | | | Liberty Broadband, Class C * | | | 254,075 | |
| | 6,369 | | | Liberty Ventures, Class A * | | | 254,760 | |
| | 2,779 | | | Omnicom Group | | | 230,574 | |
| | 2,784 | | | Ralph Lauren | | | 259,497 | |
| | 5,398 | | | Time Warner | | | 405,606 | |
| | | | | | | | |
| | | | | | | 1,932,370 | |
| | | | | | | | |
| | |
| | | | Consumer Staples – 2.91% | | | | |
| | 7,531 | | | Ingles Markets, Class A | | | 271,643 | |
| | | | | | | | |
| | |
| | | | Energy – 2.41% | | | | |
| | 6,977 | | | PBF Energy, Class A | | | 224,520 | |
| | | | | | | | |
| | |
| | | | Financials – 30.44% | | | | |
| | 7,695 | | | Allied World Assurance Co Holdings AG (Switzerland) | | | 273,788 | |
| | 4,611 | | | Berkshire Hathaway, Class B * | | | 670,808 | |
| | 10,567 | | | Communications Sales & Leasing, REIT | | | 245,471 | |
| | 26,955 | | | FNFV Group * | | | 290,305 | |
| | 9,457 | | | Iron Mountain, REIT | | | 345,464 | |
| | 7,043 | | | Oaktree Capital Group MLP | | | 340,247 | |
| | 7,901 | | | U.S. Bancorp | | | 337,294 | |
| | 6,767 | | | Wells Fargo | | | 338,215 | |
| | | | | | | | |
| | | | | | | 2,841,592 | |
| | | | | | | | |
| | |
| | | | Industrials – 19.46% | | | | |
| | 7,718 | | | Cubic | | | 320,837 | |
| | 3,981 | | | Emerson Electric | | | 217,482 | |
| | 12,400 | | | SP Plus * | | | 276,272 | |
| | 3,313 | | | UniFirst | | | 359,063 | |
| | 4,100 | | | Union Pacific | | | 357,643 | |
| | 9,565 | | | Viad | | | 284,559 | |
| | | | | | | | |
| | | | | | | 1,815,856 | |
| | | | | | | | |
| | | | | | | | |
Shares | | | | | Market
Value | |
| | |
| | | | Information Technology – 5.37% | | | | |
| | 7,301 | | | Blackhawk Network Holdings * | | $ | 234,581 | |
| | 11,669 | | | Rackspace Hosting * | | | 266,870 | |
| | | | | | | | |
| | | | | | | 501,451 | |
| | | | | | | | |
| | |
| | | | Materials – 3.35% | | | | |
| | 2,662 | | | Praxair | | | 312,679 | |
| | | | | | | | |
| | |
| | | | Total Common Stocks
(Cost $7,529,034) | | | 7,900,111 | |
| | | | | | | | |
| |
| | INVESTMENT COMPANY – 0.79% | | | | |
| | |
| | 73,813 | | | BlackRock Liquidity Funds TempFund Portfolio | | | 73,813 | |
| | | | | | | | |
| | |
| | | | Total Investment Company
(Cost $73,813) | | | 73,813 | |
| | | | | | | | |
| Total Investments – 85.43%
(Cost $7,602,847)** | | | 7,973,924 | |
| | | | | | | | |
| Net Other Assets and Liabilities – 14.57% | | | 1,359,770 | |
| | | | | | | | |
| Net Assets – 100.00% | | $ | 9,333,694 | |
| | | | | | | | |
| * | | Non-income producing security. |
| ** | | At April 30, 2016, the aggregate cost for Federal income tax purposes approximates the aggregate cost for book purposes. The aggregate gross unrealized appreciation and depreciation were as follows: |
| | | | |
Gross unrealized appreciation | | $ | 486,795 | |
Gross unrealized depreciation | | | (115,718 | ) |
| | | | |
Net unrealized appreciation | | $ | 371,077 | |
| | | | |
| MLP | | Master Limited Partnership |
| REIT | | Real Estate Investment Trust |
See accompanying Notes to Financial Statements.
| | |
| |
| ASTON/Herndon Large Cap Value Fund | | April 30, 2016 |
| |
| Schedule of Investments (unaudited) | | |
| | | | | | | | |
Shares | | | | | Market
Value | |
|
| | COMMON STOCKS – 95.68% | |
| | | | Consumer Discretionary – 5.79% | | | | |
| | 12,181 | | | Ross Stores | | $ | 691,637 | |
| | 46,691 | | | TJX | | | 3,540,112 | |
| | 11,504 | | | Yum! Brands | | | 915,258 | |
| | | | | | | | |
| | | | | | | 5,147,007 | |
| | | | | | | | |
| | | | Consumer Staples – 8.58% | | | | |
| | 56,164 | | | Altria Group | | | 3,522,044 | |
| | 14,887 | | | Campbell Soup | | | 918,677 | |
| | 32,481 | | | Philip Morris International | | | 3,187,036 | |
| | | | | | | | |
| | | | | | | 7,627,757 | |
| | | | | | | | |
| | | | Energy – 13.20% | | | | |
| | 56,615 | | | Devon Energy | | | 1,963,408 | |
| | 60,901 | | | Marathon Petroleum | | | 2,380,011 | |
| | 119,771 | | | Noble (United Kingdom) | | | 1,345,028 | |
| | 43,307 | | | Oceaneering International | | | 1,587,202 | |
| | 25,939 | | | Tesoro | | | 2,067,079 | |
| | 40,601 | | | Valero Energy | | | 2,390,181 | |
| | | | | | | | |
| | | | | | | 11,732,909 | |
| | | | | | | | |
| | | | Financials – 23.55% | | | | |
| | 37,217 | | | American Express | | | 2,435,108 | |
| | 50,525 | | | CBOE Holdings | | | 3,130,529 | |
| | 32,255 | | | CBRE Group, Class A * | | | 955,716 | |
| | 41,954 | | | Discover Financial Services | | | 2,360,752 | |
| | 57,968 | | | Eaton Vance | | | 2,001,635 | |
| | 32,706 | | | Federated Investors, Class B | | | 1,033,510 | |
| | 46,239 | | | Franklin Resources | | | 1,726,564 | |
| | 22,331 | | | Moody’s | | | 2,137,523 | |
| | 30,225 | | | S&P Global | | | 923,978 | |
| | 25,263 | | | Synchrony Financial * | | | 2,699,352 | |
| | 75,336 | | | Waddell & Reed Financial, Class A | | | 1,532,334 | |
| | | | | | | | |
| | | | | | | 20,937,001 | |
| | | | | | | | |
| | | | | | | | |
Shares | | | | | Market
Value | |
| | | | Healthcare – 7.57% | | | | |
| | 45,112 | | | AbbVie | | $ | 2,751,832 | |
| | 18,722 | | | Gilead Sciences | | | 1,651,468 | |
| | 5,639 | | | Jazz Pharmaceuticals (Ireland) * | | | 849,797 | |
| | 35,413 | | | Mylan (Netherlands) * | | | 1,477,076 | |
| | | | | | | | |
| | | | | | | 6,730,173 | |
| | | | | | | | |
| | | | Industrials – 10.17% | | | | |
| | 13,083 | | | Lockheed Martin | | | 3,040,227 | |
| | 22,782 | | | Rockwell Collins | | | 2,009,145 | |
| | 28,646 | | | United Parcel Service, Class B | | | 3,009,835 | |
| | 14,662 | | | United Rentals * | | | 981,328 | |
| | | | | | | | |
| | | | | | | 9,040,535 | |
| | | | | | | | |
| | | | Information Technology – 18.80% | | | | |
| | 18,271 | | | Accenture, Class A (Ireland) | | | 2,063,161 | |
| | 6,091 | | | Alliance Data Systems * | | | 1,238,361 | |
| | 25,714 | | | Apple | | | 2,410,430 | |
| | 24,361 | | | Harris | | | 1,949,124 | |
| | 143,003 | | | Hewlett-Packard Enterprise | | | 2,382,430 | |
| | 31,353 | | | HP | | | 384,701 | |
| | 19,849 | | | MasterCard, Class A | | | 1,925,154 | |
| | 47,593 | | | Western Digital | | | 1,944,888 | |
| | 121,124 | | | Western Union | | | 2,422,480 | |
| | | | | | | | |
| | | | | | | 16,720,729 | |
| | | | | | | | |
| | | | Materials – 6.00% | | | | |
| | 37,443 | | | CF Industries Holdings | | | 1,238,240 | |
| | 23,007 | | | LyondellBasell Industries, Class A (Netherlands) | | | 1,901,989 | |
| | 5,414 | | | NewMarket | | | 2,198,409 | |
| | | | | | | | |
| | | | | | | 5,338,638 | |
| | | | | | | | |
| | | | Utilities – 2.02% | | | | |
| | 161,273 | | | AES | | | 1,799,807 | |
| | | | | | | | |
| | |
| | | | Total Common Stocks
(Cost $79,048,246) | | | 85,074,556 | |
| | | | | | | | |
|
| | INVESTMENT COMPANY – 1.61% | |
| | |
| | 1,429,586 | | | BlackRock Liquidity Funds TempFund Portfolio | | | 1,429,586 | |
| | | | | | | | |
| | |
| | | | Total Investment Company
(Cost $1,429,586) | | | 1,429,586 | |
| | | | | | | | |
| Total Investments – 97.29%
(Cost $80,477,832)** | | | 86,504,142 | |
| | | | | | | | |
| Net Other Assets and Liabilities – 2.71% | | | 2,411,983 | |
| | | | | | | | |
| Net Assets – 100.00% | | $ | 88,916,125 | |
| | | | | | | | |
| * | | Non-income producing security. |
| ** | | At April 30, 2016, the aggregate cost for Federal income tax purposes approximates the aggregate cost for book purposes. The aggregate gross unrealized appreciation and depreciation were as follows: |
| | | | |
Gross unrealized appreciation | | $ | 11,425,540 | |
Gross unrealized depreciation | | | (5,399,230 | ) |
| | | | |
Net unrealized appreciation | | $ | 6,026,310 | |
| | | | |
See accompanying Notes to Financial Statements.
| | |
| |
| ASTON/Montag & Caldwell Growth Fund | | April 30, 2016 |
| |
| Schedule of Investments (unaudited) | | |
| | | | | | | | |
Shares | | | | | Market
Value | |
| |
| | COMMON STOCKS – 95.26% | | | | |
| | |
| | | | Consumer Discretionary – 14.88% | | | | |
| | 853,000 | | | Carnival | | $ | 41,839,650 | |
| | 397,900 | | | Dollar General | | | 32,591,989 | |
| | 622,900 | | | Dollar Tree * | | | 49,651,359 | |
| | 185,000 | | | NIKE, Class B | | | 10,903,900 | |
| | 24,696 | | | Priceline.com * | | | 33,183,028 | |
| | 408,700 | | | Starbucks | | | 22,981,201 | |
| | 640,000 | | | TJX | | | 48,524,800 | |
| | | | | | | | |
| | | | | | | 239,675,927 | |
| | | | | | | | |
| | |
| | | | Consumer Staples – 26.10% | | | | |
| | 537,700 | | | Colgate-Palmolive | | | 38,133,684 | |
| | 145,000 | | | Costco Wholesale | | | 21,478,850 | |
| | 413,700 | | | CVS Health | | | 41,576,850 | |
| | 370,000 | | | Estee Lauder, Class A | | | 35,471,900 | |
| | 600,000 | | | Kraft Heinz | | | 46,842,000 | |
| | 1,623,100 | | | Mondelez International, Class A | | | 69,728,376 | |
| | 183,100 | | | Monster Beverage * | | | 26,406,682 | |
| | 752,000 | | | PepsiCo | | | 77,425,920 | |
| | 800,000 | | | Walgreens Boots Alliance | | | 63,424,000 | |
| | | | | | | | |
| | | | | | | 420,488,262 | |
| | | | | | | | |
| | |
| | | | Energy – 0.95% | | | | |
| | 200,000 | | | Occidental Petroleum | | | 15,330,000 | |
| | | | | | | | |
| | |
| | | | Financials – 1.53% | | | | |
| | 494,700 | | | Wells Fargo | | | 24,725,106 | |
| | | | | | | | |
| | |
| | | | Healthcare – 18.37% | | | | |
| | 910,800 | | | Abbott Laboratories | | | 35,430,120 | |
| | 183,477 | | | Allergan (Ireland) * | | | 39,733,779 | |
| | 205,700 | | | AmerisourceBergen | | | 17,505,070 | |
| | 241,800 | | | Amgen | | | 38,276,940 | |
| | 368,000 | | | Celgene * | | | 38,054,880 | |
| | | | | | | | |
Shares | | | | | Market
Value | |
| | |
| | | | Healthcare (continued) | | | | |
| | 323,600 | | | Gilead Sciences | | $ | 28,544,756 | |
| | 624,800 | | | Medtronic (Ireland) | | | 49,452,920 | |
| | 340,000 | | | Thermo Fisher Scientific | | | 49,045,000 | |
| | | | | | | | |
| | | | | | | 296,043,465 | |
| | | | | | | | |
| | |
| | | | Industrials – 7.78% | | | | |
| | 510,000 | | | Honeywell International | | | 58,277,700 | |
| | 638,000 | | | United Parcel Service, Class B | | | 67,034,660 | |
| | | | | | | | |
| | | | | | | 125,312,360 | |
| | | | | | | | |
| |
| | | | Information Technology – 25.65% | |
| | 410,000 | | | Accenture, Class A (Ireland) | | | 46,297,200 | |
| | 103,000 | | | Alphabet, Class A * | | | 72,911,640 | |
| | 223,500 | | | Apple | | | 20,950,890 | |
| | 615,000 | | | Cognizant Technology Solutions, Class A * | | | 35,897,550 | |
| | 530,000 | | | Facebook, Class A * | | | 62,317,400 | |
| | 225,000 | | | MasterCard, Class A | | | 21,822,750 | |
| | 370,000 | | | Microsoft | | | 18,451,900 | |
| | 925,000 | | | PayPal Holdings * | | | 36,241,500 | |
| | 654,100 | | | QUALCOMM | | | 33,045,132 | |
| | 845,000 | | | Visa, Class A | | | 65,267,800 | |
| | | | | | | | |
| | | | | | | 413,203,762 | |
| | | | | | | | |
| | |
| | | | Total Common Stocks
(Cost $1,368,181,927) | | | 1,534,778,882 | |
| | | | | | | | |
|
| | INVESTMENT COMPANY – 4.66% | |
| | |
| | 75,125,875 | | | BlackRock Liquidity Funds TempFund Portfolio | | | 75,125,875 | |
| | | | | | | | |
| | |
| | | | Total Investment Company
(Cost $75,125,875) | | | 75,125,875 | |
| | | | | | | | |
| Total Investments – 99.92%
(Cost $1,443,307,802)** | | | 1,609,904,757 | |
| | | | | | | | |
| Net Other Assets and Liabilities – 0.08% | | | 1,317,484 | |
| | | | | | | | |
| Net Assets – 100.00% | | $ | 1,611,222,241 | |
| | | | | | | | |
| * | | Non-income producing security. |
| ** | | At April 30, 2016, the aggregate cost for Federal income tax purposes approximates the aggregate cost for book purposes. The aggregate gross unrealized appreciation and depreciation were as follows: |
| | | | |
Gross unrealized appreciation | | $ | 198,652,479 | |
Gross unrealized depreciation | | | (32,055,524 | ) |
| | | | |
Net unrealized appreciation | | $ | 166,596,955 | |
| | | | |
See accompanying Notes to Financial Statements.
| | |
| |
| ASTON/River Road Dividend All Cap Value Fund | | April 30, 2016 |
| |
| Schedule of Investments (unaudited) | | |
| | | | | | | | |
Shares | | | | | Market
Value | |
|
| | COMMON STOCKS – 98.24% | |
| | |
| | | | Consumer Discretionary – 11.69% | | | | |
| | 353,830 | | | Cinemark Holdings | | $ | 12,260,209 | |
| | 317,233 | | | Ford Motor | | | 4,301,679 | |
| | 171,956 | | | Kohl’s | | | 7,617,651 | |
| | 364,011 | | | National CineMedia | | | 5,168,956 | |
| | 222,320 | | | Omnicom Group | | | 18,445,890 | |
| | 165,156 | | | Target | | | 13,129,902 | |
| | 308,835 | | | Thomson Reuters (Canada) | | | 12,702,384 | |
| | 124,479 | | | Time Warner | | | 9,353,352 | |
| | | | | | | | |
| | | | | | | 82,980,023 | |
| | | | | | | | |
| | |
| | | | Consumer Staples – 6.98% | | | | |
| | 51,944 | | | Kimberly-Clark | | | 6,502,869 | |
| | 111,250 | | | Molson Coors Brewing, Class B | | | 10,638,838 | |
| | 81,080 | | | PepsiCo | | | 8,347,997 | |
| | 244,152 | | | Unilever, SP ADR (Great Britain) | | | 10,952,659 | |
| | 196,359 | | | Wal-Mart Stores | | | 13,130,526 | |
| | | | | | | | |
| | | | | | | 49,572,889 | |
| | | | | | | | |
| | |
| | | | Energy – 8.77% | | | | |
| | 81,308 | | | Chevron | | | 8,308,051 | |
| | 136,135 | | | Exxon Mobil | | | 12,034,334 | |
| | 139,858 | | | Magellan Midstream Partners LP | | | 10,079,566 | |
| | 192,855 | | | Occidental Petroleum | | | 14,782,336 | |
| | 189,227 | | | Spectra Energy Partners LP | | | 9,542,718 | |
| | 183,299 | | | TransMontaigne Partners LP | | | 7,496,929 | |
| | | | | | | | |
| | | | | | | 62,243,934 | |
| | | | | | | | |
| | |
| | | | Financials – 24.65% | | | | |
| | 201,665 | | | Allied World Assurance Co Holdings AG (Switzerland) | | | 7,175,241 | |
| | 415,062 | | | BB&T | | | 14,684,894 | |
| | 108,935 | | | CME Group | | | 10,012,216 | |
| | 138,841 | | | CNA Financial | | | 4,387,376 | |
| | | | | | | | |
Shares | | | | | Market
Value | |
| | |
| | | | Financials (continued) | | | | |
| | 142,120 | | | Communications Sales & Leasing, REIT | | $ | 3,301,448 | |
| | 220,633 | | | Compass Diversified Holdings | | | 3,547,779 | |
| | 368,683 | | | GEO Group, REIT | | | 11,808,916 | |
| | 607,095 | | | Iron Mountain, REIT | | | 22,177,167 | |
| | 227,316 | | | PNC Financial Services Group | | | 19,953,798 | |
| | 341,564 | | | Sabra Health Care, REIT | | | 7,203,585 | |
| | 135,257 | | | Stock Yards Bancorp | | | 5,469,793 | |
| | 425,458 | | | U.S. Bancorp | | | 18,162,802 | |
| | 200,720 | | | Ventas, REIT | | | 12,468,726 | |
| | 63,637 | | | Washington Trust Bancorp | | | 2,331,023 | |
| | 347,682 | | | Wells Fargo | | | 17,377,146 | |
| | 144,432 | | | WesBanco | | | 4,640,600 | |
| | 321,496 | | | Weyerhaeuser, REIT | | | 10,326,452 | |
| | | | | | | | |
| | | | | | | 175,028,962 | |
| | | | | | | | |
| | |
| | | | Healthcare – 5.20% | | | | |
| | 66,910 | | | Amgen | | | 10,591,853 | |
| | 277,035 | | | Owens & Minor | | | 10,081,304 | |
| | 215,761 | | | Quest Diagnostics | | | 16,218,754 | |
| | | | | | | | |
| | | | | | | 36,891,911 | |
| | | | | | | | |
| | |
| | | | Industrials – 13.93% | | | | |
| | 222,718 | | | ADT | | | 9,349,702 | |
| | 457,350 | | | Aircastle (Bermuda) | | | 9,924,495 | |
| | 211,305 | | | Emerson Electric | | | 11,543,592 | |
| | 377,531 | | | Fastenal | | | 17,664,675 | |
| | 113,484 | | | MSC Industrial Direct, Class A | | | 8,795,010 | |
| | 74,097 | | | Parker-Hannifin | | | 8,596,734 | |
| | 145,937 | | | Republic Services | | | 6,869,255 | |
| | 134,434 | | | Union Pacific | | | 11,726,678 | |
| | 137,724 | | | United Parcel Service, Class B | | | 14,470,661 | |
| | | | | | | | |
| | | | | | | 98,940,802 | |
| | | | | | | | |
| | |
| | | | Information Technology – 14.06% | | | | |
| | 679,124 | | | Corning | | | 12,679,245 | |
| | 145,332 | | | CSG Systems International | | | 6,449,834 | |
| | 538,737 | | | Intel | | | 16,312,956 | |
| | 506,445 | | | Microsoft | | | 25,256,412 | |
| | 242,931 | | | Motorola Solutions | | | 18,265,982 | |
| | 141,368 | | | QUALCOMM | | | 7,141,911 | |
| | 685,811 | | | Western Union | | | 13,716,220 | |
| | | | | | | | |
| | | | | | | 99,822,560 | |
| | | | | | | | |
| | |
| | | | Materials – 4.64% | | | | |
| | 135,292 | | | Bemis | | | 6,788,953 | |
| | 151,062 | | | Compass Minerals International | | | 11,323,608 | |
| | 126,519 | | | Praxair | | | 14,860,922 | |
| | | | | | | | |
| | | | | | | 32,973,483 | |
| | | | | | | | |
| | |
| | | | Telecommunication Services – 3.15% | | | | |
| | 39,449 | | | Atlantic Tele-Network | | | 2,836,778 | |
| | 383,115 | | | Verizon Communications | | | 19,515,878 | |
| | | | | | | | |
| | | | | | | 22,352,656 | |
| | | | | | | | |
See accompanying Notes to Financial Statements.
| | |
| |
| ASTON/River Road Dividend All Cap Value Fund | | April 30, 2016 |
| |
| Schedule of Investments (unaudited) – continued | | |
| | | | | | | | |
Shares | | | | | Market
Value | |
| | |
| | | | Utilities – 5.17% | | | | |
| | 289,351 | | | AmeriGas Partners LP | | $ | 12,543,366 | |
| | 227,310 | | | National Fuel Gas | | | 12,615,705 | |
| | 236,770 | | | Vectren | | | 11,566,214 | |
| | | | | | | | |
| | | | 36,725,285 | |
| | | | | | | | |
| | |
| | | | Total Common Stocks
(Cost $561,315,218) | | | 697,532,505 | |
| | | | | | | | |
|
| | INVESTMENT COMPANY – 1.71% | |
| | |
| | 12,181,820 | | | BlackRock Liquidity Funds TempFund Portfolio | | | 12,181,820 | |
| | | | | | | | |
| | |
| | | | Total Investment Company
(Cost $12,181,820) | | | 12,181,820 | |
| | | | | | | | |
| Total Investments – 99.95%
(Cost $573,497,038)* | | | 709,714,325 | |
| | | | | | | | |
| Net Other Assets and Liabilities – 0.05% | | | 336,052 | |
| | | | | | | | |
| Net Assets – 100.00% | | $ | 710,050,377 | |
| | | | | | | | |
| * | | At April 30, 2016, the aggregate cost for Federal income tax purposes approximates the aggregate cost for book purposes. The aggregate gross unrealized appreciation and depreciation were as follows: |
| | | | |
Gross unrealized appreciation | | $ | 143,435,410 | |
Gross unrealized depreciation | | | (7,218,123 | ) |
| | | | |
Net unrealized appreciation | | $ | 136,217,287 | |
| | | | |
| REIT | | Real Estate Investment Trust |
| SP ADR | | Sponsored American Depositary Receipt |
See accompanying Notes to Financial Statements.
| | |
| |
| ASTON/River Road Dividend All Cap Value Fund II | | April 30, 2016 |
| |
| Schedule of Investments (unaudited) | | |
| | | | | | | | |
Shares | | | | | Market
Value | |
|
| | COMMON STOCKS – 97.34% | |
| | |
| | | | Consumer Discretionary – 11.78% | | | | |
| | 64,890 | | | Cinemark Holdings | | $ | 2,248,438 | |
| | 57,604 | | | Ford Motor | | | 781,110 | |
| | 30,983 | | | Kohl’s | | | 1,372,547 | |
| | 39,190 | | | Omnicom Group | | | 3,251,594 | |
| | 29,864 | | | Target | | | 2,374,188 | |
| | 53,835 | | | Thomson Reuters (Canada) | | | 2,214,234 | |
| | 22,820 | | | Time Warner | | | 1,714,695 | |
| | | | | | | | |
| | | | 13,956,806 | |
| | | | | | | | |
| | |
| | | | Consumer Staples – 7.56% | | | | |
| | 9,492 | | | Kimberly-Clark | | | 1,188,303 | |
| | 20,193 | | | Molson Coors Brewing, Class B | | | 1,931,057 | |
| | 14,190 | | | PepsiCo | | | 1,461,002 | |
| | 44,132 | | | Unilever, SP ADR (Great Britian) | | | 1,979,762 | |
| | 35,913 | | | Wal-Mart Stores | | | 2,401,502 | |
| | | | | | | | |
| | | | 8,961,626 | |
| | | | | | | | |
| | |
| | | | Energy – 8.36% | | | | |
| | 14,700 | | | Chevron | | | 1,502,046 | |
| | 24,129 | | | Exxon Mobil | | | 2,133,004 | |
| | 25,353 | | | Magellan Midstream Partners LP | | | 1,827,191 | |
| | 35,173 | | | Occidental Petroleum | | | 2,696,010 | |
| | 34,731 | | | Spectra Energy Partners LP | | | 1,751,484 | |
| | | | | | | | |
| | | | 9,909,735 | |
| | | | | | | | |
| | |
| | | | Financials – 22.63% | | | | |
| | 35,845 | | | Allied World Assurance Co Holdings AG (Switzerland) | | | 1,275,365 | |
| | 75,715 | | | BB&T | | | 2,678,797 | |
| | 19,148 | | | CME Group | | | 1,759,893 | |
| | 14,627 | | | CNA Financial | | | 462,213 | |
| | 25,859 | | | Communications Sales & Leasing, REIT | | | 600,705 | |
| | 61,024 | | | GEO Group, REIT | | | 1,954,599 | |
| | | | | | | | |
Shares | | | | | Market
Value | |
| | |
| | | | Financials (continued) | | | | |
| | 109,672 | | | Iron Mountain, REIT | | $ | 4,006,321 | |
| | 40,919 | | | PNC Financial Services Group | | | 3,591,870 | |
| | 76,370 | | | U.S. Bancorp | | | 3,260,235 | |
| | 36,148 | | | Ventas, REIT | | | 2,245,514 | |
| | 62,307 | | | Wells Fargo | | | 3,114,104 | |
| | 58,229 | | | Weyerhaeuser, REIT | | | 1,870,315 | |
| | | | | | | | |
| | | | 26,819,931 | |
| | | | | | | | |
| | |
| | | | Healthcare – 5.47% | | | | |
| | 11,905 | | | Amgen | | | 1,884,561 | |
| | 45,899 | | | Owens & Minor | | | 1,670,265 | |
| | 38,911 | | | Quest Diagnostics | | | 2,924,940 | |
| | | | | | | | |
| | | | 6,479,766 | |
| | | | | | | | |
| | |
| | | | Industrials – 14.49% | | | | |
| | 40,750 | | | ADT | | | 1,710,685 | |
| | 53,194 | | | Aircastle (Bermuda) | | | 1,154,310 | |
| | 38,608 | | | Emerson Electric | | | 2,109,155 | |
| | 66,705 | | | Fastenal | | | 3,121,127 | |
| | 21,056 | | | MSC Industrial Direct, Class A | | | 1,631,840 | |
| | 13,355 | | | Parker-Hannifin | | | 1,549,447 | |
| | 26,662 | | | Republic Services | | | 1,254,980 | |
| | 24,675 | | | Union Pacific | | | 2,152,400 | |
| | 23,699 | | | United Parcel Service, Class B | | | 2,490,054 | |
| | | | | | | | |
| | | | 17,173,998 | |
| | | | | | | | |
| | |
| | | | Information Technology – 14.13% | | | | |
| | 124,817 | | | Corning | | | 2,330,333 | |
| | 97,075 | | | Intel | | | 2,939,431 | |
| | 91,423 | | | Microsoft | | | 4,559,265 | |
| | 42,682 | | | Motorola Solutions | | | 3,209,260 | |
| | 26,143 | | | QUALCOMM | | | 1,320,744 | |
| | 119,390 | | | Western Union | | | 2,387,800 | |
| | | | | | | | |
| | | | 16,746,833 | |
| | | | | | | | |
| | |
| | | | Materials – 5.07% | | | | |
| | 24,261 | | | Bemis | | | 1,217,417 | |
| | 27,465 | | | Compass Minerals International | | | 2,058,776 | |
| | 23,224 | | | Praxair | | | 2,727,891 | |
| | | | | | | | |
| | | | 6,004,084 | |
| | | | | | | | |
| | |
| | | | Telecommunication Services – 2.96% | | | | |
| | 68,907 | | | Verizon Communications | | | 3,510,123 | |
| | | | | | | | |
| | |
| | | | Utilities – 4.89% | | | | |
| | 33,836 | | | AmeriGas Partners LP | | | 1,466,791 | |
| | 40,789 | | | National Fuel Gas | | | 2,263,790 | |
| | 42,382 | | | Vectren | | | 2,070,361 | |
| | | | | | | | |
| | | | 5,800,942 | |
| | | | | | | | |
| | |
| | | | Total Common Stocks
(Cost $102,422,711) | | | 115,363,844 | |
| | | | | | | | |
See accompanying Notes to Financial Statements.
| | |
| |
| ASTON/River Road Dividend All Cap Value Fund II | | April 30, 2016 |
| |
| Schedule of Investments (unaudited) – continued | | |
| | | | | | | | |
Shares | | | | | Market
Value | |
|
| | INVESTMENT COMPANY – 2.61% | |
| | |
| | 3,093,068 | | | BlackRock Liquidity Funds
TempFund Portfolio | | $ | 3,093,068 | |
| | | | | | | | |
| | |
| | | | Total Investment Company
(Cost $3,093,068) | | | 3,093,068 | |
| | | | | | | | |
| Total Investments – 99.95%
(Cost $105,515,779)* | | | 118,456,912 | |
| | | | | | | | |
| Net Other Assets and Liabilities – 0.05% | | | 57,200 | |
| | | | | | | | |
| Net Assets – 100.00% | | $ | 118,514,112 | |
| | | | | | | | |
| * | | At April 30, 2016, the aggregate cost for Federal income tax purposes approximates the aggregate cost for book purposes. The aggregate gross unrealized appreciation and depreciation were as follows: |
| | | | |
Gross unrealized appreciation | | $ | 15,511,465 | |
Gross unrealized depreciation | | | (2,570,332 | ) |
| | | | |
Net unrealized appreciation | | $ | 12,941,133 | |
| | | | |
| REIT | | Real Estate Investment Trust |
| SP ADR | | Sponsored American Depositary Receipt |
See accompanying Notes to Financial Statements.
| | |
| |
| ASTON/Fairpointe Mid Cap Fund | | April 30, 2016 |
| |
| Schedule of Investments (unaudited) | | |
| | | | | | | | |
Shares | | | | | Market
Value | |
|
| | COMMON STOCKS – 97.96% | |
| | |
| | | | Consumer Discretionary – 30.77% | | | | |
| | 1,851,600 | | | BorgWarner | | $ | 66,509,472 | |
| | 832,400 | | | Cooper Tire & Rubber | | | 28,751,096 | |
| | 4,393,700 | | | DeVry Education Group | | | 76,230,695 | |
| | 6,265,800 | | | Gentex | | | 100,503,432 | |
| | 3,495,700 | | | Interpublic Group | | | 80,191,358 | |
| | 732,400 | | | Lear | | | 84,321,212 | |
| | 4,102,000 | | | Lions Gate Entertainment
(Canada) | | | 91,064,400 | |
| | 3,351,200 | | | Mattel | | | 104,188,808 | |
| | 9,682,454 | | | New York Times, Class A | | | 124,129,060 | |
| | 14,963,900 | | | Office Depot * | | | 87,987,732 | |
| | 1,626,394 | | | Scholastic | | | 59,168,214 | |
| | 3,732,800 | | | TEGNA | | | 87,198,208 | |
| | 7,514,952 | | | Time | | | 110,469,794 | |
| | 361,400 | | | Whirlpool | | | 62,934,196 | |
| | | | | | | | |
| | | | 1,163,647,677 | |
| | | | | | | | |
| | |
| | | | Consumer Staples – 0.94% | | | | |
| | 571,100 | | | Bunge | | | 35,693,750 | |
| | | | | | | | |
| | |
| | | | Energy – 7.62% | | | | |
| | 4,494,592 | | | FMC Technologies * | | | 137,040,110 | |
| | 17,860,300 | | | McDermott International (Panama) * | | | 81,085,762 | |
| | 6,317,000 | | | Transocean (Switzerland) | | | 69,992,360 | |
| | | | | | | | |
| | | | 288,118,232 | |
| | | | | | | | |
| | |
| | | | Financials – 8.01% | | | | |
| | 485,700 | | | Cincinnati Financial | | | 32,061,057 | |
| | 1,071,985 | | | Eaton Vance | | | 37,015,642 | |
| | 1,531,100 | | | Northern Trust | | | 108,830,588 | |
| | 2,398,300 | | | Raymond James Financial | | | 125,119,311 | |
| | | | | | | | |
| | | | 303,026,598 | |
| | | | | | | | |
| | | | | | | | |
Shares | | | | | Market
Value | |
| | |
| | | | Healthcare – 5.48% | | | | |
| | 1,223,200 | | | Quest Diagnostics | | $ | 91,947,944 | |
| | 1,422,200 | | | Varian Medical Systems * | | | 115,454,196 | |
| | | | | | | | |
| | | | 207,402,140 | |
| | | | | | | | |
| | |
| | | | Industrials – 11.19% | | | | |
| | 1,708,500 | | | AGCO | | | 91,353,495 | |
| | 1,998,900 | | | Chicago Bridge & Iron (Netherlands) | | | 80,455,725 | |
| | 2,205,035 | | | Copa Holdings, Class A (Panama) | | | 140,570,981 | |
| | 1,461,100 | | | Donaldson | | | 47,748,748 | |
| | 2,492,800 | | | Werner Enterprises | | | 63,167,552 | |
| | | | | | | | |
| | | | 423,296,501 | |
| | | | | | | | |
| |
| | | | Information Technology – 20.93% | |
| | 1,860,700 | | | Akamai Technologies * | | | 94,877,093 | |
| | 4,052,192 | | | Cree * | | | 99,319,226 | |
| | 2,078,948 | | | Itron * | | | 85,486,342 | |
| | 5,156,400 | | | Jabil Circuit | | | 89,515,104 | |
| | 6,172,100 | | | Juniper Networks | | | 144,427,140 | |
| | 4,475,700 | | | Nuance Communications * | | | 76,892,526 | |
| | 1,287,300 | | | NVIDIA | | | 45,737,769 | |
| | 4,625,100 | | | Teradata * | | | 117,015,030 | |
| | 4,967,138 | | | Unisys * | | | 38,296,634 | |
| | | | | | | | |
| | | | 791,566,864 | |
| | | | | | | | |
| | |
| | | | Materials – 13.02% | | | | |
| | 12,594,800 | | | Alcoa | | | 140,683,916 | |
| | 2,265,004 | | | Domtar | | | 87,519,755 | |
| | 2,569,662 | | | FMC | | | 111,163,578 | |
| | 28,432,400 | | | Gerdau, SP ADR (Brazil) | | | 63,404,252 | |
| | 4,679,900 | | | United States Steel | | | 89,432,889 | |
| | | | | | | | |
| | | | 492,204,390 | |
| | | | | | | | |
| | | | Total Common Stocks
(Cost $3,491,867,558) | | | 3,704,956,152 | |
| | | | | | | | |
|
| | INVESTMENT COMPANY – 2.72% | |
| | |
| | 102,981,476 | | | BlackRock Liquidity Funds
TempFund Portfolio | | | 102,981,476 | |
| | | | | | | | |
| | |
| | | | Total Investment Company
(Cost $102,981,476) | | | 102,981,476 | |
| | | | | | | | |
| Total Investments – 100.68%
(Cost $3,594,849,034)** | | | 3,807,937,628 | |
| | | | | | | | |
| Net Other Assets and Liabilities – (0.68)% | | | (25,837,189 | ) |
| | | | | | | | |
| Net Assets – 100.00% | | $ | 3,782,100,439 | |
| | | | | | | | |
| * | | Non-income producing security. |
| ** | | At April 30, 2016, the aggregate cost for Federal income tax purposes approximates the aggregate cost for book purposes. The aggregate gross unrealized appreciation and depreciation were as follows: |
| | | | |
Gross unrealized appreciation | | $ | 588,606,192 | |
Gross unrealized depreciation | | | (375,517,598 | ) |
| | | | |
Net unrealized appreciation | | $ | 213,088,594 | |
| | | | |
| SP ADR | | Sponsored American Depositary Receipt |
See accompanying Notes to Financial Statements.
| | |
| |
| ASTON/Montag & Caldwell Mid Cap Growth Fund | | April 30, 2016 |
| |
| Schedule of Investments (unaudited) | | |
| | | | | | | | |
Shares | | | | | Market
Value | |
|
| | COMMON STOCKS – 96.78% | |
| | |
| | | | Consumer Discretionary – 24.84% | | | | |
| | 3,290 | | | Dollar General | | $ | 269,484 | |
| | 3,880 | | | Dollar Tree * | | | 309,275 | |
| | 5,380 | | | Dunkin’ Brands Group | | | 250,170 | |
| | 920 | | | Expedia | | | 106,508 | |
| | 9,010 | | | Hanesbrands | | | 261,560 | |
| | 2,190 | | | Harman International Industries | | | 168,104 | |
| | 11,740 | | | LKQ * | | | 376,267 | |
| | 415 | | | O’Reilly Automotive * | | | 109,012 | |
| | 708 | | | Panera Bread, Class A * | | | 151,859 | |
| | 4,680 | | | Ross Stores | | | 265,730 | |
| | 2,840 | | | ServiceMaster Global Holdings * | | | 108,829 | |
| | 2,600 | | | Tractor Supply | | | 246,116 | |
| | | | | | | | |
| | | | | | | 2,622,914 | |
| | | | | | | | |
| | | | Consumer Staples – 5.21% | | | | |
| | 1,240 | | | Mead Johnson Nutrition | | | 108,066 | |
| | 1,620 | | | Molson Coors Brewing, Class B | | | 154,921 | |
| | 1,992 | | | Monster Beverage * | | | 287,286 | |
| | | | | | | | |
| | | | | | | 550,273 | |
| | | | | | | | |
| | | | Energy – 1.52% | | | | |
| | 1,200 | | | Core Laboratories (Netherlands) | | | 160,392 | |
| | | | | | | | |
| | | | Financials – 13.63% | | | | |
| | 1,564 | | | FactSet Research Systems | | | 235,773 | |
| | 4,090 | | | First Republic Bank | | | 287,609 | |
| | 1,239 | | | Intercontinental Exchange | | | 297,397 | |
| | 2,960 | | | Lazard MLP, Class A (Bermuda) | | | 106,708 | |
| | 5,140 | | | Raymond James Financial | | | 268,154 | |
| | 1,768 | | | Signature Bank New York NY * | | | 243,684 | |
| | | | | | | | |
| | | | | | | 1,439,325 | |
| | | | | | | | |
| | | | Healthcare – 14.92% | | | | |
| | 3,170 | | | AmerisourceBergen | | | 269,767 | |
| | 5,210 | | | Cerner * | | | 292,489 | |
| | 1,770 | | | Edwards Lifesciences * | | | 187,992 | |
| | | | | | | | |
Shares | | | | | Market
Value | |
| | | | Healthcare (continued) | | | | |
| | 732 | | | Henry Schein * | | $ | 123,488 | |
| | 3,490 | | | MEDNAX * | | | 248,802 | |
| | 2,870 | | | Quintiles Transnational Holdings * | | | 198,231 | |
| | 4,050 | | | VCA * | | | 255,029 | |
| | | | | | | | |
| | | | | | | 1,575,798 | |
| | | | | | | | |
| | | | Industrials – 20.34% | | | | |
| | 4,710 | | | AMETEK | | | 226,504 | |
| | 4,740 | | | Copart * | | | 203,062 | |
| | 4,120 | | | Expeditors International of Washington | | | 204,393 | |
| | 8,550 | | | HD Supply Holdings * | | | 293,094 | |
| | 2,130 | | | IHS, Class A * | | | 262,373 | |
| | 2,810 | | | J.B. Hunt Transport Services | | | 232,893 | |
| | 1,166 | | | Snap-On | | | 185,721 | |
| | 2,110 | | | Stericycle * | | | 201,632 | |
| | 2,930 | | | Verisk Analytics * | | | 227,309 | |
| | 1,330 | | | Wabtec | | | 110,297 | |
| | | | | | | | |
| | | | | | | 2,147,278 | |
| | | | | | | | |
| | | | Information Technology – 16.32% | | | | |
| | 3,580 | | | Amphenol, Class A | | | 199,871 | |
| | 2,120 | | | ANSYS * | | | 192,432 | |
| | 2,920 | | | Arista Networks * | | | 194,530 | |
| | 4,490 | | | EPAM Systems * | | | 327,456 | |
| | 1,090 | | | F5 Networks * | | | 114,178 | |
| | 3,540 | | | M/A-COM Technology Solutions
Holdings * | | | 144,751 | |
| | 3,460 | | | Skyworks Solutions | | | 231,197 | |
| | 3,370 | | | WEX * | | | 318,431 | |
| | | | | | | | |
| | | | | | | 1,722,846 | |
| | | | | | | | |
| | | | Total Common Stocks
(Cost $8,925,070) | | | 10,218,826 | |
| | | | | | | | |
|
| | INVESTMENT COMPANY – 3.58% | |
| | |
| | 377,641 | | | BlackRock Liquidity Funds TempFund Portfolio | | | 377,641 | |
| | | | | | | | |
| | | | Total Investment Company
(Cost $377,641) | | | 377,641 | |
| | | | | | | | |
| Total Investments – 100.36%
(Cost $9,302,711)** | | | 10,596,467 | |
| | | | | | | | |
| Net Other Assets and Liabilities – (0.36)% | | | (37,970 | ) |
| | | | | | | | |
| Net Assets – 100.00% | | $ | 10,558,497 | |
| | | | | | | | |
| * | | Non-income producing security. |
| ** | | At April 30, 2016, the aggregate cost for Federal income tax purposes approximates the aggregate cost for book purposes. The aggregate gross unrealized appreciation and depreciation were as follows: |
| | | | |
Gross unrealized appreciation | | $ | 1,503,963 | |
Gross unrealized depreciation | | | (210,207 | ) |
| | | | |
Net unrealized appreciation | | $ | 1,293,756 | |
| | | | |
| MLP | | Master Limited Partnership |
See accompanying Notes to Financial Statements.
| | |
| |
| ASTON/LMCG Small Cap Growth Fund | | April 30, 2016 |
| |
| Schedule of Investments (unaudited) | | |
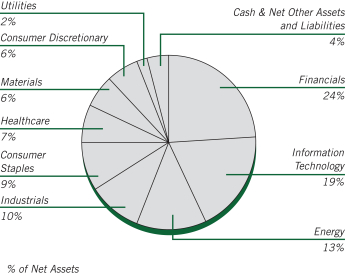
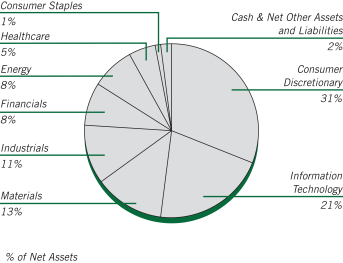
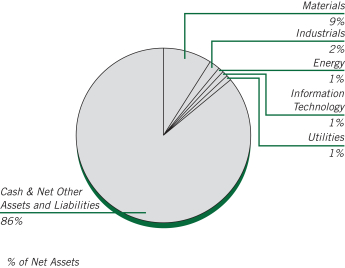
The chart represents total investments in the Fund. Net Other Assets and Liabilities is negative 3.09% and cannot be represented in the pie chart format.
| | | | | | | | |
Shares | | | | | Market
Value | |
|
| | COMMON STOCKS – 101.74% | |
| | |
| | | | Consumer Discretionary – 17.78% | | | | |
| | 24,118 | | | Buffalo Wild Wings * | | $ | 3,223,612 | |
| | 11,497 | | | Burlington Stores * | | | 654,984 | |
| | 57,686 | | | CalAtlantic Group | | | 1,867,296 | |
| | 58,553 | | | Dave & Buster’s Entertainment * | | | 2,266,001 | |
| | 22,262 | | | Lithia Motors, Class A | | | 1,848,191 | |
| | 191,836 | | | Media General * | | | 3,324,518 | |
| | 139,745 | | | Nexstar Broadcasting Group, Class A | | | 7,173,111 | |
| | 21,316 | | | Papa John’s International | | | 1,206,272 | |
| | 29,533 | | | Sonic | | | 1,015,049 | |
| | 25,883 | | | Vail Resorts | | | 3,355,472 | |
| | | | | | | | |
| | | | | | | 25,934,506 | |
| | | | | | | | |
| | | | Consumer Staples – 4.10% | | | | |
| | 45,152 | | | Casey’s General Stores | | | 5,057,024 | |
| | 10,377 | | | TreeHouse Foods * | | | 917,327 | |
| | | | | | | | |
| | | | | | | 5,974,351 | |
| | | | | | | | |
| | | | Financials – 3.09% | | | | |
| | 17,794 | | | Bank of the Ozarks | | | 734,892 | |
| | 96,687 | | | BofI Holding * | | | 1,969,514 | |
| | 4,440 | | | MarketAxess Holdings | | | 545,054 | |
| | 25,574 | | | Pinnacle Financial Partners | | | 1,257,474 | |
| | | | | | | | |
| | | | | | | 4,506,934 | |
| | | | | | | | |
| | | | Healthcare – 30.10% | | | | |
| | 22,370 | | | Acadia Healthcare * | | | 1,413,560 | |
| | 106,806 | | | ACADIA Pharmaceuticals * | | | 3,449,834 | |
| | 12,493 | | | Adeptus Health, Class A * | | | 851,023 | |
| | 46,596 | | | AMN Healthcare Services * | | | 1,654,624 | |
| | 15,974 | | | Amsurg * | | | 1,293,575 | |
| | 37,339 | | | Anacor Pharmaceuticals * | | | 2,342,649 | |
| | 24,081 | | | athenahealth * | | | 3,209,997 | |
| | | | | | | | |
Shares | | | | | Market
Value | |
| | | | Healthcare (continued) | | | | |
| | 140,544 | | | Cross Country Healthcare * | | $ | 1,746,962 | |
| | 36,524 | | | FibroGen * | | | 657,432 | |
| | 154,036 | | | HealthSouth | | | 6,386,333 | |
| | 36,548 | | | LDR Holding * | | | 984,969 | |
| | 74,778 | | | Neurocrine Biosciences * | | | 3,408,381 | |
| | 38,447 | | | Nevro * | | | 2,585,561 | |
| | 12,901 | | | Pacira Pharmaceuticals * | | | 698,073 | |
| | 27,516 | | | PAREXEL International * | | | 1,681,228 | |
| | 120,761 | | | Premier, Class A * | | | 4,082,929 | |
| | 12,368 | | | Prothena * | | | 534,174 | |
| | 53,452 | | | Radius Health * | | | 1,902,891 | |
| | 44,033 | | | Steris | | | 3,111,812 | |
| | 18,784 | | | Ultragenyx Pharmaceutical * | | | 1,270,174 | |
| | 6,997 | | | WellCare Health Plans * | | | 629,660 | |
| | | | | | | | |
| | | | | | | 43,895,841 | |
| | | | | | | | |
| | | | Industrials – 9.45% | | | | |
| | 28,252 | | | Advisory Board * | | | 893,893 | |
| | 26,998 | | | Apogee Enterprises | | | 1,118,797 | |
| | 36,461 | | | CEB | | | 2,249,279 | |
| | 67,055 | | | Continental Building Products * | | | 1,314,949 | |
| | 20,065 | | | Dycom Industries * | | | 1,416,589 | |
| | 108,143 | | | Echo Global Logistics * | | | 2,527,302 | |
| | 25,120 | | | HNI | | | 1,098,246 | |
| | 38,040 | | | WageWorks * | | | 2,048,834 | |
| | 36,903 | | | XPO Logistics * | | | 1,112,256 | |
| | | | | | | | |
| | | | | | | 13,780,145 | |
| | | | | | | | |
| | | | Information Technology – 31.29% | | | | |
| | 56,182 | | | Cavium * | | | 2,773,705 | |
| | 8,720 | | | Ellie Mae * | | | 728,992 | |
| | 21,226 | | | Euronet Worldwide * | | | 1,636,525 | |
| | 50,526 | | | Fleetmatics Group * | | | 1,831,568 | |
| | 146,711 | | | Global Eagle Entertainment * | | | 1,175,155 | |
| | 80,914 | | | GTT Communications * | | | 1,293,006 | |
| | 1,060,212 | | | Internap * | | | 2,417,283 | |
| | 35,786 | | | InterXion Holding * | | | 1,212,430 | |
| | 33,022 | | | M/A-COM Technology Solutions Holdings * | | | 1,350,270 | |
| | 66,453 | | | MAXIMUS | | | 3,515,364 | |
| | 124,223 | | | Microsemi * | | | 4,197,495 | |
| | 71,480 | | | NetScout Systems * | | | 1,591,145 | |
| | 45,719 | | | Qlik Technologies * | | | 1,407,688 | |
| | 60,490 | | | SS&C Technologies Holdings | | | 3,698,964 | |
| | 14,838 | | | Synaptics * | | | 1,061,659 | |
| | 234,322 | | | Synchronoss Technologies * | | | 7,280,385 | |
| | 32,184 | | | Syntel * | | | 1,368,786 | |
| | 14,348 | | | Tyler Technologies * | | | 2,100,691 | |
| | 6,056 | | | Ultimate Software Group * | | | 1,190,549 | |
| | 68,373 | | | Virtusa * | | | 2,429,976 | |
| | 43,302 | | | WNS Holdings, ADR (Jersey) * | | | 1,372,240 | |
| | | | | | | | |
| | | | | | | 45,633,876 | |
| | | | | | | | |
| | | | Materials – 4.57% | | | | |
| | 48,131 | | | Berry Plastics Group * | | | 1,733,679 | |
| | 235,821 | | | Summit Materials, Class A * | | | 4,928,659 | |
| | | | | | | | |
| | | | | | | 6,662,338 | |
| | | | | | | | |
See accompanying Notes to Financial Statements.
| | |
| |
| ASTON/LMCG Small Cap Growth Fund | | April 30, 2016 |
| |
| Schedule of Investments (unaudited) – continued | | |
| | | | | | | | |
Shares | | | | | Market
Value | |
| |
| | | | Telecommunication Services – 1.36% | |
| | 76,215 | | | Zayo Group Holdings * | | $ | 1,978,541 | |
| | | | | | | | |
| | |
| | | | Total Common Stocks
(Cost $156,198,722) | | | 148,366,532 | |
| | | | | | | | |
|
| | RIGHTS – 0.00% | |
| | |
| | | | Healthcare – 0.00% | | | | |
| | 99,639 | | | Dyax, CVR Expiration 12/31/19 *(a)(b) | | | 996 | |
| | | | | | | | |
| | |
| | | | Total Rights
(Cost $0) | | | 996 | |
| | | | | | | | |
| |
| | INVESTMENT COMPANY – 1.35% | | | | |
| | |
| | 1,964,356 | | | BlackRock Liquidity Funds TempFund Portfolio | | | 1,964,356 | |
| | | | | | | | |
| | |
| | | | Total Investment Company
(Cost $1,964,356) | | | 1,964,356 | |
| | | | | | | | |
| Total Investments – 103.09%
(Cost $158,163,078)** | | | 150,331,884 | |
| | | | | | | | |
| Net Other Assets and Liabilities – (3.09)% | | | (4,504,788 | ) |
| | | | | | | | |
| Net Assets – 100.00% | | $ | 145,827,096 | |
| | | | | | | | |
| * | | Non-income producing security. |
| ** | | At April 30, 2016, the aggregate cost for Federal income tax purposes approximates the aggregate cost for book purposes. The aggregate gross unrealized appreciation and depreciation were as follows: |
| | | | |
Gross unrealized appreciation | | $ | 6,775,281 | |
Gross unrealized depreciation | | | (14,606,475 | ) |
| | | | |
Net unrealized depreciation | | $ | (7,831,194 | ) |
| | | | |
| (a) | | Securities with a total aggregate market value of $996, or 0.001% of net assets, were valued under securities valuation procedures established by the Funds’ Board of Trustees. |
| (b) | | The security is restricted for resale. |
| ADR | | American Depositary Receipt |
| CVR | | Contingent Value Rights |
See accompanying Notes to Financial Statements.
| | |
| |
| ASTON/River Road Independent Value Fund | | April 30, 2016 |
| |
| Schedule of Investments (unaudited) | | |
| | | | | | | | |
Shares | | | | | Market
Value | |
|
| | COMMON STOCKS – 14.26% | |
| | |
| | | | Energy – 1.31% | | | | |
| | 43,731 | | | Energen | | $ | 1,858,130 | |
| | 194,293 | | | QEP Resources | | | 3,483,673 | |
| | | | | | | | |
| | | | | | | 5,341,803 | |
| | | | | | | | |
| | | | Financials – 0.40% | | | | |
| | 67,430 | | | Baldwin & Lyons, Class B | | | 1,647,989 | |
| | | | | | | | |
| | | | Industrials – 1.75% | | | | |
| | 193,198 | | | American Science & Engineering | | | 5,535,123 | |
| | 101,675 | | | Raven Industries | | | 1,635,951 | |
| | | | | | | | |
| | | | | | | 7,171,074 | |
| | | | | | | | |
| | | | Information Technology – 1.21% | | | | |
| | 87,135 | | | Benchmark Electronics * | | | 1,692,162 | |
| | 199,131 | | | Park Electrochemical | | | 3,247,826 | |
| | | | | | | | |
| | | | | | | 4,939,988 | |
| | | | | | | | |
| | | | Materials – 8.77% | | | | |
| | 2,084,739 | | | Alamos Gold, Class A (Canada) | | | 15,010,121 | |
| | 1,530,571 | | | New Gold (Canada) * | | | 7,193,684 | |
| | 815,265 | | | Pan American Silver (Canada) | | | 12,775,202 | |
| | 478,551 | | | Primero Mining (Canada) * | | | 899,676 | |
| | | | | | | | |
| | | | | | | 35,878,683 | |
| | | | | | | | |
| | | | Utilities – 0.82% | | | | |
| | 99,627 | | | Empire District Electric | | | 3,354,441 | |
| | | | | | | | |
| | | | Total Common Stocks
(Cost $36,733,480) | | | 58,333,978 | |
| | | | | | | | |
| | | | | | | | |
Shares | | | | | Market
Value | |
|
| | INVESTMENT COMPANY – 83.52% | |
| | |
| | 341,752,013 | | | BlackRock Liquidity Funds Treasury Trust Fund Portfolio | | $ | 341,752,013 | |
| | | | | | | | |
| | | | Total Investment Company
(Cost $341,752,013) | | | 341,752,013 | |
| | | | | | | | |
| Total Investments – 97.78%
(Cost $378,485,493)** | | | 400,085,991 | |
| | | | | | | | |
| Net Other Assets and Liabilities – 2.22% | | | 9,094,147 | |
| | | | | | | | |
| Net Assets – 100.00% | | $ | 409,180,138 | |
| | | | | | | | |
| * | | Non-income producing security. |
| ** | | At April 30, 2016, the aggregate cost for Federal income tax purposes approximates the aggregate cost for book purposes. The aggregate gross unrealized appreciation and depreciation were as follows: |
| | | | |
Gross unrealized appreciation | | $ | 21,773,752 | |
Gross unrealized depreciation | | | (173,254 | ) |
| | | | |
Net unrealized appreciation | | $ | 21,600,498 | |
| | | | |
See accompanying Notes to Financial Statements.
| | |
| |
| ASTON/River Road Select Value Fund | | April 30, 2016 |
| |
| Schedule of Investments (unaudited) | | |
| | | | | | | | |
Shares | | | | | Market
Value | |
|
| | COMMON STOCKS – 98.34% | |
| | |
| | | | Consumer Discretionary – 24.40% | | | | |
| | 2,530 | | | Biglari Holdings * | | $ | 946,068 | |
| | 44,793 | | | Bloomin’ Brands | | | 837,629 | |
| | 14,939 | | | Gentex | | | 239,622 | |
| | 35,783 | | | International Speedway, Class A | | | 1,198,373 | |
| | 19,971 | | | J. Alexander’s Holdings * | | | 205,701 | |
| | 53,520 | | | La Quinta Holdings * | | | 683,450 | |
| | 12,271 | | | Liberty Broadband, Class C * | | | 702,515 | |
| | 24,664 | | | Liberty Ventures, Class A * | | | 986,560 | |
| | 3,465 | | | Madison Square Garden, Class A * | | | 543,936 | |
| | 10,581 | | | Michael Kors Holdings (British Virgin Islands) * | | | 546,614 | |
| | 12,114 | | | Murphy USA * | | | 695,586 | |
| | 29,092 | | | News, Class A | | | 361,323 | |
| | 65,100 | | | SeaWorld Entertainment | | | 1,297,443 | |
| | 27,200 | | | SodaStream International (Israel) * | | | 373,184 | |
| | 23,120 | | | Starz, Class A * | | | 629,095 | |
| | 23,712 | | | Tribune Media, Class A | | | 914,098 | |
| | | | | | | | |
| | | | 11,161,197 | |
| | | | | | | | |
| | |
| | | | Consumer Staples – 3.24% | | | | |
| | 28,707 | | | Ingles Markets, Class A | | | 1,035,461 | |
| | 12,470 | | | United Natural Foods * | | | 444,805 | |
| | | | | | | | |
| | | | 1,480,266 | |
| | | | | | | | |
| | |
| | | | Energy – 3.98% | | | | |
| | 5,390 | | | Energen * | | | 229,021 | |
| | 69,888 | | | Evolution Petroleum | | | 387,180 | |
| | 120,784 | | | Gran Tierra Energy * | | | 357,521 | |
| | 17,980 | | | PBF Energy, Class A | | | 578,596 | |
| | 12,050 | | | PHI * | | | 270,161 | |
| | | | | | | | |
| | | | 1,822,479 | |
| | | | | | | | |
| | | | | | | | |
Shares | | | | | Market
Value | |
| | |
| | | | Financials – 18.41% | | | | |
| | 1,585 | | | Alleghany * | | $ | 826,229 | |
| | 18,360 | | | Allied World Assurance Co Holdings AG (Switzerland) | | | 653,249 | |
| | 2,795 | | | American National Insurance | | | 324,555 | |
| | 6,501 | | | Brown & Brown | | | 228,250 | |
| | 33,117 | | | Capital Southwest | | | 470,261 | |
| | 144,795 | | | FNFV Group * | | | 1,559,442 | |
| | 17,674 | | | Forest City Realty Trust, Class A, REIT | | | 367,266 | |
| | 26,070 | | | GEO Group, REIT | | | 835,022 | |
| | 42,822 | | | Leucadia National | | | 714,271 | |
| | 71,432 | | | PICO Holdings * | | | 709,320 | |
| | 2,084 | | | White Mountains Insurance Group (Bermuda) | | | 1,729,720 | |
| | | | | | | | |
| | | | 8,417,585 | |
| | | | | | | | |
| | |
| | | | Healthcare – 4.19% | | | | |
| | 23,675 | | | Air Methods * | | | 875,501 | |
| | 22,822 | | | Akorn * | | | 580,820 | |
| | 13,580 | | | Premier, Class A * | | | 459,140 | |
| | | | | | | | |
| | | | 1,915,461 | |
| | | | | | | | |
| | |
| | | | Industrials – 25.96% | | | | |
| | 59,648 | | | Air Transport Services Group * | | | 840,440 | |
| | 22,012 | | | Cubic | | | 915,039 | |
| | 16,953 | | | Forward Air | | | 772,718 | |
| | 17,930 | | | Insperity | | | 946,166 | |
| | 9,600 | | | Kansas City Southern | | | 909,600 | |
| | 22,729 | | | Kelly Services, Class A | | | 426,623 | |
| | 33,490 | | | KLX * | | | 1,129,283 | |
| | 4,798 | | | MSC Industrial Direct, Class A | | | 371,845 | |
| | 36,059 | | | SP Plus * | | | 803,395 | |
| | 7,470 | | | Spirit AeroSystems Holdings, Class A * | | | 352,210 | |
| | 3,600 | | | Stericycle * | | | 344,016 | |
| | 46,618 | | | TriNet Group * | | | 774,791 | |
| | 16,980 | | | UniFirst | | | 1,840,292 | |
| | 14,014 | | | US Ecology | | | 631,050 | |
| | 27,450 | | | Viad | | | 816,638 | |
| | | | | | | | |
| | | | 11,874,106 | |
| | | | | | | | |
| | |
| | | | Information Technology – 14.88% | | | | |
| | 42,851 | | | Blackhawk Network Holdings * | | | 1,376,803 | |
| | 18,118 | | | CSG Systems International | | | 804,077 | |
| | 29,786 | | | Dolby Laboratories, Class A | | | 1,418,111 | |
| | 10,957 | | | ePlus * | | | 880,833 | |
| | 36,380 | | | Match Group * | | | 414,732 | |
| | 39,773 | | | NeuStar, Class A * | | | 934,268 | |
| | 25,600 | | | Rackspace Hosting * | | | 585,472 | |
| | 5,674 | | | Tech Data * | | | 389,747 | |
| | | | | | | | |
| | | | 6,804,043 | |
| | | | | | | | |
| | |
| | | | Telecommunication Services – 2.07% | | | | |
| | 32,045 | | | Telephone & Data Systems | | | 947,571 | |
| | | | | | | | |
| | |
| | | | Utilities – 1.21% | | | | |
| | 9,948 | | | National Fuel Gas | | | 552,114 | |
| | | | | | | | |
| | |
| | | | Total Common Stocks
(Cost $43,740,777) | | | 44,974,822 | |
| | | | | | | | |
See accompanying Notes to Financial Statements.
| | |
| |
| ASTON/River Road Select Value Fund | | April 30, 2016 |
| |
| Schedule of Investments (unaudited) – continued | | |
| | | | | | | | |
Shares | | | | | Market
Value | |
| |
| | INVESTMENT COMPANY – 2.62% | | | | |
| | |
| | 1,198,343 | | | BlackRock Liquidity Funds
TempFund Portfolio | | $ | 1,198,343 | |
| | | | | | | | |
| | |
| | | | Total Investment Company
(Cost $1,198,343) | | | 1,198,343 | |
| | | | | | | | |
| Total Investments – 100.96%
(Cost $44,939,120)** | | | 46,173,165 | |
| | | | | | | | |
| Net Other Assets and Liabilities – (0.96)% | | | (439,231 | ) |
| | | | | | | | |
| Net Assets – 100.00% | | $ | 45,733,934 | |
| | | | | | | | |
| * | | Non-income producing security. |
| ** | | At April 30, 2016, the aggregate cost for Federal income tax purposes approximates the aggregate cost for book purposes. The aggregate gross unrealized appreciation and depreciation were as follows: |
| | | | |
Gross unrealized appreciation | | $ | 4,318,944 | |
Gross unrealized depreciation | | | (3,084,899 | ) |
| | | | |
Net unrealized appreciation | | $ | 1,234,045 | |
| | | | |
| REIT | | Real Estate Investment Trust |
See accompanying Notes to Financial Statements.
| | |
| |
| ASTON/River Road Small Cap Value Fund | | April 30, 2016 |
| |
| Schedule of Investments (unaudited) | | |
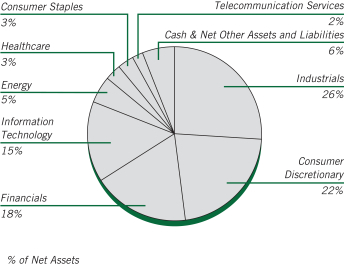
| | | | | | | | |
Shares | | | | | Market
Value | |
|
| | COMMON STOCKS – 94.05% | |
| | |
| | | | Consumer Discretionary – 21.45% | | | | |
| | 13,249 | | | Biglari Holdings * | | $ | 4,954,331 | |
| | 252,040 | | | Bloomin’ Brands | | | 4,713,148 | |
| | 197,950 | | | International Speedway, Class A | | | 6,629,345 | |
| | 274,395 | | | J. Alexander’s Holdings * (a) | | | 2,826,268 | |
| | 301,020 | | | La Quinta Holdings * | | | 3,844,025 | |
| | 77,280 | | | Liberty Tax | | | 923,496 | |
| | 136,180 | | | Marcus | | | 2,635,083 | |
| | 134,641 | | | Monarch Casino & Resort * | | | 2,558,179 | |
| | 83,000 | | | Murphy USA * | | | 4,765,860 | |
| | 395,082 | | | SeaWorld Entertainment | | | 7,873,984 | |
| | 204,090 | | | SodaStream International (Israel) * | | | 2,800,115 | |
| | 130,010 | | | Starz, Class A * | | | 3,537,572 | |
| | 131,832 | | | Tribune Media, Class A | | | 5,082,124 | |
| | 254,360 | | | UCP Class A * (a) | | | 1,968,746 | |
| | | | | | | | |
| | | | 55,112,276 | |
| | | | | | | | |
| | |
| | | | Consumer Staples – 3.17% | | | | |
| | 155,988 | | | Ingles Markets, Class A | | | 5,626,487 | |
| | 70,340 | | | United Natural Foods * | | | 2,509,028 | |
| | | | | | | | |
| | | | 8,135,515 | |
| | | | | | | | |
| | |
| | | | Energy – 5.01% | | | | |
| | 33,880 | | | Energen * | | | 1,439,561 | |
| | 584,473 | | | Evolution Petroleum (a) | | | 3,237,980 | |
| | 862,180 | | | Gran Tierra Energy * | | | 2,552,053 | |
| | 99,660 | | | PBF Energy, Class A | | | 3,207,059 | |
| | 41,610 | | | PHI * | | | 932,896 | |
| | 84,390 | | | QEP Resources * | | | 1,513,113 | |
| | | | | | | | |
| | | | 12,882,662 | |
| | | | | | | | |
| | | | | | | | |
Shares | | | | | Market
Value | |
| | |
| | | | Financials – 18.10% | | | | |
| | 65,020 | | | 1st Source | | $ | 2,239,289 | |
| | 147,210 | | | Allied World Assurance Co Holdings AG (Switzerland) | | | 5,237,732 | |
| | 37,280 | | | American National Insurance | | | 4,328,954 | |
| | 209,054 | | | Capital Southwest | | | 2,968,567 | |
| | 7,185 | | | First Citizens BancShares, Class A | | | 1,832,175 | |
| | 883,731 | | | FNFV Group * | | | 9,517,783 | |
| | 162,255 | | | GEO Group, REIT | | | 5,197,028 | |
| | 360,294 | | | PICO Holdings * | | | 3,577,719 | |
| | 13,968 | | | White Mountains Insurance Group (Bermuda) | | | 11,593,440 | |
| | | | | | | | |
| | | | 46,492,687 | |
| | | | | | | | |
| | |
| | | | Healthcare – 3.18% | | | | |
| | 132,766 | | | Air Methods * | | | 4,909,687 | |
| | 128,488 | | | Akorn * | | | 3,270,020 | |
| | | | | | | | |
| | | | 8,179,707 | |
| | | | | | | | |
| | |
| | | | Industrials – 25.54% | | | | |
| | 437,495 | | | Air Transport Services Group * | | | 6,164,304 | |
| | 80,320 | | | Argan | | | 2,745,338 | |
| | 118,257 | | | Cubic | | | 4,915,943 | |
| | 107,520 | | | Forward Air | | | 4,900,762 | |
| | 130,805 | | | Insperity | | | 6,902,580 | |
| | 162,890 | | | Kelly Services, Class A | | | 3,057,445 | |
| | 195,977 | | | KLX * | | | 6,608,344 | |
| | 68,020 | | | Marten Transport | | | 1,269,253 | |
| | 278,369 | | | SP Plus * | | | 6,202,061 | |
| | 254,442 | | | TriNet Group * | | | 4,228,826 | |
| | 93,877 | | | UniFirst | | | 10,174,389 | |
| | 89,450 | | | US Ecology | | | 4,027,933 | |
| | 148,224 | | | Viad | | | 4,409,664 | |
| | | | | | | | |
| | | | 65,606,842 | |
| | | | | | | | |
| | |
| | | | Information Technology – 15.25% | | | | |
| | 242,576 | | | Blackhawk Network Holdings * | | | 7,793,967 | |
| | 133,105 | | | Computer Services (a) | | | 4,901,592 | |
| | 102,190 | | | CSG Systems International | | | 4,535,192 | |
| | 60,069 | | | ePlus * | | | 4,828,947 | |
| | 160,578 | | | Ituran Location and Control (Israel) | | | 3,340,022 | |
| | 241,419 | | | Match Group * | | | 2,752,177 | |
| | 154,510 | | | NeuStar, Class A * | | | 3,629,440 | |
| | 221,470 | | | Rackspace Hosting * | | | 5,065,019 | |
| | 33,740 | | | Tech Data * | | | 2,317,601 | |
| | | | | | | | |
| | | | 39,163,957 | |
| | | | | | | | |
| | |
| | | | Telecommunication Services – 2.35% | | | | |
| | 204,180 | | | Telephone & Data Systems | | | 6,037,603 | |
| | | | | | | | |
| | |
| | | | Total Common Stocks
(Cost $208,889,617) | | | 241,611,249 | |
| | | | | | | | |
See accompanying Notes to Financial Statements.
| | |
| |
| ASTON/River Road Small Cap Value Fund | | April 30, 2016 |
| |
| Schedule of Investments (unaudited) – continued | | |
| | | | | | | | |
Shares | | | | | Market
Value | |
|
| | INVESTMENT COMPANY – 5.92% | |
| | |
| | 15,210,777 | | | BlackRock Liquidity Funds
TempFund Portfolio | | $ | 15,210,777 | |
| | | | | | | | |
| | |
| | | | Total Investment Company
(Cost $15,210,777) | | | 15,210,777 | |
| | | | | | | | |
| Total Investments – 99.97%
(Cost $224,100,394)** | | | 256,822,026 | |
| | | | | | | | |
| Net Other Assets and Liabilities – 0.03% | | | 68,455 | |
| | | | | | | | |
| Net Assets – 100.00% | | $ | 256,890,481 | |
| | | | | | | | |
| * | | Non-income producing security. |
| ** | | At April 30, 2016, the aggregate cost for Federal income tax purposes approximates the aggregate cost for book purposes. The aggregate gross unrealized appreciation and depreciation were as follows: |
| | | | |
Gross unrealized appreciation | | $ | 41,711,918 | |
Gross unrealized depreciation | | | (8,990,286 | ) |
| | | | |
Net unrealized appreciation | | $ | 32,721,632 | |
| | | | |
| (a) | | These securities have been determined to be illiquid securities. At April 30, 2016, these securities amounted to $12,934,586, or 5.04% of net assets. |
| REIT | | Real Estate Investment Trust |
See accompanying Notes to Financial Statements.
| | |
| |
| ASTON/Silvercrest Small Cap Fund | | April 30, 2016 |
| |
| Schedule of Investments (unaudited) | | |
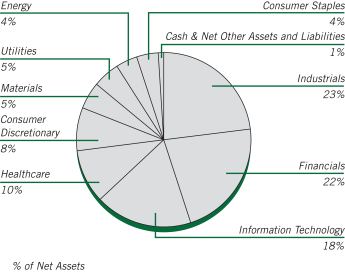
| | | | | | | | |
Shares | | | | | Market
Value | |
|
| | COMMON STOCKS – 99.38% | |
| | |
| | | | Consumer Discretionary – 8.45% | | | | |
| | 58,630 | | | Brunswick | | $ | 2,815,999 | |
| | 47,990 | | | Columbia Sportswear | | | 2,810,774 | |
| | 106,210 | | | EW Scripps, Class A | | | 1,612,268 | |
| | 128,660 | | | La-Z-Boy | | | 3,328,434 | |
| | 27,200 | | | Lithia Motors, Class A | | | 2,258,144 | |
| | 116,810 | | | Wolverine World Wide | | | 2,213,550 | |
| | | | | | | | |
| | | | | | | 15,039,169 | |
| | | | | | | | |
| | |
| | | | Consumer Staples – 3.80% | | | | |
| | 23,874 | | | J & J Snack Foods | | | 2,414,378 | |
| | 37,364 | | | Lancaster Colony | | | 4,352,906 | |
| | | | | | | | |
| | | | | | | 6,767,284 | |
| | | | | | | | |
| | |
| | | | Energy – 4.05% | | | | |
| | 199,640 | | | Callon Petroleum * | | | 2,098,216 | |
| | 129,530 | | | Forum Energy Technologies * | | | 2,168,332 | |
| | 136,190 | | | Matador Resources * | | | 2,934,895 | |
| | | | | | | | |
| | | | | | | 7,201,443 | |
| | | | | | | | |
| | |
| | | | Financials – 22.31% | | | | |
| | 211,480 | | | BancorpSouth | | | 4,967,665 | |
| | 53,440 | | | Bank of the Ozarks | | | 2,207,072 | |
| | 233,240 | | | CVB Financial | | | 4,007,063 | |
| | 60,168 | | | EastGroup Properties, REIT | | | 3,595,038 | |
| | 150,244 | | | Horace Mann Educators | | | 4,672,588 | |
| | 83,589 | | | Iberiabank | | | 4,930,915 | |
| | 103,553 | | | Independent Bank/Rockland MA | | | 4,870,098 | |
| | 122,010 | | | Pebblebrook Hotel Trust, REIT | | | 3,372,356 | |
| | 192,120 | | | Physicians Realty Trust, REIT | | | 3,483,136 | |
| | 74,270 | | | QTS Realty Trust, Class A, REIT | | | 3,596,153 | |
| | | | | | | | |
| | | | | | | 39,702,084 | |
| | | | | | | | |
| | | | | | | | |
Shares | | | | | Market
Value | |
| | |
| | | | Healthcare – 9.65% | | | | |
| | 42,287 | | | Analogic | | $ | 3,340,250 | |
| | 61,750 | | | Greatbatch * | | | 2,148,900 | |
| | 37,964 | | | ICU Medical * | | | 3,771,344 | |
| | 85,830 | | | INC Research Holdings, Class A * | | | 4,130,998 | |
| | 53,270 | | | Integra LifeSciences Holdings * | | | 3,772,581 | |
| | | | | | | | |
| | | | | | | 17,164,073 | |
| | | | | | | | |
| | |
| | | | Industrials – 23.51% | | | | |
| | 99,845 | | | Altra Industrial Motion | | | 2,865,552 | |
| | 132,860 | | | Babcock & Wilcox Enterprises * | | | 3,035,851 | |
| | 44,290 | | | CIRCOR International | | | 2,500,171 | |
| | 82,756 | | | EMCOR Group | | | 4,012,011 | |
| | 85,080 | | | ESCO Technologies | | | 3,273,878 | |
| | 33,640 | | | G & K Services, Class A | | | 2,376,666 | |
| | 57,390 | | | Hillenbrand | | | 1,739,491 | |
| | 163,420 | | | Knoll | | | 3,815,857 | |
| | 71,279 | | | MSA Safety | | | 3,427,807 | |
| | 199,900 | | | Mueller Water Products, Class A | | | 2,148,925 | |
| | 142,580 | | | Quanex Building Products | | | 2,686,207 | |
| | 39,380 | | | Standex International | | | 3,020,052 | |
| | 98,349 | | | US Ecology | | | 4,428,655 | |
| | 44,580 | | | Watts Water Technologies, Class A | | | 2,490,685 | |
| | | | | | | | |
| | | | | | | 41,821,808 | |
| | | | | | | | |
| | |
| | | | Information Technology – 17.69% | | | | |
| | 154,197 | | | ACI Worldwide * | | | 3,082,398 | |
| | 255,160 | | | Entegris * | | | 3,391,076 | |
| | 26,697 | | | FEI | | | 2,376,567 | |
| | 49,280 | | | Itron * | | | 2,026,394 | |
| | 45,115 | | | Littelfuse | | | 5,254,995 | |
| | 100,340 | | | M/A – COM Technology Solutions * | | | 4,102,903 | |
| | 143,050 | | | Mentor Graphics | | | 2,855,278 | |
| | 66,950 | | | Methode Electronics | | | 1,990,424 | |
| | 108,405 | | | MKS Instruments | | | 3,887,403 | |
| | 112,240 | | | NetScout Systems * | | | 2,498,462 | |
| | | | | | | | |
| | | | | | | 31,465,900 | |
| | | | | | | | |
| | |
| | | | Materials – 5.30% | | | | |
| | 56,430 | | | Minerals Technologies | | | 3,380,157 | |
| | 137,433 | | | PH Glatfelter | | | 3,151,339 | |
| | 43,079 | | | Sensient Technologies | | | 2,897,063 | |
| | | | | | | | |
| | | | | | | 9,428,559 | |
| | | | | | | | |
| | |
| | | | Utilities – 4.62% | | | | |
| | 61,943 | | | MGE Energy | | | 3,087,859 | |
| | 43,700 | | | ONE Gas | | | 2,555,139 | |
| | 64,959 | | | Portland General Electric | | | 2,580,171 | |
| | | | | | | | |
| | | | | | | 8,223,169 | |
| | | | | | | | |
| | |
| | | | Total Common Stocks
(Cost $172,352,856) | | | 176,813,489 | |
| | | | | | | | |
See accompanying Notes to Financial Statements.
| | |
| |
| ASTON/Silvercrest Small Cap Fund | | April 30, 2016 |
| |
| Schedule of Investments (unaudited) – continued | | |
| | | | | | | | |
Shares | | | | | Market
Value | |
|
| | INVESTMENT COMPANY – 0.16% | |
| | |
| | 289,693 | | | BlackRock Liquidity Funds TempFund Portfolio | | $ | 289,693 | |
| | | | | | | | |
| | |
| | | | Total Investment Company
(Cost $289,693) | | | 289,693 | |
| | | | | | | | |
| Total Investments – 99.54%
(Cost $172,642,549)** | | | 177,103,182 | |
| | | | | | | | |
| Net Other Assets and Liabilities – 0.46% | | | 812,221 | |
| | | | | | | | |
| Net Assets – 100.00% | | $ | 177,915,403 | |
| | | | | | | | |
| * | | Non-income producing security. |
| ** | | At April 30, 2016, the aggregate cost for Federal income tax purposes approximates the aggregate cost for book purposes. The aggregate gross unrealized appreciation and depreciation were as follows: |
| | | | |
Gross unrealized appreciation | | $ | 11,592,193 | |
Gross unrealized depreciation | | | (7,131,560 | ) |
| | | | |
Net unrealized appreciation | | $ | 4,460,633 | |
| | | | |
| REIT | | Real Estate Investment Trust |
See accompanying Notes to Financial Statements.
| | |
| |
| ASTON Small Cap Fund | | April 30, 2016 |
| |
| Schedule of Investments (unaudited) | | |
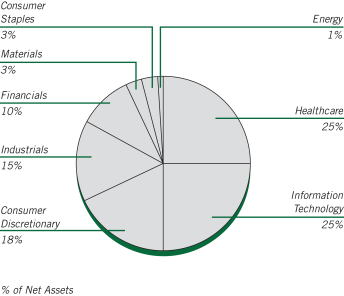
| | | | | | | | |
Shares | | | | | Market
Value | |
|
| | COMMON STOCKS – 99.63% | |
| | |
| | | | Consumer Discretionary – 18.28% | | | | |
| | 37,320 | | | BJ’s Restaurants * | | $ | 1,664,472 | |
| | 92,009 | | | Build-A-Bear Workshop * | | | 1,211,759 | |
| | 37,900 | | | Burlington Stores * | | | 2,159,163 | |
| | 49,688 | | | Chuy’s Holdings * | | | 1,517,472 | |
| | 58,871 | | | Five Below * | | | 2,454,921 | |
| | 62,425 | | | Fox Factory Holding * | | | 1,080,577 | |
| | 71,878 | | | Grand Canyon Education * | | | 3,143,225 | |
| | 29,458 | | | Hibbett Sports * | | | 1,063,434 | |
| | 23,289 | | | Oxford Industries | | | 1,546,855 | |
| | 26,048 | | | Pool | | | 2,276,856 | |
| | 53,956 | | | Tumi Holdings * | | | 1,439,546 | |
| | 15,857 | | | Vitamin Shoppe * | | | 434,006 | |
| | | | | | | | |
| | | | | | | 19,992,286 | |
| | | | | | | | |
| | |
| | | | Consumer Staples – 2.52% | | | | |
| | 18,725 | | | PriceSmart | | | 1,620,462 | |
| | 71,435 | | | Smart & Final Stores * | | | 1,137,245 | |
| | | | | | | | |
| | | | | | | 2,757,707 | |
| | | | | | | | |
| | |
| | | | Energy – 1.19% | | | | |
| | 60,431 | | | Matador Resources * | | | 1,302,288 | |
| | | | | | | | |
| | |
| | | | Financials – 9.90% | | | | |
| | 43,486 | | | Encore Capital Group * | | | 1,224,131 | |
| | 20,447 | | | Greenhill | | | 450,243 | |
| | 53,728 | | | Heritage Insurance Holdings | | | 714,045 | |
| | 19,189 | | | MarketAxess Holdings | | | 2,355,642 | |
| | 41,222 | | | PrivateBancorp | | | 1,715,247 | |
| | 74,312 | | | STAG Industrial, REIT | | | 1,483,268 | |
| | 22,836 | | | Stifel Financial * | | | 751,533 | |
| | 17,545 | | | Sun Communities, REIT | | | 1,190,779 | |
| | 20,688 | | | Texas Capital Bancshares * | | | 947,924 | |
| | | | | | | | |
| | | | | | | 10,832,812 | |
| | | | | | | | |
| | | | | | | | |
Shares | | | | | Market
Value | |
| | |
| | | | Healthcare – 25.20% | | | | |
| | 11,591 | | | ABIOMED * | | $ | 1,125,950 | |
| | 28,358 | | | Acadia Healthcare * | | | 1,791,942 | |
| | 22,775 | | | Align Technology * | | | 1,644,127 | |
| | 176,270 | | | Amicus Therapeutics * | | | 1,316,737 | |
| | 39,193 | | | Bruker | | | 1,109,162 | |
| | 63,589 | | | Catalent * | | | 1,877,783 | |
| | 46,838 | | | DBV Technologies, SP ADR (France) * | | | 1,591,087 | |
| | 60,949 | | | Dynavax Technologies * | | | 1,000,173 | |
| | 41,298 | | | Emergent BioSolutions * | | | 1,590,799 | |
| | 76,039 | | | Endologix * | | | 852,397 | |
| | 69,404 | | | Globus Medical, Class A * | | | 1,737,876 | |
| | 13,210 | | | ICU Medical * | | | 1,312,281 | |
| | 41,170 | | | Impax Laboratories * | | | 1,373,020 | |
| | 138,489 | | | Inotek Pharmaceuticals * | | | 1,357,192 | |
| | 41,396 | | | Medidata Solutions * | | | 1,806,107 | |
| | 31,880 | | | Neurocrine Biosciences * | | | 1,453,090 | |
| | 35,617 | | | Retrophin * | | | 490,802 | |
| | 30,296 | | | Team Health Holdings * | | | 1,267,282 | |
| | 20,479 | | | West Pharmaceutical Services | | | 1,458,105 | |
| | 74,662 | | | Wright Medical Group (Netherlands) * | | | 1,402,152 | |
| | | | | | | | |
| | | | | | | 27,558,064 | |
| | | | | | | | |
| | |
| | | | Industrials – 14.93% | | | | |
| | 23,645 | | | CEB | | | 1,458,660 | |
| | 25,594 | | | Exponent | | | 1,275,605 | |
| | 19,908 | | | Graco | | | 1,560,588 | |
| | 30,982 | | | HEICO | | | 1,899,506 | |
| | 37,798 | | | Knight Transportation | | | 1,004,293 | |
| | 38,220 | | | Mobile Mini | | | 1,232,595 | |
| | 22,716 | | | Proto Labs * | | | 1,359,098 | |
| | 78,314 | | | Ritchie Bros Auctioneers (Canada) | | | 2,246,829 | |
| | 34,365 | | | Thermon Group Holdings * | | | 644,000 | |
| | 42,905 | | | WageWorks * | | | 2,310,863 | |
| | 24,683 | | | Woodward | | | 1,338,065 | |
| | | | | | | | |
| | | | | | | 16,330,102 | |
| | | | | | | | |
| | |
| | | | Information Technology – 24.42% | | | | |
| | 26,943 | | | Blackbaud | | | 1,664,269 | |
| | 40,339 | | | Bottomline Technologies * | | | 990,726 | |
| | 20,544 | | | Cabot Microelectronics | | | 860,588 | |
| | 79,558 | | | Callidus Software * | | | 1,455,911 | |
| | 29,803 | | | Cardtronics * | | | 1,174,834 | |
| | 23,005 | | | Cavium * | | | 1,135,757 | |
| | 35,654 | | | Cognex | | | 1,266,787 | |
| | 39,821 | | | comScore * | | | 1,219,319 | |
| | 29,411 | | | EPAM Systems * | | | 2,144,944 | |
| | 20,289 | | | FEI | | | 1,806,127 | |
| | 21,068 | | | Forrester Research | | | 708,306 | |
| | 30,990 | | | Interactive Intelligence Group * | | | 1,151,898 | |
| | 65,322 | | | Intralinks Holdings * | | | 582,019 | |
| | 31,385 | | | LogMeIn * | | | 1,873,685 | |
| | 43,008 | | | Power Integrations | | | 2,075,136 | |
| | 35,458 | | | Super Micro Computer * | | | 954,175 | |
| | 34,455 | | | Technology Solutions Holdings * | | | 1,408,865 | |
| | 12,115 | | | Tyler Technologies * | | | 1,773,757 | |
| | 51,501 | | | VeriFone Systems * | | | 1,465,718 | |
| | 16,025 | | | Zebra Technologies, Class A * | | | 1,002,524 | |
| | | | | | | | |
| | | | | | | 26,715,345 | |
| | | | | | | | |
See accompanying Notes to Financial Statements.
| | |
| |
| ASTON Small Cap Fund | | April 30, 2016 |
| |
| Schedule of Investments (unaudited) – continued | | |
| | | | | | | | |
Shares | | | | | Market
Value | |
| | |
| | | | Materials – 3.19% | | | | |
| | 33,383 | | | Balchem | | $ | 2,048,381 | |
| | 61,869 | | | Flotek Industries * | | | 584,662 | |
| | 54,092 | | | KapStone Paper and Packaging | | | 859,522 | |
| | | | | | | | |
| | | | | | | 3,492,565 | |
| | | | | | | | |
| | |
| | | | Total Common Stocks
(Cost $97,603,595) | | | 108,981,169 | |
| | | | | | | | |
|
| | INVESTMENT COMPANY – 0.79% | |
| | |
| | 867,298 | | | BlackRock Liquidity Funds
TempFund Portfolio | | | 867,298 | |
| | | | | | | | |
| | |
| | | | Total Investment Company
(Cost $867,298) | | | 867,298 | |
| | | | | | | | |
| Total Investments – 100.42%
(Cost $98,470,893)** | | | 109,848,467 | |
| | | | | | | | |
| Net Other Assets and Liabilities – (0.42)% | | | (462,950 | ) |
| | | | | | | | |
| Net Assets – 100.00% | | $ | 109,385,517 | |
| | | | | | | | |
| * | | Non-income producing security. |
| ** | | At April 30, 2016, the aggregate cost for Federal income tax purposes approximates the aggregate cost for book purposes. The aggregate gross unrealized appreciation and depreciation were as follows: |
| | | | |
Gross unrealized appreciation | | $ | 14,721,712 | |
Gross unrealized depreciation | | | (3,344,138 | ) |
| | | | |
Net unrealized appreciation | | $ | 11,377,574 | |
| | | | |
| REIT | | Real Estate Investment Trust |
| SP ADR | | Sponsored American Depositary Receipt |
See accompanying Notes to Financial Statements.
| | |
| |
| ASTON/DoubleLine Core Plus Fixed Income Fund | | April 30, 2016 |
| |
| Schedule of Investments (unaudited) | | |
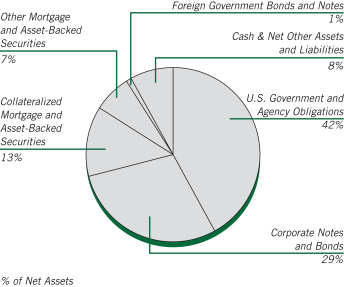
At April 30, 2016, 23.1% of the Total Net Assets of the Fund were comprised of securities of issuers located outside the United States.
| | | | | | | | |
Par Value | | | | | Market
Value | |
| | | | | | | |
|
| | CORPORATE NOTES AND BONDS – 29.20% | |
| | |
| | | | Basic Materials – 0.40% | | | | |
| | $ 300,000 | | | Freeport-McMoRan
4.000%, 11/14/21 | | $ | 266,999 | |
| | 1,000,000 | | | Inversiones CMPC SA (Chile)
4.500%, 04/25/22 | | | 1,038,463 | |
| | 200,000 | | | Minsur SA (Peru)
Senior Unsecured Notes
6.250%, 02/07/24 | | | 195,499 | |
| | 160,000 | | | PQ
Senior Secured Notes
6.750%, 11/15/22 (c) | | | 165,199 | |
| | | | Sociedad Quimica y Minera de Chile SA (Chile)
Senior Unsecured Notes | | | | |
| | 200,000 | | | 5.500%, 04/21/20 | | | 210,499 | |
| | 1,000,000 | | | 4.375%, 01/28/25 | | | 969,999 | |
| | | | | | | | |
| | | | | | | 2,846,658 | |
| | | | | | | | |
| | |
| | | | Consumer Discretionary – 1.30% | | | | |
| | 355,000 | | | Amazon.com
Senior Unsecured Notes
3.800%, 12/05/24 | | | 391,656 | |
| | 305,000 | | | American Axle & Manufacturing
6.625%, 10/15/22 | | | 324,062 | |
| | 50,000 | | | Anthem
Senior Unsecured Notes
1.875%, 01/15/18 | | | 50,229 | |
| | 130,000 | | | Asbury Automotive Group
6.000%, 12/15/24 | | | 134,874 | |
| | 350,000 | | | Celgene
Senior Unsecured Notes
3.875%, 08/15/25 | | | 370,465 | |
| | | | | | | | |
Par Value | | | | | Market
Value | |
| | | | | | | |
| | |
| | | | Consumer Discretionary (continued) | | | | |
| | $ 100,000 | | | Family Tree Escrow
Senior Secured Notes
5.750%, 03/01/23 (a) | | $ | 107,124 | |
| | 565,000 | | | Ford Motor
Senior Unsecured Notes
7.450%, 07/16/31 | | | 751,161 | |
| | 590,000 | | | General Motors Financial
4.200%, 03/01/21 | | | 622,369 | |
| | 190,000 | | | GLP Capital LP
5.375%, 04/15/26 | | | 198,312 | |
| | 330,000 | | | Goodyear Tire & Rubber
5.125%, 11/15/23 | | | 342,374 | |
| | 195,000 | | | Gray Television
7.500%, 10/01/20 | | | 205,237 | |
| | 600,000 | | | Grupo Idesa SA de CV (Mexico)
7.875%, 12/18/20 (a) | | | 589,499 | |
| | 330,000 | | | HD Supply
7.500%,07/15/20 | | | 351,038 | |
| | 60,000 | | | 5.750%,04/15/24 (a) | | | 63,074 | |
| | 260,000 | | | Home Depot
Senior Unsecured Notes
3.350%, 09/15/25 | | | 281,732 | |
| | 420,000 | | | 3.000%, 04/01/26 | | | 439,454 | |
| | 300,000 | | | Hutchison Whampoa International 12 (Cayman Islands)
6.000%, 05/29/49 (b) | | | 311,249 | |
| | 700,000 | | | Hutchison Whampoa International 12 II (Cayman Islands)
3.250%, 11/08/22 | | | 727,812 | |
| | 205,000 | | | Levi Strauss
Senior Unsecured Notes
5.000%, 05/01/25 | | | 208,588 | |
| | 285,000 | | | NCL (Bermuda)
Senior Unsecured Notes
5.250%, 11/15/19 (a) | | | 294,263 | |
| | 240,000 | | | Newell Brands
Senior Unsecured Notes
3.150%, 04/01/21 | | | 248,633 | |
| | 90,000 | | | Pilgrim’s Pride
5.750%, 03/15/25 (a) | | | 92,025 | |
| | 155,000 | | | Regal Entertainment Group
Senior Unsecured Notes
5.750%, 03/15/22 | | | 162,169 | |
| | 305,000 | | | Sally Holdings
5.750%, 06/01/22 | | | 321,013 | |
| | 185,000 | | | Station Casinos
7.500%, 03/01/21 | | | 196,066 | |
| | 330,000 | | | Tenet Healthcare
Senior Unsecured Notes
6.750%, 06/15/23 | | | 328,763 | |
| | 765,000 | | | Teva Pharmaceutical Finance Co BV
(Cook Islands)
2.950%, 12/18/22 | | | 769,484 | |
| | 210,000 | | | Viking Cruises (Bermuda)
Senior Unsecured Notes
8.500%, 10/15/22 (a) | | | 198,450 | |
| | 170,000 | | | WMG Acquisition
6.750%, 04/15/22 (a) | | | 169,150 | |
| | | | | | | | |
| | | | | | | 9,250,325 | |
| | | | | | | | |
See accompanying Notes to Financial Statements.
| | |
| |
| ASTON/DoubleLine Core Plus Fixed Income Fund | | April 30, 2016 |
| |
| Schedule of Investments (unaudited) – continued | | |
| | | | | | | | |
Par Value | | | | | Market
Value | |
| | | | | | | |
| | |
| | | | Consumer Staples – 2.50% | | | | |
| | $ 400,000 | | | Ajecorp BV (Netherlands)
6.500%, 05/14/22 | | $ | 183,040 | |
| | 150,000 | | | Camposol SA (Peru)
9.875%,02/02/17 (a) | | | 117,750 | |
| | 280,000 | | | 9.875%,02/02/17 | | | 219,800 | |
| | 600,000 | | | Central American Bottling
(British Virgin Islands)
6.750%, 02/09/22 | | | 631,500 | |
| | 525,000 | | | Coca-Cola
Senior Unsecured Notes
1.650%, 11/01/18 | | | 533,858 | |
| | 370,000 | | | 1.875%, 10/27/20 | | | 376,898 | |
| | 800,000 | | | Corp Azucarera del Peru SA (Peru)
6.375%, 08/02/22 | | | 692,000 | |
| | 1,300,000 | | | Cosan Overseas (Cayman Islands)
8.250%, 11/29/49 | | | 1,162,200 | |
| | 175,000 | | | Dana Holding
Senior Unsecured Notes
5.500%, 12/15/24 | | | 171,063 | |
| | 1,636,942 | | | ENA Norte Trust (Panama)
4.950%, 04/25/23 | | | 1,673,773 | |
| | 390,000 | | | Express Scripts Holding
4.500%, 02/25/26 | | | 419,154 | |
| | 400,000 | | | Grupo Bimbo SAB de CV (Mexico)
4.500%, 01/25/22 | | | 428,078 | |
| | 220,000 | | | HCA
5.375%,02/01/25 | | | 225,225 | |
| | 175,000 | | | 5.875%,02/15/26 | | | 182,000 | |
| | 400,000 | | | JBS Investments GmbH (Austria)
7.250%, 04/03/24 | | | 389,000 | |
| | 340,000 | | | JBS USA
Senior Unsecured Notes
5.750%, 06/15/25 (a) | | | 314,500 | |
| | 460,000 | | | Kraft Heinz Foods
1.600%,06/30/17 (a) | | | 461,648 | |
| | 230,000 | | | 2.000%,07/02/18 (a) | | | 232,591 | |
| | 100,000 | | | Kroger
Senior Notes
6.150%, 01/15/20 | | | 115,189 | |
| | 730,000 | | | Senior Unsecured Notes 3.400%, 04/15/22 | | | 772,560 | |
| | | | Laboratory Corp of America Holdings Senior Unsecured Notes | | | | |
| | 670,000 | | | 2.500%, 11/01/18 | | | 677,947 | |
| | 725,000 | | | 4.700%, 02/01/45 | | | 741,513 | |
| | 130,000 | | | Maestro Peru SA (Peru)
6.750%, 09/26/19 | | | 134,550 | |
| | | | Marfrig Holding Europe BV (Netherlands) | | | | |
| | 200,000 | | | 6.875%,06/24/19 (a) | | | 198,500 | |
| | 800,000 | | | 6.875%,06/24/19 | | | 794,000 | |
| | 300,000 | | | Minerva Luxembourg SA (Luxembourg)
8.750%,12/29/49 (a) (b) | | | 294,000 | |
| | 600,000 | | | 8.750%,12/29/49 (b) | | | 588,000 | |
| | 190,000 | | | Post Holdings
7.375%, 02/15/22 | | | 200,925 | |
| | 320,000 | | | Prime Security Services Borrower
Secured Notes
9.250%, 05/15/23 (c) | | | 333,600 | |
| | | | | | | | |
Par Value | | | | | Market
Value | |
| | | | | | | |
| | |
| | | | Consumer Staples (continued) | | | | |
| | $ 115,000 | | | RegionalCare Hospital
Partners Holdings
Senior Secured Notes
8.250%, 05/01/23 | | $ | 119,888 | |
| | 385,000 | | | Revlon Consumer Products
5.750%, 02/15/21 | | | 393,181 | |
| | 200,000 | | | Rite Aid
6.125%, 04/01/23 (a) | | | 214,875 | |
| | 315,000 | | | Scientific Games International
Senior Secured Notes
7.000%, 01/01/22 (a) | | | 321,694 | |
| | 311,000 | | | Service Corp International
Senior Unsecured Notes
5.375%, 01/15/22 | | | 327,328 | |
| | 285,000 | | | Spectrum Brands
5.750%, 07/15/25 | | | 303,710 | |
| | 90,000 | | | TreeHouse Foods
6.000%, 02/15/24 (a) | | | 96,188 | |
| | 1,370,000 | | | Tyson Foods
3.950%, 08/15/24 | | | 1,475,972 | |
| | 205,000 | | | Vizient
Senior Unsecured Notes
10.375%, 03/01/24 (a) | | | 223,963 | |
| | 650,000 | | | Wal-Mart Stores
Senior Unsecured Notes
4.300%, 04/22/44 | | | 734,434 | |
| | 245,000 | | | Zimmer Biomet Holdings
Senior Unsecured Notes
2.700%, 04/01/20 | | | 250,098 | |
| | | | | | | | |
| | | | | | | 17,726,193 | |
| | | | | | | | |
| | |
| | | | Energy – 3.24% | | | | |
| | 565,000 | | | Apache
Senior Unsecured Notes
4.750%, 04/15/43 | | | 556,783 | |
| | 300,000 | | | Bharat Petroleum (India)
Senior Unsecured Notes
4.625%, 10/25/22 | | | 319,890 | |
| | 500,000 | | | Bharat Petroleum (India), EMTN
4.000%, 05/08/25 | | | 501,997 | |
| | 575,000 | | | BP Capital Markets (United Kingdom)
3.062%, 03/17/22 | | | 593,474 | |
| | 110,000 | | | 3.119%,05/04/26 (c) | | | 111,276 | |
| | 351,000 | | | Chevron
Senior Unsecured Notes
1.365%, 03/02/18 | | | 352,645 | |
| | 190,000 | | | 1.790%, 11/16/18 | | | 192,501 | |
| | 1,100,000 | | | CNOOC Finance 2015 Australia Property (Australia)
2.625%, 05/05/20 | | | 1,099,370 | |
| | 500,000 | | | Comision Federal De Electricidad (Mexico)
Senior Unsecured Notes
4.875%, 05/26/21 | | | 527,500 | |
| | 2,000,000 | | | Delek & Avner Tamar Bond (Israel) Senior Unsecured Notes
4.435%, 12/30/20 (a) | | | 2,040,000 | |
| | 500,000 | | | 5.412%, 12/30/25 (a) | | | 513,125 | |
See accompanying Notes to Financial Statements.
| | |
| |
| ASTON/DoubleLine Core Plus Fixed Income Fund | | April 30, 2016 |
| |
| Schedule of Investments (unaudited) – continued | | |
| | | | | | | | |
Par Value | | | | | Market
Value | |
| | | | | | | |
| | |
| | | | Energy (continued) | | | | |
| | $ 400,000 | | | Ecopetrol SA (Colombia)
Senior Unsecured Notes
4.125%, 01/16/25 | | $ | 351,000 | |
| | 1,150,000 | | | 5.875%, 05/28/45 | | | 941,160 | |
| | 220,000 | | | Energy Transfer Partners LP
Senior Unsecured Notes
5.200%, 02/01/22 | | | 220,916 | |
| | 545,000 | | | 4.750%, 01/15/26 | | | 529,467 | |
| | 330,000 | | | Energy XXI Gulf Coast 9.250%,12/15/17 (d) | | | 10,106 | |
| | 45,000 | | | 7.500%,12/15/21 (d) | | | 2,306 | |
| | 44,000 | | | Senior Secured Notes 11.000%, 03/15/20 (a) (d) | | | 15,620 | |
| | 325,000 | | | EOG Resources
Senior Unsecured Notes
4.150%, 01/15/26 | | | 348,061 | |
| | 115,000 | | | EPL Oil & Gas
8.250%, 02/15/18 | | | 8,122 | |
| | 200,000 | | | Inkia Energy (Bermuda)
Senior Unsecured Notes
8.375%, 04/04/21 (a) | | | 207,500 | |
| | 600,000 | | | 8.375%, 04/04/21 | | | 622,500 | |
| | 1,200,000 | | | Instituto Costarricense de Electricidad (Costa Rica)
Senior Unsecured Notes
6.950%, 11/10/21 | | | 1,230,000 | |
| | 370,000 | | | Kinder Morgan Energy Partners, MTN Senior Unsecured Notes
6.950%, 01/15/38 | | | 388,244 | |
| | 395,000 | | | Memorial Production Partners
Senior Unsecured Notes
6.875%, 08/01/22 | | | 163,925 | |
| | 215,000 | | | MPLX LP
5.500%, 02/15/23 (a) | | | 214,678 | |
| | 180,000 | | | Occidental Petroleum
Senior Unsecured Notes
3.400%, 04/15/26 | | | 186,377 | |
| | 500,000 | | | Oleoducto Central SA (Colombia)
Senior Unsecured Notes
4.000%, 05/07/21 | | | 481,250 | |
| | 1,500,000 | | | ONGC Videsh
3.750%,05/07/23 | | | 1,496,898 | |
| | 200,000 | | | 4.625%,07/15/24 | | | 209,135 | |
| | 750,000 | | | Pacific Rubiales Energy
(Canada)
5.125%,03/28/23 (d) | | | 114,375 | |
| | 500,000 | | | 5.625%,01/19/25 (a) (d) | | | 77,500 | |
| | 300,000 | | | 5.625%,01/19/25 (d) | | | 46,500 | |
| | 200,000 | | | Petroleos Mexicanos (Mexico)
5.500%,01/21/21 | | | 210,250 | |
| | 400,000 | | | 4.500%,01/23/26 | | | 381,560 | |
| | 500,000 | | | 6.375%,01/23/45 | | | 490,000 | |
| | 1,265,000 | | | 5.625%,01/23/46 | | | 1,130,986 | |
| | 2,000,000 | | | Petronas Global Sukuk (Morocco)
Senior Unsecured Notes
2.707%, 03/18/20 | | | 2,015,174 | |
| | | | | | | | |
Par Value | | | | | Market
Value | |
| | | | | | | |
| | |
| | | | Energy (continued) | | | | |
| | $ 181,000 | | | Phillips 66
5.875%,05/01/42 | | $ | 211,744 | |
| | 75,000 | | | 4.875%,11/15/44 | | | 81,349 | |
| | 1,500,000 | | | Reliance Industries (India)
Senior Unsecured Notes
5.875%, 02/28/49 | | | 1,501,875 | |
| | 115,000 | | | Sanchez Energy
6.125%, 01/15/23 | | | 86,538 | |
| | 40,000 | | | Sandridge Energy
Senior Secured Notes
8.750%, 06/01/20 (a) | | | 11,800 | |
| | 350,000 | | | Schlumberger Holdings
Senior Unsecured Notes
2.350%, 12/21/18 (a) | | | 354,999 | |
| | 1,700,000 | | | Transportadora de Gas Internacional SA ESP (Colombia)
Senior Unsecured Notes
5.700%, 03/20/22 | | | 1,776,500 | |
| | | | | | | | |
| | | | | | | 22,926,976 | |
| | | | | | | | |
| | |
| | | | Financials – 10.57% | | | | |
| | 400,000 | | | Agromercantil Senior Trust (Cayman Islands)
6.250%,04/10/19 (a) | | | 411,000 | |
| | 900,000 | | | 6.250%,04/10/19 | | | 924,750 | |
| | 5,000 | | | Air Lease
Senior Unsecured Notes
3.375%, 06/01/21 | | | 5,038 | |
| | 695,000 | | | 3.750%, 02/01/22 | | | 701,582 | |
| | 1,305,000 | | | Alibaba Group Holding
3.600%, 11/28/24 | | | 1,322,895 | |
| | 525,000 | | | Ally Financial
Senior Unsecured Notes
4.125%, 03/30/20 | | | 536,156 | |
| | 180,000 | | | Ally Financial
Senior Unsecured Notes
4.250%, 04/15/21 | | | 183,600 | |
| | 145,000 | | | American Express Credit
Senior Unsecured Notes
2.125%, 03/18/19 | | | 147,161 | |
| | 1,350,000 | | | American Express Credit, GMTN Senior Unsecured Notes
2.250%, 08/15/19 | | | 1,373,394 | |
| | 365,000 | | | Anheuser-Busch InBev Finance
4.900%, 02/01/46 | | | 413,460 | |
| | 110,000 | | | Argos Merger Sub
Senior Unsecured Notes
7.125%, 03/15/23 (a) | | | 112,750 | |
| | 665,000 | | | Australia & New Zealand Banking Group, EMTN (Australia)
Senior Unsecured Notes
4.875%, 01/12/21 (a) | | | 742,756 | |
| | 500,000 | | | Banco Bilbao Vizcaya Argentaria Colombia SA (Colombia)
Subordinated Notes
4.875%, 04/21/25 | | | 493,250 | |
| | 1,000,000 | | | Banco Continental SAECA (Paraguay)
Senior Unsecured Notes
8.875%, 10/15/17 | | | 1,025,000 | |
See accompanying Notes to Financial Statements.
| | |
| |
| ASTON/DoubleLine Core Plus Fixed Income Fund | | April 30, 2016 |
| |
| Schedule of Investments (unaudited) – continued | | |
| | | | | | | | |
Par Value | | | | | Market
Value | |
| | | | | | | |
| | |
| | | | Financials (continued) | | | | |
| | $ 800,000 | | | Banco de Costa Rica (Costa Rica)
5.250%, 08/12/18 | | $ | 814,000 | |
| | 1,225,000 | | | Banco de Credito del Peru (Peru)
Subordinated Notes
6.125%, 04/24/27 (b) | | | 1,331,575 | |
| | 1,000,000 | | | Banco de Credito e Inversiones (Chile)
Senior Unsecured Notes
4.000%, 02/11/23 | | | 1,039,453 | |
| | 500,000 | | | Banco do Brasil SA (Brazil)
9.000%, 06/29/49 (a) (b) | | | 361,250 | |
| | 700,000 | | | Banco GNB Sudameris SA (Colombia)
Subordinated Notes
7.500%, 07/30/22 | | | 717,500 | |
| | 2,100,000 | | | Banco Internacional del Peru SAA (Peru)
Subordinated Notes
6.625%, 03/19/29 (b) | | | 2,194,500 | |
| | 1,600,000 | | | Banco Latinoamericano de Comercio Exterior SA (Panama)
Senior Unsecured Notes
3.250%, 05/07/20 | | | 1,618,000 | |
| | 1,000,000 | | | Banco Mercantil del Norte SA (Mexico)
Subordinated Notes
6.862%, 10/13/21 (b) | | | 1,010,000 | |
| | 600,000 | | | Banco Nacional de Comercio Exterior SNC (Mexico)
Senior Unsecured Notes
4.375%, 10/14/25 | | | 615,000 | |
| | 1,000,000 | | | 4.375%, 10/14/25 (a) | | | 1,025,000 | |
| | 600,000 | | | Banco Nacional de Costa Rica (Costa Rica)
Senior Unsecured Notes
4.875%, 11/01/18 | | | 601,500 | |
| | 1,000,000 | | | 5.875%, 04/25/21 | | | 1,003,750 | |
| | 150,000 | | | Banco Regional SAECA (Paraguay)
Senior Unsecured Notes
8.125%, 01/24/19 (a) | | | 156,420 | |
| | 950,000 | | | 8.125%, 01/24/19 | | | 990,660 | |
| | 2,300,000 | | | Banco Santander Mexico SA Institucion de Banca Multiple Grupo Financiero Santand (Mexico)
Subordinated Notes
5.950%, 01/30/24 (b) | | | 2,409,250 | |
| | 1,500,000 | | | Bancolombia SA (Colombia)
Subordinated Notes
6.125%, 07/26/20 | | | 1,592,550 | |
| | 570,000 | | | Bank of America
Senior Unsecured Notes
2.000%, 01/11/18 | | | 572,896 | |
| | 600,000 | | | 2.625%, 04/19/21 | | | 604,238 | |
| | 645,000 | | | Bank of Montreal, MTN (Canada)
Senior Unsecured Notes
2.375%, 01/25/19 | | | 658,618 | |
| | 150,000 | | | Bantrab Senior Trust (Cayman Islands)
Senior Secured Notes
9.000%, 11/14/20 | | | 120,750 | |
| | | | | | | | |
Par Value | | | | | Market
Value | |
| | | | | | | |
| | |
| | | | Financials (continued) | | | | |
| | $ 685,000 | | | BB&T, MTN
Senior Unsecured Notes
2.450%, 01/15/20 | | $ | 702,022 | |
| | 750,000 | | | BBVA Banco Continental SA (Peru)
Subordinated Notes
5.250%,09/22/29 (b) | | | 768,750 | |
| | 1,100,000 | | | 5.350%,11/12/29 (b) | | | 1,075,250 | |
| | 1,000,000 | | | BBVA Bancomer SA (Mexico)
Subordinated Notes
6.008%, 05/17/22 (b) | | | 1,023,900 | |
| | 300,000 | | | 5.350%, 11/12/29 (a) (b) | | | 293,250 | |
| | 250,000 | | | BBVA Colombia SA (Colombia)
Subordinated Notes
4.875%, 04/21/25 (a) | | | 246,625 | |
| | 635,000 | | | Boston Properties, REIT
Senior Unsecured Notes
4.125%, 05/15/21 | | | 686,001 | |
| | 200,000 | | | Cementos Progreso Trust
(Cayman Islands)
7.125%, 11/06/23 | | | 214,000 | |
| | 425,000 | | | Centene Escrow
Senior Unsecured Notes
5.625%, 02/15/21 (a) (c) | | | 447,313 | |
| | 200,000 | | | CIMPOR Financial Operations BV (Netherlands)
5.750%,07/17/24 (a) | | | 153,740 | |
| | 200,000 | | | 5.750%,07/17/24 | | | 153,740 | |
| | 625,000 | | | Citigroup
Senior Unsecured Notes
2.650%, 10/26/20 | | | 633,225 | |
| | 485,000 | | | 2.700%, 03/30/21 | | | 491,594 | |
| | 300,000 | | | Comcel Trust (Cayman Islands)
6.875%, 02/06/24 (a) | | | 285,000 | |
| | 750,000 | | | Corp Financiera de Desarrollo SA (Peru)
Senior Unsecured Notes
4.750%, 02/08/22 | | | 798,750 | |
| | 1,300,000 | | | Subordinated Notes 5.250%, 07/15/29 (b) | | | 1,329,250 | |
| | 250,000 | | | CorpGroup Banking SA (Chile)
Senior Unsecured Notes
6.750%, 03/15/23 (a) | | | 239,063 | |
| | 500,000 | | | 6.750%, 03/15/23 | | | 478,125 | |
| | 200,000 | | | Credito Real SAB de CV (Mexico)
Senior Unsecured Notes
7.500%, 03/13/19 (a) | | | 204,250 | |
| | 200,000 | | | 7.500%, 03/13/19 | | | 204,250 | |
| | 1,000,000 | | | DBS Bank
Subordinated Notes
3.625%, 09/21/22 (b) | | | 1,026,203 | |
| | 180,000 | | | Equinix
Senior Unsecured Notes
5.875%, 01/15/26 | | | 190,912 | |
| | 405,000 | | | ESH Hospitality
5.250%, 05/01/25 (a) | | | 401,456 | |
| | 300,000 | | | Fondo MIVIVIENDA SA
Senior Unsecured Notes
3.500%, 01/31/23 | | | 300,300 | |
See accompanying Notes to Financial Statements.
| | |
| |
| ASTON/DoubleLine Core Plus Fixed Income Fund | | April 30, 2016 |
| |
| Schedule of Investments (unaudited) – continued | | |
| | | | | | | | |
Par Value | | | | | Market
Value | |
| | | | | | | |
| | |
| | | | Financials (continued) | | | | |
| | $ 345,000 | | | General Motors Financial
3.200%, 07/13/20 | | $ | 351,960 | |
| | 800,000 | | | Global Bank (Panama)
Senior Unsecured Notes
4.750%, 10/05/17 | | | 818,240 | |
| | 1,500,000 | | | 5.125%, 10/30/19 | | | 1,527,000 | |
| | 700,000 | | | 5.125%, 10/30/19 (a) | | | 712,600 | |
| | 760,000 | | | Goldman Sachs Group
Senior Unsecured Notes
2.875%, 02/25/21 | | | 772,966 | |
| | 1,900,000 | | | Grupo Aval (Cayman Islands)
4.750%, 09/26/22 | | | 1,840,625 | |
| | 1,000,000 | | | GrupoSura Finance SA (Cayman Islands)
5.700%,05/18/21 | | | 1,065,000 | |
| | 700,000 | | | 5.500%,04/29/26 | | | 713,125 | |
| | 1,483,314 | | | Guanay Finance (Cayman Islands)
Senior Secured Notes
6.000%, 12/15/20 | | | 1,479,605 | |
| | 1,700,000 | | | Industrial Senior Trust (Cayman Islands)
5.500%, 11/01/22 | | | 1,657,500 | |
| | 800,000 | | | Intercorp Peru (Peru)
Senior Unsecured Notes
5.875%, 02/12/25 | | | 794,000 | |
| | 765,000 | | | JPMorgan Chase
Senior Unsecured Notes
2.550%, 10/29/20 | | | 775,880 | |
| | 745,000 | | | Subordinated Notes 4.250%, 10/01/27 | | | 778,383 | |
| | 884,000 | | | Liberty Mutual Group
6.500%, 05/01/42 (a) | | | 1,042,450 | |
| | 700,000 | | | Magnesita Finance (British Virgin Islands)
8.625%, 04/29/49 | | | 444,500 | |
| | 345,000 | | | McGraw Hill Financial
4.400%, 02/15/26 | | | 382,634 | |
| | 60,000 | | | MGP Escrow Issuer
5.625%, 05/01/24 | | | 62,588 | |
| | 740,000 | | | Morgan Stanley
Senior Unsecured Notes
2.650%, 01/27/20 | | | 751,329 | |
| | 220,000 | | | 2.500%, 04/21/21 | | | 220,800 | |
| | 730,000 | | | 3.875%, 01/27/26 | | | 759,350 | |
| | 720,000 | | | MUFG Americas Holdings
Senior Unsecured Notes
1.625%, 02/09/18 | | | 718,052 | |
| | 105,000 | | | National Rural Utilities Cooperative
Finance
10.375%,11/01/18 | | | 127,773 | |
| | 990,000 | | | 2.000%,01/27/20 | | | 1,001,197 | |
| | 195,000 | | | OPE KAG Finance
Senior Unsecured Notes
7.875%, 07/31/23 (a) | | | 200,363 | |
| | 2,000,000 | | | Oversea-Chinese Banking, EMTN (Singapore)
Subordinated Notes
4.000%, 10/15/24 (b) | | | 2,083,940 | |
| | | | | | | | |
Par Value | | | | | Market
Value | |
| | | | | | | |
| | |
| | | | Financials (continued) | | | | |
| | $ 400,000 | | | Peru Enhanced Pass-Through Finance (Cayman Islands)
0.000%, 06/02/25 (e) (f) | | $ | 313,028 | |
| | 660,000 | | | PNC Funding
3.300%, 03/08/22 | | | 696,760 | |
| | 210,000 | | | Royal Bank of Canada
Senior Unsecured Notes
2.500%, 01/19/21 | | | 214,705 | |
| | 690,000 | | | Simon Property Group, REIT
Senior Unsecured Notes
3.300%, 01/15/26 | | | 725,888 | |
| | 495,000 | | | State Street
Senior Unsecured Notes
3.550%, 08/18/25 | | | 534,160 | |
| | 1,500,000 | | | SUAM Finance BV (Netherlands)
4.875%, 04/17/24 | | | 1,533,750 | |
| | 770,000 | | | Sumitomo Mitsui Financial Group Senior Unsecured Notes
2.934%, 03/09/21 | | | 786,761 | |
| | 725,000 | | | Synchrony Financial
Senior Unsecured Notes
3.000%, 08/15/19 | | | 736,107 | |
| | 1,000,000 | | | Tanner Servicios Financieros SA (Chile)
Senior Unsecured Notes
4.375%, 03/13/18 | | | 1,006,500 | |
| | 740,000 | | | TIAA Asset Management Finance Senior Unsecured Notes
2.950%, 11/01/19 (a) | | | 755,371 | |
| | 710,000 | | | Toronto-Dominion Bank
Senior Unsecured Notes
2.125%, 04/07/21 | | | 710,930 | |
| | 200,000 | | | Unifin Financiera SA de CV
(Mexico)
6.250%,07/22/19 (a) | | | 193,250 | |
| | 700,000 | | | 6.250%,07/22/19 | | | 678,160 | |
| | 2,000,000 | | | United Overseas Bank, EMTN (Singapore)
Subordinated Notes
3.750%, 09/19/24 (b) | | | 2,056,900 | |
| | 500,000 | | | 3.500%, 09/16/26 (b) | | | 502,345 | |
| | 480,000 | | | Wells Fargo
Senior Unsecured Notes
3.000%, 04/22/26 | | | 478,018 | |
| | 880,000 | | | Wells Fargo, MTN
Senior Unsecured Notes
3.550%, 09/29/25 | | | 922,632 | |
| | 765,000 | | | Westpac Banking
Senior Unsecured Notes
2.600%, 11/23/20 | | | 782,493 | |
| | | | | | | | |
| | | | | | | 74,886,289 | |
| | | | | | | | |
| | |
| | | | Healthcare – 0.73% | | | | |
| | 683,000 | | | AbbVie
Senior Unsecured Notes
4.700%, 05/14/45 | | | 727,578 | |
| | 708,000 | | | Actavis Funding SCS (Luxembourg)
2.350%, 03/12/18 | | | 715,774 | |
See accompanying Notes to Financial Statements.
| | |
| |
| ASTON/DoubleLine Core Plus Fixed Income Fund | | April 30, 2016 |
| |
| Schedule of Investments (unaudited) – continued | | |
| | | | | | | | |
Par Value | | | | | Market
Value | |
| | | | | | | |
| | |
| | | | Healthcare (continued) | | | | |
| | $ 695,000 | | | AstraZeneca
Senior Unsecured Notes
2.375%, 11/16/20 | | $ | 710,729 | |
| | 515,000 | | | Cardinal Health
Senior Unsecured Notes
1.950%, 06/15/18 | | | 520,680 | |
| | 565,000 | | | Eli Lilly
Senior Unsecured Notes
3.700%, 03/01/45 | | | 586,817 | |
| | 220,000 | | | Quintiles Transnational
4.875%, 05/15/23 (a) | | | 226,325 | |
| | 320,000 | | | Select Medical
6.375%, 06/01/21 | | | 305,200 | |
| | 150,000 | | | Team Health
7.250%, 12/15/23 (a) | | | 159,656 | |
| | 770,000 | | | WellPoint
Senior Unsecured Notes
2.300%, 07/15/18 | | | 780,862 | |
| | 421,000 | | | Zimmer Holdings
Senior Unsecured Notes
1.450%, 04/01/17 | | | 421,424 | |
| | | | | | | | |
| | | | | | | 5,155,045 | |
| | | | | | | | |
| | |
| | | | Industrials – 2.36% | | | | |
| | 850,000 | | | Aeropuerto Internacional de Tocumen SA (Panama)
Senior Secured Notes
5.750%, 10/09/23 | | | 872,950 | |
| | 200,000 | | | Aeropuertos Dominicanos Siglo XXI SA (Domican Republic)
Senior Secured Notes
9.750%, 11/13/19 (a) | | | 213,500 | |
| | 200,000 | | | 9.750%, 11/13/19 | | | 213,500 | |
| | 335,000 | | | Air Medical Merger Sub
Senior Unsecured Notes
6.375%, 05/15/23 (a) | | | 323,275 | |
| | 400,000 | | | Avianca Holdings SA (Panama)
8.375%,05/10/20 (a) | | | 320,000 | |
| | 800,000 | | | 8.375%,05/10/20 | | | 640,000 | |
| | 240,000 | | | Berry Plastics
Secured Notes
5.500%, 05/15/22 | | | 247,800 | |
| | 357,000 | | | Boeing
Senior Unsecured Notes
6.875%, 03/15/39 | | | 520,770 | |
| | 700,000 | | | Burlington Northern Santa Fe
Senior Unsecured Notes
4.550%, 09/01/44 | | | 779,887 | |
| | 390,000 | | | Delphi
4.150%, 03/15/24 | | | 409,977 | |
| | 299,000 | | | Delphi Automotive
4.250%, 01/15/26 | | | 317,321 | |
| | 414,000 | | | Enterprise Products Operating
3.700%, 02/15/26 | | | 422,380 | |
| | 600,000 | | | ESAL GmbH (Austria)
6.250%,02/05/23 (a) | | | 556,320 | |
| | 200,000 | | | 6.250%,02/05/23 | | | 185,440 | |
| | | | | | | | |
Par Value | | | | | Market
Value | |
| | | | | | | |
| | |
| | | | Industrials (continued) | | | | |
| | $ 705,000 | | | FedEx
4.750%, 11/15/45 | | $ | 775,328 | |
| | 255,000 | | | Gates Global
6.000%, 07/15/22 (a) | | | 223,125 | |
| | 200,000 | | | Grupo Cementos de Chihuahua SAB de CV (Mexico)
Senior Secured Notes
8.125%, 02/08/20 | | | 210,500 | |
| | 750,000 | | | Grupo Elektra SAB de CV (Mexico)
7.250%, 08/06/18 | | | 749,063 | |
| | 200,000 | | | Grupo Posadas SAB de CV (Mexico)
7.875%, 06/30/22 (a) | | | 199,500 | |
| | 800,000 | | | Latam Airlines Group (Chile)
Senior Unsecured Notes
7.250%, 06/09/20 (a) | | | 762,000 | |
| | 700,000 | | | Lima Metro Line 2 Finance (Cayman Islands)
Senior Secured Notes
5.875%, 07/05/34 | | | 721,700 | |
| | 650,000 | | | Lockheed Martin
Senior Unsecured Notes
4.700%, 05/15/46 | | | 750,114 | |
| | 40,000 | | | Microsemi
9.125%, 04/15/23 (a) | | | 44,300 | |
| | 355,000 | | | Milacron
7.750%, 02/15/21 (a) | | | 358,106 | |
| | 400,000 | | | OAS Financial (British Virgin Islands)
8.875%,04/29/49 (a) (d) | | | 2,500 | |
| | 600,000 | | | 8.875%,04/29/49 (d) | | | 3,750 | |
| | 400,000 | | | Odebrecht Finance (Cayman Island)
7.125%, 06/26/42 | | | 149,000 | |
| | 200,000 | | | Pesquera Exalmar S.A.A. (Peru)
Senior Unsecured Notes
7.375%, 01/31/20 (a) | | | 150,500 | |
| | 400,000 | | | 7.375%, 01/31/20 | | | 301,000 | |
| | 300,000 | | | Plastipak Holdings
Senior Unsecured Notes
6.500%, 10/01/21 (a) | | | 306,000 | |
| | 665,000 | | | Reynolds American
4.000%, 06/12/22 | | | 724,038 | |
| | 385,000 | | | Reynolds Group Issuer
8.250%, 02/15/21 | | | 400,400 | |
| | 200,000 | | | Southern Copper
Senior Unsecured Notes
7.500%, 07/27/35 | | | 216,064 | |
| | 300,000 | | | Terex
6.000%, 05/15/21 | | | 298,500 | |
| | 995,000 | | | Thermo Fisher Scientific
Senior Unsecured Notes
3.300%, 02/15/22 | | | 1,026,251 | |
| | 450,000 | | | TransDigm
6.000%, 07/15/22 | | | 457,740 | |
| | 350,000 | | | Union Andina de Cementos SAA (Peru)
Senior Unsecured Notes
5.875%, 10/30/21 (a) | | | 360,500 | |
| | 900,000 | | | 5.875%, 10/30/21 | | | 927,000 | |
| | 560,000 | | | Waste Management
4.100%, 03/01/45 | | | 579,801 | |
| | | | | | | | |
| | | | | | | 16,719,900 | |
| | | | | | | | |
See accompanying Notes to Financial Statements.
| | |
| |
| ASTON/DoubleLine Core Plus Fixed Income Fund | | April 30, 2016 |
| |
| Schedule of Investments (unaudited) – continued | | |
| | | | | | | | |
Par Value | | | | | Market
Value | |
| | | | | | | |
| | |
| | | | Information Technology – 1.29% | | | | |
| | $ 310,000 | | | Activision Blizzard
5.625%, 09/15/21 (a) | | $ | 327,050 | |
| | 490,000 | | | Apple
Senior Unsecured Notes
4.650%, 02/23/46 | | | 540,429 | |
| | 800,000 | | | Cisco Systems
Senior Unsecured Notes
1.650%, 06/15/18 | | | 811,637 | |
| | 125,000 | | | CSC Holdings LLC
Senior Unsecured Notes
5.250%, 06/01/24 | | | 114,063 | |
| | 410,000 | | | Ensemble S Merger
Senior Notes
9.000%, 09/30/23 (a) | | | 408,463 | |
| | 530,000 | | | Fidelity National Information Services Senior Unsecured Notes
3.625%, 10/15/20 | | | 555,373 | |
| | 140,000 | | | First Data
7.000%,12/01/23 (a) | | | 144,375 | |
| | 155,000 | | | 5.750%,01/15/24 (a) | | | 157,906 | |
| | 540,000 | | | Hewlett Packard Enterprise
3.600%, 10/15/20 (a) | | | 559,949 | |
| | 355,000 | | | Infor US
6.500%, 05/15/22 | | | 329,444 | |
| | 430,000 | | | International Business Machines
Senior Unsecured Notes 1.125%,02/06/18 | | | 431,046 | |
| | 330,000 | | | 1.250%, 02/08/18 | | | 331,424 | |
| | 160,000 | | | Micron Technology
Senior Secured Notes
7.500%, 09/15/23 | | | 166,000 | |
| | 675,000 | | | Microsoft
Senior Unsecured Notes
4.450%, 11/03/45 | | | 753,490 | |
| | 460,000 | | | Oracle
Senior Unsecured Notes
2.375%, 01/15/19 | | | 475,892 | |
| | 994,000 | | | 2.250%, 10/08/19 | | | 1,025,125 | |
| | 735,000 | | | 4.125%, 05/15/45 | | | 763,375 | |
| | 210,000 | | | Sabre Global
5.250%, 11/15/23 (a) | | | 213,675 | |
| | 305,000 | | | Sinclair Television Group
5.625%, 08/01/24 (a) | | | 314,531 | |
| | 145,000 | | | Solera
Senior Unsecured Notes
10.500%, 03/01/24 (a) | | | 152,250 | |
| | 80,000 | | | Western Digital
Senior Secured Notes
7.375%, 04/01/23 (a) | | | 80,800 | |
| | 450,000 | | | Xerox
Senior Unsecured Notes
2.950%, 03/15/17 | | | 454,599 | |
| | | | | | | | |
| | | | | | | 9,110,896 | |
| | | | | | | | |
| | | | | | | | |
Par Value | | | | | Market
Value | |
| | | | | | | |
| | |
| | | | Materials – 1.40% | | | | |
| | $ 325,000 | | | Ashland
4.750%, 08/15/22 | | $ | 328,088 | |
| | 500,000 | | | Braskem America Finance
7.125%, 07/22/41 | | | 447,350 | |
| | 1,000,000 | | | Celulosa Arauco y Constitucion SA (Chile)
Senior Unsecured Notes
5.000%, 01/21/21 | | | 1,075,356 | |
| | 1,100,000 | | | Cia Minera Ares SAC (Peru)
7.750%, 01/23/21 | | | 1,141,250 | |
| | 100,000 | | | Colbun SA (Chile)
Senior Unsecured Notes
6.000%, 01/21/20 | | | 110,896 | |
| | 300,000 | | | Freeport-McMoRan
3.875%,03/15/23 | | | 252,000 | |
| | 850,000 | | | 5.450%,03/15/43 | | | 646,000 | |
| | 1,435,000 | | | Georgia-Pacific
Senior Unsecured Notes
3.600%, 03/01/25 (a) | | | 1,500,667 | |
| | 600,000 | | | Grupo Idesa SA de CV (Mexico)
7.875%, 12/18/20 | | | 589,500 | |
| | 460,000 | | | Signode Industrial Group Lux SA
Senior Unsecured Notes
6.375%, 05/01/22 (a) | | | 450,800 | |
| | 200,000 | | | SINOPEC Group Overseas Development
(British Virgin Islands)
2.500%, 04/28/20 (a) | | | 200,003 | |
| | 1,000,000 | | | Southern Copper
Senior Unsecured Notes
6.750%, 04/16/40 | | | 1,000,081 | |
| | 280,000 | | | 5.250%, 11/08/42 | | | 242,394 | |
| | 800,000 | | | Vedanta Resources (United Kingdom)
Senior Unsecured Notes
7.125%, 05/31/23 (a) | | | 574,000 | |
| | 400,000 | | | 7.125%, 05/31/23 | | | 287,000 | |
| | 1,300,000 | | | Volcan Cia Minera SAA (Peru)
5.375%, 02/02/22 | | | 1,053,000 | |
| | | | | | | | |
| | | | | | | 9,898,385 | |
| | | | | | | | |
| | |
| | | | Telecommunications – 2.63% | | | | |
| | 365,000 | | | 21st Century Fox America
4.750%, 09/15/44 | | | 391,222 | |
| | 705,000 | | | AT&T
Senior Unsecured Notes
3.400%, 05/15/25 | | | 717,630 | |
| | 700,000 | | | Axiata SPV2 Bhd
Senior Unsecured Notes
3.466%, 11/19/20 | | | 719,279 | |
| | 2,000,000 | | | Bharti Airtel (India)
Senior Unsecured Notes
4.375%, 06/10/25 | | | 2,049,700 | |
| | 1,306,000 | | | British Telecommunications (United Kingdom)
Senior Unsecured Notes
5.950%, 01/15/18 | | | 1,407,333 | |
See accompanying Notes to Financial Statements.
| | |
| |
| ASTON/DoubleLine Core Plus Fixed Income Fund | | April 30, 2016 |
| |
| Schedule of Investments (unaudited) – continued | | |
| | | | | | | | |
Par Value | | | | | Market
Value | |
| | | | | | | |
| | |
| | | | Telecommunications (continued) | | | | |
| | $ 180,000 | | | CCO Holdings
5.250%,09/30/22 | | $ | 186,300 | |
| | 85,000 | | | 5.125%,05/01/23 (a) | | | 86,913 | |
| | 195,000 | | | 5.500%,05/01/26 | | | 199,388 | |
| | 445,000 | | | Cequel Communications Holdings I
Senior Unsecured Notes
6.375%, 09/15/20 (a) | | | 458,350 | |
| | 120,000 | | | Comcast
4.200%,08/15/34 | | | 127,946 | |
| | 570,000 | | | 4.400%,08/15/35 | | | 631,732 | |
| | 600,000 | | | Comcel Trust Via Comunicaciones Celulares SA (Cayman Islands)
6.875%, 02/06/24 | | | 570,000 | |
| | 305,000 | | | CommScope
5.000%, 06/15/21 (a) | | | 309,194 | |
| | 300,000 | | | Digicel Group (Bermuda)
Senior Unsecured Notes
7.125%, 04/01/22 (a) | | | 245,625 | |
| | 1,900,000 | | | 7.125%, 04/01/22 | | | 1,555,625 | |
| | 195,000 | | | Frontier Communications
Senior Unsecured Notes
10.500%, 09/15/22 (a) | | | 201,825 | |
| | 385,000 | | | Gannett
4.875%, 09/15/21 (a) | | | 393,663 | |
| | 360,000 | | | Intelsat Jackson Holdings SA (Luxembourg)
Senior Secured Notes
5.500%, 08/01/23 | | | 228,825 | |
| | 40,000 | | | 8.000%, 02/15/24 (a) | | | 41,500 | |
| | 340,000 | | | Level 3 Communications
Senior Unsecured Notes
5.750%, 12/01/22 | | | 350,373 | |
| | 680,000 | | | Omnicom Group
3.600%, 04/15/26 | | | 710,048 | |
| | 1,000,000 | | | Ooredoo Tamweel
Senior Unsecured Notes
3.039%, 12/03/18 | | | 1,021,600 | |
| | 180,000 | | | Orange SA (France)
Senior Unsecured Notes
2.750%, 09/14/16 | | | 181,150 | |
| | 484,000 | | | 2.750%, 02/06/19 | | | 498,827 | |
| | 285,000 | | | SBA Communications
Senior Unsecured Notes
5.625%, 10/01/19 | | | 296,756 | |
| | 200,000 | | | Sixsigma Networks Mexico SA de CV (Mexico)
8.250%,11/07/21 | | | 193,000 | |
| | 200,000 | | | 8.250%,11/07/21 (a) | | | 193,000 | |
| | 1,000,000 | | | Telefonica Celular del Paraguay SA (Paraguay)
Senior Unsecured Notes
6.750%, 12/13/22 | | | 990,000 | |
| | 300,000 | | | Telefonica Chile SA (Chile)
Senior Unsecured Notes
3.875%, 10/12/22 | | | 310,155 | |
| | 405,000 | | | Tribune Media
5.875%, 07/15/22 | | | 402,975 | |
| | | | | | | | |
Par Value | | | | | Market
Value | |
| | | | | | | |
| | |
| | | | Telecommunications (continued) | | | | |
| | $ 200,000 | | | TV Azteca SAB de CV (Mexico)
7.500%, 05/25/18 | | $ | 132,000 | |
| | 500,000 | | | TV Azteca SAB de CV, EMTN (Mexico)
7.625%, 09/18/20 | | | 313,750 | |
| | 1,400,000 | | | Verizon Communications
Senior Unsecured Notes
4.400%, 11/01/34 | | | 1,430,612 | |
| | 1,100,000 | | | VTR Finance BV (Netherlands)
Senior Secured Notes
6.875%, 01/15/24 | | | 1,101,375 | |
| | | | | | | | |
| | | | | | | 18,647,671 | |
| | | | | | | | |
| | |
| | | | Utilities – 2.78% | | | | |
| | 1,500,000 | | | Abengoa Transmision Sur SA (Peru) Senior Secured Notes
6.875%, 04/30/43 (a) | | | 1,552,500 | |
| | 700,000 | | | 6.875%, 04/30/43 | | | 724,500 | |
| | 300,000 | | | AES El Salvador Trust II (Panama)
6.750%, 03/28/23 | | | 243,750 | |
| | 200,000 | | | Comision Federal de Electricidad (Mexico)
Senior Unsecured Notes
4.875%, 01/15/24 | | | 209,000 | |
| | 400,000 | | | 6.125%, 06/16/45 | | | 408,000 | |
| | 690,000 | | | Duke Energy Progress
4.150%, 12/01/44 | | | 749,103 | |
| | 1,500,000 | | | Empresa de Energia de Bogota SA ESP (Colombia)
Senior Unsecured Notes
6.125%, 11/10/21 | | | 1,571,250 | |
| | 2,000,000 | | | Empresa Electrica Angamos SA (Chile)
Senior Secured Notes
4.875%, 05/25/29 | | | 1,897,834 | |
| | 700,000 | | | Empresa Electrica Guacolda SA (Chile)
Senior Unsecured Notes
4.560%, 04/30/25 (a) | | | 661,947 | |
| | 600,000 | | | Empresas Publicas de Medellin ESP (Colombia)
Senior Unsecured Notes
7.625%, 07/29/19 | | | 683,400 | |
| | 420,000 | | | Exelon
Senior Unsecured Notes
3.400%, 04/15/26 | | | 428,912 | |
| | | | Fermaca Enterprises S de RL de CV (Mexico)
Senior Secured Notes | | | | |
| | 290,073 | | | 6.375%, 03/30/38 (a) | | | 280,646 | |
| | 1,498,710 | | | 6.375%, 03/30/38 | | | 1,450,002 | |
| | 2,000,000 | | | GNL Quintero SA (Chile)
Senior Unsecured Notes
4.634%, 07/31/29 | | | 2,029,966 | |
| | | | Israel Electric (Israel)
Senior Secured Notes | | | | |
| | 500,000 | | | 5.625%, 06/21/18 | | | 532,785 | |
| | 1,000,000 | | | 5.000%, 11/12/24 | | | 1,071,250 | |
See accompanying Notes to Financial Statements.
| | |
| |
| ASTON/DoubleLine Core Plus Fixed Income Fund | | April 30, 2016 |
| |
| Schedule of Investments (unaudited) – continued | | |
| | | | | | | | |
Par Value | | | | | Market
Value | |
| | | | | | | |
| | |
| | | | Utilities (continued) | | | | |
| | $ 1,258,712 | | | Mexico Generadora de Energia S de rl (Mexico)
Senior Secured Notes
5.500%, 12/06/32 | | $ | 1,208,364 | |
| | 793,000 | | | Midamerican Energy Holdings
Senior Unsecured Notes
6.500%, 09/15/37 | | | 1,074,032 | |
| | 1,800,000 | | | National Gas Co of Trinidad & Tobago (Trinidad)
Senior Unsecured Notes
6.050%, 01/15/36 | | | 1,840,500 | |
| | 1,035,000 | | | Southern
Senior Unsecured Notes
2.450%, 09/01/18 | | | 1,056,300 | |
| | | | | | | | |
| | | | | | | 19,674,041 | |
| | | | | | | | |
| | |
| | | | Total Corporate Notes and Bonds
(Cost $208,883,567) | | | 206,842,379 | |
| | | | | | | | |
|
| COLLATERALIZED MORTGAGE AND ASSET-BACKED
SECURITIES – 13.28% |
|
| | |
| | 2,613,305 | | | Alternative Loan Trust
Series 2007-J2, Class 2A1
6.000%, 07/01/37 | | | 2,695,246 | |
| | 46,685 | | | American General Mortgage Loan Trust
Series 2010-1A, Class A3
5.650%, 03/01/58 (a) (b) | | | 46,733 | |
| | 350,000 | | | Banc of America Commercial Mortgage Trust
Series 2007-4, Class AM
6.001%, 02/01/51 (b) | | | 366,680 | |
| | 495,311 | | | Banc of America Funding
Series 2006-B, Class 7A1
3.208%, 03/01/36 (b) | | | 444,168 | |
| | 669,731 | | | Banc of America Funding
Series 2010-R9, Class 3A3
5.500%, 12/01/35 (a) | | | 550,070 | |
| | 80,877 | | | Banc of America Funding
Series 2012-R4, Class A
0.699%, 03/03/39 (a) (b) | | | 80,576 | |
| | 630,000 | | | BBCMS Trust
Series 2015-STP, Class D
4.427%, 09/06/28 (a) (b) | | | 633,841 | |
| | 230,854 | | | Bear Stearns Asset Backed
Securities I Trust
Series 2004-AC2, Class 2A
5.000%, 05/01/34 | | | 229,504 | |
| | 450,000 | | | Bear Stearns Commercial Mortgage Securities Trust
Series 2007-T26, Class AJ 5.566%, 01/01/45 (b) | | | 443,324 | |
| | 403,500 | | | CDGJ Commercial Mortage Trust
Series 2014-BXCH, Class B
2.283%, 12/15/27 (a) (b) | | | 397,964 | |
| | 88,927 | | | Citicorp Mortgage Securities Trust
Series 2007-2, Class 3A1 5.500%, 02/01/37 | | | 88,503 | |
| | | | | | | | |
Par Value | | | | | Market
Value | |
| | | | | | | |
| | $ 450,000 | | | Citigroup Commercial Mortgage Trust
Series 2007-C6, Class AM
5.899%, 12/01/49 (b) | | $ | 452,813 | |
| | 946,120 | | | Citigroup Commercial Mortgage Trust
Series 2012-GC8, Class XA
2.323%, 09/01/45 (a) (b) | | | 71,115 | |
| | 350,000 | | | Citigroup Commercial Mortgage Trust
Series 2013-SMP, Class C
2.738%, 01/01/30 (a) | | | 350,570 | |
| | 350,000 | | | Citigroup Commercial Mortgage Trust
Series 2013-SMP, Class D
3.008%, 01/01/30 (a) (b) | | | 348,574 | |
| | 4,915,063 | | | Citigroup Commercial Mortgage Trust
Series 2014-GC25, Class XA
1.238%, 10/01/47 (b) | | | 327,247 | |
| | 440,700 | | | Citigroup Commercial Mortgage Trust
Series 2015-GC27, Class D
4.577%, 02/01/48 (a) (b) | | | 339,762 | |
| | 780,000 | | | Citigroup Commercial Mortgage Trust
Series 2015-GC31, Class C
4.200%, 06/01/48 (b) | | | 751,506 | |
| | 235,000 | | | Citigroup Commercial Mortgage Trust
Series 2015-GC35, Class C
4.652%, 11/01/48 | | | 229,702 | |
| | 7,522,488 | | | Citigroup Commercial Mortgage Trust
Series 2015-GC35, Class XA
1.060%, 11/01/48 (b) | | | 433,477 | |
| | 7,790,820 | | | Citigroup Commercial Mortgage Trust
Series 2016-GC36, Class XA
1.515%, 02/01/49 (b) | | | 730,135 | |
| | 5,511,000 | | | Citigroup Commercial Mortgage Trust
Series 2016-P3, Class XA
1.718%, 04/01/49 (b) | | | 661,842 | |
| | 2,000,745 | | | Citigroup Mortgage Loan Trust
Series 2006-AR2, Class 1A2
2.915%, 03/01/36 (b) | | | 1,889,322 | |
| | 340,000 | | | Citigroup/Deutsche Bank Commercial Mortgage Trust
Series 2007-CD4, Class AMFX
5.366%, 12/01/49 (b) | | | 345,535 | |
| | 300,000 | | | COBALT Commercial Mortgage Trust
Series 2007-C2, Class AFJX
5.568%, 04/01/47 (b) | | | 291,980 | |
| | 453,000 | | | COMM Mortgage Trust
Series 2016-DC2, Class C
4.798%, 02/01/49 (b) | | | 447,488 | |
| | 6,814,224 | | | COMM Mortgage Trust
Series 2016-DC2, Class XA
1.240%, 02/01/49 (b) | | | 504,348 | |
| | 56,403 | | | Commercial Mortgage Pass
Through Certificates
Series 2010-C1, Class XPA
1.726%, 07/01/46 (a) (b) | | | 1,364 | |
| | 1,874,192 | | | Commercial Mortgage Pass
Through Certificates
Series 2012-CR3, Class XA
2.260%, 10/01/45 (b) | | | 162,188 | |
See accompanying Notes to Financial Statements.
| | |
| |
| ASTON/DoubleLine Core Plus Fixed Income Fund | | April 30, 2016 |
| |
| Schedule of Investments (unaudited) – continued | | |
| | | | | | | | |
Par Value | | | | | Market
Value | |
| | | | | | | |
| | $ 20,541,705 | | | Commercial Mortgage Pass Through Certificates
Series 2013-CR10, Class XA
1.119%, 08/01/46 (b) | | $ | 860,441 | |
| | 3,677,963 | | | Commercial Mortgage Pass Through Certificates
Series 2014-CCRE19, Class XA
1.443%, 08/01/47 (b) | | | 241,869 | |
| | 300,000 | | | Commercial Mortgage Pass Through Certificates
Series 2014-CR20, Class C
4.657%, 11/01/47 (b) | | | 300,650 | |
| | 350,000 | | | Commercial Mortgage Pass Through Certificates
Series 2014-KYO, Class E
2.787%, 06/11/27 (a) (b) | | | 345,782 | |
| | 586,888 | | | Commercial Mortgage Pass Through Certificates
Series 2014-KYO, Class F
3.937%, 06/11/27 (a) (b) | | | 582,695 | |
| | 350,000 | | | Commercial Mortgage Pass Through Certificates
Series 2015-CCRE23, Class D
4.399%, 05/01/48 (b) | | | 265,766 | |
| | 470,000 | | | Commercial Mortgage Pass Through Certificates
Series 2015-CR25, Class C
4.699%, 08/01/48 (b) | | | 462,494 | |
| | 600,000 | | | Commercial Mortgage Pass Through Certificates
Series 2015-CR26, Class B
4.645%, 10/01/48 (b) | | | 637,766 | |
| | 8,374,107 | | | Commercial Mortgage Pass Through Certificates
Series 2015-CR26, Class XA
1.215%, 10/01/48 (b) | | | 590,362 | |
| | 585,000 | | | Commercial Mortgage Pass Through Certificates
Series 2015-LC23, Class C
4.801%, 10/01/53 (b) | | | 581,008 | |
| | 9,153,593 | | | Commercial Mortgage Pass Through Certificates
Series 2016-C3, Class XA
1.259%, 01/01/48 (b) | | | 711,630 | |
| | 807,000 | | | Commercial Mortgage Pass Through Certificates
Series 2016-CCRE28, Class C
4.803%, 02/01/49 (b) (c) | | | 799,160 | |
| | 650,000 | | | Commercial Mortgage Trust
Series 2007-GG11, Class AJ
6.237%, 12/01/49 (b) | | | 641,832 | |
| | 500,000 | | | Core Industrial Trust
Series 2015-CALW, Class D
3.979%, 02/01/34 (a) (b) | | | 503,282 | |
| | 1,256,548 | | | Countrywide Alternative Loan Trust
Series 2005-86CB, Class A5
5.500%, 02/01/36 | | | 1,129,671 | |
| | 512,637 | | | Countrywide Alternative Loan Trust
Series 2006-J1, Class 2A1
7.000%, 02/01/36 | | | 244,629 | |
| | | | | | | | |
Par Value | | | | | Market
Value | |
| | | | | | | |
| | $ 76,460 | | | Countrywide Alternative Loan Trust
Series 2007-18CB, Class 2A17
6.000%, 08/01/37 | | $ | 67,352 | |
| | 307,053 | | | Countrywide Alternative Loan Trust
Series 2007-23CB, Class A3
0.939%, 09/25/37 (b) | | | 189,594 | |
| | 293,184 | | | Countrywide Alternative Loan Trust
Series 2007-23CB, Class A4
6.074%, 09/25/37 (b) (g) | | | 79,697 | |
| | 588,457 | | | Countrywide Home Loan Mortgage Pass Through Trust
Series 2005-HYB8, Class 4A1
2.810%, 12/01/35 (b) | | | 523,353 | |
| | 1,473,411 | | | Countrywide Home Loan Mortgage Pass Through Trust
Series 2007-14, Class A15
6.500%, 09/01/37 | | | 1,441,984 | |
| | 546,756 | | | Countrywide Home Loan Mortgage Pass Through Trust
Series 2007-2, Class A13
6.000%, 03/01/37 | | | 512,082 | |
| | 119,059 | | | Countrywide Home Loan Mortgage Pass Through Trust
Series 2007-7, Class A4
5.750%, 06/01/37 | | | 111,920 | |
| | 275,000 | | | Credit Suisse Commercial Mortgage Trust
Series 2006-C4, Class AM
5.509%, 09/01/39 | | | 277,139 | |
| | 625,000 | | | Credit Suisse Commercial Mortgage Trust
Series 2007-C4, Class A1AM
6.140%, 09/01/39 (b) | | | 632,008 | |
| | 31,631 | | | Credit Suisse First Boston Mortgage Securities
Series 1998-C2, Class F
6.750%, 11/11/30 (a) (b) | | | 31,853 | |
| | 1,769,265 | | | Credit Suisse First Boston Mortgage Securities
Series 2005-9, Class 5A9
5.500%, 10/01/35 | | | 1,526,463 | |
| | 874,699 | | | Credit Suisse Mortgage Capital Certificates
Series 2007-1, Class 5A4
6.000%, 02/01/37 | | | 751,965 | |
| | 250,000 | | | Credit Suisse Mortgage Capital Certificates
Series 2009-RR2, Class IQB
5.695%, 04/01/49 (a) (b) | | | 254,108 | |
| | 3,972,450 | | | CSMC Trust
Series 2013-IVR4, Class A11
3.487%, 07/01/43 (a) (b) | | | 4,042,669 | |
| | 3,972,450 | | | CSMC Trust
Series 2013-IVR4, Class A2
3.000%, 07/01/43 (a) (b) | | | 3,992,002 | |
| | 534,000 | | | DBJPM
Series 2016-C1, Class C
3.352%, 05/01/49 (b) | | | 477,741 | |
See accompanying Notes to Financial Statements.
| | |
| |
| ASTON/DoubleLine Core Plus Fixed Income Fund | | April 30, 2016 |
| |
| Schedule of Investments (unaudited) – continued | | |
| | | | | | | | |
Par Value | | | | | Market
Value | |
| | | | | | | |
| | $ 7,725,000 | | | DBJPM
Series 2016-C1, Class XA
1.509%, 05/01/49 (b) | | $ | 832,959 | |
| | 569,000 | | | FHLMC Multifamily Structured Pass Through Certificates
Series K050, Class A2
3.334%, 08/01/25 (b) | | | 614,958 | |
| | 766,000 | | | FHLMC Multifamily Structured Pass Through Certificates
Series K053, Class A2
2.995%, 12/01/25 | | | 806,415 | |
| | 831,000 | | | FHLMC Multifamily Structured Pass Through Certificates
Series K054, Class A2
2.745%, 01/01/26 | | | 857,045 | |
| | 3,135,340 | | | First Horizon Alternative Mortgage Securities Trust
Series 2005-FA4, Class 1A6
5.500%, 06/01/35 | | | 2,837,652 | |
| | 1,686,630 | | | First Horizon Mortgage Pass-Through Trust
Series 2006-2, Class 1A3
6.000%, 08/01/36 | | | 1,597,384 | |
| | 831,000 | | | FREMF Mortgage Trust
Sereis 2016-K54, Class B
4.051%, 02/01/26 (b) | | | 770,004 | |
| | 391,000 | | | GS Mortgage Securities Trust
Series 2014-GC26, Class C
4.662%, 11/01/47 (b) | | | 387,276 | |
| | 6,480,889 | | | GS Mortgage Securities Trust
Series 2015-GC34, Class XA
1.533%, 10/01/48 (b) | | | 587,086 | |
| | 10,773,868 | | | GS Mortgage Securities Trust
Series 2015-GS1, Class XA
0.990%, 11/01/48 (b) | | | 650,802 | |
| | 762,000 | | | GS Mortgage Securities Trust
Series 2016-ICE2, Class A
2.363%, 02/15/33 (b) | | | 764,728 | |
| | 534,481 | | | GS Mortgage Securities Trust
Series 2207-GG10, Class A4
5.987%, 08/01/45 (b) | | | 549,538 | |
| | 546,424 | | | GSR Mortgage Loan Trust
Series 2006-AR1, Class 3A1
3.070%, 01/01/36 (b) | | | 494,580 | |
| | 41,183 | | | HSI Asset Loan Obligation Trust
Series 2007-2, Class 1A1
5.500%, 09/01/37 | | | 39,490 | |
| | 1,076,695 | | | JP Morgan Chase Commercial Mortgage Securities Trust
Series 2006-LDP8, Class X
0.676%, 05/01/45 (b) | | | 1,171 | |
| | 350,000 | | | JP Morgan Chase Commercial Mortgage Securities Trust
Series 2006-LDP9, Class AM
5.372%, 05/01/47 | | | 349,181 | |
| | 350,000 | | | JP Morgan Chase Commercial Mortgage Securities Trust
Series 2007-CB19 Class AM
5.889%, 02/01/49 (b) | | | 358,389 | |
| | | | | | | | |
Par Value | | | | | Market
Value | |
| | | | | | | |
| | $ 537,200 | | | JP Morgan Chase Commercial Mortgage Securities Trust
Series 2007-CB20, Class AJ
6.284%, 02/01/51 (b) | | $ | 532,465 | |
| | 250,000 | | | JP Morgan Chase Commercial Mortgage Securities Trust
Series 2007-LD12, Class AM
6.207%, 02/01/51 (b) | | | 260,756 | |
| | 688,986 | | | JP Morgan Chase Commercial Mortgage Securities Trust
Series 2008-C2, Class A4
6.068%, 02/01/51 | | | 719,589 | |
| | 828,402 | | | JP Morgan Chase Commercial Mortgage Securities Trust
Series 2011-C4, Class XA
1.565%, 07/01/46 (a) (b) | | | 28,245 | |
| | 2,247,272 | | | JP Morgan Chase Commercial Mortgage Securities Trust
Series 2012-C8, Class XA
2.192%, 10/01/45 (b) | | | 176,699 | |
| | 731,165 | | | JP Morgan Chase Commercial Mortgage Securities Trust
Series 2012-CBX, Class XA
1.875%, 06/01/45 (b) | | | 45,106 | |
| | 5,798,790 | | | JP Morgan Chase Commercial Mortgage Securities Trust
Series 2014-C18, Class XA
1.283%, 02/01/47 (b) | | | 307,407 | |
| | 300,000 | | | JP Morgan Chase Commercial Mortgage Securities Trust
Series 2014-C21, Class C
4.816%, 08/01/47 (b) | | | 305,974 | |
| | 3,703,785 | | | JP Morgan Chase Commercial Mortgage Securities Trust
Series 2014-C21, Class XA
1.261%, 08/01/47 (b) | | | 242,194 | |
| | 330,824 | | | JP Morgan Chase Commercial Mortgage Securities Trust
Series 2014-C23, Class C
4.608%, 09/01/47 (b) | | | 336,125 | |
| | 450,000 | | | JP Morgan Chase Commercial Mortgage Securities Trust
Series 2014-C25, Class C
4.597%, 11/01/47 (b) | | | 451,882 | |
| | 6,501,881 | | | JP Morgan Chase Commercial Mortgage Securities Trust
Series 2014-C25, Class XA
1.153%, 11/01/47 (b) | | | 371,891 | |
| | 5,282,154 | | | JP Morgan Chase Commercial Mortgage Securities Trust
Series 2014-C26, Class XA
1.322%, 01/01/48 (b) | | | 330,688 | |
| | 300,000 | | | JP Morgan Chase Commercial Mortgage Securities Trust
Series 2014-DSTY, Class A
3.429%, 06/06/27 (a) | | | 310,292 | |
| | 4,424,436 | | | JP Morgan Chase Commercial Mortgage Securities Trust
Series 2015-C27, Class XA
1.523%, 02/01/48 (b) | | | 337,393 | |
See accompanying Notes to Financial Statements.
| | |
| |
| ASTON/DoubleLine Core Plus Fixed Income Fund | | April 30, 2016 |
| |
| Schedule of Investments (unaudited) – continued | | |
| | | | | | | | |
Par Value | | | | | Market
Value | |
| | | | | | | |
| | $ 7,957,643 | | | JP Morgan Chase Commercial Mortgage Securities Trust
Series 2015-C28, Class XA
1.343%, 10/01/48 (b) | | $ | 537,189 | |
| | 650,000 | | | JP Morgan Chase Commercial Mortgage Securities Trust
Series 2015-C32, Class C
4.819%, 11/01/48 (b) | | | 607,973 | |
| | 670,000 | | | JP Morgan Chase Commercial Mortgage Securities Trust
Series 2015-C33, Class C
4.773%, 12/01/48 (b) | | | 660,290 | |
| | 8,390,056 | | | JP Morgan Chase Commercial Mortgage Securities Trust
Series2015-JP1, Class XA
1.316%, 01/01/49 (b) | | | 574,154 | |
| | 755,000 | | | JPMBB Commercial Mortgage Securities Trust
Series 2016-C1, Class C
4.905%, 03/01/49 (b) | | | 750,706 | |
| | 485,000 | | | LB Commercial Mortgage Trust
Series 2007-C3, Class AMB
5.189%, 07/11/44 | | | 500,055 | |
| | 250,000 | | | LB Commercial Mortgage Trust
Series 2007-C3, Class AMFL
6.096%, 07/11/44 (a) (b) | | | 259,431 | |
| | 586,445 | | | LB-UBS Commercial Mortgage Trust
Series 2007-C1, Class AJ
5.484%, 02/11/40 | | | 583,684 | |
| | 747,000 | | | LB-UBS Commercial Mortgage Trust
Series 2007-C7, Class AJ
6.448%, 09/11/45 (b) | | | 747,096 | |
| | 350,000 | | | Merrill Lynch Mortgage Trust
Series 2006-C2, Class AJ
5.802%, 08/01/43 (b) | | | 348,432 | |
| | 30,484 | | | ML-CFC Commercial Mortgage Trust
Series 2006-1, Class AJ
5.836%, 02/01/39 (b) | | | 30,463 | |
| | 250,000 | | | ML-CFC Commercial Mortgage Trust
Series 2007-5, Class AM
5.419%, 08/01/48 | | | 255,581 | |
| | 844,000 | | | Morgan Stanley Bank of America Merrill Lynch Trust
Series 2016-C29, Class C
4.912%, 05/01/49 (b) (c) | | | 835,280 | |
| | 894,535 | | | Morgan Stanley Bank of America Merrill Lynch Trust
Series 2012-C5, Class XA
1.894%, 08/01/45 (a) (b) | | | 56,652 | |
| | 5,914,847 | | | Morgan Stanley Bank of America Merrill Lynch Trust
Series 2014-C14, Class XA
1.434%, 02/01/47 (b) | | | 322,472 | |
| | 300,000 | | | Morgan Stanley Bank of America Merrill Lynch Trust
Series 2014-C18, Class C
4.489%, 10/01/47 | | | 301,784 | |
| | | | | | | | |
Par Value | | | | | Market
Value | |
| | | | | | | |
| | $ 413,500 | | | Morgan Stanley Bank of America Merrill Lynch Trust
Series 2014-C19, Class C
4.000%, 12/01/47 | | $ | 390,762 | |
| | 785,000 | | | Morgan Stanley Bank of America Merrill Lynch Trust
Series 2015-C25, Class C
4.680%, 10/01/48 (b) | | | 765,313 | |
| | 800,000 | | | Morgan Stanley Bank of America Merrill Lynch Trust
Series 2015-C26, Class D
3.060%, 10/01/48 (a) | | | 573,342 | |
| | 80,000 | | | Morgan Stanley Bank of America Merrill Lynch Trust
Series 2015-C27, Class C
4.689%, 12/01/47 (b) | | | 76,810 | |
| | 8,503,897 | | | Morgan Stanley Bank of America Merrill Lynch Trust
Series 2016-C28, Class XA
1.450%, 01/01/49 (b) | | | 745,432 | |
| | 140,788 | | | Morgan Stanley Capital I Trust
Series 2006-HQ8, Class AJ
5.590%, 03/01/44 (b) | | | 140,535 | |
| | 375,100 | | | Morgan Stanley Capital I Trust
Series 2007-1Q16, Class AMA
6.252%, 12/01/49 (b) | | | 389,748 | |
| | 300,000 | | | Morgan Stanley Capital I Trust
Series 2007-HQ11, Class AJ
5.508%, 02/01/44 (b) | | | 296,094 | |
| | 250,000 | | | Morgan Stanley Capital I Trust
Series 2007-IQ13, Class AM
5.406%, 03/01/44 | | | 255,777 | |
| | 636,155 | | | Morgan Stanley Capital I Trust
Series 2011-C1, Class XA
0.636%, 09/01/47 (a) (b) | | | 11,220 | |
| | 250,000 | | | Morgan Stanley Capital I Trust
Series 2014-CPT, Class E
3.560%, 07/01/29 (a) (b) | | | 244,083 | |
| | 350,000 | | | Morgan Stanley Capital I Trust
Series 2014-MP, Class D
3.816%, 08/01/29 (a) (b) | | | 353,892 | |
| | 588,000 | | | Morgan Stanley Capital I Trust
Series 2015-XLF1, Class AFSC
3.433%, 08/15/26 (a) (b) | | | 587,617 | |
| | 851,484 | | | Morgan Stanley Mortgage Loan Trust
Series 2005-3AR, Class 2A2
2.888%, 07/01/35 (b) | | | 772,664 | |
| | 6,956,484 | | | Morgan Stanley Mortgage Loan Trust
Series 2005-9AR, Class 2A
3.389%, 12/01/35 (b) | | | 5,922,041 | |
| | 275,511 | | | Nomura Asset Acceptance Corp Alternative Loan Trust
Series 2005-AP3, Class A3
5.318%, 08/01/35 (b) | | | 165,712 | |
| | 4,418,659 | | | RALI Trust
Series 2006-QS7, Class A2
6.000%, 06/01/36 | | | 3,618,645 | |
| | 222,861 | | | Residential Asset Securitization Trust
Series 2006-A6, Class 1A1
6.500%, 07/01/36 | | | 123,533 | |
See accompanying Notes to Financial Statements.
| | |
| |
| ASTON/DoubleLine Core Plus Fixed Income Fund | | April 30, 2016 |
| |
| Schedule of Investments (unaudited) – continued | | |
| | | | | | | | |
Par Value | | | | | Market
Value | |
| | | | | | | |
| | $ 503,481 | | | Residential Asset Securitization Trust
Series 2007-A1, Class A8
6.000%, 03/01/37 | | $ | 343,121 | |
| | 2,024,364 | | | Sequoia Mortgage Trust
Series 2013-1, Class 2A1
1.855%, 02/01/43 (b) | | | 1,922,079 | |
| | 305,453 | | | Structured Adjustable Rate Mortgage Loan Trust
Series 2006-1, Class 2A2
2.683%, 02/01/36 (b) | | | 268,154 | |
| | 1,871,542 | | | UBS-Barclays Commercial Mortgage Trust
Series 2012-C3, Class XA
2.239%, 08/01/49 (a) (b) | | | 164,910 | |
| | 500,000 | | | Wachovia Bank Commercial Mortgage Trust
Series 2007-C32, Class AMFX
5.703%, 06/01/49 (a) | | | 510,921 | |
| | 67,821 | | | Wachovia Bank Commercial Mortgage Trust
Series 2006-C24, Class AJ
5.658%, 03/01/45 (b) | | | 67,748 | |
| | 540,000 | | | Wachovia Bank Commercial Mortgage Trust
Series 2006-C28, Class AJ
5.632%, 10/01/48 (b) | | | 530,254 | |
| | 1,063,000 | | | Wachovia Bank Commercial Mortgage Trust
Series 2007-C30, Class AJ
5.413%, 12/01/43 (b) | | | 1,047,832 | |
| | 250,000 | | | Wachovia Bank Commercial Mortgage Trust
Series 2007-C30, Class AM
5.383%, 12/01/43 | | | 255,634 | |
| | 350,000 | | | Wachovia Bank Commercial Mortgage Trust
Series 2007-C30, Class AMFL
0.633%, 12/15/43 (a) (b) | | | 333,722 | |
| | 300,000 | | | Wachovia Bank Commercial Mortgage Trust
Series 2007-C33, Class AJ
6.147%, 02/01/51 (b) | | | 296,702 | |
| | 580,000 | | | Wachovia Bank Commercial Mortgage Trust
Series 2007-C33, Class AM
6.147%, 02/01/51 (b) | | | 599,358 | |
| | 2,141,406 | | | Washington Mutual Mortgage Pass-Through Certificates WMALT Trust
Series 2005-8, Class 2CB1
5.500%, 10/01/35 | | | 2,113,102 | |
| | 471,800 | | | Wells Fargo Commercial Mortgage Trust
Series 2015-C26, Class D
3.586%, 02/01/48 (a) | | | 347,257 | |
| | 725,000 | | | Wells Fargo Commercial Mortgage Trust
Series 2014-LC16, Class D
3.938%, 08/01/50 (a) | | | 569,030 | |
| | | | | | | | |
Par Value | | | | | Market
Value | |
| | | | | | | |
| | $ 400,000 | | | Wells Fargo Commercial Mortgage Trust
Series 2015-C28, Class C
4.275%, 05/01/48 (b) | | $ | 370,015 | |
| | 585,000 | | | Wells Fargo Commercial Mortgage Trust
Series 2015-C31, Class C
4.766%, 11/01/48 (b) | | | 584,225 | |
| | 8,473,771 | | | Wells Fargo Commercial Mortgage Trust
Series 2015-C31, Class XA (b)
1.276%, 11/01/48 | | | 649,794 | |
| | 480,000 | | | Wells Fargo Commercial Mortgage Trust
Series 2015-LC22, Class C (b)
4.690%, 09/01/58 | | | 475,617 | |
| | 4,465,794 | | | Wells Fargo Commercial Mortgage Trust
Series 2015-NXS1, Class XA
1.340%, 05/01/48 (b) | | | 324,076 | |
| | 610,000 | | | Wells Fargo Commercial Mortgage Trust
Series 2015-NXS3, Class C
4.638%, 09/01/57 (b) | | | 576,112 | |
| | 558,000 | | | Wells Fargo Commercial Mortgage Trust
Series 2016-C32, Class C
4.878%, 01/01/59 (b) | | | 557,853 | |
| | 517,000 | | | Wells Fargo Commercial Mortgage Trust
Series 2016-C33, Class C
3.896%, 03/01/59 | | | 484,439 | |
| | 5,360,730 | | | Wells Fargo Commercial Mortgage Trust
Series 2016-C33, Class XA
1.986%, 03/01/59 (b) | | | 645,185 | |
| | 512,000 | | | Wells Fargo Commerical Mortgage Trust
Series 2014-LC18, Class B
3.959%, 12/01/47 | | | 534,766 | |
| | 341,021 | | | Wells Fargo Mortgage Backed Securities Trust
Series 2007-13, Class A6
6.000%, 09/01/37 | | | 349,171 | |
| | 351,964 | | | Wells Fargo Mortgage Backed Securities Trust
Series 2007-8, Class 1A16
6.000%, 07/01/37 | | | 347,987 | |
| | 943,076 | | | WF-RBS Commercial Mortgage Trust
Series 2012-C8, Class XA
2.313%, 08/01/45 (a) (b) | | | 73,295 | |
| | 1,387,266 | | | WF-RBS Commercial Mortgage Trust
Series 2012-C9, Class XA
2.303%, 11/01/45 (a) (b) | | | 119,140 | |
| | 6,290,174 | | | WF-RBS Commercial Mortgage Trust
Series 2014-C21, Class XA
1.326%, 08/01/47 (b) | | | 411,220 | |
| | | | | | | | |
| | |
| | | | Total Collateralized Mortgage and Asset-Backed Securities
(Cost $94,811,729) | | | 94,059,089 | |
| | | | | | | | |
See accompanying Notes to Financial Statements.
| | |
| |
| ASTON/DoubleLine Core Plus Fixed Income Fund | | April 30, 2016 |
| |
| Schedule of Investments (unaudited) – continued | | |
| | | | | | | | |
Par Value | | | | | Market
Value | |
| | | | | | | |
|
| | U.S. GOVERNMENT AND AGENCY OBLIGATIONS – 42.43% | |
| | |
| | | | Fannie Mae – 11.55% | | | | |
| | $ 374,833 | | | 4.000%, 06/01/42
Pool # AB5459 | | $ | 391,786 | |
| | 4,261,306 | | | 3.000%, 10/01/34
Pool # AS3456 | | | 4,443,392 | |
| | 4,317,425 | | | 3.000%, 01/01/35
Pool # AS4281 | | | 4,501,917 | |
| | 3,783,953 | | | 3.000%, 03/01/45
Pool # AS4645 | | | 3,882,737 | |
| | 9,984,321 | | | 3.500%, 03/01/46
Pool # BC0281 | | | 10,534,156 | |
| | 618,141 | | | 3.500%, 12/01/31
Pool # MA0919 | | | 654,180 | |
| | 548,578 | | | 3.500%, 01/01/32
Pool # MA0949 | | | 580,581 | |
| | 167,835 | | | 4.500%, 03/01/42
Pool # MA1050 | | | 176,507 | |
| | 1,500,807 | | | 3.000%, 06/01/33
Pool # MA1459 | | | 1,565,347 | |
| | 5,084,957 | | | 3.000%, 04/01/45
Pool # MA2248 | | | 5,155,413 | |
| | 238,676 | | | 4.000%, 09/01/31
Pool # MA3894 | | | 257,303 | |
| | 209,737 | | | 6.194%, 10/25/36 (b) (g)
Series 2007-57, Class SX, REMIC | | | 32,977 | |
| | 395,764 | | | 5.374%, 09/25/36 (b) (g)
Series 2009-86, Class CI, REMIC | | | 53,660 | |
| | 326,562 | | | 4.000%, 01/01/41
Series 2010-156, Class ZC, REMIC | | | 369,620 | |
| | 305,392 | | | 4.500%, 12/01/41
Series 2011-121, Class JP, REMIC | | | 327,185 | |
| | 491,660 | | | 4.000%, 03/01/41
Series 2011-18, Class UZ, REMIC | | | 519,456 | |
| | 1,133,414 | | | 3.500%, 10/01/42
Series 2012-105, Class Z, REMIC | | | 1,173,495 | |
| | 2,401,274 | | | 2.750%, 11/01/42
Series 2012-127, Class PA | | | 2,442,294 | |
| | 4,164,380 | | | 3.500%, 03/01/42
Series 2012-20, Class ZT, REMIC | | | 4,402,394 | |
| | 1,765,664 | | | 4.000%, 04/01/42
Series 2012-31, Class Z, REMIC | | | 1,934,927 | |
| | 8,652,798 | | | 2.000%, 08/01/42
Series 2013-5, Class EZ, REMIC | | | 8,085,172 | |
| | 5,253,133 | | | 3.000%, 02/01/43
Series 2013-8, Class Z, REMIC | | | 5,048,667 | |
| | 5,229,846 | | | 3.000%, 11/01/44
Series 2014-73, Class CZ, REMIC | | | 5,051,946 | |
| | 7,842,131 | | | 3.000%, 01/01/45
Series 2015-9, Class HA | | | 8,178,902 | |
| | 5,886,481 | | | 3.000%, 08/01/42
Series 2015-95, Class AP, REMIC | | | 6,078,992 | |
| | 5,440,750 | | | 3.000%, 05/01/46
Series 2016-24, Class NZ, REMIC (f) | | | 5,241,825 | |
| | 757,000 | | | 2.702%, 02/01/26
Series 2016-M3, Class A2 | | | 769,753 | |
| | | | | | | | |
| | | | | | | 81,854,584 | |
| | | | | | | | |
| | | | | | | | |
Par Value | | | | | Market
Value | |
| | | | | | | |
| | |
| | | | Freddie Mac – 6.23% | | | | |
| | $ 3,193,234 | | | 3.000%, 03/01/44
Series 4316, Class BZ, REMIC | | $ | 3,145,017 | |
| | 1,414,680 | | | 3.000%, 01/01/33
Gold Pool # C91594 | | | 1,472,743 | |
| | 35,076 | | | 5.000%, 07/01/35
Gold Pool # G01840 | | | 38,975 | |
| | 10,268 | | | 5.500%, 12/01/38
Gold Pool # G06172 | | | 11,543 | |
| | 6,412,974 | | | 3.500%, 02/01/45
Gold Pool # Q31596 | | | 6,724,017 | |
| | 219,650 | | | 4.000%, 10/01/41
Gold Pool # T60392 | | | 229,422 | |
| | 928,563 | | | 3.500%, 10/01/42
Gold Pool # T65110 | | | 958,779 | |
| | 3,855,645 | | | 3.000%, 07/01/45
Pool # G08653 | | | 3,953,810 | |
| | 4,823,122 | | | 3.000%, 08/01/45
Pool # G08658 | | | 4,945,919 | |
| | 464,696 | | | 5.000%, 12/01/34
Series 2909, Class Z, REMIC | | | 515,303 | |
| | 131,618 | | | 5.675%, 04/15/37 (b) (g)
Series 3301, Class MS, REMIC | | | 19,486 | |
| | 59,342 | | | 5.575%, 11/15/37 (b) (g)
Series 3382, Class SB, REMIC | | | 7,501 | |
| | 87,820 | | | 5.965%, 11/15/37 (b) (g)
Series 3384, Class S, REMIC | | | 11,666 | |
| | 210,854 | | | 5.095%, 01/15/39 (b) (g)
Series 3500, Class SA, REMIC | | | 21,469 | |
| | 233,397 | | | 5.500%, 08/01/36
Series 3626, Class AZ, REMIC | | | 258,222 | |
| | 1,500,000 | | | 4.000%, 12/01/38
Series 3738, Class BP, REMIC | | | 1,587,027 | |
| | 123,325 | | | 4.000%, 01/01/41
Series 3795, Class VZ, REMIC | | | 135,660 | |
| | 62,355 | | | 4.000%, 06/01/41
Series 3872, Class BA, REMIC | | | 65,513 | |
| | 241,774 | | | 4.000%, 07/01/41
Series 3888, Class ZG, REMIC | | | 260,313 | |
| | 433,178 | | | 4.500%, 07/01/41
Series 3894, Class ZA, REMIC | | | 474,690 | |
| | 583,454 | | | 3.500%, 11/01/41
Series 3957, Class DZ, REMIC | | | 603,293 | |
| | 536,797 | | | 4.000%, 11/01/41
Series 3957, Class HZ, REMIC | | | 587,002 | |
| | 4,100,723 | | | 2.250%, 03/01/38 | | | 4,176,547 | |
| | 4,814,095 | | | 3.000%, 01/01/41 | | | 4,988,646 | |
| | 6,091,897 | | | 5.067%, 07/15/42 (b) | | | 893,475 | |
| | 2,018,285 | | | 8.995%, 01/15/41 (b)
Series 3792, Class SE, REMIC | | | 2,144,561 | |
| | 2,118,797 | | | 4.000%, 03/01/42
Series 4016, Class KZ | | | 2,341,134 | |
| | 3,466,788 | | | 3.000%, 06/01/40
Series 4323, Class GA, REMIC | | | 3,571,806 | |
| | | | | | | | |
| | | | | | | 44,143,539 | |
| | | | | | | | |
See accompanying Notes to Financial Statements.
| | |
| |
| ASTON/DoubleLine Core Plus Fixed Income Fund | | April 30, 2016 |
| |
| Schedule of Investments (unaudited) – continued | | |
| | | | | | | | |
Par Value | | | | | Market
Value | |
| | | | | | | |
| | |
| | | | Ginnie Mae – 0.48% | | | | |
| | $ 33,460 | | | 29.648%, 03/20/34 (b)
Series 2004-35, Class SA | | $ | 56,374 | |
| | 425,712 | | | 7.204%, 08/20/38 (b) (g)
Series 2008-69, Class SB | | | 92,488 | |
| | 498,672 | | | 4.500%, 05/01/39
Series 2009-32, Class ZE | | | 546,381 | |
| | 571,087 | | | 4.500%, 05/01/39
Series 2009-35, Class DZ | | | 623,719 | |
| | 608,354 | | | 4.500%, 09/01/39
Series 2009-75, Class GZ | | | 656,897 | |
| | 175,414 | | | 5.840%, 03/01/39 (b) (g)
Series 2010-98, Class IA | | | 18,755 | |
| | 1,032,049 | | | 5.024%, 06/20/41 (b) (g)
Series 2011-89, Class SA | | | 143,966 | |
| | 4,262,536 | | | 5.818%, 10/20/44 (b) (g)
Series 2014-156, Class PS | | | 708,240 | |
| | 4,154,541 | | | 5.718%, 07/20/43 (b) (g)
Series 2014-5, Class PS | | | 573,916 | |
| | | | | | | | |
| | | | | | | 3,420,736 | |
| | | | | | | | |
| | |
| | | | U.S. Treasury Bonds – 4.06% | | | | |
| | 17,160,000 | | | 2.750%, 11/15/42 | | | 17,565,868 | |
| | 10,450,000 | | | 3.000%, 11/15/44 | | | 11,182,524 | |
| | | | | | | | |
| | | | | | | 28,748,392 | |
| | | | | | | | |
| | |
| | | | U.S. Treasury Notes – 20.11% | | | | |
| | 22,760,000 | | | 0.500%, 06/30/16 | | | 22,768,967 | |
| | 21,050,000 | | | 0.875%, 06/15/17 | | | 21,108,372 | |
| | 2,550,000 | | | 1.000%, 05/15/18 | | | 2,560,758 | |
| | 840,000 | | | 1.000%, 11/30/19 | | | 838,540 | |
| | 22,630,000 | | | 2.000%, 11/30/20 | | | 23,378,736 | |
| | 17,350,000 | | | 2.250%, 03/31/21 | | | 18,137,864 | |
| | 1,060,000 | | | 1.875%, 11/30/21 | | | 1,086,728 | |
| | 8,100,000 | | | 1.750%, 03/31/22 | | | 8,227,194 | |
| | 13,750,000 | | | 2.500%, 05/15/24 | | | 14,581,985 | |
| | 710,000 | | | 2.375%, 08/15/24 | | | 745,708 | |
| | 14,200,000 | | | 2.250%, 11/15/24 | | | 14,766,608 | |
| | 14,000,000 | | | 2.000%, 02/15/25 | | | 14,263,046 | |
| | | | | | | | |
| | | | | | | 142,464,506 | |
| | | | | | | | |
| | |
| | | | Total U.S. Government and Agency Obligations
(Cost $296,852,531) | | | 300,631,757 | |
| | | | | | | | |
|
| | OTHER MORTGAGE AND ASSET-BACKED SECURITIES – 6.46% | |
| | |
| | 250,000 | | | Adams Mill CLO (Cayman Islands)
Series 2014-1A, Class D1
4.128%, 07/15/26 (a) (b) | | | 201,456 | |
| | 250,000 | | | Adams Mill CLO (Cayman Islands)
Series 2014-1A, Class E1
5.628%, 07/15/26 (a) (b) | | | 166,730 | |
| | 500,000 | | | ALM XI (Cayman Islands)
Series 2014-11A, Class C
4.133%, 10/17/26 (b) | | | 453,328 | |
| | | | | | | | |
Par Value | | | | | Market
Value | |
| | | | | | | |
| | $ 1,000,000 | | | ALM XIV (Cayman Islands)
Series 2014-14A, Class C
4.071%, 07/28/26 (b) | | $ | 956,874 | |
| | 500,000 | | | Apidos CDO V (Cayman Islands)
Seires 2007-5A, Class B
1.328%, 04/15/21 (a) (b) | | | 482,500 | |
| | 500,000 | | | Apidos CDO XXI (Cayman Islands)
Series 2015-21A, Class C
4.183%, 07/18/27 (a) (b) | | | 460,705 | |
| | 500,000 | | | Apidos CLO XVI (Cayman Islands)
Series 2013-16A, Class B
3.433%, 01/19/25 (a) (b) | | | 494,928 | |
| | 250,000 | | | Apidos CLO XVIII (Cayman Islands)
Series 2014-18A, Class C
4.285%, 07/22/26 (a) (b) | | | 230,341 | |
| | 250,000 | | | Apidos CLO XVIII (Cayman Islands)
Series 2014-18A, Class D
5.835%, 07/22/26 (a) (b) | | | 211,499 | |
| | 500,000 | | | Apidos CLO XX (Cayman Islands)
Series 2015-20A, Class B
3.833%, 01/16/27 (a) (b) | | | 495,039 | |
| | 500,000 | | | Apidos CLO XX (Cayman Islands)
Series 2015-20A, Class C
4.333%, 01/16/27 (a) (b) | | | 449,085 | |
| | 500,000 | | | ARES XXVI CLO (Cayman Islands)
Series 2013-1A, Class D
4.378%, 04/15/25 (a) (b) | | | 453,468 | |
| | 500,000 | | | Atrium V (Cayman Islands)
1.008%, 07/20/20 (a) (b) | | | 484,994 | |
| | 250,000 | | | AVANT Loans Funding Trust
Series 2016-B, Class A
4.150%, 08/15/19 | | | 250,040 | |
| | 500,000 | | | Babson CLO (Cayman Islands)
Series 2012-2A, Class CR
4.218%, 05/15/23 (a) (b) | | | 476,252 | |
| | 250,000 | | | Babson CLO (Cayman Islands)
Series 2014-3A, Class E2
7.128%, 01/15/26 (a) (b) | | | 193,154 | |
| | 500,000 | | | Babson CLO (Cayman Islands)
Series 2015-2A, Class D
4.434%, 07/20/27 (a) (b) | | | 471,803 | |
| | 250,000 | | | Babson CLO (Cayman Islands)
Series 2015-IA, Class D1
4.084%, 04/20/27 (a) (b) | | | 229,078 | |
| | 555,625 | | | Bayview Financial Acquisition Trust
Series 2007-A, Class 1A5
6.101%, 05/01/37 (h) | | | 558,985 | |
| | 250,000 | | | Birchwood Park CLO (Cayman Islands)
Series 2014-1A, Class C2
3.778%, 07/15/26 (a) (b) | | | 249,827 | |
| | 250,000 | | | Birchwood Park CLO (Cayman Islands)
Series 2014-1A, Class D2
4.828%, 07/15/26 (a) (b) | | | 227,323 | |
| | 250,000 | | | BlueMountain CLO (Cayman Islands)
Series 2012-1A, Class E
6.134%, 07/20/23 (a) (b) | | | 230,864 | |
See accompanying Notes to Financial Statements.
| | |
| |
| ASTON/DoubleLine Core Plus Fixed Income Fund | | April 30, 2016 |
| |
| Schedule of Investments (unaudited) – continued | | |
| | | | | | | | |
Par Value | | | | | Market
Value | |
| | | | | | | |
| | $ 750,000 | | | BlueMountain CLO (Cayman Islands)
Series 2012-2A, Class C
3.368%, 11/20/24 (a) (b) | | $ | 744,285 | |
| | 500,000 | | | BlueMountain CLO (Cayman Islands)
Series 2015-2A, Class C
3.333%, 07/18/27 (a) (b) | | | 483,076 | |
| | 1,000,000 | | | BlueMountain CLO (Cayman Islands)
Series 2015-2A, Class D
4.183%, 07/18/27 (a) (b) | | | 921,336 | |
| | 250,000 | | | Brookside Mill CLO (Cayman Islands)
Series 2013-1A, Class D
3.683%, 04/17/25 (a) (b) | | | 208,373 | |
| | 250,000 | | | Brookside Mill CLO (Cayman Islands)
Series 2013-1A, Class E
5.033%, 04/17/25 (a) (b) | | | 157,792 | |
| | 291,042 | | | Callidus Debt Partners CLO Fund VI (Cayman Islands)
Series 6A, Class A1T
0.898%, 10/23/21 (b) | | | 285,398 | |
| | 500,000 | | | Canyon Capital CLO (Cayman Islands)
Series 2014-1A, Class B
3.287%, 04/30/25 (a) (b) | | | 475,149 | |
| | 500,000 | | | Carlyle Global Market Strategies (Cayman Islands)
Series 2014-7A, Class C
3.633%, 04/17/25 (a) (b) | | | 495,669 | |
| | 1,388,336 | | | Carlyle High Yield Partners X (Cayman Islands)
Series 2007-10A, Class A1
0.858%, 04/19/22 (a) (b) | | | 1,348,814 | |
| | 250,000 | | | Catamaran CLO (Cayman Islands)
Series 2015-1A, Class C1
3.735%, 04/22/27 (a) (b) | | | 244,357 | |
| | 2,476,965 | | | Credit Suisse Commercial Mortgage Trust
Series 2015-PR2, Class A1
4.250%, 07/26/55 (a) | | | 2,418,560 | |
| | 100,000 | | | Credit-Based Asset Servicing and Securitization
Series 2007-MX1, Class A4
6.231%, 12/01/36 (a) (h) | | | 96,056 | |
| | 1,000,000 | | | Dryden 33 Senior Loan Fund (Cayman Islands)
Series 2014-33A, Class B
2.628%, 07/15/26 (a) (b) | | | 994,639 | |
| | 750,000 | | | Dryden XXIV Senior Loan Fund (Cayman Islands)
Series 2012-24RA, Class DR
4.318%, 11/15/23 (a) (b) | | | 705,014 | |
| | 250,000 | | | Eaton Vance CDO VIII (Cayman Islands)
Series 2006-8A, Class B
1.268%, 08/15/22 (a) (b) | | | 234,618 | |
| | 250,000 | | | Emerson Park CLO (Cayman Islands)
Series 2013-1A, Class C1
3.378%, 07/15/25 (a) (b) | | | 244,255 | |
| | 250,000 | | | Flatiron CLO (Cayman Islands)
Series 2014-1A, Class C
3.933%, 07/17/26 (a) (b) | | | 217,482 | |
| | | | | | | | |
Par Value | | | | | Market
Value | |
| | | | | | | |
| | $ 500,000 | | | Galaxy XVIII CLO (Cayman Islands)
Series 2014-18A, Class D1
4.328%, 10/15/26 (a) (b) | | $ | 454,446 | |
| | 250,000 | | | Goldentree Loan Opportunities VI (Cayman Islands)
Series 2012-6A, Class D
4.833%, 04/17/22 (a) (b) | | | 248,787 | |
| | 500,000 | | | Goldentree Loan Opportunities X (Cayman Islands)
Series 2015-10A, Class D
3.984%, 07/20/27 (a) (b) | | | 462,495 | |
| | 757,000 | | | GSAA Home Equity Trust
Series 2006-15, Class AF3B
5.933%, 09/01/36 (b) | | | 135,463 | |
| | 250,000 | | | Halcyon Loan Advisors Funding (Cayman Islands)
Series 2013-2A, Class C
3.337%, 08/01/25 (a) (b) | | | 234,086 | |
| | 500,000 | | | ING Investment Management CLO II (Cayman Islands)
Series 2006-2X, Class D
2.237%, 08/01/20 (b) | | | 476,235 | |
| | 419,210 | | | KKR Financial CLO (Cayman Islands)
Series 2007-1A, Class A
0.968%, 05/15/21 (b) | | | 418,602 | |
| | 250,000 | | | LCM XI (Cayman Islands)
Series 11A, Class D
4.583%, 04/19/22 (a) (b) | | | 242,847 | |
| | 500,000 | | | LCM XII (Cayman Islands)
Series 12A, Class DR
4.333%, 10/19/22 (a) (b) | | | 478,509 | |
| | 250,000 | | | LCM XIV (Cayman Islands)
Series 14A, Class D
4.128%, 07/15/25 (a) (b) | | | 232,881 | |
| | 500,000 | | | LCM XV (Cayman Islands)
Series 15A, Class C
3.729%, 08/25/24 (a) (b) | | | 496,100 | |
| | 1,000,000 | | | LCM XVIII (Cayman Islands)
Series 19A, Class D
4.078%, 07/15/27 (a) (b) | | | 929,988 | |
| | 750,000 | | | Madison Park Funding (Cayman Islands)
Series 2007-6A, Class C
1.636%, 07/26/21 (a) (b) | | | 714,026 | |
| | 1,000,000 | | | Madison Park Funding IV (Cayman Islands)
Series 2007-4A, Class A1B
0.924%, 03/22/21 (a) (b) | | | 971,250 | |
| | 350,000 | | | Madison Park Funding IV (Cayman Islands)
Series 2007-4A, Class D
2.054%, 03/22/21 (a) (b) | | | 324,354 | |
| | 950,000 | | | Madison Park Funding X
Series 2012-10A, Class A1A
2.004%, 01/20/25 (b) | | | 948,333 | |
| | 500,000 | | | Madison Park Funding XIV (Cayman Islands)
Series 2014-14A, Class D
4.234%, 07/20/26 (a) (b) | | | 465,780 | |
See accompanying Notes to Financial Statements.
| | |
| |
| ASTON/DoubleLine Core Plus Fixed Income Fund | | April 30, 2016 |
| |
| Schedule of Investments (unaudited) – continued | | |
| | | | | | | | |
Par Value | | | | | Market
Value | |
| | | | | | | |
| | $ 500,000 | | | Madison Park Funding XV (Cayman Islands)
Series 2014-15A, Class C
4.334%, 01/27/26 (a) (b) | | $ | 449,497 | |
| | 1,500,000 | | | Madison Park Funding XVI (Cayman Islands)
Series 2015-16A, Class B
3.634%, 04/20/26 (a) (b) | | | 1,488,511 | |
| | 500,000 | | | Magnetite IX (Cayman Islands)
Series 2014-9A, Class B
3.638%, 07/25/26 (a) (b) | | | 499,997 | |
| | 500,000 | | | Magnetite XI (Cayman Islands)
Series 2014-11A, Class C
4.233%, 01/18/27 (a) (b) | | | 452,727 | |
| | 1,000,000 | | | Nautique Funding (Cayman Islands)
Series 2006-1A, Class A3
1.018%, 04/15/20 (a) (b) | | | 970,321 | |
| | 250,000 | | | Nomad CLO (Cayman Islands)
Series 2013-1A, Class B
3.578%, 01/15/25 (a) (b) | | | 233,574 | |
| | 250,000 | | | Nomad CLO (Cayman Islands)
Series 2013-1A, Class C
4.128%, 01/15/25 (a) (b) | | | 224,503 | |
| | 250,000 | | | Octagon Investment Partners XVI (Cayman Islands)
Series 2013-1A, Class D
3.983%, 07/17/25 (a) (b) | | | 222,186 | |
| | 250,000 | | | Octagon Investment Partners XVI (Cayman Islands)
Series 2013-1A, Class E
5.133%, 07/17/25 (a) (b) | | | 192,051 | |
| | 1,000,000 | | | Octagon Investment Partners XX (Cayman Islands)
Series 2014-1A, Class D
4.268%, 08/12/26 (b) | | | 940,000 | |
| | 250,000 | | | Octagon Investment Partners XXI (Cayman Islands)
Series 2014-1A, Class C
4.268%, 11/14/26 (a) (b) | | | 226,534 | |
| | 250,000 | | | Octagon Investment Partners XXII (Cayman Islands)
Series 2014-1A, Class C2
4.135%, 11/25/25 (a) (b) | | | 250,518 | |
| | 250,000 | | | Octagon Investment Partners XXII (Cayman Islands)
Series 2014-1A, Class D2
5.215%, 11/25/25 (a) (b) | | | 233,551 | |
| | 2,000,000 | | | OneMain Financial Issuance Trust
Series 2015-1A, Class A
3.190%, 03/18/26 | | | 2,007,284 | |
| | 500,000 | | | Race Point VII CLO (Cayman Islands)
Series 2012-7A, Class A
2.040%, 11/08/24 (a) (b) | | | 498,773 | |
| | 18,894 | | | Residential Asset Mortgage Products
Series 2006-RS5, Class A3
0.609%, 09/25/36 (b) | | | 18,827 | |
| | 2,000,000 | | | Springleaf Funding Trust
Series 2015-AA, Class A
3.160%, 11/15/24 | | | 2,003,496 | |
| | | | | | | | |
Par Value | | | | | Market
Value | |
| | | | | | | |
| | $ 500,000 | | | Symphony CLO XI (Cayman Islands)
Series 2013-11A, Class C
3.783%, 01/17/25 (a) (b) | | $ | 498,976 | |
| | 750,000 | | | Symphony CLO XIV (Cayman Islands)
Series 2014-14A, Class D2
4.230%, 07/14/26 (a) (b) | | | 697,025 | |
| | 4,680,079 | | | Towd Point Mortgage Trust
Series 2015-6, Class A1B
2.750%, 04/01/55 (a) (b) | | | 4,690,228 | |
| | 624,560 | | | Venture VIII CDO (Cayman Islands)
Series 2007-8A, Class A1A
0.915%, 07/22/21 (b) | | | 610,345 | |
| | 500,000 | | | Venture XI CLO
Series 2012-11A, Class AR
1.918%, 11/14/22 (b) | | | 497,980 | |
| | 750,000 | | | Venture XV CLO (Cayman Islands)
Series 2013-15A, Class C
3.728%, 07/15/25 (a) (b) | | | 720,214 | |
| | 250,000 | | | Wind River CLO (Cayman Islands)
Series 2013-1A, Class C
4.034%, 04/20/25 (a) (b) | | | 212,847 | |
| | | | | | | | |
| | |
| | | | Total Other Mortgage and Asset-Backed Securities
(Cost $46,894,912) | | | 45,777,293 | |
| | | | | | | | |
|
| | MUNICIPAL BONDS – 0.17% | |
| | |
| | | | California – 0.09% | | | | |
| | 500,000 | | | State of California GO
5.000%, 08/01/33 | | | 607,660 | |
| | |
| | | | New York – 0.08% | | | | |
| | 500,000 | | | New York State Dormitory Authority RB,
Series A
5.000%, 03/15/33 | | | 605,005 | |
| | | | | | | | |
| | |
| | | | Total Municipal Bonds
(Cost $1,141,337) | | | 1,212,665 | |
| | | | | | | | |
|
| | FOREIGN GOVERNMENT BONDS AND NOTES – 0.51% | |
| | |
| | 2,000,000 | | | Colombia Government International Bond
Senior Unsecured Notes
4.375%, 07/12/21 | | | 2,095,000 | |
| | 500,000 | | | Mexico Government International Bond
Senior Unsecured Notes
3.500%, 01/21/21 | | | 518,750 | |
| | 974,000 | | | Mexico Government International Bond
Senior Unsecured Notes
4.000%, 10/02/23 | | | 1,022,700 | |
| | | | | | | | |
| | |
| | | | Total Foreign Government Bonds and Notes
(Cost $3,497,117) | | | 3,636,450 | |
| | | | | | | | |
See accompanying Notes to Financial Statements.
| | |
| |
| ASTON/DoubleLine Core Plus Fixed Income Fund | | April 30, 2016 |
| |
| Schedule of Investments (unaudited) – continued | | |
| | | | | | | | |
Shares | | | | | Market
Value | |
| | | | | | | |
|
| | INVESTMENT COMPANIES – 9.42% | |
| | |
| | 58,238,602 | | | BlackRock Liquidity Funds TempFund Portfolio (i) | | $ | 58,238,602 | |
| | 863,411 | | | DoubleLine Floating Rate Fund (j) | | | 8,487,325 | |
| | | | | | | | |
| | |
| | | | Total Investment Companies
(Cost $66,967,682) | | | 66,725,927 | |
| | | | | | | | |
| Total Investments – 101.47%
(Cost $719,048,875)* | | | 718,885,560 | |
| | | | | | | | |
| Net Other Assets and Liabilities – (1.47)% | | | (10,445,080 | ) |
| | | | | | | | |
| Net Assets – 100.00% | | $ | 708,440,480 | |
| | | | | | | | |
| * | | At April 30, 2016, the aggregate cost for Federal income tax purposes approximates the aggregate cost for book purposes. The aggregate gross unrealized appreciation and depreciation were as follows: |
| | | | |
Gross unrealized appreciation | | $ | 12,070,827 | |
Gross unrealized depreciation | | | (12,234,142 | ) |
| | | | |
Net unrealized depreciation | | $ | (163,315 | ) |
| | | | |
| (a) | | Securities exempt from registration under Rule 144A of the Securities Act of 1933, as amended. These securities are purchased in accordance with guidelines approved by the Board of Trustees and may only be resold, in transactions exempt from registration, to qualified institutional buyers. At April 30, 2016, these securities amounted to $81,455,774, or 11.50% of net assets. These securities have not been determined by the Subadviser to be illiquid securities. |
| (b) | | Variable rate bond. The interest rate shown reflects the rate in effect at April 30, 2016. |
| (c) | | Delayed delivery security. See Note B-4 in the Notes to Financial Statements. |
| (f) | | Securities with a total aggregate market value of $5,554,853, or 0.78% of net assets, were valued under securities valuation procedures established by the Funds’ Board of Trustees. |
| (g) | | Interest only security. This type of security represents the right to receive the monthly interest payments on an underlying pool of mortgages. Payments of principal on the pool reduce the value of the “interest only” holding. |
| (h) | | Step Coupon. Security becomes interest bearing at a future date. |
| (i) | | Some of this security has been pledged as collateral for delayed delivery securities. |
| (j) | | Affilited issuer. (See Note G of the Financial Statements) |
| CDO | | Collateralized Debt Obligation |
| CLO | | Collateralized Loan Obligation |
| EMTN | | Euro Medium Term Note |
| GMTN | | Global Medium Term Note |
| REIT | | Real Estate Investment Trust |
| REMIC | | Real Estate Mortgage Investment Conduit |
| | | | |
Portfolio Composition** | | | | |
U.S. Government Obligations | | | 24% | |
U.S. Government Agency Obligations | | | 18% | |
Cash | | | 7% | |
Corporate Notes and Bonds | | | | |
(S&P Ratings) | | | | |
AAA | | | 6% | |
AA | | | 4% | |
A | | | 10% | |
BBB | | | 16% | |
BB | | | 7% | |
B | | | 3% | |
Lower than B | | | 4% | |
Not Rated | | | 1% | |
| | | | |
| | | 100% | |
| | | | |
For financial reporting purposes, credit quality ratings shown are assigned by Standard & Poor’s. This rating agency is an independent, nationally recognized statistical rating organization and is widely used. Investment grade ratings are credit ratings of BBB or higher. Below investment grade ratings are credit ratings of BB or lower. Credit quality ratings are subject to change.
** Portfolio composition is based on market value of total investments.
See accompanying Notes to Financial Statements.
| | |
| |
| ASTON/TCH Fixed Income Fund | | April 30, 2016 |
| |
| Schedule of Investments (unaudited) | | |
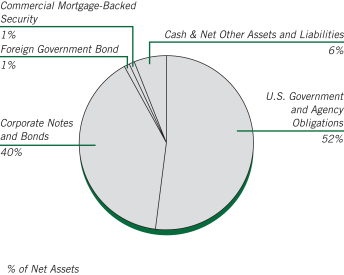
At April 30, 2016, 10.67% of the Total Net Assets of the Fund were comprised of securities of issuers located outside the United States.
| | | | | | | | |
Par Value | | | | | Market
Value | |
|
| | CORPORATE NOTES AND BONDS – 39.98% | |
| | |
| | | | Consumer Discretionary – 2.80% | | | | |
| | $ 225,000 | | | Coach
Senior Unsecured Notes
4.250%, 04/01/25 | | $ | 228,278 | |
| | 500,000 | | | Ford Motor
Senior Unsecured Notes
1.567%, 11/04/19 (a) | | | 494,253 | |
| | 390,000 | | | L Brands
Senior Unsecured Notes
7.600%, 07/15/37 | | | 422,175 | |
| | | | | | | | |
| | | | | | | 1,144,706 | |
| | | | | | | | |
| | |
| | | | Consumer Staples – 1.95% | | | | |
| | 65,000 | | | Altria Group
10.200%, 02/06/39 | | | 119,087 | |
| | 500,000 | | | Reynolds American
8.125%, 05/01/40 | | | 678,682 | |
| | | | | | | | |
| | | | | | | 797,769 | |
| | | | | | | | |
| | |
| | | | Energy – 2.37% | | | | |
| | 250,000 | | | Ecopetrol SA (Colombia)
Senior Unsecured Notes
7.375%, 09/18/43 | | | 232,656 | |
| | 100,000 | | | Petroleos Mexicanos (Mexico)
4.500%, 01/23/26 | | | 95,390 | |
| | 250,000 | | | Pride International
6.875%, 08/15/20 | | | 233,438 | |
| | | | Rowan Cos | | | | |
| | 100,000 | | | 7.875%, 08/01/19 | | | 101,678 | |
| | 180,000 | | | 4.875%, 06/01/22 | | | 146,641 | |
| | 250,000 | | | Transocean (Cayman Islands)
8.100%, 12/15/41 (b) | | | 161,875 | |
| | | | | | | | |
| | | | | | | 971,678 | |
| | | | | | | | |
| | | | | | | | |
Par Value | | | | | Market
Value | |
| | |
| | | | Financials – 10.77% | | | | |
| | $ 450,000 | | | American Express Credit, MTN
Senior Unsecured Notes
0.906%, 06/05/17 (a) | | $ | 448,108 | |
| | 450,000 | | | American Financial Group
Senior Unsecured Notes
9.875%, 06/15/19 | | | 548,429 | |
| | 580,000 | | | Bank of America
Senior Unsecured Notes
1.668%, 01/15/19 (a) | | | 580,347 | |
| | 250,000 | | | Berkshire Hathaway Finance
0.931%, 01/12/18 (a) | | | 249,981 | |
| | 140,000 | | | Citigroup
Senior Unsecured Notes
1.598%, 07/25/16 (a) | | | 140,223 | |
| | 250,000 | | | Discover Bank
Subordinated Notes
7.000%, 04/15/20 | | | 283,584 | |
| | 500,000 | | | Ensco (United Kingdom)
Senior Unsecured Notes
5.200%, 03/15/25 | | | 365,000 | |
| | 375,000 | | | Goldman Sachs Group
Senior Unsecured Notes
1.658%, 10/23/19 (a) | | | 373,358 | |
| | 500,000 | | | Goldman Sachs Group MTN
Senior Unsecured Notes
1.718%, 11/15/18 (a) | | | 500,910 | |
| | 250,000 | | | Jefferies Group
Senior Unsecured Notes
6.500%, 01/20/43 | | | 233,964 | |
| | 183,000 | | | JPMorgan Chase
Senior Unsecured Notes
3.150%, 07/05/16 | | | 183,776 | |
| | 250,000 | | | 1.465%, 03/22/19 (a) | | | 250,308 | |
| | 250,000 | | | Nomura Holdings (Japan) MTN
Senior Unsecured Notes
2.082%, 09/13/16 (a) | | | 250,781 | |
| | | | | | | | |
| | | | | | | 4,408,769 | |
| | | | | | | | |
| | |
| | | | Industrials – 5.43% | | | | |
| | 650,000 | | | ADT
Senior Unsecured Notes
4.875%, 07/15/42 | | | 489,125 | |
| | 250,000 | | | FedEx
Senior Notes
8.000%, 01/15/19 | | | 292,080 | |
| | 500,000 | | | Mexichem SAB de CV (Mexico)
6.750%, 09/19/42 (c) | | | 501,875 | |
| | 200,000 | | | Nissan Motor Acceptance
Senior Unsecured Notes
1.330%, 09/26/16 (a) (c) | | | 200,366 | |
| | 500,000 | | | Southern Copper
Senior Unsecured Notes
7.500%, 07/27/35 | | | 540,161 | |
| | 250,000 | | | Vale (Brazil)
Senior Unsecured Notes
5.625%, 09/11/42 | | | 198,750 | |
| | | | | | | | |
| | | | | | | 2,222,357 | |
| | | | | | | | |
See accompanying Notes to Financial Statements.
| | |
| |
| ASTON/TCH Fixed Income Fund | | April 30, 2016 |
| |
| Schedule of Investments (unaudited) – continued | | |
| | | | | | | | |
Par Value | | | | | Market
Value | |
| | |
| | | | Information Technology – 4.63% | | | | |
| | $ 350,000 | | | eBay
Senior Unsecured Notes
4.000%, 07/15/42 | | $ | 284,295 | |
| | 250,000 | | | Electronic Arts
Senior Unsecured Notes
3.700%, 03/01/21 | | | 261,639 | |
| | 250,000 | | | EMC
Senior Unsecured Notes
3.375%, 06/01/23 | | | 208,538 | |
| | 500,000 | | | Hewlett Packard Enterprise
Senior Unsecured Notes
4.900%, 10/15/25 (c) | | | 518,661 | |
| | 250,000 | | | Micron Technology
Senior Unsecured Notes
5.500%, 02/01/25 | | | 200,000 | |
| | 250,000 | | | QUALCOMM
Senior Unsecured Notes
4.800%, 05/20/45 | | | 253,633 | |
| | 250,000 | | | Seagate HDD (Cayman Islands)
5.750%, 12/01/34 | | | 167,824 | |
| | | | | | | | |
| | | | | | | 1,894,590 | |
| | | | | | | | |
| | |
| | | | Materials – 5.90% | | | | |
| | 400,000 | | | ArcelorMittal (Luxembourg)
Senior Unsecured Notes
8.000%, 10/15/39 (b) | | | 374,000 | |
| | 500,000 | | | Braskem America Finance
7.125%, 07/22/41 (c) | | | 447,350 | |
| | 250,000 | | | Dow Chemical
Senior Unsecured Notes
8.550%, 05/15/19 | | | 298,725 | |
| | 500,000 | | | GTL Trade Finance (Virgin Islands)
7.250%, 04/16/44 (c) | | | 426,250 | |
| | 560,000 | | | Teck Resources (Canada)
6.250%, 07/15/41 | | | 416,354 | |
| | 500,000 | | | Vale Overseas (Cayman Islands)
6.875%, 11/21/36 | | | 451,250 | |
| | | | | | | | |
| | | | | | | 2,413,929 | |
| | | | | | | | |
| | |
| | | | Media – 0.33% | | | | |
| | 150,000 | | | Viacom
Senior Unsecured Notes
4.850%, 12/15/34 | | | 135,204 | |
| | | | | | | | |
| | |
| | | | Telecommunication Services – 5.37% | | | | |
| | 500,000 | | | CenturyLink
Senior Unsecured Notes
7.600%, 09/15/39 | | | 427,500 | |
| | 500,000 | | | 7.650%, 03/15/42 | | | 427,500 | |
| | 350,000 | | | Frontier Communications
Senior Unsecured Notes
9.000%, 08/15/31 | | | 302,313 | |
| | 300,000 | | | Juniper Networks
Senior Unsecured Notes
5.950%, 03/15/41 | | | 273,769 | |
| | 250,000 | | | Telecom Italia Capital (Luxembourg)
6.375%, 11/15/33 | | | 256,250 | |
| | | | | | | | |
Par Value | | | | | Market
Value | |
| | |
| | | | Telecommunication Services (continued) | | | | |
| | $ 100,000 | | | Verizon Communications
Senior Unsecured Notes
2.164%, 09/15/16 (a) | | $ | 100,475 | |
| | 500,000 | | | Windstream
7.500%, 06/01/22 | | | 412,500 | |
| | | | | | | | |
| | | | | | | 2,200,307 | |
| | | | | | | | |
| | |
| | | | Utilities – 0.43% | | | | |
| | 150,000 | | | Pacific Gas & Electric
Senior Unsecured Notes
8.250%, 10/15/18 | | | 174,408 | |
| | | | | | | | |
| | |
| | | | Total Corporate Notes and Bonds
(Cost $16,898,209) | | | 16,363,717 | |
| | | | | | | | |
|
| | U.S. GOVERNMENT AND AGENCY OBLIGATIONS – 51.79% | |
| | |
| | | | Fannie Mae – 19.14% | | | | |
| | 57,505 | | | 6.000%, 11/01/17
Pool # 662854 | | | 58,878 | |
| | 9,105 | | | 6.000%, 04/01/18
Pool # 725175 | | | 9,263 | |
| | 81,121 | | | 5.500%, 11/01/18
Pool # 748886 | | | 84,667 | |
| | 24,095 | | | 4.500%, 06/01/19
Pool # 747860 | | | 24,834 | |
| | 151,133 | | | 6.000%, 01/01/21
Pool # 850787 | | | 160,980 | |
| | 99,017 | | | 6.000%, 09/01/32
Pool # 847899 | | | 112,794 | |
| | 49,908 | | | 6.000%, 02/01/34
Pool # 771952 | | | 57,329 | |
| | 51,428 | | | 7.500%, 02/01/35
Pool # 787557 | | | 56,472 | |
| | 17,842 | | | 7.500%, 04/01/35
Pool # 819231 | | | 18,871 | |
| | 67,142 | | | 6.000%, 11/01/35
Pool # 844078 | | | 76,635 | |
| | 70,388 | | | 5.000%, 05/01/36
Pool # 745581 | | | 78,162 | |
| | 35,227 | | | 6.000%, 12/01/36
Pool # 888029 | | | 40,224 | |
| | 48,516 | | | 5.500%, 06/01/37
Pool # 918778 | | | 54,507 | |
| | 51,672 | | | 6.500%, 10/01/37
Pool # 888890 | | | 59,593 | |
| | 150,640 | | | 5.500%, 03/01/38
Pool # 962344 | | | 169,012 | |
| | 182,338 | | | 4.000%, 02/01/41
Pool # AE0949 | | | 195,478 | |
| | 158,605 | | | 4.000%, 02/01/41
Pool # AH5695 | | | 170,016 | |
| | 841,890 | | | 3.000%, 03/01/43
Pool # AB8615 | | | 865,130 | |
| | 444,528 | | | 3.500%, 05/01/43
Pool # AB9512 | | | 466,723 | |
| | 497,606 | | | 3.000%, 07/01/43
Pool # AU1629 | | | 511,292 | |
See accompanying Notes to Financial Statements.
| | |
| |
| ASTON/TCH Fixed Income Fund | | April 30, 2016 |
| |
| Schedule of Investments (unaudited) – continued | | |
| | | | | | | | |
Par Value | | | | | Market
Value | |
| | |
| | | | Fannie Mae (continued) | | | | |
| | $ 851,690 | | | 3.000%, 08/01/43
Pool # AS0331 | | $ | 875,071 | |
| | 781,965 | | | 3.000%, 09/01/44
Pool # AX7336 | | | 802,400 | |
| | 1,343,232 | | | 3.000%, 02/01/45
Pool # AS4474 | | | 1,378,298 | |
| | 480,988 | | | 3.000%, 06/01/45
Pool # AY6104 | | | 493,545 | |
| | 991,149 | | | 3.000%, 03/01/46
Pool # AS6815 | | | 1,017,024 | |
| | | | | | | | |
| | | | | | | 7,837,198 | |
| | | | | | | | |
| | |
| | | | Freddie Mac – 18.47% | | | | |
| | 154,241 | | | 5.500%, 11/01/20
Gold Pool # G18083 | | | 164,956 | |
| | 30,933 | | | 5.500%, 12/01/20
Gold Pool # G11820 | | | 33,102 | |
| | 39,890 | | | 5.500%, 05/01/37
Gold Pool # A60048 | | | 44,376 | |
| | 100,062 | | | 5.500%, 09/01/37
Gold Pool # G03202 | | | 112,164 | |
| | 86,856 | | | 5.000%, 02/01/38
Gold Pool # A73409 | | | 95,484 | |
| | 245,960 | | | 5.000%, 04/01/38
Gold Pool # G04334 | | | 274,047 | |
| | 163,198 | | | 4.000%, 12/01/39
Gold Pool # G06935 | | | 174,834 | |
| | 74,586 | | | 4.000%, 05/01/41
Gold Pool # Q00870 | | | 79,893 | |
| | 487,671 | | | 4.000%, 11/01/41
Gold Pool # Q04550 | | | 522,071 | |
| | 799,359 | | | 3.000%, 04/01/43
Gold Pool # V80006 | | | 822,098 | |
| | 804,405 | | | 3.000%, 05/01/43
Gold Pool # G08525 | | | 825,425 | |
| | 417,899 | | | 3.000%, 09/01/43
Gold Pool # G08544 | | | 428,733 | |
| | 653,988 | | | 3.500%, 10/01/43
Gold Pool # G08554 | | | 685,669 | |
| | 238,932 | | | 3.500%, 11/01/43
Gold Pool # G08557 | | | 250,506 | |
| | 560,811 | | | 3.500%, 01/01/44
Gold Pool # G08562 | | | 587,977 | |
| | 434,070 | | | 3.500%, 02/01/44
Gold Pool # G08572 | | | 455,097 | |
| | 966,348 | | | 3.000%, 09/01/45
Gold Pool # G08666 | | | 990,951 | |
| | 987,691 | | | 3.000%, 01/01/46
Gold Pool # G08686 | | | 1,012,838 | |
| | | | | | | | |
| | | | | | | 7,560,221 | |
| | | | | | | | |
| | |
| | | | Ginnie Mae – 1.30% | | | | |
| | 70,473 | | | 5.000%, 05/01/37
Pool # 782156 | | | 78,313 | |
| | 163,217 | | | 5.000%, 08/01/37
Pool # 4015 | | | 183,467 | |
| | | | | | | | |
Par Value | | | | | Market
Value | |
| | |
| | | | Ginnie Mae (continued) | | | | |
| | $ 137,169 | | | 6.000%, 07/01/38
Pool # 4195 | | $ | 155,572 | |
| | 74,607 | | | 5.500%, 08/01/38
Pool # 4215 | | | 78,924 | |
| | 31,260 | | | 6.000%, 01/01/39
Pool # 698036 | | | 35,250 | |
| | | | | | | | |
| | | | | | | 531,526 | |
| | | | | | | | |
| |
| | | | U.S. Treasury Inflation Index Bonds – 3.22% | |
| | 1,131,810 | | | 1.750%, 01/15/28 | | | 1,318,257 | |
| | | | | | | | |
| | |
| | | | U.S. Treasury Notes – 9.66% | | | | |
| | 1,000,000 | | | 2.500%, 06/30/17 | | | 1,021,328 | |
| | 1,000,000 | | | 2.250%, 11/30/17 | | | 1,024,102 | |
| | 350,000 | | | 2.000%, 11/30/20 | | | 361,580 | |
| | 1,500,000 | | | 2.000%, 11/15/21 | | | 1,547,843 | |
| | | | | | | | |
| | | | | | | 3,954,853 | |
| | | | | | | | |
| | |
| | | | Total U.S. Government and Agency Obligations
(Cost $20,363,708) | | | 21,202,055 | |
| | | | | | | | |
|
| | COMMERCIAL MORTGAGE-BACKED SECURITY – 0.67% | |
| | |
| | 262,221 | | | Bear Stearns Commercial Mortgage Securities
Series 2007-T28, Class A4
5.742%, 09/01/42 (a) | | | 274,458 | |
| | | | | | | | |
| | |
| | | | Total Commercial Mortgage-Backed Security
(Cost $186,780) | | | 274,458 | |
| | | | | | | | |
| |
| | FOREIGN GOVERNMENT BOND – 1.14% | | | | |
| | |
| | 500,000 | | | Costa Rica Government International Bond
Senior Unsecured Notes
7.158%, 03/12/45 (c) | | | 468,125 | |
| | | | | | | | |
| | |
| | | | Total Foreign Government Bond
(Cost $500,000) | | | 468,125 | |
| | | | | | | | |
Shares | | | | | | |
| |
| | INVESTMENT COMPANY – 2.67% | | | | |
| | |
| | 1,093,027 | | | BlackRock Liquidity Funds
TempFund Portfolio | | | 1,093,027 | |
| | | | | | | | |
| | |
| | | | Total Investment Company
(Cost $1,093,027) | | | 1,093,027 | |
| | | | | | | | |
| Total Investments – 96.25%
(Cost $39,041,724)* | | | 39,401,382 | |
| | | | | | | | |
| Net Other Assets and Liabilities – 3.75% | | | 1,533,524 | |
| | | | | | | | |
| Net Assets – 100.00% | | $ | 40,934,906 | |
| | | | | | | | |
See accompanying Notes to Financial Statements.
| | |
| |
| ASTON/TCH Fixed Income Fund | | April 30, 2016 |
| |
| Schedule of Investments (unaudited) – continued | | |
| * | | At April 30, 2016, the aggregate cost for Federal income tax purposes approximates the aggregate cost for book purposes. The aggregate gross unrealized appreciation and depreciation were as follows: |
| | | | |
Gross unrealized appreciation | | $ | 1,437,498 | |
Gross unrealized depreciation | | | (1,077,840 | ) |
| | | | |
Net unrealized appreciation | | $ | 359,658 | |
| | | | |
| (a) | | Variable rate bond. The interest rate shown reflects the rate in effect at April 30, 2016. |
| (b) | | Step Coupon. A bond that pays an initial coupon rate for the first period and then a higher coupon rate for the following periods until maturity. The coupon rate shown will be the accrual rate until maturity. |
| (c) | | Securities exempt from registration under Rule 144A of the Securities Act of 1933, as amended. These securities are purchased in accordance with guidelines approved by the Funds’ Board of Trustees and may only be resold, in transactions exempt from registration, to qualified institutional buyers. At April 30, 2016, these securities amounted to $2,562,627, or 6.26% of net assets. These securities have not been determined to be illiquid securities. |
| | | | |
Portfolio Composition ** | | | | |
U.S. Government and Agency Obligations | | | 54% | |
Commercial Mortgage-Backed Security | | | 1% | |
Foreign Government Bond | | | 1% | |
Investment Company | | | 2% | |
Corporate Notes and Bonds | | | | |
(Moody’s Ratings) | | | | |
Aa | | | 1% | |
A | | | 7% | |
Baa | | | 18% | |
Ba | | | 11% | |
B | | | 5% | |
| | | | |
| | | 100% | |
| | | | |
For financial reporting purposes, credit quality ratings shown are assigned by Moody’s Investors Service. If a Moody’s credit quality rating is not available, the credit quality ratings shown are assigned by Standard & Poor’s. These rating agencies are independent, nationally recognized statistical rating organizations and are widely used. Investment grade ratings are credit ratings of Baa/ BBB or higher. Below investment grade ratings are credit ratings of Ba/BB or lower. Credit quality ratings are subject to change.
** Portfolio composition is based on market value of total investments.
See accompanying Notes to Financial Statements.
| | |
| |
| ASTON/Anchor Capital Enhanced Equity Fund | | April 30, 2016 |
| |
| Schedule of Investments (unaudited) | | |
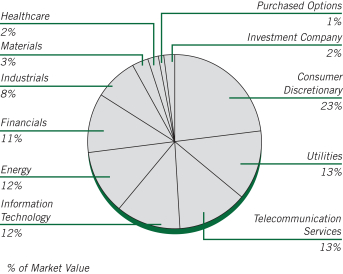
| | | | | | | | |
Shares | | | | | Market
Value | |
|
| | COMMON STOCKS – 102.41% | |
| | |
| | | | Consumer Discretionary – 24.64% | | | | |
| | 45,000 | | | Coach (a) | | $ | 1,812,150 | |
| | 420,000 | | | Ford Motor (a) | | | 5,695,200 | |
| | 168,200 | | | General Motors (a) | | | 5,348,760 | |
| | 45,000 | | | Kohl’s (a) | | | 1,993,500 | |
| | 129,000 | | | Macy’s (a) | | | 5,107,110 | |
| | 550,000 | | | Staples (a) | | | 5,610,000 | |
| | | | | | | | |
| | | | | | | 25,566,720 | |
| | | | | | | | |
| | |
| | | | Energy – 12.28% | | | | |
| | 70,000 | | | Baker Hughes (a) | | | 3,385,200 | |
| | 100,000 | | | Halliburton (a) | | | 4,131,000 | |
| | 65,000 | | | Schlumberger (a) | | | 5,222,100 | |
| | | | | | | | |
| | | | | | | 12,738,300 | |
| | | | | | | | |
| | |
| | | | Financials – 11.30% | | | | |
| | 40,000 | | | BB&T (a) | | | 1,415,200 | |
| | 20,000 | | | Hartford Financial Services Group | | | 887,600 | |
| | 450,000 | | | Huntington Bancshares (a) | | | 4,527,000 | |
| | 45,000 | | | MetLife (a) | | | 2,029,500 | |
| | 305,000 | | | Regions Financial (a) | | | 2,860,900 | |
| | | | | | | | |
| | | | | | | 11,720,200 | |
| | | | | | | | |
| | |
| | | | Healthcare – 2.66% | | | | |
| | 50,000 | | | Pfizer (a) | | | 1,635,500 | |
| | 15,000 | | | Quest Diagnostics (a) | | | 1,127,550 | |
| | | | | | | | |
| | | | | | | 2,763,050 | |
| | | | | | | | |
| | |
| | | | Industrials – 8.44% | | | | |
| | 25,000 | | | Caterpillar (a) | | | 1,943,000 | |
| | 50,000 | | | Deere (a) | | | 4,205,500 | |
| | 5,000 | | | Emerson Electric (a) | | | 273,150 | |
| | 50,000 | | | Fastenal (a) | | | 2,339,500 | |
| | | | | | | | |
| | | | | | | 8,761,150 | |
| | | | | | | | |
| | | | | | | | |
Shares | | | | | Market
Value | |
| | |
| | | | Information Technology – 13.18% | | | | |
| | 150,000 | | | Cisco Systems (a) | | $ | 4,123,500 | |
| | 130,000 | | | EMC (a) | | | 3,394,300 | |
| | 120,000 | | | Intel (a) | | | 3,633,600 | |
| | 50,000 | | | QUALCOMM (a) | | | 2,526,000 | |
| | | | | | | | |
| | | | | | | 13,677,400 | |
| | | | | | | | |
| | |
| | | | Materials – 3.17% | | | | |
| | 220,000 | | | Alcoa (a) | | | 2,457,400 | |
| | 10,000 | | | LyondellBasell Industries, Class A (a) | | | 826,700 | |
| | | | | | | | |
| | | | | | | 3,284,100 | |
| | | | | | | | |
| | |
| | | | Telecommunication Services – 13.23% | | | | |
| | 130,000 | | | AT&T (a) | | | 5,046,600 | |
| | 120,000 | | | CenturyLink (a) | | | 3,714,000 | |
| | 97,500 | | | Verizon Communications (a) | | | 4,966,650 | |
| | | | | | | | |
| | | | | | | 13,727,250 | |
| | | | | | | | |
| | |
| | | | Utilities – 13.51% | | | | |
| | 130,000 | | | Exelon (a) | | | 4,561,700 | |
| | 140,000 | | | FirstEnergy | | | 4,562,600 | |
| | 130,000 | | | PPL (a) | | | 4,893,200 | |
| | | | | | | | |
| | | | | | | 14,017,500 | |
| | | | | | | | |
| | |
| | | | Total Common Stocks
(Cost $104,995,160) | | | 106,255,670 | |
| | | | | | | | |
Number of
Contracts | | | | | | |
|
| | PURCHASED PUT OPTIONS – 1.23% | |
| | |
| | | | SPDR S&P 500 ETF TRUST | | | | |
| | 3,500 | | | Strike @ 185 Exp 06/16 | | | 266,000 | |
| | 3,500 | | | Strike @ 186 Exp 06/16 | | | 294,000 | |
| | 2,500 | | | Strike @ 187 Exp 06/16 | | | 225,000 | |
| | 5,000 | | | Strike @ 188 Exp 06/16 | | | 495,000 | |
| | | | | | | | |
| | |
| | | | Total Purchased Put Options
(Cost $1,053,905) | | | 1,280,000 | |
| | | | | | | | |
Shares | | | | | | |
|
| | INVESTMENT COMPANY – 1.93% | |
| | |
| | 2,007,042 | | | BlackRock Liquidity Funds TempFund Portfolio | | | 2,007,042 | |
| | | | | | | | |
| | |
| | | | Total Investment Company
(Cost $2,007,042) | | | 2,007,042 | |
| | | | | | | | |
| Total Investments – 105.57%
(Cost $108,056,107)* | | | 109,542,712 | |
| | | | | | | | |
| Net Other Assets and Liabilities – (5.57)% | | | (5,782,079 | ) |
| | | | | | | | |
| Net Assets – 100.00% | | $ | 103,760,633 | |
| | | | | | | | |
See accompanying Notes to Financial Statements.
| | |
| |
| ASTON/Anchor Capital Enhanced Equity Fund | | April 30, 2016 |
| |
| Schedule of Investments (unaudited) – continued | | |
| * | | At April 30, 2016, the aggregate cost for Federal income tax purposes approximates the aggregate cost for book purposes. The aggregate gross unrealized appreciation and depreciation were as follows: |
| | | | |
Gross unrealized appreciation | | $ | 8,349,085 | |
Gross unrealized depreciation | | | (6,862,480 | ) |
| | | | |
Net unrealized appreciation | | $ | 1,486,605 | |
| | | | |
| (a) | | These securities are pledged as collateral for call options written. |
| SPDR | | Standard & Poor’s Depositary Receipt |
Transactions in written call options for the period ended April 30, 2016 were as follows:
| | | | | | | | |
| Contracts | | Number of
Contracts | | | Premium | |
Outstanding, October 31, 2015 | | | 51,353 | | | $ | 4,263,438 | |
Call Options Written | | | 78,132 | | | | 9,609,939 | |
Call Options Closed or Expired | | | (94,673 | ) | | | (10,342,707 | ) |
| | | | | | | | |
Outstanding, April 30, 2016 | | | 34,812 | | | $ | 3,530,670 | |
| | | | | | | | |
Premiums received and value of written call equity options outstanding as of April 30, 2016.
| | | | | | | | | | | | |
Number of
Contracts | | | Description | | Premium
Received | | | Market
Value | |
| | | | Alcoa | | | | | | | | |
| | 500 | | | Strike @ $9 Exp 7/16 | | $ | 14,500 | | | $ | 117,500 | |
| | 1,700 | | | Strike @ $9 Exp 10/16 | | | 227,030 | | | | 434,350 | |
| | | |
| | | | AT&T | | | | | | | | |
| | 1,300 | | | Strike @ $38 Exp 10/16 | | | 66,299 | | | | 217,100 | |
| | | |
| | | | Baker Hughes | | | | | | | | |
| | 700 | | | Strike @ $45 Exp 10/16 | | | 397,563 | | | | 514,500 | |
| | | |
| | | | BB&T | | | | | | | | |
| | 350 | | | Strike @ $36 Exp 06/16 | | | 16,300 | | | | 21,350 | |
| | 50 | | | Strike @ $36 Exp 09/16 | | | 5,408 | | | | 6,500 | |
| | | |
| | | | Caterpillar | | | | | | | | |
| | 250 | | | Strike @ $67.50 Exp 8/16 | | | 43,239 | | | | 292,500 | |
| | | |
| | | | CentryLink | | | | | | | | |
| | 1,200 | | | Strike @ $32 Exp 7/16 | | | 57,585 | | | | 116,400 | |
| | | |
| | | | Cisco Systems | | | | | | | | |
| | 1,500 | | | Strike @ $27 Exp 10/16 | | | 102,236 | | | | 271,500 | |
| | | |
| | | | Coach | | | | | | | | |
| | 350 | | | Strike @ $37 Exp 8/16 | | | 27,635 | | | | 161,700 | |
| | 100 | | | Strike @ $40 Exp 8/16 | | | 4,146 | | | | 26,500 | |
| | | |
| | | | Deere | | | | | | | | |
| | 500 | | | Strike @ $80 Exp 9/16 | | | 158,591 | | | | 377,500 | |
| | | |
| | | | EMC | | | | | | | | |
| | 425 | | | Strike @ $28 Exp 07/16 | | | 21,080 | | | | 17,000 | |
| | | |
| | | | Emerson Electric | | | | | | | | |
| | 50 | | | Strike @ $57.5 Exp 06/16 | | | 5,400 | | | | 2,700 | |
| | | |
| | | | Exelon | | | | | | | | |
| | 500 | | | Strike @ $35 Exp 01/17 | | | 83,978 | | | | 112,500 | |
| | 800 | | | Strike @ $37 Exp 10/16 | | | 67,166 | | | | 72,000 | |
| | | | | | | | | | | | |
Number of
Contracts | | | Description | | Premium
Received | | | Market
Value | |
| | | | Fastenal | | | | | | | | |
| | 500 | | | Strike @ $45 Exp 8/16 | | $ | 33,249 | | | $ | 169,000 | |
| | | |
| | | | Ford Motor | | | | | | | | |
| | 200 | | | Strike @ $15 Exp 08/16 | | | 4,592 | | | | 3,800 | |
| | 3,000 | | | Strike @ $15 Exp 12/16 | | | 105,406 | | | | 129,000 | |
| | | |
| | | | General Motors | | | | | | | | |
| | 482 | | | Strike @ $35 Exp 09/16 | | | 21,690 | | | | 26,028 | |
| | 500 | | | Strike @ $36 Exp 09/16 | | | 17,000 | | | | 20,500 | |
| | 500 | | | Strike @ $38 Exp 09/16 | | | 8,500 | | | | 8,750 | |
| | | |
| | | | Halliburton | | | | | | | | |
| | 1,000 | | | Strike @ $39 Exp 01/17 | | | 555,947 | | | | 580,000 | |
| | | |
| | | | Huntington Bancshares | | | | | | | | |
| | 4,500 | | | Strike @ $11 Exp 10/16 | | | 160,375 | | | | 141,750 | |
| | | |
| | | | Intel | | | | | | | | |
| | 1,200 | | | Strike @ $32 Exp 10/16 | | | 142,748 | | | | 127,200 | |
| | | |
| | | | Kohl’s | | | | | | | | |
| | 450 | | | Strike @ $50 Exp 10/16 | | | 120,597 | | | | 47,250 | |
| | | |
| | | | LyondellBasell Industries | | | | | | | | |
| | 100 | | | Strike @ $80 Exp 09/16 | | | 54,795 | | | | 69,000 | |
| | | |
| | | | Macy’s | | | | | | | | |
| | 1,000 | | | Strike @ $50 Exp 11/16 | | | 153,239 | | | | 50,000 | |
| | | |
| | | | MetLife | | | | | | | | |
| | 250 | | | Strike @ $50 Exp 12/16 | | | 39,499 | | | | 39,000 | |
| | | |
| | | | Pfizer | | | | | | | | |
| | 150 | | | Strike @ $31 Exp 05/16 | | | 6,500 | | | | 26,850 | |
| | 50 | | | Strike @ $32 Exp 06/16 | | | 1,750 | | | | 5,600 | |
| | 300 | | | Strike @ $33 Exp 06/16 | | | 14,100 | | | | 16,800 | |
| | | |
| | | | PPL | | | | | | | | |
| | 1,300 | | | Strike @ $37 Exp 10/16 | | | 166,344 | | | | 240,500 | |
| | | |
| | | | QUALCOMM | | | | | | | | |
| | 250 | | | Strike @ $55 Exp 01/17 | | | 53,794 | | | | 55,750 | |
| | 250 | | | Strike @ $57.5 Exp 10/16 | | | 47,184 | | | | 20,250 | |
| | | |
| | | | Quest Diagnostics | | | | | | | | |
| | 150 | | | Strike @ $70 Exp 8/16 | | | 41,767 | | | | 99,750 | |
| | | |
| | | | Regions Financial | | | | | | | | |
| | 250 | | | Strike @ $9 Exp 8/16 | | | 9,750 | | | | 19,375 | |
| | 300 | | | Strike @ $10 Exp 8/16 | | | 5,400 | | | | 7,500 | |
| | 500 | | | Strike @ $10 Exp 11/16 | | | 13,014 | | | | 21,500 | |
| | 1,200 | | | Strike @ $11 Exp 5/16 | | | 36,685 | | | | 3,000 | |
| | 800 | | | Strike @ $11 Exp 8/16 | | | 25,298 | | | | 8,400 | |
| | | |
| | | | Schlumberger | | | | | | | | |
| | 650 | | | Strike @ $80 Exp 11/16 | | | 190,485 | | | | 375,375 | |
| | | |
| | | | Staples | | | | | | | | |
| | 1,500 | | | Strike @ $14 Exp 6/16 | | | 39,687 | | | | 18,750 | |
| | 2,230 | | | Strike @ $15 Exp 6/16 | | | 42,271 | | | | 11,150 | |
| | | |
| | | | Verizon Communications | | | | | | | | |
| | 1 | | | Strike @ $47 Exp 7/16 | | | 115 | | | | 423 | |
| | 974 | | | Strike @ $50 Exp 10/16 | | | 120,733 | | | | 236,682 | |
| | | | | | | | | | | | |
| | | |
| | | | Total Written Call Options | | $ | 3,530,670 | | | $ | 5,340,533 | |
| | | | | | | | | | | | |
See accompanying Notes to Financial Statements.
| | |
| |
| ASTON/Lake Partners LASSO Alternatives Fund | | April 30, 2016 |
| |
| Schedule of Investments (unaudited) | | |
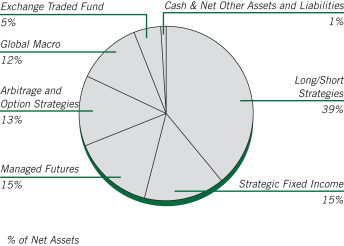
| | | | | | | | |
Shares | | | | | Market
Value | |
| |
| | INVESTMENT COMPANIES – 95.41% | | | | |
| | |
| | | | Long/Short Strategies – 39.14% | | | | |
| | 592,344 | | | 361 Global Long/Short Equity Fund-Y | | $ | 6,355,852 | |
| | 359,897 | | | Boston Partners Long/Short Equity Fund | | | 7,140,365 | |
| | 380,478 | | | Convergence Core Plus Fund | | | 6,300,709 | |
| | 101 | | | Diamond Hill Long/Short Fund-I | | | 2,435 | |
| | 102,584 | | | FPA Crescent Fund | | | 3,239,611 | |
| | 616,504 | | | John Hancock Seaport Fund-I | | | 6,467,127 | |
| | 1,220,203 | | | Mainstay U.S. Equity Opportunities Fund-I | | | 10,249,708 | |
| | 859,572 | | | Otter Creek Long/Short Opportunity Fund * | | | 10,564,142 | |
| | | | | | | | |
| | | | | | | 50,319,949 | |
| | | | | | | | |
| |
| | | | Strategic Fixed Income – 15.25% | |
| | 775,254 | | | Metropolitan West Unconstrained Bond Fund-I | | | 9,132,495 | |
| | 951,526 | | | PIMCO Mortgage Opportunities Fund | | | 10,466,784 | |
| | | | | | | | |
| | | | | | | 19,599,279 | |
| | | | | | | | |
| |
| | | | Managed Futures – 15.23% | |
| | 296,984 | | | 361 Managed Futures Fund-I * | | | 3,195,547 | |
| | 1,093,411 | | | Abbey Capital Futures Strategy Fund-I | | | 13,000,661 | |
| | 314,157 | | | ASG Managed Futures Strategy Fund-Y | | | 3,383,475 | |
| | | | | | | | |
| | | | | | | 19,579,683 | |
| | | | | | | | |
| |
| | | | Arbitrage and Options Strategies – 13.13% | |
| | 510,272 | | | Calamos Market Neutral Income Fund-I | | | 6,490,664 | |
| | 635,505 | | | Kellner Merger Fund | | | 6,482,155 | |
| | 82,093 | | | Schooner Hedged Alternative Income Fund | | | 3,901,039 | |
| | | | | | | | |
| | | | | | | 16,873,858 | |
| | | | | | | | |
| |
| | | | Global Macro – 11.66% | |
| | 644,116 | | | John Hancock Funds II - Global Absolute Return Strategies Fund-I | | | 6,479,803 | |
| | | | | | | | |
Shares | | | | | Market
Value | |
| |
| | | | Global Macro (continued) | |
| | 807,128 | | | Western Asset Macro Opportunities Fund-IS | | $ | 8,507,129 | |
| | | | | | | | |
| | | | | | | 14,986,932 | |
| | | | | | | | |
| |
| | | | Money Market – 1.00% | |
| | 1,285,573 | | | BlackRock Liquidity Funds Treasury Trust Fund Portfolio | | | 1,285,573 | |
| | | | | | | | |
| | |
| | | | Total Investment Companies (Cost $125,378,986) | | | 122,645,274 | |
| | | | | | | | |
| |
| | EXCHANGE TRADED FUND – 5.19% | | | | |
| | |
| | | | Long/Short Strategies – 5.19% | | | | |
| | 132,640 | | | Proshares Large Cap Core Plus | | | 6,675,599 | |
| | | | | | | | |
| | |
| | | | Total Exchange Traded Fund (Cost $6,716,595) | | | 6,675,599 | |
| | | | | | | | |
| Total Investments – 100.60%
(Cost $132,095,581)** | | | 129,320,873 | |
| | | | | | | | |
| Net Other Assets and Liabilities – (0.60)% | | | (767,033 | ) |
| | | | | | | | |
| Net Assets – 100.00% | | $ | 128,553,840 | |
| | | | | | | | |
| * | | Non-income producing security. |
| ** | | At April 30, 2016, the aggregate cost for Federal income tax purposes approximates the aggregate cost for book purposes. The aggregate gross unrealized appreciation and depreciation were as follows: |
| | | | |
Gross unrealized appreciation | | $ | 913,618 | |
Gross unrealized depreciation | | | (3,688,326 | ) |
| | | | |
Net unrealized depreciation | | $ | (2,774,708 | ) |
| | | | |
See accompanying Notes to Financial Statements.
| | |
| |
| ASTON/River Road Long-Short Fund | | April 30, 2016 |
| |
| Schedule of Investments (unaudited) | | |
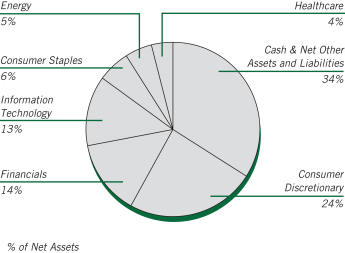
The chart represents total investments in the Fund. Industrials, Materials and Telecommunication Services are negative 1.08%, 0.65% and 1.51%, respectively, and are represented in the pie chart by reducing Cash and Net Other Assets and Liabilities to be 34%.
| | | | | | | | |
Shares | | | | | Market
Value | |
|
| | COMMON STOCKS – 96.15% | |
| | |
| | | | Consumer Discretionary – 34.18% | | | | |
| | 2,544 | | | Biglari Holdings * | | $ | 951,303 | |
| | 27,291 | | | Comcast, Class A (a) | | | 1,658,201 | |
| | 19,862 | | | Liberty Broadband, Class C * | | | 1,137,100 | |
| | 59,396 | | | Liberty Media Group, Class C (a) * | | | 1,069,128 | |
| | 40,138 | | | Liberty Sirius Group, Class C (a) * | | | 1,285,219 | |
| | 40,080 | | | Liberty Ventures, Class A (a) * | | | 1,603,200 | |
| | 7,714 | | | Madison Square Garden, Class A (a) * | | | 1,210,944 | |
| | 74,979 | | | News, Class A (a) | | | 931,239 | |
| | 48,983 | | | Quebecor, Class B (Canada) | | | 1,310,169 | |
| | 15,078 | | | Ralph Lauren (a) | | | 1,405,420 | |
| | 48,745 | | | SeaWorld Entertainment (a) | | | 971,488 | |
| | 31,733 | | | Tribune Media, Class A (a) | | | 1,223,307 | |
| | | | | | | | |
| | | | | | | 14,756,718 | |
| | | | | | | | |
| |
| | | | Consumer Staples – 7.27% | |
| | 41,934 | | | Ingles Markets, Class A (a) | | | 1,512,559 | |
| | 21,783 | | | Nestle, SP ADR (Switzerland) (a) | | | 1,624,358 | |
| | | | | | | | |
| | | | | | | 3,136,917 | |
| | | | | | | | |
| |
| | | | Energy – 4.63% | |
| | 13,553 | | | Baker Hughes (a) | | | 655,423 | |
| | 41,806 | | | PBF Energy, Class A (a) | | | 1,345,317 | |
| | | | | | | | |
| | | | | | | 2,000,740 | |
| | | | | | | | |
| |
| | | | Financials – 24.33% | |
| | 21,000 | | | Allied World Assurance Co Holdings AG (Switzerland) (a) | | | 747,180 | |
| | 31,259 | | | Associated Capital Group, Class A | | | 952,462 | |
| | 9,255 | | | Berkshire Hathaway, Class B (a) * | | | 1,346,417 | |
| | | | | | | | |
Shares | | | | | Market
Value | |
| |
| | | | Financials (continued) | |
| | 156,962 | | | FNFV Group (a) * | | $ | 1,690,481 | |
| | 34,757 | | | Oaktree Capital Group (a) | | | 1,679,111 | |
| | 43,728 | | | Wells Fargo (a) | | | 2,185,525 | |
| | 30,372 | | | Weyerhaeuser, REIT (a) | | | 975,549 | |
| | 1,118 | | | White Mountains Insurance Group (Bermuda) (a) | | | 927,940 | |
| | | | | | | | |
| | | | | | | 10,504,665 | |
| | | | | | | | |
| |
| | | | Healthcare – 4.21% | |
| | 24,621 | | | Express Scripts Holding (a) * | | | 1,815,306 | |
| | | | | | | | |
| |
| | | | Industrials – 7.34% | |
| | 26,395 | | | KLX (a) * | | | 890,039 | |
| | 23,945 | | | Spirit AeroSystems Holdings, Class A (a) * | | | 1,129,007 | |
| | 3,676 | | | Stericycle * | | | 351,279 | |
| | 7,368 | | | UniFirst (a) | | | 798,544 | |
| | | | | | | | |
| | | | | | | 3,168,869 | |
| | | | | | | | |
| |
| | | | Information Technology – 13.52% | |
| | 1,607 | | | Alphabet, Class C (a) * | | | 1,113,667 | |
| | 6,934 | | | Apple | | | 649,993 | |
| | 47,894 | | | Blackhawk Network Holdings (a) * | | | 1,538,834 | |
| | 32,240 | | | Microsoft (a) | | | 1,607,809 | |
| | 23,637 | | | PayPal Holdings (a) * | | | 926,098 | |
| | | | | | | | |
| | | | | | | 5,836,401 | |
| | | | | | | | |
| |
| | | | Materials – 0.67% | |
| | 40,004 | | | Alamos Gold (Canada), Class A (a) | | | 288,029 | |
| | | | | | | | |
| | |
| | | | Total Common Stocks (Cost $40,104,513) | | | 41,507,645 | |
| | | | | | | | |
|
| | INVESTMENT COMPANY – 46.42% | |
| | |
| | 20,038,461 | | | BlackRock Liquidity Funds TempFund Portfolio | | | 20,038,461 | |
| | | | | | | | |
| | |
| | | | Total Investment Company (Cost $20,038,461) | | | 20,038,461 | |
| | | | | | | | |
| Total Investments – 142.57%
(Cost $60,142,974) ** | | | 61,546,106 | |
| | | | | | | | |
|
| | SHORT SALES (b) – (33.50)% | |
|
| | Common Stocks – (33.50)% | |
| |
| | | | Consumer Discretionary – (10.13)% | |
| | (16,651) | | | American Axle & Manufacturing Holdings * | | | (258,256 | ) |
| | (11,086) | | | Best Buy | | | (355,639 | ) |
| | (5,032) | | | Brunswick | | | (241,687 | ) |
| | (4,209) | | | Burlington Stores * | | | (239,787 | ) |
| | (463) | | | Chipotle Mexican Grill * | | | (194,909 | ) |
| | (50,532) | | | ClubCorp Holdings | | | (674,602 | ) |
| | (4,989) | | | Delphi Automotive PLC | | | (367,340 | ) |
| | (6,133) | | | Five Below * | | | (255,746 | ) |
| | (8,138) | | | Mattress Firm Holding * | | | (317,545 | ) |
See accompanying Notes to Financial Statements.
| | |
| |
| ASTON/River Road Long-Short Fund | | April 30, 2016 |
| |
| Schedule of Investments (unaudited) – continued | | |
| | | | | | | | |
Shares | | | | | Market
Value | |
| |
| | | | Consumer Discretionary (continued) | |
| | (9,887) | | | Tempur-Pedic International * | | $ | (599,844 | ) |
| | (1,039) | | | TESLA Motors * | | | (250,150 | ) |
| | (1,802) | | | Tractor Supply | | | (170,577 | ) |
| | (2,579) | | | Whirlpool | | | (449,107 | ) |
| | | | | | | | |
| | | | | | | (4,375,189 | ) |
| | | | | | | | |
| |
| | | | Consumer Staples – (0.98)% | |
| | (24,434) | | | Dean Foods | | | (420,998 | ) |
| | | | | | | | |
| |
| | | | Financials – (9.98)% | |
| | (26,508) | | | Amtrust Financial Services | | | (658,724 | ) |
| | (16,204) | | | BofI Holding * | | | (330,075 | ) |
| | (7,767) | | | BOK Financial | | | (467,418 | ) |
| | (2,540) | | | Camden Property Trust REIT | | | (205,054 | ) |
| | (21,692) | | | Deutsche Bank AG (Germany) * | | | (411,280 | ) |
| | (1,582) | | | FactSet Research Systems | | | (238,487 | ) |
| | (18,886) | | | Hancock Holdings | | | (490,469 | ) |
| | (31,540) | | | Janus Capital Group | | | (460,484 | ) |
| | (10,944) | | | Mercury General | | | (578,938 | ) |
| | (4,466) | | | SVB Financial Group * | | | (465,714 | ) |
| | | | | | | | |
| | | | | | | (4,306,643 | ) |
| | | | | | | | |
| |
| | | | Healthcare – (0.63)% | |
| | (4,355) | | | Mallinckrodt * | | | (272,275 | ) |
| | | | | | | | |
| |
| | | | Industrials – (8.42)% | |
| | (50,825) | | | ACCO Brands * | | | (484,871 | ) |
| | (2,084) | | | Allegiant Travel | | | (334,628 | ) |
| | (3,180) | | | Caterpillar | | | (247,150 | ) |
| | (6,004) | | | Deere | | | (504,996 | ) |
| | (7,649) | | | Mobile Mini | | | (246,680 | ) |
| | (15,339) | | | Pitney Bowes | | | (321,659 | ) |
| | (45,045) | | | RR Donnelley & Sons | | | (783,783 | ) |
| | (13,207) | | | Tetra Tech | | | (388,286 | ) |
| | (4,828) | | | United Rentals * | | | (323,138 | ) |
| | | | | | | | |
| | | | | | | (3,635,191 | ) |
| | | | | | | | |
| |
| | | | Information Technology – (0.53)% | |
| | (3,721) | | | Electronic Arts * | | | (230,144 | ) |
| | | | | | | | |
| |
| | | | Materials – (1.32)% | |
| | (10,333) | | | Louisiana-Pacific * | | | (175,661 | ) |
| | (32,207) | | | Teck Resources, Class B (Canada) | | | (394,536 | ) |
| | | | | | | | |
| | | | | | | (570,197 | ) |
| | | | | | | | |
| |
| | | | Telecommunication Services – (1.51)% | |
| | (6,193) | | | Cogent Communications Holdings | | | (239,669 | ) |
| | (73,767) | | | Frontier Communications | �� | | (410,145 | ) |
| | | | | | | | |
| | | | | | | (649,814 | ) |
| | | | | | | | |
| | | | Total Common Stocks (Proceeds $13,536,329) | | | (14,460,451 | ) |
| | | | | | | | |
| Total Short Sales – (33.50)%
(Proceeds $13,536,329) | | | (14,460,451 | ) |
| | | | | | | | |
| Net Other Assets and Liabilities – (9.07)% | | | (3,914,816 | ) |
| | | | | | | | |
| Net Assets – 100.00% | | $ | 43,170,839 | |
| | | | | | | | |
| * | | Non-income producing security. |
| ** | | At April 30, 2016, the aggregate cost for Federal income tax purposes approximates the aggregate cost for book purposes. The aggregate gross unrealized appreciation and depreciation were as follows: |
| | | | |
Gross unrealized appreciation | | $ | 2,077,727 | |
Gross unrealized depreciation | | | (674,595 | ) |
| | | | |
Net unrealized appreciation | | $ | 1,403,132 | |
| | | | |
| (a) | | Security position is either entirely or partially held in a segregated account as collateral for securities sold short. As of April 30, 2016 $29,366,479 in securities was segregated or on deposit with prime brokers to cover short sales. |
| (b) | | The Fund is contractually responsible to the lender for any dividends payable and interest accrued on securities while those securities are in short position. These dividends and interest amounts are recorded as an expense of the Fund. |
| REIT | | Real Estate Investment Trust |
| SP ADR | | Sponsored American Depositary Receipt |
See accompanying Notes to Financial Statements.
| | |
| |
| ASTON/Barings International Fund | | April 30, 2016 |
| |
| Schedule of Investments (unaudited) | | |
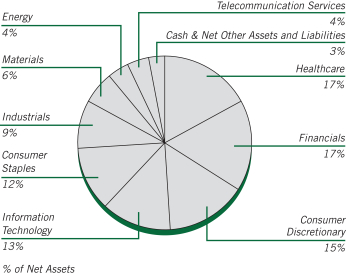
| | | | | | | | |
Shares | | | | | Market
Value | |
|
| | COMMON STOCKS – 97.19% | |
| | |
| | | | Australia – 4.10% | | | | |
| | 33,726 | | | Amcor (a) | | $ | 393,209 | |
| | 5,355 | | | CSL (a) | | | 426,732 | |
| | | | | | | | |
| | | | | | | 819,941 | |
| | | | | | | | |
| | |
| | | | Belgium – 0.84% | | | | |
| | 5,503 | | | Ontex Group (a) | | | 168,801 | |
| | | | | | | | |
| | |
| | | | China – 0.65% | | | | |
| | 151,000 | | | Pax Global Technology (a) | | | 130,044 | |
| | | | | | | | |
| | |
| | | | France – 8.83% | | | | |
| | 7,658 | | | Accor (a) | | | 339,123 | |
| | 2,409 | | | Air Liquide (a) | | | 273,222 | |
| | 12,214 | | | AXA (a) | | | 308,400 | |
| | 4,552 | | | BNP Paribas (a) | | | 241,070 | |
| | 8,152 | | | SES (a) | | | 222,719 | |
| | 7,517 | | | Total (a) | | | 379,917 | |
| | | | | | | | |
| | | | | | | 1,764,451 | |
| | | | | | | | |
| | |
| | | | Germany – 11.16% | | | | |
| | 2,743 | | | Bayer (a) | | | 317,002 | |
| | 3,400 | | | Daimler (a) | | | 236,902 | |
| | 4,320 | | | Deutsche Boerse (a) | | | 355,488 | |
| | 5,114 | | | Fresenius (a) | | | 372,906 | |
| | 4,280 | | | SAP (a) | | | 335,815 | |
| | 20,960 | | | TUI (a) | | | 304,238 | |
| | 7,113 | | | Wirecard (a) | | | 308,071 | |
| | | | | | | | |
| | | | | | | 2,230,422 | |
| | | | | | | | |
| | |
| | | | Hong Kong – 1.42% | | | | |
| | 47,400 | | | AIA Group (a) | | | 283,670 | |
| | | | | | | | |
| | | | | | | | |
Shares | | | | | Market
Value | |
| | |
| | | | Japan – 25.09% | | | | |
| | 22,900 | | | Astellas Pharma (a) | | $ | 308,751 | |
| | 9,900 | | | Bridgestone (a) | | | 364,394 | |
| | 5,300 | | | Daikin Industries (a) | | | 420,709 | |
| | 24,900 | | | Hitachi Metals (a) | | | 252,838 | |
| | 3,700 | | | Hoshizaki Electric (a) | | | 310,516 | |
| | 20,500 | | | Isuzu Motors (a) | | | 219,356 | |
| | 8,900 | | | Japan Tobacco (a) | | | 363,636 | |
| | 14,900 | | | KDDI (a) | | | 429,205 | |
| | 28,000 | | | Mitsubishi Electric (a) | | | 297,568 | |
| | 63,500 | | | Mitsubishi UFJ Financial Group (a) | | | 293,041 | |
| | 11,000 | | | Mitsui Fudosan (a) | | | 268,647 | |
| | 3,500 | | | Pigeon (a) | | | 91,930 | |
| | 20,600 | | | Rakuten (a) | | | 223,950 | |
| | 13,300 | | | Sony (a) | | | 322,148 | |
| | 1,533 | | | Sony, SP ADR | | | 36,945 | |
| | 5,400 | | | Takeda Pharmaceuticals (a) | | | 257,914 | |
| | 9,600 | | | Tokio Marine Holdings (a) | | | 314,136 | |
| | 4,700 | | | Toyota Motor (a) | | | 238,242 | |
| | | | | | | | |
| | | | | | | 5,013,926 | |
| | | | | | | | |
| | |
| | | | Netherlands – 9.52% | | | | |
| | 3,914 | | | Airbus Group (a) | | | 244,695 | |
| | 3,851 | | | ASML Holding (a) | | | 372,223 | |
| | 18,381 | | | Koninklijke Ahold (a) | | | 400,232 | |
| | 9,139 | | | Koninklijke Philips (a) | | | 251,129 | |
| | 7,454 | | | Mobileye * | | | 284,370 | |
| | 13,228 | | | Royal Dutch Shell, Class A (a) | | | 349,457 | |
| | | | | | | | |
| | | | | | | 1,902,106 | |
| | | | | | | | |
| | |
| | | | Spain – 1.81% | | | | |
| | 7,918 | | | Amadeus IT Holding, Class A (a) | | | 361,065 | |
| | | | | | | | |
| | |
| | | | Sweden – 1.82% | | | | |
| | 17,319 | | | Assa Abloy, Class B (a) | | | 363,911 | |
| | | | | | | | |
| | |
| | | | Switzerland – 6.76% | | | | |
| | 2,825 | | | Actelion (a) | | | 457,876 | |
| | 7,067 | | | Julius Baer Group (a) | | | 302,862 | |
| | 3,373 | | | Novartis (a) | | | 256,693 | |
| | 19,320 | | | UBS Group (a) | | | 334,921 | |
| | | | | | | | |
| | | | | | | 1,352,352 | |
| | | | | | | | |
| | |
| | | | Taiwan – 1.63% | | | | |
| | 13,800 | | | Taiwan Semiconductor Manufacturing, SP ADR | | | 325,542 | |
| | | | | | | | |
| | |
| | | | United Kingdom – 23.56% | | | | |
| | 12,914 | | | Admiral Group (a) | | | 350,986 | |
| | 25,531 | | | ARM Holdings (a) | | | 350,436 | |
| | 5,042 | | | AstraZeneca (a) | | | 289,274 | |
| | 5,790 | | | British American Tobacco (a) | | | 353,030 | |
| | 45,039 | | | BT Group (a) | | | 291,947 | |
| | 49,659 | | | GKN (a) | | | 202,655 | |
| | 22,257 | | | Indivior (a) | | | 52,413 | |
| | 5,019 | | | Johnson Matthey (a) | | | 212,128 | |
| | 30,596 | | | Mediclinic International (a) | | | 404,816 | |
| | 19,228 | | | Prudential (a) | | | 379,553 | |
See accompanying Notes to Financial Statements.
| | |
| |
| ASTON/Barings International Fund | | April 30, 2016 |
| |
| Schedule of Investments (unaudited) – continued | | |
| | | | | | | | |
Shares | | | | | Market
Value | |
| | |
| | | | United Kingdom (continued) | | | | |
| | 3,567 | | | Reckitt Benckiser Group (a) | | $ | 347,494 | |
| | 5,285 | | | SABMiller (a) | | | 323,686 | |
| | 4,781 | | | Shire (a) | | | 298,345 | |
| | 6,495 | | | Unilever (a) | | | 290,210 | |
| | 55,562 | | | Worldpay Group * (a) | | | 216,698 | |
| | 14,752 | | | WPP (a) | | | 344,649 | |
| | | | | | | | |
| | | | | | | 4,708,320 | |
| | | | | | | | |
| | |
| | | | Total Common Stocks
(Cost $18,663,572) | | | 19,424,551 | |
| | | | | | | | |
|
| | INVESTMENT COMPANY – 2.03% | |
| | |
| | 405,382 | | | BlackRock Liquidity Funds TempFund Portfolio | | | 405,382 | |
| | | | | | | | |
| | |
| | | | Total Investment Company
(Cost $405,382) | | | 405,382 | |
| | | | | | | | |
| Total Investments – 99.22%
(Cost $19,068,954)** | | | 19,829,933 | |
| | | | | | | | |
| Net Other Assets and Liabilities – 0.78% | | | 155,959 | |
| | | | | | | | |
| Net Assets – 100.00% | | $ | 19,985,892 | |
| | | | | | | | |
| * | | Non-income producing security. |
| ** | | At April 30, 2016, the aggregate cost for Federal income tax purposes approximates the aggregate cost for book purposes. The aggregate gross unrealized appreciation and depreciation were as follows: |
| | | | |
Gross unrealized appreciation | | $ | 1,782,259 | |
Gross unrealized depreciation | | | (1,021,280 | ) |
| | | | |
Net unrealized appreciation | | $ | 760,979 | |
| | | | |
| (a) | | Securities with a total aggregate market value of $18,777,694, or 93.95% of net assets, were valued under securities valuation procedures established by the Funds’ Board of Trustees. |
| SP ADR | | Sponsored American Depositary Receipt |
See accompanying Notes to Financial Statements.
| | |
| |
| ASTON/Guardian Capital Global Dividend Fund | | April 30, 2016 |
| |
| Schedule of Investments (unaudited) | | |
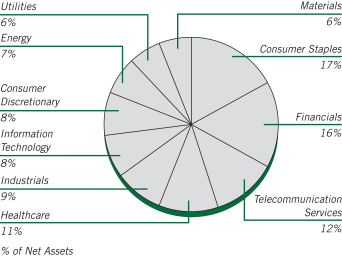
| | | | | | | | |
Shares | | | | | Market
Value | |
|
| | COMMON STOCKS – 99.52% | |
| | |
| | | | Australia – 3.73% | | | | |
| | 1,679 | | | Australia & New Zealand Banking Group (a) | | $ | 30,776 | |
| | 1,100 | | | Sonic Healthcare (a) | | | 16,142 | |
| | 8,351 | | | Sydney Airport (a) | | | 43,058 | |
| | 10,100 | | | Telstra (a) | | | 41,010 | |
| | 1,200 | | | Westpac Banking (a) | | | 28,168 | |
| | | | | | | | |
| | | | | | | 159,154 | |
| | | | | | | | |
| | |
| | | | Belgium – 2.91% | | | | |
| | 660 | | | Anheuser-Busch InBev, SP ADR | | | 81,959 | |
| | 1,256 | | | Proximus (a) | | | 42,332 | |
| | | | | | | | |
| | | | | | | 124,291 | |
| | | | | | | | |
| | |
| | | | Bermuda – 0.69% | | | | |
| | 642 | | | Validus Holdings | | | 29,590 | |
| | | | | | | | |
| | |
| | | | Canada – 0.96% | | | | |
| | 901 | | | Enbridge Income Fund Holding | | | 20,818 | |
| | 327 | | | Royal Bank of Canada | | | 20,307 | |
| | | | | | | | |
| | | | | | | 41,125 | |
| | | | | | | | |
| | |
| | | | Finland – 0.94% | | | | |
| | 1,074 | | | Elisa (a) | | | 40,159 | |
| | | | | | | | |
| | |
| | | | France – 5.74% | | | | |
| | 2,600 | | | AXA (a) | | | 65,649 | |
| | 580 | | | Icade, REIT (a) | | | 45,631 | |
| | 1,426 | | | Scor SE (a) | | | 48,578 | |
| | 800 | | | Total (a) | | | 40,433 | |
| | 166 | | | Unibail-Rodamco, REIT (a) | | | 44,496 | |
| | | | | | | | |
| | | | | | | 244,787 | |
| | | | | | | | |
| | |
| | | | Germany – 5.07% | | | | |
| | 742 | | | BASF (a) | | | 61,386 | |
| | 186 | | | Bayer (a) | | | 21,495 | |
| | 2,500 | | | Deutsche Telekom (a) | | | 43,884 | |
| | | | | | | | |
Shares | | | | | Market
Value | |
| | |
| | | | Germany (continued) | | | | |
| | 260 | | | Muenchener Rueckversicherungs-Gesellschaft (a) | | $ | 48,336 | |
| | 809 | | | ProSiebenSat.1 Media (a) | | | 41,328 | |
| | | | | | | | |
| | | | | | | 216,429 | |
| | | | | | | | |
| | |
| | | | Ireland – 1.74% | | | | |
| | 186 | | | Accenture, Class A | | | 21,003 | |
| | 673 | | | Medtronic | | | 53,268 | |
| | | | | | | | |
| | | | | | | 74,271 | |
| | | | | | | | |
| | |
| | | | Israel – 2.04% | | | | |
| | 23,348 | | | Bezeq The Israeli Telecommunication (a) | | | 49,205 | |
| | 695 | | | Teva Pharmaceutical, SP ADR | | | 37,843 | |
| | | | | | | | |
| | | | | | | 87,048 | |
| | | | | | | | |
| | |
| | | | Netherlands – 1.65% | | | | |
| | 315 | | | LyondellBasell Industries, Class A | | | 26,041 | |
| | 1,003 | | | Unilever | | | 44,152 | |
| | | | | | | | |
| | | | | | | 70,193 | |
| | | | | | | | |
| | |
| | | | New Zealand – 1.11% | | | | |
| | 18,226 | | | Spark New Zealand (a) | | | 47,128 | |
| | | | | | | | |
| | |
| | | | Norway – 2.20% | | | | |
| | 5,331 | | | Statoil ASA, SP ADR | | | 93,772 | |
| | | | | | | | |
| | |
| | | | Singapore – 0.86% | | | | |
| | 252 | | | Broadcom | | | 36,729 | |
| | | | | | | | |
| | |
| | | | Spain – 2.10% | | | | |
| | 4,151 | | | Ferrovial (a) | | | 89,559 | |
| | | | | | | | |
| | |
| | | | Switzerland – 4.90% | | | | |
| | 1,000 | | | Nestle (a) | | | 74,640 | |
| | 178 | | | Novartis, SP ADR | | | 13,523 | |
| | 657 | | | Swiss Re (a) | | | 58,393 | |
| | 123 | | | Swisscom (a) | | | 62,506 | |
| | | | | | | | |
| | | | | | | 209,062 | |
| | | | | | | | |
| | |
| | | | United Kingdom – 13.40% | | | | |
| | 600 | | | AstraZeneca (a) | | | 34,424 | |
| | 5,491 | | | BAE Systems (a) | | | 38,309 | |
| | 735 | | | British American Tobacco, SP ADR | | | 89,780 | |
| | 5,927 | | | BT Group (a) | | | 38,419 | |
| | 418 | | | GlaxoSmithKline, SP ADR | | | 17,936 | |
| | 1,553 | | | Imperial Brands (a) | | | 84,442 | |
| | 5,976 | | | National Grid (a) | | | 85,269 | |
| | 3,570 | | | Royal Dutch Shell, Class A (a) | | | 93,510 | |
| | 4,047 | | | SSE (a) | | | 89,413 | |
| | | | | | | | |
| | | | | | | 571,502 | |
| | | | | | | | |
| | |
| | | | United States – 49.48% | | | | |
| | 742 | | | AbbVie | | | 45,262 | |
| | 148 | | | Air Products & Chemicals | | | 21,592 | |
| | 1,500 | | | Altria Group | | | 94,065 | |
| | 843 | | | Ameren | | | 40,464 | |
| | 190 | | | Amgen | | | 30,077 | |
See accompanying Notes to Financial Statements.
| | |
| |
| ASTON/Guardian Capital Global Dividend Fund | | April 30, 2016 |
| |
| Schedule of Investments (unaudited) – continued | | |
| | | | | | | | |
Shares | | | | | Market
Value | |
| | |
| | | | United States (continued) | | | | |
| | 989 | | | Apple | | $ | 92,709 | |
| | 2,087 | | | AT&T | | | 81,017 | |
| | 860 | | | Automatic Data Processing | | | 76,058 | |
| | 2,133 | | | Corrections Corp of America, REIT | | | 64,886 | |
| | 806 | | | Dow Chemical | | | 42,404 | |
| | 666 | | | Dr Pepper Snapple Group | | | 60,546 | |
| | 475 | | | Duke Energy | | | 37,420 | |
| | 1,444 | | | GEO Group, REIT | | | 46,251 | |
| | 934 | | | Illinois Tool Works | | | 97,622 | |
| | 405 | | | Ingredion | | | 46,611 | |
| | 550 | | | Intel | | | 16,654 | |
| | 899 | | | Johnson & Johnson | | | 100,760 | |
| | 714 | | | JPMorgan Chase | | | 45,125 | |
| | 200 | | | Kimberly-Clark | | | 25,038 | |
| | 185 | | | Lockheed Martin | | | 42,990 | |
| | 420 | | | McDonald’s | | | 53,126 | |
| | 562 | | | Merck | | | 30,820 | |
| | 794 | | | Microsoft | | | 39,597 | |
| | 857 | | | Paychex | | | 44,667 | |
| | 876 | | | Pfizer | | | 28,654 | |
| | 886 | | | Philip Morris International | | | 86,934 | |
| | 233 | | | Phillips 66 | | | 19,132 | |
| | 370 | | | Procter & Gamble | | | 29,644 | |
| | 328 | | | Raytheon | | | 41,443 | |
| | 765 | | | Republic Services | | | 36,009 | |
| | 1,797 | | | Reynolds American | | | 89,131 | |
| | 1,611 | | | Six Flags Entertainment | | | 96,741 | |
| | 1,434 | | | Starbucks | | | 80,634 | |
| | 905 | | | Texas Instruments | | | 51,621 | |
| | 298 | | | Valero Energy | | | 17,543 | |
| | 1,355 | | | Verizon Communications | | | 69,024 | |
| | 753 | | | Walt Disney | | | 77,755 | |
| | 644 | | | Waste Management | | | 37,861 | |
| | 1,458 | | | Wells Fargo | | | 72,871 | |
| | | | | | | | |
| | | | | | | 2,110,758 | |
| | | | | | | | |
| | |
| | | | Total Common Stocks
(Cost $3,959,219) | | | 4,245,557 | |
| | | | | | | | |
|
| | INVESTMENT COMPANY – 0.50% | |
| | |
| | 21,253 | | | BlackRock Liquidity Funds TempFund Portfolio | | | 21,253 | |
| | | | | | | | |
| | |
| | | | Total Investment Company
(Cost $21,253) | | | 21,253 | |
| | | | | | | | |
| Total Investments – 100.02%
(Cost $3,980,472)* | | | 4,266,810 | |
| | | | | | | | |
| Net Other Assets and Liabilities – (0.02)% | | | (1,035 | ) |
| | | | | | | | |
| Net Assets – 100.00% | | $ | 4,265,775 | |
| | | | | | | | |
| * | | At April 30, 2016, the aggregate cost for Federal income tax purposes approximates the aggregate cost for book purposes. The aggregate gross unrealized appreciation and depreciation were as follows: |
| (a) | | Securities with a total aggregate market value of $1,548,078, or 36.29% of net assets, were valued under securities valuation procedures established by the Funds’ Board of Trustees. |
| | | | |
Gross unrealized appreciation | | $ | 491,085 | |
Gross unrealized depreciation | | | (204,747 | ) |
| | | | |
Net unrealized appreciation | | $ | 286,338 | |
| | | | |
| REIT | | Real Estate Investment Trust |
| SP ADR | | Sponsored American Depositary Receipt |
See accompanying Notes to Financial Statements.
| | |
| |
| ASTON/LMCG Emerging Markets Fund | | April 30, 2016 |
| |
| Schedule of Investments (unaudited) | | |

The chart represents total investments in the Fund. Net Other Assets and Liabilities is negative 44.88% and cannot be represented in the pie chart format.
| | | | | | | | |
Shares | | Market
Value | |
|
| | COMMON STOCKS – 136.20% | |
| | |
| | | | Bermuda – 0.60% | | | | |
| | 66,000 | | | GOME Electrical Appliances Holding (a) | | $ | 8,465 | |
| | | | | | | | |
| | |
| | | | Brazil – 12.88% | | | | |
| | 3,700 | | | Ambev SA | | | 20,656 | |
| | 2,000 | | | BB Seguridade Participacoes SA | | | 17,399 | |
| | 1,000 | | | BRF SA | | | 14,227 | |
| | 2,100 | | | Embraer SA | | | 12,194 | |
| | 1,300 | | | Fibria Celulose SA | | | 11,453 | |
| | 10,500 | | | Gerdau SA, Preference | | | 23,966 | |
| | 3,180 | | | Itau Unibanco Holding | | | 30,420 | |
| | 6,200 | | | JBS SA | | | 16,351 | |
| | 4,200 | | | Kroton Educacional SA | | | 15,656 | |
| | 6,400 | | | Petroleo Brasileiro SA, Preference * | | | 18,999 | |
| | | | | | | | |
| | | | 181,321 | |
| | | | | | | | |
| | |
| | | | Cayman Islands – 4.85% | | | | |
| | 121 | | | Alibaba Group Holding, SP ADR * | | | 9,310 | |
| | 4,000 | | | China Resources Land (a) | | | 9,827 | |
| | 17,000 | | | Evergrande Real Estate, Class H (a) | | | 12,562 | |
| | 58,000 | | | GCL Poly Energy Holdings (a) | | | 8,643 | |
| | 6,000 | | | Shimao Property Holdings (a) | | | 8,281 | |
| | 16,000 | | | Sino Biopharmaceutical (a) | | | 11,338 | |
| | 4,000 | | | Zhen Ding Technology Holding (a) | | | 8,383 | |
| | | | | | | | |
| | | | 68,344 | |
| | | | | | | | |
| | |
| | | | China – 19.29% | | | | |
| | 18,000 | | | Air China, Class H (a) | | | 13,627 | |
| | 27,000 | | | Bank of Communications, Class H (a) | | | 17,017 | |
| | 31,000 | | | China CITIC Bank, Class H (a) * | | | 19,442 | |
| | 33,000 | | | China Construction Bank, Class H (a) | | | 20,959 | |
| | 20,000 | | | China Everbright Bank, Class H (a) | | | 9,069 | |
| | 15,000 | | | China Minsheng Banking, Class H (a) | | | 14,089 | |
| | | | | | | | |
Shares | | Market
Value | |
| | |
| | | | China (continued) | | | | |
| | 27,000 | | | Chongqing Rural Commerical Bank, Class H (a) | | $ | 14,191 | |
| | 12,000 | | | Guangzhou Automobile Group, Class H (a) | | | 13,945 | |
| | 8,800 | | | Guangzhou R&F Properties, Class H (a) | | | 12,272 | |
| | 41,000 | | | Industrial and Commercial Bank of China, Class H (a) | | | 21,951 | |
| | 8,000 | | | Jiangxi Copper, Class H (a) | | | 9,767 | |
| | 25,000 | | | People’s Insurance, Group of China, Class H (a) | | | 10,054 | |
| | 8,000 | | | PICC Property & Casualty, Class H (a) | | | 14,553 | |
| | 5,400 | | | Shanghai Pharmaceuticals Holding, Class H (a) | | | 11,446 | |
| | 3,400 | | | Tencent Holdings (a) | | | 69,184 | |
| | | | | | | | |
| | | | 271,566 | |
| | | | | | | | |
| | |
| | | | Egypt – 0.64% | | | | |
| | 2,410 | | | Commerical International Bank SAE, GDR (a) | | | 9,001 | |
| | | | | | | | |
| | |
| | | | Hong Kong – 8.10% | | | | |
| | 4,000 | | | China Everbright (a) | | | 7,896 | |
| | 3,000 | | | China Mobile (a) | | | 34,442 | |
| | 6,000 | | | China Overseas Land & Investment (a) | | | 19,046 | |
| | 4,000 | | | China Resources Power Holdings (a) | | | 6,737 | |
| | 4,200 | | | China Taiping Insurance Holdings (a) * | | | 8,559 | |
| | 12,000 | | | CITIC (a) | | | 17,500 | |
| | 40,000 | | | Geely Automobile Holdings (a) | | | 19,884 | |
| | | | | | | | |
| | | | 114,064 | |
| | | | | | | | |
| | |
| | | | Hungary – 1.88% | | | | |
| | 606 | | | OTP Bank PLC (a) | | | 16,057 | |
| | 524 | | | Richter Gedeon (a) | | | 10,410 | |
| | | | | | | | |
| | | | 26,467 | |
| | | | | | | | |
| | |
| | | | India – 6.00% | | | | |
| | 210 | | | Dr. Reddy’s Laboratories, ADR | | | 9,576 | |
| | 1,665 | | | Infosys, SP ADR | | | 31,302 | |
| | 811 | | | Reliance Industries, GDR (b) | | | 24,006 | |
| | 1,610 | | | Wipro, ADR | | | 19,561 | |
| | | | | | | | |
| | | | 84,445 | |
| | | | | | | | |
| | |
| | | | Indonesia – 0.92% | | | | |
| | 16,600 | | | Bank Rakyat Indonesia Persero Tbk PT (a) | | | 12,973 | |
| | | | | | | | |
| | |
| | | | Malaysia – 2.33% | | | | |
| | 9,600 | | | IHH Healthcare | | | 16,096 | |
| | 3,500 | | | Public Bank (a) | | | 16,742 | |
| | | | | | | | |
| | | | 32,838 | |
| | | | | | | | |
| | |
| | | | Mexico – 7.00% | | | | |
| | 29,110 | | | America Movil, Series L | | | 20,608 | |
| | 2,971 | | | Arca Continental | | | 20,494 | |
| | 711 | | | Gruma, Class B | | | 10,364 | |
| | 1,326 | | | Grupo Aeroportuario del Pacifico | | | 12,520 | |
| | 2,919 | | | Grupo Financiero Banorte | | | 16,596 | |
| | 7,296 | | | Wal-Mart de Mexico SAB, Class O | | | 18,031 | |
| | | | | | | | |
| | | | 98,613 | |
| | | | | | | | |
See accompanying Notes to Financial Statements.
| | |
| |
| ASTON/LMCG Emerging Markets Fund | | April 30, 2016 |
| |
| Schedule of Investments (unaudited) – continued | | |
| | | | | | | | |
Shares | | Market
Value | |
| | |
| | | | Poland – 3.00% | | | | |
| | 670 | | | KGHM Polska Miedz, SA (a) | | $ | 13,062 | |
| | 940 | | | Polski Koncern Naftowy Orlen SA (a) | | | 16,953 | |
| | 1,350 | | | Powszechny Zaklad Ubezpieczen SA (a) | | | 12,219 | |
| | | | | | | | |
| | | | 42,234 | |
| | | | | | | | |
| | |
| | | | Russia – 5.47% | | | | |
| | 1,015 | | | Gazprom, SP ADR | | | 5,268 | |
| | 5,685 | | | Gazprom, SP ADR (a) | | | 29,539 | |
| | 326 | | | Lukoil, SP ADR | | | 13,855 | |
| | 53 | | | Lukoil, SP ADR (a) | | | 2,258 | |
| | 569 | | | MMC Norilsk Nickel OJSC, ADR (a) | | | 8,408 | |
| | 563 | | | Tatneft, SP ADR | | | 17,647 | |
| | | | | | | | |
| | | | 76,975 | |
| | | | | | | | |
| | |
| | | | South Africa – 6.98% | | | | |
| | 568 | | | Bidvest Group (a) | | | 14,431 | |
| | 1,223 | | | Discovery (a) | | | 10,946 | |
| | 1,131 | | | Foschini Group (a) | | | 12,150 | |
| | 7,651 | | | Netcare (a) | | | 19,509 | |
| | 2,664 | | | Sappi (a) * | | | 11,554 | |
| | 1,904 | | | Truworths International (a) | | | 14,218 | |
| | 1,330 | | | Vodacom Group (a) | | | 15,464 | |
| | | | | | | | |
| | | | 98,272 | |
| | | | | | | | |
| | |
| | | | South Korea – 28.14% | | | | |
| | 52 | | | CJ CheilJedang (a) | | | 17,273 | |
| | 209 | | | Dongbu Insurance (a) | | | 12,811 | |
| | 85 | | | E-Mart (a) | | | 13,653 | |
| | 473 | | | GS Engineering & Construction (a) * | | | 12,762 | |
| | 379 | | | Hite Jinro (a) | | | 9,285 | |
| | 185 | | | Hyosung (a) | | | 19,793 | |
| | 1,596 | | | Industrial Bank of Korea (a) | | | 16,965 | |
| | 339 | | | Kangwon Land | | | 12,689 | |
| | 175 | | | Kia Motors (a) | | | 7,340 | |
| | 388 | | | Korea Electric Power (a) | | | 21,076 | |
| | 635 | | | LG Display (a) | | | 13,218 | |
| | 455 | | | LG International (a) | | | 15,062 | |
| | 1,136 | | | LG Uplus (a) | | | 11,144 | |
| | 69 | | | Lotte Chemical (a) | | | 17,600 | |
| | 43 | | | Lotte Shopping (a) | | | 10,238 | |
| | 97 | | | POSCO (a) | | | 20,323 | |
| | 78 | | | Samsung Electronics (a) | | | 85,007 | |
| | 481 | | | Shinhan Financial Group (a) | | | 17,636 | �� |
| | 761 | | | SK Hynix (a) | | | 18,666 | |
| | 158 | | | SK Innovation (a) | | | 21,339 | |
| | 1,436 | | | Woori Bank (a) | | | 13,194 | |
| | 36 | | | Yuhan (a) | | | 9,195 | |
| | | | | | | | |
| | | | 396,269 | |
| | | | | | | | |
| | |
| | | | Taiwan – 17.02% | | | | |
| | 15,000 | | | Advanced Semiconductor Engineering (a) | | | 14,433 | |
| | 7,000 | | | Cheng Uei Precision Industry (a) | | | 8,982 | |
| | 5,000 | | | Chunghwa Telecom (a) | | | 16,881 | |
| | 19,000 | | | Compal Electronics (a) | | | 11,153 | |
| | 15,120 | | | Hon Hai Precision Industry (a) | | | 36,017 | |
| | 18,000 | | | King Yuan Electronics (a) | | | 15,843 | |
| | | | | | | | |
Shares | | Market
Value | |
| | |
| | | | Taiwan (continued) | | | | |
| | 4,000 | | | Pegatron (a) | | $ | 8,427 | |
| | 9,000 | | | Pou Chen (a) | | | 11,314 | |
| | 6,000 | | | Powertech Technology (a) | | | 12,109 | |
| | 15,000 | | | Taiwan Semiconductor Manufacturing (a) | | | 68,916 | |
| | 14,543 | | | Uni-President Enterprises (a) | | | 26,180 | |
| | 16,000 | | | Wistron (a) | | | 9,445 | |
| | | | | | | | |
| | | | 239,700 | |
| | | | | | | | |
| | |
| | | | Thailand – 1.52% | | | | |
| | 950 | | | Siam Cement (a) | | | 13,307 | |
| | 125,300 | | | TMB Bank, NVDR (a) | | | 8,156 | |
| | | | | | | | |
| | | | 21,463 | |
| | | | | | | | |
| | |
| | | | Turkey – 8.68% | | | | |
| | 1,723 | | | Arcelik (a) | | | 11,568 | |
| | 12,522 | | | Eregli Demir ve Celik Fabrikalari TAS (a) | | | 20,888 | |
| | 5,692 | | | Haci Omer Sabanci Holding AS (a) | | | 20,535 | |
| | 3,079 | | | KOC Holding AS (a) | | | 16,088 | |
| | 2,051 | | | Koza Altin Isletmeleri AS (a) * | | | 13,427 | |
| | 5,225 | | | Turk Hava Yollari (a) * | | | 12,876 | |
| | 7,694 | | | Turkiye Vakiflar Bankasi Tao, Class D (a) | | | 13,579 | |
| | 5,136 | | | Vestel Elektronik Sanayi ve Ticaret AS (a) * | | | 13,281 | |
| | | | | | | | |
| | | | 122,242 | |
| | | | | | | | |
| | |
| | | | United Kingdom – 0.90% | | | | |
| | 955 | | | Mediclinic International (a) | | | 12,636 | |
| | | | | | | | |
| | |
| | | | Total Common Stocks
(Cost $2,006,169) | | | 1,917,888 | |
| | | | | | | | |
| |
| | EXCHANGE TRADED FUNDS – 6.31% | | | | |
| | |
| | | | United States – 6.31% | | | | |
| | 1,897 | | | iShares MSCI Emerging Markets Index Fund | | | 65,238 | |
| | 874 | | | iShares MSCI India | | | 23,650 | |
| | | | | | | | |
| | | | 88,888 | |
| | | | | | | | |
| | |
| | | | Total Exchange Traded Funds
(Cost $93,526) | | | 88,888 | |
| | | | | | | | |
| |
| | INVESTMENT COMPANY – 2.37% | | | | |
| | |
| | 33,388 | | | BlackRock Liquidity Funds TempFund Portfolio | | | 33,388 | |
| | | | | | | | |
| | |
| | | | Total Investment Company
(Cost $33,388) | | | 33,388 | |
| | | | | | | | |
| Total Investments – 144.88%
(Cost $2,133,083)** | | | 2,040,164 | |
| | | | | | | | |
| Net Other Assets and Liabilities – (44.88)% | | | (631,953 | ) |
| | | | | | | | |
| Net Assets – 100.00% | | $ | 1,408,211 | |
| | | | | | | | |
See accompanying Notes to Financial Statements.
| | |
| |
| ASTON/LMCG Emerging Markets Fund | | April 30, 2016 |
| |
| Schedule of Investments (unaudited) – continued | | |
| * | | Non-income producing security. |
| ** | | At April 30, 2016, the aggregate cost for Federal income tax purposes approximates the aggregate cost for book purposes. The aggregate gross unrealized appreciation and depreciation were as follows: |
| | | | |
Gross unrealized appreciation | | $ | 175,332 | |
Gross unrealized depreciation | | | (268,251 | ) |
| | | | |
Net unrealized depreciation | | $ | (92,919 | ) |
| | | | |
| (a) | | Securities with a total aggregate market value of $1,478,644, or 105.00% of net assets, were valued under securities valuation procedures established by the Funds’ Board of Trustees. |
| (b) | | Security exempt from registration under Rule 144A of the Securities Act of 1933, as amended. This security is purchased in accordance with guidelines approved by the Fund’s Board of Trustees and may only be resold, in transactions exempt from registration, to qualified institutional buyers. At April 30, 2016, this security amounted to $24,006 or 1.70% of net assets. This security has not been determined by the Subadviser to be an illiquid security. |
| ADR | | American Depositary Receipt |
| GDR | | Global Depositary Receipt |
| MSCI | | Morgan Stanley Capital International |
| NVDR | | Non-Voting Depositary Receipt |
| SP ADR | | Sponsored American Depositary Receipt |
See accompanying Notes to Financial Statements.
| | |
| |
| ASTON/Pictet International Fund | | April 30, 2016 |
| |
| Schedule of Investments (unaudited) | | |
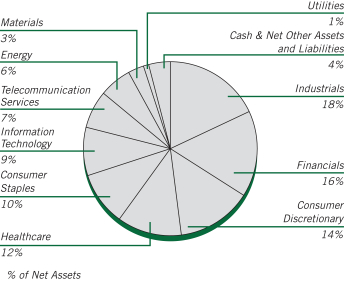
| | | | | | | | |
Shares | | | | | Market
Value | |
| |
| | COMMON STOCKS – 96.28% | | | | |
| | |
| | | | Australia – 4.21% | | | | |
| | 435,318 | | | Ansell (a) | | $ | 6,570,379 | |
| | 2,035,331 | | | Computershare (a) | | | 15,580,277 | |
| | 1,433,310 | | | Estia Health (a) | | | 6,269,517 | |
| | 3,600,962 | | | Primary Health Care (a) | | | 9,454,512 | |
| | | | | | | | |
| | | | | | | 37,874,685 | |
| | | | | | | | |
| | |
| | | | Austria – 1.12% | | | | |
| | 349,823 | | | Erste Bank Group (a) * | | | 10,070,131 | |
| | | | | | | | |
| | |
| | | | Belgium – 3.75% | | | | |
| | 197,328 | | | Ageas (a) | | | 7,754,390 | |
| | 138,657 | | | Anheuser-Busch InBev (a) | | | 17,201,027 | |
| | 287,024 | | | Ontex Group (a) | | | 8,804,300 | |
| | | | | | | | |
| | | | | | | 33,759,717 | |
| | | | | | | | |
| | |
| | | | Bermuda – 1.13% | | | | |
| | 183,998 | | | Jardine Matheson Holdings (a) | | | 10,147,886 | |
| | | | | | | | |
| | |
| | | | Cayman Islands – 4.07% | | | | |
| | 2,003,248 | | | Cheung Kong Property Holding (a) | | | 13,681,164 | |
| | 1,274,748 | | | CK Hutchison Holdings (a) | | | 15,250,604 | |
| | 5,515,200 | | | MGM China Holdings (a) | | | 7,727,160 | |
| | | | | | | | |
| | | | | | | 36,658,928 | |
| | | | | | | | |
| | |
| | | | Denmark – 0.65% | | | | |
| | 306,563 | | | Matas (a) | | | 5,848,549 | |
| | | | | | | | |
| | |
| | | | Finland – 2.28% | | | | |
| | 3,473,314 | | | Nokia (a) | | | 20,504,798 | |
| | | | | | | | |
| | | | | | | | |
Shares | | | | | Market
Value | |
| | |
| | | | France – 9.40% | | | | |
| | 4,130,035 | | | Bollore (a) | | $ | 16,355,821 | |
| | 732 | | | Bollore - New (a) * | | | 2,850 | |
| | 464,248 | | | Elis (a) | | | 8,524,042 | |
| | 237,053 | | | Orpea (a) | | | 19,556,753 | |
| | 134,896 | | | Rubis (a) | | | 10,538,009 | |
| | 262,482 | | | Vinci (a) | | | 19,604,435 | |
| | 523,865 | | | Vivendi (a) | | | 10,063,662 | |
| | | | | | | | |
| | | | | | | 84,645,572 | |
| | | | | | | | |
| | |
| | | | Germany – 1.53% | | | | |
| | 89,959 | | | Linde AG (a) | | | 13,763,973 | |
| | | | | | | | |
| | |
| | | | Hong Kong – 1.19% | | | | |
| | 15,800,355 | | | PCCW (a) | | | 10,694,998 | |
| | | | | | | | |
| | |
| | | | Italy – 2.18% | | | | |
| | 713,063 | | | Cerved Information Solutions (a) | | | 5,748,470 | |
| | 1,093,105 | | | Finmeccanica (a) * | | | 13,857,284 | |
| | | | | | | | |
| | | | | | | 19,605,754 | |
| | | | | | | | |
| | |
| | | | Japan – 20.37% | | | | |
| | 162,400 | | | ABC-Mart (a) | | | 10,538,503 | |
| | 508,300 | | | Bandai Namco Holdings | | | 10,821,350 | |
| | 165,300 | | | CyberAgent (a) | | | 7,749,362 | |
| | 64,400 | | | FANUC (a) | | | 9,513,300 | |
| | 560,400 | | | Fujitec (a) | | | 5,541,308 | |
| | 1,248,900 | | | Inpex (a) | | | 9,928,565 | |
| | 423,100 | | | Japan Tobacco (a) | | | 17,286,994 | |
| | 428,100 | | | LIXIL Group (a) | | | 8,963,640 | |
| | 176,700 | | | Miraca Holdings (a) | | | 7,509,244 | |
| | 344,600 | | | NGK Spark Plug(a) | | | 6,872,486 | |
| | 1,399,800 | | | Rakuten(a) | | | 15,217,737 | |
| | 836,700 | | | SKY Perfect JSAT Holdings (a) | | | 4,454,028 | |
| | 430,600 | | | SoftBank Group (a) | | | 23,153,578 | |
| | 712,400 | | | Sompo Japan Nipponkoa Holdings (a) | | | 18,704,797 | |
| | 675,400 | | | Sony (a) | | | 16,359,284 | |
| | 358,200 | | | Sumitomo Mitsui Financial Group | | | 10,778,854 | |
| | | | | | | | |
| | | | | | | 183,393,030 | |
| | | | | | | | |
| | |
| | | | Luxembourg – 1.54% | | | | |
| | 239,643 | | | Millicom International Cellular, SDR (a) | | | 13,875,210 | |
| | | | | | | | |
| | |
| | | | Netherlands – 7.26% | | | | |
| | 221,702 | | | ASML Holding (a) | | | 21,428,879 | |
| | 205,595 | | | Konnikluke DSM (a) | | | 12,618,773 | |
| | 1,193,033 | | | Royal Dutch Shell, Class B (a) | | | 31,323,034 | |
| | | | | | | | |
| | | | | | | 65,370,686 | |
| | | | | | | | |
| | |
| | | | New Zealand – 0.65% | | | | |
| | 1,840,972 | | | Trade Me Group (a) | | | 5,854,826 | |
| | | | | | | | |
| | |
| | | | Papua New Guinea – 0.64% | | | | |
| | 1,093,849 | | | Oil Search | | | 5,799,309 | |
| | | | | | | | |
| | |
| | | | Philippines – 0.12% | | | | |
| | 9,052,382 | | | Metro Pacific Investments (a) | | | 1,119,920 | |
| | | | | | | | |
See accompanying Notes to Financial Statements.
| | |
| |
| ASTON/Pictet International Fund | | April 30, 2016 |
| |
| Schedule of Investments (unaudited) – continued | | |
| | | | | | | | |
Shares | | | | | Market
Value | |
| | |
| | | | South Korea – 1.92% | | | | |
| | 12,696 | | | NAVER (a) | | $ | 7,524,250 | |
| | 8,944 | | | Samsung Electronics | | | 9,747,454 | |
| | | | | | | | |
| | | | | | | 17,271,704 | |
| | | | | | | | |
| | |
| | | | Spain – 6.76% | | | | |
| | 2,658,652 | | | Banco Bilbao Vizcaya Argentaria (a) | | | 18,269,830 | |
| | 2,498,007 | | | Distribuidora Internacional de Alimentacion (a) | | | 13,899,888 | |
| | 526,691 | | | Grifols, ADR (a) | | | 8,279,582 | |
| | 852,850 | | | Merlin Properties Socimi, REIT (a) | | | 9,926,932 | |
| | 1,481,081 | | | Obrascon Huarte Lain (a) | | | 10,526,002 | |
| | | | | | | | |
| | | | | | | 60,902,234 | |
| | | | | | | | |
| | |
| | | | Sweden – 2.11% | | | | |
| | 601,900 | | | Alfa Laval (a) | | | 9,496,850 | |
| | 1,071,977 | | | Com Hem Holding | | | 9,514,789 | |
| | | | | | | | |
| | | | | | | 19,011,639 | |
| | | | | | | | |
| | |
| | | | Switzerland – 6.04% | | | | |
| | 136,803 | | | Cie Financiere Richemont (a) | | | 9,122,061 | |
| | 131,006 | | | Gategroup Holding (a) | | | 7,224,795 | |
| | 317,234 | | | Nestle | | | 23,678,247 | |
| | 831,244 | | | UBS Group (a) | | | 14,409,997 | |
| | | | | | | | |
| | | | | | | 54,435,100 | |
| | | | | | | | |
| | |
| | | | United Kingdom – 17.36% | | | | |
| | 176,702 | | | AstraZeneca (a) | | | 10,137,887 | |
| | 7,961,126 | | | BBA Aviation (a) | | | 23,311,620 | |
| | 1,691,496 | | | Enterprise Inns (a) * | | | 2,144,059 | |
| | 1,272,837 | | | GlaxoSmithKline | | | 27,203,751 | |
| | 1,235,215 | | | Inmarsat (a) | | | 16,806,461 | |
| | 254,657 | | | LivaNova (a) * | | | 13,584,647 | |
| | 795,736 | | | Petrofac (a) | | | 9,858,799 | |
| | 893,408 | | | Prudential (a) | | | 17,635,521 | |
| | 21,501 | | | Royal Dutch Shell, Class A(a) | | | 563,182 | |
| | 1,708,658 | | | Saga (a) | | | 5,232,904 | |
| | 1,495,968 | | | Standard Chartered (a) | | | 12,091,364 | |
| | 574,337 | | | Tate & Lyle (a) | | | 4,944,791 | |
| | 2,789,747 | | | William Hill (a) | | | 12,772,389 | |
| | | | | | | | |
| | | | 156,287,375 | |
| | | | | | | | |
| | |
| | | | Total Common Stocks
(Cost $817,725,462) | | | 866,896,024 | |
| | | | | | | | |
| |
| | INVESTMENT COMPANY – 3.22% | | | | |
| | |
| | 28,935,213 | | | BlackRock Liquidity Funds TempFund Portfolio | | | 28,935,213 | |
| | | | | | | | |
| | |
| | | | Total Investment Company
(Cost $28,935,213) | | | 28,935,213 | |
| | | | | | | | |
| Total Investments – 99.50%
(Cost $846,660,675)** | | | 895,831,237 | |
| | | | | | | | |
| Net Other Assets and Liabilities – 0.50% | | | 4,535,252 | |
| | | | | | | | |
| Net Assets – 100.00% | | $ | 900,366,489 | |
| | | | | | | | |
| * | | Non-income producing security. |
| ** | | At April 30, 2016, the aggregate cost for Federal income tax purposes approximates the aggregate cost for book purposes. The aggregate gross unrealized appreciation and depreciation were as follows: |
| | | | |
Gross unrealized appreciation | | $ | 64,472,269 | |
Gross unrealized depreciation | | | (15,301,707 | ) |
| | | | |
Net unrealized appreciation | | $ | 49,170,562 | |
| | | | |
| (a) | | Securities with a total aggregate market value of $769,352,270, or 85.45% of net assets, were valued under securities valuation procedures established by the Funds’ Board of Trustees. |
| ADR | | American Depositary Receipt |
| REIT | | Real Estate Investment Trust |
| SDR | | Sponsored Depositary Receipt |
See accompanying Notes to Financial Statements.
| | |
| |
| ASTON/Value Partners Asia Dividend Fund | | April 30, 2016 |
| |
| Schedule of Investments (unaudited) | | |
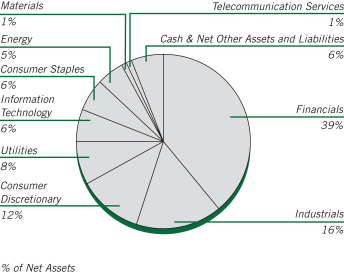
| | | | | | | | |
Shares | | | | | Market
Value | |
|
| | COMMON STOCKS – 84.72% | |
| | |
| | | | China – 30.30% | | | | |
| | 337,000 | | | Bank of China, Class H (a) | | $ | 136,449 | |
| | 121,000 | | | Belle International Holdings (a) | | | 73,793 | |
| | 443,000 | | | China Construction Bank, Class H (a) | | | 281,361 | |
| | 96,000 | | | China Life Insurance, Class H (a) | | | 221,141 | |
| | 133,000 | | | China Lilang (a) | | | 85,025 | |
| | 95,000 | | | China Machinery Engineering, Class H (a) | | | 64,543 | |
| | 70,000 | | | China Resources Power Holdings (a) | | | 117,897 | |
| | 96,000 | | | China Zhongwang Holdings (a) | | | 47,805 | |
| | 57,863 | | | Chongqing Changan Automobile,
Class B (a) | | | 100,056 | |
| | 340,000 | | | CIFI Holdings Group (a) | | | 78,679 | |
| | 12,800 | | | Dalian Wanda Commercial Properties,
Class H (a) | | | 83,797 | |
| | 78,000 | | | Goldpac Group (a) | | | 31,389 | |
| | 15,000 | | | Haitian International Holdings (a) | | | 25,592 | |
| | 118,000 | | | Huaneng Power International, Class H (a) | | | 84,165 | |
| | 3,200 | | | Huatai Securities, Class H * (a) | | | 6,750 | |
| | 690,000 | | | Jiangnan Group (a) | | | 116,236 | |
| | 165,500 | | | Longfor Properties (a) | | | 232,183 | |
| | 256,000 | | | PetroChina, Class H (a) | | | 187,297 | |
| | 197,500 | | | Sinopec Engineering Group, Class H (a) | | | 183,187 | |
| | 72,000 | | | Yangtze Optical Fibre and Cable Joint Stock, Class H (a) | | | 88,538 | |
| | 60,000 | | | Zhejiang Expressway, Class H (a) | | | 61,224 | |
| | | | | | | | |
| | | | 2,307,107 | |
| | | | | | | | |
| | |
| | | | Hong Kong – 26.14% | | | | |
| | 40,000 | | | BOC Hong Kong Holdings (a) | | | 119,476 | |
| | 6,500 | | | Cheung Kong Property Holdings (a) | | | 44,392 | |
| | 146,000 | | | China High Speed Transmission Equipment Group * (a) | | | 113,148 | |
| | 84,000 | | | China Overseas Land & Investment (a) | | | 266,638 | |
| | 302,000 | | | China Power International Development (a) | | | 128,899 | |
| | | | | | | | |
Shares | | | | | Market
Value | |
| | |
| | | | Hong Kong (continued) | | | | |
| | 126,000 | | | China State Construction International Holdings (a) | | $ | 196,271 | |
| | 32,000 | | | Chow Sang Sang Holdings International (a) | | | 51,891 | |
| | 11,000 | | | CK Hutchison Holdings (a) | | | 131,600 | |
| | 90,000 | | | Convenience Retail Asia (a) | | | 39,512 | |
| | 1,170,000 | | | CSI Properties (a) | | | 35,538 | |
| | 188,000 | | | EGL Holdings (a) | | | 53,967 | |
| | 191,000 | | | Far East Consortium International (a) | | | 63,640 | |
| | 188,000 | | | Far East Horizon (a) | | | 149,230 | |
| | 159,000 | | | FSE Engineering Holdings (a) | | | 44,780 | |
| | 84,000 | | | Lee & Man Chemical | | | 27,398 | |
| | 312,000 | | | Oi Wah Pawnshop Credit Holdings (a) | | | 18,240 | |
| | 150,000 | | | Pico Far East Holdings | | | 40,996 | |
| | 24,447 | | | Sino Land (a) | | | 38,381 | |
| | 112,000 | | | SITC International Holdings (a) | | | 60,533 | |
| | 196,000 | | | Skyworth Digital Holdings (a) | | | 127,559 | |
| | 22,500 | | | SmarTone Telecommunications Holdings (a) | | | 37,195 | |
| | 6,000 | | | Sun Hung Kai Properties (a) | | | 75,619 | |
| | 166,000 | | | TK Group Holdings (a) | | | 45,027 | |
| | 40,000 | | | Wasion Group Holdings (a) | | | 22,184 | |
| | 242,000 | | | Wonderful Sky Financial Group Holdings (a) | | | 58,437 | |
| | | | | | | | |
| | | | 1,990,551 | |
| | | | | | | | |
| | |
| | | | Indonesia – 2.00% | | | | |
| | 111,200 | | | Bank Mandiri Persero (a) | | | 80,834 | |
| | 232,300 | | | Bank Pan Indonesia * (a) | | | 13,795 | |
| | 293,000 | | | Perusahaan Gas Negara Persero (a) | | | 57,899 | |
| | | | | | | | |
| | | | 152,528 | |
| | | | | | | | |
| | |
| | | | Japan – 0.52% | | | | |
| | 1,100 | | | Japan Airlines (a) | | | 39,594 | |
| | | | | | | | |
| | |
| | | | Singapore – 9.46% | | | | |
| | 83,600 | | | AIMS AMP Capital Industrial, REIT | | | 86,717 | |
| | 166,500 | | | Asian Pay Television (a) | | | 74,165 | |
| | 31,500 | | | CapitaLand Commercial Trust, REIT (a) | | | 33,419 | |
| | 33,000 | | | CapitaLand Retail China Trust, REIT (a) | | | 36,161 | |
| | 138,438 | | | Croesus Retail Trust (a) | | | 85,933 | |
| | 11,600 | | | DBS Group Holdings (a) | | | 131,208 | |
| | 83,200 | | | Ezion Holdings (a) | | | 33,837 | |
| | 90,700 | | | Frasers Commercial, REIT (a) | | | 87,235 | |
| | 259,300 | | | IPS Securex Holdings (a) | | | 37,288 | |
| | 40,400 | | | Mapletree Greater China Commercial Trust, REIT (a) | | | 30,886 | |
| | 30,200 | | | Mapletree Logistics Trust, REIT (a) | | | 24,211 | |
| | 80,700 | | | Yangzijiang Shipbuilding Holdings (a) | | | 59,163 | |
| | | | | | | | |
| | | | 720,223 | |
| | | | | | | | |
| | |
| | | | South Korea – 9.85% | | | | |
| | 380 | | | BGF Rretail (a) | | | 61,823 | |
| | 2,523 | | | Dongbu Insurance (a) | | | 154,649 | |
| | 2,594 | | | GS Retail (a) | | | 121,371 | |
| | 2,543 | | | Haitai Confectionery & Foods (a) | | | 33,701 | |
See accompanying Notes to Financial Statements.
| | |
| |
| ASTON/Value Partners Asia Dividend Fund | | April 30, 2016 |
| |
| Schedule of Investments (unaudited) – continued | | |
| | | | | | | | |
Shares | | | | | Market
Value | |
| | |
| | | | South Korea (continued) | | | | |
| | 3,610 | | | Korea Electric Power (a) | | $ | 196,091 | |
| | 546 | | | Maeil Dairy Industry (a) | | | 22,216 | |
| | 392 | | | Nong Woo Bio (a) | | | 8,040 | |
| | 4,647 | | | SK Hynix (a) | | | 113,981 | |
| | 282 | | | SK Innovation (a) | | | 38,086 | |
| | | | | | | | |
| | | | 749,958 | |
| | | | | | | | |
| | |
| | | | Taiwan – 2.63% | | | | |
| | 2,000 | | | Largan Precision (a) | | | 139,608 | |
| | 67,000 | | | Mega Financial Holding (a) | | | 47,482 | |
| | 27,000 | | | Mercuries Life insurance (a) | | | 12,985 | |
| | | | | | | | |
| | | | 200,075 | |
| | | | | | | | |
| | |
| | | | Thailand – 2.42% | | | | |
| | 58,400 | | | AP Thailand (a) | | | 10,013 | |
| | 84,300 | | | Bangchak Petroleum (a) | | | 74,680 | |
| | 10,700 | | | Hana Microelectronics (a) | | | 10,166 | |
| | 101,100 | | | Jasmine Broadband Internet Infrastructure, Class F (a) | | | 27,180 | |
| | 25,000 | | | Namyong Terminal (a) | | | 9,801 | |
| | 29,500 | | | SPCG (a) | | | 17,627 | |
| | 59,700 | | | Supalai (a) | | | 34,992 | |
| | | | | | | | |
| | | | 184,459 | |
| | | | | | | | |
| | |
| | | | United Kingdom – 1.40% | | | | |
| | 16,000 | | | HSBC Holdings (a) | | | 106,505 | |
| | | | | | | | |
| | |
| | | | Total Common Stocks
(Cost $6,501,289) | | | 6,451,000 | |
| | | | | | | | |
|
| | PREFERRED STOCK – 4.95% | |
| | |
| | | | South Korea – 4.95% | | | | |
| | 606 | | | AMOREPACIFIC * (a) | | | 120,453 | |
| | 217 | | | CJ CheilJedang (a) | | | 39,892 | |
| | 1,974 | | | LG (a) | | | 81,241 | |
| | 20 | | | Samsung Electronics (a) | | | 18,266 | |
| | 715 | | | Samsung Fire & Marine Insurance (a) | | | 117,417 | |
| | | | | | | | |
| | | | 377,269 | |
| | | | | | | | |
| | |
| | | | Total Preferred Stock
(Cost $367,935) | | | 377,269 | |
| | | | | | | | |
|
| | WARRANTS – 3.81% | |
| | |
| | | | China – 3.71% | | | | |
| | 21,700 | | | Midea Group, Expiring 09/23/23 * | | | 107,158 | |
| | 61,100 | | | Gree Electric Appliance, Expiring 12/02/16 * (a)(b) | | | 181,100 | |
| | | | | | | | |
| | | | 288,258 | |
| | | | | | | | |
| | | | | | | | |
Shares | | | | | Market
Value | |
| | |
| | | | Singapore – 0.02% | | | | |
| | 16,640 | | | Ezion Holdings, Expiring 04/24/20 * | | $ | 1,980 | |
| | | | | | | | |
| | | | 1,980 | |
| | | | | | | | |
| | |
| | | | Total Warrants
(Cost $285,280) | | | 290,238 | |
| | | | | | | | |
| Total Investments – 93.48%
(Cost $7,154,504)** | | | 7,118,507 | |
| | | | | | | | |
| Net Other Assets and Liabilities – 6.52% | | | 496,223 | |
| | | | | | | | |
| Net Assets – 100.00% | | $ | 7,614,730 | |
| | | | | | | | |
| * | | Non-income producing security. |
| ** | | At April 30, 2016, the aggregate cost for Federal income tax purposes approximates the aggregate cost for book purposes. The aggregate gross unrealized appreciation and depreciation were as follows: |
| | | | |
Gross unrealized appreciation | | $ | 284,909 | |
Gross unrealized depreciation | | | (320,906 | ) |
| | | | |
Net unrealized depreciation | | $ | (35,997 | ) |
| | | | |
| (a) | | Securities with a total aggregate market value of $6,961,416, or 91.42% of net assets, were valued under securities valuation procedures established by the Funds’ Board of Trustees. |
| (b) | | This security has been determined to be an illiquid security. At April 30, 2016, this security amounted to $181,100, or 2.4% of net assets. |
| REIT | | Real Estate Investment Trust |
See accompanying Notes to Financial Statements.
| | |
| |
| ASTON/Harrison Street Real Estate Fund | | April 30, 2016 |
| |
| Schedule of Investments (unaudited) | | |
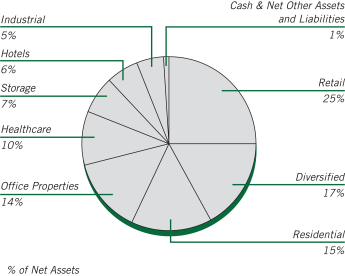
| | | | | | | | |
Shares | | | | | Market
Value | |
|
| | COMMON STOCKS – 2.79% | |
| | |
| | | | Hotels – 2.79% | | | | |
| | 2,958 | | | Las Vegas Sands | | $ | 133,554 | |
| | 2,171 | | | Marriott International, Class A | | | 152,165 | |
| | | | | | | | |
| | | | 285,719 | |
| | | | | | | | |
| | |
| | | | Total Common Stocks
(Cost $288,348) | | | 285,719 | |
| | | | | | | | |
|
| REAL ESTATE INVESTMENT TRUSTS – 96.67%
|
|
| | |
| | | | Diversified – 16.96% | | | | |
| | 6,605 | | | American Tower | | | 692,733 | |
| | 11,908 | | | Duke Realty | | | 260,428 | |
| | 1,464 | | | EQUINIX | | | 483,633 | |
| | 15,568 | | | Spirit Realty Capital | | | 177,942 | |
| | 4,786 | | | STORE Capital | | | 122,857 | |
| | | | | | | | |
| | | | 1,737,593 | |
| | | | | | | | |
| | |
| | | | Healthcare – 10.42% | | | | |
| | 6,895 | | | Healthcare Trust of America, Class A | | | 199,197 | |
| | 5,287 | | | Omega Healthcare Investors | | | 178,542 | |
| | 1,736 | | | National Health Investors | | | 118,204 | |
| | 6,888 | | | Physicians Realty Trust | | | 124,879 | |
| | 6,433 | | | Welltower | | | 446,579 | |
| | | | | | | | |
| | | | 1,067,401 | |
| | | | | | | | |
| | |
| | | | Hotels – 2.98% | | | | |
| | 6,395 | | | LaSalle Hotel Properties | | | 152,841 | |
| | 5,502 | | | Pebblebrook Hotel Trust | | | 152,075 | |
| | | | | | | | |
| | | | 304,916 | |
| | | | | | | | |
| | |
| | | | Industrial – 5.15% | | | | |
| | 1,672 | | | EastGroup Properties | | | 99,902 | |
| | 7,763 | | | Prologis | | | 352,518 | |
| | 3,300 | | | Terreno Realty | | | 75,141 | |
| | | | | | | | |
| | | | 527,561 | |
| | | | | | | | |
| | | | | | | | |
Shares | | | | | Market
Value | |
| | |
| | | | Office Properties – 13.51% | | | | |
| | 1,959 | | | Alexandria Real Estate Equities | | $ | 182,089 | |
| | 2,690 | | | Boston Properties | | | 346,634 | |
| | 5,901 | | | CyrusOne | | | 260,411 | |
| | 3,333 | | | Highwoods Properties | | | 155,751 | |
| | 4,757 | | | Hudson Pacific Properties | | | 139,142 | |
| | 2,854 | | | SL Green Realty | | | 299,898 | |
| | | | | | | | |
| | | | 1,383,925 | |
| | | | | | | | |
| | |
| | | | Residential – 15.10% | | | | |
| | 6,749 | | | Apartment Investment & Management, Class A | | | 270,365 | |
| | 2,905 | | | AvalonBay Communities | | | 513,575 | |
| | 2,425 | | | Camden Property Trust | | | 195,770 | |
| | 1,922 | | | Essex Property Trust | | | 423,705 | |
| | 2,506 | | | Post Properties | | | 143,744 | |
| | | | | | | | |
| | | | 1,547,159 | |
| | | | | | | | |
| | |
| | | | Retail – 25.34% | | | | |
| | 9,283 | | | Acadia Realty Trust | | | 312,837 | |
| | 2,876 | | | Agree Realty | | | 111,531 | |
| | 10,555 | | | Cedar Realty Trust | | | 73,041 | |
| | 9,847 | | | General Growth Properties | | | 276,011 | |
| | 3,292 | | | Macerich | | | 250,455 | |
| | 5,326 | | | National Retail Properties | | | 233,066 | |
| | 11,711 | | | Retail Opportunity Investments | | | 230,355 | |
| | 4,448 | | | Simon Property Group | | | 894,804 | |
| | 5,788 | | | Weingarten Realty Investors | | | 213,693 | |
| | | | | | | | |
| | | | 2,595,793 | |
| | | | | | | | |
| | |
| | | | Storage – 7.21% | | | | |
| | 4,392 | | | Extra Space Storage | | | 373,100 | |
| | 5,252 | | | National Storage Affiliates Trust | | | 102,519 | |
| | 2,480 | | | Sovran Self Storage | | | 263,426 | |
| | | | | | | | |
| | | | 739,045 | |
| | | | | | | | |
| | |
| | | | Total Real Estate Investment Trusts
(Cost $9,296,823) | | | 9,903,393 | |
| | | | | | | | |
|
| INVESTMENT COMPANY – 0.60%
|
|
| | |
| | 60,894 | | | BlackRock Liquidity Funds
TempFund Portfolio | | | 60,894 | |
| | | | | | | | |
| | |
| | | | Total Investment Company
(Cost $60,894) | | | 60,894 | |
| | | | | | | | |
| Total Investments – 100.06%
(Cost $9,646,065)* | | | 10,250,006 | |
| | | | | | | | |
| Net Other Assets and Liabilities – (0.06)% | | | (5,736 | ) |
| | | | | | | | |
| Net Assets – 100.00% | | $ | 10,244,270 | |
| | | | | | | | |
| * | | At April 30, 2016, the aggregate cost for Federal income tax purposes approximates the aggregate cost for book purposes. The aggregate gross unrealized appreciation and depreciation were as follows: |
| | | | |
Gross unrealized appreciation | | $ | 714,604 | |
Gross unrealized depreciation | | | (110,663 | ) |
| | | | |
Net unrealized appreciation | | $ | 603,941 | |
| | | | |
See accompanying Notes to Financial Statements.
| | |
| |
| ASTON/Montag & Caldwell Balanced Fund | | April 30, 2016 |
| |
| Schedule of Investments (unaudited) | | |
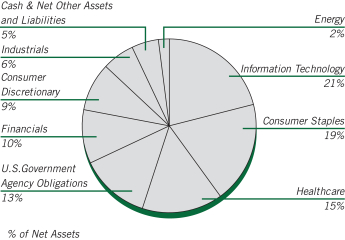
| | | | | | | | |
Shares | | | | | Market
Value | |
| |
| | COMMON STOCKS – 57.47% | | | | |
| | |
| | | | Consumer Discretionary – 9.11% | | | | |
| | 12,700 | | | Carnival | | $ | 622,935 | |
| | 6,100 | | | Dollar General | | | 499,651 | |
| | 9,500 | | | Dollar Tree * | | | 757,245 | |
| | 4,000 | | | NIKE, Class B | | | 235,760 | |
| | 376 | | | Priceline Group * | | | 505,216 | |
| | 6,200 | | | Starbucks | | | 348,626 | |
| | 9,650 | | | TJX | | | 731,663 | |
| | | | | | | | |
| | | | 3,701,096 | |
| | | | | | | | |
| | |
| | | | Consumer Staples – 15.36% | | | | |
| | 7,900 | | | Colgate-Palmolive | | | 560,268 | |
| | 2,424 | | | Costco Wholesale | | | 359,067 | |
| | 6,400 | | | CVS Health | | | 643,200 | |
| | 5,150 | | | Estee Lauder, Class A | | | 493,731 | |
| | 8,300 | | | Kraft Heinz | | | 647,981 | |
| | 25,050 | | | Mondelez International, Class A | | | 1,076,148 | |
| | 2,800 | | | Monster Beverage * | | | 403,816 | |
| | 10,720 | | | PepsiCo | | | 1,103,731 | |
| | 12,000 | | | Walgreens Boots Alliance | | | 951,360 | |
| | | | | | | | |
| | | | 6,239,302 | |
| | | | | | | | |
| | |
| | | | Energy – 0.72% | | | | |
| | 3,800 | | | Occidental Petroleum | | | 291,270 | |
| | | | | | | | |
| | |
| | | | Financials – 0.98% | | | | |
| | 8,000 | | | Wells Fargo | | | 399,840 | |
| | | | | | | | |
| | |
| | | | Healthcare – 10.74% | | | | |
| | 13,800 | | | Abbott Laboratories | | | 536,820 | |
| | 2,669 | | | Allergan (Ireland) * | | | 577,999 | |
| | 2,850 | | | AmerisourceBergen | | | 242,535 | |
| | 3,352 | | | Amgen | | | 530,622 | |
| | 5,600 | | | Celgene * | | | 579,096 | |
| | 4,900 | | | Gilead Sciences | | | 432,229 | |
| | 9,200 | | | Medtronic (Ireland) | | | 728,180 | |
| | 5,100 | | | Thermo Fisher Scientific | | | 735,675 | |
| | | | | | | | |
| | | | 4,363,156 | |
| | | | | | | | |
| | | | | | | | |
Shares | | | | | Market
Value | |
| | |
| | | | Industrials – 4.68% | | | | |
| | 7,800 | | | Honeywell International | | $ | 891,306 | |
| | 9,600 | | | United Parcel Service, Class B | | | 1,008,672 | |
| | | | | | | | |
| | | | 1,899,978 | |
| | | | | | | | |
| | |
| | | | Information Technology – 15.88% | | | | |
| | 6,750 | | | Accenture, Class A (Ireland) | | | 762,210 | |
| | 1,547 | | | Alphabet, Class A * | | | 1,095,090 | |
| | 3,500 | | | Apple | | | 328,090 | |
| | 9,700 | | | Cognizant Technology Solutions, Class A * | | | 566,189 | |
| | 7,900 | | | Facebook, Class A * | | | 928,882 | |
| | 4,100 | | | MasterCard, Class A | | | 397,659 | |
| | 5,900 | | | Microsoft | | | 294,233 | |
| | 13,800 | | | PayPal Holdings * | | | 540,684 | |
| | 9,700 | | | QUALCOMM | | | 490,044 | |
| | 13,568 | | | Visa, Class A | | | 1,047,992 | |
| | | | | | | | |
| | | | 6,451,073 | |
| | | | | | | | |
| | |
| | | | Total Common Stocks
(Cost $21,232,584) | | | 23,345,715 | |
| | | | | | | | |
Par Value | | | | | | |
| |
| | CORPORATE NOTES AND BONDS – 24.61% | | | | |
| | |
| | | | Consumer Staples – 4.11% | | | | |
| | $600,000 | | | Abbott Laboratories
Senior Unsecured Notes
2.950%, 03/15/25 | | | 589,221 | |
| | 500,000 | | | PepsiCo
Senior Unsecured Notes
5.000%, 06/01/18 | | | 541,188 | |
| | 500,000 | | | Wal-Mart Stores
Senior Unsecured Notes
3.250%, 10/25/20 | | | 540,095 | |
| | | | | | | | |
| | | | 1,670,504 | |
| | | | | | | | |
| | |
| | | | Energy – 1.49% | | | | |
| | 600,000 | | | Chevron
Senior Unsecured Notes
1.718%, 06/24/18 | | | 606,269 | |
| | | | | | | | |
| | |
| | | | Financials – 8.03% | | | | |
| | 375,000 | | | Berkshire Hathaway
Senior Unsecured Notes
3.125%, 03/15/26 | | | 390,778 | |
| | 500,000 | | | General Electric Capital
Senior Unsecured Notes, MTN
4.375%, 09/16/20 | | | 557,033 | |
| | 525,000 | | | JPMorgan Chase
Senior Unsecured Notes
4.350%, 08/15/21 | | | 575,044 | |
| | 500,000 | | | State Street
Senior Unsecured Notes
2.550%, 08/18/20 | | | 515,377 | |
| | 600,000 | | | U.S. Bancorp
Subordinated Notes, MTN
2.950%, 07/15/22 | | | 618,673 | |
See accompanying Notes to Financial Statements.
| | |
| |
| ASTON/Montag & Caldwell Balanced Fund | | April 30, 2016 |
| |
| Schedule of Investments (unaudited) – continued | | |
| | | | | | | | |
Par Value | | | | | Market
Value | |
| | |
| | | | Financials (continued) | | | | |
| | $ 600,000 | | | Wells Fargo & Co
Senior Unsecured Notes,
MTN 2.150%, 01/30/20 | | $ | 607,141 | |
| | | | | | | | |
| | | | 3,264,046 | |
| | | | | | | | |
| | |
| | | | Healthcare – 4.11% | | | | |
| | 400,000 | | | Johnson & Johnson
Senior Unsecured Notes
5.950%, 08/15/37 | | | 557,880 | |
| | 500,000 | | | Merck & Co., Inc.
Senior Unsecured Notes
2.350%, 02/10/22 | | | 510,043 | |
| | 600,000 | | | Pfizer
Senior Unsecured Notes
1.100%, 05/15/17 | | | 602,888 | |
| | | | | | | | |
| | | | 1,670,811 | |
| | | | | | | | |
| | |
| | | | Industrials – 1.32% | | | | |
| | 500,000 | | | United Parcel Service
Senior Unsecured Notes
3.125%, 01/15/21 | | | 534,505 | |
| | | | | | | | |
| | |
| | | | Information Technology – 5.55% | | | | |
| | 500,000 | | | Alphabet
Senior Unsecured Notes
3.625%, 05/19/21 | | | 550,795 | |
| | 525,000 | | | Apple
Senior Unsecured Notes
1.000%, 05/03/18 | | | 525,061 | |
| | 600,000 | | | Oracle
Senior Unsecured Notes
2.500%, 10/15/22 | | | 612,688 | |
| | 550,000 | | | QUALCOMM
Senior Unsecured Notes
2.250%, 05/20/20 | | | 564,250 | |
| | | | | | | | |
| | | | 2,252,794 | |
| | | | | | | | |
| | |
| | | | Total Corporate Notes and Bonds
(Cost $9,746,095) | | | 9,998,929 | |
| | | | | | | | |
|
| | U.S. GOVERNMENT AND AGENCY OBLIGATIONS – 13.31% | |
| | |
| | | | Fannie Mae – 0.06% | | | | |
| | 8,063 | | | 7.500%, 02/01/35
Pool # 787557 | | | 8,854 | |
| | 2,798 | | | 7.500%, 04/01/35
Pool # 819231 | | | 2,959 | |
| | 11,945 | | | 6.000%, 11/01/35
Pool # 844078 | | | 13,634 | |
| | | | | | | | |
| | | | 25,447 | |
| | | | | | | | |
| | |
| | | | Freddie Mac – 1.25% | | | | |
| | 500,000 | | | 1.000%, 09/29/17 | | | 501,845 | |
| | 5,501 | | | 5.500%, 12/01/20
Gold Pool # G11820 | | | 5,887 | |
| | | | | | | | |
| | | | 507,732 | |
| | | | | | | | |
| | | | | | | | |
Par Value | | | | | Market
Value | |
| | |
| | | | Ginnie Mae – 0.01% | | | | |
| | $ 4,185 | | | 5.500%, 02/15/39
Pool # 698060 | | $ | 4,695 | |
| | | | | | | | |
| | |
| | | | U.S. Treasury Bonds – 4.30% | | | | |
| | 475,000 | | | 5.375%, 02/15/31 | | | 675,892 | |
| | 625,000 | | | 3.500%, 02/15/39 | | | 738,306 | |
| | 300,000 | | | 3.125%, 11/15/41 | | | 330,990 | |
| | | | | | | | |
| | | | 1,745,188 | |
| | | | | | | | |
| | |
| | | | U.S. Treasury Notes – 7.69% | | | | |
| | 450,000 | | | 4.625%, 02/15/17 | | | 464,326 | |
| | 525,000 | | | 1.000%, 12/15/17 | | | 527,338 | |
| | 550,000 | | | 1.375%, 09/30/18 | | | 557,036 | |
| | 550,000 | | | 1.500%, 01/31/19 | | | 559,109 | |
| | 475,000 | | | 2.500%, 05/15/24 | | | 503,741 | |
| | 500,000 | | | 2.125%, 05/15/25 | | | 514,102 | |
| | | | | | | | |
| | | | 3,125,652 | |
| | | | | | | | |
| | |
| | | | Total U.S. Government and Agency Obligations
(Cost $5,234,504) | | | 5,408,714 | |
| | | | | | | | |
|
| INVESTMENT COMPANY – 3.67%
|
|
| | |
| | 1,489,226 | | | BlackRock Liquidity Funds TempFund Portfolio | | | 1,489,226 | |
| | | | | | | | |
| | |
| | | | Total Investment Company
(Cost $1,489,226) | | | 1,489,226 | |
| | | | | | | | |
| Total Investments – 99.06%
(Cost $37,702,409)** | | | 40,242,584 | |
| | | | | | | | |
| Net Other Assets and Liabilities – 0.94% | | | 382,678 | |
| | | | | | | | |
| Net Assets – 100.00% | | $ | 40,625,262 | |
| | | | | | | | |
| * | | Non-income producing security. |
| ** | | At April 30, 2016, the aggregate cost for Federal income tax purposes approximates the aggregate cost for book purposes. The aggregate gross unrealized appreciation and depreciation were as follows: |
| | | | |
Gross unrealized appreciation | | $ | 2,950,497 | |
Gross unrealized depreciation | | | (410,322 | ) |
| | | | |
Net unrealized appreciation | | $ | 2,540,175 | |
| | | | |
See accompanying Notes to Financial Statements.
| | |
| |
| ASTON/Montag & Caldwell Balanced Fund | | April 30, 2016 |
| |
| Schedule of Investments (unaudited) – continued | | |
| | | | |
Portfolio Composition *** | | | | |
Common Stocks | | | 58% | |
U.S. Government and Agency Obligations | | | 13% | |
Investment Company | | | 4% | |
Corporate Notes and Bonds | | | | |
(Moody’s Ratings) | | | | |
Aaa | | | 1% | |
Aa | | | 8% | |
A | | | 16% | |
| | | | |
| | | 100% | |
| | | | |
| *** | Portfolio composition is based on market value of total investments. |
See accompanying Notes to Financial Statements.
| | |
| |
| | April 30, 2016 |
| |
| Statements of Assets and Liabilities (unaudited) | | |
| | | | | | | | |
| | |
| |
| Cornerstone
Large Cap
Value Fund
|
| |
| Fairpointe
Focused
Equity Fund
|
|
| | | | | | | | |
| | |
ASSETS: | | | | | | | | |
Investments: | | | | | | | | |
Investments at cost | | $ | 87,648,496 | | | $ | 7,003,325 | |
Net unrealized appreciation (depreciation) | | | (6,730,510 | ) | | | (284,568 | ) |
| | | | | | | | |
Total investments at value | | | 80,917,986 | | | | 6,718,757 | |
Cash | | | 28,160 | | | | — | |
Receivables: | | | | | | | | |
Dividends and interest | | | 38,457 | | | | 3,326 | |
Dividend reclaims | | | 6,053 | | | | 341 | |
Fund shares sold | | | 10,649 | | | | — | |
Investments sold | | | 176,219 | | | | 87,786 | |
Due from Adviser, net (Note G) | | | — | | | | 3,319 | |
Deferred offering costs (Note B-14) | | | — | | | | — | |
Other assets | | | — | | | | — | |
| | | | | | | | |
Total assets | | | 81,177,524 | | | | 6,813,529 | |
| | | | | | | | |
| | |
LIABILITIES: | | | | | | | | |
Payables: | | | | | | | | |
Dividend distribution | | | — | | | | — | |
Investments purchased | | | 307,362 | | | | 151,603 | |
Fund shares redeemed | | | 198,835 | | | | — | |
Advisory fees, net (Note G) | | | 35,251 | | | | — | |
Administration fees (Note G) | | | 4,838 | | | | 1,729 | |
Distribution fees (Note G) | | | 2,081 | | | | 93 | |
Audit and tax fees | | | 11,621 | | | | 9,839 | |
Custodian fees | | | 10,820 | | | | 1,376 | |
Transfer agent fees | | | 33,464 | | | | 10,822 | |
Trustees fees (Note G) | | | 1,043 | | | | 48 | |
Offering costs | | | — | | | | — | |
Accrued expenses and other payables | | | 14,623 | | | | 6,735 | |
| | | | | | | | |
Total liabilities | | | 619,938 | | | | 182,245 | |
| | | | | | | | |
NET ASSETS | | $ | 80,557,586 | | | $ | 6,631,284 | |
| | | | | | | | |
| | |
NET ASSETS CONSIST OF: | | | | | | | | |
Paid-in capital | | $ | 109,952,616 | | | $ | 7,128,110 | |
Accumulated undistributed (distribution in excess of) net investment income (loss) | | | 310,850 | | | | 22,272 | |
Accumulated undistributed net realized gain (loss) on investments | | | (22,975,370 | ) | | | (234,530 | ) |
Net unrealized appreciation (depreciation) on investments | | | (6,730,510 | ) | | | (284,568 | ) |
| | | | | | | | |
TOTAL NET ASSETS | | $ | 80,557,586 | | | $ | 6,631,284 | |
| | | | | | | | |
| | |
Class N: | | | | | | | | |
Net Assets | | $ | 49,908,672 | | | $ | 2,242,600 | |
Shares of beneficial interest outstanding (unlimited authorization) | | | 3,721,257 | | | | 245,026 | |
Net asset value, offering and redemption price per share
(Net Assets/Shares Outstanding) | | $ | 13.41 | | | $ | 9.15 | |
| | | | | | | | |
Class I: | | | | | | | | |
Net Assets | | $ | 30,648,914 | | | $ | 4,388,684 | |
Shares of beneficial interest outstanding (unlimited authorization) | | | 2,280,451 | | | | 478,918 | |
Net asset value, offering and redemption price per share
(Net Assets/Shares Outstanding) | | $ | 13.44 | | | $ | 9.16 | |
| | | | | | | | |
Class R: | | | | | | | | |
Net Assets | | $ | — | | | $ | — | |
Shares of beneficial interest outstanding (unlimited authorization) | | | — | | | | — | |
Net asset value, offering and redemption price per share
(Net Assets/Shares Outstanding) | | $ | — | | | $ | — | |
| | | | | | | | |
See accompanying Notes to Financial Statements.
| | | | | | | | | | | | | | | | | | | | | | | | | | |
| | | | | | |
River Road
Focused Absolute
Value Fund | | | Herndon
Large Cap
Value Fund | | | Montag & Caldwell
Growth Fund | | | River Road
Dividend All
Cap Value Fund | | | River Road
Dividend All
Cap Value Fund II | | | Fairpointe
Mid Cap Fund | | | Montag & Caldwell
Mid Cap
Growth Fund | |
| | | | | | | | | | | | | | | | | | | | | | | | | | |
| | | | | | |
| | | | | | | | | | | | | | | | | | | | | | | | | | |
| | | | | | | | | | | | | | | | | | | | | | | | | | |
| $ | 7,602,847 | | | $ | 80,477,832 | | | $ | 1,443,307,802 | | | $ | 573,497,038 | | | $ | 105,515,779 | | | $ | 3,594,849,034 | | | $ | 9,302,711 | |
| | 371,077 | | | | 6,026,310 | | | | 166,596,955 | | | | 136,217,287 | | | | 12,941,133 | | | | 213,088,594 | | | | 1,293,756 | |
| | | | | | | | | | | | | | | | | | | | | | | | | | |
| | 7,973,924 | | | | 86,504,142 | | | | 1,609,904,757 | | | | 709,714,325 | | | | 118,456,912 | | | | 3,807,937,628 | | | | 10,596,467 | |
| | — | | | | — | | | | — | | | | — | | | | — | | | | — | | | | — | |
| | | | | | | | | | | | | | | | | | | | | | | | | | |
| | 49 | | | | 157,715 | | | | 1,220,671 | | | | 1,114,569 | | | | 174,392 | | | | 943,967 | | | | 1,956 | |
| | — | | | | — | | | | — | | | | 9,544 | | | | — | | | | — | | | | — | |
| | 1,401,270 | | | | 163,864 | | | | 1,225,604 | | | | 1,514,714 | | | | 45,131 | | | | 5,258,821 | | | | 1,000 | |
| | — | | | | 2,364,996 | | | | 5,602,613 | | | | — | | | | — | | | | 5,850,349 | | | | 154,470 | |
| | 9,097 | | | | — | | | | — | | | | — | | | | — | | | | — | | | | 35 | |
| | 30,700 | | | | — | | | | — | | | | — | | | | — | | | | — | | | | — | |
| | — | | | | 7,035 | | | | — | | | | — | | | | — | | | | — | | | | — | |
| | | | | | | | | | | | | | | | | | | | | | | | | | |
| | 9,415,040 | | | | 89,197,752 | | | | 1,617,953,645 | | | | 712,353,152 | | | | 118,676,435 | | | | 3,819,990,765 | | | | 10,753,928 | |
| | | | | | | | | | | | | | | | | | | | | | | | | | |
| | | | | | |
| | | | | | | | | | | | | | | | | | | | | | | | | | |
| | | | | | | | | | | | | | | | | | | | | | | | | | |
| | — | | | | — | | | | — | | | | 56,662 | | | | 9,021 | | | | — | | | | — | |
| | — | | | | — | | | | — | | | | — | | | | — | | | | 22,200,535 | | | | 166,906 | |
| | — | | | | 174,947 | | | | 4,940,253 | | | | 1,477,597 | | | | 15,225 | | | | 11,736,526 | | | | — | |
| | — | | | | 49,663 | | | | 948,624 | | | | 405,728 | | | | 67,736 | | | | 2,162,099 | | | | — | |
| | 2,388 | | | | 5,510 | | | | 78,319 | | | | 30,171 | | | | 6,377 | | | | 172,588 | | | | 2,181 | |
| | 9 | | | | 267 | | | | 30,395 | | | | 8,675 | | | | 124 | | | | 64,829 | | | | 187 | |
| | 9,277 | | | | 10,033 | | | | 16,859 | | | | 12,299 | | | | 12,299 | | | | 16,863 | | | | 9,839 | |
| | 4,493 | | | | 6,170 | | | | 34,348 | | | | 16,616 | | | | 4,153 | | | | 75,855 | | | | 1,577 | |
| | 11,484 | | | | 29,167 | | | | 524,235 | | | | 231,385 | | | | 30,547 | | | | 1,002,092 | | | | 11,698 | |
| | 77 | | | | 1,020 | | | | 17,150 | | | | 6,943 | | | | 1,042 | | | | 38,923 | | | | 83 | |
| | 42,999 | | | | — | | | | — | | | | — | | | | — | | | | — | | | | — | |
| | 10,619 | | | | 4,850 | | | | 141,221 | | | | 56,699 | | | | 15,799 | | | | 420,016 | | | | 2,960 | |
| | | | | | | | | | | | | | | | | | | | | | | | | | |
| | 81,346 | | | | 281,627 | | | | 6,731,404 | | | | 2,302,775 | | | | 162,323 | | | | 37,890,326 | | | | 195,431 | |
| | | | | | | | | | | | | | | | | | | | | | | | | | |
| $ | 9,333,694 | | | $ | 88,916,125 | | | $ | 1,611,222,241 | | | $ | 710,050,377 | | | $ | 118,514,112 | | | $ | 3,782,100,439 | | | $ | 10,558,497 | |
| | | | | | | | | | | | | | | | | | | | | | | | | | |
| | | | | | |
| | | | | | | | | | | | | | | | | | | | | | | | | | |
| $ | 8,801,530 | | | $ | 86,183,833 | | | $ | 1,367,451,474 | | | $ | 542,188,203 | | | $ | 104,922,686 | | | $ | 3,394,099,778 | | | $ | 9,298,953 | |
| | 30,517 | | | | 507,682 | | | | 942,554 | | | | (323,425 | ) | | | (34,277 | ) | | | 4,357,319 | | | | (69,496 | ) |
| | 130,570 | | | | (3,801,700 | ) | | | 76,231,258 | | | | 31,968,312 | | | | 684,570 | | | | 170,554,748 | | | | 35,284 | |
| | 371,077 | | | | 6,026,310 | | | | 166,596,955 | | | | 136,217,287 | | | | 12,941,133 | | | | 213,088,594 | | | | 1,293,756 | |
| | | | | | | | | | | | | | | | | | | | | | | | | | |
| $ | 9,333,694 | | | $ | 88,916,125 | | | $ | 1,611,222,241 | | | $ | 710,050,377 | | | $ | 118,514,112 | | | $ | 3,782,100,439 | | | $ | 10,558,497 | |
| | | | | | | | | | | | | | | | | | | | | | | | | | |
| | | | | | |
| | | | | | | | | | | | | | | | | | | | | | | | | | |
| $ | 211,411 | | | $ | 6,361,074 | | | $ | 718,585,340 | | | $ | 210,625,223 | | | $ | 3,006,860 | | | $ | 1,551,238,857 | | | $ | 4,473,068 | |
| | 20,871 | | | | 510,987 | | | | 36,917,948 | | | | 17,454,222 | | | | 224,355 | | | | 43,246,049 | | | | 436,324 | |
| | | | | | |
| $ | 10.13 | | | $ | 12.45 | | | $ | 19.46 | | | $ | 12.07 | | | $ | 13.40 | | | $ | 35.87 | | | $ | 10.25 | |
| | | | | | | | | | | | | | | | | | | | | | | | | | |
| | | | | | | | | | | | | | | | | | | | | | | | | | |
| $ | 9,122,283 | | | $ | 82,555,051 | | | $ | 886,880,596 | | | $ | 499,425,154 | | | $ | 115,507,252 | | | $ | 2,230,861,582 | | | $ | 6,085,429 | |
| | 899,508 | | | | 6,651,924 | | | | 45,312,750 | | | | 41,419,551 | | | | 8,613,537 | | | | 60,787,644 | | | | 590,641 | |
$ |
10.14 |
| | $ | 12.41 | | | $ | 19.57 | | | $ | 12.06 | | | $ | 13.41 | | | $ | 36.70 | | | $ | 10.30 | |
| | | | | | | | | | | | | | | | | | | | | | | | | | |
| | | | | | | | | | | | | | | | | | | | | | | | | | |
| $ | — | | | $ | — | | | $ | 5,756,305 | | | $ | — | | | $ | — | | | $ | — | | | $ | — | |
| | — | | | | — | | | | 301,886 | | | | — | | | | — | | | | — | | | | — | |
| | | | | | |
| $ | — | | | $ | — | | | $ | 19.07 | | | $ | — | | | $ | — | | | $ | — | | | $ | — | |
| | | | | | | | | | | | | | | | | | | | | | | | | | |
See accompanying Notes to Financial Statements.
| | |
| |
| | April 30, 2016 |
| |
| Statements of Assets and Liabilities (unaudited) – continued | | |
| | | | | | | | |
| | |
| | | LMCG
Small Cap
Growth Fund | | | River Road
Independent
Value Fund | |
| | | | | | | | |
| | |
ASSETS: | | | | | | | | |
Investments: | | | | | | | | |
Investments at cost | | $ | 158,163,078 | | | $ | 378,485,493 | |
Affiliated Investment at cost (Note G) | | | — | | | | — | |
Net unrealized appreciation (depreciation) | | | (7,831,194 | ) | | | 21,600,498 | |
| | | | | | | | |
Total investments at value | | | 150,331,884 | | | | 400,085,991 | |
Total affiliated investment at value (Note G) | | | — | | | | — | |
Cash | | | — | | | | 20,093 | |
Receivables: | | | | | | | | |
Dividends and interest | | | 11,251 | | | | 67,403 | |
Dividend reclaims | | | — | | | | — | |
Fund shares sold | | | 37,479 | | | | 8,437,635 | |
Investments sold | | | 5,263,469 | | | | 3,189,500 | |
| | | | | | | | |
Total assets | | | 155,644,083 | | | | 411,800,622 | |
| | | | | | | | |
| | |
LIABILITIES: | | | | | | | | |
Payables: | | | | | | | | |
Dividend distribution | | | — | | | | — | |
Investments purchased | | | 3,925,313 | | | | 54,469 | |
Fund shares redeemed | | | 5,663,946 | | | | 2,043,166 | |
Advisory fees, net (Note G) | | | 100,824 | | | | 315,687 | |
Administration fees (Note G) | | | 8,727 | | | | 16,240 | |
Distribution fees (Note G) | | | 3,605 | | | | 11,834 | |
Audit and tax fees | | | 9,839 | | | | 9,839 | |
Custodian fees | | | 8,530 | | | | 8,131 | |
Transfer agent fees | | | 62,766 | | | | 120,618 | |
Trustees fees (Note G) | | | 2,014 | | | | 3,302 | |
Accrued expenses and other payables | | | 31,423 | | | | 37,198 | |
Call options written, at value (premiums received $3,530,670) | | | — | | | | — | |
| | | | | | | | |
Total liabilities | | | 9,816,987 | | | | 2,620,484 | |
| | | | | | | | |
NET ASSETS | | $ | 145,827,096 | | | $ | 409,180,138 | |
| | | | | | | | |
| | |
NET ASSETS CONSIST OF: | | | | | | | | |
Paid-in capital | | $ | 188,568,182 | | | $ | 413,656,659 | |
Accumulated undistributed (distribution in excess of) net investment income (loss) | | | (1,871,818 | ) | | | (5,401,434 | ) |
Accumulated undistributed net realized gain (loss) on investments, purchased and written options | | | (33,038,074 | ) | | | (20,675,585 | ) |
Net unrealized appreciation (depreciation) on investments, purchased and written options | | | (7,831,194 | ) | | | 21,600,498 | |
| | | | | | | | |
TOTAL NET ASSETS | | $ | 145,827,096 | | | $ | 409,180,138 | |
| | | | | | | | |
Class N: | | | | | | | | |
Net Assets | | $ | 85,138,809 | | | $ | 299,593,523 | |
Shares of beneficial interest outstanding (unlimited authorization) | | | 6,971,030 | | | | 27,891,490 | |
Net asset value, offering and redemption price per share
(Net Assets/Shares Outstanding) | | $ | 12.21 | | | $ | 10.74 | |
| | | | | | | | |
Class I: | | | | | | | | |
Net Assets | | $ | 60,688,287 | | | $ | 109,586,615 | |
Shares of beneficial interest outstanding (unlimited authorization) | | | 4,907,990 | | | | 10,070,269 | |
Net asset value, offering and redemption price per share
(Net Assets/Shares Outstanding) | | $ | 12.37 | | | $ | 10.88 | |
| | | | | | | | |
See accompanying Notes to Financial Statements.
| | | | | | | | | | | | | | | | | | | | | | | | | | |
| | | | | | |
River Road
Select Value
Fund | | | River Road
Small Cap
Value Fund | | | Silvercrest
Small Cap
Fund | | | Small Cap
Fund | | | DoubleLine Core
Plus Fixed
Income Fund | | | TCH
Fixed Income
Fund | | | Anchor Capital
Enhanced Equity
Fund | |
| | | | | | | | | | | | | | | | | | | | | | | | | | |
| | | | | | |
| | | | | | | | | | | | | | | | | | | | | | | | | | |
| | | | | | | | | | | | | | | | | | | | | | | | | | |
| $ | 44,939,120 | | | $ | 224,100,394 | | | $ | 172,642,549 | | | $ | 98,470,893 | | | $ | 710,319,795 | | | $ | 39,041,724 | | | $ | 108,056,107 | |
| | — | | | | — | | | | — | | | | — | | | | 8,729,080 | | | | — | | | | — | |
| | 1,234,045 | | | | 32,721,632 | | | | 4,460,633 | | | | 11,377,574 | | | | (163,315 | ) | | | 359,658 | | | | 1,486,605 | |
| | | | | | | | | | | | | | | | | | | | | | | | | | |
| | 46,173,165 | | | | 256,822,026 | | | | 177,103,182 | | | | 109,848,467 | | | | 710,398,235 | | | | 39,401,382 | | | | 109,542,712 | |
| | — | | | | — | | | | — | | | | — | | | | 8,487,325 | | | | — | | | | — | |
| | — | | | | — | | | | — | | | | — | | | | 75,170 | | | | 1,262,500 | | | | — | |
| | | | | | | | | | | | | | | | | | | | | | | | | | |
| | 17,392 | | | | 122,993 | | | | 25,973 | | | | 18,055 | | | | 4,637,925 | | | | 326,069 | | | | 261,062 | |
| | — | | | | — | | | | — | | | | 1,488 | | | | — | | | | — | | | | — | |
| | 19,895 | | | | 303,517 | | | | 565,552 | | | | 23,700 | | | | 2,327,132 | | | | 38,222 | | | | 153,738 | |
| | 314,796 | | | | 2,697,336 | | | | 592,843 | | | | — | | | | 1,543,648 | | | | — | | | | 1,735,167 | |
| | | | | | | | | | | | | | | | | | | | | | | | | | |
| | 46,525,248 | | | | 259,945,872 | | | | 178,287,550 | | | | 109,891,710 | | | | 727,469,435 | | | | 41,028,173 | | | | 111,692,679 | |
| | | | | | | | | | | | | | | | | | | | | | | | | | |
| | | | | | |
| | | | | | | | | | | | | | | | | | | | | | | | | | |
| | | | | | | | | | | | | | | | | | | | | | | | | | |
| | — | | | | — | | | | — | | | | — | | | | 108,232 | | | | 3,975 | | | | — | |
| | 677,780 | | | | 2,423,494 | | | | 91,733 | | | | — | | | | 16,113,185 | | | | — | | | | 1,898,611 | |
| | 13,333 | | | | 277,960 | | | | 82,834 | | | | 252,368 | | | | 2,305,707 | | | | 20,626 | | | | 509,548 | |
| | 26,207 | | | | 190,204 | | | | 139,677 | | | | 79,789 | | | | 274,048 | | | | 8,829 | | | | 62,877 | |
| | 4,369 | | | | 12,074 | | | | 8,575 | | | | 7,640 | | | | 57,866 | | | | 9,393 | | | | 7,806 | |
| | 206 | | | | 827 | | | | 781 | | | | 1,838 | | | | 13,406 | | | | 1,357 | | | | 2,280 | |
| | 11,621 | | | | 11,621 | | | | 9,839 | | | | 11,815 | | | | 17,804 | | | | 13,565 | | | | 10,973 | |
| | 5,977 | | | | 8,165 | | | | 3,245 | | | | 14,678 | | | | 20,602 | | | | 3,521 | | | | 30,703 | |
| | 41,480 | | | | 101,465 | | | | 18,157 | | | | 102,872 | | | | 80,278 | | | | 22,985 | | | | 45,185 | |
| | 1,569 | | | | 2,351 | | | | 1,198 | | | | 74 | | | | 3,700 | | | | 426 | | | | 1,781 | |
| | 8,772 | | | | 27,230 | | | | 16,108 | | | | 35,119 | | | | 34,127 | | | | 8,590 | | | | 21,749 | |
| | — | | | | — | | | | — | | | | — | | | | — | | | | — | | | | 5,340,533 | |
| | | | | | | | | | | | | | | | | | | | | | | | | | |
| | 791,314 | | | | 3,055,391 | | | | 372,147 | | | | 506,193 | | | | 19,028,955 | | | | 93,267 | | | | 7,932,046 | |
| | | | | | | | | | | | | | | | | | | | | | | | | | |
| $ | 45,733,934 | | | $ | 256,890,481 | | | $ | 177,915,403 | | | $ | 109,385,517 | | | $ | 708,440,480 | | | $ | 40,934,906 | | | $ | 103,760,633 | |
| | | | | | | | | | | | | | | | | | | | | | | | | | |
| | | | | | |
| | | | | | | | | | | | | | | | | | | | | | | | | | |
| $ | 43,010,549 | | | $ | 217,995,890 | | | $ | 176,147,456 | | | $ | 62,145,370 | | | $ | 714,340,210 | | | $ | 43,938,115 | | | $ | 105,929,837 | |
| | (589,968 | ) | | | 29,193 | | | | 75,603 | | | | (3,322,526 | ) | | | (1,131,485 | ) | | | (58,166 | ) | | | 243,174 | |
| | 2,079,308 | | | | 6,143,766 | | | | (2,768,289 | ) | | | 39,185,099 | | | | (4,604,930 | ) | | | (3,304,701 | ) | | | (2,089,120 | ) |
| | 1,234,045 | | | | 32,721,632 | | | | 4,460,633 | | | | 11,377,574 | | | | (163,315 | ) | | | 359,658 | | | | (323,258 | ) |
| | | | | | | | | | | | | | | | | | | | | | | | | | |
| $ | 45,733,934 | | | $ | 256,890,481 | | | $ | 177,915,403 | | | $ | 109,385,517 | | | $ | 708,440,480 | | | $ | 40,934,906 | | | $ | 103,760,633 | |
| | | | | | | | | | | | | | | | | | | | | | | | | | |
| | | | | | | | | | | | | | | | | | | | | | | | | | |
| $ | 5,086,561 | | | $ | 20,135,056 | | | $ | 18,929,771 | | | $ | 44,043,721 | | | $ | 327,884,606 | | | $ | 33,228,864 | | | $ | 55,040,400 | |
| | 756,411 | | | | 1,737,055 | | | | 1,310,267 | | | | 7,743,871 | | | | 30,771,922 | | | | 3,186,838 | | | | 6,100,681 | |
$ |
6.72 |
| | $ | 11.59 | | | $ | 14.45 | | | $ | 5.69 | | | $ | 10.66 | | | $ | 10.43 | | | $ | 9.02 | |
| | | | | | | | | | | | | | | | | | | | | | | | | | |
| | | | | | | | | | | | | | | | | | | | | | | | | | |
| $ | 40,647,373 | | | $ | 236,755,425 | | | $ | 158,985,632 | | | $ | 65,341,796 | | | $ | 380,555,874 | | | $ | 7,706,042 | | | $ | 48,720,233 | |
| | 5,945,814 | | | | 20,205,919 | | | | 10,928,665 | | | | 10,272,862 | | | | 35,730,993 | | | | 738,903 | | | | 5,394,799 | |
$ |
6.84 |
| | $ | 11.72 | | | $ | 14.55 | | | $ | 6.36 | | | $ | 10.65 | | | $ | 10.43 | | | $ | 9.03 | |
| | | | | | | | | | | | | | | | | | | | | | | | | | |
See accompanying Notes to Financial Statements.
| | |
| |
| | April 30, 2016 |
| |
| Statements of Assets and Liabilities (unaudited) – continued | | |
| | | | | | | | |
| | |
| | | Lake Partners
LASSO Alternatives
Fund | | | River Road
Long-Short
Fund | |
| | | | | | | | |
| | |
ASSETS: | | | | | | | | |
Investments: | | | | | | | | |
Investments at cost | | $ | 132,095,581 | | | $ | 60,142,974 | |
Net unrealized appreciation (depreciation) | | | (2,774,708 | ) | | | 1,403,132 | |
| | | | | | | | |
Total investments at value | | | 129,320,873 | | | | 61,546,106 | |
Foreign currency (Cost $115,437, $586, $6,512, $48, $6,822,878, $205,325, respectively) | | | — | | | | 115,758 | |
Cash | | | 1,096 | | | | — | |
Segregated Cash (Note B-6) | | | — | | | | 1,000,000 | |
Receivables: | | | | | | | | |
Dividends and interest | | | 48,040 | | | | 77,275 | |
Dividend reclaims | | | — | | | | 88,057 | |
Fund shares sold | | | 177,317 | | | | 156,552 | |
Investments sold | | | 127,827 | | | | 4,700,865 | |
Due from Adviser, net (Note G) | | | — | | | | — | |
Due from Subadviser (Note G) | | | — | | | | — | |
Deferred offering costs (Note B-13) | | | — | | | | — | |
Other assets | | | — | | | | — | |
| | | | | | | | |
Total assets | | | 129,675,153 | | | | 67,684,613 | |
| | | | | | | | |
| | |
LIABILITIES: | | | | | | | | |
Payables: | | | | | | | | |
Due to broker | | | — | | | | 6,665,384 | |
Interest and dividends on securities sold short | | | — | | | | 37,315 | |
Investments purchased | | | 49,017 | | | | 2,347,815 | |
Fund shares redeemed | | | 883,382 | | | | 899,130 | |
Advisory fees, net (Note G) | | | 97,849 | | | | 33,353 | |
Administration fees (Note G) | | | 7,077 | | | | 4,299 | |
Distribution fees (Note G) | | | 1,469 | | | | 488 | |
Audit and tax fees | | | 10,973 | | | | 11,651 | |
Custodian fees | | | 4,313 | | | | 8,518 | |
Transfer agent fees | | | 49,587 | | | | 33,786 | |
Trustees fees (Note G) | | | 2,082 | | | | 365 | |
Offering costs | | | — | | | | — | |
Accrued expenses and other payables | | | 15,564 | | | | 11,219 | |
Securities sold short, at value (proceeds $13,536,329) | | | — | | | | 14,460,451 | |
| | | | | | | | |
Total liabilities | | | 1,121,313 | | | | 24,513,774 | |
| | | | | | | | |
NET ASSETS | | $ | 128,553,840 | | | $ | 43,170,839 | |
| | | | | | | | |
| | |
NET ASSETS CONSIST OF: | | | | | | | | |
Paid-in capital | | $ | 128,829,597 | | | $ | 47,975,991 | |
Accumulated undistributed (distribution in excess of) net investment income (loss) | | | (506,790 | ) | | | (344,875 | ) |
Accumulated undistributed net realized gain (loss) on investments, securities sold short, foreign currency transactions and capital gain distributions received | | | 3,005,741 | | | | (4,938,515 | ) |
Net unrealized appreciation (depreciation) on investments, securities sold short and translation of assets and liabilities in foreign currency | | | (2,774,708 | ) | | | 478,238 | |
| | | | | | | | |
TOTAL NET ASSETS | | $ | 128,553,840 | | | $ | 43,170,839 | |
| | | | | | | | |
Class N: | | | | | | | | |
Net Assets | | $ | 35,864,012 | | | $ | 11,800,123 | |
Shares of beneficial interest outstanding (unlimited authorization) | | | 3,048,688 | | | | 1,080,525 | |
Net asset value, offering and redemption price per share
(Net Assets/Shares Outstanding) | | $ | 11.76 | | | $ | 10.92 | |
| | | | | | | | |
Class I: | | | | | | | | |
Net Assets | | $ | 92,689,828 | | | $ | 31,370,716 | |
Shares of beneficial interest outstanding (unlimited authorization) | | | 7,858,896 | | | | 2,848,386 | |
Net asset value, offering and redemption price per share
(Net Assets/Shares Outstanding) | | $ | 11.79 | | | $ | 11.01 | |
| | | | | | | | |
See accompanying Notes to Financial Statements.
| | | | | | | | | | | | | | | | | | | | | | | | | | |
| | | | | | |
Barings
International
Fund | | | Guardian
Capital Global
Dividend Fund | | | LMCG
Emerging
Markets Fund | | | Pictet
International
Fund | | | Value Partners
Asia Dividend
Fund | | | Harrison Street
Real Estate
Fund | | | Montag & Caldwell
Balanced Fund | |
| | | | | | | | | | | | | | | | | | | | | | | | | | |
| | | | | | |
| | | | | | | | | | | | | | | | | | | | | | | | | | |
| | | | | | | | | | | | | | | | | | | | | | | | | | |
| $ | 19,068,954 | | | $ | 3,980,472 | | | $ | 2,133,083 | | | $ | 846,660,675 | | | $ | 7,154,504 | | | $ | 9,646,065 | | | $ | 37,702,409 | |
| | 760,979 | | | | 286,338 | | | | (92,919 | ) | | | 49,170,562 | | | | (35,997 | ) | | | 603,941 | | | | 2,540,175 | |
| | | | | | | | | | | | | | | | | | | | | | | | | | |
| | 19,829,933 | | | | 4,266,810 | | | | 2,040,164 | | | | 895,831,237 | | | | 7,118,507 | | | | 10,250,006 | | | | 40,242,584 | |
| | 613 | | | | 6,581 | | | | 49 | | | | 6,911,493 | | | | 205,582 | | | | — | | | | — | |
| | — | | | | 314 | | | | — | | | | — | | | | 536,331 | | | | — | | | | 354,594 | |
| | — | | | | — | | | | — | | | | — | | | | — | | | | — | | | | — | |
| | | | | | | | | | | | | | | | | | | | | | | | | | |
| | 91,231 | | | | 11,004 | | | | 340 | | | | 3,830,331 | | | | 17,650 | | | | 6,958 | | | | 122,899 | |
| | 130,179 | | | | 7,785 | | | | 23 | | | | 305,552 | | | | 66 | | | | 1,916 | | | | — | |
| | — | | | | 610 | | | | — | | | | 1,601,180 | | | | — | | | | 26,855 | | | | 23,702 | |
| | — | | | | 10,797 | | | | — | | | | 7,358,105 | | | | 47,219 | | | | — | | | | — | |
| | — | | | | 5,349 | | | | 11,977 | | | | — | | | | 11,880 | | | | 154 | | | | — | |
| | — | | | | — | | | | — | | | | 619,174 | | | | — | | | | — | | | | — | |
| | — | | | | — | | | | — | | | | — | | | | 39,156 | | | | — | | | | — | |
| | — | | | | 9,902 | | | | 7,615 | | | | 39,683 | | | | — | | | | — | | | | — | |
| | | | | | | | | | | | | | | | | | | | | | | | | | |
| | 20,051,956 | | | | 4,319,152 | | | | 2,060,168 | | | | 916,496,755 | | | | 7,976,391 | | | | 10,285,889 | | | | 40,743,779 | |
| | | | | | | | | | | | | | | | | | | | | | | | | | |
| | | | | | |
| | | | | | | | | | | | | | | | | | | | | | | | | | |
| | | | | | | | | | | | | | | | | | | | | | | | | | |
| | — | | | | — | | | | — | | | | — | | | | — | | | | — | | | | — | |
| | — | | | | — | | | | — | | | | — | | | | — | | | | — | | | | — | |
| | — | | | | 21,566 | | | | — | | | | 13,119,508 | | | | 241,306 | | | | — | | | | — | |
| | — | | | | — | | | | 591,607 | | | | 1,998,844 | | | | — | | | | 3,666 | | | | 47,824 | |
| | 5,011 | | | | — | | | | — | | | | 730,104 | | | | — | | | | — | | | | 25,105 | |
| | 13,727 | | | | 8,072 | | | | 16,677 | | | | 42,583 | | | | 11,780 | | | | 1,782 | | | | 4,711 | |
| | 18 | | | | 43 | | | | 24 | | | | 6 | | | | 31 | | | | 403 | | | | 613 | |
| | 11,621 | | | | 11,621 | | | | 10,307 | | | | 11,621 | | | | 9,595 | | | | 10,517 | | | | 13,565 | |
| | 18,066 | | | | 1,802 | | | | 23,062 | | | | 30,242 | | | | 18,610 | | | | 2,887 | | | | 2,341 | |
| | 14,254 | | | | 10,086 | | | | 10,177 | | | | 179,332 | | | | 9,513 | | | | 14,631 | | | | 17,543 | |
| | 146 | | | | 30 | | | | 18 | | | | 5,044 | | | | 64 | | | | 82 | | | | 198 | |
| | — | | | | — | | | | — | | | | — | | | | 64,933 | | | | — | | | | — | |
| | 3,221 | | | | 157 | | | | 85 | | | | 12,982 | | | | 5,829 | | | | 7,651 | | | | 6,617 | |
| | — | | | | — | | | | — | | | | — | | | | — | | | | — | | | | — | |
| | | | | | | | | | | | | | | | | | | | | | | | | | |
| | 66,064 | | | | 53,377 | | | | 651,957 | | | | 16,130,266 | | | | 361,661 | | | | 41,619 | | | | 118,517 | |
| | | | | | | | | | | | | | | | | | | | | | | | | | |
| $ | 19,985,892 | | | $ | 4,265,775 | | | $ | 1,408,211 | | | $ | 900,366,489 | | | $ | 7,614,730 | | | $ | 10,244,270 | | | $ | 40,625,262 | |
| | | | | | | | | | | | | | | | | | | | | | | | | | |
| | | | | | |
| | | | | | | | | | | | | | | | | | | | | | | | | | |
| $ | 19,592,256 | | | $ | 4,253,207 | | | $ | 2,095,339 | | | $ | 837,496,187 | | | $ | 7,500,020 | | | $ | 20,399,382 | | | $ | 37,905,160 | |
| | 145,387 | | | | 19,970 | | | | (6,262 | ) | | | 5,475,161 | | | | 22,395 | | | | 64,907 | | | | (339,360 | ) |
| (504,396 | ) | | | (293,807 | ) | | | (587,952 | ) | | | 8,038,289 | | | | 128,431 | | | | (10,823,960 | ) | | | 519,287 | |
|
752,645 |
| | | 286,405 | | | | (92,914 | ) | | | 49,356,852 | | | | (36,116 | ) | | | 603,941 | | | | 2,540,175 | |
| | | | | | | | | | | | | | | | | | | | | | | | | | |
| $ | 19,985,892 | | | $ | 4,265,775 | | | $ | 1,408,211 | | | $ | 900,366,489 | | | $ | 7,614,730 | | | $ | 10,244,270 | | | $ | 40,625,262 | |
| | | | | | | | | | | | | | | | | | | | | | | | | | |
| | | | | | | | | | | | | | | | | | | | | | | | | | |
| $ | 442,476 | | | $ | 1,035,713 | | | $ | 589,592 | | | $ | 141,635 | | | $ | 760,845 | | | $ | 9,727,943 | | | $ | 37,150,974 | |
| | 76,006 | | | | 103,112 | | | | 77,898 | | | | 14,923 | | | | 75,001 | | | | 730,001 | | | | 1,641,193 | |
$ |
5.82 |
| | $ | 10.04 | | | $ | 7.57 | | | $ | 9.49 | | | $ | 10.14 | | | $ | 13.33 | | | $ | 22.64 | |
| | | | | | | | | | | | | | | | | | | | | | | | | | |
| | | | | | | | | | | | | | | | | | | | | | | | | | |
| $ | 19,543,416 | | | $ | 3,230,062 | | | $ | 818,619 | | | $ | 900,224,854 | | | $ | 6,853,885 | | | $ | 516,327 | | | $ | 3,474,288 | |
| | 3,355,383 | | | | 322,129 | | | | 107,848 | | | | 94,611,480 | | | | 675,001 | | | | 38,980 | | | | 154,016 | |
$ |
5.82 |
| | $ | 10.03 | | | $ | 7.59 | | | $ | 9.51 | | | $ | 10.15 | | | $ | 13.25 | | | $ | 22.56 | |
| | | | | | | | | | | | | | | | | | | | | | | | | | |
See accompanying Notes to Financial Statements.
| | |
| |
| For the Six Months Ended April 30, 2016 | | |
| |
| Statements of Operations (unaudited) | | |
| | | | | | | | |
| | |
| | | Cornerstone
Large Cap
Value Fund | | | Fairpointe
Focused
Equity Fund | |
| | | | | | | | |
INVESTMENT INCOME: | | | | | | | | |
Dividends | | $ | 1,239,487 | | | $ | 66,563 | |
Less: foreign taxes withheld | | | (21,209 | ) | | | — | |
| | | | | | | | |
Total investment income | | | 1,218,278 | | | | 66,563 | |
| | | | | | | | |
EXPENSES: | | | | | | | | |
Investment advisory fees (Note G) | | | 360,920 | | | | 24,834 | |
Distribution expenses (Note G)(b) | | | 64,971 | | | | 2,711 | |
Transfer agent fees | | | 60,500 | | | | 14,504 | |
Administration fees (Note G) | | | 28,965 | | | | 8,365 | |
Custodian fees | | | 11,319 | | | | 1,285 | |
Audit and tax fees | | | 11,109 | | | | 9,327 | |
Legal fees | | | 2,204 | | | | 112 | |
Registration expenses | | | 19,891 | | | | 14,420 | |
Amortization of offering costs (Note B-14) | | | — | | | | 6,131 | |
Reports to shareholder expense | | | 5,647 | | | | 189 | |
Trustees fees (Note G) | | | 4,814 | | | | 244 | |
Other expenses | | | 4,092 | | | | 1,111 | |
| | | | | | | | |
Total expenses before waivers/reimbursement | | | 574,432 | | | | 83,233 | |
| | | | | | | | |
Less: Investment advisory fees waived (Note G) | | | (43,914 | ) | | | (24,834 | ) |
Less: Expenses reimbursed (Note G) | | | — | | | | (27,750 | ) |
| | | | | | | | |
Net expenses | | | 530,518 | | | | 30,649 | |
| | | | | | | | |
NET INVESTMENT INCOME (LOSS) | | | 687,760 | | | | 35,914 | |
| | | | | | | | |
NET REALIZED AND UNREALIZED GAIN (LOSS) ON INVESTMENTS: | | | | | | | | |
Net realized gain (loss) on investments | | | (6,597,658 | ) | | | (96,901 | ) |
Net change in unrealized appreciation (depreciation) on investments | | | 2,512,682 | | | | 35,873 | |
| | | | | | | | |
NET REALIZED AND UNREALIZED GAIN (LOSS) ON INVESTMENTS | | | (4,084,976 | ) | | | (61,028 | ) |
| | | | | | | | |
| | |
NET INCREASE (DECREASE) IN NET ASSETS FROM OPERATIONS | | $ | (3,397,216 | ) | | $ | (25,114 | ) |
| | | | | | | | |
| (a) | The commencement of investment operations for the River Road Focused Absolute Value Fund was November 3, 2015. |
| (b) | Distribution expense is incurred at the Class N level for all funds except the Montag & Caldwell Growth Fund. The distribution expenses for Class N and R of the Montag & Caldwell Growth Fund are $933,527 and $14,353, respectively. |
See accompanying Notes to Financial Statements.
| | | | | | | | | | | | | | | | | | | | | | | | | | |
| | | | | | |
River Road
Focused Absolute
Value Fund(a) | | | Herndon
Large Cap
Value Fund | | | Montag & Caldwell
Growth Fund | | | River Road
Dividend All
Cap Value Fund | | | River Road
Dividend All Cap
Value Fund II | | | Fairpointe
Mid Cap Fund | | | Montag & Caldwell
Mid Cap
Growth Fund | |
| | | | | | | | | | | | | | | | | | | | | | | | | | |
| | | | | | | | | | | | | | | | | | | | | | | | | | |
| $ | 49,851 | | | $ | 1,239,424 | | | $ | 11,924,814 | | | $ | 12,078,599 | | | $ | 1,871,061 | | | $ | 32,794,276 | | | $ | 32,465 | |
| | — | | | | — | | | | — | | | | (55,895 | ) | | | (8,976 | ) | | | (86,929 | ) | | | (103 | ) |
| | | | | | | | | | | | | | | | | | | | | | | | | | |
| | 49,851 | | | | 1,239,424 | | | | 11,924,814 | | | | 12,022,704 | | | | 1,862,085 | | | | 32,707,347 | | | | 32,362 | |
| | | | | | | | | | | | | | | | | | | | | | | | | | |
| | | | | | | | | | | | | | | | | | | | | | | | | | |
| | 17,877 | | | | 381,329 | | | | 6,105,549 | | | | 2,517,932 | | | | 397,691 | | | | 13,934,148 | | | | 44,100 | |
| | 180 | | | | 8,990 | | | | 947,880 | | | | 249,676 | | | | 3,505 | | | | 2,027,148 | | | | 5,628 | |
| | 13,560 | | | | 53,741 | | | | 816,885 | | | | 305,354 | | | | 48,734 | | | | 1,746,325 | | | | 14,942 | |
| | 8,577 | | | | 30,457 | | | | 415,279 | | | | 169,429 | | | | 32,837 | | | | 916,301 | | | | 9,694 | |
| | 4,493 | | | | 5,655 | | | | 33,004 | | | | 16,109 | | | | 4,437 | | | | 72,905 | | | | 1,561 | |
| | 9,277 | | | | 9,477 | | | | 16,347 | | | | 11,632 | | | | 11,632 | | | | 16,351 | | | | 9,327 | |
| | 86 | | | | 2,120 | | | | 37,055 | | | | 14,907 | | | | 2,161 | | | | 82,256 | | | | 196 | |
| | 15,329 | | | | 18,398 | | | | 47,739 | | | | 23,372 | | | | 21,383 | | | | 55,694 | | | | 14,919 | |
| | 29,731 | | | | — | | | | — | | | | — | | | | — | | | | — | | | | — | |
| | 97 | | | | 3,868 | | | | 116,180 | | | | 23,467 | | | | 3,785 | | | | 291,146 | | | | 293 | |
| | 191 | | | | 4,634 | | | | 81,017 | | | | 31,911 | | | | 4,723 | | | | 179,108 | | | | 426 | |
| | 1,071 | | | | 3,965 | | | | 57,852 | | | | 22,351 | | | | 4,006 | | | | 90,920 | | | | 1,264 | |
| | | | | | | | | | | | | | | | | | | | | | | | | | |
| | 100,469 | | | | 522,634 | | | | 8,674,787 | | | | 3,386,140 | | | | 534,894 | | | | 19,412,302 | | | | 102,350 | |
| | | | | | | | | | | | | | | | | | | | | | | | | | |
| | (17,877 | ) | | | (25,721 | ) | | | — | | | | — | | | | — | | | | — | | | | (44,100 | ) |
| | (63,258 | ) | | | — | | | | — | | | | — | | | | — | | | | — | | | | (740 | ) |
| | | | | | | | | | | | | | | | | | | | | | | | | | |
| | 19,334 | | | | 496,913 | | | | 8,674,787 | | | | 3,386,140 | | | | 534,894 | | | | 19,412,302 | | | | 57,510 | |
| | | | | | | | | | | | | | | | | | | | | | | | | | |
| | 30,517 | | | | 742,511 | | | | 3,250,027 | | | | 8,636,564 | | | | 1,327,191 | | | | 13,295,045 | | | | (25,148 | ) |
| | | | | | | | | | | | | | | | | | | | | | | | | | |
| | | | | | | | | | | | | | | | | | | | | | | | | | |
| | 130,570 | | | | (3,263,425 | ) | | | 79,984,561 | | | | 26,495,631 | | | | 181,718 | | | | 171,212,463 | | | | 76,876 | |
| | 371,077 | | | | (3,634,989 | ) | | | (117,201,590 | ) | | | (1,641,108 | ) | | | 4,510,645 | | | | (190,697,929 | ) | | | (79,616 | ) |
| | | | | | | | | | | | | | | | | | | | | | | | | | |
| | 501,647 | | | | (6,898,414 | ) | | | (37,217,029 | ) | | | 24,854,523 | | | | 4,692,363 | | | | (19,485,466 | ) | | | (2,740 | ) |
| | | | | | | | | | | | | | | | | | | | | | | | | | |
| | | | | | |
| $ | 532,164 | | | $ | (6,155,903 | ) | | $ | (33,967,002 | ) | | $ | 33,491,087 | | | $ | 6,019,554 | | | $ | (6,190,421 | ) | | $ | (27,888 | ) |
| | | | | | | | | | | | | | | | | | | | | | | | | | |
See accompanying Notes to Financial Statements.
| | |
| |
| For the Six Months Ended April 30, 2016 | | |
| |
| Statements of Operations (unaudited) – continued | | |
| | | | | | | | |
| | |
| | | LMCG
Small Cap
Growth Fund | | | River Road
Independent
Value Fund | |
| | | | | | | | |
INVESTMENT INCOME: | | | | | | | | |
Dividends | | $ | 449,334 | | | $ | 599,902 | |
Dividends from affiliated security | | | — | | | | — | |
Less: foreign taxes withheld | | | — | | | | (17,065 | ) |
Interest | | | — | | | | — | |
| | | | | | | | |
Total investment income | | | 449,334 | | | | 582,837 | |
| | | | | | | | |
EXPENSES: | | | | | | | | |
Investment advisory fees (Note G) | | | 919,567 | | | | 1,741,899 | |
Distribution expenses (Note G)(a) | | | 148,530 | | | | 310,241 | |
Transfer agent fees | | | 110,547 | | | | 182,575 | |
Administration fees (Note G) | | | 49,361 | | | | 84,424 | |
Custodian fees | | | 8,141 | | | | 7,670 | |
Audit and tax fees | | | 9,328 | | | | 9,328 | |
Legal fees | | | 4,125 | | | | 6,484 | |
Registration expenses | | | 35,803 | | | | 21,383 | |
Reports to shareholder expense | | | 16,730 | | | | 30,006 | |
Trustees fees (Note G) | | | 9,018 | | | | 14,172 | |
Other expenses | | | 6,551 | | | | 10,505 | |
| | | | | | | | |
Total expenses before waivers | | | 1,317,701 | | | | 2,418,687 | |
| | | | | | | | |
Less: Investment advisory fees waived (Note G) | | | (157,648 | ) | | | (70,424 | ) |
| | | | | | | | |
Net expenses | | | 1,160,053 | | | | 2,348,263 | |
| | | | | | | | |
NET INVESTMENT INCOME (LOSS) | | | (710,719 | ) | | | (1,765,426 | ) |
| | | | | | | | |
NET REALIZED AND UNREALIZED GAIN (LOSS) ON INVESTMENTS: | | | | | | | | |
Net realized gain (loss) on investments | | | (32,433,820 | ) | | | 1,209,696 | |
Net realized gain (loss) on purchased options | | | — | | | | — | |
Net realized gain (loss) on written options | | | — | | | | — | |
Net realized gain (loss) on affiliated investments | | | — | | | | — | |
Net change in unrealized appreciation (depreciation) on investments | | | (1,662,031 | ) | | | 30,326,683 | |
Net change in unrealized appreciation on purchased options | | | — | | | | — | |
Net change in unrealized appreciation on written options | | | — | | | | — | |
| | | | | | | | |
NET REALIZED AND UNREALIZED GAIN (LOSS) ON INVESTMENTS | | | (34,095,851 | ) | | | 31,536,379 | |
| | | | | | | | |
| | |
NET INCREASE (DECREASE) IN NET ASSETS FROM OPERATIONS | | $ | (34,806,570 | ) | | $ | 29,770,953 | |
| | | | | | | | |
| (a) | Distribution expense is incurred at the Class N level. |
| (b) | Includes net realized gains of $34,395,511 relating to a redemption in-kind. For tax purposes, no gain or losses will be recognized. |
See accompanying Notes to Financial Statements.
| | | | | | | | | | | | | | | | | | | | | | | | | | |
| | | | | | |
River Road
Select Value
Fund | | | River Road
Small Cap
Value Fund | | | Silvercrest
Small Cap
Fund | | | Small Cap
Fund | | | DoubleLine Core
Plus Fixed
Income Fund | | | TCH
Fixed Income
Fund | | | Anchor Capital
Enhanced Equity
Fund | |
| | | | | | | | | | | | | | | | | | | | | | | | | | |
| | | | | | | | | | | | | | | | | | | | | | | | | | |
| $ | 295,703 | | | $ | 1,454,961 | | | $ | 1,452,656 | | | $ | 666,051 | | | $ | 98,874 | | | $ | 4,180 | | | $ | 2,612,511 | |
| | — | | | | — | | | | — | | | | — | | | | 146,339 | | | | — | | | | — | |
| | (559 | ) | | | (21,845 | ) | | | — | | | | (3,719 | ) | | | — | | | | — | | | | — | |
| | — | | | | — | | | | — | | | | — | | | | 10,824,725 | | | | 851,920 | | | | — | |
| | | | | | | | | | | | | | | | | | | | | | | | | | |
| | 295,144 | | | | 1,433,116 | | | | 1,452,656 | | | | 662,332 | | | | 11,069,938 | | | | 856,100 | | | | 2,612,511 | |
| | | | | | | | | | | | | | | | | | | | | | | | | | |
| | | | | | | | | | | | | | | | | | | | | | | | | | |
| | 257,808 | | | | 1,119,318 | | | | 816,344 | | | | 912,237 | | | | 1,624,091 | | | | 125,326 | | | | 467,916 | |
| | 5,695 | | | | 25,605 | | | | 23,243 | | | | 100,351 | | | | 315,683 | | | | 41,316 | | | | 88,106 | |
| | 57,086 | | | | 124,968 | | | | 45,154 | | | | 137,436 | | | | 221,639 | | | | 34,365 | | | | 84,343 | |
| | 19,742 | | | | 63,413 | | | | 44,043 | | | | 53,834 | | | | 179,769 | | | | 24,524 | | | | 39,097 | |
| | 7,010 | | | | 7,813 | | | | 5,099 | | | | 13,424 | | | | 21,961 | | | | 3,482 | | | | 31,833 | |
| | 11,109 | | | | 11,109 | | | | 9,328 | | | | 11,259 | | | | 17,063 | | | | 13,053 | | | | 10,462 | |
| | 1,718 | | | | 4,797 | | | | 2,937 | | | | 4,952 | | | | 9,539 | | | | 880 | | | | 3,078 | |
| | 16,409 | | | | 20,388 | | | | 18,897 | | | | 19,891 | | | | 46,350 | | | | 16,260 | | | | 19,891 | |
| | 4,531 | | | | 8,356 | | | | 5,836 | | | | 18,637 | | | | 28,945 | | | | 1,511 | | | | 11,493 | |
| | 3,757 | | | | 10,485 | | | | 6,414 | | | | 11,170 | | | | 19,520 | | | | 1,924 | | | | 6,730 | |
| | 3,345 | | | | 7,671 | | | | 5,020 | | | | 9,969 | | | | 8,469 | | | | 1,653 | | | | 4,181 | |
| | | | | | | | | | | | | | | | | | | | | | | | | | |
| | 388,210 | | | | 1,403,923 | | | | 982,315 | | | | 1,293,160 | | | | 2,493,029 | | | | 264,294 | | | | 767,130 | |
| | | | | | | | | | | | | | | | | | | | | | | | | | |
| | (60,254 | ) | | | — | | | | (20,276 | ) | | | (7,899 | ) | | | (139,850 | ) | | | (65,749 | ) | | | — | |
| | | | | | | | | | | | | | | | | | | | | | | | | | |
| | 327,956 | | | | 1,403,923 | | | | 962,039 | | | | 1,285,261 | | | | 2,353,179 | | | | 198,545 | | | | 767,130 | |
| | | | | | | | | | | | | | | | | | | | | | | | | | |
| | (32,812 | ) | | | 29,193 | | | | 490,617 | | | | (622,929 | ) | | | 8,716,759 | | | | 657,555 | | | | 1,845,381 | |
| | | | | | | | | | | | | | | | | | | | �� | | | | | | |
| | | | | | | | | | | | | | | | | | | | | | | | | | |
| | 2,448,852 | | | | 7,682,032 | | | | (2,455,033 | ) | | | 47,314,702(b | ) | | | (369,812 | ) | | | (72,646 | ) | | | 5,160,542 | |
| | — | | | | — | | | | — | | | | — | | | | — | | | | — | | | | (3,967,674 | ) |
| | — | | | | — | | | | — | | | | — | | | | — | | | | — | | | | (2,878,072 | ) |
| | — | | | | — | | | | — | | | | — | | | | (11,380 | ) | | | — | | | | — | |
| | (2,117,604 | ) | | | (5,352,382 | ) | | | 992,769 | | | | (68,352,360 | ) | | | 6,566,372 | | | | 373,611 | | | | (2,077,299 | ) |
| | — | | | | — | | | | — | | | | — | | | | — | | | | — | | | | 561,931 | |
| | — | | | | — | | | | — | | | | — | | | | — | | | | — | | | | 709,798 | |
| | | | | | | | | | | | | | | | | | | | | | | | | | |
| | 331,248 | | | | 2,329,650 | | | | (1,462,264 | ) | | | (21,037,658 | ) | | | 6,185,180 | | | | 300,965 | | | | (2,490,774 | ) |
| | | | | | | | | | | | | | | | | | | | | | | | | | |
| | | | | | |
| $ | 298,436 | | | $ | 2,358,843 | | | $ | (971,647 | ) | | $ | (21,660,587 | ) | | $ | 14,901,939 | | | $ | 958,520 | | | $ | (645,393 | ) |
| | | | | | | | | | | | | | | | | | | | | | | | | | |
See accompanying Notes to Financial Statements.
| | |
| |
| For the Six Months Ended April 30, 2016 | | |
| |
| Statements of Operations (unaudited) – continued | | |
| | | | | | | | |
| | |
| | | Lake Partners
LASSO Alternatives
Fund | | | River Road
Long-Short
Fund | |
| | | | | | | | |
INVESTMENT INCOME: | | | | | | | | |
Dividends | | $ | 1,847,955 | | | $ | 513,169 | |
Less: foreign taxes withheld | | | — | | | | (12,719 | ) |
Interest | | | — | | | | 3,345 | |
| | | | | | | | |
Total investment income | | | 1,847,955 | | | | 503,795 | |
| | | | | | | | |
EXPENSES: | | | | | | | | |
Investment advisory fees (Note G) | | | 818,563 | | | | 310,547 | |
Distribution expenses (Note G)(b) | | | 46,662 | | | | 21,584 | |
Transfer agent fees | | | 85,647 | | | | 49,469 | |
Administration fees (Note G) | | | 43,733 | | | | 19,880 | |
Custodian fees | | | 4,050 | | | | 7,579 | |
Audit and tax fees | | | 10,461 | | | | 10,984 | |
Legal fees | | | 3,759 | | | | 1,408 | |
Registration expenses | | | 34,809 | | | | 18,897 | |
Interest and dividend expense on securities sold-short | | | — | | | | 428,613 | |
Amortization of offering costs (Note B-14) | | | — | | | | — | |
Reports to shareholder expense | | | 9,038 | | | | 5,323 | |
Trustees fees (Note G) | | | 8,221 | | | | 3,078 | |
Other expenses | | | 5,259 | | | | 3,031 | |
| | | | | | | | |
Total expenses before waivers/reimbursement/recoupment | | | 1,070,202 | | | | 880,393 | |
| | | | | | | | |
Less: Investment advisory fees waived (Note G) | | | (82,193 | ) | | | (54,952 | ) |
Less: Expenses reimbursed (Note G) | | | — | | | | — | |
Plus: Net expenses recouped (Note G) | | | — | | | | — | |
| | | | | | | | |
Net expenses | | | 988,009 | | | | 825,441 | |
| | | | | | | | |
NET INVESTMENT INCOME (LOSS) | | | 859,946 | | | | (321,646 | ) |
| | | | | | | | |
NET REALIZED AND UNREALIZED GAIN (LOSS) ON INVESTMENTS: | | | | | | | | |
Net realized gain (loss) on investments | | | 383,411 | | | | (2,062,053 | ) |
Net realized loss on securities sold short | | | — | | | | (170,263 | ) |
Net realized gain (loss) on foreign currency transactions | | | — | | | | 3,973 | |
Capital gain distributions received | | | 2,861,756 | | | | — | |
Net change in unrealized appreciation (depreciation) on investments | | | (7,369,341 | ) | | | 307,523 | |
Net change in unrealized appreciation on securities sold short | | | — | | | | 767,645 | |
Net change in unrealized appreciation (depreciation) on translation of assets and liabilities denominated in foreign currency | | | — | | | | 1,199 | |
| | | | | | | | |
NET REALIZED AND UNREALIZED GAIN (LOSS) ON INVESTMENTS | | | (4,124,174 | ) | | | (1,151,976 | ) |
| | | | | | | | |
| | |
NET INCREASE (DECREASE) IN NET ASSETS FROM OPERATIONS | | $ | (3,264,228 | ) | | $ | (1,473,622 | ) |
| | | | | | | | |
| (a) | The commencement of investment operations for the Value Partners Asia Dividend Fund was December 16, 2015. |
| (b) | Distribution expense is incurred at the Class N level. |
See accompanying Notes to Financial Statements.
| | | | | | | | | | | | | | | | | | | | | | | | | | |
| | | | | | |
Barings
International
Fund | | | Guardian
Capital Global
Dividend Fund | | | LMCG
Emerging
Markets Fund | | | Pictet
International
Fund | | | Value Partners
Asia Dividend
Fund(a) | | | Harrison Street
Real Estate
Fund | | | Montag & Caldwell
Balanced Fund | |
| | | | | | | | | | | | | | | | | | | | | | | | | | |
| | | | | | | | | | | | | | | | | | | | | | | | | | |
| $ | 280,254 | | | $ | 79,599 | | | $ | 17,481 | | | $ | 8,795,325 | | | $ | 59,612 | | | $ | 134,257 | | | $ | 143,006 | |
| | (20,886 | ) | | | (4,984 | ) | | | (2,399 | ) | | | (737,944 | ) | | | (5,296 | ) | | | — | | | | — | |
| | — | | | | — | | | | — | | | | — | | | | — | | | | — | | | | 138,069 | |
| | | | | | | | | | | | | | | | | | | | | | | | | | |
| | 259,368 | | | | 74,615 | | | | 15,082 | | | | 8,057,381 | | | | 54,316 | | | | 134,257 | | | | 281,075 | |
| | | | | | | | | | | | | | | | | | | | | | | | | | |
| | | | | | | | | | | | | | | | | | | | | | | | | | |
| | 97,655 | | | | 16,636 | | | | 9,982 | | | | 2,002,527 | | | | 24,450 | | | | 51,041 | | | | 130,739 | |
| | 494 | | | | 1,262 | | | | 700 | | | | 1,078 | | | | 679 | | | | 12,138 | | | | 15,538 | |
| | 20,508 | | | | 12,108 | | | | 12,225 | | | | 194,999 | | | | 9,513 | | | | 19,279 | | | | 25,587 | |
| | 22,318 | | | | 14,516 | | | | 22,323 | | | | 113,542 | | | | 16,310 | | | | 9,213 | | | | 16,754 | |
| | 17,338 | | | | 1,603 | | | | 20,462 | | | | 29,337 | | | | 18,610 | | | | 2,745 | | | | 2,262 | |
| | 11,109 | | | | 11,109 | | | | 12,751 | | | | 11,109 | | | | 9,595 | | | | 9,850 | | | | 13,053 | |
| | 357 | | | | 76 | | | | 37 | | | | 5,142 | | | | 118 | | | | 303 | | | | 516 | |
| | 14,919 | | | | 13,923 | | | | 15,416 | | | | 23,130 | | | | 8,500 | | | | 14,420 | | | | 15,415 | |
| | — | | | | — | | | | — | | | | — | | | | — | | | | — | | | | — | |
| | — | | | | — | | | | — | | | | — | | | | 28,276 | | | | — | | | | — | |
| | 415 | | | | 91 | | | | 51 | | | | 6,236 | | | | 138 | | | | 950 | | | | 965 | |
| | 781 | | | | 164 | | | | 80 | | | | 7,316 | | | | 207 | | | | 419 | | | | 1,127 | |
| | 1,366 | | | | 1,073 | | | | 1,034 | | | | 4,511 | | | | 1,578 | | | | 1,182 | | | | 1,523 | |
| | | | | | | | | | | | | | | | | | | | | | | | | | |
| | 187,260 | | | | 72,561 | | | | 95,061 | | | | 2,398,927 | | | | 117,974 | | | | 121,540 | | | | 223,479 | |
| | | | | | | | | | | | | | | | | | | | | | | | | | |
| | (74,463 | ) | | | (16,636 | ) | | | (9,982 | ) | | | — | | | | (24,450 | ) | | | (51,041 | ) | | | (16,191 | ) |
| | — | | | | (32,828 | ) | | | (73,161 | ) | | | — | | | | (61,603 | ) | | | (1,193 | ) | | | — | |
| | — | | | | — | | | | — | | | | 160,935 | | | | — | | | | — | | | | — | |
| | | | | | | | | | | | | | | | | | | | | | | | | | |
| | 112,797 | | | | 23,097 | | | | 11,918 | | | | 2,559,862 | | | | 31,921 | | | | 69,306 | | | | 207,288 | |
| | | | | | | | | | | | | | | | | | | | | | | | | | |
| | 146,571 | | | | 51,518 | | | | 3,164 | | | | 5,497,519 | | | | 22,395 | | | | 64,951 | | | | 73,787 | |
| | | | | | | | | | | | | | | | | | | | | | | | | | |
| | | | | | | | | | | | | | | | | | | | | | | | | | |
| | (372,108 | ) | | | (172,922 | ) | | | (117,366 | ) | | | 7,128,780 | | | | 132,897 | | | | 149,829 | | | | 526,857 | |
| | — | | | | — | | | | — | | | | — | | | | — | | | | — | | | | — | |
| | (3,773 | ) | | | (584 | ) | | | (900 | ) | | | 1,141,808 | | | | (4,466 | ) | | | — | | | | — | |
| | — | | | | — | | | | — | | | | — | | | | — | | | | — | | | | — | |
| | (594,773 | ) | | | 70,850 | | | | 59,361 | | | | 49,026,434 | | | | (35,997 | ) | | | 285,563 | | | | (382,679 | ) |
| | — | | | | — | | | | — | | | | — | | | | — | | | | — | | | | — | |
|
9,716 |
| | | 263 | | | | 73 | | | | 186,898 | | | | (119 | ) | | | — | | | | — | |
| | | | | | | | | | | | | | | | | | | | | | | | | | |
| | (960,938 | ) | | | (102,393 | ) | | | (58,832 | ) | | | 57,483,920 | | | | 92,315 | | | | 435,392 | | | | 144,178 | |
| | | | | | | | | | | | | | | | | | | | | | | | | | |
| | | | | | |
| $ | (814,367 | ) | | $ | (50,875 | ) | | $ | (55,668 | ) | | $ | 62,981,439 | | | $ | 114,710 | | | $ | 500,343 | | | $ | 217,965 | |
| | | | | | | | | | | | | | | | | | | | | | | | | | |
See accompanying Notes to Financial Statements.
| | |
| |
| | |
| |
| Statements of Changes in Net Assets | | |
| | | | | | | | | | | | | | | | |
| | |
| | | Cornerstone Large Cap
Value Fund | | | Fairpointe Focused
Equity Fund | |
| | | Six Months Ended April 30, 2016 | | | Year Ended | | | Six Months Ended April 30, 2016 | | | Period Ended | |
| | | (unaudited) | | | October 31, 2015 | | | (unaudited) | | | October 31, 2015(a) | |
| | | | | | | | | | | | | | | | |
NET ASSETS at Beginning of Period | | $ | 130,044,602 | | | $ | 163,910,660 | | | $ | 6,456,792 | | | $ | — | |
| | | | | | | | | | | | | | | | |
Increase (decrease) in net assets from operations: | | | | | | | | | | | | | | | | |
Net investment income | | | 687,760 | | | | 1,557,677 | | | | 35,914 | | | | 42,552 | |
Net realized gain (loss) on investments | | | (6,597,658 | ) | | | 1,649,684 | | | | (96,901 | ) | | | (137,629 | ) |
Net change in unrealized appreciation (depreciation) on investments | | | 2,512,682 | | | | (18,638,883 | ) | | | 35,873 | | | | (320,441 | ) |
| | | | | | | | | | | | | | | | |
Net increase (decrease) in net assets from operations | | | (3,397,216 | ) | | | (15,431,522 | ) | | | (25,114 | ) | | | (415,518 | ) |
| | | | | | | | | | | | | | | | |
Distributions to shareholders from: | | | | | | | | | | | | | | | | |
Net investment income: | | | | | | | | | | | | | | | | |
Class N | | | (601,599 | ) | | | (453,376 | ) | | | (21,065 | ) | | | — | |
Class I | | | (775,199 | ) | | | (916,253 | ) | | | (46,607 | ) | | | — | |
Class R | | | — | | | | — | | | | — | | | | — | |
Net realized gain on investments: | | | | | | | | | | | | | | | | |
Class N | | | — | | | | — | | | | — | | | | — | |
Class I | | | — | | | | — | | | | — | | | | — | |
Class R | | | — | | | | — | | | | — | | | | — | |
| | | | | | | | | | | | | | | | |
Total distributions | | | (1,376,798 | ) | | | (1,369,629 | ) | | | (67,672 | ) | | | — | |
| | | | | | | | | | | | | | | | |
Capital share transactions: | | | | | | | | | | | | | | | | |
Proceeds from sales of shares: | | | | | | | | | | | | | | | | |
Class N | | | 2,562,297 | | | | 25,360,315 | | | | 118,201 | | | | 2,662,257(b | ) |
Class I | | | 1,984,057 | | | | 15,432,813 | | | | 233,940 | | | | 4,383,700(b | ) |
Class R | | | — | | | | — | | | | — | | | | — | |
Proceeds from reinvestment of distributions: | | | | | | | | | | | | | | | | |
Class N | | | 599,118 | | | | 443,961 | | | | 21,065 | | | | — | |
Class I | | | 772,089 | | | | 892,106 | | | | 46,607 | | | | — | |
Class R | | | — | | | | — | | | | — | | | | — | |
Cost of shares redeemed: | | | | | | | | | | | | | | | | |
Class N | | | (10,379,706 | ) | | | (21,728,149 | ) | | | (152,535 | ) | | | (173,637 | ) |
Class I | | | (40,250,857 | ) | | | (37,465,953 | ) | | | — | | | | (10 | ) |
Class R | | | — | | | | — | | | | — | | | | — | |
| | | | | | | | | | | | | | | | |
Net increase (decrease) from capital share transactions | | | (44,713,002 | ) | | | (17,064,907 | ) | | | 267,278 | | | | 6,872,310 | |
| | | | | | | | | | | | | | | | |
Total increase (decrease) in net assets | | | (49,487,016 | ) | | | (33,866,058 | ) | | | 174,492 | | | | 6,456,792 | |
| | | | | | | | | | | | | | | | |
NET ASSETS at End of Period | | $ | 80,557,586 | | | $ | 130,044,602 | | | $ | 6,631,284 | | | $ | 6,456,792 | |
| | | | | | | | | | | | | | | | |
Undistributed net investment income | | $ | 310,850 | | | $ | 999,888 | | | $ | 22,272 | | | $ | 54,030 | |
| | | | | | | | | | | | | | | | |
| (a) | The commencement of investment operations for the Fairpointe Focused Equity Fund was December 23, 2014. |
| (b) | Fairpointe Focused Equity Fund had a subscription in-kind in the amount of $2,333,718 on December 24, 2014. The subscription was composed of securities, cash and dividends accrued in the amounts of $2,305,531, $26,148 and $2,039, respectively. |
| (c) | The commencement of investment operations for the River Road Focused Absolute Value Fund was November 3, 2015. |
| (d) | River Road Focused Absolute Value Fund had a subscription in-kind in the amount of $3,663,463 on November 3, 2015. The subscription was composed of securities, cash and dividends accrued in the amounts of $3,632,219, $26,056 and $5,188, respectively. |
See accompanying Notes to Financial Statements.
| | | | | | | | | | | | | | | | | | |
| | |
River Road Focused
Absolute Value Fund | | | Herndon Large Cap
Value Fund | | | Montag & Caldwell
Growth Fund | |
Period Ended
April 30, 2016(c)
(unaudited) | | | Six Months Ended
April 30, 2016
(unaudited) | | | Year Ended
October 31, 2015 | | | Six Months Ended
April 30, 2016
(unaudited) | | | Year Ended
October 31, 2015 | |
| | | | | | | | | | | | | | | | | | |
| | | | | | | | | | | | | | | | | | |
| $ | — | | | $ | 120,540,055 | | | $ | 153,445,046 | | | $ | 2,185,832,613 | | | $ | 4,136,667,896 | |
| | | | | | | | | | | | | | | | | | |
| | | | | | | | | | | | | | | | | | |
| | 30,517 | | | | 742,511 | | | | 1,220,697 | | | | 3,250,027 | | | | 13,058,911 | |
| | 130,570 | | | | (3,263,425 | ) | | | (5,778 | ) | | | 79,984,561 | | | | 646,002,403 | |
| 371,077 | | | | (3,634,989 | ) | | | (9,545,604 | ) | | | (117,201,590 | ) | | | (401,880,540 | ) |
| | | | | | | | | | | | | | | | | | |
| 532,164 | | | | (6,155,903 | ) | | | (8,330,685 | ) | | | (33,967,002 | ) | | | 257,180,774 | |
| | | | | | | | | | | | | | | | | | |
| | | | | | | | | | | | | | | | | | |
| | | | | | | | | | | | | | | | | | |
| | — | | | | (64,019 | ) | | | (45,033 | ) | | | (2,341,331 | ) | | | (2,061,261 | ) |
| | — | | | | (1,134,426 | ) | | | (1,262,041 | ) | | | (5,950,061 | ) | | | (15,765,431 | ) |
| | — | | | | — | | | | — | | | | (3,417 | ) | | | (2,777 | ) |
| | | | | | | | | | | | | | | | | | |
| | — | | | | (11,330 | ) | | | (823,682 | ) | | | (195,686,596 | ) | | | (212,615,826 | ) |
| | — | | | | (145,582 | ) | | | (7,930,253 | ) | | | (256,099,119 | ) | | | (439,875,741 | ) |
| | — | | | | — | | | | — | | | | (1,528,281 | ) | | | (1,298,521 | ) |
| | | | | | | | | | | | | | | | | | |
| | — | | | | (1,355,357 | ) | | | (10,061,009 | ) | | | (461,608,805 | ) | | | (671,619,557 | ) |
| | | | | | | | | | | | | | | | | | |
| | | | | | | | | | | | | | | | | | |
| | | | | | | | | | | | | | | | | | |
| | 206,842(d | ) | | | 1,044,313 | | | | 2,861,832 | | | | 110,732,045 | | | | 186,556,494 | |
| | 8,821,137(d | ) | | | 9,683,283 | | | | 20,901,274 | | | | 154,668,492 | | | | 241,907,926 | |
| | — | | | | — | | | | — | | | | 1,127,779 | | | | 914,418 | |
| | | | | | | | | | | | | | | | | | |
| | — | | | | 75,280 | | | | 868,259 | | | | 192,258,234 | | | | 209,112,111 | |
| | — | | | | 1,145,007 | | | | 8,623,751 | | | | 199,997,475 | | | | 365,652,584 | |
| | — | | | | — | | | | — | | | | 1,315,758 | | | | 1,092,345 | |
| | | | | | | | | | | | | | | | | | |
| | (232 | ) | | | (2,636,083 | ) | | | (7,618,749 | ) | | | (205,469,433 | ) | | | (769,717,997 | ) |
| | (226,217 | ) | | | (33,424,470 | ) | | | (40,149,664 | ) | | | (532,778,108 | ) | | | (1,768,877,865 | ) |
| | — | | | | — | | | | — | | | | (886,807 | ) | | | (3,036,516 | ) |
| | | | | | | | | | | | | | | | | | |
| 8,801,530 | | | | (24,112,670 | ) | | | (14,513,297 | ) | | | (79,034,565 | ) | | | (1,536,396,500 | ) |
| | | | | | | | | | | | | | | | | | |
| | 9,333,694 | | | | (31,623,930 | ) | | | (32,904,991 | ) | | | (574,610,372 | ) | | | (1,950,835,283 | ) |
| | | | | | | | | | | | | | | | | | |
| $ | 9,333,694 | | | $ | 88,916,125 | | | $ | 120,540,055 | | | $ | 1,611,222,241 | | | $ | 2,185,832,613 | |
| | | | | | | | | | | | | | | | | | |
| $ | 30,517 | | | $ | 507,682 | | | $ | 963,616 | | | $ | 942,554 | | | $ | 5,987,336 | |
| | | | | | | | | | | | | | | | | | |
See accompanying Notes to Financial Statements.
| | |
| |
| | |
| |
| Statements of Changes in Net Assets – continued | | |
| | | | | | | | | | | | | | | | |
| | |
| | | River Road Dividend
All Cap Value Fund | | | River Road Dividend
All Cap Value Fund II | |
| | | Six Months Ended
April 30, 2016 | | | Year Ended | | | Six Months Ended
April 30, 2016 | | | Year Ended | |
| | | (unaudited) | | | October 31, 2015 | | | (unaudited) | | | October 31, 2015 | |
| | | | | | | | | | | | | | | | |
NET ASSETS at Beginning of Period | | $ | 849,977,579 | | | $ | 1,138,258,945 | | | $ | 124,343,937 | | | $ | 132,696,953 | |
| | | | | | | | | | | | | | | | |
Increase (decrease) in net assets from operations: | | | | | | | | | | | | | | | | |
Net investment income (loss) | | | 8,636,564 | | | | 17,625,101 | | | | 1,327,191 | | | | 2,517,501 | |
Net realized gain (loss) on investments | | | 26,495,631 | | | | 78,461,890 | | | | 181,718 | | | | 1,871,086 | |
Net change in unrealized appreciation (depreciation) on investments | | | (1,641,108 | ) | | | (92,867,978 | ) | | | 4,510,645 | | | | (4,861,779 | ) |
| | | | | | | | | | | | | | | | |
Net increase (decrease) in net assets from operations | | | 33,491,087 | | | | 3,219,013 | | | | 6,019,554 | | | | (473,192 | ) |
| | | | | | | | | | | | | | | | |
Distributions to shareholders from: | | | | | | | | | | | | | | | | |
Net investment income: | | | | | | | | | | | | | | | | |
Class N | | | (1,338,061 | ) | | | (4,291,181 | ) | | | (22,329 | ) | | | (90,999 | ) |
Class I | | | (3,955,001 | ) | | | (14,028,198 | ) | | | (1,010,640 | ) | | | (2,543,708 | ) |
Net realized gain on investments: | | | | | | | | | | | | | | | | |
Class N | | | (19,557,150 | ) | | | (24,073,946 | ) | | | (41,705 | ) | | | (214,191 | ) |
Class I | | | (49,288,884 | ) | | | (65,111,598 | ) | | | (1,625,842 | ) | | | (3,926,742 | ) |
| | | | | | | | | | | | | | | | |
Total distributions | | | (74,139,096 | ) | | | (107,504,923 | ) | | | (2,700,516 | ) | | | (6,775,640 | ) |
| | | | | | | | | | | | | | | | |
Capital share transactions: | | | | | | | | | | | | | | | | |
Proceeds from sales of shares: | | | | | | | | | | | | | | | | |
Class N | | | 23,557,013 | | | | 41,437,554 | | | | 180,615 | | | | 974,246 | |
Class I | | | 42,308,148 | | | | 90,897,533 | | | | 7,344,585 | | | | 26,220,994 | |
Proceeds from reinvestment of distributions: | | | | | | | | | | | | | | | | |
Class N | | | 20,648,621 | | | | 27,956,925 | | | | 63,713 | | | | 304,395 | |
Class I | | | 44,028,382 | | | | 54,080,077 | | | | 2,386,359 | | | | 6,012,510 | |
Cost of shares redeemed: | | | | | | | | | | | | | | | | |
Class N | | | (37,697,348 | ) | | | (177,421,338 | ) | | | (250,380 | ) | | | (5,131,502 | ) |
Class I | | | (192,124,009 | ) | | | (220,946,207 | ) | | | (18,873,755 | ) | | | (29,484,827 | ) |
| | | | | | | | | | | | | | | | |
Net increase (decrease) from capital share transactions | | | (99,279,193 | ) | | | (183,995,456 | ) | | | (9,148,863 | ) | | | (1,104,184 | ) |
| | | | | | | | | | | | | | | | |
Total increase (decrease) in net assets | | | (139,927,202 | ) | | | (288,281,366 | ) | | | (5,829,825 | ) | | | (8,353,016 | ) |
| | | | | | | | | | | | | | | | |
NET ASSETS at End of Period | | $ | 710,050,377 | | | $ | 849,977,579 | | | $ | 118,514,112 | | | $ | 124,343,937 | |
| | | | | | | | | | | | | | | | |
Undistributed (distributions in excess of) net investment income (loss) | | $ | (323,425 | ) | | $ | (3,666,927 | ) | | $ | (34,277 | ) | | $ | (328,499 | ) |
| | | | | | | | | | | | | | | | |
See accompanying Notes to Financial Statements.
| | | | | | | | | | | | | | | | | | | | | | |
| | |
| Fairpointe Mid Cap Fund | | | Montag & Caldwell Mid Cap
Growth Fund | | | LMCG Small Cap
Growth Fund | |
Six Months Ended
April 30, 2016
(unaudited) | | | Year Ended
October 31, 2015 | | | Six Months Ended
April 30, 2016
(unaudited) | | | Year Ended
October 31, 2015 | | | Six Months Ended
April 30, 2016
(unaudited) | | | Year Ended
October 31, 2015 | |
| | | | | | | | | | | | | | | | | | | | | | |
| $ | 4,700,395,942 | | | $ | 5,963,929,210 | | | $ | 11,053,000 | | | $ | 11,500,265 | | | $ | 231,382,604 | | | $ | 52,181,137 | |
| | | | | | | | | | | | | | | | | | | | | | |
| | | | | | | | | | | | | | | | | | | | | | |
| | 13,295,045 | | | | 23,029,830 | | | | (25,148 | ) | | | (51,489 | ) | | | (710,719 | ) | | | (1,224,794 | ) |
| | 171,212,463 | | | | 314,132,084 | | | | 76,876 | | | | 1,246,022 | | | | (32,433,820 | ) | | | 605,946 | |
| (190,697,929 | ) | | | (558,847,097 | ) | | | (79,616 | ) | | | (713,635 | ) | | | (1,662,031 | ) | | | (11,741,432 | ) |
| | | | | | | | | | | | | | | | | | | | | | |
| (6,190,421 | ) | | | (221,685,183 | ) | | | (27,888 | ) | | | 480,898 | | | | (34,806,570 | ) | | | (12,360,280 | ) |
| | | | | | | | | | | | | | | | | | | | | | |
| | | | | | | | | | | | | | | | | | | | | | |
| | | | | | | | | | | | | | | | | | | | | | |
| | (5,351,086 | ) | | | (2,292,874 | ) | | | — | | | | — | | | | — | | | | — | |
| | (15,653,440 | ) | | | (4,564,241 | ) | | | — | | | | — | | | | — | | | | — | |
| | | | | | | | | | | | | | | | | | | | | | |
| | (95,369,480 | ) | | | (388,644,763 | ) | | | (556,660 | ) | | | (403,184 | ) | | | (26,929 | ) | | | (1,601,490 | ) |
| | (139,128,107 | ) | | | (533,671,049 | ) | | | (693,830 | ) | | | (315,621 | ) | | | (13,737 | ) | | | (873,314 | ) |
| | | | | | | | | | | | | | | | | | | | | | |
| | (255,502,113 | ) | | | (929,172,927 | ) | | | (1,250,490 | ) | | | (718,805 | ) | | | (40,666 | ) | | | (2,474,804 | ) |
| | | | | | | | | | | | | | | | | | | | | | |
| | | | | | | | | | | | | | | | | | | | | | |
| | | | | | | | | | | | | | | | | | | | | | |
| | 139,465,606 | | | | 416,140,464 | | | | 79,896 | | | | 254,809 | | | | 11,603,319 | | | | 163,893,120 | |
| | 375,903,832 | | | | 915,244,322 | | | | 63,857 | | | | 2,248,304 | | | | 28,313,768 | | | | 78,735,146 | |
| | | | | | | | | | | | | | | | | | | | | | |
| | 96,573,843 | | | | 374,916,825 | | | | 553,193 | | | | 401,617 | | | | 26,617 | | | | 1,532,620 | |
| | 133,199,882 | | | | 421,110,375 | | | | 693,830 | | | | 315,621 | | | | 10,674 | | | | 772,122 | |
| | | | | | | | | | | | | | | | | | | | | | |
| | (459,164,661 | ) | | | (876,287,601 | ) | | | (457,502 | ) | | | (3,272,973 | ) | | | (57,333,976 | ) | | | (38,253,671 | ) |
| | (942,581,471 | ) | | | (1,363,799,543 | ) | | | (149,399 | ) | | | (156,736 | ) | | | (33,328,674 | ) | | | (12,642,786 | ) |
| | | | | | | | | | | | | | | | | | | | | | |
| (656,602,969 | ) | | | (112,675,158 | ) | | | 783,875 | | | | (209,358 | ) | | | (50,708,272 | ) | | | 194,036,551 | |
| | | | | | | | | | | | | | | | | | | | | | |
| | (918,295,503 | ) | | | (1,263,533,268 | ) | | | (494,503 | ) | | | (447,265 | ) | | | (85,555,508 | ) | | | 179,201,467 | |
| | | | | | | | | | | | | | | | | | | | | | |
| $ | 3,782,100,439 | | | $ | 4,700,395,942 | | | $ | 10,558,497 | | | $ | 11,053,000 | | | $ | 145,827,096 | | | $ | 231,382,604 | |
| | | | | | | | | | | | | | | | | | | | | | |
$ | 4,357,319 | | | $ | 12,066,800 | | | $ | (69,496 | ) | | $ | (44,348 | ) | | $ | (1,871,818 | ) | | $ | (1,161,099 | ) |
| | | | | | | | | | | | | | | | | | | | | | |
See accompanying Notes to Financial Statements.
| | |
| |
| | |
| |
| Statements of Changes in Net Assets – continued | | |
| | | | | | | | | | | | | | | | |
| | |
| | | River Road
Independent Value Fund | | | River Road
Select Value Fund | |
| | | Six Months Ended
April 30, 2016 | | | Year Ended | | | Six Months Ended
April 30, 2016 | | | Year Ended | |
| | | (unaudited) | | | October 31, 2015 | | | (unaudited) | | | October 31, 2015 | |
| | | | | | | | | | | | | | | | |
NET ASSETS at Beginning of Period | | $ | 355,995,582 | | | $ | 667,238,002 | | | $ | 97,111,333 | | | $ | 184,553,976 | |
| | | | | | | | | | | | | | | | |
Increase (decrease) in net assets from operations: | | | | | | | | | | | | | | | | |
Net investment income (loss) | | | (1,765,426 | ) | | | (4,525,785 | ) | | | (32,812 | ) | | | (384,137 | ) |
Net realized gain (loss) on investments | | | 1,209,696 | | | | (10,441,681 | ) | | | 2,448,852 | | | | 9,998,759 | |
Net change in unrealized appreciation (depreciation) on investments | | | 30,326,683 | | | | 2,361,945 | | | | (2,117,604 | ) | | | (4,782,442 | ) |
| | | | | | | | | | | | | | | | |
Net increase (decrease) in net assets from operations | | | 29,770,953 | | | | (12,605,521 | ) | | | 298,436 | | | | 4,832,180 | |
| | | | | | | | | | | | | | | | |
Distributions to shareholders from: | | | | | | | | | | | | | | | | |
Net investment income: | | | | | | | | | | | | | | | | |
Class N | | | — | | | | — | | | | — | | | | — | |
Class I | | | — | | | | — | | | | (153,030 | ) | | | — | |
Net realized gain on investments: | | | | | | | | | | | | | | | | |
Class N | | | — | | | | (16,133,453 | ) | | | (697,557 | ) | | | (1,302,384 | ) |
Class I | | | — | | | | (18,654,429 | ) | | | (7,272,173 | ) | | | (23,636,785 | ) |
| | | | | | | | | | | | | | | | |
Total distributions | | | — | | | | (34,787,882 | ) | | | (8,122,760 | ) | | | (24,939,169 | ) |
| | | | | | | | | | | | | | | | |
Capital share transactions: | | | | | | | | | | | | | | | | |
Proceeds from sales of shares: | | | | | | | | | | | | | | | | |
Class N | | | 69,801,684 | | | | 58,337,595 | | | | 646,850 | | | | 563,077 | |
Class I | | | 28,092,585 | | | | 24,984,792 | | | | 2,304,464 | | | | 5,734,516 | |
Proceeds from reinvestment of distributions: | | | | | | | | | | | | | | | | |
Class N | | | — | | | | 16,067,708 | | | | 635,124 | | | | 1,186,303 | |
Class I | | | — | | | | 16,055,433 | | | | 7,252,502 | | | | 23,099,814 | |
Cost of shares redeemed: | | | | | | | | | | | | | | | | |
Class N | | | (31,228,210 | ) | | | (96,524,628 | ) | | | (694,015 | ) | | | (4,058,556 | ) |
Class I | | | (43,252,456 | ) | | | (282,769,917 | ) | | | (53,698,000 | ) | | | (93,860,808 | ) |
| | | | | | | | | | | | | | | | |
Net increase (decrease) from capital share transactions | | | 23,413,603 | | | | (263,849,017 | ) | | | (43,553,075 | ) | | | (67,335,654 | ) |
| | | | | | | | | | | | | | | | |
Total increase (decrease) in net assets | | | 53,184,556 | | | | (311,242,420 | ) | | | (51,377,399 | ) | | | (87,442,643 | ) |
| | | | | | | | | | | | | | | | |
NET ASSETS at End of Period | | $ | 409,180,138 | | | $ | 355,995,582 | | | $ | 45,733,934 | | | $ | 97,111,333 | |
| | | | | | | | | | | | | | | | |
Undistributed (distributions in excess of) net investment income (loss) | | $ | (5,401,434 | ) | | $ | (3,636,008 | ) | | $ | (589,968 | ) | | $ | (404,126 | ) |
| | | | | | | | | | | | | | | | |
| (a) | Small Cap Fund had a redemption in-kind on December 1, 2015, in the amount of $142,509,610. The redemption was comprised of securities and cash in the amount of $134,464,305 and $8,045,305, respectively. |
See accompanying Notes to Financial Statements.
| | | | | | | | | | | | | | | | | | | | | | |
| | |
River Road
Small Cap Value Fund | | | Silvercrest
Small Cap Fund | | | Small Cap Fund | |
Six Months Ended
April 30, 2016 | | | Year Ended | | | Six Months Ended
April 30, 2016 | | | Year Ended | | | Six Months Ended
April 30, 2016 | | | Year Ended | |
| (unaudited) | | | October 31, 2015 | | | (unaudited) | | | October 31, 2015 | | | (unaudited) | | | October 31, 2015 | |
| | | | | | | | | | | | | | | | | | | | | | |
| $ | 270,438,198 | | | $ | 299,221,337 | | | $ | 164,463,697 | | | $ | 68,888,134 | | | $ | 548,685,895 | | | $ | 835,868,756 | |
| | | | | | | | | | | | | | | | | | | | | | |
| | | | | | | | | | | | | | | | | | | | | | |
| | 29,193 | | | | (643,900 | ) | | | 490,617 | | | | 289,585 | | | | (622,929 | ) | | | (3,068,930 | ) |
| | 7,682,032 | | | | 16,135,358 | | | | (2,455,033 | ) | | | 5,949,673 | | | | 47,314,702 | | | | 146,503,032 | |
| (5,352,382 | ) | | | (468,319 | ) | | | 992,769 | | | | (3,498,719 | ) | | | (68,352,360 | ) | | | (162,319,947 | ) |
| | | | | | | | | | | | | | | | | | | | | | |
| 2,358,843 | | | | 15,023,139 | | | | (971,647 | ) | | | 2,740,539 | | | | (21,660,587 | ) | | | (18,885,845 | ) |
| | | | | | | | | | | | | | | | | | | | | | |
| | | | | | | | | | | | | | | | | | | | | | |
| | | | | | | | | | | | | | | | | | | | | | |
| | — | | | | — | | | | (50,273 | ) | | | (10,817 | ) | | | — | | | | — | |
| | — | | | | — | | | | (577,200 | ) | | | (144,060 | ) | | | — | | | | — | |
| | | | | | | | | | | | | | | | | | | | | | |
| | (1,286,224 | ) | | | (6,051,268 | ) | | | (734,281 | ) | | | (132,428 | ) | | | (45,712,393 | ) | | | (42,602,557 | ) |
| | (13,941,244 | ) | | | (35,176,931 | ) | | | (5,513,361 | ) | | | (1,405,279 | ) | | | (82,171,807 | ) | | | (51,414,056 | ) |
| | | | | | | | | | | | | | | | | | | | | | |
| | (15,227,468 | ) | | | (41,228,199 | ) | | | (6,875,115 | ) | | | (1,692,584 | ) | | | (127,884,200 | ) | | | (94,016,613 | ) |
| | | | | | | | | | | | | | | | | | | | | | |
| | | | | | | | | | | | | | | | | | | | | | |
| | | | | | | | | | | | | | | | | | | | | | |
| | 1,829,659 | | | | 4,898,671 | | | | 3,014,425 | | | | 14,949,946 | | | | 4,693,834 | | | | 19,025,334 | |
| | 22,148,323 | | | | 51,083,192 | | | | 30,962,348 | | | | 120,581,732 | | | | 27,251,130 | | | | 60,349,910 | |
| | | | | | | | | | | | | | | | | | | | | | |
| | 1,280,134 | | | | 6,025,655 | | | | 784,554 | | | | 143,245 | | | | 44,184,394 | | | | 41,973,876 | |
| | 13,501,050 | | | | 34,115,956 | | | | 6,090,561 | | | | 1,549,338 | | | | 73,187,629 | | | | 49,177,354 | |
| | | | | | | | | | | | | | | | | | | | | | |
| | (6,907,202 | ) | | | (30,860,654 | ) | | | (2,952,507 | ) | | | (2,969,906 | ) | | | (190,811,322 | ) | | | (133,982,290 | ) |
| | (32,531,056 | ) | | | (67,840,899 | ) | | | (16,600,913 | ) | | | (39,726,747 | ) | | | (248,261,256 | )(a) | | | (210,824,587 | ) |
| | | | | | | | | | | | | | | | | | | | | | |
| (679,092 | ) | | | (2,578,079 | ) | | | 21,298,468 | | | | 94,527,608 | | | | (289,755,591 | ) | | | (174,280,403 | ) |
| | | | | | | | | | | | | | | | | | | | | | |
| | (13,547,717 | ) | | | (28,783,139 | ) | | | 13,451,706 | | | | 95,575,563 | | | | (439,300,378 | ) | | | (287,182,861 | ) |
| | | | | | | | | | | | | | | | | | | | | | |
| $ | 256,890,481 | | | $ | 270,438,198 | | | $ | 177,915,403 | | | $ | 164,463,697 | | | $ | 109,385,517 | | | $ | 548,685,895 | |
| | | | | | | | | | | | | | | | | | | | | | |
$ | 29,193 | | | $ | — | | | $ | 75,603 | | | $ | 212,459 | | | $ | (3,322,526 | ) | | $ | (2,699,597 | ) |
| | | | | | | | | | | | | | | | | | | | | | |
See accompanying Notes to Financial Statements.
| | |
| |
| | |
| |
| Statements of Changes in Net Assets – continued | | |
| | | | | | | | | | | | | | | | |
| | |
| | | DoubleLine Core Plus
Fixed Income Fund | | | TCH Fixed Income Fund | |
| | | Six Months Ended
April 30, 2016
(unaudited) | | | Year Ended
October 31, 2015 | | | Six Months Ended
April 30, 2016
(unaudited) | | | Year Ended
October 31, 2015 | |
| | | | | | | | | | | | | | | | |
NET ASSETS at Beginning of Period | | $ | 492,337,589 | | | $ | 207,345,624 | | | $ | 49,831,281 | | | $ | 52,148,980 | |
| | | | | | | | | | | | | | | | |
Increase (decrease) in net assets from operations: | | | | | | | | | | | | | | | | |
Net investment income (loss) | | | 8,716,759 | | | | 12,120,905 | | | | 657,555 | | | | 1,502,097 | |
Net realized gain (loss) on investments, affiliated investments, purchased and written options, securities sold short, capital gain distributions and foreign currency transactions | | | (381,192 | ) | | | 725,979 | | | | (72,646 | ) | | | 767,386 | |
Net change in unrealized appreciation (depreciation) on investments, purchased and written options, securities sold short and translation of assets and liabilities denominated in foreign currency | | | 6,566,372 | | | | (9,455,664 | ) | | | 373,611 | | | | (3,098,937 | ) |
| | | | | | | | | | | | | | | | |
Net increase (decrease) in net assets from operations | | | 14,901,939 | | | | 3,391,220 | | | | 958,520 | | | | (829,454 | ) |
| | | | | | | | | | | | | | | | |
Distributions to shareholders from: | | | | | | | | | | | | | | | | |
Net investment income: | | | | | | | | | | | | | | | | |
Class N | | | (3,794,839 | ) | | | (3,720,662 | ) | | | (518,935 | ) | | | (1,136,381 | ) |
Class I | | | (5,454,124 | ) | | | (9,249,014 | ) | | | (199,544 | ) | | | (538,130 | ) |
Net realized gain on investments: | | | | | | | | | | | | | | | | |
Class N | | | — | | | | — | | | | — | | | | — | |
Class I | | | — | | | | — | | | | — | | | | — | |
| | | | | | | | | | | | | | | | |
Total distributions | | | (9,248,963 | ) | | | (12,969,676 | ) | | | (718,479 | ) | | | (1,674,511 | ) |
| | | | | | | | | | | | | | | | |
Capital share transactions: | | | | | | | | | | | | | | | | |
Proceeds from sales of shares: | | | | | | | | | | | | | | | | |
Class N | | | 198,777,560 | | | | 184,596,263 | | | | 1,684,638 | | | | 5,212,865 | |
Class I | | | 124,027,861 | | | | 194,716,457 | | | | 708,638 | | | | 7,349,230 | |
Proceeds from reinvestment of distributions: | | | | | | | | | | | | | | | | |
Class N | | | 3,746,418 | | | | 3,553,381 | | | | 497,673 | | | | 1,082,315 | |
Class I | | | 4,787,066 | | | | 7,995,114 | | | | 197,170 | | | | 528,388 | |
Cost of shares redeemed: | | | | | | | | | | | | | | | | |
Class N | | | (66,126,698 | ) | | | (45,659,902 | ) | | | (4,177,502 | ) | | | (6,493,178 | ) |
Class I | | | (54,762,292 | ) | | | (50,630,892 | ) | | | (8,047,033 | ) | | | (7,493,354 | ) |
Capital Contribution (Note G): | | | | | | | | | | | | | | | | |
Class I | | | — | | | | — | | | | — | | | | — | |
| | | | | | | | | | | | | | | | |
Net increase (decrease) from capital share transactions | | | 210,449,915 | | | | 294,570,421 | | | | (9,136,416 | ) | | | 186,266 | |
| | | | | | | | | | | | | | | | |
Total increase (decrease) in net assets | | | 216,102,891 | | | | 284,991,965 | | | | (8,896,375 | ) | | | (2,317,699 | ) |
| | | | | | | | | | | | | | | | |
NET ASSETS at End of Period | | $ | 708,440,480 | | | $ | 492,337,589 | | | $ | 40,934,906 | | | $ | 49,831,281 | |
| | | | | | | | | | | | | | | | |
Undistributed (distributions in excess of) net investment income (loss) | | $ | (1,131,485 | ) | | $ | (599,281 | ) | | $ | (58,166 | ) | | $ | 2,758 | |
| | | | | | | | | | | | | | | | |
See accompanying Notes to Financial Statements.
| | | | | | | | | | | | | | | | | | | | | | |
| | |
Anchor Capital
Enhanced Equity Fund | | | Lake Partners
LASSO Alternatives Fund | | | River Road
Long-Short Fund | |
Six Months Ended
April 30, 2016
(unaudited) | | | Year Ended
October 31, 2015 | | | Six Months Ended
April 30, 2016
(unaudited) | | | Year Ended
October 31, 2015 | | | Six Months Ended
April 30, 2016
(unaudited) | | | Year Ended
October 31, 2015 | |
| | | | | | | | | | | | | | | | | | | | | | |
| $ | 168,469,585 | | | $ | 210,964,549 | | | $ | 209,739,030 | | | $ | 521,542,660 | | | $ | 77,070,545 | | | $ | 219,410,621 | |
| | | | | | | | | | | | | | | | | | | | | | |
| | | | | | | | | | | | | | | | | | | | | | |
| | 1,845,381 | | | | 3,895,072 | | | | 859,946 | | | | (312,051 | ) | | | (321,646 | ) | | | (1,585,959 | ) |
| (1,685,204 | ) | | | 1,727,822 | | | | 3,245,167 | | | | 16,102,822 | | | | (2,228,343 | ) | | | 7,121,809 | |
| (805,570 | ) | | | (8,554,292 | ) | | | (7,369,341 | ) | | | (22,840,249 | ) | | | 1,076,367 | | | | 2,054,254 | |
| | | | | | | | | | | | | | | | | | | | | | |
| (645,393 | ) | | | (2,931,398 | ) | | | (3,264,228 | ) | | | (7,049,478 | ) | | | (1,473,622 | ) | | | 7,590,104 | |
| | | | | | | | | | | | | | | | | | | | | | |
| | | | | | | | | | | | | | | | | | | | | | |
| | | | | | | | | | | | | | | | | | | | | | |
| | (1,002,526 | ) | | | (1,707,469 | ) | | | — | | | | (15,074 | ) | | | — | | | | — | |
| | (968,355 | ) | | | (2,146,798 | ) | | | (335,854 | ) | | | (1,016,136 | ) | | | — | | | | — | |
| | | | | | | | | | | | | | | | | | | | | | |
| | (318,424 | ) | | | — | | | | (2,460,419 | ) | | | (1,747,938 | ) | | | (688,352 | ) | | | (2,666,296 | ) |
| | (272,247 | ) | | | — | | | | (8,718,084 | ) | | | (13,332,770 | ) | | | (1,158,799 | ) | | | (2,591,487 | ) |
| | | | | | | | | | | | | | | | | | | | | | |
| | (2,561,552 | ) | | | (3,854,267 | ) | | | (11,514,357 | ) | | | (16,111,918 | ) | | | (1,847,151 | ) | | | (5,257,783 | ) |
| | | | | | | | | | | | | | | | | | | | | | |
| | | | | | | | | | | | | | | | | | | | | | |
| | | | | | | | | | | | | | | | | | | | | | |
| | 4,372,077 | | | | 19,879,836 | | | | 3,658,663 | | | | 34,958,681 | | | | 724,314 | | | | 24,668,308 | |
| | 4,902,250 | | | | 38,797,603 | | | | 14,197,540 | | | | 91,358,414 | | | | 9,417,186 | | | | 21,197,504 | |
| | | | | | | | | | | | | | | | | | | | | | |
| | 1,286,566 | | | | 1,660,101 | | | | 2,444,199 | | | | 1,751,278 | | | | 683,579 | | | | 2,640,850 | |
| | 1,034,063 | | | | 1,570,561 | | | | 4,563,357 | | | | 10,592,840 | | | | 1,144,342 | | | | 1,835,170 | |
| | | | | | | | | | | | | | | | | | | | | | |
| | (34,108,475 | ) | | | (35,314,017 | ) | | | (7,787,528 | ) | | | (36,889,708 | ) | | | (16,253,404 | ) | | | (109,558,808 | ) |
| | (38,988,488 | ) | | | (62,303,383 | ) | | | (83,482,836 | ) | | | (390,414,611 | ) | | | (26,294,950 | ) | | | (85,455,421 | ) |
| | | | | | | | | | | | | | | | | | | | | | |
| | — | | | | — | | | | — | | | | 872 | | | | — | | | | — | |
| | | | | | | | | | | | | | | | | | | | | | |
| (61,502,007 | ) | | | (35,709,299 | ) | | | (66,406,605 | ) | | | (288,642,234 | ) | | | (30,578,933 | ) | | | (144,672,397 | ) |
| | | | | | | | | | | | | | | | | | | | | | |
| | (64,708,952 | ) | | | (42,494,964 | ) | | | (81,185,190 | ) | | | (311,803,630 | ) | | | (33,899,706 | ) | | | (142,340,076 | ) |
| | | | | | | | | | | | | | | | | | | | | | |
| $ | 103,760,633 | | | $ | 168,469,585 | | | $ | 128,553,840 | | | $ | 209,739,030 | | | $ | 43,170,839 | | | $ | 77,070,545 | |
| | | | | | | | | | | | | | | | | | | | | | |
$ | 243,174 | | | $ | 368,674 | | | $ | (506,790 | ) | | $ | (1,030,882 | ) | | $ | (344,875 | ) | | $ | (23,229 | ) |
| | | | | | | | | | | | | | | | | | | | | | |
See accompanying Notes to Financial Statements.
| | |
| |
| | |
| |
| Statements of Changes in Net Assets – continued | | |
| | | | | | | | | | | | | | | | |
| | |
| | | Barings
International Fund | | | Guardian Capital
Global Dividend Fund | |
| | | Six Months Ended
April 30, 2016
(unaudited) | | | Year Ended
October 31, 2015 | | | Six Months Ended
April 30, 2016
(unaudited) | | | Year Ended
October 31, 2015 | |
| | | | | | | | | | | | | | | | |
NET ASSETS at Beginning of Period | | $ | 20,736,746 | | | $ | 21,590,303 | | | $ | 4,345,783 | | | $ | 4,263,024 | |
| | | | | | | | | | | | | | | | |
Increase (decrease) in net assets from operations: | | | | | | | | | | | | | | | | |
Net investment income | | | 146,571 | | | | 225,383 | | | | 51,518 | | | | 107,411 | |
Net realized gain (loss) on investments and foreign currency transactions | | | (375,881 | ) | | | 337,634 | | | | (173,506 | ) | | | (82,953 | ) |
Net change in unrealized appreciation (depreciation) on investments and translation of assets and liabilities denominated in foreign currency | | | (585,057 | ) | | | 431,841 | | | | 71,113 | | | | (18,854 | ) |
| | | | | | | | | | | | | | | | |
Net increase (decrease) in net assets from operations | | | (814,367 | ) | | | 994,858 | | | | (50,875 | ) | | | 5,604 | |
| | | | | | | | | | | | | | | | |
Distributions to shareholders from: | | | | | | | | | | | | | | | | |
Net investment income: | | | | | | | | | | | | | | | | |
Class N | | | (3,194 | ) | | | (6,430 | ) | | | (12,860 | ) | | | (22,159 | ) |
Class I | | | (218,268 | ) | | | (466,160 | ) | | | (44,001 | ) | | | (80,811 | ) |
Net realized gain on investments: | | | | | | | | | | | | | | | | |
Class N | | | (5,858 | ) | | | (41,149 | ) | | | — | | | | — | |
Class I | | | (298,975 | ) | | | (2,620,405 | ) | | | — | | | | — | |
| | | | | | | | | | | | | | | | |
Total distributions | | | (526,295 | ) | | | (3,134,144 | ) | | | (56,861 | ) | | | (102,970 | ) |
| | | | | | | | | | | | | | | | |
Capital share transactions: | | | | | | | | | | | | | | | | |
Proceeds from sales of shares: | | | | | | | | | | | | | | | | |
Class N | | | 65,443 | | | | 79,319 | | | | 7,543 | | | | 35,451 | |
Class I | | | 7,560 | | | | 1,046,591 | | | | — | | | | 106,476 | |
Proceeds from reinvestment of distributions: | | | | | | | | | | | | | | | | |
Class N | | | 9,052 | | | | 47,579 | | | | 360 | | | | 339 | |
Class I | | | 517,243 | | | | 3,086,565 | | | | 31,311 | | | | 57,526 | |
Cost of shares redeemed: | | | | | | | | | | | | | | | | |
Class N | | | (9,317 | ) | | | (22,075 | ) | | | — | | | | (12,441 | ) |
Class I | | | (173 | ) | | | (2,952,250 | ) | | | (11,486 | ) | | | (7,667 | ) |
Capital Contribution (Note G): | | | | | | | | | | | | | | | | |
Class N | | | — | | | | — | | | | — | | | | 107 | |
Class I | | | — | | | | — | | | | — | | | | 334 | |
| | | | | | | | | | | | | | | | |
Net increase (decrease) from capital share transactions | | | 589,808 | | | | 1,285,729 | | | | 27,728 | | | | 180,125 | |
| | | | | | | | | | | | | | | | |
Total increase (decrease) in net assets | | | (750,854 | ) | | | (853,557 | ) | | | (80,008 | ) | | | 82,759 | |
| | | | | | | | | | | | | | | | |
NET ASSETS at End of Period | | $ | 19,985,892 | | | $ | 20,736,746 | | | $ | 4,265,775 | | | $ | 4,345,783 | |
| | | | | | | | | | | | | | | | |
Undistributed (distributions in excess of) net investment income (loss) | | $ | 145,387 | | | $ | 220,278 | | | $ | 19,970 | | | $ | 25,313 | |
| | | | | | | | | | | | | | | | |
| (a) | The commencement of investment operations for the Value Partners Asia Dividend Fund was December 16, 2015. |
See accompanying Notes to Financial Statements.
| | | | | | | | | | | | | | | | | | |
| | |
LMCG Emerging
Markets Fund | | | Pictet International Fund | | | Value Partners
Asia Dividend Fund | |
Six Months Ended
April 30, 2016
(unaudited) | | | Year Ended
October 31, 2015 | | | Six Months Ended
April 30, 2016
(unaudited) | | | Year Ended
October 31, 2015 | | | Period Ended
April 30, 2016(a)
(unaudited) | |
| | | | | | | | | | | | | | | | | | |
| $ | 2,054,394 | | | $ | 3,913,026 | | | $ | 50,859,091 | | | $ | 9,450,969 | | | $ | — | |
| | | | | | | | | | | | | | | | | | |
| | | | | | | | | | | | | | | | | | |
| | 3,164 | | | | 40,192 | | | | 5,497,519 | | | | 433,841 | | | | 22,395 | |
|
(118,266 |
) | | | (213,890 | ) | | | 8,270,588 | | | | 299,417 | | | | 128,431 | |
|
59,434 |
| | | (289,270 | ) | | | 49,213,332 | | | | 944,133 | | | | (36,116 | ) |
| | | | | | | | | | | | | | | | | | |
|
(55,668 |
) | | | (462,968 | ) | | | 62,981,439 | | | | 1,677,391 | | | | 114,710 | |
| | | | | | | | | | | | | | | | | | |
| | | | | | | | | | | | | | | | | | |
| | | | | | | | | | | | | | | | | | |
| | (6,411 | ) | | | (3,910 | ) | | | (2,107 | ) | | | (3,516 | ) | | | — | |
| | (19,195 | ) | | | (24,689 | ) | | | (384,730 | ) | | | (122,686 | ) | | | — | |
| | | | | | | | | | | | | | | | | | |
| | — | | | | — | | | | (7,188 | ) | | | (2,589 | ) | | | — | |
| | — | | | | — | | | | (581,130 | ) | | | (59,646 | ) | | | — | |
| | | | | | | | | | | | | | | | | | |
| | (25,606 | ) | | | (28,599 | ) | | | (975,155 | ) | | | (188,437 | ) | | | — | |
| | | | | | | | | | | | | | | | | | |
| | | | | | | | | | | | | | | | | | |
| | | | | | | | | | | | | | | | | | |
| | 8,200 | | | | 18,704 | | | | 47,785 | | | | 66,599 | | | | 750,010 | |
| | — | | | | — | | | | 831,866,374 | | | | 47,089,385 | | | | 6,750,010 | |
| | | | | | | | | | | | | | | | | | |
| | 6,411 | | | | 3,910 | | | | 915 | | | | 305 | | | | — | |
| | 19,195 | | | | 24,689 | | | | 70,238 | | | | 47,892 | | | | — | |
| | | | | | | | | | | | | | | | | | |
| | (7,108 | ) | | | (14,368 | ) | | | (945,128 | ) | | | (17,102 | ) | | | — | |
| | (591,607 | ) | | | (1,400,000 | ) | | | (44,158,244 | ) | | | (7,291,209 | ) | | | — | |
| | | | | | | | | | | | | | | | | | |
| | — | | | | — | | | | 96 | | | | 1,022 | | | | — | |
| | — | | | | — | | | | 619,078 | | | | 22,276 | | | | — | |
| | | | | | | | | | | | | | | | | | |
|
(564,909 |
) | | | (1,367,065 | ) | | | 787,501,114 | | | | 39,919,168 | | | | 7,500,020 | |
| | | | | | | | | | | | | | | | | | |
| | (646,183 | ) | | | (1,858,632 | ) | | | 849,507,398 | | | | 41,408,122 | | | | 7,614,730 | |
| | | | | | | | | | | | | | | | | | |
| $ | 1,408,211 | | | $ | 2,054,394 | | | $ | 900,366,489 | | | $ | 50,859,091 | | | $ | 7,614,730 | |
| | | | | | | | | | | | | | | | | | |
$ |
(6,262 |
) | | $ | 16,180 | | | $ | 5,475,161 | | | $ | 364,479 | | | $ | 22,395 | |
| | | | | | | | | | | | | | | | | | |
See accompanying Notes to Financial Statements.
| | |
| |
| | |
| |
| Statements of Changes in Net Assets – continued | | |
| | | | | | | | | | | | | | | | |
| | |
| | | Harrison Street
Real Estate Fund | | | Montag & Caldwell
Balanced Fund | |
| | | Six Months Ended
April 30, 2016
(unaudited) | | | Year Ended
October 31, 2015 | | | Six Months Ended
April 30, 2016
(unaudited) | | | Year Ended
October 31, 2015 | |
| | | | | | | | | | | | | | | | |
NET ASSETS at Beginning of Period | | $ | 10,914,654 | | | $ | 13,583,237 | | | $ | 30,124,934 | | | $ | 22,379,687 | |
| | | | | | | | | | | | | | | | |
Increase in net assets from operations: | | | | | | | | | | | | | | | | |
Net investment income | | | 64,951 | | | | 171,176 | | | | 73,787 | | | | 106,468 | |
Net realized gain on investments | | | 149,829 | | | | 881,172 | | | | 526,857 | | | | 1,390,086 | |
Net change in unrealized appreciation (depreciation) on investments | | | 285,563 | | | | (835,550 | ) | | | (382,679 | ) | | | (109,152 | ) |
| | | | | | | | | | | | | | | | |
Net increase in net assets from operations | | | 500,343 | | | | 216,798 | | | | 217,965 | | | | 1,387,402 | |
| | | | | | | | | | | | | | | | |
Distributions to shareholders from: | | | | | | | | | | | | | | | | |
Net investment income: | | | | | | | | | | | | | | | | |
Class N | | | (115,422 | ) | | | (153,737 | ) | | | (89,384 | ) | | | (156,641 | ) |
Class I | | | (6,835 | ) | | | (10,621 | ) | | | (12,899 | ) | | | (20,244 | ) |
Net realized gain on investments: | | | | | | | | | | | | | | | | |
Class N | | | — | | | | — | | | | (1,154,068 | ) | | | (1,709,309 | ) |
Class I | | | — | | | | — | | | | (170,597 | ) | | | (163,800 | ) |
| | | | | | | | | | | | | | | | |
Total distributions | | | (122,257 | ) | | | (164,358 | ) | | | (1,426,948 | ) | | | (2,049,994 | ) |
| | | | | | | | | | | | | | | | |
Capital share transactions: | | | | | | | | | | | | | | | | |
Proceeds from sales of shares: | | | | | | | | | | | | | | | | |
Class N | | | 421,708 | | | | 1,977,600 | | | | 17,147,413 | | | | 8,907,085 | |
Class I | | | 29,014 | | | | 125,440 | | | | 790,487 | | | | 2,184,522 | |
Proceeds from reinvestment of distributions: | | | | | | | | | | | | | | | | |
Class N | | | 107,325 | | | | 148,501 | | | | 1,210,274 | | | | 1,812,107 | |
Class I | | | 4,552 | | | | 7,332 | | | | 104,090 | | | | 88,941 | |
Cost of shares redeemed: | | | | | | | | | | | | | | | | |
Class N | | | (1,564,728 | ) | | | (4,621,226 | ) | | | (6,793,755 | ) | | | (3,919,684 | ) |
Class I | | | (46,341 | ) | | | (358,670 | ) | | | (749,198 | ) | | | (665,132 | ) |
| | | | | | | | | | | | | | | | |
Net increase (decrease) from capital share transactions | | | (1,048,470 | ) | | | (2,721,023 | ) | | | 11,709,311 | | | | 8,407,839 | |
| | | | | | | | | | | | | | | | |
Total increase (decrease) in net assets | | | (670,384 | ) | | | (2,668,583 | ) | | | 10,500,328 | | | | 7,745,247 | |
| | | | | | | | | | | | | | | | |
NET ASSETS at End of Period | | $ | 10,244,270 | | | $ | 10,914,654 | | | $ | 40,625,262 | | | $ | 30,124,934 | |
| | | | | | | | | | | | | | | | |
Undistributed (distributions in excess of) net investment income (loss) | | $ | 64,907 | | | $ | 122,213 | | | $ | (339,360 | ) | | $ | (310,864 | ) |
| | | | | | | | | | | | | | | | |
See accompanying Notes to Financial Statements.
| | |
| |
| ASTON/Cornerstone Large Cap Value Fund – Class N | | April 30, 2016 |
| |
| Financial Highlights | | |
| | | | | | | | | | | | | | | | | | | | | | | | |
| | | Six Months
Ended
04/30/16
(unaudited) | | | Year
Ended
10/31/15
| | | Year
Ended
10/31/14 | | | Year
Ended
10/31/13 | | | Year
Ended
10/31/12 | | | Year
Ended
10/31/11 | |
Net Asset Value, Beginning of Period | | $ | 13.69 | | | $ | 15.35 | | | $ | 13.74 | | | $ | 11.04 | | | $ | 10.04 | | | $ | 9.20 | |
| | | | | | | | | | | | | | | | | | | | | | | | |
Income from Investment Operations: | | | | | | | | | | | | | | | | | | | | | | | | |
Net investment income | | | 0.08 | (a) | | | 0.13 | (a) | | | 0.11 | (a) | | | 0.09 | (a) | | | 0.10 | (a) | | | 0.12 | (a) |
Net realized and unrealized gain (loss) on investments | | | (0.21 | ) | | | (1.67 | ) | | | 1.56 | | | | 2.72 | | | | 0.94 | | | | 0.83 | |
| | | | | | | | | | | | | | | | | | | | | | | | |
Total from investment operations | | | (0.13 | ) | | | (1.54 | ) | | | 1.67 | | | | 2.81 | | | | 1.04 | | | | 0.95 | |
| | | | | | | | | | | | | | | | | | | | | | | | |
Less Distributions: | | | | | | | | | | | | | | | | | | | | | | | | |
Distributions from and in excess of net investment income | | | (0.15 | ) | | | (0.12 | ) | | | (0.06 | ) | | | (0.11 | ) | | | (0.04 | ) | | | (0.11 | ) |
| | | | | | | | | | | | | | | | | | | | | | | | |
Total distributions | | | (0.15 | ) | | | (0.12 | ) | | | (0.06 | ) | | | (0.11 | ) | | | (0.04 | ) | | | (0.11 | ) |
| | | | | | | | | | | | | | | | | | | | | | | | |
Net increase (decrease) in net asset value . | | | (0.28 | ) | | | (1.66 | ) | | | 1.61 | | | | 2.70 | | | | 1.00 | | | | 0.84 | |
| | | | | | | | | | | | | | | | | | | | | | | | |
Net Asset Value, End of Period | | $ | 13.41 | | | $ | 13.69 | | | $ | 15.35 | | | $ | 13.74 | | | $ | 11.04 | | | $ | 10.04 | |
| | | | | | | | | | | | | | | | | | | | | | | | |
Total Return (b) | | | (0.96 | )%(c) | | | (10.17 | )% | | | 12.17 | % | | | 25.72 | % | | | 10.43 | % | | | 10.44 | % |
| | | | | | |
Ratios/Supplemental Data: | | | | | | | | | | | | | | | | | | | | | | | | |
Net Assets, End of Period (in 000’s) | | $ | 49,909 | | | $ | 58,598 | | | $ | 60,683 | | | $ | 23,913 | | | $ | 21,105 | | | $ | 24,631 | |
Ratios of expenses to average net assets: | | | | | | | | | | | | | | | | | | | | | | | | |
Before expense reimbursement and/or fee waiver by Adviser | | | 1.30 | %(d) | | | 1.28 | % | | | 1.30 | % | | | 1.48 | % | | | 1.58 | % | | | 1.61 | % |
After expense reimbursement and/or fee waiver by Adviser | | | 1.20 | %(d)(e) | | | 1.28 | % | | | 1.30 | % | | | 1.30 | % | | | 1.26 | %(e) | | | 1.14 | %(f) |
Ratios of net investment income to average net assets: | | | | | | | | | | | | | | | | | | | | | | | | |
Before expense reimbursement and/or fee waiver by Adviser | | | 1.21 | %(d) | | | 0.89 | % | | | 0.73 | % | | | 0.53 | % | | | 0.60 | % | | | 0.80 | % |
After expense reimbursement and/or fee waiver by Adviser | | | 1.30 | %(d) | | | 0.89 | % | | | 0.73 | % | | | 0.71 | % | | | 0.92 | % | | | 1.27 | % |
Portfolio Turnover | | | 12.29 | %(c) | | | 57.64 | % | | | 30.03 | % | | | 58.24 | % | | | 58.21 | % | | | 59.07 | %(g) |
| | (a) | The selected per share data was calculated using the weighted average shares outstanding method for the period. |
| | (b) | The total return is calculated using the Net Asset Value used for trading at the close of business at period end. |
| | (e) | Effective January 1, 2016, the Adviser changed the contractual expense limitation from 1.30% to 1.14%. |
| | (f) | Effective March 22, 2011, the Adviser changed the voluntary expense limitation from 1.07% to 1.19%. Subsequently, on February 29, 2012, the Adviser removed the voluntary expense limitation and replaced it with a contractual expense limitation of 1.30%. |
| | (g) | Portfolio turnover rate excludes securities delivered from processing a redemption in-kind. |
See accompanying Notes to Financial Statements.
| | |
| |
| ASTON/Cornerstone Large Cap Value Fund – Class I | | April 30, 2016 |
| |
| Financial Highlights | | |
| | | | | | | | | | | | | | | | | | | | | | | | |
| | | Six Months
Ended
04/30/16
(unaudited) | | | Year
Ended
10/31/15 | | | Year
Ended
10/31/14 | | | Year
Ended
10/31/13 | | | Year
Ended
10/31/12 | | | Year
Ended
10/31/11 | |
Net Asset Value, Beginning of Period | | $ | 13.74 | | | $ | 15.38 | | | $ | 13.78 | | | $ | 11.07 | | | $ | 10.05 | | | $ | 9.19 | |
| | | | | | | | | | | | | | | | | | | | | | | | |
Income from Investment Operations: | | | | | | | | | | | | | | | | | | | | | | | | |
Net investment income | | | 0.10 | (a) | | | 0.17 | (a) | | | 0.15 | (a) | | | 0.12 | (a) | | | 0.11 | (a) | | | 0.16 | (a) |
Net realized and unrealized gain (loss) on
investments | | | (0.22 | ) | | | (1.67 | ) | | | 1.54 | | | | 2.73 | | | | 0.96 | | | | 0.84 | |
| | | | | | | | | | | | | | | | | | | | | | | | |
Total from investment operations | | | (0.12 | ) | | | (1.50 | ) | | | 1.69 | | | | 2.85 | | | | 1.07 | | | | 1.00 | |
| | | | | | | | | | | | | | | | | | | | | | | | |
Less Distributions: | | | | | | | | | | | | | | | | | | | | | | | | |
Distributions from and in excess of net investment income | | | (0.18 | ) | | | (0.14 | ) | | | (0.09 | ) | | | (0.14 | ) | | | (0.05 | ) | | | (0.14 | ) |
| | | | | | | | | | | | | | | | | | | | | | | | |
Total distributions | | | (0.18 | ) | | | (0.14 | ) | | | (0.09 | ) | | | (0.14 | ) | | | (0.05 | ) | | | (0.14 | ) |
| | | | | | | | | | | | | | | | | | | | | | | | |
Net increase (decrease) in net asset value . | | | (0.30 | ) | | | (1.64 | ) | | | 1.60 | | | | 2.71 | | | | 1.02 | | | | 0.86 | |
| | | | | | | | | | | | | | | | | | | | | | | | |
Net Asset Value, End of Period | | $ | 13.44 | | | $ | 13.74 | | | $ | 15.38 | | | $ | 13.78 | | | $ | 11.07 | | | $ | 10.05 | |
| | | | | | | | | | | | | | | | | | | | | | | | |
Total Return (b) | | | (0.85 | )%(c) | | | (9.88 | )% | | | 12.33 | % | | | 26.08 | % | | | 10.66 | % | | | 10.95 | % |
| | | | | | |
Ratios/Supplemental Data: | | | | | | | | | | | | | | | | | | | | | | | | |
Net Assets, End of Period (in 000’s) | | $ | 30,649 | | | $ | 71,446 | | | $ | 103,228 | | | $ | 38,735 | | | $ | 5,397 | | | $ | 126 | |
Ratios of expenses to average net assets: | | | | | | | | | | | | | | | | | | | | | | | | |
Before expense reimbursement and/or fee waiver by Adviser | | | 1.05 | %(d) | | | 1.03 | % | | | 1.05 | % | | | 1.23 | % | | | 1.33 | % | | | 1.36 | % |
After expense reimbursement and/or fee waiver by Adviser | | | 0.97 | %(d)(e) | | | 1.03 | % | | | 1.05 | % | | | 1.05 | % | | | 1.01 | %(e) | | | 0.89 | %(f) |
Ratios of net investment income to average net assets: | | | | | | | | | | | | | | | | | | | | | | | | |
Before expense reimbursement and/or fee waiver by Adviser | | | 1.46 | %(d) | | | 1.14 | % | | | 0.98 | % | | | 0.78 | % | | | 0.85 | % | | | 1.05 | % |
After expense reimbursement and/or fee waiver by Adviser | | | 1.54 | %(d) | | | 1.14 | % | | | 0.98 | % | | | 0.96 | % | | | 1.17 | % | | | 1.52 | % |
Portfolio Turnover | | | 12.29 | %(c) | | | 57.64 | % | | | 30.03 | % | | | 58.24 | % | | | 58.21 | % | | | 59.07 | %(g) |
| | (a) | The selected per share data was calculated using the weighted average shares outstanding method for the period. |
| | (b) | The total return is calculated using the Net Asset Value used for trading at the close of business at period end. |
| | (e) | Effective January 1, 2016, the Adviser changed the contractual expense limitation from 1.05% to 0.89%. |
| | (f) | Effective March 22, 2011, the Adviser changed the voluntary expense limitation from 0.82% to 0.94%. Subsequently, on February 29, 2012, the Adviser removed the voluntary expense limitation and replaced it with a contractual expense limitation of 1.05%. |
| | (g) | Portfolio turnover rate excludes securities delivered from processing a redemption in-kind. |
See accompanying Notes to Financial Statements.
| | |
| |
| ASTON/Fairpointe Focused Equity Fund – Class N | | April 30, 2016 |
| |
| Financial Highlights | | |
| | | | | | | | |
| | | Six Months
Ended
04/30/16
(unaudited) | | | Period
Ended
10/31/15(a) | |
Net Asset Value, Beginning of Period | | $ | 9.33 | | | $ | 10.00 | |
| | | | | | | | |
Income from Investment Operations: | | | | | | | | |
Net investment income | | | 0.04 | (b) | | | 0.06 | (b) |
Net realized and unrealized loss on investments | | | (0.13 | ) | | | (0.73 | ) |
| | | | | | | | |
Total from investment operations | | | (0.09 | ) | | | (0.67 | ) |
| | | | | | | | |
Less Distributions: | | | | | | | | |
Distributions from and in excess of net investment income | | | (0.09 | ) | | | — | |
| | | | | | | | |
Total distributions | | | (0.09 | ) | | | — | |
| | | | | | | | |
Net decrease in net asset value | | | (0.18 | ) | | | (0.67 | ) |
| | | | | | | | |
Net Asset Value, End of Period | | $ | 9.15 | | | $ | 9.33 | |
| | | | | | | | |
Total Return (c) | | | (0.98 | )%(d) | | | (6.70 | )%(d) |
| | |
Ratios/Supplemental Data: | | | | | | | | |
Net Assets, End of Period (in 000’s) | | $ | 2,243 | | | $ | 2,295 | |
Ratios of expenses to average net assets: | | | | | | | | |
Before expense reimbursement and/or fee waiver by Adviser | | | 2.84 | %(e) | | | 3.78 | %(e) |
After expense reimbursement and/or fee waiver by Adviser | | | 1.15 | %(e) | | | 1.15 | %(e) |
Ratios of net investment income (loss) to average net assets: | | | | | | | | |
Before expense reimbursement and/or fee waiver by Adviser | | | (0.70 | )%(e) | | | (1.93 | )%(e) |
After expense reimbursement and/or fee waiver by Adviser | | | 0.99 | %(e) | | | 0.70 | %(e) |
Portfolio Turnover | | | 16.38 | %(d) | | | 0.91 | %(d)(f) |
| | (a) | The commencement of investment operations for Fairpointe Focused Equity Fund Class N shares was December 23, 2014. |
| | (b) | The selected per share data was calculated using the weighted average shares outstanding method for the period. |
| | (c) | The total return is calculated using the Net Asset Value used for trading at the close of business at period end. |
| | (f) | Portfolio turnover rate excludes securities received from processing a subscription in-kind. |
See accompanying Notes to Financial Statements.
| | |
| |
| ASTON/Fairpointe Focused Equity Fund – Class I | | April 30, 2016 |
| |
| Financial Highlights | | |
| | | | | | | | |
| | | Six Months
Ended
04/30/16
(unaudited) | | | Period
Ended
10/31/15(a)
| |
Net Asset Value, Beginning of Period | | $ | 9.35 | | | $ | 10.00 | |
| | | | | | | | |
Income from Investment Operations: | | | | | | | | |
Net investment income | | | 0.05 | (b) | | | 0.08 | (b) |
Net realized and unrealized loss on investments | | | (0.14 | ) | | | (0.73 | ) |
| | | | | | | | |
Total from investment operations | | | (0.09 | ) | | | (0.65 | ) |
| | | | | | | | |
Less Distributions: | | | | | | | | |
Distributions from and in excess of net investment income | | | (0.10 | ) | | | — | |
| | | | | | | | |
Total distributions | | | (0.10 | ) | | | — | |
| | | | | | | | |
Net decrease in net asset value | | | (0.19 | ) | | | (0.65 | ) |
| | | | | | | | |
Net Asset Value, End of Period | | $ | 9.16 | | | $ | 9.35 | |
| | | | | | | | |
Total Return (c) | | | (0.87 | )%(d) | | | (6.50 | )%(d) |
| | |
Ratios/Supplemental Data: | | | | | | | | |
Net Assets, End of Period (in 000’s) | | $ | 4,389 | | | $ | 4,162 | |
Ratios of expenses to average net assets: | | | | | | | | |
Before expense reimbursement and/or fee waiver by Adviser | | | 2.59 | %(e) | | | 3.53 | %(e) |
After expense reimbursement and/or fee waiver by Adviser | | �� | 0.90 | %(e) | | | 0.90 | %(e) |
Ratios of net investment income (loss) to average net assets: | | | | | | | | |
Before expense reimbursement and/or fee waiver by Adviser | | | (0.45 | )%(e) | | | (1.68 | )%(e) |
After expense reimbursement and/or fee waiver by Adviser | | | 1.24 | %(e) | | | 0.95 | %(e) |
Portfolio Turnover | | | 16.38 | %(d) | | | 0.91 | %(d)(f) |
| | (a) | The commencement of investment operations for Fairpointe Focused Equity Fund Class I shares was December 23, 2014. |
| | (b) | The selected per share data was calculated using the weighted average shares outstanding method for the period. |
| | (c) | The total return is calculated using the Net Asset Value used for trading at the close of business at period end. |
| | (f) | Portfolio turnover rate excludes securities received from processing a subscription in-kind. |
See accompanying Notes to Financial Statements.
| | |
| |
| ASTON/River Road Focused Absolute Value Fund – Class N | | April 30, 2016 |
| |
| Financial Highlights | | |
| | | | |
| | | Period
Ended
04/30/16(a)
(unaudited) | |
Net Asset Value, Beginning of Period | | $ | 10.00 | |
| | | | |
Income from Investment Operations: | | | | |
Net investment income | | | 0.04 | (b) |
Net realized and unrealized gain on investments | | | 0.09 | |
| | | | |
Total from investment operations | | | 0.13 | |
| | | | |
Net increase in net asset value | | | 0.13 | |
| | | | |
Net Asset Value, End of Period | | $ | 10.13 | |
| | | | |
Total Return (c) | | | 1.30 | %(d) |
| |
Ratios/Supplemental Data: | | | | |
Net Assets, End of Period (in 000’s) | | $ | 211 | |
Ratios of expenses to average net assets: | | | | |
Before expense reimbursement and/or fee waiver by Adviser | | | 4.18 | %(e) |
After expense reimbursement and/or fee waiver by Adviser | | | 1.00 | %(e) |
Ratios of net investment income (loss) to average net assets: | | | | |
Before expense reimbursement and/or fee waiver by Adviser | | | (2.23 | )%(e) |
After expense reimbursement and/or fee waiver by Adviser | | | 0.95 | %(e) |
Portfolio Turnover | | | 75.51 | %(d)(f) |
| | (a) | The commencement of investment operations for River Road Focused Absolute Value Fund Class N shares was November 3, 2015. |
| | (b) | The selected per share data was calculated using the weighted average shares outstanding method for the period. |
| | (c) | The total return is calculated using the Net Asset Value used for trading at the close of business at period end. |
| | (f) | Portfolio turnover rate excludes securities delivered from processing a subscription in-kind. |
See accompanying Notes to Financial Statements.
| | |
| |
| ASTON/River Road Focused Absolute Value Fund – Class I | | April 30, 2016 |
| |
| Financial Highlights | | |
| | | | |
| | | Period
Ended
04/30/16(a)
(unaudited) | |
Net Asset Value, Beginning of Period | | $ | 10.00 | |
| | | | |
Income from Investment Operations: | | | | |
Net investment income | | | 0.06 | (b) |
Net realized and unrealized gain on investments | | | 0.08 | |
| | | | |
Total from investment operations | | | 0.14 | |
| | | | |
Net increase in net asset value | | | 0.14 | |
| | | | |
Net Asset Value, End of Period | | $ | 10.14 | |
| | | | |
Total Return (c) | | | 1.40 | %(d) |
| |
Ratios/Supplemental Data: | | | | |
Net Assets, End of Period (in 000’s) | | $ | 9,122 | |
Ratios of expenses to average net assets: | | | | |
Before expense reimbursement and/or fee waiver by Adviser | | | 3.93 | %(e) |
After expense reimbursement and/or fee waiver by Adviser | | | 0.75 | %(e) |
Ratios of net investment income (loss) to average net assets: | | | | |
Before expense reimbursement and/or fee waiver by Adviser | | | (1.98 | )%(e) |
After expense reimbursement and/or fee waiver by Adviser | | | 1.20 | %(e) |
Portfolio Turnover | | | 75.51 | %(d)(f) |
| | (a) | The commencement of investment operations for River Road Focused Absolute Value Fund Class I shares was November 3, 2015. |
| | (b) | The selected per share data was calculated using the weighted average shares outstanding method for the period. |
| | (c) | The total return is calculated using the Net Asset Value used for trading at the close of business at period end. |
| | (f) | Portfolio turnover rate excludes securities delivered from processing a subscription in-kind. |
See accompanying Notes to Financial Statements.
| | |
| |
| ASTON/Herndon Large Cap Value Fund – Class N | | April 30, 2016 |
| |
| Financial Highlights | | |
| | | | | | | | | | | | | | | | | | | | | | | | |
| | | Six Months
Ended
04/30/16
(unaudited) | | | Year
Ended
10/31/15 | | | Year
Ended
10/31/14 | | | Year
Ended
10/31/13 | | | Year
Ended
10/31/12 | | | Year
Ended
10/31/11 | |
Net Asset Value, Beginning of Period | | $ | 13.27 | | | $ | 15.08 | | | $ | 13.84 | | | $ | 11.73 | | | $ | 11.31 | | | $ | 10.39 | |
| | | | | | | | | | | | | | | | | | | | | | | | |
Income from Investment Operations: | | | | | | | | | | | | | | | | | | | | | | | | |
Net investment income | | | 0.07 | (a) | | | 0.09 | (a) | | | 0.11 | (a) | | | 0.15 | (a) | | | 0.18 | (a) | | | 0.12 | (a) |
Net realized and unrealized gain (loss) on investments | | | (0.77 | ) | | | (0.97 | ) | | | 1.49 | | | | 2.40 | | | | 0.91 | | | | 0.81 | |
| | | | | | | | | | | | | | | | | | | | | | | | |
Total from investment operations | | | (0.70 | ) | | | (0.88 | ) | | | 1.60 | | | | 2.55 | | | | 1.09 | | | | 0.93 | |
| | | | | | | | | | | | | | | | | | | | | | | | |
Less Distributions: | | | | | | | | | | | | | | | | | | | | | | | | |
Distributions from and in excess of net investment income | | | (0.10 | ) | | | (0.05 | ) | | | (0.10 | ) | | | (0.22 | ) | | | (0.11 | ) | | | (0.01 | ) |
Distributions from net realized gain on investments | | | (0.02 | ) | | | (0.88 | ) | | | (0.26 | ) | | | (0.22 | ) | | | (0.56 | ) | | | — | |
| | | | | | | | | | | | | | | | | | | | | | | | |
Total distributions | | | (0.12 | ) | | | (0.93 | ) | | | (0.36 | ) | | | (0.44 | ) | | | (0.67 | ) | | | (0.01 | ) |
| | | | | | | | | | | | | | | | | | | | | | | | |
Net increase (decrease) in net asset value | | | (0.82 | ) | | | (1.81 | ) | | | 1.24 | | | | 2.11 | | | | 0.42 | | | | 0.92 | |
| | | | | | | | | | | | | | | | | | | | | | | | |
Net Asset Value, End of Period | | $ | 12.45 | | | $ | 13.27 | | | $ | 15.08 | | | $ | 13.84 | | | $ | 11.73 | | | $ | 11.31 | |
| | | | | | | | | | | | | | | | | | | | | | | | |
Total Return (b) | | | (5.29 | )%(c) | | | (6.10 | )% | | | 11.67 | % | | | 22.58 | % | | | 10.39 | % | | | 9.09 | % |
| | | | | | |
Ratios/Supplemental Data: | | | | | | | | | | | | | | | | | | | | | | | | |
Net Assets, End of Period (in 000’s) | | $ | 6,361 | | | $ | 8,500 | | | $ | 13,997 | | | $ | 41,861 | | | $ | 20,832 | | | $ | 6,089 | |
Ratios of expenses to average net assets: | | | | | | | | | | | | | | | | | | | | | | | | |
Before expense reimbursement and/or fee waiver, or recoupment by Adviser | | | 1.25 | %(d) | | | 1.26 | % | | | 1.23 | % | | | 1.27 | % | | | 1.41 | % | | | 2.38 | % |
After expense reimbursement and/or fee waiver, or recoupment by Adviser | | | 1.20 | %(d)(e) | | | 1.29 | % | | | 1.30 | % | | | 1.30 | % | | | 1.30 | % | | | 1.30 | % |
Ratios of net investment income (loss) to average net assets: | | | | | | | | | | | | | | | | | | | | | | | | |
Before expense reimbursement and/or fee waiver, or recoupment by Adviser | | | 1.15 | %(d) | | | 0.70 | % | | | 0.84 | % | | | 1.24 | % | | | 1.44 | % | | | (0.05 | )% |
After expense reimbursement and/or fee waiver, or recoupment by Adviser | | | 1.20 | %(d) | | | 0.67 | % | | | 0.77 | % | | | 1.21 | % | | | 1.55 | % | | | 1.03 | % |
Portfolio Turnover | | | 28.89 | %(c) | | | 62.28 | % | | | 75.46 | % | | | 69.51 | % | | | 80.56 | % | | �� | 189.70 | % |
| | (a) | The selected per share data was calculated using the weighted average shares outstanding method for the period. |
| | (b) | The total return is calculated using the Net Asset Value used for trading at the close of business at period end. |
| | (e) | Effective January 1, 2016, the Adviser changed the contractual expense limitation from 1.30% to 1.14%. |
See accompanying Notes to Financial Statements.
| | |
| |
| ASTON/Herndon Large Cap Value Fund – Class I | | April 30, 2016 |
| |
| Financial Highlights | | |
| | | | | | | | | | | | | | | | | | | | | | | | |
| | | Six Months
Ended
04/30/16
(unaudited) | | | Year
Ended
10/31/15 | | | Year
Ended
10/31/14 | | | Year
Ended
10/31/13 | | | Year
Ended
10/31/12 | | | Period
Ended
10/31/11(a) | |
Net Asset Value, Beginning of Period | | $ | 13.25 | | | $ | 15.12 | | | $ | 13.87 | | | $ | 11.75 | | | $ | 11.33 | | | $ | 11.48 | |
| | | | | | | | | | | | | | | | | | | | | | | | |
Income from Investment Operations: | | | | | | | | | | | | | | | | | | | | | | | | |
Net investment income | | | 0.09 | (b) | | | 0.13 | (b) | | | 0.15 | (b) | | | 0.19 | (b) | | | 0.21 | (b) | | | 0.10 | (b) |
Net realized and unrealized gain (loss) on investments | | | (0.77 | ) | | | (0.98 | ) | | | 1.48 | | | | 2.39 | | | | 0.91 | | | | (0.25 | ) |
| | | | | | | | | | | | | | | | | | | | | | | | |
Total from investment operations | | | (0.68 | ) | | | (0.85 | ) | | | 1.63 | | | | 2.58 | | | | 1.12 | | | | (0.15 | ) |
| | | | | | | | | | | | | | | | | | | | | | | | |
Less Distributions: | | | | | | | | | | | | | | | | | | | | | | | | |
Distributions from and in excess of net investment income | | | (0.14 | ) | | | (0.14 | ) | | | (0.12 | ) | | | (0.24 | ) | | | (0.14 | ) | | | — | |
Distributions from net realized gain on investments | | | (0.02 | ) | | | (0.88 | ) | | | (0.26 | ) | | | (0.22 | ) | | | (0.56 | ) | | | — | |
| | | | | | | | | | | | | | | | | | | | | | | | |
Total distributions | | | (0.16 | ) | | | (1.02 | ) | | | (0.38 | ) | | | (0.46 | ) | | | (0.70 | ) | | | — | |
| | | | | | | | | | | | | | | | | | | | | | | | |
Net increase (decrease) in net asset value | | | (0.84 | ) | | | (1.87 | ) | | | 1.25 | | | | 2.12 | | | | 0.42 | | | | (0.15 | ) |
| | | | | | | | | | | | | | | | | | | | | | | | |
Net Asset Value, End of Period | | $ | 12.41 | | | $ | 13.25 | | | $ | 15.12 | | | $ | 13.87 | | | $ | 11.75 | | | $ | 11.33 | |
| | | | | | | | | | | | | | | | | | | | | | | | |
Total Return (c) | | | (5.16 | )%(d) | | | (5.88 | )% | | | 11.94 | % | | | 22.94 | % | | | 10.69 | % | | | (1.31 | )%(d) |
| | | | | | |
Ratios/Supplemental Data: | | | | | | | | | | | | | | | | | | | | | | | | |
Net Assets, End of Period (in 000’s) | | $ | 82,555 | | | $ | 112,040 | | | $ | 139,448 | | | $ | 80,534 | | | $ | 34,575 | | | $ | 11,881 | |
Ratios of expenses to average net assets: | | | | | | | | | | | | | | | | | | | | | | | | |
Before expense reimbursement and/or fee waiver, or recoupment by Adviser | | | 0.99 | %(e) | | | 1.01 | % | | | 0.98 | % | | | 1.02 | % | | | 1.16 | % | | | 2.13 | %(e) |
After expense reimbursement and/or fee waiver, or recoupment by Adviser | | | 0.94 | %(e)(f) | | | 1.04 | % | | | 1.05 | % | | | 1.05 | % | | | 1.05 | % | | | 1.05 | %(e) |
Ratios of net investment income to average net assets: | | | | | | | | | | | | | | | | | | | | | | | | |
Before expense reimbursement and/or fee waiver, or recoupment by Adviser | | | 1.40 | %(e) | | | 0.95 | % | | | 1.09 | % | | | 1.49 | % | | | 1.69 | % | | | 0.20 | %(e) |
After expense reimbursement and/or fee waiver, or recoupment by Adviser | | | 1.45 | %(e) | | | 0.92 | % | | | 1.02 | % | | | 1.46 | % | | | 1.80 | % | | | 1.28 | %(e) |
Portfolio Turnover | | | 28.89 | %(d) | | | 62.28 | % | | | 75.46 | % | | | 69.51 | % | | | 80.56 | % | | | 189.70 | %(d) |
| | (a) | The commencement of investment operations for Herndon Large Cap Value Fund Class I shares was March 1, 2011. |
| | (b) | The selected per share data was calculated using the weighted average shares outstanding method for the period. |
| | (c) | The total return is calculated using the Net Asset Value used for trading at the close of business at period end. |
| | (f) | Effective January 1, 2016, the Adviser changed the contractual expense limitation from 1.05% to 0.89%. |
See accompanying Notes to Financial Statements.
| | |
| |
| ASTON/Montag & Caldwell Growth Fund – Class N | | April 30, 2016 |
| |
| Financial Highlights | | |
| | | | | | | | | | | | | | | | | | | | | | | | |
| | | Six Months
Ended
04/30/16
(unaudited) | | | Year
Ended
10/13/15 | | | Year
Ended
10/31/14 | | | Year
Ended
10/31/13 | | | Year
Ended
10/31/12 | | | Year
Ended
10/31/11 | |
| | | | | | | | | | | | | | | | | | | | | | | | |
Net Asset Value, Beginning of Period | | $ | 26.67 | | | $ | 29.59 | | | $ | 28.68 | | | $ | 25.31 | | | $ | 24.72 | | | $ | 22.92 | |
| | | | | | | | | | | | | | | | | | | | | | | | |
Income from Investment Operations: | | | | | | | | | | | | | | | | | | | | | | | | |
Net investment income | | | 0.02 | (a) | | | 0.07 | (a) | | | 0.10 | (a) | | | 0.23 | (a) | | | 0.15 | (a) | | | 0.14 | (a) |
Net realized and unrealized gain (loss) on investments | | | (0.40 | ) | | | 2.06 | | | | 2.93 | | | | 5.07 | | | | 2.45 | | | | 1.83 | |
| | | | | | | | | | | | | | | | | | | | | | | | |
Total from investment operations | | | (0.38 | ) | | | 2.13 | | | | 3.03 | | | | 5.30 | | | | 2.60 | | | | 1.97 | |
| | | | | | | | | | | | | | | | | | | | | | | | |
Less Distributions: | | | | | | | | | | | | | | | | | | | | | | | | |
Distributions from and in excess of net investment income | | | (0.08 | ) | | | (0.05 | ) | | | (0.16 | ) | | | (0.22 | ) | | | (0.13 | ) | | | (0.13 | ) |
Distributions from net realized gain on investments | | | (6.75 | ) | | | (5.00 | ) | | | (1.96 | ) | | | (1.71 | ) | | | (1.88 | ) | | | (0.04 | ) |
| | | | | | | | | | | | | | | | | | | | | | | | |
Total distributions | | | (6.83 | ) | | | (5.05 | ) | | | (2.12 | ) | | | (1.93 | ) | | | (2.01 | ) | | | (0.17 | ) |
| | | | | | | | | | | | | | | | | | | | | | | | |
Net increase (decrease) in net asset value | | | (7.21 | ) | | | (2.92 | ) | | | 0.91 | | | | 3.37 | | | | 0.59 | | | | 1.80 | |
| | | | | | | | | | | | | | | | | | | | | | | | |
Net Asset Value, End of Period | | $ | 19.46 | | | $ | 26.67 | | | $ | 29.59 | | | $ | 28.68 | | | $ | 25.31 | | | $ | 24.72 | |
| | | | | | | | | | | | | | | | | | | | | | | | |
Total Return (b) | | | (2.28 | )%(c) | | | 7.93 | % | | | 10.98 | % | | | 22.61 | % | | | 11.40 | % | | | 8.56 | % |
| | | | | | |
Ratios/Supplemental Data: | | | | | | | | | | | | | | | | | | | | | | | | |
Net Assets, End of Period (in 000’s) | | $ | 718,585 | | | $ | 835,725 | | | $ | 1,344,317 | | | $ | 2,190,074 | | | $ | 1,908,663 | | | $ | 1,683,183 | |
Ratios of expenses to average net assets: | | | | | | | | | | | | | | | | | | | | | | | | |
Before expense reimbursement and/or fee waiver by Adviser | | | 1.12 | %(d) | | | 1.05 | % | | | 1.03 | % | | | 1.04 | % | | | 1.05 | % | | | 1.06 | % |
After expense reimbursement and/or fee waiver by Adviser | | | 1.12 | %(d) | | | 1.05 | % | | | 1.03 | % | | | 1.04 | % | | | 1.05 | % | | | 1.06 | % |
Ratios of net investment income to average net assets: | | | | | | | | | | | | | | | | | | | | | | | | |
Before expense reimbursement and/or fee waiver by Adviser | | | 0.22 | %(d) | | | 0.28 | % | | | 0.34 | % | | | 0.88 | % | | | 0.60 | % | | | 0.59 | % |
After expense reimbursement and/or fee waiver by Adviser | | | 0.22 | %(d) | | | 0.28 | % | | | 0.34 | % | | | 0.88 | % | | | 0.60 | % | | | 0.59 | % |
Portfolio Turnover | | | 27.27 | %(c) | | | 12.11 | % | | | 47.31 | % | | | 50.57 | % | | | 46.42 | % | | | 63.48 | % |
| | (a) | The selected per share data was calculated using the weighted average shares outstanding method for the period. |
| | (b) | The total return is calculated using the Net Asset Value used for trading at the close of business at period end. |
See accompanying Notes to Financial Statements.
| | |
| |
| ASTON/Montag & Caldwell Growth Fund – Class I | | April 30, 2016 |
| |
| Financial Highlights | | |
| | | | | | | | | | | | | | | | | | | | | | | | |
| | | Six Months
Ended
04/30/16
(unaudited) | | | Year
Ended
10/31/15 | | | Year
Ended
10/31/14 | | | Year
Ended
10/31/13 | | | Year
Ended
10/31/12 | | | Year
Ended
10/31/11 | |
| | | | | | | | | | | | | | | | | | | | | | | | |
Net Asset Value, Beginning of Period | | $ | 26.82 | | | $ | 29.80 | | | $ | 28.87 | | | $ | 25.46 | | | $ | 24.85 | | | $ | 23.05 | |
| | | | | | | | | | | | | | | | | | | | | | | | |
Income from Investment Operations: | | | | | | | | | | | | | | | | | | | | | | | | |
Net investment income | | | 0.05 | (a) | | | 0.14 | (a) | | | 0.17 | (a) | | | 0.30 | (a) | | | 0.21 | (a) | | | 0.21 | (a) |
Net realized and unrealized gain (loss) on investments | | | (0.39 | ) | | | 2.06 | | | | 2.96 | | | | 5.10 | | | | 2.47 | | | | 1.82 | |
| | | | | | | | | | | | | | | | | | | | | | | | |
Total from investment operations | | | (0.34 | ) | | | 2.20 | | | | 3.13 | | | | 5.40 | | | | 2.68 | | | | 2.03 | |
| | | | | | | | | | | | | | | | | | | | | | | | |
Less Distributions: | | | | | | | | | | | | | | | | | | | | | | | | |
Distributions from and in excess of net investment income | | | (0.16 | ) | | | (0.18 | ) | | | (0.24 | ) | | | (0.28 | ) | | | (0.19 | ) | | | (0.19 | ) |
Distributions from net realized gain on investments | | | (6.75 | ) | | | (5.00 | ) | | | (1.96 | ) | | | (1.71 | ) | | | (1.88 | ) | | | (0.04 | ) |
| | | | | | | | | | | | | | | | | | | | | | | | |
Total distributions | | | (6.91 | ) | | | (5.18 | ) | | | (2.20 | ) | | | (1.99 | ) | | | (2.07 | ) | | | (0.23 | ) |
| | | | | | | | | | | | | | | | | | | | | | | | |
Net increase (decrease) in net asset value | | | (7.25 | ) | | | (2.98 | ) | | | 0.93 | | | | 3.41 | | | | 0.61 | | | | 1.80 | |
| | | | | | | | | | | | | | | | | | | | | | | | |
Net Asset Value, End of Period | | $ | 19.57 | | | $ | 26.82 | | | $ | 29.80 | | | $ | 28.87 | | | $ | 25.46 | | | $ | 24.85 | |
| | | | | | | | | | | | | | | | | | | | | | | | |
Total Return (b) | | | (2.16 | )%(c) | | | 8.21 | % | | | 11.26 | % | | | 22.95 | % | | | 11.67 | % | | | 8.82 | % |
| | | | | | |
Ratios/Supplemental Data: | | | | | | | | | | | | | | | | | | | | | | | | |
Net Assets, End of Period (in 000’s) | | $ | 886,881 | | | $ | 1,344,231 | | | $ | 2,784,650 | | | $ | 3,035,623 | | | $ | 2,406,145 | | | $ | 1,749,183 | |
Ratios of expenses to average net assets: | | | | | | | | | | | | | | | | | | | | | | | | |
Before expense reimbursement and/or fee waiver by Adviser | | | 0.87 | %(d) | | | 0.80 | % | | | 0.78 | % | | | 0.79 | % | | | 0.80 | % | | | 0.81 | % |
After expense reimbursement and/or fee waiver by Adviser | | | 0.87 | %(d) | | | 0.80 | % | | | 0.78 | % | | | 0.79 | % | | | 0.80 | % | | | 0.81 | % |
Ratios of net investment income to average net assets: | | | | | | | | | | | | | | | | | | | | | | | | |
Before expense reimbursement and/or fee waiver by Adviser | | | 0.47 | %(d) | | | 0.53 | % | | | 0.59 | % | | | 1.13 | % | | | 0.85 | % | | | 0.84 | % |
After expense reimbursement and/or fee waiver by Adviser | | | 0.47 | %(d) | | | 0.53 | % | | | 0.59 | % | | | 1.13 | % | | | 0.85 | % | | | 0.84 | % |
Portfolio Turnover | | | 27.27 | %(c) | | | 12.11 | % | | | 47.31 | % | | | 50.57 | % | | | 46.42 | % | | | 63.48 | % |
| | (a) | The selected per share data was calculated using the weighted average shares outstanding method for the period. |
| | (b) | The total return is calculated using the Net Asset Value used for trading at the close of business at period end. |
See accompanying Notes to Financial Statements.
| | |
| |
| ASTON/Montag & Caldwell Growth Fund – Class R | | April 30, 2016 |
| |
| Financial Highlights | | |
| | | | | | | | | | | | | | | | | | | | | | | | |
| | | Six Months
Ended
04/30/16
(unaudited) | | | Year
Ended
10/31/15 | | | Year
Ended
10/31/14 | | | Year
Ended
10/31/13 | | | Year
Ended
10/31/12 | | | Year
Ended
10/31/11 | |
Net Asset Value, Beginning of Period | | $ | 26.22 | | | $ | 29.21 | | | $ | 28.33 | | | $ | 25.02 | | | $ | 24.45 | | | $ | 22.70 | |
| | | | | | | | | | | | | | | | | | | | | | | | |
Income from Investment Operations: | | | | | | | | | | | | | | | | | | | | | | | | |
Net investment income (loss) | | | (0.00 | )(a)(b) | | | 0.01 | (a) | | | 0.03 | (a) | | | 0.16 | (a) | | | 0.09 | (a) | | | 0.08 | (a) |
Net realized and unrealized gain (loss) on investments | | | (0.38 | ) | | | 2.01 | | | | 2.91 | | | | 5.01 | | | | 2.43 | | | | 1.80 | |
| | | | | | | | | | | | | | | | | | | | | | | | |
Total from investment operations | | | (0.38 | ) | | | 2.02 | | | | 2.94 | | | | 5.17 | | | | 2.52 | | | | 1.88 | |
| | | | | | | | | | | | | | | | | | | | | | | | |
Less Distributions: | | | | | | | | | | | | | | | | | | | | | | | | |
Distributions from and in excess of net investment income | | | (0.02 | ) | | | (0.01 | ) | | | (0.10 | ) | | | (0.15 | ) | | | (0.07 | ) | | | (0.09 | ) |
Distributions from net realized gain on investments | | | (6.75 | ) | | | (5.00 | ) | | | (1.96 | ) | | | (1.71 | ) | | | (1.88 | ) | | | (0.04 | ) |
| | | | | | | | | | | | | | | | | | | | | | | | |
Total distributions | | | (6.77 | ) | | | (5.01 | ) | | | (2.06 | ) | | | (1.86 | ) | | | (1.95 | ) | | | (0.13 | ) |
| | | | | | | | | | | | | | | | | | | | | | | | |
Net increase (decrease) in net asset value . | | | (7.15 | ) | | | (2.99 | ) | | | 0.88 | | | | 3.31 | | | | 0.57 | | | | 1.75 | |
| | | | | | | | | | | | | | | | | | | | | | | | |
Net Asset Value, End of Period | | $ | 19.07 | | | $ | 26.22 | | | $ | 29.21 | | | $ | 28.33 | | | $ | 25.02 | | | $ | 24.45 | |
| | | | | | | | | | | | | | | | | | | | | | | | |
Total Return (c) | | | (2.38 | )%(d) | | | 7.66 | % | | | 10.74 | % | | | 22.30 | % | | | 11.10 | % | | | 8.29 | % |
| | | | | | |
Ratios/Supplemental Data: | | | | | | | | | | | | | | | | | | | | | | | | |
Net Assets, End of Period (in 000’s) | | $ | 5,756 | | | $ | 5,877 | | | $ | 7,701 | | | $ | 10,099 | | | $ | 8,771 | | | $ | 8,654 | |
Ratios of expenses to average net assets: | | | | | | | | | | | | | | | | | | | | | | | | |
Before expense reimbursement and/or fee waiver by Adviser | | | 1.37 | %(e) | | | 1.30 | % | | | 1.28 | % | | | 1.29 | % | | | 1.30 | % | | | 1.31 | % |
After expense reimbursement and/or fee waiver by Adviser | | | 1.37 | %(e) | | | 1.30 | % | | | 1.28 | % | | | 1.29 | % | | | 1.30 | % | | | 1.31 | % |
Ratios of net investment income (loss) to average net assets: | | | | | | | | | | | | | | | | | | | | | | | | |
Before expense reimbursement and/or fee waiver by Adviser | | | (0.03 | )%(e) | | | 0.03 | % | | | 0.09 | % | | | 0.63 | % | | | 0.35 | % | | | 0.34 | % |
After expense reimbursement and/or fee waiver by Adviser | | | (0.03 | )%(e) | | | 0.03 | % | | | 0.09 | % | | | 0.63 | % | | | 0.35 | % | | | 0.34 | % |
Portfolio Turnover | | | 27.27 | %(d) | | | 12.11 | % | | | 47.31 | % | | | 50.57 | % | | | 46.42 | % | | | 63.48 | % |
| | (a) | The selected per share data was calculated using the weighted average shares outstanding method for the period. |
| | (b) | Represents less than $(0.005) per share. |
| | (c) | The total return is calculated using the Net Asset Value used for trading at the close of business at period end. |
See accompanying Notes to Financial Statements.
| | |
| |
| ASTON/River Road Dividend All Cap Value Fund – Class N | | April 30, 2016 |
| |
| Financial Highlights | | |
| | | | | | | | | | | | | | | | | | | | | | | | |
| | | Six Months
Ended
04/30/16
(unaudited) | | | Year
Ended
10/31/15 | | | Year
Ended
10/31/14 | | | Year
Ended
10/31/13 | | | Year
Ended
10/31/12 | | | Year
Ended
10/31/11 | |
Net Asset Value, Beginning of Period | | $ | 12.67 | | | $ | 14.05 | | | $ | 13.99 | | | $ | 11.67 | | | $ | 10.68 | | | $ | 10.23 | |
| | | | | | | | | | | | | | | | | | | | | | | | |
Income from Investment Operations: | | | | | | | | | | | | | | | | | | | | | | | | |
Net investment income | | | 0.13 | (a) | | | 0.21 | | | | 0.42 | | | | 0.30 | | | | 0.31 | (a) | | | 0.29 | (a) |
Net realized and unrealized gain (loss) on investments | | | 0.51 | | | | (0.20 | ) | | | 0.89 | | | | 2.73 | | | | 1.05 | | | | 0.42 | |
| | | | | | | | | | | | | | | | | | | | | | | | |
Total from investment operations | | | 0.64 | | | | 0.01 | | | | 1.31 | | | | 3.03 | | | | 1.36 | | | | 0.71 | |
| | | | | | | | | | | | | | | | | | | | | | | | |
Less Distributions: | | | | | | | | | | | | | | | | | | | | | | | | |
Distributions from and in excess of net investment income | | | (0.08 | ) | | | (0.22 | ) | | | (0.44 | ) | | | (0.27 | ) | | | (0.30 | ) | | | (0.26 | ) |
Distributions from net realized gain on investments | | | (1.16 | ) | | | (1.17 | ) | | | (0.81 | ) | | | (0.44 | ) | | | (0.07 | ) | | | — | |
| | | | | | | | | | | | | | | | | | | | | | | | |
Total distributions | | | (1.24 | ) | | | (1.39 | ) | | | (1.25 | ) | | | (0.71 | ) | | | (0.37 | ) | | | (0.26 | ) |
| | | | | | | | | | | | | | | | | | | | | | | | |
Net increase (decrease) in net asset value | | | (0.60 | ) | | | (1.38 | ) | | | 0.06 | | | | 2.32 | | | | 0.99 | | | | 0.45 | |
| | | | | | | | | | | | | | | | | | | | | | | | |
Net Asset Value, End of Period | | $ | 12.07 | | | $ | 12.67 | | | $ | 14.05 | | | $ | 13.99 | | | $ | 11.67 | | | $ | 10.68 | |
| | | | | | | | | | | | | | | | | | | | | | | | |
Total Return (b) | | | 5.68 | %(c) | | | (0.23 | )% | | | 9.89 | % | | | 27.47 | % | | | 12.96 | % | | | 6.94 | % |
| | | | | | |
Ratios/Supplemental Data: | | | | | | | | | | | | | | | | | | | | | | | | |
Net Assets, End of Period (in 000’s) | | $ | 210,625 | | | $ | 214,789 | | | $ | 349,937 | | | $ | 449,130 | | | $ | 338,166 | | | $ | 301,290 | |
Ratios of expenses to average net assets: | | | | | | | | | | | | | | | | | | | | | | | | |
Before expense reimbursement and/or fee waiver by Adviser | | | 1.12 | %(d) | | | 1.10 | % | | | 1.09 | % | | | 1.09 | % | | | 1.12 | % | | | 1.12 | % |
After expense reimbursement and/or fee waiver by Adviser | | | 1.12 | %(d) | | | 1.10 | % | | | 1.09 | % | | | 1.09 | % | | | 1.12 | % | | | 1.12 | % |
Ratios of net investment income to average net assets: | | | | | | | | | | | | | | | | | | | | | | | | |
Before expense reimbursement and/or fee waiver by Adviser | | | 2.22 | %(d) | | | 1.62 | % | | | 2.96 | % | | | 2.38 | % | | | 2.74 | % | | | 2.70 | % |
After expense reimbursement and/or fee waiver by Adviser | | | 2.22 | %(d) | | | 1.62 | % | | | 2.96 | % | | | 2.38 | % | | | 2.74 | % | | | 2.70 | % |
Portfolio Turnover | | | 15.18 | %(c) | | | 26.68 | % | | | 31.78 | % | | | 35.18 | % | | | 28.17 | % | | | 24.65 | % |
| | (a) | The selected per share data was calculated using the weighted average shares outstanding method for the period. |
| | (b) | The total return is calculated using the Net Asset Value used for trading at the close of business at period end. |
See accompanying Notes to Financial Statements.
| | |
| |
| ASTON/River Road Dividend All Cap Value Fund – Class I | | April 30, 2016 |
| |
| Financial Highlights | | |
| | | | | | | | | | | | | | | | | | | | | | | | |
| | | Six Months
Ended
04/30/16
(unaudited) | | | Year
Ended
10/31/15 | | | Year
Ended
10/31/14 | | | Year
Ended
10/31/13 | | | Year
Ended
10/31/12 | | | Year
Ended
10/31/11 | |
Net Asset Value, Beginning of Period | | $ | 12.66 | | | $ | 14.04 | | | $ | 13.98 | | | $ | 11.66 | | | $ | 10.67 | | | $ | 10.22 | |
| | | | | | | | | | | | | | | | | | | | | | | | |
Income from Investment Operations: | | | | | | | | | | | | | | | | | | | | | | | | |
Net investment income | | | 0.14 | (a) | | | 0.25 | | | | 0.44 | | | | 0.34 | | | | 0.34 | (a) | | | 0.32 | (a) |
Net realized and unrealized gain (loss) on investments | | | 0.51 | | | | (0.20 | ) | | | 0.90 | | | | 2.72 | | | | 1.05 | | | | 0.42 | |
| | | | | | | | | | | | | | | | | | | | | | | | |
Total from investment operations | | | 0.65 | | | | 0.05 | | | | 1.34 | | | | 3.06 | | | | 1.39 | | | | 0.74 | |
| | | | | | | | | | | | | | | | | | | | | | | | |
Less Distributions: | | | | | | | | | | | | | | | | | | | | | | | | |
Distributions from and in excess of net investment income | | | (0.09 | ) | | | (0.26 | ) | | | (0.47 | ) | | | (0.30 | ) | | | (0.33 | ) | | | (0.29 | ) |
Distributions from net realized gain on investments | | | (1.16 | ) | | | (1.17 | ) | | | (0.81 | ) | | | (0.44 | ) | | | (0.07 | ) | | | — | |
| | | | | | | | | | | | | | | | | | | | | | | | |
Total distributions | | | (1.25 | ) | | | (1.43 | ) | | | (1.28 | ) | | | (0.74 | ) | | | (0.40 | ) | | | (0.29 | ) |
| | | | | | | | | | | | | | | | | | | | | | | | |
Net increase (decrease) in net asset value . | | | (0.60 | ) | | | (1.38 | ) | | | 0.06 | | | | 2.32 | | | | 0.99 | | | | 0.45 | |
| | | | | | | | | | | | | | | | | | | | | | | | |
Net Asset Value, End of Period | | $ | 12.06 | | | $ | 12.66 | | | $ | 14.04 | | | $ | 13.98 | | | $ | 11.66 | | | $ | 10.67 | |
| | | | | | | | | | | | | | | | | | | | | | | | |
Total Return (b) | | | 5.81 | %(c) | | | 0.02 | % | | | 10.18 | % | | | 27.81 | % | | | 13.25 | % | | | 7.21 | % |
| | | | | | |
Ratios/Supplemental Data: | | | | | | | | | | | | | | | | | | | | | | | | |
Net Assets, End of Period (in 000’s) | | $ | 499,425 | | | $ | 635,189 | | | $ | 788,322 | | | $ | 779,859 | | | $ | 586,043 | | | $ | 318,863 | |
Ratios of expenses to average net assets: | | | | | | | | | | | | | | | | | | | | | | | | |
Before expense reimbursement and/or fee waiver by Adviser | | | 0.87 | %(d) | | | 0.85 | % | | | 0.84 | % | | | 0.84 | % | | | 0.87 | % | | | 0.87 | % |
After expense reimbursement and/or fee waiver by Adviser | | | 0.87 | %(d) | | | 0.85 | % | | | 0.84 | % | | | 0.84 | % | | | 0.87 | % | | | 0.87 | % |
Ratios of net investment income to average net assets: | | | | | | | | | | | | | | | | | | | | | | | | |
Before expense reimbursement and/or fee waiver by Adviser | | | 2.47 | %(d) | | | 1.87 | % | | | 3.21 | % | | | 2.63 | % | | | 2.99 | % | | | 2.95 | % |
After expense reimbursement and/or fee waiver by Adviser | | | 2.47 | %(d) | | | 1.87 | % | | | 3.21 | % | | | 2.63 | % | | | 2.99 | % | | | 2.95 | % |
Portfolio Turnover | | | 15.18 | %(c) | | | 26.68 | % | | | 31.78 | % | | | 35.18 | % | | | 28.17 | % | | | 24.65 | % |
| | (a) | The selected per share data was calculated using the weighted average shares outstanding method for the period. |
| | (b) | The total return is calculated using the Net Asset Value used for trading at the close of business at period end. |
See accompanying Notes to Financial Statements.
| | |
| |
| ASTON/River Road Dividend All Cap Value Fund II – Class N | | April 30, 2016 |
| |
| Financial Highlights | | |
| | | | | | | | | | | | | | | | | | | | |
| | | Six Months
Ended
04/30/16
(unaudited) | | | Year
Ended
10/31/15 | | | Year
Ended
10/31/14 | | | Year
Ended
10/31/13 | | | Period
Ended
10/31/12(a) | |
Net Asset Value, Beginning of Period | | $ | 12.99 | | | $ | 13.69 | | | $ | 12.89 | | | $ | 10.44 | | | $ | 10.00 | |
| | | | | | | | | | | | | | | | | | | | |
Income from Investment Operations: | | | | | | | | | | | | | | | | | | | | |
Net investment income | | | 0.13 | (b) | | | 0.22 | (b) | | | 0.36 | | | | 0.22 | | | | 0.09 | (b) |
Net realized and unrealized gain (loss) on investments | | | 0.57 | | | | (0.26 | ) | | | 0.96 | | | | 2.46 | | | | 0.41 | |
| | | | | | | | | | | | | | | | | | | | |
Total from investment operations | | | 0.70 | | | | (0.04 | ) | | | 1.32 | | | | 2.68 | | | | 0.50 | |
| | | | | | | | | | | | | | | | | | | | |
Less Distributions: | | | | | | | | | | | | | | | | | | | | |
Distributions from and in excess of net investment income | | | (0.10 | ) | | | (0.23 | ) | | | (0.38 | ) | | | (0.23 | ) | | | (0.06 | ) |
Distributions from net realized gain on investments | | | (0.19 | ) | | | (0.43 | ) | | | (0.14 | ) | | | (0.00 | )(c) | | | — | |
| | | | | | | | | | | | | | | | | | | | |
Total distributions | | | (0.29 | ) | | | (0.66 | ) | | | (0.52 | ) | | | (0.23 | ) | | | (0.06 | ) |
| | | | | | | | | | | | | | | | | | | | |
Net increase (decrease) in net asset value | | | 0.41 | | | | (0.70 | ) | | | 0.80 | | | | 2.45 | | | | 0.44 | |
| | | | | | | | | | | | | | | | | | | | |
Net Asset Value, End of Period | | $ | 13.40 | | | $ | 12.99 | | | $ | 13.69 | | | $ | 12.89 | | | $ | 10.44 | |
| | | | | | | | | | | | | | | | | | | | |
Total Return (d) | | | 5.50 | %(e) | | | (0.47 | )% | | | 10.46 | % | | | 25.99 | % | | | 5.09 | %(e) |
| | | | | |
Ratios/Supplemental Data: | | | | | | | | | | | | | | | | | | | | |
Net Assets, End of Period (in 000’s) | | $ | 3,007 | | | $ | 2,930 | | | $ | 7,037 | | | $ | 3,634 | | | $ | 1,049 | |
Ratios of expenses to average net assets: | | | | | | | | | | | | | | | | | | | | |
Before expense reimbursement and/or fee waiver, or recoupment by Adviser | | | 1.19 | %(f) | | | 1.15 | % | | | 1.17 | % | | | 1.37 | % | | | 4.99 | %(f) |
After expense reimbursement and/or fee waiver, or recoupment by Adviser | | | 1.19 | %(f) | | | 1.15 | % | | | 1.25 | % | | | 1.30 | % | | | 1.30 | %(f) |
Ratios of net investment income (loss) to average net assets: | | | | | | | | | | | | | | | | | | | | |
Before expense reimbursement and/or fee waiver, or recoupment by Adviser | | | 2.09 | %(f) | | | 1.62 | % | | | 2.81 | % | | | 1.68 | % | | | (1.24 | )%(f) |
After expense reimbursement and/or fee waiver, or recoupment by Adviser | | | 2.09 | %(f) | | | 1.62 | % | | | 2.72 | % | | | 1.76 | % | | | 2.45 | %(f) |
Portfolio Turnover | | | 15.14 | %(e) | | | 34.86 | % | | | 29.42 | % | | | 27.80 | % | | | 5.58 | %(e)(g) |
| | (a) | The commencement of investment operations for River Road Dividend All Cap Value Fund II Class N shares was June 26, 2012. |
| | (b) | The selected per share data was calculated using the weighted average shares outstanding method for the period. |
| | (c) | Represents less than $(0.005) per share. |
| | (d) | The total return is calculated using the Net Asset Value used for trading at the close of business at period end. |
| | (g) | Portfolio turnover excludes securities received from processing a subscription in-kind. |
See accompanying Notes to Financial Statements.
| | |
| |
| ASTON/River Road Dividend All Cap Value Fund II – Class I | | April 30, 2016 |
| |
| Financial Highlights | | |
| | | | | | | | | | | | | | | | | | | | |
| | | Six Months
Ended
04/30/16
(unaudited) | | | Year
Ended
10/31/15 | | | Year
Ended
10/31/14 | | | Year
Ended
10/31/13 | | | Period
Ended
10/31/12(a) | |
Net Asset Value, Beginning of Period | | $ | 13.00 | | | $ | 13.69 | | | $ | 12.89 | | | $ | 10.45 | | | $ | 10.00 | |
| | | | | | | | | | | | | | | | | | | | |
Income from Investment Operations: | | | | | | | | | | | | | | | | | | | | |
Net investment income | | | 0.15 | (b) | | | 0.25 | (b) | | | 0.39 | | | | 0.25 | | | | 0.10 | (b) |
Net realized and unrealized gain (loss) on investments | | | 0.57 | | | | (0.25 | ) | | | 0.96 | | | | 2.45 | | | | 0.42 | |
| | | | | | | | | | | | | | | | | | | | |
Total from investment operations | | | 0.72 | | | | — | | | | 1.35 | | | | 2.70 | | | | 0.52 | |
| | | | | | | | | | | | | | | | | | | | |
Less Distributions: | | | | | | | | | | | | | | | | | | | | |
Distributions from and in excess of net investment income | | | (0.12 | ) | | | (0.26 | ) | | | (0.41 | ) | | | (0.26 | ) | | | (0.07 | ) |
Distributions from net realized gain on investments | | | (0.19 | ) | | | (0.43 | ) | | | (0.14 | ) | | | (0.00 | )(c) | | | — | |
| | | | | | | | | | | | | | | | | | | | |
Total distributions | | | (0.31 | ) | | | (0.69 | ) | | | (0.55 | ) | | | (0.26 | ) | | | (0.07 | ) |
| | | | | | | | | | | | | | | | | | | | |
Net increase (decrease) in net asset value | | | 0.41 | | | | (0.69 | ) | | | 0.80 | | | | 2.44 | | | | 0.45 | |
| | | | | | | | | | | | | | | | | | | | |
Net Asset Value, End of Period | | $ | 13.41 | | | $ | 13.00 | | | $ | 13.69 | | | $ | 12.89 | | | $ | 10.45 | |
| | | | | | | | | | | | | | | | | | | | |
Total Return (d) | | | 5.63 | %(e) | | | (0.13 | )% | | | 10.73 | % | | | 26.30 | % | | | 5.17 | %(e) |
| | | | | |
Ratios/Supplemental Data: | | | | | | | | | | | | | | | | | | | | |
Net Assets, End of Period (in 000’s) | | $ | 115,507 | | | $ | 121,414 | | | $ | 125,660 | | | $ | 86,240 | | | $ | 9,370 | |
Ratios of expenses to average net assets: | | | | | | | | | | | | | | | | | | | | |
Before expense reimbursement and/or fee waiver, or recoupment by Adviser | | | 0.94 | %(f) | | | 0.90 | % | | | 0.92 | % | | | 1.12 | % | | | 4.74 | %(f) |
After expense reimbursement and/or fee waiver, or recoupment by Adviser | | | 0.94 | %(f) | | | 0.90 | % | | | 1.00 | % | | | 1.05 | % | | | 1.05 | %(f) |
Ratios of net investment income (loss) to average net assets: | | | | | | | | | | | | | | | | | | | | |
Before expense reimbursement and/or fee waiver, or recoupment by Adviser | | | 2.34 | %(f) | | | 1.87 | % | | | 3.06 | % | | | 1.93 | % | | | (0.99 | )%(f) |
After expense reimbursement and/or fee waiver, or recoupment by Adviser | | | 2.34 | %(f) | | | 1.87 | % | | | 2.97 | % | | | 2.01 | % | | | 2.70 | %(f) |
Portfolio Turnover | | | 15.14 | %(e) | | | 34.86 | % | | | 29.42 | % | | | 27.80 | % | | | 5.58 | %(e)(g) |
| | (a) | The commencement of investment operations for River Road Dividend All Cap Value Fund II Class I shares was June 26, 2012. |
| | (b) | The selected per share data was calculated using the weighted average shares outstanding method for the period. |
| | (c) | Represents less than $(0.005) per share. |
| | (d) | The total return is calculated using the Net Asset Value used for trading at the close of business at period end. |
| | (g) | Portfolio turnover excludes securities received from processing a subscription in-kind. |
See accompanying Notes to Financial Statements.
| | |
| |
| ASTON/Fairpointe Mid Cap Fund – Class N | | April 30, 2016 |
| |
| Financial Highlights | | |
| | | | | | | | | | | | | | | | | | | | | | | | |
| | | Six Months
Ended
04/30/16
(unaudited) | | | Year
Ended
10/31/15 | | | Year
Ended
10/31/14 | | | Year
Ended
10/31/13 | | | Year
Ended
10/31/12 | | | Year
Ended
10/31/11 | |
Net Asset Value, Beginning of Period | | $ | 37.56 | | | $ | 46.89 | | | $ | 45.40 | | | $ | 32.79 | | | $ | 29.76 | | | $ | 29.04 | |
| | | | | | | | | | | | | | | | | | | | | | | | |
Income from Investment Operations: | | | | | | | | | | | | | | | | | | | | | | | | |
Net investment income (loss) | | | 0.09 | (a) | | | 0.12 | | | | (0.06 | ) | | | 0.17 | | | | 0.16 | | | | 0.06 | (a) |
Net realized and unrealized gain (loss) on investments | | | 0.38 | | | | (1.83 | ) | | | 5.82 | | | | 13.48 | | | | 3.13 | | | | 0.82 | |
| | | | | | | | | | | | | | | | | | | | | | | | |
Total from investment operations | | | 0.47 | | | | (1.71 | ) | | | 5.76 | | | | 13.65 | | | | 3.29 | | | | 0.88 | |
| | | | | | | | | | | | | | | | | | | | | | | | |
Less Distributions: | | | | | | | | | | | | | | | | | | | | | | | | |
Distributions from and in excess of net investment income | | | (0.11 | ) | | | (0.04 | ) | | | — | | | | (0.30 | ) | | | (0.05 | ) | | | (0.08 | ) |
Distributions from net realized gain on investments | | | (2.05 | ) | | | (7.58 | ) | | | (4.27 | ) | | | (0.74 | ) | | | (0.21 | ) | | | (0.08 | ) |
| | | | | | | | | | | | | | | | | | | | | | | | |
Total distributions | | | (2.16 | ) | | | (7.62 | ) | | | (4.27 | ) | | | (1.04 | ) | | | (0.26 | ) | | | (0.16 | ) |
| | | | | | | | | | | | | | | | | | | | | | | | |
Net increase (decrease) in net asset value . | | | (1.69 | ) | | | (9.33 | ) | | | 1.49 | | | | 12.61 | | | | 3.03 | | | | 0.72 | |
| | | | | | | | | | | | | | | | | | | | | | | | |
Net Asset Value, End of Period | | $ | 35.87 | | | $ | 37.56 | | | $ | 46.89 | | | $ | 45.40 | | | $ | 32.79 | | | $ | 29.76 | |
| | | | | | | | | | | | | | | | | | | | | | | | |
Total Return (b) | | | 1.46 | %(c) | | | (5.02 | )% | | | 13.32 | % | | | 42.88 | % | | | 11.15 | % | | | 2.98 | % |
| | | | | | |
Ratios/Supplemental Data: | | | | | | | | | | | | | | | | | | | | | | | | |
Net Assets, End of Period (in 000’s) | | $ | 1,551,239 | | | $ | 1,861,753 | | | $ | 2,432,815 | | | $ | 2,370,432 | | | $ | 1,561,510 | | | $ | 1,502,266 | |
Ratios of expenses to average net assets: | | | | | | | | | | | | | | | | | | | | | | | | |
Before expense reimbursement and/or fee waiver by Adviser | | | 1.13 | %(d) | | | 1.11 | % | | | 1.10 | % | | | 1.11 | % | | | 1.11 | %(e) | | | 1.14 | %(e) |
After expense reimbursement and/or fee waiver by Adviser | | | 1.13 | %(d) | | | 1.11 | % | | | 1.10 | % | | | 1.11 | % | | | 1.11 | %(e) | | | 1.14 | %(e) |
Ratios of net investment income (loss) to average net assets: | | | | | | | | | | | | | | | | | | | | | | | | |
Before expense reimbursement and/or fee waiver by Adviser | | | 0.53 | %(d) | | | 0.27 | % | | | (0.12 | )% | | | 0.42 | % | | | 0.50 | % | | | 0.21 | % |
After expense reimbursement and/or fee waiver by Adviser | | | 0.53 | %(d) | | | 0.27 | % | | | (0.12 | )% | | | 0.42 | % | | | 0.50 | % | | | 0.21 | % |
Portfolio Turnover | | | 15.26 | %(c) | | | 31.75 | % | | | 50.25 | % | | | 36.98 | % | | | 28.06 | %(f) | | | 11.20 | % |
| | (a) | The selected per share data was calculated using the weighted average shares outstanding method for the period. |
| | (b) | The total return is calculated using the Net Asset Value used for trading at the close of business at period end. |
| | (e) | Ratios of expenses to average net assets include interest expense of less than 0.005% for each of the years ended October 31, 2012, and October 31, 2011, which is not included in the contractual expense limitation. The interest expense is a result of utilizing the line of credit, as discussed in Note H to the Financial Statements. |
| | (f) | Portfolio turnover rate excludes securities delivered from processing a redemption in-kind. |
See accompanying Notes to Financial Statements.
| | |
| |
| ASTON/Fairpointe Mid Cap Fund – Class I | | April 30, 2016 |
| |
| Financial Highlights | | |
| | | | | | | | | | | | | | | | | | | | | | | | |
| | | Six Months
Ended
04/30/16
(unaudited) | | | Year
Ended
10/31/15 | | | Year
Ended
10/31/14 | | | Year
Ended
10/31/13 | | | Year
Ended
10/31/12 | | | Year
Ended
10/31/11 | |
Net Asset Value, Beginning of Period | | $ | 38.44 | | | $ | 47.74 | | | $ | 46.10 | | | $ | 33.28 | | | $ | 30.20 | | | $ | 29.41 | |
| | | | | | | | | | | | | | | | | | | | | | | | |
Income from Investment Operations: | | | | | | | | | | | | | | | | | | | | | | | | |
Net investment income | | | 0.14 | (a) | | | 0.23 | | | | 0.05 | | | | 0.28 | | | | 0.24 | | | | 0.14 | (a) |
Net realized and unrealized gain (loss) on investments | | | 0.40 | | | | (1.89 | ) | | | 5.92 | | | | 13.67 | | | | 3.18 | | | | 0.82 | |
| | | | | | | | | | | | | | | | | | | | | | | | |
Total from investment operations | | | 0.54 | | | | (1.66 | ) | | | 5.97 | | | | 13.95 | | | | 3.42 | | | | 0.96 | |
| | | | | | | | | | | | | | | | | | | | | | | | |
Less Distributions: | | | | | | | | | | | | | | | | | | | | | | | | |
Distributions from and in excess of net investment income | | | (0.23 | ) | | | (0.06 | ) | | | (0.06 | ) | | | (0.39 | ) | | | (0.13 | ) | | | (0.09 | ) |
Distributions from net realized gain on investment | | | (2.05 | ) | | | (7.58 | ) | | | (4.27 | ) | | | (0.74 | ) | | | (0.21 | ) | | | (0.08 | ) |
| | | | | | | | | | | | | | | | | | | | | | | | |
Total distributions | | | (2.28 | ) | | | (7.64 | ) | | | (4.33 | ) | | | (1.13 | ) | | | (0.34 | ) | | | (0.17 | ) |
| | | | | | | | | | | | | | | | | | | | | | | | |
Net increase (decrease) in net asset value | | | (1.74 | ) | | | (9.30 | ) | | | 1.64 | | | | 12.82 | | | | 3.08 | | | | 0.79 | |
| | | | | | | | | | | | | | | | | | | | | | | | |
Net Asset Value, End of Period | | $ | 36.70 | | | $ | 38.44 | | | $ | 47.74 | | | $ | 46.10 | | | $ | 33.28 | | | $ | 30.20 | |
| | | | | | | | | | | | | | | | | | | | | | | | |
Total Return (b) | | | 1.59 | %(c) | | | (4.78 | )% | | | 13.61 | % | | | 43.23 | % | | | 11.46 | % | | | 3.22 | % |
| | | | | | |
Ratios/Supplemental Data: | | | | | | | | | | | | | | | | | | | | | | | | |
Net Assets, End of Period (in 000’s) | | $ | 2,230,862 | | | $ | 2,838,642 | | | $ | 3,531,114 | | | $ | 2,521,876 | | | $ | 1,464,222 | | | $ | 1,339,223 | |
Ratios of expenses to average net assets: | | | | | | | | | | | | | | | | | | | | | | | | |
Before expense reimbursement and/or fee waiver by Adviser | | | 0.88 | %(d) | | | 0.86 | % | | | 0.85 | % | | | 0.86 | % | | | 0.86 | %(e) | | | 0.89 | %(e) |
After expense reimbursement and/or fee waiver by Adviser | | | 0.88 | %(d) | | | 0.86 | % | | | 0.85 | % | | | 0.86 | % | | | 0.86 | %(e) | | | 0.89 | %(e) |
Ratios of net investment income to average net assets: | | | | | | | | | | | | | | | | | | | | | | | | |
Before expense reimbursement and/or fee waiver by Adviser | | | 0.78 | %(d) | | | 0.52 | % | | | 0.13 | % | | | 0.67 | % | | | 0.75 | % | | | 0.46 | % |
After expense reimbursement and/or fee waiver by Adviser | | | 0.78 | %(d) | | | 0.52 | % | | | 0.13 | % | | | 0.67 | % | | | 0.75 | % | | | 0.46 | % |
Portfolio Turnover | | | 15.26 | %(c) | | | 31.75 | % | | | 50.25 | % | | | 36.98 | % | | | 28.06 | %(f) | | | 11.20 | % |
| | (a) | The selected per share data was calculated using the weighted average shares outstanding method for the period. |
| | (b) | The total return is calculated using the Net Asset Value used for trading at the close of business at period end. |
| | (e) | Ratios of expenses to average net assets include interest expense of less than 0.005% for each of the years ended October 31, 2012, and October 31, 2011, which is not included in the contractual expense limitation. The interest expense is a result of utilizing the line of credit, as discussed in Note H to the Financial Statements. |
| | (f) | Portfolio turnover rate excludes securities delivered from processing a redemption in-kind. |
See accompanying Notes to Financial Statements.
| | |
| |
| ASTON/Montag & Caldwell Mid Cap Growth Fund – Class N | | April 30, 2016 |
| |
| Financial Highlights | | |
| | | | | | | | | | | | | | | | | | | | | | | | |
| | | Six Months
Ended
04/30/16
(unaudited) | | | Year
Ended
10/31/15 | | | Year
Ended
10/31/14 | | | Year
Ended
10/31/13 | | | Year
Ended
10/31/12 | | | Year
Ended
10/31/11 | |
Net Asset Value, Beginning of Period | | $ | 11.57 | | | $ | 11.99 | | | $ | 12.77 | | | $ | 10.36 | | | $ | 9.71 | | | $ | 8.51 | |
| | | | | | | | | | | | | | | | | | | | | | | | |
Income from Investment Operations: | | | | | | | | | | | | | | | | | | | | | | | | |
Net investment loss | | | (0.03 | )(a) | | | (0.08 | ) | | | (0.06 | )(a) | | | (0.07 | ) | | | (0.07 | )(a) | | | (0.07 | ) |
Net realized and unrealized gain on investments | | | 0.04 | | | | 0.65 | | | | 1.20 | | | | 2.58 | | | | 0.72 | | | | 1.27 | |
| | | | | | | | | | | | | | | | | | | | | | | | |
Total from investment operations | | | 0.01 | | | | 0.57 | | | | 1.14 | | | | 2.51 | | | | 0.65 | | | | 1.20 | |
| | | | | | | | | | | | | | | | | | | | | | | | |
Less Distributions: | | | | | | | | | | | | | | | | | | | | | | | | |
Distributions from net realized gain on investments | | | (1.33 | ) | | | (0.99 | ) | | | (1.92 | ) | | | (0.10 | ) | | | — | | | | — | |
| | | | | | | | | | | | | | | | | | | | | | | | |
Total distributions | | | (1.33 | ) | | | (0.99 | ) | | | (1.92 | ) | | | (0.10 | ) | | | — | | | | — | |
| | | | | | | | | | | | | | | | | | | | | | | | |
Net increase (decrease) in net asset value | | | (1.32 | ) | | | (0.42 | ) | | | (0.78 | ) | | | 2.41 | | | | 0.65 | | | | 1.20 | |
| | | | | | | | | | | | | | | | | | | | | | | | |
Net Asset Value, End of Period | | $ | 10.25 | | | $ | 11.57 | | | $ | 11.99 | | | $ | 12.77 | | | $ | 10.36 | | | $ | 9.71 | |
| | | | | | | | | | | | | | | | | | | | | | | | |
Total Return (b) | | | (0.02 | )%(c) | | | 4.81 | % | | | 9.75 | % | | | 24.51 | % | | | 6.70 | % | | | 14.10 | % |
| | | | | | |
Ratios/Supplemental Data: | | | | | | | | | | | | | | | | | | | | | | | | |
Net Assets, End of Period (in 000’s) | | $ | 4,473 | | | $ | 4,890 | | | $ | 7,633 | | | $ | 11,402 | | | $ | 7,369 | | | $ | 4,507 | |
Ratios of expenses to average net assets: | | | | | | | | | | | | | | | | | | | | | | | | |
Before expense reimbursement and/or fee waiver by Adviser | | | 2.11 | %(d) | | | 2.10 | % | | | 2.16 | % | | | 1.85 | % | | | 2.50 | % | | | 3.07 | % |
After expense reimbursement and/or fee waiver by Adviser | | | 1.25 | %(d) | | | 1.25 | % | | | 1.25 | % | | | 1.25 | % | | | 1.25 | %(e) | | | 1.39 | %(e) |
Ratios of net investment loss to average net assets: | | | | | | | | | | | | | | | | | | | | | | | | |
Before expense reimbursement and/or fee waiver by Adviser | | | (1.49 | )%(d) | | | (1.46 | )% | | | (1.45 | )% | | | (1.18 | )% | | | (1.88 | )% | | | (2.39 | )% |
After expense reimbursement and/or fee waiver by Adviser | | | (0.63 | )%(d) | | | (0.60 | )% | | | (0.55 | )% | | | (0.58 | )% | | | (0.63 | )% | | | (0.71 | )% |
Portfolio Turnover | | | 15.23 | %(c) | | | 58.12 | % | | | 32.96 | % | | | 74.24 | % | | | 36.60 | % | | | 29.31 | % |
| | (a) | The selected per share data was calculated using the weighted average shares outstanding method for the period. |
| | (b) | The total return is calculated using the Net Asset Value used for trading at the close of business at period end. |
| | (e) | For the period November 1, 2010 through September 29, 2011 the Adviser contractually waived management fees and/or reimbursed expenses so that the net expense ratio did not exceed 1.40%, excluding interest, taxes, investment-related costs (such as brokerage commissions), extraordinary expenses and acquired fund fees and expenses. Effective September 30, 2011, the Adviser implemented a voluntary expense limitation of 1.25%. Subsequently, on February 29, 2012, the Adviser removed the voluntary expense limitation and replaced it with a contractual expense limitation of 1.25%. |
See accompanying Notes to Financial Statements.
| | |
| |
| ASTON/Montag & Caldwell Mid Cap Growth Fund – Class I | | April 30, 2016 |
| |
| Financial Highlights | | |
| | | | | | | | | | | | |
| | | Six Months
Ended
04/30/16
(unaudited) | | | Year
Ended
10/31/15 | | | Period
Ended
10/31/14(a) | |
| | | | | | | | | | | | |
Net Asset Value, Beginning of Period | | $ | 11.61 | | | $ | 12.00 | | | $ | 11.36 | |
| | | | | | | | | | | | |
Income from Investment Operations: | | | | | | | | | | | | |
Net investment loss | | | (0.02 | )(b) | | | (0.04 | ) | | | (0.04 | )(b) |
Net realized and unrealized gain on investments | | | 0.04 | | | | 0.64 | | | | 0.68 | |
| | | | | | | | | | | | |
Total from investment operations | | | 0.02 | | | | 0.60 | | | | 0.64 | |
| | | | | | | | | | | | |
Less Distributions: | | | | | | | | | | | | |
Distributions from net realized gain on investments | | | (1.33 | ) | | | (0.99 | ) | | | — | |
| | | | | | | | | | | | |
Total Distributions | | | (1.33 | ) | | | (0.99 | ) | | | — | |
| | | | | | | | | | | | |
Net increase (decrease) in net asset value | | | (1.31 | ) | | | (0.39 | ) | | | 0.64 | |
| | | | | | | | | | | | |
Net Asset Value, End of Period | | $ | 10.30 | | | $ | 11.61 | | | $ | 12.00 | |
| | | | | | | | | | | | |
Total Return (c) | | | 0.08 | %(d) | | | 5.08 | % | | | 5.63 | %(d) |
| | | |
Ratios/Supplemental Data: | | | | | | | | | | | | |
Net Assets, End of Period (in 000’s) | | $ | 6,085 | | | $ | 6,163 | | | $ | 3,867 | |
Ratios of expenses to average net assets: | | | | | | | | | | | | |
Before expense reimbursement and/or fee waiver by Adviser | | | 1.86 | %(e) | | | 1.85 | % | | | 2.27 | %(e) |
After expense reimbursement and/or fee waiver by Adviser | | | 1.00 | %(e) | | | 1.00 | % | | | 1.00 | %(e) |
Ratios of net investment loss to average net assets: | | | | | | | | | | | | |
Before expense reimbursement and/or fee waiver by Adviser | | | (1.24 | )%(e) | | | (1.21 | )% | | | (1.95 | )%(e) |
After expense reimbursement and/or fee waiver by Adviser | | | (0.38 | )%(e) | | | (0.35 | )% | | | (0.68 | )%(e) |
Portfolio Turnover | | | 15.23 | %(d) | | | 58.12 | % | | | 32.96 | %(d) |
| | (a) | The commencement of investment operations for Montag & Caldwell Mid Cap Growth Fund Class I shares was May 13, 2014. |
| | (b) | The selected per share data was calculated using the weighted average shares outstanding method for the period. |
| | (c) | The total return is calculated using the Net Asset Value used for trading at the close of business at period end. |
See accompanying Notes to Financial Statements.
| | |
| |
| ASTON/LMCG Small Cap Growth Fund – Class N | | April 30, 2016 |
| |
| Financial Highlights | | |
| | | | | | | | | | | | | | | | | | | | | | | | |
| | | Six Months
Ended
04/30/16
(unaudited) | | | Year
Ended
10/31/15 | | | Year
Ended
10/31/14 | | | Year
Ended
10/31/13 | | | Year
Ended
10/31/12 | | | Period
Ended
10/31/11(a) | |
| | | | | | |
| | | | | | |
| | | | | | |
Net Asset Value, Beginning of Period | | $ | 14.47 | | | $ | 14.76 | | | $ | 14.71 | | | $ | 11.42 | | | $ | 9.95 | | | $ | 10.00 | |
| | | | | | | | | | | | | | | | | | | | | | | | |
Income from Investment Operations: | | | | | | | | | | | | | | | | | | | | | | | | |
Net investment income (loss) | | | (0.06 | )(b) | | | (0.15 | )(b) | | | (0.13 | )(b) | | | 0.00 | (b)(c) | | | (0.12 | )(b) | | | (0.04 | ) |
Net realized and unrealized gain (loss) on investments | | | (2.20 | ) | | | 0.40 | | | | 2.21 | | | | 4.18 | | | | 1.59 | | | | (0.01 | ) |
| | | | | | | | | | | | | | | | | | | | | | | | |
Total from investment operations | | | (2.26 | ) | | | 0.25 | | | | 2.08 | | | | 4.18 | | | | 1.47 | | | | (0.05 | ) |
| | | | | | | | | | | | | | | | | | | | | | | | |
Less Distributions: | | | | | | | | | | | | | | | | | | | | | | | | |
Distributions from net realized gain on investments | | | (0.00 | )(c) | | | (0.54 | ) | | | (2.03 | ) | | | (0.89 | ) | | | — | | | | — | |
| | | | | | | | | | | | | | | | | | | | | | | | |
Total distributions | | | (0.00 | )(c) | | | (0.54 | ) | | | (2.03 | ) | | | (0.89 | ) | | | — | | | | — | |
| | | | | | | | | | | | | | | | | | | | | | | | |
Net increase (decrease) in net asset value | | | (2.26 | ) | | | (0.29 | ) | | | 0.05 | | | | 3.29 | | | | 1.47 | | | | (0.05 | ) |
| | | | | | | | | | | | | | | | | | | | | | | | |
Net Asset Value, End of Period | | $ | 12.21 | | | $ | 14.47 | | | $ | 14.76 | | | $ | 14.71 | | | $ | 11.42 | | | $ | 9.95 | |
| | | | | | | | | | | | | | | | | | | | | | | | |
Total Return (d) | | | (15.53 | )%(e) | | | 1.65 | % | | | 15.18 | % | | | 39.31 | % | | | 14.77 | % | | | (0.50 | )%(e) |
| | | | | | |
Ratios/Supplemental Data: | | | | | | | | | | | | | | | | | | | | | | | | |
Net Assets, End of Period (in 000’s) | | $ | 85,139 | | | $ | 154,394 | | | $ | 37,099 | | | $ | 32,045 | | | $ | 5,659 | | | $ | 5,411 | |
Ratios of expenses to average net assets: | | | | | | | | | | | | | | | | | | | | | | | | |
Before expense reimbursement and/or fee waiver by Adviser | | | 1.52 | %(f) | | | 1.53 | % | | | 1.67 | % | | | 2.03 | % | | | 2.86 | % | | | 8.27 | %(f) |
After expense reimbursement and/or fee waiver by Adviser | | | 1.35 | %(f) | | | 1.35 | % | | | 1.35 | % | | | 1.35 | % | | | 1.35 | % | | | 1.35 | %(f) |
Ratios of net investment income (loss) to average net assets: | | | | | | | | | | | | | | | | | | | | | | | | |
Before expense reimbursement and/or fee waiver by Adviser | | | (1.03 | )%(f) | | | (1.18 | )% | | | (1.22 | )% | | | (0.66 | )% | | | (2.68 | )% | | | (8.14 | )%(f) |
After expense reimbursement and/or fee waiver by Adviser | | | (0.86 | )%(f) | | | (1.00 | )% | | | (0.90 | )% | | | 0.02 | % | | | (1.17 | )% | | | (1.21 | )%(f) |
Portfolio Turnover | | | 64.58 | %(e) | | | 79.46 | % | | | 143.99 | % | | | 186.40 | %(g) | | | 168.05 | %(h) | | | 205.85 | %(e) |
| | (a) | The commencement of investment operations for LMCG Small Cap Growth Fund Class N shares was November 2, 2010. |
| | (b) | The selected per share data was calculated using the weighted average shares outstanding method for the period. |
| | (c) | Represents less than $(0.005) or $0.005 per share. |
| | (d) | The total return is calculated using the Net Asset Value used for trading at the close of business at period end. |
| | (g) | Portfolio turnover rate excludes securities received from the reorganization. |
| | (h) | Portfolio turnover rate excludes securities delivered from processing a redemption in-kind. |
See accompanying Notes to Financial Statements.
| | |
| |
| ASTON/LMCG Small Cap Growth Fund – Class I | | April 30, 2016 |
| |
| Financial Highlights | | |
| | | | | | | | | | | | | | | | | | | | | | | | |
| | | Six Months
Ended
04/30/16
(unaudited) | | | Year
Ended
10/31/15 | | | Year
Ended
10/31/14 | | | Year
Ended
10/31/13 | | | Year
Ended
10/31/12 | | | Period
Ended
10/31/11(a) | |
| | | | | | |
| | | | | | |
| | | | | | |
| | | | | | | | | | | | | | | | | | | | | | | | |
Net Asset Value, Beginning of Period | | $ | 14.64 | | | $ | 14.89 | | | $ | 14.81 | | | $ | 11.46 | | | $ | 9.97 | | | $ | 12.40 | |
| | | | | | | | | | | | | | | | | | | | | | | | |
Income from Investment Operations: | | | | | | | | | | | | | | | | | | | | | | | | |
Net investment income (loss) | | | (0.04 | )(b) | | | (0.12 | )(b) | | | (0.09 | )(b) | | | 0.04 | (b) | | | (0.10 | )(b) | | | (0.04 | ) |
Net realized and unrealized gain (loss) on investments | | | (2.23 | ) | | | 0.41 | | | | 2.23 | | | | 4.20 | | | | 1.59 | | | | (2.39 | ) |
| | | | | | | | | | | | | | | | | | | | | | | | |
Total from investment operations | | | (2.27 | ) | | | 0.29 | | | | 2.14 | | | | 4.24 | | | | 1.49 | | | | (2.43 | ) |
| | | | | | | | | | | | | | | | | | | | | | | | |
Less Distributions: | | | | | | | | | | | | | | | | | | | | | | | | |
Distributions from and in excess of net investment income | | | — | | | | — | | | | (0.03 | ) | | | — | | | | — | | | | — | |
Distributions from net realized gain on investments | | | (0.00 | )(c) | | | (0.54 | ) | | | (2.03 | ) | | | (0.89 | ) | | | — | | | | — | |
| | | | | | | | | | | | | | | | | | | | | | | | |
Total distributions | | | (0.00 | )(c) | | | (0.54 | ) | | | (2.06 | ) | | | (0.89 | ) | | | — | | | | — | |
| | | | | | | | | | | | | | | | | | | | | | | | |
Net increase (decrease) in net asset value | | | (2.27 | ) | | | (0.25 | ) | | | 0.08 | | | | 3.35 | | | | 1.49 | | | | (2.43 | ) |
| | | | | | | | | | | | | | | | | | | | | | | | |
Net Asset Value, End of Period | | $ | 12.37 | | | $ | 14.64 | | | $ | 14.89 | | | $ | 14.81 | | | $ | 11.46 | | | $ | 9.97 | |
| | | | | | | | | | | | | | | | | | | | | | | | |
Total Return (d) | | | (15.49 | )%(e) | | | 1.91 | % | | | 15.51 | % | | | 39.72 | % | | | 14.95 | % | | | (19.60 | )%(e) |
| | | | | | |
Ratios/Supplemental Data: | | | | | | | | | | | | | | | | | | | | | | | | |
Net Assets, End of Period (in 000’s) | | $ | 60,688 | | | $ | 76,989 | | | $ | 15,083 | | | $ | 8,496 | | | $ | 755 | | | $ | 2,551 | |
Ratios of expenses to average net assets: | | | | | | | | | | | | | | | | | | | | | | | | |
Before expense reimbursement and/or fee waiver by Adviser | | | 1.27 | %(f) | | | 1.28 | % | | | 1.42 | % | | | 1.78 | % | | | 2.61 | % | | | 6.25 | %(f) |
After expense reimbursement and/or fee waiver by Adviser | | | 1.10 | %(f) | | | 1.10 | % | | | 1.10 | % | | | 1.10 | % | | | 1.10 | % | | | 1.10 | %(f) |
Ratios of net investment income (loss) to average net assets: | | | | | | | | | | | | | | | | | | | | | | | | |
Before expense reimbursement and/or fee waiver by Adviser | | | (0.78 | )%(f) | | | (0.93 | )% | | | (0.97 | )% | | | (0.41 | )% | | | (2.43 | )% | | | (6.11 | )%(f) |
After expense reimbursement and/or fee waiver by Adviser | | | (0.61 | )%(f) | | | (0.75 | )% | | | (0.65 | )% | | | 0.27 | % | | | (0.92 | )% | | | (0.96 | )%(f) |
Portfolio Turnover | | | 64.58 | %(e) | | | 79.46 | % | | | 143.99 | % | | | 186.40 | %(g) | | | 168.05 | %(h) | | | 205.85 | %(e) |
| | (a) | The commencement of investment operations for LMCG Small Cap Growth Fund Class I shares was May 31, 2011. |
| | (b) | The selected per share data was calculated using the weighted average shares outstanding method for the period. |
| | (c) | Represents less than ($0.005) or $0.005 per share. |
| | (d) | The total return is calculated using the Net Asset Value used for trading at the close of business at period end. |
| | (g) | Portfolio turnover rate excludes securities received from the reorganization. |
| | (h) | Portfolio turnover rate excludes securities delivered from processing a redemption in-kind. |
See accompanying Notes to Financial Statements.
| | |
| |
| ASTON/River Road Independent Value Fund – Class N | | April 30, 2016 |
| |
| Financial Highlights | | |
| | | | | | | | | | | | | | | | | | | | | | | | |
| | | Six Months
Ended
04/30/16
(unaudited) | | | Year
Ended
10/31/15 | | | Year
Ended
10/31/14 | | | Year
Ended
10/31/13 | | | Year
Ended
10/31/12 | | | Period
Ended
10/31/11(a) | |
Net Asset Value, Beginning of Period | | $ | 9.90 | | | $ | 10.89 | | | $ | 11.47 | | | $ | 11.42 | | | $ | 10.75 | | | $ | 10.00 | |
| | | | | | | | | | | | | | | | | | | | | | | | |
Income from Investment Operations: | | | | | | | | | | | | | | | | | | | | | | | | |
Net investment loss | | | (0.05 | )(b) | | | (0.11 | )(b) | | | (0.12 | )(b) | | | (0.07 | ) | | | (0.09 | )(b) | | | (0.07 | )(b) |
Net realized and unrealized gain (loss) on investments | | | 0.89 | | | | (0.23 | ) | | | (0.01 | ) | | | 0.75 | | | | 0.88 | | | | 0.82 | |
| | | | | | | | | | | | | | | | | | | | | | | | |
Total from investment operations | | | 0.84 | | | | (0.34 | ) | | | (0.13 | ) | | | 0.68 | | | | 0.79 | | | | 0.75 | |
| | | | | | | | | | | | | | | | | | | | | | | | |
Less Distributions: | | | | | | | | | | | | | | | | | | | | | | | | |
Distributions from net realized gain on investments | | | — | | | | (0.65 | ) | | | (0.45 | ) | | | (0.63 | ) | | | (0.12 | ) | | | — | |
| | | | | | | | | | | | | | | | | | | | | | | | |
Total distributions | | | — | | | | (0.65 | ) | | | (0.45 | ) | | | (0.63 | ) | | | (0.12 | ) | | | — | |
| | | | | | | | | | | | | | | | | | | | | | | | |
Net increase (decrease) in net asset value | | | 0.84 | | | | (0.99 | ) | | | (0.58 | ) | | | 0.05 | | | | 0.67 | | | | 0.75 | |
| | | | | | | | | | | | | | | | | | | | | | | | |
Net Asset Value, End of Period | | $ | 10.74 | | | $ | 9.90 | | | $ | 10.89 | | | $ | 11.47 | | | $ | 11.42 | | | $ | 10.75 | |
| | | | | | | | | | | | | | | | | | | | | | | | |
Total Return (c) | | | 8.49 | %(d) | | | (3.38 | )% | | | (1.24 | )% | | | 6.37 | % | | | 7.41 | % | | | 7.50 | %(d) |
| | | | | | |
Ratios/Supplemental Data: | | | | | | | | | | | | | | | | | | | | | | | | |
Net Assets, End of Period (in 000’s) | | $ | 299,594 | | | $ | 239,543 | | | $ | 285,949 | | | $ | 339,088 | | | $ | 362,416 | | | $ | 306,223 | |
Ratios of expenses to average net assets: | | | | | | | | | | | | | | | | | | | | | | | | |
Before earnings credit, expense reimbursement and/or fee waiver, by the Adviser | | | 1.46 | %(e) | | | 1.44 | % | | | 1.42 | %(f) | | | 1.43 | %(f) | | | 1.44 | %(f) | | | 1.59 | %(e) |
After earnings credit, expense reimbursement and/or fee waiver, by the Adviser | | | 1.42 | %(e) | | | 1.42 | % | | | 1.42 | %(f) | | | 1.41 | %(f) | | | 1.42 | %(f) | | | 1.42 | %(e) |
Ratios of net investment loss to average net assets: | | | | | | | | | | | | | | | | | | | | | | | | |
Before earnings credit, expense reimbursement and/or fee waiver, by the Adviser | | | (1.13 | )%(e) | | | (1.09 | )% | | | (1.04 | )% | | | (0.61 | )% | | | (0.81 | )% | | | (0.98 | )%(e) |
After earnings credit, expense reimbursement and/or fee waiver, by the Adviser | | | (1.09 | )%(e) | | | (1.07 | )% | | | (1.03 | )% | | | (0.59 | )% | | | (0.79 | )% | | | (0.80 | )%(e) |
Portfolio Turnover | | | 46.35 | %(d) | | | 59.40 | % | | | 91.10 | % | | | 82.24 | %(g) | | | 141.17 | % | | | 105.69 | %(d) |
| | (a) | The commencement of investment operations for River Road Independent Value Fund Class N shares was December 30, 2010. |
| | (b) | The selected per share data was calculated using the weighted average shares outstanding method for the period. |
| | (c) | The total return is calculated using the Net Asset Value used for trading at the close of business at period end. |
| | (f) | Ratios of expenses to average net assets include Earnings Credits of 0.01% for the year ended October 31, 2013 and less than 0.005% for the years ended October 31, 2014 and 2012, which is not included in the contractual expense limitation. |
| | (g) | Portfolio turnover rate excludes securities received from processing a subscription in-kind. |
See accompanying Notes to Financial Statements.
| | |
| |
| ASTON/River Road Independent Value Fund – Class I | | April 30, 2016 |
| |
| Financial Highlights | | |
| | | | | | | | | | | | | | | | | | | | | | | | |
| | | Six Months
Ended
04/30/16
(unaudited) | | | Year
Ended
10/31/15 | | | Year
Ended
10/31/14 | | | Year
Ended
10/31/13 | | | Year
Ended
10/31/12 | | | Period
Ended
10/31/11(a) | |
Net Asset Value, Beginning of Period | | $ | 10.01 | | | $ | 10.98 | | | $ | 11.54 | | | $ | 11.46 | | | $ | 10.75 | | | $ | 10.92 | |
| | | | | | | | | | | | | | | | | | | | | | | | |
Income from Investment Operations: | | | | | | | | | | | | | | | | | | | | | | | | |
Net investment loss | | | (0.04 | )(b) | | | (0.09 | )(b) | | | (0.09 | )(b) | | | (0.04 | ) | | | (0.06 | )(b) | | | (0.02 | )(b) |
Net realized and unrealized gain (loss) on investments | | | 0.91 | | | | (0.23 | ) | | | (0.02 | ) | | | 0.75 | | | | 0.89 | | | | (0.15 | ) |
| | | | | | | | | | | | | | | | | | | | | | | | |
Total from investment operations | | | 0.87 | | | | (0.32 | ) | | | (0.11 | ) | | | 0.71 | | | | 0.83 | | | | (0.17 | ) |
| | | | | | | | | | | | | | | | | | | | | | | | |
Less Distributions: | | | | | | | | | | | | | | | | | | | | | | | | |
Distributions from net realized gain on investments | | | — | | | | (0.65 | ) | | | (0.45 | ) | | | (0.63 | ) | | | (0.12 | ) | | | — | |
| | | | | | | | | | | | | | | | | | | | | | | | |
Total distributions | | | — | | | | (0.65 | ) | | | (0.45 | ) | | | (0.63 | ) | | | (0.12 | ) | | | — | |
| | | | | | | | | | | | | | | | | | | | | | | | |
Net increase (decrease) in net asset value | | | 0.87 | | | | (0.97 | ) | | | (0.56 | ) | | | 0.08 | | | | 0.71 | | | | (0.17 | ) |
| | | | | | | | | | | | | | | | | | | | | | | | |
Net Asset Value, End of Period | | $ | 10.88 | | | $ | 10.01 | | | $ | 10.98 | | | $ | 11.54 | | | $ | 11.46 | | | $ | 10.75 | |
| | | | | | | | | | | | | | | | | | | | | | | | |
Total Return (c) | | | 8.69 | %(d) | | | (3.16 | )% | | | (1.05 | )% | | | 6.62 | % | | | 7.68 | % | | | (1.47 | )%(d) |
| | | | | | |
Ratios/Supplemental Data: | | | | | | | | | | | | | | | | | | | | | | | | |
Net Assets, End of Period (in 000’s) | | $ | 109,587 | | | $ | 116,452 | | | $ | 381,289 | | | $ | 386,268 | | | $ | 338,234 | | | $ | 85,478 | |
Ratios of expenses to average net assets: | | | | | | | | | | | | | | | | | | | | | | | | |
Before earnings credit, expense reimbursement and/or fee waiver, by the Adviser | | | 1.21 | %(e) | | | 1.19 | % | | | 1.17 | %(f) | | | 1.18 | %(f) | | | 1.19 | %(f) | | | 1.34 | %(e) |
After earnings credit, expense reimbursement and/or fee waiver, by the Adviser | | | 1.17 | %(e) | | | 1.17 | % | | | 1.17 | %(f) | | | 1.16 | %(f) | | | 1.17 | %(f) | | | 1.17 | %(e) |
Ratios of net investment loss to average net assets: | | | | | | | | | | | | | | | | | �� | | | | | | | |
Before earnings credit, expense reimbursement and/or fee waiver, by the Adviser | | | (0.88 | )%(e) | | | (0.84 | )% | | | (0.79 | )% | | | (0.36 | )% | | | (0.56 | )% | | | (0.73 | )%(e) |
After earnings credit, expense reimbursement and/or fee waiver, by the Adviser | | | (0.84 | )%(e) | | | (0.82 | )% | | | (0.78 | )% | | | (0.34 | )% | | | (0.54 | )% | | | (0.55 | )%(e) |
Portfolio Turnover | | | 46.35 | %(d) | | | 59.40 | % | | | 91.10 | % | | | 82.24 | %(g) | | | 141.17 | % | | | 105.69 | %(d) |
| | (a) | The commencement of investment operations for River Road Independent Value Fund Class I shares was May 31, 2011. |
| | (b) | The selected per share data was calculated using the weighted average shares outstanding method for the period. |
| | (c) | The total return is calculated using the Net Asset Value used for trading at the close of business at period end. |
| | (f) | Ratios of expenses to average net assets include Earnings Credits of 0.01% for the year ended October 31, 2013 and less than 0.005% for the years ended October 31, 2014 and 2012, which is not included in the contractual expense limitation. |
| | (g) | Portfolio turnover rate excludes securities received from processing a subscription in-kind. |
See accompanying Notes to Financial Statements.
| | |
| |
| ASTON/River Road Select Value Fund – Class N | | April 30, 2016 |
| |
| Financial Highlights | | |
| | | | | | | | | | | | | | | | | | | | | | | | |
| | | Six Months
Ended
04/30/16
(unaudited) | | | Year
Ended
10/31/15 | | | Year
Ended
10/31/14 | | | Year
Ended
10/31/13 | | | Year
Ended
10/31/12 | | | Year
Ended
10/31/11 | |
Net Asset Value, Beginning of Period | | $ | 7.63 | | | $ | 8.77 | | | $ | 10.28 | | | $ | 8.50 | | | $ | 9.54 | | | $ | 9.01 | |
| | | | | | | | | | | | | | | | | | | | | | | | |
Income from Investment Operations: | | | | | | | | | | | | | | | | | | | | | | | | |
Net investment income (loss) | | | (0.01 | )(a) | | | (0.04 | )(a) | | | (0.03 | )(a) | | | 0.07 | (a) | | | 0.01 | (a) | | | (0.02 | )(a) |
Net realized and unrealized gain on investments | | | 0.21 | | | | 0.33 | | | | 0.03 | | | | 2.34 | | | | 1.01 | | | | 0.66 | |
| | | | | | | | | | | | | | | | | | | | | | | | |
Total from investment operations | | | 0.20 | | | | 0.29 | | | | — | | | | 2.41 | | | | 1.02 | | | | 0.64 | |
| | | | | | | | | | | | | | | | | | | | | | | | |
Less Distributions: | | | | | | | | | | | | | | | | | | | | | | | | |
Distributions from net investment income | | | — | | | | — | | | | (0.02 | ) | | | (0.12 | ) | | | — | | | | (0.03 | ) |
Distributions from net realized gain on investments | | | (1.11 | ) | | | (1.43 | ) | | | (1.49 | ) | | | (0.51 | ) | | | (2.06 | ) | | | (0.08 | ) |
| | | | | | | | | | | | | | | | | | | | | | | | |
Total distributions | | | (1.11 | ) | | | (1.43 | ) | | | (1.51 | ) | | | (0.63 | ) | | | (2.06 | ) | | | (0.11 | ) |
| | | | | | | | | | | | | | | | | | | | | | | | |
Net increase (decrease) in net asset value | | | (0.91 | ) | | | (1.14 | ) | | | (1.51 | ) | | | 1.78 | | | | (1.04 | ) | | | 0.53 | |
| | | | | | | | | | | | | | | | | | | | | | | | |
Net Asset Value, End of Period | | $ | 6.72 | | | $ | 7.63 | | | $ | 8.77 | | | $ | 10.28 | | | $ | 8.50 | | | $ | 9.54 | |
| | | | | | | | | | | | | | | | | | | | | | | | |
Total Return (b) | | | 3.62 | %(c) | | | 3.26 | % | | | (0.23 | )% | | | 30.44 | % | | | 12.87 | % | | | 7.12 | % |
| | | | | | |
Ratios/Supplemental Data: | | | | | | | | | | | | | | | | | | | | | | | | |
Net Assets, End of Period (in 000’s) | | $ | 5,087 | | | $ | 5,038 | | | $ | 8,388 | | | $ | 19,099 | | | $ | 6,270 | | | $ | 13,160 | |
Ratios of expenses to average net assets: | | | | | | | | | | | | | | | | | | | | | | | | |
Before expense reimbursement and/or fee waiver, or recoupment by Adviser | | | 1.73 | %(d) | | | 1.49 | % | | | 1.45 | % | | | 1.46 | % | | | 1.43 | %(e) | | | 1.42 | %(e) |
After expense reimbursement and/or fee waiver, or recoupment by Adviser | | | 1.50 | %(d) | | | 1.49 | % | | | 1.45 | % | | | 1.46 | % | | | 1.43 | %(e) | | | 1.42 | %(e) |
Ratios of net investment income (loss) to average net assets: | | | | | | | | | | | | | | | | | | | | | | | | |
Before expense reimbursement and/or fee waiver, or recoupment by Adviser | | | (0.59 | )%(d) | | | (0.52 | )% | | | (0.36 | )% | | | 0.78 | % | | | 0.07 | % | | | (0.18 | )% |
After expense reimbursement and/or fee waiver, or recoupment by Adviser | | | (0.36 | )%(d) | | | (0.52 | )% | | | (0.36 | )% | | | 0.78 | % | | | 0.07 | % | | | (0.18 | )% |
Portfolio Turnover | | | 39.72 | %(c) | | | 58.97 | % | | | 64.44 | % | | | 71.01 | % | | | 38.84 | % | | | 48.22 | % |
| | (a) | The selected per share data was calculated using the weighted average shares outstanding method for the period. |
| | (b) | The total return is calculated using the Net Asset Value used for trading at the close of business at period end. |
| | (e) | Ratios of expenses to average net assets include interest expense of less than 0.005% for each of the years ended October 31, 2012 and October 31, 2011, which is not included in the contractual expense limitation. The interest expense is a result of utilizing the line of credit, as discussed in Note H to the Financial Statements. |
See accompanying Notes to Financial Statements.
| | |
| |
| ASTON/River Road Select Value Fund – Class I | | April 30, 2016 |
| |
| Financial Highlights | | |
| | | | | | | | | | | | | | | | | | | | | | | | |
| | | Six Months
Ended
04/30/16
(unaudited) | | | Year
Ended
10/31/15 | | | Year
Ended
10/31/14 | | | Year
Ended
10/31/13 | | | Year
Ended
10/31/12 | | | Year
Ended
10/31/11 | |
Net Asset Value, Beginning of Period | | $ | 7.76 | | | $ | 8.88 | | | $ | 10.38 | | | $ | 8.58 | | | $ | 9.59 | | | $ | 9.04 | |
| | | | | | | | | | | | | | | | | | | | | | | | |
Income from Investment Operations: | | | | | | | | | | | | | | | | | | | | | | | | |
Net investment income (loss) | | | (0.00 | )(a)(b) | | | (0.02 | )(a) | | | (0.01 | )(a) | | | 0.10 | (a) | | | 0.03 | (a) | | | 0.01 | (a) |
Net realized and unrealized gain on investments | | | 0.21 | | | | 0.33 | | | | 0.04 | | | | 2.36 | | | | 1.02 | | | | 0.67 | |
| | | | | | | | | | | | | | | | | | | | | | | | |
Total from investment operations | | | 0.21 | | | | 0.31 | | | | 0.03 | | | | 2.46 | | | | 1.05 | | | | 0.68 | |
| | | | | | | | | | | | | | | | | | | | | | | | |
Less Distributions: | | | | | | | | | | | | | | | | | | | | | | | | |
Distributions from net investment income | | | (0.02 | ) | | | — | | | | (0.04 | ) | | | (0.15 | ) | | | — | | | | (0.05 | ) |
Distributions from net realized gain on investments | | | (1.11 | ) | | | (1.43 | ) | | | (1.49 | ) | | | (0.51 | ) | | | (2.06 | ) | | | (0.08 | ) |
| | | | | | | | | | | | | | | | | | | | | | | | |
Total distributions | | | (1.13 | ) | | | (1.43 | ) | | | (1.53 | ) | | | (0.66 | ) | | | (2.06 | ) | | | (0.13 | ) |
| | | | | | | | | | | | | | | | | | | | | | | | |
Net increase (decrease) in net asset value | | | (0.92 | ) | | | (1.12 | ) | | | (1.50 | ) | | | 1.80 | | | | (1.01 | ) | | | 0.55 | |
| | | | | | | | | | | | | | | | | | | | | | | | |
Net Asset Value, End of Period | | $ | 6.84 | | | $ | 7.76 | | | $ | 8.88 | | | $ | 10.38 | | | $ | 8.58 | | | $ | 9.59 | |
| | | | | | | | | | | | | | | | | | | | | | | | |
Total Return (c) | | | 3.78 | %(d) | | | 3.60 | % | | | 0.00 | % | | | 30.74 | % | | | 13.18 | % | | | 7.56 | % |
| | | | | | |
Ratios/Supplemental Data: | | | | | | | | | | | | | | | | | | | | | | | | |
Net Assets, End of Period (in 000’s) | | $ | 40,647 | | | $ | 92,073 | | | $ | 176,166 | | | $ | 198,220 | | | $ | 156,510 | | | $ | 130,527 | |
Ratios of expenses to average net assets: | | | | | | | | | | | | | | | | | | | | | | | | |
Before expense reimbursement and/or fee waiver, or recoupment by Adviser | | | 1.48 | %(e) | | | 1.24 | % | | | 1.20 | % | | | 1.21 | % | | | 1.18 | %(f) | | | 1.17 | %(f) |
After expense reimbursement and/or fee waiver, or recoupment by Adviser | | | 1.25 | %(e) | | | 1.24 | % | | | 1.20 | % | | | 1.21 | % | | | 1.18 | %(f) | | | 1.17 | %(f) |
Ratios of net investment income (loss) to average net assets: | | | | | | | | | | | | | | | | | | | | | | | | |
Before expense reimbursement and/or fee waiver, or recoupment by Adviser | | | (0.34 | )%(e) | | | (0.27 | )% | | | (0.11 | )% | | | 1.03 | % | | | 0.32 | % | | | 0.07 | % |
After expense reimbursement and/or fee waiver, or recoupment by Adviser | | | (0.11 | )%(e) | | | (0.27 | )% | | | (0.11 | )% | | | 1.03 | % | | | 0.32 | % | | | 0.07 | % |
Portfolio Turnover | | | 39.72 | %(d) | | | 58.97 | % | | | 64.44 | % | | | 71.01 | % | | | 38.84 | % | | | 48.22 | % |
| | (a) | The selected per share data was calculated using the weighted average shares outstanding method for the period. |
| | (b) | Represents less than $(0.005) per share. |
| | (c) | The total return is calculated using the Net Asset Value used for trading at the close of business at period end. |
| | (f) | Ratios of expenses to average net assets include interest expense of less than 0.005% for each of the years ended October 31, 2012 and October 31, 2011, which is not included in the contractual expense limitation. The interest expense is a result of utilizing the line of credit, as discussed in Note H to the Financial Statements. |
See accompanying Notes to Financial Statements.
| | |
| |
| ASTON/River Road Small Cap Value Fund – Class N | | April 30, 2016 |
| |
| Financial Highlights | | |
| | | | | | | | | | | | | | | | | | | | | | | | |
| | | Six Months
Ended
04/30/16
(unaudited) | | | Year
Ended
10/31/15 | | | Year
Ended
10/31/14 | | | Year
Ended
10/31/13 | | | Year
Ended
10/31/12 | | | Year
Ended
10/31/11 | |
| | | | | | | | | | | | | | | | | | | | | | | | |
Net Asset Value, Beginning of Period | | $ | 12.20 | | | $ | 13.53 | | | $ | 17.05 | | | $ | 13.56 | | | $ | 12.20 | | | $ | 11.60 | |
| | | | | | | | | | | | | | | | | | | | | | | | |
Income from Investment Operations: | | | | | | | | | | | | | | | | | | | | | | | | |
Net investment income (loss) | | | (0.01 | )(a) | | | (0.06 | )(a) | | | (0.04 | )(a) | | | 0.16 | | | | 0.03 | (a) | | | (0.03 | ) |
Net realized and unrealized gain on investments | | | 0.12 | | | | 0.72 | | | | 0.14 | | | | 3.98 | | | | 1.33 | | | | 0.67 | |
| | | | | | | | | | | | | | | | | | | | | | | | |
Total from investment operations | | | 0.11 | | | | 0.66 | | | | 0.10 | | | | 4.14 | | | | 1.36 | | | | 0.64 | |
| | | | | | | | | | | | | | | | | | | | | | | | |
Less Distributions: | | | | | | | | | | | | | | | | | | | | | | | | |
Distributions from and in excess of net investment income | | | — | | | | — | | | | (0.04 | ) | | | (0.22 | ) | | | — | | | | (0.04 | ) |
Distributions from net realized gain on investments | | | (0.72 | ) | | | (1.99 | ) | | | (3.58 | ) | | | (0.43 | ) | | | — | | | | — | |
| | | | | | | | | | | | | | | | | | | | | | | | |
Total distributions | | | (0.72 | ) | | | (1.99 | ) | | | (3.62 | ) | | | (0.65 | ) | | | — | | | | (0.04 | ) |
| | | | | | | | | | | | | | | | | | | | | | | | |
Net increase (decrease) in net asset value | | | (0.61 | ) | | | (1.33 | ) | | | (3.52 | ) | | | 3.49 | | | | 1.36 | | | | 0.60 | |
| | | | | | | | | | | | | | | | | | | | | | | | |
Net Asset Value, End of Period | | $ | 11.59 | | | $ | 12.20 | | | $ | 13.53 | | | $ | 17.05 | | | $ | 13.56 | | | $ | 12.20 | |
| | | | | | | | | | | | | | | | | | | | | | | | |
Total Return (b) | | | 1.11 | %(c) | | | 5.15 | % | | | (0.05 | )% | | | 31.98 | % | | | 11.15 | % | | | 5.46 | % |
| | | | | | |
Ratios/Supplemental Data: | | | | | | | | | | | | | | | | | | | | | | | | |
Net Assets, End of Period (in 000’s) | | $ | 20,135 | | | $ | 25,246 | | | $ | 49,049 | | | $ | 56,793 | | | $ | 49,154 | | | $ | 91,347 | |
Ratios of expenses to average net assets: | | | | | | | | | | | | | | | | | | | | | | | | |
Before expense reimbursement and/or fee waiver by Adviser | | | 1.36 | %(d) | | | 1.34 | % | | | 1.33 | % | | | 1.34 | % | | | 1.37 | % | | | 1.37 | %(e) |
After expense reimbursement and/or fee waiver by Adviser | | | 1.36 | %(d) | | | 1.34 | % | | | 1.33 | % | | | 1.34 | % | | | 1.37 | % | | | 1.37 | %(e) |
Ratios of net investment income (loss) to average net assets: | | | | | | | | | | | | | | | | | | | | | | | | |
Before expense reimbursement and/or fee waiver by Adviser | | | (0.21 | )%(d) | | | (0.45 | )% | | | (0.26 | )% | | | 1.03 | % | | | 0.22 | % | | | (0.13 | )% |
After expense reimbursement and/or fee waiver by Adviser | | | (0.21 | )%(d) | | | (0.45 | )% | | | (0.26 | )% | | | 1.03 | % | | | 0.22 | % | | | (0.13 | )% |
Portfolio Turnover | | | 38.30 | %(c) | | | 60.94 | % | | | 66.22 | % | | | 56.08 | % | | | 26.95 | % | | | 42.29 | % |
| | (a) | The selected per share data was calculated using the weighted average shares outstanding method for the period. |
| | (b) | The total return is calculated using the Net Asset Value used for trading at the close of business at period end. |
| | (e) | Ratios of expenses to average net assets include interest expense of less than 0.005% for the year ended October 31, 2011, which is not included in the contractual expense limitation. The interest expense is a result of utilizing the line of credit, as discussed in Note H to the Financial Statements. |
See accompanying Notes to Financial Statements.
| | |
| |
| ASTON/River Road Small Cap Value Fund – Class I | | April 30, 2016 |
| |
| Financial Highlights | | |
| | | | | | | | | | | | | | | | | | | | | | | | |
| | | Six Months
Ended
04/30/16
(unaudited) | | | Year
Ended
10/31/15 | | | Year
Ended
10/31/14 | | | Year
Ended
10/31/13 | | | Year
Ended
10/31/12 | | | Year
Ended
10/31/11 | |
| | | | | | | | | | | | | | | | | | | | | | | | |
Net Asset Value, Beginning of Period | | $ | 12.31 | | | $ | 13.60 | | | $ | 17.13 | | | $ | 13.62 | | | $ | 12.22 | | | $ | 11.62 | |
| | | | | | | | | | | | | | | | | | | | | | | | |
Income from Investment Operations: | | | | | | | | | | | | | | | | | | | | | | | | |
Net investment income (loss) | | | 0.00 | (a)(b) | | | (0.03 | )(b) | | | (0.00 | )(a)(b) | | | 0.19 | | | | 0.06 | (b) | | | 0.01 | |
Net realized and unrealized gain on investments | | | 0.13 | | | | 0.73 | | | | 0.13 | | | | 4.01 | | | | 1.34 | | | | 0.65 | |
| | | | | | | | | | | | | | | | | | | | | | | | |
Total from investment operations | | | 0.13 | | | | 0.70 | | | | 0.13 | | | | 4.20 | | | | 1.40 | | | | 0.66 | |
| | | | | | | | | | | | | | | | | | | | | | | | |
Less Distributions: | | | | | | | | | | | | | | | | | | | | | | | | |
Distributions from and in excess of net investment income | | | — | | | | — | | | | (0.08 | ) | | | (0.26 | ) | | | — | | | | (0.06 | ) |
Distributions from net realized gain on investments | | | (0.72 | ) | | | (1.99 | ) | | | (3.58 | ) | | | (0.43 | ) | | | — | | | | — | |
| | | | | | | | | | | | | | | | | | | | | | | | |
Total distributions | | | (0.72 | ) | | | (1.99 | ) | | | (3.66 | ) | | | (0.69 | ) | | | — | | | | (0.06 | ) |
| | | | | | | | | | | | | | | | | | | | | | | | |
Net increase (decrease) in net asset value | | | (0.59 | ) | | | (1.29 | ) | | | (3.53 | ) | | | 3.51 | | | | 1.40 | | | | 0.60 | |
| | | | | | | | | | | | | | | | | | | | | | | | |
Net Asset Value, End of Period | | $ | 11.72 | | | $ | 12.31 | | | $ | 13.60 | | | $ | 17.13 | | | $ | 13.62 | | | $ | 12.22 | |
| | | | | | | | | | | | | | | | | | | | | | | | |
Total Return (c) | | | 1.27 | %(d) | | | 5.45 | % | | | 0.16 | % | | | 32.36 | % | | | 11.46 | % | | | 5.70 | % |
| | | | | | |
Ratios/Supplemental Data: | | | | | | | | | | | | | | | | | | | | | | | | |
Net Assets, End of Period (in 000’s) | | $ | 236,755 | | | $ | 245,192 | | | $ | 250,173 | | | $ | 252,804 | | | $ | 240,075 | | | $ | 246,141 | |
Ratios of expenses to average net assets: | | | | | | | | | | | | | | | | | | | | | | | | |
Before expense reimbursement and/or fee waiver by Adviser | | | 1.11 | %(e) | | | 1.09 | % | | | 1.08 | % | | | 1.09 | % | | | 1.12 | % | | | 1.12 | %(f) |
After expense reimbursement and/or fee waiver by Adviser | | | 1.11 | %(e) | | | 1.09 | % | | | 1.08 | % | | | 1.09 | % | | | 1.12 | % | | | 1.12 | %(f) |
Ratios of net investment income (loss) to average net assets: | | | | | | | | | | | | | | | | | | | | | | | | |
Before expense reimbursement and/or fee waiver by Adviser | | | 0.04 | %(e) | | | (0.20 | )% | | | (0.01 | )% | | | 1.28 | % | | | 0.47 | % | | | 0.12 | % |
After expense reimbursement and/or fee waiver by Adviser | | | 0.04 | %(e) | | | (0.20 | )% | | | (0.01 | )% | | | 1.28 | % | | | 0.47 | % | | | 0.12 | % |
Portfolio Turnover | | | 38.30 | %(d) | | | 60.94 | % | | | 66.22 | % | | | 56.08 | % | | | 26.95 | % | | | 42.29 | % |
| | (a) | Represents less than $(0.005) or $0.005 per share. |
| | (b) | The selected per share data was calculated using the weighted average shares outstanding method for the period. |
| | (c) | The total return is calculated using the Net Asset Value used for trading at the close of business at period end. |
| | (f) | Ratios of expenses to average net assets include interest expense of less than 0.005% for the year ended October 31, 2011, which is not included in the contractual expense limitation. The interest expense is a result of utilizing the line of credit, as discussed in Note H to the Financial Statements. |
See accompanying Notes to Financial Statements.
| | |
| |
| ASTON/Silvercrest Small Cap Fund – Class N | | April 30, 2016 |
| |
| Financial Highlights | | |
| | | | | | | | | | | | | | | | | | | | |
| | | Six Months
Ended
04/30/16
(unaudited) | | | Year
Ended
10/31/15 | | | Year
Ended
10/31/14 | | | Year
Ended
10/31/13 | | | Period
Ended
10/31/12(a) | |
| | | | | |
| | | | | |
| | | | | |
| | | | | | | | | | | | | | | | | | | | |
Net Asset Value, Beginning of Period | | $ | 15.20 | | | $ | 15.20 | | | $ | 14.54 | | | $ | 10.90 | | | $ | 10.00 | |
| | | | | | | | | | | | | | | | | | | | |
Income from Investment Operations: | | | | | | | | | | | | | | | | | | | | |
Net investment income | | | 0.03 | (b) | | | 0.01 | (b) | | | 0.01 | | | | 0.01 | (b) | | | 0.01 | |
Net realized and unrealized gain (loss) on investments | | | (0.19 | ) | | | 0.31 | | | | 1.16 | | | | 3.77 | | | | 0.89 | |
| | | | | | | | | | | | | | | | | | | | |
Total from investment operations | | | (0.16 | ) | | | 0.32 | | | | 1.17 | | | | 3.78 | | | | 0.90 | |
| | | | | | | | | | | | | | | | | | | | |
Less Distributions: | | | | | | | | | | | | | | | | | | | | |
Distributions from and in excess of net investment income | | | (0.04 | ) | | | (0.02 | ) | | | (0.00 | )(c) | | | (0.11 | ) | | | — | |
Distributions from net realized gain on investments | | | (0.55 | ) | | | (0.30 | ) | | | (0.51 | ) | | | (0.03 | ) | | | — | |
| | | | | | | | | | | | | | | | | | | | |
Total distributions | | | (0.59 | ) | | | (0.32 | ) | | | (0.51 | ) | | | (0.14 | ) | | | — | |
| | | | | | | | | | | | | | | | | | | | |
Net increase (decrease) in net asset value | | | (0.75 | ) | | | 0.00 | | | | 0.66 | | | | 3.64 | | | | 0.90 | |
| | | | | | | | | | | | | | | | | | | | |
Net Asset Value, End of Period | | $ | 14.45 | | | $ | 15.20 | | | $ | 15.20 | | | $ | 14.54 | | | $ | 10.90 | |
| | | | | | | | | | | | | | | | | | | | |
Total Return (d) | | | (0.99 | )%(e) | | | 2.14 | % | | | 8.18 | % | | | 35.09 | % | | | 9.00 | %(e) |
| | | | | |
Ratios/Supplemental Data: | | | | | | | | | | | | | | | | | | | | |
Net Assets, End of Period (in 000’s) | | $ | 18,930 | | | $ | 19,061 | | | $ | 6,673 | | | $ | 4,049 | | | $ | 750 | |
Ratios of expenses to average net assets: | | | | | | | | | | | | | | | | | | | | |
Before expense reimbursement and/or fee waiver by Adviser | | | 1.42 | %(f) | | | 1.47 | % | | | 1.61 | % | | | 2.05 | % | | | 5.10 | %(f) |
After expense reimbursement and/or fee waiver by Adviser | | | 1.40 | %(f) | | | 1.40 | % | | | 1.40 | % | | | 1.40 | % | | | 1.40 | %(f) |
Ratios of net investment income (loss) to average net assets: | | | | | | | | | | | | | | | | | | | | |
Before expense reimbursement and/or fee waiver by Adviser | | | 0.35 | %(f) | | | (0.03 | )% | | | (0.17 | )% | | | (0.61 | )% | | | (3.51 | )%(f) |
After expense reimbursement and/or fee waiver by Adviser | | | 0.38 | %(f) | | | 0.04 | % | | | 0.04 | % | | | 0.04 | % | | | 0.19 | %(f) |
Portfolio Turnover | | | 13.69 | %(e) | | | 36.02 | % | | | 31.68 | % | | | 36.82 | % | | | 26.22 | %(e)(g) |
| | (a) | The commencement of investment operations for Silvercrest Small Cap Fund Class N shares was December 26, 2011. |
| | (b) | The selected per share data was calculated using the weighted average shares outstanding method for the period. |
| | (c) | Represents less than $(0.005) per share. |
| | (d) | The total return is calculated using the Net Asset Value used for trading at the close of business at period end. |
| | (g) | Portfolio turnover rate excludes securities delivered from processing a redemption in-kind. |
See accompanying Notes to Financial Statements.
| | |
| |
| ASTON/Silvercrest Small Cap Fund – Class I | | April 30, 2016 |
| |
| Financial Highlights | | |
| | | | | | | | | | | | | | | | | | | | |
| | | Six Months
Ended
04/30/16
(unaudited) | | | Year
Ended
10/31/15 | | | Year
Ended
10/31/14 | | | Year
Ended
10/31/13 | | | Period
Ended
10/31/12(a) | |
| | | | | |
| | | | | |
| | | | | |
| | | | | | | | | | | | | | | | | | | | |
Net Asset Value, Beginning of Period | | $ | 15.30 | | | $ | 15.27 | | | $ | 14.59 | | | $ | 10.93 | | | $ | 10.00 | |
| | | | | | | | | | | | | | | | | | | | |
Income from Investment Operations: | | | | | | | | | | | | | | | | | | | | |
Net investment income | | | 0.04 | (b) | | | 0.04 | (b) | | | 0.05 | | | | 0.04 | (b) | | | 0.03 | |
Net realized and unrealized gain (loss) on investments | | | (0.18 | ) | | | 0.32 | | | | 1.17 | | | | 3.78 | | | | 0.90 | |
| | | | | | | | | | | | | | | | | | | | |
Total from investment operations | | | (0.14 | ) | | | 0.36 | | | | 1.22 | | | | 3.82 | | | | 0.93 | |
| | | | | | | | | | | | | | | | | | | | |
Less Distributions: | | | | | | | | | | | | | | | | | | | | |
Distributions from and in excess of net investment income | | | (0.06 | ) | | | (0.03 | ) | | | (0.03 | ) | | | (0.13 | ) | | | — | |
Distributions from net realized gain on investments | | | (0.55 | ) | | | (0.30 | ) | | | (0.51 | ) | | | (0.03 | ) | | | — | |
| | | | | | | | | | | | | | | | | | | | |
Total distributions | | | (0.61 | ) | | | (0.33 | ) | | | (0.54 | ) | | | (0.16 | ) | | | — | |
| | | | | | | | | | | | | | | | | | | | |
Net increase (decrease) in net asset value | | | (0.75 | ) | | | 0.03 | | | | 0.68 | | | | 3.66 | | | | 0.93 | |
| | | | | | | | | | | | | | | | | | | | |
Net Asset Value, End of Period | | $ | 14.55 | | | $ | 15.30 | | | $ | 15.27 | | | $ | 14.59 | | | $ | 10.93 | |
| | | | | | | | | | | | | | | | | | | | |
Total Return (c) | | | (0.85 | )%(d) | | | 2.37 | % | | | 8.47 | % | | | 35.39 | % | | | 9.30 | %(d) |
| | | | | |
Ratios/Supplemental Data: | | | | | | | | | | | | | | | | | | | | |
Net Assets, End of Period (in 000’s) | | $ | 158,986 | | | $ | 145,402 | | | $ | 62,215 | | | $ | 29,219 | | | $ | 4,962 | |
Ratios of expenses to average net assets: | | | | | | | | | | | | | | | | | | | | |
Before expense reimbursement and/or fee waiver by Adviser | | | 1.17 | %(e) | | | 1.22 | % | | | 1.36 | % | | | 1.80 | % | | | 4.85 | %(e) |
After expense reimbursement and/or fee waiver by Adviser | | | 1.15 | %(e) | | | 1.15 | % | | | 1.15 | % | | | 1.15 | % | | | 1.15 | %(e) |
Ratios of net investment income (loss) to average net assets: | | | | | | | | | | | | | | | | | | | | |
Before expense reimbursement and/or fee waiver by Adviser | | | 0.60 | %(e) | | | 0.22 | % | | | 0.08 | % | | | (0.36 | )% | | | (3.26 | )%(e) |
After expense reimbursement and/or fee waiver by Adviser | | | 0.63 | %(e) | | | 0.29 | % | | | 0.29 | % | | | 0.29 | % | | | 0.44 | %(e) |
Portfolio Turnover | | | 13.69 | %(d) | | | 36.02 | % | | | 31.68 | % | | | 36.82 | % | | | 26.22 | %(d)(f) |
| | (a) | The commencement of investment operations for Silvercrest Small Cap Fund Class I shares was December 26, 2011. |
| | (b) | The selected per share data was calculated using the weighted average shares outstanding method for the period. |
| | (c) | The total return is calculated using the Net Asset Value used for trading at the close of business at period end. |
| | (f) | Portfolio turnover rate excludes securities delivered from processing a redemption in-kind. |
See accompanying Notes to Financial Statements.
| | |
| |
| ASTON Small Cap Fund – Class N (formerly, ASTON/TAMRO Small Cap Fund) | | April 30, 2016 |
| |
| Financial Highlights | | |
| | | | | | | | | | | | | | | | | | | | | | | | |
| | | Six Months
Ended
04/30/16
(unaudited) | | | Year
Ended
10/31/15 | | | Year
Ended
10/31/14 | | | Year
Ended
10/31/13 | | | Year
Ended
10/31/12 | | | Year
Ended
10/31/11 | |
Net Asset Value, Beginning of Period | | $ | 18.59 | | | $ | 22.07 | | | $ | 24.06 | | | $ | 20.52 | | | $ | 20.57 | | | $ | 19.42 | |
| | | | | | | | | | | | | | | | | | | | | | | | |
Income from Investment Operations: | | | | | | | | | | | | | | | | | | | | | | | | |
Net investment loss | | | (0.04 | )(a) | | | (0.12 | )(a) | | | (0.13 | )(a) | | | (0.03 | )(a) | | | (0.12 | )(a) | | | (0.15 | )(a) |
Net realized and unrealized gain (loss) on investments | | | (0.89 | ) | | | (0.62 | ) | | | 0.30 | | | | 5.55 | | | | 2.09 | | | | 1.75 | |
| | | | | | | | | | | | | | | | | | | | | | | | |
Total from investment operations | | | (0.93 | ) | | | (0.74 | ) | | | 0.17 | | | | 5.52 | | | | 1.97 | | | | 1.60 | |
| | | | | | | | | | | | | | | | | | | | | | | | |
Less Distributions: | | | | | | | | | | | | | | | | | | | | | | | | |
Distributions from net realized gain on investments | | | (11.97 | ) | | | (2.74 | ) | | | (2.16 | ) | | | (1.98 | ) | | | (2.02 | ) | | | (0.45 | ) |
| | | | | | | | | | | | | | | | | | | | | | | | |
Total distributions | | | (11.97 | ) | | | (2.74 | ) | | | (2.16 | ) | | | (1.98 | ) | | | (2.02 | ) | | | (0.45 | ) |
| | | | | | | | | | | | | | | | | | | | | | | | |
Net increase (decrease) in net asset value | | | (12.90 | ) | | | (3.48 | ) | | | (1.99 | ) | | | 3.54 | | | | (0.05 | ) | | | 1.15 | |
| | | | | | | | | | | | | | | | | | | | | | | | |
Net Asset Value, End of Period | | $ | 5.69 | | | $ | 18.59 | | | $ | 22.07 | | | $ | 24.06 | | | $ | 20.52 | | | $ | 20.57 | |
| | | | | | | | | | | | | | | | | | | | | | | | |
Total Return (b) | | | (6.94 | )%(c) | | | (4.12 | )% | | | 0.57 | % | | | 29.52 | % | | | 10.70 | % | | | 8.16 | % |
| | | | | | |
Ratios/Supplemental Data: | | | | | | | | | | | | | | | | | | | | | | | | |
Net Assets, End of Period (in 000’s) | | $ | 44,044 | | | $ | 241,283 | | | $ | 336,350 | | | $ | 533,627 | | | $ | 389,125 | | | $ | 375,969 | |
Ratios of expenses to average net assets: | | | | | | | | | | | | | | | | | | | | | | | | |
Before expense reimbursement and/or fee waiver by Adviser | | | 1.43 | %(d) | | | 1.31 | % | | | 1.31 | % | | | 1.31 | % | | | 1.28 | %(f) | | | 1.29 | % |
After expense reimbursement and/or fee waiver by Adviser | | | 1.42 | %(d)(e) | | | 1.31 | % | | | 1.31 | % | | | 1.31 | % | | | 1.28 | %(f) | | | 1.29 | % |
Ratios of net investment loss to average net assets: | | | | | | | | | | | | | | | | | | | | | | | | |
Before expense reimbursement and/or fee waiver by Adviser | | | (0.77 | )%(d) | | | (0.58 | )% | | | (0.57 | )% | | | (0.16 | )% | | | (0.59 | )% | | | (0.69 | )% |
After expense reimbursement and/or fee waiver by Adviser | | | (0.77 | )%(d) | | | (0.58 | )% | | | (0.57 | )% | | | (0.16 | )% | | | (0.59 | )% | | | (0.69 | )% |
Portfolio Turnover | | | 70.16 | %(c)(g) | | | 64.94 | % | | | 69.72 | % | | | 71.28 | %(g)(h) | | | 48.22 | %(g) | | | 47.25 | % |
| | (a) | The selected per share data was calculated using the weighted average shares outstanding method for the period. |
| | (b) | The total return is calculated using the Net Asset Value used for trading at the close of business at period end. |
| | (e) | Effective January 12, 2016, the Adviser has agreed to a contractual expense limitation of 1.35%. |
| | (f) | Ratios of expenses to average net assets include interest expense of less than 0.005% for the year ended October 31, 2012, which is not included in the contractual expense limitation. The interest expense is a result of utilizing the line of credit, as discussed in Note H to the Financial Statements. |
| | (g) | Portfolio turnover rate excludes securities delivered from processing a redemption in-kind. |
| | (h) | Portfolio turnover rate excludes securities received from processing a subscription in-kind. |
See accompanying Notes to Financial Statements.
| | |
| |
| ASTON Small Cap Fund – Class I (formerly, ASTON/TAMRO Small Cap Fund) | | April 30, 2016 |
| |
| Financial Highlights | | |
| | | | | | | | | | | | | | | | | | | | | | | | |
| | | Six Months
Ended
04/30/16
(unaudited) | | | Year
Ended
10/31/15 | | | Year
Ended
10/31/14 | | | Year
Ended
10/31/13 | | | Year
Ended
10/31/12 | | | Year
Ended
10/31/11 | |
| | | | | | | | | | | | | | | | | | | | | | | | |
Net Asset Value, Beginning of Period | | $ | 19.30 | | | $ | 22.76 | | | $ | 24.69 | | | $ | 20.96 | | | $ | 20.91 | | | $ | 19.69 | |
| | | | | | | | | | | | | | | | | | | | | | | | |
Income from Investment Operations: | | | | | | | | | | | | | | | | | | | | | | | | |
Net investment income (loss) | | | (0.03 | )(a) | | | (0.07 | )(a) | | | (0.07 | )(a) | | | 0.02 | (a) | | | (0.07 | )(a) | | | (0.09 | )(a) |
Net realized and unrealized gain (loss) on investments | | | (0.94 | ) | | | (0.65 | ) | | | 0.30 | | | | 5.69 | | | | 2.14 | | | | 1.76 | |
| | | | | | | | | | | | | | | | | | | | | | | | |
Total from investment operations | | | (0.97 | ) | | | (0.72 | ) | | | 0.23 | | | | 5.71 | | | | 2.07 | | | | 1.67 | |
| | | | | | | | | | | | | | | | | | | | | | | | |
Less Distributions: | | | | | | | | | | | | | | | | | | | | | | | | |
Distributions from net realized gain on investments | | | (11.97 | ) | | | (2.74 | ) | | | (2.16 | ) | | | (1.98 | ) | | | (2.02 | ) | | | (0.45 | ) |
| | | | | | | | | | | | | | | | | | | | | | | | |
Total distributions | | | (11.97 | ) | | | (2.74 | ) | | | (2.16 | ) | | | (1.98 | ) | | | (2.02 | ) | | | (0.45 | ) |
| | | | | | | | | | | | | | | | | | | | | | | | |
Net increase (decrease) in net asset value | | | (12.94 | ) | | | (3.46 | ) | | | (1.93 | ) | | | 3.73 | | | | 0.05 | | | | 1.22 | |
| | | | | | | | | | | | | | | | | | | | | | | | |
Net Asset Value, End of Period | | $ | 6.36 | | | $ | 19.30 | | | $ | 22.76 | | | $ | 24.69 | | | $ | 20.96 | | | $ | 20.91 | |
| | | | | | | | | | | | | | | | | | | | | | | | |
Total Return (b) | | | (6.84 | )%(c) | | | (3.93 | )% | | | 0.86 | % | | | 29.84 | % | | | 10.98 | % | | | 8.40 | % |
| | | | | | |
Ratios/Supplemental Data: | | | | | | | | | | | | | | | | | | | | | | | | |
Net Assets, End of Period (in 000’s) | | $ | 65,342 | | | $ | 307,403 | | | $ | 469,518 | | | $ | 792,172 | | | $ | 635,663 | | | $ | 625,315 | |
Ratios of expenses to average net assets: | | | | | | | | | | | | | | | | | | | | | | | | |
Before expense reimbursement and/or fee waiver by Adviser | | | 1.18 | %(d) | | | 1.06 | % | | | 1.06 | % | | | 1.06 | % | | | 1.03 | %(f) | | | 1.04 | % |
After expense reimbursement and/or fee waiver by Adviser | | | 1.17 | %(d)(e) | | | 1.06 | % | | | 1.06 | % | | | 1.06 | % | | | 1.03 | %(f) | | | 1.04 | % |
Ratios of net investment income (loss) to average net assets: | | | | | | | | | | | | | | | | | | | | | | | | |
Before expense reimbursement and/or fee waiver by Adviser | | | (0.52 | )%(d) | | | (0.33 | )% | | | (0.32 | )% | | | 0.09 | % | | | (0.34 | )% | | | (0.44 | )% |
After expense reimbursement and/or fee waiver by Adviser | | | (0.52 | )%(d) | | | (0.33 | )% | | | (0.32 | )% | | | 0.09 | % | | | (0.34 | )% | | | (0.44 | )% |
Portfolio Turnover | | | 70.16 | %(c)(g) | | | 64.94 | % | | | 69.72 | % | | | 71.28 | %(g)(h) | | | 48.22 | %(g) | | | 47.25 | % |
| | (a) | The selected per share data was calculated using the weighted average shares outstanding method for the period. |
| | (b) | The total return is calculated using the Net Asset Value used for trading at the close of business at period end. |
| | (e) | Effective January 12, 2016, the Adviser has agreed to a contractual expense limitation of 1.10%. |
| | (f) | Ratios of expenses to average net assets include interest expense of less than 0.005% for the year ended October 31, 2012, which is not included in the contractual expense limitation. The interest expense is a result of utilizing the line of credit, as discussed in Note H to the Financial Statements. |
| | (g) | Portfolio turnover rate excludes securities delivered from processing a redemption in-kind. |
| | (h) | Portfolio turnover rate excludes securities received from processing a subscription in-kind. |
See accompanying Notes to Financial Statements.
| | |
| |
| ASTON/DoubleLine Core Plus Fixed Income Fund – Class N | | April 30, 2016 |
| |
| Financial Highlights | | |
| | | | | | | | | | | | | | | | | | | | | | | | |
| | | Six Months
Ended
04/30/16
(unaudited) | | | Year
Ended
10/31/15 | | | Year
Ended
10/31/14 | | | Year
Ended
10/31/13 | | | Year
Ended
10/31/12 | | | Period
Ended
10/31/11(a) | |
Net Asset Value, Beginning of Period | | $ | 10.60 | | | $ | 10.86 | | | $ | 10.65 | | | $ | 11.10 | | | $ | 10.44 | | | $ | 10.00 | |
| | | | | | | | | | | | | | | | | | | | | | | | |
Income from Investment Operations: | | | | | | | | | | | | | | | | | | | | | | | | |
Net investment income | | | 0.15 | (b) | | | 0.38 | | | | 0.40 | | | | 0.30 | | | | 0.33 | (b) | | | 0.12 | (b) |
Net realized and unrealized gain (loss) on investments | | | 0.06 | | | | (0.27 | ) | | | 0.22 | | | | (0.33 | ) | | | 0.72 | | | | 0.41 | |
| | | | | | | | | | | | | | | | | | | | | | | | |
Total from investment operations | | | 0.21 | | | | 0.11 | | | | 0.62 | | | | (0.03 | ) | | | 1.05 | | | | 0.53 | |
| | | | | | | | | | | | | | | | | | | | | | | | |
Less Distributions: | | | | | | | | | | | | | | | | | | | | | | | | |
Distributions from and in excess of net investment income | | | (0.15 | ) | | | (0.37 | ) | | | (0.41 | ) | | | (0.36 | ) | | | (0.37 | ) | | | (0.09 | ) |
Distributions from net realized gain on investments | | | — | | | | — | | | | — | | | | (0.06 | ) | | | (0.02 | ) | | | — | |
| | | | | | | | | | | | | | | | | | | | | | | | |
Total distributions | | | (0.15 | ) | | | (0.37 | ) | | | (0.41 | ) | | | (0.42 | ) | | | (0.39 | ) | | | (0.09 | ) |
| | | | | | | | | | | | | | | | | | | | | | | | |
Net increase (decrease) in net asset value | | | 0.06 | | | | (0.26 | ) | | | 0.21 | | | | (0.45 | ) | | | 0.66 | | | | 0.44 | |
| | | | | | | | | | | | | | | | | | | | | | | | |
Net Asset Value, End of Period | | $ | 10.66 | | | $ | 10.60 | | | $ | 10.86 | | | $ | 10.65 | | | $ | 11.10 | | | $ | 10.44 | |
| | | | | | | | | | | | | | | | | | | | | | | | |
Total Return (c) | | | 2.05 | %(d) | | | 1.04 | % | | | 5.96 | % | | | (0.28 | )% | | | 10.25 | % | | | 5.33 | %(d) |
| | | | | | |
Ratios/Supplemental Data: | | | | | | | | | | | | | | | | | | | | | | | | |
Net Assets, End of Period (in 000’s) | | $ | 327,885 | | | $ | 188,286 | | | $ | 49,147 | | | $ | 66,368 | | | $ | 71,546 | | | $ | 22,657 | |
Ratios of expenses to average net assets: | | | | | | | | | | | | | | | | | | | | | | | | |
Before expense reimbursement and/or fee waiver by Adviser | | | 0.99 | %(e) | | | 1.05 | % | | | 1.08 | % | | | 1.04 | % | | | 1.35 | % | | | 3.16 | %(e) |
After expense reimbursement and/or fee waiver by Adviser | | | 0.94 | %(e) | | | 0.94 | % | | | 0.94 | % | | | 0.94 | % | | | 0.94 | % | | | 0.94 | %(e) |
Ratios of net investment income to average net assets: | | | | | | | | | | | | | | | | | | | | | | | | |
Before expense reimbursement and/or fee waiver by Adviser | | | 2.79 | %(e) | | | 3.21 | % | | | 3.58 | % | | | 2.66 | % | | | 2.59 | % | | | 1.63 | %(e) |
After expense reimbursement and/or fee waiver by Adviser | | | 2.84 | %(e) | | | 3.32 | % | | | 3.72 | % | | | 2.77 | % | | | 3.01 | % | | | 3.85 | %(e) |
Portfolio Turnover | | | 36.01 | %(d) | | | 59.42 | % | | | 117.18 | % | | | 125.07 | % | | | 118.67 | % | | | 38.49 | %(d) |
| | (a) | The commencement of investment operations for DoubleLine Core Plus Fixed Income Fund Class N shares was July 17, 2011. |
| | (b) | The selected per share data was calculated using the weighted average shares outstanding method for the period. |
| | (c) | The total return is calculated using the Net Asset Value used for trading at the close of business at period end. |
See accompanying Notes to Financial Statements.
| | |
| |
| ASTON/DoubleLine Core Plus Fixed Income Fund – Class I | | April 30, 2016 |
| |
| Financial Highlights | | |
| | | | | | | | | | | | | | | | | | | | | | | | |
| | | Six Months
Ended
04/30/16
(unaudited) | | | Year
Ended
10/31/15 | | | Year
Ended
10/31/14 | | | Year
Ended
10/31/13 | | | Year
Ended
10/31/12 | | | Period
Ended
10/31/11(a) | |
Net Asset Value, Beginning of Period | | $ | 10.60 | | | $ | 10.86 | | | $ | 10.65 | | | $ | 11.10 | | | $ | 10.44 | | | $ | 10.00 | |
| | | | | | | | | | | | | | | | | | | | | | | | |
Income from Investment Operations: | | | | | | | | | | | | | | | | | | | | | | | | |
Net investment income | | | 0.16 | (b) | | | 0.41 | | | | 0.44 | | | | 0.33 | | | | 0.35 | (b) | | | 0.13 | (b) |
Net realized and unrealized gain (loss) on investments | | | 0.06 | | | | (0.27 | ) | | | 0.21 | | | | (0.33 | ) | | | 0.73 | | | | 0.41 | |
| | | | | | | | | | | | | | | | | | | | | | | | |
Total from investment operations | | | 0.22 | | | | 0.14 | | | | 0.65 | | | | — | | | | 1.08 | | | | 0.54 | |
| | | | | | | | | | | | | | | | | | | | | | | | |
Less Distributions: | | | | | | | | | | | | | | | | | | | | | | | | |
Distributions from and in excess of net investment income | | | (0.17 | ) | | | (0.40 | ) | | | (0.44 | ) | | | (0.39 | ) | | | (0.40 | ) | | | (0.10 | ) |
Distributions from net realized gain on investments | | | — | | | | — | | | | — | | | | (0.06 | ) | | | (0.02 | ) | | | — | |
| | | | | | | | | | | | | | | | | | | | | | | | |
Total distributions | | | (0.17 | ) | | | (0.40 | ) | | | (0.44 | ) | | | (0.45 | ) | | | (0.42 | ) | | | (0.10 | ) |
| | | | | | | | | | | | | | | | | | | | | | | | |
Net increase (decrease) in net asset value | | | 0.05 | | | | (0.26 | ) | | | 0.21 | | | | (0.45 | ) | | | 0.66 | | | | 0.44 | |
| | | | | | | | | | | | | | | | | | | | | | | | |
Net Asset Value, End of Period | | $ | 10.65 | | | $ | 10.60 | | | $ | 10.86 | | | $ | 10.65 | | | $ | 11.10 | | | $ | 10.44 | |
| | | | | | | | | | | | | | | | | | | | | | | | |
Total Return (c) | | | 2.08 | %(d) | | | 1.28 | % | | | 6.22 | % | | | (0.03 | )% | | | 10.52 | % | | | 5.38 | %(d) |
| | | | | | |
Ratios/Supplemental Data: | | | | | | | | | | | | | | | | | | | | | | | | |
Net Assets, End of Period (in 000’s) | | $ | 380,556 | | | $ | 304,051 | | | $ | 158,198 | | | $ | 110,018 | | | $ | 105,335 | | | $ | 4,486 | |
Ratios of expenses to average net assets: | | | | | | | | | | | | | | | | | | | | | | | | |
Before expense reimbursement and/or fee waiver by Adviser | | | 0.74 | %(e) | | | 0.80 | % | | | 0.83 | % | | | 0.79 | % | | | 1.10 | % | | | 2.91 | %(e) |
After expense reimbursement and/or fee waiver by Adviser | | | 0.69 | %(e) | | | 0.69 | % | | | 0.69 | % | | | 0.69 | % | | | 0.69 | % | | | 0.69 | %(e) |
Ratios of net investment income to average net assets: | | | | | | | | | | | | | | | | | | | | | | | | |
Before expense reimbursement and/or fee waiver by Adviser | | | 3.04 | %(e) | | | 3.46 | % | | | 3.83 | % | | | 2.91 | % | | | 2.84 | % | | | 1.88 | %(e) |
After expense reimbursement and/or fee waiver by Adviser | | | 3.09 | %(e) | | | 3.57 | % | | | 3.97 | % | | | 3.02 | % | | | 3.26 | % | | | 4.10 | %(e) |
Portfolio Turnover | | | 36.01 | %(d) | | | 59.42 | % | | | 117.18 | % | | | 125.07 | % | | | 118.67 | % | | | 38.49 | %(d) |
| | (a) | The commencement of investment operations for DoubleLine Core Plus Fixed Income Fund Class I shares was July 17, 2011. |
| | (b) | The selected per share data was calculated using the weighted average shares outstanding method for the period. |
| | (c) | The total return is calculated using the Net Asset Value used for trading at the close of business at period end. |
See accompanying Notes to Financial Statements.
| | |
| |
| ASTON/TCH Fixed Income Fund – Class N | | April 30, 2016 |
| |
| Financial Highlights | | |
| | | | | | | | | | | | | | | | | | | | | | | | |
| | | Six Months
Ended
04/30/16
(unaudited) | | | Year
Ended
10/31/15 | | | Year
Ended
10/31/14 | | | Year
Ended
10/31/13 | | | Year
Ended
10/31/12 | | | Year
Ended
10/31/11 | |
| | | | | | | | | | | | | | | | | | | | | | | | |
Net Asset Value, Beginning of Period | | $ | 10.35 | | | $ | 10.85 | | | $ | 10.67 | | | $ | 11.11 | | | $ | 10.59 | | | $ | 10.49 | |
| | | | | | | | | | | | | | | | | | | | | | | | |
Income from Investment Operations: | | | | | | | | | | | | | | | | | | | | | | | | |
Net investment income | | | 0.14 | (a) | | | 0.29 | | | | 0.35 | (a) | | | 0.40 | (a) | | | 0.45 | (a) | | | 0.47 | (a) |
Net realized and unrealized gain (loss) on investments | | | 0.10 | | | | (0.46 | ) | | | 0.23 | | | | (0.39 | ) | | | 0.56 | | | | 0.10 | |
| | | | | | | | | | | | | | | | | | | | | | | | |
Total from investment operations | | | 0.24 | | | | (0.17 | ) | | | 0.58 | | | | 0.01 | | | | 1.01 | | | | 0.57 | |
| | | | | | | | | | | | | | | | | | | | | | | | |
Less Distributions: | | | | | | | | | | | | | | | | | | | | | | | | |
Distributions from and in excess of net investment income | | | (0.16 | ) | | | (0.33 | ) | | | (0.40 | ) | | | (0.45 | ) | | | (0.49 | ) | | | (0.47 | ) |
| | | �� | | | | | | | | | | | | | | | | | | | | | |
Total distributions | | | (0.16 | ) | | | (0.33 | ) | | | (0.40 | ) | | | (0.45 | ) | | | (0.49 | ) | | | (0.47 | ) |
| | | | | | | | | | | | | | | | | | | | | | | | |
Net increase (decrease) in net asset value | | | 0.08 | | | | (0.50 | ) | | | 0.18 | | | | (0.44 | ) | | | 0.52 | | | | 0.10 | |
| | | | | | | | | | | | | | | | | | | | | | | | |
Net Asset Value, End of Period | | $ | 10.43 | | | $ | 10.35 | | | $ | 10.85 | | | $ | 10.67 | | | $ | 11.11 | | | $ | 10.59 | |
| | | | | | | | | | | | | | | | | | | | | | | | |
Total Return (b) | | | 2.36 | %(c) | | | (1.61 | )% | | | 5.48 | % | | | 0.13 | % | | | 9.74 | % | | | 5.62 | % |
| | | | | | |
Ratios/Supplemental Data: | | | | | | | | | | | | | | | | | | | | | | | | |
Net Assets, End of Period (in 000’s) | | $ | 33,229 | | | $ | 35,023 | | | $ | 36,950 | | | $ | 45,771 | | | $ | 59,772 | | | $ | 62,346 | |
Ratios of expenses to average net assets: | | | | | | | | | | | | | | | | | | | | | | | | |
Before expense reimbursement and/or fee waiver by Adviser | | | 1.23 | %(d) | | | 1.18 | % | | | 1.17 | % | | | 1.02 | % | | | 1.02 | % | | | 1.14 | % |
After expense reimbursement and/or fee waiver by Adviser | | | 0.94 | %(d) | | | 0.94 | % | | | 0.94 | % | | | 0.84 | % | | | 0.86 | % | | | 0.88 | %(e) |
Ratios of net investment income to average net assets: | | | | | | | | | | | | | | | | | | | | | | | | |
Before expense reimbursement and/or fee waiver by Adviser | | | 2.53 | %(d) | | | 2.52 | % | | | 3.04 | % | | | 3.49 | % | | | 4.03 | % | | | 4.20 | % |
After expense reimbursement and/or fee waiver by Adviser | | | 2.82 | %(d) | | | 2.76 | % | | | 3.26 | % | | | 3.67 | % | | | 4.19 | % | | | 4.46 | % |
Portfolio Turnover | | | 14.24 | %(c) | | | 28.51 | % | | | 36.31 | % | | | 53.77 | % | | | 57.43 | % | | | 37.51 | % |
| | (a) | The selected per share data was calculated using the weighted average shares outstanding method for the period. |
| | (b) | The total return is calculated using the Net Asset Value used for trading at the close of business at period end. |
| | (e) | Effective March 1, 2011, the contractual expense limitation was increased from 0.74% to 0.94%, excluding interest, taxes, investment-related costs (such as brokerage commissions), extraordinary expenses and acquired fund fees and expenses. |
See accompanying Notes to Financial Statements.
| | |
| |
| ASTON/TCH Fixed Income Fund – Class I | | April 30, 2016 |
| |
| Financial Highlights | | |
| | | | | | | | | | | | | | | | | | | | | | | | |
| | | Six Months
Ended
04/30/16
(unaudited) | | | Year
Ended
10/31/15 | | | Year
Ended
10/31/14 | | | Year
Ended
10/31/13 | | | Year
Ended
10/31/12 | | | Year
Ended
10/31/11 | |
| | | | | | | | | | | | | | | | | | | | | | | | |
Net Asset Value, Beginning of Period | | $ | 10.35 | | | $ | 10.85 | | | $ | 10.67 | | | $ | 11.11 | | | $ | 10.59 | | | $ | 10.49 | |
| | | | | | | | | | | | | | | | | | | | | | | | |
Income from Investment Operations: | | | | | | | | | | | | | | | | | | | | | | | | |
Net investment income | | | 0.16 | (a) | | | 0.32 | | | | 0.38 | (a) | | | 0.42 | (a) | | | 0.47 | (a) | | | 0.49 | (a) |
Net realized and unrealized gain (loss) on investments | | | 0.09 | | | | (0.46 | ) | | | 0.22 | | | | (0.39 | ) | | | 0.55 | | | | 0.11 | |
| | | | | | | | | | | | | | | | | | | | | | | | |
Total from investment operations | | | 0.25 | | | | (0.14 | ) | | | 0.60 | | | | 0.03 | | | | 1.02 | | | | 0.60 | |
| | | | | | | | | | | | | | | | | | | | | | | | |
Less Distributions: | | | | | | | | | | | | | | | | | | | | | | | | |
Distributions from and in excess of net investment income | | | (0.17 | ) | | | (0.36 | ) | | | (0.42 | ) | | | (0.47 | ) | | | (0.50 | ) | | | (0.50 | ) |
| | | | | | | | | | | | | | | | | | | | | | | | |
Total distributions | | | (0.17 | ) | | | (0.36 | ) | | | (0.42 | ) | | | (0.47 | ) | | | (0.50 | ) | | | (0.50 | ) |
| | | | | | | | | | | | | | | | | | | | | | | | |
Net increase (decrease) in net asset value . | | | 0.08 | | | | (0.50 | ) | | | 0.18 | | | | (0.44 | ) | | | 0.52 | | | | 0.10 | |
| | | | | | | | | | | | | | | | | | | | | | | | |
Net Asset Value, End of Period | | $ | 10.43 | | | $ | 10.35 | | | $ | 10.85 | | | $ | 10.67 | | | $ | 11.11 | | | $ | 10.59 | |
| | | | | | | | | | | | | | | | | | | | | | | | |
Total Return (b) | | | 2.49 | %(c) | | | (1.37 | )% | | | 5.75 | % | | | 0.28 | % | | | 9.93 | % | | | 5.89 | % |
| | | | | | |
Ratios/Supplemental Data: | | | | | | | | | | | | | | | | | | | | | | | | |
Net Assets, End of Period (in 000’s) | | $ | 7,706 | | | $ | 14,808 | | | $ | 15,199 | | | $ | 8,742 | | | $ | 10,396 | | | $ | 10,423 | |
Ratios of expenses to average net assets: | | | | | | | | | | | | | | | | | | | | | | | | |
Before expense reimbursement and/or fee waiver by Adviser | | | 0.98 | %(d) | | | 0.93 | % | | | 0.92 | % | | | 0.87 | % | | | 0.85 | % | | | 0.89 | % |
After expense reimbursement and/or fee waiver by Adviser | | | 0.69 | %(d) | | | 0.69 | % | | | 0.69 | % | | | 0.69 | % | | | 0.69 | % | | | 0.63 | %(e) |
Ratios of net investment income to average net assets: | | | | | | | | | | | | | | | | | | | | | | | | |
Before expense reimbursement and/or fee waiver by Adviser | | | 2.78 | %(d) | | | 2.77 | % | | | 3.29 | % | | | 3.64 | % | | | 4.20 | % | | | 4.45 | % |
After expense reimbursement and/or fee waiver by Adviser | | | 3.07 | %(d) | | | 3.01 | % | | | 3.51 | % | | | 3.82 | % | | | 4.36 | % | | | 4.71 | % |
Portfolio Turnover | | | 14.24 | %(c) | | | 28.51 | % | | | 36.31 | % | | | 53.77 | % | | | 57.43 | % | | | 37.51 | % |
| | (a) | The selected per share data was calculated using the weighted average shares outstanding method for the period. |
| | (b) | The total return is calculated using the Net Asset Value used for trading at the close of business at period end. |
| | (e) | Effective March 1, 2011, the contractual expense limitation was increased from 0.49% to 0.69%, excluding interest, taxes, investment-related costs (such as brokerage commissions), extraordinary expenses and acquired fund fees and expenses. |
See accompanying Notes to Financial Statements.
| | |
| |
| ASTON/Anchor Capital Enhanced Equity Fund – Class N | | April 30, 2016 |
| |
| Financial Highlights | | |
| | | | | | | | | | | | | | | | | | | | | | | | |
| | | Six Months
Ended
04/30/16
(unaudited) | | | Year
Ended
10/31/15 | | | Year
Ended
10/31/14 | | | Year
Ended
10/31/13 | | | Year
Ended
10/31/12 | | | Year
Ended
10/31/11 | |
| | | | | | | | | | | | | | | | | | | | | | | | |
Net Asset Value, Beginning of Period | | $ | 9.14 | | | $ | 9.49 | | | $ | 9.39 | | | $ | 8.68 | | | $ | 9.61 | | | $ | 9.41 | |
| | | | | | | | | | | | | | | | | | | | | | | | |
Income from Investment Operations: | | | | | | | | | | | | | | | | | | | | | | | | |
Net investment income | | | 0.12 | (a) | | | 0.18 | | | | 0.17 | | | | 0.20 | | | | 0.16 | | | | 0.14 | |
Net realized and unrealized gain (loss) on investments | | | (0.07 | ) | | | (0.36 | ) | | | 0.09 | | | | 0.86 | | | | 0.11 | | | | 0.56 | |
| | | | | | | | | | | | | | | | | | | | | | | | |
Total from investment operations | | | 0.05 | | | | (0.18 | ) | | | 0.26 | | | | 1.06 | | | | 0.27 | | | | 0.70 | |
| | | | | | | | | | | | | | | | | | | | | | | | |
Less Distributions: | | | | | | | | | | | | | | | | | | | | | | | | |
Distributions from and in excess of net investment income | | | (0.13 | ) | | | (0.17 | ) | | | (0.16 | ) | | | (0.20 | ) | | | (0.16 | ) | | | (0.13 | ) |
Distributions from net realized gain on investments | | | (0.04 | ) | | | — | | | | — | | | | (0.15 | ) | | | (1.04 | ) | | | (0.37 | ) |
| | | | | | | | | | | | | | | | | | | | | | | | |
Total distributions | | | (0.17 | ) | | | (0.17 | ) | | | (0.16 | ) | | | (0.35 | ) | | | (1.20 | ) | | | (0.50 | ) |
| | | | | | | | | | | | | | | | | | | | | | | | |
Net increase (decrease) in net asset value | | | (0.12 | ) | | | (0.35 | ) | | | 0.10 | | | | 0.71 | | | | (0.93 | ) | | | 0.20 | |
| | | | | | | | | | | | | | | | | | | | | | | | |
Net Asset Value, End of Period | | $ | 9.02 | | | $ | 9.14 | | | $ | 9.49 | | | $ | 9.39 | | | $ | 8.68 | | | $ | 9.61 | |
| | | | | | | | | | | | | | | | | | | | | | | | |
Total Return (b) | | | 0.54 | %(c) | | | (1.86 | )% | | | 2.68 | % | | | 12.60 | % | | | 3.12 | % | | | 7.69 | % |
| | | | | | |
Ratios/Supplemental Data: | | | | | | | | | | | | | | | | | | | | | | | | |
Net Assets, End of Period (in 000’s) | | $ | 55,040 | | | $ | 84,994 | | | $ | 101,980 | | | $ | 101,663 | | | $ | 106,191 | | | $ | 48,365 | |
Ratios of expenses to average net assets: | | | | | | | | | | | | | | | | | | | | | | | | |
Before earnings credit, expense reimbursement and/or fee waiver, or recoupment by the Adviser | | | 1.27 | %(d) | | | 1.19 | % | | | 1.19 | % | | | 1.23 | %(e) | | | 1.22 | %(e)(f) | | | 1.24 | %(f) |
After earnings credit, expense reimbursement and/or fee waiver, or recoupment by the Adviser | | | 1.27 | %(d) | | | 1.19 | % | | | 1.19 | % | | | 1.23 | %(e) | | | 1.27 | %(e)(f) | | | 1.33 | %(f) |
Ratios of net investment income to average net assets: | | | | | | | | | | | | | | | | | | | | | | | | |
Before earnings credit, expense reimbursement and/or fee waiver, or recoupment by the Adviser | | | 2.64 | %(d) | | | 1.78 | % | | | 1.81 | % | | | 2.24 | % | | | 1.82 | % | | | 1.51 | % |
After earnings credit, expense reimbursement and/or fee waiver, or recoupment by the Adviser | | | 2.64 | %(d) | | | 1.78 | % | | | 1.81 | % | | | 2.24 | % | | | 1.78 | % | | | 1.41 | % |
Portfolio Turnover | | | 13.44 | %(c) | | | 33.30 | % | | | 41.24 | % | | | 77.70 | % | | | 56.33 | % | | | 87.37 | % |
| | (a) | The selected per share data was calculated using the weighted average shares outstanding method for the period. |
| | (b) | The total return is calculated using the Net Asset Value used for trading at the close of business at period end. |
| | (e) | Ratios of expenses to average net assets include Earnings Credits of less than 0.005% for each of the years ended October 31, 2013 and October 31, 2012, which is not included in the contractual expense limitation. |
| | (f) | Ratios of expenses to average net assets include interest expense of less than 0.005% for each of the years ended October 31, 2012 and October 31, 2011, which is not included in the contractual expense limitation. The interest expense is a result of utilizing the line of credit, as discussed in Note H to the Financial Statements. |
See accompanying Notes to Financial Statements.
| | |
| |
| ASTON/Anchor Capital Enhanced Equity Fund – Class I | | April 30, 2016 |
| |
| Financial Highlights | | |
| | | | | | | | | | | | | | | | | | | | | | | | |
| | | Six Months
Ended
04/30/16
(unaudited) | | | Year
Ended
10/31/15 | | | Year
Ended
10/31/14 | | | Year
Ended
10/31/13 | | | Year
Ended
10/31/12 | | | Year
Ended
10/31/11 | |
| | | | | | | | | | | | | | | | | | | | | | | | |
Net Asset Value, Beginning of Period | | $ | 9.15 | | | $ | 9.50 | | | $ | 9.40 | | | $ | 8.69 | | | $ | 9.62 | | | $ | 9.41 | |
| | | | | | | | | | | | | | | | | | | | | | | | |
Income from Investment Operations: | | | | | | | | | | | | | | | | | | | | | | | | |
Net investment income | | | 0.13 | (a) | | | 0.19 | | | | 0.18 | | | | 0.22 | | | | 0.18 | | | | 0.16 | |
Net realized and unrealized gain (loss) on investments | | | (0.07 | ) | | | (0.35 | ) | | | 0.10 | | | | 0.86 | | | | 0.11 | | | | 0.57 | |
| | | | | | | | | | | | | | | | | | | | | | | | |
Total from investment operations | | | 0.06 | | | | (0.16 | ) | | | 0.28 | | | | 1.08 | | | | 0.29 | | | | 0.73 | |
| | | | | | | | | | | | | | | | | | | | | | | | |
Less Distributions: | | | | | | | | | | | | | | | | | | | | | | | | |
Distributions from and in excess of net investment income | | | (0.14 | ) | | | (0.19 | ) | | | (0.18 | ) | | | (0.22 | ) | | | (0.18 | ) | | | (0.15 | ) |
Distributions from net realized gain on investments | | | (0.04 | ) | | | — | | | | — | | | | (0.15 | ) | | | (1.04 | ) | | | (0.37 | ) |
| | | | | | | | | | | | | | | | | | | | | | | | |
Total distributions | | | (0.18 | ) | | | (0.19 | ) | | | (0.18 | ) | | | (0.37 | ) | | | (1.22 | ) | | | (0.52 | ) |
| | | | | | | | | | | | | | | | | | | | | | | | |
Net increase (decrease) in net asset value | | | (0.12 | ) | | | (0.35 | ) | | | 0.10 | | | | 0.71 | | | | (0.93 | ) | | | 0.21 | |
| | | | | | | | | | | | | | | | | | | | | | | | |
Net Asset Value, End of Period | | $ | 9.03 | | | $ | 9.15 | | | $ | 9.50 | | | $ | 9.40 | | | $ | 8.69 | | | $ | 9.62 | |
| | | | | | | | | | | | | | | | | | | | | | | | |
Total Return (b) | | | 0.68 | %(c) | | | (1.60 | )% | | | 2.94 | % | | | 12.88 | % | | | 3.46 | % | | | 7.97 | % |
| | | | | | |
Ratios/Supplemental Data: | | | | | | | | | | | | | | | | | | | | | | | | |
Net Assets, End of Period (in 000’s) | | $ | 48,720 | | | $ | 83,475 | | | $ | 108,985 | | | $ | 58,099 | | | $ | 71,618 | | | $ | 64,840 | |
Ratios of expenses to average net assets: | | | | | | | | | | | | | | | | | | | | | | | | |
Before earnings credit, expense reimbursement and/or fee waiver, or recoupment by the Adviser | | | 1.02 | %(d) | | | 0.94 | % | | | 0.94 | % | | | 0.98 | %(e) | | | 0.97 | %(e)(f) | | | 0.99 | %(f) |
After earnings credit, expense reimbursement and/or fee waiver, or recoupment by the Adviser | | | 1.02 | %(d) | | | 0.94 | % | | | 0.94 | % | | | 0.98 | %(e) | | | 1.02 | %(e)(f) | | | 1.08 | %(f) |
Ratios of net investment income to average net assets: | | | | | | | | | | | | | | | | | | | | | | | | |
Before earnings credit, expense reimbursement and/or fee waiver, or recoupment by the Adviser | | | 2.89 | %(d) | | | 2.03 | % | | | 2.06 | % | | | 2.49 | % | | | 2.07 | % | | | 1.76 | % |
After earnings credit, expense reimbursement and/or fee waiver, or recoupment by the Adviser | | | 2.89 | %(d) | | | 2.03 | % | | | 2.06 | % | | | 2.49 | % | | | 2.03 | % | | | 1.66 | % |
Portfolio Turnover | | | 13.44 | %(c) | | | 33.30 | % | | | 41.24 | % | | | 77.70 | % | | | 56.33 | % | | | 87.37 | % |
| | (a) | The selected per share data was calculated using the weighted average shares outstanding method for the period. |
| | (b) | The total return is calculated using the Net Asset Value used for trading at the close of business at period end. |
| | (e) | Ratios of expenses to average net assets include Earnings Credits of less than 0.005% for each of the years ended October 31, 2013 and October 31, 2012, which is not included in the contractual expense limitation. |
| | (f) | Ratios of expenses to average net assets include interest expense of less than 0.005% for each of the years ended October 31, 2012 and October 31, 2011, which is not included in the contractual expense limitation. The interest expense is a result of utilizing the line of credit, as discussed in Note H to the Financial Statements. |
See accompanying Notes to Financial Statements.
| | |
| |
| ASTON/Lake Partners LASSO Alternatives Fund – Class N | | April 30, 2016 |
| |
| Financial Highlights | | |
| | | | | | | | | | | | | | | | | | | | | | | | |
| | | Six Months
Ended
04/30/16
(unaudited) | | | Year
Ended
10/31/15 | | | Year
Ended
10/31/14 | | | Year
Ended
10/31/13 | | | Year
Ended
10/31/12 | | | Year
Ended
10/31/11 | |
| | | | | | | | | | | | | | | | | | | | | | | | |
Net Asset Value, Beginning of Period | | $ | 12.76 | | | $ | 13.64 | | | $ | 13.34 | | | $ | 12.39 | | | $ | 11.94 | | | $ | 11.97 | |
| | | | | | | | | | | | | | | | | | | | | | | | |
Income from Investment Operations: | | | | | | | | | | | | | | | | | | | | | | | | |
Net investment income (loss) | | | 0.05 | (a) | | | (0.04 | )(a) | | | (0.07 | )(a) | | | 0.00 | (a)(b) | | | 0.04 | (a) | | | (0.01 | )(a) |
Net realized and unrealized gain (loss) on investments | | | (0.25 | ) | | | (0.34 | ) | | | 0.50 | (c) | | | 1.11 | | | | 0.59 | | | | 0.13 | |
| | | | | | | | | | | | | | | | | | | | | | | | |
Total from investment operations | | | (0.20 | ) | | | (0.38 | ) | | | 0.43 | | | | 1.11 | | | | 0.63 | | | | 0.12 | |
| | | | | | | | | | | | | | | | | | | | | | | | |
Less Distributions: | | | | | | | | | | | | | | | | | | | | | | | | |
Distributions from and in excess of net investment income | | | — | | | | (0.00 | )(b) | | | (0.09 | ) | | | (0.16 | ) | | | (0.18 | ) | | | (0.08 | ) |
Distributions from net realized gain on investments | | | (0.80 | ) | | | (0.50 | ) | | | (0.04 | ) | | | — | | | | — | | | | (0.07 | ) |
| | | | | | | | | | | | | | | | | | | | | | | | |
Total distributions | | | (0.80 | ) | | | (0.50 | ) | | | (0.13 | ) | | | (0.16 | ) | | | (0.18 | ) | | | (0.15 | ) |
| | | | | | | | | | | | | | | | | | | | | | | | |
Net increase (decrease) in net asset value | | | (1.00 | ) | | | (0.88 | ) | | | 0.30 | | | | 0.95 | | | | 0.45 | | | | (0.03 | ) |
| | | | | | | | | | | | | | | | | | | | | | | | |
Net Asset Value, End of Period | | $ | 11.76 | | | $ | 12.76 | | | $ | 13.64 | | | $ | 13.34 | | | $ | 12.39 | | | $ | 11.94 | |
| | | | | | | | | | | | | | | | | | | | | | | | |
Total Return (d) | | | (1.59 | )%(e) | | | (2.87 | )% | | | 3.27 | % | | | 9.05 | % | | | 5.34 | % | | | 0.92 | % |
| | | | | | |
Ratios/Supplemental Data: | | | | | | | | | | | | | | | | | | | | | | | | |
Net Assets, End of Period (in 000’s) | | $ | 35,864 | | | $ | 40,667 | | | $ | 44,386 | | | $ | 54,388 | | | $ | 33,719 | | | $ | 17,626 | |
Ratios of expenses to average net assets: | | | | | | | | | | | | | | | | | | | | | | | | |
Before earnings credit, expense reimbursement and/or fee waiver, or recoupment by the Adviser (f) | | | 1.50 | %(g) | | | 1.43 | %(h) | | | 1.41 | % | | | 1.43 | %(i) | | | 1.41 | %(i)(j) | | | 1.53 | % |
After earnings credit, expense reimbursement and/or fee waiver, or recoupment by the Adviser (f) | | | 1.40 | %(g) | | | 1.41 | %(h) | | | 1.43 | % | | | 1.45 | %(i) | | | 1.45 | %(i)(j) | | | 1.45 | % |
Ratios of net investment income (loss) to average net assets: | | | | | | | | | | | | | | | | | | | | | | | | |
Before earnings credit, expense reimbursement and/or fee waiver, or recoupment by the Adviser | | | 0.76 | %(g) | | | (0.33 | )% | | | (0.51 | )% | | | (0.00 | )%(b) | | | 0.36 | %(j) | | | (0.17 | )% |
After earnings credit, expense reimbursement and/or fee waiver, or recoupment by the Adviser | | | 0.86 | %(g) | | | (0.31 | )% | | | (0.53 | )% | | | (0.03 | )% | | | 0.32 | %(j) | | | (0.10 | )% |
Portfolio Turnover | | | 17.66 | %(e) | | | 72.73 | % | | | 45.91 | % | | | 43.55 | % | | | 45.60 | % | | | 79.77 | % |
| | (a) | The selected per share data was calculated using the weighted average shares outstanding method for the period. |
| | (b) | Represents less than ($0.005) or $0.005 per share or less than 0.005%. |
| | (c) | Includes capital contribution of less than $0.005 per share. |
| | (d) | The total return is calculated using the Net Asset Value used for trading at the close of business at period end. |
| | (f) | Does not include expenses of the underlying funds in which the Fund invests. |
| | (h) | Effective February 28, 2015, the contractual expense limitation was decreased from 1.45% to 1.40%, excluding interest, taxes, investment-related costs (such as brokerage commissions), extraordinary expenses and acquired fund fees and expenses. |
| | (i) | Ratios of expenses to average net assets includes Earnings Credits of less than 0.005% for each of the years ended October 31, 2013 and October 31, 2012, which is not included in the contractual expense limitation. |
| | (j) | Ratios of expenses and net investment income to average net assets include advisory fee waiver of less than 0.005% for the year ended October 31, 2012. |
See accompanying Notes to Financial Statements.
| | |
| |
| ASTON/Lake Partners LASSO Alternatives Fund – Class I | | April 30, 2016 |
| |
| Financial Highlights | | |
| | | | | | | | | | | | | | | | | | | | | | | | |
| | | Six Months
Ended
04/30/16
(unaudited) | | | Year
Ended
10/31/15 | | | Year
Ended
10/31/14 | | | Year
Ended
10/31/13 | | | Year
Ended
10/31/12 | | | Year
Ended
10/31/11 | |
| | | | | | | | | | | | | | | | | | | | | | | | |
Net Asset Value, Beginning of Period | | $ | 12.81 | | | $ | 13.69 | | | $ | 13.38 | | | $ | 12.42 | | | $ | 11.97 | | | $ | 11.98 | |
| | | | | | | | | | | | | | | | | | | | | | | | |
Income from Investment Operations: | | | | | | | | | | | | | | | | | | | | | | | | |
Net investment income (loss) | | | 0.07 | (a) | | | (0.01 | )(a) | | | (0.04 | )(a) | | | 0.03 | (a) | | | 0.07 | (a) | | | 0.02 | (a) |
Net realized and unrealized gain (loss) on investments | | | (0.26 | ) | | | (0.33 | )(b) | | | 0.51 | (b) | | | 1.11 | | | | 0.59 | | | | 0.13 | |
| | | | | | | | | | | | | | | | | | | | | | | | |
Total from investment operations | | | (0.19 | ) | | | (0.34 | ) | | | 0.47 | | | | 1.14 | | | | 0.66 | | | | 0.15 | |
| | | | | | | | | | | | | | | | | | | | | | | | |
Less Distributions: | | | | | | | | | | | | | | | | | | | | | | | | |
Distributions from and in excess of net investment income | | | (0.03 | ) | | | (0.04 | ) | | | (0.12 | ) | | | (0.18 | ) | | | (0.21 | ) | | | (0.09 | ) |
Distributions from net realized gain on investments | | | (0.80 | ) | | | (0.50 | ) | | | (0.04 | ) | | | — | | | | — | | | | (0.07 | ) |
| | | | | | | | | | | | | | | | | | | | | | | | |
Total distributions | | | (0.83 | ) | | | (0.54 | ) | | | (0.16 | ) | | | (0.18 | ) | | | (0.21 | ) | | | (0.16 | ) |
| | | | | | | | | | | | | | | | | | | | | | | | |
Net increase (decrease) in net asset value | | | (1.02 | ) | | | (0.88 | ) | | | 0.31 | | | | 0.96 | | | | 0.45 | | | | (0.01 | ) |
| | | | | | | | | | | | | | | | | | | | | | | | |
Net Asset Value, End of Period | | $ | 11.79 | | | $ | 12.81 | | | $ | 13.69 | | | $ | 13.38 | | | $ | 12.42 | | | $ | 11.97 | |
| | | | | | | | | | | | | | | | | | | | | | | | |
Total Return (c) | | | (1.50 | )%(d) | | | (2.62 | )% | | | 3.56 | % | | | 9.31 | % | | | 5.56 | % | | | 1.22 | % |
| | | | | | |
Ratios/Supplemental Data: | | | | | | | | | | | | | | | | | | | | | | | | |
Net Assets, End of Period (in 000’s) | | $ | 92,690 | | | $ | 169,072 | | | $ | 477,157 | | | $ | 416,475 | | | $ | 253,343 | | | $ | 189,999 | |
Ratios of expenses to average net assets: | | | | | | | | | | | | | | | | | | | | | | | | |
Before earnings credit, expense reimbursement and/or fee waiver, or recoupment by the Adviser (e) | | | 1.25 | %(f) | | | 1.18 | %(g) | | | 1.16 | % | | | 1.18 | %(h) | | | 1.16 | %(h)(i) | | | 1.28 | % |
After earnings credit, expense reimbursement and/or fee waiver, or recoupment by the Adviser (e) | | | 1.15 | %(f) | | | 1.16 | %(g) | | | 1.18 | % | | | 1.20 | %(h) | | | 1.20 | %(h)(i) | | | 1.20 | % |
Ratios of net investment income (loss) to average net assets: | | | | | | | | | | | | | | | | | | | | | | | | |
Before earnings credit, expense reimbursement and/or fee waiver, or recoupment by the Adviser | | | 1.01 | %(f) | | | (0.08 | )% | | | (0.26 | )% | | | 0.25 | % | | | 0.61 | %(i) | | | 0.08 | % |
After earnings credit, expense reimbursement and/or fee waiver, or recoupment by the Adviser | | | 1.11 | %(f) | | | (0.06 | )% | | | (0.28 | )% | | | 0.22 | % | | | 0.57 | %(i) | | | 0.15 | % |
Portfolio Turnover | | | 17.66 | %(d) | | | 72.73 | % | | | 45.91 | % | | | 43.55 | % | | | 45.60 | % | | | 79.77 | % |
| | (a) | The selected per share data was calculated using the weighted average shares outstanding method for the period. |
| | (b) | Includes capital contribution of less than $0.005 per share. |
| | (c) | The total return is calculated using the Net Asset Value used for trading at the close of business at period end. |
| | (e) | Does not include expenses of the underlying funds in which the Fund invests. |
| | (g) | Effective February 28, 2015, the contractual expense limitation was decreased from 1.20% to 1.15%, excluding interest, taxes, investment-related costs (such as brokerage commissions), extraordinary expenses and acquired fund fees and expenses. |
| | (h) | Ratios of expenses to average net assets include Earnings Credits of less than 0.005% for each of the years ended October 31, 2013 and October 31, 2012, which is not included in the contractual expense limitation. |
| | (i) | Ratios of expenses and net investment income to average net assets include advisory fee waiver of less than 0.005% for the year ended October 31, 2012. |
See accompanying Notes to Financial Statements.
| | |
| |
| ASTON/River Road Long-Short Fund – Class N | | April 30, 2016 |
| |
| Financial Highlights | | |
| | | | | | | | | | | | | | | | | | | | | | | | |
| | | Six Months
Ended
04/30/16
(unaudited) | | | Year
Ended
10/31/15 | | | Year
Ended
10/31/14 | | | Year
Ended
10/31/13 | | | Year
Ended
10/31/12 | | | Period
Ended
10/31/11(a) | |
| | | | | | | | | | | | | | | | | | | | | | | | |
Net Asset Value, Beginning of Period | | $ | 11.48 | | | $ | 11.35 | | | $ | 12.02 | | | $ | 10.73 | | | $ | 9.91 | | | $ | 10.00 | |
| | | | | | | | | | | | | | | | | | | | | | | | |
Income from Investment Operations: | | | | | | | | | | | | | | | | | | | | | | | | |
Net investment loss | | | (0.08 | )(b) | | | (0.14 | )(b) | | | (0.19 | ) | | | (0.17 | )(b) | | | (0.18 | ) | | | (0.04 | )(b) |
Net realized and unrealized gain (loss) on investments | | | (0.10 | ) | | | 0.57 | | | | (0.19 | ) | | | 2.02 | | | | 1.00 | | | | (0.05 | ) |
| | | | | | | | | | | | | | | | | | | | | | | | |
Total from investment operations | | | (0.18 | ) | | | 0.43 | | | | (0.38 | ) | | | 1.85 | | | | 0.82 | | | | (0.09 | ) |
| | | | | | | | | | | | | | | | | | | | | | | | |
Less Distributions: | | | | | | | | | | | | | | | | | | | | | | | | |
Distributions from net realized gain on investments | | | (0.38 | ) | | | (0.30 | ) | | | (0.29 | ) | | | (0.56 | ) | | | — | | | | — | |
| | | | | | | | | | | | | | | | | | | | | | | | |
Total distributions | | | (0.38 | ) | | | (0.30 | ) | | | (0.29 | ) | | | (0.56 | ) | | | — | | | | — | |
| | | | | | | | | | | | | | | | | | | | | | | | |
Net increase (decrease) in net asset value | | | (0.56 | ) | | | 0.13 | | | | (0.67 | ) | | | 1.29 | | | | 0.82 | | | | (0.09 | ) |
| | | | | | | | | | | | | | | | | | | | | | | | |
Net Asset Value, End of Period | | $ | 10.92 | | | $ | 11.48 | | | $ | 11.35 | | | $ | 12.02 | | | $ | 10.73 | | | $ | 9.91 | |
| | | | | | | | | | | | | | | | | | | | | | | | |
Total Return (c) | | | (1.60 | )%(d) | | | 3.79 | % | | | (3.27 | )% | | | 18.14 | % | | | 8.17 | % | | | (0.80 | )%(d) |
| | | | | | |
Ratios/Supplemental Data: | | | | | | | | | | | | | | | | | | | | | | | | |
Net Assets, End of Period (in 000’s) | | $ | 11,800 | | | $ | 27,983 | | | $ | 109,140 | | | $ | 108,966 | | | $ | 7,506 | | | $ | 4,594 | |
Ratios of expenses to average net assets: | | | | | | | | | | | | | | | | | | | | | | | | |
Before expense reimbursement and/or fee waiver, or recoupment by Adviser, including interest and dividend expense for securities sold short | | | 3.57 | %(e) | | | 2.87 | % | | | 2.53 | % | | | 2.54 | % | | | 5.03 | % | | | 8.68 | %(e) |
After expense reimbursement and/or fee waiver, or recoupment by Adviser, including interest and dividend expense for securities sold short | | | 3.36 | %(e) | | | 2.89 | % | | | 2.58 | % | | | 2.38 | % | | | 3.11 | % | | | 2.72 | %(e) |
After expense reimbursement and/or fee waiver, or recoupment by Adviser, excluding interest and dividend expense for securities sold short | | | 1.70 | %(e) | | | 1.70 | % | | | 1.70 | % | | | 1.70 | % | | | 1.70 | % | | | 1.70 | %(e) |
Ratios of net investment loss to average net assets: | | | | | | | | | | | | | | | | | | | | | | | | |
Before expense reimbursement and/or fee waiver, or recoupment by Adviser | | | (1.62 | )%(e) | | | (1.16 | )% | | | (1.55 | )% | | | (1.62 | )% | | | (3.63 | )% | | | (6.80 | )%(e) |
After expense reimbursement and/or fee waiver, or recoupment by Adviser | | | (1.41 | )%(e) | | | (1.19 | )% | | | (1.59 | )% | | | (1.46 | )% | | | (1.71 | )% | | | (0.84 | )%(e) |
Portfolio Turnover | | | 149.37 | %(d) | | | 278.88 | % | | | 303.04 | % | | | 291.36 | % | | | 277.72 | % | | | 127.32 | %(d) |
| | (a) | The commencement of investment operations for River Road Long-Short Fund Class N shares was May 3, 2011. |
| | (b) | The selected per share data was calculated using the weighted average shares outstanding method for the period. |
| | (c) | The total return is calculated using the Net Asset Value used for trading at the close of business at period end. |
See accompanying Notes to Financial Statements.
| | |
| |
| ASTON/River Road Long-Short Fund – Class I | | April 30, 2016 |
| |
| Financial Highlights | | |
| | | | | | | | | | | | | | | | |
| | | Six Months
Ended
04/30/16
(unaudited) | | | Year
Ended
10/31/15 | | | Year
Ended
10/31/14 | | | Period
Ended
10/31/13(a) | |
Net Asset Value, Beginning of Period | | $ | 11.56 | | | $ | 11.40 | | | $ | 12.05 | | | $ | 10.96 | |
| | | | | | | | | | | | | | | | |
Income from Investment Operations: | | | | | | | | | | | | | | | | |
Net investment loss | | | (0.06 | )(b) | | | (0.11 | )(b) | | | (0.16 | ) | | | (0.10 | )(b) |
Net realized and unrealized gain (loss) on investments | | | (0.11 | ) | | | 0.57 | | | | (0.20 | ) | | | 1.19 | |
| | | | | | | | | �� | | | | | | | |
Total from investment operations | | | (0.17 | ) | | | 0.46 | | | | (0.36 | ) | | | 1.09 | |
| | | | | | | | | | | | | | | | |
Less Distributions: | | | | | | | | | | | | | | | | |
Distributions from net realized gain on investments | | | (0.38 | ) | | | (0.30 | ) | | | (0.29 | ) | | | — | |
| | | | | | | | | | | | | | | | |
Total distributions | | | (0.38 | ) | | | (0.30 | ) | | | (0.29 | ) | | | — | |
| | | | | | | | | | | | | | | | |
Net increase (decrease) in net asset value | | | (0.55 | ) | | | 0.16 | | | | (0.65 | ) | | | 1.09 | |
| | | | | | | | | | | | | | | | |
Net Asset Value, End of Period | | $ | 11.01 | | | $ | 11.56 | | | $ | 11.40 | | | $ | 12.05 | |
| | | | | | | | | | | | | | | | |
Total Return (c) | | | (1.50 | )%(d) | | | 4.04 | % | | | (3.01 | )% | | | 9.85 | %(d) |
| | | | |
Ratios/Supplemental Data: | | | | | | | | | | | | | | | | |
Net Assets, End of Period (in 000’s) | | $ | 31,371 | | | $ | 49,088 | | | $ | 110,271 | | | $ | 71,175 | |
Ratios of expenses to average net assets: | | | | | | | | | | | | | | | | |
Before expense reimbursement and/or fee waiver, or recoupment by Adviser, including interest and dividend expense for securities sold short | | | 3.32 | %(e) | | | 2.62 | % | | | 2.28 | % | | | 2.20 | %(e) |
After expense reimbursement and/or fee waiver, or recoupment by Adviser, including interest and dividend expense for securities sold short | | | 3.11 | %(e) | | | 2.64 | % | | | 2.33 | % | | | 2.10 | %(e) |
After expense reimbursement and/or fee waiver, or recoupment by Adviser, excluding interest and dividend expense for securities sold short | | | 1.45 | %(e) | | | 1.45 | % | | | 1.45 | % | | | 1.45 | %(e) |
Ratios of net investment loss to average net assets: | | | | | | | | | | | | | | | | |
Before expense reimbursement and/or fee waiver, or recoupment by Adviser | | | (1.37 | )%(e) | | | (0.91 | )% | | | (1.30 | )% | | | (1.44 | )%(e) |
After expense reimbursement and/or fee waiver, or recoupment by Adviser | | | (1.16 | )%(e) | | | (0.94 | )% | | | (1.34 | )% | | | (1.33 | )%(e) |
Portfolio Turnover | | | 149.37 | %(d) | | | 278.88 | % | | | 303.04 | % | | | 291.36 | %(d) |
| | (a) | The commencement of investment operations for River Road Long-Short Fund Class I shares was March 1, 2013. |
| | (b) | The selected per share data was calculated using the weighted average shares outstanding method for the period. |
| | (c) | The total return is calculated using the Net Asset Value used for trading at the close of business at period end. |
See accompanying Notes to Financial Statements.
| | |
| |
| ASTON/Barings International Fund – Class N | | April 30, 2016 |
| |
| Financial Highlights | | |
| | | | | | | | | | | | | | | | | | | | | | | | |
| | | Six Months
Ended
04/30/16
(unaudited) | | | Year
Ended
10/31/15 | | | Year
Ended
10/31/14 | | | Year
Ended
10/31/13 | | | Year
Ended
10/31/12 | | | Year
Ended
10/31/11 | |
| | | | | | | | | | | | | | | | | | | | | | | | |
Net Asset Value, Beginning of Period | | $ | 6.21 | | | $ | 6.98 | | | $ | 7.81 | | | $ | 6.87 | | | $ | 6.81 | | | $ | 7.24 | |
| | | | | | | | | | | | | | | | | | | | | | | | |
Income from Investment Operations: | | | | | | | | | | | | | | | | | | | | | | | | |
Net investment income | | | 0.04 | (a) | | | 0.05 | (a) | | | 0.14 | (a) | | | 0.11 | (a) | | | 0.10 | (a) | | | 0.07 | (a) |
Net realized and unrealized gain (loss) on investments | | | (0.29 | ) | | | 0.20 | | | | (0.31 | ) | | | 1.00 | | | | 0.17 | | | | (0.37 | ) |
| | | | | | | | | | | | | | | | | | | | | | | | |
Total from investment operations | | | (0.25 | ) | | | 0.25 | | | | (0.17 | ) | | | 1.11 | | | | 0.27 | | | | (0.30 | ) |
| | | | | | | | | | | | | | | | | | | | | | | | |
Less Distributions: | | | | | | | | | | | | | | | | | | | | | | | | |
Distributions from and in excess of net investment income | | | (0.05 | ) | | | (0.14 | ) | | | (0.18 | ) | | | (0.09 | ) | | | (0.04 | ) | | | (0.13 | ) |
Distributions from net realized gain on investments | | | (0.09 | ) | | | (0.88 | ) | | | (0.48 | ) | | | (0.08 | ) | | | (0.17 | ) | | | — | |
| | | | | | | | | | | | | | | | | | | | | | | | |
Total distributions | | | (0.14 | ) | | | (1.02 | ) | | | (0.66 | ) | | | (0.17 | ) | | | (0.21 | ) | | | (0.13 | ) |
| | | | | | | | | | | | | | | | | | | | | | | | |
Net increase (decrease) in net asset value | | | (0.39 | ) | | | (0.77 | ) | | | (0.83 | ) | | | 0.94 | | | | 0.06 | | | | (0.43 | ) |
| | | | | | | | | | | | | | | | | | | | | | | | |
Net Asset Value, End of Period | | $ | 5.82 | | | $ | 6.21 | | | $ | 6.98 | | | $ | 7.81 | | | $ | 6.87 | | | $ | 6.81 | |
| | | | | | | | | | | | | | | | | | | | | | | | |
Total Return (b) | | | (4.06 | )%(c) | | | 4.47 | % | | | (2.62 | )% | | | 16.64 | % | | | 4.28 | % | | | (4.22 | )% |
| | | | | | |
Ratios/Supplemental Data: | | | | | | | | | | | | | | | | | | | | | | | | |
Net Assets, End of Period (in 000’s) | | $ | 442 | | | $ | 399 | | | $ | 331 | | | $ | 477 | | | $ | 421 | | | $ | 393 | |
Ratios of expenses to average net assets: | | | | | | | | | | | | | | | | | | | | | | | | |
Before expense reimbursement and/or fee waiver by Adviser | | | 2.16 | %(d) | | | 2.11 | % | | | 1.95 | % | | | 1.67 | % | | | 1.60 | % | | | 1.68 | %(e) |
After expense reimbursement and/or fee waiver by Adviser | | | 1.40 | %(d) | | | 1.40 | % | | | 1.40 | % | | | 1.40 | % | | | 1.40 | % | | | 1.40 | %(e) |
Ratios of net investment income to average net assets: | | | | | | | | | | | | | | | | | | | | | | | | |
Before expense reimbursement and/or fee waiver by Adviser | | | 0.49 | %(d) | | | 0.12 | % | | | 1.42 | % | | | 1.26 | % | | | 1.30 | % | | | 0.76 | %(e) |
After expense reimbursement and/or fee waiver by Adviser | | | 1.26 | %(d) | | | 0.83 | % | | | 1.97 | % | | | 1.53 | % | | | 1.50 | % | | | 1.04 | %(e) |
Portfolio Turnover | | | 8.89 | %(c) | | | 37.56 | % | | | 53.14 | % | | | 55.78 | % | | | 33.48 | % | | | 58.96 | % |
| | (a) | The selected per share data was calculated using the weighted average shares outstanding method for the period. |
| | (b) | The total return is calculated using the Net Asset Value used for trading at the close of business at period end. |
| | (e) | For the period November 1, 2010 through February 28, 2011, the Adviser voluntarily waived management fees and/or reimbursed expenses so that the net expense ratio did not exceed 1.40%, excluding interest, taxes, investment-related costs (such as brokerage commissions), extraordinary expenses and acquired fund fees and expenses. Effective March 1, 2011, the expense limitation became contractual and was decreased from 1.50% to 1.40%, excluding interest, taxes, investment-related costs (such as brokerage commissions), extraordinary expenses and acquired fund fees and expenses. |
See accompanying Notes to Financial Statements.
| | |
| |
| ASTON/Barings International Fund – Class I | | April 30, 2016 |
| |
| Financial Highlights | | |
| | | | | | | | | | | | | | | | | | | | | | | | |
| | | Six Months
Ended
04/30/16
(unaudited) | | | Year
Ended
10/31/15 | | | Year
Ended
10/31/14 | | | Year
Ended
10/31/13 | | | Year
Ended
10/31/12 | | | Year
Ended
10/31/11 | |
| | | | | | | | | | | | | | | | | | | | | | | | |
Net Asset Value, Beginning of Period | | $ | 6.22 | | | $ | 6.99 | | | $ | 7.82 | | | $ | 6.89 | | | $ | 6.82 | | | $ | 7.26 | |
| | | | | | | | | | | | | | | | | | | | | | | | |
Income from Investment Operations: | | | | | | | | | | | | | | | | | | | | | | | | |
Net investment income | | | 0.04 | (a) | | | 0.07 | (a) | | | 0.16 | (a) | | | 0.13 | (a) | | | 0.12 | (a) | | | 0.09 | (a) |
Net realized and unrealized gain (loss) on investments | | | (0.28 | ) | | | 0.20 | | | | (0.31 | ) | | | 0.99 | | | | 0.18 | | | | (0.38 | ) |
| | | | | | | | | | | | | | | | | | | | | | | | |
Total from investment operations | | | (0.24 | ) | | | 0.27 | | | | (0.15 | ) | | | 1.12 | | | | 0.30 | | | | (0.29 | ) |
| | | | | | | | | | | | | | | | | | | | | | | | |
Less Distributions: | | | | | | | | | | | | | | | | | | | | | | | | |
Distributions from and in excess of net investment income | | | (0.07 | ) | | | (0.16 | ) | | | (0.20 | ) | | | (0.11 | ) | | | (0.06 | ) | | | (0.15 | ) |
Distributions from net realized gain on investments | | | (0.09 | ) | | | (0.88 | ) | | | (0.48 | ) | | | (0.08 | ) | | | (0.17 | ) | | | — | |
| | | | | | | | | | | | | | | | | | | | | | | | |
Total distributions | | | (0.16 | ) | | | (1.04 | ) | | | (0.68 | ) | | | (0.19 | ) | | | (0.23 | ) | | | (0.15 | ) |
| | | | | | | | | | | | | | | | | | | | | | | | |
Net increase (decrease) in net asset value | | | (0.40 | ) | | | (0.77 | ) | | | (0.83 | ) | | | 0.93 | | | | 0.07 | | | | (0.44 | ) |
| | | | | | | | | | | | | | | | | | | | | | | | |
Net Asset Value, End of Period | | $ | 5.82 | | | $ | 6.22 | | | $ | 6.99 | | | $ | 7.82 | | | $ | 6.89 | | | $ | 6.82 | |
| | | | | | | | | | | | | | | | | | | | | | | | |
Total Return (b) | | | (3.95 | )%(c) | | | 4.78 | % | | | (2.37 | )% | | | 16.72 | % | | | 4.72 | % | | | (4.09 | )% |
| | | | | | |
Ratios/Supplemental Data: | | | | | | | | | | | | | | | | | | | | | | | | |
Net Assets, End of Period (in 000’s) | | $ | 19,543 | | | $ | 20,338 | | | $ | 21,260 | | | $ | 37,507 | | | $ | 61,662 | | | $ | 52,390 | |
Ratios of expenses to average net assets: | | | | | | | | | | | | | | | | | | | | | | | | |
Before expense reimbursement and/or fee waiver by Adviser | | | 1.91 | %(d) | | | 1.86 | % | | | 1.70 | % | | | 1.42 | % | | | 1.35 | % | | | 1.43 | %(e) |
After expense reimbursement and/or fee waiver by Adviser | | | 1.15 | %(d) | | | 1.15 | % | | | 1.15 | % | | | 1.15 | % | | | 1.15 | % | | | 1.15 | %(e) |
Ratios of net investment income to average net assets: | | | | | | | | | | | | | | | | | | | | | | | | |
Before expense reimbursement and/or fee waiver by Adviser | | | 0.74 | %(d) | | | 0.37 | % | | | 1.67 | % | | | 1.51 | % | | | 1.55 | % | | | 1.01 | %(e) |
After expense reimbursement and/or fee waiver by Adviser | | | 1.51 | %(d) | | | 1.08 | % | | | 2.22 | % | | | 1.78 | % | | | 1.75 | % | | | 1.29 | %(e) |
Portfolio Turnover | | | 8.89 | %(c) | | | 37.56 | % | | | 53.14 | % | | | 55.78 | % | | | 33.48 | % | | | 58.96 | % |
| | (a) | The selected per share data was calculated using the weighted average shares outstanding method for the period. |
| | (b) | The total return is calculated using the Net Asset Value used for trading at the close of business at period end. |
| | (e) | For the period November 1, 2010 through February 28, 2011, the Adviser voluntarily waived management fees and/or reimbursed expenses so that the net expense ratio did not exceed 1.15%, excluding interest, taxes, investment related costs (such as brokerage commissions), extraordinary expenses and acquired fund fees and expenses. Effective March 1, 2011, the expense limitation became contractual and was decreased from 1.25% to 1.15%, excluding interest, taxes, investment-related costs (such as brokerage commissions), extraordinary expenses and acquired fund fees and expenses. |
See accompanying Notes to Financial Statements.
| | |
| |
| ASTON/Guardian Capital Global Dividend Fund – Class N | | April 30, 2016 |
| |
| Financial Highlights | | |
| | | | | | | | | | | | |
| | | Six Months
Ended
04/30/16
(unaudited) | | | Year
Ended
10/31/15 | | | Period
Ended
10/31/14(a) | |
| | | | | | | | | | | | |
Net Asset Value, Beginning of Period | | $ | 10.30 | | | $ | 10.51 | | | $ | 10.00 | |
| | | | | | | | | | | | |
Income from Investment Operations: | | | | | | | | | | | | |
Net investment income | | | 0.12 | (b) | | | 0.24 | | | | 0.13 | |
Net realized and unrealized gain (loss) on investments | | | (0.25 | ) | | | (0.23 | ) | | | 0.49 | |
| | | | | | | | | | | | |
Total from investment operations | | | (0.13 | ) | | | 0.01 | | | | 0.62 | |
| | | | | | | | | | | | |
Less Distributions: | | | | | | | | | | | | |
Distributions from and in excess of net investment income | | | (0.13 | ) | | | (0.22 | ) | | | (0.11 | ) |
| | | | | | | | | | | | |
Total Distributions | | | (0.13 | ) | | | (0.22 | ) | | | (0.11 | ) |
| | | | | | | | | | | | |
Net increase (decrease) in net asset value | | | (0.26 | ) | | | (0.21 | ) | | | 0.51 | |
| | | | | | | | | | | | |
Net Asset Value, End of Period | | $ | 10.04 | | | $ | 10.30 | | | $ | 10.51 | |
| | | | | | | | | | | | |
Total Return (c) | | | (1.31 | )%(d) | | | 0.07 | % | | | 6.17 | %(d) |
| | | |
Ratios/Supplemental Data: | | | | | | | | | | | | |
Net Assets, End of Period (in 000’s) | | $ | 1,036 | | | $ | 1,054 | | | $ | 1,052 | |
Ratios of expenses to average net assets: | | | | | | | | | | | | |
Before expense reimbursement and/or fee waiver by Adviser | | | 3.68 | %(e) | | | 4.10 | % | | | 5.21 | %(e) |
After expense reimbursement and/or fee waiver by Adviser | | | 1.30 | %(e) | | | 1.30 | % | | | 1.30 | %(e) |
Ratios of net investment income (loss) to average net assets: | | | | | | | | | | | | |
Before expense reimbursement and/or fee waiver by Adviser | | | (0.09 | )%(e) | | | (0.53 | )% | | | (1.74 | )%(e) |
After expense reimbursement and/or fee waiver by Adviser | | | 2.29 | %(e) | | | 2.28 | % | | | 2.17 | %(e) |
Portfolio Turnover | | | 24.77 | %(d) | | | 28.46 | % | | | 15.97 | %(d) |
| | (a) | The commencement of investment operations for Guardian Capital Global Dividend Fund Class N shares was April 11, 2014. |
| | (b) | The selected per share data was calculated using the weighted average shares outstanding method for the period. |
| | (c) | The total return is calculated using the Net Asset Value used for trading at the close of business at period end. |
See accompanying Notes to Financial Statements.
| | |
| |
| ASTON/Guardian Capital Global Dividend Fund – Class I | | April 30, 2016 |
| |
| Financial Highlights | | |
| | | | | | | | | | | | |
| | | Six Months
Ended
04/30/16
(unaudited) | | | Year
Ended
10/31/15 | | | Period
Ended
10/31/14(a) | |
| | | | | | | | | | | | |
Net Asset Value, Beginning of Period | | $ | 10.28 | | | $ | 10.52 | | | $ | 10.00 | |
| | | | | | | | | | | | |
Income from Investment Operations: | | | | | | | | | | | | |
Net investment income | | | 0.13 | (b) | | | 0.27 | | | | 0.14 | |
Net realized and unrealized gain (loss) on investments | | | (0.24 | ) | | | (0.25 | ) | | | 0.50 | |
| | | | | | | | | | | | |
Total from investment operations | | | (0.11 | ) | | | 0.02 | | | | 0.64 | |
| | | | | | | | | | | | |
Less Distributions: | | | | | | | | | | | | |
Distributions from and in excess of net investment income | | | (0.14 | ) | | | (0.26 | ) | | | (0.12 | ) |
| | | | | | | | | | | | |
Total Distributions | | | (0.14 | ) | | | (0.26 | ) | | | (0.12 | ) |
| | | | | | | | | | | | |
Net increase (decrease) in net asset value | | | (0.25 | ) | | | (0.24 | ) | | | 0.52 | |
| | | | | | | | | | | | |
Net Asset Value, End of Period | | $ | 10.03 | | | $ | 10.28 | | | $ | 10.52 | |
| | | | | | | | | | | | |
Total Return (c) | | | (1.10 | )%(d) | | | 0.14 | % | | | 6.39 | %(d) |
| | | |
Ratios/Supplemental Data: | | | | | | | | | | | | |
Net Assets, End of Period (in 000’s) | | $ | 3,230 | | | $ | 3,292 | | | $ | 3,211 | |
Ratios of expenses to average net assets: | | | | | | | | | | | | |
Before expense reimbursement and/or fee waiver by Adviser | | | 3.43 | %(e) | | | 3.85 | % | | | 4.96 | %(e) |
After expense reimbursement and/or fee waiver by Adviser | | | 1.05 | %(e) | | | 1.05 | % | | | 1.05 | %(e) |
Ratios of net investment income (loss) to average net assets: | | | | | | | | | | | | |
Before expense reimbursement and/or fee waiver by Adviser | | | 0.16 | %(e) | | | (0.28 | )% | | | (1.49 | )%(e) |
After expense reimbursement and/or fee waiver by Adviser | | | 2.54 | %(e) | | | 2.52 | % | | | 2.42 | %(e) |
Portfolio Turnover | | | 24.77 | %(d) | | | 28.46 | % | | | 15.97 | %(d) |
| | (a) | The commencement of investment operations for Guardian Capital Global Dividend Fund Class I shares was April 11, 2014. |
| | (b) | The selected per share data was calculated using the weighted average shares outstanding method for the period. |
| | (c) | The total return is calculated using the Net Asset Value used for trading at the close of business at period end. |
See accompanying Notes to Financial Statements.
| | |
| |
| ASTON/LMCG Emerging Markets Fund – Class N | | April 30, 2016 |
| |
| Financial Highlights | | |
| | | | | | | | | | | | | | | | |
| | | Six Months
Ended
04/30/16
(unaudited) | | | Year
Ended
10/31/15 | | | Year
Ended
10/31/14 | | | Period
Ended
10/31/13(a) | |
Net Asset Value, Beginning of Period | | $ | 7.88 | | | $ | 9.55 | | | $ | 9.65 | | | $ | 10.00 | |
| | | | | | | | | | | | | | | | |
Income from Investment Operations: | | | | | | | | | | | | | | | | |
Net investment income | | | 0.01 | (b) | | | 0.09 | (b) | | | 0.11 | | | | 0.08 | (b) |
Net realized and unrealized loss on investments | | | (0.24 | ) | | | (1.71 | ) | | | (0.07 | ) | | | (0.43 | ) |
| | | | | | | | | | | | | | | | |
Total from investment operations | | | (0.23 | ) | | | (1.62 | ) | | | 0.04 | | | | (0.35 | ) |
| | | | | | | | | | | | | | | | |
Less Distributions: | | | | | | | | | | | | | | | | |
Distributions from and in excess of net investment income | | | (0.08 | ) | | | (0.05 | ) | | | (0.14 | ) | | | — | |
| | | | | | | | | | | | | | | | |
Total distributions | | | (0.08 | ) | | | (0.05 | ) | | | (0.14 | ) | | | — | |
| | | | | | | | | | | | | | | | |
Net decrease in net asset value | | | (0.31 | ) | | | (1.67 | ) | | | (0.10 | ) | | | (0.35 | ) |
| | | | | | | | | | | | | | | | |
Net Asset Value, End of Period | | $ | 7.57 | | | $ | 7.88 | | | $ | 9.55 | | | $ | 9.65 | |
| | | | | | | | | | | | | | | | |
Total Return (c) | | | (2.83 | )%(d) | | | (17.02 | )% | | | 0.49 | % | | | (3.50 | )%(d) |
| | | | |
Ratios/Supplemental Data: | | | | | | | | | | | | | | | | |
Net Assets, End of Period (in 000’s) | | $ | 590 | | | $ | 605 | | | $ | 725 | | | $ | 675 | |
Ratios of expenses to average net assets: | | | | | | | | | | | | | | | | |
Before expense reimbursement and/or fee waiver by Adviser | | | 10.18 | %(e) | | | 6.27 | % | | | 5.96 | % | | | 7.24 | %(e) |
After expense reimbursement and/or fee waiver by Adviser | | | 1.43 | %(e) | | | 1.43 | % | | | 1.57 | % | | | 1.65 | %(e) |
Ratios of net investment income (loss) to average net assets: | | | | | | | | | | | | | | | | |
Before expense reimbursement and/or fee waiver by Adviser | | | (8.59 | )%(e) | | | (3.79 | )% | | | (3.24 | )% | | | (4.13 | )%(e) |
After expense reimbursement and/or fee waiver by Adviser | | | 0.16 | %(e) | | | 1.05 | % | | | 1.15 | % | | | 1.46 | %(e) |
Portfolio Turnover | | | 29.11 | %(d) | | | 64.35 | % | | | 63.48 | % | | | 101.96 | %(d) |
| | (a) | The commencement of investment operations for LMCG Emerging Markets Fund Class N shares was March 27, 2013. |
| | (b) | The selected per share data was calculated using the weighted average shares outstanding method for the period. |
| | (c) | The total return is calculated using the Net Asset Value used for trading at the close of business at period end. |
See accompanying Notes to Financial Statements.
| | |
| |
| ASTON/LMCG Emerging Markets Fund – Class I | | April 30, 2016 |
| |
| Financial Highlights | | |
| | | | | | | | | | | | | | | | |
| | | Six Months
Ended
04/30/16
(unaudited) | | | Year
Ended
10/31/15 | | | Year
Ended
10/31/14 | | | Period
Ended
10/31/13 (a)
| |
| | | | | | | | | | | | | | | | |
Net Asset Value, Beginning of Period | | $ | 7.91 | | | $ | 9.58 | | | $ | 9.67 | | | $ | 10.00 | |
| | | | | | | | | | | | | | | | |
Income from Investment Operations: | | | | | | | | | | | | | | | | |
Net investment income | | | 0.01 | (b) | | | 0.12 | (b) | | | 0.14 | | | | 0.10 | (b) |
Net realized and unrealized loss on investments | | | (0.23 | ) | | | (1.72 | ) | | | (0.07 | ) | | | (0.43 | ) |
| | | | | | | | | | | | | | | | |
Total from investment operations | | | (0.22 | ) | | | (1.60 | ) | | | 0.07 | | | | (0.33 | ) |
| | | | | | | | | | | | | | | | |
Less Distributions: | | | | | | | | | | | | | | | | |
Distributions from and in excess of net investment income | | | (0.10 | ) | | | (0.07 | ) | | | (0.16 | ) | | | — | |
| | | | | | | | | | | | | | | | |
Total distributions | | | (0.10 | ) | | | (0.07 | ) | | | (0.16 | ) | | | — | |
| | | | | | | | | | | | | | | | |
Net decrease in net asset value | | | (0.32 | ) | | | (1.67 | ) | | | (0.09 | ) | | | (0.33 | ) |
| | | | | | | | | | | | | | | | |
Net Asset Value, End of Period | | $ | 7.59 | | | $ | 7.91 | | | $ | 9.58 | | | $ | 9.67 | |
| | | | | | | | | | | | | | | | |
Total Return (c) | | | (2.67 | )%(d) | | | (16.77 | )% | | | 0.79 | % | | | (3.30 | )%(d) |
| | | | |
Ratios/Supplemental Data: | | | | | | | | | | | | | | | | |
Net Assets, End of Period (in 000’s) | | $ | 819 | | | $ | 1,449 | | | $ | 3,188 | | | $ | 3,307 | |
Ratios of expenses to average net assets: | | | | | | | | | | | | | | | | |
Before expense reimbursement and/or fee waiver by Adviser | | | 9.93 | %(e) | | | 6.02 | % | | | 5.71 | % | | | 6.99 | %(e) |
After expense reimbursement and/or fee waiver by Adviser | | | 1.18 | %(e) | | | 1.18 | % | | | 1.33 | % | | | 1.40 | %(e) |
Ratios of net investment income (loss) to average net assets: | | | | | | | | | | | | | | | | |
Before expense reimbursement and/or fee waiver by Adviser | | | (8.34 | )%(e) | | | (3.54 | )% | | | (2.99 | )% | | | (3.88 | )%(e) |
After expense reimbursement and/or fee waiver by Adviser | | | 0.41 | %(e) | | | 1.30 | % | | | 1.40 | % | | | 1.71 | %(e) |
Portfolio Turnover | | | 29.11 | %(d) | | | 64.35 | % | | | 63.48 | % | | | 101.96 | %(d) |
| | (a) | The commencement of investment operations for LMCG Emerging Markets Fund Class I shares was March 27, 2013. |
| | (b) | The selected per share data was calculated using the weighted average shares outstanding method for the period. |
| | (c) | The total return is calculated using the Net Asset Value used for trading at the close of business at period end. |
See accompanying Notes to Financial Statements.
| | |
| |
| ASTON/Pictet International Fund – Class N | | April 30, 2016 |
| |
| Financial Highlights | | |
| | | | | | | | | | | | |
| | | Six Months
Ended
04/30/16
(unaudited) | | | Year
Ended
10/31/15 | | | Period
Ended
10/31/14(a) | |
Net Asset Value, Beginning of Period | | $ | 9.56 | | | $ | 9.34 | | | $ | 10.00 | |
| | | | | | | | | | | | |
Income from Investment Operations: | | | | | | | | | | | | |
Net investment income | | | 0.10 | (b) | | | 0.10 | (b) | | | 0.09 | |
Net realized and unrealized gain (loss) on investments | | | (0.09 | ) | | | 0.17 | (c) | | | (0.75 | ) |
| | | | | | | | | | | | |
Total from investment operations | | | 0.01 | | | | 0.27 | | | | (0.66 | ) |
| | | | | | | | | | | | |
Less Distributions: | | | | | | | | | | | | |
Distributions from and in excess of net investment income | | | (0.02 | ) | | | (0.03 | ) | | | — | |
Distributions from net realized gain on investments | | | (0.06 | ) | | | (0.02 | ) | | | — | |
| | | | | | | | | | | | |
Total distributions | | | (0.08 | ) | | | (0.05 | ) | | | — | |
| | | | | | | | | | | | |
Net increase (decrease) in net asset value | | | (0.07 | ) | | | 0.22 | | | | (0.66 | ) |
| | | | | | | | | | | | |
Net Asset Value, End of Period | | $ | 9.49 | | | $ | 9.56 | | | $ | 9.34 | |
| | | | | | | | | | | | |
Total Return (d) | | | 0.15 | %(c)(e) | | | 3.02 | % | | | (6.60 | )%(e) |
| | | |
Ratios/Supplemental Data: | | | | | | | | | | | | |
Net Assets, End of Period (in 000’s) | | $ | 142 | | | $ | 1,056 | | | $ | 984 | |
Ratios of expenses to average net assets: | | | | | | | | | | | | |
Before expense reimbursement and/or fee waiver, or recoupment by Adviser | | | 1.33 | %(f) | | | 1.92 | % | | | 3.26 | %(f) |
After expense reimbursement and/or fee waiver, or recoupment by Adviser | | | 1.40 | %(f) | | | 1.40 | % | | | 1.40 | %(f) |
Ratios of net investment income (loss) to average net assets: | | | | | | | | | | | | |
Before expense reimbursement and/or fee waiver, or recoupment by Adviser | | | 2.29 | %(f) | | | 0.53 | % | | | (0.25 | )%(f) |
After expense reimbursement and/or fee waiver, or recoupment by Adviser | | | 2.22 | %(f) | | | 1.06 | % | | | 1.61 | %(f) |
Portfolio Turnover | | | 26.73 | %(e) | | | 53.26 | % | | | 25.82 | %(e) |
| | (a) | The commencement of investment operations for Pictet International Fund Class N shares was April 11, 2014. |
| | (b) | The selected per share data was calculated using the weighted average shares outstanding method for the period. |
| | (c) | Includes capital contribution of $0.01 per share. |
| | (d) | The total return is calculated using the Net Asset Value used for trading at the close of business at period end. |
See accompanying Notes to Financial Statements.
| | |
| |
| ASTON/Pictet International Fund – Class I | | April 30, 2016 |
| |
| Financial Highlights | | |
| | | | | | | | | | | | |
| | | Six Months
Ended
04/30/16
(unaudited) | | | Year
Ended
10/31/15 | | | Period
Ended
10/31/14(a) | |
| | | | | | | | | | | | |
Net Asset Value, Beginning of Period | | $ | 9.60 | | | $ | 9.36 | | | $ | 10.00 | |
| | | | | | | | | | | | |
Income from Investment Operations: | | | | | | | | | | | | |
Net investment income | | | 0.11 | (b) | | | 0.12 | (b) | | | 0.10 | |
Net realized and unrealized gain (loss) on investments | | | (0.10 | ) | | | 0.19 | (c) | | | (0.74 | ) |
| | | | | | | | | | | | |
Total from investment operations | | | 0.01 | | | | 0.31 | | | | (0.64 | ) |
| | | | | | | | | | | | |
Less Distributions: | | | | | | | | | | | | |
Distributions from and in excess of net investment income | | | (0.04 | ) | | | (0.05 | ) | | | — | |
Distributions from net realized gain on investments | | | (0.06 | ) | | | (0.02 | ) | | | — | |
| | | | | | | | | | | | |
Total distributions | | | (0.10 | ) | | | (0.07 | ) | | | — | |
| | | | | | | | | | | | |
Net increase (decrease) in net asset value | | | (0.09 | ) | | | 0.24 | | | | (0.64 | ) |
| | | | | | | | | | | | |
Net Asset Value, End of Period | | $ | 9.51 | | | $ | 9.60 | | | $ | 9.36 | |
| | | | | | | | | | | | |
Total Return (d) | | | 0.20 | %(c)(e) | | | 3.43 | % | | | (6.40 | )%(e) |
| | | |
Ratios/Supplemental Data: | | | | | | | | | | | | |
Net Assets, End of Period (in 000’s) | | $ | 900,225 | | | $ | 49,803 | | | $ | 8,467 | |
Ratios of expenses to average net assets: | | | | | | | | | | | | |
Before expense reimbursement and/or fee waiver, or recoupment by Adviser | | | 1.08 | %(f) | | | 1.67 | % | | | 3.01 | %(f) |
After expense reimbursement and/or fee waiver, or recoupment by Adviser | | | 1.15 | %(f) | | | 1.15 | % | | | 1.15 | %(f) |
Ratios of net investment income to average net assets: | | | | | | | | | | | | |
Before expense reimbursement and/or fee waiver, or recoupment by Adviser | | | 2.54 | %(f) | | | 0.78 | % | | | 0 | %(f)(g) |
After expense reimbursement and/or fee waiver, or recoupment by Adviser | | | 2.47 | %(f) | | | 1.31 | % | | | 1.86 | %(f) |
Portfolio Turnover | | | 26.73 | %(e) | | | 53.26 | % | | | 25.82 | %(e) |
| | (a) | The commencement of investment operations for Pictet International Fund Class I shares was April 11, 2014. |
| | (b) | The selected per share data was calculated using the weighted average shares outstanding method for the period. |
| | (c) | Includes capital contribution of $0.01 per share. |
| | (d) | The total return is calculated using the Net Asset Value used for trading at the close of business at period end. |
| | (g) | Represents less than 0.005%. |
See accompanying Notes to Financial Statements.
| | |
| |
| ASTON/Value Partners Asia Dividend Fund – Class N | | April 30, 2016 |
| |
| Financial Highlights | | |
| | | | |
| | | Period
Ended
04/30/16(a)
(unaudited) | |
Net Asset Value, Beginning of Period | | $ | 10.00 | |
| | | | |
Income from Investment Operations: | | | | |
Net investment income | | | 0.02 | (b) |
Net realized and unrealized gain on investments | | | 0.12 | |
| | | | |
Total from investment operations | | | 0.14 | |
| | | | |
Net increase in net asset value | | | 0.14 | |
| | | | |
Net Asset Value, End of Period | | $ | 10.14 | |
| | | | |
Total Return (c) | | | 1.50 | %(d) |
| |
Ratios/Supplemental Data: | | | | |
Net Assets, End of Period (in 000’s) | | $ | 761 | |
Ratios of expenses to average net assets: | | | | |
Before expense reimbursement and/or fee waiver by Adviser | | | 4.57 | %(e) |
After expense reimbursement and/or fee waiver by Adviser | | | 1.40 | %(e) |
Ratios of net investment income (loss) to average net assets: | | | | |
Before expense reimbursement and/or fee waiver by Adviser | | | (2.57 | )%(e) |
After expense reimbursement and/or fee waiver by Adviser | | | 0.60 | %(e) |
Portfolio Turnover | | | 18.12 | %(d) |
| | (a) | The commencement of investment operations for Value Partners Asia Dividend Fund Class N shares was December 16, 2015. |
| | (b) | The selected per share data was calculated using the weighted average shares outstanding method for the period. |
| | (c) | The total return is calculated using the Net Asset Value used for trading at the close of business at period end. |
See accompanying Notes to Financial Statements.
| | |
| |
| ASTON/Value Partners Asia Dividend Fund – Class I | | April 30, 2016 |
| |
| Financial Highlights | | |
| | | | |
| | | Period
Ended
04/30/16(a)
(unaudited) | |
Net Asset Value, Beginning of Period | | $ | 10.00 | |
| | | | |
Income from Investment Operations: | | | | |
Net investment income | | | 0.03 | (b) |
Net realized and unrealized gain on investments | | | 0.12 | |
| | | | |
Total from investment operations | | | 0.15 | |
| | | | |
Net increase in net asset value | | | 0.15 | |
| | | | |
Net Asset Value, End of Period | | $ | 10.15 | |
| | | | |
Total Return (c) | | | 1.50 | %(d) |
| |
Ratios/Supplemental Data: | | | | |
Net Assets, End of Period (in 000’s) | | $ | 6,854 | |
Ratios of expenses to average net assets: | | | | |
Before expense reimbursement and/or fee waiver by Adviser | | | 4.32 | %(e) |
After expense reimbursement and/or fee waiver by Adviser | | | 1.15 | %(e) |
Ratios of net investment income (loss) to average net assets: | | | | |
Before expense reimbursement and/or fee waiver by Adviser | | | (2.32 | )%(e) |
After expense reimbursement and/or fee waiver by Adviser | | | 0.85 | %(e) |
Portfolio Turnover | | | 18.12 | %(d) |
| | (a) | The commencement of investment operations for Value Partners Asia Dividend Fund Class I shares was December 16, 2015. |
| | (b) | The selected per share data was calculated using the weighted average shares outstanding method for the period. |
| | (c) | The total return is calculated using the Net Asset Value used for trading at the close of business at period end. |
See accompanying Notes to Financial Statements.
| | |
| |
| ASTON/Harrison Street Real Estate Fund – Class N | | April 30, 2016 |
| |
| Financial Highlights | | |
| | | | | | | | | | | | | | | | | | | | | | | | |
| | | Six Months
Ended
04/30/16
(unaudited) | | | Year
Ended
10/31/15 | | | Year
Ended
10/31/14 | | | Year
Ended
10/31/13 | | | Year
Ended
10/31/12 | | | Year
Ended
10/31/11 | |
| | | | | | | | | | | | | | | | | | | | | | | | |
Net Asset Value, Beginning of Period | | $ | 12.78 | | | $ | 12.63 | | | $ | 11.29 | | | $ | 10.49 | | | $ | 8.97 | | | $ | 8.16 | |
| | | | | | | | | | | | | | | | | | | | | | | | |
Income from Investment Operations: | | | | | | | | | | | | | | | | | | | | | | | | |
Net investment income | | | 0.08 | (a) | | | 0.17 | (a) | | | 0.10 | (a) | | | 0.17 | (a) | | | 0.15 | (a) | | | 0.15 | (a) |
Net realized and unrealized gain on investments | | | 0.62 | | | | 0.13 | | | | 1.37 | | | | 0.79 | (b) | | | 1.44 | | | | 0.79 | |
| | | | | | | | | | | | | | | | | | | | | | | | |
Total from investment operations | | | 0.70 | | | | 0.30 | | | | 1.47 | | | | 0.96 | | | | 1.59 | | | | 0.94 | |
| | | | | | | | | | | | | | | | | | | | | | | | |
Less Distributions: | | | | | | | | | | | | | | | | | | | | | | | | |
Distributions from and in excess of net investment income | | | (0.15 | ) | | | (0.15 | ) | | | (0.13 | ) | | | (0.16 | ) | | | (0.07 | ) | | | (0.13 | ) |
| | | | | | | | | | | | | | | | | | | | | | | | |
Total distributions | | | (0.15 | ) | | | (0.15 | ) | | | (0.13 | ) | | | (0.16 | ) | | | (0.07 | ) | | | (0.13 | ) |
| | | | | | | | | | | | | | | | | | | | | | | | |
Net increase in net asset value . | | | 0.55 | | | | 0.15 | | | | 1.34 | | | | 0.80 | | | | 1.52 | | | | 0.81 | |
| | | | | | | | | | | | | | | | | | | | | | | | |
Net Asset Value, End of Period | | $ | 13.33 | | | $ | 12.78 | | | $ | 12.63 | | | $ | 11.29 | | | $ | 10.49 | | | $ | 8.97 | |
| | | | | | | | | | | | | | | | | | | | | | | | |
Total Return (c) | | | 5.48 | %(d) | | | 2.38 | % | | | 13.19 | % | | | 9.30 | % | | | 17.85 | % | | | 11.66 | % |
| | | | | | |
Ratios/Supplemental Data: | | | | | | | | | | | | | | | | | | | | | | | | |
Net Assets, End of Period (in 000’s) | | $ | 9,728 | | | $ | 10,408 | | | $ | 12,852 | | | $ | 13,093 | | | $ | 10,381 | | | $ | 6,287 | |
Ratios of expenses to average net assets: | | | | | | | | | | | | | | | | | | | | | | | | |
Before expense reimbursement and/or fee waiver by Adviser | | | 2.39 | %(e) | | | 2.20 | % | | | 2.16 | % | | | 2.22 | % | | | 2.36 | % | | | 1.61 | %(f) |
After expense reimbursement and/or fee waiver by Adviser | | | 1.37 | %(e) | | | 1.37 | % | | | 1.37 | % | | | 1.37 | % | | | 1.37 | % | | | 1.29 | %(f) |
Ratios of net investment income to average net assets: | | | | | | | | | | | | | | | | | | | | | | | | |
Before expense reimbursement and/or fee waiver by Adviser | | | 0.24 | %(e) | | | 0.51 | % | | | 0.08 | % | | | 0.67 | % | | | 0.53 | % | | | 1.36 | % |
After expense reimbursement and/or fee waiver by Adviser | | | 1.26 | %(e) | | | 1.34 | % | | | 0.87 | % | | | 1.52 | % | | | 1.52 | % | | | 1.68 | % |
Portfolio Turnover | | | 41.94 | %(d) | | | 150.16 | % | | | 162.93 | % | | | 159.14 | % | | | 86.62 | %(g) | | | 143.86 | % |
| | (a) | The selected per share data was calculated using the weighted average shares outstanding method for the period. |
| | (b) | Includes capital contribution of less than $0.005 per share. |
| | (c) | The total return is calculated using the Net Asset Value used for trading at the close of business at period end. |
| | (f) | Ratios of expenses to average net assets include interest expense of less than 0.005% for the year ended October 31, 2011, which is not included in the contractual expense limitation. The interest expense is a result of utilizing the line of credit as discussed in Note H to the Financial Statements. |
| | (g) | Portfolio turnover rate excludes securities delivered from processing a redemption in-kind. |
See accompanying Notes to Financial Statements.
| | |
| |
| ASTON/Harrison Street Real Estate Fund – Class I | | April 30, 2016 |
| |
| Financial Highlights | | |
| | | | | | | | | | | | | | | | | | | | | | | | |
| | | Six Months
Ended
04/30/16
(unaudited) | | | Year
Ended
10/31/15 | | | Year
Ended
10/31/14 | | | Year
Ended
10/31/13 | | | Year
Ended
10/31/12 | | | Year
Ended
10/31/11 | |
| | | | | | | | | | | | | | | | | | | | | | | | |
Net Asset Value, Beginning of Period | | $ | 12.72 | | | $ | 12.57 | | | $ | 11.24 | | | $ | 10.44 | | | $ | 8.92 | | | $ | 8.12 | |
| | | | | | | | | | | | | | | | | | | | | | | | |
Income from Investment Operations: | | | | | | | | | | | | | | | | | | | | | | | | |
Net investment income | | | 0.10 | (a) | | | 0.20 | (a) | | | 0.13 | (a) | | | 0.20 | (a) | | | 0.15 | (a) | | | 0.16 | (a) |
Net realized and unrealized gain on investments | | | 0.61 | | | | 0.14 | | | | 1.35 | | | | 0.79 | (b) | | | 1.46 | | | | 0.79 | |
| | | | | | | | | | | | | | | | | | | | | | | | |
Total from investment operations | | | 0.71 | | | | 0.34 | | | | 1.48 | | | | 0.99 | | | | 1.61 | | | | 0.95 | |
| | | | | | | | | | | | | | | | | | | | | | | | |
Less Distributions: | | | | | | | | | | | | | | | | | | | | | | | | |
Distributions from and in excess of net investment income | | | (0.18 | ) | | | (0.19 | ) | | | (0.15 | ) | | | (0.19 | ) | | | (0.09 | ) | | | (0.15 | ) |
| | | | | | | | | | | | | | | | | | | | | | | | |
Total distributions | | | (0.18 | ) | | | (0.19 | ) | | | (0.15 | ) | | | (0.19 | ) | | | (0.09 | ) | | | (0.15 | ) |
| | | | | | | | | | | | | | | | | | | | | | | | |
Net increase in net asset value . | | | 0.53 | | | | 0.15 | | | | 1.33 | | | | 0.80 | | | | 1.52 | | | | 0.80 | |
| | | | | | | | | | | | | | | | | | | | | | | | |
Net Asset Value, End of Period | | $ | 13.25 | | | $ | 12.72 | | | $ | 12.57 | | | $ | 11.24 | | | $ | 10.44 | | | $ | 8.92 | |
| | | | | | | | | | | | | | | | | | | | | | | | |
Total Return (c) | | | 5.60 | %(d) | | | 2.65 | % | | | 13.45 | % | | | 9.58 | % | | | 18.16 | % | | | 11.82 | % |
| | | | | | |
Ratios/Supplemental Data: | | | | | | | | | | | | | | | | | | | | | | | | |
Net Assets, End of Period (in 000’s) | | $ | 516 | | | $ | 507 | | | $ | 732 | | | $ | 532 | | | $ | 166 | | | $ | 32,925 | |
Ratios of expenses to average net assets: | | | | | | | | | | | | | | | | | | | | | | | | |
Before expense reimbursement and/or fee waiver by Adviser | | | 2.14 | %(e) | | | 1.95 | % | | | 1.91 | % | | | 1.97 | % | | | 2.11 | % | | | 1.44 | %(f) |
After expense reimbursement and/or fee waiver by Adviser | | | 1.12 | %(e) | | | 1.12 | % | | | 1.12 | % | | | 1.12 | % | | | 1.12 | % | | | 1.12 | %(f) |
Ratios of net investment income to average net assets: | | | | | | | | | | | | | | | | | | | | | | | | |
Before expense reimbursement and/or fee waiver by Adviser | | | 0.49 | %(e) | | | 0.76 | % | | | 0.33 | % | | | 0.92 | % | | | 0.78 | % | | | 1.53 | % |
After expense reimbursement and/or fee waiver by Adviser | | | 1.51 | %(e) | | | 1.59 | % | | | 1.12 | % | | | 1.77 | % | | | 1.77 | % | | | 1.85 | % |
Portfolio Turnover | | | 41.94 | %(d) | | | 150.16 | % | | | 162.93 | % | | | 159.14 | % | | | 86.62 | %(g) | | | 143.86 | % |
| | (a) | The selected per share data was calculated using the weighted average shares outstanding method for the period. |
| | (b) | Includes capital contribution of less than $0.005 per share. |
| | (c) | The total return is calculated using the Net Asset Value used for trading at the close of business at period end. |
| | (f) | Ratios of expenses to average net assets include interest expense of less than 0.005% for the year ended October 31, 2011, which is not included in the contractual expense limitation. The interest expense is a result of utilizing the line of credit as discussed in Note H to the Financial Statements. |
| | (g) | Portfolio turnover rate excludes securities delivered from processing a redemption in-kind. |
See accompanying Notes to Financial Statements.
| | |
| |
| ASTON/Montag & Caldwell Balanced Fund – Class N | | April 30, 2016 |
| |
| Financial Highlights | | |
| | | | | | | | | | | | | | | | | | | | | | | | |
| | | Six Months
Ended
04/30/16
(unaudited) | | | Year
Ended
10/31/15 | | | Year
Ended
10/31/14 | | | Year
Ended
10/31/13 | | | Year
Ended
10/31/12 | | | Year
Ended
10/31/11 | |
| | | | | | | | | | | | | | | | | | | | | | | | |
Net Asset Value, Beginning of Period | | $ | 23.83 | | | $ | 24.68 | | | $ | 23.81 | | | $ | 21.46 | | | $ | 20.09 | | | $ | 19.13 | |
| | | | | | | | | | | | | | | | | | | | | | | | |
Income from Investment Operations: | | | | | | | | | | | | | | | | | | | | | | | | |
Net investment income | | | 0.05 | (a) | | | 0.10 | (a) | | | 0.12 | (a) | | | 0.21 | (a) | | | 0.16 | (a) | | | 0.15 | (a) |
Net realized and unrealized gain (loss) on investments | | | (0.13 | ) | | | 1.31 | | | | 1.70 | | | | 2.43 | | | | 1.45 | | | | 1.03 | |
| | | | | | | | | | | | | | | | | | | | | | | | |
Total from investment operations | | | (0.08 | ) | | | 1.41 | | | | 1.82 | | | | 2.64 | | | | 1.61 | | | | 1.18 | |
| | | | | | | | | | | | | | | | | | | | | | | | |
Less Distributions: | | | | | | | | | | | | | | | | | | | | | | | | |
Distributions from and in excess of net investment income | | | (0.07 | ) | | | (0.18 | ) | | | (0.21 | ) | | | (0.29 | ) | | | (0.24 | ) | | | (0.22 | ) |
Distributions from net realized gain on investments | | | (1.04 | ) | | | (2.08 | ) | | | (0.74 | ) | | | — | | | | — | | | | — | |
| | | | | | | | | | | | | | | | | | | | | | | | |
Total distributions | | | (1.11 | ) | | | (2.26 | ) | | | (0.95 | ) | | | (0.29 | ) | | | (0.24 | ) | | | (0.22 | ) |
| | | | | | | | | | | | | | | | | | | | | | | | |
Net increase (decrease) in net asset value. | | | (1.19 | ) | | | (0.85 | ) | | | 0.87 | | | | 2.35 | | | | 1.37 | | | | 0.96 | |
| | | | | | | | | | | | | | | | | | | | | | | | |
Net Asset Value, End of Period | | $ | 22.64 | | | $ | 23.83 | | | $ | 24.68 | | | $ | 23.81 | | | $ | 21.46 | | | $ | 20.09 | |
| | | | | | | | | | | | | | | | | | | | | | | | |
Total Return (b) | | | (0.38 | )%(c) | | | 6.01 | % | | | 7.83 | % | | | 12.40 | % | | | 8.03 | % | | | 6.20 | % |
| | | | | | |
Ratios/Supplemental Data: | | | | | | | | | | | | | | | | | | | | | | | | |
Net Assets, End of Period (in 000’s) | | $ | 37,151 | | | $ | 26,607 | | | $ | 20,446 | | | $ | 22,425 | | | $ | 31,536 | | | $ | 23,315 | |
Ratios of expenses to average net assets: | | | | | | | | | | | | | | | | | | | | | | | | |
Before expense reimbursement and/or fee waiver by Adviser | | | 1.29 | %(d) | | | 1.44 | % | | | 1.43 | % | | | 1.37 | % | | | 1.42 | % | | | 1.57 | %(e) |
After expense reimbursement and/or fee waiver by Adviser | | | 1.20 | %(d) | | | 1.20 | % | | | 1.20 | % | | | 1.20 | % | | | 1.22 | % | | | 1.35 | %(e) |
Ratios of net investment income to average net assets: | | | | | | | | | | | | | | | | | | | | | | | | |
Before expense reimbursement and/or fee waiver by Adviser | | | 0.32 | %(d) | | | 0.19 | % | | | 0.26 | % | | | 0.77 | % | | | 0.57 | % | | | 0.53 | % |
After expense reimbursement and/or fee waiver by Adviser | | | 0.41 | %(d) | | | 0.43 | % | | | 0.50 | % | | | 0.94 | % | | | 0.77 | % | | | 0.76 | % |
Portfolio Turnover | | | 23.46 | %(c) | | | 35.78 | % | | | 27.43 | % | | | 34.62 | % | | | 35.48 | % | | | 40.31 | % |
| | (a) | The selected per share data was calculated using the weighted average shares outstanding method for the period. |
| | (b) | The total return is calculated using the Net Asset Value used for trading at the close of business at period end. |
| | (e) | Ratios of expenses to average net assets include interest expense of less than 0.005% for the year ended October 31, 2011, which is not included in the voluntary expense limitation. The interest expense is a result of utilizing the line of credit as discussed in Note H to the Financial Statements. |
See accompanying Notes to Financial Statements.
| | |
| |
| ASTON/Montag & Caldwell Balanced Fund – Class I | | April 30, 2016 |
| |
| Financial Highlights | | |
| | | | | | | | | | | | | | | | | | | | | | | | |
| | | Six Months
Ended
04/30/16
(unaudited) | | | Year
Ended
10/31/15 | | | Year
Ended
10/31/14 | | | Year
Ended
10/31/13 | | | Year
Ended
10/31/12 | | | Year
Ended
10/31/11 | |
| | | | | | | | | | | | | | | | | | | | | | | | |
Net Asset Value, Beginning of Period | | $ | 23.75 | | | $ | 24.60 | | | $ | 23.76 | | | $ | 21.41 | | | $ | 20.05 | | | $ | 19.08 | |
| | | | | | | | | | | | | | | | | | | | | | | | |
Income from Investment Operations: | | | | | | | | | | | | | | | | | | | | | | | | |
Net investment income | | | 0.06 | (a) | | | 0.12 | (a) | | | 0.14 | (a) | | | 0.23 | (a) | | | 0.19 | (a) | | | 0.20 | (a) |
Net realized and unrealized gain (loss) on investments | | | (0.13 | ) | | | 1.31 | | | | 1.70 | | | | 2.43 | | | | 1.44 | | | | 1.04 | |
| | | | | | | | | | | | | | | | | | | | | | | | |
Total from investment operations | | | (0.07 | ) | | | 1.43 | | | | 1.84 | | | | 2.66 | | | | 1.63 | | | | 1.24 | |
| | | | | | | | | | | | | | | | | | | | | | | | |
Less Distributions: | | | | | | | | | | | | | | | | | | | | | | | | |
Distributions from and in excess of net investment income | | | (0.08 | ) | | | (0.20 | ) | | | (0.26 | ) | | | (0.31 | ) | | | (0.27 | ) | | | (0.27 | ) |
Distributions from net realized gain on investments | | | (1.04 | ) | | | (2.08 | ) | | | (0.74 | ) | | | — | | | | — | | | | — | |
| | | | | | | | | | | | | | | | | | | | | | | | |
Total distributions | | | (1.12 | ) | | | (2.28 | ) | | | (1.00 | ) | | | (0.31 | ) | | | (0.27 | ) | | | (0.27 | ) |
| | | | | | | | | | | | | | | | | | | | | | | | |
Net increase (decrease) in net asset value . | | | (1.19 | ) | | | (0.85 | ) | | | 0.84 | | | | 2.35 | | | | 1.36 | | | | 0.97 | |
| | | | | | | | | | | | | | | | | | | | | | | | |
Net Asset Value, End of Period | | $ | 22.56 | | | $ | 23.75 | | | $ | 24.60 | | | $ | 23.76 | | | $ | 21.41 | | | $ | 20.05 | |
| | | | | | | | | | | | | | | | | | | | | | | | |
Total Return (b) | | | (0.33 | )%(c) | | | 6.13 | % | | | 7.92 | % | | | 12.53 | % | | | 8.14 | % | | | 6.52 | % |
| | | | | | |
Ratios/Supplemental Data: | | | | | | | | | | | | | | | | | | | | | | | | |
Net Assets, End of Period (in 000’s) | | $ | 3,474 | | | $ | 3,518 | | | $ | 1,934 | | | $ | 1,839 | | | $ | 1,930 | | | $ | 1,415 | |
Ratios of expenses to average net assets: | | | | | | | | | | | | | | | | | | | | | | | | |
Before expense reimbursement and/or fee waiver by Adviser | | | 1.19 | %(d) | | | 1.34 | % | | | 1.33 | % | | | 1.27 | % | | | 1.30 | % | | | 1.32 | %(e) |
After expense reimbursement and/or fee waiver by Adviser | | | 1.10 | %(d) | | | 1.10 | % | | | 1.10 | % | | | 1.10 | % | | | 1.10 | % | | | 1.10 | %(e) |
Ratios of net investment income to average net assets: | | | | | | | | | | | | | | | | | | | | | | | | |
Before expense reimbursement and/or fee waiver by Adviser | | | 0.42 | %(d) | | | 0.29 | % | | | 0.36 | % | | | 0.87 | % | | | 0.69 | % | | | 0.79 | % |
After expense reimbursement and/or fee waiver by Adviser | | | 0.51 | %(d) | | | 0.53 | % | | | 0.60 | % | | | 1.04 | % | | | 0.89 | % | | | 1.02 | % |
Portfolio Turnover | | | 23.46 | %(c) | | | 35.78 | % | | | 27.43 | % | | | 34.62 | % | | | 35.48 | % | | | 40.31 | % |
| | (a) | The selected per share data was calculated using the weighted average shares outstanding method for the period. |
| | (b) | The total return is calculated using the Net Asset Value used for trading at the close of business at period end. |
| | (e) | Ratios of expenses to average net assets include interest expense of less than 0.005% for the year ended October 31, 2011, which is not included in the voluntary expense limitation. The interest expense is a result of utilizing the line of credit as discussed in Note H to the Financial Statements. |
See accompanying Notes to Financial Statements.
| | |
| |
| | April 30, 2016 |
| |
| Notes to Financial Statements (unaudited) | | |
Note (A) Fund Organization: Aston Funds (the “Trust”) was organized as a Delaware statutory trust under a Declaration of Trust dated September 10, 1993. The Trust is registered under the Investment Company Act of 1940, as amended (the “1940 Act”) as an open-end management investment company with 27 separate portfolios (each, a “Fund”, and collectively, the “Funds”) as of April 30, 2016.
Aston Asset Management, LLC (“Aston” or the “Adviser”), the investment adviser and the administrator, manages each Fund by retaining one or more subadvisers (each, a “Subadviser”) to manage each Fund’s portfolio on a subadvisory basis. The following 27 funds of the Trust are included in these financial statements:
|
ASTON/Cornerstone Large Cap Value Fund
(the “Cornerstone Large Cap Value Fund”) |
ASTON/Fairpointe Focused Equity Fund
(the “Fairpointe Focused Equity Fund”) |
ASTON/River Road Focused Absolute Value Fund
(the “River Road Focused Absolute Value Fund”) |
ASTON/Herndon Large Cap Value Fund
(the “Herndon Large Cap Value Fund”) |
ASTON/Montag & Caldwell Growth Fund
(the “Montag & Caldwell Growth Fund”) |
ASTON/River Road Dividend All Cap Value Fund
(the “River Road Dividend All Cap Value Fund”) |
ASTON/River Road Dividend All Cap Value Fund II
(the “River Road Dividend All Cap Value Fund II”) |
ASTON/Fairpointe Mid Cap Fund
(the “Fairpointe Mid Cap Fund”) |
ASTON/Montag & Caldwell Mid Cap Growth Fund
(the “Montag & Caldwell Mid Cap Growth Fund”) |
ASTON/LMCG Small Cap Growth Fund
(the “LMCG Small Cap Growth Fund”) |
ASTON/River Road Independent Value Fund
(the “River Road Independent Value Fund”) |
ASTON/River Road Select Value Fund
(the “River Road Select Value Fund”) |
ASTON/River Road Small Cap Value Fund
(the “River Road Small Cap Value Fund”) |
ASTON/Silvercrest Small Cap Fund
(the “Silvercrest Small Cap Fund”) |
ASTON Small Cap Fund (the “Small Cap Fund”)
(formerly, ASTON/TAMRO Small Cap Fund) |
ASTON/DoubleLine Core Plus Fixed Income Fund
(the “DoubleLine Core Plus Fixed Income Fund”) |
ASTON/TCH Fixed Income Fund
(the “TCH Fixed Income Fund”) |
ASTON/Anchor Capital Enhanced Equity Fund
(the “Anchor Capital Enhanced Equity Fund”) |
ASTON/Lake Partners LASSO Alternatives Fund
(the “Lake Partners LASSO Alternatives Fund”) |
ASTON/River Road Long-Short Fund
(the “River Road Long-Short Fund”) |
|
Funds |
ASTON/Barings International Fund
(the “Barings International Fund”) |
ASTON/Guardian Capital Global Dividend Fund
(the “Guardian Capital Global Dividend Fund”) |
ASTON/LMCG Emerging Markets Fund
(the “LMCG Emerging Markets Fund”) |
ASTON/Pictet International Fund
(the “Pictet International Fund”) |
ASTON/Value Partners Asia Dividend Fund
(the “Value Partners Asia Dividend Fund”) |
ASTON/Harrison Street Real Estate Fund (the “Harrison Street Real Estate Fund”) |
ASTON/Montag & Caldwell Balanced Fund
(the “Montag & Caldwell Balanced Fund”) |
Each Fund, except Montag & Caldwell Growth Fund, is authorized to issue two classes of shares (Class N shares and Class I shares). Montag & Caldwell Growth Fund is authorized to issue three classes of shares (Class N shares, Class I shares and Class R shares). Each class of shares is substantially the same except that certain classes of shares bear class specific expenses that include distribution and services fees.
The investment objectives of the Funds are as follows:
| | |
Cornerstone Large Cap Value Fund Total return through long-term capital appreciation and current income. |
Fairpointe Focused Equity Fund Long-term total return through capital appreciation. |
River Road Focused Absolute Value Fund Long-term capital appreciation. |
Herndon Large Cap Value Fund Long-term capital appreciation. |
Montag & Caldwell Growth Fund Long-term capital appreciation, and secondarily, current income, by investing primarily in common stocks and convertible securities. |
River Road Dividend All Cap Value Fund High current income, and secondarily, long-term capital appreciation. |
River Road Dividend All Cap Value Fund II Long-term capital appreciation and high current income. |
Fairpointe Mid Cap Fund Long-term total return through capital appreciation by investing primarily in common and preferred stocks and convertible securities. |
Montag & Caldwell Mid Cap Growth Fund Long-term capital appreciation, and secondarily, current income, by investing primarily in common stocks and convertible securities. |
LMCG Small Cap Growth Fund Long-term capital appreciation. |
River Road Independent Value Fund Long-term total return. |
River Road Select Value Fund Long-term capital appreciation. |
| | |
| |
| | April 30, 2016 |
| |
| Notes to Financial Statements (unaudited) – continued | | |
| | |
River Road Small Cap Value Fund Long-term capital appreciation. |
Silvercrest Small Cap Fund Long-term capital appreciation. |
Small Cap Fund Long-term capital appreciation. |
DoubleLine Core Plus Fixed Income Fund Maximize total return. |
TCH Fixed Income Fund High current income consistent with prudent risk of capital. |
Anchor Capital Enhanced Equity Fund Total return through a combination of a high level of current income and capital appreciation. |
Lake Partners LASSO Alternatives Fund Long term total return with reduced correlation to the conventional stock and bond markets. |
River Road Long-Short Fund Absolute return while minimizing volatility over a full market cycle. |
Barings International Fund Total return. |
Guardian Capital Global Dividend Fund Long-term capital appreciation and current income. |
LMCG Emerging Markets Fund Long-term capital appreciation. |
Pictet International Fund Capital appreciation. |
Value Partners Asia Dividend Fund Capital appreciation and current income. |
Harrison Street Real Estate Fund Total return through a combination of growth and income. |
Montag & Caldwell Balanced Fund Long-term total return. |
Note (B) Summary of Significant Accounting Policies: The following is a summary of the significant accounting policies consistently followed by each Fund in the preparation of its financial statements. These policies are in conformity with accounting principles generally accepted in the United States of America.
(1) Valuation of Investments: Equity securities, closed-end funds, exchange-traded funds, index options traded on a national securities exchange, and over-the-counter securities listed on the NASDAQ National Market System are valued at the last sale price or the NASDAQ Official Closing Price (“NOCP”), if applicable. If no last sale price or NOCP, if applicable, is reported, the last quoted bid price may be used. Fixed income securities, except short-term investments, are valued on the basis of mean prices provided by an independent pricing service when such prices are believed by the Adviser to reflect the current market value of such securities, in accordance with guidelines adopted by the Board of Trustees of the Trust (the “Board”). The pricing service provider may employ methodologies that utilize actual market transactions, broker-dealer supplied valuations, or other techniques. Such techniques generally consider factors such as composite security prices, yields, maturities, call features, credit
ratings and developments relating to specific securities, in arriving at valuations. If accurate market quotations are not available, securities are valued at fair values in accordance with guidelines adopted by the Board. Short-term investments, that is, those with maturities of 60 days or less, are valued at amortized cost, which approximates fair market value. Repurchase agreements are valued at cost. Investments in money market funds and other mutual funds are valued at the net asset value (“NAV”) at the date of valuation. Foreign equity securities are valued at the last official closing price on the primary exchange where the security is traded. With respect to foreign equity securities and certain foreign fixed income securities, the Board has adopted a policy that securities held in a Fund that can be fair valued by the applicable fair value pricing service are fair valued on each business day provided that each individual price exceeds a pre-established confidence level.
Fair Value Measurements - The inputs and valuation techniques used to measure fair value of the Funds’ net assets are summarized into three levels as described in the hierarchy below:
| | |
• Level 1 – | | unadjusted quoted prices in active markets for identical assets or liabilities |
• Level 2 – | | other significant observable inputs (including quoted prices for similar securities, interest rates, prepayment speeds, credit risk, etc.) |
• Level 3 – | | significant unobservable inputs (including the Funds’ own assumptions in determining the fair value of investments) |
| | |
| |
| | April 30, 2016 |
| |
| Notes to Financial Statements (unaudited) – continued | | |
The inputs or methodology used for valuing securities are not necessarily an indication of the risk associated with investing in those securities. Transfers in and out of the levels are recognized at the market value at the end of the period. The summary of each Fund’s investments that are measured at fair value by Level within the fair value hierarchy as of April 30, 2016 is as follows:
| | | | | | | | | | | | | | | | |
Funds | | Total
Value | | | Level 1
Quoted
Prices | | | Level 2
Significant
Observable
Inputs | | | Level 3
Significant
Unobservable
Inputs | |
| | | | | | | | | | | | | | | | |
| Cornerstone Large Cap Value Fund | | | | | | | | | | | | | | | | |
| Assets | | | | | | | | | | | | | | | | |
Investments in Securities* | | $ | 80,917,986 | | | $ | 80,917,986 | | | $ | — | | | $ | — | |
| | | | | | | | | | | | | | | | |
| Fairpointe Focused Equity Fund | | | | | | | | | | | | | | | | |
| Assets | | | | | | | | | | | | | | | | |
Investments in Securities* | | $ | 6,718,757 | | | $ | 6,718,757 | | | $ | — | | | $ | — | |
| | | | | | | | | | | | | | | | |
| River Road Focused Absolute Value Fund | | | | | | | | | | | | | | | | |
| Assets | | | | | | | | | | | | | | | | |
Investments in Securities* | | $ | 7,973,924 | | | $ | 7,973,924 | | | $ | — | | | $ | — | |
| | | | | | | | | | | | | | | | |
| Herndon Large Cap Value Fund | | | | | | | | | | | | | | | | |
| Assets | | | | | | | | | | | | | | | | |
Investments in Securities* | | $ | 86,504,142 | | | $ | 86,504,142 | | | $ | — | | | $ | — | |
| | | | | | | | | | | | | | | | |
| Montag & Caldwell Growth Fund | | | | | | | | | | | | | | | | |
| Assets | | | | | | | | | | | | | | | | |
Investments in Securities* | | $ | 1,609,904,757 | | | $ | 1,609,904,757 | | | $ | — | | | $ | — | |
| | | | | | | | | | | | | | | | |
| River Road Dividend All Cap Value Fund | | | | | | | | | | | | | | | | |
| Assets | | | | | | | | | | | | | | | | |
Investments in Securities* | | $ | 709,714,325 | | | $ | 709,714,325 | | | $ | — | | | $ | — | |
| | | | | | | | | | | | | | | | |
| River Road Dividend All Cap Value Fund II | | | | | | | | | | | | | | | | |
| Assets | | | | | | | | | | | | | | | | |
Investments in Securities* | | $ | 118,456,912 | | | $ | 118,456,912 | | | $ | — | | | $ | — | |
| | | | | | | | | | | | | | | | |
| Fairpointe Mid Cap Fund | | | | | | | | | | | | | | | | |
| Assets | | | | | | | | | | | | | | | | |
Investments in Securities* | | $ | 3,807,937,628 | | | $ | 3,807,937,628 | | | $ | — | | | $ | — | |
| | | | | | | | | | | | | | | | |
| Montag & Caldwell Mid Cap Growth Fund | | | | | | | | | | | | | | | | |
| Assets | | | | | | | | | | | | | | | | |
Investments in Securities* | | $ | 10,596,467 | | | $ | 10,596,467 | | | $ | — | | | $ | — | |
| | | | | | | | | | | | | | | | |
| LMCG Small Cap Growth Fund | | | | | | | | | | | | | | | | |
| Assets | | | | | | | | | | | | | | | | |
Consumer Discretionary | | $ | 25,934,506 | | | $ | 25,934,506 | | | $ | — | | | $ | — | |
Consumer Staples | | | 5,974,351 | | | | 5,974,351 | | | | — | | | | — | |
Financials | | | 4,506,934 | | | | 4,506,934 | | | | — | | | | — | |
Healthcare | | | 43,895,841 | | | | 43,895,841 | | | | — | | | | — | |
Industrials | | | 13,780,145 | | | | 13,780,145 | | | | — | | | | — | |
Information Technology | | | 45,633,876 | | | | 45,633,876 | | | | — | | | | — | |
Materials | | | 6,662,338 | | | | 6,662,338 | | | | — | | | | — | |
Telecommunication Services | | | 1,978,541 | | | | 1,978,541 | | | | — | | | | — | |
Rights | | | 996 | | | | — | | | | — | | | | 996 | |
Investment Company* | | | 1,964,356 | | | | 1,964,356 | | | | — | | | | — | |
| | | | | | | | | | | | | | | | |
Total | | $ | 150,331,884 | | | $ | 150,330,888 | | | $ | — | | | $ | 996 | |
| | | | | | | | | | | | | | | | |
| River Road Independent Value Fund | | | | | | | | | | | | | | | | |
| Assets | | | | | | | | | | | | | | | | |
Investments in Securities* | | $ | 400,085,991 | | | $ | 400,085,991 | | | $ | — | | | $ | — | |
| | | | | | | | | | | | | | | | |
| River Road Select Value Fund | | | | | | | | | | | | | | | | |
| Assets | | | | | | | | | | | | | | | | |
Investments in Securities* | | $ | 46,173,165 | | | $ | 46,173,165 | | | $ | — | | | $ | — | |
| | | | | | | | | | | | | | | | |
| | |
| |
| | April 30, 2016 |
| |
| Notes to Financial Statements (unaudited) – continued | | |
| | | | | | | | | | | | | | | | |
Funds | | Total
Value | | | Level 1
Quoted
Prices | | | Level 2
Significant
Observable
Inputs | | | Level 3
Significant
Unobservable
Inputs | |
| | | | | | | | | | | | | | | | |
| River Road Small Cap Value Fund | | | | | | | | | | | | | | | | |
| Assets | | | | | | | | | | | | | | | | |
Common Stocks | | | | | | | | | | | | | | | | |
Consumer Discretionary | | $ | 55,112,276 | | | $ | 50,317,262 | | | $ | 4,795,014 | | | $ | — | |
Consumer Staples | | | 8,135,515 | | | | 8,135,515 | | | | — | | | | — | |
Energy | | | 12,882,662 | | | | 9,644,682 | | | | 3,237,980 | | | | — | |
Financials | | | 46,492,687 | | | | 46,492,687 | | | | — | | | | — | |
Healthcare | | | 8,179,707 | | | | 8,179,707 | | | | — | | | | — | |
Industrials | | | 65,606,842 | | | | 65,606,842 | | | | — | | | | — | |
Information Technology | | | 39,163,957 | | | | 34,262,365 | | | | 4,901,592 | | | | — | |
Telecommunication Services | | | 6,037,603 | | | | 6,037,603 | | | | — | | | | — | |
| | | | | | | | | | | | | | | | |
Total Common Stocks | | | 241,611,249 | | | | 228,676,663 | | | | 12,934,586 | | | | — | |
Investment Company* | | | 15,210,777 | | | | 15,210,777 | | | | — | | | | — | |
| | | | | | | | | | | | | | | | |
Total | | $ | 256,822,026 | | | $ | 243,887,440 | | | $ | 12,934,586 | | | $ | — | |
| | | | | | | | | | | | | | | | |
| Silvercrest Small Cap Fund | | | | | | | | | | | | | | | | |
| Assets | | | | | | | | | | | | | | | | |
Investments in Securities* | | $ | 177,103,182 | | | $ | 177,103,182 | | | $ | — | | | $ | — | |
| | | | | | | | | | | | | | | | |
| Small Cap Fund | | | | | | | | | | | | | | | | |
| Assets | | | | | | | | | | | | | | | | |
Investments in Securities* | | $ | 109,848,467 | | | $ | 109,848,467 | | | $ | — | | | $ | — | |
| | | | | | | | | | | | | | | | |
| DoubleLine Core Plus Fixed Income Fund | | | | | | | | | | | | | | | | |
| Assets | | | | | | | | | | | | | | | | |
Corporate Notes and Bonds** | | $ | 206,842,379 | | | $ | — | | | $ | 206,842,379 | | | $ | — | |
Collateralized Mortgage and Asset-Backed Securities | | | 94,059,089 | | | | — | | | | 94,059,089 | | | | — | |
U.S. Government and Agency Obligations** | | | 300,631,757 | | | | — | | | | 300,631,757 | | | | — | |
Other Mortgage and Asset-Backed Securities | | | 45,777,293 | | | | — | | | | 45,777,293 | | | | — | |
Municipal Bonds | | | 1,212,665 | | | | — | | | | 1,212,665 | | | | — | |
Foreign Government Bonds and Notes | | | 3,636,450 | | | | — | | | | 3,636,450 | | | | — | |
Investment Companies* | | | 66,725,927 | | | | 66,725,927 | | | | — | | | | — | |
| | | | | | | | | | | | | | | | |
Total | | $ | 718,885,560 | | | $ | 66,725,927 | | | $ | 652,159,633 | | | $ | — | |
| | | | | | | | | | | | | | | | |
| TCH Fixed Income Fund | | | | | | | | | | | | | | | | |
| Assets | | | | | | | | | | | | | | | | |
Corporate Notes and Bonds** | | $ | 16,363,717 | | | $ | — | | | $ | 16,363,717 | | | $ | — | |
U.S. Government and Agency Obligations** | | | 21,202,055 | | | | — | | | | 21,202,055 | | | | — | |
Commercial Mortgage-Backed Security | | | 274,458 | | | | — | | | | 274,458 | | | | — | |
Foreign Government Bond | | | 468,125 | | | | — | | | | 468,125 | | | | — | |
Investment Company* | | | 1,093,027 | | | | 1,093,027 | | | | — | | | | — | |
| | | | | | | | | | | | | | | | |
Total | | $ | 39,401,382 | | | $ | 1,093,027 | | | $ | 38,308,355 | | | $ | — | |
| | | | | | | | | | | | | | | | |
| Anchor Capital Enhanced Equity Fund | | | | | | | | | | | | | | | | |
| Assets | | | | | | | | | | | | | | | | |
Common Stocks* | | $ | 106,255,670 | | | $ | 106,255,670 | | | $ | — | | | $ | — | |
Purchased Options | | | 1,280,000 | | | | 1,280,000 | | | | — | | | | — | |
Investment Company* | | | 2,007,042 | | | | 2,007,042 | | | | — | | | | — | |
| | | | | | | | | | | | | | | | |
Total Assets | | | 109,542,712 | | | | 109,542,712 | | | | — | | | | — | |
| | | | | | | | | | | | | | | | |
| Liabilities | | | | | | | | | | | | | | | | |
Written Options | | | (5,340,533 | ) | | | (5,340,533 | ) | | | — | | | | — | |
| | | | | | | | | | | | | | | | |
Total Liabilities | | | (5,340,533 | ) | | | (5,340,533 | ) | | | — | | | | — | |
| | | | | | | | | | | | | | | | |
Total | | $ | 104,202,179 | | | $ | 104,202,179 | | | $ | — | | | $ | — | |
| | | | | | | | | | | | | | | | |
| Lake Partners LASSO Alternative Fund | | | | | | | | | | | | | | | | |
| Assets | | | | | | | | | | | | | | | | |
Investments in Securities* | | $ | 129,320,873 | | | $ | 129,320,873 | | | $ | — | | | $ | — | |
| | | | | | | | | | | | | | | | |
| | |
| |
| | April 30, 2016 |
| |
| Notes to Financial Statements (unaudited) – continued | | |
| | | | | | | | | | | | | | | | |
Funds | | Total
Value | | | Level 1
Quoted
Prices | | | Level 2
Significant
Observable
Inputs | | | Level 3
Significant
Unobservable
Inputs | |
| | | | | | | | | | | | | | | | |
| River Road Long-Short Fund | | | | | | | | | | | | | | | | |
| Assets | | | | | | | | | | | | | | | | |
Investments in Securities* | | $ | 61,546,106 | | | $ | 61,546,106 | | | $ | — | | | $ | — | |
| | | | | | | | | | | | | | | | |
Total Assets | | | 61,546,106 | | | | 61,546,106 | | | | — | | | | — | |
| | | | | | | | | | | | | | | | |
| Liabilities | | | | | | | | | | | | | | | | |
Common Stocks* | | | (14,460,451 | ) | | | (14,460,451 | ) | | | — | | | | — | |
| | | | | | | | | | | | | | | | |
Total Liabilities | | | (14,460,451 | ) | | | (14,460,451 | ) | | | — | | | | — | |
| | | | | | | | | | | | | | | | |
Total | | $ | 47,085,655 | | | $ | 47,085,655 | | | $ | — | | | $ | — | |
| | | | | | | | | | | | | | | | |
| Barings International Fund | | | | | | | | | | | | | | | | |
| Assets | | | | | | | | | | | | | | | | |
Common Stocks | | | | | | | | | | | | | | | | |
Australia | | $ | 819,941 | | | $ | — | | | $ | 819,941 | | | $ | — | |
Belgium | | | 168,801 | | | | — | | | | 168,801 | | | | — | |
China | | | 130,044 | | | | — | | | | 130,044 | | | | — | |
France | | | 1,764,451 | | | | — | | | | 1,764,451 | | | | — | |
Germany | | | 2,230,422 | | | | — | | | | 2,230,422 | | | | — | |
Hong Kong | | | 283,670 | | | | — | | | | 283,670 | | | | — | |
Japan | | | 5,013,926 | | | | 36,945 | | | | 4,976,981 | | | | — | |
Netherlands | | | 1,902,106 | | | | 284,370 | | | | 1,617,736 | | | | — | |
Spain | | | 361,065 | | | | — | | | | 361,065 | | | | — | |
Sweden | | | 363,911 | | | | — | | | | 363,911 | | | | — | |
Switzerland | | | 1,352,352 | | | | — | | | | 1,352,352 | | | | — | |
Taiwan | | | 325,542 | | | | 325,542 | | | | — | | | | — | |
United Kingdom | | | 4,708,320 | | | | — | | | | 4,708,320 | | | | — | |
| | | | | | | | | | | | | | | | |
Total Common Stocks | | | 19,424,551 | | | | 646,857 | | | | 18,777,694 | | | | — | |
Investment Company* | | | 405,382 | | | | 405,382 | | | | — | | | | — | |
| | | | | | | | | | | | | | | | |
Total | | $ | 19,829,933 | | | $ | 1,052,239 | | | $ | 18,777,694 | | | $ | — | |
| | | | | | | | | | | | | | | | |
| Guardian Capital Global Dividend Fund | | | | | | | | | | | | | | | | |
| Assets | | | | | | | | | | | | | | | | |
Common Stocks | | | | | | | | | | | | | | | | |
Australia | | $ | 159,154 | | | $ | — | | | $ | 159,154 | | | $ | — | |
Belgium | | | 124,291 | | | | 81,959 | | | | 42,332 | | | | — | |
Bermuda | | | 29,590 | | | | 29,590 | | | | — | | | | — | |
Canada | | | 41,125 | | | | 41,125 | | | | — | | | | — | |
Finland | | | 40,159 | | | | — | | | | 40,159 | | | | — | |
France | | | 244,787 | | | | — | | | | 244,787 | | | | — | |
Germany | | | 216,429 | | | | — | | | | 216,429 | | | | — | |
Ireland | | | 74,271 | | | | 74,271 | | | | — | | | | — | |
Israel | | | 87,048 | | | | 37,843 | | | | 49,205 | | | | — | |
Netherlands | | | 70,193 | | | | 70,193 | | | | — | | | | — | |
New Zealand | | | 47,128 | | | | — | | | | 47,128 | | | | — | |
Norway | | | 93,772 | | | | 93,772 | | | | — | | | | — | |
Singapore | | | 36,729 | | | | 36,729 | | | | — | | | | — | |
Spain | | | 89,559 | | | | — | | | | 89,559 | | | | — | |
Switzerland | | | 209,062 | | | | 13,523 | | | | 195,539 | | | | — | |
United Kingdom | | | 571,502 | | | | 107,716 | | | | 463,786 | | | | — | |
United States | | | 2,110,758 | | | | 2,110,758 | | | | — | | | | — | |
| | | | | | | | | | | | | | | | |
Total Common Stocks | | | 4,245,557 | | | | 2,697,479 | | | | 1,548,078 | | | | — | |
Investment Company* | | | 21,253 | | | | 21,253 | | | | — | | | | — | |
| | | | | | | | | | | | | | | | |
Total | | $ | 4,266,810 | | | $ | 2,718,732 | | | $ | 1,548,078 | | | $ | — | |
| | | | | | | | | | | | | | | | |
| | |
| |
| | April 30, 2016 |
| |
| Notes to Financial Statements (unaudited) – continued | | |
| | | | | | | | | | | | | | | | |
Funds | | Total
Value | | | Level 1
Quoted
Prices | | | Level 2
Significant
Observable
Inputs | | | Level 3
Significant
Unobservable
Inputs | |
| | | | | | | | | | | | | | | | |
| LMCG Emerging Markets Fund | | | | | | | | | | | | | | | | |
| Assets | | | | | | | | | | | | | | | | |
Common Stocks | | | | | | | | | | | | | | | | |
Bermuda | | $ | 8,465 | | | $ | — | | | $ | 8,465 | | | $ | — | |
Brazil | | | 181,321 | | | | 181,321 | | | | — | | | | — | |
Cayman Islands | | | 68,344 | | | | 9,310 | | | | 59,034 | | | | — | |
China | | | 271,566 | | | | — | | | | 271,566 | | | | — | |
Egypt | | | 9,001 | | | | — | | | | 9,001 | | | | — | |
Hong Kong | | | 114,064 | | | | — | | | | 114,064 | | | | — | |
Hungary | | | 26,467 | | | | — | | | | 26,467 | | | | — | |
India | | | 84,445 | | | | 84,445 | | | | — | | | | — | |
Indonesia | | | 12,973 | | | | — | | | | 12,973 | | | | — | |
Malaysia | | | 32,838 | | | | 16,096 | | | | 16,742 | | | | — | |
Mexico | | | 98,613 | | | | 98,613 | | | | — | | | | — | |
Poland | | | 42,234 | | | | — | | | | 42,234 | | | | — | |
Russia | | | 76,975 | | | | 36,770 | | | | 40,205 | | | | — | |
South Africa | | | 98,272 | | | | — | | | | 98,272 | | | | — | |
South Korea | | | 396,269 | | | | 12,689 | | | | 383,580 | | | | — | |
Taiwan | | | 239,700 | | | | — | | | | 239,700 | | | | — | |
Thailand | | | 21,463 | | | | — | | | | 21,463 | | | | — | |
Turkey | | | 122,242 | | | | — | | | | 122,242 | | | | — | |
United Kingdom | | | 12,636 | | | | — | | | | 12,636 | | | | — | |
| | | | | | | | | | | | | | | | |
Total Common Stocks | | | 1,917,888 | | | | 439,244 | | | | 1,478,644 | | | | — | |
| | | | | | | | | | | | | | | | |
Exchange Traded Funds | | | 88,888 | | | | 88,888 | | | | — | | | | — | |
Investment Company* | | | 33,388 | | | | 33,388 | | | | — | | | | — | |
| | | | | | | | | | | | | | | | |
Total | | $ | 2,040,164 | | | $ | 561,520 | | | $ | 1,478,644 | | | $ | — | |
| | | | | | | | | | | | | | | | |
| Pictet International Fund | | | | | | | | | | | | | | | | |
| Assets | | | | | | | | | | | | | | | | |
Common Stocks | | | | | | | | | | | | | | | | |
Australia | | $ | 37,874,685 | | | $ | — | | | $ | 37,874,685 | | | $ | — | |
Austria | | | 10,070,131 | | | | — | | | | 10,070,131 | | | | — | |
Belgium | | | 33,759,717 | | | | — | | | | 33,759,717 | | | | — | |
Bermuda | | | 10,147,886 | | | | — | | | | 10,147,886 | | | | — | |
Cayman Islands | | | 36,658,928 | | | | — | | | | 36,658,928 | | | | — | |
Denmark | | | 5,848,549 | | | | — | | | | 5,848,549 | | | | — | |
Finland | | | 20,504,798 | | | | — | | | | 20,504,798 | | | | — | |
France | | | 84,645,572 | | | | — | | | | 84,645,572 | | | | — | |
Germany | | | 13,763,973 | | | | — | | | | 13,763,973 | | | | — | |
Hong Kong | | | 10,694,998 | | | | — | | | | 10,694,998 | | | | — | |
Italy | | | 19,605,754 | | | | — | | | | 19,605,754 | | | | — | |
Japan | | | 183,393,030 | | | | 21,600,204 | | | | 161,792,826 | | | | — | |
Luxembourg | | | 13,875,210 | | | | — | | | | 13,875,210 | | | | — | |
Netherlands | | | 65,370,686 | | | | — | | | | 65,370,686 | | | | — | |
New Zealand | | | 5,854,826 | | | | — | | | | 5,854,826 | | | | — | |
Papua New Guinea | | | 5,799,309 | | | | 5,799,309 | | | | — | | | | — | |
Philippines | | | 1,119,920 | | | | — | | | | 1,119,920 | | | | — | |
South Korea | | | 17,271,704 | | | | 9,747,454 | | | | 7,524,250 | | | | — | |
Spain | | | 60,902,234 | | | | — | | | | 60,902,234 | | | | — | |
Sweden | | | 19,011,639 | | | | 9,514,789 | | | | 9,496,850 | | | | — | |
Switzerland | | | 54,435,100 | | | | 23,678,247 | | | | 30,756,853 | | | | — | |
United Kingdom | | | 156,287,375 | | | | 27,203,751 | | | | 129,083,624 | | | | — | |
| | | | | | | | | | | | | | | | |
Total Common Stocks | | | 866,896,024 | | | | 97,543,754 | | | | 769,352,270 | | | | — | |
| | | | | | | | | | | | | | | | |
Investment Company* | | | 28,935,213 | | | | 28,935,213 | | | | — | | | | — | |
| | | | | | | | | | | | | | | | |
Total | | $ | 895,831,237 | | | $ | 126,478,967 | | | $ | 769,352,270 | | | $ | — | |
| | | | | | | | | | | | | | | | |
| | |
| |
| | April 30, 2016 |
| |
| Notes to Financial Statements (unaudited) – continued | | |
| | | | | | | | | | | | | | | | |
Funds | | Total
Value | | | Level 1
Quoted
Prices | | | Level 2
Significant
Observable
Inputs | | | Level 3
Significant
Unobservable
Inputs | |
| Value Partners Asia Dividend Fund | | | | | | | | | | | | | | | | |
| Assets | | | | | | | | | | | | | | | | |
Common Stocks | | | | | | | | | | | | | | | | |
China | | $ | 2,307,107 | | | $ | — | | | $ | 2,307,107 | | | $ | — | |
Hong Kong | | | 1,990,551 | | | | 68,394 | | | | 1,922,157 | | | | — | |
Indonesia | | | 152,528 | | | | — | | | | 152,528 | | | | — | |
Japan | | | 39,594 | | | | — | | | | 39,594 | | | | — | |
Singapore | | | 720,223 | | | | — | | | | 720,223 | | | | — | |
South Korea | | | 749,958 | | | | — | | | | 749,958 | | | | — | |
Taiwan | | | 200,075 | | | | — | | | | 200,075 | | | | — | |
Thailand | | | 184,459 | | | | — | | | | 184,459 | | | | — | |
United Kingdom | | | 106,505 | | | | — | | | | 106,505 | | | | — | |
| | | | | | | | | | | | | | | | |
Total Common Stocks | | | 6,451,000 | | | | 68,394 | | | | 6,382,606 | | | | — | |
| | | | | | | | | | | | | | | | |
Preferred Stock | | | | | | | | | | | | | | | | |
South Korea | | | 377,269 | | | | — | | | | 377,269 | | | | — | |
Warrants | | | | | | | | | | | | | | | | |
China | | | 288,258 | | | | — | | | | 288,258 | | | | — | |
Singapore | | | 1,980 | | | | 1,980 | | | | — | | | | — | |
| | | | | | | | | | | | | | | | |
Total Warrants | | | 290,238 | | | | 1,980 | | | | 288,258 | | | | — | |
| | | | | | | | | | | | | | | | |
Total | | $ | 7,118,507 | | | $ | 70,374 | | | $ | 7,048,133 | | | $ | — | |
| | | | | | | | | | | | | | | | |
| Harrison Street Real Estate Fund | | | | | | | | | | | | | | | | |
| Assets | | | | | | | | | | | | | | | | |
Investments in Securities* | | $ | 10,250,006 | | | $ | 10,250,006 | | | $ | — | | | $ | — | |
| | | | | | | | | | | | | | | | |
| Montag & Caldwell Balanced Fund | | | | | | | | | | | | | | | | |
| Assets | | | | | | | | | | | | | | | | |
Common Stocks* | | $ | 23,345,715 | | | $ | 23,345,715 | | | $ | — | | | $ | — | |
Corporate Notes and Bonds** | | | 9,998,929 | | | | — | | | | 9,998,929 | | | | — | |
U.S. Government and Agency Obligations** | | | 5,408,714 | | | | — | | | | 5,408,714 | | | | — | |
Investment Company* | | | 1,489,226 | | | | 1,489,226 | | | | — | | | | — | |
| | | | | | | | | | | | | | | | |
Total | | $ | 40,242,584 | | | $ | 24,834,941 | | | $ | 15,407,643 | | | $ | — | |
| | | | | | | | | | | | | | | | |
| * | | All Common Stocks and Investment Company are Level 1. Please refer to the respective Schedule of Investments for industry, sector or country breakout. |
| ** | | All corporate notes and bonds and U.S. government and agency obligations held in the Funds are Level 2 securities. For a detailed breakout of the corporate notes and bonds and U.S. government and agency obligations; by major industry or agency classification, please refer to the respective Schedule of Investments. |
At the end of each fiscal quarter, management evaluates the Level 2 and 3 assets and liabilities for changes in liquidity, including but not limited to: whether a broker is willing to execute at a quoted price, the depth and consistency of prices from third party services, and the existence of contemporaneous, observable trades in the market. Additionally, management evaluates the Level 1 and 2 assets and liabilities on a quarterly basis for changes in listings or delistings on national exchanges. Due to the inherent uncertainty of determining the fair values of investments that do not have readily available market values, the fair values of the Funds’ investments may fluctuate from period to period. Additionally, the fair values of investments may differ significantly from the values that would have been used had a ready market existed for such investments and may differ materially from the values the Funds may ultimately realize upon the disposition of such investments. Further, such investments may be subject to legal and other restrictions on resale or they may be otherwise less liquid than publicly-traded securities.
Certain securities that were held at April 30, 2016 and since the beginning of the fiscal year in Barings International Fund, River Road Small Cap Value Fund, LMCG Emerging Market
Fund, and Pictet International Fund had changes in liquidity assessments which resulted in a transfer between Levels. Transfers between Levels, if any, are recognized as of the last day of the fiscal quarter in which the event or change in circumstances that resulted in reclassification occurred.
| | | | | | | | |
Funds | | Transfer from
Level 1 to Level 2 | | | Transfer from
Level 2 to Level 1 | |
| Barings International Fund | | $ | 216,698 | | | $ | — | |
| River Road Small Cap Value | | | 2,826,269 | | | | 3,340,022 | |
| LMCG Emerging Markets Fund | | | 8,408 | | | | 16,096 | |
| Pictet International Fund | | | 13,584,647 | | | | 7,992,608 | |
As of April 30, 2016, there were no Level 3 securities for which significant unobservable inputs or Adviser assumptions used in determining fair value except for LMCG Small Cap Growth Fund, which received rights at no cost as a result of a corporate action.
(2) Investment Companies: Certain Funds invest in securities of other investment companies, including open-end funds, closed-end funds and exchange-traded funds (“ETFs”). Open-end funds are investment companies that issue new shares continuously and redeem shares daily. Closed-end funds are
| | |
| |
| | April 30, 2016 |
| |
| Notes to Financial Statements (unaudited) – continued | | |
investment companies that typically issue a fixed number of shares that trade on a securities exchange or over-the-counter. An ETF is an investment company. Typically, an ETF seeks to track the performance of an index by holding in its portfolio shares of all the companies, or a representative sample of the companies, that are components of a particular index; however, some ETFs are actively managed. ETFs are traded on securities exchanges based on their market values. The risks of investment in other investment companies typically reflect the risks of the types of securities in which investment companies invest. Investments in ETFs and closed-end funds are subject to the additional risk that shares of the fund may trade at a premium or discount to their NAV per share. When a Fund invests in another investment company, shareholders of the Fund bear their proportionate shares of the other investment company’s fees and expenses, including operating, registration, trustee, licensing and marketing, as well as their shares of the Fund’s fees and expenses.
(3) Repurchase Agreements: Each Fund may enter into repurchase agreements with financial institutions deemed to be creditworthy by the Fund’s Adviser or Subadviser, subject to the seller’s agreement to repurchase and the Fund’s agreement to sell such securities at a mutually agreed upon price. Securities purchased subject to repurchase agreements are deposited with the Fund’s custodian and, pursuant to the terms of the repurchase agreement, must have an aggregate market value greater than or equal to the repurchase price plus accrued interest at all times. If the value of the underlying securities falls below the value of the repurchase price plus accrued interest, the Fund will require the seller to deposit additional collateral by the next business day. If the request for additional collateral is not met, or the seller defaults on its repurchase obligation, the Fund has the right to sell the underlying securities at market value and may claim any resulting loss against the seller. During the six months ended April 30, 2016, the Funds did not hold any repurchase agreements.
(4) When Issued/Delayed Delivery Securities: Each Fund may purchase and sell securities on a “when issued” or “delayed delivery” basis, with settlement to occur at a later date. The value of any security so purchased is subject to market fluctuations during the applicable period. The Funds segregate assets having an aggregate value at least equal to the amount of when issued or delayed delivery purchase commitments until payment is made. As of and during the six months ended April 30, 2016, DoubleLine Core Plus Fixed Income Fund owned delayed delivery securities.
(5) Mortgage-Backed Securities: Montag & Caldwell Balanced Fund, DoubleLine Core Plus Fixed Income Fund and TCH Fixed Income Fund may invest in mortgage-backed securities (“MBS”). These securities represent interests in pools of mortgage loans and they provide shareholders with payments consisting of both principal and interest as the mortgages in the underlying mortgage pools are paid. The timely payment of principal and interest on MBS issued or guaranteed by Ginnie Mae (formerly known as the Government National Mortgage Association) is backed by Ginnie Mae and the
full faith and credit of the U.S. government. MBS issued by U.S. government agencies or instrumentalities other than Ginnie Mae are not “full faith and credit” obligations. Certain obligations, such as those issued by the Federal Home Loan Banks, Fannie Mae (formerly known as the Federal National Mortgage Association) and Freddie Mac (formerly known as the Federal Home Loan Mortgage Corporation) are supported only by the credit of the issuer. MBS issued by private issuers are not government securities and are not guaranteed by any government agency. They are secured by the underlying collateral of the private issuer. Yields on privately issued MBS tend to be higher than those of government-backed issues. However, risk of loss due to default and sensitivity to interest rate fluctuations are also higher. Montag & Caldwell Balanced Fund, DoubleLine Core Plus Fixed Income Fund and TCH Fixed Income Fund may also invest in collateralized mortgage obligations (“CMOs”), collateralized loan obligations (“CLOs”) and real estate mortgage investment conduits (“REMICs”). A CMO and/or REMIC is a bond that is collateralized by a pool of MBS. A CLO is a bond that is collateralized by a financial institution’s receivables from loans. These MBS pools are divided into classes with each class having its own characteristics. The different classes are retired in sequence as the underlying mortgages are repaid.
(6) Securities Sold Short: River Road Long-Short Fund utilizes short sales as part of its overall portfolio management strategy. A short sale involves the sale of a security that is borrowed from a broker or other institution. A gain, limited to the price at which the Fund sold the security short, or a loss, unlimited in size, will be recognized upon closing a short sale. Short sales expose the Fund to the risk that it will be required to acquire, convert or exchange securities to replace the borrowed securities at a time when the securities sold short have appreciated in value, thus resulting in a loss to the Fund. The Fund making a short sale must segregate liquid assets, or otherwise cover its position in a permissible manner. The Subadviser determines the liquidity of assets, in accordance with procedures established by the Board. Cash segregated as collateral for short sales is shown in the Statement of Assets and Liabilities as segregated cash. Security positions segregated as collateral for short sales are included in the Total Investments on the Statement of Assets and Liabilities.
(7) Options Contracts: In the normal course of pursuing its investment objectives, certain Funds are subject to price volatility risk. Certain Funds may write and/or purchase call and put options on securities for hedging purposes, to seek capital appreciation, to mitigate risk and/or to increase exposure. Writing put options or purchasing call options tends to increase a Fund’s exposure to the underlying instrument. Writing call options or purchasing put options tends to decrease a Fund’s exposure to the underlying instrument. When a Fund writes or purchases a call or put option, an amount equal to the premium received or paid by the Fund is included in a Fund’s Statement of Assets and Liabilities as a liability or an investment and subsequently adjusted to the current market value based on the quoted daily settlement price of the option written or purchased. Premiums received or paid from writing or purchasing options that expire unexercised are treated by the Fund on the expiration date as realized gains or losses. The
| | |
| |
| | April 30, 2016 |
| |
| Notes to Financial Statements (unaudited) – continued | | |
difference between the premium and the amount paid or received on a closing purchase or sale transaction, including brokerage commissions, is also treated as a realized gain or loss. If an option is exercised, the premium paid or received is added to the cost of the purchase or proceeds from the sale in determining whether the Fund has realized a gain or loss on investment transactions. If the Fund writes a covered call option, the Fund forgoes, in exchange for the premium, the opportunity to profit during the option period from an increase in the market value of the underlying security above the exercise price. If the Fund writes a put option, it accepts the risk of a decline in the market value of the underlying security below the exercise price. There is the risk a Fund may not be able to enter into a closing transaction because of an illiquid market. The risk associated with purchasing put and call options is limited to the premium paid. Options were traded during the period in Anchor Capital Enhanced Equity Fund. See the Schedule of Investments for open options contracts held by Anchor Capital Enhanced Equity Fund at April 30, 2016. During the six months ended April 30, 2016, the average* volume of derivative activities were as follows:
For the six months ended April 30, 2016, the average* volume of derivative activities are as follows:
| | | | | | | | |
Funds | | Purchased
Options
(Premium Paid) | | | Written Options
(Premiums Received) | |
| Anchor Capital Enhanced Equity Fund | | $ | 1,363,549 | | | $ | 3,810,752 | |
| * | estimated based on quarterly holdings |
(8) Forward Foreign Currency Contracts: In the normal course of pursuing their investment objectives, certain Funds are subject to foreign investment and currency risk. Certain Funds may enter into forward foreign currency contracts (“forward contracts”) for purposes of hedging, duration management, as a substitute for securities, to increase returns, for currency hedging or risk management, or to otherwise help achieve a Fund’s investment goal. These contracts are marked-to-market daily at the applicable forward exchange rates. A Fund records realized gains or losses at the time the forward contract is closed. Risks may arise upon entering these contracts from the potential inability of a counterparty to meet the terms of its contracts and from unanticipated movements in the value of a foreign currency relative to the U.S. dollar or other currencies. During the six months ended April 30, 2016, the Funds did not enter into any forward foreign currency contracts.
(9) Disclosures about Derivative Instruments: The following is a table summarizing the fair value of derivatives held at April 30, 2016, by primary risk exposure:
| | | | | | | | |
| | | Asset Derivative
Investments Value | | | Liability Derivative
Investments Value | |
| | | Equity
Contracts (a) | | | Equity
Contracts (a) | |
| Anchor Capital Enhanced Equity Fund | | $ | 1,280,000 | | | $ | 5,340,533 | |
| (a) | Statement of Assets and Liabilities location: Total investments at value for purchase options and call options written, at value for written options. |
The effect of derivative instruments on the Statement of Operations for the six months ended April 30, 2016:
| | | | | | | | |
| | | Amount of
Realized Gain (Loss)
on Derivatives
Investments Value | | | Change in Unrealized
Appreciation
(Depreciation)
on Derivatives
Investments Value | |
| | | Equity
Contracts (a) | | | Equity
Contracts (b) | |
| Anchor Capital Enhanced Equity Fund | | $ | (6,845,746 | ) | | $ | 1,271,729 | |
| (a) | Statement of Operations location: Net realized loss on purchased options and net realized loss on written options. |
| (b) | Statement of Operations location: Net change in unrealized appreciation (depreciation) on purchased options and net change in unrealized appreciation (depreciation) on written options. |
(10) Investment Income and Securities Transactions: Dividend income is recorded on the ex-dividend date, except for certain dividends from foreign securities where the ex-dividend date may have passed, which are recorded as soon as a Fund is informed of the ex-dividend date. Interest income is accrued daily. Premiums and discounts are amortized or accreted on an effective yield method on fixed income securities. The Funds may be subject to foreign taxes on income, gains on investments, securities transactions or currency repatriation, some of which may be recoverable in part. The Funds will accrue such taxes and reclaims as applicable, based upon their current interpretation of tax rules and regulations that exist in the markets in which the Funds invest. Transactions in securities are accounted for on a trade date basis. The cost of securities sold is determined using the identified cost method.
(11) Foreign Currency: Foreign currencies, investments and other assets and liabilities are translated into U.S. dollars at the exchange rates at the close of the regular trading session on the New York Stock Exchange. Fluctuations in the value of the foreign currencies and other assets and liabilities resulting from changes in exchange rates are recorded as unrealized foreign currency gains (losses). Realized gains (losses) and unrealized appreciation (depreciation) on investment securities and income and expenses are translated on the respective dates of such transactions. The Funds do not isolate the net realized and unrealized gain or loss resulting from changes in exchange rates from the fluctuations in market prices of securities held. Such fluctuations are included with the net realized and unrealized gain or loss on investments.
(12) Federal Income Taxes: The Funds have elected to be treated as “regulated investment companies” under Subchapter M of the Internal Revenue Code of 1986, as amended, and to distribute substantially all of their respective net taxable income. Accordingly, no provisions for federal income taxes have been made in the accompanying financial statements. Under the Regulated Investment Company Modernization Act of 2010 (the “Act”), post-enactment capital losses may be carried forward for an unlimited time period. However, any new losses incurred will be required to be utilized prior to any loss carryovers incurred in pre-enactment taxable years, which generally expire eight years following the close of the taxable year in which they were incurred. As a result of this ordering rule, pre-enactment capital
| | |
| |
| | April 30, 2016 |
| |
| Notes to Financial Statements (unaudited) – continued | | |
loss carryovers may be more likely to expire unused. Additionally, post-enactment capital losses that are carried forward retain their tax character as either short-term or long-term
capital losses rather than being considered all short-term as under previous law.
At October 31, 2015, the following Funds had available realized capital loss carryforwards to offset future net capital gains through the fiscal year ended:
| | | | | | | | | | | | | | | | | | | | | | | | | | | | |
| | | Capital Loss Carryforwards: | |
| | | 2016 | | | 2017 | | | 2018 | | | 2019 | | | No Expiration
Short Term | | | No Expiration
Long Term | | | Total | |
| | | | | | | | | | | | | | | | | | | | | | | | | | | | |
| Cornerstone Large Cap Value Fund | | $ | — | | | $ | 7,545,482 | | | $ | 6,819,813 | | | $ | — | | | $ | — | | | $ | — | | | $ | 14,365,295 | |
| Fairpointe Focused Equity Fund | | | — | | | | — | | | | — | | | | — | | | | 135,558 | | | | — | | | | 135,558 | |
| Montag & Caldwell Growth Fund | | | — | | | | 2,530,371 | | | | — | | | | — | | | | — | | | | — | | | | 2,530,371 | |
| LMCG Small Cap Growth Fund | | | 561,605 | * | | | — | | | | — | | | | — | | | | — | | | | — | | | | 561,605 | |
| River Road Independent Value Fund | | | — | | | | — | | | | — | | | | — | | | | 4,834,393 | | | | — | | | | 4,834,393 | |
| DoubleLine Core Plus Fixed Income Fund | | | — | | | | — | | | | — | | | | — | | | | 2,853,818 | | | | 1,207,345 | | | | 4,061,163 | |
| TCH Fixed Income Fund | | | 1,961,275 | | | | 1,270,780 | | | | — | | | | — | | | | — | | | | — | | | | 3,232,055 | |
| Guardian Capital Global Dividend Fund | | | — | | | | — | | | | — | | | | — | | | | 80,836 | | | | 39,734 | | | | 120,570 | |
| LMCG Emerging Markets Fund | | | — | | | | — | | | | — | | | | — | | | | 428,582 | | | | 37,443 | | | | 466,025 | |
| Harrison Street Real Estate Fund | | | — | | | | 10,893,731 | | | | — | | | | — | | | | — | | | | — | | | | 10,893,731 | |
| * | This capital loss carryforward amount was acquired in the reorganization of the Small Cap Fund into the LMCG Small Cap Growth Fund on April 19, 2013. The Fund’s ability to utilize the capital loss carryforwards may be limited under Internal Revenue Service regulations. |
Management has analyzed the Funds’ tax positions for all open tax years (current and prior three tax years), as well as potential exposure to foreign capital gains withholding taxes, and has concluded that no provision for federal, state, or international income tax is required in the Funds’ financial statements. The Funds’ federal income and excise tax returns for tax years for which the applicable statutes of limitations have not expired are subject to examination by the Internal Revenue Service.
(13) Multi-Class Operations: Each class offered by a Fund that is authorized to offer multiple classes of shares has equal rights as to the Fund’s net assets.
Income, fund and trust level expenses, and realized and unrealized capital gains and losses, if any, are allocated to each class of shares based on the relative net assets of each class. Class specific expenses are charged to their respective class.
(14) Offering Costs: Certain costs were incurred in connection with the offering of the following Funds, as disclosed in the table below. The costs associated have been capitalized and are being amortized on a straight-line basis over twelve months based on the commencement date of the Funds, stated below.
| | | | | | | | |
Fund | | Commencement
Date | | | Original
Offering Costs | |
| Fairpointe Focused Equity Fund | | | December 24, 2014 | | | $ | 49,967 | |
River Road Focused Absolute Value Fund | | | November 3, 2015 | | | | 60,431 | |
Value Partners Asia Dividend Fund | | | December 17, 2015 | | | | 67,432 | |
(15) Use of Estimates: The preparation of financial statements in conformity with U.S. GAAP requires management to make estimates and assumptions that affect the reported amounts of assets and liabilities and disclosure of contingent assets and liabilities at the date of the financial statements and the
reported amounts of revenues and expenses during the reporting period. Actual results could differ from those estimates.
(16) Commitments and Contingencies: In the normal course of business, the Trust enters into contracts on behalf of the Funds that contain a variety of provisions for general indemnifications. Each Fund’s maximum exposure under these arrangements is unknown, as this would involve future claims that may be made against each Fund that are not known at this time. However, based on experience, the Funds believe the risk of loss is remote.
Note (C) Dividends from Net Investment Income and Distributions of Capital Gains: Dividends and distributions to shareholders are recorded on the ex-dividend date. River Road Dividend All Cap Value Fund, River Road Dividend All Cap Value Fund II, DoubleLine Core Plus Fixed Income Fund and TCH Fixed Income Fund distribute dividends from net investment income to shareholders monthly and net realized gains from investment transactions, if any, are generally distributed annually, usually in December.
Anchor Capital Enhanced Equity Fund, Guardian Capital Global Dividend Fund, Value Partners Asia Dividend Fund and Montag & Caldwell Balanced Fund distribute dividends from net investment income to shareholders quarterly and net realized gains from investment transactions, if any, are generally distributed annually, usually in December.
| | |
| |
| | April 30, 2016 |
| |
| Notes to Financial Statements (unaudited) – continued | | |
The following Funds distribute dividends from net investment income to shareholders annually and net realized gains from investment transactions, if any, are generally distributed annually, usually in December: Cornerstone Large Cap Value Fund, Fairpointe Focused Equity Fund, River Road Focused Absolute Value Fund, Herndon Large Cap Value Fund, Montag & Caldwell Growth Fund, Fairpointe Mid Cap Fund, Montag & Caldwell Mid Cap Growth Fund, LMCG Small Cap Growth Fund, River Road Independent Value Fund, River Road Select Value Fund, River Road Small Cap Value Fund, Silvercrest Small Cap Fund, Small Cap Fund, Lake Partners LASSO Alternatives Fund, River Road Long-Short Fund, Barings International Fund, LMCG Emerging Markets Fund, Pictet International Fund and Harrison Street Real Estate Fund.
Dividends and distributions are automatically reinvested in additional Fund shares on ex-date at that day’s ending NAV for the respective Fund for those shareholders who have elected the reinvestment option.
Differences in dividends per share between classes of the Funds are due to different class expenses.
Net investment income and realized gains and losses for federal income tax purposes may differ from those reported on the financial statements because of temporary and permanent book and tax basis differences. Permanent differences, such as redesignation of dividends paid, partnership reclasses, disallowed capitalized dividends on short sales, reclass of short-term gain to ordinary income, write off of capital loss carryovers, return of capital adjustments, non-deductible tax paid and long term undistributed gains, premium reversals, paydown reclasses, passive foreign investment company reclasses, foreign currency reclasses, adjustments for business development corporations, disallowed expenses, non-deductible 12b-1 fee, Fund level over distributions, the use of equalization and net operating loss reclasses are reclassified among capital accounts in the financial statements to reflect their character. Temporary differences, such as deferrals on losses relating to wash sales transactions, amortization of offering costs, premium amortization, current year dividends payable, passive foreign investment company adjustments, qualified late-year losses deferred, prior year partnership basis adjustment, and capital loss carryovers, arise when income, expenses, gains or losses are recognized in different periods for financial statement and tax purposes; these differences may reverse at some time in the future.
| | |
| |
| | April 30, 2016 |
| |
| Notes to Financial Statements (unaudited) – continued | | |
Distributions from net realized gains for book purposes may include short-term capital gains, which are classified as ordinary income for shareholder tax purposes.
The tax character of distributions paid during the fiscal years ended 2015 and 2014 was as follows:
| | | | | | | | | | | | | | | | |
| | | Distributions Paid in 2015 | | | Distributions Paid in 2014 | |
| | | Ordinary Income | | | Long-Term
Capital Gains | | | Ordinary Income | | | Long-Term
Capital Gains | |
| | | | | | | | | | | | | | | | |
| Cornerstone Large Cap Value Fund | | $ | 1,369,629 | | | $ | — | | | $ | 400,233 | | | $ | — | |
| Herndon Large Cap Value Fund | | | 2,334,787 | | | | 7,726,222 | | | | 3,419,118 | | | | 6,349 | |
| Montag & Caldwell Growth Fund | | | 44,398,227 | | | | 627,221,330 | | | | 45,645,316 | | | | 341,924,841 | |
| River Road Dividend All Cap Value Fund | | | 18,975,031 | | | | 89,326,656 | | | | 46,656,555 | | | | 64,851,857 | |
| River Road Dividend All Cap Value Fund II | | | 3,652,872 | | | | 3,141,523 | | | | 4,391,126 | | | | 86,891 | |
| Fairpointe Mid Cap Fund | | | 158,253,393 | | | | 770,919,534 | | | | 3,375,463 | | | | 458,048,169 | |
| Montag & Caldwell Mid Cap Growth Fund | | | 22,455 | | | | 696,350 | | | | 54,000 | | | | 1,654,527 | |
| LMCG Small Cap Growth Fund | | | 1,396,041 | | | | 1,078,763 | | | | 4,567,533 | | | | 960,263 | |
| River Road Independent Value Fund | | | 13,126,283 | | | | 21,661,599 | | | | 27,428,053 | | | | 833,833 | |
| River Road Select Value Fund | | | 7,895,744 | | | | 17,043,425 | | | | 5,039,706 | | | | 26,824,144 | |
| River Road Small Cap Value Fund | | | 9,289,576 | | | | 31,938,623 | | | | 10,537,955 | | | | 56,872,092 | |
| Silvercrest Small Cap Fund | | | 494,555 | | | | 1,198,029 | | | | 723,403 | | | | 562,187 | |
| Small Cap Fund | | | — | | | | 94,016,613 | | | | — | | | | 116,418,951 | |
| DoubleLine Core Plus Fixed Income Fund | | | 12,876,362 | | | | — | | | | 5,696,835 | | | | — | |
| TCH Fixed Income Fund | | | 1,676,460 | | | | — | | | | 1,961,530 | | | | — | |
| Anchor Capital Enhanced Equity Fund | | | 3,854,267 | | | | — | | | | 3,308,423 | | | | — | |
| Lake Partners LASSO Alternatives Fund | | | 1,031,209 | | | | 15,080,709 | | | | 4,167,016 | | | | 1,590,997 | |
| River Road Long-Short Fund | | | 4,922,443 | | | | 335,340 | | | | 4,915,054 | | | | 28,902 | |
| Barings International Fund | | | 773,676 | | | | 2,360,468 | | | | 2,458,302 | | | | 944,009 | |
| Guardian Capital Global Dividend Fund | | | 102,970 | | | | — | | | | 46,620 | | | | — | |
| LMCG Emerging Markets Fund | | | 28,599 | | | | — | | | | 64,574 | | | | — | |
| Pictet International Fund | | | 188,437 | | | | — | | | | — | | | | — | |
| Harrison Street Real Estate Fund | | | 164,358 | | | | — | | | | 147,567 | | | | — | |
| Montag & Caldwell Balanced Fund | | | 241,984 | | | | 1,808,010 | | | | 208,332 | | | | 740,641 | |
As of October 31, 2015, the most recent tax year end, the components of distributable earnings on a tax cost basis were as follows:
| | | | | | | | | | | | | | | | | | | | |
| | | | | | | | | | | | | | | | | | | | |
| | | Accumulated Capital and
Other Losses | | | Undistributed
Ordinary
Income | | | Undistributed Long-Term
Capital Gain | | | Appreciation
(Depreciation) | | | Total | |
| Cornerstone Large Cap Value Fund | | $ | (14,365,295 | ) | | $ | 999,888 | | | $ | — | | | $ | (11,255,609 | ) | | $ | (24,621,016 | ) |
| Fairpointe Focused Equity Fund | | | (135,558 | ) | | | 54,030 | | | | — | | | | (322,512 | ) | | | (404,040 | ) |
| Herndon Large Cap Value Fund | | | — | | | | 963,616 | | | | 156,441 | | | | 9,123,495 | | | | 10,243,552 | |
| Montag & Caldwell Growth Fund | | | (2,530,371 | ) | | | 5,987,336 | | | | 453,313,303 | | | | 282,576,306 | | | | 739,346,574 | |
| River Road Dividend All Cap Value Fund | | | — | | | | — | | | | 68,842,050 | | | | 139,805,427 | | | | 208,647,477 | |
| River Road Dividend All Cap Value Fund II | | | — | | | | — | | | | 1,666,697 | | | | 8,623,205 | | | | 10,289,902 | |
| Fairpointe Mid Cap Fund | | | — | | | | 12,066,800 | | | | 234,496,728 | | | | 403,129,667 | | | | 649,693,195 | |
| Montag & Caldwell Mid Cap Growth Fund | | | (44,348 | ) | | | — | | | | 1,215,154 | | | | 1,367,116 | | | | 2,537,922 | |
| LMCG Small Cap Growth Fund | | | (1,718,723 | ) | | | — | | | | 25,386 | | | | (6,196,532 | ) | | | (7,889,869 | ) |
| River Road Independent Value Fund | | | (8,436,726 | ) | | | — | | | | — | | | | (25,777,073 | ) | | | (34,213,799 | ) |
| River Road Select Value Fund | | | (404,126 | ) | | | — | | | | 7,969,023 | | | | 2,982,812 | | | | 10,547,709 | |
| River Road Small Cap Value Fund | | | — | | | | 1,531,982 | | | | 13,692,607 | | | | 36,538,627 | | | | 51,763,216 | |
| Silvercrest Small Cap Fund | | | — | | | | 259,867 | | | | 6,208,067 | | | | 3,156,437 | | | | 9,624,371 | |
| Small Cap Fund | | | (2,699,597 | ) | | | — | | | | 127,883,451 | | | | 71,601,080 | | | | 196,784,934 | |
| DoubleLine Core Plus Fixed Income Fund | | | (4,061,163 | ) | | | 244,629 | | | | — | | | | (7,489,005 | ) | | | 11,305,539 | |
| TCH Fixed Income Fund | | | (3,232,055 | ) | | | 12,396 | | | | — | | | | (19,474 | ) | | | (3,239,133 | ) |
| Anchor Capital Enhanced Equity Fund | | | — | | | | 368,674 | | | | 590,164 | | | | 78,903 | | | | 1,037,741 | |
| Lake Partners LASSO Alternatives Fund | | | (1,030,882 | ) | | | — | | | | 11,177,682 | | | | 4,356,028 | | | | 14,502,828 | |
| River Road Long-Short Fund | | | — | | | | 1,302,018 | | | | 544,844 | | | | (3,308,012 | ) | | | (1,461,150 | ) |
| Barings International Fund | | | — | | | | 220,278 | | | | 304,678 | | | | 1,209,342 | | | | 1,734,298 | |
| Guardian Capital Global Dividend Fund | | | (120,570 | ) | | | 28,570 | | | | — | | | | 215,561 | | | | 123,561 | |
| LMCG Emerging Markets Fund | | | (466,025 | ) | | | 19,918 | | | | — | | | | (156,009 | ) | | | (602,116 | ) |
| Pictet International Fund | | | — | | | | 973,948 | | | | — | | | | (88,522 | ) | | | 885,426 | |
| Harrison Street Real Estate Fund | | | (10,893,730 | ) | | | 122,213 | | | | — | | | | 238,319 | | | | (10,533,198 | ) |
| Montag & Caldwell Balanced Fund | | | — | | | | 11,392 | | | | 1,324,571 | | | | 2,593,122 | | | | 3,929,085 | |
| | |
| |
| | April 30, 2016 |
| |
| Notes to Financial Statements (unaudited) – continued | | |
Note (D) Shares of Beneficial Interest: Each Fund is authorized to issue an unlimited number of shares of beneficial interest with no par value. Share transactions of the Funds were as follows:
Six Months Ended April 30, 2016
| | | | | | | | | | | | | | | | |
Class N | | Sold | | | Issued in
Connection with
Reinvestment
of Distributions | | | Redeemed | | | Net Increase
(Decrease) in
Shares Outstanding | |
| Cornerstone Large Cap Value Fund | | | 195,283 | | | | 44,912 | | | | (798,493 | ) | | | (558,298 | ) |
| Fairpointe Focused Equity Fund | | | 14,162 | | | | 2,394 | | | | (17,527 | ) | | | (971 | ) |
| River Road Focused Absolute Value Fund (a)(b) | | | 20,894 | | | | — | | | | (23 | ) | | | 20,871 | |
| Herndon Large Cap Value Fund | | | 82,220 | | | | 5,886 | | | | (217,758 | ) | | | (129,652 | ) |
| Montag & Caldwell Growth Fund | | | 5,471,568 | | | | 9,531,891 | | | | (9,426,106 | ) | | | 5,577,353 | |
| River Road Dividend All Cap Value Fund | | | 1,989,056 | | | | 1,825,081 | | | | (3,307,775 | ) | | | 506,362 | |
| River Road Dividend All Cap Value Fund II | | | 14,058 | | | | 5,023 | | | | (20,244 | ) | | | (1,163 | ) |
| Fairpointe Mid Cap Fund | | | 4,058,825 | | | | 2,786,317 | | | | (13,172,181 | ) | | | (6,327,039 | ) |
| Montag & Caldwell Mid Cap Growth Fund | | | 8,189 | | | | 53,656 | | | | (48,054 | ) | | | 13,791 | |
| LMCG Small Cap Growth Fund | | | 892,788 | | | | 1,863 | | | | (4,589,965 | ) | | | (3,695,314 | ) |
| River Road Independent Value Fund | | | 6,779,991 | | | | — | | | | (3,091,826 | ) | | | 3,688,165 | |
| River Road Select Value Fund | | | 97,001 | | | | 100,813 | | | | (101,418 | ) | | | 96,396 | |
| River Road Small Cap Value Fund | | | 161,538 | | | | 114,605 | | | | (608,197 | ) | | | (332,054 | ) |
| Silvercrest Small Cap Fund | | | 213,700 | | | | 55,211 | | | | (212,641 | ) | | | 56,270 | |
| Small Cap Fund (c) | | | 677,200 | | | | 7,539,999 | | | | (13,451,876 | ) | | | (5,234,677 | ) |
| DoubleLine Core Plus Fixed Income Fund | | | 18,946,382 | | | | 355,892 | | | | (6,286,779 | ) | | | 13,015,495 | |
| TCH Fixed Income Fund | | | 165,317 | | | | 48,877 | | | | (412,289 | ) | | | (198,095 | ) |
| Anchor Capital Enhanced Equity Fund | | | 495,400 | | | | 145,006 | | | | (3,835,877 | ) | | | (3,195,471 | ) |
| Lake Partners LASSO Alternatives Fund | | | 305,842 | | | | 206,436 | | | | (651,053 | ) | | | (138,775 | ) |
| River Road Long-Short Fund | | | 66,180 | | | | 61,918 | | | | (1,485,315 | ) | | | (1,357,217 | ) |
| Barings International Fund | | | 11,826 | | | | 1,516 | | | | (1,576 | ) | | | 11,766 | |
| Guardian Capital Global Dividend Fund | | | 753 | | | | 35 | | | | — | | | | 788 | |
| LMCG Emerging Markets Fund | | | 1,236 | | | | 881 | | | | (1,082 | ) | | | 1,035 | |
| Pictet International Fund | | | 5,161 | | | | 97 | | | | (100,719 | ) | | | (95,461 | ) |
| Value Partners Asia Dividend Fund (d) | | | 75,001 | | | | — | | | | — | | | | 75,001 | |
| Harrison Street Real Estate Fund | | | 32,928 | | | | 8,281 | | | | (125,310 | ) | | | (84,101 | ) |
| Montag & Caldwell Balanced Fund | | | 768,002 | | | | 53,049 | | | | (296,459 | ) | | | 524,592 | |
| | | | | | | | | | | | | | | | |
Class I | | Sold | | | Issued in
Connection with
Reinvestment
of Distributions | | | Redeemed | | | Net Increase
(Decrease) in
Shares Outstanding | |
| Cornerstone Large Cap Value Fund | | | 152,015 | | | | 57,834 | | | | (3,129,540 | ) | | | (2,919,691 | ) |
| Fairpointe Focused Equity Fund | | | 28,469 | | | | 5,297 | | | | — | | | | 33,766 | |
| River Road Focused Absolute Value Fund (a)(b) | | | 922,154 | | | | — | | | | (22,646 | ) | | | 899,508 | |
| Herndon Large Cap Value Fund | | | 793,475 | | | | 89,877 | | | | (2,686,117 | ) | | | (1,802,765 | ) |
| Montag & Caldwell Growth Fund | | | 7,557,827 | | | | 9,866,674 | | | | (22,227,076 | ) | | | (4,802,575 | ) |
| River Road Dividend All Cap Value Fund | | | 3,654,058 | | | | 3,893,274 | | | | (16,284,596 | ) | | | (8,737,264 | ) |
| River Road Dividend All Cap Value Fund II | | | 579,756 | | | | 187,895 | | | | (1,492,852 | ) | | | (725,201 | ) |
| Fairpointe Mid Cap Fund | | | 10,626,963 | | | | 3,759,517 | | | | (27,438,034 | ) | | | (13,051,554 | ) |
| Montag & Caldwell Mid Cap Growth Fund | | | 6,366 | | | | 67,037 | | | | (13,631 | ) | | | 59,772 | |
| LMCG Small Cap Growth Fund | | | 2,247,589 | | | | 738 | | | | (2,600,243 | ) | | | (351,916 | ) |
| River Road Independent Value Fund | | | 2,713,125 | | | | — | | | | (4,271,222 | ) | | | (1,558,097 | ) |
| River Road Select Value Fund | | | 323,651 | | | | 1,133,203 | | | | (7,376,531 | ) | | | (5,919,677 | ) |
| River Road Small Cap Value Fund | | | 1,973,883 | | | | 1,196,902 | | | | (2,880,732 | ) | | | 290,053 | |
| Silvercrest Small Cap Fund | | | 2,190,424 | | | | 425,913 | | | | (1,188,764 | ) | | | 1,427,573 | |
| Small Cap Fund (c) | | | 2,312,763 | | | | 11,173,684 | | | | (19,143,575 | ) | | | (5,657,128 | ) |
| DoubleLine Core Plus Fixed Income Fund | | | 11,804,711 | | | | 455,339 | | | | (5,217,681 | ) | | | 7,042,369 | |
| TCH Fixed Income Fund | | | 69,968 | | | | 19,385 | | | | (781,342 | ) | | | (691,989 | ) |
| Anchor Capital Enhanced Equity Fund | | | 549,405 | | | | 116,333 | | | | (4,391,236 | ) | | | (3,725,498 | ) |
| Lake Partners LASSO Alternatives Fund | | | 1,175,402 | | | | 384,769 | | | | (6,904,690 | ) | | | (5,344,519 | ) |
| River Road Long-Short Fund | | | 848,907 | | | | 102,909 | | | | (2,349,795 | ) | | | (1,397,979 | ) |
| Barings International Fund | | | 1,288 | | | | 86,640 | | | | (29 | ) | | | 87,899 | |
| Guardian Capital Global Dividend Fund | | | — | | | | 3,114 | | | | (1,180 | ) | | | 1,934 | |
| LMCG Emerging Markets Fund | | | — | | | | 2,633 | | | | (77,946 | ) | | | (75,313 | ) |
| Pictet International Fund | | | 94,203,334 | | | | 7,456 | | | | (4,787,923 | ) | | | 89,422,867 | |
| Value Partners Asia Dividend Fund (d) | | | 675,001 | | | | — | | | | — | | | | 675,001 | |
| Harrison Street Real Estate Fund | | | 2,354 | | | | 354 | | | | (3,566 | ) | | | (858 | ) |
| Montag & Caldwell Balanced Fund | | | 34,341 | | | | 4,578 | | | | (33,045 | ) | | | 5,874 | |
| | |
| | April 30, 2016 |
Notes to Financial Statements (unaudited) – continued | | |
| | | | | | | | | | | | | | | | |
Class R | | Sold | | | Issued in
Connection with
Reinvestment
of Distributions | | | Redeemed | | | Net
Decrease in
Shares Outstanding | |
| Montag & Caldwell Growth Fund | | | 48,969 | | | | 66,520 | | | | (37,730 | ) | | | 77,759 | |
| (a) | The inception date for the River Road Focused Absolute Value Fund was November 3, 2015. |
| (b) | River Road Focused Absolute Value Fund had a subscription in-kind in the amount of $3,663,463 on November 3, 2015. The subscription was comprised of securities, cash and dividends accrued in the amounts of $3,632,219, $26,056 and $5,188, respectively. |
| (c) | Small Cap Fund had a redemption in-kind on December 1, 2015, in the amount of $142,509,610. The redemption was comprised of securities and cash in the amount of $134,464,305 and $8,045,305, respectively. |
| (d) | The inception date for the Value Partners Asia Dividend Fund was December 16, 2015. |
| | | | | | | | | | | | | | | | |
Year Ended October 31, 2015 Class N | | Sold | | | Issued in
Connection with
Reinvestment
of Distributions | | | Redeemed | | | Net Increase
(Decrease) in
Shares Outstanding | |
| Cornerstone Large Cap Value Fund | | | 1,788,633 | | | | 28,081 | | | | (1,491,371 | ) | | | 325,343 | |
| Fairpointe Focused Equity Fund (a)(b) | | | 263,764 | | | | — | | | | (17,767 | ) | | | 245,997 | |
| Herndon Large Cap Value Fund | | | 204,863 | | | | 62,690 | | | | (555,307 | ) | | | (287,754 | ) |
| Montag & Caldwell Growth Fund | | | 7,138,882 | | | | 8,194,054 | | | | (29,417,908 | ) | | | (14,084,972 | ) |
| River Road Dividend All Cap Value Fund | | | 3,166,753 | | | | 2,107,691 | | | | (13,241,566 | ) | | | (7,967,122 | ) |
| River Road Dividend All Cap Value Fund II | | | 73,197 | | | | 22,350 | | | | (384,147 | ) | | | (288,600 | ) |
| Fairpointe Mid Cap Fund | | | 10,093,808 | | | | 9,137,627 | | | | (21,538,445 | ) | | | (2,307,010 | ) |
| Montag & Caldwell Mid Cap Growth Fund | | | 22,197 | | | | 34,984 | | | | (271,296 | ) | | | (214,115 | ) |
| LMCG Small Cap Growth Fund | | | 10,550,961 | | | | 105,407 | | | | (2,502,649 | ) | | | 8,153,719 | |
| River Road Independent Value Fund | | | 5,681,604 | | | | 1,563,007 | | | | (9,309,358 | ) | | | (2,064,747 | ) |
| River Road Select Value Fund | | | 73,126 | | | | 156,298 | | | | (525,281 | ) | | | (295,857 | ) |
| River Road Small Cap Value Fund | | | 397,814 | | | | 503,817 | | | | (2,457,631 | ) | | | (1,556,000 | ) |
| Silvercrest Small Cap Fund | | | 1,007,117 | | | | 9,374 | | | | (201,402 | ) | | | 815,089 | |
| Small Cap Fund | | | 941,849 | | | | 2,105,009 | | | | (6,664,523 | ) | | | (3,617,665 | ) |
| DoubleLine Core Plus Fixed Income Fund | | | 17,140,542 | | | | 330,780 | | | | (4,242,057 | ) | | | 13,229,265 | |
| TCH Fixed Income Fund | | | 486,398 | | | | 101,645 | | | | (609,564 | ) | | | (21,521 | ) |
| Anchor Capital Enhanced Equity Fund | | | 2,092,810 | | | | 175,479 | | | | (3,722,695 | ) | | | (1,454,406 | ) |
| Lake Partners LASSO Alternatives Fund | | | 2,643,650 | | | | 133,278 | | | | (2,843,208 | ) | | | (66,280 | ) |
| River Road Long-Short Fund | | | 2,159,459 | | | | 231,451 | | | | (9,572,482 | ) | | | (7,181,572 | ) |
| Barings International Fund | | | 12,218 | | | | 8,119 | | | | (3,483 | ) | | | 16,854 | |
| Guardian Capital Global Dividend Fund | | | 3,342 | | | | 32 | | | | (1,156 | ) | | | 2,218 | |
| LMCG Emerging Markets Fund | | | 2,222 | | | | 426 | | | | (1,711 | ) | | | 937 | |
| Pictet International Fund | | | 6,850 | | | | 34 | | | | (1,762 | ) | | | 5,122 | |
| Harrison Street Real Estate Fund | | | 152,499 | | | | 11,379 | | | | (367,136 | ) | | | (203,258 | ) |
| Montag & Caldwell Balanced Fund | | | 377,132 | | | | 78,257 | | | | (167,264 | ) | | | 288,125 | |
| | | | | | | | | | | | | | | | |
Class I | | Sold | | | Issued in
Connection with
Reinvestment
of Distributions | | | Redeemed | | | Net Increase
(Decrease) in
Shares Outstanding | |
| Cornerstone Large Cap Value Fund | | | 1,038,073 | | | | 56,356 | | | | (2,604,193 | ) | | | (1,509,764 | ) |
| Fairpointe Focused Equity Fund (a)(b) | | | 445,153 | | | | — | | | | (1 | ) | | | 445,152 | |
| Herndon Large Cap Value Fund | | | 1,504,825 | | | | 624,457 | | | | (2,898,699 | ) | | | (769,417 | ) |
| Montag & Caldwell Growth Fund | | | 9,136,847 | | | | 14,272,154 | | | | (66,732,284 | ) | | | (43,323,283 | ) |
| River Road Dividend All Cap Value Fund | | | 6,894,934 | | | | 4,086,211 | | | | (16,988,277 | ) | | | (6,007,132 | ) |
| River Road Dividend All Cap Value Fund II | | | 1,954,180 | | | | 444,366 | | | | (2,238,283 | ) | | | 160,263 | |
| Fairpointe Mid Cap Fund | | | 21,809,966 | | | | 10,047,970 | | | | (31,979,189 | ) | | | (121,253 | ) |
| Montag & Caldwell Mid Cap Growth Fund | | | 194,128 | | | | 27,469 | | | | (13,014 | ) | | | 208,583 | |
| LMCG Small Cap Growth Fund | | | 5,014,447 | | | | 52,633 | | | | (820,163 | ) | | | 4,246,917 | |
| River Road Independent Value Fund | | | 2,378,112 | | | | 1,546,766 | | | | (27,022,115 | ) | | | (23,097,237 | ) |
| River Road Select Value Fund | | | 725,982 | | | | 2,999,976 | | | | (11,708,876 | ) | | | (7,982,918 | ) |
| River Road Small Cap Value Fund | | | 4,076,490 | | | | 2,833,551 | | | | (5,385,952 | ) | | | 1,524,089 | |
| Silvercrest Small Cap Fund | | | 7,917,658 | | | | 100,934 | | | | (2,591,868 | ) | | | 5,426,724 | |
| Small Cap Fund | | | 2,927,154 | | | | 2,381,469 | | | | (10,007,368 | ) | | | (4,698,745 | ) |
| DoubleLine Core Plus Fixed Income Fund | | | 18,070,549 | | | | 742,838 | | | | (4,697,945 | ) | | | 14,115,442 | |
| TCH Fixed Income Fund | | | 681,573 | | | | 49,603 | | | | (701,252 | ) | | | 29,924 | |
| Anchor Capital Enhanced Equity Fund | | | 4,045,214 | | | | 165,598 | | | | (6,567,499 | ) | | | (2,356,687 | ) |
| Lake Partners LASSO Alternatives Fund | | | 6,903,527 | | | | 804,316 | | | | (29,352,862 | ) | | | (21,645,019 | ) |
| River Road Long-Short Fund | | | 1,845,983 | | | | 160,137 | | | | (7,436,665 | ) | | | (5,430,545 | ) |
| Barings International Fund | | | 168,034 | | | | 526,718 | | | | (467,167 | ) | | | 227,585 | |
| Guardian Capital Global Dividend Fund | | | 10,042 | | | | 5,543 | | | | (731 | ) | | | 14,854 | |
| LMCG Emerging Markets Fund | | | — | | | | 2,687 | | | | (152,256 | ) | | | (149,569 | ) |
| Pictet International Fund | | | 5,060,181 | | | | 5,369 | | | | (781,788 | ) | | | 4,283,762 | |
| Harrison Street Real Estate Fund | | | 9,993 | | | | 565 | | | | (28,917 | ) | | | (18,359 | ) |
| Montag & Caldwell Balanced Fund | | | 94,050 | | | | 3,852 | | | | (28,359 | ) | | | 69,543 | |
| | |
| |
| | April 30, 2016 |
| |
| Notes to Financial Statements (unaudited) – continued | | |
| | | | | | | | | | | | | | | | |
Class R | | Sold | | | Issued in
Connection with
Reinvestment
of Distributions | | | Redeemed | | | Net Decrease in
Shares Outstanding | |
| Montag & Caldwell Growth Fund | | | 35,243 | | | | 43,433 | | | | (118,215 | ) | | | (39,539 | ) |
| (a) | The commencement of investment operations for Fairpointe Focused Equity Fund was December 23, 2014. |
| (b) | Fairpointe Focused Equity Fund had a subscription in-kind in the amount of $2,333,718 on December 23, 2014. The subscription was comprised of securities, cash and dividends accrued in the amounts of $2,305,531, $26,148 and $2,039, respectively. |
Note (E) Investment Transactions: Purchases and proceeds from sales and maturities of investment securities (other than short-term investments) for the six months ended April 30, 2016 were as follows:
| | | | | | | | | | | | | | | | |
| | | Purchases | | | Proceeds from Sales | |
| | | | |
| | | U.S Government | | | Other | | | U.S Government | | | Other | |
| Cornerstone Large Cap Value Fund | | $ | — | | | $ | 11,829,323 | | | $ | — | | | $ | 54,271,582 | |
| Fairpointe Focused Equity Fund | | | — | | | | 1,220,075 | | | | — | | | | 1,029,410 | |
| River Road Focused Absolute Value Fund | | | — | | | | 7,347,567 | | | | — | | | | 3,577,148 | |
| Herndon Large Cap Value Fund | | | — | | | | 29,360,610 | | | | — | | | | 57,518,232 | |
| Montag & Caldwell Growth Fund | | | — | | | | 463,344,200 | | | | — | | | | 932,924,709 | |
| River Road Dividend All Cap Value Fund | | | — | | | | 110,590,014 | | | | — | | | | 278,341,050 | |
| River Road Dividend All Cap Value Fund II | | | — | | | | 17,199,417 | | | | — | | | | 28,792,025 | |
| Fairpointe Mid Cap Fund | | | — | | | | 596,766,935 | | | | — | | | | 1,161,285,162 | |
| Montag & Caldwell Mid Cap Growth Fund | | | — | | | | 1,559,764 | | | | — | | | | 1,974,995 | |
| LMCG Small Cap Growth Fund | | | — | | | | 120,900,829 | | | | — | | | | 169,686,789 | |
| River Road Independent Value Fund | | | — | | | | 38,267,703 | | | | — | | | | 63,493,386 | |
| River Road Select Value Fund | | | — | | | | 21,574,705 | | | | — | | | | 73,268,980 | |
| River Road Small Cap Value Fund | | | — | | | | 90,977,688 | | | | — | | | | 101,819,378 | |
| Silvercrest Small Cap Fund | | | — | | | | 38,067,959 | | | | — | | | | 22,404,980 | |
| Small Cap Fund | | | — | | | | 157,630,340 | | | | — | | | | 562,409,291 | |
| DoubleLine Core Plus Fixed Income Fund | | | 225,003,862 | | | | 133,376,032 | | | | 120,074,468 | | | | 68,349,866 | |
| TCH Fixed Income Fund | | | 5,073,254 | | | | 974,150 | | | | 7,072,282 | | | | 7,629,197 | |
| Anchor Capital Enhanced Equity Fund | | | — | | | | 18,339,528 | | | | — | | | | 83,981,064 | |
| Lake Partners LASSO Alternatives Fund | | | — | | | | 28,538,629 | | | | — | | | | 92,939,915 | |
| River Road Long-Short Fund | | | — | | | | 74,519,440 | | | | — | | | | 105,848,952 | |
| Barings International Fund | | | — | | | | 1,939,784 | | | | — | | | | 1,709,180 | |
| Guardian Capital Global Dividend Fund | | | — | | | | 1,050,939 | | | | — | | | | 1,043,275 | |
| LMCG Emerging Markets Fund | | | — | | | | 638,233 | | | | — | | | | 562,628 | |
| Pictet International Fund | | | — | | | | 873,954,649 | | | | — | | | | 113,244,437 | |
Value Partners Asia Dividend Fund | | | — | | | | 7,888,322 | | | | — | | | | 866,713 | |
| Harrison Street Real Estate Fund | | | — | | | | 4,337,601 | | | | — | | | | 5,402,264 | |
| Montag & Caldwell Balanced Fund | | | 1,667,209 | | | | 16,591,901 | | | | 1,124,523 | | | | 6,577,399 | |
Note (F) Redemption Fees: In accordance with the prospectus, certain Funds may assess a redemption fee on Fund share redemptions and exchanges within specified time periods. The redemption fees are indicated in the following table for the six months ended April 30, 2016 and are included in the Cost of Shares Redeemed on the Statements of Changes in Net Assets:
| | | | | | |
Fund Name | | Time Period | | Amount | |
| Barings International Fund | | 2% Within 90 Days | | $ | — | |
| Guardian Capital Dividend Fund | | 2% Within 90 Days | | | 50 | |
| LMCG Emerging Markets Fund | | 2% Within 90 Days | | | — | |
| Pictet International Fund | | 2% Within 90 Days | | | 331 | |
| Value Partners Asia Dividend Fund | | 2% Within 90 Days | | | — | |
| Harrison Street Real Estate Fund | | 2% Within 90 Days | | | 117 | |
Note (G) Advisory, Administration, Affiliated Investments, Distribution Services and Trustee Arrangements:
Advisory. Aston serves as investment adviser and administrator to the Funds. Under the terms of the investment advisory agreement for the Funds (the “Investment Advisory Agreement”), fees are accrued daily and paid monthly, at specified annual rates of average daily net assets.
| | |
| |
| | April 30, 2016 |
| |
| Notes to Financial Statements (unaudited) – continued | | |
Certain Funds are subject to an expense limitation agreement with the Adviser, pursuant to which annual ordinary operating expenses for Class N and Class I shareholders are capped at certain specified annual rates of average daily net assets. There are no contractual expense limitations for Class R shareholders.
The contractual expense limitations for the Funds are effective through February 28, 2017. The advisory rates and contractual expense limitations for the six months ended April 30, 2016 were as follows:
| | | | | | |
| | | | | Contractual Expense Limitations |
Fund Name | | Advisory Fees | | Class N | | Class I |
| Cornerstone Large Cap Value Fund (a)(b) | | 0.70% | | 1.14% | | 0.89% |
| Fairpointe Focused Equity Fund | | 0.80% | | 1.15% | | 0.90% |
| River Road Focused Absolute Value Fund (c) | | 0.70% | | 1.00% | | 0.75% |
| Herndon Large Cap Value Fund (a)(b) | | 0.70% | | 1.14% | | 0.89% |
| Montag & Caldwell Growth Fund | | 0.80% on first $800,000,000 | | | | |
| | 0.60% over $800,000,000 up to $6 billion | | | | |
| | 0.55% over $6 billion up to $12 billion | | | | |
| | 0.50% over $12 billion | | N/A | | N/A |
| River Road Dividend All Cap Value Fund | | 0.70% | | 1.30% | | 1.05% |
| River Road Dividend All Cap Value Fund II | | 0.70% | | 1.30% | | 1.05% |
| Fairpointe Mid Cap Fund | | 0.80% on first $100,000,000 | | | | |
| | 0.75% next $300,000,000 | | | | |
| | 0.70% over $400,000,000 | | N/A | | N/A |
| Montag & Caldwell Mid Cap Growth Fund | | 0.85% | | 1.25% | | 1.00% |
| LMCG Small Cap Growth Fund | | 1.00% | | 1.35% | | 1.10% |
| River Road Independent Value Fund | | 1.00% | | 1.42% | | 1.17% |
| River Road Select Value Fund | | 1.00% | | 1.50% | | 1.25% |
| River Road Small Cap Value Fund | | 0.90% | | N/A | | N/A |
| Silvercrest Small Cap Fund | | 1.00% | | 1.40% | | 1.15% |
| Small Cap Fund (d) | | 0.90% | | 1.35% | | 1.10% |
| DoubleLine Core Plus Fixed Income Fund | | 0.55% | | 0.94% | | 0.69% |
| TCH Fixed Income Fund | | 0.55% | | 0.94% | | 0.69% |
| Anchor Capital Enhanced Equity Fund | | 0.70% | | 1.40% | | 1.15% |
| Lake Partners LASSO Alternatives Fund | | 1.00% | | 1.40% | | 1.15% |
| River Road Long-Short Fund | | 1.20% | | 1.70% | | 1.45% |
| Barings International Fund | | 1.00% | | 1.40% | | 1.15% |
| Guardian Capital Global Dividend Fund | | 0.80% | | 1.30% | | 1.05% |
| LMCG Emerging Markets Fund | | 1.05% | | 1.43% | | 1.18% |
| Pictet International Fund | | 0.90% | | 1.40% | | 1.15% |
Value Partners Asia Dividend Fund (e) | | 0.90% | | 1.40% | | 1.15% |
| Harrison Street Real Estate Fund | | 1.00% | | 1.37% | | 1.12% |
| Montag & Caldwell Balanced Fund | | 0.75% | | 1.35% | | 1.10% |
| (a) | Prior to January 1, 2016, the advisory fee was 0.80% for Cornerstone Large Cap Value Fund and Herndon Large Cap Value Fund. |
| (b) | Prior to January 1, 2016, the contractual expense limitation was 1.30% and 1.05% for Class N and Class I, respectively. |
| (c) | The commencement of investment operations for River Road Focused Absolute Value Fund was November 3, 2015. |
| (d) | Effective January 12, 2016, the Adviser has agreed to a contractual expense limitation. |
| (e) | The commencement of investment operations for Value Partners Asia Dividend Fund was December 16, 2015. |
Pursuant to a contractual expense reimbursement agreement between the Adviser and the Trust, for a period of up to three years from the fiscal year end during which the Adviser waived its advisory fees or reimbursed expenses for each of: Fairpointe Focused Equity Fund-Classes N and I, River Road Focused Absolute Value Fund-Classes N and I, Herndon Large Cap Value Fund-Classes N and I, River Road Dividend All Cap Value Fund II-Classes N and I, LMCG Small Cap Growth Fund-Classes N and I, River Road Independent Value Fund-Classes N and I, Silvercrest Small Cap Fund-Classes N and I, DoubleLine Core Plus Fixed Income Fund-Classes N and I, River Road Long-Short Fund-Classes N and I, Guardian Capital Global Dividend Fund-Classes N and I, LMCG
Emerging Markets Fund-Classes N and I, Pictet International Fund-Classes N and I, and Value Partners Asia Dividend Fund-Classes N and I, the Adviser is entitled to be repaid by each Fund for such previously waived fees and reimbursed expenses from commencement of operations through the completion of the first three full fiscal years, to the extent that each Fund’s expense ratio for a class, not including interest, taxes, brokerage commissions, other investment-related costs, extraordinary expenses, such as litigation and other expenses, not incurred in the ordinary cause of a Fund’s business and acquired fund fees and expenses remains at or below the operating expense cap applicable to each class after such reimbursement.
| | |
| |
| | April 30, 2016 |
| |
| Notes to Financial Statements (unaudited) – continued | | |
The cumulative reimbursement amounts as of April 30, 2016 that are entitled to be recouped for each Fund are as follows:
| | | | | | | | | | | | | | | | |
| | | Expiration | |
| | | 2016 | | | 2017 | | | 2018 | | | 2019 | |
| Fairpointe Focused Equity Fund | | | N/A | | | | N/A | | | $ | 128,683 | | | $ | 52,584 | |
| River Road Focused Absolute Value Fund | | | N/A | | | | N/A | | | | N/A | | | | 81,135 | |
| Herndon Large Cap Value Fund | | $ | — | | | | N/A | | | | N/A | | | | N/A | |
| River Road Dividend All Cap Value Fund II | | | — | | | $ | — | | | | — | | | | N/A | |
| LMCG Small Cap Growth Fund | | | 157,143 | | | | 131,012 | | | | N/A | | | | N/A | |
| River Road Independent Value Fund | | | 59,855 | | | | 25,960 | | | | N/A | | | | N/A | |
| Silvercrest Small Cap Fund | | | 116,435 | | | | 108,554 | | | | 77,805 | | | | N/A | |
| DoubleLine Core Plus Fixed Income Fund | | | 205,067 | | | | 183,865 | | | | N/A | | | | N/A | |
| River Road Long-Short Fund | | | 76,699 | | | | — | | | | N/A | | | | N/A | |
| Guardian Capital Global Dividend Fund | | | N/A | | | | 89,764 | | | | 122,164 | | | | 49,464 | |
| LMCG Emerging Markets Fund | | | 119,333 | | | | 173,395 | | | | 156,268 | | | | 83,143 | |
| Pictet International Fund | | | N/A | | | | — | | | | 116,350 | | | | — | |
| Value Partners Asia Dividend Fund | | | N/A | | | | N/A | | | | N/A | | | | 86,053 | |
Through the six months ended April 30, 2016, the Adviser is eligible to recapture prior year fee waivers and expense reimbursements of $160,935 from Pictet International Fund.
During the six months ended April 30, 2016, the following Fund was reimbursed by the respective Subadviser for losses incurred on transactions not meeting the Funds’ investment guidelines:
| | | | |
| | | Capital Contribution | |
| Pictet International Fund | | $ | 619,174 | |
The Adviser manages each Fund by retaining one or more Subadvisers to manage each Fund, as follows:
| | |
| Fund | | Subadviser |
Cornerstone Large Cap Value Fund | | Cornerstone Investment Partners, LLC |
Fairpointe Focused Equity Fund | | Fairpointe Capital LLC |
River Road Focused Absolute Value Fund | | River Road Asset Management, LLC(a) |
Herndon Large Cap Value Fund | | Herndon Capital Management, LLC |
Montag & Caldwell Growth Fund | | Montag & Caldwell, LLC |
River Road Dividend All Cap Value Fund | | River Road Asset Management, LLC(a) |
River Road Dividend All Cap Value Fund II | | River Road Asset Management, LLC(a) |
Fairpointe Mid Cap Fund | | Fairpointe Capital LLC |
Montag & Caldwell Mid Cap Growth Fund | | Montag & Caldwell, LLC |
LMCG Small Cap Growth Fund | | LMCG Investments, LLC |
River Road Independent Value Fund | | River Road Asset Management, LLC(a) |
River Road Select Value Fund | | River Road Asset Management, LLC(a) |
River Road Small Cap Value Fund | | River Road Asset Management, LLC(a) |
Silvercrest Small Cap Fund | | Silvercrest Asset Management Group LLC |
Small Cap Fund | | GW&K Investment Management, LLC(a) |
DoubleLine Core Plus Fixed Income Fund | | DoubleLine Capital LP |
TCH Fixed Income Fund | | Taplin, Canida & Habacht, LLC |
Anchor Capital Enhanced Equity Fund | | Anchor Capital Advisors LLC |
Lake Partners LASSO Alternatives Fund | | Lake Partners, Inc. |
River Road Long-Short Fund | | River Road Asset Management, LLC(a) |
Barings International Fund | | Baring International Investment Limited |
Guardian Capital Global Dividend Fund | | Guardian Capital LP |
LMCG Emerging Markets Fund | | LMCG Investments, LLC |
| | |
| Fund | | Subadviser |
Pictet International Fund | | Pictet Asset Management Limited |
Value Partners Asia Dividend Fund | | Value Partners Hong Kong Limited(b) |
Harrison Street Real Estate Fund | | Harrison Street Securities, LLC |
Montag & Caldwell Balanced Fund | | Montag & Caldwell, LLC |
| (a) | Affiliated Managers Group Inc. (“AMG”) indirectly owns a majority interest in River Road Asset Management, LLC and GW&K Investment Management, LLC. |
| (b) | AMG indirectly owns a minority interest in Value Partners Hong Kong Limited. |
Subadvisory fees are paid monthly by Aston.
Administration. Under the terms of the administration agreement between the Trust and Aston, the Funds’ administrator (the “Administration Agreement”), administration fees are accrued daily and paid monthly, based on a specified percentage of average daily net assets of the Trust, and base fees are fixed at an annual rate of $12,000 per Fund. The fee is allocated to each Fund based on the relative net assets of the Trust. Administration expenses also include pricing agent fees and compliance-related expenses. The administration fee arrangement is as follows:
| | |
Administration Fees at Trust Level | | Annual Rate |
| |
| First $7.4 billion | | 0.0437% |
| Over $7.4 billion | | 0.0412% |
BNY Mellon Investment Servicing (US) Inc. (“BNY Mellon”) provides certain administrative services to the Funds pursuant to a Sub-administration and Accounting Services Agreement between Aston and BNY Mellon (the “Sub-Administration Agreement”).
Distribution Services. Foreside Funds Distributors LLC (the “Distributor”) serves as principal underwriter and distributor of the Funds’ shares. Pursuant to Rule 12b-1 distribution and service plans (the “Plans”) adopted by the Funds, with respect to Class N shares and Class R shares, the Funds pay certain expenses associated with the distribution and servicing of their shares. Under the Plans, each Fund may pay actual expenses not exceeding, on an annual basis, 0.25% of each participating Fund’s Class N average daily net assets and 0.50% of each participating Fund’s Class R average daily net assets. The Class I shares do not have Rule 12b-1 plans. Effective January 1, 2012 and ending October 31, 2013, the TCH Fixed Income Fund 12b-1 fee was reduced to 0.15%. Effective January 1, 2012, Montag & Caldwell Balanced Fund reduced its 12b-1 fees to 0.10%.
Trustees. The Board provides supervision of the affairs of the Trust and other affiliated funds. The Trustees of the Trust who are not affiliated with an Adviser receive an annual retainer and per meeting fees for regular, special and telephonic meetings, and they are reimbursed for out-of-pocket expenses incurred while carrying out their duties as Board members. The Chairman of the Board and the Audit Committee Chair receive additional annual retainers. Certain Trustees and Officers of the Funds are Officers and/or Directors of AMG, AMG Funds LLC, and the Adviser.
| | |
| |
| | April 30, 2016 |
| |
| Notes to Financial Statements (unaudited) – continued | | |
Effective May 30, 2014, Aston became an indirect, wholly-owned subsidiary of AMG, the interests in which are held by AMG through its wholly-owned subsidiary, AMG Funds LLC.
Affiliated Investments: Certain Funds may invest in affiliated funds subject to compliance with each Fund’s policies.
A summary of each Fund’s investment, as applicable, in affiliated funds for the six months ended April 30, 2016, is as follows:
DoubleLine Core Plus Fixed Income Fund
| | | | | | | | | | | | | | | | | | | | |
Underlying Fund | | Purchases | | | Proceeds
from Sales | | | Market Value
04/30/2016 | | | Dividend
Income | | | Realized
(loss) | |
| DoubleLine Floating Rate Fund | | $ | — | | | $ | 1,000,000 | | | $ | 8,487,325 | | | $ | 146,339 | | | $ | (11,380 | ) |
Note (H) Credit Agreement: Effective July 6, 2010 and as amended August 29, 2014 and July 29, 2015, the Trust entered into a Credit Agreement with The Bank of New York Mellon (the “Bank”) which provides the Trust with a revolving line of credit facility of up to $50 million. The facility is shared by each Fund of the Trust and is available for temporary, emergency purposes including liquidity needs in meeting redemptions. The interest rate on outstanding Alternate Base Rate Loans is equal to the greater of the Prime Rate plus 1.25% or 0.50% plus the Federal Funds Effective Rate plus 1.25%. The interest rate on outstanding Overnight Loans is equal to the greater of the Federal Funds Effective Rate plus 1.25% or the One Month LIBOR Rate plus 1.25%. Effective July 29, 2015, the Trust pays a commitment fee on the unutilized commitment amount of 0.15% per annum, included in Other Expenses on the Statement of Operations. Prior to July 29, 2015, the Trust paid a commitment fee of 0.12% per annum. The Funds did not utilize the line of credit during the six months ended April 30, 2016.
Note (I) Fund Closure: ASTON/TAMRO International Small Cap Fund was liquidated on February 1, 2016.
Note (J) Foreign Securities: Certain Funds may invest a significant percentage of their assets in securities of foreign issuers. These
investments may involve certain considerations and risks not typically associated with investments in the United States as a result of, among other factors, the possibility of future political and economic developments and the level of governmental supervision and regulation of securities markets in the respective countries. Some countries in which the Funds invest may require government approval for repatriation of investment income, capital or the proceeds for sales of securities by foreign investors. In addition, if there is deterioration in a country’s balance of payments or for other reasons, a country may impose temporary restrictions on foreign capital remittances abroad. In addition, changes in currency exchange rates will affect the value of investments denominated in a foreign currency, as well as investment income derived from those securities.
Note (K) Subsequent Events: Management has evaluated the impact of all subsequent events on the Funds through the date the financial statements were issued, and has determined that there were no subsequent events requiring recognition or disclosure in the financial statements except that on June 23, 2016, the Board has approved a Plan of Liquidation of River Road Independent Value Fund, TCH Fixed Income Fund, Barings International Fund, LMCG Emerging Markets Fund and Harrison Street Real Estate Fund pursuant to which the Funds will be liquidated on or about July 28, 2016.
| | |
| |
| | April 30, 2016 |
| |
| Additional Information (unaudited) | | |
Form N-Q: The Trust files complete schedules of portfolio holdings for the Funds with the Securities and Exchange Commission (the “SEC”) for the Trust’s first and third quarters of each fiscal year on Form N-Q. The Trust’s Form N-Q are available on the SEC’s website at www.sec.gov and are available for review and copying at the SEC’s Public Reference Room in Washington, DC. Information on the operations of the Public Reference Room may be obtained by calling the SEC at 202-942-8090.
Proxy Voting: The Trust’s Proxy Voting Policies and Procedures, used to determine how to vote proxies relating to portfolio securities, are included in the Trust’s Statement of Additional Information, which is available (i) upon request, without charge, by calling 800-992-8151; (ii) on Aston Funds’ website at www.astonfunds.com; and (iii) on the SEC’s website at www.sec.gov. The Funds’ Proxy Voting Record for the most recent twelve-month period ended June 30 is available without charge (i) on the Funds’ website at www.astonfunds.com; and (ii) on the SEC’s website at www.sec.gov.
Approval of Interim and New Subadvisory Agreement with GW&K Investment Management, LLC with Respect to ASTON/TAMRO Small Cap Fund
At an in-person meeting held on January 11, 2016, the Board of Trustees (the “Board” or the “Trustees”) of Aston Funds, and separately a majority of the Trustees who are not “interested persons” of the Trust (“Independent Trustees”) within the meaning of the Investment Company Act of 1940, as amended (the “1940 Act”), voted to approve the Interim Subadvisory Agreement (the “Interim Subadvisory Agreement”) between Aston Asset Management, LLC (“Aston”) and GW&K Investment Management, LLC (“GW&K”) with respect to ASTON/TAMRO Small Cap Fund (the “Small Cap Fund”), the New Subadvisory Agreement (the “New Subadvisory Agreement” and, together with the Interim Subadvisory Agreement, the “Agreements”) between Aston and GW&K with respect to the Small Cap Fund, and the presentation of the New Subadvisory Agreement for shareholder approval at a special meeting to be held for such purpose. The Independent Trustees were separately represented by independent legal counsel in their consideration of the Agreements.
In considering the Agreements, the Trustees considered the information relating to the Small Cap Fund and GW&K provided to them, including performance information for the Small Cap Fund and the Russell 2000® Growth Index and, with respect to GW&K, comparative performance information for the composite investment portfolio managed by GW&K in its small cap growth strategy (the “Small Cap Growth Strategy”). In considering the Agreements, the Trustees also considered the information provided to them regarding the nature, extent and quality of services provided by GW&K to the five other funds that GW&K sub-advises in the AMG Funds Family of Funds, a mutual fund complex comprised of 74 different funds, each having distinct investment management objectives, strategies, risks, and policies (the “AMG Fund Complex”), and to be provided by GW&K under the Agreements. Prior to voting, the Independent Trustees: (a) reviewed the foregoing information with their independent legal counsel
and with management; (b) discussed with their independent legal counsel the legal standards applicable to their consideration of the Agreements; and (c) met with their independent legal counsel in a private session at which no representatives of management were present.
Nature, extent and quality of services. In considering the nature, extent and quality of the services to be provided by GW&K, the Trustees reviewed information relating to GW&K’s financial condition, operations and personnel and the investment philosophy, strategies and techniques (the “Investment Strategy”) that are intended to be used by GW&K in managing the Small Cap Fund. Among other things, the Trustees reviewed biographical information on portfolio management and other professional staff, information regarding GW&K’s organizational and management structure and GW&K’s brokerage policies and practices. The Trustees considered specific information provided regarding the experience of the individuals at GW&K that are expected to have portfolio management responsibility for the Small Cap Fund, including the information set forth in the AMG GW&K Small Cap Growth Fund’s prospectus to be filed with the Securities and Exchange Commission. The Trustees noted that one proposed portfolio manager joined GW&K in 2008, serves as co-portfolio manager on two other funds subadvised by GW&K in the AMG Funds Family of Funds and is a Partner and Director of Equities at GW&K. The Trustees also noted that the other proposed portfolio manager joined GW&K in 2008, serves as a co-portfolio manager on one other fund subadvised by GW&K in the AMG Funds Family of Funds and is a Vice President at GW&K. In the course of their deliberations, the Trustees evaluated, among other things: (a) the expected services to be rendered by GW&K to the Small Cap Fund; (b) the qualifications and experience of GW&K’s personnel; and (c) GW&K’s compliance program. The Trustees also considered GW&K’s risk management processes. The Trustees also took into account the financial condition of GW&K with respect to its ability to provide the services required under the Agreements and noted that, as of September 30, 2015, GW&K managed approximately $4.3 billion in assets across their equity business.
Performance. The Trustees considered information relating to the Small Cap Fund’s performance and GW&K’s performance managing small cap strategies. Among other information relating to GW&K’s performance, the Trustees considered the performance of GW&K with respect to its Small Cap Growth Strategy, noting that, for the one-year period, and the period since inception of the strategy (April 1, 2008), in each case, ended December 31, 2015, the annualized gross performance and annualized net performance of the Small Cap Growth Strategy exceeded the performance of the Russell 2000® Growth Index for the same periods. The Trustees considered that for the three-year and five-year periods, in each case, ended December 31, 2015, the annualized gross performance of the Small Cap Growth Strategy was slightly below and above, respectively, the performance of the Russell 2000® Growth Index and the annualized net performance of the Small Cap Growth Strategy, in each case, was below the performance of the Russell 2000® Growth Index for the same periods. The Trustees concluded that this performance record supported the approval of the Agreements.
| | |
| |
| | April 30, 2016 |
| |
| Additional Information (unaudited) – continued | | |
Subadvisory Fees, Profitability and Economies of Scale. The Trustees noted that Aston, and not the Small Cap Fund, is responsible for paying the fees charged by GW&K. In considering the anticipated profitability of GW&K with respect to the provision of subadvisory services to the Small Cap Fund, the Trustees considered information regarding GW&K’s organization, management and financial stability. The Trustees noted that, because GW&K is an affiliate of Aston, such anticipated profitability might be directly or indirectly shared by Aston. The Trustees also noted that the subadvisory fee rate to be paid to GW&K under each Agreement was the same as the rate paid to TAMRO Capital Partners LLC (“TAMRO”) under the former subadvisory agreement between Aston and TAMRO with respect to the Small Cap Fund (the “Former Subadvisory Agreement”). The Board of Trustees of Aston Funds took into account management’s discussion of the proposed subadvisory fee structure, and the services GW&K is expected to provide in performing its functions under the Agreements. Based on the foregoing, the Trustees concluded that the profitability to GW&K is expected to be reasonable.
In addition, the Trustees considered other potential benefits of the subadvisory relationship to GW&K, including, among others, the indirect benefits that GW&K may receive from GW&K’s relationship with the Small Cap Fund, including any so-called “fallout benefits” to GW&K, such as reputational value derived from GW&K serving as subadvisor to the Small Cap Fund. With respect to economies of scale, given that GW&K is being hired as a new subadvisor for the Small Cap Fund, the Trustees did not consider potential economies of scale in the management of the Small Cap Fund by GW&K to be a material factor in their deliberations at this time. In addition, with respect to fee comparisons, the Trustees noted that the fee rates to be charged by GW&K are the same as those charged by TAMRO under the Former Subadvisory Agreement with respect to the Small Cap Fund. Taking into account all of the foregoing, the Trustees concluded that, in light of the nature, extent and quality of the services to be provided by GW&K, and the other considerations noted above with respect to GW&K, the Small Cap Fund’s subadvisory fees are reasonable.
After consideration of the foregoing, the Trustees reached the following conclusions (in addition to the conclusions discussed above) regarding each Agreement: (a) GW&K has demonstrated that it possesses the capability and resources to perform the duties required of it under each Agreement; (b) GW&K’s Investment Strategy is appropriate for pursuing the Small Cap Fund’s investment objectives; (c) GW&K is reasonably likely to execute its investment strategy consistently over time; and (d) GW&K maintains appropriate compliance programs.
Based on all of the above-mentioned factors and their related conclusions, with no single factor or conclusion being determinative and with each Trustee not necessarily attributing the same weight to each factor, the Trustees concluded that approval of each Agreement would be in the best interests of the Small Cap Fund and its shareholders. Accordingly, on January 11, 2016, the Trustees, and separately a majority of the Independent Trustees, voted to approve each Agreement.
Disclosure of Fund Expenses: We believe it is important for you to understand the impact of fees regarding your investment. All mutual funds have operating expenses. As a shareholder of a mutual fund, you incur ongoing costs, which include costs for portfolio management, administrative services, and shareholder reports (like this one), among others. Operating expenses, which are deducted from a fund’s gross income, directly reduce the investment return of the fund. A fund’s expenses are expressed as a percentage of its average daily net assets. This figure is known as the expense ratio. The following examples are intended to help you understand the ongoing fees (in dollars) of investing in your Fund and to compare these costs with those of other mutual funds. The examples are based on an investment of $1,000 made at the beginning of the period shown and held for the entire period.
The following table illustrates each Fund’s costs in two ways:
Actual Fund Return: This section helps you to estimate the actual expenses, after any applicable fee waivers, that you paid over the period. The “Ending Account Value” shown is derived from the Fund’s actual return for the past six-month period, the “Expense Ratio” column shows the period’s annualized expense ratio, and the “Expenses Paid During Period” column shows the dollar amount that would have been paid by an investor who started with $1,000 in the Fund at the beginning of the period. You may use the information here, together with your account value, to estimate the expenses that you paid over the period. To do so, simply divide your account value by $1,000 (for example, an $8,600 account value divided by $1,000 = 8.6), then multiply the result by the number given for your Fund in the first line under the heading entitled “Expenses Paid During Period.”
Hypothetical 5% Return: This section is intended to help you compare your Fund’s costs with those of other mutual funds. It assumes that the Fund had an annual return of 5% before expenses, but that the expense ratio is unchanged. In this case, because the return used is not the Fund’s actual return, the results do not apply to your investment. This example is useful in making comparisons to other mutual funds because the SEC requires all mutual funds to calculate expenses based on an assumed 5% annual return. You can assess your Fund’s costs by comparing this hypothetical example with the hypothetical examples that appear in shareholder reports of other funds.
Please note that the expenses shown in the table are meant to highlight and help you compare your ongoing costs only and do not reflect any transactional costs such as sales charges (loads) and redemption fees, which are described in the prospectus. If these costs were applied to your account, your costs would be higher.
| | |
| |
| | April 30, 2016 |
| |
| Additional Information (unaudited) – continued | | |
| | | | | | | | | | | | | | | | |
| | | Beginning
Account
Value
11/01/15 | | | Ending
Account
Value
04/30/16 | | | Expense
Ratio(1) | | | Expenses
Paid During
Period(2) | |
| Cornerstone Large Cap Value Fund | |
Actual Fund Return | | | | | | | | | | | | | | | | |
Class N | | | $1,000 | | | | $990.40 | | | | 1.20% | | | | $5.94 | |
Class I | | | 1,000 | | | | 991.50 | | | | 0.97% | | | | 4.80 | |
Hypothetical 5% Return | | | | | | | | | | | | | | | | |
Class N | | | $1,000 | | | | $1,018.90 | | | | 1.20% | | | | $6.02 | |
Class I | | | 1,000 | | | | 1,020.04 | | | | 0.97% | | | | 4.87 | |
| Fairpointe Focused Equity Fund | |
Actual Fund Return | | | | | | | | | | | | | | | | |
Class N | | | $1,000 | | | | $990.20 | | | | 1.15% | | | | $5.69 | |
Class I | | | 1,000 | | | | 991.30 | | | | 0.90% | | | | 4.46 | |
Hypothetical 5% Return | | | | | | | | | | | | | | | | |
Class N | | | $1,000 | | | | $1,019.14 | | | | 1.15% | | | | $5.77 | |
Class I | | | 1,000 | | | | 1,020.39 | | | | 0.90% | | | | 4.52 | |
| River Road Focused Absolute Value Fund(3) | |
Actual Fund Return | | | | | | | | | | | | | | | | |
Class N | | | $1,000 | | | | $1,013.00 | | | | 1.00% | | | | $4.95 | |
Class I | | | 1,000 | | | | 1,014.00 | | | | 0.75% | | | | 3.71 | |
Hypothetical 5% Return | | | | | | | | | | | | | | | | |
Class N | | | $1,000 | | | | $1,019.89 | | | | 1.00% | | | | $5.02 | |
Class I | | | 1,000 | | | | 1,021.13 | | | | 0.75% | | | | 3.77 | |
| Herndon Large Cap Value Fund | |
Actual Fund Return | | | | | | | | | | | | | | | | |
Class N | | | $1,000 | | | | $947.10 | | | | 1.20% | | | | $5.81 | |
Class I | | | 1,000 | | | | 948.40 | | | | 0.94% | | | | 4.55 | |
Hypothetical 5% Return | | | | | | | | | | | | | | | | |
Class N | | | $1,000 | | | | $1,018.90 | | | | 1.20% | | | | $6.02 | |
Class I | | | 1,000 | | | | 1,020.19 | | | | 0.94% | | | | 4.72 | |
| Montag & Caldwell Growth Fund | |
Actual Fund Return | | | | | | | | | | | | | | | | |
Class N | | | $1,000 | | | | $977.20 | | | | 1.12% | | | | $5.51 | |
Class I | | | 1,000 | | | | 978.40 | | | | 0.87% | | | | 4.28 | |
Class R | | | 1,000 | | | | 976.20 | | | | 1.37% | | | | 6.73 | |
Hypothetical 5% Return | | | | | | | | | | | | | | | | |
Class N | | | $1,000 | | | | $1,019.29 | | | | 1.12% | | | | $5.62 | |
Class I | | | 1,000 | | | | 1,020.54 | | | | 0.87% | | | | 4.37 | |
Class R | | | 1,000 | | | | 1,018.00 | | | | 1.37% | | | | 6.87 | |
| River Road Dividend All Cap Value Fund | |
Actual Fund Return | | | | | | | | | | | | | | | | |
Class N | | | $1,000 | | | | $1,056.80 | | | | 1.12% | | | | $5.73 | |
Class I | | | 1,000 | | | | 1,058.10 | | | | 0.87% | | | | 4.45 | |
Hypothetical 5% Return | | | | | | | | | | | | | | | | |
Class N | | | $1,000 | | | | $1,019.29 | | | | 1.12% | | | | $5.62 | |
Class I | | | 1,000 | | | | 1,020.54 | | | | 0.87% | | | | 4.37 | |
| River Road Dividend All Cap Value Fund II | |
Actual Fund Return | | | | | | | | | | | | | | | | |
Class N | | | $1,000 | | | | $1,055.00 | | | | 1.19% | | | | $6.08 | |
Class I | | | 1,000 | | | | 1,056.30 | | | | 0.94% | | | | 4.81 | |
Hypothetical 5% Return | | | | | | | | | | | | | | | | |
Class N | | | $1,000 | | | | $1,018.95 | | | | 1.19% | | | | $5.97 | |
Class I | | | 1,000 | | | | 1,020.19 | | | | 0.94% | | | | 4.72 | |
| Fairpointe Mid Cap Fund | |
Actual Fund Return | | | | | | | | | | | | | | | | |
Class N | | | $1,000 | | | | $1,014.60 | | | | 1.13% | | | | $5.66 | |
Class I | | | 1,000 | | | | 1,015.90 | | | | 0.88% | | | | 4.41 | |
Hypothetical 5% Return | | | | | | | | | | | | | | | | |
Class N | | | $1,000 | | | | $1,019.24 | | | | 1.13% | | | | $5.67 | |
Class I | | | 1,000 | | | | 1,020.49 | | | | 0.88% | | | | 4.42 | |
| | | | | | | | | | | | | | | | |
| | | Beginning
Account
Value
11/01/15 | | | Ending
Account
Value
04/30/16 | | | Expense
Ratio(1) | | | Expenses
Paid During
Period(2) | |
| Montag & Caldwell Mid Cap Growth Fund | | | | | | | | | | | | | |
Actual Fund Return | | | | | | | | | | | | | | | | |
Class N | | | $1,000 | | | | $999.80 | | | | 1.25 | % | | | $6.22 | |
Class I | | | 1,000 | | | | 1,000.80 | | | | 1.00 | % | | | 4.97 | |
Hypothetical 5% Return | | | | | | | | | | | | | | | | |
Class N | | | $1,000 | | | | $1,018.65 | | | | 1.25 | % | | | $6.27 | |
Class I | | | 1,000 | | | | 1,019.89 | | | | 1.00 | % | | | 5.02 | |
| LMCG Small Cap Growth Fund | | | | | | | | | | | | | |
Actual Fund Return | | | | | | | | | | | | | | | | |
Class N | | | $1,000 | | | | $844.70 | | | | 1.35 | % | | | $6.19 | |
Class I | | | 1,000 | | | | 845.10 | | | | 1.10 | % | | | 5.05 | |
Hypothetical 5% Return | | | | | | | | | | | | | | | | |
Class N | | | $1,000 | | | | $1,018.15 | | | | 1.35 | % | | | $6.77 | |
Class I | | | 1,000 | | | | 1,019.39 | | | | 1.10 | % | | | 5.52 | |
| River Road Independent Value Fund | | | | | | | | | | | | | |
Actual Fund Return | | | | | | | | | | | | | | | | |
Class N | | | $1,000 | | | | $1,084.90 | | | | 1.42 | % | | | $7.36 | |
Class I | | | 1,000 | | | | 1,086.90 | | | | 1.17 | % | | | 6.07 | |
Hypothetical 5% Return | | | | | | | | | | | | | | | | |
Class N | | | $1,000 | | | | $1,017.80 | | | | 1.42 | % | | | $7.12 | |
Class I | | | 1,000 | | | | 1,019.05 | | | | 1.17 | % | | | 5.87 | |
| River Road Select Value Fund | | | | | | | | | | | | | |
Actual Fund Return | | | | | | | | | | | | | | | | |
Class N | | | $1,000 | | | | $1,036.20 | | | | 1.50 | % | | | $7.59 | |
Class I | | | 1,000 | | | | 1,037.80 | | | | 1.25 | % | | | 6.33 | |
Hypothetical 5% Return | | | | | | | | | | | | | | | | |
Class N | | | $1,000 | | | | $1,017.40 | | | | 1.50 | % | | | $7.52 | |
Class I | | | 1,000 | | | | 1,018.65 | | | | 1.25 | % | | | 6.27 | |
| River Road Small Cap Value Fund | | | | | | | | | | | | | |
Actual Fund Return | | | | | | | | | | | | | | | | |
Class N | | | $1,000 | | | | $1,011.10 | | | | 1.36 | % | | | $6.80 | |
Class I | | | 1,000 | | | | 1,012.70 | | | | 1.11 | % | | | 5.55 | |
Hypothetical 5% Return | | | | | | | | | | | | | | | | |
Class N | | | $1,000 | | | | $1,018.10 | | | | 1.36 | % | | | $6.82 | |
Class I | | | 1,000 | | | | 1,019.34 | | | | 1.11 | % | | | 5.57 | |
| Silvercrest Small Cap Fund | | | | | | | | | | | | | |
Actual Fund Return | | | | | | | | | | | | | | | | |
Class N | | | $1,000 | | | | $990.10 | | | | 1.40 | % | | | $6.93 | |
Class I | | | 1,000 | | | | 991.50 | | | | 1.15 | % | | | 5.69 | |
Hypothetical 5% Return | | | | | | | | | | | | | | | | |
Class N | | | $1,000 | | | | $1,017.90 | | | | 1.40 | % | | | $7.02 | |
Class I | | | 1,000 | | | | 1,019.14 | | | | 1.15 | % | | | 5.77 | |
| Small Cap Fund | | | | | | | | | | | | | |
Actual Fund Return | | | | | | | | | | | | | | | | |
Class N | | | $1,000 | | | | $930.60 | | | | 1.42 | % | | | $6.82 | |
Class I | | | 1,000 | | | | 931.60 | | | | 1.17 | % | | | 5.62 | |
Hypothetical 5% Return | | | | | | | | | | | | | | | | |
Class N | | | $1,000 | | | | $1,017.80 | | | | 1.42 | % | | | $7.12 | |
Class I | | | 1,000 | | | | 1,019.05 | | | | 1.17 | % | | | 5.87 | |
| DoubleLine Core Plus Fixed Income Fund | | | | | | | | | | | | | |
Actual Fund Return | | | | | | | | | | | | | | | | |
Class N | | | $1,000 | | | | $1,020.50 | | | | 0.94 | % | | | $4.72 | |
Class I | | | 1,000 | | | | 1,020.80 | | | | 0.69 | % | | | 3.47 | |
Hypothetical 5% Return | | | | | | | | | | | | | | | | |
Class N | | | $1,000 | | | | $1,020.19 | | | | 0.94 | % | | | $4.72 | |
Class I | | | 1,000 | | | | 1,021.43 | | | | 0.69 | % | | | 3.47 | |
| | |
| |
| | April 30, 2016 |
| |
| Additional Information (unaudited) – continued | | |
| | | | | | | | | | | | | | | | |
| | | Beginning
Account
Value
11/01/15 | | | Ending
Account
Value
04/30/16 | | | Expense
Ratio(1) | | | Expenses
Paid During
Period(2) | |
| TCH Fixed Income Fund | | | | | | | | | |
Actual Fund Return | | | | | | | | | | | | | | | | |
Class N | | | $1,000 | | | | $1,023.60 | | | | 0.94 | % | | | $4.73 | |
Class I | | | 1,000 | | | | 1,024.90 | | | | 0.69 | % | | | 3.47 | |
Hypothetical 5% Return | | | | | | | | | | | | | | | | |
Class N | | | $1,000 | | | | $1,020.19 | | | | 0.94 | % | | | $4.72 | |
Class I | | | 1,000 | | | | 1,021.43 | | | | 0.69 | % | | | 3.47 | |
| Anchor Capital Enhanced Equity Fund | | | | | | | | | |
Actual Fund Return | | | | | | | | | | | | | | | | |
Class N | | | $1,000 | | | | $1,005.40 | | | | 1.27 | % | | | $6.33 | |
Class I | | | 1,000 | | | | 1,006.80 | | | | 1.02 | % | | | 5.09 | |
Hypothetical 5% Return | | | | | | | | | | | | | | | | |
Class N | | | $1,000 | | | | $1,018.55 | | | | 1.27 | % | | | $6.37 | |
Class I | | | 1,000 | | | | 1,019.79 | | | | 1.02 | % | | | 5.12 | |
| Lake Partners LASSO Alternatives Fund | | | | | | | | | |
Actual Fund Return | | | | | | | | | | | | | | | | |
Class N | | | $1,000 | | | | $984.10 | | | | 1.40 | % | | | $6.91 | |
Class I | | | 1,000 | | | | 985.00 | | | | 1.15 | % | | | 5.68 | |
Hypothetical 5% Return | | | | | | | | | | | | | | | | |
Class N | | | $1,000 | | | | $1,017.90 | | | | 1.40 | % | | | $7.02 | |
Class I | | | 1,000 | | | | 1,019.14 | | | | 1.15 | % | | | 5.77 | |
| River Road Long-Short Fund(4) | | | | | | | | |
Actual Fund Return | | | | | | | | | | | | | | | | |
Class N | | | $1,000 | | | | $984.00 | | | | 1.70 | % | | | $8.39 | |
Class I | | | 1,000 | | | | 985.00 | | | | 1.45 | % | | | 7.16 | |
Hypothetical 5% Return | | | | | | | | | | | | | | | | |
Class N | | | $1,000 | | | | $1,016.41 | | | | 1.70 | % | | | $8.52 | |
Class I | | | 1,000 | | | | 1,017.65 | | | | 1.45 | % | | | 7.27 | |
| Barings International Fund | | | | | | | | | |
Actual Fund Return | | | | | | | | | | | | | | | | |
Class N | | | $1,000 | | | | $959.40 | | | | 1.40 | % | | | $6.82 | |
Class I | | | 1,000 | | | | 960.50 | | | | 1.15 | % | | | 5.61 | |
Hypothetical 5% Return | | | | | | | | | | | | | | | | |
Class N | | | $1,000 | | | | $1,017.90 | | | | 1.40 | % | | | $7.02 | |
Class I | | | 1,000 | | | | 1,019.14 | | | | 1.15 | % | | | 5.77 | |
| Guardian Capital Global Dividend Fund | | | | | | | | | |
Actual Fund Return | | | | | | | | | | | | | | | | |
Class N | | | $1,000 | | | | $986.90 | | | | 1.30 | % | | | $6.42 | |
Class I | | | 1,000 | | | | 989.00 | | | | 1.05 | % | | | 5.19 | |
Hypothetical 5% Return | | | | | | | | | | | | | | | | |
Class N | | | $1,000 | | | | $1,018.40 | | | | 1.30 | % | | | $6.52 | |
Class I | | | 1,000 | | | | 1,019.64 | | | | 1.05 | % | | | 5.27 | |
| LMCG Emerging Markets Fund | | | | | | | | | |
Actual Fund Return | | | | | | | | | | | | | | | | |
Class N | | | $1,000 | | | | $971.70 | | | | 1.43 | % | | | $7.01 | |
Class I | | | 1,000 | | | | 973.30 | | | | 1.18 | % | | | 5.79 | |
Hypothetical 5% Return | | | | | | | | | | | | | | | | |
Class N | | | $1,000 | | | | $1,017.75 | | | | 1.43 | % | | | $7.17 | |
Class I | | | 1,000 | | | | 1,019.00 | | | | 1.18 | % | | | 5.92 | |
| Pictet International Fund | | | | | | | | | |
Actual Fund Return | | | | | | | | | | | | | | | | |
Class N | | | $1,000 | | | | $1,001.50 | | | | 1.40 | % | | | $6.97 | |
Class I | | | 1,000 | | | | 1,002.00 | | | | 1.15 | % | | | 5.72 | |
Hypothetical 5% Return | | | | | | | | | | | | | | | | |
Class N | | | $1,000 | | | | $1,017.90 | | | | 1.40 | % | | | $7.02 | |
Class I | | | 1,000 | | | | 1,019.14 | | | | 1.15 | % | | | 5.77 | |
| | | | | | | | | | | | | | | | |
| | | Beginning
Account
Value
11/01/15 | | | Ending
Account
Value
04/30/16 | | | Expense
Ratio(1) | | | Expenses
Paid During
Period(2) | |
| Value Partners Asia Dividend Fund(5) | | | | | | | | | | | | | |
Actual Fund Return | | | | | | | | | | | | | | | | |
Class N | | | $1,000 | | | | $1,015.00 | | | | 1.40 | % | | | $5.24 | |
Class I | | | 1,000 | | | | 1,015.00 | | | | 1.15 | %�� | | | 4.31 | |
Hypothetical 5% Return | | | | | | | | | | | | | | | | |
Class N | | | $1,000 | | | | $1,017.90 | | | | 1.40 | % | | | $7.02 | |
Class I | | | 1,000 | | | | 1,019.14 | | | | 1.15 | % | | | 5.77 | |
| Harrison Street Real Estate Fund | | | | | | | | | | | | | |
Actual Fund Return | | | | | | | | | | | | | | | | |
Class N | | | $1,000 | | | | $1,054.80 | | | | 1.37 | % | | | $7.00 | |
Class I | | | 1,000 | | | | 1,056.00 | | | | 1.12 | % | | | 5.73 | |
Hypothetical 5% Return | | | | | | | | | | | | | | | | |
Class N | | | $1,000 | | | | $1,018.05 | | | | 1.37 | % | | | $6.87 | |
Class I | | | 1,000 | | | | 1,019.29 | | | | 1.12 | % | | | 5.62 | |
| Montag & Caldwell Balanced Fund | | | | | | | | | | | | | |
Actual Fund Return | | | | | | | | | | | | | | | | |
Class N | | | $1,000 | | | | $996.20 | | | | 1.20 | % | | | $5.96 | |
Class I | | | 1,000 | | | | 996.70 | | | | 1.10 | % | | | 5.46 | |
Hypothetical 5% Return | | | | | | | | | | | | | | | | |
Class N | | | $1,000 | | | | $1,018.90 | | | | 1.20 | % | | | $6.02 | |
Class I | | | 1,000 | | | | 1,019.39 | | | | 1.10 | % | | | 5.52 | |
| (1) | Annualized, based on the Fund’s most recent fiscal half-year expenses. |
| (2) | Expenses are equal to the Fund’s annualized expense ratio multiplied by the average account value over the period, multiplied by the number of days in the most recent fiscal half-year (182) or partial year, if applicable, for the actual return and multiplied by the most recent fiscal half-year for the hypothetical 5% return, then divided by 366. Expense ratios do not include interest expense, if applicable. |
| (3) | The commencement of investment operations for River Road Focused Absolute Value Fund is November 3, 2015. |
| (4) | Excludes interest expense and dividends on short positions. If included, your annualized expense ratios would be 3.36% and 3.11% for Class N and Class I, respectively and your actual and hypothetical expenses paid during the period would be $16.57 and $16.78 and $15.35 and $15.54 for Class N and Class I, respectively. |
| (5) | The commencement of investment operations for Value Partners Asia Dividend Fund is December 16, 2015. |
Aston Funds
ADVISER
Aston Asset Management, LLC
120 N. LaSalle Street, 25th Floor
Chicago, IL 60602
SUBADVISERS
Anchor Capital Advisors LLC
One Post Office Square, Suite 3850
Boston, MA 02109
Baring International Investment Limited
155 Bishopsgate
London, EC2M 3XY UK
Cornerstone Investment Partners, LLC
Phipps Tower
3438 Peachtree Road NE, Suite 900
Atlanta, GA 30326
DoubleLine Capital LP
333 South Grand Avenue, Suite 1800
Los Angeles, CA 90071
Fairpointe Capital LLC
One North Franklin, Suite 3300
Chicago, IL 60606
Guardian Capital LP
199 Bay Street, Suite 3100
Toronto, ON, M5L 1E8
GW&K Investment Management, LLC
222 Berkeley Street, 15th Floor
Boston, MA 02116
Harrison Street Securities, LLC
71 South Wacker Drive, Suite 3575
Chicago, IL 60606
Herndon Capital Management, LLC
191 Peachtree Street, NE, Suite 2500
Atlanta, GA 30303
Lake Partners, Inc.
4 High Ridge Park, Suite 300
Stamford, CT 06905
LMCG Investments, LLC
200 Clarendon Street, 28th Floor
Boston, MA 02116
SUBADVISERS - continued
Montag & Caldwell, LLC
3455 Peachtree Road NE, Suite 1200
Atlanta, GA 30326
Pictet Asset Management Limited
120 London Wall
London, EC2Y 5ET UK
River Road Asset Management, LLC
Meidinger Tower, Suite 2000
462 South Fourth Street
Louisville, KY 40202
Silvercrest Asset Management Group LLC
1330 Avenue of the Americas, 38th Floor
New York, NY 10019
Taplin, Canida & Habacht LLC
1001 Brickell Bay Drive, Suite 2100
Miami, FL 33131
Value Partners Hong Kong Limited
9th Floor, Nexxus Building
41 Connaught Road Central
Hong Kong
SHAREHOLDER SERVICES
Aston Funds
P.O. Box 9765
Providence, RI 02940
DISTRIBUTOR
Foreside Funds Distributors LLC
400 Berwyn Park
899 Cassatt Road
Berwyn, PA 19312
OFFICERS
Jeffrey T. Cerutti, President, Chief Executive Officer and Principal Executive Officer
Keitha L. Kinne Chief Operating Officer
Donald S. Rumery, Treasurer, Chief Financial Officer, Principal Financial Officer and Principal Accounting Officer
Gerald F. Dillenburg, Chief Compliance Officer and Sarbanes-Oxley Code of Ethics Compliance Officer
Mark J. Duggan, Secretary and Chief Legal Officer
John C. Ball, Assistant Treasurer
Laura M. Curylo, Assistant Treasurer
James A. Dimmick, Assistant Secretary
Maureen A. Meredith, Assistant Secretary
Marc Peirce, Assistant Secretary
Diana R. Podgorny, Assistant Secretary
Patrick J. Spellman, Anti-Money Laundering Compliance Officer
CUSTODIAN
The Bank of New York Mellon
2 Hanson Street
Brooklyn, NY 11217
LEGAL COUNSEL
Vedder Price P.C.
222 N. LaSalle Street
Chicago, IL 60601
INDEPENDENT REGISTERED PUBLIC ACCOUNTING FIRM
PricewaterhouseCoopers LLP
101 Seaport Boulevard Suite 500
Boston, MA 02210
THE STATEMENT OF ADDITIONAL INFORMATION INCLUDES ADDITIONAL INFORMATION ABOUT FUND TRUSTEES AND IS AVAILABLE UPON REQUEST WITHOUT CHARGE BY CALLING 800-992-8151.
Guide to Shareholder Benefits
We’re delighted to offer all Aston Funds shareholders a variety of services and convenient options. To receive more information about any of these benefits, simply call an Investor Services Associate Monday through Friday, 9 a.m. – 7 p.m. Eastern Time.
THE EASY WAY TO ADD TO YOUR ACCOUNT: START AN AUTOMATIC INVESTMENT PLAN
For Class N shareholders, systematic investing is an easy, effortless way to help reach any investment goal. Just choose a fixed amount, and we’ll automatically deduct it from your checking or savings account on a regular schedule and invest it in your Aston Funds account. Periodic investment plans involve continuous investments in securities regardless of price. You should consider your financial ability to continue to purchase shares through periods of both high and low price levels. This plan does not assure a profit and does not protect against loss in declining markets.
COMPOUND YOUR EARNINGS WITH AUTOMATIC DIVIDEND REINVESTMENT
By automatically reinvesting dividends into your Fund account, profits have the opportunity to mount. Monthly and quarterly dividends and annual capital gain distributions are reinvested at no charge.
ACCESS INFORMATION AND MAKE TRANSACTIONS ONLINE AT OUR WEBSITE
You can open a new account, access account balances, view statements, obtain fund information, and make transactions online 24 hours a day, 7 days a week.
| | |
| | www.astonfunds.com |
| |
| | Our Automated Shareholder Services Line Is at Your Service 24 Hours a Day |
| | 800-992-8151 |
Investor Services
Associates are available to assist you Monday – Friday 9 a.m. to 7 p.m., Eastern Time. Or, call any time, day or night, for automated account information to make exchanges or check fund performance.

Aston Funds
P.O. Box 9765
Providence, RI 02940
ATSEM 16
Not applicable.
| Item 3. | Audit Committee Financial Expert. |
Not applicable.
| Item 4. | Principal Accountant Fees and Services. |
Not applicable.
| Item 5. | Audit Committee of Listed Registrants. |
Not applicable.
| (a) | Schedule of Investments in securities of unaffiliated issuers as of the close of the reporting period is included as part of the report to shareholders filed under Item 1 of this form. |
| Item 7. | Disclosure of Proxy Voting Policies and Procedures for Closed-End Management Investment Companies. |
Not applicable.
| Item 8. | Portfolio Managers of Closed-End Management Investment Companies. |
Not applicable.
| Item 9. | Purchases of Equity Securities by Closed-End Management Investment Company and Affiliated Purchasers. |
Not applicable.
| Item 10. | Submission of Matters to a Vote of Security Holders. |
There have been no material changes to the procedures by which the shareholders may recommend nominees to the registrant’s board of directors, where those changes were implemented after the registrant last provided disclosure in response to the requirements of Item 407(c)(2)(iv) of Regulation S-K (17 CFR 229.407) (as required by Item 22(b)(15) of Schedule 14A (17 CFR 240.14a-101)), or this Item.
| Item 11. | Controls and Procedures. |
| | (a) | The registrant’s principal executive and principal financial officers, or persons performing similar functions, have concluded that the registrant’s disclosure controls and procedures (as defined in Rule 30a-3(c) under the Investment Company Act of 1940, as amended (the “1940 Act”) (17 CFR 270.30a-3(c))) are effective, as of a date within 90 days of the filing date of the report that includes the disclosure required by this paragraph, based on their evaluation of these controls and procedures required by Rule 30a-3(b) under the 1940 Act (17 CFR 270.30a-3(b)) and Rules 13a-15(b) or 15d-15(b) under the Securities Exchange Act of 1934, as amended (17 CFR 240.13a-15(b) or 240.15d-15(b)). |
| | (b) | There were no changes in the registrant’s internal control over financial reporting (as defined in Rule 30a-3(d) under the 1940 Act (17 CFR 270.30a-3(d))) that occurred during the registrant’s second fiscal quarter of the period covered by this report that has materially affected, or is reasonably likely to materially affect, the registrant’s internal control over financial reporting. |
| | (a)(2) | Certifications pursuant to Rule 30a-2(a) under the 1940 Act and Section 302 of the Sarbanes-Oxley Act of 2002 are attached hereto. |
| | (b) | Certifications pursuant to Rule 30a-2(b) under the 1940 Act and Section 906 of the Sarbanes-Oxley Act of 2002 are attached hereto. |
SIGNATURES
Pursuant to the requirements of the Securities Exchange Act of 1934 and the Investment Company Act of 1940, the registrant has duly caused this report to be signed on its behalf by the undersigned, thereunto duly authorized.
(Registrant) Aston Funds
By (Signature and Title)* /s/ Jeffrey T. Cerutti
Jeffrey T. Cerutti, President, Chief Executive Officer and Principal
Executive Officer
Date July 7, 2016
Pursuant to the requirements of the Securities Exchange Act of 1934 and the Investment Company Act of 1940, this report has been signed below by the following persons on behalf of the registrant and in the capacities and on the dates indicated.
By (Signature and Title)* /s/ Jeffrey T. Cerutti
Jeffrey T. Cerutti, President, Chief Executive Officer and Principal
Executive Officer
Date July 7, 2016
By (Signature and Title)* /s/ Donald S. Rumery
Donald S. Rumery, Treasurer, Chief Financial Officer and Principal
Financial Officer
Date July 7, 2016
* Print the name and title of each signing officer under his or her signature.