UNITED STATES
SECURITIES AND EXCHANGE COMMISSION
Washington, D.C. 20549
FORM N-CSR
CERTIFIED SHAREHOLDER REPORT OF REGISTERED
MANAGEMENT INVESTMENT COMPANIES
Investment Company Act file number | 811-8194 |
|
FINANCIAL INVESTORS TRUST |
(Exact name of registrant as specified in charter) |
|
1290 Broadway, Suite 1100, Denver, Colorado | | 80203 |
(Address of principal executive offices) | | (Zip code) |
|
JoEllen L. Legg, Secretary Financial Investors Trust 1290 Broadway, Suite 1100 Denver, Colorado 80203 |
(Name and address of agent for service) |
|
Registrant’s telephone number, including area code: | 303-623-2577 | |
|
Date of fiscal year end: | April 30 | |
|
Date of reporting period: | May 1, 2008 - April 30, 2009 | |
| | | | | | | | | |
Item 1. Reports to Stockholders.

ANNUAL REPORT
DISCLOSURE OF FUND EXPENSES (UNAUDITED)
As a shareholder of the American Freedom U.S. Government Money Market Fund (the “Fund”), you will not incur any transaction costs, including sales charges (loads) on purchases, on reinvested dividends, or on other distributions. There are also no redemption fees or exchange fees. However, the Fund does incur ongoing costs, including management fees and other Fund expenses. The following example is intended to help you understand your ongoing costs (in dollars) of investing in the Fund and to compare these costs with the ongoing costs of investing in other mutual funds. The examples are based on an investment of $1,000 invested on November 1, 2008 and held until April 30, 2009.
Actual Return. The first line of the table below provides information about actual account values and actual expenses. You may use the information in this line, together with the amount you invested, to estimate the expenses that you paid over the period. Simply divide your account value by $1,000 (for example, an $8,600 account value divided by $1,000 = 8.6), then multiply the result by the number in the first line under the heading “Expense Paid During Period” to estimate the expenses you paid on your account during this period.
Hypothetical 5% Return. The second line of the table below provides information about hypothetical account values and hypothetical expenses based on the Fund’s actual expense ratio and an assumed rate of return of 5% per year before expenses, which is not the Fund’s actual return. The hypothetical account values and expenses may not be used to estimate the actual ending account balance or expenses you paid for the period. You may use this information to compare the ongoing costs of investing in the Fund and other mutual funds. To do so, compare this 5% hypothetical example with the 5% hypothetical examples that appear in the shareholder reports of the other funds.
The expenses shown in the table below are meant to highlight ongoing Fund costs. Therefore, the second line of the table is useful in comparing ongoing costs only and may not help you determine the relative total costs of owning different funds.
| | | | | | Expense Paid | |
| | Beginning Account | | Ending Account | | During Period | |
| | Value 11/1/08 | | Value 4/30/09 | | 11/1/08-4/30/09* | |
Actual Fund Return | | $ | 1,000.00 | | $ | 1,002.90 | | $ | 1.14 | |
Hypothetical Fund Return | | $ | 1,000.00 | | $ | 1,023.65 | | $ | 1.15 | |
* Expenses are equal to the annualized expense ratio of 0.23%, multiplied by the average account value over the period, multiplied by the number of days in the first half-year (181) divided by 365 days in the current year (to reflect the one-half year period).
ASSET ALLOCATION*
April 30, 2009
| | Percentage of Fund’s | |
| | Total Net Assets | |
U.S. Government & Agency Obligations | | 61.59 | % |
Repurchase Agreements | | 38.43 | % |
Liabilities in Excess of Other Assets | | (0.02 | )% |
| | 100.00 | % |
* These allocations may not reflect the current or future position of the Fund.
1
REPORT OF INDEPENDENT REGISTERED PUBLIC ACCOUNTING FIRM
To the Shareholders and Board of Trustees of Financial Investors Trust:
We have audited the accompanying statement of assets and liabilities of American Freedom U.S. Government Money Market Fund, one of the portfolios of Financial Investors Trust (the “Trust”), including the statement of investments, as of April 30, 2009, and the related statement of operations for the year then ended, the statements of changes in net assets for each of the two years in the period then ended, and the financial highlights for each of the five years in the period then ended. These financial statements and financial highlights are the responsibility of the Trust’s management. Our responsibility is to express an opinion on these financial statements and financial highlights based on our audits.
We conducted our audits in accordance with the standards of the Public Company Accounting Oversight Board (United States). Those standards require that we plan and perform the audit to obtain reasonable assurance about whether the financial statements and financial highlights are free of material misstatement. The Trust is not required to have, nor were we engaged to perform, an audit of its internal control over financial reporting. Our audits included consideration of internal control over financial reporting as a basis for designing audit procedures that are appropriate in the circumstances, but not for the purpose of expressing an opinion on the effectiveness of the Trust’s internal control over financial reporting. Accordingly, we express no such opinion. An audit also includes examining, on a test basis, evidence supporting the amounts and disclosures in the financial statements, assessing the accounting principles used and significant estimates made by management, as well as evaluating the overall financial statement presentation. Our procedures included confirmation of securities owned as of April 30, 2009, by correspondence with the custodian and brokers; where replies were not received from brokers, we performed other auditing procedures. We believe that our audits provide a reasonable basis for our opinion.
In our opinion, the financial statements and financial highlights referred to above present fairly, in all material respects, the financial position of American Freedom U.S. Government Money Market Fund of Financial Investors Trust as of April 30, 2009, the results of its operations for the year then ended, the changes in its net assets for each of the two years in the period then ended, and the financial highlights for each of the five years in the period then ended, in conformity with accounting principles generally accepted in the United States of America.

Denver, Colorado
June 22, 2009
2
STATEMENT OF INVESTMENTS
AMERICAN FREEDOM U.S. GOVERNMENT MONEY MARKET FUND
April 30, 2009
Face Value | | | | Value | | | |
| | U.S. GOVERNMENT & AGENCY OBLIGATIONS 61.59% | | | | | |
| | | | | | | |
| | Federal Home Loan Bank | | | | | |
$ | 15,500,000 | | 0.24%, 5/19/09 DN | | $ | 15,498,140 | | | |
20,000,000 | | 0.40%, 5/28/09 DN | | 19,994,000 | | | |
15,000,000 | | 0.30%, 6/2/09 DN | | 14,996,000 | | | |
6,535,000 | | 0.40%, 9/16/09 DN | | 6,524,979 | | | |
| | | | | | | |
| | Federal Home Loan Mortgage Corporation | | | | | |
15,000,000 | | 0.65%*, 5/1/09 | | 15,000,000 | | | |
10,000,000 | | 0.40%, 5/11/09 DN | | 9,998,889 | | | |
5,000,000 | | 0.42%*, 5/18/09 | | 5,001,329 | | | |
15,000,000 | | 0.51%, 7/1/09 DN | | 14,987,037 | | | |
25,000,000 | | 0.50%, 7/30/09 DN | | 24,968,750 | | | |
| | | | | | | |
| | Federal National Mortgage Association | | | | | |
25,000,000 | | 0.38%, 5/18/09 DN | | 24,995,514 | | | |
20,000,000 | | 0.30%, 6/22/09 DN | | 19,991,334 | | | |
20,000,000 | | 0.48%, 6/23/09 DN | | 19,985,867 | | | |
20,000,000 | | 0.58%, 9/9/09 DN | | 19,957,789 | | | |
| | | | | | | |
TOTAL U.S. GOVERNMENT & AGENCY OBLIGATIONS
(Amortized Cost $211,899,628) | | 211,899,628 | | | |
| | | | | | | | | |
| | | | | | | |
| | | | | | | |
| | | | | | | |
| | | | | | Collateral Value | |
| | REPURCHASE AGREEMENTS COLLATERALIZED BY U.S. GOVERNMENT OBLIGATIONS 38.43% | | | | | |
| | | | | | | | |
| | Agreement with Bank of America and Bank of New York (Tri-party), 0.17%, dated 4/30/09 and maturing 5/1/09, collateralized by U. S. Government and Agency Obligations with a repurchase amount of $22,211,105 | | 22,211,000 | | $ | 22,655,820 | |
| | | | | | | |
| | Agreement with BNP Paribas Securities Corp. and Bank of New York (Tri-party), 0.17%, dated 4/30/09 and maturing 5/1/09, collateralized by U. S. Government and Agency Obligations with a repurchase amount of $15,000,071 | | 15,000,000 | | 15,300,613 | |
3
| | | | | | | |
| | | | | | | |
| | | | | | | |
| | | | Value | | Collateral Value | |
| | REPURCHASE AGREEMENTS COLLATERALIZED BY U.S. GOVERNMENT OBLIGATIONS (continued) | | | | | | | |
| | | | | | | | | |
| | Agreement with Credit Suisse First Boston and J. P. Morgan Chase & Co. (Tri-party), 0.17%, dated 4/30/09 and maturing 5/1/09, collateralized by U. S. Government and Agency Obligations with a repurchase amount of $15,000,071 | | $ | 15,000,000 | | $ | 15,304,330 | |
| | | | | | | |
| | Agreement with Goldman Sachs and Bank of New York (Tri-party), 0.16%, dated 4/30/09 and maturing 5/1/09, collateralized by U. S. Government and Agency Obligations with a repurchase amount of $15,000,067 | | 15,000,000 | | 15,300,579 | |
| | | | | | | |
| | Agreement with HSBC Bank and J. P. Morgan Chase & Co. (Tri-party), 0.16%, dated 4/30/09 and maturing 5/1/09, collateralized by U. S. Government and Agency Obligations with a repurchase amount of $15,000,067 | | 15,000,000 | | 15,302,700 | |
| | | | | | | |
| | Agreement with ING Financial Markets and J. P. Morgan Chase & Co. (Tri-party), 0.17%, dated 4/30/09 and maturing 5/1/09, collateralized by U. S. Government and Agency Obligations with a repurchase amount of $5,000,023 | | 5,000,000 | | 5,103,442 | |
| | | | | | | |
| | Agreement with J. P. Morgan Chase and J. P. Morgan Chase & Co. (Tri-party), 0.17%, dated 4/30/09 and maturing 5/1/09, collateralized by U. S. Government and Agency Obligations with a repurchase amount of $15,000,071 | | 15,000,000 | | 15,302,769 | |
| | | | | | | |
| | Agreement with Smith Barney Citigroup and Bank of New York (Tri-party), 0.16%, dated 4/30/09 and maturing 5/1/09, collateralized by U. S. Government and Agency Obligations with a repurchase amount of $15,000,067 | | 15,000,000 | | 15,300,083 | |
4
| | | | | | | |
| | | | | | | |
| | | | | | | |
| | | | Value | | Collateral Value | |
| | REPURCHASE AGREEMENTS COLLATERALIZED BY U.S. GOVERNMENT OBLIGATIONS (continued) | | | | | | | |
| | | | | | | | | |
| | Agreement with UBS Warburg and J. P. Morgan Chase & Co. (Tri-party), 0.16%, dated 4/30/09 and maturing 5/1/09, collateralized by U. S. Government and Agency Obligations with a repurchase amount of $15,000,067 | | $ | 15,000,000 | | $ | 15,301,770 | |
| | | | | | | |
TOTAL REPURCHASE AGREEMENTS
(Cost $132,211,000) | | 132,211,000 | | 134,872,106 | |
TOTAL INVESTMENTS
(Cost $344,110,628) | | 100.02 | % | $ | 344,110,628 | | | |
Liabilities in Excess of Other Assets | | (0.02 | )% | (64,906 | ) | | |
| | | | | | | |
NET ASSETS | | 100.00 | % | $ | 344,045,722 | | | |
* Floating rate security - rate disclosed as of April 30, 2009. Maturity date represents the next interest rate reset date.
DN - Discount Note
Income Tax Information:
Total cost for federal income tax purposes - $344,110,628
For Fund compliance purposes, the Fund’s industry classifications refer to any one or more of the industry sub-classifications used by one or more widely recognized market indexes or ratings group indexes, and/or as defined by Fund management. This definition may not apply for purposes of this report, which may combine industry sub-classifications for reporting ease. Industries are shown as a percent of net assets. These industry classifications are unaudited.
See Notes to Financial Statements.
5
FINANCIAL STATEMENTS
AMERICAN FREEDOM U.S. GOVERNMENT MONEY MARKET FUND
STATEMENT OF ASSETS AND LIABILITIES
AMERICAN FREEDOM U.S. GOVERNMENT MONEY MARKET FUND
April 30, 2009
Assets | | | |
Investments, at amortized cost (1) | | $ | 344,110,628 | |
Interest receivable | | 7,024 | |
Prepaid and other assets | | 28,566 | |
Total Assets | | 344,146,218 | |
| | | |
Liabilities | | | |
Dividends payable | | 31,098 | |
Accrued investment advisory fee | | 22,458 | |
Accrued administration fee | | 19,683 | |
Accrued trustee fees | | 11,126 | |
Other payables | | 16,131 | |
Total Liabilities | | 100,496 | |
Net Assets | | $ | 344,045,722 | |
| | | |
Composition of Net Assets | | | |
Paid-in capital | | $ | 344,044,232 | |
Undistributed net investment income | | 1,490 | |
Net Assets | | $ | 344,045,722 | |
| | | |
Shares of beneficial interest outstanding (no par value, unlimited shares authorized) | | 343,897,503 | |
| | | |
Net asset value and redemption value per share | | $ | 1.00 | |
(1) Including repurchase agreements in the amount of: | | $ | 132,211,000 | |
See Notes to Financial Statements.
7
STATEMENT OF OPERATIONS
AMERICAN FREEDOM U.S. GOVERNMENT MONEY MARKET FUND
For the Year Ended April 30, 2009
��
Investment Income | | | |
Interest Income | | $ | 6,664,606 | |
Total Investment Income | | 6,664,606 | |
| | | |
Expenses | | | |
Investment advisory fee | | 461,998 | |
Administration services | | 703,789 | |
Legal | | 72,123 | |
Reports to Shareholders | | 40,456 | |
Insurance | | 61,780 | |
State Registration | | 5,731 | |
Trustee fees | | 76,804 | |
Miscellaneous | | 25,202 | |
Total Expenses before fee waiver | | 1,447,883 | |
Expenses waived by administrator | | (346,219 | ) |
Expenses waived by investment adviser | | (153,999 | ) |
Net Expenses | | 947,665 | |
| | | |
Net Investment Income and Net Increase in Net Assets Resulting from Operations | | $ | 5,716,941 | |
See Notes to Financial Statements.
8
STATEMENTS OF CHANGES IN NET ASSETS
AMERICAN FREEDOM U.S. GOVERNMENT MONEY MARKET FUND
| | For the | | For the | |
| | Year Ended | | Year Ended | |
| | April 30, 2009 | | April 30, 2008 | |
Operations | | | | | |
Net investment income | | $ | 5,716,941 | | $ | 20,563,282 | |
Net realized gain on investments | | — | | 25,495 | |
Net increase in net assets resulting from operations | | 5,716,941 | | 20,588,777 | |
| | | | | |
Distributions | | | | | |
Dividends to shareholders from net investment income | | (5,716,941 | ) | (20,563,282 | ) |
Dividends to shareholders from net realized gains | | (24,302 | ) | — | |
Net decrease in net assets from distributions | | (5,741,243 | ) | (20,563,282 | ) |
| | | | | |
Beneficial Interest Transactions(1) | | | | | |
Shares sold | | 923,599,419 | | 1,235,921,967 | |
Dividends reinvested | | 5,597,638 | | 18,936,545 | |
Shares redeemed | | (1,019,536,455 | ) | (1,226,415,885 | ) |
Net increase/(decrease) in net assets derived from beneficial interest transactions | | (90,339,398 | ) | 28,442,627 | |
| | | | | |
Net increase/(decrease) in net assets | | (90,363,700 | ) | 28,468,122 | |
| | | | | |
Net Assets | | | | | |
Beginning of year | | 434,409,422 | | 405,941,300 | |
End of year* | | $ | 344,045,722 | | $ | 434,409,422 | |
* Includes undistributed net investment income of: | | $ | 1,490 | | $ | 1,490 | |
(1) At net asset value of $1.00 per share.
See Notes to Financial Statements.
9
FINANCIAL HIGHLIGHTS
AMERICAN FREEDOM U.S. GOVERNMENT MONEY MARKET FUND(1)
Selected data for a share of beneficial interest outstanding throughout the years indicated:
| | For the Years Ended | |
| | 2009 | | 2008 | | 2007 | | 2006 | | 2005 | |
Net asset value, beginning of year | | $ | 1.00 | | $ | 1.00 | | $ | 1.00 | | $ | 1.00 | | $ | 1.00 | |
| | | | | | | | | | | |
Income from Investment Operations | | | | | | | | | | | |
Net investment income | | 0.01 | | 0.04 | | 0.05 | | 0.04 | | 0.02 | |
Net realized gain | | — | | — | * | — | | — | | — | |
Total from investment operations | | 0.01 | | 0.04 | | 0.05 | | 0.04 | | 0.02 | |
| | | | | | | | | | | |
Distributions | | | | | | | | | | | |
From net investment income | | (0.01 | ) | (0.04 | ) | (0.05 | ) | (0.04 | ) | (0.02 | ) |
From net realized gain | | (0.00 | )* | — | | — | | — | | — | |
Total distributions | | (0.01 | ) | (0.04 | ) | (0.05 | ) | (0.04 | ) | (0.02 | ) |
Net asset value, end of year | | $ | 1.00 | | $ | 1.00 | | $ | 1.00 | | $ | 1.00 | | $ | 1.00 | |
Total return (2) | | 1.28 | % | 4.31 | % | 5.20 | % | 3.77 | % | 1.68 | % |
| | | | | | | | | | | |
Ratios/Supplemental Data | | | | | | | | | | | |
Net assets, end of year (000) | | $ | 344,046 | | $ | 434,409 | | $ | 405,941 | | $ | 214,907 | | $ | 245,040 | |
| | | | | | | | | | | |
Ratio of expenses to average net assets | | 0.22 | % | 0.20 | % | 0.20 | % | 0.20 | % | 0.20 | % |
Ratio of net investment income to average net assets | | 1.30 | % | 4.25 | % | 5.09 | % | 3.69 | % | 1.64 | % |
Ratio of expenses to average net assets without fee waivers | | 0.33 | % | 0.29 | % | 0.30 | % | 0.30 | % | 0.30 | % |
Ratio of net investment income to average net assets without fee waivers | | 1.19 | % | 4.16 | % | 4.99 | % | 3.59 | % | 1.54 | % |
* | Less than $0.005 per share. |
(1) | Prior to November 30, 2006, the American Freedom U.S. Government Money Market Fund, a series of Financial Investors Trust, was known as the Financial Investors Trust U.S. Government Money Market Fund. |
(2) | Total return would have been lower had various fees not been waived during the period. |
See Notes to Financial Statements.
10
NOTES TO FINANCIAL STATEMENTS
1. ORGANIZATION AND SIGNIFICANT ACCOUNTING POLICIES
Financial Investors Trust (the “Trust”) was organized as a Delaware statutory trust on November 30, 1993, and registered as an open-end management investment company under the Investment Company Act of 1940, as amended (“1940 Act”). The American Freedom U.S. Government Money Market Fund (the “Fund”) is one of two separate series offered to the public under the Trust as of April 30, 2009. The Fund has one share class, Class I, which incurs ongoing fees, but is not subject to sales and redemption charges. The Fund’s principal investment objective is to seek as high a level of current income as is consistent with preservation of capital and liquidity.
The following is a summary of significant accounting policies consistently followed by the Fund in the preparation of its financial statements. The policies are in conformity with accounting principles generally accepted in the United States of America.
Investment Valuation: The Fund values securities utilizing the amortized cost method of valuation under Rule 2a-7 of the 1940 Act, pursuant to which the Fund must adhere to certain conditions. Under this method, investments are valued initially at cost and thereafter assume a constant amortization to maturity of any discount or premium.
Fair Value Measurements: The Fund adopted the provisions of Financial Accounting Standards Board Statement of Financial Accounting Standards No. 157 (“FAS 157”), “Fair Value Measurements,” on May 1, 2008. FAS 157 established a three-tier hierarchy to establish classification of fair value measurements for disclosure purposes. Inputs refer broadly to the assumptions that market participants would use in pricing the asset or liability, including assumptions about risk. Inputs may be observable or unobservable. Observable inputs are inputs that reflect the assumptions market participants would use in pricing the asset or liability that are developed based on market data obtained from sources independent of the reporting entity. Unobservable inputs are inputs that reflect the reporting entity’s own assumptions about the assumptions market participants would use in pricing the asset or liability that are developed based on the best information available.
Various inputs are used in determining the value of the Fund’s investments as of the reporting period end. The designated input levels are not necessarily an indication of the risk or liquidity associated with these investments. These inputs are categorized in the following hierarchy under applicable financial accounting standards:
Level 1 – Quoted prices in active markets for identical investments
Level 2 – Other significant observable inputs (including quoted prices for similar investments, interest rates, prepayment speeds, credit risk, etc.)
Level 3 – Significant unobservable inputs (including the Fund’s own assumptions in determining the fair value of investments)
The following is a summary of the inputs used to value the Fund’s investments as of April 30, 2009.
| | Investments in | | Other Financial | |
Valuation Inputs | | Securities | | Instruments (a) | |
Level 1-Quoted Prices | | — | | $ | — | |
Level 2-Other Significant Observable Inputs | | $ | 344,110,628 | | — | |
Level 3-Significant Unobservable Inputs | | — | | — | |
Total | | $ | 344,110,628 | | $ | — | |
(a) Other financial instruments are derivative instruments not reflected in the Statement of Investments, such as written options, short sales, currency contracts, futures, forward contracts and swap contracts.
For the year ended April 30, 2009, the Fund did not have any significant unobservable inputs (Level 3) in determining fair value. Therefore, a reconciliation of assets in which significant unobservable inputs (Level 3) were used in determining fair value is not applicable.
11
NOTES TO FINANCIAL STATEMENTS
At April 30, 2009, 100% of the Fund’s investments were valued using amortized cost, in accordance with rules under the Investment Company Act of 1940. Amortized cost approximates the current fair value of a security, but since the value is not obtained from a quoted price in an active market, securities valued at amortized cost are considered to be valued using Level 2 inputs.
Investment Transactions and Investment Income: Investment transactions are accounted for on the date the investments are purchased or sold (trade date). Realized gains and losses from investment transactions are reported on an identified cost basis, which is the same basis the Fund uses for federal income tax purposes. Interest income, which includes accretion of discounts, is accrued and recorded as earned.
Repurchase Agreements: In some cases, the Fund’s custodian takes possession of the collateral pledged for investments in repurchase agreements, unless it is a tri-party repurchase agreement. The underlying collateral is valued daily on a mark-to-market basis to ensure that value, including accrued interest, is at least equal to the repurchase price. In the event of default on the obligation to repurchase, the Fund has the right to liquidate the collateral and apply the proceeds in satisfaction of the obligation. Under certain circumstances, in the event of default by or bankruptcy of the other party to the agreement, realization and/or retention of the collateral may be subject to legal proceedings.
Use of Estimates: The preparation of financial statements in conformity with accounting principles generally accepted in the United States of America requires management to make estimates and assumptions that affect the reported amounts of assets and liabilities and disclosure of contingent assets and liabilities at the date of the financial statements and the reported amounts of revenues and expenses during the reporting period. Actual results could differ from these estimates.
Expenses: Some expenses of the Trust can be directly attributed to the Fund. Expenses which cannot be directly attributed are apportioned among all funds in the Trust based on average net assets.
Federal Income Taxes: The Fund complies with the requirements under Subchapter M of the Internal Revenue Code applicable to regulated investment companies and intends to distribute substantially all of its net taxable income and net capital gains, if any, each year. The Fund is not subject to income taxes to the extent such distributions are made.
The Fund follows Financial Accounting Standards Board (“FASB”) Interpretation No. 48 (“FIN 48”), “Accounting for Uncertainty in Income Taxes”, that requires the tax effects of certain tax positions to be recognized. These tax positions must meet a “more likely than not” standard that, based on their technical merits, have a more than 50 percent likelihood of being sustained upon examination. As of April 30, 2009, the Fund reviewed the tax positions and determined that FIN 48 resulted in no liability for unrecognized tax benefits and no change to the beginning net asset value of the Fund. The Fund files income tax returns in the U.S. federal jurisdiction and the State of Colorado. The statute of limitations on the Fund’s federal tax return filings remains open for the years ended April 30, 2006 through April 30, 2009. The Fund’s Colorado tax return filings remain open for the years ended April 30, 2005 through April 30, 2009. To our knowledge, there are no federal or Colorado income tax returns currently under examination.
Classification of Distributions to Shareholders: Dividends from net investment income are declared daily and paid monthly. Distributions of accumulated net realized gains, if any, are declared at least once a year. Net investment income (loss) and net realized gain (loss) may differ for financial statement and tax purposes. The character of distributions made during the year from net investment income or net realized gains may differ from its ultimate characterization for federal income tax purposes. Also, due to the timing of dividend distributions, the fiscal year in which amounts are distributed may differ from the fiscal year in which the income or realized gain was recorded by the Fund. The components of distributable earnings on a tax basis will not be known until year end when classifications of distributions are known.
12
NOTES TO FINANCIAL STATEMENTS
The tax character of the distributions paid by the Funds during the years ended April 30, 2009 and April 30, 2008, respectively, were as follows:
| | 2009 | | 2008 | |
Distributions paid from: | | | | | |
Ordinary Income | | $ | 5,716,941 | | $ | 20,563,282 | |
Long-Term Capital Gain | | $ | 24,302 | | $ | — | |
Total | | $ | 5,741,243 | | $ | 20,563,282 | |
As of April 30, 2009, the components of distributable earnings on a tax basis were as follows:
Undistributed ordinary income | | $ | 1,490 | | | |
Total | | $ | 1,490 | | | |
2. INVESTMENT ADVISORY FEES, ADMINISTRATION FEES AND OTHER RELATED PARTY TRANSACTIONS
On September 9, 2008, the Trust’s Board of Trustees renewed and approved the Investment Advisory Agreement between the Trust and SSgA Funds Management, Inc. (“SSgA FM” or the “Adviser”). Pursuant to this advisory agreement, SSgA FM is entitled to an advisory fee at the annual rate of 0.105% of the Fund’s average net assets. SSgA FM has voluntarily agreed to waive 0.035% of their advisory fee until assets for the Fund reach $1 billion.
ALPS Fund Services, Inc. (“ALPS”) serves as the Fund’s administrator. ALPS is entitled to receive a fee from each Fund for its administrative services, computed daily and payable monthly based on the following fee schedule:
Average Net Assets* | | | |
First $500 million | | 0.16 | % |
Next $500 million | | 0.14 | % |
In excess of $1 billion | | 0.12 | % |
* Subject to a minimum monthly fee of $30,000.
ALPS has contractually agreed to waive a portion of its administration fees to the extent necessary for the Fund to maintain a total expense ratio of no more than 0.20% for the period May 1, 2008 to December 8, 2008, and no more than 0.24% for the period December 9, 2008 to April 30, 2009, of its average net assets. The Administration fee includes fund administration, fund accounting, daily pricing, registration, shareholder servicing, transfer agency, fund ratings and audit.
ALPS Distributors, Inc. (an affiliate of ALPS) (“ADI” or the “Distributor”) acts as the distributor of the Fund’s shares pursuant to a Distribution Agreement with the Trust. Shares are sold on a continuous basis by ADI as agent for the Fund, and ADI has agreed to use its best efforts to solicit orders for the sale of Fund shares, although it is not obliged to sell any particular amount of shares. ADI is not entitled to any compensation for its services as Distributor. ADI is registered as a broker-dealer with the Securities and Exchange Commission.
Beneficial Ownership: The beneficial ownership, either directly or indirectly, of more than 25% of the voting securities of a fund creates a presumption of control of the Fund, under Section 2(a)(9) of the 1940 Act. As of April 30, 2009, the Fund had no shareholders of beneficial ownership of 25% or more.
Subsequent Event: On June 9, 2009, the Board of Trustees authorized a new series, the Activa Value Fund, to the Trust. The Activa Value Fund’s registration statement is expected to become effective on August 29, 2009 (this date is subject to change).
13
ADDITIONAL INFORMATION (UNAUDITED)
FUND HOLDINGS
The Fund files its complete schedule of portfolio holdings with the Securities Exchange Commission (“SEC”) for the first and third quarters of each fiscal year on Form N-Q within 60 days after the end of the period. Copies of the Fund’s Forms N-Q are available without charge, upon request, by contacting the Fund at 1-800-862-3040 and on the SEC’s website at http:// www.sec.gov. You may also review and copy Form N-Q at the SEC’s Public Reference Room in Washington, D.C. For more information about the operation of the Public Reference Room, please call the SEC at 1-800-SEC-0330.
FUND PROXY VOTING POLICIES & PROCEDURES
Fund policies and procedures used in determining how to vote proxies and information regarding how the Fund voted proxies relating to portfolio securities during the most recent 12-month period ending June 30 are available without a charge, upon request, by contacting the Fund at 1-800-862-3040 and on the SEC’s website at http://www.sec.gov.
14
TRUSTEES AND OFFICERS (UNAUDITED)
As of April 30, 2009, the Fund represented one of two separate series offered to the public under the Trust. The Trust’s Board of Trustees oversees the overall management of each series of the Trust and elects the officers of the Trust. You can find more information about the Trustees in the Statement of Additional Information (SAI) which is available without charge by calling 1-800-862-3040. The principal occupations for the past five years of the Trustees and executive officers of the Trust are listed below.
INDEPENDENT TRUSTEES
| | | | | | | | Funds in | | |
| | | | | | | | Fund | | |
Name, | | Position(s) | | Term of Office and | | | | Complex | | Other |
Address* | | Held with | | Length of Time | | Principal Occupation(s) | | Overseen by | | Directorships |
& Age | | Funds | | Served | | During Past 5 Years** | | Trustee*** | | Held by Trustee |
| | | | | | | | | | |
Mary K. Anstine,
age 68 | | Trustee | | Ms. Anstine was elected at a special meeting of shareholders held on March 21, 1997 | | Ms. Anstine was President/ Chief Executive Officer of HealthONE Alliance, Denver, Colorado, and former Executive Vice President of First Interstate Bank of Denver. Ms. Anstine is also Trustee/Director of the AV Hunter Trust and Colorado Uplift Board. Ms. Anstine was formerly a Director of the Trust Bank of Colorado (later purchased and now known as Northern Trust Bank) and HealthONE, and a member of the American Bankers Association Trust Executive Committee. | | 2 | | Ms. Anstine is a Trustee of ALPS ETF Trust (1 fund); Financial Investors Variable Insurance Trust (5 funds); ALPS Variable Insurance Trust (1 fund); Reaves Utility Income Fund; and Westcore Trust (12 funds). |
| | | | | | | | | | |
John R. Moran, Jr.,
age 78 | | Trustee and Interim Chairman | | Mr. Moran was elected at a special meeting of shareholders held on March 21, 1997. | | Mr. Moran is formerly President and CEO of The Colorado Trust, a private foundation promoting health initiatives in the state of Colorado. An attorney, Mr. Moran was formerly a partner with the firm of Kutak Rock & Campbell in Denver, Colorado and a member of the Colorado House of Representatives. Currently, Mr. Moran is a member of the Treasurer’s Investment Advisory Committee for the University of Colorado. | | 2 | | None. |
15
| | | | | | | | Funds in | | |
| | | | | | | | Fund | | |
Name, | | Position(s) | | Term of Office and | | | | Complex | | Other |
Address* | | Held with | | Length of Time | | Principal Occupation(s) | | Overseen by | | Directorships |
& Age | | Funds | | Served | | During Past 5 Years** | | Trustee*** | | Held by Trustee |
| | | | | | | | | | |
Jeremy W. Deems,
age 32 | | Trustee | | Mr. Deems was appointed as a Trustee at the March 11, 2008 meeting of the Board of Trustees. | | Mr. Deems is the Co-President and Chief Financial Officer of Green Alpha Advisors, LLC. Prior to joining Green Alpha Advisors, Mr. Deems was CFO and Treasurer of Forward Management, LLC, ReFlow Management Co., LLC, ReFlow Fund, LLC, a private investment fund, and Sutton Place Management, LLC, an administrative services company, from 2004 to June 2007. Prior to this, Mr. Deems served as Controller of Forward Management, LLC, ReFlow Management Co., LLC, ReFlow Fund, LLC and Sutton Place Management, LLC. | | 2 | | Mr. Deems is a Trustee of ALPS ETF Trust (1 fund); ALPS Variable Insurance Trust (1 fund); and Reaves Utility Income Fund. |
* All communications to Trustees and Officers may be directed to Financial Investors Trust c/o 1290 Broadway, Suite 1100, Denver, CO 80203.
** Except as otherwise indicated, each individual has held the office shown or other offices in the same company for the last five years.
*** The Fund Complex includes all series of the Trust and any other investment companies for which SSgA FM (or any affiliate) provides investment advisory services.
16
OFFICERS
Name, | | | | | | |
Address* | | Position(s) Held | | | | |
& Age | | with Funds | | Term of Office | | Principal Occupation(s) During Past 5 Years** |
| | | | | | |
Edmund J. Burke,
age 47 | | President | | Mr. Burke was elected President of the Trust at the December 17, 2002 meeting of the Board of Trustees. | | Mr. Burke is Chief Executive Officer and a Director of ALPS Holdings, Inc. (“AHI”) (since 2005) and Director of ALPS Advisors, Inc. (“AAI”), ADI, ALPS, ALPS Holdings, Inc. and FTAM Distributors, Inc. (“FDI”). Mr. Burke and was President of AAI, ADI, ALPS and FDI (2001-2008). Because of his positions with ALPS, Mr. Burke is deemed an affiliate of the Trust as defined under the 1940 Act. Mr. Burke is President of the Reaves Utility Income Fund (since 2004); President of the Financial Investors Variable Insurance Trust (since 2006); Trustee and President of the Clough Global Allocation Fund (Trustee since 2006; President since 2004); Trustee and President of the Clough Global Equity Fund (Trustee since 2006; President since 2005); Trustee and President of the Clough Global Opportunities Fund (since 2006); Trustee of the Liberty All-Star Equity Fund; and Director of the Liberty All-Star Growth Fund, Inc. |
| | | | | | |
Jeremy O. May,
age 39 | | Treasurer | | Mr. May was elected Treasurer of the Trust at the October 7, 1997 meeting of the Board of Trustees. | | Mr. May joined ALPS in 1995 and is currently President and Director of ALPS and Director of AAI, ADI, ALPS Holdings, Inc. and FDI. Because of his positions with ALPS, Mr. May is deemed an affiliate of the Trust as defined under the 1940 Act. Mr. May is also the Treasurer of the Liberty All-Star Equity Fund, Liberty All-Star Growth Fund, Inc., Clough Global Allocation Fund, Clough Global Equity Fund, Clough Global Opportunities Fund, Financial Investors Variable Insurance Trust and Reaves Utility Income Fund. Mr. May is also President, Chairman and Trustee of the ALPS Variable Insurance Trust and Chairman and Trustee of the Reaves Utility Income Fund. Mr. May is currently on the Board of Directors and is Chairman of the Audit Committee of the University of Colorado Foundation. |
* All communications to Trustees and Officers may be directed to Financial Investors Trust c/o 1290 Broadway, Suite 1100, Denver, CO 80203.
** Except as otherwise indicated, each individual has held the office shown or other offices in the same company for the last five years.
*** The Fund Complex includes all series of the Trust and any other investment companies for which SSgA FM (or any affiliate) provides investment advisory services.
17
Name, | | | | | | |
Address* | | Position(s) Held | | | | |
& Age | | with Funds | | Term of Office | | Principal Occupation(s) During Past 5 Years** |
| | | | | | |
JoEllen L. Legg,
age 47 | | Secretary | | Ms. Legg was elected Secretary of the Trust at the November 13, 2007 meeting of the Board of Trustees. | | Ms. Legg joined ALPS as Associate Counsel in October 2007. Prior to joining ALPS, Ms. Legg served as Senior Counsel - Law (Corporate & Securities) for Adelphia Communications Corporation from February 2005 to March 2007. Prior to this, Ms. Legg held associate positions at Fried Frank Harris Shriver & Jacobson LLP (1998 - 2004) and at Patton Boggs LLP (2004 - 2005). Because of her position with ALPS, Ms. Legg is deemed an affiliate of the Trust as defined under the 1940 Act. Ms. Legg is also the Secretary of the Westcore Trust and Assistant Secretary of the Stone Harbor Investment Funds and the WesMark Funds. |
| | | | | | |
Michael Akins,
age 32 | | Chief
Compliance
Officer (“CCO”) | | Mr. Akins was appointed CCO of the Trust at the June 13, 2006 meeting of the Board of Trustees. | | Mr. Akins joined ALPS as Deputy Compliance Officer in April 2006. Prior to joining ALPS, Mr. Akins served as Compliance Officer and AVP for UMB Financial Corporation. Before joining UMB, Mr. Akins served as an account manager for State Street Corporation. Because of his affiliation with ALPS and ADI, Mr. Akins is deemed an affiliate of the Trust as defined under the 1940 Act. Mr. Akins is currently the CCO of ALPS Variable Insurance Trust, Financial Investors Variable Insurance Trust, Reaves Utility Income Fund, Clough Global Allocation Fund, Clough Global Opportunities Fund, the Clough Global Equity Fund, and the ALPS ETF Trust. |
| | | | | | |
Kimberly R. Storms, age 37 | | Assistant
Treasurer | | Kim Storms was elected Assistant Treasurer of the Trust at the June 14, 2005 meeting of the Board of Trustees. | | Ms. Storms is Vice President - Director of Fund Administration of ALPS. Ms. Storms joined ALPS in 1998 as Assistant Controller. Because of her position with ALPS, Ms. Storms is deemed an affiliate of the Trust as defined under the 1940 Act. Ms. Storms is also Treasurer of ALPS ETF Trust and ALPS Variable Insurance Trust; Assistant Treasurer of Liberty All-Star Equity Fund and Liberty All-Star Growth Fund, Inc.; and Assistant Secretary of Ameristock Mutual Fund, Inc. |
* All communications to Trustees and Officers may be directed to Financial Investors Trust c/o 1290 Broadway, Suite 1100, Denver, CO 80203.
** Except as otherwise indicated, each individual has held the office shown or other offices in the same company for the last five years.
18
INVESTMENT ADVISER | INDEPENDENT REGISTERED |
SSgA Funds Management, Inc. | PUBLIC ACCOUNTING FIRM |
1 Lincoln Street | Deloitte & Touche LLP |
Boston, Massachusetts 02110 | 555 Seventeenth Street |
| Suite 3600 |
ADMINISTRATOR, TRANSFER | Denver, Colorado 80202 |
AGENT & FUND ACCOUNTANT | |
ALPS Fund Services, Inc. | CUSTODIAN |
1290 Broadway | State Street Bank & Trust Company |
Suite 1100 | 750 Main Street |
Denver, Colorado 80203 | Suite 1114 |
| Hartford, Connecticut 06103 |
DISTRIBUTOR | |
ALPS Distributors, Inc. | SUB-CUSTODIAN |
1290 Broadway | State Street Bank & Trust Company |
Suite 1100 | 1776 Heritage Drive |
Denver, Colorado 80203 | North Quincy, Massachusetts 02171 |
| |
LEGAL COUNSEL | Must be accompanied or preceded by |
Davis Graham & Stubbs LLP | a current prospectus. |
1550 Seventeenth Street | |
Suite 500 | For more information, please |
Denver, Colorado 80202 | call 1.800.862.3040 or visit |
| www.fitfunds.com |

| | An investment in the Fund is not insured or guaranteed by the Federal Deposit Insurance Corporation or any other government agency. Although the Fund seeks to preserve the value of your investment at $1.00 per share, it is possible to lose money by investing in the Fund. FIT000266 12/31/2009 |

TABLE OF CONTENTS
| Page |
| |
Shareholder Letter | 2 |
| |
Performance History | 5 |
| |
Disclosure of Fund Expenses | 7 |
| |
Report of Independent Registered Public Accounting Firm | 9 |
| |
Statement of Investments | 10 |
| |
Statement of Assets and Liabilities | 13 |
| |
Statement of Operations | 15 |
| |
Statements of Changes in Net Assets | 16 |
| |
Financial Highlights | 17 |
| |
Class A | 17 |
| |
Class I | 18 |
| |
Class R | 19 |
| |
Notes to Financial Statements | 20 |
| |
Additional Information | 29 |
| |
Trustees and Officers | 30 |
www.alpsfunds.com
1
SHAREHOLDER LETTER (UNAUDITED)
The Fund and Red Rocks Capital experienced a challenging year ending April 30, 2009 as global markets experienced their harshest conditions in 70 years. Almost every major index/asset class was impacted as a trend of asset devaluation gripped the world. Private equity was not immune to this phenomenon.
Over the last two quarters we have experienced write downs by the managers/General Partners of private equity funds. These write-downs were not wholly unexpected as the publicly traded side of private equity, listed private equity, along with the secondary market for existing private equity partnership interests, had already experienced discounts to stated General Partner valuations of 40%-80% on average.
The current stock price of the listed private equity companies likely reflects the uncertainty existing in the worldwide capital markets and the ongoing broad economic recession. We believe, however, the market has assigned too large of a discount to the value of these companies’ portfolio holdings. Without considering any market appreciation or additions to the portfolio, we are confident that the underlying holdings of listed private equity companies have more value than what is reflected in today’s stock prices.
The Listed Private Equity Strategy
For the year ended April 30, 2009, the Red Rocks Listed Private Equity Fund returned (61.79)%, underperforming its primary benchmark, the S&P Listed Private Equity Index(a) and outperforming its secondary benchmark, the LPX50® Index(b), which returned (60.16)% and (64.66)%, respectively.
We remain focused on companies with the following financial attributes as we position the strategy in 2009:
· Companies that have lower debt levels
· Companies that can take advantage of the dislocated environment
· Companies that can access capital for new investments
· Companies that can gain liquidity in existing investments
During the year, we made few changes to our holdings. The portfolio remains well-diversified in terms of industry and geography, with our largest positions in North America, UK and Europe. We continue to maintain our largest concentration of holdings outside the U.S.
Past performance does not guarantee future results.
Listed Private Equity Fund Annual Report | April 30, 2009
2

**Provided by Red Rocks Capital LLC, Reflects the percentages of the underlying investments of the listed private equity companies owned by the Fund as of 4/30/09.
During the recent quarter ended March 31, 2009, two companies in particular had a negative impact on the Listed Private Equity strategy’s performance; Candover Investments PLC, a UK based buyout firm, and Conversus Capital L.P., a US based multi strategy/multi stage private equity fund of funds. Candover’s weak performance, down ~90% for the quarter, was due to the firm’s extensive write-offs/write-downs of previous buyout investments (Ferritti and Gala Coral), their inability to defend those investments with future capital, and the concern that they would be unable to meet future funding commitments to their upcoming fund. In the case of Conversus, down over 40% for the quarter, the concern rests with the company’s ability to invest in new funds going forward given their net debt position along with the valuation of existing funds.
3
Two companies that did relatively well during the recent quarter ended March 31, 2009, are GIMV N.V., a Belgium based private equity firm, and KTB Securities, a South Korean based venture capital firm. Both companies are viewed as being in a strong position within their respective geographic markets from both a capital (net cash to invest) and competitive perspective.
Looking Ahead
We expect the remainder of this year to remain challenging, but one that should provide outstanding investment opportunities. For those listed private equity firms that have a solid balance sheet, and whose portfolio companies are not over-levered, 2009 should be a year to rationalize their own set of businesses by positioning them for growth when the global recession ends. For those listed private equity firms that have excess capital/uncommitted cash to put to work, 2009 may be a buyer’s dream. Private equity firms haven’t witnessed valuations that are this low on public companies in decades. We expect a number of “going private” transactions to take place in 2009. Valuations on private companies, while having come down quite a bit, still haven’t reached a level where a large number of private equity transactions are taking place, but that is expected to change over the course of 2009 as sellers adjust their asking prices downward.
While the last six months have been a very difficult market environment we continue to believe that the private equity asset class has very strong long term capital appreciation potential. While the private equity model may have changed from 2006/2007 (levered buyouts coupled with ever increasing EBITDA – which measures the extent to which cash operating expenses use up revenue – expectations of portfolio companies’ prospects in the future), the model is not broken. Private equity is highly adaptable. Return expectations will moderate.
We appreciate your continued support and interest in the Listed Private Equity Fund.
Adam Goldman, Co-Portfolio Manager
Mark Sunderhuse, Co-Portfolio Manager
(a) S&P Listed Private Equity Index: The S&P Listed Private Equity Index is comprised of 30 leading listed private equity companies that meet size, liquidity, exposure and activity requirements. The index is designed to provide tradable exposure to the leading publicly listed companies in the private equity space. The index figures do not reflect any deduction for fees, expenses or taxes.
(b) LPX50® Index: The LPX50® Index is a global index that measures the performance of 50 Listed Private Equity (“LPE”) companies. Due to its high degree of diversification across regions and LPE investment styles the LPX50® has become a widely used benchmark for the LPE asset class.
4
PERFORMANCE HISTORY
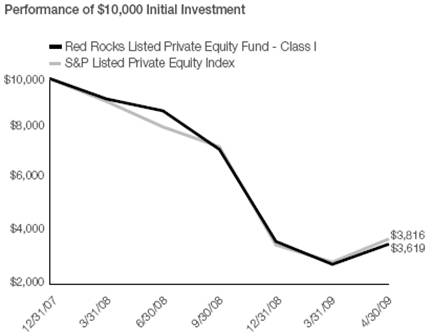
The chart above represents historical performance of a hypothetical investment of $10,000 in the Fund over the life of the Fund. Past performance does not guarantee future results. This chart does not reflect the deduction of taxes that a shareholder would pay on Fund distributions or the redemption of Fund shares.
Average Total Return For the Period Ended April 30, 2009
| | One Year | | Since Inception | | Inception Date | |
Class A | | (62.01 | )% | (53.60 | )% | 12/31/07 | |
Class I | | (61.79 | )% | (53.39 | )% | 12/31/07 | |
Class R | | (62.10 | )% | (53.71 | )% | 12/31/07 | |
S&P Listed Private Equity Index(a) | | (59.39 | )% | (51.44 | )% | | |
The performance data quoted represents past performance and does not guarantee future results. Current performance may be lower or higher than the performance quoted. To obtain current performance as of the most recent month-end, please visit us online at www.lpefund.com. Average annual total returns and yield figures reflect the reinvestment of dividends and capital gains distributions and include all fee waivers and expense reimbursements. Without the fee waivers and expense reimbursements, total return and yield figures would have been lower.
The performance data quoted does not reflect the deduction of the 2% redemption fee imposed on class A, I & R shares, redeemed or exchanged
5
within three months of purchase or the deduction of taxes that a shareholder would pay on Fund distributions or the redemption of Fund shares. If imposed, the redemption fee would reduce the performance quoted. The performance data quoted does not reflect an initial sales charge (load) on class A shares of up to 5.50% for purchases up to $1 million, subject to breakpoint discounts, and a CDSC charge of 1.00% for shares redeemed within the first 12 months after a purchase in excess of $1 million. Total return and yield figures represent past performance. Investment return and principal value will vary, and shares, when redeemed, may be worth more or less than their original cost.
(a) S&P Listed Private Equity Index: The S&P Listed Private Equity Index is comprised of 30 leading listed private equity companies that meet size, liquidity, exposure and activity requirements. The index is designed to provide tradable exposure to the leading publicly listed companies in the private equity space. The index figures do not reflect any deduction for fees, expenses or taxes. It is not possible to invest directly in an index.
The Fund’s Advisor and Administrator have contractually agreed to waive a portion of the investment advisory and/or administration fees and/or to reimburse other expenses until August 31, 2009. Without fee waivers and expense reimbursements, total return and yield figures would have been lower.
6
DISCLOSURE OF FUND EXPENSES (UNAUDITED)
As a shareholder of Listed Private Equity Fund (the “Fund”), you will incur two types of costs: (1) transaction costs, including applicable sales charges (loads) and redemption fees; and (2) ongoing costs, including management fees, distribution and service (12b-1) fees, shareholder service fees and other Fund expenses. The following examples are intended to help you understand your ongoing costs (in dollars) of investing in the Fund and to compare these costs with the ongoing costs of investing in other mutual funds. The examples are based on an investment of $1,000 invested on November 1, 2008 and held until April 30, 2009.
Actual Expenses. The first line of the table on the next page provides information about actual account values and actual expenses. You may use the information in this line, together with the amount you invested, to estimate the expenses that you paid over the period. Simply divide your account value by $1,000 (for example, an $8,600 account value divided by $1,000 = 8.6), then multiply the result by the number in the first line under the heading “Expenses Paid During Period” to estimate the expenses you paid on your account during this period.
Hypothetical Example for Comparison Purposes. The second line of the table on the next page provides information about hypothetical account values and hypothetical expenses based on the Fund’s actual expense ratio and an assumed rate of return of 5% per year before expenses, which is not the Fund’s actual return. The hypothetical account values and expenses may not be used to estimate the actual ending account balance or expenses you paid for the period. You may use this information to compare the ongoing costs of investing in the Fund and other mutual funds. To do so, compare this 5% hypothetical example with the 5% hypothetical examples that appear in the shareholder reports of the other funds.
The expenses shown in the table are meant to highlight ongoing Fund costs only and do not reflect transaction fees, such as sales charges, redemption fees, or exchange fees. Therefore, the second line of the table on the next page is useful in comparing ongoing costs only, and may not help you determine the relative total costs of owning different funds. In addition, if these transactional costs were included, your costs would have been higher.
7
| | Beginning | | Ending | | | | | |
| | Account | | Account | | | | Expenses Paid | |
| | Value | | Value | | Expense | | During Period(a) | |
| | 11/01/08 | | 04/30/09 | | Ratio | | 11/01/08-04/30/09 | |
Class A | | | | | | | | | |
Actual | | $ | 1,000.00 | | $ | 749.40 | | 1.25 | % | $ | 5.42 | |
Hypothetical | | $ | 1,000.00 | | $ | 1,018.60 | | 1.25 | % | $ | 6.26 | |
Class I | | | | | | | | | |
Actual | | $ | 1,000.00 | | $ | 750.70 | | 1.00 | % | $ | 4.34 | |
Hypothetical | | $ | 1,000.00 | | $ | 1,019.83 | | 1.00 | % | $ | 5.01 | |
Class R | | | | | | | | | |
Actual | | $ | 1,000.00 | | $ | 748.50 | | 1.50 | % | $ | 6.50 | |
Hypothetical | | $ | 1,000.00 | | $ | 1,017.36 | | 1.50 | % | $ | 7.49 | |
(a) Expenses are equal to the Fund’s annualized expense ratio multiplied by the average account value over the period, multiplied by the number of days in the most recent fiscal half year (181), then divided by 365.
8
REPORT OF INDEPENDENT REGISTERED PUBLIC ACCOUNTING FIRM
To the Shareholders and Board of Trustees of Financial Investors Trust:
We have audited the accompanying statement of assets and liabilities of Listed Private Equity Fund, one of the portfolios of Financial Investors Trust (the “Trust”), including the statement of investments, as of April 30, 2009, and the related statement of operations for the year then ended, the statements of changes in net assets for the year then ended and the period from December 31, 2007 (commencement of operations) to April 30, 2008, and the financial highlights for the year ended April 30, 2009 and for the period from December 31, 2007 to April 30, 2008. These financial statements and financial highlights are the responsibility of the Trust’s management. Our responsibility is to express an opinion on these financial statements and financial highlights based on our audits.
We conducted our audits in accordance with the standards of the Public Company Accounting Oversight Board (United States). Those standards require that we plan and perform the audit to obtain reasonable assurance about whether the financial statements and financial highlights are free of material misstatement. The Trust is not required to have, nor were we engaged to perform, an audit of its internal control over financial reporting. Our audits included consideration of internal control over financial reporting as a basis for designing audit procedures that are appropriate in the circumstances, but not for the purpose of expressing an opinion on the effectiveness of the Trust’s internal control over financial reporting. Accordingly, we express no such opinion. An audit also includes examining, on a test basis, evidence supporting the amounts and disclosures in the financial statements, assessing the accounting principles used and significant estimates made by management, as well as evaluating the overall financial statement presentation. Our procedures included confirmation of securities owned as of April 30, 2009, by correspondence with the custodian and brokers. We believe that our audits provide a reasonable basis for our opinion.
In our opinion, the financial statements and financial highlights referred to above present fairly, in all material respects, the financial position of Listed Private Equity Fund of Financial Investors Trust as of April 30, 2009, the results of its operations for the year then ended, the changes in its net assets for the year then ended and the period from December 31, 2007 to April 30, 2008, and the financial highlights for the year ended April 30, 2009 and for the period from December 31, 2007 to April 30, 2008, in conformity with accounting principles generally accepted in the United States of America.

Denver, Colorado
June 22, 2009
9
STATEMENT OF INVESTMENTS
April 30, 2009
| | | | Market Value | |
| | Shares | | (Note 1) | |
COMMON STOCKS (98.62%) | | | | | |
DIVERSIFIED (10.25%) | | | | | |
Diversified Operations (2.34%) | | | | | |
Wendel Investissement (a) | | 25,700 | | $ | 953,634 | |
| | | | | |
Holding Companies-Diversified (7.91%) | | | | | |
Ackermans & van Haaren N.V. (a) | | 8,500 | | 499,676 | |
HAL Trust (a) | | 17,300 | | 1,254,353 | |
Leucadia National Corp. (a) | | 69,500 | | 1,475,485 | |
| | | | 3,229,514 | |
| | | | | |
TOTAL DIVERSIFIED | | | | 4,183,148 | |
| | | | | |
FINANCIAL (86.37%) | | | | | |
Banks (1.21%) | | | | | |
SVB Financial Group (a) | | 23,700 | | 492,012 | |
| | | | | |
Closed-End Funds (17.49%) | | | | | |
AP Alternative Assets LP (a) | | 316,717 | | 538,419 | |
Candover Investments PLC | | 114,670 | | 609,423 | |
Continental Venture Capital, Ltd. | | 1,103,942 | | 449,282 | |
Electra Private Equity PLC (a) | | 89,108 | | 1,041,397 | |
Graphite Enterprise Trust PLC (a) | | 354,000 | | 1,421,823 | |
HgCapital Trust PLC | | 134,867 | | 1,606,107 | |
Partners Group Global Opportunities, Ltd. (a) | | 235,421 | | 759,247 | |
Private Equity Investor PLC | | 113,000 | | 191,406 | |
SVG Capital PLC (a) | | 321,750 | | 520,011 | |
| | | | 7,137,115 | |
Diversified Financial Services (17.75%) | | | | | |
Brait SA | | 537,300 | | 761,453 | |
Conversus Capital LP (a) | | 305,000 | | 2,028,249 | |
GP Investments, Ltd. (a) | | 428,500 | | 1,448,594 | |
Intermediate Capital Group PLC | | 54,000 | | 389,241 | |
KTB Securities Co., Ltd. (a) | | 231,000 | | 941,645 | |
Onex Corp. | | 103,550 | | 1,671,309 | |
| | | | 7,240,491 | |
Investment Companies (29.64%) | | | | | |
American Capital Strategies, Ltd. | | 190,836 | | 589,683 | |
BlackRock Kelso Capital Corp. | | 80,905 | | 471,676 | |
Capital Southwest Corp. | | 11,880 | | 923,789 | |
| | | | | | |
10
| | | | Market Value | |
| | Shares | | (Note 1) | |
Investment Companies (continued) | | | | | |
CapMan OYJ, B Shares (a) | | 412,751 | | $ | 518,806 | |
China Merchants China Direct Investments, Ltd. (a) | | 721,600 | | 928,297 | |
DeA Capital SpA (a) | | 471,153 | | 797,930 | |
Eurazeo (a) | | 29,212 | | 1,204,927 | |
KKR Private Equity Investors LP (a) | | 478,500 | | 1,626,900 | |
Macquarie International Infrastructure Fund, Ltd. | | 5,661,100 | | 1,300,084 | |
MVC Capital, Inc. | | 79,800 | | 683,088 | |
NGP Capital Resources Co. | | 96,425 | | 676,904 | |
Prospect Capital Corp. | | 75,825 | | 687,733 | |
Ratos AB, B Shares | | 97,000 | | 1,682,112 | |
| | | | 12,091,929 | |
REITS (1.20%) | | | | | |
CapitalSource, Inc. | | 158,225 | | 488,915 | |
| | | | | |
Venture Capital (19.08%) | | | | | |
3i Group PLC | | 279,551 | | 1,327,513 | |
3i Infrastructure PLC | | 1,160,083 | | 1,596,043 | |
Altamir Amboise (a) | | 240,000 | | 854,194 | |
Deutsche Beteiligungs AG | | 80,975 | | 1,076,738 | |
Dinamia Capital Privado S.C.R., SA (a) | | 62,500 | | 740,937 | |
GIMV N.V. (a) | | 37,200 | | 1,870,336 | |
IP Group PLC (a) | | 471,200 | | 320,653 | |
| | | | 7,786,414 | |
| | | | | |
TOTAL FINANCIAL | | | | 35,236,876 | |
| | | | | |
UTILITIES (2.00%) | | | | | |
Electric (2.00%) | | | | | |
Babcock & Brown Infrastructure Group | | 10,670,000 | | 814,214 | |
| | | | | |
TOTAL UTILITIES | | | | 814,214 | |
| | | | | |
TOTAL COMMON STOCKS
(Cost $58,475,234) | | | | 40,234,238 | |
| | | | | | |
11
| | | | Market Value | |
7-Day Yield | | Shares | | (Note 1) | |
SHORT TERM INVESTMENTS (1.37%) | | | | | |
MONEY MARKET FUND (1.37%) | | | | | |
Dreyfus Treasury Prime | | | | | |
Cash Management Fund (b) 0.000% (c) | | 558,429 | | $ | 558,429 | |
| | | | | |
TOTAL MONEY MARKET FUND | | | | 558,429 | |
| | | | | |
TOTAL SHORT TERM INVESTMENTS
(Cost $558,429) | | | | 558,429 | |
| | | | | |
TOTAL INVESTMENTS (99.99%)
(Cost $59,033,663) | | | | $ | 40,792,667 | |
| | | | | |
Other Assets In Excess Of Liabilities (0.01%) | | | | 5,307 | |
| | | | | |
NET ASSETS (100.00%) | | | | $ | 40,797,974 | |
Common Abbreviations:
AB - Aktiebolag is the Swedish equivalent of the term corporation.
AG - Aktiengesellschaft is a German term that refers to a corporation that is limited by shares, i.e., owned by shareholders.
Corp. - Corporation
Inc. - Incorporated
LP - Limited Partnership
Ltd. - Limited
N.V. - Naamloze Vennootchap is the Dutch term for a public limited liability corporation.
OYJ - Public Limited Company
PLC - Public Limited Company
REIT - Real Estate Investment Trust
SA - Generally designates corporations in various countries, mostly those employing the civil law.
SpA - Società Per Azioni is an Italian shared company.
(a) Non-Income Producing Security.
(b) Investments in other funds are calculated at their respective net asset values as determined by those funds, in accordance with the Investment Company Act of 1940.
(c) Less than 0.0005% .
For Fund compliance purposes, the Fund’s industry classifications refer to any one or more of the industry sub-classifications used by one or more widely recognized market indexes or ratings group indexes, and/or as defined by Fund management. This definition may not apply for purposes of this report, which may combine industry sub-classifications for reporting ease. Industries are shown as a percent of net assets. These industry classifications are based on third party definitions and are unaudited. The definitions are industry terms and do not reflect the legal status of any of the investments or the companies in which the Fund has invested.
See Notes to Financial Statements.
12
STATEMENT OF ASSETS AND LIABILITIES
April 30, 2009
ASSETS: | | | |
Investments, at value | | $ | 40,792,667 | |
Cash | | 261 | |
Foreign currency, at value (Cost $17,652) | | 17,910 | |
Receivable for shares sold | | 24,036 | |
Interest and dividends receivable | | 54,365 | |
Other assets | | 30,042 | |
Total Assets | | 40,919,281 | |
| | | |
LIABILITIES: | | | |
Payable for investments purchased | | 39,098 | |
Payable for shares redeemed | | 10,597 | |
Payable to advisor | | 9,274 | |
Payable for audit fees | | 25,000 | |
Payable to custodian | | 8,278 | |
Payable for transfer agent fees | | 7,035 | |
Payable for legal fees | | 5,399 | |
Payable for distribution and services fees | | 5,173 | |
Payable for printing fees | | 4,194 | |
Payable for administration fee | | 2,401 | |
Payable to trustees | | 921 | |
Accrued expenses and other liabilities | | 3,937 | |
Total Liabilities | | 121,307 | |
TOTAL NET ASSETS | | $ | 40,797,974 | |
| | | |
NET ASSETS CONSIST OF: | | | |
Paid-in capital | | $ | 75,630,402 | |
Undistributed net investment income | | 1,113,077 | |
Accumulated net realized loss on investments and foreign currency transactions | | (17,705,950 | ) |
Net unrealized depreciation on investments and translation of assets and liabilities in foreign currencies | | (18,239,555 | ) |
TOTAL NET ASSETS | | $ | 40,797,974 | |
| | | |
INVESTMENTS, AT COST | | $ | 59,033,663 | |
See Notes to Financial Statements.
13
PRICING OF SHARES: | | | |
| | | |
Class A: | | | |
Net Asset Value, offering and redemption price per share | | $ | 3.56 | |
Net Assets | | $ | 27,860,004 | |
Shares of beneficial interest outstanding (unlimited number of shares, no par value common stock authorized) | | 7,817,202 | |
Maximum offering price per share
(NAV/0.945, based on maximum sales charge of 5.50% of the offering price) | | $ | 3.77 | |
| | | |
Class I: | | | |
Net Asset Value, offering and redemption price per share | | $ | 3.57 | |
Net Assets | | $ | 12,937,612 | |
Shares of beneficial interest outstanding (unlimited number of shares, no par value common stock authorized) | | 3,621,436 | |
| | | |
Class R: | | | |
Net Asset Value, offering and redemption price per share | | $ | 3.31 | |
Net Assets | | $ | 358 | |
Shares of beneficial interest outstanding (unlimited number of shares, no par value common stock authorized) | | 108 | |
See Notes to Financial Statements.
14
STATEMENT OF OPERATIONS | | | |
For the Year Ended April 30, 2009 | | | |
INVESTMENT INCOME: | | | |
Interest | | $ | 16,795 | |
Dividends | | 880,165 | |
Other Income | | 2,853 | |
Foreign taxes withheld | | (25,357 | ) |
Total Investment Income | | 874,456 | |
| | | |
EXPENSES: | | | |
Investment advisory fee | | 220,515 | |
Administrative fee | | 20,754 | |
Custodian fee | | 49,594 | |
Legal and audit fee | | 50,219 | |
Transfer agent fee | | 39,128 | |
Trustees’ fees and expenses | | 3,063 | |
Report to shareholder and printing fees | | 8,753 | |
Distribution and service fees | | | |
12b-1 Class A | | 43,341 | |
12b-1 Class R | | 2 | |
Registration fee | | 40,423 | |
Offering costs | | 54,200 | |
Other | | 7,506 | |
Total expenses before waiver | | 537,498 | |
Less fees waived/reimbursed by investment advisor | | | |
Class A | | (144,634 | ) |
Class I | | (90,063 | ) |
Class R | | (27 | ) |
Total net expenses | | 302,774 | |
NET INVESTMENT INCOME: | | 571,682 | |
| | | |
Net realized loss on investments | | (14,443,113 | ) |
Net realized loss on foreign currency transactions | | (2,306,547 | ) |
Net change in unrealized depreciation on investments | | (18,213,050 | ) |
Net change in unrealized appreciation on translation of assets and liabilities in foreign currencies | | 1,468 | |
NET REALIZED AND UNREALIZED LOSS ON INVESTMENTS | | (34,961,242 | ) |
NET DECREASE IN NET ASSETS RESULTING FROM OPERATIONS | | $ | (34,389,560 | ) |
See Notes to Financial Statements.
15
STATEMENTS OF CHANGES IN NET ASSETS
| | Year Ended | | Period Ended | |
| | April 30, 2009 | | April 30, 2008(a) | |
OPERATIONS: | | | | | |
Net investment income | | $ | 571,682 | | $ | 9,646 | |
Net realized gain/(loss) on investments | | (14,443,113 | ) | 2,662 | |
Net realized loss on foreign currency transactions | | (2,306,547 | ) | (251 | ) |
Net change in unrealized depreciation on investments and foreign currency | | (18,211,582 | ) | (27,973 | ) |
Net decrease in net assets resulting from operations | | (34,389,560 | ) | (15,916 | ) |
| | | | | |
DISTRIBUTIONS TO SHAREHOLDERS: | | | | | |
From net investment income | | | | | |
Class A | | (271,455 | ) | — | |
Class I | | (151,725 | ) | — | |
Class R | | (26 | ) | — | |
From net realized gains on investments | | | | | |
Class A | | (3,447 | ) | — | |
Class I | | (1,488 | ) | — | |
Total distributions | | (428,141 | ) | — | |
| | | | | |
SHARE TRANSACTIONS: (Note 2) | | | | | |
Class A | | | | | |
Proceeds from sale of shares | | 56,557,393 | | 848,083 | |
Issued to shareholders in reinvestment of distributions | | 268,647 | | — | |
Cost of shares redeemed | | (6,347,401 | ) | — | |
Net increase from share transactions | | 50,478,639 | | 848,083 | |
| | | | | |
Class I | | | | | |
Proceeds from sale of shares | | 29,215,601 | | 20,964 | |
Issued to shareholders in reinvestment of distributions | | 102,538 | | — | |
Cost of shares redeemed | | (5,035,259 | ) | — | |
Net increase from share transactions | | 24,282,880 | | 20,964 | |
| | | | | |
Class R | | | | | |
Proceeds from sale of shares | | 33 | | 1,000 | |
Issued to shareholders in reinvestment of distributions | | 26 | | — | |
Cost of shares redeemed | | (34 | ) | — | |
Net increase from share transactions | | 25 | | 1,000 | |
Net increase in net assets | | $ | 39,943,843 | | $ | 854,131 | |
| | | | | |
NET ASSETS: | | | | | |
Beginning of period | | 854,131 | | — | |
End of period (including undistributed net investment income of $1,113,077 and $10,584, respectively) | | $ | 40,797,974 | | $ | 854,131 | |
(a) The Fund commenced operations on December 31, 2007.
See Notes to Financial Statements.
16
FINANCIAL HIGHLIGHTS
For a share outstanding throughout the periods presented.
| | Class A | |
| | Year Ended | | Period Ended | |
| | April 30, 2009 | | April 30, 2008(a) | |
NET ASSET VALUE, BEGINNING OF PERIOD | | $ | 9.47 | | $ | 10.00 | |
INCOME/(LOSS) FROM OPERATIONS: | | | | | |
Net investment income | | 0.08 | (b) | 0.11 | |
Net realized and unrealized loss on investments | | (5.97 | )(b) | (0.64 | ) |
Total from Investment Operations | | (5.89 | ) | (0.53 | ) |
| | | | | |
LESS DISTRIBUTIONS: | | | | | |
From net investment income | | (0.03 | ) | — | |
From net realized gains | | — | (c) | — | |
Total Distributions | | (0.03 | ) | — | |
| | | | | |
REDEMPTION FEES ADDED TO PAID IN CAPITAL (Note 2) | | 0.01 | (b) | — | |
NET DECREASE IN NET ASSET VALUE | | (5.91 | ) | (0.53 | ) |
NET ASSET VALUE, END OF PERIOD | | $ | 3.56 | | $ | 9.47 | |
TOTAL RETURN(g) | | (62.01 | )% | (5.30 | )%(d) |
| | | | | |
RATIOS/SUPPLEMENTAL DATA: | | | | | |
Net assets, end of period (in 000s) | | $ | 27,860 | | $ | 832 | |
| | | | | |
RATIOS TO AVERAGE NET ASSETS: | | | | | |
Net investment income including reimbursement/waiver | | 2.16 | % | 4.68 | %(e) |
Operating expenses including reimbursement/waiver | | 1.25 | % | 1.25 | %(e) |
Operating expenses excluding reimbursement/waiver | | 2.08 | % | 39.07 | %(e) |
PORTFOLIO TURNOVER RATE (f) | | 59 | % | 15 | % |
(a) The Fund commenced operations on December 31, 2007.
(b) Per share numbers have been calculated using the average shares method.
(c) Less than $0.005 per share.
(d) Total returns for periods less than one year are not annualized.
(e) Annualized.
(f) A portfolio turnover rate is the percentage computed by taking the lesser of the purchases and sales of portfolio securities (excluding securities with a maturity date of one year or less at the time of acquisition) for a period and dividing it by the monthly average of the market value of such securities during the period. Purchases and sales of investment securities (excluding short-term securities) for the year ended April 30, 2009 were $89,001,816 and $14,576,567, respectively.
(g) Total return assumes dividend reinvestment and does not reflect the effect of sales charges.
See Notes to Financial Statements.
17
| | Class I | |
| | Year Ended | | Period Ended | |
| | April 30, 2009 | | April 30, 2008(a) | |
NET ASSET VALUE, BEGINNING OF PERIOD | | $ | 9.47 | | $ | 10.00 | |
INCOME/(LOSS) FROM OPERATIONS: | | | | | |
Net investment income | | 0.10 | (b) | 0.13 | |
Net realized and unrealized loss on investments | | (5.97 | )(b) | (0.66 | ) |
Total from Investment Operations | | (5.87 | ) | (0.53 | ) |
| | | | | |
LESS DISTRIBUTIONS: | | | | | |
From net investment income | | (0.05 | ) | — | |
From net realized gains | | — | (c) | — | |
Total Distributions | | (0.05 | ) | — | |
| | | | | |
REDEMPTION FEES ADDED TO PAID IN CAPITAL (Note 2) | | 0.02 | (b) | — | |
NET DECREASE IN NET ASSET VALUE | | (5.90 | ) | (0.53 | ) |
NET ASSET VALUE, END OF PERIOD | | $ | 3.57 | | $ | 9.47 | |
TOTAL RETURN(g) | | (61.79 | )% | (5.30 | )%(d) |
| | | | | |
RATIOS/SUPPLEMENTAL DATA: | | | | | |
Net assets, end of period (in 000s) | | $ | 12,938 | | $ | 21 | |
| | | | | |
RATIOS TO AVERAGE NET ASSETS: | | | | | |
Net investment income including reimbursement/waiver | | 2.56 | % | 6.11 | %(e) |
Operating expenses including reimbursement/waiver | | 1.00 | % | 1.00 | %(e) |
Operating expenses excluding reimbursement/waiver | | 2.05 | % | 35.33 | %(e) |
PORTFOLIO TURNOVER RATE (f) | | 59 | % | 15 | % |
(a) The Fund commenced operations on December 31, 2007.
(b) Per share numbers have been calculated using the average shares method.
(c) Less than $0.005 per share.
(d) Total returns for periods less than one year are not annualized.
(e) Annualized.
(f) A portfolio turnover rate is the percentage computed by taking the lesser of the purchases and sales of portfolio securities (excluding securities with a maturity date of one year or less at the time of acquisition) for a period and dividing it by the monthly average of the market value of such securities during the period. Purchases and sales of investment securities (excluding short-term securities) for the year ended April 30, 2009 were $89,001,816 and $14,576,567, respectively.
(g) Total return assumes dividend reinvestment.
See Notes to Financial Statements.
18
| | Class R | |
| | Year Ended | | Period Ended | |
| | April 30, 2009 | | April 30, 2008(a) | |
NET ASSET VALUE, BEGINNING OF PERIOD | | $ | 9.46 | | $ | 10.00 | |
INCOME/(LOSS) FROM OPERATIONS: | | | | | |
Net investment income | | 0.15 | (b) | 0.12 | |
Net realized and unrealized loss on investments | | (6.05 | )(b) | (0.66 | ) |
Total from Investment Operations | | (5.90 | ) | (0.54 | ) |
| | | | | |
LESS DISTRIBUTIONS: | | | | | |
From net investment income | | (0.26 | ) | — | |
From net realized gains | | — | (c) | — | |
Total Distributions | | (0.26 | ) | — | |
| | | | | |
REDEMPTION FEES ADDED TO PAID IN CAPITAL (Note 2) | | 0.01 | (b) | — | |
NET DECREASE IN NET ASSET VALUE | | (6.15 | ) | (0.54 | ) |
NET ASSET VALUE, END OF PERIOD | | $ | 3.31 | | $ | 9.46 | |
TOTAL RETURN(h) | | (62.10 | )% | (5.40 | )%(d) |
| | | | | |
RATIOS/SUPPLEMENTAL DATA: | | | | | |
Net assets, end of period (in 000s) | | $ | 0 | (e) | $ | 1 | |
| | | | | |
RATIOS TO AVERAGE NET ASSETS: | | | | | |
Net investment income including reimbursement/waiver | | 2.72 | % | 3.90 | %(f) |
Operating expenses including reimbursement/waiver | | 1.50 | % | 1.50 | %(f) |
Operating expenses excluding reimbursement/waiver | | 6.08 | % | 43.39 | %(f) |
PORTFOLIO TURNOVER RATE (g) | | 59 | % | 15 | % |
(a) The Fund commenced operations on December 31, 2007.
(b) Per share numbers have been calculated using the average shares method.
(c) Less than $0.005 per share.
(d) Total returns for periods less than one year are not annualized.
(e) Less than $500.
(f) Annualized.
(g) A portfolio turnover rate is the percentage computed by taking the lesser of the purchases and sales of portfolio securities (excluding securities with a maturity date of one year or less at the time of acquisition) for a period and dividing it by the monthly average of the market value of such securities during the period. Purchases and sales of investment securities (excluding short-term securities) for the year ended April 30, 2009 were $89,001,816 and $14,576,567, respectively.
(h) Total return assumes dividend reinvestment.
See Notes to Financial Statements.
19
NOTES TO FINANCIAL STATEMENTS
1. ORGANIZATION AND SIGNIFICANT ACCOUNTING POLICIES
Financial Investors Trust (the “Trust”) was organized as a Delaware statutory trust on November 30, 1993, and registered as an open-end management investment company under the Investment Company Act of 1940, as amended (“1940 Act”). The Listed Private Equity Fund (the “Fund”) is one of two separate series offered to the public under the Trust as of April 30, 2009. This Fund commenced operations on December 31, 2007. The Fund has three classes of shares authorized: Class A, Class I and Class R. Each class differs as to sales and redemption charges and ongoing fees. All classes of shares have identical rights to earnings, assets, and voting privileges, except for class-specific expenses and exclusive rights to vote on matters affecting only individual classes. Class A shares of the Fund are subject to an initial sales charge of up to 5.50% . Class A shares of the Fund for which no initial sales charge was paid were subject to a contingent deferred sales charge of 1% if the shares were sold within twelve months. The Fund’s investment objective is to achieve maximum total return consisting of appreciation on its investment and a variable income stream.
The following is a summary of significant accounting policies consistently followed by the Fund in the preparation of its financial statements. The policies are in conformity with accounting principles generally accepted in the United States of America for investment companies.
Investment Valuation: The Board of Trustees (“Board” or “Trustees”) has approved procedures to be used to value the Fund’s securities for the purposes of determining the Fund’s net asset value (“NAV”). The valuation of the securities of the Fund is determined in good faith by or under the direction of the Board. The Board has delegated certain valuation functions for the Fund to ALPS Fund Services, Inc. (“ALPS” or the “Administrator”).
The Fund generally values its securities based on market prices determined at the close of regular trading on the NYSE (normally, 4 p.m. Eastern time) on each business day (Monday through Friday). The Fund will not value its securities on any day that the NYSE is closed, including the following observed holidays: New Year’s Day, Martin Luther King, Jr. Day, Presidents’ Day, Good Friday, Memorial Day, Independence Day, Labor Day, Thanksgiving Day, and Christmas Day, and the preceding Friday or subsequent Monday when one of those holidays falls on a Saturday or Sunday, respectively.
The Fund’s currency valuations, if any, are done as of the close of regularly scheduled trading on the London stock exchange, which is usually at 12 noon Eastern time. For equity securities that are traded on an exchange, the market price is usually the closing sale or official closing price on that exchange. In the case of securities not traded on an exchange, or if such closing prices are not otherwise available, the market price is typically determined by independent third
20
NOTES TO FINANCIAL STATEMENTS
party pricing vendors approved by the Fund’s Board using a variety of pricing techniques and methodologies. The market price for debt obligations is generally the price supplied by an independent third-party pricing service approved by the Fund’s Board, which may use a matrix, formula or other objective method that takes into consideration market indices, yield curves and other specific adjustments. Short-term debt obligations that will mature in 60 days or less are valued at amortized cost, unless it is determined that using this method would not reflect an investment’s fair value. If vendors are unable to supply a price, or if the price supplied is deemed to be unreliable, the market price may be determined using quotations received from one or more brokers/dealers that make a market in the security.
When such prices or quotations are not available, or when Red Rocks Capital LLC (“RRC” or “Sub-Adviser”) believes that they are unreliable, securities may be priced using fair value procedures approved by the Board. Because the Fund invests in securities that may be thinly traded or for which market quotations may not be readily available or may be unreliable (such as securities of small capitalization companies), the Fund may use fair valuation procedures more frequently than funds that invest primarily in securities that are more liquid (such as equity securities of large capitalization domestic issuers). The Fund may also use fair value procedures if the Sub-Adviser determines that a significant event has occurred between the time at which a market price is determined and the time at which the Fund’s net asset value is calculated. In particular, the value of non-U.S. securities may be materially affected by events occurring after the close of the market on which they are traded, but before the Fund prices its shares.
The Fund may determine the fair value of investments based on information provided by pricing services and other third-party vendors, which may recommend fair value prices or adjustments with reference to other securities, indices or assets. In considering whether fair value pricing is required and in determining fair values, the Fund may, among other things, consider significant events (which may be considered to include changes in the value of U.S. securities or securities indices) that occur after the close of the relevant market and before the Fund values its securities. In addition, the Fund may utilize modeling tools provided by third-party vendors to determine fair values of non-U.S. securities. The Fund’s use of fair value pricing may help deter “stale price arbitrage.”
Valuing securities at fair value involves greater reliance on judgment than valuation of securities based on readily available market quotations. A fund that uses fair value to price securities may value those securities higher or lower than another fund using market quotations or its own fair value methodologies to price the same securities. There can be no assurance that the Fund could obtain the fair value assigned to a security if it were to sell the security at approximately the time at which the Fund determines its net asset value, and the difference between fair value and the price of the securities may be material.
21
NOTES TO FINANCIAL STATEMENTS
Fair Value Measurements: The Fund adopted the provisions of Financial Accounting Standards Board Statement of Financial Accounting Standards No. 157 (“FAS 157”), “Fair Value Measurements,” on May 1, 2008. FAS 157 established a three-tier hierarchy to establish classification of fair value measurements for disclosure purposes. Inputs refer broadly to the assumptions that market participants would use in pricing the asset or liability, including assumptions about risk. Inputs may be observable or unobservable. Observable inputs are inputs that reflect the assumptions market participants would use in pricing the asset or liability that are developed based on market data obtained from sources independent of the reporting entity. Unobservable inputs are inputs that reflect the reporting entity’s own assumptions about the assumptions market participants would use in pricing the asset or liability that are developed based on the best information available.
Various inputs are used in determining the value of the Fund’s investments as of the reporting period end. The designated input levels are not necessarily an indication of the risk or liquidity associated with these investments. These inputs are categorized in the following hierarchy under applicable financial accounting standards:
· Level 1 – Quoted prices in active markets for identical investments
· Level 2 – Other significant observable inputs (including quoted prices for similar investments, interest rates, prepayment speeds, credit risk, etc.)
· Level 3 – Significant unobservable inputs (including the Fund’s own assumptions in determining the fair value of investments)
The following is a summary of the inputs used to value the Fund’s investments as of April 30, 2009.
| | Investments | | Other Financial | |
Valuation Inputs | | in Securities | | Instruments(a) | |
Level 1-Quoted Prices | | $ | 38,315,135 | | — | |
Level 2-Other Significant Observable Inputs | | 2,477,532 | | — | |
Level 3-Significant Unobservable Inputs | | — | | — | |
Total | | $ | 40,792,667 | | — | |
(a) Other financial instruments are derivative instruments not reflected in the Statement of Investments, such as written options, short sales, currency contracts, futures, forward contracts and swap contracts.
For the year ended April 30, 2009, the Fund did not have any significant unobservable inputs (Level 3) in determining fair value. Therefore, a reconciliation of assets in which significant unobservable inputs (Level 3) were used in determining fair value is not applicable.
Investment Transactions: Investment and shareholder transactions are accounted for on the date the investments are purchased or sold (trade date). Realized
22
NOTES TO FINANCIAL STATEMENTS
gains and losses from investment transactions are reported on an identified cost basis, which is the same basis the Fund uses for federal income tax purposes. Interest income, which includes accretion of discounts, is accrued and recorded as earned. Dividend income is recognized on the ex-dividend date or for certain foreign securities, as soon as information is available to the Fund.
Dividend income from investments in real estate investment trusts (“REITs”) is recorded at management’s estimate of income included in distributions received. Distributions received in excess of this amount are recorded as a reduction of the cost of investments. The actual amount of income and return of capital are determined by each REIT only after its fiscal year-end, and may differ from the estimated amounts. Such differences, if any, are recorded in Fund’s following year.
Foreign Securities: The Fund may directly purchase securities of foreign issuers. Investing in securities of foreign issuers involves special risks not typically associated with investing in securities of U.S. issuers. The risks include possible reevaluation of currencies, the inability to repatriate the Fund, less complete financial information about companies and possible future adverse political and economic developments. Moreover, securities of many foreign issuers and their markets may be less liquid and their prices more volatile than those of securities of comparable U.S. issuers.
Foreign Currency Translation: The books and records of the Fund are maintained in U.S. dollars. Investment valuations and other assets and liabilities initially expressed in foreign currencies are converted each business day into U.S. dollars based upon current exchange rates. Prevailing foreign exchange rates may generally be obtained at the close of the NYSE, normally 4:00 p.m. Eastern time. As available and as provided by an appropriate pricing service, translation of foreign security and currency market values may also occur with the use of foreign exchange rates obtained at approximately 11:00 a.m. Eastern time, which approximates the close of the London Exchange. The portion of realized and unrealized gains or losses on investments due to fluctuations in foreign currency exchange rates and are included in realized and unrealized gains or losses on investments.
Forward Foreign Currency Transactions: The Fund may engage in currency transactions with counterparties to hedge the value of portfolio securities denominated in particular currencies against fluctuations in relative value, to gain or reduce exposure to certain currencies, or to generate income or gains. All commitments are marked to market daily at the applicable exchange rates and any resulting unrealized gains or losses are recorded in the Fund’s financial statements. The Fund records realized gains or losses at the time a forward contract is offset by entry into a closing transaction or extinguished by delivery of the currency. The Fund did not have forward foreign currency contracts at April 30, 2009.
Expenses: Some expenses of the Trust can be directly attributed to the Fund or the Fund specific share class. Expenses which cannot be directly attributed are apportioned among all funds in the Trust based on average net assets.
23
NOTES TO FINANCIAL STATEMENTS
Use of Estimates: The Fund’s financial statements are prepared in accordance with accounting principles generally accepted in the United States of America. This requires management to make estimates and assumptions that affect (a) the reported amounts of assets and liabilities and disclosure of contingent assets and liabilities at the date of the financial statements, and (b) the reported amounts of increases and decreases in net assets from operations during the reporting period. Actual results could differ from these estimates.
Federal Income Taxes: The Fund complies with the requirements under Sub-chapter M of the Internal Revenue Code applicable to regulated investment companies and intends to distribute substantially all of its net taxable income and net capital gains, if any, each year. The Fund is not subject to income taxes to the extent such distributions are made.
The Fund follows Financial Accounting Standards Board (“FASB”) Interpretation No. 48 (“FIN 48”), “Accounting for Uncertainty in Income Taxes”, that requires the tax effects of certain tax positions to be recognized. These tax positions must meet a “more likely than not” standard that, based on their technical merits, have a more than 50 percent likelihood of being sustained upon examination. As of April 30, 2009, the Fund reviewed the tax positions and determined the implementation of FIN 48 resulted in no liability for unrecognized tax benefits. The Fund files income tax returns in the U.S. federal jurisdiction and the State of Colorado. The statute of limitations on the Fund’s federal tax return filings remain open for the years ended April 30, 2008 and April 30, 2009. The Fund’s Colorado tax return filings remain open for the years ended April 30, 2008 and April 30, 2009. To our knowledge there are no federal or Colorado income tax returns currently under examination.
Distributions to Shareholders: The Fund normally pays dividends and distributes capital gains, if any, on an annual basis. Income dividend distributions are derived from interest and other income the Fund receives from its investments, including distributions of short-term capital gains. Capital gain distributions are derived from gains realized when the Fund sells a security it has owned for more than a year. The Fund may make additional distributions and dividends at other times if the portfolio manager believes doing so may be necessary for the Fund to avoid or reduce taxes. Net investment income (loss) and net realized gain (loss) may differ for financial statement and tax purposes. The character of distributions made during the year from net investment income or net realized gains may differ from its ultimate characterization for federal income tax purposes. Also, due to the timing of dividend distributions, the fiscal year in which amounts are distributed may differ from the fiscal year in which the income or realized gain were recorded by the Fund.
24
NOTES TO FINANCIAL STATEMENTS
The tax character of the distributions paid by the Fund for the year ended April 30, 2009 is as follows:
Distributions Paid From: | | | |
Ordinary Income | | $ | 428,026 | |
Long-Term Capital Gain | | 115 | |
Total | | $ | 428,141 | |
Components of Earnings: At April 30, 2009, permanent differences in book and tax accounting were reclassified. These differences had no effect on net assets and were primarily attributed to differences in book and tax distributions, differing tax treatment of foreign currency and certain other investments and treatment of net investment loss. The reclassifications were as follows:
| | Increase/(Decrease) | | Increase/(Decrease) | |
| | Accumulated | | Accumulated | |
Increase/(Decrease) | | Net Investment | | Net Realized | |
Paid In-Capital | | Income/(Loss) | | Gain/(Loss) | |
$ | 558 | | $ | 954,017 | | $ | (954,575 | ) |
| | | | | | | | |
As of April 30, 2009, the components of distributable earnings on a tax basis were as follows:
Undistributed ordinary income | | $ | 2,569,410 | |
Accumulated net realized loss | | (7,658,078 | ) |
Unrealized Depreciation | | (29,743,862 | ) |
Other Cumulative Effect of Timing Differences | | 102 | |
Total | | $ | (34,832,428 | ) |
The net unrealized appreciation/depreciation on investments for federal income tax purposes for the year ended April 30, 2009 were as follows:
Gross appreciation (excess of value over tax cost) | | $ | 0 | |
Gross depreciation (excess of tax cost over value) | | (29,743,862 | ) |
Net unrealized depreciation | | $ | (29,743,862 | ) |
Cost of investments for income tax purposes | | $ | 70,537,970 | |
Post October Loss: Under current tax law, capital and currency losses realized after October 31 may be deferred and treated as occurring on the first day of the following fiscal year. For the Fiscal year ended April 30, 2009, the Fund elected to defer currency losses occurring between November 1, 2008 and April 30, 2009 in the amount of $7,319,633.
Capital Loss Carry Forwards: At April 30, 2009, the Fund had generated for Federal income tax purposes a capital loss carry over of $(338,445), which will expire April 30, 2017.
25
NOTES TO FINANCIAL STATEMENTS
Recent Accounting Pronouncements: In March 2008, FASB issued FASB Statement No. 161 (“SFAS No. 161”), “Disclosures about Derivative Instruments and Hedging Activities”, which is intended to improve financial reporting of derivative instruments and hedging activities. It is effective for financial statements issued for fiscal years and interim periods beginning after November 15, 2008. The Fund is currently evaluating the potential impact, if any, the adoption of SFAS No. 161 will have on the Fund’s financial statements.
In April 2009, the Financial Accounting Standards Board (“FASB”) issued FASB Staff Position No. 157-4, “Determining Fair Value When the Volume and Level of Activity for the Asset or Liability Have Significantly Decreased and Identifying Transactions That Are Not Orderly” (“FSP 157-4”). FSP 157-4 provides additional guidance for estimating fair value in accordance with FAS 157, when the volume and level of activity for the asset or liability have significantly decreased as well as guidance on identifying circumstances that indicate a transaction is not orderly. FSP 157-4 is effective for fiscal years and interim periods ending after June 15, 2009. Management is currently evaluating the impact the adoption of FSP 157-4 will have on the Fund’s future financial statement disclosures.
2. CAPITAL SHARE TRANSACTIONS
Shares redeemed within 90 days of purchase may incur a 2% short-term redemption fee deducted from the redemption amount. For year ended April 30, 2009 the Fund retained $97,971, such redemption fees are reflected in the “cost of shares redeemed” in the Statement of Changes in Net Assets. Transactions in shares of capital stock for the year ended April 30, 2009 and period ended April 30, 2008 were as follows:
| | Year Ended | | Period Ended | |
| | April 30, 2009 | | April 30, 2008* | |
Class A | | | | | |
Sold | | 9,511,389 | | 87,915 | |
Issued in reinvestment of distributions | | 79,707 | | — | |
Redeemed | | (1,861,807 | ) | — | |
Net increase in shares outstanding | | 7,729,287 | | 87,915 | |
Class I | | | | | |
Sold | | 5,208,527 | | 2,219 | |
Issued in reinvestment of distributions | | 30,427 | | — | |
Redeemed | | (1,619,737 | ) | — | |
Net increase in shares outstanding | | 3,619,217 | | 2,219 | |
Class R | | | | | |
Sold | | 4 | | 100 | |
Issued in reinvestment of distributions | | 8 | | — | |
Redeemed | | (4 | ) | — | |
Net increase in shares outstanding | | 8 | | 100 | |
* The Fund commenced operations on December 31, 2007.
26
NOTES TO FINANCIAL STATEMENTS
3. MANAGEMENT AND RELATED PARTY TRANSACTIONS
ALPS Advisors, Inc. (“AAI” or “Advisor”), subject to the authority of the Board, is responsible for the overall management and administration of the Fund’s business affairs. AAI has delegated daily management of Fund assets to RRC, the Sub-Adviser of the Fund. RRC manages the investments of the Fund in accordance with its investment objective, policies and limitations and investment guidelines established by the Adviser and the Trustees. Pursuant to the Investment Advisory Agreement (the “Advisory Agreement”), the Fund pays AAI an annual management fee of 0.85% based on the Fund’s average daily net assets. Pursuant to an Investment Sub-advisory Agreement, AAI pays RRC an annual sub-advisory management fee of 0.57% based on the Fund’s average daily net assets. AAI is required to pay all fees due to RRC out of the management fee AAI receives from the Fund.
AAI and RRC have contractually agreed with the Fund to limit the amount of the Fund’s total annual expenses (exclusive of distribution and service (12b-1) fees, acquired fund fees and expenses, brokerage expenses, interest expense, taxes and extraordinary expenses) to 1.00% of the Fund’s average daily net assets. This agreement is in effect through April 30, 2009 and is reevaluated on an annual basis. Without this agreement, expenses could be higher. In addition, the Fund’s organizational expenses have been borne by AAI. The Adviser and Sub-Adviser will be permitted to recover, on a class by class basis, expenses it has borne through the agreement described above to the extent that the Fund’s expenses in later periods fall below the annual rates set forth in the relevant agreement. The Fund will not be obligated to pay any such deferred fees and expenses more than one year after the end of the fiscal year in which the fee and expense was deferred.
ALPS Distributors, Inc. (an affiliate of ALPS) (“ADI” or the “Distributor”) acts as the distributor of the Fund’s shares pursuant to a Distribution Agreement with the Trust. Shares are sold on a continuous basis by ADI as agent for the Fund, and ADI has agreed to use its best efforts to solicit orders for the sale of Fund shares, although it is not obliged to sell any particular amount of shares. ADI is not entitled to any compensation for its services as Distributor. ADI is registered as a broker-dealer with the Securities and Exchange Commission.
The Fund has adopted a Distribution and Services Plan (the “Plan”) pursuant to Rule 12b-1 under the 1940 Act for each of the Class A shares and Class R shares. The Plan allows the Fund to use its Class A and Class R assets to pay fees in connection with the distribution, marketing and/or the provision of shareholder services to Class A and R shareholders. The Plan permits payment for services in connection with the administration of plans or programs that use Class A and R shares of the Fund as their funding medium and for related expenses. The Plan permits the Fund to make total payments at an annual rate of up to 0.25% and 0.50% of the Fund’s average daily net assets attributable to its Class A and Class R shares, respectively. Because these fees are paid out of a Fund’s share class assets on an ongoing basis, over time they will increase the cost of an investment in Class A and Class R shares, and Plan fees may cost an investor more than other types of sales charges.
27
NOTES TO FINANCIAL STATEMENTS
ALPS serves as administrator to the Fund and the Fund has agreed to pay expenses incurred in connection with its administrative activities. Pursuant to an Administrative Agreement, ALPS will provide operational services to the Fund including, but not limited to fund accounting, fund administration, and generally assist in the Fund’s operations. The Annual Administrative Fee will be billed monthly, in the amount of: (i) 8 basis points of Fund’s average net assets between $0 - $500 million; and (ii) 6 basis points of Fund’s average net assets between $500 million - $1 billion; and (iii) 4 basis points of Fund’s average net assets over $1 billion.
Beneficial Ownership: The beneficial ownership, either directly or indirectly, of more than 25% of the voting securities of any class a fund creates a presumption of control of the Fund, under Section 2(a)(9) of the 1940 Act. As of April 30, 2009, National Financial Services LLC held approximately 95.57% of Class A of the Fund; Charles Schwab & Co., and First Clearing LLC held approximately 46.45% and 40.72% of Class I of the Fund, respectively; ALPS Fund Services, Inc., held approximately 100.00% of Class R of the Fund. ALPS is considered to be an affiliate of the Fund as defined by the 1940 Act.
4. SUBSEQUENT EVENT
On June 9, 2009, the Board of Trustees authorized a new series, the Activa Value Fund, to the Trust. The Activa Value Fund’s registration statement is expected to become effective on August 29, 2009 (this date is subject to change).
28
ADDITIONAL INFORMATION (UNAUDITED)
1. FUND HOLDINGS
The Fund files its complete schedule of portfolio holdings with the Securities and Exchange Commission (the “SEC”) for the first and third quarters of each fiscal year on Form N-Q within 60 days after the end of the period. Copies of the Fund’s Forms N-Q are available without charge on the SEC website at http:// www.sec.gov. You may also review and copy the Form N-Q at the SEC’s Public Reference Room in Washington, DC. For more information about the operation of the Public Reference Room, please call the SEC at 1-800-SEC-0330.
2. FUND PROXY VOTING POLICIES AND PROCEDURES
Fund policies and procedures used in determining how to vote proxies and information regarding how the Fund voted proxies relating to portfolio securities during the most recent prior 12-month period ending June 30 will be available without charge, (1) upon request, by calling (866) 759-5679 and (2) on the SEC’s website at http://www.sec.gov.
3. TAX DESIGNATIONS
The Fund designates the following for federal income tax purposes for the fiscal year ended April 30, 2009:
Qualified Dividend Income | | 36.29 | % |
29
TRUSTEES & OFFICERS (UNAUDITED)
As of April 30, 2009, the Fund represented one of two separate series offered to the public under the Trust. The Trust’s Board of Trustees oversees the overall management of each series of the Trust and elects the officers of the Trust. You can find more information about the Trustees in the Statement of Additional Information (SAI) which is available without charge by calling (866) 759-5679. The principal occupations for the past five years of the Trustees and executive officers of the Trust are listed below.
INDEPENDENT TRUSTEES
| | | | | | | | Number of | | | |
| | | | | | | | Funds in | | | |
| | | | | | | | Fund | | | |
Name, | | Position(s) | | Term of Office | | Principal | | Complex | | Other | |
Address* | | Held with | | and Length of | | Occupation(s) | | Overseen by | | Directorships | |
& Age | | Funds | | Time Served | | During Past 5 Years** | | Trustee*** | | Held by Trustee | |
Mary K. Anstine,
age 68 | | Trustee | | Ms. Anstine was elected at a special meeting of shareholders held on March 21, 1997 | | Ms. Anstine was President/Chief Executive Officer of HealthONE Alliance, Denver, Colorado, and former Executive Vice President of First Interstate Bank of Denver. Ms. Anstine is also Trustee/Director of the AV Hunter Trust and Colorado Uplift Board. Ms. Anstine was formerly a Director of the Trust Bank of Colorado (later purchased and now known as Northern Trust Bank) and HealthONE, and a member of the American Bankers Association Trust Executive Committee. | | 9 | | Ms. Anstine is a Trustee of ALPS ETF Trust (1 fund); Financial Investors Variable Insurance Trust (5 funds); ALPS Variable Insurance Trust (1 fund); Reaves Utility Income Fund; and Westcore Trust (12 funds). | |
* All communications to Trustees and Officers may be directed to Financial Investors Trust c/o 1290 Broadway, Suite 1100, Denver, CO 80203.
** Except as otherwise indicated, each individual has held the office shown or other offices in the same company for the last five years.
*** The Fund Complex includes all series of the Trust and any other investment companies for which ALPS Advisors, Inc. provides investment advisory services.
30
Name,
Address*
& Age | | Position(s)
Held with
Funds | | Term of Office
and Length of
Time Served | | Principal
Occupation(s)
During Past 5 Years** | | Number of
Funds in
Fund
Complex
Overseen by
Trustee*** | | Other
Directorships
Held by Trustee | |
John R. Moran, Jr.,
age 78 | | Trustee and Interim Chairman | | Mr. Moran was elected at a special meeting of shareholders held on March 21, 1997. | | Mr. Moran is formerly President and CEO of The Colorado Trust, a private foundation promoting health initiatives in the state of Colorado. An attorney, Mr. Moran was formerly a partner with the firm of Kutak Rock & Campbell in Denver, Colorado and a member of the Colorado House of Representatives. Currently, Mr. Moran is a member of the Treasurer’s Investment Advisory Committee for the University of Colorado. | | 2 | | None | |
| | | | | | | | | | | |
Jeremy W. Deems,
age 32 | | Trustee | | Mr. Deems was appointed as a Trustee at the March 11, 2008 meeting of the Board of Trustees. | | Mr. Deems is the Co-President and Chief Financial Officer of Green Alpha Advisors, LLC. Prior to joining Green Alpha Advisors, Mr. Deems was CFO and Treasurer of Forward Management, LLC, ReFlow Management Co., LLC, ReFlow Fund, LLC, a private investment fund, and Sutton Place Management, LLC, an administrative services company, from 2004 to June 2007. Prior to this, Mr. Deems served as Controller of Forward Management, LLC, ReFlow Management Co., LLC, ReFlow Fund, LLC and Sutton Place Management, LLC. | | 4 | | Mr. Deems is a Trustee of ALPS ETF Trust (1 fund); ALPS Variable Insurance Trust (1 fund); and Reaves Utility Income Fund. | |
31
OFFICERS
Name, Address* | | Position(s) | | Term of Office and | | Principal Occupation(s) |
& Age | | Held with Funds | | Length of Time Served | | During Past 5 Years** |
Edmund J. Burke,
age 47 | | President | | Mr. Burke was elected President of the Trust at the December 17, 2002 meeting of the Board of Trustees. | | Mr. Burke is Chief Executive Officer and a Director of ALPS Holdings, Inc. (“AHI”) (since 2005) and Director of ALPS Advisors, Inc. (“AAI”), ADI, ALPS, ALPS Holdings, Inc. and FTAM Distributors, Inc. (“FDI”). Mr. Burke and was President of AAI, ADI, ALPS and FDI (2001-2008). Because of his positions with ALPS, Mr. Burke is deemed an affiliate of the Trust as defined under the 1940 Act. Mr. Burke is President of the Reaves Utility Income Fund (since 2004); President of the Financial Investors Variable Insurance Trust (since 2006); Trustee and President of the Clough Global Allocation Fund (Trustee since 2006; President since 2004); Trustee and President of the Clough Global Equity Fund (Trustee since 2006; President since 2005); Trustee and President of the Clough Global Opportunities Fund (since 2006); Trustee of the Liberty All-Star Equity Fund; and Director of the Liberty All-Star Growth Fund, Inc. |
| | | | | | |
Jeremy O. May,
age 39 | | Treasurer | | Mr. May was elected Treasurer of the Trust at the October 7, 1997 meeting of the Board of Trustees. | | Mr. May joined ALPS in 1995 and is currently President and Director of ALPS and Director of AAI, ADI, ALPS Holdings, Inc. and FDI. Because of his positions with ALPS, Mr. May is deemed an affiliate of the Trust as defined under the 1940 Act. Mr. May is also the Treasurer of the Liberty All-Star Equity Fund, Liberty All-Star Growth Fund, Inc., Clough Global Allocation Fund, Clough Global Equity Fund, Clough Global Opportunities Fund, Financial Investors Trust, Financial Investors Variable Insurance Trust and Reaves Utility Income Fund. Mr. May is also President, Chairman and Trustee of the ALPS Variable Insurance Trust and Chairman and Trustee of the Reaves Utility Income Fund. Mr. May is currently on the Board of Directors and is Chairman of the Audit Committee of the University of Colorado Foundation. |
* All communications to Trustees and Officers may be directed to Financial Investors Trust c/o 1290 Broadway, Suite 1100, Denver, CO 80203.
** Except as otherwise indicated, each individual has held the office shown or other offices in the same company for the last five years.
32
Name, Address* | | Position(s) | | Term of Office and | | Principal Occupation(s) |
& Age | | Held with Funds | | Length of Time Served | | During Past 5 Years** |
JoEllen L. Legg,
Age 47 | | Secretary | | Ms. Legg was elected Secretary of the Trust at the November 13, 2007 meeting of the Board of Trustees. | | Ms. Legg joined ALPS as Associate Counsel in October 2007. Prior to joining ALPS, Ms. Legg served as Senior Counsel - Law (Corporate & Securities) for Adelphia Communications Corporation from February 2005 to March 2007. Prior to this, Ms. Legg held associate positions at Fried Frank Harris Shriver & Jacobson LLP (1998 – 2004) and at Patton Boggs LLP (2004 – 2005). Because of her position with ALPS, Ms. Legg is deemed an affiliate of the Trust as defined under the 1940 Act. Ms. Legg is also the Secretary of the Westcore Trust and Assistant Secretary of the Stone Harbor Investment Funds and the WesMark Funds. |
| | | | | | |
Michael Akins,
age 32 | | Chief Compliance Officer (“CCO”) | | Mr. Akins was appointed CCO of the Trust at the June 13, 2006 meeting of the Board of Trustees. | | Mr. Akins joined ALPS as Deputy Compliance Officer in April 2006. Prior to joining ALPS, Mr. Akins served as Compliance Officer and AVP for UMB Financial Corporation. Before joining UMB, Mr. Akins served as an account manager for State Street Corporation. Because of his affiliation with ALPS and ADI, Mr. Akins is deemed an affiliate of the Trust as defined under the 1940 Act. Mr. Akins is currently the CCO of ALPS Variable Insurance Trust, Financial Investors Variable Insurance Trust, Reaves Utility Income Fund, Clough Global Allocation Fund, Clough Global Opportunities Fund, the Clough Global Equity Fund, and the ALPS ETF Trust. |
| | | | | | |
Kimberly R. Storms,
age 37 | | Assistant Treasurer | | Kim Storms was elected Assistant Treasurer of the Trust at the June 14, 2005 meeting of the Board of Trustees. | | Ms. Storms is Vice President - Director of Fund Administration of ALPS. Ms. Storms joined ALPS in 1998 as Assistant Controller. Because of her position with ALPS, Ms. Storms is deemed an affiliate of the Trust as defined under the 1940 Act. Ms. Storms is also Treasurer of ALPS ETF Trust and ALPS Variable Insurance Trust; Assistant Treasurer of Liberty All-Star Equity Fund and Liberty All-Star Growth Fund, Inc.; and Assistant Secretary of Ameristock Mutual Fund, Inc. |
33

Item 2. Code of Ethics.
(a) The Registrant, as of the end of the period covered by this report, has adopted a code of ethics that applies to the Registrant’s principal executive officer, principal financial officer, principal accounting officer or controller or any persons performing similar functions on behalf of the Registrant.
(b) Not applicable.
(c) During the period covered by this report, no amendments to the provisions of the code of ethics adopted in Item 2(a) above were made.
(d) During the period covered by this report, no implicit or explicit waivers to the provisions of the code of ethics adopted in Item 2(a) above were granted.
(e) Not applicable.
(f) The Registrant’s Code of Ethics is attached as an Exhibit hereto.
Item 3. Audit Committee Financial Expert.
The Board of Trustees of the Registrant has determined that the Registrant has at least one Audit Committee Financial Expert serving on its audit committee. The Board of Trustees of the Registrant has designated Jeremy W. Deems as the Registrant’s “Audit Committee Financial Expert.” Mr. Deems is “independent” as defined in paragraph (a)(2) of Item 3 to Form N-CSR.
Item 4. Principal Accountant Fees and Services.
(a) Audit Fees: For the Registrant’s fiscal years ended April 30, 2008 and April 30, 2009, the aggregate fees billed for professional services rendered by the principal accountant for the audit of the Registrant’s annual financial statements were $66,150 and $45,000, respectively.
(b) Audit-Related Fees: For the Registrant’s fiscal years ended April 30, 2008 and April 30, 2009, the aggregate fees billed for professional services rendered by the principal accountant for the verification of the Registrant’s securities and similar
2
investments in accordance with Rule 17f-2 under the Investment Company Act of 1940 were $14,000 and $10,000, respectively.
(c) Tax Fees: For the Registrant’s fiscal years ended April 30, 2008 and April 30, 2009, the aggregate fees billed for professional services rendered by the principal accountant for tax compliance, tax advice and tax planning were $13,735 and $10,570, respectively. The fiscal year 2008 and 2009 tax fees were for services for dividend calculation, excise tax preparation and tax return preparation.
(d) All Other Fees: For the Registrant’s fiscal years ended April 30, 2008 and April 30, 2009, no fees were billed to Registrant by the principal accountant for services other than the services reported in paragraphs (a) through (c) of this Item.
(e)(1) Audit Committee Pre-Approval Policies and Procedures: All services to be performed by the Registrant’s principal accountant must be pre-approved by the Registrant’s audit committee.
(e)(2) No services described in paragraphs (b) through (d) of this Item were approved by the Registrant’s audit committee pursuant to paragraph (c)(7)(i)(C) of Rule 2-01 of Regulation S-X.
(f) Not applicable.
(g) The aggregate non-audit fees billed by the Registrant’s accountant in each of the last two fiscal years of the Registrant were $178,070 in 2009 and $347,934 in 2008. These fees consisted of non-audit fees billed to (i) the Registrant of $10,570 in 2009 and $13,735 in 2008 as described in response to paragraph (c) above and (ii) to ALPS Fund Services, Inc. (“AFS”), an entity under common control with ALPS Advisors, Inc., the Registrant’s investment adviser, of $167,500 in 2009 and $334,199 in 2008. The non-audit fees billed to AFS related to SAS 70 services and other compliance-related matters.
(h) The Registrant’s audit committee has considered whether the provision of non-audit services that were rendered to the Registrant’s investment adviser (not including any sub-adviser whose role is primarily portfolio management and is subcontracted with or overseen by another investment adviser), and any entity controlling, controlled by, or under common control with the investment adviser that provides ongoing services to the Registrant that were not pre-approved pursuant to paragraph (c)(7)(ii) of Rule 2-01 of Regulation S-X, is compatible with maintaining the principal accountant’s independence. The Registrant’s audit committee determined that the provision of such non-audit services is compatible with maintaining the principal accountant’s independence.
Item 5. Audit Committee of Listed Registrants.
Not applicable.
3
Item 6. Investments.
(a) Schedule of Investments is included as part of the Reports to Stockholders filed under Item 1 of this Form N-CSR.
(b) Not applicable.
Item 7. Disclosure of Proxy Voting Policies and Procedures for Closed-End Management Investment Companies.
Not applicable.
Item 8. Portfolio Managers of Closed-End Management Investment Companies.
Not applicable.
Item 9. Purchases of Equity Securities by Closed-End Management Investment Company and Affiliated Purchasers.
Not applicable.
Item 10. Submission of Matters to a Vote of Security Holders.
There have been no material changes to the procedures by which shareholders may recommend nominees to the Registrant’s Board of Trustees, where those changes were implemented after the Registrant last provided disclosure in response to the requirements of Item 407(c)(2) of Regulation S-K, or this Item.
Item 11. Controls and Procedures.
(a) The Registrant’s principal executive officer and principal financial officer have concluded that the Registrant’s disclosure controls and procedures (as defined in Rule 30a-3(c) under the Investment Company Act of 1940, as amended) are effective based on their evaluation of these controls and procedures as of a date within 90 days of the filing date of this report.
(b) There was no change in the Registrant’s internal control over financial reporting (as defined in Rule 30a-3(d) under the Investment Company Act of 1940, as amended) during the second fiscal quarter of the period covered by this report that has materially affected, or is reasonably likely to materially affect, the Registrant’s internal control over financial reporting.
4
Item 12. Exhibits.
(a)(1) Registrant’s Code of Ethics for Senior Financial Officers, which is the subject of the disclosure required by Item 2 of Form N-CSR, was filed as Exhibit 12(a)(1) to the Registrant’s Certified Shareholder Report on Form N-CSR, File No. 811-8194, on July 7, 2008.
(a)(2) The certifications required by Rule 30a-2(a) of the Investment Company Act of 1940, as amended, and Section 302 of the Sarbanes-Oxley Act of 2002 are attached hereto as Exhibit 99.Cert.
(a)(3) Not applicable.
(b) The certifications by the Registrant’s principal executive officer and principal financial officer, as required by Rule 30a-2(b) of the Investment Company Act of 1940, as amended, and Section 906 of the Sarbanes-Oxley Act of 2002 are attached hereto as Exhibit 99.906Cert.
5
SIGNATURES
Pursuant to the requirements of the Securities Exchange Act of 1934 and the Investment Company Act of 1940, the Registrant has duly caused this report to be signed on its behalf by the undersigned, thereunto duly authorized.
FINANCIAL INVESTORS TRUST |
|
By: | /s/ Edmund J. Burke | |
| Edmund J. Burke (Principal Executive Officer) |
| President |
|
Date: | July 7, 2009 |
Pursuant to the requirements of the Securities Exchange Act of 1934 and the Investment Company Act of 1940, this report has been signed below by the following persons on behalf of the Registrant and in the capacities and on the dates indicated.
FINANCIAL INVESTORS TRUST
By: | /s/ Edmund J. Burke | |
| Edmund J. Burke (Principal Executive Officer) |
| President |
| |
Date: | July 7, 2009 |
| |
| |
By: | /s/ Jeremy O. May | |
| Jeremy O. May (Principal Financial Officer) |
| Treasurer |
| |
Date: | July 7, 2009 |
6