UNITED STATES
SECURITIES AND EXCHANGE COMMISSION
Washington, D.C. 20549
FORM N-CSR
CERTIFIED SHAREHOLDER REPORT OF REGISTERED
MANAGEMENT INVESTMENT COMPANIES
Investment Company Act file number: 811-8194
FINANCIAL INVESTORS TRUST
(Exact name of registrant as specified in charter)
1290 Broadway, Suite 1100, Denver, Colorado 80203
(Address of principal executive offices) (Zip code)
JoEllen L. Legg, Secretary
Financial Investors Trust
1290 Broadway, Suite 1100
Denver, Colorado 80203
(Name and address of agent for service)
Registrant’s telephone number, including area code: 303-623-2577
Date of fiscal year end: April 30
Date of reporting period: May 1, 2009 - April 30, 2010
Item 1. Reports to Stockholders.
Table of Contents
| | | | |
Activa Value Fund | | | | |
Management Commentary ––––––––––––––––––––––––––– | | 1 | | |
Disclosure of Fund Expenses ––––––––––––––––––––––––– | | 4 | | |
Statement of Investments –––––––––––––––––––––––––––– | | 5 | | |
| | |
ALPS | GNI Long-Short Fund | | | | |
Management Commentary ––––––––––––––––––––––––––– | | 8 | | |
Disclosure of Fund Expenses ––––––––––––––––––––––––– | | 12 | | |
Statement of Investments –––––––––––––––––––––––––––– | | 13 | | |
| | |
ALPS | Red Rocks Listed Private Equity Fund | | | | |
Management Commentary ––––––––––––––––––––––––––– | | 15 | | |
Disclosure of Fund Expenses ––––––––––––––––––––––––– | | 18 | | |
Statement of Investments –––––––––––––––––––––––––––– | | 19 | | |
| | |
Clough China Fund | | | | |
Management Commentary ––––––––––––––––––––––––––– | | 21 | | |
Disclosure of Fund Expenses ––––––––––––––––––––––––– | | 24 | | |
Statement of Investments –––––––––––––––––––––––––––– | | 25 | | |
| | |
Statement of Assets and Liabilities –––––––––––––––– | | 28 | | |
| | |
Statement of Operations –––––––––––––––––––––––– | | 30 | | |
| | |
Statement of Changes in Net Assets –––––––––––––— | | 31 | | |
| | |
Financial Highlights ––––––––––––––––––––––––––— | | 34 | | |
| | |
Notes to Financial Statements ––––––––––––––––––– | | 44 | | |
| | |
Report of Independent Registered Public Accounting Firm –––––––––––––––––––––––– | | 54 | | |
| | |
Additional Information –––––––––––––––––––––––––– | | 55 | | |
| | |
Trustees and Officers –––––––––––––––––––––––––– | | 60 | | |
| | | | | | |
| Activa Value Fund | | |
| | | Management Commentary | | April 30, 2010 (Unaudited) |
Market Comment
Amid concerns of government spending run amuck, talk of double-dip recessions, and anemic consumers, the markets were sanguine in the first quarter of 2010 as healthy fundamentals among corporations ruled the day. Past cost saving actions set the stage for robust cash flow, high net cash levels, and near unprecedented operating leverage.
Within the Russell 1000 Value Index, eight of ten sectors recorded positive absolute returns during the period. Consumer Discretionary, Industrials, and Financials led the Index higher, while Telecommunication Services and Health Care were the only sectors to post negative returns.
Fund Review
The Portfolio underperformed its benchmark for the period as the Portfolio posted negative relative results in seven of the ten broad market sectors. Stock selection within Financials, Information Technology, and Materials detracted the most relative to the Russell 1000 Value Index.
Among the top relative detractors to performance were Citigroup (Financials), Boeing (Industrials), and The Mosaic Company (Materials). Citigroup, which was not held in the Portfolio during the period, was a drag on relative performance as the stock gained on acquisition news. We continue to have a negative quantitative assessment of Citigroup’s balance sheet and a poor fundamental outlook for the company overall. Aircraft manufacturer Boeing started to outperform coincident with successful flight tests of its new models, the 787 and 747-8. Investors started to factor in earnings and cash flow potential from the 787 Dreamliner program, boosting expectations for future years. Not holding this security in the Portfolio detracted from relative results. The Mosaic Company, a large North American producer of potash and phosphate fertilizers, performed poorly during the period as it reported lower than expected earnings in April due to lessened demand for potash over year end.
Among the top relative contributors to performance were Verizon Communications (Telecommunication Services), Time Warner Cable (Consumer Discretionary), and Wells Fargo (Financials). Communications services provider Verizon Communications’ shares fell during the period as fourth quarter 2009 earnings results disappointed. The company’s wireline business showed declines in revenue and despite net new additions of wireless subscribers, its wireless business showed flat service revenues further adding to the stock’s decline. Not holding this stock benefited relative results. Cable operator Time Warner Cable’s shares rose steadily over the period helped by a pick up in advertising and expansion in its business segment growth as it looks to increase its platform, products, and salesforce. Shares of Wells Fargo, a diversified financial services company, rose on revenue and earnings that beat expectations, driven by strength in the company’s mortgage banking business. We believe that the company’s solid franchise across financial markets will continue to drive earnings power going forward.
Outlook
We continue to expect that inexpensive stocks with improving fundamentals will outperform as long as the economic backdrop remains constructive. While it is likely the US economy will see only modest growth in 2010, it is possible to find attractive opportunities including companies poised to take market share from weaker competitors and businesses where cost discipline is paying off with improved margins. On the longer term we remain cautious on potential headwinds to US economic growth, especially the need to pay for fiscal deficits and the potential negative impact on consumption, and believe that in this environment focusing on valuation and quality will be increasingly important.
“The Shareholder Letter included in this shareholder report contains certain forward-looking statements about the factors that may affect the performance of the Funds in the future. These statements are based on Fund management’s predictions and expectations concerning certain future events and their expected impact on the Funds, such as performance of the economy as a whole and of specific industry sectors, changes in the levels of interest rates, the impact of developing world events, and other factors that may influence the future performance of the Funds. Management believes these forward-looking statements to be reasonable, although they are inherently uncertain and difficult to predict. Actual events may cause adjustments in portfolio management strategies from those currently expected to be employed.”
1 | April 30, 2010
| | | | | | |
| Activa Value Fund | | |
| | | Management Commentary | | April 30, 2010 (Unaudited) |
Performance of $10,000 Initial Investment (as of April 30, 2010)
Comparison of change in value of a $10,000 investment (includes applicable sales loads)
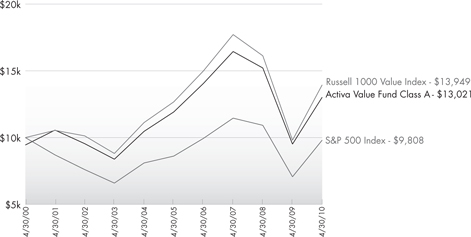
Source: Morningstar
The chart above represents historical performance of a hypothetical investment of $10,000 in the Fund since inception. Past performance does not guarantee future results. This chart does not reflect the deduction of taxes that a shareholder would pay on Fund distributions or the redemption of Fund shares.
2 | April 30, 2010
| | | | | | |
| Activa Value Fund | | |
| | | Management Commentary | | April 30, 2010 (Unaudited) |
Average Annual Total Returns (as of April 30, 2010)
| | | | | | | | | | |
| | | 1 Year | | 5 Year | | 10 Year | | Gross Expense
Ratio | | Net Expense
Ratio* |
Activa Class A - NAV1 | | 36.91% | | 1.78% | | 3.26% | | 1.95% | | 1.40% |
Activa Class A - MOP2 | | 29.36% | | 0.64% | | 2.67% | | |
Activa Class I† | | 37.44% | | 2.02% | | 3.51% | | 1.58% | | 1.15% |
Russell 1000 Value Index3 | | 42.28% | | 1.93% | | 3.38% | | | | |
S&P 500 Index4 | | 38.84% | | 2.63% | | -0.19% | | | | |
Performance data quoted represents past performance. Past performance does not guarantee future results. Investment return and principal value of an investment will fluctuate so that an investor’s shares, when sold or redeemed, may be worth more or less than the original cost. Current performance data may be higher or lower than actual data quoted. The Fund imposes a maximum Contingent Deferred Sales Charge (“CDSC”) of 1.00% to shares redeemed within the first 12 months after a purchase in excess of $1 million. Performance data does not reflect the redemption fee or the CDSC, which if reflected would reduce the performance quoted. For the most current month-end performance data please call (866) 759-5679.
On August 28, 2009 the Activa Value Fund (the “Predecessor Fund”) was reorganized into the Activa Value Fund, a series of Financial Investors Trust (the “Fund”). The Fund commenced operations on 8/28/09. Performance shown for the Fund for periods prior to 8/28/09, is derived from the performance of the Predecessor Fund, adjusted to reflect the current fees and expenses of the Activa Value Fund, net of waivers. Without these adjustments the fund’s performance would have been lower. Further information is available in the Fund prospectus.
| | 1 | Net Asset Value (NAV) is the share price without sales charges. |
| | 2 | Maximum Offering Price (MOP) includes sales charges. Class A returns include effects of the Fund’s maximum sales charge of 5.50%. |
| | 3 | The Russell 1000 Value Index measures the performance of those Russell 1000 companies with lower price-to-book ratios and lower forecasted growth values. You cannot invest directly in an index. |
| | 4 | The S&P 500 Index is the Standard & Poor’s composite index of 500 stocks, a widely recognized, unmanaged index of common stock prices. You cannot invest directly in the index. |
| | † | Prior to close of business on August 28, 2009, Class I was known as Class R of the Predecessor Fund. |
| | * | ALPS Advisors, Inc. (the “Adviser”) has given a contractual agreement to the Fund to limit the amount of the Fund’s total annual expenses, exclusive of Distribution and Service (12b-1) Fees, brokerage expenses, interest expense, taxes and extraordinary expenses, to 1.15% of the Fund’s average daily net assets. This agreement is in effect through August 31, 2011. The Adviser will be permitted to recover, on a class-by-class basis, expenses it has borne through the agreement described above to the extent that the Fund’s expenses in later periods fall below the annual rates set forth in the relevant agreement. The Fund will not be obligated to pay any such deferred fees and expenses more than one year after the end of the fiscal year in which the fee and expense was deferred. The Adviser may not discontinue this waiver without the approval by the Board of Trustees of the Fund. |
The table does not reflect the deduction of taxes that a shareholder would pay on Fund distributions or the redemption of fund shares.
Mutual funds, annuities, and other investments are not insured or guaranteed by the FDIC or by any other government agency or government sponsored agency of the federal government or any state, not deposits, obligations, or guaranteed by any bank or its affiliates and are subject to investment risks, including possible loss of the principal amount invested.
There is no guarantee that the fund will continue to hold any one particular security or stay invested in any one particular company. The composition of the fund’s top holdings is subject to change. Performance figures are historical and reflect the change in share price, reinvested distributions, changes in net asset value, sales charges and capital gains distributions, if any.
Subject to investment risks, including possible loss of the principal amount invested. Derivatives generally are more sensitive to changes in economic or market conditions than other types of investments; this could result in losses that significantly exceed the funds original investment.
3 | April 30, 2010
| | | | | | |
| Activa Value Fund | | |
| | | Disclosure of Fund Expenses | | April 30, 2010 (Unaudited) |
As a shareholder of Activa Value Fund (the “Fund”), you will incur two types of costs: (1) transaction costs, including applicable sales charges (loads); and (2) ongoing costs, including management fees, distribution and service (12b-1) fees, shareholder service fees and other Fund expenses. The following examples are intended to help you understand your ongoing costs (in dollars) of investing in the Fund and to compare these costs with the ongoing costs of investing in other mutual funds. The examples are based on an investment of $1,000 invested on January 1, 2010 and held until April 30, 2010.
Actual Expenses. The first line of the table on the next page provides information about actual account values and actual expenses. You may use the information in this line, together with the amount you invested, to estimate the expenses that you paid over the period. Simply divide your account value by $1,000 (for example, an $8,600 account value divided by $1,000 = 8.6), then multiply the result by the number in the first line under the heading “Expenses Paid During Period” to estimate the expenses you paid on your account during this period.
Hypothetical Example for Comparison Purposes. The second line of the table on the next page provides information about hypothetical account values and hypothetical expenses based on the Fund’s actual expense ratio and an assumed rate of return of 5% per year before expenses, which is not the Fund’s actual return. The hypothetical account values and expenses may not be used to estimate the actual ending account balance or expenses you paid for the period. You may use this information to compare the ongoing costs of investing in the Fund and other mutual funds. To do so, compare this 5% hypothetical example with the 5% hypothetical examples that appear in the shareholder reports of the other funds.
The expenses shown in the table are meant to highlight ongoing Fund costs only and do not reflect transaction fees, such as sales charges or exchange fees. Therefore, the second line of the table on the next page is useful in comparing ongoing costs only, and may not help you determine the relative total costs of owning different funds. In addition, if these transactional costs were included, your costs would have been higher.
The examples are based on an investment of $1,000 invested on January 1, 2010 and held until April 30, 2010.
| | | | | | | | |
| | | Beginning Account
Value 1/1/10 | | Ending Account
Value 4/30/10 | | Expense Ratio | | Expense Paid
During Period(a)
1/1/10-4/30/10 |
Class A | | | | | | | | |
Actual | | $ 1,000.00 | | $ 1,072.20 | | 1.40% | | $ 4.77 |
Hypothetical (5% return before expenses) | | $ 1,000.00 | | $ 1,011.84 | | 1.40% | | $ 4.63 |
| | | | |
Class I | | | | | | | | |
Actual | | $ 1,000.00 | | $ 1,074.70 | | 1.15% | | $ 3.92 |
Hypothetical (5% return before expenses) | | $ 1,000.00 | | $ 1,012.66 | | 1.15% | | $ 3.80 |
| | (a) | Expenses are equal to the Fund’s annualized expense ratio multiplied by the average account value over the period, multiplied by the number of days in the most recent fiscal period (120), then divided by 365. |
4 | April 30, 2010
| | | | | | |
| Activa Value Fund | | |
| | | Statement of Investments | | April 30, 2010 |
| | | | | |
| | | Shares | | Value (Note 1) |
| |
COMMON STOCKS (99.44%) | | | |
Consumer Discretionary (10.22%) | | | |
Automobiles & Components (2.31%) | | | |
Ford Motor Co.(a) | | 75,200 | | $ | 979,104 |
TRW Automotive Holdings Corp.(a) | | 14,100 | | | 454,161 |
| | | | | |
| | | | | 1,433,265 |
| | | | | |
| |
Consumer Durables & Apparel (0.63%) | | | |
Whirlpool Corp. | | 3,600 | | | 391,932 |
| | | | | |
| |
Consumer Services (0.55%) | | | |
Apollo Group, Inc., Class A(a) | | 5,900 | | | 338,719 |
| | | | | |
| |
Media (3.31%) | | | |
CBS Corp., Class B | | 27,700 | | | 449,017 |
Gannett Co., Inc. | | 20,800 | | | 354,016 |
Time Warner Cable, Inc. | | 15,939 | | | 896,569 |
Time Warner, Inc. | | 10,800 | | | 357,264 |
| | | | | |
| | | | | 2,056,866 |
| | | | | |
| |
Retailing (3.42%) | | | |
The Gap, Inc. | | 47,500 | | | 1,174,675 |
Kohl’s Corp.(a) | | 4,800 | | | 263,952 |
Lowe’s Cos, Inc. | | 11,100 | | | 301,032 |
Office Depot, Inc.(a) | | 56,300 | | | 386,218 |
| | | | | |
| | | | | 2,125,877 |
| | | | | |
| |
TOTAL CONSUMER DISCRETIONARY | | | 6,346,659 |
| | | | | |
| | |
Consumer Staples (4.76%) | | | | | |
Food Beverage & Tobacco (3.85%) | | | |
Altria Group, Inc. | | 19,500 | | | 413,205 |
Archer-Daniels-Midland Co. | | 17,500 | | | 488,950 |
Dr Pepper Snapple Group, Inc. | | 9,300 | | | 304,389 |
Philip Morris International, Inc. | | 14,225 | | | 698,163 |
Smithfield Foods, Inc.(a) | | 25,900 | | | 485,366 |
| | | | | |
| | | | | 2,390,073 |
| | | | | |
| |
Household & Personal Products (0.91%) | | | |
Kimberly-Clark Corp. | | 9,200 | | | 563,592 |
| | | | | |
| | |
TOTAL CONSUMER STAPLES | | | | | 2,953,665 |
| | | | | |
| | |
Energy (17.98%) | | | | | |
Energy (17.98%) | | | | | |
Apache Corp. | | 1,400 | | | 142,464 |
Baker Hughes, Inc. | | 10,500 | | | 522,480 |
Cabot Oil & Gas Corp. | | 6,700 | | | 242,071 |
Chevron Corp. | | 18,019 | | | 1,467,467 |
| | | | | |
| | | Shares | | Value (Note 1) |
| | |
Energy (continued) | | | | | |
ConocoPhillips | | 29,500 | | $ | 1,746,105 |
EOG Resources, Inc. | | 3,600 | | | 403,632 |
Exxon Mobil Corp. | | 36,864 | | | 2,501,223 |
Hess Corp. | | 10,000 | | | 635,500 |
Marathon Oil Corp. | | 33,000 | | | 1,060,950 |
National Oilwell Varco, Inc. | | 17,500 | | | 770,525 |
Occidental Petroleum Corp. | | 13,700 | | | 1,214,642 |
XTO Energy, Inc. | | 9,700 | | | 460,944 |
| | | | | |
| | | | | 11,168,003 |
| | | | | |
| | |
TOTAL ENERGY | | | | | 11,168,003 |
| | | | | |
| |
Financials (25.89%) | | | |
Banks (6.99%) | | | |
Comerica, Inc. | | 12,360 | | | 519,120 |
PNC Financial Services Group, Inc. | | 9,900 | | | 665,379 |
US Bancorp | | 21,800 | | | 583,586 |
Wells Fargo & Co. | | 77,800 | | | 2,575,958 |
| | | | | |
| | | | | 4,344,043 |
| | | | | |
| |
Diversified Financials (10.33%) | | | |
Ameriprise Financial, Inc. | | 23,200 | | | 1,075,552 |
Bank of America Corp. | | 106,312 | | | 1,895,543 |
The Goldman Sachs Group, Inc. | | 7,500 | | | 1,089,000 |
JPMorgan Chase & Co. | | 47,700 | | | 2,031,066 |
SLM Corp.(a) | | 26,600 | | | 325,584 |
| | | | | |
| | | | | 6,416,745 |
| | | | | |
| | |
Insurance (7.11%) | | | | | |
ACE, Ltd. | | 15,200 | | | 808,488 |
Allied World Assurance Co. Holdings, Ltd. | | 7,800 | | | 339,846 |
Axis Capital Holdings, Ltd. | | 15,000 | | | 467,550 |
Everest Re Group, Ltd. | | 4,300 | | | 329,595 |
Genworth Financial, Inc.(a) | | 23,600 | | | 389,872 |
Hartford Financial Services Group, Inc. | | 24,100 | | | 688,537 |
Prudential Financial, Inc. | | 9,300 | | | 591,108 |
The Travelers Cos. Inc. | | 8,500 | | | 431,290 |
Unum Group | | 15,200 | | | 371,944 |
| | | | | |
| | | | | 4,418,230 |
| | | | | |
| | |
Real Estate (1.46%) | | | | | |
Annaly Capital Management, Inc. | | 27,200 | | | 461,040 |
Forest City Enterprises, Inc.(a) | | 29,000 | | | 448,050 |
| | | | | |
| | | | | 909,090 |
| | | | | |
| | |
TOTAL FINANCIALS | | | | | 16,088,108 |
| | | | | |
5 | April 30, 2010
| | | | | | |
| Activa Value Fund | | |
| | | Statement of Investments | | April 30, 2010 |
| | | | | |
| | | Shares | | Value (Note 1) |
| |
Health Care (10.10%) | | | |
Health Care Equipment & Services (2.63%) | | | |
McKesson Corp. | | 7,600 | | $ | 492,556 |
UnitedHealth Group, Inc. | | 17,700 | | | 536,487 |
WellPoint, Inc.(a) | | 11,200 | | | 602,560 |
| | | | | |
| | | | | 1,631,603 |
| | | | | |
|
Pharmaceuticals, Biotechnology & Life Sciences (7.47%) |
Amgen, Inc.(a) | | 11,600 | | | 665,376 |
Eli Lilly & Co. | | 24,100 | | | 842,777 |
Forest Laboratories, Inc.(a) | | 9,828 | | | 267,911 |
Merck & Co., Inc. | | 17,900 | | | 627,216 |
Pfizer, Inc. | | 105,523 | | | 1,764,345 |
Watson Pharmaceuticals, Inc.(a) | | 11,100 | | | 475,302 |
| | | | | |
| | | | | 4,642,927 |
| | | | | |
| | |
TOTAL HEALTH CARE | | | | | 6,274,530 |
| | | | | |
| | |
Industrials (13.06%) | | | | | |
Capital Goods (11.16%) | | | | | |
3M Co. | | 3,800 | | | 336,946 |
Caterpillar, Inc. | | 8,400 | | | 571,956 |
Dover Corp. | | 13,500 | | | 704,970 |
General Dynamics Corp. | | 9,400 | | | 717,784 |
General Electric Co. | | 72,800 | | | 1,373,008 |
Joy Global, Inc. | | 5,300 | | | 301,093 |
Northrop Grumman Corp. | | 9,700 | | | 657,951 |
Oshkosh Corp.(a) | | 7,000 | | | 270,340 |
Parker Hannifin Corp. | | 8,500 | | | 588,030 |
Raytheon Co. | | 8,400 | | | 489,720 |
United Technologies Corp. | | 12,300 | | | 921,885 |
| | | | | |
| | | | | 6,933,683 |
| | | | | |
|
Commercial & Professional Services (0.49%) |
RR Donnelley & Sons Co. | | 14,100 | | | 303,009 |
| | | | | |
| | |
Transportation (1.41%) | | | | | |
Delta Air Lines, Inc.(a) | | 28,300 | | | 341,864 |
FedEx Corp. | | 5,900 | | | 531,059 |
| | | | | |
| | | | | 872,923 |
| | | | | |
| | |
TOTAL INDUSTRIALS | | | | | 8,109,615 |
| | | | | |
| |
Information Technology (5.47%) | | | |
Semiconductors & Semiconductor Equipment (1.04%) |
Xilinx, Inc. | | 25,100 | | | 647,078 |
| | | | | |
| | | | | |
| | | Shares | | Value (Note 1) |
| | |
Software & Services (3.19%) | | | | | |
Accenture PLC | | 14,400 | | $ | 628,416 |
Automatic Data Processing, Inc. | | 7,200 | | | 312,192 |
eBay, Inc.(a) | | 17,800 | | | 423,818 |
Microsoft Corp. | | 20,300 | | | 619,962 |
| | | | | |
| | | | | 1,984,388 |
| | | | | |
|
Technology Hardware & Equipment (1.24%) |
Lexmark International, Inc.(a) | | 12,500 | | | 463,125 |
Seagate Technology(a) | | 16,600 | | | 304,942 |
| | | | | |
| | | | | 768,067 |
| | | | | |
| |
TOTAL INFORMATION TECHNOLOGY | | | 3,399,533 |
| | | | | |
| | |
Materials (3.73%) | | | | | |
Materials (3.73%) | | | | | |
Freeport-McMoRan Copper & | | | | | |
Gold, Inc. | | 6,500 | | | 490,945 |
International Paper Co. | | 18,900 | | | 505,386 |
The Mosaic Co. | | 7,000 | | | 357,980 |
Owens-Illinois, Inc.(a) | | 8,700 | | | 308,328 |
Reliance Steel & Aluminum Co. | | 6,800 | | | 331,908 |
Valspar Corp. | | 10,200 | | | 319,464 |
| | | | | |
| | | | | 2,314,011 |
| | | | | |
| | |
TOTAL MATERIALS | | | | | 2,314,011 |
| | | | | |
|
Telecommunication Services (3.33%) |
Telecommunication Services (3.33%) |
AT&T, Inc. | | 79,445 | | | 2,070,336 |
| | | | | |
| |
TOTAL TELECOMMUNICATION SERVICES | | | 2,070,336 |
| | | | | |
| | |
Utilities (4.90%) | | | | | |
Utilities (4.90%) | | | | | |
CenterPoint Energy, Inc. | | 22,800 | | | 327,408 |
DPL, Inc. | | 8,500 | | | 239,530 |
Entergy Corp. | | 3,500 | | | 284,515 |
FPL Group, Inc. | | 4,900 | | | 255,045 |
PG&E Corp. | | 11,900 | | | 521,220 |
UGI Corp. | | 36,000 | | | 989,640 |
Xcel Energy, Inc. | | 19,700 | | | 428,475 |
| | | | | |
| | | | | 3,045,833 |
| | | | | |
| | |
TOTAL UTILITIES | | | | | 3,045,833 |
| | | | | |
| | |
TOTAL COMMON STOCKS | | | | | |
(Cost $53,030,774) | | | | | 61,770,293 |
| | | | | |
6 | April 30, 2010
| | | | | | |
| Activa Value Fund | | |
| | | Statement of Investments | | April 30, 2010 |
| | | | | | |
| 7-Day Yield | | Shares | | Value (Note 1) | |
SHORT-TERM INVESTMENTS (0.61%) | | | | |
Money Market Fund (0.61%) | | | | |
Fidelity Institutional Money Market - Money Market Portfolio - Class I 0.21% | | 377,135 | | $ | 377,135 | |
| | | | | | |
| |
TOTAL SHORT-TERM INVESTMENTS (Cost $377,135) | | | 377,135 | |
| | | | | | |
| |
TOTAL INVESTMENTS - (100.05%) (Cost $53,407,909) | | $ | 62,147,428 | |
| |
Liabilities in Excess of Other Assets (-0.05%) | | | (33,166 | ) |
| | | | | | |
| |
NET ASSETS (100.00%) | | $ | 62,114,262 | |
| | | | | | |
| (a) | Non-Income Producing Security. |
For Fund compliance purposes, the Fund’s industry classifications refer to any one or more of the industry sub-classifications used by one or more widely recognized market indexes or ratings group indexes, and/or as defined by Fund management. This definition may not apply for purposes of this report, which may combine industry subclassifications for reporting ease. Industries are shown as a percent of net assets. These industry classifications are based on third-party definitions. The definitions are industry terms and do not reflect the legal status of any of the investments or the companies in which the Fund has invested.
See Notes to Financial Statements.
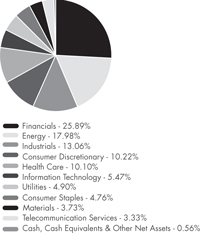
Top Ten Holdings (as a % of Net Assets) †
| | |
Wells Fargo & Co. | | 4.15% |
Exxon Mobil Corp. | | 4.03% |
AT&T, Inc. | | 3.33% |
JPMorgan Chase & Co. | | 3.27% |
Bank of America Corp. | | 3.05% |
Pfizer, Inc. | | 2.84% |
ConocoPhillips | | 2.81% |
Chevron Corp. | | 2.36% |
General Electric Co. | | 2.21% |
Occidental Petroleum Corp. | | 1.96% |
Top Ten Holdings | | 30.01% |
† Holdings are subject to change.
Industry Sector Allocation (as a % of Net Assets)
7 | April 30, 2010
| | | | | | |
| ALPS | GNI Long-Short Fund | | |
| | | Management Commentary | | April 30, 2010 (Unaudited) |
In the simplest of terms, risk is the measurable possibility of loss, or, perhaps more accurately, it’s the uncertainty that an investment will earn its required rate of return. We thought it would be useful to start off our letter with that reminder because, frankly, the concept of risk is something that has been wholly unfamiliar to investors over the past year as a carefree, happy-go-lucky mindset propelled high beta, a measure of volatility, pro-cyclical stocks on a nearly vertical course.
We should also acknowledge right up front that we could stand to learn a thing or two about upside risk, having completely underestimated the ease with which the nightmare of recent years has been wished away and the willingness of investors to bury their heads in the sand to the many threats still lurking. Specifically, during the period covered in this report, from inception through April 30, 2010, the Fund Class A shares lost -24.48% while the S&P 1500 Index gained 16.19%. The performance was negatively impacted by our cautious view during this episode of exuberance, which was expressed through very low net exposure to the market. Given the worrisome conditions described below, this position seemed both warranted and prudent. In fact, beginning in late April, the market began slowly re-pricing risk as investors started to recognize some of the risks that we outline below; while this process is now well underway, it is incomplete, in our opinion. Besides being too hedged, performance was also encumbered by a few short-term, event-driven trades that did not go our way within the biotech and defense sectors in companies like InterMune, Inc. and Oshkosh Corp. While we intend to put lessons learned from this period to work, we believe our disciplined, analysis-based approach will continue to serve us well, as it has over the past 11 years that we have managed similar portfolios.
Although it may be true that the economy has stopped contracting and some sort of tenuous recovery is underway, the rebound has been almost entirely manufactured by temporary growth drivers like extraordinary levels of government stimulus and inventory rebalancing. Real final demand that’s required to power a durable, self-sustaining economic expansion has been nearly undetectable. The upturn itself has been rather anemic – not a single data point is back to its prior, pre-crisis high – especially considering the trillion-dollar sum spent to generate it and the severity of the contraction preceding it. Now, as inventory restocking and government support begin to fade over the coming quarters, whether the economy can ride on without its training wheels is still a very big question mark.
For one thing, the recovery is hobbled by a labor market that is still exceptionally weak, especially relative to most other post-recession expansions. While layoffs finally seem to be easing, jobs remain
elusive, as businesses are still too wary to add to payrolls. Many jobs from the old bubble sectors, like construction or finance, might not surface again for some time. The number of underemployed workers, including those that have simply surrendered and left the workforce altogether, has crept back up to over 17%. A frightening 6.7 million people have been jobless for over six months, and, with their skills wasting away, the long-term unemployed are more likely to garner a lower wage whenever it is that they’re able to get one.1
Taken together, the large supply-demand imbalance in the labor market – about six job seekers jostling for every opening– has weighed down income growth. Transfer payments, government handouts to subsidize income, account for over 20% of personal income.2
Housing, too, is still a problem. As a classic leading indicator of the economy – and as the match that helped light, and then burn, the financial system only a few years ago – housing activity should be booming if the broader recovery were as rigorous as equity investors would have you believe. But it’s not.
Home prices nationwide remain depressed. Mortgage delinquencies are soaring as many homeowners are still distressed. Job losses have, of course, made it tough for borrowers to keep up with mortgage payments, but the stigma of reneging on one’s debt obligations has also faded, with the notion of “strategic default”– purposefully defaulting on a mortgage to save money – quickly gaining in popularity. Further threatening to hasten the pace of delinquencies: Several hundred billion dollars’ worth of adjustable rate mortgages offered at the height of the housing frenzy that are now resetting (on a schedule that’s expected to accelerate in coming months and quarters), causing monthly payments to balloon.
Foreclosures, currently at a record high, are expected to hit 4.5 million this year, up from 2.8 million in 2009, according to RealtyTrac.3 The very large inventory of bank-possessed properties– combined with softer demand as tax credits disappear – could cut home values further still, causing even more homeowners to owe more than their home is worth.
Home loans aside, the contraction in consumer credit is intense as the borrowing binge from bygone days is purged. American households don’t have much of an appetite for more debt, and bank lending standards are tighter, too, making credit harder to come by anyhow. This contraction in credit availability also impacts the ability for small businesses to fund themselves and add payrolls. The odds are stacked against a lasting expansion in today’s modern economy without credit growth.
8 | April 30, 2010
| | | | | | |
| ALPS | GNI Long-Short Fund | | |
| | | Management Commentary | | April 30, 2010 (Unaudited) |
We believe a bleak labor market, less housing wealth, contracting credit availability and nonexistent income growth outside of government transfers all point to a fragile consumer whose spending is likely to be constrained for some time. With a debt burden that’s still high relative to income, especially given the shaky job market, households are liable to focus on debt service more than spending as the deleveraging process carries on.
U.S. consumers are clearly strained, their spending habits structurally changed by the balance-sheet scars of years past. But when it comes to financial worries, they are in good company.
Through an endless series of costly bailouts and guarantees, the stresses in the private sector have been transferred to the public sector, proving once again that there is no free lunch. Many governments around the world find themselves overleveraged, struggling with bloated budgets requiring some combination of government-spending cuts or tax hikes – both of which could smother still-fragile growth – while diminishing creditworthiness drives up borrowing costs. No doubt, sovereign credit risk is palpable and currently one of our primary concerns.
The vulnerable euro zone economies of Greece, Portugal, Ireland and Spain are far from the only highly indebted, advanced nations facing unsustainable fiscal pressures. According to the International Monetary Fund (“IMF”), by 2014, all members of the G7, the finance ministers of Canada, France, Germany, Italy, Japan, United Kingdom and United States, (with the exception of Canada and Germany) will have debt levels at least as large as, if not in excess of, their entire economic output.4 Dramatic austerity measures are in order, tough medicine for a still-delicate recovery that’s heavily dependent on government support. The fiscal cuts required for the weaker nations in the European Union (“EU”) to receive a bailout will, in our opinion, put much of Europe back into contraction mode.
Here at home, all of Uncle Sam’s generous check writing, accompanied by a swift collapse in tax revenue, produced a record $1.4 trillion budget deficit last year.5 Taxes are headed dramatically higher and spending programs must be controlled. Even then, the U.S. government’s borrowing needs are considerable and entirely reliant on a buyer of its ever-growing pile of obligations.
State and local governments, facing a similar crunch but without the luxury of being able to maintain a shortfall indefinitely, are swiftly addressing gaping, billion-dollar holes in their own budgets by firing public employees, slashing services, or deferring payments to pension plans while also raising taxes to increase revenue. As states boldly reduce services and boost taxes to repair their broken balance sheets – fighting estimated budget gaps totaling a whopping $136 billion through fiscal year 2012 – they risk muting the stimulative effects of federal aid.6
Now, contrast these realities with the perception of equity investors. Excessively optimistic and enormously complacent, investors are largely taking for granted an orderly withdrawal of government support and a vigorous, organically–driven recovery – as if the patient was completely cured – while trivializing downside risk and the possibility of a relapse. We continue to expect the healing process to be a prolonged one after such a massive financial-system accident and maintain that genuine risks to the recovery are currently underappreciated and mispriced. Investors could be disappointed as the trajectory of earnings and economic activity turns out to be more moderate than is now widely expected. We imagine, in the coming months and quarters, as downside risk is reassessed, there will be a convergence between our view and the one currently discounted in the marketplace. It appears that this process has already started but it is incomplete.
Bear in mind that even after the recent surge in stock prices, impressive as it’s been, the S&P 500 Index7 is down over the past decade, even with the benefit dividend income. Speculative fervor and mindless risk-taking can sometimes lead to impressive short-term results, but invariably, over a complete market cycle, valuations do matter in determining an investor’s long-term returns: Rich valuations are inevitably followed by lower returns.
Though select pockets of value exist today, by nearly every measure, prevailing broad-market equity valuations seem excessive. Yale University economics professor Robert Shiller’s data, for example, indicates that the S&P 500 is currently trading at 21.7 times trailing, cyclically adjusted earnings compared to its long-term average valuation of 16.4 times, suggesting the market is quite overvalued.8
| | 1 | Bureau of Labor Statistics (BLS) |
| | 2 | Bureau of Economic Analysis (BEA) |
| | 3 | Bloomberg News, “Mortgage Modifications Rise as U.S. Program Grows,” by Theo Francis, Feb. 17, 2010 |
| | 4 | Speech by John Lipsky, IMF on March 21, 2010 (http://www.imf.org/external/np/speeches/2010/032110.htm) |
| | 5 | Congressional Budget Office |
| | 6 | State Fiscal Update, February 2010, National Association of State Budget Officers and National Governors Association |
| | 7 | The S&P 500 Index is the Standard & Poor’s composite index of 500 stocks, a widely recognized, unmanaged index of common stock prices. You cannot invest directly in an index. |
| | 8 | Robert Shiller, http://www.econ.yale.edu/~shiller/data.htm |
9 | April 30, 2010
| | | | | | |
| ALPS | GNI Long-Short Fund | | |
| | | Management Commentary | | April 30, 2010 (Unaudited) |
After a dizzying rally that has carried valuations to extreme levels – and with yields possibly on the rise – the equity market’s longer-term forward return from this point is likely to be inadequate. As a result, we believe a less-correlated, defensive posture will be greatly rewarded.
As to the current portfolio, we remain bullish on the long-term prospects for gold; the production of the shiny metal has been largely dormant over the past decade but the demand for it from the world’s central banks is intensifying. We’re also finding opportunities on the long side in higher quality, larger companies, mostly within the health care, technology and consumer staples areas. We’re particularly keen on certain themes like the Internet, precious metals, defensive high yielders and large cap outperformance relative to small cap. On the short side, we are carefully looking at cyclical companies or broken-momentum stories that are popular, over-owned and expensive, complemented by broad index-related short exposure.
As a result of our cautious view stemming from the toxic combination of high valuations, an overbought and universally loved
market, and a misperception that there is zero risk in owning risky assets, our net exposure has recently been below its historical range of 20-60% net long.
GNI is dedicated to creating long-term value in a variety of different market environments in a deliberate and methodical fashion, while always remaining mindful of the risks and challenges that we face. We believe that our disciplined approach, which eschews jumping into a hazardous, frenzy-driven rally, has positioned us to weather– and, ideally, profit from – the more difficult setting we envision. In over 11 years of managing long/short equity assets, we believe that philosophy has served our clients well. Thank you for entrusting us with the management of your assets. It is both an honor and a great privilege.
Sincerely,
Charles L. Norton, CFA | Principal
Allen R. Gillespie, CFA | Principal
Performance of $10,000 Initial Investment (as of April 30, 2010)
Comparison of change in value of a $10,000 investment (includes applicable sales loads)
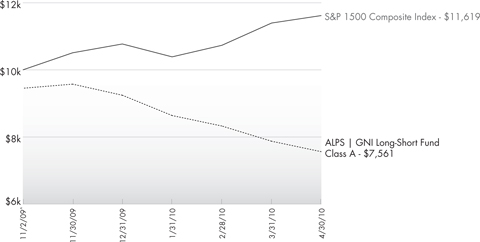
The chart above represents historical performance of a hypothetical investment of $10,000 in the Fund since inception. Past performance does not guarantee future results. This chart does not reflect the deduction of taxes that a shareholder would pay on Fund distributions or the redemption of Fund shares.
10 | April 30, 2010
| | | | | | |
| ALPS | GNI Long-Short Fund | | |
| | | Management Commentary | | April 30, 2010 (Unaudited) |
Cumulative Return (as of April 30, 2010)
| | | | | | |
| | | Since Inception^ | | Gross Expense Ratio | | Net Expense Ratio* |
Class A (NAV)1 | | -20.10% | | 3.58% | | 2.25% |
Class A (MOP)2 | | -24.48% | | |
Class I | | -19.90% | | 3.33% | | 2.00% |
S&P 1500 Composite Index3 | | 16.19% | | | | |
Performance data quoted represents past performance. Past performance does not guarantee future results. Investment return and principal value of an investment will fluctuate so that an investor’s shares, when sold or redeemed, may be worth more or less than the original cost. Current performance data may be higher or lower than actual data quoted. The Fund imposes a 2.00% redemption fee on shares held for less than 90 days. The Fund imposes a maximum Contingent Deferred Sales Charge (“CDSC”) of 1.00% to shares redeemed within the first 12 months after a purchase in excess of $1 million. Performance data does not reflect the redemption fee or the CDSC, which if reflected would reduce the performance quoted. For the most current month-end performance data please call (866) 759-5679.
Subject to investment risks, including possible loss of the principal amount invested. Derivatives generally are more sensitive to changes in economic or market conditions than other types of investments; this could result in losses that significantly exceed the funds original investment.
| | 1 | Net Asset Value (NAV) is the share price without sales charges. |
| | 2 | Maximum Offering Price (MOP) includes sales charges. Class A returns include effects of the Fund’s maximum sales charge of 5.50%. |
| | 3 | S&P Composite 1500: an equity benchmark that combines three leading indices, the S&P 500®, the S&P MidCap 400, and the S&P SmallCap 600 to cover approximately 90% of the U.S. market capitalization. It is designed for investors seeking to replicate the performance of the U.S. equity market or benchmark against a representative universe of tradable stocks. You cannot invest directly in the index. |
| | ^ | Fund inception date of 11/02/09. |
| | * | The Adviser has given a contractual agreement to the Fund to limit the amount of the Fund’s total annual expenses, exclusive of Distribution and Service (12b-1) Fees, brokerage expenses, interest expense, taxes and extraordinary expenses, to 2.00% of the Fund’s average daily net assets. This agreement is in effect through October 31, 2010 and is reevaluated on an annual basis. Without this agreement, expenses could be higher. The Adviser will be permitted to recover, on a class-by-class basis, expenses it has borne through the agreement described above to the extent that the Fund’s expenses in later periods fall below the annual rates set forth in the relevant agreement. The Fund will not be obligated to pay any such deferred fees and expenses more than one year after the end of the fiscal year in which the fee and expense was deferred. |
The Fund enters into a short sale by selling a security it has borrowed. If the market price of a security increases after the Fund borrows the security, the Fund will suffer a potentially unlimited loss when it replaces the borrowed security at the higher price. Short sales also involve transaction and other costs that will reduce potential Fund gains and increase potential Fund losses. Please refer to the prospectus for complete information regarding all risks associated with the fund.
The Fund is less than a year old and has limited operating history. This fund is not suitable for all investors. Subject to investment risks, including possible loss of the principal amount invested.
Derivatives generally are more sensitive to changes in economic or market conditions than other types of investments; this could result in losses that significantly exceed the Fund’s original investment.
11 | April 30, 2010
| | | | | | |
| ALPS | GNI Long-Short Fund | | |
| | | Disclosure of Fund Expenses | | April 30, 2010 (Unaudited) |
As a shareholder of ALPS | GNI Long-Short Fund (the “Fund”), you will incur two types of costs: (1) transaction costs, including applicable sales charges (loads); and (2) ongoing costs, including management fees, distribution and service (12b-1) fees, shareholder service fees and other Fund expenses. The following examples are intended to help you understand your ongoing costs (in dollars) of investing in the Fund and to compare these costs with the ongoing costs of investing in other mutual funds. The examples are based on an investment of $1,000 invested on November 2, 2009 and held until April 30, 2010.
Actual Expenses. The first line of the table on the next page provides information about actual account values and actual expenses. You may use the information in this line, together with the amount you invested, to estimate the expenses that you paid over the period. Simply divide your account value by $1,000 (for example, an $8,600 account value divided by $1,000 = 8.6), then multiply the result by the number in the first line under the heading “Expenses Paid During Period” to estimate the expenses you paid on your account during this period.
Hypothetical Example for Comparison Purposes. The second line of the table on the next page provides information about hypothetical account values and hypothetical expenses based on the Fund’s actual expense ratio and an assumed rate of return of 5% per year before expenses, which is not the Fund’s actual return. The hypothetical account values and expenses may not be used to estimate the actual ending account balance or expenses you paid for the period. You may use this information to compare the ongoing costs of investing in the Fund and other mutual funds. To do so, compare this 5% hypothetical example with the 5% hypothetical examples that appear in the shareholder reports of the other funds.
The expenses shown in the table are meant to highlight ongoing Fund costs only and do not reflect transaction fees, such as sales charges or exchange fees. Therefore, the second line of the table on the next page is useful in comparing ongoing costs only, and may not help you determine the relative total costs of owning different funds. In addition, if these transactional costs were included, your costs would have been higher.
The examples are based on an investment of $1,000 invested on November 2, 2009 (Inception) and held until April 30, 2010.
| | | | | | | | |
| | | Beginning Account
Value 11/2/09 | | Ending Account
Value 4/30/10 | | Expense Ratio | | Expense Paid
During Period(a)
11/2/09-4/30/10 |
Class A | | | | | | | | |
Actual | | $ 1,000.00 | | $ 799.00 | | 2.90% | | $ 12.72 |
Hypothetical (5% return before expenses) | | $ 1,000.00 | | $ 1,010.24 | | 2.90% | | $ 14.21 |
| | | | |
Class I | | | | | | | | |
Actual | | $ 1,000.00 | | $ 801.00 | | 2.78% | | $ 12.21 |
Hypothetical (5% return before expenses) | | $ 1,000.00 | | $ 1,010.83 | | 2.78% | | $ 13.63 |
| | (a) | Expenses are equal to the Fund’s annualized expense ratio multiplied by the average account value over the period, multiplied by the number of days in the most recent fiscal half year (178), then divided by 365. |
12 | April 30, 2010
| | | | | | |
| ALPS | GNI Long-Short Fund | | |
| | | Statement of Investments | | April 30, 2010 |
| | | | | |
| | | Shares | | Value (Note 1) |
| |
COMMON STOCKS (71.43%) | | | |
Basic Materials (7.94%) | | | |
Mining (7.94%) | | | |
Newmont Mining Corp.(a) | | 13,000 | | $ | 729,040 |
| | | | | |
| |
TOTAL BASIC MATERIALS | | | 729,040 |
| | | | | |
| |
Communications (5.18%) | | | |
Internet (5.18%) | | | |
Drugstore.Com, Inc.(a)(b) | | 130,000 | | | 475,800 |
| | | | | |
| |
TOTAL COMMUNICATIONS | | | 475,800 |
| | | | | |
| |
Consumer, Cyclical (4.56%) | | | |
Retail (4.56%) | | | |
J Crew Group, Inc.(b) | | 9,000 | | | 418,230 |
| | | | | |
| |
TOTAL CONSUMER, CYCLICAL | | | 418,230 |
| | | | | |
|
Consumer, Non-Cyclical (25.48%) |
Agriculture (14.53%) | | | | | |
Lorillard, Inc. | | 4,500 | | | 352,665 |
Philip Morris International, Inc.(a) | | 20,000 | | | 981,600 |
| | | | | |
| | | | | 1,334,265 |
| | | | | |
Biotechnology (10.95%) | | | | | |
Dendreon Corp.(b) | | 5,000 | | | 271,100 |
Human Genome Sciences, Inc.(a)(b) | | 26,500 | | | 733,785 |
| | | | | |
| | | | | 1,004,885 |
| | | | | |
| |
TOTAL CONSUMER, NON-CYCLICAL | | | 2,339,150 |
| | | | | |
| | |
Energy (3.52%) | | | | | |
Oil&Gas Services (3.52%) | | | |
Baker Hughes, Inc. | | 6,500 | | | 323,440 |
| | | | | |
| |
TOTAL ENERGY | | | 323,440 |
| | | | | |
| | |
Financials (4.66%) | | | | | |
Diversified Financial Services (4.66%) |
Legg Mason, Inc. | | 13,500 | | | 427,815 |
| | | | | |
| | |
TOTAL FINANCIALS | | | | | 427,815 |
| | | | | |
| | |
Industrial (5.25%) | | | | | |
Electrical Components & Equipment (5.25%) |
Harbin Electric, Inc.(a)(b) | | 22,000 | | | 482,020 |
| | | | | |
| | |
TOTAL INDUSTRIAL | | | | | 482,020 |
| | | | | |
| | | | | | | | | |
| | | Shares | | Value
(Note 1) |
| |
Technology (14.84%) | | | |
Software (14.84%) | | | |
Bottomline Technologies, Inc.(b) | | 30,000 | | $ | 522,000 |
Oracle Corp. | | 32,500 | | | 839,800 |
| | | | | | | | | |
| | | | | 1,361,800 |
| | | | | | | | | |
| | |
TOTAL TECHNOLOGY | | | | | 1,361,800 |
| | | | | | | | | |
| |
TOTAL COMMON STOCKS (Cost $6,506,772) | | | 6,557,295 |
| | | | | | | | | |
|
Exchange Traded Funds (5.03%) |
SPDR Gold Trust(b) | | 4,000 | | | 461,520 |
| | | | | | | | | |
| |
TOTAL EXCHANGE TRADED FUNDS (Cost $450, 784) | | | 461,520 |
| | | | | | | | | |
| | | Expiration
Date | | Exercise
Price | | Number of
Contracts | | Value
(Note 1) |
|
Purchased Put Options (b) (6.09%) |
Harbin Electric, Inc. |
| | June, 2010 | | $20.00 | | 220 | | | 19,250 |
Human Genome Science |
| | July, 2010 | | 30.00 | | 270 | | | 108,675 |
Intuitive Surgical |
| | July, 2010 | | 340.00 | | 20 | | | 24,000 |
iShares Russell 2000 Index Fund |
| | May, 2010 | | 71.00 | | 125 | | | 17,500 |
iShares Russell 2000 Index Fund |
| | June, 2010 | | 70.00 | | 600 | | | 140,400 |
SPDR DJIA Trust |
| | May, 2010 | | 110.00 | | 600 | | | 105,000 |
SPDR S&P 500 ETF Trust |
| | May, 2010 | | 120.00 | | 450 | | | 116,550 |
Toyota Motor Corp. |
| | July, 2010 | | 75.00 | | 100 | | | 27,500 |
| | | | | | | | | |
| |
TOTAL PURCHASED PUT OPTIONS (Cost $487,169) | | | 558,875 |
| | | | | | | | | |
| | | |
| | | 7-Day Yield | | Shares/Principal
Amount | | Value
(Note 1) |
|
SHORT-TERM INVESTMENTS (36.69%) |
U.S. Government & Agency Obligations (21.79%) |
U.S. Treasury Bill DN |
5/27/10(a) | | 0.08% | | $2,000,000 | | | 1,999,884 |
| | | | | | | | | |
|
Money Market Fund (14.90%) |
Dreyfus Treasury Prime Cash Management, Investor Shares |
| | 0.00004% | | 1,367,947 | | | 1,367,947 |
| | | | | | | | | |
| | | | | | |
| ALPS | GNI Long-Short Fund | | |
| | | Statement of Investments | | April 30, 2010 |
| | | | | | | | | | |
| | | | | | | | | Value (Note 1) |
| |
TOTAL SHORT-TERM INVESTMENTS (Cost $3,367,831) | | $ | 3,367,831 |
| | | | | | | | | | |
| |
TOTAL INVESTMENTS - (119.24%) (Cost $10,812,556) | | | 10,945,521 |
| |
Liabilities in Excess of Other Assets (-19.24%) | | | (1,766,447) |
| | | | | | | | | | |
| |
NET ASSETS (100.00%) | | $ | 9,179,074 |
| | | | | | | | | | |
|
| SCHEDULE OF OPTIONS WRITTEN |
| | | | |
| | | Expiration
Date | | Exercise
Price | | Number of
Contracts | | Value
(Note 1) |
|
PUT OPTIONS WRITTEN (b) |
Human Genome Science |
| | July, 2010 | | $ | 23.00 | | 65 | | $ | (6,370) |
SPDR DJIA Trust |
| | May, 2010 | | | 108.00 | | 600 | | | (66,600) |
SPDR S&P 500 ETF Trust |
| | May, 2010 | | | 117.00 | | 250 | | | (36,250) |
| | | | | | | | | | |
| |
TOTAL PUT OPTIONS WRITTEN (Premiums received $66,510) | | | (109,220) |
| | | | | | | | | | |
| |
TOTAL OPTIONS WRITTEN (Premiums received $66,510) | | $ | (109,220) |
| | | | | | | | | | |
| | | | | |
| | | Value
Shares | | (Note 1) |
|
SCHEDULE OF SECURITIES SOLD SHORT |
|
COMMON STOCKS (b) |
Abercrombie & Fitch Co., Class A | | (3,000) | | $ | (131,190) |
Advanced Micro Devices, Inc. | | (7,500) | | | (67,950) |
Boyd Gaming Corp. | | (10,000) | | | (127,000) |
Cliffs Natural Resources, Inc. | | (750) | | | (46,898) |
Diamond Offshore Drilling, Inc. | | (2,000) | | | (158,200) |
First Solar, Inc. | | (1,400) | | | (200,970) |
Freeport-McMoRan Copper & Gold, Inc. | | (3,000) | | | (226,590) |
Reynolds American, Inc. | | (3,300) | | | (176,286) |
T Rowe Price Group, Inc. | | (3,300) | | | (189,783) |
United States Steel Corp. | | (2,500) | | | (136,650) |
| | | | | |
| |
TOTAL SECURITIES SOLD SHORT (Proceeds $1,495,832) | | $ | (1,461,517) |
| | | | | |
Common Abbreviations:
DN - Discount Note
ETF - Exchange Traded Fund
SPDR - Standard & Poor’s Depositary Receipt
| (a) | All or portion of the security is pledged as collateral on written options and/or short sales as of April 30, 2010. Aggregate collateral segregated to cover margin or segregation requirements on options contracts and short sales as of April 30, 2010 was $2,862,174. |
| (b) | Non-Income Producing Security/Securities. |
For Fund compliance purposes, the Fund’s industry classifications refer to any one or more of the industry sub-classifications used by one or more widely recognized market indexes or ratings group indexes, and/ or as defined by Fund management. This definition may not apply for purposes of this report, which may combine industry subclassifications for reporting ease. Industries are shown as a percent of net assets. These industry classifications are based on third-party definitions. The definitions are industry terms and do not reflect the legal status of any of the investments or the companies in which the Fund has invested.
See Notes to Financial Statements.
Top Ten Long Holdings (as a % of Net Assets) †
| | | |
Philip Morris International, Inc. | | 10.69 | % |
Oracle Corp. | | 9.15 | % |
Human Genome Sciences, Inc. | | 7.99 | % |
Newmont Mining Corp. | | 7.94 | % |
Bottomline Technologies, Inc. | | 5.69 | % |
Harbin Electric, Inc. | | 5.25 | % |
Drugstore.Com, Inc. | | 5.18 | % |
SPDR Gold Trust | | 5.03 | % |
Legg Mason, Inc. | | 4.66 | % |
J Crew Group, Inc. | | 4.56 | % |
Top Ten Long Holdings | | 66.14 | % |
| | † | Holdings are subject to change. |
Industry Sector Allocation (Long Positions as a % of Net Assets)

| | | | | | |
| ALPS | Red Rocks Listed Private Equity Fund | | |
| | | Management Commentary | | April 30, 2010 (Unaudited) |
Overview
It’s hard to believe that 12 months ago the world financial markets were in a state of crisis; equity indices had fallen to levels not witnessed in almost 15 years, the banking system was hemorrhaging, and private equity funds were contemplating some of the largest write-downs that they had ever experienced. To say that the financial world was at a tipping point would have been no exaggeration.
Fortunately March 2009 marked the bottom of a very long and painful decline. The pendulum had swung too far. We believe the markets had priced in the worst, or at least a scenario that didn’t come to pass…a worldwide economic depression.
Over the past 12 months the investment world has breathed a collective sigh of relief. Many prognosticators were predicting the demise of the private equity industry. We believe the commonly heard refrain was that the private equity industry was sitting on too many highly-levered portfolio companies that would break financial covenants or be unable to satisfy or refinance upcoming debt obligations. As it turned out the private equity industry, and their portfolio companies, weathered the storm reasonably well. The high yield market, which caters to private equity backed companies, had record issuances in 2009. The debt markets were all too happy to re-finance many of the private equity loans. And the private equity industry took advantage of this wherever possible.
With this as a backdrop, 2010 has gotten off to a good start. Private equity deal activity has picked up significantly, both on the sell side (sales of portfolio companies along with initial public offerings (“IPOs”)) and on the buy side (investing in new companies). Existing portfolio companies are showing signs of revenue growth, although muted and only in selective sectors. Banks are even starting to lend to established businesses of size. We believe confidence is slowly returning.
Portfolio Review
For the year ended April 30, 2010, the ALPS | Red Rocks Listed Private Equity Fund - Class A shares returned 52.68% net of fees and sales loads, compared with 78.98% and 37.02% for the S&P Listed Private Equity Index and the MSCI World Index, respectively.
During the year, we made a moderate number of changes to the Fund. We added twelve companies to the Fund and parted ways with eight companies. The reason for the moderate turnover in actual holdings is that the majority of the companies
within the Fund are performing well and meeting, or in some cases, beating expectations. We expect that if the economic backdrop continues to stabilize, the Fund will benefit.
Net contributors to performance for the year included: KKR & CO. L.P. (US), Conversus Capital L.P. (US) and Onex Corp. (Canada). Recently, KKR & Co. filed to trade on the NYSE, hoping to increase the liquidity in the stock along with increasing its investor base. The management of Conversus Capital continues to impress us with its ability to oversee a large global portfolio of primary and secondary fund investments while managing their own liquidity position. Onex Corp. announced that it was acquiring sporting goods and uniform supplier Sport Supply Group, Inc. for $170 million. In total, these three companies contributed over 18% to the overall return of the Fund during the year.
Net detractors to performance for the year included: Babcock & Brown Infrastructure Group (Australia), KTB Securities CO. LTD (S. Korea) and IP Group PLC (UK). While the overall performance for the year was very good, several our holdings did not fare well Babcock & Brown Infrastructure Group went through a significant balance sheet restructuring which severely hurt the equity shareholders of the company. IP Group had several positive results. However, the market has not rewarded the company with any sustainable increase in the price of its stock. And last, KTB Securities continued to experience challenges as they modified their business model in ways with which we were not comfortable. All told, these three companies detracted approximately 1.40% from the overall return of the Fund during the year.
The Fund continues to be very well diversified from a geographic, industry, vintage and stage of investment perspective, which provides our investors broad exposure to the private equity asset class without having to make specific bets in any one area. This theme of broad diversification is one that we do not see ourselves deviating from significantly anytime in the near future. Diversification does not eliminate risks.
Looking Ahead
2010 looks to be a year of stabilization and re-grouping. Private equity funds are still sitting on record amounts of cash that they hope to put to work, albeit in a much more conservative leverage environment. M&A activity has picked up meaningfully and private equity expects to play a major role, both on the buy side and the sell side of transactions. Balance sheet restructurings continue, with lenders assuming the role of the new equity owners in some cases.
| | | | | | |
| ALPS | Red Rocks Listed Private Equity Fund | | |
| | | Management Commentary | | April 30, 2010 (Unaudited) |
The challenge: finding investment growth opportunities. We believe certain parts of the world are well positioned for this; the BRIC countries (Brazil, Russia, India and China) to name a few. Other parts are not; most of Western Europe and the United States. While our universe of eligible publicly traded private equity companies is still trading at a steep discount to the underlying value of their private investments, those discounts are contracting as the fear of a global depression continues to fade. We would not suggest that we are out of the woods yet. However, assuming
the healing continues and small pockets of growth emerge, we expect that the patient investor will be rewarded by having well diversified exposure to the private equity asset class.
As always, we appreciate your continued support and interest in the ALPS/Red Rocks Listed Private Equity Fund.
Adam Goldman, Co-Portfolio Manager
Performance of $10,000 Initial Investment (as of April 30, 2010)
Comparison of change in value of a $10,000 investment (includes applicable sales loads)
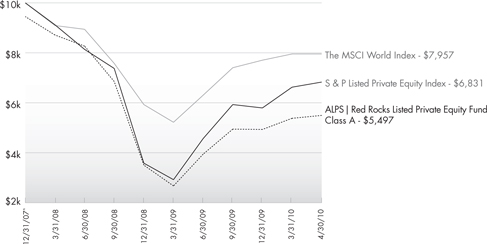
Source: Morningstar
The chart above represents historical performance of a hypothetical investment of $10,000 in the Fund since inception. Past performance does not guarantee future results. This chart does not reflect the deduction of taxes that a shareholder would pay on Fund distributions or the redemption of Fund shares.
16 | April 30, 2010
| | | | | | |
| ALPS | Red Rocks Listed Private Equity Fund |
| | | | | | | |
| | |
| Management Commentary | | April 30, 2010 (Unaudited) |
|
| Average Annual Total Returns (as of April 30, 2010) |
| | | | | | | | |
| | | 1 Year | | Since Inception^ | | Gross Expense Ratio | | Net Expense Ratio* |
Class A (NAV)1 | | 61.68% | | -20.74% | | 2.53% | | 1.80% |
Class A (MOP)2 | | 52.68% | | -22.63% | | |
Class I | | 62.09% | | -20.45% | | 2.35% | | 1.55% |
Class R | | 60.92% | | -21.11% | | 6.38% | | 2.05% |
S&P LPE Index3 | | 78.98% | | -15.07% | | | | |
MSCI World Index4 | | 37.02% | | -9.33% | | | | |
|
Performance data quoted represents past performance. Past performance does not guarantee future results. Investment return and principal value of an investment will fluctuate so that an investor’s shares, when sold or redeemed, may be worth more or less than the original cost. Current performance data may be higher or lower than actual data quoted. The fund imposes a 2.00% redemption fee on shares held for less than 90 days. The fund imposes a maximum Contingent Deferred Sales Charge (“CDSC”) of 1.00% to shares redeemed within the first 12 months after a purchase in excess of $1 million. Performance data does not reflect the redemption fee or the CDSC, which if reflected would reduce the performance quoted. For the most current month-end performance data please call (866) 759-5679. 1 Net Asset Value (NAV) is the share price without sales charges. The performance data shown does not reflect the deduction of the sales load or the redemption fee or Contingent Deferred Sales Charge (“CDSC”), and that, if reflected, the load or fee would reduce the performance quoted. 2 Maximum Offering Price (MOP) includes sales charges. Returns include effects of the Fund’s maximum sales charge of 5.50% for ALPS/Red Rocks Listed Private Equity Fund – A Shares. ^ Fund inception date of 12/31/2007. The Fund began trading on 1/2/2008. * Effective September 1, 2009 through August 31, 2010, the Adviser and the Sub-Adviser have given a contractual agreement to the Fund to limit the amount of the Fund’s total annual expenses, exclusive of Distribution and service (12b-1) fees, Acquired Fund Fees and Expenses, brokerage expenses, interest expense, taxes and extraordinary expenses, to 1.25% of the Fund’s average daily net assets. This agreement is reevaluated on an annual basis. Without this agreement expenses could be higher. 3 S&P Listed Private Equity Index: The S&P Listed Private Equity Index is comprised of 30 leading listed private equity companies that meet size, liquidity, exposure, and activity requirements. The index is designed to provide tradable exposure to the leading publicly listed companies in the private equity space. 4 MSCI World Index: Morgan Stanley Capital International’s market capitalization weighted index is composed of companies representative of the market structure of 22 developed market countries in North America, Europe, and the Asia/Pacific Region. You cannot invest directly in an index. Listed Private Equity Companies are subject to various risks depending on their underlying investments, which could include, but are not limited to, additional liquidity risk, industry risk, non-U.S. security risk, currency risk, credit risk, managed portfolio risk and derivatives risk (derivatives risk is the risk that the value of the Listed Private Equity Companies’ derivative investments will fall because of pricing difficulties or lack of correlation with the underlying investment). There are inherent risks in investing in private equity companies, which encompass financial institutions or vehicles whose principal business is to invest in and lend capital to privately–held companies. Generally, little public information exists for private and thinly traded companies, and there is a risk that investors may not be able to make a fully informed investment decision. Listed Private Equity Companies may have relatively concentrated investment portfolios, consisting of a relatively small number of holdings. A consequence of this limited number of investments is that the aggregate returns realized may be adversely impacted by the poor performance of a small number of investments, or even a single investment, particularly if a company experiences the need to write down the value of an investment. Certain of the Fund’s investments may be exposed to liquidity risk due to low trading volume, lack of a market maker or legal restrictions limiting the ability of the Fund to sell particular securities at an advantageous price and/or time. As a result these securities may be more difficult to value. Foreign investing involves special risks such as currency fluctuations and political uncertainty. The fund invests in derivatives and is subject to the risk that the value of those derivative investments will fall because of pricing difficulties or lack of correlation with the underlying investment. |
17 | April 30, 2010
| | | | | | |
| ALPS | Red Rocks Listed Private Equity Fund |
| | | | | | | |
| | |
| Disclosure of Fund Expenses | | April 30, 2010 (Unaudited) |
|
As a shareholder of ALPS | Red Rocks Listed Private Equity Fund (the “Fund”), you will incur two types of costs: (1) transaction costs, including applicable sales charges (loads) and redemption fees; and (2) ongoing costs, including management fees, distribution and service (12b-1) fees, shareholder service fees and other Fund expenses. The following examples are intended to help you understand your ongoing costs (in dollars) of investing in the Fund and to compare these costs with the ongoing costs of investing in other mutual funds. The examples are based on an investment of $1,000 invested on November 1, 2009 and held until April 30, 2010. Actual Expenses. The first line of the table on the next page provides information about actual account values and actual expenses. You may use the information in this line, together with the amount you invested, to estimate the expenses that you paid over the period. Simply divide your account value by $1,000 (for example, an $8,600 account value divided by $1,000 = 8.6), then multiply the result by the number in the first line under the heading “Expenses Paid During Period” to estimate the expenses you paid on your account during this period. Hypothetical Example for Comparison Purposes. The second line of the table on the next page provides information about hypothetical account values and hypothetical expenses based on the Fund’s actual expense ratio and an assumed rate of return of 5% per year before expenses, which is not the Fund’s actual return. The hypothetical account values and expenses may not be used to estimate the actual ending account balance or expenses you paid for the period. You may use this information to compare the ongoing costs of investing in the Fund and other mutual funds. To do so, compare this 5% hypothetical example with the 5% hypothetical examples that appear in the shareholder reports of the other funds. The expenses shown in the table are meant to highlight ongoing Fund costs only and do not reflect transaction fees, such as sales charges, redemption fees, or exchange fees. Therefore, the second line of the table on the next page is useful in comparing ongoing costs only, and may not help you determine the relative total costs of owning different funds. In addition, if these transactional costs were included, your costs would have been higher. The examples are based on an investment of $1,000 invested on November 1, 2009 and held until April 30, 2010. |
| | | | | | | | | | | | |
| | | Beginning
Account Value
11/1/09 | | Ending
Account Value
4/30/10 | | Expense
Ratio | | | Expenses Paid
During Period(a)
11/1/09-4/30/10 |
Class A | | | | | | | | | | | | |
Actual | | $ | 1,000.00 | | $ | 1,142.00 | | 1.50 | % | | $ | 7.98 |
Hypothetical (5% return before expenses) | | $ | 1,000.00 | | $ | 1,017.35 | | 1.50 | % | | $ | 7.51 |
| | | | |
Class I | | | | | | | | | | | | |
Actual | | $ | 1,000.00 | | $ | 1,145.80 | | 1.25 | % | | $ | 6.66 |
Hypothetical (5% return before expenses) | | $ | 1,000.00 | | $ | 1,018.59 | | 1.25 | % | | $ | 6.27 |
| | | | |
Class R | | | | | | | | | | | | |
Actual | | $ | 1,000.00 | | $ | 1,142.00 | | 1.75 | % | | $ | 9.29 |
Hypothetical (5% return before expenses) | | $ | 1,000.00 | | $ | 1,016.12 | | 1.75 | % | | $ | 8.75 |
|
(a) Expenses are equal to the Fund’s annualized expense ratio multiplied by the average account value over the period, multiplied by the number of days in the most recent fiscal half year (181), then divided by 365. |
18 | April 30, 2010
| | | | | | |
| ALPS | Red Rocks Listed Private Equity Fund | | |
| | | Statement of Investments | | April 30, 2010 |
| | | | | |
| | | Shares | | Value (Note 1) |
COMMON STOCKS (98.42%) | | | |
Communications (1.70%) | | | |
Internet (1.70%) | | | |
Internet Capital Group, Inc.(a) | | 193,000 | | $ | 1,908,770 |
| | | | | |
| |
TOTAL COMMUNICATIONS | | | 1,908,770 |
| | | | | |
| | |
Diversified (11.53%) | | | | | |
Diversified Operations (2.12%) | | | |
Wendel Investissement | | 36,500 | | | 2,381,544 |
| | | | | |
|
Holding Companies-Diversified (9.41%) |
Ackermans & van Haaren N.V. | | 34,150 | | | 2,363,937 |
HAL Trust | | 30,400 | | | 3,223,923 |
Leucadia National Corp.(a) | | 197,000 | | | 4,986,070 |
| | | | | |
| | | | | 10,573,930 |
| | | | | |
| | |
TOTAL DIVERSIFIED | | | | | 12,955,474 |
| | | | | |
| | |
Financial (85.19%) | | | | | |
Closed-End Funds (25.71%) | | | |
AP Alternative Assets LP(a) | | 409,314 | | | 2,791,521 |
ARC Capital Holdings, Ltd.(a) | | 2,305,000 | | | 2,581,600 |
Candover Investments PLC(a) | | 238,237 | | | 3,091,099 |
Electra Private Equity PLC(a) | | 157,294 | | | 3,403,059 |
Graphite Enterprise Trust PLC | | 572,357 | | | 2,924,970 |
HBM BioVentures AG, Class A(a) | | 56,452 | | | 2,565,166 |
HgCapital Trust PLC(a) | | 47,670 | | | 37,198 |
HgCapital Trust PLC | | 230,050 | | | 2,935,595 |
Macquarie International Infrastructure Fund, Ltd. | | 4,390,000 | | | 1,649,894 |
Princess Private Equity Holding, Ltd.(a) | | 387,882 | | | 2,504,763 |
Private Equity Investor PLC(a) | | 460,100 | | | 879,975 |
SVG Capital PLC(a) | | 1,407,541 | | | 3,521,168 |
| | | | | |
| | | | | 28,886,008 |
| | | | | |
|
Diversified Financial Services (26.42%) |
Blackstone Group LP | | 153,800 | | | 2,150,124 |
Conversus Capital LP(a) | | 298,800 | | | 4,894,344 |
GP Investments, Ltd.(a) | | 718,600 | | | 3,270,028 |
Intermediate Capital Group PLC | | 627,000 | | | 2,706,316 |
KKR & Co. Guernsey LP | | 864,100 | | | 10,524,738 |
Onex Corp. | | 212,000 | | | 6,142,115 |
| | | | | |
| | | | | 29,687,665 |
| | | | | |
| |
Investment Companies (16.16%) | | | |
China Merchants China Direct Investments, Ltd.(a) | | 1,294,000 | | | 3,083,274 |
DeA Capital SpA(a) | | 761,000 | | | 1,267,556 |
Eurazeo | | 29,000 | | | 2,027,135 |
Investor AB, Class B | | 137,400 | | | 2,613,999 |
MVC Capital, Inc. | | 180,700 | | | 2,553,291 |
Prospect Capital Corp. | | 66,949 | | | 778,617 |
Ratos AB | | 117,000 | | | 3,682,903 |
RHJ International(a) | | 250,000 | | | 2,143,637 |
| | | | | |
| | | | | 18,150,412 |
| | | | | |
| | | | | | | | |
| | | | | Shares | | | | Value (Note 1) |
Venture Capital (16.90%) |
3i Group PLC | | 1,000,000 | | | | $ 4,166,348 |
3i Infrastructure PLC | | 1,017,292 | | | | 1,775,984 |
Altamir Amboise(a) | | 410,691 | | | | 3,412,127 |
Deutsche Beteiligungs AG | | 82,689 | | | | 1,922,283 |
Dinamia Capital Privado S.C.R., SA | | 118,778 | | | | 1,587,797 |
GIMV N.V. | | 74,700 | | | | 4,055,956 |
IP Group PLC(a) | | 1,266,800 | | | | 814,076 |
JAFCO Co., Ltd. | | 40,600 | | | | 1,256,879 |
| | | | | | | | |
| | | | | | | | 18,991,450 |
| | | | | | | | |
| | | |
TOTAL FINANCIAL | | | | | | 95,715,535 |
| | | | | | | | |
| | |
TOTAL COMMON STOCKS (Cost $90,328,740) | | | | 110,579,779 |
| | | | | | | | |
| | | | |
| | | 7-Day Yield | | Shares | | | | Value (Note 1) |
SHORT-TERM INVESTMENTS (1.27%) |
Money Market Fund (1.27%) | | | | |
Dreyfus Treasury Prime Cash Management, Investor Shares | | | | | | |
| | 0.00004% | | 1,429,972 | | $ | | 1,429,972 |
| | | | | | | | |
| | |
TOTAL SHORT-TERM INVESTMENTS (Cost $1,429,972) | | | | 1,429,972 |
| | | | | | | | |
| | |
TOTAL INVESTMENTS - (99.69%) (Cost $91,758,712) | | $ | | 112,009,751 |
| | | |
Assets in Excess of Other Liabilities (0.31%) | | | | | | 344,647 |
| | | | | | | | |
| | | |
NET ASSETS (100.00%) | | | | $ | | 112,354,398 |
| | | | | | | | |
Common Abbreviations:
AB- Aktiebolag is the Swedish equivalent of the term corporation
AG - Aktiengesellschaft is a German term that refers to a corporation that is limited by shares, i.e., owned by shareholders.
N.V. - Naamloze Vennootschap is the Dutch term for a public limited liability corporation.
SA -Generally designates corporations in various countries, mostly those employing the civil law. This translates literally in all languages mentioned as anonymous company.
SpA - Società Per Azioni is an Italian shared company.
| (a) | Non-Income Producing Security. |
For Fund compliance purposes, the Fund’s industry classifications refer to any one or more of the industry sub-classifications used by one or more widely recognized market indexes or ratings group indexes, and/or as defined by Fund management. This definition may not apply for purposes of this report, which may combine industry subclassifications for reporting ease. Industries are shown as a percent of net assets. These industry classifications are based on third-party definitions. The definitions are industry terms and do not reflect the legal status of any of the investments or the companies in which the Fund has invested.
See Notes to Financial Statements.
| | | | | | |
| ALPS | Red Rocks Listed Private Equity Fund | | |
| | | Statement of Investments | | | | April 30, 2010 |
Top Ten Holdings (as a % of Net Assets) †
| | | |
KKR & Co. Guernsey LP | | 9.37 | % |
Onex Corp. | | 5.47 | % |
Leucadia National Corp. | | 4.44 | % |
Conversus Capital LP | | 4.36 | % |
3i Group PLC | | 3.71 | % |
GIMV N.V. | | 3.61 | % |
Ratos AB, B Shares | | 3.28 | % |
SVG Capital PLC | | 3.13 | % |
Altamir Amboise | | 3.04 | % |
Electra Private Equity PLC | | 3.03 | % |
Top Ten Holdings | | 43.44 | % |
| | † | Holdings are subject to change. |
Industry Sector Allocation (as a % of Net Assets)
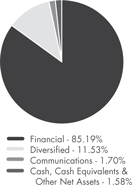
20 | April 30, 2010
| | | | | | |
| Clough China Fund | | |
| | | Management Commentary | | April 30, 2010 (Unaudited) |
The Clough China Fund declined 0.65% in April and at month end stood -0.11% lower year-to-date. The MSCI China Index at month end was -0.59% and -2.16% lower year-to-date.
Chinese equity markets experienced two clearly distinct phases over the first four months of the year. January saw a sell-off in Chinese equities with the MSCI China falling 11% to reach a year-to-date low on February 5th. The weak open to the New Year was driven by worries over the impact of monetary policy tightening. A continuation of strong macro data indicating steady and high economic growth helped buoy sentiment in mid-February and share prices recovered by 10% by the end of March.
Investment Environment
The decision of China’s Central Bank to raise commercial banks’ Reserve Requirement Ratio (RRR) twice by 50 basis points (“bps”) from 15.5% to 16.5% on January 12 and February 12 followed the announcement of very high bank lending and the confirmation of both recovering exports (up 21% in January)(1) and strong domestic demand (January electricity consumption up 40% year over year (“YoY”)). The release of China’s fourth quarter 2009 gross domestic product (“GDP”) increasing 10.7% showed the economy continued on a strong growth path again.(1) Retail sales during the February “Golden Week” holiday of Chinese New Year were up 17% YoY.(2) Inflation rose to 2.7% in February from 1.5% in January, due to seasonal effects, before slowing down to 2.4% in March. Residential property prices continued to accelerate steadily – on average, from 9.5% in January to 11.7% in March(1) – and became a sticky point and the focus of attention for the government. On the corporate side however, investors received encouraging signals of an underlying rebound in profitability:
| | » | About 85% of MSCI China index companies have currently reported results for 2009 with an aggregate earnings per share (“EPS”) rise of 17%.(3) |
| | » | Industrial firms reported a 120% profit growth for the 2 months of January and February 2010 YoY.(4) |
In general, investors adopted a cautious attitude on major sectors in the index and top traded names. Competition was seen as increasing in telecom services, banks’ shares suffered from an anticipation of slower loan growth to be engineered by the Central Bank and property stocks remained weak due to concerns of further tightening measures to cool down prices.
Portfolio composition
The Fund’s consistent underweight in the financial sector, including property, contributed to the outperformance while its emphasis in consumer related sectors such as retail, sportswear, electrical appliances and the migration away from very large to small and mid-sized market capitalizations also had a positive impact. Wumart, a leading supermarket chain in Beijing and surrounding areas, Sa Sa International, a cosmetic retailer in Hong Kong and Mainland China and Anta Sports, a leading designer and manufacturer of sports apparel including footwear and garments are examples of core holdings that enhanced the Fund performance in the first quarter. On the contrary, China Unicom, China’s second largest mobile phone operator and Aluminum Corporation of China, China’s leading producer of alumina and aluminum, detracted from the Fund’s performance. China Unicom and Aluminum Corporation of China are no longer holdings in the portfolio.
Investment Outlook
As we write this letter, the MSCI China index has rallied 14% since its recent low on February 5th. The market is trading at 14.2 times and 12.2 times 2010 and 2011 forecasted earnings, respectively, while consensus earnings are expected to increase 18 – 20% per year on average over the next two years.(5) We consider this valuation inexpensive as visibility on China’s economic growth remains high. We have shown in the preceding statements the positive trends of corporate profits. From a macro standpoint, recently released first quarter 2010 GDP data revealed a very healthy 11.9% year-over-year growth,(6) imports rebounded strongly in March, up 66%,(6) illustrating the momentum of domestic demand, retail sales year to date (“YTD”) increased 17.9%(6) and industrial production 19.6%.(6) We believe the government policy to clamp down on rising property prices by tightening mortgage credit to second home buyers is actually moderate and reasonable. If it cools down speculative demand and property transactions in the short term, we believe favorable demographics, the urbanization process and rising individual income will remain the major drivers of this sector for many years to come. More generally, policy measures to avoid overheating and to keep inflationary trends under control are healthy. We do not expect them to slow down China’s economic growth significantly and see no reason to alter our previous forecast for China’s GDP to grow at least 9% in 2010 and about 8% next year. Given the rebalancing of the Chinese development model towards domestic consumer spending and inland urban development and a reduced focus on exports, we are confident the Fund is well positioned
21 | April 30, 2010
| | | | | | |
| Clough China Fund | | |
| | | Management Commentary | | April 30, 2010 (Unaudited) |
to benefit from this structural change with its large emphasis on quality consumer discretionary and consumer staples companies, which represent about 28% of the Fund’s portfolio holdings (as compared to just a 10% weighting in the MSCI China benchmark). Further, we will continue to focus the Fund on discovering future leaders among smaller, private-sector
firms, as we firmly believe stronger investment returns will be found there, as opposed to the old National Champions which have led China’s corporate growth over the previous decade. We share the view that the Chinese currency should resume an upward appreciating trend vs. the U.S. dollar (“USD”) before the end of this year.
| | (1) | National Bureau of Statistics (02/10) |
| | (2) | National Bureau of Statistics, UBS Financial Services (03/10) |
| | (3) | UBS Financial Services (04/10) |
| | (4) | National Bureau of Statistics (03/10) |
| | (5) | UBS Financial Services (04/10) and CLSA Research (04/10) |
| | (6) | National Bureau of Statistics (04/10) |
For the individual stocks mentioned above, performance calculations are according to Bloomberg daily prices from 12/31/09 to 03/31/10
Performance of $10,000 Initial Investment (as of April 30, 2010)
Comparison of change in value of a $10,000 investment (includes applicable sales loads)

The chart above represents historical performance of a hypothetical investment of $10,000 in the Fund since inception. Past performance does not guarantee future results. This chart does not reflect the deduction of taxes that a shareholder would pay on Fund distributions or the redemption of Fund shares.
22 | April 30, 2010
| | |
| Management Commentary | | April 30, 2010 (Unaudited) |
|
| Average Annual Total Returns (as of April 30, 2010) |
| | | | | | | | | | |
| | | 1 Year | | 3 Year | | Since Inception^ | | Gross Expense Ratio | | Net Expense Ratio* |
Class A (NAV)1 | | 47.06% | | 7.57% | | 21.66% | | 2.13% | | 1.85% |
Class A (MOP)2 | | 38.59% | | 5.46% | | 20.01% | | |
Class C (NAV)1 | | 45.68% | | 6.66% | | 20.67% | | 2.88% | | 2.70% |
Class C (MOP)2 | | 44.68% | | 6.66% | | 20.67% | | |
Class I3 | | 47.55% | | 8.04% | | 22.20% | | 1.88% | | 1.40% |
MSCI China Index4 | | 41.40% | | 8.67% | | 22.14% | | | | |
|
Performance data quoted represents past performance. Past performance does not guarantee future results. Investment return and principal value of an investment will fluctuate so that an investor’s shares, when sold or redeemed, may be worth more or less than the original cost. Current performance data may be higher or lower than actual data quoted. The Fund imposes a 2.00% redemption fee on shares held for less than 90 days. The Fund imposes a maximum Contingent Deferred Sales Charge (“CDSC”) of 1.00% to shares redeemed within the first 12 months after a purchase in excess of $1 million. Performance data does not reflect the redemption fee or the CDSC, which if reflected would reduce the performance quoted. For the most current month-end performance data, please call 1(877)256-8445. Effective as of the close of business January 15, 2010, Old Mutual China Fund, a series of Old Mutual Funds I (the “Predecessor Fund”), reorganized into the Fund. The Predecessor Fund was advised by Old Mutual Capital, Inc. and sub-advised by Clough Capital Partners, LP, the Fund’s sub-adviser. Performance shown for the Fund for periods prior to 1/15/10, is derived from the performance of the Predecessor Fund, adjusted to reflect the current fees and expenses of the Clough China Fund, net of waivers. Without these adjustments the fund’s performance would have been lower. Further information is available in the Fund prospectus. 1 Net Asset Value (NAV) is the share price without sales charges. 2 Maximum Offering Price (MOP) includes sales charges. Class A returns include effects of the Fund’s maximum sales charge of 5.75%; Class C returns include the 1.00% contingent deferred sales charge. 3 Prior to close of business on January 15, 2010, Class I was known as Institutional Class of the Predecessor Fund. 4 The Morgan Stanley Capital International (“MSCI”) China Index is constructed according to the MSCI Global Investable Market Index (GIMI) family. The MSCI China Index is part of the MSCI Emerging Markets Index. An investor may not invest directly in an index. ^ Predecessor Fund Inception date of 12/30/05. * The Adviser contractually has agreed to limit the operating expenses of the Fund (excluding underlying fund fees and expenses, interest, taxes, brokerage costs and commissions, dividend and interest expense on short sales, litigation, indemnification, and extraordinary expenses as determined under generally accepted accounting principles) to an annual rate of 1.40% for Class I shares through December 31, 2010, 1.70% for Class A shares through December 31, 2009 and 1.85% for Class A shares from January 1, 2010 through December 31, 2010, and 2.70% for Class C shares through December 31, 2010. The Adviser will consider further reductions to these limits on an annual basis. Without this agreement, expenses would be higher. Effective January 1, 2011, the Adviser contractually has agreed to limit the operating expenses of the Fund (excluding underlying fund fees and expenses, interest, taxes, brokerage costs and commissions, dividend and interest expense on short sales, litigation, indemnification and extraordinary expenses as determined under generally accepted accounting principles) to an annual rate of 2.75% for Class I shares, 3.00% for Class A shares, and 3.75% for Class C shares through December 31, 2018. ALPS Advisors will consider further reductions to these limits on an annual basis. Without this agreement, expenses would be higher. The table does not reflect the deduction of taxes that a shareholder would pay on Fund distributions or the redemption of Fund shares. Subject to investment risks, including possible loss of the principal amount invested. Derivatives generally are more sensitive to changes in economic or market conditions than other types of investments; this could result in losses that significantly exceed the Fund’s original investment. Investing in China, Hong Kong, and Taiwan involves risk and considerations not present when investing in more established securities markets. The Clough China Fund may be more susceptible to the economic, market, political, and local risks of these regions than a fund that is more geographically diversified. This fund is not suitable for all investors. Subject to investment risks, including possible loss of the principal amount invested. |
23 | April 30, 2010
| | |
| Disclosure of Fund Expenses | | April 30, 2010 (Unaudited) |
|
As a shareholder of the Fund you will incur two types of costs: (1) transaction costs, including applicable sales charges (loads) and redemption fees; and (2) ongoing costs, including management fees, distribution and service (12b-1) fees, shareholder service fees and other Fund expenses. The following examples are intended to help you understand your ongoing costs (in dollars) of investing in the Fund and to compare these costs with the ongoing costs of investing in other mutual funds. The examples are based on an investment of $1,000 invested on November 1, 2009 and held until April 30, 2010. Actual Expenses. The first line of the table on the next page provides information about actual account values and actual expenses. You may use the information in this line, together with the amount you invested, to estimate the expenses that you paid over the period. Simply divide your account value by $1,000 (for example, an $8,600 account value divided by $1,000 = 8.6), then multiply the result by the number in the first line under the heading “Expenses Paid During Period” to estimate the expenses you paid on your account during this period. Hypothetical Example for Comparison Purposes. The second line of the table on the next page provides information about hypothetical account values and hypothetical expenses based on the Fund’s actual expense ratio and an assumed rate of return of 5% per year before expenses, which is not the Fund’s actual return. The hypothetical account values and expenses may not be used to estimate the actual ending account balance or expenses you paid for the period. You may use this information to compare the ongoing costs of investing in the Fund and other mutual funds. To do so, compare this 5% hypothetical example with the 5% hypothetical examples that appear in the shareholder reports of the other funds. The expenses shown in the table are meant to highlight ongoing Fund costs only and do not reflect transaction fees, such as sales charges, redemption fees or exchange fees. Therefore, the second line of the table on the next page is useful in comparing ongoing costs only, and may not help you determine the relative total costs of owning different funds. In addition, if these transactional costs were included, your costs would have been higher. The examples are based on an investment of $1,000 invested on November 1, 2009 and held until April 30, 2010. |
| | | | | | | | | | | | |
| | | Beginning
Account Value
11/1/09 | | Ending
Account Value
4/30/10 | | Expense
Ratio | | | Expenses Paid
During Period(a)
11/1/09- 4/30/10 |
Class A | | | | | | | | | | | | |
Actual | | $ | 1,000.00 | | $ | 1,082.60 | | 1.85 | % | | $ | 9.53 |
Hypothetical (5% return before expenses) | | $ | 1,000.00 | | $ | 1,015.64 | | 1.85 | % | | $ | 9.22 |
| | | | |
Class C | | | | | | | | | | | | |
Actual | | $ | 1,000.00 | | $ | 1,077.70 | | 2.71 | % | | $ | 13.94 |
Hypothetical (5% return before expenses) | | $ | 1,000.00 | | $ | 1,011.38 | | 2.71 | % | | $ | 13.49 |
| | | | |
Class I | | | | | | | | | | | | |
Actual | | $ | 1,000.00 | | $ | 1,084.20 | | 1.39 | % | | $ | 7.21 |
Hypothetical (5% return before expenses) | | $ | 1,000.00 | | $ | 1,017.88 | | 1.39 | % | | $ | 6.98 |
|
(a) Expenses are equal to the Fund’s annualized expense ratio multiplied by the average account value over the period, multiplied by the number of days in the most recent fiscal half year (181), then divided by 365. |
24 | April 30, 2010
| | | | | | |
| Clough China Fund | | |
| | | Statement of Investments | | April 30, 2010 |
| | | | | |
| | | Shares | | Value (Note 1) |
| |
COMMON STOCKS (87.06%) | | | |
Consumer Discretionary (22.54%) | | | |
Auto Components (0.56%) | | | |
Tianneng Power International, Ltd. | | 444,000 | | $ | 285,861 |
| | | | | |
| |
Distributors (1.02%) | | | |
Li & Fung, Ltd. | | 50,000 | | | 241,047 |
Sparkle Roll Group, Ltd. | | 2,624,000 | | | 281,862 |
| | | | | |
| | | | | 522,909 |
| | | | | |
| |
Household Durables (3.27%) | | | |
Chigo Holding, Ltd.(a) | | 718,000 | | | 518,006 |
Skyworth Digital Holdings, Ltd. | | 1,288,000 | | | 1,162,296 |
| | | | | |
| | | 1,680,302 |
| | | | | |
| |
Media (0.54%) | | | |
A8 Digital Music Holdings, Ltd.(a) | | 386,000 | | | 279,850 |
| | | | | |
| |
Multiline Retail (2.13%) | | | |
Golden Eagle Retail Group, Ltd. | | 297,000 | | | 572,108 |
Parkson Retail Group, Ltd. | | 318,500 | | | 520,194 |
| | | | | |
| | | 1,092,302 |
| | | | | |
| |
Specialty Retail (5.21%) | | | |
Chow Sang Sang Holdings International, Ltd. | | 386,000 | | | 660,373 |
SA SA International Holdings, Ltd. | | 2,414,000 | | | 2,014,022 |
| | | | | |
| | | | | 2,674,395 |
| | | | | |
| |
Textiles, Apparel & Luxury Goods (9.81%) | | | |
Anta Sports Products, Ltd. | | 542,000 | | | 964,922 |
China Lilang, Ltd. | | 506,000 | | | 620,294 |
Shenzhou International Group Holdings, Ltd. | | 1,260,500 | | | 1,658,457 |
Texwinca Holdings, Ltd. | | 711,000 | | | 759,512 |
Xtep International Holdings, Ltd. | | 1,361,500 | | | 1,036,782 |
| | | | | |
| | | | | 5,039,967 |
| | | | | |
| |
TOTAL CONSUMER DISCRETIONARY | | | 11,575,586 |
| | | | | |
| |
Consumer Staples (6.10%) | | | |
Food & Staples Retailing (2.58%) | | | |
China Resources Enterprise, Ltd. | | 172,000 | | | 606,820 |
Wumart Stores, Inc., Class H | | 336,000 | | | 717,963 |
| | | | | |
| | | | | 1,324,783 |
| | | | | |
| |
Food Products (1.72%) | | | |
Shenguan Holdings Group, Ltd. | | 957,300 | | | 885,140 |
| | | | | |
| | | | | |
| | | Shares | | Value (Note 1) |
| |
Personal Products (1.80%) | | | |
Hengan International Group Co., Ltd. | | 46,000 | | $ | 353,139 |
Ruinian International, Ltd.(a) | | 799,000 | | | 570,115 |
| | | | | |
| | | | | 923,254 |
| | | | | |
| |
TOTAL CONSUMER STAPLES | | | 3,133,177 |
| | | | | |
| |
Energy (7.71%) | | | |
Oil, Gas & Consumable Fuels (7.71%) | | | |
China Petroleum & Chemical Corp., Class H | | 1,329,000 | | | 1,065,576 |
CNOOC, Ltd. | | 1,646,000 | | | 2,895,263 |
| | | | | |
| | | | | 3,960,839 |
| | | | | |
| |
TOTAL ENERGY | | | 3,960,839 |
| | | | | |
| | |
Financials (10.53%) | | | | | |
Commercial Banks (7.14%) | | | |
Bank of China, Ltd. | | 1,812,000 | | | 932,775 |
Industrial & Commercial Bank of China, Class H | | 3,756,500 | | | 2,737,876 |
| | | | | |
| | | | | 3,670,651 |
| | | | | |
| |
Diversified Financial Services (0.83%) | | | |
Hong Kong Exchanges and Clearing, Ltd. | | 26,000 | | | 424,884 |
| | | | | |
| |
Insurance (2.56%) | | | |
China Life Insurance Co., Ltd., Class H | | 285,500 | | | 1,314,584 |
| | | | | |
| |
TOTAL FINANCIALS | | | 5,410,119 |
| | | | | |
| | |
Health Care (0.83%) | | | | | |
Pharmaceuticals (0.83%) | | | |
Lijun International Pharmaceutical Holding Co., Ltd. | | 1,275,000 | | | 427,866 |
| | | | | |
| |
TOTAL HEALTH CARE | | | 427,866 |
| | | | | |
| |
Industrials (16.03%) | | | |
Airlines (2.02%) | | | |
Air China, Ltd., Class H(a) | | 939,000 | | | 1,037,597 |
| | | | | |
| |
Commercial Services & Supplies (2.60%) | | | |
China Everbright International, Ltd. | | 2,707,000 | | | 1,336,250 |
| | | | | |
| |
Construction & Engineering (1.29%) | | | |
China State Construction International Holdings, Ltd. | | 1,919,800 | | | 661,903 |
| | | | | |
| | | | | | |
| Clough China Fund | | |
| | | Statement of Investments | | April 30, 2010 |
| | | | | |
| | | Shares | | Value (Note 1) |
|
Electrical Equipment (2.83%) |
China High Speed Transmission Equipment Group Co., Ltd. | | 266,000 | | $ | 630,395 |
Dongfang Electric Corp., Ltd. | | 89,000 | | | 577,080 |
Shanghai Electric Group Co., Ltd., Class H | | 520,000 | | | 246,700 |
| | | | | |
| | | | | 1,454,175 |
| | | | | |
Machinery (2.12%) |
Chen Hsong Holdings, Ltd. | | 1,220,000 | | | 504,709 |
China Automation Group, Ltd. | | 723,000 | | | 581,695 |
| | | | | |
| | | | | 1,086,404 |
| | | | | |
Road & Rail (0.78%) |
MTR Corp. | | 114,000 | | | 399,495 |
| | | | | |
|
Transportation Infrastructure (4.39%) |
China Merchants Holdings International Co., Ltd. | | 86,000 | | | 298,747 |
COSCO Pacific, Ltd. | | 574,000 | | | 773,953 |
Jiangsu Expressway Co., Ltd., Class H | | 1,259,000 | | | 1,182,130 |
| | | | | |
| | | | | 2,254,830 |
| | | | | |
| |
TOTAL INDUSTRIALS | | | 8,230,654 |
| | | | | |
|
Information Technology (7.11%) |
Communications Equipment (0.66%) |
Comba Telecom Systems Holdings, Ltd. | | 239,720 | | | 341,477 |
| | | | | |
| | |
Computers & Peripherals (0.98%) | | | | | |
Lenovo Group, Ltd. | | 680,000 | | | 501,302 |
| | | | | |
|
Electrical Equipment & Instruments (0.39%) |
Byd Co., Ltd. | | 22,500 | | | 199,778 |
| | | | | |
|
Internet Software & Services (4.15%) |
Alibaba.com, Ltd. | | 260,500 | | | 496,242 |
Tencent Holdings, Ltd. | | 79,000 | | | 1,633,730 |
| | | | | |
| | | | | 2,129,972 |
| | | | | |
Software (0.93%) |
Kingdee International Software Group Co., Ltd. | | 1,244,000 | | | 478,299 |
| | | | | |
| |
TOTAL INFORMATION TECHNOLOGY | | | 3,650,828 |
| | | | | |
|
Materials (8.00%) |
Chemicals (1.10%) |
Fufeng Group, Ltd. | | 716,000 | | | 564,867 |
| | | | | |
| | | | | |
| | | Shares | | Value (Note 1) |
|
Construction Materials (1.34%) |
Anhui Conch Cement Co., Ltd., Class H | | 216,000 | | $ | 689,701 |
| | | | | |
|
Metals & Mining (2.30%) |
Angang Steel Co., Ltd., Class H | | 328,000 | | | 505,936 |
Fosun International | | 454,000 | | | 352,639 |
Zhaojin Mining Industry Co., Ltd., Class H | | 168,000 | | | 323,045 |
| | | | | |
| | | | | 1,181,620 |
| | | | | |
Paper & Forest Products (3.26%) |
Lee & Man Paper Manufacturing, Ltd. | | 1,032,200 | | | 901,562 |
Nine Dragons Paper Holdings, Ltd. | | 457,000 | | | 770,905 |
| | | | | |
| | | | | 1,672,467 |
| | | | | |
| |
TOTAL MATERIALS | | | 4,108,655 |
| | | | | |
|
Telecommunication Services (3.80%) |
Diversified Telecommunication (1.24%) |
China Telecom Corp., Ltd., Class H | | 1,394,000 | | | 639,551 |
| | | | | |
| | |
Wireless Telecommunication Services (2.56%) | | | | | |
China Mobile, Ltd. | | 134,400 | | | 1,315,647 |
| | | | | |
| |
TOTAL TELECOMMUNICATION SERVICES | | | 1,955,198 |
| | | | | |
|
Utilities (4.41%) |
Gas Utilities (1.50%) |
China Resources Gas Group, Ltd. | | 518,000 | | | 768,679 |
| | | | | |
|
Independent Power Producers & Energy Traders (2.03%) |
China Longyuan Power Group Corp., Class H(a) | | 106,000 | | | 112,770 |
China Resources Power Holdings Co., Ltd. | | 458,000 | | | 928,488 |
| | | | | |
| | | | | 1,041,258 |
| | | | | |
Water Utilities (0.88%) |
Guangdong Investment, Ltd. | | 870,000 | | | 451,183 |
| | | | | |
| |
TOTAL UTILITIES | | | 2,261,120 |
| | | | | |
| |
TOTAL COMMON STOCKS (Cost $35,355,144) | | | 44,714,042 |
| | | | | |
26 | April 30, 2010
| | | | | | |
| Clough China Fund | | |
| | | Statement of Investments | | April 30, 2010 |
| | | | | | | | |
| | | 7-Day Yield | | | Shares | | Value (Note 1) |
|
SHORT-TERM INVESTMENTS (10.50%) |
Money Market Fund (10.50%) |
Dreyfus Cash Management Fund, Institutional Class | | 0.09 | % | | 5,392,735 | | $ | 5,392,735 |
| | | | | | | | |
| |
TOTAL SHORT-TERM INVESTMENTS (Cost $5,392,735) | | | 5,392,735 |
| | | | | | | | |
| |
TOTAL INVESTMENTS - (97.56%) (Cost $40,747,879) | | $ | 50,106,777 |
| |
Assets in Excess of Other Liabilities (2.44%) | | | 1,252,632 |
| | | | | | | | |
| |
NET ASSETS (100.00%) | | $ | 51,359,409 |
| | | | | | | | |
| (a) | Non-Income Producing Security. |
For Fund compliance purposes, the Fund’s industry classifications refer to any one or more of the industry sub-classifications used by one or more widely recognized market indexes or ratings group indexes, and/or as defined by Fund management. This definition may not apply for purposes of this report, which may combine industry subclassifications for reporting ease. Industries are shown as a percent of net assets. These industry classifications are based on third-party definitions. The definitions are industry terms and do not reflect the legal status of any of the investments or the companies in which the Fund has invested.
See Notes to Financial Statements.
| | | |
Top Ten Holdings (as a % of Net Assets) † | | | |
CNOOC, Ltd. | | 5.64 | % |
Industrial & Commercial Bank of China, Class H | | 5.33 | % |
SA SA International Holdings, Ltd. | | 3.92 | % |
Shenzhou International Group Holdings, Ltd. | | 3.23 | % |
Tencent Holdings, Ltd. | | 3.18 | % |
China Everbright International, Ltd. | | 2.60 | % |
China Mobile, Ltd. | | 2.56 | % |
China Life Insurance Co., Ltd., Class H | | 2.56 | % |
Jiangsu Expressway Co., Ltd., Class H | | 2.30 | % |
Skyworth Digital Holdings, Ltd. | | 2.26 | % |
Top Ten Holdings | | 33.58 | % |
| † | Holdings are subject to change. |
Industry Sector Allocation (as a % of Net Assets)
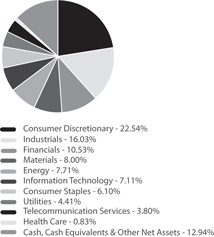
27 | April 30, 2010
| | | | | | |
| Statements of Assets and Liabilities | | |
| | | | | April 30, 2010 |
| | | | | | | | | | | | | | |
| | | Activa Value Fund | | | ALPS | GNI
Long-Short Fund | | | ALPS | Red Rocks
Listed Private
Equity Fund | | | Clough China Fund |
| |
ASSETS | | | | | | | | | | | | | | |
Investments, at value | | $ | 62,147,428 | | | $ | 10,945,521 | | | $ | 112,009,751 | | | $ 50,106,777 |
Cash | | | – | | | | 327,750 | | | | 343,830 | | | – |
Foreign currency, at value (Cost $0, $0, $166,122 and $15,187, respectively) | | | – | | | | – | | | | 165,704 | | | 15,194 |
Receivable for investments sold | | | – | | | | 1,060,959 | | | | 145,636 | | | 1,081,028 |
Receivable for shares sold | | | 400 | | | | – | | | | 186,927 | | | 952,666 |
Dividends and interest receivable | | | 53,442 | | | | 1,625 | | | | 52,415 | | | 166,943 |
Prepaid offering costs | | | – | | | | 25,194 | | | | – | | | – |
Prepaid expenses and other assets | | | 9,699 | | | | 3,828 | | | | 32,179 | | | 3,428 |
| |
Total Assets | | | 62,210,969 | | | | 12,364,877 | | | | 112,936,442 | | | 52,326,036 |
| |
| | | | |
LIABILITIES | | | | | | | | | | | | | | |
Payable for investments purchased | | | – | | | | 1,083,047 | | | | 352,392 | | | 691,930 |
Payable for shares redeemed | | | 9,454 | | | | – | | | | 61,884 | | | 119,875 |
Securities sold short (proceeds $1,495,832) | | | – | | | | 1,461,517 | | | | – | | | – |
Interest payable – margin account | | | – | | | | 473,076 | | | | – | | | – |
Dividends payable–short sales | | | – | | | | 3,300 | | | | – | | | – |
Written options (premiums received $66,510) | | | – | | | | 109,220 | | | | – | | | – |
Investment advisory fees payable | | | 15,231 | | | | 27,587 | | | | 42,982 | | | 55,612 |
Administration and transfer agency fees payable | | | 12,821 | | | | 1,931 | | | | 22,809 | | | 14,058 |
Transfer agency fees payable – prior service provider | | | – | | | | – | | | | – | | | 13,088 |
Distribution and services fees payable | | | 9,587 | | | | 13 | | | | 21,565 | | | 11,973 |
Directors’ fees and expenses payable | | | 5,101 | | | | 767 | | | | 8,605 | | | 3,974 |
Audit fees payable | | | 19,101 | | | | 17,200 | | | | 31,450 | | | 24,100 |
Legal fees payable | | | 4,005 | | | | 141 | | | | 1,248 | | | 2,312 |
Custody fees payable | | | 1,722 | | | | 2,000 | | | | 11,284 | | | 8,056 |
Reports to shareholders and printing fees payable | | | 19,385 | | | | 4,300 | | | | 8,234 | | | 12,371 |
Accrued expenses and other liabilities | | | 300 | | | | 1,704 | | | | 19,591 | | | 9,278 |
| |
Total Liabilities | | | 96,707 | | | | 3,185,803 | | | | 582,044 | | | 966,627 |
| |
NET ASSETS | | $ | 62,114,262 | | | $ | 9,179,074 | | | $ | 112,354,398 | | | $ 51,359,409 |
| |
| | | | |
NET ASSETS CONSIST OF | | | | | | | | | | | | | | |
Paid–in capital | | $ | 68,072,229 | | | $ | 11,264,953 | | | $ | 122,983,781 | | | $ 46,817,819 |
Undistributed/(overdistributed) net investment income | | | 245,095 | | | | – | | | | (4,922,899 | ) | | (147,621) |
Accumulated net realized loss on investments, securities sold short, written options and foreign currency transactions | | | (14,942,581 | ) | | | (2,210,451 | ) | | | (25,956,186 | ) | | (4,669,648) |
Net unrealized appreciation on investments, securities sold short, written options and translation of assets and liabilities in foreign currencies | | | 8,739,519 | | | | 124,572 | | | | 20,249,702 | | | 9,358,859 |
| |
NET ASSETS | | $ | 62,114,262 | | | $ | 9,179,074 | | | $ | 112,354,398 | | | $ 51,359,409 |
| |
| | | | |
INVESTMENTS, AT COST | | $ | 53,407,909 | | | $ | 10,812,556 | | | $ | 91,758,712 | | | $ 40,747,879 |
| |
See Notes to Financial Statements.
28 | April 30, 2010
| | | | | | |
| Statements of Assets and Liabilities | | |
| | | | | April 30, 2010 |
| | | | | | | | | | | | |
| | | Activa Value Fund | | ALPS | GNI
Long-Short Fund | | ALPS | Red Rocks
Listed Private
Equity Fund | | Clough China Fund |
| |
PRICING OF SHARES | | | | | | | | | | | | |
Class A: | | | | | | | | | | | | |
Net Asset Value, offering and redemption price per share (a) | | $ | 7.43 | | $ | 7.99 | | $ | 5.17 | | $ | 18.21 |
Net Assets | | $ | 45,300,265 | | $ | 60,275 | | $ | 67,191,526 | | $ | 28,694,557 |
Shares of beneficial interest outstanding (unlimited number of shares, no par value common stock authorized) | | | 6,094,690 | | | 7,546 | | | 12,985,963 | | | 1,576,189 |
Maximum offering price per share (NAV/0.945), (NAV/0.9425 Clough China), based on maximum sales charge of 5.50% (5.75% Clough China) of the offering price) | | $ | 7.86 | | $ | 8.46 | | $ | 5.47 | | $ | 19.32 |
| | | | |
Class C: | | | | | | | | | | | | |
Net Asset Value, offering and redemption price per share (a) | | | N/A | | | N/A | | | N/A | | $ | 17.89 |
Net Assets | | | N/A | | | N/A | | | N/A | | $ | 7,593,873 |
Shares of beneficial interest outstanding (unlimited number of shares, no par value common stock authorized) | | | N/A | | | N/A | | | N/A | | | 424,564 |
| | | | |
Class I (b)(c): | | | | | | | | | | | | |
Net Asset Value, offering and redemption price per share | | $ | 7.48 | | $ | 8.01 | | $ | 5.19 | | $ | 18.41 |
Net Assets | | $ | 16,813,997 | | $ | 9,118,799 | | $ | 45,144,386 | | $ | 15,070,979 |
Shares of beneficial interest outstanding (unlimited number of shares, no par value common stock authorized) | | | 2,248,328 | | | 1,138,426 | | | 8,696,044 | | | 818,719 |
| | | | |
Class R: | | | | | | | | | | | | |
Net Asset Value, offering and redemption price per share | | | N/A | | | N/A | | $ | 4.73 | | | N/A |
Net Assets | | | N/A | | | N/A | | $ | 18,486 | | | N/A |
Shares of beneficial interest outstanding (unlimited number of shares, no par value common stock authorized) | | | N/A | | | N/A | | | 3,911 | | | N/A |
| | (a) | Redemption price per share may be reduced for any applicable contingent deferred sales charge. For a description of a possible sales charge, please see the Fund’s Prospectus. |
| | (b) | Prior to close of business August 28, 2009, Class I of the Activa Fund was known as Class R of the Predecessor Fund. |
| | (c) | Prior to the close of business on January 15, 2010, Class I of the Clough China Fund was known as Institutional Class of the Predecessor Fund. |
See Notes to Financial Statements.
29 | April 30, 2010
| | | | | | |
| Statements of Operations | | | | |
| | | | | Activa Value Fund (a) |
| | | | | | |
| | | For the Period
January 1, 2010
through
April 30, 2010 | | For the Year Ended
December 31, 2009 |
| |
INVESTMENT INCOME | | | | | | |
Dividends | | $ | 480,561 | | $ | 1,797,893 |
Foreign taxes withheld on dividends | | | – | | | – |
Interest and other income | | | 511 | | | 24,453 |
Securities lending income | | | – | | | 8,835 |
Other income | | | – | | | – |
| |
Total Investment Income | | | 481,072 | | | 1,831,181 |
| |
| | |
EXPENSES | | | | | | |
Investment advisory fee | | | 230,523 | | | 495,567 |
Administrative and transfer agency fee | | | 52,965 | | | 51,322 |
Prior service provider fund accounting fees/administrative fee | | | – | | | 35,446 |
Prior service provider service fees | | | – | | | 102,992 |
Prior service provider transfer agency fees | | | – | | | – |
Prior service provider transfer agency fees – Class A | | | – | | | 124,469 |
Prior service provider transfer agent fees – Class I (c) | | | – | | | 14,245 |
Distribution and service fees | | | | | | |
Class A | | | 47,004 | | | 85,940 |
Class C | | | N/A | | | N/A |
Class R | | | N/A | | | N/A |
Legal fees | | | 8,765 | | | 30,755 |
Audit fees | | | 17,200 | | | 72,043 |
Networking fees | | | | | | |
Class A | | | – | | | – |
Class C | | | N/A | | | N/A |
Class I (c)(d) | | | – | | | – |
Class R | | | N/A | | | N/A |
Class Z (e) | | | N/A | | | N/A |
Reports to shareholders and printing fees | | | 11,037 | | | 46,841 |
State registration fees | | | 6,537 | | | 589 |
Interest expense – Margin Account | | | – | | | – |
Insurance | | | 3,291 | | | 48,789 |
Michigan state business tax | | | – | | | (74,213) |
Custody fees | | | 3,517 | | | 14,391 |
Directors’ fees and expenses | | | 15,626 | | | 21,315 |
Dividend expense on short sales | | | – | | | – |
Offering costs | | | – | | | – |
Miscellaneous | | | 5,022 | | | 2,433 |
| |
Total Expense | | | 401,487 | | | 1,072,924 |
Less fees waived/reimbursed by investment adviser and sub-adviser | | | | | | |
Class A | | | (57,029) | | | – |
Class C | | | N/A | | | N/A |
Class I (c)(d) | | | (18,400) | | | – |
Class R | | | N/A | | | N/A |
Class Z (e) | | | N/A | | | N/A |
| |
Net Expenses | | | 326,058 | | | 1,072,924 |
| |
Net Investment Income/(Loss) | | | 155,014 | | | 758,257 |
| |
| | |
Net increase from payment by affiliate (Note 1) | | | – | | | – |
Net realized gain/(loss) on investments | | | 138,322 | | | (2,572,827) |
Net realized loss on securities sold short | | | – | | | – |
Net realized gain on written options | | | – | | | – |
Net realized gain/(loss) on foreign currency transactions | | | – | | | – |
Net change in unrealized appreciation/(depreciation) of investments, securities sold short and written options | | | 5,191,701 | | | 16,108,515 |
Net change in unrealized appreciation/(depreciation) on translation of assets and liabilities in foreign currencies | | | – | | | – |
| |
NET REALIZED AND UNREALIZED GAIN/(LOSS) ON INVESTMENTS | | | 5,330,023 | | | 13,535,688 |
| |
NET INCREASE/(DECREASE) IN NET ASSETS RESULTING FROM OPERATIONS | | $ | 5,485,037 | | $ | 14,293,945 |
| |
(a) Effective March 9, 2010, the Board approved changing the fiscal year–end of the Fund from December 31 to April 30.
(b) Effective March 9, 2010, the Board approved changing the fiscal year–end of the Fund from January 31 to April 30.
(c) Prior to close of business August 28, 2009, Class I of the Activa Fund was known as Class R of the Predecessor Fund.
30 | April 30, 2010
| | | | | | | | | | | | |
| | | | | | | | | | | | | |
| | | |
| | | ALPS | GNI Long-Short Fund | | ALPS | Red Rocks Listed Private Equity Fund | | Clough China Fund (b) |
| | |
| | | For the Period November 2, 2009 (Inception) through April 30, 2010 | | | | For the Year Ended April 30, 2010 | | | | For the Period
August 1, 2009
through April 30, 2010 | | For the
Year Ended
July 31, 2009
(000) |
| | |
| | | | | | |
| | $ 16,395 | | | | $ 1,545,336 | | | | $ 515,939 | | $ 845 |
| | – | | | | (108,877) | | | | (24,381) | | (35) |
| | 220 | | | | – | | | | 1,979 | | 1 |
| | – | | | | – | | | | – | | – |
| | – | | | | – | | | | 3,740 | | – |
| | |
| | 16,615 | | | | 1,436,459 | | | | 497,277 | | 811 |
| | |
| | | | | | |
| | 49,505 | | | | 643,813 | | | | 476,632 | | 411 |
| | 5,863 | | | | 143,736 | | | | 57,517 | | – |
| | – | | | | – | | | | – | | 30 |
| | – | | | | – | | | | – | | – |
| | – | | | | – | | | | 45,595 | | 90 |
| | – | | | | – | | | | – | | – |
| | – | | | | – | | | | – | | – |
| | 76 | | | | 135,726 | | | | 38,184 | | 30 |
| | N/A | | | | N/A | | | | 51,358 | | 64 |
| | N/A | | | | 66 | | | | N/A | | N/A |
| | 420 | | | | 10,610 | | | | 4,393 | | – |
| | 18,150 | | | | 40,495 | | | | 24,371 | | 5 |
| | | | | | |
| | – | | | | 630 | | | | 4,609 | | – |
| | N/A | | | | N/A | | | | 3,390 | | – |
| | 738 | | | | 9,835 | | | | 84 | | – |
| | N/A | | | | 39 | | | | N/A | | – |
| | N/A | | | | N/A | | | | 2,103 | | – |
| | 4,479 | | | | 63,994 | | | | 13,102 | | 21 |
| | 873 | | | | 53,009 | | | | 37,683 | | 51 |
| | 21,421 | | | | – | | | | – | | – |
| | – | | | | 6,438 | | | | 2,522 | | – |
| | – | | | | – | | | | – | | – |
| | 6,000 | | | | 64,571 | | | | 28,722 | | 33 |
| | 1,208 | | | | 18,069 | | | | 13,203 | | 6 |
| | 8,062 | | | | – | | | | – | | – |
| | 32,219 | | | | – | | | | – | | – |
| | 4,741 | | | | 43,540 | | | | 8,890 | | 53 |
| | |
| | 153,755 | | | | 1,234,571 | | | | 812,358 | | 794 |
| | | | | | |
| | (7,457) | | | | (135,626) | | | | (55,592) | | (80) |
| | N/A | | | | N/A | | | | (26,181) | | (47) |
| | (40,577) | | | | (75,103) | | | | (36,323) | | (36) |
| | N/A | | | | (68) | | | | N/A | | – |
| | N/A | | | | N/A | | | | (33,103) | | (41) |
| | |
| | 105,721 | | | | 1,023,774 | | | | 661,159 | | 590 |
| | |
| | (89,106) | | | | 412,685 | | | | (163,882) | | 221 |
| | |
| | – | | | | – | | | | – | | 1 |
| | (1,651,974) | | | | (7,644,127) | | | | 7,475,435 | | (7,544) |
| | (610,416) | | | | – | | | | – | | – |
| | 54,939 | | | | – | | | | – | | – |
| | – | | | | 764,702 | | | | (24,039) | | (53) |
| | | | | | |
| | 124,572 | | | | 38,491,614 | | | | (2,456,116) | | 8,479 |
| | | | | | |
| | – | | | | (2,357) | | | | (12,785) | | 3 |
| | |
| | (2,082,879) | | | | 31,609,832 | | | | 4,982,495 | | 886 |
| | |
| | $ (2,171,985) | | | | $ 32,022,517 | | | | $4,818,613 | | $ 1,107 |
| | |
| | (d) | Prior to the close of business on January 15, 2010, Class I of the Clough China Fund was known as Institutional Class of the Predecessor Fund. |
| | (e) | As a result of the reorganization (Note 1), the Clough China Fund no longer offers Class Z shares. Effective as of the close of business January 15, 2010, holders of Class Z shares of the Old Mutual China Fund received Class A shares of the Fund. |
See Notes to Financial Statements.
31 | April 30, 2010
| | | | | | | | | | | | | |
| Statements of Changes in Net Assets |
| | |
| | | | | Activa Value Fund (a) |
| | |
| | | | | For the Period
January 1, 2010
through
April 30, 2010 | | | For the Year Ended
December 31, 2009 | | | For the Year Ended
December 31, 2008 |
| | |
| | OPERATIONS | | | | | | | | | | | |
| | Net investment income/(loss) | | $ | 155,014 | | | $ | 758,257 | | | $ | 894,243 |
| | Net increase for payment by affiliate (Note 1) | | | – | | | | – | | | | – |
| | Net realized gain/(loss) on investments | | | 138,322 | | | | (2,572,827 | ) | | | (12,507,251) |
| | Net realized loss on securities sold short | | | – | | | | – | | | | – |
| | Net realized gain on written options | | | – | | | | – | | | | – |
| | Net realized gain/(loss) on foreign currency transactions | | | – | | | | – | | | | – |
| | Net change in unrealized appreciation/(depreciation) of investments, securities sold short, written options and translation of assets and liabilities in foreign currencies | | | 5,191,701 | | | | 16,108,515 | | | | (22,231,765) |
| | �� |
| | Net Increase/(Decrease) in Net Assets Resulting from Operations | | | 5,485,037 | | | | 14,293,945 | | | | (33,844,773) |
| | |
| | | | |
| | DISTRIBUTIONS | | | | | | | | | | | |
| | Dividends to shareholders from net investment income | | | | | | | | | | | |
| | Class A | | | – | | | | (602,511 | ) | | | (706,713) |
| | Class C | | | N/A | | | | N/A | | | | N/A |
| | Class I (c)(d) | | | – | | | | (197,487 | ) | | | (55,708) |
| | Class R | | | N/A | | | | N/A | | | | N/A |
| | Class Z (e) | | | N/A | | | | N/A | | | | N/A |
| | Dividends to shareholders from net realized gains | | | | | | | | | | | |
| | Class A | | | – | | | | – | | | | 901 |
| | Class C | | | N/A | | | | N/A | | | | N/A |
| | Class I (c)(d) | | | – | | | | – | | | | (85) |
| | Class R | | | N/A | | | | N/A | | | | N/A |
| | Class Z (e) | | | N/A | | | | N/A | | | | N/A |
| | |
| | Net decrease in net assets from distributions | | | – | | | | (799,998 | ) | | | (761,605) |
| | |
| | | |
| | BENEFICIAL INTEREST TRANSACTIONS (NOTE 3) | | | | | | | | |
| | Shares sold | | | | | | | | | | | |
| | Class A | | | 1,703,692 | | | | 2,575,630 | | | | 2,679,527 |
| | Class C | | | N/A | | | | N/A | | | | N/A |
| | Class I (c)(d) | | | 1,570,054 | | | | 11,456,364 | | | | 962,266 |
| | Class R | | | N/A | | | | N/A | | | | N/A |
| | Class Z (e) | | | N/A | | | | N/A | | | | N/A |
| | Dividends reinvested | | | | | | | | | | | |
| | Class A | | | – | | | | 585,747 | | | | 688,975 |
| | Class C | | | N/A | | | | N/A | | | | N/A |
| | Class I (c)(d) | | | – | | | | 197,487 | | | | 55,792 |
| | Class R | | | N/A | | | | N/A | | | | N/A |
| | Class Z (e) | | | N/A | | | | N/A | | | | N/A |
| | Shares redeemed | | | | | | | | | | | |
| | Class A | | | (22,940,410 | ) | | | (4,161,769 | ) | | | (5,756,696) |
| | Class C | | | N/A | | | | N/A | | | | N/A |
| | Class I (c)(d) | | | (2,432,434 | ) | | | (2,918,243 | ) | | | (625,028) |
| | Class R | | | N/A | | | | N/A | | | | N/A |
| | Class Z (e) | | | N/A | | | | N/A | | | | N/A |
| | |
| | Net increase/(decrease) in net assets derived from
beneficial interest transactions | | | (22,099,098 | ) | | | 7,735,216 | | | | (1,995,164) |
| | |
| | | | |
| | Net increase/(decrease) in net assets | | | (16,614,061 | ) | | | 21,229,163 | | | | (36,601,542) |
| | | | |
| | Net Assets | | | | | | | | | | | |
| | | | |
| | Beginning of period | | | 78,728,323 | | | | 57,499,160 | | | | 94,100,702 |
| | |
| | End of period* | | $ | 62,114,262 | | | $ | 78,728,323 | | | $ | 57,499,160 |
| | |
| | | | |
| | * Includes undistributed net investment income of: | | $ | 245,095 | | | $ | 90,081 | | | $ | 38,859 |
| | (a) | Effective March 9, 2010, the Board approved changing the fiscal year–end of the Fund from December 31 to April 30. |
| | (b) | Effective March 9, 2010, the Board approved changing the fiscal year–end of the Fund from January 31 to April 30. (c) Prior to close of business August 28, 2009, Class I of the Activa Fund was known as Class R of the Predecessor Fund. |
| | (d) | Prior to the close of business on January 15, 2010, Class I of the Clough China Fund was known as Institutional Class of the Predecessor Fund |
| | (e) | As a result of the reorganization (Note 1), the Clough China Fund no longer offers Class Z shares. Effective as of the close of business January 15, 2010, holders of Class Z shares of the Predecessor Fund received Class A shares of the Fund. |
32 | April 30, 2010
| | | | | | | | | | | | | | | | | |
| | | | | | | | | | | | | | | | | | |
| | | |
| | | ALPS | GNI Long-Short Fund | | ALPS | Red Rocks Listed Private Equity Fund | | Clough China Fund (b) |
| | |
| | | | | | |
| | | For the Period November 2, 2009 (Inception) through April 30, 2010 | | For the Year Ended April 30, 2010 | | For the Year Ended April 30, 2009 | | For the Period
August 1, 2009
through April 30, 2010 | | For the Year Ended July 31, 2009 (000) | | For the Year Ended July 31, 2008 (000) |
| | |
| | | | | | |
| | $ (89,106) | | $ | 412,685 | | $ | 571,682 | | $ | (163,882) | | $ | 221 | | $ | 7 |
| | – | | | – | | | – | | | – | | | 1 | | | – |
| | (1,651,974) | | | (7,644,127) | | | (14,443,113) | | | 7,475,435 | | | (7,544) | | | 621 |
| | (610,416) | | | – | | | – | | | – | | | – | | | – |
| | 54,939 | | | – | | | – | | | – | | | – | | | – |
| | – | | | 764,702 | | | (2,306,547) | | | (24,039) | | | (53) | | | 20 |
| | | | | | |
| | 124,572 | | | 38,489,257 | | | (18,211,582) | | | (2,468,901) | | | 8,482 | | | (10,026) |
| | |
| | (2,171,985) | | | 32,022,517 | | | (34,389,560) | | | 4,818,613 | | | 1,107 | | | (9,378) |
| | |
| | | | | | |
| | – | | | (5,410,948) | | | (271,455) | | | (59,414) | | | (182) | | | (46) |
| | N/A | | | N/A | | | N/A | | | – | | | (18) | | | (78) |
| | – | | | (2,409,866) | | | (151,725) | | | (87,067) | | | (187) | | | – |
| | N/A | | | (2,124) | | | (26) | | | N/A | | | N/A | | | N/A |
| | N/A | | | N/A | | | N/A | | | (95,371) | | | (73) | | | (3) |
| | – | | | – | | | (3,447) | | | – | | | – | | | (5,842) |
| | N/A | | | N/A | | | N/A | | | – | | | – | | | (3,380) |
| | – | | | – | | | (1,488) | | | – | | | – | | | (4,804) |
| | N/A | | | – | | | – | | | N/A | | | N/A | | | N/A |
| | N/A | | | N/A | | | N/A | | | – | | | – | | | (1,497) |
| | |
| | – | | | (7,822,938) | | | (428,141) | | | (241,852) | | | (460) | | | (15,650) |
| | |
| | | | | | |
| | 75,000 | | | 32,648,787 | | | 56,557,393 | | | 22,831,904 | | | 5,929 | | | 13,134 |
| | N/A | | | N/A | | | N/A | | | 2,058,570 | | | 1,796 | | | 6,819 |
| | 12,217,413 | | | 32,137,386 | | | 29,215,601 | | | 4,220,994 | | | 13 | | | 23 |
| | N/A | | | 17,750 | | | 33 | | | N/A | | | N/A | | | N/A |
| | N/A | | | N/A | | | N/A | | | 14,440,499 | | | 7,001 | | | 8,593 |
| | | | | | |
| | – | | | 5,282,397 | | | 268,647 | | | 37,489 | | | 120 | | | 4,289 |
| | N/A | | | N/A | | | N/A | | | – | | | 9 | | | 1,736 |
| | – | | | 1,760,196 | | | 102,538 | | | 87,068 | | | 187 | | | 4,804 |
| | N/A | | | 2,123 | | | 26 | | | N/A | | | N/A | | | N/A |
| | N/A | | | N/A | | | N/A | | | 94,027 | | | 71 | | | 1,466 |
| | | | | | |
| | – | | | (13,844,500) | | | (6,347,401) | | | (10,253,870) | | | (8,473) | | | (16,213) |
| | N/A | | | N/A | | | N/A | | | (3,451,765) | | | (3,205) | | | (8,617) |
| | (941,354) | | | (10,644,215) | | | (5,035,259) | | | (3,956) | | | (12) | | | (10,650) |
| | N/A | | | (3,079) | | | (34) | | | N/A | | | N/A | | | N/A |
| | N/A | | | N/A | | | N/A | | | (28,012,416) | | | (1,831) | | | (5,027) |
| | |
| | | | | | |
| | 11,351,059 | | | 47,356,845 | | | 74,761,544 | | | 2,048,544 | | | 1,605 | | | 357 |
| | |
| | | | | | |
| | 9,179,074 | | | 71,556,424 | | | 39,943,843 | | | 6,625,305 | | | 2,252 | | | (24,671) |
| | | | | | |
| | – | | | 40,797,974 | | | 854,131 | | | 44,734,104 | | | 42,482 | | | 67,153 |
| | |
| | | | | | |
| | $ 9,179,074 | | $ | 112,354,398 | | $ | 40,797,974 | | $ | 51,359,409 | | $ | 44,734 | | $ | 42,482 |
| | |
| | | | | | |
| | $ – | | $ | (4,922,899) | | $ | 1,113,077 | | $ | (147,621) | | $ | 22 | | $ | (28) |
See Notes to Financial Statements.
33 | April 30, 2010
| | | | | | |
| Financial Highlights | | |
| | | Selected data for a share of benificial interest outstanding throughout the periods indicated: |
| | | | | | | | | | | | | | | | | | |
| | | Activa Value Fund [Class A] |
| |
| | | For the Period
January 1, 2010
through April 30, | | For the Year Ended December 31, |
| | | 2010 (a) | | 2009 | | 2008 | | 2007 | | 2006 | | 2005 |
| |
Net asset value, beginning of period | | $ | 6.92 | | $ | 5.86 | | $ | 9.35 | | $ | 9.81 | | $ | 8.65 | | $ | 8.06 |
| | |
INCOME/(LOSS) FROM INVESTMENT OPERATIONS: | | | | | | |
Net investment income | | | 0.03 | | | 0.07 | | | 0.08 | | | 0.14 | | | 0.13 | | | 0.09 |
Net realized and unrealized gain/(loss) | | | 0.48 | | | 1.06 | | | (3.49) | | | 0.09 | | | 1.49 | | | 0.59 |
| |
Total from investment operations | | | 0.51 | | | 1.13 | | | (3.41) | | | 0.23 | | | 1.62 | | | 0.68 |
| |
| | | | | | |
DISTRIBUTIONS: | | | | | | | | | | | | | | | | | | |
From net investment income | | | – | | | (0.07) | | | (0.08) | | | (0.14) | | | (0.13) | | | (0.09) |
From net realized gains | | | – | | | – | | | – | | | (0.55) | | | (0.33) | | | – |
| |
Total distributions | | | – | | | (0.07) | | | (0.08) | | | (0.69) | | | (0.46) | | | (0.09) |
| |
Net increase/(decrease) in net asset value | | | 0.51 | | | 1.06 | | | (3.49) | | | (0.46) | | | 1.16 | | | 0.59 |
| |
Net asset value, end of period | | $ | 7.43 | | $ | 6.92 | | $ | 5.86 | | $ | 9.35 | | $ | 9.81 | | $ | 8.65 |
| |
TOTAL RETURN (b) | | | 7.22% | | | 19.24% | | | (36.45)% | | | 2.43% | | | 18.80% | | | 8.47% |
| | | | | |
RATIOS/SUPPLEMENTAL DATA: | | | | | | | | | | | | | | | |
Net assets, end of period (000) | | $ | 45,300 | | $ | 62,264 | | $ | 53,841 | | $ | 88,679 | | $ | 125,459 | | $ | 132,597 |
Ratio of net investment income to average net assets | | | 0.60% (c) | | | 1.12% | | | 1.1% | | | 1.4% | | | 1.4% | | | 1.1% |
Ratio of expenses to average net assets including fee waivers and reimbursements | | | 1.40% (c) | | | 1.62% | | | 1.5% | | | 1.2% | | | 1.1% | | | 1.2% |
Ratio of expenses to average net assets excluding fee waivers and reimbursements | | | 1.70% (c) | | | N/A | | | N/A | | | N/A | | | N/A | | | N/A |
Portfolio turnover rate (d) | | | 11% | | | 56% | | | 83% | | | 52% | | | 64% | | | 54% |
| | (a) | Effective March 9, 2010, the Board approved changing the fiscal year–end of the Fund from December 31 to April 30. |
| | (b) | Total returns are for the period indicated and have not been annualized. Total returns would have been lower had ceratin expenses not been waived during the period. Ruturns shown do not reflect the deduction of taxes that a shareholder would pay on Fund distributions or the redemption of Fund shares. Returns shown exclude any applicable sales charges. |
| | (d) | Portfolio turnover rate for periods of less than one full year have not been annualized. |
See Notes to Financial Statements.
34 | April 30, 2010
| | | | | | |
| Financial Highlights | | |
| | | Selected data for a share of benificial interest outstanding throughout the periods indicated: |
| | | | | | | | | | | | | | | | | | | | |
| | | | | Activa Value Fund [Class I] (a) |
| | |
| | | | | For the Period
January 1, 2010
through April 30, | | For the Year Ended December 31, |
| | | | | 2010 (a) | | 2009 | | 2008 | | 2007 | | 2006 | | 2005 |
| | |
| | Net asset value, beginning of period | | $ | 6.96 | | $ | 5.89 | | $ | 9.41 | | $ | 9.86 | | $ | 8.69 | | $ | 8.10 |
| | | | |
| | INCOME/(LOSS) FROM INVESTMENT OPERATIONS: | | | | | | | | | |
| | Net investment income | | | 0.02 | | | 0.07 | | | 0.09 | | | 0.15 | | | 0.14 | | | 0.10 |
| | Net realized and unrealized gain/(loss) | | | 0.50 | | | 1.08 | | | (3.52) | | | 0.10 | | | 1.50 | | | 0.59 |
| | |
| | Total from investment operations | | | 0.52 | | | 1.15 | | | (3.43) | | | 0.25 | | | 1.64 | | | 0.69 |
| | |
| | | | | | | |
| | DISTRIBUTIONS: | | | | | | | | | | | | | | | | | | |
| | From net investment income | | | – | | | (0.08) | | | (0.09) | | | (0.15) | | | (0.14) | | | (0.10) |
| | From net realized gains | | | – | | | – | | | – | | | (0.55) | | | (0.33) | | | – |
| | |
| | Total distributions | | | – | | | (0.08) | | | (0.09) | | | (0.70) | | | (0.47) | | | (0.10) |
| | |
| | | | | | | |
| | Net increase/(decrease) in net asset value | | | 0.52 | | | 1.07 | | | (3.52) | | | (0.45) | | | 1.17 | | | 0.59 |
| | |
| | Net asset value, end of period | | $ | 7.48 | | $ | 6.96 | | $ | 5.89 | | $ | 9.41 | | $ | 9.86 | | $ | 8.69 |
| | |
| | TOTAL RETURN (c) | | | 7.47% | | | 19.59% | | | (36.38)% | | | 2.59% | | | 18.89% | | | 8.52% |
| | | | | | | |
| | RATIOS/SUPPLEMENTAL DATA: | | | | | | | | | | | | | | | | | | |
| | Net assets, end of period (000) | | $ | 16,814 | | $ | 16,465 | | $ | 3,658 | | $ | 5,422 | | $ | 4,956 | | $ | 4,264 |
| | Ratio of net investment income to average net assets | | | 0.77% (d) | | | 1.17% | | | 1.3% | | | 1.4% | | | 1.4% | | | 1.2% |
| | Ratio of expenses to average net assets including fee waivers and reimbursements | | | 1.15% (d) | | | 1.46% | | | 1.4% | | | 1.1% | | | 1.1% | | | 1.1% |
| | Ratio of expenses to average net assets excluding fee waivers and reimbursements | | | 1.49% (d) | | | N/A | | | N/A | | | N/A | | | N/A | | | N/A |
| | Portfolio turnover rate (e) | | | 11% | | | 56% | | | 83% | | | 52% | | | 64% | | | 54% |
| | (a) | Prior to the close of business on August 28, 2009, Class I was known as Class R of the Predecessor Fund. |
| | (b) | Effective March 9, 2010, the Board approved changing the fiscal year–end of the Fund from December 31 to April 30. |
| | (c) | Total returns are for the period indicated and have not been annualized. Total returns would have been lower had ceratin expenses not been waived during the period. Ruturns shown do not reflect the deduction of taxes that a shareholder would pay on Fund distributions or the redemption of Fund shares. |
| | (e) | Portfolio turnover rate for periods of less than one full year have not been annualized. |
See Notes to Financial Statements.
35 | April 30, 2010
| | | | | | |
| Financial Highlights | | |
| | | Selected data for a share of benificial interest outstanding throughout the periods indicated: |
| | | | | |
| | | ALPS | GNI Long-Short Fund [Class A] | | |
| |
| | | For the Period November 2, 2009
(Inception) through April 30, 2010 | | |
| |
Net asset value, beginning of period | | $ | 10.00 | | |
| | |
LOSS FROM INVESTMENT OPERATIONS: | | | | | |
Net investment loss | | | – | | |
Net realized and unrealized loss | | | (2.01) | | |
| |
Total from investment operations | | | (2.01) | | |
| |
| | |
DISTRIBUTIONS: | | | | | |
From net investment income | | | – | | |
From net realized gains | | | – | | |
| |
Total distributions | | | – | | |
| |
| | |
Net decrease in net asset value | | | (2.01) | | |
| |
Net asset value, end of period | | $ | 7.99 | | |
| |
TOTAL RETURN (a) | | | (20.10)% | | |
| | |
RATIOS/SUPPLEMENTAL DATA: | | | | | |
Net assets, end of period (000) | | $ | 60 | | |
Ratio of net investment loss to average net assets | | | (2.53)% (b) | | |
Ratio of expenses to average net assets including fee waivers and reimbursement | | | 2.90% (b) | | |
Ratio of expenses to average net assets excluding fee waivers and reimbursement | | | 27.32% (b) | | |
Ratio of expenses to average net assets including fee waivers and reimbursement (excluding interest expense and short sale dividend expense) | | | 2.25% (b) | | |
Ratio of expenses to average net assets excluding fee waivers and reimbursement (excluding interest expense and short sale dividend expense) | | | 26.69% (b) | | |
Portfolio turnover rate (c) | | | 250% | | |
| | (a) | Total returns are for the period indicated and have not been annualized. Total returns would have been lower had ceratin expenses not been waived during the period. Returns shown do not reflect the deduction of taxes that a shareholder would pay on Fund distributions or the redemption of Fund shares. Returns shown exclude any applicable sales charges. |
| | (c) | Portfolio turnover rate for periods of less than one full year have not been annualized. |
See Notes to Financial Statements.
36 | April 30, 2010
| | | | | | |
| Financial Highlights | | |
| | | Selected data for a share of benificial interest outstanding throughout the periods indicated: |
| | | | | |
| | | ALPS | GNI Long-Short Fund [Class I] | | |
| |
| | | For the Period November 2, 2009
(Inception) through April 30, 2010 | | |
| |
Net asset value, beginning of period | | $ | 10.00 | | |
| | |
LOSS FROM INVESTMENT OPERATIONS: | | | | | |
Net investment loss | | | – | | |
Net realized and unrealized loss | | | (1.99) | | |
| |
Total from investment operations | | | (1.99) | | |
| |
| | |
DISTRIBUTIONS: | | | | | |
From net investment income | | | – | | |
From net realized gains | | | – | | |
| |
Total distributions | | | – | | |
| |
| | |
Net decrease in net asset value | | | (1.99) | | |
| |
Net asset value, end of period | | $ | 8.01 | | |
| |
TOTAL RETURN (a) | | | (19.90)% | | |
| | |
RATIOS/SUPPLEMENTAL DATA: | | | | | |
Net assets, end of period (000) | | $ | 9,119 | | |
Ratio of net investment loss to average net assets | | | (2.34)% (b) | | |
Ratio of expenses to average net assets including fee waivers and reimbursement | | | 2.78% (b) | | |
Ratio of expenses to average net assets excluding fee waivers and reimbursement | | | 3.85% (b) | | |
Ratio of expenses to average net assets including fee waivers and reimbursement (excluding interest expense and short sale dividend expense) | | | 2.00% (b) | | |
Ratio of expenses to average net assets excluding fee waivers and reimbursement (excluding interest expense and short sale dividend expense) | | | 3.07% (b) | | |
Portfolio turnover rate (c) | | | 250% | | |
| | (a) | Total returns are for the period indicated and have not been annualized. Total returns would have been lower had ceratin expenses not been waived during the period. Returns shown do not reflect the deduction of taxes that a shareholder would pay on Fund distributions or the redemption of Fund shares. |
| | (c) | Portfolio turnover rate for periods of less than one full year have not been annualized. |
See Notes to Financial Statements.
37 | April 30, 2010
| | | | | | |
| Financial Highlights | | |
| | | Selected data for a share of benificial interest outstanding throughout the periods indicated: |
| | | | | | | | | | | | | |
| | | ALPS | Red Rocks Listed Private Equity Fund [Class A] | | |
| |
| | | For the Year Ended April 30, | | | For the Period Ended | | |
| | | 2010 | | | 2009 | | | April 30, 2008 (a) | | |
| |
Net asset value, beginning of period | | $ | 3.56 | | | $ | 9.47 | | | $ | 10.00 | | |
| | | | |
INCOME/(LOSS) FROM INVESTMENT OPERATIONS: | | | | | | | | | | | | | |
Net investment income | | | 0.14 | | | | 0.08 | (b) | | | 0.11 | | |
Net realized and unrealized gain/(loss) | | | 1.99 | | | | (5.97 | ) (b) | | | (0.64) | | |
| |
Total from investment operations | | | 2.13 | | | | (5.89 | ) | | | (0.53) | | |
| |
| | | | |
DISTRIBUTIONS: | | | | | | | | | | | | | |
From net investment income | | | (0.52 | ) | | | (0.03 | ) | | | – | | |
From net realized gains | | | – | | | | – | (c) | | | – | | |
| |
Total distributions | | | (0.52 | ) | | | (0.03 | ) | | | – | | |
| |
| | | | |
REDEMPTION FEES ADDED TO PAID IN CAPITAL (NOTE 3) | | | – | (c) | | | 0.01 | (b) | | | – | | |
| |
Net increase/(decrease) in net asset value | | | 1.61 | | | | (5.91 | ) | | | (0.53) | | |
| |
Net asset value, end of period | | $ | 5.17 | | | $ | 3.56 | | | $ | 9.47 | | |
| |
TOTAL RETURN (d) | | | 61.68 | % | | | (62.01 | )% | | | (5.30)% | | |
| | | | |
RATIOS/ SUPPLEMENTAL DATA: | | | | | | | | | | | | | |
Net assets, end of period (in 000) | | $ | 67,192 | | | $ | 27,860 | | | $ | 832 | | |
Ratio of net investment income to average net assets | | | 0.42 | % | | | 2.16 | % | | | 4.68% (e) | | |
Ratio of expenses to average net assets including fee waivers and reimbursements | | | 1.44 | % (f) | | | 1.25 | % | | | 1.25% (e) | | |
Ratio of expenses to average net assets excluding fee waivers and reimbursements | | | 1.71 | % | | | 2.08 | % | | | 39.07% (e) | | |
Portfolio turnover rate (g) | | | 54 | % | | | 59 | % | | | 15% | | |
| | (a) | The Fund commenced operations on December 31, 2007. |
| | (b) | Per share numbers have been calculated using the average shares method. |
| | (c) | Less than $0.005 per share. |
| | (d) | Total returns are for the period indicated and have not been annualized. Total returns would have been lower had ceratin expenses not been waived during the period. Returns shown do not reflect the deduction of taxes that a shareholder would pay on Fund distributions or the redemption of Fund shares. Returns shown exclude any applicable sales charges. |
| | (f) | Effective September 1, 2009, the net expense ratio limitation changed from 1.25% to 1.50%. |
| | (g) | Portfolio turnover rate for periods of less than one full year have not been annualized. |
See Notes to Financial Statements.
38 | April 30, 2010
| | | | | | |
| Financial Highlights | | |
| | | Selected data for a share of benificial interest outstanding throughout the periods indicated: |
| | | | | | | | | | | | | |
| | | ALPS | Red Rocks Listed Private Equity Fund [Class I] | | |
| |
| | | For the Year Ended April 30, | | | For the Period Ended | | |
| | | 2010 | | | 2009 | | | April 30, 2008 (a) | | |
| |
Net asset value, beginning of period | | $ | 3.57 | | | $ | 9.47 | | | $ | 10.00 | | |
| | | | |
INCOME/(LOSS) FROM INVESTMENT OPERATIONS: | | | | | | | | | | | | | |
Net investment income | | | 0.28 | | | | 0.10 | (b) | | | 0.13 | | |
Net realized and unrealized gain/(loss) | | | 1.87 | | | | (5.97 | ) (b) | | | (0.66) | | |
| |
Total from investment operations | | | 2.15 | | | | (5.87 | ) | | | (0.53) | | |
| |
| | | | |
DISTRIBUTIONS: | | | | | | | | | | | | | |
From net investment income | | | (0.53 | ) | | | (0.05 | ) | | | – | | |
From net realized gains | | | – | | | | – | (c) | | | – | | |
| |
Total distributions | | | (0.53 | ) | | | (0.05 | ) | | | – | | |
| |
| | | | |
REDEMPTION FEES ADDED TO PAID IN CAPITAL (NOTE 3) | | | – | (c) | | | 0.02 | (b) | | | – | | |
| |
Net increase/(decrease) in net asset value | | | 1.62 | | | | (5.90 | ) | | | (0.53) | | |
| |
Net asset value, end of period | | $ | 5.19 | | | $ | 3.57 | | | $ | 9.47 | | |
| |
TOTAL RETURN(d) | | | 62.09 | % | | | (61.79 | )% | | | (5.30)% | | |
| | | | |
RATIOS/ SUPPLEMENTAL DATA: | | | | | | | | | | | | | |
Net assets, end of period (in 000) | | $ | 45,144 | | | $ | 12,938 | | | $ | 21 | | |
Ratio of net investment income to average net assets | | | 0.78 | % | | | 2.56 | % | | | 6.11% (e) | | |
Ratio of expenses to average net assets including fee waivers and reimbursements | | | 1.19 | % (f) | | | 1.00 | % | | | 1.00% (e) | | |
Ratio of expenses to average net assets excluding fee waivers and reimbursements | | | 1.47 | % | | | 2.05 | % | | | 35.33% (e) | | |
Portfolio turnover rate (g) | | | 54 | % | | | 59 | % | | | 15% | | |
| | (a) | The Fund commenced operations on December 31, 2007. |
| | (b) | Per share numbers have been calculated using the average shares method. |
| | (c) | Less than $0.005 per share. |
| | (d) | Total returns are for the period indicated and have not been annualized. Total returns would have been lower had ceratin expenses not been waived during the period. Returns shown do not reflect the deduction of taxes that a shareholder would pay on Fund distributions or the redemption of Fund shares. Returns shown exclude any applicable sales charges. |
| | (f) | Effective September 1, 2009, the net expense ratio limitation changed from 1.00% to 1.25%. |
| | (g) | Portfolio turnover rate for periods of less than one full year have not been annualized. |
See Notes to Financial Statements.
39 | April 30, 2010
| | | | | | |
| Financial Highlights | | |
| | | Selected data for a share of benificial interest outstanding throughout the periods indicated: |
| | | | | | | | | | | | | | |
| | | ALPS | Red Rocks Listed Private Equity Fund [Class R] | | |
| | | | | For the Year Ended April 30, | | | For the Period Ended | | |
| | | | | 2010 | | | 2009 | | | April 30, 2008 (a) | | |
Net asset value, beginning of period | | | | $ | 3.31 | | | $ | 9.46 | | | $ 10.00 | | |
| | | |
INCOME/(LOSS) FROM INVESTMENT OPERATIONS: | | | | | | | | | |
Net investment income/(loss) | | | | | (0.09 | ) | | | 0.15 | (b) | | 0.12 | | |
Net realized and unrealized gain/(loss) | | | 2.02 | | | | (6.05 | ) (b) | | (0.66) | | |
| |
Total from investment operations | | | | | 1.93 | | | | (5.90 | ) | | (0.54) | | |
| |
| | | | | |
DISTRIBUTIONS: | | | | | | | | | | | | | | |
From net investment income | | | | | (0.51 | ) | | | (0.26 | ) | | – | | |
From net realized gains | | | | | – | | | | – | (c) | | – | | |
| |
Total distributions | | | | | (0.51 | ) | | | (0.26 | ) | | – | | |
| |
| | | | |
REDEMPTION FEES ADDED TO PAID IN
CAPITAL (NOTE 3) | | | – | | | | 0.01 | (b) | | – | | |
| |
Net increase/(decrease) in net asset value | | | 1.42 | | | | (6.15 | ) | | (0.54) | | |
| |
Net asset value, end of period | | | | $ | 4.73 | | | $ | 3.31 | | | $ 9.46 | | |
| |
TOTAL RETURN(d) | | | | | 60.92 | % | | | (62.10 | )% | | (5.40)% | | |
| | | | | |
RATIOS/ SUPPLEMENTAL DATA: | | | | | | | | | | | | | | |
Net assets, end of period (in 000) | | | | $ | 18 | | | $ | – | (e) | | $ 1 | | |
Ratio of net investment loss to average net assets | | | (0.24 | )% | | | 2.72 | % | | 3.90% (f) | | |
Ratio of expenses to average net assets including fee waivers and reimbursements | | | 1.75 | % (g) | | | 1.50 | % | | 1.50% (f) | | |
Ratio of expenses to average net assets excluding fee waivers and reimbursements | | | 2.27 | % | | | 6.08 | % | | 43.39% (f) | | |
Portfolio turnover rate (h) | | | | | 54 | % | | | 59 | % | | 15% | | |
| | (a) | The Fund commenced operations on December 31, 2007. |
| | (b) | Per share numbers have been calculated using the average shares method. |
| | (c) | Less than $0.005 per share. |
| | (d) | Total returns are for the period indicated and have not been annualized. Total returns would have been lower had ceratin expenses not been waived during the period. Ruturns shown do not reflect the deduction of taxes that a shareholder would pay on Fund distributions or the redemption of Fund shares. |
| | (g) | Effective September 1, 2009, the net expense ratio limitation changed from 1.50% to 1.75%. |
| | (h) | Portfolio turnover rate for periods of less than one full year have not been annualized. |
See Notes to Financial Statements.
40 | April 30, 2010
| | | | | | |
| Financial Highlights | | |
| | | Selected data for a share of benificial interest outstanding throughout the periods indicated: |
| | | | | | | | | | | | | |
| | | Clough China Fund [Class A] |
| |
| | | For the Period
August 1, 2009
through | | For the Year Ended July 31, | | | For the Period
December 30, 2005
(Inception) through |
| | | April 30, 2010 (a) | | 2009 | | | 2008 | | | 2007 | | | July 31, 2006 |
| |
Net asset value, beginning of period | | $ 16.32 | | $ 15.81 | | | $ 22.46 | | | $ 13.23 | | | $ 10.00 |
| | | | | |
INCOME/(LOSS) FROM INVESTMENT OPERATIONS: | | | | | | | | | | | | | |
Net investment income/(loss) | | 0.10 | | 0.09 | (b) | | (0.01 | ) (b) | | 0.06 | (b) | | 0.01 (b) |
Net realized and unrealized gain/(loss) | | 1.85 | | 0.62 | (b)(c) | | (1.73 | ) (b) | | 9.59 | (b) | | 3.22 (b) |
| |
Total from investment operations | | 1.95 | | 0.71 | | | (1.74 | ) | | 9.65 | | | 3.23 |
| |
| | | | | |
DISTRIBUTIONS: | | | | | | | | | | | | | |
From net investment income | | (0.07) | | (0.20 | ) | | (0.03 | ) | | (0.05 | ) | | – |
From net realized gains | | – | | – | | | (4.88 | ) | | (0.37 | ) | | – |
| |
Total distributions | | (0.07) | | (0.20 | ) | | (4.91 | ) | | (0.42 | ) | | – |
| |
| | | | | |
REDEMPTION FEES ADDED TO PAID IN CAPITAL (NOTE 3) | | 0.01 | | – | (d) | | – | | | – | | | – |
| |
Net increase/(decrease) in net asset value | | 1.89 | | 0.51 | | | (6.65 | ) | | 9.23 | | | 3.23 |
| |
Net asset value, end of period | | $ 18.21 | | $ 16.32 | | | $ 15.81 | | | $ 22.46 | | | $ 13.23 |
| |
TOTAL RETURN (e) | | 12.07% | | 5.00 | % (c) | | (13.91 | )% | | 73.81 | % | | 32.30% |
| | | | | |
RATIOS/SUPPLEMENTAL DATA: | | | | | | | | | | | | | |
Net assets, end of period (000) | | $ 28,695 | | $ 15,069 | | | $ 17,927 | | | $ 25,976 | | | $ 2,532 |
Ratio of net investment loss to average net assets | | (0.53)% (f) | | 0.70 | % | | (0.06 | )% | | 0.31 | % | | 0.12% (f) |
Ratio of expenses to average net assets including fee waivers and reimbursements | | 1.87% (f)(g) | | 1.95 | % | | 2.02 | % | | 2.10 | % | | 2.10% (f) |
Ratio of expenses to average net assets excluding fee waivers and reimbursements | | 2.24% (f) | | 2.62 | % | | 2.34 | % | | 2.42 | % | | 6.65% (f) |
Portfolio turnover rate (h) | | 110% | | 120 | % | | 178 | % | | 193 | % | | 51% |
| | (a) | Effective March 9, 2010, the Board approved changing the fiscal year–end of the Fund from July 31 to April 30. |
| | (b) | Per share numbers have been calculated using the average shares method. |
| | (c) | Impact of payment by affiliate was less than $0.01 per share and 0.01%, respectively (See Note 1). |
| | (d) | Less than $0.005 per share. |
| | (e) | Total returns are for the period indicated and have not been annualized. Total returns would have been lower had ceratin expenses not been waived during the period. Ruturns shown do not reflect the deduction of taxes that a shareholder would pay on Fund distributions or the redemption of Fund shares. Returns shown exclude any applicable sales charges. |
| | (g) | Effective January 1, 2010, the net expense ratio limitation changed from 1.70% to 1.85%. Prior to January 1, 2010 the net expense ratio limitation was 1.95%. |
| | (h) | Portfolio turnover rate for periods of less than one full year have not been annualized. |
See Notes to Financial Statements.
41 | April 30, 2010
| | | | | | |
| Financial Highlights | | |
| | | Selected data for a share of benificial interest outstanding throughout the periods indicated: |
| | | | | | | | | | | | | |
| | | Clough China Fund [Class C] |
| |
| | | For the Period
August 1, 2009
through | | For the Year Ended July 31, | | | For the Period
December 30, 2005
(Inception) through |
| | | April 30, 2010 (a) | | 2009 | | | 2008 | | | 2007 | | | July 31, 2006 |
| |
Net asset value, beginning of period | | $ 16.08 | | $ 15.48 | | | $ 22.26 | | | $ 13.18 | | | $ 10.00 |
| | | | | |
INCOME/(LOSS) FROM INVESTMENT OPERATIONS: | | | | | | | | | | | | | |
Net investment loss | | (0.17) | | (0.01 | ) (b) | | (0.17 | ) (b) | | (0.06 | ) (b) | | (0.06) (b) |
Net realized and unrealized gain/(loss) | | 1.98 | | 0.65 | (b)(c) | | (1.64 | ) (b) | | 9.52 | (b) | | 3.24 (b) |
| |
Total from investment operations | | 1.81 | | 0.64 | | | (1.81 | ) | | 9.46 | | | 3.18 |
| |
| | | | | |
DISTRIBUTIONS: | | | | | | | | | | | | | |
From net investment income | | – | | (0.04 | ) | | (0.09 | ) | | (0.02 | ) | | – |
From net realized gains | | – | | – | | | (4.88 | ) | | (0.37 | ) | | – |
| |
Total distributions | | – | | (0.04 | ) | | (4.97 | ) | | (0.39 | ) | | – |
| |
| | | | | |
REDEMPTION FEES ADDED TO PAID IN CAPITAL (NOTE 3) | | – | | – | | | – | | | 0.01 | | | – |
| |
Net increase/(decrease) in net asset value | | 1.81 | | 0.60 | | | (6.78 | ) | | 9.08 | | | 3.18 |
| |
Net asset value, end of period | | $ 17.89 | | $ 16.08 | | | $ 15.48 | | | $ 22.26 | | | $ 13.18 |
| |
TOTAL RETURN (d) | | 11.26% | | 4.21 | % (c) | | (14.49 | )% | | 76.27 | % | | 31.80% |
| | | | | |
RATIOS/SUPPLEMENTAL DATA: | | | | | | | | | | | | | |
Net assets, end of period (000) | | $ 7,594 | | $ 8,267 | | | $ 9,991 | | | $ 15,497 | | | $ 793 |
Ratio of net investment loss to average net assets | | (1.26)% (e) | | (0.05 | )% | | (0.85 | )% | | (0.33 | )% | | (0.76)% (e) |
Ratio of expenses to average net assets including fee waivers and reimbursements | | 2.70% (e) | | 2.70 | % | | 2.77 | % | | 2.85 | % | | 2.85% (e) |
Ratio of expenses to average net assets excluding fee waivers and reimbursements | | 3.18% (e) | | 3.43 | % | | 3.15 | % | | 3.33 | % | | 11.53% (e) |
Portfolio turnover rate (f) | | 110% | | 120 | % | | 178 | % | | 193 | % | | 51% |
| | (a) | Effective March 9, 2010, the Board approved changing the fiscal year–end of the Fund from July 31 to April 30. |
| | (b) | Per share numbers have been calculated using the average shares method. |
| | (c) | Impact of payment by affiliate was less than $0.01 per share and 0.01%, respectively (See Note 1). |
| | (d) | Total returns are for the period indicated and have not been annualized. Total returns would have been lower had ceratin expenses not been waived during the period. Ruturns shown do not reflect the deduction of taxes that a shareholder would pay on Fund distributions or the redemption of Fund shares. Returns shown exclude any applicable sales charges. |
| | (f) | Portfolio turnover rate for periods of less than one full year have not been annualized. |
See Notes to Financial Statements.
42 | April 30, 2010
| | | | | | |
| Financial Highlights | | |
| | | Selected data for a share of benificial interest outstanding throughout the periods indicated: |
| | | | | | | | | | | | | |
| | | Clough China Fund [Class I] (a) |
| |
| | | For the Period
August 1, 2009
through | | For the Year Ended July 31, | | | For the Period
December 30, 2005
(Inception) through |
| | | April 30, 2010 (b) | | 2009 | | | 2008 | | | 2007 | | | July 31, 2006 |
| |
Net asset value, beginning of period | | $ 16.52 | | $ 16.10 | | | $ 22.65 | | | $ 13.27 | | | $10.00 |
| | | | | |
INCOME/(LOSS) FROM INVESTMENT OPERATIONS: | | | | | | | | | | | | | |
Net investment income | | 0.01 | | 0.15 | (c) | | 0.13 | (c) | | 0.19 | (c) | | 0.08 (c) |
Net realized and unrealized gain/(loss) | | 2.03 | | 0.60 | (c)(d) | | (1.80 | ) (c) | | 9.63 | (c) | | 3.19 (c) |
| |
Total from investment operations | | 2.04 | | 0.75 | | | (1.67 | ) | | 9.82 | | | 3.27 |
| |
| | | | | |
DISTRIBUTIONS: | | | | | | | | | | | | | |
From net investment income | | (0.15) | | (0.33 | ) | | – | | | (0.07 | ) | | – |
From net realized gains | | – | | – | | | (4.88 | ) | | (0.37 | ) | | – |
| |
Total distributions | | (0.15) | | (0.33 | ) | | (4.88 | ) | | (0.44 | ) | | – |
| |
| | | | | |
REDEMPTION FEES ADDED TO PAID IN CAPITAL (NOTE 3) | | – | | – | | | – | | | – | | | – |
| |
Net increase/(decrease) in net asset value | | 1.89 | | 0.42 | | | (6.55 | ) | | 9.38 | | | 3.27 |
| |
Net asset value, end of period | | $ 18.41 | | $ 16.52 | | | $ 16.10 | | | $ 22.65 | | | $ 13.27 |
| |
TOTAL RETURN (e) | | 12.36% | | 5.51 | % (d) | | (13.41 | )% | | 74.91 | % | | 32.70% |
| | | | | |
RATIOS/SUPPLEMENTAL DATA: | | | | | | | | | | | | | |
Net assets, end of period (000) | | $ 15,071 | | $ 9,744 | | | $ 9,231 | | | $ 22,303 | | | $ 12,622 |
Ratio of net investment income to average net assets | | 0.08% (f) | | 1.20 | % | | 0.62 | % | | 1.06 | % | | 1.07% (f) |
Ratio of expenses to average net assets including fee waivers and reimbursements | | 1.40% (f) | | 1.40 | % | | 1.47 | % | | 1.55 | % | | 1.55% (f) |
Ratio of expenses to average net assets excluding fee waivers and reimbursements | | 1.86% (f) | | 1.97 | % | | 1.76 | % | | 1.75 | % | | 2.58% (f) |
Portfolio turnover rate (g) | | 110% | | 120 | % | | 178 | % | | 193 | % | | 51% |
| | (a) | Prior to the close of business on January 15, 2010, Class I of the Clough China Fund was known as Institutional Class of the Predecessor Fund. |
| | (b) | Effective March 9, 2010, the Board approved changing the fiscal year–end of the Fund from July 31 to April 30. |
| | (c) | Per share numbers have been calculated using the average shares method. |
| | (d) | Impact of payment by affiliate was less than $0.01 per share and 0.01%, respectively (See Note 1). |
| | (e) | Total returns are for the period indicated and have not been annualized. Total returns would have been lower had ceratin expenses not been waived during the period. Ruturns shown do not reflect the deduction of taxes that a shareholder would pay on Fund distributions or the redemption of Fund shares. |
| | (g) | Portfolio turnover rate for periods of less than one full year have not been annualized. |
See Notes to Financial Statements.
43 | April 30, 2010
| | | | | | |
| Notes to Financial Statements | | |
| | | | | April 30, 2010 |
| | 1. | ORGANIZATION AND SIGNIFICANT ACCOUNTING POLICIES |
Financial Investors Trust (the “Trust”) was organized as a Delaware statutory trust on November 30, 1993 and registered as an open-end management investment company under the Investment Company Act of 1940, as amended (“1940 Act”). Activa Value Fund, ALPS | GNI Long-Short Fund, ALPS | Red Rocks Listed Private Equity Fund and Clough China Fund (collectively the “Funds” and individually a “Fund”) are series funds representing four of six separate series offered to the public under the Trust as of April 30, 2010. The Trust offers six Funds which include multiple series of shares, with differing investment objectives and policies. Each class differs as to sales and redemption charges and ongoing fees. All classes of shares have identical rights to earnings, assets and voting privileges, except for class-specific expenses and exclusive rights to vote on matters affecting only individual classes. Class A shares of the Fund are subject to an initial sales charge of up to 5.50%, with the exception of the Clough China Fund, which is subject to an initial sales charge of up to 5.75%. Class A shares and Class C shares of the Funds, as applicable, for which no initial sales charge was paid are subject to a contingent deferred sales charge of 1% if the shares are sold within twelve months after a purchase in excess of $1 million.
On August 29, 2009, Activa Value Fund (“predecessor Activa Fund”), a series of the Activa Mutual Fund Trust, participated in a tax-free reorganization. Through the reorganization, the predecessor Activa Fund merged into the newly created Activa Value Fund series of the Trust. The Activa Value Fund has carried over the historic financial statements of the predecessor Activa Fund. The predecessor Activa Fund commenced operations on August 10, 1971.
On November 2, 2009, ALPS | GNI Long-Short Fund commenced operations.
On January 16, 2010, Old Mutual China Fund (“predecessor China Fund”), a series of the Old Mutual Funds I, participated in a tax-free reorganization. Through the reorganization, the predecessor China Fund merged into the newly created Clough China Fund series of the Trust. The Clough China Fund has carried over the historic performance and financial statements of the predecessor China Fund. The predecessor China Fund commenced operations on December 30, 2005.
The following is a summary of significant accounting policies consistently followed by each of the Funds in the preparation of its financial statements. The policies are in conformity with accounting principles generally accepted in the United States of America for investment companies.
Investment Valuation: The Board of Trustees (“Board” or “Trustees”) of the Trust has approved procedures to be used to value the Funds’ securities for the purposes of determining the Funds’ net asset value (“NAV”). The valuation of the securities of the Funds is determined in good faith by or under the direction
of the Board. The Board has delegated certain valuation functions for the Funds to ALPS Fund Services, Inc. (“ALPS” or the “Administrator”).
Each Fund generally values its investments based on market prices determined at the close of regular trading on the New York Stock Exchange (“NYSE”) (normally, 4:00 p.m. Eastern time) on each business day (Monday through Friday). None of the Funds values their securities on any day that the NYSE is closed, including the following observed holidays: New Year’s Day, Martin Luther King, Jr. Day, Presidents’ Day, Good Friday, Memorial Day, Independence Day, Labor Day, Thanksgiving Day and Christmas Day, and the preceding Friday or subsequent Monday when one of those holidays falls on a Saturday or Sunday, respectively.
The Funds’ currency valuations, if any, are done as of the close of regularly scheduled trading on the NYSE (normally at 4:00 p.m. Eastern time). For equity securities that are traded on an exchange, the market price is usually the closing sale or official closing price on that exchange. In the case of securities not traded on an exchange, or if such closing prices are not otherwise available, the market price is typically determined by independent third-party pricing vendors approved by the Board using a variety of pricing techniques and methodologies. The market price for debt obligations is generally the price supplied by an independent third-party pricing service approved by the Board, which may use a matrix, formula or other objective method that takes into consideration market indices, yield curves and other specific adjustments. Short-term debt obligations that will mature in 60 days or less are valued at amortized cost, unless it is determined that using this method would not reflect an investment’s fair value. If vendors are unable to supply a price, or if the price supplied is deemed to be unreliable, the market price may be determined using quotations received from one or more brokers/dealers that make a market in the security. Investments in other mutual funds are calculated at their respective net asset values as determined by those funds in accordance with the 1940 Act.
When such prices or quotations are not available, or when the Fair Value Committee appointed by the Board believes that they are unreliable, securities may be priced using fair value procedures approved by the Board. Because the Funds may invest in securities that may be thinly traded or for which market quotations may not be readily available or may be unreliable (such as securities of small capitalization companies), the Funds may use fair valuation procedures more frequently than funds that invest primarily in securities that are more liquid (such as equity securities of large capitalization domestic issuers). The Funds may also use fair value procedures if the Fair Value Committee determines that a significant event has occurred between the time at which a market price is determined and the time at which each Fund’s net asset value is calculated. In particular, the value of non-U.S. securities may be materially affected by events occurring after the close of the market on which they are traded, but before the Fund prices its shares.
The Funds may determine the fair value of investments based on information provided by pricing services and other third-
| | | | | | |
| Notes to Financial Statements | | |
| | | | | April 30, 2010 |
party vendors, which may recommend fair value prices or adjustments with reference to other securities, indices or assets. In considering whether fair value pricing is required and in determining fair values, the Funds may, among other things, consider significant events (which may be considered to include changes in the value of U.S. securities or securities indices) that occur after the close of the relevant market and before each Fund values its securities. In addition, the Funds may utilize modeling tools provided by third-party vendors to determine fair values of non-U.S. securities. The Funds’ use of fair value pricing may help deter “stale price arbitrage.”
Valuing securities at fair value involves greater reliance on judgment than valuation of securities based on readily available market quotations. A fund that uses fair value to price securities may value those securities higher or lower than another fund using market quotations or its own fair value methodologies to price the same securities. There can be no assurance that the Fund could obtain the fair value assigned to a security if it were to sell the security at approximately the time at which the Fund determines its net asset value, and the difference between fair value and the price of the securities may be material.
Fair Value Measurements: A three-tier hierarchy has been established to classify fair value measurements for disclosure purposes. Inputs refer broadly to the assumptions that market
participants would use in pricing the asset or liability, including assumptions about risk. Inputs may be observable or unobservable. Observable inputs are inputs that reflect the assumptions market participants would use in pricing the asset or liability that are developed based on market data obtained from sources independent of the reporting entity. Unobservable inputs are inputs that reflect the reporting entity’s own assumptions about the assumptions market participants would use in pricing the asset or liability that are developed based on the best information available.
Various inputs are used in determining the value of the Funds’ investments, including written options and securities sold short, as of the reporting period end. The designated input levels are not necessarily an indication of the risk or liquidity associated with these investments. These inputs are categorized in the following hierarchy under applicable financial accounting standards:
| | » | Level 1 – Unadjusted quoted prices in active markets for identical investments |
| | » | Level 2 – Other significant observable inputs (including quoted prices for similar investments, interest rates, prepayment speeds, credit risk, etc.) |
| | » | Level 3 – Significant unobservable inputs (including the Fund’s own assumptions in determining the fair value of investments) |
The following is a summary of the inputs used to value each Fund’s investments as of April 30, 2010:
| | | | | | | | | | | | |
| Investments in Securities at Value | | Level 1 - Quoted Prices | | Level 2 - Other Significant
Observable Inputs | | Level 3 - Significant
Unobservable Inputs | | Total |
| |
Activa Value Fund: | | | | | | | | | | | | |
Common Stocks (a) | | $ | 61,770,293 | | | – | | | – | | $ | 61,770,293 |
Short-Term Investments | | | 377,135 | | | – | | | – | | | 377,135 |
| |
TOTAL | | $ | 62,147,428 | | $ | – | | $ | – | | $ | 62,147,428 |
| |
ALPS | GNI Long-Short Fund: | | | | | | | | | | | | |
Common Stocks (a) | | $ | 6,557,295 | | | – | | | – | | $ | 6,557,295 |
Exchange Traded Funds | | | 461,520 | | | – | | | – | | | 461,520 |
Purchased Put Options | | | 558,875 | | | – | | | – | | | 558,875 |
Short-Term Investments | | | 3,367,831 | | | – | | | – | | | 3,367,831 |
| |
TOTAL | | $ | 10,945,521 | | $ | – | | $ | – | | $ | 10,945,521 |
| |
Other Financial Instruments | | | | | | | | | | | | |
Liabilities | | | | | | | | | | | | |
Put Options Written | | $ | (109,220) | | | – | | | – | | $ | (109,220) |
Securities Sold Short | | | (1,461,517) | | | – | | | – | | | (1,461,517) |
| |
TOTAL | | $ | (1,570,737) | | $ | – | | $ | – | | $ | (1,570,737) |
| |
ALPS | Red Rocks Listed Private Equity Fund: | | | | | | |
Common Stocks (a) | | $ | 110,579,779 | | | – | | | – | | $ | 110,579,779 |
Short-Term Investments | | | 1,429,972 | | | – | | | – | | | 1,429,972 |
| |
TOTAL | | $ | 112,009,751 | | $ | – | | $ | – | | $ | 112,009,751 |
| |
Clough China Fund: | | | | | | | | | | | | |
Common Stocks - Consumer Staples | | $ | 570,115 | | | – | | | – | | $ | 570,115 |
Common Stocks -Utilities | | | 112,770 | | | – | | | – | | | 112,770 |
Other Common Stocks (a) | | | – | | | 44,031,157 | | | – | | | 44,031,157 |
Short-Term Investments | | | 5,392,735 | | | – | | | – | | | 5,392,735 |
| |
TOTAL | | $ | 6,075,620 | | $ | 44,031,157 | | $ | – | | $ | 50,106,777 |
| |
| | (a) | For detailed descriptions of sector and industry, see the accompanying Statement of Investments. |
45 | April 30, 2010
| | | | | | |
| Notes to Financial Statements | | |
| | | | | April 30, 2010 |
For the periods ended April 30, 2010, the Funds did not have any significant transfers between Level 1 and Level 2 securities. For the periods ended April 30, 2010, the Funds did not have any securities which used significant unobservable inputs (Level 3) in determining fair value. Therefore, a reconciliation of assets in which significant unobservable inputs (Level 3) were used in determining fair value is not applicable.
Investment Transactions: Investment transactions are accounted for on the date the investments are purchased or sold (trade date). Realized gains and losses from investment transactions are reported on an identified cost basis, which is the same basis the Funds use for federal income tax purposes. Interest income, which includes accretion of discounts, is accrued and recorded as earned. Dividend income is recorded on the ex-dividend date.
Dividend income from investments in real estate investment trusts (“REITs”) is recorded at management’s estimate of income included in distributions received. Distributions received in excess of this amount are recorded as a reduction of the cost of investments. The actual amount of income and return of capital are determined by each REIT only after its fiscal year-end and may differ from the estimated amounts. Such differences, if any, are recorded in the Fund in the following year.
Options: The Funds may purchase or write (sell) put and call options. One of the risks associated with purchasing an option, among others, is that the Fund pays a premium whether or not the option is exercised. Additionally, the Fund bears the risk of loss of premium and change in market value should the counterparty not perform under the contract. Put and call options purchased are accounted for in the same manner as portfolio securities. The cost of securities acquired through the exercise of call options is increased by premiums paid. The proceeds from securities sold through the exercise of put options are decreased by the premiums paid.
When a Fund writes an option, an amount equal to the premium received by the Fund is recorded as a liability and is subsequently adjusted to the current value of the option written. Premiums received from writing options that expire unexercised are treated by the Fund on the expiration date as realized gains from investments. The difference between the premium and the amount paid effecting a closing purchase transaction, including brokerage commissions, is also treated as a realized gain, or, if the premium is less than the amount paid for the closing purchase transaction, as a realized loss. If a call option is exercised, the premium is added to the proceeds from the sale of the underlying security or currency in determining whether the Fund has realized a gain or loss. If a put option is exercised, the premium reduces the cost basis of the securities purchased by the Fund. The Fund, as writer of an option, bears the market risk of an unfavorable change in the price of the security underlying
the written option. Written and purchased options are non-income producing securities.
Written option activity for the period ended April 30, 2010 was as follows:
ALPS | GNI Long-Short Fund:
| | | | | |
| Written Call Options | | Contracts | | | Premiums |
Outstanding, November 2, 2009 | | – | | $ | – |
Positions opened | | 695 | | | 139,673 |
Exercised | | – | | | – |
Expired | | – | | | – |
Closed | | (695) | | | (139,673) |
| |
Outstanding, April 30, 2010 | | – | | $ | – |
| |
Market Value, April 30, 2010 | | – | | $ | – |
| |
| | | | | |
| Written Put Options | | Contracts | | | Premiums |
Outstanding, November 2, 2009 | | – | | $ | – |
Positions opened | | 5,045 | | | 579,355 |
Exercised | | – | | | – |
Expired | | – | | | – |
Closed | | (4,130) | | | (512,845) |
| |
Outstanding, April 30, 2010 | | 915 | | $ | 66,510 |
| |
Market Value, April 30, 2010 | | | | $ | 109,220 |
| |
Short Sales: Each Fund may sell a security it does not own in anticipation of a decline in the fair value of that security. When the Fund sells a security short, it must borrow the security sold short and deliver it to the broker-dealer through which it made the short sale. A gain, limited to the price at which the Fund sold the security short, or a loss, unlimited in size, will be recognized upon the termination of the short sale.
Derivatives Instruments and Hedging Activities: The following tables disclose the amounts related to each Fund’s use of derivative instruments and hedging activities. The Funds may write or purchase option contracts to adjust risk and return of their overall investment positions. The average long option contracts volume and the average long option contracts notional volume during the period ended April 30, 2010 was 1,850 and $11,526,721, respectively. The average short option contracts volume and the average short option contracts notional volume during the period ended April 30, 2010 was 738 and $4,877,899, respectively.
| | | | | | |
| Notes to Financial Statements | | |
| | | | | April 30, 2010 |
The effect of derivatives instruments on the Balance Sheet as April 30, 2010 is as follows:
ALPS | GNI long-Short Fund:
| | | | | | | | | | | | |
| | | Asset Derivatives | | Liability Derivatives | | |
| | | | |
| | | | | |
Derivatives not accounted for as hedging instruments | | Balance Sheet
location | | Fair Value | | Balance Sheet
location | | Fair Value | | |
| | | | | |
Equity Contracts | | Investments, at value | | $ | 558,875 | | Options written at value | | $ | 109,220 | | |
| | | |
Total | | | | $ | 558,875 | | | | $ | 109,220 | | |
| | | |
The effect of derivatives instruments on the Statement of Operations for the period ended April 30, 2010 is as follows:
ALPS | GNI long-Short Fund:
| | | | | | | | |
Derivatives not accounted for as hedging instruments | | Location of Gain/(loss) On Derivatives Recognized in Income | | Realized Gain/ (Loss) On Derivatives Recognized in Income | | Change in Unrealized Gain/(loss) On Derivatives Recognized in Income |
| |
| | | |
Equity Contracts | | Net realized gain (loss) on Investment securities and Written options/Net change in unrealized appreciation (depreciation) on investments, options, securities sold short and translation of assets and liabilities denominated in foreign currencies | | $ | (719,766) | | $ | 28,996 |
| |
Total | | | | $ | (719,766) | | $ | 28,996 |
| |
Securities Lending: The predecessor Activa Fund loaned portfolio securities from time to time in order to earn additional income. The income recorded as a result of securities lending transactions is included in “Securities lending income” in the Statement of Operations. The predecessor Activa Fund received collateral in the form of U.S. Treasury obligations, letters of credit and/or cash against the loaned securities and maintained collateral in an amount not less than 100% of the market value of the loaned securities during the period of the loan. The market value of the loaned securities was determined at the close of business of the predecessor Activa Fund and any additional required collateral was delivered to the predecessor Activa Fund on the next business day. If the borrower defaulted on its obligation to return the securities loaned because of insolvency or other reasons, the predecessor Activa Fund could experience delays and costs in recovering the securities loaned or in gaining access to the collateral. As of April 30, 2010 none of the funds were engaged in securities lending.
Foreign Securities: The Funds may directly purchase securities of foreign issuers. Investing in securities of foreign issuers involves special risks not typically associated with investing in securities of U.S. issuers. The risks include possible reevaluation of currencies, the inability to repatriate currencies, less complete financial information about companies and possible future adverse political and economic developments. Moreover, securities of many foreign issuers and their markets may be less liquid and their prices more volatile than those of securities of comparable U.S. issuers.
Foreign Currency Translation: The books and records of the Funds are maintained in U.S. dollars. Investment valuations and other assets and liabilities initially expressed in foreign currencies are converted each business day into U.S. dollars based upon current exchange rates. Prevailing foreign exchange rates may generally be obtained at the close of the NYSE (normally 4:00 p.m. Eastern time). The portion of realized and unrealized gains or losses on investments due to fluctuations in foreign currency exchange rates is not separately disclosed and is included in realized and unrealized gains or losses on investments, when applicable.
Forward Foreign Currency Transactions: The Funds may engage in currency transactions with counterparties to hedge the value of portfolio securities denominated, in particular currencies against fluctuations in relative value, to gain or reduce exposure to certain currencies or to generate income or gains. All commitments are marked to market daily at the applicable exchange rates and any resulting unrealized gains or losses are recorded in the Fund’s financial statements. The Fund records realized gains or losses at the time a forward contract is offset by entry into a closing transaction or extinguished by delivery of the currency. The Funds did not have forward foreign currency contracts at April 30, 2010.
Expenses: Some expenses of the Trust can be directly attributed to the Fund or the Fund-specific share class. Expenses which cannot be directly attributed are apportioned among all Funds in the Trust based on average net assets.
| | | | | | |
| Notes to Financial Statements | | |
| | | | | �� April 30, 2010 |
Use of Estimates: The Funds’ financial statements are prepared in accordance with accounting principles generally accepted in the United States of America. This requires management to make estimates and assumptions that affect (a) the reported amounts of assets and liabilities and disclosure of contingent assets and liabilities at the date of the financial statements, and (b) the reported amounts of increases and decreases in net assets from operations during the reporting period. Actual results could differ from these estimates.
Payment by Affiliate: During the year ended July 31, 2009, the predecessor China Fund was reimbursed $1,000 by Clas Finlay LLC (the predecessor China Fund’s former sub-adviser) for a trading error.
Income Taxes: The Funds comply with the requirements under Subchapter M of the Internal Revenue Code applicable to regulated investment companies and intend to distribute substantially all of their net taxable income and net capital gains, if any, each year. The Funds are not subject to income taxes to the extent such distributions are made.
During the fiscal year or period ended April 30, 2010, none of the Funds have a liability for any unrecognized tax benefits in the accompanying financial statements. The Funds file income tax returns in the U.S. federal jurisdiction and the State of Colorado.
For the years ended December 31, 2006 through April 30, 2010 for the U.S. federal jurisdiction, for the years ended December 31, 2005 through December 31, 2008 for Michigan, and for the year ended April 30, 2010 for Colorado, the predecessor Activa Fund’s and the current Activa Value Fund’s returns are still open to examination by the appropriate taxing authority.
Distributions to Shareholders: The Funds normally pay dividends and distribute capital gains, if any, on an annual basis. Income dividend distributions are derived from interest and other income each Fund receives from its investments, including distributions of short-term capital gains. Capital gain distributions are derived from gains realized when a Fund sells a security it has owned for more than a year. Each Fund may make additional distributions and dividends at other times if the respective portfolio manager believes doing so may be necessary for the Fund to avoid or reduce taxes. Net investment income (loss) and net realized gain (loss) may differ for financial statement and tax purposes. The character of distributions made during the year from net investment income or net realized gains may differ from its ultimate characterization for federal income tax purposes. Also, due to the timing of dividend distributions, the fiscal year in which amounts are distributed may differ from the fiscal year in which the income or realized gain were recorded by the Fund.
The tax character of the distributions paid by the Funds for the fiscal year or period ended April 30, 2010 is as follows:
| | | | | | | | | | | | | | | |
| Fund | | Distributions
paid from
Ordinary Income | | Distributions
paid from
Long-Term
Capital Gain | | Distributions
paid from
Return of Capital | | Total | | Foreign
Taxes Passed
Through |
| |
Activa Value Fund | | $ | – | | $ | – | | $ | – | | $ | – | | $ | – |
ALPS | GNI Long-Short Fund | | | – | | | – | | | – | | | – | | | – |
ALPS | Red Rocks Listed Private Equity Fund | | | 7,822,938 | | | – | | | – | | | 7,822,938 | | | – |
Clough China Fund | | | 203,634 | | | – | | | 38,218 | | | 241,852 | | | 24,381 |
| |
|
Components of Earnings: At April 30, 2010, permanent differences in book and tax accounting were reclassified. These differences had no effect on net assets and were primarily attributed to differences in book and tax distributions and certain other investments. The reclassifications were as follows: |
| | | | | | | | | | |
| Fund | | Increase/(Decrease) Paid In-Capital | | | Increase/(Decrease) Accumulated Net Investment Income | | Increase/(Decrease) Accumulated Net Realized Gain |
| |
Activa Value Fund | | $ | – | | | $ | – | | $ | – |
ALPS | GNI Long-Short Fund | | | (86,106 | ) | | | 89,106 | | | (3,000) |
ALPS | Red Rocks Listed Private Equity Fund | | | (3,466 | ) | | | 1,374,277 | | | (1,370,811) |
Clough China Fund | | | (343,028 | ) | | | 235,106 | | | 107,922 |
| |
48 | April 30, 2010
| | | | | | |
| Notes to Financial Statements | | |
| | | | | | | April 30, 2010 |
Post October Losses: Under current tax law, capital and currency losses realized after October 31 may be deferred and treated as occurring on the first day of the following fiscal year. These losses, if applicable, will be deferred for tax purposes and recognized during the fiscal year ending April 30, 2011.
As of April 30, 2010, the components of distributable earnings on a tax basis were as follows:
| | | | | | | | | | | | | | | | | |
| Fund | | Undistributed
ordinary
income | | Accumulated
net realized
gain/(loss) | | | Post-October
Deferrals | | | Other Book
to Tax
Differences | | Unrealized
Appreciation |
Activa Value Fund | | $ | 245,095 | | $ | (13,149,149 | ) | | $ | (1,750,905 | ) | | $ | – | | $ | 8,696,992 |
ALPS | GNI Long-Short Fund | | | — | | | _ | | | | (2,131,456 | ) | | | – | | | 45,577 |
ALPS | Red Rocks Listed Private Equity Fund | | | 2,902,442 | | | (14,656,783 | ) | | | (71,291 | ) | | | – | | | 1,196,249 |
Clough China Fund | | | — | | | (4,567,049 | ) | | | (3,421 | ) | | | – | | | 9,112,060 |
Capital Loss Carry Forwards: Accumulated capital losses noted below represent net capital loss carryovers as of April 30, 2010 that may be available to offset future realized capital gains and thereby reduce future taxable gains distributions. The following table shows the expiration dates of the carryovers.
| | | | | | | | | | | | | | | |
| Fund | | April 30, 2016 | | April 30,
2017 | | April 30, 2018 | | | Accumulated
Capital Losses | | |
Activa Value Fund | | $ | 10,368,867 | | $ | 2,780,282 | | $ | – | | | $ | 13,149,149 | | |
ALPS | GNI Long-Short Fund | | | – | | | – | | | – | | | | – | | |
ALPS | Red Rocks Listed Private Equity Fund | | | – | | | 338,681 | | | (14,318,102 | ) | | | 14,656,783 | | |
Clough China Fund | | | 4,567,049 | | | – | | | – | | | | 4,567,049 | | |
As of April 30, 2010, net unrealized appreciation/(depreciation) of investments based on federal tax cost was as follows:
| | | | | | | | | | | | | | | | | |
| Fund | | Gross
appreciation
on investments
(excess of value
over tax cost) | | Gross
depreciation
on investments
(excess of tax
cost over value) | | | Net
depreciation
of foreign
currency and
derivatives | | | Net unrealized
appreciation | | Total cost for
federal income
tax purposes |
Activa Value Fund | | $ | 11,737,209 | | $ | (3,040,217 | ) | | $ | – | | | $ | 8,696,992 | | $ | 53,450,436 |
ALPS | GNI Long-Short Fund | | | 283,867 | | | (229,897 | ) | | | (8,393 | ) | | | 45,577 | | | 10,891,551 |
ALPS | Red Rocks Listed | | | | | | | | | | | | | | | | | |
Private Equity Fund | | | 6,255,047 | | | (5,057,461 | ) | | | (1,337 | ) | | | 1,196,249 | | | 110,812,165 |
Clough China Fund | | | 10,114,217 | | | (1,002,118 | ) | | | (39 | ) | | | 9,112,060 | | | 40,994,678 |
2. SECURITIES TRANSACTIONS
Purchases and sales of securities, excluding short term securities during the fiscal year or period ended April 30, 2010 were as follows:
| | | | | | |
| Fund | | Purchases of
Securities | | Proceeds
from Sales of
Securities |
Activa Value Fund | | $ | 8,111,109 | | $ | 29,801,845 |
ALPS | GNI Long-Short Fund | | | 22,027,208 | | | 14,192,384 |
ALPS | Red Rocks Listed Private Equity Fund | | | 79,220,769 | | | 40,475,104 |
Clough China Fund | | | 47,538,008 | | | 50,258,789 |
49 | April 30, 2010
| | | | | | |
| Notes to Financial Statements | | |
| | | | | April 30, 2010 |
3. CAPITAL SHARE TRANSACTIONS
Shares redeemed within 90 days of purchase may incur a 2% short-term redemption fee deducted from the redemption amount, with the exception of Activa Value Fund shares. ALPS | GNI Long-Short Fund, ALPS | Red Rocks Listed Private Equity Fund and Clough China Fund retained $0, $16,722, and $9,065, respectively, for the fiscal year or period ended April 30, 2010, which is reflected in “Shares redeemed” in the Statement of Changes in Net Assets. Transactions in shares of capital stock for the last two full fiscal years were as follows:
| | | | | | |
| | | Activa Value Fund(a) |
| | | For the Period
January 1, 2010
through
April 30, 2010 | | For the Year Ended
December 31, 2009 | | For the Year Ended
December 31, 2008 |
Class A | | | | | | |
Shares sold | | 236,002 | | 433,024 | | 310,678 |
Dividends reinvested | | – | | 84,159 | | 123,473 |
Shares redeemed | | (3,133,694) | | (715,207) | | (723,115) |
| |
Net increase/(decrease) in shares outstanding | | (2,897,692) | | (198,024) | | (288,964) |
| |
Class C | | | | | | |
Shares sold | | N/A | | N/A | | N/A |
Dividends reinvested | | N/A | | N/A | | N/A |
Shares redeemed | | N/A | | N/A | | N/A |
| |
Net increase/(decrease) in shares outstanding | | N/A | | N/A | | N/A |
| |
Class I (c)(d) | | | | | | |
Shares sold | | 217,071 | | 2,184,008 | | 116,500 |
Dividends reinvested | | – | | 28,213 | | 9,963 |
Shares redeemed | | (334,099) | | (468,350) | | (81,393) |
| |
Net increase/(decrease) in shares outstanding | | (117,028) | | 1,743,871 | | 45,070 |
| |
Class R | | | | | | |
Shares sold | | N/A | | N/A | | N/A |
Dividends reinvested | | N/A | | N/A | | N/A |
Shares redeemed | | N/A | | N/A | | N/A |
| |
Net increase/(decrease) in shares outstanding | | N/A | | N/A | | N/A |
| |
Class Z (e) | | | | | | |
Shares sold | | N/A | | N/A | | N/A |
Dividends reinvested | | N/A | | N/A | | N/A |
Shares redeemed | | N/A | | N/A | | N/A |
| |
Net increase/(decrease) in shares outstanding | | N/A | | N/A | | N/A |
| |
| | (a) | Effective March 9, 2010, the Board approved changing the fiscal year-end of the Fund from December 31 to April 30. |
| | (b) | Effective March 9, 2010, the Board approved changing the fiscal year-end of the Fund from July 31 to April 30. |
| | (c) | Prior to close of business August 28, 2009, Class I of the Activa Fund was known as Class R. |
| | (d) | Prior to the close of business on January 15, 2010, Class I of the Clough China Fund was known as Institutional Class. |
| | (e) | As a result of the reorganization (Note 1), the Clough China Fund no longer offers Class Z shares. Effective as of the close of business January 15, 2010, holders of Class Z shares of the predecessor China Fund received Class A shares of the Fund. |
50 | April 30, 2010
| | | | | | |
| Notes to Financial Statements | | |
| | | | | | | April 30, 2010 |
| | | | | | | | | | |
ALPS | GNI Long–Short Fund | | ALPS | Red Rocks Listed Private Equity Fund | | Clough China Fund(b) |
For the Period
November 2, 2009
(Inception) through
April 30, 2010 | | For the Year Ended April 30, 2010 | | For the Year Ended April 30, 2009 | | For the Period August 1, 2009 through April 30, 2010 | | For the Year Ended July 31, 2009 (000) | | For the Year Ended July 31, 2008 (000) |
| | | | | |
| 7,546 | | 6,906,283 | | 9,511,389 | | 1,255,330 | | 458 | | 584 |
| – | | 1,155,886 | | 79,707 | | 2,123 | | 10 | | 194 |
| – | | (2,893,408) | | (1,861,807) | | (604,582) | | (679) | | (801) |
| |
| 7,546 | | 5,168,761 | | 7,729,289 | | 652,871 | | (211) | | (23) |
| |
| | | | | |
| N/A | | N/A | | N/A | | 118,832 | | 144 | | 296 |
| N/A | | N/A | | N/A | | – | | 1 | | 80 |
| N/A | | N/A | | N/A | | (208,520) | | (276) | | (426) |
| |
| N/A | | N/A | | N/A | | (89,688) | | (131) | | (50) |
| |
| | | | | |
| 1,243,775 | | 6,896,703 | | 5,208,527 | | 224,363 | | 1 | | 1 |
| – | | 384,322 | | 30,427 | | 4,881 | | 16 | | 215 |
| (105,349) | | (2,206,417) | | (1,619,737) | | (216) | | (1) | | (627) |
| |
| 1,138,426 | | 5,074,608 | | 3,619,217 | | 229,028 | | 16 | | (411) |
| |
| | | | | |
| N/A | | 4,030 | | 4 | | – | | N/A | | N/A |
| N/A | | 508 | | 8 | | – | | N/A | | N/A |
| N/A | | (735) | | (4) | | – | | N/A | | N/A |
| |
| N/A | | 3,803 | | 8 | | – | | N/A | | N/A |
| |
| | | | | |
| N/A | | N/A | | N/A | | 828,700 | | 507 | | 366 |
| N/A | | N/A | | N/A | | 5,297 | | 6 | | 66 |
| N/A | | N/A | | N/A | | (1,543,589) | | (137) | | (248) |
| |
| N/A | | N/A | | N/A | | (709,592) | | 376 | | 184 |
| |
51 | April 30, 2010
| | | | | | |
| Notes to Financial Statements | | |
| | | | | April 30, 2010 |
4. MANAGEMENT AND RELATED-PARTY TRANSACTIONS
ALPS Advisors, Inc. (“AAI” or “Adviser”), subject to the authority of the Board, is responsible for the overall management and administration of each Fund’s business affairs. AAI has delegated daily management of the funds listed below to the corresponding sub-adviser listed in the table below. Each sub-adviser manages the investments of the Fund in accordance with its investment objective, policies and limitations and investment guidelines established jointly by the Adviser and the Board.
| | |
| Fund | | Sub-Adviser |
Activa Value Fund | | Wellington Management Company, LLP |
ALPS | GNI Long-Short Fund | | GNI Capital, Inc. |
ALPS | Red Rocks Listed Private Equity Fund | | Red Rocks Capital LLC |
Clough China Fund | | Clough Capital Partners, LP |
Pursuant to an Investment Advisory Agreement (the “Advisory Agreement”), each Fund pays AAI an annual management fee which is based on each Fund’s average daily net assets. The following table reflects the Funds’ contractual management fee rates (expressed as an annual rate).
| | |
| Fund | | Contractual
Management Fee |
Activa Value Fund | | 0.95% |
ALPS | GNI Long-Short Fund | | 1.30% |
ALPS | Red Rocks Listed Private Equity Fund | | 0.85% |
Clough China Fund | | 1.35% |
Pursuant to an Investment Sub-advisory Agreement, AAI pays each sub-adviser an annual sub-advisory management fee which is based on each Fund’s average daily assets. AAI is required to pay all fees due to each sub-adviser out of the management fee AAI receives from each Fund. The following table reflects the Funds’ contractual sub-advisory fee rates.
| | | | |
| Fund | | Average Daily Net Assets of the Fund | | Contractual
Sub-Advisory
Fee |
Activa | | First $250 Million | | 0.50% |
Value Fund | | $250 Million - $500 Million | | 0.40% |
| | Over $500 Million | | 0.30% |
ALPS | GNI | | First $10 Million | | 0.85% |
Long-Short Fund | | Over $10 Million | | 0.65% |
ALPS | Red Rocks | | All Asset Levels | | 0.57% |
Listed Private | | | | |
Equity Fund | | | | |
Clough | | All Asset Levels | | 0.90% |
China Fund | | | | |
AAI with each Fund and with Red Rocks Capital LLC for ALPS | Red Rocks Listed Private Equity Fund, have contractually agreed to limit the amount of each Fund’s total annual expenses
(exclusive of distribution and service (12b-1) fees (except Clough China Fund A, C, and I shares), acquired fund fees and expenses, brokerage expenses, interest expense, short sale dividend expense, taxes and extraordinary expenses) that exceed the following annual rates below. These agreements are reevaluated on an annual basis. Without these agreements, expenses could be higher.
| | | | |
| Fund | | Expense limit % | | Term of Expense Limit Agreement |
Activa Value Fund | | 1.15% | | 03/09/2010 - 08/31/2011 |
ALPS | GNI Long-Short Fund | | 2.00% | | 03/09/2010 -08/31/2011 |
ALPS | Red Rocks Listed Private Equity Fund | | 1.25% | | 03/09/2010 -08/31/2011 |
Clough China Fund - Class A Shares | | 1.85% | | 01/19/10 - 12/31/2010 |
Clough China Fund - Class C Shares | | 2.70% | | 01/19/10 - 12/31/2010 |
Clough China Fund - Class I Shares | | 1.40% | | 01/19/10 - 12/31/2010 |
Clough China Fund - Class A Shares | | 3.00% | | 01/01/11 - 12/31/2018 |
Clough China Fund - Class C Shares | | 3.75% | | 01/01/11 - 12/31/2018 |
Clough China Fund - Class I Shares | | 2.75% | | 01/01/11 - 12/31/2018 |
In addition, each Fund’s organizational expenses have been borne by AAI. The Adviser, and Red Rocks Capital LLC for ALPS | Red Rocks Listed Private Equity Fund, will be permitted to recover, on a class-by-class basis, expenses it has borne through the agreements described above to the extent that each Fund’s expenses in later periods fall below the annual rates set forth in the relevant agreement. The Funds will not be obligated to pay any such deferred fees and expenses more than one year after the end of the fiscal year in which the fee and expense was deferred.
ALPS Distributors, Inc. (an affiliate of ALPS and AAI) (“ADI” or the “Distributor”) acts as the distributor of the Funds’ shares pursuant to a Distribution Agreement with the Trust. Shares are sold on a continuous basis by ADI as agent for the Fund, and ADI has agreed to use its best efforts to solicit orders for the sale of Fund shares, although it is not obliged to sell any particular amount of shares. ADI is not entitled to any compensation for its services as Distributor. ADI is registered as a broker-dealer with the Securities and Exchange Commission.
Each Fund has adopted a Distribution and Services Plan (the “Plan”) pursuant to Rule 12b-1 under the 1940 Act for the Class A shares. The Plan allows the Fund to use its Class A and Class C assets, respectively, to pay fees in connection with the distribution, marketing and/or the provision of shareholder services to Class A and Class C shareholders, respectively. The Plan permits payment for services in connection with the administration of plans or
| | | | | | |
| Notes to Financial Statements | | |
| | | | | | | April 30, 2010 |
programs that use Class A and Class C shares, respectively, of each Fund as their funding medium and for related expenses. The Plan permits each Fund to make total payments at an annual rate of up to 0.25% for A Shares and 0.75% for C Shares of the Fund’s average daily net assets attributable to its Class A shares and Class C Shares, respectively. Because these fees are paid out of a Fund’s share class assets on an ongoing basis, over time they will increase the cost of an investment in Class A shares and Class C Shares, and Plan fees may cost an investor more than other types of sales charges. Clough China Fund currently only fund in the Trust offering Class C Shares.
The ALPS | Red Rocks Listed Private Equity Fund Class A shares and the Clough China Fund Class C shares have adopted a shareholder services plan (a “Shareholder Services Plan”). Under the Shareholder Services Plan for each Fund, the Funds are authorized to pay banks and their affiliates and other institutions, including broker-dealers and Fund affiliates (“Participating Organizations”), an aggregate fee in an amount not to exceed on an annual basis 0.15% for ALPS|Red Rocks Listed Private Equity Fund Class A shares and 0.25% for Clough China Fund Class C shares of the average daily net asset value of the Class A shares and Class C shares, respectively, attributable to or held in the name of a Participating Organization for its clients as compensation for providing shareholder service activities, which do not include distribution services, pursuant to an agreement with a Participating Organization.
ALPS (an affiliate of ADI and AAI) serves as administrator to the Funds and the Funds have agreed to pay expenses incurred in connection with their administrative activities. Pursuant to an Administrative Agreement, ALPS will provide operational services to the Funds including, but not limited to fund accounting and fund administration and generally assist in each Fund’s operations. The Annual Administrative Fee is based on each Fund’s average daily net assets and will be billed monthly, in the amounts shown to the right.
| | | | |
| Fund | | Average Daily Net
Assets of the Fund | | Annual
Administrative
Fee |
Activa Value Fund | | All Asset Levels | | 0.15% |
ALPS | GNI | | | | |
Long-Short Fund | | First $500 Million | | 0.08% |
| | $500 Million - $1 Billion | | 0.06% |
| | Over $1 Billion | | 0.04% |
ALPS | Red Rocks |
Listed Private |
Equity Fund | | First $500 Million | | 0.08% |
| | $500 Million - $1 Billion | | 0.06% |
| | Over $1 Billion | | 0.04% |
Clough | | | | |
China Fund | | All Asset Levels | | 0.15% |
|
Beneficial Ownership: The beneficial ownership, either directly or indirectly, of more than 25% of the voting securities of any class of a fund creates a presumption of control of each Fund, under Section 2(a)(9) of the 1940 Act. Beneficial owners owning more than 25% of the voting securities of each class of each fund, as of April 30, 2010, are listed below: |
| | | | |
| Fund | | Shareholder Name | | Percentage Interest |
Activa Value Fund - Class I Shares | | Fidelity Investments | | 100.00% |
ALPS|GNI Long-Short Fund - Class A Shares | | ALPS Fund Services, Inc. | | 66.26% |
ALPS|GNI Long-Short Fund - Class A Shares | | Charles Schwab & Co. Inc. | | 33.74% |
ALPS|GNI Long-Short Fund - Class I Shares | | Charles Schwab & Co. Inc. | | 53.27% |
ALPS|GNI Long-Short Fund - Class I Shares | | NFS LLC | | 46.29% |
ALPS|Red Rocks Listed Private Equity Fund - Class A Shares | | NFS LLC | | 81.17% |
ALPS|Red Rocks Listed Private Equity Fund - Class I Shares | | Charles Schwab & Co. Inc | | 52.74% |
ALPS|Red Rocks Listed Private Equity Fund - Class I Shares | | NFS LLC | | 46.32% |
ALPS|Red Rocks Listed Private Equity Fund - Class R Shares | | NFS LLC | | 96.89% |
Clough China Fund - Class C Shares | | Merrill Lynch | | 39.10% |
Clough China Fund - Class I Shares | | John Clay | | 50.27% |
Clough China Fund - Class I Shares | | Merrill Lynch | | 27.35% |
|
5. INDEMNIFICATIONS Under the Trust’s organizational documents, its officers and Trustees are indemnified against certain liability arising out of the performance of their duties to the Trust. Additionally, in the normal course of business, the Trust enters into contracts with service providers that contain general indemnification clauses. The Trust’s maximum exposure under these arrangements is unknown, as this would involve future claims that may be made against the Trust that have not yet occurred. |
6. SUBSEQUENT EVENTS Management has evaluated whether any events or transactions occurred subsequent to April 30, 2010 through the date of issuance of the Funds’ financial statements and determined that there were no other material events or transactions that would require recognition or disclosure in the Funds’ financial statements. |
53 | April 30, 2010
| | | | | | |
| Report of Independent Registered Public Accounting Firm |
| | | | | | | |
To the Shareholders and Board of Trustees of Financial Investors Trust:
We have audited the accompanying statements of assets and liabilities of Listed Private Equity Fund, Activa Value Fund, ALPS/GNI Long-Short Fund and Clough China Fund, four of the portfolios of Financial Investors Trust (the “Funds”), including the statement of investments, as of April 30, 2010; and the related statements of operations for the periods then ended; the statements of changes in net assets for the period from January 1, 2010 to April 30, 2010 and the year ended December 31, 2009, for the Activa Value Fund, for the period from November 2, 2009 (inception) to April 30, 2010 for the ALPS/GNI Long-Short Fund, for the period from August 1, 2009 to April 30, 2010 for the Clough China Fund, and for the years ended April 30, 2010 and 2009 for the Listed Private Equity Fund; and the financial highlights for the period from January 1, 2010 to April 30, 2010 and the year ended December 31, 2009, for the Activa Value Fund, for the period from November 2, 2009 (inception) to April 30, 2010 for the ALPS/GNI Long-Short Fund, for the period from August 1, 2009 to April 30, 2010 for the Clough China Fund, and for the years ended April 30, 2010 and 2009, and for the period ended April 30, 2008 for the Listed Private Equity Fund. These financial statements and financial highlights are the responsibility of the Funds’ management. Our responsibility is to express an opinion on these financial statements and financial highlights based on our audits. The statement of changes in net assets of the Activa Value Fund for the year ended December 31, 2008 and the financial highlights of the Activa Value Fund for each of the four years in the period ended December 31, 2008, were audited by other auditors whose report, dated February 17, 2009, expressed an unqualified opinion on the statement of changes in net assets and financial highlights. The statement of operations and the statement of changes in net assets of the Clough China Fund for the year ended July 31, 2009 and the financial highlights of the Clough China Fund for the period from December 30, 2005 (inception) to July 31, 2006 and for each of the three years in the period ended July 31, 2009, were audited by other auditors whose report, dated September 21, 2009, expressed an unqualified opinion on the statement of changes in net assets and financial highlights.
We conducted our audits in accordance with the standards of the Public Company Accounting Oversight Board (United States). Those standards require that we plan and perform the audit to obtain reasonable assurance about whether the financial statements and financial highlights are free of material misstatement. The Funds are not required to have, nor were we engaged to perform, an audit of its internal control over financial reporting. Our audits included consideration of internal control over financial reporting as a basis for designing audit procedures that are appropriate in the circumstances, but not for the purpose of expressing an opinion on the effectiveness of the Funds’ internal control over financial reporting. Accordingly, we express no such opinion. An audit also includes examining, on a test basis, evidence supporting the amounts and disclosures in the financial statements, assessing the accounting principles used and significant estimates made by management, as well as evaluating the overall financial statement presentation. Our procedures included confirmation of securities owned as of April 30, 2010, by correspondence with the custodian and brokers; where replies were not received from brokers, we performed other auditing procedures. We believe that our audits provide a reasonable basis for our opinion.
In our opinion, the financial statements and financial highlights referred to above present fairly, in all material respects, the financial position of Listed Private Equity Fund, Activa Value Fund, ALPS/GNI Long-Short Fund and Clough China Fund as of April 30, 2010, the results of its operations for the periods then ended, the changes in its net assets for the period from January 1, 2010 to April 30, 2010 and the year ended December 31, 2009 for the Activa Value Fund, for the period from November 2, 2009 (inception) to April 30, 2010 for the ALPS/ GNI Long-Short Fund, for the period from August 1, 2009 to April 30, 2010 for the Clough China Fund, and for the years ended April 30, 2010 and 2009 for the Listed Private Equity Fund; and the financial highlights for the period from January 1, 2010 to April 30, 2010 and the year ended December 31, 2009, for the Activa Value Fund, for the period from November 2, 2009 (inception) to April 30, 2010 for the ALPS/GNI Long-Short Fund, for the period from August 1, 2009 to April 30, 2010 for the Clough China Fund, and for the years ended April 30, 2010 and 2009, and for the period ended April 30, 2008 for the Listed Private Equity Fund, in conformity with accounting principles generally accepted in the United States of America.
/s/ DELOITTE & TOUCHE LLP
Denver, Colorado
June 23, 2010
54 | April 30, 2010
| | | | | | |
| Additional Information |
| | | | | | | April 30, 2010 (Unaudited) |
The Funds file their complete schedule of portfolio holdings with the Securities and Exchange Commission (the “SEC”) for the first and third quarters of each fiscal year on Form N-Q within 60 days after the end of the period. Copies of the Funds’ Form N-Q are available without charge on the SEC website at http://www.sec. gov. You may also review and copy the Form N-Q at the SEC’s Public Reference Room in Washington, D.C. For more information about the operation of the Public Reference Room, please call the SEC at 1-800-SEC-0330.
| | 2. | FUND PROXY VOTING POLICIES, PROCEDURES AND SUMMARIES |
Fund policies and procedures used in determining how to vote proxies and information regarding how each of the Funds voted proxies relating to portfolio securities during the most recent prior 12-month period ending June 30 will be available without charge, (1) upon request, by calling (866) 759-5679 and (2) on the SEC’s website at http://www.sec.gov.
The Funds designate the following for federal income tax purposes for the fiscal year ended April 30, 2010:
| | | | | | |
| | | Qualified
Dividend
Income | | | Dividend
Received
Deduction | |
Activa Value Fund | | 0.00 | % | | 0.00 | % |
ALPS | GNI Long-Short Fund | | 0.00 | % | | 0.00 | % |
ALPS | Red Rocks Listed Private Equity Fund | | 5.94 | % | | 0.00 | % |
Clough China Fund | | 20.58 | % | | 1.61 | % |
Pursuant to Section 853(c) of the internal Revenue Code, the Clough China Fund designates $24,381 as foreign taxes paid and $515,939 as foreign source income earned as of April 30, 2010.
| | 4. | DISCLOSURE REGARDING APPROVAL OF FUND ADVISORY AGREEMENTS |
Activa Value Fund
On June 9, 2009, the Trustees met in person to discuss, among other things, the approval of the Investment Advisory Agreement between the Trust and the Adviser (the “Advisory Agreement”) and the Investment Sub-Advisory Agreement among the Trust, the Adviser and Wellington Management Company, LLP (“Wellington”), the sub-adviser for the Activa Value Fund (the “Sub-Advisory Agreement, together with the Advisory Agreement, the “Fund Advisory Agreements”) in accordance with Section 15(a) of the 1940 Act. The Trustees were informed that the Adviser, as the investment adviser, has responsibility for the investment and management of the Fund’s assets and securities. The Independent Trustees met with independent legal counsel during executive session and discussed the Fund Advisory Agreements and other related materials.
In approving the Investment Advisory Agreement with the Adviser and the Sub-Advisory Agreement with Wellington, the Trustees, including the Independent Trustees, considered the following factors with respect to the Fund:
Investment Advisory Fee Rate: The Trustees reviewed and considered the tiered contractual annual advisory fee to be paid by (a) the Trust, on behalf of the Fund, to the Adviser of (i) 0.95% of the Fund’s daily average net assets of $0-$250M; (ii) 0.85% of the Fund’s daily average net assets between $250M-$500M ; and (iii) 0.75% of the Fund’s daily average net assets over $500M and (b) by the Adviser to Wellington of (i) 0.50% of the Fund’s daily average net assets of $0-$250M; (ii) 0.40% of the Fund’s daily average net assets between $250M-$500M; and (iii) 0.30% of the Fund’s daily average net assets over $500M, in light of the extent and quality of the advisory services provided by the Adviser and Wellington to the Fund.
The Board received and considered information comparing the Fund’s contractual advisory fees and overall expenses with those of funds in both the relevant expense group and universe of funds provided by Lipper, an independent provider of investment company data, as well as the Fund’s direct competitors.
Based on such information, the Trustees further determined that the tiered contractual annual advisory fees set forth above and the total expense ratio of 1.40% and 1.15% for Class A and Class I, respectively, of the Fund, taking into account the contractual fee waivers in place, is comparable to others within the Fund’s peer universe.
Nature, Extent and Quality of the Services under the Fund Advisory Agreements: The Trustees received and considered information regarding the nature, extent and quality of services provided to the Fund under the Advisory Agreement and the Sub-Advisory Agreement. The Trustees reviewed certain background materials supplied by the Adviser and Wellington in each of their presentations, including their Forms ADV.
The Trustees reviewed and considered the Adviser’s and Wellington’s investment advisory personnel, their history as asset managers, their performance and the amount of assets currently under management by the Adviser and Wellington. The Trustees also reviewed the research and decision-making processes utilized by the Adviser and Wellington, including the methods adopted to seek to achieve compliance with the investment objectives, policies and restrictions of the Fund.
The Trustees considered the background and experience of the Adviser’s and Wellington’s management in connection with the Fund, including reviewing the qualifications, backgrounds and responsibilities of the management team primarily responsible for the day-to-day portfolio management of the Fund and the extent of the resources devoted to research and analysis of actual and potential investments.
| | | | | | |
| Additional Information | | | | |
| | | �� | | | | April 30, 2010 (Unaudited) |
The Trustees also reviewed, among other things, the Adviser’s and Wellington’s insider trading policies and procedures and a description of their Codes of Ethics.
Performance: The Trustees reviewed performance information for the Predecessor Fund for the 1-, 3-, 5- and 10-year periods ended March 31, 2009 and since inception (December 31, 1999). That review included a comparison of the Fund’s performance to the performance of a group of comparable funds selected by Lipper and the Russell 1000 Value Index, the Fund’s benchmark. The Trustees also considered Wellington’s representations about the effect of recent market turmoil on the Fund’s performance. The Trustees also considered Wellington’s performance and reputation generally and its investment techniques, risk management controls and decision-making processes.
The Adviser’s Profitability: The Trustees received and considered a profitability analysis prepared by the Adviser’s based on the fees payable under the Advisory Agreement. The Trustees considered the profits, if any, anticipated to be realized by the Adviser in connection with the operation of the Fund. The Board then reviewed the Adviser’s and Wellington’s financial statements in order to analyze the financial condition and stability and profitability of each adviser.
Economies of Scale: The Trustees considered whether economies of scale in the provision of services to the Fund were being passed along to the shareholders.
Other Benefits to the Adviser and Wellington: The Trustees reviewed and considered any other benefits derived or to be derived by the Adviser and Wellington from their relationship with the Fund, including soft dollar arrangements.
In selecting the Adviser as the Fund’s investment adviser and Wellington as the Fund’s sub-adviser and approving the Advisory Agreement and Sub-Advisory Agreement and the fees charged under each agreement, the Trustees concluded that no single factor reviewed by the Trustees was identified by the Trustees to be determinative as the principal factor in whether to approve the Advisory Agreement and Sub-Advisory Agreement. Further, the Independent Trustees were advised by separate independent legal counsel throughout the process. The Trustees, including all of the Independent Trustees, concluded that:
| | » | the investment advisory fees to be received by the Adviser with respect to the Fund were comparable to others with in the Fund’s peer universe; |
| | » | the nature, extent and quality of services rendered by the Adviser under the Advisory Agreement and by Wellington under the Sub-Advisory Agreement were adequate; |
| | » | the profit, if any, anticipated to be realized by the Adviser in connection with the operation of the Fund is fair to the Trust, especially in light of the fee waiver agreement between the Trust and the Adviser; and |
| | » | there were no material other benefits accruing to the Adviser or Wellington in connection with its relationship with the Fund. |
Based on the Trustees’ deliberations and their evaluation of the information described above, the Trustees, including all of the Independent Trustees, concluded that the Adviser’s and Wellington’s compensation for investment advisory services is consistent with the best interests of the Fund and its shareholders.
ALPS/GNI Long-Short Fund
On August 28, 2009, the Trustees met in person to discuss, among other things, the approval of the Investment Advisory Agreement between the Trust and the Adviser (the “Advisory Agreement”) and the Investment Sub-Advisory Agreement among the Trust, the Adviser and GNI Capital, Inc. (“GNI Capital”), the sub-adviser for the ALPS/GNI Long-Short Fund (the “Sub-Advisory Agreement, together with the Advisory Agreement, the “Fund Advisory Agreements”) in accordance with Section 15(a) of the 1940 Act. The Trustees were informed that the Adviser, as the investment adviser, has responsibility for the investment and management of the Fund’s assets and securities. The Independent Trustees met with independent legal counsel during executive session and discussed the Fund Advisory Agreements and other related materials.
In approving the Advisory Agreement with the Adviser and the Sub-Advisory Agreement with GNI Capital, the Trustees, including the Independent Trustees, considered the following factors with respect to the Fund:
Investment Advisory Fee Rate: The Trustees reviewed and considered the contractual annual advisory fee to be paid by (a) the Trust, on behalf of the Fund, to the Adviser of 1.30% of the Fund’s daily average net assets and (b) by the Adviser to GNI Capital of (i) 0.85% based on the Fund’s average net assets between $0 - $10 million and (ii) 0.65% based on the Fund’s average net assets over $10 million, in light of the extent and quality of the advisory services provided by the Adviser and GNI Capital to the Fund.
The Board received and considered information comparing the Fund’s contractual advisory fees and overall expenses with those of funds in the relevant expense group and universe of funds provided by Lipper, an independent provider of investment company data.
Based on such information, the Trustees further determined that the contractual annual advisory fees set forth above and the total expense ratio (after waivers) of 2.25% and 2.00% for Class A and Class I shares, respectively, of the Fund, taking into account the contractual fee waivers in place, is comparable to others within the Fund’s peer universe.
Nature, Extent and Quality of the Services under the Advisory Agreement and the Sub-Advisory Agreement: The Trustees received and considered information regarding the nature, extent and quality of services provided to the Fund under the Advisory Agreement and the Sub-Advisory Agreement. The Trustees reviewed certain background materials supplied by the Adviser and GNI Capital in each of their presentations, including their Forms ADV.
The Trustees reviewed and considered the Adviser’s and GNI Capital’s investment advisory personnel, their history as asset managers, their performance and the amount of assets currently under management by the Adviser and GNI Capital. The Trustees
| | | | | | |
| Additional Information | | |
| | | | | April 30, 2010 (Unaudited) |
also reviewed the research and decision-making processes utilized by the Adviser and GNI Capital, including the methods adopted to seek to achieve compliance with the investment objectives, policies and restrictions of the Fund.
The Trustees considered the background and experience of the Adviser’s and GNI Capital’s management in connection with the Fund, including reviewing the qualifications, backgrounds and responsibilities of the management team primarily responsible for the day-to-day portfolio management of the Fund and the extent of the resources devoted to research and analysis of actual and potential investments.
The Trustees also reviewed the accompanying compliance-related materials with respect to the Fund.
Performance: The Trustees noted that since the Fund has not yet begun operations, there was no performance to be reviewed or analyzed at this time.
The Advisers’ Profitability: The Trustees received and considered a projected profitability analysis prepared by the Adviser based on the fees payable under the Advisory Agreement. Based on the allocation methodologies used by the Adviser, the Trustees considered the near-term losses projected to be realized by the Adviser in connection with the operation of the Fund. The Board then reviewed and discussed the Adviser’s and GNI Capital’s financial statements in order to analyze the financial condition and stability and profitability of each adviser.
Economies of Scale: The Trustees considered whether economies of scale in the provision of services to the Fund would be passed along to the shareholders. The Trustees considered whether any economies of scale, fall-out benefits or any other direct or indirect benefits would accrue to the Adviser or GNI Capital from their relationship with the Trust.
Other Benefits to the Advisers: The Trustees reviewed and considered any other benefits derived or to be derived by the Adviser and GNI Capital from their relationship with the Fund, including soft-dollar arrangements.
The Board summarized its deliberations with respect to the Advisory Agreement with the Adviser and the Sub-Advisory Agreement with GNI Capital. In selecting the Adviser and GNI Capital and approving the investment advisory and sub-advisory agreements and fees under such agreements, the Trustees concluded that no single factor reviewed by the Trustees was identified by the Trustees to be determinative as the principal factor in whether to approve the investment advisory and sub-advisory agreements. Further, the Trustees, including all of the Independent Trustees, concluded that:
| | » | the investment advisory fees to be received by the Adviser with respect to the Fund were comparable to others with in the Fund’s peer universe; |
| | » | the nature, extent and quality of services rendered by the Adviser under the Advisory Agreement and by GNI Capital under the Sub-Advisory Agreement were adequate; |
| | » | there was no performance to date with respect to the Fund; |
| | » | the profit, if any, anticipated to be realized by the Adviser in connection with the operation of the Fund is fair to the Trust, especially in light of the fee waiver agreement between the Trust and the Adviser; and |
| | » | there were no material other benefits accruing to the Adviser or GNI Capital in connection with its relationship with the Fund. |
| | » | Based on the Trustees’ deliberations and their evaluation of the information described above, all of the Trustees, including all of the Independent Trustees in person at the meeting, concluded that the Adviser’s and GNI Capital’s compensation for investment advisory services is consistent with the best interests of the Fund and its shareholders. |
ALPS/Red Rocks Listed Private Equity Fund
On August 28, 2009, the Trustees met in person to discuss, among other things, the renewal and approval of the Investment Advisory and Management Agreement between the Trust and the Adviser (the “Advisory Agreement”) and the Investment Sub-Advisory Agreement among the Trust, the Adviser and Red Rocks Capital LLC (“Red Rocks”), the sub-adviser for the ALPS/Red Rocks Listed Private Equity Fund (the “Sub-Advisory Agreement, together with the Advisory Agreement, the “Fund Advisory Agreements”) in accordance with Section 15(c) of the 1940 Act. The Independent Trustees met with independent legal counsel during executive session and discussed the Fund Advisory Agreements and other related materials.
In renewing and approving the Investment Advisory and Management Agreement with the Adviser and the Sub-Advisory Agreement with Red Rocks, the Trustees, including the Independent Trustees, considered the following factors with respect to the Fund:
Investment Advisory Fee Rate: The Trustees reviewed and considered the contractual annual advisory fee to be paid by (a) the Trust, on behalf of the Fund, to the Adviser of 0.85% of the Fund’s daily average net assets and (b) by the Adviser to Red Rocks of 0.57% based on the Fund’s average net assets, in light of the extent and quality of the advisory services provided by the Adviser and Red Rocks to the Fund.
The Board received and considered information comparing the Fund’s contractual advisory fees and overall expenses with those of funds in both the relevant expense group and universe of funds provided by Lipper, an independent provider of investment company data, as well as the Fund’s direct competitors.
Based on such information, the Trustees further determined that the contractual annual advisory fees set forth above and the total expense ratio (after waivers) of 1.50%, 1.25% and 1.75% for Class A, Class I and Class R shares, respectively, of the Fund, taking into account the contractual fee waivers in place, is comparable to others within the Fund’s peer universe.
Nature, Extent and Quality of the Services under the Advisory Agreement and the Sub-Advisory Agreement: The Trustees received and considered information regarding the nature, extent and quality of services provided to the Fund under the Advisory Agreement and the Sub-Advisory Agreement. The Trustees
| | | | | | |
| Additional Information | | |
| | | | | April 30, 2010 (Unaudited) |
reviewed certain background materials supplied by the Adviser and Red Rocks in each of their presentations, including their Forms ADV.
The Trustees reviewed and considered the Adviser’s and Red Rocks’ investment advisory personnel, their history as asset managers, their performance and the amount of assets currently under management by the Adviser and Red Rocks. The Trustees also reviewed the research and decision-making processes utilized by the Adviser and Red Rocks, including the methods adopted to seek to achieve compliance with the investment objectives, policies and restrictions of the Fund.
The Trustees considered the background and experience of the Adviser’s and Red Rocks’ management in connection with the Fund, including reviewing the qualifications, backgrounds and responsibilities of the management team primarily responsible for the day-to-day portfolio management of the Fund and the extent of the resources devoted to research and analysis of actual and potential investments.
The Trustees also reviewed the accompanying compliance-related materials and also noted that they have received reports on these services and compliance issues from the Adviser and Red Rocks at each regular Board meeting throughout the year related to the services rendered by the Adviser and Red Rocks with respect to the Fund.
Fund Performance: The Trustees reviewed performance information for the Fund for the one-year and since inception (December 31, 2007) periods ended July 31, 2009. That review included a comparison of the Fund’s performance to the performance of a group of comparable funds selected by Lipper. The Trustees also considered Red Rocks’ representations about the effect of recent market turmoil on the Fund’s performance. The Trustees also considered Red Rocks’ performance and reputation generally and its investment techniques, risk management controls and decision-making processes.
The Advisers’ Profitability: The Trustees received and considered a profitability analysis prepared by the Adviser based on the fees payable under the Advisory Agreement. Based on the allocation methodologies used by the Adviser, the Trustees considered the losses realized by the Adviser in connection with the operation of the Fund. The Trustees also considered the advisers’ statements regarding their continuing commitment to the Fund despite these losses. The Board then reviewed and discussed the Adviser’s and Red Rocks’ financial statements in order to analyze the financial condition and stability and profitability of each adviser.
Economies of Scale: The Trustees considered whether economies of scale in the provision of services to the Fund were being passed along to the shareholders. The Trustees considered whether any economies of scale, fall-out benefits or any other direct or indirect benefits would accrue to the Adviser or Red Rocks from their relationship with the Trust.
Other Benefits to the Advisers: The Trustees reviewed and considered any other benefits derived or to be derived by the Adviser and Red Rocks from their relationship with the Fund, including soft-dollar arrangements.
The Board summarized its deliberations with respect to the Advisory Agreement with the Adviser and the Sub-Advisory Agreement with Red Rocks. In selecting the Adviser and Red Rocks and approving the investment advisory and sub-advisory agreements and fees under such agreements, the Trustees concluded that no single factor reviewed by the Trustees was identified by the Trustees to be determinative as the principal factor in whether to approve the investment advisory and sub-advisory agreements. Further, the Trustees, including all of the Independent Trustees, concluded that:
| | » | the investment advisory fees to be received by the Adviser with respect to the Fund were comparable to others with in the Fund’s peer universe; |
| | » | the nature, extent and quality of services rendered by the Adviser under the Advisory Agreement and by Red Rocks under the Sub-Advisory Agreement were adequate; |
| | » | the performance of the Fund was generally comparable to the performance of the funds in its Lipper peer group, although the peer group was composed of several funds that, although in the financial sector, have very different investment theses than the Fund; |
| | » | the profit, if any, anticipated to be realized by the Adviser in connection with the operation of the Fund is fair to the Trust, especially in light of the fee waiver agreement among the Trust, the Adviser and Red Rocks; and |
| | » | there were no material other benefits accruing to the Adviser or Red Rocks in connection with its relationship with the Fund. |
Based on the Trustees’ deliberations and their evaluation of the information described above, all of the Trustees, including all of the Independent Trustees in person at the meeting, concluded that the Adviser’s and Red Rocks’ compensation for investment advisory services is consistent with the best interests of the Fund and its shareholders.
Clough China Fund
On August 28, 2009, the Trustees met in person to discuss, among other things, the approval of the Investment Advisory Agreement between the Trust and the Adviser (the “Advisory Agreement”) and the Investment Sub-Advisory Agreement among the Trust, the Adviser and Clough Capital Partners, LP (“Clough Capital”), the sub-adviser for the Clough China Fund (the “Sub-Advisory Agreement, together with the Advisory Agreement, the “Fund Advisory Agreements”) in accordance with Section 15(a) of the 1940 Act. The Trustees were informed that the Adviser, as the investment adviser, has responsibility for the investment and management of the Fund’s assets and securities. The Independent Trustees met with independent legal counsel during executive session and discussed the Fund Advisory Agreements and other related materials.
In approving the Advisory Agreement with the Adviser and the Sub-Advisory Agreement with Clough Capital, the Trustees, including the Independent Trustees, considered the following factors with respect to the Fund:
Investment Advisory Fee Rate: The Trustees reviewed and considered the tiered contractual annual advisory fee to be paid by (a) the Trust, on behalf of the Fund, to the Adviser of 1.35% of the Fund’s daily average net assets and (b) the Adviser to Clough Capital of 0.90% of the Fund’s daily average net assets, in light
| | | | | | |
| Additional Information | | |
| | | | | April 30, 2010 (Unaudited) |
of the extent and quality of the advisory services provided by the Adviser and Clough Capital to the Fund.
The Board received and considered information comparing the Fund’s contractual advisory fees and overall expenses with those of funds in both the relevant expense group and universe of funds provided by Lipper, an independent provider of investment company data.
Based on such information, the Trustees further determined that the tiered contractual annual advisory fees set forth above and the total expense ratio (after waivers) of 1.85%, 2.45% and 1.40% for Class A, Class C and Class I, respectively, of the Fund, taking into account the contractual fee waivers in place, is comparable to others within the Fund’s peer universe.
Nature, Extent and Quality of the Services under the Advisory Agreement and the Sub-Advisory Agreement: The Trustees received and considered information regarding the nature, extent and quality of services provided to the Fund under the Advisory Agreement and the Sub-Advisory Agreement. The Trustees reviewed certain background materials supplied by the Adviser and Clough Capital in each of their presentations, including their Forms ADV.
The Trustees reviewed and considered the Adviser’s and Clough Capital’s investment advisory personnel, their history as asset managers, their performance and the amount of assets currently under management by the Adviser and Clough Capital. The Trustees also reviewed the research and decision-making processes utilized by the Adviser and Clough Capital, including the methods adopted to seek to achieve compliance with the investment objectives, policies and restrictions of the Fund.
The Trustees considered the background and experience of the Adviser’s and Clough Capital’s management in connection with the Fund, including reviewing the qualifications, backgrounds and responsibilities of the management team primarily responsible for the day-to-day portfolio management of the Fund and the extent of the resources devoted to research and analysis of actual and potential investments.
The Trustees also reviewed, among other things, the Adviser’s and Clough Capital’s insider trading policies and procedures and a description of their Codes of Ethics.
Performance: The Trustees reviewed performance information for the predecessor fund of the Fund for the one-, two- and three-year periods ended July 31, 2009. That review included a comparison of the predecessor’s performance to the performance of a group of comparable funds selected by Lipper. The Trustees also considered Clough Capital’s representations about the effect of recent market turmoil on the Fund’s performance. The Trustees also considered Clough Capital’s performance and reputation generally and its investment techniques, risk management controls and decision-making processes.
The Advisers’ Profitability: The Trustees received and considered a projected profitability analysis prepared by the Adviser and Clough Capital based on the fees payable under the Advisory Agreement and Sub-Advisory Agreement, respectively. The Trustees considered the projected profits, if any, anticipated to be realized by the Adviser and Clough Capital in connection with the operation of the Fund. The Board then reviewed the Adviser’s and Clough Capital’s financial statements in order to analyze the financial condition and stability and profitability of each adviser.
Economies of Scale: The Trustees considered whether economies of scale in the provision of services to the Fund would be passed along to the shareholders.
Other Benefits to the Advisers: The Trustees reviewed and considered any other benefits derived or to be derived by the Adviser and Clough Capital from their relationship with the Fund, including soft dollar arrangements.
In selecting the Adviser as the Clough China Fund’s investment adviser and Clough Capital as the Fund’s sub-adviser and approving the Advisory Agreement and Sub-Advisory Agreement and the fees charged under each agreement, the Trustees concluded that no single factor reviewed by the Trustees was identified by the Trustees to be determinative as the principal factor in whether to approve the Advisory Agreement and Sub-Advisory Agreement. Further, the Independent Trustees were advised by separate independent legal counsel throughout the process. The Trustees, including all of the Independent Trustees, concluded that:
| | » | the investment advisory fees to be received by the Adviser with respect to the Fund were comparable to others with in the Fund’s peer universe; |
| | » | the nature, extent and quality of services rendered by the Adviser under the Advisory Agreement and by Clough Capital under the Sub-Advisory Agreement were adequate; |
| | » | there was no performance to date with respect to the Fund and the performance of the predecessor fund was comparable to the performance of other funds in the predecessor fund’s peer universe; |
| | » | the profit, if any, anticipated to be realized by the Adviser in connection with the operation of the Fund is fair to the Trust, especially in light of the fee waiver agreement between the Trust and the Adviser; and |
| | » | there were no material other benefits accruing to the Adviser or Clough Capital in connection with its relationship with the Fund. |
Based on the Trustees’ deliberations and their evaluation of the information described above, all of the Trustees, including all of the Independent Trustees in person at the meeting, concluded that the Adviser’s and Clough Capital’s compensation for investment advisory services is consistent with the best interests of the Fund and its shareholders.
| | | | | | |
| Trustees and Officers | | |
| | | | | April 30, 2010 (Unaudited) |
INDEPENDENT TRUSTEES
| | | | | | | | | | |
Name, Address* & Age | | Position(s) Held with Funds | | Term of Office and Length of Time
Served | | Principal Occupation(s) During Past 5 Years** | | Number of Funds in Fund Complex Overseen by Trustee*** | | Other Directorships Held by Trustee |
Mary K. Anstine, age 68 | | Trustee | | Ms. Anstine was elected at a special meeting of shareholders held on March 21, 1997 and re-elected at a special meeting of shareholders held on August 7, 2009. | | Ms. Anstine was President/Chief Executive Officer of HealthONE Alliance, Denver, Colorado, and former Executive Vice President of First Interstate Bank of Denver. Ms. Anstine is also Trustee/Director of AV Hunter Trust and Colorado Uplift Board. Ms. Anstine was formerly a Director of the Trust Bank of Colorado (later purchased and now known as Northern Trust Bank), HealthONE and Denver Area Council of the Boy Scouts of America, and a member of the American Bankers Association Trust Executive Committee. | | 21 | | Ms. Anstine is a Trustee of ALPS ETF Trust (9 funds); Financial Investors Variable Insurance Trust (5 funds); ALPS Variable Insurance Trust (1 fund); Reaves Utility Income Fund (1 fund); and Westcore Trust (12 funds). |
John R. Moran, Jr., age 79 | | Trustee | | Mr. Moran was elected at a special meeting of shareholders held on March 21, 1997 and re-elected at a special meeting of shareholders held on August 7, 2009. | | and CEO of The Colorado Trust, a private foundation serving the health and hospital community in the state of Colorado. An attorney, Mr. Moran was formerly a partner with the firm of Kutak Rock & Campbell in Denver, Colorado and a member of the Colorado House of Representatives. Currently, Mr. Moran is a member of the Treasurer’s Investment Advisory Committee for the University of Colorado. | | 6 | | None. |
Jeremy W. Deems, age 33 | | Trustee | | Mr. Deems was appointed as a Trustee at the March 11, 2008 meeting of the Board of Trustees and elected at a special meeting of shareholders held on August 7, 2009. | | Mr. Deems is the Co-President and Chief Financial Officer of Green Alpha Advisors, LLC. Prior to joining Green Alpha Advisors, Mr. Deems was CFO and Treasurer of Forward Management, LLC, an investment management company, ReFlow Management Co., LLC, a liquidity resourcing company, ReFlow Fund, LLC, a private investment fund, and Sutton Place Management, LLC, an administrative services company (from 2004 to June 2007). Prior to this, Mr. Deems served as Controller of Forward Management, LLC, ReFlow Management Co., LLC, ReFlow Fund, LLC and Sutton Place Management, LLC. | | 16 | | Mr. Deems is a Trustee of ALPS ETF Trust (9 funds); ALPS Variable Insurance Trust (1 fund); and Reaves Utility Income Fund (1 fund). |
60 | April 30, 2010
| | | | | | |
| Trustees and Officers | | |
| | | April 30, 2010 (Unaudited) |
| | | | | | | | | | |
Name, Address* & Age | | Position(s) Held with Funds | | Term of Office and Length of Time Served | | Principal Occupation(s) During Past 5 Years** | | Number of Funds in Fund Complex Overseen by Trustee*** | | Other Directorships Held by Trustee |
Jerry G. Rutledge, age 65 | | Trustee | | Mr. Rutledge was elected at a special meeting of shareholders held on August 7, 2009. | | Mr. Rutledge is the President and owner of Rutledge’s Inc., a retail clothing business. Mr. Rutledge is currently Director of the University of Colorado Hospital. He was from 1994 to 2007 a Regent of the University of Colorado and Director of the American National Bank until 2009. | | 9 | | Mr. Rutledge is a Trustee of Clough Global Allocation Fund (1 fund), Clough Global Equity Fund (1 fund) and Clough Global Opportunities Fund (1 fund). |
Michael “Ross” Shell, age 39 | | Trustee | | Mr. Shell was elected at a special meeting of shareholders held on August 7, 2009. | | Mr. Shell is Founder and CEO of Red Idea, LLC, a strategic consulting/early stage venture firm (since June 2008) and a Director of Tesser, Inc., a brand agency (since November 1999). From December 2005 to May 2008, he was Director, Marketing and Investor Relations, of Woodbourne, a REIT/real estate hedge fund and private equity firm. Prior to this, from May 2004 to November 2005, he worked as a business strategy consultant; from June 2003 to April 2004, he was on the Global Client Services team of IDEO, a product design/ innovation firm; and from 1999 to 2003, he was President of Tesser, Inc. Mr. Shell graduated with honors from Stanford University with a degree in Political Science. | | 6 | | None. |
| | * | All communications to Trustees and Officers may be directed to Financial Investors Trust c/o 1290 Broadway, Suite 1100, Denver, CO 80203. |
| | ** | Except as otherwise indicated, each individual has held the office shown or other offices in the same company for the last five years. |
| | *** | The Fund Complex includes all series of the Trust and any other investment companies for which ALPS Advisors, Inc., Wellington Management Company, LLP, Red Rocks Capital LLC, GNI Capital, Inc., and Clough Capital Partners, LP provides investment advisory services. |
61 | April 30, 2010
| | | | | | |
| Trustees and Officers | | |
| | | | | April 30, 2010 (Unaudited) |
| | | | | | | | | | | | |
| | INTERESTED TRUSTEE |
| | | | | | |
| | | Name, Address* & Age | | Position(s) Held with Funds | | Term of Office and Length of Time Served | | Principal Occupation(s) During Past 5 Years** | | Number of Funds in Fund Complex Overseen by Trustee*** | | Other Directorships Held by Trustee |
| | |
| | Edmund J. Burke, age 48 | | Trustee, Chairman and President | | Mr. Burke was elected as Chairman at the August 28, 2009 meeting of the Board of Trustees. Mr. Burke was elected as Trustee at a special meeting of shareholders held on August 7, 2009. Mr. Burke was elected President of the Trust at the December 17, 2002 meeting of the Board of Trustees. | | Mr. Burke is Chief Executive Officer and a Director of ALPS Holdings, Inc. (“AHI”) (since 2005) and Director of ALPS Advisors, Inc. (“AAI”), ALPS Distributors, Inc. (“ADI”), ALPS Fund Services, Inc. (“AFS”) and FTAM Distributors, Inc. (“FDI”) and from 2001-2008, was President of AAI, ADI, AFS and FDI. Because of his positions with AHI, AAI, ADI, AFS and FDI, Mr. Burke is deemed an affiliate of the Trust as defined under the 1940 Act. Mr. Burke is President and Chief Executive Officer of the Financial Investors Variable Insurance Trust (since 2006); Trustee and President of the Clough Global Allocation Fund (Trustee since 2006; President since 2004); Trustee and President of the Clough Global Equity Fund (Trustee since 2006; President since 2005); Trustee and President of the Clough Global Opportunities Fund (since 2006); Trustee of the Liberty All-Star Equity Fund; and Director of the Liberty All-Star Growth Fund, Inc. | | 13 | | Mr. Burke is a Trustee of Clough Global Allocation Fund (1 fund); Clough Global Equity Fund (1 fund); Clough Global Opportunities Fund (1 fund); Trustee of the Liberty All-Star Equity Fund (1 fund); and Director of the Liberty All-Star Growth Fund, Inc. (1 fund). |
| |
| | |
62 | April 30, 2010
| | | | | | |
| Trustees and Officers | | |
| | | | | April 30, 2010 (Unaudited) |
| | | | | | | | | | | | |
| | OFFICERS | | | | | | | | |
| | | Name, Address* & Age | | Position(s) Held with Funds | | Term of Office and Length
of Time Served | | Principal Occupation(s) During Past 5 Years** |
| | |
| | Jeremy O. May, age 39 | | Treasurer | | Mr. May was elected Treasurer of the Trust at the October 7, 1997 meeting of the Board of Trustees. | | Mr. May joined ALPS in 1995 and is currently President and Director of AFS and Executive Vice President and Director of AHI, AAI, ADI and FDI. Because of his positions with these entities, Mr. May is deemed an affiliate of the Trust as defined under the 1940 Act. Mr. May is also the Treasurer of the Liberty All-Star Equity Fund, Liberty All- Star Growth Fund, Inc., Clough Global Allocation Fund, Clough Global Equity Fund, Clough Global Opportunities Fund, Financial Investors Trust and Financial Investors Variable Insurance Trust. Mr. May is also President, Chairman and Trustee of the ALPS Variable Insurance Trust and the Reaves Utility Income Fund. Mr. May is currently on the Board of Directors and is Chairman of the Audit Committee of the University of Colorado Foundation. |
| | |
| | JoEllen L. Legg, age 48 | | Secretary | | Ms. Legg was elected Secretary of the Trust at the November 13, 2007 meeting of the Board of Trustees. | | Ms. Legg joined ALPS in October 2007 and is currently Vice President and Associate Counsel of ALPS, AAI, ADI and FDI. Prior to joining ALPS, Ms. Legg served as Senior Counsel - Law (Corporate & Securities) for Adelphia Communications Corporation from February 2005 to March 2007. Prior to this, Ms. Legg held associate positions at Fried Frank Harris Shriver & Jacobson LLP (1998 - 2004) and at Patton Boggs LLP (2004 - 2005). Because of her position with ALPS, Ms. Legg is deemed an affiliate of the Trust as defined under the 1940 Act. Ms. Legg is also the Secretary of Transparent Value Trust and Westcore Trust and Assistant Secretary of the Stone Harbor Investment Funds and WesMark Funds. |
| | |
| | Michael Akins, age 33 | | Chief Compliance Officer (“CCO”) | | Mr. Akins was appointed CCO of the Trust at the June 13, 2006 meeting of the Board of Trustees. | | Mr. Akins joined ALPS in April 2006 and is currently Vice President and Deputy Compliance Officer of ALPS. Prior to joining ALPS, Mr. Akins served as Compliance Officer and AVP for UMB Financial Corporation. Before joining UMB, Mr. Akins served as an account manager for State Street Corporation. Because of his position with ALPS, Mr. Akins is deemed an affiliate of the Trust as defined under the 1940 Act. Mr. Akins is currently the CCO of Reaves Utility Income Fund, Clough Global Allocation Fund, Clough Global Opportunities Fund and the Clough Global Equity Fund. |
| | |
| | Kimberly R. Storms, age 37 | | Assistant Treasurer | | Ms. Storms was elected Assistant Treasurer of the Trust at the June 14, 2005 meeting of the Board of Trustees. | | Ms. Storms is Senior Vice President - Director of Fund Administration of ALPS. Ms. Storms joined ALPS in 1998 as Assistant Controller. Because of her position with ALPS, Ms. Storms is deemed an affiliate of the Trust as defined under the 1940 Act. Ms. Storms is also Treasurer of ALPS ETF Trust and ALPS Variable Insurance Trust; Assistant Treasurer of Liberty All-Star Equity Fund and Liberty All-Star Growth Fund, Inc.; and Assistant Secretary of Ameristock Mutual Fund, Inc. |
| | |
| | * | All communications to Trustees and Officers may be directed to Financial Investors Trust c/o 1290 Broadway, Suite 1100, Denver, CO 80203. |
| | ** | Except as otherwise indicated, each individual has held the office shown or other offices in the same company for the last five years. |
| | *** | The Fund Complex includes all series of the Trust and any other investment companies for which ALPS Advisors, Inc., Wellington Management Company, LLP, Red Rocks Capital LLC, GNI Capital, Inc., and Clough Capital Partners, LP provides investment advisory services. |
63 | April 30, 2010


VULCAN
VALUE
PARTNERS
ANNUAL
April 30, 2010
VULCAN VALUE PARTNERS FUND
VULCAN VALUE PARTNERS
SMALL CAP FUND
Table of Contents
April 30, 2010
1-877-421-5078 | www.vulcanvaluepartners.com
Shareholder Letter
April 30, 2010 (Unaudited)
Dear Shareholders:
We are pleased to report that Vulcan Value Partners delivered solid performance and good returns for the period ended April 30, 2010; Vulcan Value Partners Fund returned 5.70% and Vulcan Value Partners Small Cap Fund returned 16.00% (all returns are net of fees). While our returns have been good, we are more pleased with the quality and valuation of the companies the funds own.
Over the long term we expect that our results will be a function of value growth and the closing of the gap between price and value in the companies we own. Short term results can be overly influenced by market psychology and may not be very meaningful. The long term drivers of our performance are encouraging. During 2009 and on average, our companies compounded their values at a double digit rate during the recession. As the economy continues to improve we believe it is reasonable to expect that their values will compound at above average rates. Moreover, we believe our price to value ratios are compelling as we have sold or reduced our stake in companies whose prices have risen in relation to fair value and have replaced them with more discounted names possessing similar, outstanding business economics.
The price to value ratio is a calculation that compares the price of a company’s stock to our appraisal of the company’s intrinsic value. The price to value ratio does not guarantee that a company’s stock price will ever reach our appraisal of its intrinsic value or give any insight as to when that might happen. We define intrinsic value, or fair value, as the price that a fully informed buyer would pay, and a fully informed seller would accept, for a company, assuming neither was compelled to buy or sell.
We only purchase investments that we would be comfortable owning for five years. Our expectation is that over our five year time horizon, price will converge with value. While it may seem intuitive that the faster value is recognized, the larger our returns will be; there is also a cost. When the price to value gap closes, we sell because there is no longer a margin of safety. We will not hold an investment at fair value. So, we must find replacements for companies that have risen to fair value and those replacements might or might not be able to compound their underlying values at the same rate as the companies we have sold. In short, we face execution risk because it is easier to make one great decision than to make, say, ten great decisions. Therefore, we are very happy to own what are, in our opinion, superior business enterprises that steadily compound their value as long as we can do so while enjoying a margin of safety.
We believe the key to successfully executing our investment philosophy is to limit our investments to truly outstanding businesses possessing sustainable competitive advantages that allow them to consistently compound their values. Doing so allows us to take advantage of stock market volatility, instead of being taken advantage of, because the values of the companies we own are more stable than their stock prices. When such businesses are purchased at a discount, which we demand, then risk is reduced and the potential for excess returns is maximized. We believe our research team has done an excellent job of finding qualifying investments to replace companies whose stock price has appreciated faster than underlying values have compounded. We believe prospects for future compounding are materially better than they would have been without their great work. As of April 30, 2010 we were virtually fully invested across both of our portfolios. We believe our portfolios enjoy a substantial margin of safety in terms of value over price. Our price to value ratios range from the low 70’s to the low 60’s. Business values are growing nicely. We are fortunate to have assembled such a fine research team. It will be fun for me to let you learn more about them in future letters.
| | |
| Annual Report | April 30, 2010 | | 1 |
Shareholder Letter
April 30, 2010 (Unaudited)
Please note that in the commentary that follows regarding each of our funds we define meaningful as having a 1% impact on portfolio returns or a greater than 10% change in price. We generally limit comments about top contributors and detractors to the top three or to companies that had a meaningful impact on portfolio performance.
VULCAN VALUE PARTNERS FUND REVIEW
Top contributors to performance included Time Warner Cable and Boeing. Time Warner Cable produced solid results and generated substantial free cash flow in 2009. Its strong business fundamentals became a little less under-appreciated during the first four months of 2010. Boeing successfully completed the first test flight of the 787 and also received some good news on a large defense contract to build long range refueling planes for the Unites States Air Force.
The only meaningful detractor to our performance was Google. Google’s impact was less than 1% but it was the largest detractor. Google is generating ample free cash flow and is producing solid bottom line results. Consequently, its value is growing, which is our chief concern. Google has been in the news a lot lately because of its decision to stop filtering its Chinese website search results. Chinese related revenues are a small fraction of Google’s total so if Google does leave China it will be immaterial. While the opportunity cost of foregoing future growth in China is high we believe that it is more than offset by the benefit Google derives from cementing its worldwide reputation as the leading source of objective search information on the Internet.
VULCAN VALUE PARTNERS SMALL CAP FUND REVIEW
Top contributors to performance were Joseph A. Bank, Discovery Communications and Heartland Payment Systems. Joseph A. Bank is a recent addition to the fund. It sells men’s clothes, mostly for the office. Joseph A. Bank offers high quality clothes across a broad price spectrum. Its stores are relatively small and are fully staffed. They emphasize customer service and allow their clientele to get in and out quickly. Their selection and customer service greatly exceeds that of most department stores and their prices are lower. Joseph A. Bank has built a great brand based on service, value, accessibility and quality. Additionally, because their clothes do not go out of style, the risk that their inventory will decline in value is much lower than an average retailer. Despite the poor economy, Joseph A. Bank produced double digit growth in its bottom line and enjoyed strong same store sales gains in 2009. The market responded favorably to its results.
Discovery Communications, which owns a number of highly rated cable networks providing high quality family entertainment, generated substantial free cash flow and double digit bottom line results. It, like Google, which we also own, is one of the few companies to enjoy higher advertising revenues in 2009. Consequently, Discovery Communications grew its value at very high double digit rates during one of the worst recessions in memory.
Heartland Payments Systems is a credit card processor. It was the victim of a sophisticated data breach whereby encrypted credit card information on their network was stolen. When the breach was discovered we calculated a range of possible legal liabilities related to the data theft. Under the worst of scenarios Heartland Payment Systems was substantially undervalued. As the company has moved forward in settling its claims the market’s assessment of Heartland Payment System’s legal liability has declined and the stock has responded favorably.
| | |
| 2 | | 1-877-421-5078 | www.vulcanvaluepartners.com |
Shareholder Letter
April 30, 2010 (Unaudited)
Everest RE Group was the largest detractor to performance with roughly 2/3 of 1% negative impact on Vulcan Value Partners Small Cap Fund. Everest RE Group is a fine company with a strong balance sheet, disciplined underwriting and excellent pricing, but the industry has been challenged by thin premiums and low interest rates. We expect the company to continue to emphasize disciplined underwriting, looking to grow only where it makes sense and cutting back where it doesn’t.
CLOSING
We are pleased to report good results. We caution you that we do not place importance on short term results and will willingly move against the crowd to generate superior long term returns. Our time horizon is five years and, as our investment partners, yours should be as well.
Here at Vulcan Value Partners one of our fundamental values is that we believe we should “walk the talk”. We believe in our discipline of investing. We practice what we preach. Vulcan Value Partners is the exclusive public equity investment vehicle for all of us at Vulcan Value Partners. We do not ask you, as our investment partners, to invest where we do not invest ourselves. We view you as our investment partners and we hope that is how you consider yourselves.
We thank you for the confidence you have placed in us and look forward to updating you again in our next report.
|
| Sincerely, |
| C.T. Fitzpatrick |
| Chief Investment Officer |
The Shareholder Letter included in this shareholder report contains certain forward-looking statements about the factors that may affect the performance of the Funds in the future. These statements are based on Fund management’s predictions and expectations concerning certain future events and their expected impact on the Funds, such as performance of the economy as a whole and of specific industry sectors, changes in the levels of interest rates, the impact of developing world events, and other factors that may influence the future performance of the Funds. Management believes these forward-looking statements to be reasonable, although they are inherently uncertain and difficult to predict. Actual events may cause adjustments in portfolio management strategies from those currently expected to be employed.
| | |
| Annual Report | April 30, 2010 | | 3 |
Fund Overview
April 30, 2010 (Unaudited)
VULCAN VALUE PARTNERS FUND
Cumulative Total Returns (as of 4/30/2010)
| | | | | | | | | | |
| | | | | | | | | Expense Ratios** |
| | | 1 month | | 3 month | | Since Inception* | | Gross | | Net*** |
Vulcan Value Partners Fund | | 0.86% | | 10.45% | | 5.70% | | 2.09% | | 1.50% |
S&P 500 Index(1) | | 1.58% | | 11.04% | | 5.98% | | | | |
Performance data quoted represents past performance. Past performance does not guarantee future results. Investment return and principal value of an investment will fluctuate so that an investor’s shares, when sold or redeemed, may be worth more or less than the original cost. Current performance data may be higher or lower than actual data quoted. For the most current month-end performance data, please call 1-877-421-5078.
The Vulcan Value Partners Fund is a new fund with limited operating history. The table does not reflect the deduction of taxes that a shareholder would pay on Fund distributions or the redemption of Fund shares.
Subject to investment risks, including possible loss of the principal amount invested.
| * | Fund Inception date of 12/30/09. |
| ** | The gross and net expense ratios are as stated in the “Fees and Expenses of the Fund” in the Fund’s current prospectus. |
| *** | Vulcan Value Partners, LLC (“Vulcan” or the “Adviser”) has given a contractual agreement to the Fund that to the extent the Total Annual Fund Operating Expenses (as defined in Item 3 of Form N-1A) with respect to the Fund (exclusive of Acquired Fund Fees and Expenses (if any), brokerage expenses, interest expense, taxes and extraordinary expenses) (“Designated Annual Fund Operating Expenses”) exceed 1.50% of the Fund’s average daily net assets for a particular fiscal year of the Fund, the Adviser will reduce the Management Fee and/or Other Expenses otherwise payable to the Adviser with respect to the Fund for the fiscal year by an amount equal to such excess, and/or the Adviser shall reimburse the Fund by the amount of such excess. This agreement is in effect through August 31, 2011 and will be reevaluated on an annual basis thereafter. Without this agreement, expenses could be higher. If the Adviser foregoes any fees and/or reimburses the Fund pursuant to this letter agreement with respect to a particular fiscal year, then the Adviser shall be entitled to recover from the Fund the amount foregone or reimbursed to the extent Designated Annual Fund Operating Expenses are less than 1.50% of the Fund’s average daily net assets during any fiscal year following such fiscal year. |
Performance of $10,000 Initial Investment (as of 4/30/2010)
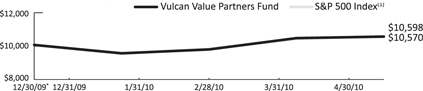
The chart above represents historical performance of a hypothetical investment of $10,000 in the Fund since inception.
| * | Fund Inception date of 12/30/09. |
| (1) | The S&P 500 Index is an unmanaged index of 500 common stocks chosen for market size, liquidity and industry group representation. It is a market-value weighted index. The S&P 500 Index figures do not reflect any fees, expenses or taxes. Investors cannot invest directly in this index. |
| | |
| 4 | | 1-877-421-5078 | www.vulcanvaluepartners.com |
Disclosure of Fund Expenses
April 30, 2010 (Unaudited)
As a shareholder of the Vulcan Value Partners Fund (the “Fund”), you will incur two types of costs: (1) transaction costs, including applicable redemptions fees; and (2) ongoing costs, including management fees and other Fund expenses. The following examples are intended to help you understand your ongoing costs (in dollars) of investing in the Fund and to compare these costs with the ongoing costs of investing in other mutual funds. The examples are based on an investment of $1,000 invested on December 30, 2009 and held until April 30, 2010.
Actual Expenses. The first line of each table below provides information about actual account values and actual expenses. You may use the information in this line, together with the amount you invested, to estimate the expenses that you paid over the period. Simply divide your account value by $1,000 (for example, an $8,600 account value divided by $1,000 = 8.6), then multiply the result by the number in the first line under the heading “Expenses Paid During Period” to estimate the expenses you paid on your account during this period.
Hypothetical Example for Comparison Purposes. The second line of the each table below provides information about hypothetical account values and hypothetical expenses based on the Fund’s actual expense ratio and an assumed rate of return of 5% per year before expenses, which is not the Fund’s actual return. The hypothetical account values and expenses may not be used to estimate the actual ending account balance or expenses you paid for the period. You may use this information to compare the ongoing costs of investing in the Fund and other mutual funds. To do so, compare this 5% hypothetical example with the 5% hypothetical examples that appear in the shareholder reports of the other funds. The expenses shown in the table are meant to highlight ongoing Fund costs only and do not reflect transaction fees, such as redemption fees or exchange fees. Therefore, the second line of each table below is useful in comparing ongoing costs only, and may not help you determine the relative total costs of owning different funds. In addition, if these transactional costs were included, your costs would have been higher.
The examples are based on an investment of $1,000 invested on December 30, 2009 and held until April 30, 2010.
Vulcan Value Partners Fund
| | | | | | | | | | | |
| | | Beginning Account
Value at 12/30/09 | | Ending Account
Value at 4/30/10 | | Expense Ratio(a) | | Expense Paid
During Period(b)
12/30/09 to 4/30/10 |
Actual Fund Return | | $ | 1,000.00 | | $ | 1,057.00 | | 1.50% | | $ | 5.11 |
Hypothetical Fund Return | | $ | 1,000.00 | | $ | 1,011.60 | | 1.50% | | $ | 7.48 |
| (a) | Vulcan Value Partners Fund commenced operations on December 30, 2009. The Fund’s expense ratios have been annualized for the period December 30, 2009 through April 30, 2010. |
| (b) | Expenses are equal to the Fund’s annualized expense ratio, multiplied by the average account value over the period, multiplied by the number of days in the most recent fiscal half-year (122)/365. |
| | |
| Annual Report | April 30, 2010 | | 5 |
| | |
Statement of Investments | | Vulcan Value Partners Fund |
April 30, 2010
| | | | | |
| | | Shares | | Value (Note 1) |
COMMON STOCKS (99.01%) | | | | | |
Communications (31.60%) | | | | | |
Internet (5.97%) | | | | | |
Google, Inc., Class A(a) | | 1,455 | | $ | 764,515 |
| | | | | |
| | |
Media (25.63%) | | | | | |
Comcast Corp. | | 30,687 | | | 578,450 |
DIRECTV(a) | | 21,186 | | | 767,569 |
Discovery Communications, Inc.(a) | | 15,483 | | | 599,192 |
Time Warner Cable, Inc. | | 10,159 | | | 571,444 |
The Walt Disney Co. | | 20,799 | | | 766,235 |
| | | | | |
| | | | | 3,282,890 |
| | | | | |
| | |
TOTAL COMMUNICATIONS | | | | | 4,047,405 |
| | | | | |
| | |
Consumer, Cyclical (6.39%) | | | | | |
Home Furnishings (3.47%) | | | | | |
Whirlpool Corp. | | 4,077 | | | 443,863 |
| | | | | |
| | |
Leisure Time (2.92%) | | | | | |
Harley-Davidson, Inc. | | 11,059 | | | 374,126 |
| | | | | |
| | |
TOTAL CONSUMER, CYCLICAL | | | | | 817,989 |
| | | | | |
| | |
Consumer, Non-Cyclical (38.75%) | | | | | |
Beverages (11.38%) | | | | | |
The Coca-Cola Co. | | 10,804 | | | 577,473 |
Diageo PLC | | 8,411 | | | 573,125 |
Dr Pepper Snapple Group, Inc. | | 9,390 | | | 307,335 |
| | | | | |
| | | | | 1,457,933 |
| | | | | |
| | |
Commercial Services (6.36%) | | | | | |
Mastercard, Inc. | | 3,284 | | | 814,563 |
| | | | | |
| | |
Cosmetics & Personal Care (2.52%) | | | | | |
The Procter & Gamble Co. | | 5,186 | | | 322,362 |
| | | | | |
| | |
Healthcare-Products (6.95%) | | | | | |
Baxter International, Inc. | | 6,689 | | | 315,855 |
Johnson & Johnson | | 8,931 | | | 574,263 |
| | | | | |
| | | | | 890,118 |
| | | | | |
| | |
Household Products & Wares (5.47%) | | | | | |
Church & Dwight Co., Inc. | | 4,688 | | | 324,644 |
Fortune Brands, Inc. | | 7,168 | | | 375,747 |
| | | | | |
| | | | | 700,391 |
| | | | | |
| | |
Pharmaceuticals (6.07%) | | | | | |
Teva Pharmaceutical Industries, Ltd. | | 13,231 | | | 777,057 |
| | | | | |
| | |
TOTAL CONSUMER, NON-CYCLICAL | | | | | 4,962,424 |
| | | | | |
| | |
Financial (8.95%) | | | | | |
Insurance (8.95%) | | | | | |
Chubb Corp. | | 10,916 | | | 577,129 |
Everest Re Group, Ltd. | | 7,425 | | | 569,126 |
| | | | | |
| | | | | 1,146,255 |
| | | | | |
| | |
| 6 | | 1-877-421-5078 | www.vulcanvaluepartners.com |
| | |
| Vulcan Value Partners Fund | | Statement of Investments |
April 30, 2010
| | | | | | | |
| | | | | Shares | | Value (Note 1) |
TOTAL FINANCIAL | | | | | | $ | 1,146,255 |
| | | | | | | |
| | | |
Technology (13.32%) | | | | | | | |
Computers (8.86%) | | | | | | | |
Dell, Inc.(a) | | | | 34,871 | | | 564,213 |
Hewlett-Packard Co. | | | | 10,980 | | | 570,630 |
| | | | | | | |
| | | | | | | 1,134,843 |
| | | | | | | |
| | | |
Software (4.46%) | | | | | | | |
Microsoft Corp. | | | | 18,727 | | | 571,923 |
| | | | | | | |
| | | |
TOTAL TECHNOLOGY | | | | | | | 1,706,766 |
| | | | | | | |
| | | |
TOTAL COMMON STOCKS (Cost $11,780,682) | | | | | | | 12,680,839 |
| | | | | | | |
| | | |
| | | 7-Day Yield | | Shares | | Value (Note 1) |
SHORT TERM INVESTMENTS (1.87%) | | | | | | | |
Money Market Fund (1.87%) | | | | | | | |
Dreyfus Treasury Prime Cash Management
Fund, Institutional Shares | | 0.00004% | | 239,144 | | | 239,144 |
| | | | | | | |
| | | |
TOTAL SHORT TERM INVESTMENTS (Cost $239,144) | | | | | | | 239,144 |
| | | | | | | |
| | | |
TOTAL INVESTMENTS (100.88%) (Cost $12,019,826) | | | | | | $ | 12,919,983 |
| | | |
LIABILITIES IN EXCESS OF OTHER ASSETS (-0.88%) | | | | | | | (112,896) |
| | | | | | | |
| | | |
NET ASSETS (100.00%) | | | | | | $ | 12,807,087 |
| | | | | | | |
| (a) | Non-Income Producing Security. |
See Accompanying Notes to Financial Statements.
Industry Allocation (as a % of Net Assets)
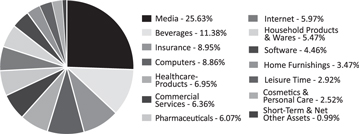
For Fund compliance purposes, the Fund’s industry classifications refer to any one or more of the industry sub-classifications used by one or more widely recognized market indexes or ratings group indexes, and/or as defined by Fund management. This definition may not apply for purposes of this report, which may combine industry subclassifications for reporting ease. Industries are shown as a percent of net assets. These industry classifications are based on third-party definitions. The definitions are industry terms and do not reflect the legal status of any of the investments or the companies in which the Fund has invested.
| | |
| Annual Report | April 30, 2010 | | 7 |
Fund Overview
April 30, 2010 (Unaudited)
VULCAN VALUE PARTNERS SMALL CAP FUND
Cumulative Total Returns (as of 4/30/2010)
| | | | | | | | | | |
| | | | | | | | | Expense Ratios** |
| | | 1 month | | 3 month | | Since Inception* | | Gross | | Net*** |
Vulcan Value Partners Small Cap Fund | | 4.32% | | 21.34% | | 16.00% | | 2.34% | | 1.50% |
Russell 2000 Index(1) | | 5.66% | | 19.41% | | 13.56% | | | | |
Performance data quoted represents past performance. Past performance does not guarantee future results. Investment return and principal value of an investment will fluctuate so that an investor’s shares, when sold or redeemed, may be worth more or less than the original cost. Current performance data may be higher or lower than actual data quoted. For the most current month-end performance data, please call 1-877-421-5078.
The Vulcan Value Partners Small Cap Fund is a new fund with limited operating history. The table does not reflect the deduction of taxes that a shareholder would pay on Fund distributions or the redemption of Fund shares.
Subject to investment risks, including possible loss of the principal amount invested.
| * | Fund Inception date of 12/30/09. |
| ** | The gross and net expense ratios are as stated in the “Fees and Expenses of the Fund” in the Fund’s current prospectus. |
| *** | Vulcan Value Partners, LLC (“Vulcan” or the “Adviser”) has given a contractual agreement to the Fund that to the extent the Total Annual Fund Operating Expenses (as defined in Item 3 of Form N-1A) with respect to the Fund (exclusive of Acquired Fund Fees and Expenses (if any), brokerage expenses, interest expense, taxes and extraordinary expenses) (“Designated Annual Fund Operating Expenses”) exceed 1.50% of such Fund’s average daily net assets for a particular fiscal year of the Fund, the Adviser will reduce the Management Fee and/or Other Expenses otherwise payable to the Adviser with respect to the Fund for such fiscal year by an amount equal to such excess, and/or the Adviser shall reimburse the Fund by the amount of such excess. This agreement is in effect through August 31, 2011 and will be reevaluated on an annual basis thereafter. Without this agreement, expenses could be higher. If the Adviser foregoes any fees and/or reimburses the Fund pursuant to this letter agreement with respect to a particular fiscal year, then the Adviser shall be entitled to recover from the Fund the amount foregone or reimbursed to the extent Designated Annual Fund Operating Expenses are less than 1.50% of the Fund’s average daily net assets during any fiscal year following such fiscal year. |
Performance of $10,000 Initial Investment (as of 4/30/2010)
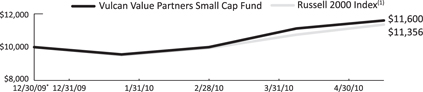
The chart above represents historical performance of a hypothetical investment of $10,000 in the Fund since inception.
| * | Fund Inception date of 12/30/09. |
| (1) | The Russell 2000 Index includes the 2000 firms from the Russell 3000 Index with the smallest market capitalizations. The Russell 2000 Index figures do not reflect any fees, expenses or taxes. Investors cannot invest directly in this index. |
| | |
| 8 | | 1-877-421-5078 | www.vulcanvaluepartners.com |
Disclosure of Fund Expenses
April 30, 2010 (Unaudited)
As a shareholder of the Vulcan Value Partners Small Cap Fund (the “Fund”), you will incur two types of costs: (1) transaction costs, including applicable redemptions fees; and (2) ongoing costs, including management fees and other Fund expenses. The following examples are intended to help you understand your ongoing costs (in dollars) of investing in the Fund and to compare these costs with the ongoing costs of investing in other mutual funds. The examples are based on an investment of $1,000 invested on December 30, 2009 and held until April 30, 2010.
Actual Expenses. The first line of each table below provides information about actual account values and actual expenses. You may use the information in this line, together with the amount you invested, to estimate the expenses that you paid over the period. Simply divide your account value by $1,000 (for example, an $8,600 account value divided by $1,000 = 8.6), then multiply the result by the number in the first line under the heading “Expenses Paid During Period” to estimate the expenses you paid on your account during this period.
Hypothetical Example for Comparison Purposes. The second line of the each table below provides information about hypothetical account values and hypothetical expenses based on the Fund’s actual expense ratio and an assumed rate of return of 5% per year before expenses, which is not the Fund’s actual return. The hypothetical account values and expenses may not be used to estimate the actual ending account balance or expenses you paid for the period. You may use this information to compare the ongoing costs of investing in the Fund and other mutual funds. To do so, compare this 5% hypothetical example with the 5% hypothetical examples that appear in the shareholder reports of the other funds. The expenses shown in the table are meant to highlight ongoing Fund costs only and do not reflect transaction fees, such as redemption fees or exchange fees. Therefore, the second line of each table below is useful in comparing ongoing costs only, and may not help you determine the relative total costs of owning different funds. In addition, if these transactional costs were included, your costs would have been higher.
The examples are based on an investment of $1,000 invested on December 30, 2009 and held until April 30, 2010.
Vulcan Value Partners Small-Cap Fund
| | | | | | | | | | | |
| | | Beginning Account
Value at 12/30/09 | | Ending Account
Value at 4/30/10 | | Expense Ratio(a) | | Expense Paid
During Period(b)
12/30/09 to 4/30/10 |
Actual Fund Return | | $ | 1,000.00 | | $ | 1,160.00 | | 1.50% | | $ | 5.37 |
Hypothetical Fund Return | | $ | 1,000.00 | | $ | 1,011.60 | | 1.50% | | $ | 7.48 |
| (a) | Vulcan Value Partners Small Cap Fund commenced operations on December 30, 2009. The Fund’s expense ratios have been annualized for the period December 30, 2009 through April 30,2010. |
| (b) | Expenses are equal to the Fund’s annualized expense ratio, multiplied by the average account value over the period, multiplied by the number of days in the most recent fiscal half-year (122)/365. |
| | |
| Annual Report | April 30, 2010 | | 9 |
| | |
Statement of Investments | | Vulcan Value Partners Small Cap Fund |
April 30, 2010
| | | | | |
| | | Shares | | Value (Note 1) |
COMMON STOCKS (98.64%) | | | | | |
Communications (7.31%) | | | | | |
Media (7.31%) | | | | | |
Discovery Communications, Inc.(a) | | 13,644 | | $ | 528,023 |
| | | | | |
| | |
TOTAL COMMUNICATIONS | | | | | 528,023 |
| | | | | |
| | |
Consumer, Cyclical (25.15%) | | | | | |
Entertainment (3.46%) | | | | | |
Speedway Motorsports, Inc. | | 15,393 | | | 250,136 |
| | | | | |
| | |
Leisure Time (4.40%) | | | | | |
Harley-Davidson, Inc. | | 9,398 | | | 317,934 |
| | | | | |
| | |
Retail (17.29%) | | | | | |
Darden Restaurants, Inc. | | 2,378 | | | 106,416 |
JOS A Bank Clothiers, Inc.(a) | | 6,807 | | | 414,274 |
Nathan’s Famous, Inc.(a) | | 19,172 | | | 300,617 |
Sonic Corp.(a) | | 36,547 | | | 427,965 |
| | | | | |
| | | | | 1,249,272 |
| | | | | |
| | |
TOTAL CONSUMER, CYCLICAL | | | | | 1,817,342 |
| | | | | |
| | |
Consumer, Non-Cyclical (17.60%) | | | | | |
Beverages (3.86%) | | | | | |
Dr Pepper Snapple Group, Inc. | | 8,512 | | | 278,598 |
| | | | | |
| | |
Commercial Services (13.74%) | | | | | |
Global Payments, Inc. | | 4,127 | | | 176,677 |
Heartland Payment Systems, Inc. | | 17,051 | | | 313,397 |
Towers Watson & Co. | | 6,795 | | | 326,160 |
The Washington Post Co. | | 348 | | | 176,492 |
| | | | | |
| | | | | 992,726 |
| | | | | |
| | |
TOTAL CONSUMER, NON-CYCLICAL | | | | | 1,271,324 |
| | | | | |
| | |
Financial (28.84%) | | | | | |
Diversified Financial Services (11.89%) | | | | | |
Investment Technology Group, Inc.(a) | | 25,190 | | | 437,550 |
The NASDAQ OMX Group, Inc.(a) | | 20,081 | | | 421,701 |
| | | | | |
| | | | | 859,251 |
| | | | | |
| | |
Insurance (16.95%) | | | | | |
Arthur J Gallagher & Co. | | 11,008 | | | 289,180 |
Brown & Brown, Inc. | | 7,219 | | | 145,391 |
Everest Re Group, Ltd. | | 5,609 | | | 429,931 |
Markel Corp.(a) | | 379 | | | 145,096 |
ProAssurance Corp.(a) | | 3,532 | | | 215,275 |
| | | | | |
| | | | | 1,224,873 |
| | | | | |
| | |
TOTAL FINANCIAL | | | | | 2,084,124 |
| | | | | |
| | |
Industrial (11.87%) | | | | | |
Hand & Machine Tools (2.96%) | | | | | |
Lincoln Electric Holdings, Inc. | | 3,563 | | | 213,566 |
| | | | | |
| | |
Miscellaneous Manufacturers (4.59%) | | | | | |
Donaldson Co., Inc. | | 7,161 | | | 331,554 |
| | | | | |
| | |
| 10 | | 1-877-421-5078 | www.vulcanvaluepartners.com |
| | |
Vulcan Value Partners Small Cap Fund | | Statement of Investments |
| | | | | | | |
| | | | | Shares | | Value (Note 1) |
Transportation (4.32%) | | | | | | | |
Pacer International, Inc.(a) | | | | 47,056 | | $ | 312,452 |
| | | | | | | |
| | | |
TOTAL INDUSTRIAL | | | | | | | 857,572 |
| | | | | | | |
| | | |
Technology (7.87%) | | | | 11,337 | | | 289,320 |
| | | | | | | |
Computers (4.01%) | | | | | | | |
Jack Henry & Associates, Inc. | | | | | | | |
| | | |
Software (3.86%) | | | | 13,248 | | | 279,003 |
| | | | | | | |
Fair Isaac Corp. | | | | | | | |
| | | |
TOTAL TECHNOLOGY | | | | | | | 568,323 |
| | | | | | | |
| | | |
TOTAL COMMON STOCKS
(Cost $6,436,199) | | | | | | | 7,126,708 |
| | | | | | | |
| | | |
| | | 7-Day Yield | | Shares | | Value (Note 1) |
| | | |
SHORT TERM INVESTMENTS (7.60%) | | | | | | | |
Money Market Fund (7.60%) | | | | | | | |
Dreyfus Treasury Prime Cash Management Fund, Institutional Shares | | 0.00004% | | 548,877 | | | 548,877 |
| | | | | | | |
| | | |
TOTAL SHORT TERM INVESTMENTS
(Cost $548,877) | | | | | | | 548,877 |
| | | | | | | |
| | | |
TOTAL INVESTMENTS (106.24%)
(Cost $6,985,076) | | | | | | $ | 7,675,585 |
| | | |
Liabilities In Excess Of Other Assets (-6.24%) | | | | | | | (450,441) |
| | | | | �� | | |
| | | |
NET ASSETS (100.00%) | | | | | | $ | 7,225,144 |
| | | | | | | |
| (a) | Non-Income Producing Security. |
See Accompanying Notes to Financial Statements.
Industry Allocation (as a % of Net Assets)
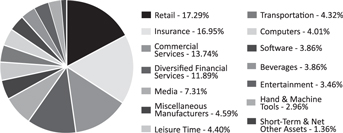
For Fund compliance purposes, the Fund’s industry classifications refer to any one or more of the industry sub-classifications used by one or more widely recognized market indexes or ratings group indexes, and/or as defined by Fund management. This definition may not apply for purposes of this report, which may combine industry subclassifications for reporting ease. Industries are shown as a percent of net assets. These industry classifications are based on third-party definitions. The definitions are industry terms and do not reflect the legal status of any of the investments or the companies in which the Fund has invested.
| | |
| Annual Report | April 30, 2010 | | 11 |
Statements of Assets and Liabilities
April 30, 2010
| | | | | | |
| | | Vulcan Value Partners Fund | | Vulcan Value Partners Small Cap Fund |
ASSETS: | | | | | | |
Investments, at value | | $ | 12,919,983 | | $ | 7,675,585 |
Receivable for investments sold | | | 532,220 | | | 192,463 |
Receivable for shares sold | | | 67,031 | | | 48,500 |
Dividends receivable | | | 2,912 | | | 1,292 |
Receivable due from advisor | | | 2,092 | | | 83 |
Other assets | | | 27,886 | | | 28,047 |
Total assets | | | 13,552,124 | | | 7,945,970 |
| | |
LIABILITIES: | | | | | | |
Payable for investments purchased | | | 706,783 | | | 689,366 |
Payable for administration fees | | | 11,516 | | | 6,230 |
Payable for transfer agency fees | | | 3,596 | | | 2,931 |
Payable to trustees | | | 999 | | | 537 |
Payable for principal financial officer fees | | | 394 | | | 394 |
Accrued expenses and other liabilities | | | 21,749 | | | 21,368 |
Total liabilities | | | 745,037 | | | 720,826 |
| |
NET ASSETS | | $ | 12,807,087 | | $ | 7,225,144 |
| |
| | |
NET ASSETS CONSIST OF: | | | | | | |
| | |
Paid-in capital | | $ | 11,905,086 | | $ | 6,204,485 |
Accumulated net investment gain | | | 3,496 | | | 0 |
Accumulated net realized gain/(loss) on investments | | | (1,652) | | | 330,150 |
Net unrealized appreciation in value of investments | | | 900,157 | | | 690,509 |
NET ASSETS | | $ | 12,807,087 | | $ | 7,225,144 |
| |
| | |
INVESTMENTS, AT COST | | $ | 12,019,826 | | $ | 6,985,076 |
| | |
PRICING OF SHARES: | | | | | | |
Net Asset Value, offering and redemption price per share | | $ | 10.57 | | $ | 11.60 |
Shares of beneficial interest outstanding (unlimited number of shares,
no par value common stock authorized) | | | 1,212,125 | | | 622,805 |
See Accompanying Notes to Financial Statements.
| | |
| 12 | | 1-877-421-5078 | www.vulcanvaluepartners.com |
Statements of Operations
For the Period December 30, 2009 (Inception) to April 30, 2010
| | | | | | | | |
| | | Vulcan Value Partners Fund | | | | Vulcan Value
Partners Small Cap Fund |
INVESTMENT INCOME: | | | | | | | | |
Dividends | | $ | 35,365 | | | | $ | 12,153 |
Foreign taxes withheld | | | (188) | | | | | – |
Total income | | | 35,177 | | | | | 12,153 |
| | | |
EXPENSES: | | | | | | | | |
Investment advisory fees | | | 24,432 | | | | | 16,371 |
Administration fees | | | 42,135 | | | | | 28,393 |
Transfer agency fees | | | 11,236 | | | | | 9,873 |
Legal and audit fees | | | 19,166 | | | | | 18,104 |
Offering cost | | | 13,146 | | | | | 13,146 |
Custodian fees | | | 4,000 | | | | | 4,000 |
Principal financial officer fees | | | 1,644 | | | | | 1,644 |
Trustees’ fees and expenses | | | 1,169 | | | | | 630 |
Other | | | 4,506 | | | | | 3,604 |
Total expenses before waiver | | | 121,434 | | | | | 95,765 |
Less fees waived/reimbursed by investment advisor | | | (84,786) | | | | | (76,119) |
Total net expenses | | | 36,648 | | | | | 19,646 |
NET INVESTMENT LOSS | | | (1,471) | | | | | (7,493) |
| | | |
Net realized gain/(loss)on investments | | | (1,652) | | | | | 334,390 |
Net change in unrealized appreciation of investments | | | 900,157 | | | | | 690,509 |
NET REALIZED AND UNREALIZED GAIN ON INVESTMENTS | | | 898,505 | | | | | 1,024,899 |
NET INCREASE IN NET ASSETS RESULTING FROM OPERATIONS | | $ | 897,034 | | | | $ | 1,017,406 |
| | | | | | | | | |
See Accompanying Notes to Financial Statements.
| | |
| Annual Report | April 30, 2010 | | 13 |
Statements of Changes in Net Assets
For the Period December 30, 2009 (Inception) to April 30, 2010
| | | | | | | | |
| | | Vulcan Value
Partners Fund | | | | Vulcan Value
Partners Small Cap Fund |
OPERATIONS: | | | | | | | | |
Net investment loss | | $ | (1,471) | | | | $ | (7,493) |
Net realized gain/(loss) on investments | | | (1,652) | | | | | 334,390 |
Net change in unrealized appreciation on investments | | | 900,157 | | | | | 690,509 |
Net increase in net assets resulting from operations | | | 897,034 | | | | | 1,017,406 |
| | | |
SHARE TRANSACTIONS: (NOTE 3) | | | | | | | | |
Proceeds from sales of shares | | | 12,180,711 | | | | | 6,207,738 |
Cost of shares redeemed, net of redemption fees | | | (270,658) | | | | | – |
Net Increase from share transactions | | | 11,910,053 | | | | | 6,207,738 |
| | | |
Net increase in net assets | | | 12,807,087 | | | | | 7,225,144 |
| | | |
NET ASSETS: | | | | | | | | |
Beginning of period | | | – | | | | | – |
End of period(including accumulated net investment gain of $3,496 and $0, respectively) | | $ | 12,807,087 | | | | $ | 7,225,144 |
| | | | | | | | | |
See Accompanying Notes to Financial Statements.
| | |
| 14 | | 1-877-421-5078 | www.vulcanvaluepartners.com |
| | |
| Vulcan Value Partners Fund | | Financial Highlights |
For a share outstanding throughout the period presented. |
| | | |
| | | For the Period December 30, 2009 (Inception) to April 30, 2010 |
NET ASSET VALUE, BEGINNING OF PERIOD | | $ | 10.00 |
INCOME/(LOSS) FROM OPERATIONS: | | | |
Net investment loss | | | 0.00(a) |
Net realized and unrealized gain on investments | | | 0.57 |
Total from investment operations | | | 0.57 |
| |
REDEMPTION FEES ADDED TO PAID IN CAPITAL (NOTE 3) | | | 0.00(a) |
INCREASE IN NET ASSET VALUE | | | 0.57 |
Net asset value, end of period | | $ | 10.57 |
| | | | |
Total Return (b) | | | 5.70% |
| | | | |
| |
RATIOS/SUPPLEMENTAL DATA | | | |
Net assets, end of period (000’s) | | $ | 12,807 |
Ratio of expenses to average net assets including fee waivers/reimbursements | | | 1.50%(c) |
Ratio of expenses to average net assets without fee waivers/reimbursements | | | 4.97%(c) |
Ratio of net investment loss to average net assets including fee waivers/reimbursements | | | (0.06)%(c) |
Portfolio turnover rate | | | 24% |
| (a) | Less than $0.005 per share. |
| (b) | Total return not annualized for periods of less than one full year. |
See Accompanying Notes to Financial Statements.
| | |
| Annual Report | April 30, 2010 | | 15 |
For a share outstanding throughout the period presented.
| | | |
| | | For the Period December 30, 2009 (Inception) to April 30, 2010 |
NET ASSET VALUE, BEGINNING OF PERIOD | | $ | 10.00 |
INCOME/(LOSS) FROM OPERATIONS: | | | |
Net investment loss | | | – |
Net realized and unrealized gain on investments | | | 1.60 |
Total from investment operations | | | 1.60 |
| |
REDEMPTION FEES ADDED TO PAID IN CAPITAL (NOTE 3) | | | – |
INCREASE IN NET ASSET VALUE | | | 1.60 |
Net asset value, end of period | | $ | 11.60 |
| | | | |
Total Return (a) | | | 16.00% |
| | | | |
| |
RATIOS/SUPPLEMENTAL DATA | | | |
Net assets, end of period (000’s) | | $ | 7,225 |
Ratio of expenses to average net assets including fee waivers/reimbursements | | | 1.50%(b) |
Ratio of expenses to average net assets without fee waivers/reimbursements | | | 7.31%(b) |
Ratio of net investment loss to average net assets including fee waivers/reimbursements | | | (0.57)%(b) |
Portfolio turnover rate | | | 33% |
| (a) | Total return not annualized for periods of less than one full year. |
See Accompanying Notes to Financial Statements.
| | |
| 16 | | 1-877-421-5078 | www.vulcanvaluepartners.com |
Notes to Financial Statements
April 30, 2010
1. ORGANIZATION AND SIGNIFICANT ACCOUNTING POLICIES
Financial Investors Trust (the “Trust”) was organized as a Delaware statutory trust on November 30, 1993, and registered as an open-end management investment company under the Investment Company Act of 1940, as amended (“1940 Act”). Vulcan Value Partners Fund and Vulcan Value Partners Small Cap Fund (the “Funds”) represent two of six separate series offered to the public under the Trust as of April 30, 2010. Each Fund commenced operations on December 30, 2009. Each Fund has one class of shares. Each Fund seeks to achieve long-term capital appreciation.
The following is a summary of significant accounting policies consistently followed by each Fund in the preparation of its financial statements. The policies are in conformity with accounting principles generally accepted in the United States of America.
Investment Valuation: The Board of Trustees (“Board” or “Trustees”) of the Trust has approved procedures to be used to value each Fund’s securities for the purposes of determining each Fund’s net asset value (“NAV”). The valuation of the securities of the Funds is determined in good faith by or under the direction of the Board. The Board has delegated certain valuation functions for the Funds to ALPS Fund Services, Inc. (“ALPS” or the “Administrator”).
Each Fund generally values its securities based on market prices determined at the close of regular trading on the NYSE (normally, 4:00 p.m. Eastern time) on each business day (Monday through Friday). Neither Fund values its securities on any day that the NYSE is closed, including the following observed holidays: New Year’s Day, Martin Luther King, Jr. Day, Presidents’ Day, Good Friday, Memorial Day, Independence Day, Labor Day, Thanksgiving Day and Christmas Day, and the preceding Friday or subsequent Monday when one of those holidays falls on a Saturday or Sunday, respectively.
Each Fund’s currency valuations, if any, are done as of the close of regularly scheduled trading on the NYSE (normally at 4:00 p.m. Eastern time). For equity securities that are traded on an exchange, the market price is usually the closing sale or official closing price on that exchange. In the case of securities not traded on an exchange, or if such closing prices are not otherwise available, the market price is typically determined by independent third party pricing vendors approved by the Board using a variety of pricing techniques and methodologies. The market price for debt obligations is generally the price supplied by an independent third-party pricing service approved by the Board, which may use a matrix, formula or other objective method that takes into consideration market indices, yield curves and other specific adjustments. Short-term debt obligations that will mature in 60 days or less are valued at amortized cost, unless it is determined that using this method would not reflect an investment’s fair value. If vendors are unable to supply a price, or if the price supplied is deemed to be unreliable, the market price may be determined using quotations received from one or more brokers/dealers that make a market in the security. Investments in other funds are calculated to their respective net asset values as determined by those funds in accordance with the 1940 Act.
When such prices or quotations are not available, or when Vulcan Value Partners, LLC (“Vulcan” or “Adviser”) believes that they are unreliable, securities may be priced using fair value procedures approved by the Board. Because the Funds may invest in securities that may be thinly traded or for which market quotations may not be readily available or may be unreliable (such as securities of small capitalization companies), the Funds may use fair valuation procedures more frequently than funds that invest primarily in securities that are more liquid (such as equity securities of large capitalization domestic issuers). The Funds may also use fair value procedures if the Adviser determines that a significant event has occurred between the time at which a market price is determined and the time at which each Fund’s NAV is calculated. In particular, the value of non-U.S. securities may be materially affected by events occurring after the close of the market on which they are traded, but before each Fund prices its shares.
| | |
| Annual Report | April 30, 2010 | | 17 |
Notes to Financial Statements
April 30, 2010
The Funds may determine the fair value of investments based on information provided by pricing services and other third-party vendors, which may recommend fair value prices or adjustments with reference to other securities, indices or assets. In considering whether fair value pricing is required and in determining fair values, the Funds may, among other things, consider significant events (which may be considered to include changes in the value of U.S. securities or securities indices) that occur after the close of the relevant market and before each Fund values its securities. In addition, the Funds may utilize modeling tools provided by third-party vendors to determine fair values of non-U.S. securities. The Funds’ use of fair value pricing may help deter “stale price arbitrage.”
Valuing securities at fair value involves greater reliance on judgment than valuation of securities based on readily available market quotations. A fund that uses fair value to price securities may value those securities higher or lower than another fund using market quotations or its own fair value methodologies to price the same securities. There can be no assurance that the Funds could obtain the fair value assigned to a security if it were to sell the security at approximately the time at which each Fund determines its net asset value, and the difference between fair value and the price of the securities may be material.
Fair Value Measurements: A three-tier hierarchy has been established to classify fair value measurements for disclosure purposes. Inputs refer broadly to the assumptions that market participants would use in pricing the asset or liability, including assumptions about risk. Inputs may be observable or unobservable. Observable inputs are inputs that reflect the assumptions market participants would use in pricing the asset or liability that are developed based on market data obtained from sources independent of the reporting entity. Unobservable inputs are inputs that reflect the reporting entity’s own assumptions about the assumptions market participants would use in pricing the asset or liability that are developed based on the best information available.
Various inputs are used in determining the value of each Fund’s investments as of the reporting period end. The designated input levels are not necessarily an indication of the risk or liquidity associated with these investments. These inputs are categorized in the following hierarchy under applicable financial accounting standards:
| | ¡ | Level 1 – Unadjusted quoted prices in active markets for identical investments |
| | ¡ | Level 2 – Other significant observable inputs (including quoted prices for similar investments, interest rates, prepayment speeds, credit risk, etc.) |
| | ¡ | Level 3 – Significant unobservable inputs (including the Fund’s own assumptions in determining the fair value of investments) |
| | |
| 18 | | 1-877-421-5078 | www.vulcanvaluepartners.com |
Notes to Financial Statements
April 30, 2010
The following is a summary of the inputs used to value each Fund’s investments as of April 30, 2010.
Vulcan Value Partners Fund:
Assets:
| | | | | | | | | | | | |
Investments in Securities at Value | | Level 1 - Quoted Prices | | Level 2 - Other Significant Observable Inputs | | Level 3 - Significant Unobservable Inputs | | Total |
Common Stocks (a) | | $ | 12,680,839 | | $ | – | | $ | – | | $ | 12,680,839 |
Short Term Investments | | | 239,144 | | | – | | | – | | | 239,144 |
TOTAL | | $ | 12,919,983 | | $ | – | | $ | – | | $ | 12,919,983 |
| | | | | | | | | | | | | |
| | | | | | | | | | | | | |
|
| Vulcan Value Partners Small Cap Fund: |
| | | | |
| Assets: | | | | | | | | | | | | |
| | | | |
Investments in Securities at Value | | Level 1 - Quoted Prices | | Level 2 - Other Significant Observable Inputs | | Level 3 - Significant Unobservable Inputs | | Total |
Common Stocks (a) | | $ | 7,126,708 | | $ | – | | $ | – | | $ | 7,126,708 |
Short Term Investments | | | 548,877 | | | – | | | – | | | 548,877 |
TOTAL | | $ | 7,675,585 | | $ | – | | $ | – | | $ | 7,675,585 |
| | | | | | | | | | | | | |
| | | | | | | | | | | | | |
| (a) | For detailed descriptions of sector and industry, see the accompanying Statement of Investments. |
For the fiscal period ended April 30, 2010, the Funds did not have any significant transfers between Level 1 and Level 2 securities. For the fiscal period ended April 30, 2010, the Funds did not have any securities which used significant unobservable inputs (Level 3) in determining fair value. Therefore, a reconciliation of assets in which significant unobservable inputs (Level 3) were used in determining fair value is not applicable. There were no fair valued securities in the Funds as of April 30, 2010.
Investment Transactions: Investment and shareholder transactions are accounted for on the date the investments are purchased or sold (trade date). Realized gains and losses from investment transactions are reported on an identified cost basis, which is the same basis the Funds use for federal income tax purposes. Interest income, which includes accretion of discounts, is accrued and recorded as earned. Dividend income is recognized on the ex-dividend date or for certain foreign securities, as soon as information is available to the Funds.
Foreign Securities: The Funds may directly purchase securities of foreign issuers. Investing in securities of foreign issuers involves special risks not typically associated with investing in securities of U.S. issuers. The risks include possible reevaluation of currencies, the inability to repatriate foreign currency, less complete financial information about companies and possible future adverse political and economic developments. Moreover, securities of many foreign issuers and their markets may be less liquid and their prices more volatile than those of securities of comparable U.S. issuers.
Foreign Currency Translation: The books and records of the Funds are maintained in U.S. dollars. Investment valuations and other assets and liabilities initially expressed in foreign currencies are converted each business day into U.S. dollars based upon current exchange rates. Prevailing foreign exchange rates may generally be obtained at the close of the NYSE (normally 4:00 p.m. Eastern time). As available and as provided by an appropriate pricing service, translation of foreign security and currency market
| | |
| Annual Report | April 30, 2010 | | 19 |
Notes to Financial Statements
April 30, 2010
values may also occur with the use of foreign exchange rates obtained at approximately 11:00 a.m. Eastern time, which approximates the close of the London Exchange. The portion of unrealized and realized gains or losses on investments due to fluctuations in foreign currency exchange rates are included in net change in unrealized appreciation/depreciation of investments and net realized gain/loss on foreign currency transactions, respectively, on the Statement of Operations, as applicable.
Forward Foreign Currency Transactions: The Funds may engage in currency transactions with counterparties to hedge the value of portfolio securities denominated in particular currencies against fluctuations in relative value, to gain or reduce exposure to certain currencies, or to generate income or gains. All commitments are marked to market daily at the applicable exchange rates and any resulting unrealized gains or losses are recorded in each Fund’s financial statements. The Funds record realized gains or losses at the time a forward contract is offset by entry into a closing transaction or extinguished by delivery of the currency. The Funds did not have forward foreign currency contracts at April 30, 2010.
Expenses: Some expenses of the Trust can be directly attributed to the Funds. Expenses which cannot be directly attributed are apportioned among all Funds in the Trust based on average net assets.
Use of Estimates: Each Fund’s financial statements are prepared in accordance with accounting principles generally accepted in the United States of America. This requires management to make estimates and assumptions that affect (a) the reported amounts of assets and liabilities and disclosure of contingent assets and liabilities at the date of the financial statements, and (b) the reported amounts of increases and decreases in net assets from operations during the reporting period. Actual results could differ from these estimates.
Federal Income Taxes: Each Fund complies with the requirements under Subchapter M of the Internal Revenue Code applicable to regulated investment companies and intend to distribute substantially all of their net taxable income and net capital gains, if any, each year. The Funds are not subject to income taxes to the extent such distributions are made.
During the fiscal period ended April 30, 2010, the Funds did not have a liability for any unrecognized tax benefits in the accompanying financial statements. The Funds file income tax returns in the U.S. federal jurisdiction and the State of Colorado.
Distributions to Shareholders: Each Fund normally pays dividends and distributes capital gains, if any, on an annual basis. Income dividend distributions are derived from interest and other income each Fund receives from its investments, including distributions of short-term capital gains. Capital gain distributions are derived from gains realized when each Fund sells a security it has owned for more than a year. Each Fund may make additional distributions and dividends at other times if the portfolio manager believes doing so may be necessary for each Fund to avoid or reduce taxes. Net investment income (loss) and net realized gain (loss) may differ for financial statement and tax purposes. The character of distributions made during the year from net investment income or net realized gains may differ from its ultimate characterization for federal income tax purposes. Also, due to the timing of dividend distributions, the fiscal year in which amounts are distributed may differ from the fiscal year in which the income or realized gain were recorded by each Fund.
| | |
| 20 | | 1-877-421-5078 | www.vulcanvaluepartners.com |
Notes to Financial Statements
April 30, 2010
Components of Earnings: At April 30, 2010, permanent differences in book and tax accounting were reclassified. These differences had no effect on net assets and were primarily attributed to stock issuance costs and treatment of net investment loss. The reclassifications were as follows:
| | | | | | |
| | | Vulcan Value
Partners Fund | | Vulcan Value Partners Small Cap Fund |
Decrease Paid In-Capital | | $ | (4,967) | | $ | (3,253) |
Increase Accumulated | | | | | | |
Net Investment Income | | | 4,967 | | | 7,493 |
Decrease Accumulated | | | | | | |
Net Realized Loss | | $ | – | | $ | (4,240) |
As of April 30, 2010, the components of distributable earnings on a tax basis were as follows:
| | | | | | |
| | | Vulcan Value
Partners Fund | | Vulcan Value Partners Small Cap Fund |
Undistributed ordinary income | | $ | 115,890 | | $ | 252,414 |
Accumulated net realized gain/(loss) | | | (37,891) | | | 80,126 |
Unrealized Appreciation | | | 824,002 | | | 688,119 |
Total | | $ | 902,001 | | $ | 1,020,659 |
The differences between book-basis and tax-basis are primarily due to the deferral of post October losses and wash sale losses.
As of April 30, 2010, the cost of securities on a tax basis and gross unrealized appreciation (depreciation) on investments for federal income tax purposes were as follows:
| | | | | | |
| | | Vulcan Value
Partners Fund | | Vulcan Value Partners Small Cap Fund |
Gross appreciation (excess of value over tax cost) | | $ | 1,004,098 | | $ | 850,507 |
Gross depreciation (excess of tax cost over value) | | | (180,096) | | | (162,388) |
Net unrealized appreciation | | $ | 824,002 | | | 688,119 |
Cost of investments for income tax purposes | | $ | 12,095,981 | | $ | 6,987,466 |
| | | | | | | |
| | | | | | | |
Post October Loss: Under current tax law, capital and currency losses realized after October 31 may be deferred and treated as occurring on the first day of the following fiscal year. For the fiscal period ended April 30, 2010, the Funds elected to defer losses occurring between December 30, 2009 and April 30, 2010 in the amounts of $37,891 for the Vulcan Value Partners Fund.
2. SECURITIES TRANSACTIONS
The cost of purchases and proceeds from sales of securities (excluding short-term securities) during the fiscal period ended April 30, 2010, was as follows:
| | | | | | |
| Fund | | Purchases of
Securities | | Proceeds from
Sales of Securities |
Vulcan Value Partners Fund | | $ | 12,533,219 | | $ | 1,756,440 |
Vulcan Value Partners Small Cap Fund | | $ | 6,495,539 | | $ | 1,292,706 |
| | |
| Annual Report | April 30, 2010 | | 21 |
Notes to Financial Statements
April 30, 2010
3. CAPITAL SHARE TRANSACTIONS
Shares redeemed within 90 days of purchase may incur a 2% short-term redemption fee deducted from the redemption amount. The Vulcan Value Partners Fund retained $5,524 for the fiscal period ended April 30, 2010, which is reflected in the “Shares redeemed” in the Statement of Changes in Net Assets. Transactions in shares of capital stock for the fiscal period ended April 30, 2010 were as follows:
Vulcan Value Partners Fund
For the Period December 30, 2009 (Inception) to April 30, 2010
| | | | |
| | | Shares | | |
| |
Shares Sold | | 1,237,792 | | |
Less Shares Redeemed | | (25,667) | | |
| |
Net Increase | | 1,212,125 | | |
| | | | | |
| | | | | |
| |
| Vulcan Value Partners Small Cap Fund | | |
| For the Period December 30, 2009 (Inception) to April 30, 2010 | | |
| | |
| | | Shares | | |
| |
Shares Sold | | 622,805 | | |
Less Shares Redeemed | | – | | |
| |
Net Increase | | 622,805 | | |
| | | | | |
| | | | | |
4. MANAGEMENT AND RELATED-PARTY TRANSACTIONS
Vulcan, subject to the authority of the Board, is responsible for the overall management and administration of the Funds’ business affairs. Vulcan manages the investments of the Funds in accordance with each Fund’s investment objective, policies and limitations and investment guidelines established jointly by the Adviser and the Trustees. Pursuant to the Investment Advisory Agreement (the “Advisory Agreement”), the Funds pays Vulcan an annual management fee of 1.00% and 1.25% for Vulcan Value Partners Fund and Vulcan Value Partners Small Cap Fund, respectively, based on each Fund’s average daily net assets.
Vulcan has contractually agreed with the Funds to limit the amount of each Fund’s total annual expenses (exclusive of distribution and service (12b-1) fees, acquired fund fees and expenses, brokerage expenses, interest expense, taxes and extraordinary expenses) to 1.50% of each Fund’s average daily net assets. This agreement is in effect through August 31, 2011 and is reevaluated on an annual basis. Without this agreement, expenses could be higher. In addition, each Fund’s organizational expenses have been borne by Vulcan. The Adviser will be permitted to recover expenses it has borne through the agreement described above to the extent that each Fund’s expenses in later periods fall below the annual rates set forth in the relevant agreement. The Fund will not be obligated to pay any such deferred fees and expenses more than one year after the end of the fiscal year in which the fee and expense was deferred.
Distributor: ALPS Distributors, Inc. (an affiliate of ALPS) (“ADI” or the “Distributor”) acts as the distributor of each Fund’s shares pursuant to a Distribution Agreement with the Trust. Shares are sold on a continuous basis by ADI as agent for the Funds, and ADI has agreed to use its best efforts to solicit orders for the sale of each Fund’s shares, although it is not obliged to sell any particular amount of shares. ADI is not entitled to any compensation for its services as Distributor. ADI is registered as a broker-dealer with the Securities and Exchange Commission.
| | |
| 22 | | 1-877-421-5078 | www.vulcanvaluepartners.com |
Notes to Financial Statements
April 30, 2010
ALPS (an affiliate of ADI and AAI) serves as administrator to the Funds, and each Fund has agreed to pay expenses incurred in connection with its administrative activities. Pursuant to an Administrative Agreement, ALPS will provide operational services to the Funds including, but not limited to fund accounting and fund administration and generally assist in each Fund’s operations.
The table below provides the administrative fee to be paid by the Funds to ALPS pursuant to the Fund Accounting and Administration Agreement:
Annual Administrative Fee, billed monthly, in the amount of the greater of $210,000 annual minimum or:
| | (i) | | 5.0 basis points of the Funds’ average net assets between $0 - $500 million; and |
| | (ii) | | 3.0 basis points of the Funds’ average net assets between $500 million - $1 billion; and |
| | (iii) | | 2.0 basis points of the Funds’ average net assets over $1 billion. |
Beneficial Ownership: The beneficial ownership, either directly or indirectly, of more than 25% of the voting securities of any class a Fund creates a presumption of control of the Fund under Section 2(a)(9) of the 1940 Act. As of April 30, 2010, Charles Schwab & Co. held approximately 68.32% and 49.92% of the Vulcan Value Partners Fund and the Vulcan Value Partners Small Cap Fund, respectively. Charles Schwab & Co. is believed to hold its shares of the Funds as nominee for the benefit of its clients.
5. SUBSEQUENT EVENTS
Management has evaluated whether any events or transactions occurred subsequent to April 30, 2010 through the date of issuance of the Funds’ financial statements and determined that there were no other material events or transactions that would require recognition or disclosure in the Funds’ financial statements.
6. INDEMNIFICATIONS
Under the Trust’s organizational documents, its officers and Trustees are indemnified against certain liability arising out of the performance of their duties to the Trust. Additionally, in the normal course of business, the Trust enters into contracts with service providers that contain general indemnification clauses. The Trust’s maximum exposure under these arrangements is unknown, as this would involve future claims that may be made against the Trust that have not yet occurred.
| | |
| Annual Report | April 30, 2010 | | 23 |
Report of Independent Registered Public Accounting Firm
To the Shareholders and Board of Trustees of Financial Investors Trust:
We have audited the accompanying statements of assets and liabilities of Vulcan Value Partners Fund and Vulcan Value Partners Small Cap Fund, two of the portfolios of Financial Investors Trust (the “Funds”), including the statement of investments, as of April 30, 2010, and the related statements of operations, the statements of changes in net assets, and the financial highlights for the period from December 30, 2009 (inception) to April 30, 2010. These financial statements and financial highlights are the responsibility of the Funds’ management. Our responsibility is to express an opinion on these financial statements and financial highlights based on our audits.
We conducted our audits in accordance with the standards of the Public Company Accounting Oversight Board (United States). Those standards require that we plan and perform the audit to obtain reasonable assurance about whether the financial statements and financial highlights are free of material misstatement. The Funds are not required to have, nor were we engaged to perform, an audit of its internal control over financial reporting. Our audits included consideration of internal control over financial reporting as a basis for designing audit procedures that are appropriate in the circumstances, but not for the purpose of expressing an opinion on the effectiveness of the Funds’ internal control over financial reporting. Accordingly, we express no such opinion. An audit also includes examining, on a test basis, evidence supporting the amounts and disclosures in the financial statements, assessing the accounting principles used and significant estimates made by management, as well as evaluating the overall financial statement presentation. Our procedures included confirmation of securities owned as of April 30, 2010, by correspondence with the custodian and brokers; where replies were not received from brokers, we performed other auditing procedures. We believe that our audits provide a reasonable basis for our opinion.
In our opinion, the financial statements and financial highlights referred to above present fairly, in all material respects, the financial position of Vulcan Value Partners Fund and Vulcan Value Partners Small Cap Fund as of April 30, 2010, the results of their operations, the changes in their net assets, and their financial highlights for the period from December 30, 2009 (inception) to April 30, 2010, in conformity with accounting principles generally accepted in the United States of America.
|
| /s/ DELOITTE & TOUCHE LLP |
|
| Denver, Colorado |
| June 23, 2010 |
| | |
| 24 | | 1-877-421-5078 | www.vulcanvaluepartners.com |
Additional Information
April 30, 2010 (Unaudited)
1. FUND HOLDINGS
The Funds file their complete schedule of portfolio holdings with the Securities and Exchange Commission (the “SEC”) for the first and third quarters of each fiscal year on Form N-Q within 60 days after the end of the period. Copies of the Funds’ Form N-Q are available without charge on the SEC website at http://www.sec.gov. You may also review and copy the Form N-Q at the SEC’s Public Reference Room in Washington, DC. For more information about the operation of the Public Reference Room, please call the SEC at 1-800-SEC-0330.
2. FUND PROXY VOTING POLICIES, PROCEDURES AND SUMMARIES
Each Fund’s policies and procedures used in determining how to vote proxies and information regarding how the Funds voted proxies relating to portfolio securities during the most recent prior 12-month period ending June 30 will be available without charge, (1) upon request, by calling (866) 759-5679 and (2) on the SEC’s website at http://www.sec.gov.
3. DISCLOSURE REGARDING APPROVAL OF FUND ADVISORY AGREEMENTS
On November 4, 2009, the Trustees met in person to discuss, among other things, the approval of the Investment Advisory Agreement between the Trust and Vulcan for the Funds (“Advisory Agreement”) in accordance with Section 15(c) of the Investment Company Act of 1940, as amended. The Trustees were informed that Vulcan, as the investment adviser, has responsibility for the investment and management of the Funds’ assets and securities. The Independent Trustees met with independent legal counsel during executive session and discussed the Advisory Agreement and other related materials.
In approving the Advisory Agreements, the Trustees, including the Independent Trustees, considered the following factors with respect to the Funds:
Investment Advisory Fee Rate: The Trustees reviewed and considered the contractual annual advisory fee to be paid by the Trust, on behalf of the Funds, to Vulcan of 1.00% of the Vulcan Value Partners Fund’s daily average net assets and 1.25% of the Vulcan Value Partners Small Cap Fund’s daily average net assets, in light of the extent and quality of the advisory services provided by Vulcan to the Funds.
The Trustees considered the information they received comparing each of the Fund’s contractual advisory fees and overall expenses with those of funds in both the relevant expense group and universe of funds provided by Lipper, an independent provider of investment company data.
Based on such information, the Trustees further determined that the contractual annual advisory fees set forth above and the total expense ratio of 1.00% and 1.25% for the Vulcan Value Partners Fund and the Vulcan Value Partners Small Cap Fund, respectively, taking into account the contractual fee waivers in place, is comparable to others within such Fund’s anticipated peer universe.
Nature, Extent and Quality of the Services under the Advisory Agreement: The Trustees received and considered information regarding the nature, extent and quality of services provided to the Funds under the Advisory Agreement. The Trustees reviewed certain background materials supplied by Vulcan in its presentation, including its Form ADV.
| | |
| Annual Report | April 30, 2010 | | 25 |
Additional Information
April 30, 2010 (Unaudited)
The Trustees reviewed and considered Vulcan’s investment advisory personnel, its history as an asset manager, its performance and the amount of assets currently under management by Vulcan. The Trustees also reviewed the research and decision-making processes utilized by Vulcan, including the methods adopted to seek to achieve compliance with the investment objectives, policies and restrictions of the Funds. The Trustees considered the background and experience of Vulcan’s management in connection with the Funds, including reviewing the qualifications, backgrounds and responsibilities of the management team primarily responsible for the day-to-day portfolio management of the Funds and the extent of the resources devoted to research and analysis of actual and potential investments.
The Trustees also reviewed, among other things, Vulcan’s insider trading policies and procedures and a description of its Code of Ethics.
Performance: The Trustees noted that since neither of the Funds had begun operations, there is no fund performance to be reviewed or analyzed at this time, but they noted the performance of the private accounts advised by Vulcan. The Trustees considered Vulcan’s performance and reputation generally and its investment techniques, risk management controls and decision-making processes, taking into account that such performance was not the actual performance of the Funds.
The Adviser’s Profitability: The Trustees received and considered a projected profitability analysis prepared by Vulcan based on the fees payable under the Advisory Agreement. The Trustees considered the profits, if any, anticipated to be realized by Vulcan in connection with the operation of the Funds. The Board then reviewed Vulcan’s financial statements in order to analyze the financial condition and stability and profitability of the adviser.
Economies of Scale: The Trustees considered whether economies of scale in the provision of services to the Funds will be passed along to the shareholders under the proposed agreements.
Other Benefits to the Adviser: The Trustees reviewed and considered any other benefits derived or to be derived by Vulcan from its relationship with the Funds, including soft dollar arrangements.
In selecting Vulcan as the Funds’ investment adviser and approving the Advisory Agreement and the fees charged under this agreement, the Trustees concluded that no single factor reviewed by the Trustees was identified by the Trustees to be determinative as the principal factor in whether to approve the Advisory Agreement. Further, the Independent Trustees were advised by separate independent legal counsel throughout the process. The Trustees, including all of the Independent Trustees, concluded that:
| | ¡ | | the investment advisory fees to be received by Vulcan with respect to each of the Funds were comparable to others with in such Fund’s peer universe; |
| | ¡ | | the nature, extent and quality of services rendered by Vulcan under the Advisory Agreement were adequate; |
| | ¡ | | the profit, if any, anticipated to be realized by Vulcan in connection with the operation of the Funds is fair to the Trust, especially in light of the fee waiver agreement between the Trust and Vulcan; and |
| | ¡ | | there were no material economies of scale or other benefits accruing to Vulcan in connection with its relationship with the Funds. |
| | |
| 26 | | 1-877-421-5078 | www.vulcanvaluepartners.com |
Additional Information
April 30, 2010 (Unaudited)
Based on the Trustees’ deliberations and their evaluation of the information described above, the Trustees, including all of the Independent Trustees, concluded that Vulcan’s compensation for investment advisory services is consistent with the best interests of each of the Funds and its shareholders.
TAX DESIGNATIONS
The Funds designate the following for federal income tax purposes for the fiscal year ended April 30, 2010:
| | | | |
| | | Qualified Dividend
Income | | Dividend Received
Deduction |
| | | | | |
Vulcan Value Partners Fund | | 0% | | 0% |
| | | | | |
Vulcan Value Partners Small Cap Fund | | 0% | | 0% |
| | | | | |
| | |
| Annual Report | April 30, 2010 | | 27 |
Trustees and Officers
April 30, 2010 (Unaudited)
As of April 30, 2010, the Funds represented two of six separate series offered to the public under the Trust. The Trust’s Board of Trustees oversees the overall management of each series of the Trust and elects the officers of the Trust. You can find more information about the Trustees in the Statement of Additional Information (SAI) which is available without charge by calling (866) 759-5679. The principal occupations for the past five years of the Trustees and executive officers of the Trust are listed below.
INDEPENDENT TRUSTEES
| | | | | | | | | | |
Name, Address* & Age | | Position(s) Held with Funds | | Term of Office and Length of Time Served | | Principal Occupation(s)
During Past 5 Years** | | Number of Funds in Fund Complex Overseen by Trustee*** | | Other Directorships Held by Trustee |
| | | | | | | | | | | |
Mary K. Anstine, age 68 | | Trustee | | Ms. Anstine was elected at a special meeting of shareholders held on March 21, 1997 and re-elected at a special meeting of shareholders held on August 7, 2009. | | Ms. Anstine was President/ Chief Executive Officer of HealthONE Alliance, Denver, Colorado, and former Executive Vice President of First Interstate Bank of Denver. Ms. Anstine is also Trustee/Director of AV Hunter Trust and Colorado Uplift Board. Ms. Anstine was formerly a Director of the Trust Bank of Colorado (later purchased and now known as Northern Trust Bank), HealthONE and Denver Area Council of the Boy Scouts of America, and a member of the American Bankers Association Trust Executive Committee. | | 6 | | Ms. Anstine is a Trustee of ALPS ETF Trust (9 funds); Financial Investors Variable Insurance Trust (5 funds); ALPS Variable Insurance Trust (1 fund); Reaves Utility Income Fund (1 fund); and Westcore Trust (12 funds). |
| * | All communications to Trustees and Officers may be directed to Financial Investors Trust c/o 1290 Broadway, Suite 1100, Denver, CO 80203. |
| ** | Except as otherwise indicated, each individual has held the office shown or other offices in the same company for the last five years. |
| *** | The Fund Complex includes all series of the Trust and any other investment companies for which Vulcan Value Partners provides investment advisory services. |
| | |
| 28 | | 1-877-421-5078 | www.vulcanvaluepartners.com |
Trustees and Officers
April 30, 2010 (Unaudited)
INDEPENDENT TRUSTEES (Continued)
| | | | | | | | | | |
Name, Address* & Age | | Position(s) Held with Funds | | Term of Office and Length of Time Served | | Principal Occupation(s)
During Past 5 Years** | | Number of Funds in Fund Complex
Overseen by Trustee*** | | Other Directorships Held by Trustee |
| | | | | | | | | | | |
John R. Moran, Jr., age 79 | | Trustee | | Mr. Moran was elected at a special meeting of shareholders held on March 21, 1997 and re-elected at a special meeting of shareholders held on August 7, 2009. | | Mr. Moran is formerly President and CEO of The Colorado Trust, a private foundation serving the health and hospital community in the state of Colorado. An attorney, Mr. Moran was formerly a partner with the firm of Kutak Rock & Campbell in Denver, Colorado and a member of the Colorado House of Representatives. | | 6 | | None. |
| | | | | |
| | | | | | | | | | | |
Jeremy W. Deems, age 33 | | Trustee | | Mr. Deems was appointed as a Trustee at the March 11, 2008 meeting of the Board of Trustees and elected at a special meeting of shareholders held on August 7, 2009. | | Mr. Deems is the Co-President and Chief Financial Officer of Green Alpha Advisors, LLC. Prior to joining Green Alpha Advisors, Mr. Deems was CFO and Treasurer of Forward Management, LLC, an investment management company, ReFlow Management Co., LLC, a liquidity resourcing company, ReFlow Fund, LLC, a private investment fund, and Sutton Place Management, LLC, an administrative services company (from 2004 to June 2007). Prior to this, Mr. Deems served as Controller of Forward Management, LLC, ReFlow Management Co., LLC, ReFlow Fund, LLC and Sutton Place Management, LLC. | | 6 | | Mr. Deems is a Trustee of ALPS ETF Trust (9 funds); ALPS Variable Insurance Trust (1 fund); and Reaves Utility Income Fund (1 fund). |
| | |
| Annual Report | April 30, 2010 | | 29 |
Trustees and Officers
April 30, 2010 (Unaudited)
INDEPENDENT TRUSTEES (Continued)
| | | | | | | | | | |
Name, Address* & Age | | Position(s) Held with Funds | | Term of Office and Length of Time Served | | Principal Occupation(s)
During Past 5 Years** | | Number of Funds in Fund Complex Overseen by Trustee*** | | Other Directorships Held by Trustee |
| | | | | | | | | | | |
Jerry G. Rutledge, age 65 | | Trustee | | Mr. Rutledge was elected at a special meeting of shareholders held on August 7, 2009. | | Mr. Rutledge is the President and owner of Rutledge’s Inc., a retail clothing business. Mr. Rutledge is currently Director of the University of Colorado Hospital. He was from 1994 to 2007 a Regent of the University of Colorado and Director of the American National Bank until 2009. | | 6 | | Mr. Rutledge is a Trustee of Clough Global Allocation Fund (1 fund), Clough Global Equity Fund (1 fund) and Clough Global Opportunities Fund (1 fund). |
| | | | | |
| | | | | | | | | | | |
Michael “Ross” Shell, age 39 | | Trustee | | Mr. Shell was elected at a special meeting of shareholders held on August 7, 2009. | | Mr. Shell is Founder and CEO of Red Idea, LLC, a strategic consulting/early stage venture firm (since June 2008) and a Director of Tesser, Inc., a brand agency (since November 1999). From December 2005 to May 2008, he was Director, Marketing and Investor Relations, of Woodbourne, a REIT/real estate hedge fund and private equity firm. Prior to this, from May 2004 to November 2005, he worked as a business strategy consultant; from June 2003 to April 2004, he was on the Global Client Services team of IDEO, a product design/innovation firm; and from 1999 to 2003, he was President of Tesser, Inc. Mr. Shell graduated with honors from Stanford University with a degree in Political Science. | | 6 | | None. |
| * | All communications to Trustees and Officers may be directed to Financial Investors Trust c/o 1290 Broadway, Suite 1100, Denver, CO 80203. |
| ** | Except as otherwise indicated, each individual has held the office shown or other offices in the same company for the last five years. |
| *** | The Fund Complex includes all series of the Trust and any other investment companies for which Vulcan Value Partners provides investment advisory services. |
| | |
| 30 | | 1-877-421-5078 | www.vulcanvaluepartners.com |
Trustees and Officers
April 30, 2010 (Unaudited)
INTERESTED TRUSTEE
| | | | | | | | | | |
Name, Address* & Age | | Position(s) Held with Funds | | Term of Office and Length of Time Served | | Principal Occupation(s)
During Past 5 Years** | | Number of Funds in Fund Complex Overseen by Trustee*** | | Other Directorships Held by Trustee |
| | | | | | | | | | | |
Edmund J. Burke, age 48 | | Trustee, Chairman and President | | Mr. Burke was elected as Chairman at the August 28, 2009 meeting of the Board of Trustees. Mr. Burke was elected as Trustee at a special meeting of shareholders held on August 7, 2009. Mr. Burke was elected President of the Trust at the December 17, 2002 meeting of the Board of Trustees. | | Mr. Burke is Chief Executive Officer and a Director of ALPS Holdings, Inc. (“AHI”) (since 2005) and Director of ALPS Advisors, Inc. (“AAI”), ALPS Distributors, Inc. (“ADI”), ALPS Fund Services, Inc. (“AFS”) and FTAM Distributors, Inc. (“FDI”) and from 2001-2008, was President of AAI, ADI, AFS and FDI. Because of his positions with AHI, AAI, ADI, AFS and FDI, Mr. Burke is deemed an affiliate of the Trust as defined under the 1940 Act. Mr. Burke is President and Chief Executive Officer of the Financial Investors Variable Insurance Trust (since 2006); Trustee and President of the Clough Global Allocation Fund (Trustee since 2006; President since 2004); Trustee and President of the Clough Global Equity Fund (Trustee since 2006; President since 2005); Trustee and President of the Clough Global Opportunities Fund (since 2006); Trustee of the Liberty All-Star Equity Fund; and Director of the Liberty All-Star Growth Fund, Inc. | | 6 | | Mr. Burke is a Trustee of Clough Global Allocation Fund (1 fund); Clough Global Equity Fund (1 fund); Clough Global Opportunities Fund (1 fund); Trustee of the Liberty All-Star Equity Fund (1 fund); and Director of the Liberty All-Star Growth Fund, Inc. (1 fund). |
| | |
| Annual Report | April 30, 2010 | | 31 |
Trustees and Officers
April 30, 2010 (Unaudited)
OFFICERS
| | | | | | |
Name, Address* & Age | | Position(s) Held with Funds | | Term of Office and Length of Time Served | | Principal Occupation(s) During Past 5 Years** |
| | | | | | | |
| Jeremy O. May, age 39 | | Treasurer | | Mr. May was elected Treasurer of the Trust at the October 7, 1997 meeting of the Board of Trustees. | | Mr. May joined ALPS in 1995 and is currently President and Director of AFS and Executive Vice President and Director of AHI, AAI, ADI and FDI. Because of his positions with these entities, Mr. May is deemed an affiliate of the Trust as defined under the 1940 Act. Mr. May is also the Treasurer of the Liberty All-Star Equity Fund, Liberty All-Star Growth Fund, Inc., Clough Global Allocation Fund, Clough Global Equity Fund, Clough Global Opportunities Fund, Financial Investors Trust and Financial Investors Variable Insurance Trust. Mr. May is also President, Chairman and Trustee of the ALPS Variable Insurance Trust and the Reaves Utility Income Fund. Mr. May is currently on the Board of Directors and is Chairman of the Audit Committee of the University of Colorado Foundation. |
| | | |
| | | | | | | |
| JoEllen L. Legg, age 48 | | Secretary | | Ms. Legg was elected Secretary of the Trust at the November 13, 2007 meeting of the Board of Trustees. | | Ms. Legg joined ALPS in October 2007 and is currently Vice President and Associate Counsel of ALPS, AAI, ADI and FDI. Prior to joining ALPS, Ms. Legg served as Senior Counsel -Law (Corporate & Securities) for Adelphia Communications Corporation from February 2005 to March 2007. Prior to this, Ms. Legg held associate positions at Fried Frank Harris Shriver & Jacobson LLP (1998 - 2004) and at Patton Boggs LLP (2004 -2005). Because of her position with ALPS, Ms. Legg is deemed an affiliate of the Trust as defined under the 1940 Act. Ms. Legg is also the Secretary of Transparent Value Trust and Westcore Trust and Assistant Secretary of the Stone Harbor Investment Funds and WesMark Funds. |
| * | All communications to Trustees and Officers may be directed to Financial Investors Trust c/o 1290 Broadway, Suite 1100, Denver, CO 80203. |
| ** | Except as otherwise indicated, each individual has held the office shown or other offices in the same company for the last five years. |
| *** | The Fund Complex includes all series of the Trust and any other investment companies for which Vulcan Value Partners provides investment advisory services. |
| | |
| 32 | | 1-877-421-5078 | www.vulcanvaluepartners.com |
Trustees and Officers
April 30, 2010 (Unaudited)
OFFICERS
| | | | | | |
Name, Address* & Age | | Position(s)
Held with
Funds | | Term of Office
and Length of
Time Served | | Principal Occupation(s) During Past 5 Years** |
| | | | | | | |
Michael Akins, age 33 | | Chief Compliance Officer (“CCO”) | | Mr. Akins was appointed CCO of the Trust at the June 13, 2006 meeting of the Board of Trustees. | | Mr. Akins joined ALPS in April 2006 and is currently Vice President and Deputy Compliance Officer of ALPS. Prior to joining ALPS, Mr. Akins served as Compliance Officer and AVP for UMB Financial Corporation. Before joining UMB, Mr. Akins served as an account manager for State Street Corporation. Because of his position with ALPS, Mr. Akins is deemed an affiliate of the Trust as defined under the 1940 Act. Mr. Akins is currently the CCO of Reaves Utility Income Fund, Clough Global Allocation Fund, Clough Global Opportunities Fund and the Clough Global Equity Fund. |
| | | |
| | | | | | | |
| Kimberly R. Storms, age 37 | | Assistant Treasurer | | Ms. Storms was elected Assistant Treasurer of the Trust at the June 14, 2005 meeting of the Board of Trustees. | | Ms. Storms is Senior Vice President - Director of Fund Administration of ALPS. Ms. Storms joined ALPS in 1998 as Assistant Controller. Because of her position with ALPS, Ms. Storms is deemed an affiliate of the Trust as defined under the 1940 Act. Ms. Storms is also Treasurer of ALPS ETF Trust and ALPS Variable Insurance Trust; Assistant Treasurer of Liberty All-Star Equity Fund and Liberty All-Star Growth Fund, Inc.; and Assistant Secretary of Ameristock Mutual Fund, Inc. |
| * | All communications to Trustees and Officers may be directed to Financial Investors Trust c/o 1290 Broadway, Suite 1100, Denver, CO 80203. |
| ** | Except as otherwise indicated, each individual has held the office shown or other offices in the same company for the last five years. |
| *** | The Fund Complex includes all series of the Trust and any other investment companies for which Vulcan Value Partners provides investment advisory services. |
| | |
| Annual Report | April 30, 2010 | | 33 |
This Fund is neither insured nor guaranteed by the U.S. Government, the FDIC, the Federal Reserve Board or any other governmental agency or insurer.
For more information about the Fund, including a prospectus, please visit www.vulcanvaluepartners.com or call 1.877.421.5078.
This material must be accompanied or proceeded by a prospectus.
The Vulcan Value Partners Funds are distributed by ALPS Distributors, Inc.
| | | | |
Item 2. | | Code of Ethics. |
| | |
| | (a) | | The Registrant, as of the end of the period covered by this report, has adopted a code of ethics that applies to the Registrant’s principal executive officer, principal financial officer, principal accounting officer or controller or any persons performing similar functions on behalf of the Registrant. |
| | |
| | (b) | | Not applicable. |
| | |
| | (c) | | During the period covered by this report, no amendments to the provisions of the code of ethics adopted in Item 2(a) above were made. |
| | |
| | (d) | | During the period covered by this report, no implicit or explicit waivers to the provisions of the code of ethics adopted in Item 2(a) above were granted. |
| | |
| | (e) | | Not applicable. |
| | |
| | (f) | | The Registrant’s Code of Ethics is attached as an Exhibit hereto. |
| |
Item 3. | | Audit Committee Financial Expert. |
| |
| | The Board of Trustees of the Registrant has determined that the Registrant has at least one Audit Committee Financial Expert serving on its audit committee. The Board of Trustees of the Registrant has designated Jeremy W. Deems as the Registrant’s “Audit Committee Financial Expert.” Mr. Deems is “independent” as defined in paragraph (a)(2) of Item 3 to Form N-CSR. |
| |
Item 4. | | Principal Accountant Fees and Services. |
| | |
| | (a) | | Audit Fees: For the Registrant’s fiscal years ended April 30, 2009 and April 30, 2010, the aggregate fees billed for professional services rendered by the principal accountant for the audit of the Registrant’s annual financial statements were $45,000 and $105,340, respectively. |
| | |
| | (b) | | Audit-Related Fees: For the Registrant’s fiscal years ended April 30, 2009 and April 30, 2010, the aggregate fees billed for professional services rendered by the principal accountant for the verification of the Registrant’s securities and similar |
| | | | |
| | | | investments in accordance with Rule 17f-2 under the Investment Company Act of 1940 were $10,000 and $10,000, respectively. |
| | |
| | (c) | | Tax Fees: For the Registrant’s fiscal years ended April 30, 2009 and April 30, 2010, the aggregate fees billed for professional services rendered by the principal accountant for tax compliance, tax advice and tax planning were $10,570 and $26,770, respectively. The fiscal year 2009 and 2010 tax fees were for services for dividend calculation, excise tax preparation and tax return preparation. |
| | |
| | (d) | | All Other Fees: For the Registrant’s fiscal years ended April 30, 2009 and April 30, 2010, no fees were billed to Registrant by the principal accountant for services other than the services reported in paragraphs (a) through (c) of this Item. |
| | |
| | (e)(1) | | Audit Committee Pre-Approval Policies and Procedures: All services to be performed by the Registrant’s principal accountant must be pre-approved by the Registrant’s audit committee. |
| | |
| | (e)(2) | | No services described in paragraphs (b) through (d) of this Item were approved by the Registrant’s audit committee pursuant to paragraph (c)(7)(i)(C) of Rule 2-01 of Regulation S-X. |
| | |
| | (f) | | Not applicable. |
| | |
| | (g) | | The aggregate non-audit fees billed by the Registrant’s accountant in each of the last two fiscal years of the Registrant were $178,070 in 2009 and $166,770 in 2010. These fees consisted of non-audit fees billed to (i) the Registrant of $10,570 in 2009 and $26,770 in 2010 as described in response to paragraph (c) above and (ii) to ALPS Fund Services, Inc. (“AFS”), an entity under common control with ALPS Advisors, Inc., the Registrant’s investment adviser, of $167,500 in 2009 and $140,000 in 2010. The non-audit fees billed to AFS related to SAS 70 services and other compliance-related matters. |
| | |
| | (h) | | The Registrant’s audit committee has considered whether the provision of non-audit services that were rendered to the Registrant’s investment adviser (not including any sub-adviser whose role is primarily portfolio management and is subcontracted with or overseen by another investment adviser), and any entity controlling, controlled by, or under common control with the investment adviser that provides ongoing services to the Registrant that were not pre-approved pursuant to paragraph (c)(7)(ii) of Rule 2-01 of Regulation S-X, is compatible with maintaining the principal accountant’s independence. The Registrant’s audit committee determined that the provision of such non-audit services is compatible with maintaining the principal accountant’s independence. |
| |
| Item 5. | | Audit Committee of Listed Registrants. |
| |
| | Not applicable. |
| | | | |
| Item 6. | | Investments. |
| | |
| | (a) | | Schedule of Investments is included as part of the Reports to Stockholders filed under Item 1 of this Form N-CSR. |
| | |
| | (b) | | Not applicable. |
| |
| Item 7. | | Disclosure of Proxy Voting Policies and Procedures for Closed-End Management Investment Companies. |
| |
| | Not applicable to Registrant. |
| |
| Item 8. | | Portfolio Managers of Closed-End Management Investment Companies. |
| |
| | Not applicable to Registrant. |
| |
| Item 9. | | Purchases of Equity Securities by Closed-End Management Investment Company and Affiliated Purchasers. |
| |
| | Not applicable to Registrant. |
| |
| Item 10. | | Submission of Matters to a Vote of Security Holders. |
| |
| | There have been no material changes to the procedures by which shareholders may recommend nominees to the Registrant’s Board of Trustees, where those changes were implemented after the Registrant last provided disclosure in response to the requirements of Item 407(c)(2) of Regulation S-K, or this Item. |
| |
| Item 11. | | Controls and Procedures. |
| | |
| | (a) | | The Registrant’s principal executive officer and principal financial officer have concluded that the Registrant’s disclosure controls and procedures (as defined in Rule 30a-3(c) under the Investment Company Act of 1940, as amended) are effective based on their evaluation of these controls and procedures as of a date within 90 days of the filing date of this report. |
| | |
| | (b) | | There was no change in the Registrant’s internal control over financial reporting (as defined in Rule 30a-3(d) under the Investment Company Act of 1940, as amended) during the second fiscal quarter of the period covered by this report that has materially affected, or is reasonably likely to materially affect, the Registrant’s internal control over financial reporting. |
| | | | |
| Item 12. | | Exhibits. |
| | |
| | (a)(1) | | Registrant’s Code of Ethics for Senior Financial Officers, which is the subject of the disclosure required by Item 2 of Form N-CSR, was filed as Exhibit 12(a)(1) to the Registrant’s Certified Shareholder Report on Form N-CSR, File No. 811-8194, on July 7, 2008. |
| | |
| | (a)(2) | | The certifications required by Rule 30a-2(a) of the Investment Company Act of 1940, as amended, and Section 302 of the Sarbanes-Oxley Act of 2002 are attached hereto as Exhibit 99.Cert. |
| | |
| | (a)(3) | �� | Not applicable. |
| | |
| | (b) | | The certifications by the Registrant’s principal executive officer and principal financial officer, as required by Rule 30a-2(b) of the Investment Company Act of 1940, as amended, and Section 906 of the Sarbanes-Oxley Act of 2002 are attached hereto as Exhibit 99.906Cert. |
SIGNATURES
Pursuant to the requirements of the Securities Exchange Act of 1934 and the Investment Company Act of 1940, the Registrant has duly caused this report to be signed on its behalf by the undersigned, thereunto duly authorized.
| | | | |
| FINANCIAL INVESTORS TRUST |
| | |
| By: | | | | /s/ Edmund J. Burke |
| | | | Edmund J. Burke (Principal Executive Officer) |
| | | | President |
| | |
| Date: | | | | July 6, 2010 |
Pursuant to the requirements of the Securities Exchange Act of 1934 and the Investment Company Act of 1940, this report has been signed below by the following persons on behalf of the Registrant and in the capacities and on the dates indicated.
| | | | |
| FINANCIAL INVESTORS TRUST |
| | |
| By: | | | | /s/ Edmund J. Burke |
| | | | Edmund J. Burke (Principal Executive Officer) |
| | | | President |
| | |
| Date: | | | | July 6, 2010 |
| | | | |
| | |
| By: | | | | /s/ Jeremy O. May |
| | | | Jeremy O. May (Principal Financial Officer) |
| | | | Treasurer |
| | |
| Date: | | | | July 6, 2010 |