UNITED STATES
SECURITIES AND EXCHANGE COMMISSION
Washington, D.C. 20549
FORM N-CSR
CERTIFIED SHAREHOLDER REPORT OF REGISTERED
MANAGEMENT INVESTMENT COMPANIES
Investment Company Act file number: 811-8194
FINANCIAL INVESTORS TRUST
(Exact name of registrant as specified in charter)
1290 Broadway, Suite 1100, Denver, Colorado 80203
(Address of principal executive offices) (Zip code)
JoEllen L. Legg, Secretary
Financial Investors Trust
1290 Broadway, Suite 1100
Denver, Colorado 80203
(Name and address of agent for service)
Registrant’s telephone number, including area code: 303-623-2577
Date of fiscal year end: April 30
Date of reporting period: May 1, 2010 - April 30, 2011
Item 1. Reports to Stockholders.
Table of Contents
| | | | |
ALPS | Kotak India Growth Fund |
| | | Management Commentary | | April 30, 2011 (Unaudited) |
Performance
ALPS | Kotak India Growth Fund (the “Fund”) was launched on February 14, 2011. The Fund’s Class A Shares, INDAX, delivered a net return of 3.40% at Net Asset Value (Class A delivered a net return of -2.27% at MOP, Class C, INFCX, was +2.20% with CDSC, Class I, INDIX, was +3.50%). The Fund’s performance was below that of the S&P CNX 500 Index(1) (“CNX 500”) (+5.72%), without taking into account sales charges for Class A and C Shares. As the Fund was in the portfolio build-up phase, the portfolio was significantly in cash the first few weeks of launch during which Indian markets rallied.
During the four-month period ended 4/30/2011, Indian equity markets underperformed most equity markets by a wide margin – broader Indian indices like CNX 500 returned -9.78% during this period compared to the Dow Jones Industrial Average(2) return of 8.57%. The investment environment during this period was impacted by the following, with January 2011 marking the worst monthly decline since October 2008 (CNX 500 down -12.80% in January, February CNX 500 down -2.66%, while in March the CNX 500 was up 10.60% and in April down -4.47%).
| | » | While global cues like ratings downgrade of Japan by S&P and a threat by Moody’s(3) to downgrade US debt rating added to market participant woes, the fall in Indian markets was mainly attributed to local factors like high inflation, tightening interest rates and a paralysis by the government on policy and worries that this might slow investments and hence overall growth. |
| | » | January also witnessed corporate India report earnings for the quarter ending December 2010. While there have been a few sectors which reported earnings reports impacted by higher commodity prices, on an aggregate corporate earnings was in-line with expectations, the fall in markets therefore reflective of change in macro-environment than in the micro-functioning of corporate India. |
| | » | With macro-economic environment dominating market behaviour, the key event during the quarter was the credit policy meeting of Reserve Bank of India (“RBI”). As expected, the RBI raised Repurchases(4) and Reverse Repurchases(5) by 25 basis points(6) (“bps”) each to 6.5 and 5.5%, respectively, in its credit policy in January. As expected, the RBI also upped the inflation forecast to 7% from 5.5% while keeping the Gross Domestic Product (“GDP”) estimate unchanged at 8.5%, albeit with an upward bias. With inflation persisting at elevated levels, RBI in its May credit policy increased the key rates by 50 bps – hinting that RBI has moved to controlling inflation as its primary target at this point of time. |
| | » | The Union Budget(7) presented on February 28, 2011 by Mr. Pranab Mukherjee, was devoid of any significant populist measures but can at best be described as a pragmatic one in an environment where the government is faced with |
| | multiple deficits – that of governance, fiscal and current account. A budget should be judged for its role in creating an environment for sustained growth rather than the short term impact on individuals and that’s what the Finance Minister has done – choosing a path for sustained growth rather than committing to overtly populist measures. |
| | » | For the markets, the announcement of a reduced fiscal deficit target of 4.6% against 4.8% was below industry expectations and a reason to cheer. Fuelled by a buoyant economy estimated in the budget to grow at 9%, the government’s reduced borrowing targets for the year were also below market expectations. Although this figure is likely to please the markets it is highly dependent on global oil prices and the government’s commitment to subsidies in this space. The budget also provided a big boost to equity and mutual fund markets by allowing foreign individual investors to access Indian funds. |
| | » | The sharp rise in crude (Brent Crude up 23.24% and NYMEX WTI Crude up 16.79%) during this period was another significant headwind for the markets. As the fourth-largest consumer of oil in the world, most of India’s oil energy needs are met through imports (around 93%) making India the world’s 5th largest oil-importing nation. Increasing oil price have major impact on BoP (Balance of payment), leading to increasing fiscal deficit and current account deficit. An estimate from Citi showed that a US$1/bbl increase in oil prices would impact India’s trade deficit by US$800mn (approx 0.4% of GDP). |
Portfolio Composition
The portfolio is constructed to potentially benefit from the strong macro-economic growth in Indian economy across four broad themes in India – consumption lead by favourable demographics, financial services, infrastructure and outsourcing. The Fund has flexibility to invest across market capitalizations – depending on market conditions, valuation differential, earnings growth, liquidity etc.
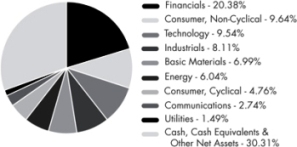
Sectorally, the portfolio is overweight financials, information technology, healthcare, while the portfolio is underweight energy, utilities, consumer discretionary. With risk averseness increasing in the first quarter of 2011, the Fund had relatively low exposure to midcaps on an average (10-15%), However, close to the end of the quarter, this had increased marginally to about 20% due to favourable valuation discount.
Outlook
Indian markets, after underperforming most global markets for the first two months in 2011, have bounced back strongly in March 2011. While we have seen some positives in the budget, reform agenda, environment clearances, moderation of food
1 | April 30, 2011
| | | | |
ALPS | Kotak India Growth Fund |
| | | Management Commentary | | April 30, 2011 (Unaudited) |
inflation, many other macro variables remain challenging, particularly crude oil prices, and now rising core inflation. On the policy front, while we have seen some movements in recent weeks, we see an increased thrust post the state elections in April and May 2011.
After the recent run up, valuations at 15x fiscal year-end 2012 earnings per share(8) and 12.9x fiscal year-end 2013 earnings
per share are reasonable but not cheap. We expect markets to consolidate before making a fresh upmove. In addition, midcaps, after underperforming for last few months, are seeing renewed interest. Given the valuation gap and liquidity improvement, we believe midcaps are now likely to outperform. Reforms are key for the next leg of sustainable growth and the market will likely be disappointed without critical reforms post five state elections. Lastly, oil prices continue to remain a key risk for the market.
| (1) | India’s first broad based benchmark of the Indian capital market. The S&P CNX 500 companies are disaggregated into 72 industry indices. Industry weightages in the index reflect the industry weightages in the market. An investor may not invest directly in an index. |
| (2) | The most widely used indicator of the overall condition of the stock market, a price-weighted average of 30 actively traded blue chip stocks, primarily industrials. An investor may not invest directly in an index. |
| (3) | Standard & Poor’s (S&P) and Moody’s ratings are based on statistical calculations of a company’s likelihood of default. |
| (4) | A form of short-term borrowing for dealers in government securities. The dealer sells the government securities to investors, usually on an overnight basis, and buys them back the following day. |
| (5) | The purchase of securities with the agreement to sell them at a higher price at a specific future date. For the party selling the security (and agreeing to repurchase it in the future) it is a repurchase agreement; for the party on the other end of the transaction (buying the security and agreeing to sell in the future) it is a reverse repurchase agreement. |
| (6) | A unit that is equal to 1/100th of 1%. |
| (7) | The annual budget of the Republic of India, presented each year on the last working day of February by the Finance Minister of India in Parliament. |
| (8) | The portion of a company’s profit allocated to each outstanding share of common stock. Earnings per share serves as an indicator of a company’s profitability. |
Past performance does not guarantee future results.
2 | April 30, 2011
| | | | |
ALPS | Kotak India Growth Fund |
| | | Management Commentary | | April 30, 2011 (Unaudited) |
Performance of $10,000 Initial Investment (as of April 30, 2011)
Comparison of change in value of a $10,000 investment (includes applicable sales loads)
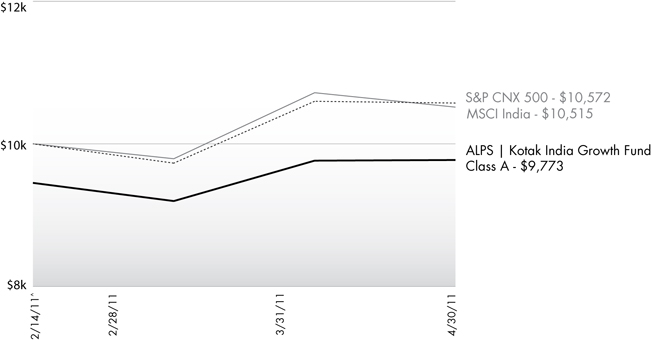
The chart above represents historical performance of a hypothetical investment of $10,000 in the Fund since inception. Past performance does not guarantee future results. This chart does not reflect the deduction of taxes that a shareholder would pay on Fund distributions or the redemption of Fund shares.
3 | April 30, 2011
| | | | |
ALPS | Kotak India Growth Fund |
| | | Management Commentary | | April 30, 2011 (Unaudited) |
Cumulative Return (as of April 30, 2011)
| | | | | | |
| | | Since Inception^ | | Total Expense Ratio | | What You Pay* |
Class A (NAV)1 | | 3.40% | | 4.16% | | 2.00% |
Class A (MOP)2 | | -2.27% | | |
Class C (NAV)1 | | 3.20% | | 4.76% | | 2.60% |
Class C (CDSC)2 | | 2.20% | | |
Class I | | 3.50% | | 3.76% | | 1.60% |
S&P CNX 500 Index3 | | 5.72% | | | | |
MSCI India Index4 | | 5.06% | | | | |
Performance data quoted represents past performance. Past performance does not guarantee future results. Investment return and principal value of an investment will fluctuate so that an investor’s shares, when sold or redeemed, may be worth more or less than the original cost. Current performance data may be higher or lower than actual data quoted. The Fund imposes a 2.00% redemption fee on shares held for less than 90 days. The Fund imposes a maximum Contingent Deferred Sales Charge (“CDSC”) of 1.00% to shares redeemed within the first 12 months after a purchase in excess of $1 million. Performance data does not reflect the redemption fee or the CDSC, which if reflected would reduce the performance quoted. For the most current month-end performance data please call (866) 759-5679.
Investing in the Fund is subject to investment risks, including possible loss of the principal amount invested. Derivatives generally are more sensitive to changes in economic or market conditions than other types of investments; this could result in losses that significantly exceed the funds original investment.
| 1 | Net Asset Value (NAV) is the share price without sales charges. |
| 2 | Maximum Offering Price (MOP) includes sales charges. Class A returns include effects of the Fund’s maximum sales charge of 5.50%; Class C returns include the 1.00% CDSC. |
| 3 | S&P CNX 500 - India’s first broad based benchmark of the Indian capital market. The S&P CNX 500 companies are disaggregated into 72 industry indices. Industry weightages in the market. An investor may not invest directly in an index. |
| 4 | MSCI India Index-a free float weighted equity index. It was developed with a base value of 100 as-of December 31, 1992. An investor may not invest directly in an index. |
| ^ | Fund inception date of 2/14/2011. |
| * | What You Pay reflects the Adviser and Sub-Adviser’s decision to contractually limit expenses through August 31, 2012. Please see the prospectus for additional information. |
The table does not reflect the deduction of taxes that a shareholder would pay on Fund distributions or the redemption of Fund shares.
The Fund is less than a year old and has limited operating history. This Fund is not suitable for all investors. Subject to investment risks, including possible loss of the principal amount invested.
Investing in India involves risk and considerations not present when investing in more established securities markets. The Fund may be more susceptible to economic, market, political and local risks of the region than a fund that is more geographically diversified.
| | | | |
Top Ten Long Holdings (as a % of Net Assets) † | |
ICICI Bank, Ltd. | | | 4.30 | % |
Infosys Technologies, Ltd. | | | 4.25 | % |
Reliance Industries, Ltd. | | | 3.72 | % |
Tata Consultancy Services, Ltd. | | | 3.22 | % |
Larsen & Toubro, Ltd. | | | 2.13 | % |
ITC, Ltd. | | | 1.92 | % |
HDFC Bank, Ltd. | | | 1.82 | % |
Bharti Airtel, Ltd. | | | 1.74 | % |
State Bank of India | | | 1.70 | % |
Union Bank of India | | | 1.47 | % |
Top Ten Long Holdings | | | 26.27 | % |
| |
† Holdings are subject to change. | | | | |
Industry Sector Allocation (Long Positions as a % of Net Assets)
4 | April 30, 2011
| | | | |
ALPS | Kotak India Growth Fund |
| | | Disclosure of Fund Expenses | | April 30, 2011 (Unaudited) |
As a shareholder of the Fund, you will incur two types of costs: (1) transaction costs, including applicable sales charges (loads); and (2) ongoing costs, including management fees, distribution and service (12b-1) fees, shareholder service fees and other Fund expenses. The following examples are intended to help you understand your ongoing costs (in dollars) of investing in the Fund and to compare these costs with the ongoing costs of investing in other mutual funds. The examples are based on an investment of $1,000 invested on February 14, 2011 and held until April 30, 2011.
Actual Expenses. The first line of the table on the next page provides information about actual account values and actual expenses. You may use the information in this line, together with the amount you invested, to estimate the expenses that you paid over the period. Simply divide your account value by $1,000 (for example, an $8,600 account value divided by $1,000 = 8.6), then multiply the result by the number in the first line under the heading “Expense Paid During Period” to estimate the expenses you paid on your account during this period.
Hypothetical Example for Comparison Purposes. The second line of the table on the next page provides information about hypothetical account values and hypothetical expenses based on the Fund’s actual expense ratio and an assumed rate of return of 5% per year before expenses, which is not the Fund’s actual return. The hypothetical account values and expenses may not be used to estimate the actual ending account balance or expenses you paid for the period. You may use this information to compare the ongoing costs of investing in the Fund and other mutual funds. To do so, compare this 5% hypothetical example with the 5% hypothetical examples that appear in the shareholder reports of the other funds.
The expenses shown in the table are meant to highlight ongoing Fund costs only and do not reflect transaction fees, such as sales charges or exchange fees. Therefore, the second line of the table on the next page is useful in comparing ongoing costs only, and may not help you determine the relative total costs of owning different funds. In addition, if these transactional costs were included, your costs would have been higher.
| | | | | | | | |
| | | Beginning Account Value
2/14/11 | | Ending Account Value
4/30/11 | | Expense
Ratio(a) | | Expense Paid
During Period(b)
2/14/11 - 4/30/11 |
Class A(c) | | | | | | | | |
Actual | | $1,000.00 | | $1,034.00 | | 2.00% | | $4.18 |
Hypothetical (5% return before expenses) | | $1,000.00 | | $1,006.16 | | 2.00% | | $9.95 |
| | | | |
Class C(c) | | | | | | | | |
Actual | | $1,000.00 | | $1,032.00 | | 2.60% | | $5.43 |
Hypothetical (5% return before expenses) | | $1,000.00 | | $1,004.93 | | 2.60% | | $12.92 |
| | | | |
Class I(c) | | | | | | | | |
Actual | | $1,000.00 | | $1,035.00 | | 1.60% | | $3.35 |
Hypothetical (5% return before expenses) | | $1,000.00 | | $1,006.99 | | 1.60% | | $7.96 |
| (a) | The Fund’s expense ratios have been based on the period from Fund’s inception date of February 14, 2011 through April 30, 2011. |
| (b) | Expenses are equal to the Fund’s annualized expense ratio multiplied by the average account value over the period, multiplied by the number of days in the most recent fiscal half year (181), then divided by 365. |
| (c) | Shares commenced operations on February 14, 2011. |
5 | April 30, 2011
| | | | |
ALPS | Kotak India Growth Fund |
| | | Consolidated Statement of Investments | | April 30, 2011 |
| | | | | | | | |
| | | Shares | | | Value
(Note 1) | |
COMMON STOCKS (69.69%) | | | | | | | | |
Basic Materials (6.99%) | | | | | | | | |
Chemicals (2.28%) | | | | | | | | |
Asian Paints, Ltd. | | | 316 | | | $ | 19,853 | |
Gujarat State Fertilisers & Chemicals, Ltd. | | | 2,975 | | | | 25,128 | |
| | | | | | | | |
| | | | | | | 44,981 | |
| | | | | | | | |
| | |
Iron & Steel (2.41%) | | | | | | | | |
Jindal Steel & Power, Ltd. | | | 1,471 | | | | 21,826 | |
Tata Steel, Ltd. | | | 1,833 | | | | 25,615 | |
| | | | | | | | |
| | | | | | | 47,441 | |
| | | | | | | | |
| | |
Mining (2.30%) | | | | | | | | |
Hindalco Industries, Ltd. | | | 4,130 | | | | 20,217 | |
Sterlite Industries India, Ltd. | | | 6,072 | | | | 25,022 | |
| | | | | | | | |
| | | | | | | 45,239 | |
| | | | | | | | |
| | |
TOTAL BASIC MATERIALS | | | | | | | 137,661 | |
| | | | | | | | |
| | |
Communications (2.74%) | | | | | | | | |
Media (1.00%) | | | | | | | | |
Jagran Prakashan, Ltd. | | | 6,985 | | | | 19,710 | |
| | | | | | | | |
| | |
Telecommunications (1.74%) | | | | | | | | |
Bharti Airtel, Ltd. | | | 3,981 | | | | 34,253 | |
| | | | | | | | |
| | |
TOTAL COMMUNICATIONS | | | | | | | 53,963 | |
| | | | | | | | |
| | |
Consumer, Cyclical (4.76%) | | | | | | | | |
Airlines (0.91%) | | | | | | | | |
Jet Airways India, Ltd.(a) | | | 1,647 | | | | 17,828 | |
| | | | | | | | |
| | |
Auto Manufacturers (1.79%) | | | | | | | | |
Mahindra & Mahindra, Ltd. | | | 1,345 | | | | 23,039 | |
Tata Motors, Ltd. | | | 790 | | | | 12,159 | |
| | | | | | | | |
| | | | | | | 35,198 | |
| | | | | | | | |
| | |
Leisure Time (1.13%) | | | | | | | | |
Bajaj Auto, Ltd. | | | 669 | | | | 22,345 | |
| | | | | | | | |
| | |
Retail (0.93%) | | | | | | | | |
Titan Industries, Ltd. | | | 200 | | | | 18,237 | |
| | | | | | | | |
| |
TOTAL CONSUMER, CYCLICAL | | | | 93,608 | |
| | | | | | | | |
| | |
Consumer, Non-cyclical (9.64%) | | | | | | | | |
Agriculture (1.92%) | | | | | | | | |
ITC, Ltd. | | | 8,680 | | | | 37,834 | |
| | | | | | | | |
| | |
Commercial Services (1.12%) | | | | | | | | |
Mundra Port and Special Economic Zone, Ltd. | | | 6,715 | | | | 21,966 | |
| | | | | | | | |
| | | | | | | | |
| | | Shares | | | Value
(Note 1) | |
Food (1.44%) | | | | | | | | |
GlaxoSmithKline Consumer Healthcare, Ltd. | | | 225 | | | $ | 12,433 | |
Shree Renuka Sugars, Ltd. | | | 9,950 | | | | 15,876 | |
| | | | | | | | |
| | | | | | | 28,309 | |
| | | | | | | | |
| | |
Household Products & Wares (1.08%) | | | | | | | | |
Godrej Consumer Products, Ltd. | | | 2,500 | | | | 21,320 | |
| | | | | | | | |
| | |
Pharmaceuticals (4.08%) | | | | | | | | |
Dr Reddy’s Laboratories, Ltd. | | | 623 | | | | 23,577 | |
Lupin, Ltd. | | | 2,021 | | | | 20,176 | |
Ranbaxy Laboratories, Ltd. | | | 400 | | | | 4,145 | |
Strides Arcolab, Ltd. | | | 2,067 | | | | 18,085 | |
Sun Pharmaceutical Industries, Ltd. | | | 1,350 | | | | 14,237 | |
| | | | | | | | |
| | | | | | | 80,220 | |
| | | | | | | | |
| | |
TOTAL CONSUMER, NON-CYCLICAL | | | | | | | 189,649 | |
| | | | | | | | |
| | |
Energy (6.04%) | | | | | | | | |
Oil & Gas (6.04%) | | | | | | | | |
Hindustan Petroleum Corp., Ltd. | | | 3,400 | | | | 28,736 | |
Oil & Natural Gas Corp., Ltd. | | | 2,450 | | | | 17,081 | |
Reliance Industries, Ltd. | | | 3,290 | | | | 73,161 | |
| | | | | | | | |
| | | | | | | 118,978 | |
| | | | | | | | |
| | |
TOTAL ENERGY | | | | | | | 118,978 | |
| | | | | | | | |
| | |
Financials (20.38%) | | | | | | | | |
Banks (14.51%) | | | | | | | | |
Allahabad Bank | | | 5,660 | | | | 26,298 | |
Axis Bank, Ltd. | | | 925 | | | | 26,938 | |
Bank of Baroda | | | 200 | | | | 4,133 | |
HDFC Bank, Ltd. | | | 690 | | | | 35,825 | |
ICICI Bank, Ltd. | | | 3,348 | | | | 84,609 | |
IndusInd Bank, Ltd. | | | 4,380 | | | | 25,781 | |
State Bank of India | | | 526 | | | | 33,425 | |
Union Bank of India | | | 3,988 | | | | 28,869 | |
Yes Bank, Ltd. | | | 2,850 | | | | 19,729 | |
| | | | | | | | |
| | | | | | | 285,607 | |
| | | | | | | | |
| | |
Diversified Financial Services (4.92%) | | | | | | | | |
Bajaj Finance, Ltd. | | | 1,200 | | | | 19,019 | |
Housing Development Finance Corp. | | | 1,685 | | | | 26,955 | |
IFCI, Ltd. | | | 13,380 | | | | 15,743 | |
Mahindra & Mahindra Financial Services, Ltd. | | | 1,357 | | | | 22,502 | |
Power Finance Corp., Ltd. | | | 2,400 | | | | 12,587 | |
| | | | | | | | |
| | | | | | | 96,806 | |
| | | | | | | | |
| | |
Real Estate (0.95%) | | | | | | | | |
Phoenix Mills, Ltd. | | | 4,026 | | | | 18,662 | |
| | | | | | | | |
| | |
TOTAL FINANCIALS | | | | | | | 401,075 | |
| | | | | | | | |
6 | April 30, 2011
| | | | |
ALPS | Kotak India Growth Fund |
| | | Consolidated Statement of Investments | | April 30, 2011 |
| | | | | | | | |
| | | Shares | | | Value (Note 1) | |
Industrials (8.11%) | | | | | | | | |
Building Materials (1.12%) | | | | | | | | |
Grasim Industries, Ltd. | | | 85 | | | $ | 4,715 | |
Shree Cement, Ltd. | | | 382 | | | | 17,378 | |
| | | | | | | | |
| | | | | | | 22,093 | |
| | | | | | | | |
| | |
Electrical Components & Equipment (3.68%) | | | | | | | | |
Bharat Heavy Electricals, Ltd. | | | 418 | | | | 18,934 | |
Crompton Greaves, Ltd. | | | 3,763 | | | | 21,491 | |
Exide Industries, Ltd. | | | 4,000 | | | | 13,808 | |
Havells India, Ltd. | | | 2,025 | | | | 18,195 | |
| | | | | | | | |
| | | | | | | 72,428 | |
| | | | | | | | |
| | |
Engineering & Construction (3.31%) | | | | | | | | |
IRB Infrastructure Developers, Ltd. | | | 5,825 | | | | 23,217 | |
Larsen & Toubro, Ltd. | | | 1,161 | | | | 41,951 | |
| | | | | | | | |
| | | | | | | 65,168 | |
| | | | | | | | |
| | |
TOTAL INDUSTRIALS | | | | | | | 159,689 | |
| | | | | | | | |
| | |
Technology (9.54%) | | | | | | | | |
Computers (8.57%) | | | | | | | | |
Infosys Technologies, Ltd. | | | 1,272 | | | | 83,623 | |
Redington India, Ltd. | | | 10,800 | | | | 21,555 | |
Tata Consultancy Services, Ltd. | | | 2,407 | | | | 63,474 | |
| | | | | | | | |
| | | | | | | 168,652 | |
| | | | | | | | |
| | |
Software (0.97%) | | | | | | | | |
HCL Technologies, Ltd. | | | 1,617 | | | | 19,092 | |
| | | | | | | | |
| | |
TOTAL TECHNOLOGY | | | | | | | 187,744 | |
| | | | | | | | |
| | |
Utilities (1.49%) | | | | | | | | |
Electric (0.78%) | | | | | | | | |
Tata Power Co., Ltd. | | | 519 | | | | 15,324 | |
| | | | | | | | |
| | |
Oil & Gas (0.71%) | | | | | | | | |
GAIL India, Ltd. | | | 1,297 | | | | 13,960 | |
| | | | | | | | |
| | |
TOTAL UTILITIES | | | | | | | 29,284 | |
| | | | | | | | |
| | |
TOTAL COMMON STOCKS (Cost $1,336,186) | | | | | | | 1,371,651_ | |
| | | | | | | | |
| | | | | | | | |
7-Day Yield | | Shares | | | Value (Note 1) | |
SHORT TERM INVESTMENTS (0.48%) | | | | | | | | |
Money Market Fund (0.48%) | | | | | | | | |
Dreyfus Cash Management Fund, Institutional Class 0.129% | | | 9,568 | | | $ | 9,568 | |
| | | | | | | | |
| | |
TOTAL SHORT TERM INVESTMENTS (Cost $9,568) | | | | | | | 9,568 | |
| | | | | | | | |
| | |
TOTAL INVESTMENTS (Cost $1,345,754) (70.17%) | | | | | | $ | 1,381,219 | |
| | |
Other Assets In Excess Of Liabilities (29.83%) | | | | | | | 587,035 | |
| | | | | | | | |
| | |
NET ASSETS (100.00%) | | | | | | $ | 1,968,254 | |
| | | | | | | | |
| (a) | Non-Income Producing Security. |
Common Abbreviations:
Ltd. - Limited.
S&P - Standard & Poor’s.
For Fund compliance purposes, the Fund’s industry classifications refer to any one or more of the industry sub-classifications used by one or more widely recognized market indexes or ratings group indexes, and/or as defined by Fund management. This definition may not apply for purposes of this report, which may combine industry sub-classifications for reporting ease. Industries are shown as a percent of net assets. These industry classifications are based on third party definitions and are unaudited. The definitions are industry terms and do not reflect the legal status of any of the investments or companies in which the Fund has invested.
FUTURES CONTRACTS
At April 30, 2011, the Fund had outstanding futures contracts:
| | | | | | | | | | | | | | | | |
| Description | | Position | | Contracts | | Expiration
Date | | | Value (Note 1) | | | Unrealized
Depreciation | |
Bank of Baroda | | Long | | 4 | | | 5/26/11 | | | | $915,600 | | | | $(1,585) | |
Grasim Industries | | Long | | 2 | | | 5/26/11 | | | | 613,500 | | | | (194) | |
S&P CNX NIFTY Future | | Long | | 48 | | | 5/26/11 | | | | 13,809,120 | | | | (3,446) | |
| | | | | | | | | | | | |
| | | | | | | | | | | $15,338,220 | | | | $(5,225) | |
| | | | | | | | | | | | |
See Notes to Financial Statements.
7 | April 30, 2011
| | | | |
ALPS | Red Rocks Listed Private Equity Fund |
| | | Management Commentary | | April 30, 2011 (Unaudited) |
Overview
The current fiscal year for the ALPS | Red Rocks Listed Private Equity Fund has ended on a very good note. The world economy continues to improve at a slow but steady rate. Many sectors are experiencing business expansion and increases in revenue. Companies have selectively added head count. Materials and labor costs, while increasing, are manageable. And the ability of companies to meet their debt obligations, service their debt and in most cases refinance their debt obligations with equal or better terms has improved. Consumers have responded accordingly; spending has loosened up a bit, especially among those who feel they have job security. The bad news is that the “I” word (as in Inflation with a capital I) has been creeping back into the vernacular. Will it be a problem? No one really knows at this time, but it is something to keep an eye on.
The experience of our portfolio companies and their underlying businesses has been no different. They too have witnessed an uplift in revenue in most cases. Their increase in input costs has been modest. And their ability to refinance debt on very favorable terms is as good as it’s been in years. In essence, their prospects continue to improve in a meaningful way.
The last item of note is mergers and acquisitions activity. In a word, it’s been “robust”. Private equity firms have taken advantage of the favorable confluence of events (as noted above) and have monetized select investments from their portfolio at strong valuations through sales or an Initial Public Offering.
While not everything has been perfect (such as the Middle East unrest, the corresponding increase in oil prices, the Japan earthquake, the tragic tsunami, and the ongoing nuclear disaster), the world feels to us like a more stable place; especially the financial markets. That’s not to say that near term challenges don’t exist. They do. The US government spending and deficit issue, the Euro zone financial institution/sovereign debt situation, and the Chinese currency valuation, coupled with accelerating inflation are examples of fundamental problems that will need to be addressed sooner rather than later.
On balance, we think things feel better than worse, businesses continue to adapt and grow under the new regime, and private equity is benefiting overall.
Portfolio Review
For the annual period ended April 30, 2011, the Fund’s Class A Shares, LPEFX, returned 33.22% at Net Asset Value, (Class A delivered a net return of 25.92% at MOP), compared with 23.82% and 18.25% for the MSCI World Index and the S&P Listed Private Equity Index, respectively.*
* Past Performance does not guarantee future results.
We made a few more changes than usual to the portfolio during the second half of the period, expanding the number of holdings in the portfolio. We exited four holdings: American Capital Ltd, DEA Capital S.P.A., MVC Capital Inc. and RHJ International SA. These amounted to approximately 4.7% of the portfolio’s total holdings. We added ten companies to the portfolio during the quarter: Aker ASA, Apollo Global Management, Bure Equity, LMS Capital, Marfin Investment Group, Pantheon International Participation, Partners Group Holding, Remgro, Safeguard Scientifics Inc. and Schouw. Hence, turnover was a bit higher than in the past. Our focus though has not changed: being long term investors in sponsors of private equity funds where we see good underlying private businesses that have performed well and have the potential to grow in value.
We continue to be pleased with how the portfolio has performed, exceeding our expectations in most instances.
| | | | | | |
Net contributors to performance for the year included: |
KKR & CO LP | | | 2.65 | % | | |
Blackstone Group LP | | | 2.41 | % | | |
Wendel | | | 2.16 | % | | |
|
| Net detractors to performance for the year included: |
Candover Investments PLC | | | -0.53 | % | | |
GP Investments Ltd | | | -0.29 | % | | |
Marfin Investment Group SA | | | -0.19 | % | | |
The Fund has seen little to no deviation in its underlying investments from a diversification standpoint: geographic, industry, vintage and stage of investment. We believe the ALPS | Red Rocks Listed Private Equity Fund continues to provide investors institutional exposure to high quality private equity funds and managers, the cornerstone of our strategy.
Looking Ahead
Before we can look forward, it’s helpful to look back. Six months ago we discussed how uncertainty surrounding the future was THE topic that we heard over and over again. Questions that we posed, and the ensuing answers (assuming they can be believed) have unfolded as follows:
| | » | Are we entering a period of prolonged deflation? We think probably not, unless you’re focused on housing prices and wages in the developed world; two very significant areas when it comes to the health of the consumer. Inflation looks to be more of an issue in basic commodities and foodstuffs. Once again, two very significant areas when it comes to the health of the consumer most everywhere. This has the potential to set up an unpleasant squeeze in the future. |
8 | April 30, 2011
| | | | |
ALPS | Red Rocks Listed Private Equity Fund |
| | | Management Commentary | | April 30, 2011 (Unaudited) |
| | » | When will the consumer come back? Although somewhat tepid, in our view the consumer is slowly coming back, particularly for those who have decent, steady jobs with good credit history/personal balance sheets. |
| | » | What about government spending and taxes? We believe this issue is being addressed, and in some cases (the UK) action is being taken. We are not out of the woods yet, but the discussion (the first step) is taking place. |
| | » | What’s going to happen with China, trade and their currency? This issue is unresolved. We suspect that this will be an ongoing set of issues for years to come. |
| | » | Are Portugal, Italy, Ireland, Greece and Spain real problems that can take the EU down (and the rest of the world?) or just a set of hiccups? So far they appear to us to be hiccups that are contained and manageable. Hopefully it stays this way. |
| | » | How is the developed world going to pay for the ever growing amounts of government debt and unfunded liabilities? This is the elephant in the living room as we like |
| | » | Is the banking system truly fixed and on sustainable ground? With a few notable exceptions, this one appears to us to be “yes”. A good thing. |
»
So far we believe these issues and outcomes have had a minimal, to mostly positive, effect on the Listed Private Equity Fund. We continue to focus not so much on what can go right in the portfolio (that is fairly well defined in our mind), but what can go wrong. While I know we don’t have all of the answers, we have positioned the portfolio to potentially benefit from a world that continues to heal while keeping a watchful eye on the uncertainty that exists.
As always, we appreciate your continued support and interest in Red Rocks and the Listed Private Equity strategy.
Adam Goldman, Co_Portfolio Manager
Performance of $10,000 Initial Investment (as of April 30, 2011)
Comparison of change in value of a $10,000 investment (includes applicable sales loads)
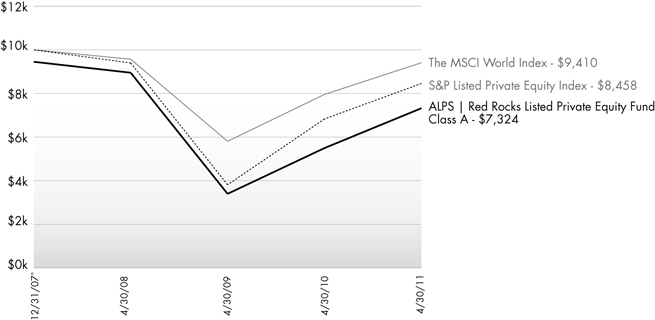
Source: Morningstar
The chart above represents historical performance of a hypothetical investment of $10,000 in the Fund since inception. Past performance does not guarantee future results. This chart does not reflect the deduction of taxes that a shareholder would pay on Fund distributions or the redemption of Fund shares.
9 | April 30, 2011
| | | | |
ALPS | Red Rocks Listed Private Equity Fund |
| | | Management Commentary | | April 30, 2011 (Unaudited) |
Average Annual Total Returns (as of April 30, 2011)
| | | | | | | | | | |
| | | 1 Year | | | | Since Inception^ | | Total Expense Ratio | | What You Pay* |
Class A (NAV)1 | | 33.22% | | | | -7.37% | | 1.86% | | 1.65% |
Class A (MOP)2 | | 25.92% | | | | -8.93% | | | | |
Class C (NAV)1 | | 31.72% | | | | -8.17% | | 2.46% | | 2.40% |
Class C (CDSC)2 | | 30.72% | | | | -8.17% | | |
Class I | | 33.47% | | | | -7.09% | | 1.62% | | 1.40% |
Class R | | 32.47% | | | | -7.83% | | 2.42% | | 1.90% |
MSCI World Index3 | | 23.82% | | | | -1.81% | | | | |
S&P LPE Index4 | | 18.25% | | | | -4.90% | | | | |
Performance data quoted represents past performance. Past performance does not guarantee future results. Investment return and principal value of an investment will fluctuate so that an investor’s shares, when sold or redeemed, may be worth more or less than the original cost. Current performance data may be higher or lower than actual data quoted. The Fund imposes a 2.00% redemption fee on shares held for less than 90 days. The Fund imposes a maximum Contingent Deferred Sales Charge (“CDSC”) of 1.00% to shares redeemed within the first 12 months after a purchase in excess of $1 million. Performance data does not reflect the redemption fee or the CDSC, which if reflected would reduce the performance quoted. For the most current month-end performance data, please call (866) 759-5679.
Maximum Offering Price (MOP) for Class A shares includes the Fund’s maximum sales charge of 5.50%. CDSC performance for Class C shares includes a 1% contingent deferred sales charge (CDSC) on C shares redeemed within 12 months of purchase. Performance shown at NAV does not include these sales charges and would have been lower had it been taken into account.
Performance shown for Class C shares prior to June 30, 2010 reflects the historical performance of the Fund’s Class A shares, calculated using the fees and expenses of Class C shares.
| 1 | Net Asset Value (NAV) is the share price without sales charges. The performance data shown does not reflect the decution of the sales load or the redemption fee or CDSC, and that, if reflected, the load or fee would reduce the performance quoted. |
| 2 | Maximum Offering Price (MOP) includes sales charges. Returns include effects of the Fund’s maximum sales charge of 5.50% for ALPS/Red Rocks Listed Private Equity Fund - A Shares. |
| 3 | MSCI World Index: Morgan Stanley Capital International’s market capitalization weighted index is composed of companies representative of the market structure of 22 developed market countries in North America, Europe and the Asia/Pacific Region. You cannot invest directly in an index. |
| 4 | S&P Listed Private Equity Index: The S&P Listed Private Equity Index is comprised of 30 leading listed private equity companies that meet size, liquidity, exposure, and activity requirements. The index is designed to provide tradable exposure to the leading publicly listed companies in the private equity space. You cannot invest directly in an index. |
| ^ | Fund inception date of 12/31/2007. |
| * | What You Pay reflects the Adviser and Sub-Adviser’s decision to contractually limit expenses through August 31, 2011. Please see the prospectus for additional information. |
The table does not reflect the deduction of taxes that a shareholder would pay on Fund distributions or the redemption of Fund shares.
Listed Private Equity Companies are subject to various risks depending on their underlying investments, which could include, but are not limited to, additional liquidity risk, industry risk, non-U.S. security risk, currency risk, credit risk, managed portfolio risk and derivatives risk (derivatives risk is the risk that the value of the Listed Private Equity Companies’ derivative investments will fall because of pricing difficulties or lack of correlation with the underlying investment).
There are inherent risks in investing in private equity companies, which encompass financial institutions or vehicles whose principal business is to invest in and lend capital to privately held companies. Generally, little public information exists for private and thinly traded companies, and there is a risk that investors may not be able to make a fully informed investment decision.
Listed Private Equity Companies may have relatively concentrated investment portfolios, consisting of a relatively small number of holdings. A consequence of this limited number of investments is that the aggregate returns realized may be adversely impacted by the poor performance of a small number of investments, or even a single investment, particularly if a company experiences the need to write down the value of an investment.
Certain of the Fund’s investments may be exposed to liquidity risk due to low trading volume, lack of a market maker or legal restrictions limiting the ability of the Fund to sell particular securities at an advantageous price and/or time. As a result, these securities may be more difficult to value. Foreign investing involves special risks, such as currency fluctuations and political uncertainty. The Fund invests in derivatives and is subject to the risk that the value of those derivative investments will fall because of pricing difficulties or lack of correlation with the underlying investment.
10 | April 30, 2011
| | | | |
ALPS | Red Rocks Listed Private Equity Fund |
| | | Management Commentary | | April 30, 2011 (Unaudited) |
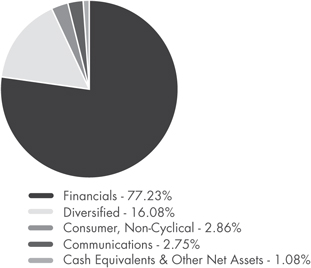
Top Ten Holdings (as a % of Net Assets) †
| | | | | | |
KKR & Co. LP | | | | | 4.79 | % |
Eurazeo | | | | | 4.64 | % |
Onex Corp. | | | | | 4.59 | % |
Blackstone Group LP | | | | | 4.34 | % |
Conversus Capital LP | | | | | 4.17 | % |
3i Group PLC | | | | | 4.10 | % |
Leucadia National Corp. | | | | | 3.96 | % |
SVG Capital PLC | | | | | 3.71 | % |
Investor AB, Class B | | | | | 3.69 | % |
Electra Private Equity PLC | | | | | 3.64 | % |
Top Ten Holdings | | | | | 41.63 | % |
| † | Holdings are subject to change. |
Industry Sector Allocation (as a % of Net Assets)
11 | April 30, 2011
| | | | |
ALPS | Red Rocks Listed Private Equity Fund |
| | | Disclosure of Fund Expenses | | April 30, 2011 (Unaudited) |
As a shareholder of the Fund, you will incur two types of costs: (1) transaction costs, including applicable sales charges (loads) and redemption fees; and (2) ongoing costs, including management fees, distribution and service (12b-1) fees, shareholder service fees and other Fund expenses. The following examples are intended to help you understand your ongoing costs (in dollars) of investing in the Fund and to compare these costs with the ongoing costs of investing in other mutual funds. The examples are based on an investment of $1,000 invested on November 1, 2010 and held until April 30, 2011.
Actual Expenses. The first line of the table on the next page provides information about actual account values and actual expenses. You may use the information in this line, together with the amount you invested, to estimate the expenses that you paid over the period. Simply divide your account value by $1,000 (for example, an $8,600 account value divided by $1,000 = 8.6), then multiply the result by the number in the first line under the heading “Expense Paid During Period” to estimate the expenses you paid on your account during this period.
Hypothetical Example for Comparison Purposes. The second line of the table on the next page provides information about hypothetical account values and hypothetical expenses based on the Fund’s actual expense ratio and an assumed rate of return of 5% per year before expenses, which is not the Fund’s actual return. The hypothetical account values and expenses may not be used to estimate the actual ending account balance or expenses you paid for the period. You may use this information to compare the ongoing costs of investing in the Fund and other mutual funds. To do so, compare this 5% hypothetical example with the 5% hypothetical examples that appear in the shareholder reports of the other funds.
The expenses shown in the table are meant to highlight ongoing Fund costs only and do not reflect transaction fees, such as sales charges, redemption fees, or exchange fees. Therefore, the second line of the table on the next page is useful in comparing ongoing costs only, and may not help you determine the relative total costs of owning different funds. In addition, if these transactional costs were included, your costs would have been higher.
| | | | | | | | | | | | | | | | |
| | | Beginning Account Value
11/1/10 | | | Ending Account Value
4/30/11 | | | Expense
Ratio(a) | | | Expense Paid During Period(b)
11/1/10 - 4/30/11 | |
Class A | | | | | | | | | | | | | | | | |
Actual | | | $1,000.00 | | | | $1,241.00 | | | | 1.50% | | | | $8.33 | |
Hypothetical (5% return before expenses) | | | $1,000.00 | | | | $1,017.36 | | | | 1.50% | | | | $7.50 | |
| | | | |
Class C | | | | | | | | | | | | | | | | |
Actual | | | $1,000.00 | | | | $1,237.50 | | | | 2.25% | | | | $12.48 | |
Hypothetical (5% return before expenses) | | | $1,000.00 | | | | $1,013.64 | | | | 2.25% | | | | $11.23 | |
| | | | |
Class I | | | | | | | | | | | | | | | | |
Actual | | | $1,000.00 | | | | $1,243.70 | | | | 1.25% | | | | $6.95 | |
Hypothetical (5% return before expenses) | | | $1,000.00 | | | | $1,018.60 | | | | 1.25% | | | | $6.26 | |
| | | | |
Class R | | | | | | | | | | | | | | | | |
Actual | | | $1,000.00 | | | | $1,240.80 | | | | 1.75% | | | | $9.72 | |
Hypothetical (5% return before expenses) | | | $1,000.00 | | | | $1,016.12 | | | | 1.75% | | | | $8.75 | |
| (a) | The Fund’s expense ratios have been based on the Fund’s most recent fiscal half-year expenses. |
| (b) | Expenses are equal to the Fund’s annualized expense ratio multiplied by the average account value over the period, multiplied by the number of days in the most recent fiscal half year (181), then divided by 365. |
12 | April 30, 2011
| | | | |
ALPS | Red Rocks Listed Private Equity Fund |
| | | Statement of Investments | | April 30, 2011 |
| | | | | | | | |
| | | Shares | | | Value (Note 1) | |
COMMON STOCKS (98.92%) | | | | | |
Communications (2.75%) | | | | | | | | |
Internet (2.75%) | | | | | | | | |
Internet Capital Group, Inc.(a) | | | 199,000 | | | $ | 2,764,110 | |
Safeguard Scientifics, Inc.(a) | | | 131,797 | | | | 2,576,632 | |
| | | | | | | | |
| | | | | | | 5,340,742 | |
| | | | | | | | |
| | |
TOTAL COMMUNICATIONS | | | | | | | 5,340,742 | |
| | | | | | | | |
| | |
Consumer, Non-Cyclical (2.86%) | | | | | | | | |
Food (2.86%) | | | | | | | | |
Orkla ASA | | | 549,000 | | | | 5,561,573 | |
| | | | | | | | |
| | | | | | | | |
TOTAL CONSUMER, NON-CYCLICAL | | | | | | | 5,561,573 | |
| | | | | | | | |
| | |
Diversified (16.08%) | | | | | | | | |
Holding Companies-Diversified Operations (16.08%) | | | | | | | | |
Ackermans & van Haaren N.V. | | | 50,000 | | | | 5,231,430 | |
Aker ASA, Class A | | | 116,000 | | | | 3,537,529 | |
HAL Trust | | | 35,997 | | | | 5,643,609 | |
Leucadia National Corp. | | | 199,000 | | | | 7,693,340 | |
Remgro, Ltd. | | | 115,000 | | | | 1,994,851 | |
Schouw & Co. | | | 46,603 | | | | 1,383,716 | |
Wendel Investissement | | | 46,200 | | | | 5,787,061 | |
| | | | | | | | |
| | | | | | | 31,271,536 | |
| | | | | | | | |
| | |
TOTAL DIVERSIFIED | | | | | | | 31,271,536 | |
| | | | | | | | |
| | |
Financials (77.23%) | | | | | | | | |
Closed-End Funds (25.35%) | | | | | | | | |
AP Alternative Assets LP | | | 405,000 | | | | 5,240,700 | |
ARC Capital Holdings, Ltd.(a) | | | 2,179,000 | | | | 2,407,795 | |
Candover Investments PLC(a) | | | 149,452 | | | | 1,532,140 | |
Castle Private Equity, Ltd.(a) | | | 88,876 | | | | 893,897 | |
Conversus Capital LP(a) | | | 350,000 | | | | 8,116,500 | |
Electra Private Equity PLC(a) | | | 242,000 | | | | 7,069,854 | |
Graphite Enterprise Trust PLC | | | 496,801 | | | | 3,074,510 | |
HBM BioVentures AG, Class A(a) | | | 53,000 | | | | 2,971,676 | |
HgCapital Trust PLC(a) | | | 47,670 | | | | 141,733 | |
HgCapital Trust PLC | | | 200,932 | | | | 3,792,563 | |
Pantheon International Participations PLC(a) | | | 129,000 | | | | 1,486,771 | |
Pantheon International Participations PLC(a) | | | 71,000 | | | | 844,391 | |
Princess Private Equity Holding, Ltd.(a) | | | 458,365 | | | | 4,338,225 | |
Standard Life European Private Equity Trust PLC | | | 60,671 | | | | 160,626 | |
SVG Capital PLC(a) | | | 1,574,724 | | | | 7,217,616 | |
| | | | | | | | |
| | | | | | | 49,288,997 | |
| | | | | | | | |
Diversified Financial Services (21.09%) | | | | | | | | |
Blackstone Group LP | | | 445,075 | | | | 8,429,720 | |
GP Investments, Ltd.(a) | | | 1,141,000 | | | | 4,699,771 | |
Intermediate Capital Group PLC | | | 1,039,080 | | | | 5,727,541 | |
| | | | | | | | |
| | | Shares | | | Value (Note 1) | |
Diversified Financial Services (Continued) | | | | | | | | |
KKR & Co. LP | | | 491,000 | | | $ | 9,309,360 | |
Onex Corp. | | | 238,000 | | | | 8,929,874 | |
Partners Group Holding AG | | | 18,400 | | | | 3,907,607 | |
| | | | | | | | |
| | | | | | | 41,003,873 | |
| | | | | | | | |
Investment Companies (9.36%) | | | | | | | | |
Bure Equity AB(a) | | | 260,000 | | | | 1,475,891 | |
China Merchants China | | | | | | | | |
Direct Investments, Ltd. | | | 515,600 | | | | 1,129,955 | |
Investor AB, Class B | | | 288,000 | | | | 7,173,249 | |
LMS Capital PLC(a) | | | 745,023 | | | | 785,492 | |
Ratos AB, B Shares | | | 146,000 | | | | 6,033,348 | |
THL Credit, Inc. | | | 110,790 | | | | 1,586,513 | |
| | | | | | | | |
| | | | | | | 18,184,448 | |
| | | | | | | | |
Private Equity (18.56%) | | | | | | | | |
3i Group PLC | | | 1,705,000 | | | | 7,977,058 | |
Altamir Amboise(a) | | | 269,011 | | | | 3,307,104 | |
Apollo Global Management LLC, Class A(a) | | | 194,000 | | | | 3,507,520 | |
Deutsche Beteiligungs AG | | | 65,670 | | | | 1,925,892 | |
Dinamia Capital Privado S.C.R., SA | | | 20,761 | | | | 252,152 | |
Eurazeo | | | 108,300 | | | | 9,021,391 | |
GIMV N.V. | | | 76,018 | | | | 5,039,718 | |
IP Group PLC(a) | | | 1,320,000 | | | | 1,143,656 | |
JAFCO Co., Ltd. | | | 82,000 | | | | 2,077,421 | |
Marfin Investment Group SA(a) | | | 1,742,535 | | | | 1,832,481 | |
| | | | | | | | |
| | | | | | | 36,084,393 | |
| | | | | | | | |
Real Estate (2.87%) | | | | | | | | |
Brookfield Asset Management, Inc., Class A | | | 166,000 | | | | 5,580,920 | |
| | | | | | | | |
| | | | | | | _ | |
TOTAL FINANCIALS | | | | | | | 150,142,631 | |
| | | | | | | | |
| | |
TOTAL COMMON STOCKS (Cost $142,087,162) | | | | | | | 192,316,482 | |
| | | | | | | | |
| | | | | | | | |
| | |
| 7-Day Yield | | Shares | | | Value (Note 1) | |
SHORT TERM INVESTMENTS (1.47%) | | | | | | | | |
Money Market Fund (1.47%) | | | | | | | | |
Dreyfus Treasury Prime Cash Management, Investor Shares 0.00004% | | | 2,865,261 | | | | 2,865,261 | |
| | | | | | | | |
| | |
TOTAL SHORT TERM INVESTMENTS (Cost $2,865,261) | | | | | | | 2,865,261 | |
| | | | | | | | |
| | |
TOTAL INVESTMENTS (100.39%) (Cost $144,952,423) | | | | | | $ | 195,181,743 | |
| | |
Liabilities In Excess Of Other Assets (-0.39%) | | | | | | | (762,225 | ) |
| | | | | | | | |
| | |
NET ASSETS (100.00%) | | | | | | $ | 194,419,518 | |
| | | | | | | | |
13 | April 30, 2011
| | | | |
ALPS | Red Rocks Listed Private Equity Fund |
| | | Statement of Investments | | April 30, 2011 |
(a) Non-Income Producing Security.
Common Abbreviations:
| | |
AB - | | Aktiebolag is the Swedish equivalent of the term corporation. |
AG - | | Aktiengesellschaft is a German term that refers to a corporation that is limited by shares, i.e., owned by shareholders. |
ASA - | | Allmennaksjeselskap is the Norwegian term for a public company. |
LLC - | | Limited Liability Company. |
LP - | | Limited Partnership. |
Ltd. - | | Limited. |
N.V. - | | Naamloze Vennootschap is the Dutch term for a public limited liability corporation. |
PLC - | | Public Limited Company. |
SA - | | Generally designates corporations in various countries, mostly those employing the civil law. This translates literally in all languages mentioned as anonymous company. |
SpA - | | Societá per Azioni is an Italian shared company. |
For Fund compliance purposes, the Fund’s industry classifications refer to any one or more of the industry sub-classifications used by one or more widely recognized market indexes or ratings group indexes, and/or as defined by Fund management. This definition may not apply for purposes of this report, which may combine industry sub-classifications for reporting ease. Industries are shown as a percent of net assets. These industry classifications are based on third party definitions and are unaudited. The definitions are industry terms and do not reflect the legal status of any of the investments or the companies in which the Fund has invested.
See Notes to Financial Statements.
14 | April 30, 2011
| | | | |
ALPS | WMC Value Intersection Fund |
| | | Management Commentary | | April 30, 2011 (Unaudited) |
Market Comment
Markets rose in the second half of 2010 and continued their ascent into 2011 as the first part of the new year was characterized by resilient, upbeat equity markets that shrugged off geopolitical uncertainties and the devastating earthquake and tsunami in Japan. Investors embraced news of strong corporate earnings, robust merger-and-acquisition activity, and ample global liquidity to push equities higher.
Within the Russell 1000 Value Index, all ten sectors posted a positive return with nine of ten sectors recording double-digit gains. Energy, Telecommunication Services, and Materials performed the best. Financials was the only sector to post a single-digit return.
Fund Review
The Portfolio outperformed its benchmark for the period, posting positive results in eight out of ten broad market sectors. Overall, stock selection was positive relative to the Russell 1000 Value Index, with the strongest results coming from the Health Care, Energy, and Financials sectors. This was partially offset by negative relative returns in the Materials, Telecommunication Services, and Consumer Discretionary sectors.
Among the top contributors to relative performance were Marathon Oil (Energy), Caterpillar (Industrials), and TRW Automotive (Consumer Discretionary). Large integrated oil and refining company Marathon Oil’s shares gained after the company announced a plan to separate their refining and oil production businesses. Shares of Caterpillar, a US-based construction and mining equipment firm, rallied in reaction to strong revenue results in their machine, engine, and mining businesses. Auto parts supplier TRW’s shares rose as new business wins, successful cost reductions, and higher levels of vehicle production boosted the firm’s results and guidance. Not holding poor performing benchmark component Berkshire Hathaway (Financials) also contributed to relative results. The stock of this conglomerate lagged during a volatile year, which ended with a high-profile key member of the company resigning.
Verizon Communications (Telecommunication Services), which was not held in the Portfolio during the period, detracted the most from relative results as the stock gained on news that the company would offer the iPhone on its network. Other top detractors from relative performance included The Gap (Consumer Discretionary) and Wells Fargo (Financials). Shares of specialty retailer The Gap declined early in the period after the company issued guidance below analysts’ estimates. Although shares recovered later in the period on strong sales numbers, the stock still underperformed. Wells Fargo, a diversified financial services and bank holding company, retreated early in the period on concerns that weak home-buying activity and new financial regulations would weaken revenue within the Banking industry. Shares rallied later in the period after the company announced strong mortgage banking revenue results and anticipated increases in margins driven by both improving credit quality and synergies from the Wachovia merger.
Outlook
Government spending and inventories accounted for roughly two thirds of the US economy’s growth over the past four quarters. Going forward, we believe that private sector demand will contribute more to growth, primarily spurred by an improving job market. We also see fiscal policy providing additional stimulus to the economy next year as evidenced by the recent tax package which was passed by Congress.
We believe labor market should improve more in 2011 than it did in 2010, providing an important boost to wage and salary income across the economy and supporting consumer spending. The pace of layoffs has slowed with unemployment claims edging decidedly lower; the number of job openings has picked up, and even small businesses are planning to add workers. We believe that the pace of job growth will be sufficient to push the unemployment rate down, but gradually. We also expect the jobless rate to fall by year-end as well as in 2012. Additionally, we see a recovering economy with solid corporate profit growth (and lots of cash on the balance sheet) slated to bring accelerating capital spending in 2011. Improving business confidence, an easier credit environment, the recently legislated 100% depreciation allowance for capital goods purchases in 2012, and a likelihood of significant pent up demand should all add to this positive story.
15 | April 30, 2011
| | | | |
ALPS | WMC Value Intersection Fund |
| | | Management Commentary | | April 30, 2011 (Unaudited) |
Performance of $10,000 Initial Investment (as of April 30, 2011)
Comparison of change in value of a $10,000 investment (includes applicable sales loads)
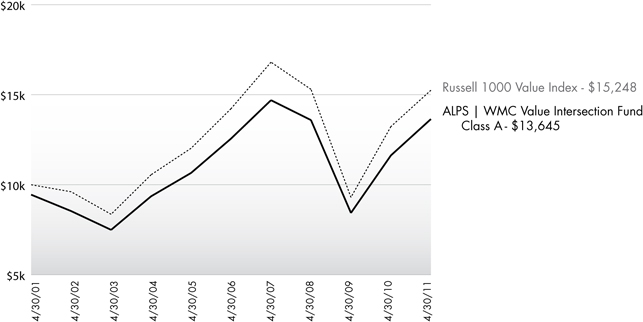
Source: Morningstar
The chart above represents historical performance of a hypothetical investment of $10,000 in the Fund since inception. Past performance does not guarantee future results. This chart does not reflect the deduction of taxes that a shareholder would pay on Fund distributions or the redemption of Fund shares.
16 | April 30, 2011
| | | | |
ALPS | WMC Value Intersection Fund |
| | | Management Commentary | | April 30, 2011 (Unaudited) |
Average Annual Total Returns (as of April 30, 2011)
| | | | | | | | | | |
| | | 1 Year | | 5 Year | | 10 Year | | Total
Expense Ratio | | What You Pay^ |
Class A (NAV)1* | | 17.34% | | 1.67% | | 3.75% | | 1.71% | | 1.41% |
Class A (MOP)2* | | 10.92% | | 0.52% | | 3.16% | | |
Class C (NAV)1* | | 16.52% | | 0.92% | | 2.98% | | 2.46% | | 2.16% |
Class C (CDSC)2* | | 15.52% | | 0.92% | | 2.98% | | |
Class I* | | 17.67% | | 1.86% | | 3.91% | | 1.50% | | 1.16% |
Russell 1000 Value Index3 | | 15.24% | | 1.40% | | 4.31% | | | | |
S&P 500 Index4 | | 17.22% | | 2.95% | | 2.82% | | | | |
Performance data quoted represents past performance. Past performance does not guarantee future results. Investment return and principal value of an investment will fluctuate so that an investor’s shares, when sold or redeemed, may be worth more or less than the original cost. Current performance data may be higher or lower than actual data quoted. The Fund imposes a maximum Contingent Deferred Sales Charge (“CDSC”) of 1.00% to shares redeemed within the first 12 months after a purchase in excess of $1 million. Performance data does not reflect the redemption fee or the CDSC, which if reflected would reduce the performance quoted. For the most current month-end performance data, please call (866) 759-5679.
Maximum Offering Price (MOP) for Class A shares includes the Fund’s maximum sales charge of 5.50%. CDSC performance for Class C shares includes a 1% CDSC on C shares redeemed within 12 months of purchase. Performance shown at NAV does not include these sales charges and would have been lower had it been taken into account.
Performance shown for Class C shares prior to June 30, 2010 reflects the historical performance of the Fund’s Class A shares, calculated using the fees and expenses of Class C shares.
The performance shown for the ALPS | WMC Value Intersection Fund (the “Fund”) for periods prior to August 29, 2009, reflects the performance of the Activa Mutual Funds Trust – Activa Value Fund (as result of a prior reorganization of Activa Mutual Funds Trust – Activa Value Fund into the Fund).
| 1 | Net Asset Value (NAV) is the share price without sales charges. |
| 2 | Maximum Offering Price (MOP) includes sales charges. Class A returns include effects of the Fund’s maximum sales charge of 5.50%. |
| 3 | The Russell 1000 Value Index measures the performance of those Russell 1000 companies with lower price-to-book ratios and lower forecasted growth values. You cannot invest directly in the index. |
| 4 | The S&P 500 Index is the Standard & Poor’s composite index of 500 stocks, a widely recognized, unmanaged index of common stock prices. You cannot invest directly in the index. |
| ^ | What You Pay reflects the Adviser’s decision to contractually limit expenses through August 31, 2011. Please see the prospectus for additional information. |
| * | Fund inception date of 8/10/1971. |
The table does not reflect the deduction of taxes that a shareholder would pay on Fund distributions or the redemption of Fund shares.
Mutual funds, annuities and other investments are not insured or guaranteed by the FDIC or by any other government agency or government sponsored agency of the federal government or any state, not deposits, obligations or guaranteed by any bank or its affiliates and are subject to investment risks, including possible loss of the principal amount invested.
There is no guarantee that the Fund will continue to hold any one particular security or stay invested in any one particular company. The composition of the Fund’s top holdings is subject to change. Performance figures are historical and reflect the change in share price, reinvested distributions, changes in net asset value, sales charges and capital gains distributions, if any.
Investing in the Fund is subject to investment risks, including possible loss of the principal amount invested. Derivatives generally are more sensitive to changes in economic or market conditions than other types of investments; this could result in losses that significantly exceed the Fund’s original investment.
17 | April 30, 2011
| | | | |
ALPS | WMC Value Intersection Fund |
| | | Management Commentary | | April 30, 2011 (Unaudited) |
| | |
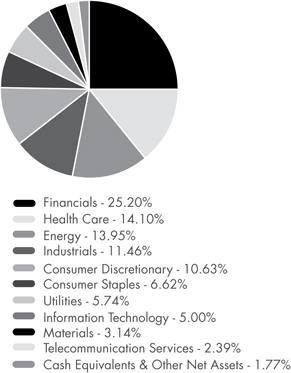
Top Ten Holdings (as a % of Net Assets) † |
| | | | |
Chevron Corp. | | | 3.85% | |
JPMorgan Chase & Co. | | | 3.26% | |
Wells Fargo & Co. | | | 2.91% | |
Pfizer, Inc. | | | 2.90% | |
AT&T, Inc. | | | 2.39% | |
Bank of America Corp. | | | 2.13% | |
Occidental Petroleum Corp. | | | 2.03% | |
Merck & Co., Inc. | | | 1.96% | |
General Electric Co. | | | 1.79% | |
Marathon Oil Corp. | | | 1.71% | |
Top Ten Holdings | | | 24.93% | |
|
† Holdings are subject to change. | |
Industry Sector Allocation (as a % of Net Assets)
18 | April 30, 2011
| | | | |
ALPS | WMC Value Intersection Fund |
| | | Disclosure of Fund Expenses | | April 30, 2011 (Unaudited) |
As a shareholder of the Fund, you will incur two types of costs: (1) transaction costs, including applicable sales charges (loads); and (2) ongoing costs, including management fees, distribution and service (12b-1) fees, shareholder service fees and other Fund expenses. The following examples are intended to help you understand your ongoing costs (in dollars) of investing in the Fund and to compare these costs with the ongoing costs of investing in other mutual funds. The examples are based on an investment of $1,000 invested on November 1, 2010 and held until April 30, 2011.
Actual Expenses. The first line of the table on the next page provides information about actual account values and actual expenses. You may use the information in this line, together with the amount you invested, to estimate the expenses that you paid over the period. Simply divide your account value by $1,000 (for example, an $8,600 account value divided by $1,000 = 8.6), then multiply the result by the number in the first line under the heading “Expense Paid During Period” to estimate the expenses you paid on your account during this period.
Hypothetical Example for Comparison Purposes. The second line of the table on the next page provides information about hypothetical account values and hypothetical expenses based on the Fund’s actual expense ratio and an assumed rate of return of 5% per year before expenses, which is not the Fund’s actual return. The hypothetical account values and expenses may not be used to estimate the actual ending account balance or expenses you paid for the period. You may use this information to compare the ongoing costs of investing in the Fund and other mutual funds. To do so, compare this 5% hypothetical example with the 5% hypothetical examples that appear in the shareholder reports of the other funds.
The expenses shown in the table are meant to highlight ongoing Fund costs only and do not reflect transaction fees, such as sales charges or exchange fees. Therefore, the second line of the table on the next page is useful in comparing ongoing costs only, and may not help you determine the relative total costs of owning different funds. In addition, if these transactional costs were included, your costs would have been higher.
| | | | | | | | | | | | | | | | |
| | | Beginning Account Value
11/1/10 | | | Ending Account Value
4/30/11 | | | Expense
Ratio(a) | | | Expense Paid During Period(b) 11/1/10 - 4/30/11 | |
Class A | | | | | | | | | | | | | | | | |
Actual | | | $1,000.00 | | | | $1,187.80 | | | | 1.40% | | | | $7.59 | |
Hypothetical (5% return before expenses) | | | $1,000.00 | | | | $1,017.85 | | | | 1.40% | | | | $7.00 | |
| | | | |
Class C | | | | | | | | | | | | | | | | |
Actual | | | $1,000.00 | | | | $1,182.60 | | | | 2.15% | | | | $11.64 | |
Hypothetical (5% return before expenses) | | | $1,000.00 | | | | $1,014.13 | | | | 2.15% | | | | $10.74 | |
| | | | |
Class I | | | | | | | | | | | | | | | | |
Actual | | | $1,000.00 | | | | $1,189.40 | | | | 1.15% | | | | $6.24 | |
Hypothetical (5% return before expenses) | | | $1,000.00 | | | | $1,019.09 | | | | 1.15% | | | | $5.76 | |
| (a) | The Fund’s expense ratios have been based on the Fund’s most recent fiscal half-year expenses. |
| (b) | Expenses are equal to the Fund’s annualized expense ratio multiplied by the average account value over the period, multiplied by the number of days in the most recent fiscal half year (181), then divided by 365. |
19 | April 30, 2011
| | | | |
ALPS | WMC Value Intersection Fund |
| | | Statement of Investments | | April 30, 2011 |
| | | | | | | | |
| | | Shares | | | Value (Note 1) | |
COMMON STOCKS (98.23%) | |
Consumer Discretionary (10.63%) | |
Automobiles & Components (2.70%) | | | | | | | | |
Ford Motor Co. (a) | | | 55,200 | | | $ | 853,944 | |
General Motors Co. (a) | | | 14,800 | | | | 474,932 | |
TRW Automotive Holdings Corp. (a) | | | 13,700 | | | | 781,722 | |
| | | | | | | | |
| | | | | | | 2,110,598 | |
| | | | | | | | |
| | |
Consumer Durables & Apparel (0.65%) | | | | | | | | |
Whirlpool Corp. | | | 5,900 | | | | 508,462 | |
| | | | | | | | |
| | |
Consumer Services (0.64%) | | | | | | | | |
Carnival Corp. | | | 13,100 | | | | 498,717 | |
| | | | | | | | |
| | |
Media (3.57%) | | | | | | | | |
CBS Corp., Class B | | | 31,800 | | | | 801,996 | |
News Corp., Class A | | | 41,500 | | | | 739,530 | |
Time Warner Cable, Inc. | | | 16,039 | | | | 1,253,127 | |
| | | | | | | | |
| | | | | | | 2,794,653 | |
| | | | | | | | |
| | |
Retailing (3.07%) | | | | | | | | |
Abercrombie & Fitch Co., Class A | | | 9,900 | | | | 700,920 | |
Guess? Inc | | | 9,000 | | | | 386,910 | |
Kohl’s Corp. | | | 15,690 | | | | 827,020 | |
Lowe’s Cos., Inc. | | | 18,400 | | | | 483,000 | |
| | | | | | | | |
| | | | | | | 2,397,850 | |
| | | | | | | | |
| |
TOTAL CONSUMER DISCRETIONARY | | | | 8,310,280 | |
| | | | | | | | |
| |
Consumer Staples (6.62%) | | | | | |
Food & Staples Retailing (0.62%) | | | | | | | | |
Wal-Mart Stores, Inc. | | | 8,760 | | | | 481,625 | |
| | | | | | | | |
| | |
Food Beverage & Tobacco (4.89%) | | | | | | | | |
Altria Group, Inc. | | | 34,600 | | | | 928,664 | |
Constellation Brands, Inc., Class A (a) | | | 22,600 | | | | 506,014 | |
Dr Pepper Snapple Group, Inc. | | | 14,800 | | | | 580,160 | |
Lorillard, Inc. | | | 7,700 | | | | 820,050 | |
Philip Morris International, Inc. | | | 14,225 | | | | 987,784 | |
| | | | | | | | |
| | | | | | | 3,822,672 | |
| | | | | | | | |
| | |
Household & Personal Products (1.11%) | | | | | | | | |
Kimberly-Clark Corp. | | | 13,200 | | | | 871,992 | |
| | | | | | | | |
| |
TOTAL CONSUMER STAPLES | | | | 5,176,289 | |
| | | | | | | | |
| | | | | | | | |
| | | Shares | | | Value (Note 1) | |
Energy (13.95%) | | | | | |
Energy (13.95%) | | | | | | | | |
Anadarko Petroleum Corp. | | | 13,200 | | | $ | 1,042,008 | |
Apache Corp. | | | 1,600 | | | | 213,392 | |
Baker Hughes, Inc. | | | 12,000 | | | | 928,920 | |
Chesapeake Energy Corp. | | | 21,500 | | | | 723,905 | |
Chevron Corp. | | | 27,519 | | | | 3,011,679 | |
Exxon Mobil Corp. | | | 12,564 | | | | 1,105,632 | |
Hess Corp. | | | 11,100 | | | | 954,156 | |
Marathon Oil Corp. | | | 24,700 | | | | 1,334,788 | |
Occidental Petroleum Corp. | | | 13,900 | | | | 1,588,631 | |
| | | | | | | | |
| | |
TOTAL ENERGY | | | | | | | 10,903,111 | |
| | | | | | | | |
| | |
Financials (25.20%) | | | | | | | | |
Banks (5.99%) | | | | | | | | |
BB&T Corp. | | | 27,610 | | | | 743,261 | |
PNC Financial Services Group, Inc. | | | 13,400 | | | | 835,356 | |
US Bancorp | | | 32,000 | | | | 826,240 | |
Wells Fargo & Co. | | | 78,200 | | | | 2,276,402 | |
| | | | | | | | |
| | | | | | | 4,681,259 | |
| | | | | | | | |
| | |
Diversified Financials (11.45%) | | | | | | | | |
Ameriprise Financial, Inc. | | | 20,400 | | | | 1,266,024 | |
Bank of America Corp. | | | 135,312 | | | | 1,661,631 | |
BlackRock, Inc. | | | 1,900 | | | | 372,286 | |
The Goldman Sachs Group, Inc. | | | 7,700 | | | | 1,162,777 | |
Invesco Ltd. | | | 28,200 | | | | 701,334 | |
JPMorgan Chase & Co. | | | 55,900 | | | | 2,550,717 | |
The NASDAQ OMX Group, Inc. (a) | | | 12,300 | | | | 333,330 | |
NYSE Euronext | | | 9,880 | | | | 395,694 | |
SLM Corp. (a) | | | 30,500 | | | | 505,995 | |
| | | | | | | | |
| | | | | | | 8,949,788 | |
| | | | | | | | |
| | |
Insurance (6.56%) | | | | | | | | |
ACE, Ltd. | | | 15,300 | | | | 1,028,925 | |
Allied World Assurance Co. Holdings, Ltd. | | | 8,900 | | | | 578,233 | |
Everest Re Group, Ltd. | | | 4,900 | | | | 446,488 | |
Genworth Financial, Inc., Class A (a) | | | 35,750 | | | | 435,793 | |
Hartford Financial Services Group, Inc. | | | 29,900 | | | | 866,203 | |
MetLife, Inc. | | | 14,000 | | | | 655,060 | |
Prudential Financial, Inc. | | | 11,400 | | | | 722,988 | |
Unum Group | | | 14,800 | | | | 391,904 | |
| | | | | | | | |
| | | | | | | 5,125,594 | |
| | | | | | | | |
20 | April 30, 2011
| | | | |
ALPS | WMC Value Intersection Fund |
| | | Statement of Investments | | April 30, 2011 |
| | | | | | | | |
| | | Shares | | | Value (Note 1) | |
Real Estate (1.20%) | | | | | | | | |
Forest City Enterprises, Inc., Class A (a) | | | 49,100 | | | $ | 943,211 | |
| | | | | | | | |
| |
TOTAL FINANCIALS | | | | 19,699,852 | |
| | | | | | | | |
| |
Health Care (14.10%) | | | | | |
Health Care Equipment & Services (3.87%) | | | | | | | | |
Aetna, Inc. | | | 17,400 | | | | 720,012 | |
McKesson Corp. | | | 7,700 | | | | 639,177 | |
UnitedHealth Group, Inc. | | | 23,500 | | | | 1,156,905 | |
WellPoint, Inc. | | | 6,610 | | | | 507,582 | |
| | | | | | | | |
| | | | | | | 3,023,676 | |
| | | | | | | | |
Pharmaceuticals, Biotechnology & Life Sciences (10.23%) | | | | | | | | |
Agilent Technologies, Inc. (a) | | | 16,900 | | | | 843,479 | |
Amgen, Inc. (a) | | | 17,950 | | | | 1,020,458 | |
Forest Laboratories,
Inc. (a) | | | 11,228 | | | | 372,320 | |
Gilead Sciences, Inc. (a) | | | 8,700 | | | | 337,908 | |
Merck & Co., Inc. | | | 42,720 | | | | 1,535,784 | |
Pfizer, Inc. | | | 108,123 | | | | 2,266,258 | |
Thermo Fisher Scientific, Inc. (a) | | | 15,110 | | | | 906,449 | |
Watson Pharmaceuticals,
Inc. (a) | | | 11,500 | | | | 713,230 | |
| | | | | | | | |
| | | | | | | 7,995,886 | |
| | | | | | | | |
| |
TOTAL HEALTH CARE | | | | 11,019,562 | |
| | | | | | | | |
| |
Industrials (11.46%) | | | | | |
Capital Goods (10.93%) | | | | | | | | |
3M Co. | | | 4,400 | | | | 427,724 | |
The Boeing Co. | | | 4,900 | | | | 390,922 | |
Caterpillar, Inc. | | | 8,700 | | | | 1,004,067 | |
Dover Corp. | | | 15,000 | | | | 1,020,600 | |
General Dynamics Corp. | | | 10,400 | | | | 757,328 | |
General Electric Co. | | | 68,600 | | | | 1,402,870 | |
Joy Global, Inc. | | | 6,100 | | | | 615,795 | |
Northrop Grumman Corp. | | | 10,400 | | | | 661,544 | |
Parker Hannifin Corp. | | | 9,800 | | | | 924,336 | |
The Timken Co. | | | 9,100 | | | | 513,149 | |
United Technologies Corp. | | | 9,200 | | | | 824,136 | |
| | | | | | | | |
| | | | | | | 8,542,471 | |
| | | | | | | | |
| | |
Transportation (0.53%) | | | | | | | | |
Delta Air Lines, Inc. (a) | | | 39,800 | | | | 413,124 | |
| | | | | | | | |
| |
TOTAL INDUSTRIALS | | | | 8,955,595 | |
| | | | | | | | |
| | | | | | | | |
| | | Shares | | | Value (Note 1) | |
Information Technology (5.00%) | | | | | |
Semiconductors & Semiconductor Equipment (0.72%) | | | | | | | | |
Xilinx, Inc. | | | 16,100 | | | $ | 561,246 | |
| | | | | | | | |
| | |
Software & Services (4.28%) | | | | | | | | |
Accenture PLC, Class A | | | 21,700 | | | | 1,239,721 | |
eBay, Inc. (a) | | | 28,800 | | | | 990,720 | |
Teradata Corp. (a) | | | 10,200 | | | | 570,384 | |
The Western Union Co. | | | 25,600 | | | | 544,000 | |
| | | | | | | | |
| | | | | | | 3,344,825 | |
| | | | | | | | |
| |
TOTAL INFORMATION TECHNOLOGY | | | | 3,906,071 | |
| | | | | | | | |
| |
Materials (3.14%) | | | | | |
Materials (3.14%) | | | | | | | | |
CF Industries Holdings, Inc. | | | 3,160 | | | | 447,298 | |
The Dow Chemical Co. | | | 21,000 | | | | 860,790 | |
Freeport-McMoRan Copper & Gold, Inc. | | | 7,200 | | | | 396,216 | |
Newmont Mining Corp. | | | 5,000 | | | | 293,050 | |
Valspar Corp. | | | 11,700 | | | | 459,927 | |
| | | | | | | | |
| |
TOTAL MATERIALS | | | | 2,457,281 | |
| | | | | | | | |
| | |
Telecommunication Services (2.39%) | | | | | | | | |
Telecommunication Services (2.39%) | | | | | | | | |
AT&T, Inc. | | | 59,945 | | | | 1,865,488 | |
| | | | | | | | |
| |
TOTAL TELECOMMUNICATION SERVICES | | | | 1,865,488 | |
| | | | | | | | |
| | |
Utilities (5.74%) | | | | | | | | |
Utilities (5.74%) | | | | | | | | |
CenterPoint Energy, Inc. | | | 26,200 | | | | 487,320 | |
NextEra Energy, Inc. | | | 14,300 | | | | 808,951 | |
Northeast Utilities | | | 21,600 | | | | 768,960 | |
PG&E Corp. | | | 17,300 | | | | 797,184 | |
UGI Corp. | | | 25,400 | | | | 845,820 | |
Xcel Energy, Inc. | | | 32,000 | | | | 778,560 | |
| | | | | | | | |
| |
TOTAL UTILITIES | | | | 4,486,795 | |
| | | | | | | | |
| |
TOTAL COMMON STOCKS (Cost $60,239,254) | | | | 76,780,324 | |
| | | | | | | | |
| |
EXCHANGE TRADED FUNDS (1.19%) | | | | | |
iShares Russell 1000 Value Index Fund | | | 13,170 | | | | 927,827 | |
| | | | | | | | |
| |
TOTAL EXCHANGE TRADED FUNDS (Cost $847,862) | | | | 927,827 | |
| | | | | | | | |
21 | April 30, 2011
| | | | |
ALPS | WMC Value Intersection Fund |
| | | Statement of Investments | | April 30, 2011 |
| | | | | | | | |
| 7-Day Yield | | Shares | | | Value (Note 1) | |
SHORT TERM INVESTMENTS (0.62%) | | | | | |
Money Market Fund (0.62%) | | | | | |
Fidelity Institutional Money Market - Money Market Portfolio - Class I 0.187% | | | 488,304 | | | $ | 488,304 | |
| | | | | | | | |
| |
TOTAL SHORT TERM INVESTMENTS (Cost $488,304) | | | | 488,304 | |
| | | | | | | | |
| |
TOTAL INVESTMENTS (100.04%) (Cost $61,575,420) | | | $ | 78,196,455 | |
| |
Liabilities In Excess Of Other Assets (-0.04%) | | | | (32,443 | ) |
| | | | | | | | |
| |
NET ASSETS (100.00%) | | | $ | 78,164,012 | |
| | | | | | | | |
| (a) | Non-Income Producing Security. |
Common Abbreviations:
Ltd. - Limited.
PLC - Public Limited Company.
For Fund compliance purposes, the Fund’s industry classifications refer to any one or more of the industry sub-classifications used by one or more widely recognized market indexes or ratings group indexes, and/or as defined by Fund management. This definition may not apply for purposes of this report, which may combine industry sub-classifications for reporting ease. Industries are shown as a percent of net assets. These industry classifications are based on third party definitions and are unaudited. The definitions are industry terms and do not reflect the legal status of any of the investments or the companies in which the Fund has invested.
See Notes to Financial Statements.
22 | April 30, 2011
| | | | |
Clough China Fund |
| | | Management Commentary | | April 30, 2011 (Unaudited) |
For the 1-year performance, the Clough China Fund returned 16.00% compared to an 11.50% return for the MSCI China Index (“MSCI China”). Through the four month period ended 4/30/2011, the Clough China Fund returned 3.85%. It underperformed the MSCI China, which returned 4.55%. The investment environment in China during the first three months of 2011 was negatively impacted by the following factors:
| | » | China Central Bank hiked commercial banks’ reserve ratio three times, up to 20% for larger banks. It also lifted its benchmark lending and deposit rates by 25 basis points (bps)^. A series of property tightening policies were adopted by cities – such as property tax trial programs and limits imposed on the number of properties owned by residents and non-residents. |
| | » | Consumer price rises were kept under 5% year-over-year (YoY)^^ in the first two months. February trade balance showed a deficit of $7.3 Billion that was the largest one recorded in 7 years. However, one key indicator of global activity levels strengthened at the end of the quarter: the Purchasing Manager Index rebounded in March after a fall in February. |
| | » | The earthquake, tsunami and resulting nuclear crisis in Japan shocked an already fragile market confidence. |
| | » | Tight liquidity and inflation concerns pushed investors to switch out of small and mid-sized capitalizations into large, more liquid names. |
On the other hand, the corporate earnings reporting season in March revealed generally good results for last year. According to UBS (UBS Investment Research, China Market Strategy April 1, 2011), among MSCI China companies, 27% beat analysts’ consensus while only 10% missed and the 2010 YoY growth for total net profits was 35%. Results were particularly strong and better than expected in financial sectors – banks, insurance and property - as well as for mining companies. These data, and encouraging trends for the beginning of 2011 unveiled by the State Owned Enterprises (SOE’s – companies owned by the Chinese government) whose profits rose 29.4% in January – February triggered an improvement in the market sentiment in March, when the index rebounded 5.3% to finish the quarter in positive territory. New themes and preferred sectors emerged with strong performances. It was especially the case with cement stocks who are one of the major beneficiaries of the speeding up of affordable housing construction as well as a consolidation policy engineered by the government and higher selling prices.
Portfolio Composition
The Clough China Fund was penalized in the first quarter of 2011 by its relatively large exposure to small and mid-sized stocks and needed some time to reorganize and adjust its
structure. In terms of sectors, consumer discretionary and energy were the main detractors and a prudent high cash holding appears to have been a drag. On the other hand, telecommunication services were a outperformer followed by consumer staples and industrials.
Looking at individual stocks, the 3 major positive contributors in Q1 2011 were:
| | » | Industrial & Commercial Bank of China – the largest Chinese commercial bank - who reported a strong 28% rise in 2010 net earnings with good fundamental asset quality, very low nonperforming loans (NPL)* and high provisioning and whose management gave a very confident guidance on 2011. |
| | » | China Telecom who continued to deliver an excellent execution as 2010 operating revenue rose 5.4% but net profit grew 15%. Mobile business was a key growth driver, showing 90 million mobile subscribers, while the decline in fixed-lines was limited and costs kept under strict control. |
| | » | Anhui Conch Cement, leader of China’s cement industry, whose 2010 results up 76% confirmed margin improvement trends and who more recently announced a 150-170% jump in its bottom line for the 1Q2011. |
Major detractors were:
| | » | Sa Sa International, the leading cosmetics retailer in Hong Kong, whose share price appreciated 82% last year, suffered from profit taking without any specific bad news on the stock. |
| | » | Dongfang Electric, leading nuclear power equipment supplier, fell heavily after the Japanese nuclear crisis and after Beijing government announced a review of its previous development plans for the nuclear power industry. This holding has been sold out – with accumulated profits to the fund. |
| | » | Man Wah Holdings, a leading recliner sofa manufacturer in the US and China, was in a situation very similar to Sa Sa mentioned above. Its share price almost doubled in 2010 after its Initial Public Offering (IPO)** in April, it is a mid-sized cap – at about $1.4 to $1.5 Billion – and it was the victim of profit taking by international investors whereas no disappointing or worrying news came out specifically on its earnings or outlook. |
Outlook
Given recent strong corporate results for 2010 that led to forecast upgrades for the current year and next, we believe Chinese equities are now reasonably valued at about 11 to 11.5x P/E† 2012, below their long term average of 12.5x
23 | April 30, 2011
| | | | |
| Clough China Fund |
| | | Management Commentary | | April 30, 2011 (Unaudited) |
(Deutsche Bank estimates, April 2011). Macro data have signaled a slowdown in the growth of monetary aggregates and bank lending; meaning the government tightening policy has actually started to show some results. The rise in crude oil prices, aggravated by the political crisis in North Africa, may ignite inflation fears again and trigger 1 or 2 new rate hikes in coming months but they have been widely anticipated and should not lead to significant revisions of the growth outlook. Thanks to 15-20% annual increases in wages and personal income, as well as infrastructure spending plans focused on high speed trains, subways and so on, China has many means to achieve its target of 8% Gross Domestic Product (GDP)†† growth
for this year and 7% on average for the 5 years of the 12th Plan1 from 2011 to 2015. We believe opportunities to invest in China’s growing wealth will continue to expand through a large number of new IPOs that will increase the size of Chinese equity markets and make them more and more impossible to ignore for investors. The Fund has been repositioned in line with what we believe the new market momentum is for 2011 while keeping its fundamental convictions for the long term, favoring Chinese domestic demand and healthy financial groups. The Fund’s cash holding has been cut to put more money at work in the market. Our managers remain confident of a strong upside potential for the coming months.
| ^ | A unit that is equal to 1/100th of 1%. |
| ^^ | A method of evaluating two or more measured events to compare the results at one time period with those from another time period (or series of time periods), on an annualized basis. |
| * | Loans that are in default or close to being in default. |
| ** | The first sale of stock by a private company to the public. |
| † | Price-to-earnings ratio is a valuation ratio of a company’s current share price compared to its per-share earnings. |
| †† | The monetary value of all the finished goods and services produced within a country’s borders in a specific time period, though GDP is usually calculated on an annual basis. |
| 1 | The Five-Year Plans of People’s Republic of China are a series of economic development initiatives. The Twelfth Five-Year Plan (12th Plan) seeks to: address rising inequality and create an environment for more sustainable growth by prioritizing more equitable wealth distribution, increased domestic consumption, and improved social infrastructure and social safety nets. |
Performance of $10,000 Initial Investment (as of April 30, 2011)
Comparison of change in value of a $10,000 investment (includes applicable sales loads)
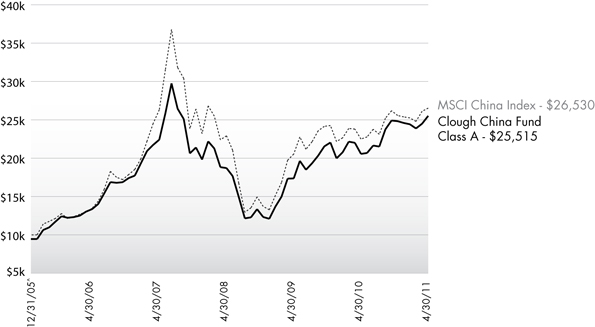
The chart above represents historical performance of a hypothetical investment of $10,000 in the Fund since inception. Past performance does not guarantee future results. This chart does not reflect the deduction of taxes that a shareholder would pay on Fund distributions or the redemption of Fund shares.
24 | April 30, 2011
| | | | |
| Clough China Fund |
| | | Management Commentary | | April 30, 2011 (Unaudited) |
Average Annual Total Returns (as of April 30, 2011)
| | | | | | | | | | | | |
| | | 1 Year | | 3 Year | | 5 Year | | Since Inception^ | | Total
Expense Ratio | | What You Pay* |
Class A (NAV)1 | | 16.00% | | 4.76% | | 15.49% | | 20.47% | | 2.25% | | 1.86% |
Class A (MOP)2 | | 9.61% | | 2.81% | | 14.20% | | 19.21% | | |
Class C (NAV)1 | | 15.13% | | 3.94% | | 14.62% | | 19.59% | | 3.19% | | 2.71% |
Class C (CDSC)2 | | 14.13% | | 3.94% | | 14.62% | | 19.59% | | |
Class I3 | | 16.45% | | 5.26% | | 16.07% | | 21.10% | | 1.87% | | 1.41% |
MSCI China Index4 | | 11.50% | | -0.36% | | 14.68% | | 20.07% | | | | |
Performance data quoted represents past performance. Past performance does not guarantee future results. Investment return and principal value of an investment will fluctuate so that an investor’s shares, when sold or redeemed, may be worth more or less than the original cost. Current performance data may be higher or lower than actual data quoted. The Fund imposes a 2.00% redemption fee on shares held for less than 90 days. The Fund imposes a maximum Contingent Deferred Sales Charge (“CDSC”) of 1.00% to shares redeemed within the first 12 months after a purchase in excess of $1 million. Performance data does not reflect the redemption fee or the CDSC, which if reflected would reduce the performance quoted. For the most current month-end performance data, please call (877)256-8445.
The performance shown for the Clough China Fund for periods prior to January 15, 2010, reflects the performance of the Old Mutual China Fund, a series of Old Mutual Funds I (as a result of a prior reorganization of the Old Mutual China Fund into the Clough China Fund).
| 1 | Net Asset Value (NAV) is the share price without sales charges. |
| 2 | Maximum Offering Price (MOP) includes sales charges. Class A returns include effects of the Fund’s maximum sales charge of 5.50%; Class C returns include the 1.00% CDSC. |
| 3 | Prior to close of business on January 15, 2010, Class I was known as Institutional Class of the Old Mutual China. |
| 4 | The Morgan Stanley Capital International (“MSCI”) China Index is constructed according to the MSCI Global Investable Market Index (GIMI) family. The MSCI China Index is part of the MSCI Emerging Markets Index. An investor may not invest directly in the index. |
| ^ | Fund Inception date of 12/30/2005. |
| * | What You Pay reflects the Adviser’s decision to contractually limit expenses through August 31, 2012. Please see the prospectus for additional information. |
Effective January 1, 2011, the Adviser has given a contractual agreement to limit the operating expenses of the Fund (excluding underlying fund fees and expenses, interest, taxes, brokerage costs and commissions, dividend and interest expense on short sales, litigation, indemnification and extraordinary expenses as determined under generally accepted accounting principles) to an annual rate of 2.75% for Class I shares, 3.00% for Class A shares, and 3.75% for Class C shares through December 31, 2018. ALPS Advisors will consider further reductions to these limits on an annual basis. Without this agreement, expenses would be higher.
The table does not reflect the deduction of taxes that a shareholder would pay on Fund distributions or the redemption of Fund shares.
Investing in the Fund is subject to investment risks, including possible loss of the principal amount invested.
Investing in China, Hong Kong and Taiwan involves risk and considerations not present when investing in more established securities markets. The Fund may be more susceptible to the economic, market, political and local risks of these regions than a fund that is more geographically diversified.
This Fund is not suitable for all investors.
25 | April 30, 2011
| | | | |
Clough China Fund |
| | | Management Commentary | | April 30, 2011 (Unaudited) |
| | | | |
Top Ten Holdings (as a % of Net Assets) † | |
Industrial & Commercial Bank of China, Class H | | | 8.11 | % |
China Construction Bank Corp., Class H | | | 6.78 | % |
CNOOC, Ltd. | | | 3.96 | % |
China Telecom Corp., Ltd., Class H | | | 3.71 | % |
Zhaojin Mining Industry Co., Ltd., Class H | | | 3.53 | % |
Anhui Conch Cement Co., Ltd., Class H | | | 3.38 | % |
SA SA International Holdings, Ltd. | | | 3.02 | % |
Ping An Insurance Group Co. of China, Ltd., Class H | | | 2.85 | % |
China State Construction International Holdings, Ltd. | | | 2.79 | % |
China Shenhua Energy Co., Ltd., Class H | | | 2.77 | % |
Top Ten Holdings | | | 40.90 | % |
| † | Holdings are subject to change. |
| | |
Industry Sector Allocation (as a % of Net Assets) |
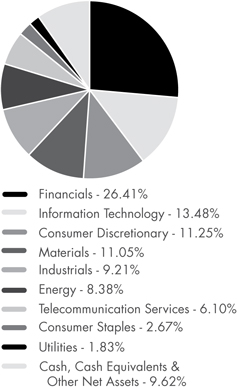
26 | April 30, 2011
| | | | |
Clough China Fund |
| | | Disclosure of Fund Expenses | | April 30, 2011 (Unaudited) |
As a shareholder of the Fund you will incur two types of costs: (1) transaction costs, including applicable sales charges (loads) and redemption fees; and (2) ongoing costs, including management fees, distribution and service (12b-1) fees, shareholder service fees and other Fund expenses. The following examples are intended to help you understand your ongoing costs (in dollars) of investing in the Fund and to compare these costs with the ongoing costs of investing in other mutual funds. The examples are based on an investment of $1,000 invested on November 1, 2010 and held until April 30, 2011.
Actual Expenses. The first line of the table on the next page provides information about actual account values and actual expenses. You may use the information in this line, together with the amount you invested, to estimate the expenses that you paid over the period. Simply divide your account value by $1,000 (for example, an $8,600 account value divided by $1,000 = 8.6), then multiply the result by the number in the first line under the heading “Expense Paid During Period” to estimate the expenses you paid on your account during this period.
Hypothetical Example for Comparison Purposes. The second line of the table on the next page provides information about hypothetical account values and hypothetical expenses based on the Fund’s actual expense ratio and an assumed rate of return of 5% per year before expenses, which is not the Fund’s actual return. The hypothetical account values and expenses may not be used to estimate the actual ending account balance or expenses you paid for the period. You may use this information to compare the ongoing costs of investing in the Fund and other mutual funds. To do so, compare this 5% hypothetical example with the 5% hypothetical examples that appear in the shareholder reports of the other funds.
The expenses shown in the table are meant to highlight ongoing Fund costs only and do not reflect transaction fees, such as sales charges, redemption fees or exchange fees. Therefore, the second line of the table on the next page is useful in comparing ongoing costs only, and may not help you determine the relative total costs of owning different funds. In addition, if these transactional costs were included, your costs would have been higher.
| | | | | | | | | | | | | | |
| | | Beginning Account Value 11/1/10 | | | Ending Account Value 4/30/11 | | | Expense Ratio(a) | | | Expense Paid During Period(b) 11/1/10 - 4/30/11 |
Class A | | | | | | | | | | | | | | |
Actual | | | $1,000.00 | | | | $1,025.30 | | | | 1.91% | | | $9.62 |
Hypothetical (5% return before expenses) | | | $1,000.00 | | | | $1,015.30 | | | | 1.91% | | | $9.57 |
| | | | |
Class C | | | | | | | | | | | | | | |
Actual | | | $1,000.00 | | | | $1,020.60 | | | | 2.70% | | | $13.53 |
Hypothetical (5% return before expenses) | | | $1,000.00 | | | | $1,011.41 | | | | 2.70% | | | $13.47 |
Class I | | | | | | | | | | | | | | |
Actual | | | $1,000.00 | | | | $1,026.70 | | | | 1.60% | | | $8.05 |
Hypothetical (5% return before expenses) | | | $1,000.00 | | | | $1,016.85 | | | | 1.60% | | | $8.01 |
| (a) | The Fund’s expense ratios have been based on the Fund’s most recent fiscal half-year expenses. |
| (b) | Expenses are equal to the Fund’s annualized expense ratio multiplied by the average account value over the period, multiplied by the number of days in the most recent fiscal half year (181), then divided by 365. |
27 | April 30, 2011
| | | | |
Clough China Fund |
| | | Statement of Investments | | April 30, 2011 |
| | | | | | | | |
| | | Shares | | | Value (Note 1) | |
COMMON STOCKS (90.38%) | |
Consumer Discretionary (11.25%) | |
Auto Components (1.58%) | | | | | | | | |
Xinyi Glass Holdings, Ltd. | | | 1,340,000 | | | $ | 1,618,387 | |
| | | | | | | | |
| | |
Automobiles (1.05%) | | | | | | | | |
Brilliance China Automotive Holdings, Ltd. (a) | | | 1,100,000 | | | | 1,074,356 | |
| | | | | | | | |
| | |
Household Durables (1.15%) | | | | | | | | |
China Overseas Grand Oceans Group,
Ltd. (a) | | | 278,000 | | | | 393,755 | |
Man Wah Holdings, Ltd. | | | 636,194 | | | | 788,787 | |
| | | | | | | | |
| | | | | | | 1,182,542 | |
| | | | | | | | |
Multiline Retail (0.73%) | | | | | | | | |
Golden Eagle Retail Group, Ltd. | | | 283,000 | | | | 743,669 | |
| | | | | | | | |
| | |
Specialty Retail (5.21%) | | | | | | | | |
Belle International Holdings, Ltd. | | | 318,000 | | | | 622,406 | |
China ZhengTong Auto Services Holdings, Ltd. (a) | | | 913,000 | | | | 1,033,352 | |
Hengdeli Holdings, Ltd. | | | 984,000 | | | | 590,951 | |
SA SA International Holdings, Ltd. | | | 5,162,000 | | | | 3,096,834 | |
| | | | | | | | |
| | | | | | | 5,343,543 | |
| | | | | | | | |
| | |
Textiles, Apparel & Luxury Goods (1.53%) | | | | | | | | |
Ports Design, Ltd. | | | 223,500 | | | | 616,680 | |
| | |
Trinity, Ltd. | | | 884,000 | | | | 956,832 | |
| | | | | | | | |
| | | | | | | 1,573,512 | |
| | | | | | | | |
| | |
TOTAL CONSUMER DISCRETIONARY | | | | | | | 11,536,009 | |
| | | | | | | | |
| | |
Consumer Staples (2.67%) | | | | | | | | |
Food & Staples Retailing (1.21%) | | | | | | | | |
China Resources Enterprise, Ltd. | | | 306,000 | | | | 1,235,686 | |
| | | | | | | | |
Food Products (1.13%) | | | | | | | | |
Shenguan Holdings Group, Ltd. | | | 874,300 | | | | 1,162,795 | |
| | | | | | | | |
Personal Products (0.33%) | | | | | | | | |
Magic Holdings International, Ltd. (a) | | | 564,000 | | | | 338,055 | |
| | | | | | | | |
TOTAL CONSUMER STAPLES | | | | | | | 2,736,536 | |
| | | | | | | | |
| | |
Energy (8.38%) | | | | | | | | |
Oil, Gas & Consumable Fuels (8.38%) | | | | | | | | |
China Petroleum & Chemical Corp., Class H | | | 1,677,000 | | | | 1,690,355 | |
| | | | | | | | |
| | | Shares | | | Value (Note 1) | |
Oil, Gas & Consumable Fuels (Continued) | | | | | | | | |
China Shenhua Energy Co., Ltd., Class H | | | 609,000 | | | $ | 2,844,439 | |
CNOOC, Ltd. | | | 1,633,000 | | | | 4,058,945 | |
| | | | | | | | |
| | | | | | | 8,593,739 | |
| | | | | | | | |
| | |
TOTAL ENERGY | | | | | | | 8,593,739 | |
| | | | | | | | |
| | |
Financials (26.41%) | | | | | | | | |
Commercial Banks (19.12%) | | | | | | | | |
Bank of China, Ltd., Class H | | | 3,845,300 | | | | 2,128,265 | |
China Construction Bank Corp., Class H | | | 7,345,080 | | | | 6,955,187 | |
HSBC Holdings PLC | | | 203,200 | | | | 2,211,216 | |
Industrial & Commercial Bank of China, Class H | | | 9,797,967 | | | | 8,310,720 | |
| | | | | | | | |
| | | | | | | 19,605,388 | |
| | | | | | | | |
Insurance (3.97%) | | | | | | | | |
China Life Insurance Co., Ltd., Class H | | | 321,000 | | | | 1,147,387 | |
Ping An Insurance Group Co. of China, Ltd., Class H | | | 268,000 | | | | 2,921,993 | |
| | | | | | | | |
| | | | | | | 4,069,380 | |
| | | | | | | | |
Real Estate Management & Development (3.32%) | | | | | | | | |
Cheung Kong Holdings, Ltd. | | | 58,000 | | | | 915,382 | |
China Overseas Land & Investment, Ltd. | | | 610,000 | | | | 1,177,012 | |
Evergrande Real Estate Group, Ltd. | | | 1,055,000 | | | | 754,384 | |
Wharf Holdings, Ltd. | | | 75,900 | | | | 556,974 | |
| | | | | | | | |
| | | | | | | 3,403,752 | |
| | | | | | | | |
| | |
TOTAL FINANCIALS | | | | | | | 27,078,520 | |
| | | | | | | | |
| | |
Industrials (9.21%) | | | | | | | | |
Commercial Services & Supplies (1.62%) | | | | | | | | |
China Everbright International, Ltd. | | | 3,703,000 | | | | 1,664,294 | |
| | | | | | | | |
| | |
Construction & Engineering (3.34%) | | | | | | | | |
China Communications Construction Co., Ltd., Class H | | | 615,000 | | | | 569,613 | |
China State Construction International Holdings, Ltd. | | | 2,917,800 | | | | 2,856,053 | |
| | | | | | | | |
| | | | | | | 3,425,666 | |
| | | | | | | | |
| | |
Industrial Conglomerates (1.39%) | | | | | | | | |
Hutchison Whampoa, Ltd. | | | 125,000 | | | | 1,429,564 | |
| | | | | | | | |
28 | April 30, 2011
| | | | |
Clough China Fund |
| | | Statement of Investments | | April 30, 2011 |
| | | | | | | | |
| | | Shares | | | Value (Note 1) | |
Transportation Infrastructure (2.86%) | | | | | | | | |
COSCO Pacific, Ltd. | | | 1,010,000 | | | $ | 2,096,560 | |
Jiangsu Expressway Co., Ltd., Class H | | | 783,000 | | | | 830,532 | |
| | | | | | | | |
| | | | | | | 2,927,092 | |
| | | | | | | | |
| | |
TOTAL INDUSTRIALS | | | | | | | 9,446,616 | |
| | | | | | | | |
| | |
Information Technology (13.48%) | | | | | | | | |
Communications Equipment (3.15%) | | | | | | | | |
Comba Telecom Systems Holdings, Ltd. | | | 1,374,661 | | | | 1,721,439 | |
VTech Holdings, Ltd. | | | 132,100 | | | | 1,508,754 | |
| | | | | | | | |
| | | | | | | 3,230,193 | |
| | | | | | | | |
| | |
Computers & Peripherals (0.64%) | | | | | | | | |
Lenovo Group, Ltd. | | | 1,122,000 | | | | 654,773 | |
| | | | | | | | |
| | |
Internet Software & Services (3.64%) | | | | | | | | |
Baidu, Inc., ADR (a) | | | 5,100 | | | | 757,452 | |
Qihoo 360 Technology | | | | | | | | |
Co., Ltd., ADR (a) | | | 11,059 | | | | 315,182 | |
Tencent Holdings, Ltd. | | | 93,100 | | | | 2,658,388 | |
| | | | | | | | |
| | | | | | | 3,731,022 | |
| | | | | | | | |
| | |
Semiconductors & Semiconductor Equipment (4.50%) | | | | | | | | |
Comtec Solar Systems Group, Ltd. | | | 3,398,227 | | | | 2,035,633 | |
GCL Poly Energy Holdings, Ltd. (a) | | | 2,550,000 | | | | 1,826,970 | |
Trina Solar, Ltd.,
ADR (a) | | | 26,200 | | | | 746,438 | |
| | | | | | | | |
| | | | | | | 4,609,041 | |
| | | | | | | | |
| | |
Software (1.55%) | | | | | | | | |
Kingdee International Software Group Co., Ltd. | | | 2,479,200 | | | | 1,591,508 | |
| | | | | | | | |
| | |
TOTAL INFORMATION TECHNOLOGY | | | | | | | 13,816,537 | |
| | | | | | | | |
| | |
Materials (11.05%) | | | | | | | | |
Chemicals (0.80%) | | | | | | | | |
Lee & Man Holdings, Ltd. | | | 670,000 | | | | 817,777 | |
| | | | | | | | |
| | |
Construction Materials (5.29%) | | | | | | | | |
Anhui Conch Cement Co., Ltd., Class H | | | 730,500 | | | | 3,463,499 | |
Asia Cement China Holdings Corp. | | | 802,500 | | | | 653,955 | |
TCC International Holdings, Ltd. | | | 2,158,000 | | | | 1,305,734 | |
| | | | | | | | |
| | | | | | | 5,423,188 | |
| | | | | | | | |
| | | | | | | | |
| | | Shares | | | Value (Note 1) | |
Metals & Mining (4.38%) | | | | | | | | |
Maanshan Iron & Steel Co., Ltd., Class H | | | 1,641,000 | | | $ | 867,615 | |
Zhaojin Mining Industry Co., Ltd., Class H (a) | | | 781,000 | | | | 3,623,186 | |
| | | | | | | | |
| | | | | | | 4,490,801 | |
| | | | | | | | |
| | |
Paper & Forest Products (0.58%) | | | | | | | | |
Lee & Man Paper Manufacturing, Ltd. | | | 824,000 | | | | 593,365 | |
| | | | | | | | |
| | |
TOTAL MATERIALS | | | | | | | 11,325,131 | |
| | | | | | | | |
| | |
Telecommunication Services (6.10%) | | | | | | | | |
Diversified Telecommunication (3.72%) | | | | | | | | |
China Telecom Corp., Ltd., Class H | | | 6,544,000 | | | | 3,807,549 | |
| | | | | | | | |
| | |
Wireless Telecommunication Services (2.38%) | | | | | | | | |
China Mobile, Ltd. | | | 212,900 | | | | 1,958,356 | |
SmarTone Telecommunications Holdings, Ltd. | | | 312,000 | | | | 483,420 | |
| | | | | | | | |
| | | | | | | 2,441,776 | |
| | | | | | | | |
| | |
TOTAL TELECOMMUNICATION SERVICES | | | | | | | 6,249,325 | |
| | | | | | | | |
| | |
Utilities (1.83%) | | | | | | | | |
Independent Power Producers & Energy Traders (1.83%) | | | | | | | | |
China Longyuan Power Group Corp., Class H | | | 1,820,000 | | | | 1,875,435 | |
| | | | | | | | |
| | |
TOTAL UTILITIES | | | | | | | 1,875,435 | |
| | | | | | | | |
| | |
TOTAL COMMON STOCKS (Cost $75,721,794) | | | | | | | 92,657,848 | |
| | | | | | | | |
| | |
RIGHTS (0.12%) | | | | | | | | |
China State Construction International Holdings, Ltd., strike price 6 HKD, Expires 5/5/11 (a) | | | 583,560 | | | | 117,971 | |
| | | | | | | | |
| | |
TOTAL RIGHTS (Cost $0) | | | | | | | 117,971 | |
| | | | | | | | |
29 | April 30, 2011
| | | | |
Clough China Fund |
| | | Statement of Investments | | April 30, 2011 |
| | | | | | | | |
| 7-Day Yield | | Shares | | | Value (Note 1) | |
SHORT-TERM INVESTMENTS (4.99%) | |
Money Market Fund (4.99%) | |
Dreyfus Cash Management Fund, Institutional Class 0.102% | | | 5,113,117 | | | $ | 5,113,117 | |
| | | | | | | | |
| |
TOTAL SHORT-TERM INVESTMENTS (Cost $5,113,117) | | | | 5,113,117 | |
| | | | | | | | |
| |
TOTAL INVESTMENTS (95.49%) (Cost $80,834,911) | | | $ | 97,888,936 | |
| |
Other Assets In Excess Of Liabilities (4.51%) | | | | 4,628,659 | |
| | | | | | | | |
| |
NET ASSETS (100.00%) | | | $ | 102,517,595 | |
| | | | | | | | |
| (a) | Non-Income Producing Security. |
Common Abbreviations:
ADR - American Depositary Receipt.
Ltd. - Limited.
For Fund compliance purposes, the Fund’s industry classifications refer to any one or more of the industry sub-classifications used by one or more widely recognized market indexes or ratings group indexes, and/or as defined by Fund management. This definition may not apply for purposes of this report, which may combine industry sub-classifications for reporting ease. Industries are shown as a percent of net assets. These industry classifications are based on third party definitions and are unaudited. The definitions are industry terms and do not reflect the legal status of any of the investments or the companies in which the Fund has invested.
See Notes to Financial Statements.
30 | April 30, 2011
| | | | |
| Jefferies Asset Management Commodity Strategy Allocation Fund |
| | | Management Commentary | | April 30, 2011 (Unaudited) |
For the period ending April 30, 2011, the Jefferies Asset Management Commodity Strategy Allocation Fund (the “Fund”) continued to outperform an already buoyant commodity market. Since inception, June 29, 2010, the Fund’s Class I Shares, JCRIX, delivered a return of 51.74% (Class A, JCRAX, was up 43.11% at MOP and Class C, JCRCX, was up 49.90% with CDSC) for the period. Commodity prices have risen significantly higher over the period. As of April 30, 2011, the Fund outperformed its Benchmark, the Thomson Reuters/Jefferies CRB Total Return Index (the “TR/J CRB Index”) (+44.76%) 698 basis points^ since inception.
The Fund’s strategy to reduce the corrosive effects of commodity contango^^ (or costs associated with replacing expiring futures contacts when new contacts are more expensive) by combining commodity futures related investments (collateralized by Treasury Inflation-Protected Securities (“TIPS”), commodity equities, and where appropriate, physical commodity ETFs were effective this quarter. The Fund’s combination of these assets contributed to the outperformance relative to its Benchmark. During most of the quarter, the Fund assets were invested in approximately 64% in commodity futures related instruments (backed by collateral held in TIPS) with the remainder (approximately 36%) in commodity equities. The Fund was successful in reducing the costs of contango in many of the components of the CRB Index, which contributed to the composite performance of the Fund relative to its Benchmark.
Global events had an important impact on the commodity markets throughout the first four months of 2011. Military outbursts across much of the Middle East and Northern Africa, including Egypt and Libya, have contributed to surging crude oil and oil-related product prices. The horrific Japanese earthquake and tsunami initially depressed commodity and equity prices. By the end of April, most prices, especially energy prices, had rebounded above the pre-quake levels as the world evaluated the future of nuclear power. Hydrocarbon based energy in all forms benefited from the possible shift away from nuclear power that the Japanese tragedy may trigger.
The various global situations and natural events have edged commodity futures related prices higher than commodity equities in the first four months of 2011. Commodity prices, as measured by the TR/J CRB Index, rose by 11.39% for the first four months
while commodity equities, as represented by the Thomson Reuters/Jefferies Global Commodity Index, were up 9.47%. Both exceeded the broader based equity S&P 500 Total Return Index (+9.06%) for the same period. At approximately 15.16% after-expense returns for JCRIX shares, our active management in commodity futures related investments and commodity equities added material outperformance during the period.
Accommodative monetary policies are being pursued by numerous central banks around the world, including the US Federal Reserve. We believe these policies are contributing to the surge in commodity prices. Since the Fund’s inception, the US Dollar has decreased in value by 15.21% as measured by the US Dollar Index. The US Dollar is down 7.71% since the beginning of 2011, using the same Index. Since most commodities are priced in US Dollars, a lower Dollar usually increases the price of anything denominated in the currency. Commodity prices outpaced the gains explained simply by currency moves during this period of time.
The Fund invests its excess cash held as collateral held for commodity futures related positions in U.S. Treasury Inflation Protected Bonds or TIPS. We believe that we may be nearing the end of what has been a significant rally in US treasury prices, both nominal and TIPS, and as a result, we continue to limit our duration exposure. At the end of April, our weighted average maturity was approximately 2.4 years.
The pace of commodity price appreciation has been significant over the last ten months, and we expect both commodity and equity markets to be volatile, with the possibility of significant pullbacks. However, our long-term thesis for investing in commodities as a source for capturing growth in the emerging markets, as a hedge against the possible weakness of the US Dollar, and as a possible diversifying element within a well balanced portfolio continues to be strong. We believe that the ultimate levels commodity prices can reach may be well beyond current levels.
^ A unit that is equal to 1/100th of 1%.
^^ If successive-month futures contracts are trading at prices higher than the current month, the market is said to be in “contango”.
31 | April 30, 2011
| | | | |
| Jefferies Asset Management Commodity Strategy Allocation Fund |
| | | Management Commentary | | April 30, 2011 (Unaudited) |
Performance of $10,000 Initial Investment (as of April 30, 2011)
Comparison of change in value of a $10,000 investment (includes applicable sales loads)
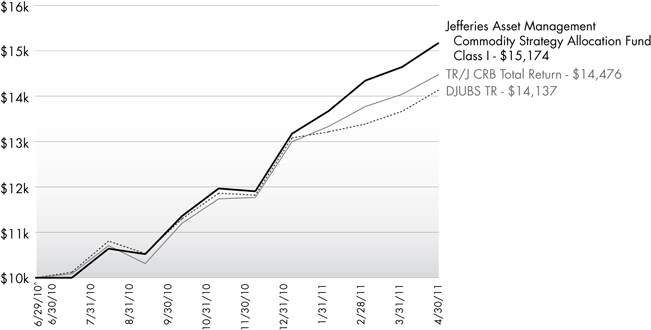
The chart above represents historical performance of a hypothetical investment of $10,000 in the Fund since inception. Past performance does not guarantee future results. This chart does not reflect the deduction of taxes that a shareholder would pay on Fund distributions or the redemption of Fund shares.
32 | April 30, 2011
| | | | |
| Jefferies Asset Management Commodity Strategy Allocation Fund |
| | | Management Commentary | | April 30, 2011 (Unaudited) |
Cumulative Return (as of April 30, 2011)
| | | | | | |
| | | Since Inception^ | | Total Expense Ratio | | What You Pay* |
Class A (NAV)1 | | 51.41% | | 1.60% | | 1.45% |
Class A (MOP)2 | | 43.11% | | �� |
Class C (NAV)1 | | 50.90% | | 2.20% | | 2.05% |
Class C (CDSC)2 | | 49.90% | | |
Class I | | 51.74% | | 1.30% | | 1.15% |
TR/J CRB Total Return Index3 | | 44.76% | | | | |
DJUBS Commodity TR3 | | 41.37% | | | | |
Performance data quoted represents past performance. Past performance does not guarantee future results. Investment return and principal value of an investment will fluctuate so that an investor’s shares, when sold or redeemed, may be worth more or less than the original cost. Current performance data may be higher or lower than actual data quoted. The Fund imposes a 2.00% redemption fee on shares held for less than 30 days. The Fund imposes a maximum Contingent Deferred Sales Charge (“CDSC”) of 1.00% to shares redeemed within the first 12 months after a purchase in excess of $1 million. Performance data does not reflect the redemption fee or the CDSC, which if reflected would reduce the performance quoted. For the most current month-end performance data, please call (866) 759-5679.
| 1 | Net Asset Value (NAV) is the share price without sales charges. |
| 2 | Maximum Offering Price (MOP) includes sales charges. Class A returns include effects of the Fund’s maximum sales charge of 5.50%; Class C returns include the 1.00% CDSC. |
| 3 | Thomson Reuters / Jefferies CRB Index and the Dow Jones-UBS Commodity Index are unmanaged indices used as a measurement of change in commodity market conditions based on the performance of a basket of different commodities. An investor cannot invest directly in an index. |
| ^ | Fund inception date of 6/29/2010. |
| * | What You Pay reflects the Sub-Adviser’s decision to contractually limit expenses through August 31, 2011. Please see the prospectus for additional information. |
The table does not reflect the deduction of taxes that a shareholder would pay on Fund distributions or the redemption of Fund shares.
The Fund is less than a year old and has limited operating history. This Fund is not suitable for all investors. Subject to investment risks, including possible loss of the principal amount invested.
Investing in Commodity-Related securities involves risk and considerations not present when investing in more conventional securities. The Fund may be more susceptible to high volatility of commodity markets.
Derivatives generally are more sensitive to changes in economic or market conditions than other types of investments; this could result in losses that significantly exceed the Fund’s original investment.
Top Ten Holdings (as a % of Net Assets) †
| | |
iShares Gold Trust | | 2.49% |
SPDR Gold Trust | | 2.13% |
Exxon Mobil Corp. | | 1.16% |
Chevron Corp. | | 1.10% |
Potash Corp. of Saskatchewan, Inc. | | 1.05% |
Deere & Co. | | 1.05% |
Monsanto Co. | | 0.92% |
Total SA | | 0.90% |
ConocoPhillips | | 0.81% |
Syngenta AG | | 0.70% |
Top Ten Holdings | | 12.31% |
| † | Holdings are subject to change. |
Industry Sector Allocation (as a % of Net Assets)
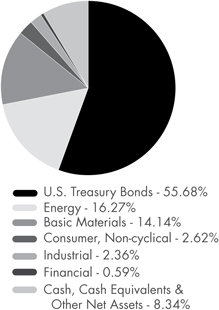
33 | April 30, 2011
| | | | |
| Jefferies Asset Management Commodity Strategy Allocation Fund |
| | | Disclosure of Fund Expenses | | April 30, 2011 (Unaudited) |
As a shareholder of the Fund you will incur two types of costs: (1) transaction costs, including applicable sales charges (loads) and redemption fees; and (2) ongoing costs, including management fees, distribution and service (12b-1) fees, shareholder service fees and other Fund expenses. The following examples are intended to help you understand your ongoing costs (in dollars) of investing in the Fund and to compare these costs with the ongoing costs of investing in other mutual funds. The examples are based on an investment of $1,000 invested on November 1, 2010 and held until April 30, 2011.
Actual Expenses. The first line of the table on the next page provides information about actual account values and actual expenses. You may use the information in this line, together with the amount you invested, to estimate the expenses that you paid over the period. Simply divide your account value by $1,000 (for example, an $8,600 account value divided by $1,000 = 8.6), then multiply the result by the number in the first line under the heading “Expense Paid During Period” to estimate the expenses you paid on your account during this period.
Hypothetical Example for Comparison Purposes. The second line of the table on the next page provides information about hypothetical account values and hypothetical expenses based on the Fund’s actual expense ratio and an assumed rate of return of 5% per year before expenses, which is not the Fund’s actual return. The hypothetical account values and expenses may not be used to estimate the actual ending account balance or expenses you paid for the period. You may use this information to compare the ongoing costs of investing in the Fund and other mutual funds. To do so, compare this 5% hypothetical example with the 5% hypothetical examples that appear in the shareholder reports of the other funds.
The expenses shown in the table are meant to highlight ongoing Fund costs only and do not reflect transaction fees, such as sales charges, redemption fees or exchange fees. Therefore, the second line of the table on the next page is useful in comparing ongoing costs only, and may not help you determine the relative total costs of owning different funds. In addition, if these transactional costs were included, your costs would have been higher.
| | | | | | | | |
| | | Beginning Account Value
11/1/10 | | Ending Account Value
4/30/11 | | Expense
Ratio(a) | | Expense Paid
During Period (b)
11/1/10 - 4/30/11 |
| Class A | | | | | | | | |
Actual | | $1,000.00 | | $1,268.50 | | 1.45% | | $8.16 |
Hypothetical (5% return before expenses) | | $1,000.00 | | $1,017.60 | | 1.45% | | $7.25 |
| | | | |
| Class C | | | | | | | | |
Actual | | $1,000.00 | | $1,262.90 | | 2.05% | | $11.50 |
Hypothetical (5% return before expenses) | | $1,000.00 | | $1,014.63 | | 2.05% | | $10.24 |
| | | | |
| Class I | | | | | | | | |
Actual | | $1,000.00 | | $1,268.10 | | 1.15% | | $6.47 |
Hypothetical (5% return before expenses) | | $1,000.00 | | $1,019.09 | | 1.15% | | $5.76 |
| (a) | The Fund’s expense ratios have been based on the Fund’s most recent fiscal half-year expenses. |
| (b) | Expenses are equal to the Fund’s annualized expense ratio multiplied by the average account value over the period, multiplied by the number of days in the most recent fiscal half year (181), then divided by 365. |
34 | April 30, 2011
| | | | |
| Jefferies Asset Management Commodity Strategy Allocation Fund |
| | | Consolidated Statement of Investments | | April 30, 2011 |
| | | | | | | | |
| | | Shares | | | Value (Note 1) | |
COMMON STOCKS (35.97%) | | | | | | | | |
Australia (1.25%) | | | | | | | | |
Fortescue Metals Group, Ltd. | | | 4,308 | | | $ | 29,040 | |
Incitec Pivot, Ltd. | | | 40,132 | | | | 165,397 | |
Newcrest Mining, Ltd. | | | 13,306 | | | | 604,533 | |
Nufarm, Ltd.(a) | | | 110,723 | | | | 586,183 | |
Woodside Petroleum, Ltd. | | | 1,764 | | | | 90,488 | |
| | | | | | | | |
| | | | | | | 1,475,641 | |
| | | | | | | | |
| | |
Bermuda (0.41%) | | | | | | | | |
Aquarius Platinum, Ltd. | | | 1,502 | | | | 8,116 | |
Bunge, Ltd. | | | 3,505 | | | | 264,417 | |
Energy XXI (Bermuda), Ltd.(a) | | | 5,349 | | | | 193,901 | |
Sinofert Holdings, Ltd.(a) | | | 43,744 | | | | 18,250 | |
| | | | | | | | |
| | | | | | | 484,684 | |
| | | | | | | | |
| | |
Brazil (0.40%) | | | | | | | | |
Companhia Siderurgica | | | | | | | | |
Nacional SA, ADR | | | 3,687 | | | | 58,734 | |
Gerdau SA, ADR | | | 2,582 | | | | 31,190 | |
Petroleo Brasileiro SA, ADR | | | 6,075 | | | | 226,780 | |
Vale SA, ADR | | | 4,682 | | | | 156,379 | |
| | | | | | | | |
| | | | | | | 473,083 | |
| | | | | | | | |
| | |
Canada (5.41%) | | | | | | | | |
Advantage Oil & Gas,
Ltd.(a) | | | 12,924 | | | | 109,823 | |
Agnico-Eagle Mines, Ltd. | | | 1,154 | | | | 80,401 | |
Agrium, Inc. | | | 8,026 | | | | 727,485 | |
Angle Energy, Inc.(a) | | | 4,922 | | | | 49,368 | |
Bankers Petroleum, Ltd.(a) | | | 19,107 | | | | 167,614 | |
Barrick Gold Corp. | | | 6,824 | | | | 348,503 | |
Birchcliff Energy,
Ltd.(a) | | | 9,657 | | | | 133,503 | |
Cameco Corp. | | | 1,284 | | | | 37,903 | |
Canadian Natural | | | | | | | | |
Resources, Ltd. | | | 4,405 | | | | 207,226 | |
Celtic Exploration, Ltd.(a) | | | 5,561 | | | | 114,024 | |
Corridor Resources, Inc.(a) | | | 6,902 | | | | 33,921 | |
Crew Energy, Inc.(a) | | | 6,363 | | | | 109,956 | |
Daylight Energy, Ltd. | | | 16,084 | | | | 184,614 | |
Delphi Energy
Corp.(a) | | | 8,529 | | | | 24,429 | |
Eldorado Gold Corp. | | | 3,759 | | | | 69,964 | |
EnCana Corp. | | | 2,254 | | | | 75,733 | |
Galleon Energy,
Inc.(a) | | | 5,124 | | | | 18,955 | |
Goldcorp, Inc. | | | 5,056 | | | | 282,632 | |
Inmet Mining Corp. | | | 369 | | | | 25,896 | |
Ivanhoe Mines, Ltd.(a) | | | 1,949 | | | | 51,107 | |
Legacy Oil + Gas, Inc.(a) | | | 8,781 | | | | 125,105 | |
Midway Energy,
Ltd.(a) | | | 4,855 | | | | 23,604 | |
New Gold, Inc.(a) | | | 1,433 | | | | 16,100 | |
Osisko Mining Corp.(a) | | | 2,183 | | | | 31,955 | |
Pan American Silver Corp. | | | 10,832 | | | | 390,737 | |
Paramount Resources, Ltd.(a) | | | 2,717 | | | | 84,426 | |
Potash Corp. of | | | | | | | | |
Saskatchewan, Inc. | | | 21,945 | | | | 1,239,719 | |
SEMAFO, Inc.(a) | | | 994 | | | | 8,447 | |
| | | | | | | | |
| | | Shares | | | Value (Note 1) | |
Canada (Continued) | | | | | | | | |
Silver Wheaton Corp. | | | 2,376 | | | $ | 96,682 | |
Suncor Energy, Inc. | | | 4,796 | | | | 221,057 | |
Talisman Energy, Inc. | | | 3,131 | | | | 75,615 | |
Teck Resources, Ltd.,
Class B | | | 8,437 | | | | 458,611 | |
TransCanada Corp. | | | 11,301 | | | | 486,248 | |
Transglobe Energy Corp.(a) | | | 5,420 | | | | 79,110 | |
Twin Butte Energy, Ltd.(a) | | | 9,555 | | | | 28,883 | |
Viterra, Inc. | | | 8,555 | | | | 102,806 | |
Yamana Gold, Inc. | | | 5,098 | | | | 64,981 | |
| | | | | | | | |
| | | | | | | 6,387,143 | |
| | | | | | | | |
| | |
Cayman Islands (0.19%) | | | | | | | | |
Chaoda Modern Agriculture Holdings, Ltd. | | | 359,028 | | | | 223,287 | |
| | | | | | | | |
| | |
Chile (0.18%) | | | | | | | | |
Sociedad Quimica y Minera de Chile SA, ADR | | | 3,435 | | | | 209,638 | |
| | | | | | | | |
| | |
China (0.99%) | | | | | | | | |
Angang Steel Co., Ltd.,
Class H | | | 145,213 | | | | 186,419 | |
China BlueChemical, Ltd.,
Class H | | | 474,429 | | | | 386,080 | |
China Petroleum & Chemical Corp., Class H | | | 51,523 | | | | 51,880 | |
China Shenhua Energy
Co., Ltd., Class H | | | 10,421 | | | | 48,641 | |
Jiangxi Copper Co., Ltd.,
Class H | | | 4,448 | | | | 15,091 | |
PetroChina Co., Ltd., Class H | | | 319,188 | | | | 458,669 | |
Zijin Mining Group Co.,
Ltd., Class H | | | 27,606 | | | | 21,719 | |
| | | | | | | | |
| | | | | | | 1,168,499 | |
| | | | | | | | |
| | |
Denmark (0.13%) | | | | | | | | |
Danisco A/S | | | 1,177 | | | | 156,151 | |
| | | | | | | | |
| | |
France (0.90%) | | | | | | | | |
Total SA | | | 16,652 | | | | 1,065,985 | |
| | | | | | | | |
| | |
Germany (0.47%) | | | | | | | | |
K+S AG | | | 6,174 | | | | 501,034 | |
ThyssenKrupp AG | | | 1,073 | | | | 49,419 | |
| | | | | | | | |
| | | | | | | 550,453 | |
| | | | | | | | |
| | |
Hong Kong (0.14%) | | | | | | | | |
China Agri-Industries Holdings, Ltd. | | | 38,958 | | | | 44,445 | |
CNOOC, Ltd. | | | 48,816 | | | | 120,433 | |
| | | | | | | | |
| | | | | | | 164,878 | |
| | | | | | | | |
35 | April 30, 2011
| | | | |
| Jefferies Asset Management Commodity Strategy Allocation Fund |
| | | Consolidated Statement of Investments | | April 30, 2011 |
| | | | | | | | |
| | | Shares | | | Value (Note 1) | |
India (0.21%) | | | | | | | | |
Reliance Industries, Ltd., | | | | | | | | |
GDR(b) | | | 5,024 | | | $ | 221,006 | |
Sterlite Industries India, | | | | | | | | |
Ltd., ADR | | | 1,565 | | | | 25,588 | |
| | | | | | | | |
| | | | | | | 246,594 | |
| | | | | | | | |
| | |
Israel (0.52%) | | | | | | | | |
Israel Chemicals, Ltd. | | | 10,510 | | | | 185,310 | |
The Israel Corp., Ltd. | | | 348 | | | | 430,850 | |
| | | | | | | | |
| | | | | | | 616,160 | |
| | | | | | | | |
| | |
Italy (0.53%) | | | | | | | | |
Eni SpA | | | 23,390 | | | | 625,327 | |
| | | | | | | | |
| | |
Japan (1.67%) | | | | | | | | |
Inpex Corp. | | | 49 | | | | 372,114 | |
JFE Holdings, Inc. | | | 19,457 | | | | 529,152 | |
Nippon Steel Corp. | | | 121,268 | | | | 376,743 | |
Sumitomo Metal Industries, Ltd. | | | 162,444 | | | | 340,448 | |
Sumitomo Metal Mining Co., Ltd. | | | 19,682 | | | | 348,678 | |
| | | | | | | | |
| | | | | | | 1,967,135 | |
| | | | | | | | |
| | |
Luxembourg (0.16%) | | | | | | | | |
APERAM | | | 84 | | | | 3,537 | |
ArcelorMittal | | | 2,856 | | | | 105,077 | |
Evraz Group SA, GDR(c)(a) | | | 394 | | | | 13,357 | |
Tenaris SA, ADR | | | 1,217 | | | | 61,811 | |
| | | | | | | | |
| | | | | | | 183,782 | |
| | | | | | | | |
| | |
Mauritius (0.07%) | | | | | | | | |
Golden Agri-Resources, Ltd. | | | 153,462 | | | | 83,373 | |
| | | | | | | | |
| | |
Mexico (0.04%) | | | | | | | | |
Grupo Mexico SAB de CV, Series B | | | 12,256 | | | | 42,437 | |
| | | | | | | | |
| | |
Netherlands (1.41%) | | | | | | | | |
CNH Global N.V.(a) | | | 12,996 | | | | 627,707 | |
Nutreco Holding N.V. | | | 8,595 | | | | 668,988 | |
Schlumberger, Ltd. | | | 4,148 | | | | 372,283 | |
| | | | | | | | |
| | | | | | | 1,668,978 | |
| | | | | | | | |
| | |
Norway (0.77%) | | | | | | | | |
Norsk Hydro ASA | | | 73,942 | | | | 655,339 | |
Yara International ASA | | | 4,380 | | | | 256,542 | |
| | | | | | | | |
| | | | | | | 911,881 | |
| | | | | | | | |
| | |
Peru (0.38%) | | | | | | | | |
Companhia de Minas Buenaventura SA, ADR | | | 10,713 | | | | 446,411 | |
| | | | | | | | |
| | |
Russia (1.52%) | | | | | | | | |
Gazprom OAO, ADR | | | 38,300 | | | | 646,121 | |
LUKOIL OAO, ADR | | | 8,973 | | | | 620,932 | |
| | | | | | | | |
| | | Shares | | | Value (Note 1) | |
Russia (Continued) | | | | | | | | |
Mechel Steel Group, ADR | | | 451 | | | $ | 12,885 | |
MMC Norilsk Nickel, ADR | | | 2,634 | | | | 72,698 | |
Polyus Gold Co., ADR | | | 919 | | | | 33,084 | |
Rosneft Oil Co., GDR(c) | | | 28,994 | | | | 258,771 | |
Uralkali, GDR(c) | | | 3,602 | | | | 151,176 | |
| | | | | | | | |
| | | | | | | 1,795,667 | |
| | | | | | | | |
| | |
Singapore (0.28%) | | | | | | | | |
Olam International, Ltd. | | | 44,394 | | | | 104,090 | |
Wilmar International, Ltd. | | | 52,990 | | | | 228,142 | |
| | | | | | | | |
| | | | | | | 332,232 | |
| | | | | | | | |
| | |
South Africa (0.70%) | | | | | | | | |
AngloGold Ashanti, Ltd., ADR | | | 2,567 | | | | 130,866 | |
Gold Fields, Ltd. | | | 26,219 | | | | 468,388 | |
Harmony Gold Mining Co., Ltd. | | | 2,044 | | | | 30,870 | |
Impala Platinum Holdings, Ltd. | | | 3,640 | | | | 113,680 | |
Sasol, Ltd. | | | 1,457 | | | | 84,113 | |
| | | | | | | | |
| | | | | | | 827,917 | |
| | | | | | | | |
| | |
Spain (0.41%) | | | | | | | | |
Repsol YPF SA | | | 13,517 | | | | 482,700 | |
| | | | | | | | |
| | |
Switzerland (0.83%) | | | | | | | | |
Noble Corp. | | | 777 | | | | 33,419 | |
Syngenta AG | | | 2,336 | | | | 826,647 | |
Transocean, Ltd.(a) | | | 977 | | | | 71,076 | |
Weatherford International, Ltd.(a) | | | 2,119 | | | | 45,728 | |
| | | | | | | | |
| | | | | | | 976,870 | |
| | | | | | | | |
| | |
United Kingdom (1.50%) | | | | | | | | |
Anglo American PLC | | | 4,121 | | | | 214,799 | |
Antofagasta PLC | | | 1,203 | | | | 27,469 | |
BG Group PLC | | | 10,395 | | | | 266,265 | |
BHP Billiton PLC | | | 6,952 | | | | 293,150 | |
Kazakhmys PLC | | | 669 | | | | 15,410 | |
Lonmin PLC | | | 1,056 | | | | 28,787 | |
Rio Tinto PLC | | | 4,809 | | | | 350,224 | |
Royal Dutch Shell PLC, Class A | | | 10,916 | | | | 421,668 | |
Xstrata PLC | | | 6,263 | | | | 159,169 | |
| | | | | | | | |
| | | | | | | 1,776,941 | |
| | | | | | | | |
| | |
United States (14.50%) | | | | | | | | |
Abraxas Petroleum Corp.(a) | | | 6,023 | | | | 30,597 | |
AGCO Corp.(a) | | | 13,244 | | | | 762,589 | |
Alcoa, Inc. | | | 25,394 | | | | 431,698 | |
Allegheny Technologies, Inc. | | | 308 | | | | 22,176 | |
Anadarko Petroleum Corp. | | | 1,519 | | | | 119,910 | |
Apache Corp. | | | 1,117 | | | | 148,974 | |
Approach Resources, Inc.(a) | | | 1,215 | | | | 35,770 | |
Archer-Daniels-Midland Co. | | | 15,607 | | | | 577,771 | |
Baker Hughes, Inc. | | | 1,972 | | | | 152,652 | |
Berry Petroleum Co., Class A | | | 3,544 | | | | 188,293 | |
36 | April 30, 2011
| | | | |
| Jefferies Asset Management Commodity Strategy Allocation Fund |
| | | Consolidated Statement of Investments | | April 30, 2011 |
| | | | | | | | |
| | | Shares | | | Value (Note 1) | |
United States (Continued) | | | | | | | | |
Bill Barrett Corp.(a) | | | 3,633 | | | $ | 151,605 | |
Brigham Exploration Co.(a) | | | 9,046 | | | | 303,312 | |
Cameron International Corp.(a) | | | 737 | | | | 38,855 | |
Carrizo Oil & Gas, Inc.(a) | | | 2,699 | | | | 107,528 | |
CF Industries Holdings, Inc. | | | 4,508 | | | | 638,107 | |
Chesapeake Energy Corp. | | | 6,990 | | | | 235,353 | |
Chevron Corp. | | | 11,818 | | | | 1,293,362 | |
Clayton Williams Energy, Inc.(a) | | | 468 | | | | 42,387 | |
Cliffs Natural Resources, Inc. | | | 4,365 | | | | 409,088 | |
Coeur d’Alene Mines Corp.(a) | | | 614 | | | | 19,470 | |
Comstock Resources, Inc.(a) | | | 3,727 | | | | 119,488 | |
ConocoPhillips | | | 12,130 | | | | 957,421 | |
Consol Energy, Inc. | | | 692 | | | | 37,430 | |
Contango Oil & Gas Co.(a) | | | 1,011 | | | | 62,601 | |
Corn Products International, Inc. | | | 13,429 | | | | 739,938 | |
Deere & Co. | | | 12,658 | | | | 1,234,155 | |
Devon Energy Corp. | | | 2,843 | | | | 258,713 | |
Diamond Offshore Drilling, Inc. | | | 215 | | | | 16,312 | |
Energy Partners, Ltd.(a) | | | 2,858 | | | | 52,044 | |
EOG Resources, Inc. | | | 2,356 | | | | 266,016 | |
Exxon Mobil Corp. | | | 15,535 | | | | 1,367,080 | |
Freeport-McMoRan Copper & Gold, Inc. | | | 3,058 | | | | 168,282 | |
GeoResources, Inc.(a) | | | 1,011 | | | | 29,339 | |
Gran Tierra Energy, Inc.(a) | | | 18,313 | | | | 136,261 | |
Gulfport Energy Corp.(a) | | | 2,155 | | | | 73,356 | |
Halliburton Co. | | | 2,784 | | | | 140,536 | |
Harvest Natural Resources, Inc.(a) | | | 2,652 | | | | 36,651 | |
Hecla Mining Co.(a) | | | 1,761 | | | | 16,571 | |
Hess Corp. | | | 913 | | | | 78,481 | |
Houston American Energy Corp. | | | 1,415 | | | | 26,022 | |
Hyperdynamics Corp.(a) | | | 9,097 | | | | 38,389 | |
International Paper Co. | | | 8,102 | | | | 250,190 | |
Intrepid Potash, Inc.(a) | | | 1,146 | | | | 39,262 | |
Magnum Hunter Resources Corp.(a) | | | 4,191 | | | | 34,199 | |
Marathon Oil Corp. | | | 9,420 | | | | 509,057 | |
McMoRan Exploration Co.(a) | | | 8,308 | | | | 152,119 | |
Monsanto Co. | | | 16,018 | | | | 1,089,865 | |
The Mosaic Co. | | | 3,943 | | | | 295,173 | |
National Oilwell Varco, Inc. | | | 6,051 | | | | 464,051 | |
Newfield Exploration Co.(a) | | | 1,063 | | | | 75,260 | |
Noble Energy, Inc. | | | 4,982 | | | | 479,617 | |
Northern Oil and Gas, Inc.(a) | | | 3,251 | | | | 77,244 | |
Nucor Corp. | | | 1,030 | | | | 48,369 | |
Occidental Petroleum Corp. | | | 2,476 | | | | 282,982 | |
Peabody Energy Corp. | | | 826 | | | | 55,193 | |
| | | | | | | | |
| | | Shares | | | Value (Note 1) | |
United States (Continued) | | | | | | | | |
Penn Virginia Corp. | | | 3,639 | | | $ | 56,259 | |
Petroleum Development Corp.(a) | | | 1,847 | | | | 73,548 | |
PetroQuest Energy, Inc.(a) | | | 4,430 | | | | 38,807 | |
Quicksilver Resources, Inc.(a) | | | 9,230 | | | | 137,065 | |
Rex Energy Corp.(a) | | | 2,530 | | | | 32,460 | |
Rosetta Resources, Inc.(a) | | | 4,108 | | | | 188,680 | |
Southern Copper Corp. | | | 554 | | | | 20,753 | |
Southwestern Energy Co.(a) | | | 1,057 | | | | 46,360 | |
Stone Energy Corp.(a) | | | 3,786 | | | | 133,873 | |
Swift Energy Co.(a) | | | 3,267 | | | | 128,034 | |
Toreador Resources Corp.(a) | | | 1,797 | | | | 14,574 | |
United States Steel Corp. | | | 470 | | | | 22,424 | |
VAALCO Energy, Inc.(a) | | | 4,447 | | | | 30,996 | |
Valero Energy Corp. | | | 9,593 | | | | 271,482 | |
Vanguard Natural Resources LLC | | | 1,892 | | | | 62,606 | |
Venoco, Inc.(a) | | | 1,645 | | | | 30,581 | |
W&T Offshore, Inc. | | | 2,768 | | | | 74,210 | |
Warren Resources, Inc.(a) | | | 5,569 | | | | 25,228 | |
Weyerhaeuser Co. | | | 10,843 | | | | 249,497 | |
The Williams Co., Inc. | | | 1,794 | | | | 59,507 | |
| | | | | | | | |
| | | | | | | 17,114,108 | |
| | | | | | | | |
| | |
TOTAL COMMON STOCKS (Cost $39,638,215) | | | | | | | 42,457,955 | |
| | | | | | | | |
| | |
EXCHANGE TRADED FUNDS (4.62%) | | | | | | | | |
iShares Gold Trust(a) | | | 192,778 | | | | 2,943,720 | |
SPDR Gold Trust(a) | | | 16,476 | | | | 2,510,283 | |
| | | | | | | | |
| | |
TOTAL EXCHANGE TRADED FUNDS (Cost $4,994,605) | | | | | | | 5,454,003 | |
| | | | | | | | |
| | |
WARRANT (0.00%)(d) | | | | | | | | |
Canada (0.00%)(d) | | | | | | | | |
Kinross Gold Corp., strike price $21.30, Expires 9/17/14(a) | | | 19 | | | | 53 | |
| | | | | | | | |
| | |
TOTAL WARRANT (Cost $70) | | | | | | | 53 | |
| | | | | | | | |
37 | April 30, 2011
| | | | |
| Jefferies Asset Management Commodity Strategy Allocation Fund |
| | | Consolidated Statement of Investments | | April 30, 2011 |
| | | | | | | | |
| | | Principal
Amount | | | Value (Note 1) | |
GOVERNMENT BONDS (55.68%) | |
U.S. Treasury Bonds (55.68%) | |
United States Treasury Inflation Indexed Bonds | | | | | |
3.375%, 1/15/12 | | | $ 790,956 | | | $ | 827,661 | |
2.000%, 4/15/12 | | | 1,363,050 | | | | 1,424,814 | |
0.625%, 4/15/13 | | | 21,306,430 | | | | 22,421,693 | |
1.875%, 7/15/13 | | | 337,473 | | | | 367,265 | |
2.000%, 1/15/14 | | | 18,759,307 | | | | 20,655,761 | |
1.250%, 4/15/14 | | | 5,123,195 | | | | 5,541,258 | |
2.000%, 7/15/14 | | | 9,009,529 | | | | 10,018,173 | |
1.625%, 1/15/15 | | | 1,987,393 | | | | 2,189,394 | |
0.500%, 4/15/15 | | | 1,807,241 | | | | 1,911,580 | |
1.875%, 7/15/15 | | | 329,901 | | | | 369,412 | |
| | | | | | | | |
| | | | | | | 65,727,011 | |
| | | | | | | | |
| |
TOTAL GOVERNMENT BONDS (Cost $64,562,282) | | | | 65,727,011 | |
| | | | | | | | |
| |
TOTAL INVESTMENTS (Cost $109,195,172) (96.27%) | | | $ | 113,639,022 | |
| |
Other Assets In Excess
Of Liabilities (3.73%) | | | | 4,402,988 | |
| | | | | | | | |
| | |
NET ASSETS (100.00%) | | | | | | $ | 118,042,010 | |
| | | | | | | | |
| (a) | Non Income Producing Security. |
| (b) | Security exempt from registration under rule 144A of the securities act of 1933. This security may be resold in transactions exempt from registration, normally to qualified institutional buyers. At period end, the market value of those securities was $221,006, representing 0.19% of the Fund’s net assets. |
| (c) | These securities initially sold to other parties pursuant to Regulation S under the 1933 Act and subsequently resold to the Fund. At period end, the aggregate market value of those securities was $423,304, representing 0.36% of the Fund’s net assets. |
Common Abbreviations:
| A/S | - Aktieselskab is the Danish name for a stock-based corporation. |
| ADR | - American Depositary Receipt. |
| AG | - Aktiengesellschaft is a German term that refers to a corporation that is limited by shares, i.e., owned by shareholders. |
| ASA | - Allmennaksjeselskap is the Norwegian term for public limited company. |
| GDR | - Global Depositary Receipt. |
| LLC | - Limited Liability Company. |
| N.V. | - Naamloze Vennootschap is the Dutch term for public limited liability corporation. |
| OAO | - Otkrytoe Aktsionernoe Obschestvo is a Russian term meaning Open Joint Stock Corporation. |
| SA | - Generally designated corporations in various countries, mostly those employing the civil law. |
| SAB | de CV - A variable capital company. |
| SpA | - Societá per Azioni is an Italian shared company. |
See Notes to Financial Statements.
FUTURES CONTRACTS
At April 30, 2011, the Fund has outstanding futures contracts:
| | | | | | | | | | | | | | | | | | | | |
| Description | | Position | | | Contracts | | | Expiration Date | | | Value | | | Unrealized
Appreciation | |
WTI Crude Future | | | Long | | | | 45 | | | | 8/22/11 | | | $ | 5,167,350 | | | | $ 577,093 | |
WTI Crude Future | | | Long | | | | 40 | | | | 9/20/11 | | | | 4,592,800 | | | | 284,751 | |
| | | | | | | | | | | | | | | | |
| | | | | | | | | | | | | | $ | 9,760,150 | | | | $ 861,844 | |
| | | | | | | | | | | | | | | | |
| | | | | | | | | | | | | | | | | | | | |
| Description | | Position | | | Contracts | | | Expiration Date | | | Value | | | Unrealized
Depreciation | |
WTI Crude Future | | | Short | | | | (85 | ) | | | 7/20/11 | | | $ | (9,750,350 | ) | | $ | (634,216 | ) |
| | | | | | | | | | | | | | | | |
TOTAL RETURN SWAP CONTRACTS(a)
| | | | | | | | | | | | | | | | | | |
| Swap Counterparty | | Reference Obligation | | Notional Amount | | | Rate Paid by
the Fund | | | Termination Date | | | Unrealized
Appreciation | |
Bank of America Merrill Lynch | | CRB 3 Month Forward
Total Return Index | | $ | 77,330,869 | | | | 0.48 | % | | | 6/30/11 | | | $ | 684,840 | |
| | | | | | | | | | | | | | | | | | |
| | | | | | | | | | | | | | | | | | |
| Swap Counterparty | | Reference Obligation | | Notional Amount | | | Rate Paid by
the Fund | | | Termination Date | | | Unrealized
Depreciation | |
Bank of America
Merrill Lynch | | DJUBS GoldT-F3 | | $ | (4,826,969 | ) | | | 0.10 | % | | | 6/30/11 | | | | $ (53,749) | |
Bank of America
Merrill Lynch | | S&P GSCI 3 Month
Natural Gas | | | (5,098,464 | ) | | | 0.10 | % | | | 6/30/11 | | | | (123,921 | ) |
| | | | | | | | | | | | | | | | | | |
| | | | | | | | | | | | | | | | | $ (177,670) | |
| | | | | | | | | | | | | | | | | | |
| (a) | The Fund receives monthly payments based on any positive monthly return of the Reference Obligation. The Fund makes payments on any negative monthly return of such Reference Obligation. |
For Fund compliance purposes, the Fund’s industry classifications refer to any one or more of the industry sub-classifications used by one or more widely recognized market indexes or ratings group indexes, and/or as defined by Fund management. This definition may not apply for purposes of this report, which may combine industry sub-classifications for reporting ease. Industries are shown as a percent of net assets. These industry classifications are based on third party definitions and are unaudited. The definitions are industry terms and do not reflect the legal status of any of the investments or the companies in which the Fund has invested.
38 | April 30, 2011
| | | | |
RiverFront Long-Term Growth Fund |
| | | Management Commentary | | April 30, 2011 (Unaudited) |
For the year ending April 30, 2011, the RiverFront Long-Term Growth Fund’s (the “Fund”) Class A Shares, RLTAX, delivered a net return of 14.63% at NAV (Class A delivered a net return of 8.32% at MOP, Class C, RLTCX, was +12.82% with CDSC, Class I, RLFIX, was +14.95% with CDSC, Class L, RLTIX, was +14.83%, and Investor Class, RLTSX, was +14.49%) for the year1. The Fund’s performance was below that of the broad based S&P 500 Total Return Index (+17.22%), without taking into account sales charges for Class A and C Shares.
Over the course of the past year, financial markets have gone through several distinct mood swings. Post recession enthusiasm was replaced by concerns about domestic and global economic growth. The realization that a double-dip was unlikely, along with additional monetary stimulus on the part of the Federal Reserve, sparked an uptrend in the equity markets that is still in place. We believe this resilience supports our belief that many segments of the equity markets are reasonably valued and conditions for a sustainable recovery are in place. With that said, we are keeping a keen eye on inflationary pressures. Inflation has been of little concern to investors for much of the past three decades. A cyclical downturn in inflation that began in the late 1970s has continued in recent years. Steady declines in inflation and interest rates have allowed bonds to provide stability rocked by repeated equity market crises. In addition to this stability, bonds delivered an income stream that more than offset inflation. That is no longer the case.
The collapse in corporate yield spreads over the past year means that many fixed income asset classes now offer returns well below inflation. We believe that these depressed yields are a direct result of the Federal Reserve’s policy of keeping short-term rates close to 0%. If the Fed continues this policy, an extended period of negative inflation-adjusted yields will erode the purchasing power of fixed income investments, in our view. Conversely, if the Fed ends its zero interest rate policy, rising yields could cause bond prices to fall sharply. Either way, bonds’ traditional role of protecting investors from short-term volatility must increasingly come at the expense of exposure to significant longer-term investment risks. By contrast, we think equities provide more inflation protection than is generally recognized and, given current price levels, offer a viable alternative to overbought commodities.
During the market collapse in May and June of 2010, major technical support levels were breached and markets were threatening to break down to levels not seen since the crises of 2008/2009. Although our fundamental view remained positive, our risk management disciplines prompted us to increase the cash
position in the Fund. While we felt the allocation to cash was a prudent risk management decision, our performance suffered from buying insurance that we ultimately did not need. As the market gained confidence toward the end of the summer, we had to quickly switch from defense to offense and get the cash balance invested. We reinvested the proceeds in emerging markets and micro-cap domestic equities. Both were positive contributors to performance as we closed last year.
We began 2011 overweight emerging markets and underweight developed international. Our domestic equity allocation was skewed towards high quality, income-oriented stocks which have been solid performers thus far. The emerging markets equities, however, failed to keep pace with the gains from 2010. Emerging market stock indexes have diverged significantly from developed markets this year as many emerging market central banks have begun to tighten more aggressively to fight rising inflation. We think many emerging market central banks are still behind the inflation curve and, until they get ahead, emerging market underperformance will likely continue. Our emerging markets weighting cost us slightly from a performance standpoint. Since we expect this rising interest rate trend to continue in emerging markets for the next several months, we have lowered our weighting in emerging market equities despite our long term confidence in this asset class. We chose to neutralize our position in developed international. Our Price Matters™ framework continues to suggest that this asset class is attractively price relative to long term trends, however concerns about the financial stability of various European countries has caused these stocks to lag the S&P 500 on a year to date basis.
In summary, negative contributors during the period have been our above average cash allocation, overweight emerging markets as we moved into 2011 and a more recent lag in developed international.
Positive contributors have been stock selection in our Industrials and Technology sectors. In addition, Energy proved to be a positive contributor during the first quarter. The RiverFront portfolios were overweight energy throughout the quarter either through individual equities or exchange-traded funds (ETFs). The decision was a positive from the standpoint of both selection and allocation. We continue to favor the sector due to our improved outlook for the integrated companies and an improving outlook for energy commodities; however we are neutral at this time, having taken some money off the table.
| 1 | The Class A, C, I, and L shares performance shown for periods prior to September 27, 2010, reflects the performance of the Baird Funds, Inc. |
– RiverFront Long-Term Growth Fund’s Institutional Class shares (as result of the reorganization of the Baird Funds, Inc. – RiverFront Long-Term Growth Fund into the Fund). The Investor Class performance shown for periods prior to September 27, 2010, reflects the performance of the Baird Funds, Inc. – RiverFront Long-Term Growth Fund’s Investor Class shares (as result of the reorganization of the Baird Funds, Inc.
– RiverFront Long-Term Growth Fund into the Fund).
39 | April 30, 2011
| | | | |
RiverFront Long-Term Growth Fund |
| | | Management Commentary | | April 30, 2011 (Unaudited) |
Performance of $10,000 Initial Investment (as of April 30, 2011)
Comparison of change in value of a $10,000 investment (includes applicable sales loads)
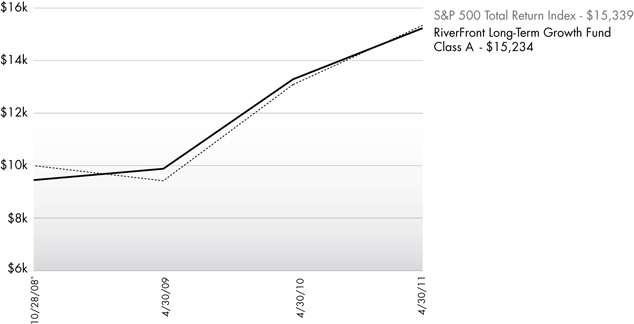
The chart above represents historical performance of a hypothetical investment of $10,000 in the Fund since inception. Past performance does not guarantee future results. This chart does not reflect the deduction of taxes that a shareholder would pay on Fund distributions or the redemption of Fund shares.
Average Annual Total Returns (as of April 30, 2011)
| | | | | | | | |
| | | 1 Year | | Since Inception^ | | Total Expense Ratio | | What You Pay* |
Investor (NAV)2 | | 14.49% | | 60.83% | | 1.70% | | 1.15% |
Class L (NAV)1, 3 | | 14.83% | | 62.06% | | 1.45% | | 0.90% |
Class A (NAV)1 | | 14.63% | | 61.18% | | 1.70% | | 1.15% |
Class A (MOP)2 | | 8.32% | | 52.34% | | |
Class C (NAV)1 | | 13.82% | | 58.23% | | 2.45% | | 1.90% |
Class C (CDSC)2 | | 12.82% | | 58.23% | | |
Class I | | 14.95% | | 62.23% | | 1.45% | | 0.90% |
S&P 500 Total Return Index4 | | 17.22% | | 53.39% | | | | |
Performance data quoted represents past performance. Past performance does not guarantee future results. Investment return and principal value of an investment will fluctuate so that an investor’s shares, when sold or redeemed, may be worth more or less than the original cost. Current performance data may be higher or lower than actual data quoted. The Fund imposes a maximum Contingent Deferred Sales Charge (“CDSC”) of 1.00% to shares redeemed within the first 12 months after a purchase in excess of $1 million. Performance data does not reflect the CDSC, which if reflected would reduce the performance quoted. For the most current month-end performance data, please call (866) 759-5679.
| 1 | Net Asset Value (NAV) is the share price without sales charges. |
| 2 | Maximum Offering Price (MOP) includes sales charges. Class A returns include effects of the Fund’s maximum sales charge of 5.50%; Class C returns include the 1.00% CDSC. |
| 3 | Prior to close of business on September 24, 2010, Class L was known as Institutional Class of the Baird Funds, Inc. - RiverFront Long-Term Growth Fund. |
| 4 | S&P 500 Total Return Index is the Standard & Poor’s composite index of 500 stocks, a widely recognized, unmanaged index of common stock prices. An investor may not invest directly in the index. |
| ^ | Fund inception date of 10/28/2008. |
| * | What you pay reflects the Adviser and Sub-Adviser’s decision to contractually limit expenses through December 31, 2012. Please see the prospectus for additional information. |
The Class A, C, I and L shares performance shown for periods prior to September 27, 2010, reflects the performance of the Baird Funds, Inc. – RiverFront Long-Term Growth Fund’s Institutional Class shares (as result of the reorganization of the Baird Funds, Inc. – RiverFront Long-Term Growth Fund into the Fund).
The Investor Class performance shown for periods prior to September 27, 2010, reflects the performance of the Baird Funds, Inc. – RiverFront Long-Term Growth Fund’s Investor Class shares (as result of the reorganization of the Baird Funds, Inc. – RiverFront Long-Term Growth Fund into the Fund). The table does not reflect the deduction of taxes that a shareholder would pay on Fund distributions or the redemption of Fund shares.
This Fund is not suitable for all investors. Subject to investment risks, including possible loss of the principal amount invested.
40 | April 30, 2011
| | | | |
RiverFront Long-Term Growth Fund |
| | | Management Commentary | | April 30, 2011 (Unaudited) |
Top Ten Holdings (as a % of Net Assets) †
| | | | |
Vanguard MSCI Emerging Markets ETF | | | 10.38 | % |
Vanguard MSCI EAFE ETF | | | 8.90 | % |
iShares S&P 100 Index Fund | | | 5.17 | % |
Wilshire Micro-Cap ETF | | | 4.14 | % |
First Trust Dow Jones Select MicroCap Index Fund | | | 3.09 | % |
iShares MSCI Canada Index Fund | | | 3.03 | % |
iShares MSCI ACWI Index Fund | | | 2.06 | % |
SPDR S&P Mid-Cap 400 ETF Trust | | | 2.05 | % |
Vanguard FTSE All World ex-US Small-Cap ETF | | | 2.01 | % |
JPMorgan Alerian MLP Index ETN | | | 1.92 | % |
Top Ten Holdings | | | 42.75 | % |
| |
† Holdings are subject to change. | | | | |
Portfolio Composition (as a % of Net Assets)
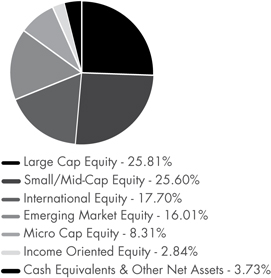
41 | April 30, 2011
| | | | |
RiverFront Long-Term Growth Fund |
| | | Disclosure of Fund Expenses | | April 30, 2011 (Unaudited) |
As a shareholder of the Fund you will incur two types of costs: (1) transaction costs, including applicable sales charges (loads) and redemption fees; and (2) ongoing costs, including management fees, distribution and service (12b-1) fees, shareholder service fees and other Fund expenses. The following examples are intended to help you understand your ongoing costs (in dollars) of investing in the Fund and to compare these costs with the ongoing costs of investing in other mutual funds. The examples are based on an investment of $1,000 invested on November 1, 2010 and held until April 30, 2011.
Actual Expenses. The first line of the table on the next page provides information about actual account values and actual expenses. You may use the information in this line, together with the amount you invested, to estimate the expenses that you paid over the period. Simply divide your account value by $1,000 (for example, an $8,600 account value divided by $1,000 = 8.6), then multiply the result by the number in the first line under the heading “Expense Paid During Period” to estimate the expenses you paid on your account during this period.
Hypothetical Example for Comparison Purposes. The second line of the table on the next page provides information about hypothetical account values and hypothetical expenses based on the Fund’s actual expense ratio and an assumed rate of return of 5% per year before expenses, which is not the Fund’s actual return. The hypothetical account values and expenses may not be used to estimate the actual ending account balance or expenses you paid for the period. You may use this information to compare the ongoing costs of investing in the Fund and other mutual funds. To do so, compare this 5% hypothetical example with the 5% hypothetical examples that appear in the shareholder reports of the other funds.
The expenses shown in the table are meant to highlight ongoing Fund costs only and do not reflect transaction fees, such as sales charges, redemption fees or exchange fees. Therefore, the second line of the table on the next page is useful in comparing ongoing costs only, and may not help you determine the relative total costs of owning different funds. In addition, if these transactional costs were included, your costs would have been higher.
| | | | | | | | | | | | | | | | |
| | | Beginning Account Value
11/1/10 | | | Ending Account Value
4/30/11 | | | Expense
Ratio(a) | | | Expense Paid
During Period(b)
11/1/10 - 4/30/11 | |
Class A | | | | | | | | | | | | | | | | |
Actual | | | $1,000.00 | | | | $1,067.50 | | | | 1.15% | | | | $3.91 | |
Hypothetical (5% return before expenses) | | | $1,000.00 | | | | $1,012.66 | | | | 1.15% | | | | $5.74 | |
| | | | |
Class C | | | | | | | | | | | | | | | | |
Actual | | | $1,000.00 | | | | $1,066.30 | | | | 1.90% | | | | $6.45 | |
Hypothetical (5% return before expenses) | | | $1,000.00 | | | | $1,010.19 | | | | 1.90% | | | | $9.47 | |
| | | | |
Class I | | | | | | | | | | | | | | | | |
Actual | | | $1,000.00 | | | | $1,070.40 | | | | 0.90% | | | | $3.06 | |
Hypothetical (5% return before expenses) | | | $1,000.00 | | | | $1,013.48 | | | | 0.90% | | | | $4.49 | |
| | | | |
Class L | | | | | | | | | | | | | | | | |
Actual | | | $1,000.00 | | | | $1,069.70 | | | | 0.90% | | | | $3.06 | |
Hypothetical (5% return before expenses) | | | $1,000.00 | | | | $1,013.48 | | | | 0.90% | | | | $4.49 | |
| | | | |
Investor Class | | | | | | | | | | | | | | | | |
Actual | | | $1,000.00 | | | | $1,067.90 | | | | 1.15% | | | | $3.91 | |
Hypothetical (5% return before expenses) | | | $1,000.00 | | | | $1,012.66 | | | | 1.15% | | | | $5.74 | |
| (a) | The Fund’s expense ratios have been based on the Fund’s most recent fiscal half-year expenses. |
| (b) | Expenses are equal to the Fund’s annualized expense ratio multiplied by the average account value over the period, multiplied by the number of days in the most recent fiscal half year (181), then divided by 365. |
42 | April 30, 2011
| | | | |
RiverFront Long-Term Growth Fund |
| | | Statement of Investments | | April 30, 2011 |
| | | | | | | | |
| | | Shares | | | Value (Note 1) | |
COMMON STOCKS (35.48%) | | | | | | | | |
Basic Materials (2.21%) | | | | | | | | |
Chemicals (0.93%) | | | | | | | | |
Monsanto Co. | | | 7,410 | | | $ | 504,176 | |
Sensient Technologies Corp. | | | 8,155 | | | | 308,993 | |
| | | | | | | | |
| | | | | | | 813,169 | |
| | | | | | | | |
| | |
Forest Products & Paper (0.62%) | | | | | | | | |
MeadWestvaco Corp. | | | 15,992 | | | | 538,771 | |
| | | | | | | | |
| | |
Iron & Steel (0.66%) | | | | | | | | |
Steel Dynamics, Inc. | | | 31,760 | | | | 577,714 | |
| | | | | | | | |
| | |
TOTAL BASIC MATERIALS | | | | | | | 1,929,654 | |
| | | | | | | | |
| | |
Communications (2.46%) | | | | | | | | |
Advertising (0.57%) | | | | | | | | |
Omnicom Group, Inc. | | | 10,124 | | | | 498,000 | |
| | | | | | | | |
| | |
Communications Equipment (0.69%) | | | | | | | | |
Harris Corp. | | | 11,236 | | | | 596,969 | |
| | | | | | | | |
| | |
Telecommunications (1.20%) | | | | | | | | |
QUALCOMM, Inc. | | | 10,945 | | | | 622,114 | |
Verizon Communications, Inc. | | | 11,275 | | | | 425,969 | |
| | | | | | | | |
| | | | | | | 1,048,083 | |
| | | | | | | | |
| | |
TOTAL COMMUNICATIONS | | | | | | | 2,143,052 | |
| | | | | | | | |
| | |
Consumer, Cyclical (2.91%) | | | | | | | | |
Hotels, Restaurants & Leisure (1.05%) | | | | | | | | |
Darden Restaurants, Inc. | | | 7,801 | | | | 366,413 | |
Penn National Gaming, Inc. (a) | | | 13,631 | | | | 545,376 | |
| | | | | | | | |
| | | | | | | 911,789 | |
| | | | | | | | |
| | |
Leisure Equipment & Products (0.42%) | | | | | | | | |
Hasbro, Inc. | | | 7,738 | | | | 362,448 | |
| | | | | | | | |
| | |
Leisure Time (0.32%) | | | | | | | | |
WMS Industries, Inc. (a) | | | 8,557 | | | | 280,670 | |
| | | | | | | | |
| | |
Multiline Retail (0.73%) | | | | | | | | |
Dollar Tree, Inc. (a) | | | 11,069 | | | | 636,467 | |
| | | | | | | | |
| | |
Retail (0.39%) | | | | | | | | |
The Gap, Inc. | | | 14,795 | | | | 343,836 | |
| | | | | | | | |
| | |
TOTAL CONSUMER, CYCLICAL | | | | | | | 2,535,210 | |
| | | | | | | | |
| | |
Consumer, Non-cyclical (8.01%) | | | | | | | | |
Agriculture (0.56%) | | | | | | | | |
Altria Group, Inc. | | | 18,238 | | | | 489,508 | |
| | | | | | | | |
| | | | | | | | |
| | | Shares | | | Value (Note 1) | |
Chemicals (0.75%) | | | | | | | | |
The Scotts Miracle-Gro Co., Class A | | | 11,662 | | | $ | 658,553 | |
| | | | | | | | |
| | |
Commercial Services (1.72%) | | | | | | | | |
Automatic Data Processing, Inc. | | | 10,573 | | | | 574,643 | |
Iron Mountain, Inc. | | | 19,433 | | | | 618,941 | |
Moody’s Corp. | | | 7,751 | | | | 303,374 | |
| | | | | | | | |
| | | | | | | 1,496,958 | |
| | | | | | | | |
Commercial Services & Supplies (0.48%) | | | | | | | | |
Manpower, Inc. | | | 6,281 | | | | 416,116 | |
| | | | | | | | |
| | |
Health Care Providers & Services (2.18%) | | | | | | | | |
CareFusion Corp. (a) | | | 23,736 | | | | 697,126 | |
Henry Schein, Inc. (a) | | | 8,538 | | | | 623,872 | |
PSS World Medical, Inc. (a) | | | 20,285 | | | | 583,397 | |
| | | | | | | | |
| | | | | | | 1,904,395 | |
| | | | | | | | |
Healthcare Products (0.57%) | | | | | | | | |
Hologic, Inc. (a) | | | 22,460 | | | | 494,569 | |
| | | | | | | | |
Pharmaceuticals (1.75%) | | | | | | | | |
Omnicare, Inc. | | | 23,168 | | | | 727,938 | |
Pfizer, Inc. | | | 37,906 | | | | 794,510 | |
| | | | | | | | |
| | | | | | | 1,522,448 | |
| | | | | | | | |
| | |
TOTAL CONSUMER, NON-CYCLICAL | | | | | | | 6,982,547 | |
| | | | | | | | |
| | |
Energy (4.46%) | | | | | | | | |
Energy Equipment & Services (0.74%) | | | | | | | | |
Superior Energy Services, Inc. (a) | | | 16,758 | | | | 643,842 | |
| | | | | | | | |
| | |
Oil & Gas (3.72%) | | | | | | | | |
Chevron Corp. | | | 9,760 | | | | 1,068,134 | |
Exxon Mobil Corp. | | | 12,582 | | | | 1,107,216 | |
Forest Oil Corp. (a) | | | 15,540 | | | | 558,042 | |
Petrohawk Energy Corp. (a) | | | 18,976 | | | | 512,542 | |
| | | | | | | | |
| | | | | | | 3,245,934 | |
| | | | | | | | |
| | |
TOTAL ENERGY | | | | | | | 3,889,776 | |
| | | | | | | | |
| | |
Financials (4.37%) | | | | | | | | |
Banks (0.75%) | | | | | | | | |
East West Bancorp, Inc. | | | 30,904 | | | | 653,002 | |
| | | | | | | | |
Insurance (0.83%) | | | | | | | | |
HCC Insurance Holdings, Inc. | | | 22,167 | | | | 721,314 | |
| | | | | | | | |
| | |
Real Estate Investment Trusts (2.03%) | | | | | | | | |
American Campus Communities, Inc. | | | 15,329 | | | | 538,814 | |
43 | April 30, 2011
| | | | |
RiverFront Long-Term Growth Fund |
| | | Statement of Investments | | April 30, 2011 |
| | | | | | | | |
| | | Shares | | | Value (Note 1) | |
Real Estate Investment Trusts (Continued) | | | | | | | | |
Corporate Office Properties Trust | | | 13,949 | | | $ | 491,144 | |
DuPont Fabros Technology, Inc. | | | 15,006 | | | | 367,047 | |
Weingarten Realty Investors | | | 14,305 | | | | 377,795 | |
| | | | | | | | |
| | | | | | | 1,774,800 | |
| | | | | | | | |
| | |
Savings & Loans (0.76%) | | | | | | | | |
People’s United Financial, Inc. | | | 48,751 | | | | 667,401 | |
| | | | | | | | |
| | |
TOTAL FINANCIALS | | | | | | | 3,816,517 | |
| | | | | | | | |
| | |
Industrials (7.13%) | | | | | | | | |
Aerospace & Defense (2.98%) | | | | | | | | |
Esterline Technologies Corp. (a) | | | 10,529 | | | | 755,982 | |
L-3 Communications Holdings, Inc. | | | 5,443 | | | | 436,474 | |
Lockheed Martin Corp. | | | 9,000 | | | | 713,250 | |
United Technologies Corp. | | | 7,744 | | | | 693,708 | |
| | | | | | | | |
| | | | | | | 2,599,414 | |
| | | | | | | | |
| | |
Containers & Packaging (0.98%) | | | | | | | | |
Ball Corp. | | | 22,989 | | | | 857,720 | |
| | | | | | | | |
| | |
Engineering & Construction (0.52%) | | | | | | | | |
Aecom Technology Corp. (a) | | | 16,752 | | | | 456,659 | |
| | | | | | | | |
| | |
Hand & Machine Tools (0.61%) | | | | | | | | |
Snap-On, Inc. | | | 8,561 | | | | 528,813 | |
| | | | | | | | |
Machinery, Construction & Mining (0.62%) | | | | | | | | |
Caterpillar, Inc. | | | 4,688 | | | | 541,042 | |
| | | | | | | | |
| | |
Pharmaceuticals (0.72%) | | | | | | | | |
PerkinElmer, Inc. | | | 22,162 | | | | 626,520 | |
| | | | | | | | |
| | |
Transportation (0.70%) | | | | | | | | |
United Parcel Service, Inc., Class B | | | 8,136 | | | | 609,956 | |
| | | | | | | | |
| | |
TOTAL INDUSTRIALS | | | | | | | 6,220,124 | |
| | | | | | | | |
| | |
Technology (3.93%) | | | | | | | | |
Computers & Peripherals (2.09%) | | | | | | | | |
Accenture PLC, Class A | | | 9,324 | | | | 532,680 | |
Apple, Inc. (a) | | | 1,236 | | | | 430,412 | |
International Business Machines Corp. | | | 5,035 | | | | 858,871 | |
| | | | | | | | |
| | | | | | | 1,821,963 | |
| | | | | | | | |
IT Services (0.78%) | | | | | | | | |
Fiserv, Inc. (a) | | | 11,168 | | | | 684,710 | |
| | | | | | | | |
| | | | | | | | |
| | | Shares | | | Value (Note 1) | |
Semiconductors & Semiconductor Equipment (0.68%) | | | | | | | | |
Microchip Technology, Inc. | | | 14,355 | | | $ | 589,129 | |
| | | | | | | | |
| | |
Software (0.38%) | | | | | | | | |
BMC Software, Inc. (a) | | | 6,624 | | | | 332,724 | |
| | | | | | | | |
| | |
TOTAL TECHNOLOGY | | | | | | | 3,428,526 | |
| | | | | | | | |
TOTAL COMMON STOCKS (Cost $25,213,475) | | | | | | | 30,945,406 | |
| | | | | | | | |
| | |
EXCHANGE TRADED FUNDS (58.68%) | | | | | | | | |
Emerging Markets (11.75%) | | | | | | | | |
iShares MSCI Emerging Markets Index Fund | | | 23,874 | | | | 1,193,700 | |
Vanguard MSCI Emerging Markets ETF | | | 178,967 | | | | 9,052,151 | |
| | | | | | | | |
| | | | | | | 10,245,851 | |
| | | | | | | | |
| | |
Equity (18.64%) | | | | | | | | |
Global X China Consumer ETF | | | 20,430 | | | | 377,138 | |
iShares Dow Jones U.S. Real Estate Index Fund | | | 8,115 | | | | 504,591 | |
iShares MSCI ACWI Index Fund | | | 37,698 | | | | 1,798,948 | |
iShares MSCI South Korea Index Fund | | | 13,246 | | | | 913,576 | |
iShares S&P 100 Index Fund | | | 73,959 | | | | 4,507,801 | |
iShares S&P Latin America 40 Index Fund | | | 16,045 | | | | 869,158 | |
PowerShares Dynamic Media Portfolio | | | 32,943 | | | | 514,570 | |
PowerShares S&P Small-Cap Health Care Portfolio | | | 17,951 | | | | 613,027 | |
PowerShares S&P Small-Cap Industrials Portfolio | | | 16,745 | | | | 518,593 | |
PowerShares S&P Small-Cap Information Technology Portfolio | | | 28,794 | | | | 940,700 | |
SPDR KBW Capital Markets ETF | | | 19,888 | | | | 778,158 | |
SPDR S&P Oil & Gas Equipment & Services ETF | | | 12,769 | | | | 562,985 | |
Vanguard FTSE All World ex- US Small-Cap ETF | | | 16,374 | | | | 1,754,965 | |
WisdomTree Japan Total Dividend Fund | | | 43,535 | | | | 1,599,911 | |
| | | | | | | | |
| | | | | | | 16,254,121 | |
| | | | | | | | |
| | |
Financial Services (0.72%) | | | | | | | | |
Financial Select Sector SPDR Fund (b) | | | 38,418 | | | | 628,903 | |
| | | | | | | | |
| | |
Growth (4.14%) | | | | | | | | |
Wilshire Micro-Cap ETF | | | 178,161 | | | | 3,610,433 | |
| | | | | | | | |
44 | April 30, 2011
| | | | |
RiverFront Long-Term Growth Fund |
| | | Statement of Investments | | April 30, 2011 |
| | | | | | | | |
| | | Shares | | | Value (Note 1) | |
Growth Mid-Cap (2.05%) | | | | | | | | |
SPDR S&P Mid-Cap 400 ETF Trust | | | 9,704 | | | $ | 1,791,455 | |
| | | | | | | | |
| | |
Growth Small-Cap (1.91%) | | | | | | | | |
PowerShares Zacks Micro-Cap Portfolio | | | 80,454 | | | | 1,004,870 | |
Vanguard Small-Cap ETF | | | 8,150 | | | | 662,677 | |
| | | | | | | | |
| | | | | | | 1,667,547 | |
| | | | | | | | |
International Equity (11.93%) | | | | | | | | |
iShares MSCI Canada Index Fund | | | 78,427 | | | | 2,642,990 | |
Vanguard MSCI EAFE ETF | | | 195,982 | | | | 7,764,807 | |
| | | | | | | | |
| | | | | | | 10,407,797 | |
| | | | | | | | |
| | |
Large-Cap (0.92%) | | | | | | | | |
iShares S&P North American Technology-Software Index Fund (a) | | | 12,403 | | | | 799,497 | |
| | | | | | | | |
| | |
Micro-Cap (3.09%) | | | | | | | | |
First Trust Dow Jones Select Micro-Cap Index Fund | | | 111,109 | | | | 2,692,171 | |
| | | | | | | | |
| | |
Small-Cap (2.64%) | | | | | | | | |
PowerShares Dynamic Leisure & Entertainment Portfolio | | | 33,021 | | | | 639,287 | |
SPDR S&P Emerging Small-Cap ETF | | | 29,661 | | | | 1,665,168 | |
| | | | | | | | |
| | | | | | | 2,304,455 | |
| | | | | | | | |
| | |
Value (0.89%) | | | | | | | | |
PowerShares Dividend Achievers Portfolio | | | 50,966 | | | | 779,270 | |
| | | | | | | | |
| | |
TOTAL EXCHANGE TRADED FUNDS (Cost $43,887,727) | | | | | | | 51,181,500 | |
| | | | | | | | |
| | |
EXCHANGE TRADED NOTES (2.87%) | | | | | | | | |
Master Limited Partnerships (MLPs) (2.87%) | | | | | | | | |
JPMorgan Alerian MLP Index ETN | | | 42,806 | | | | 1,677,995 | |
UBS E-TRACS Alerian MLP Infrastructure ETN | | | 25,656 | | | | 819,709 | |
| | | | | | | | |
| | | | | | | 2,497,704 | |
| | | | | | | | |
| | |
TOTAL EXCHANGE TRADED NOTES (Cost $2,105,424) | | | | | | | 2,497,704 | |
| | | | | | | | |
| | | | | | | | |
| | | Shares | | | Value (Note 1) | |
SHORT TERM INVESTMENTS (3.75%) | | | | | | | | |
Money Market Fund (3.75%) | | | | | | | | |
Dreyfus Cash Management Fund, Institutional Class 0.102% | | | 3,271,203 | | | $ | 3,271,203 | |
| | | | | | | | |
| | |
TOTAL SHORT TERM INVESTMENTS (Cost $3,271,203) | | | | | | | 3,271,203 | |
| | | | | | | | |
| | |
TOTAL INVESTMENTS (100.78%) (Cost $74,477,829) | | | | | | $ | 87,895,813 | |
| | |
Liabilities In Excess Of Other Assets (-0.78%) | | | | | | | (678,170 | ) |
| | | | | | | | |
| | |
NET ASSETS (100.00%) | | | | | | $ | 87,217,643 | |
| | | | | | | | |
| (a) | Non-Income Producing Security. |
| (b) | Affiliated Company. See Note 6 to Financial Statements. |
Common Abbreviations:
ACWI - All Country World Index.
EAFE - Europe, Australia, and Far East.
ETF - Exchange Traded Fund.
ETN - Exchange Traded Note.
E-TRACS - Exchange Traded Access Securities.
FTSE - Financial Times and the London Stock Exchange.
KBW - Keefe, Bruyette & Woods.
MLP - Master Limited Partnership.
MSCI - Morgan Stanley Capital International.
PLC - Public Limited Company.
S&P - Standard and Poor’s.
SPDR - Standard and Poor’s Depositary Receipt.
For Fund compliance purposes, the Fund’s industry classifications refer to any one or more of the industry sub-classifications used by one or more widely recognized market indexes or ratings group indexes, and/or as defined by Fund management. This definition may not apply for purposes of this report, which may combine industry sub-classifications for reporting ease. Industries are shown as a percent of net assets. These industry classifications are based on third party definitions and are unaudited. The definitions are industry terms and do not reflect the legal status of any of the investments or the companies in which the Fund has invested.
See Notes to Financial Statements.
45 | April 30, 2011
| | | | |
RiverFront Long-Term Growth & Income Fund |
| | | Management Commentary | | April 30, 2011 (Unaudited) |
For the period ending April 30, 2011, the RiverFront Long-Term Growth & Income Fund’s (the “Fund”) Class A Shares, RLGAX, delivered a net return of 17.99% at Net Asset Value (Class A delivered a net return of 11.52% at MOP, Class C, RLGCX, was +16.32% with CDSC, Class I, RLIIX, was +18.21%). The Fund’s performance was below that of the broad based S&P 500 Total Return Index (+22.92%), without taking into account sales charges for Class A and C Shares.
Over the course of the past year, financial markets have gone through several distinct mood swings. Post recession enthusiasm was replaced by concerns about domestic and global economic growth. The realization that a double-dip was unlikely, along with additional monetary stimulus on the part of the Federal Reserve, sparked an uptrend in the equity markets that is still in place. We believe this resilience supports our belief that many segments of the equity markets are reasonably valued and conditions for a sustainable recovery are in place. With that said, we are keeping a keen eye on inflationary pressures. Inflation has been of little concern to investors for much of the past three decades. A cyclical downturn in inflation that began in the late 1970s has continued in recent years. Steady declines in inflation and interest rates have allowed bonds to provide stability rocked by repeated equity market crises. In addition to this stability, bonds delivered an income stream that more than offset inflation. That is no longer the case.
The collapse in corporate yield spreads over the past year means that many fixed income asset classes now offer returns well below inflation. We believe that these depressed yields are a direct result of the Federal Reserve’s policy of keeping short-term rates close to 0%. If the Fed continues this policy, an extended period of negative inflation-adjusted yields will erode the purchasing power of fixed income investments, in our view. Conversely, if the Fed ends its zero interest rate policy, rising yields could cause bond prices to fall sharply. Either way, bonds’ traditional role of protecting investors from short-term volatility must increasingly come at the expense of exposure to significant longer-term investment risks. By contrast, we think equities provide more inflation protection than is generally recognized and, given current price levels, offer a viable alternative to overbought commodities.
We began 2011 overweight emerging markets; underweight developed international and overweight high yield bonds. Our domestic equity allocation was skewed towards high quality, income-oriented stocks which have been solid performers thus far. The emerging markets equities, however, failed to keep pace with the gains from 2010. Emerging market stock indexes have diverged significantly from developed markets this year as many emerging market central banks have begun to tighten more aggressively to fight rising inflation. We think many emerging market central banks are still behind the inflation curve and, until they get ahead, emerging market underperformance will likely continue. Our emerging markets weighting proved to be a detractor from performance. Since we expect the rising interest rate trend to continue in emerging markets for the next several months, we have lowered our weighting in emerging market equities despite our long term confidence in this asset class. We chose to neutralize our position in developed international. Our Price Matters™ framework continues to suggest that this asset class is attractively price relative to long term trends, however concerns about the financial stability of various European countries has caused these stocks to lag the S&P 500 on a year to date basis. In summary, both the emerging and international equity areas have contributed negatively to performance over the period.
Positive contributors have been stock selection in our Industrials and Technology sectors. In addition, Energy proved to be a positive contributor during the first quarter, both from an allocation and selection standpoint. Lastly, our overweight in high yield for much of this year was a positive contributor. High yield bonds saw their third consecutive quarter of significant spread tightening during the first quarter of this year, making them the best performing fixed income sector.
46 | April 30, 2011
| | | | |
RiverFront Long-Term Growth & Income Fund |
| | | Management Commentary | | April 30, 2011 (Unaudited) |
Performance of $10,000 Initial Investment (as of April 30, 2011)
Comparison of change in value of a $10,000 investment (includes applicable sales loads)
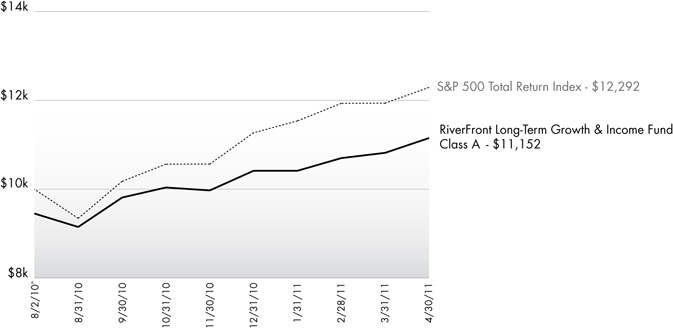
The chart above represents historical performance of a hypothetical investment of $10,000 in the Fund since inception. Past performance does not guarantee future results. This chart does not reflect the deduction of taxes that a shareholder would pay on Fund distributions or the redemption of Fund shares.
Cumulative Return (as of April 30, 2011)
| | | | | | |
| | | Since Inception^ | | Gross Expense Ratio | | What You Pay* |
Class A (NAV)1 | | 17.99% | | 2.01% | | 1.51% |
Class A (MOP)2 | | 11.52% | | |
Class C (NAV)1 | | 17.32% | | 2.76% | | 2.26% |
Class C (CDSC)2 | | 16.32% | | |
Class I | | 18.21% | | 1.76% | | 1.26% |
S&P 500 Total Return Index3 | | 22.92% | | | | |
Performance data quoted represents past performance. Past performance does not guarantee future results. Investment return and principal value of an investment will fluctuate so that an investor’s shares, when sold or redeemed, may be worth more or less than the original cost. Current performance data may be higher or lower than actual data quoted. The Fund imposes a maximum Contingent Deferred Sales Charge (“CDSC”) of 1.00% to shares redeemed within the first 12 months after a purchase in excess of $1 million. Performance data does not reflect the CDSC, which if reflected would reduce the performance quoted. For the most current month-end performance data, please call (866) 759-5679.
| 1 | Net Asset Value (NAV) is the share price without sales charges. |
| 2 | Maximum Offering Price (MOP) includes sales charges. Class A returns include effects of the Fund’s maximum sales charge of 5.50%; Class C returns include the 1.00% CDSC. |
| 3 | S&P 500 Total Return Index is the Standard & Poor’s composite index of 500 stocks, a widely recognized, unmanaged index of common stock prices. An investor may not invest directly in the index. |
| ^ | Fund inception date of 8/2/2010. |
| * | What you pay reflects the Adviser and Sub-Adviser’s decision to contractually limit expenses through August 31, 2012. Please see the prospectus for additional information. |
The table does not reflect the deduction of taxes that a shareholder would pay on Fund distributions or the redemption of Fund shares.
The Fund is less than a year old and has limited operating history. This Fund is not suitable for all investors. Subject to investment risks, including possible loss of the principal amount invested.
47 | April 30, 2011
| | | | |
RiverFront Long-Term Growth & Income Fund |
| | | Management Commentary | | April 30, 2011 (Unaudited) |
Top Ten Holdings (as a % of Net Assets) †
| | | | |
Vanguard MSCI Emerging Markets ETF | | | 8.93 | % |
SPDR S&P Mid-Cap 400 ETF Trust | | | 6.12 | % |
Vanguard MSCI EAFE ETF | | | 5.85 | % |
iShares S&P 100 Index Fund | | | 4.85 | % |
JPMorgan Alerian MLP Index ETN | | | 3.09 | % |
WisdomTree Dreyfus Emerging Currency Fund | | | 2.97 | % |
iShares Dow Jones U.S. Real Estate Index Fund | | | 2.59 | % |
Chevron Corp. | | | 2.48 | % |
iShares MSCI EAFE Index Fund | | | 2.44 | % |
ONEOK, Inc. | | | 2.15 | % |
Top Ten Holdings | | | 41.47 | % |
| † | Holdings are subject to change. |
Portfolio Composition (as a % of Net Assets)
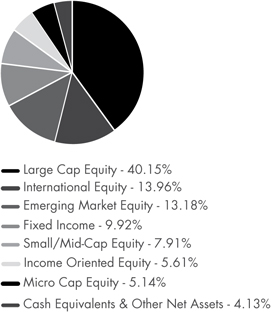
48 | April 30, 2011
| | | | |
RiverFront Long-Term Growth & Income Fund |
| | | Disclosure of Fund Expenses | | April 30, 2011 (Unaudited) |
As a shareholder of the Fund you will incur two types of costs: (1) transaction costs, including applicable sales charges (loads) and redemption fees; and (2) ongoing costs, including management fees, distribution and service (12b-1) fees, shareholder service fees and other Fund expenses. The following examples are intended to help you understand your ongoing costs (in dollars) of investing in the Fund and to compare these costs with the ongoing costs of investing in other mutual funds. The examples are based on an investment of $1,000 invested on November 1, 2010 and held until April 30, 2011.
Actual Expenses. The first line of the table on the next page provides information about actual account values and actual expenses. You may use the information in this line, together with the amount you invested, to estimate the expenses that you paid over the period. Simply divide your account value by $1,000 (for example, an $8,600 account value divided by $1,000 = 8.6), then multiply the result by the number in the first line under the heading “Expense Paid During Period” to estimate the expenses you paid on your account during this period.
Hypothetical Example for Comparison Purposes. The second line of the table on the next page provides information about hypothetical account values and hypothetical expenses based on the Fund’s actual expense ratio and an assumed rate of return of 5% per year before expenses, which is not the Fund’s actual return. The hypothetical account values and expenses may not be used to estimate the actual ending account balance or expenses you paid for the period. You may use this information to compare the ongoing costs of investing in the Fund and other mutual funds. To do so, compare this 5% hypothetical example with the 5% hypothetical examples that appear in the shareholder reports of the other funds.
The expenses shown in the table are meant to highlight ongoing Fund costs only and do not reflect transaction fees, such as sales charges, redemption fees or exchange fees. Therefore, the second line of the table on the next page is useful in comparing ongoing costs only, and may not help you determine the relative total costs of owning different funds. In addition, if these transactional costs were included, your costs would have been higher.
| | | | | | | | | | | | | | | | |
| | | Beginning Account Value
11/1/10 | | | Ending Account Value
4/30/11 | | | Expense
Ratio(a) | | | Expense Paid
During Period(b)
11/1/10 - 4/30/11 | |
Class A | | | | | | | | | | | | | | | | |
Actual | | | $1,000.00 | | | | $1,111.00 | | | | 1.30% | | | | $6.80 | |
Hypothetical (5% return before expenses) | | | $1,000.00 | | | | $1,018.35 | | | | 1.30% | | | | $6.51 | |
| | | | |
Class C | | | | | | | | | | | | | | | | |
Actual | | | $1,000.00 | | | | $1,106.80 | | | | 2.05% | | | | $10.71 | |
Hypothetical (5% return before expenses) | | | $1,000.00 | | | | $1,014.63 | | | | 2.05% | | | | $10.24 | |
| | | | |
Class I | | | | | | | | | | | | | | | | |
Actual | | | $1,000.00 | | | | $1,113.10 | | | | 1.05% | | | | $5.50 | |
Hypothetical (5% return before expenses) | | | $1,000.00 | | | | $1,019.59 | | | | 1.05% | | | | $5.26 | |
| (a) | The Fund’s expense ratios have been based on the Fund’s most recent fiscal half-year expenses. |
| (b) | Expenses are equal to the Fund’s annualized expense ratio multiplied by the average account value over the period, multiplied by the number of days in the most recent fiscal half year (181), then divided by 365. |
49 | April 30, 2011
| | | | |
RiverFront Long-Term Growth & Income Fund |
| | | Statement of Investments | | April 30, 2011 |
| | | | | | | | |
| | | Shares | | | Value (Note 1) | |
COMMON STOCKS (33.31%) | | | | | | | | |
Basic Materials (2.41%) | | | | | | | | |
Chemicals (1.23%) | | | | | | | | |
Monsanto Co. | | | 3,306 | | | $ | 224,941 | |
| | | | | | | | |
| | |
Forest Products & Paper (1.18%) | | | | | | | | |
MeadWestvaco Corp. | | | 6,383 | | | | 215,043 | |
| | | | | | | | |
| | |
TOTAL BASIC MATERIALS | | | | | | | 439,984 | |
| | | | | | | | |
| | |
Communications (4.88%) | | | | | | | | |
Advertising (1.20%) | | | | | | | | |
Omnicom Group, Inc. | | | 4,451 | | | | 218,945 | |
| | | | | | | | |
| | |
Telecommunications (3.68%) | | | | | | | | |
BCE, Inc. | | | 5,729 | | | | 214,436 | |
QUALCOMM, Inc. | | | 5,177 | | | | 294,261 | |
Verizon Communications, Inc. | | | 4,312 | | | | 162,907 | |
| | | | | | | | |
| | | | | | | 671,604 | |
| | | | | | | | |
| | |
TOTAL COMMUNICATIONS | | | | | | | 890,549 | |
| | | | | | | | |
| | |
Consumer, Cyclical (4.34%) | | | | | | | | |
Retail (4.34%) | | | | | | | | |
Darden Restaurants, Inc. | | | 1,997 | | | | 93,799 | |
The Gap, Inc. | | | 8,789 | | | | 204,256 | |
McDonald’s Corp. | | | 3,565 | | | | 279,175 | |
Tiffany & Co. | | | 3,079 | | | | 213,806 | |
| | | | | | | | |
| | | | | | | 791,036 | |
| | | | | | | | |
| | |
TOTAL CONSUMER, CYCLICAL | | | | | | | 791,036 | |
| | | | | | | | |
| | |
Consumer, Non-cyclical (5.98%) | | | | | | | | |
Agriculture (0.71%) | | | | | | | | |
Altria Group, Inc. | | | 4,847 | | | | 130,093 | |
| | | | | | | | |
| | |
Commercial Services (3.60%) | | | | | | | | |
Automatic Data Processing, Inc. | | | 3,783 | | | | 205,606 | |
Iron Mountain, Inc. | | | 6,678 | | | | 212,694 | |
Moody’s Corp. | | | 6,081 | | | | 238,011 | |
| | | | | | | | |
| | | | | | | 656,311 | |
| | | | | | | | |
| | |
Pharmaceuticals (1.67%) | | | | | | | | |
Pfizer, Inc. | | | 14,573 | | | | 305,450 | |
| | | | | | | | |
| | |
TOTAL CONSUMER, NON-CYCLICAL | | | | | | | 1,091,854 | |
| | | | | | | | |
| | |
Energy (6.38%) | | | | | | | | |
Oil & Gas (4.23%) | | | | | | | | |
Chevron Corp. | | | 4,143 | | | | 453,409 | |
Exxon Mobil Corp. | | | 3,611 | | | | 317,768 | |
| | | | | | | | |
| | | | | | | 771,177 | |
| | | | | | | | |
| | | | | | | | |
| | | Shares | | | Value (Note 1) | |
Pipelines (2.15%) | | | | | | | | |
ONEOK, Inc. | | | 5,608 | | | $ | 392,224 | |
| | | | | | | | |
| | |
TOTAL ENERGY | | | | | | | 1,163,401 | |
| | | | | | | | |
| | |
Financials (2.40%) | | | | | | | | |
Diversified Financial Services (0.86%) | | | | | | | | |
American Express Co. | | | 3,219 | | | | 157,989 | |
| | | | | | | | |
| | |
Insurance (1.54%) | | | | | | | | |
Chubb Corp. | | | 4,300 | | | | 280,317 | |
| | | | | | | | |
| | |
TOTAL FINANCIALS | | | | | | | 438,306 | |
| | | | | | | | |
| | |
Industrials (4.04%) | | | | | | | | |
Aerospace & Defense (1.58%) | | | | | | | | |
Lockheed Martin Corp. | | | 3,637 | | | | 288,233 | |
| | | | | | | | |
| | |
Machinery, Construction & Mining (1.23%) | | | | | | | | |
Caterpillar, Inc. | | | 1,939 | | | | 223,780 | |
| | | | | | | | |
| | |
Transportation (1.23%) | | | | | | | | |
United Parcel Service, Inc., Class B | | | 2,990 | | | | 224,160 | |
| | | | | | | | |
| | |
TOTAL INDUSTRIALS | | | | | | | 736,173 | |
| | | | | | | | |
| | |
Technology (2.88%) | | | | | | | | |
Computers (2.88%) | | | | | | | | |
Accenture PLC, Class A | | | 3,735 | | | | 213,381 | |
International Business Machines Corp. | | | 1,832 | | | | 312,502 | |
| | | | | | | | |
| | | | | | | 525,883 | |
| | | | | | | | |
| | |
TOTAL TECHNOLOGY | | | | | | | 525,883 | |
| | | | | | | | |
| | |
TOTAL COMMON STOCKS (Cost $5,510,800) | | | | | | | 6,077,186 | |
| | | | | | | | |
| | |
EXCHANGE TRADED FUNDS (60.46%) | | | | | | | | |
Asset Allocation (2.97%) | | | | | | | | |
WisdomTree Dreyfus Emerging Currency Fund (a) | | | 22,981 | | | | 542,581 | |
| | | | | | | | |
| | |
Debt (2.04%) | | | | | | | | |
iShares iBoxx $ High Yield Corporate Bond Fund | | | 1,779 | | | | 165,180 | |
PowerShares Senior Loan Portfolio | | | 8,185 | | | | 206,917 | |
| | | | | | | | |
| | | | | | | 372,097 | |
| | | | | | | | |
| | |
Emerging Market Equity (11.32%) | | | | | | | | |
Global X China Consumer ETF | | | 4,315 | | | | 79,655 | |
50 | April 30, 2011
| | | | |
RiverFront Long-Term Growth & Income Fund |
| | | Statement of Investments | | April 30, 2011 |
| | | | | | | | |
| | | Shares | | | Value (Note 1) | |
Emerging Market Equity (Continued) | | | | | | | | |
Vanguard MSCI Emerging Markets ETF | | | 32,205 | | | $ | 1,628,929 | |
WisdomTree Emerging Markets Small-Cap Dividend Fund | | | 6,322 | | | | 357,319 | |
| | | | | | | | |
| | | | | | | 2,065,903 | |
| | | | | | | | |
| | |
Equity (18.63%) | | | | | | | | |
iShares MSCI ACWI ex US Index Fund | | | 7,833 | | | | 373,791 | |
iShares MSCI Canada Index Fund | | | 10,690 | | | | 360,253 | |
iShares MSCI EAFE Index Fund | | | 7,013 | | | | 445,045 | |
iShares MSCI South Korea Index Fund | | | 2,711 | | | | 186,978 | |
iShares S&P Latin America 40 Index Fund | | | 3,323 | | | | 180,007 | |
PowerShares Dynamic Industrials Sector Portfolio | | | 4,945 | | | | 160,515 | |
SPDR S&P 500 ETF Trust | | | 860 | | | | 117,424 | |
SPDR S&P Oil & Gas Equipment & Services ETF | | | 3,966 | | | | 174,861 | |
Vanguard MSCI EAFE ETF | | | 26,950 | | | | 1,067,759 | |
WisdomTree Japan Hedged Equity Fund | | | 9,048 | | | | 332,514 | |
| | | | | | | | |
| | | | | | | 3,399,147 | |
| | | | | | | | |
| | |
Fixed Income / High Yield (2.86%) | | | | | | | | |
PowerShares Fundamental High Yield Corporate Bond Portfolio | | | 8,588 | | | | 160,252 | |
SPDR Barclays Capital High Yield Bond ETF | | | 8,833 | | | | 361,270 | |
| | | | | | | | |
| | | | | | | 521,522 | |
| | | | | | | | |
| | |
Foreign Bond (1.97%) | | | | | | | | |
WisdomTree Dreyfus Commodity Currency Fund (a) | | | 12,833 | | | | 360,222 | |
| | | | | | | | |
| | |
Growth Large-Cap (4.85%) | | | | | | | | |
iShares S&P 100 Index Fund | | | 14,528 | | | | 885,482 | |
| | | | | | | | |
| | |
Micro-Cap (5.21%) | | | | | | | | |
First Trust Dow Jones Select Micro-Cap Index Fund | | | 15,466 | | | | 374,741 | |
PowerShares Zacks Micro-Cap Portfolio | | | 30,966 | | | | 386,765 | |
Wilshire Micro-Cap ETF | | | 9,313 | | | | 188,728 | |
| | | | | | | | |
| | | | | | | 950,234 | |
| | | | | | | | |
| | |
Mid-Cap (8.02%) | | | | | | | | |
iShares S&P Mid-Cap 400 Index Fund | | | 3,409 | | | | 345,639 | |
SPDR S&P Mid-Cap 400 ETF Trust | | | 6,050 | | | | 1,116,890 | |
| | | | | | | | |
| | | | | | | 1,462,529 | |
| | | | | | | | |
| | | | | | | | |
| | | Shares | | | Value (Note 1) | |
Real Estate Investment Trust (REIT) (2.59%) | | | | | | | | |
iShares Dow Jones U.S. Real Estate Index Fund | | | 7,613 | | | $ | 473,376 | |
| | | | | | | | |
| | |
TOTAL EXCHANGE TRADED FUNDS (Cost $10,346,940) | | | | | | | 11,033,093 | |
| | | | | | | | |
| | |
EXCHANGE TRADED NOTES (3.09%) | | | | | | | | |
Master Limited Partnerships (MLPs) (3.09%) | | | | | | | | |
JPMorgan Alerian MLP Index ETN | | | 14,367 | | | | 563,186 | |
| | | | | | | | |
| | |
TOTAL EXCHANGE TRADED NOTES (Cost $523,650) | | | | | | | 563,186 | |
| | | | | | | | |
| | |
| 7-Day Yield | | Shares | | | Value (Note 1) | |
SHORT TERM INVESTMENTS (4.17%) | | | | | | | | |
Money Market Fund (4.17%) | | | | | | | | |
Dreyfus Cash Management Fund, Institutional Class 0.102% | | | 761,338 | | | $ | 761,338 | |
| | | | | | | | |
TOTAL SHORT TERM INVESTMENTS (Cost $761,338) | | | | | | | 761,338 | |
| | | | | | | | |
| | |
TOTAL INVESTMENTS (101.03%) (Cost $17,142,728) | | | | | | $ | 18,434,803 | |
Liabilities In Excess Of Other Assets (-1.03%) | | | | | | | (187,853) | |
| | | | | | | | |
| | |
NET ASSETS (100.00%) | | | | | | $ | 18,246,950 | |
| | | | | | | | |
| (a) | Non-Income Producing Security. |
Common Abbreviations:
ACWI - All Country World Index.
EAFE - Europe, Australia, and Far East.
ETF - Exchange Traded Fund.
ETN - Exchange Traded Note.
MLP - Master Limited Partnership.
MSCI - Morgan Stanley Capital International.
PLC - Public Limited Company.
S&P - Standard and Poor’s.
SPDR - Standard and Poor’s Depositary Receipt.
For Fund compliance purposes, the Fund’s industry classifications refer to any one or more of the industry sub-classifications used by one or more widely recognized market indexes or ratings group indexes, and/or as defined by Fund management. This definition may not apply for purposes of this report, which may combine industry sub-classifications for reporting ease. Industries are shown as a percent of net assets. These industry classifications are based on third party definitions and are unaudited. The definitions are industry terms and do not reflect the legal status of any of the investments or the companies in which the Fund has invested.
See Notes to Financial Statements.
51 | April 30, 2011
| | | | |
RiverFront Moderate Growth Fund |
| | | Management Commentary | | April 30, 2011 (Unaudited) |
For the period ending April 30, 2011, the RiverFront Moderate Growth Fund’s (the “Fund”) Class A Shares, RMGAX, delivered a net return of 17.12% at Net Asset Value (Class A delivered a net return of 10.70% at MOP, Class C, RMGCX, was +15.52% with CDSC, Class I, RMGIX, was +17.20%). The Fund’s performance was below that of the broad based S&P 500 Total Return Index (+22.92%), without taking into account sales charges for Class A and C Shares.
Over the course of the past year, financial markets have gone through several distinct mood swings. Post recession enthusiasm was replaced by concerns about domestic and global economic growth. The realization that a double-dip was unlikely, along with additional monetary stimulus on the part of the Federal Reserve, sparked an uptrend in the equity markets that is still in place. We believe this resilience supports our belief that many segments of the equity markets are reasonably valued and conditions for a sustainable recovery are in place. With that said, we are keeping a keen eye on inflationary pressures. Inflation has been of little concern to investors for much of the past three decades. A cyclical downturn in inflation that began in the late 1970s has continued in recent years. Steady declines in inflation and interest rates have allowed bonds to provide stability rocked by repeated equity market crises. In addition to this stability, bonds delivered an income stream that more than offset inflation. That is no longer the case.
The collapse in corporate yield spreads over the past year means that many fixed income asset classes now offer returns well below inflation. We believe that these depressed yields are a direct result of the Federal Reserve’s policy of keeping short-term rates close to 0%. If the Fed continues this policy, an extended period of negative inflation-adjusted yields will erode the purchasing power of fixed income investments, in our view. Conversely, if the Fed ends its zero interest rate policy, rising yields could cause bond prices to fall sharply. Either way, bonds’ traditional role of protecting investors from short-term volatility must increasingly come at the expense of exposure to significant longer-term investment risks. By contrast, we think equities provide more inflation protection than is generally recognized and, given current price levels, offer a viable alternative to overbought commodities.
We began 2011 overweight emerging markets; underweight developed international and overweight high yield bonds. Our domestic equity allocation was skewed towards high quality, income-oriented stocks which have been solid performers thus far. The emerging markets equities, however, failed to keep pace with the gains from 2010. Emerging market stock indexes have diverged significantly from developed markets this year as many emerging market central banks have begun to tighten more aggressively to fight rising inflation. We think many emerging market central banks are still behind the inflation curve and, until they get ahead, emerging market underperformance will likely continue. Our emerging markets weighting proved to be a detractor from performance. Since we expect the rising interest rate trend to continue in emerging markets for the next several months, we have lowered our weighting in emerging market equities despite our long term confidence in this asset class. We chose to neutralize our position in developed international. Our Price Matters™ framework continues to suggest that this asset class is attractively price relative to long term trends, however concerns about the financial stability of various European countries has caused these stocks to lag the S&P 500 on a year to date basis. In summary, both the emerging and international equity areas have contributed negatively to performance over the period.
Positive contributors have been stock selection in our Industrials and Technology sectors. In addition, Energy proved to be a positive contributor during the first quarter, both from an allocation and selection standpoint. Lastly, our overweight in high yield for much of this year was a positive contributor. High yield bonds saw their third consecutive quarter of significant spread tightening during the first quarter of this year, making them the best performing fixed income sector.
52 | April 30, 2011
| | | | |
RiverFront Moderate Growth Fund |
| | | Management Commentary | | April 30, 2011 (Unaudited) |
Performance of $10,000 Initial Investment (as of April 30, 2011)
Comparison of change in value of a $10,000 investment (includes applicable sales loads)
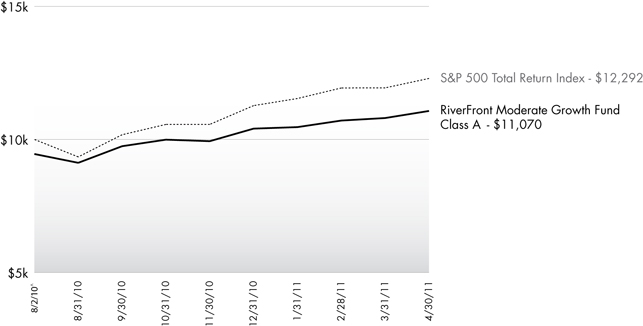
The chart above represents historical performance of a hypothetical investment of $10,000 in the Fund since inception. Past performance does not guarantee future results. This chart does not reflect the deduction of taxes that a shareholder would pay on Fund distributions or the redemption of Fund shares.
Cumulative Return (as of April 30, 2011)
| | | | | | |
| | | Since Inception^ | | Total Expense Ratio | | What You Pay* |
Class A (NAV)1 | | 17.12% | | 2.01% | | 1.51% |
Class A (MOP)2 | | 10.70% | | |
Class C (NAV)1 | | 16.52% | | 2.76% | | 2.26% |
Class C (CDSC)2 | | 15.52% | | |
Class I | | 17.20% | | 1.76% | | 1.26% |
S&P 500 Total Return Index3 | | 22.92% | | | | |
Performance data quoted represents past performance. Past performance does not guarantee future results. Investment return and principal value of an investment will fluctuate so that an investor’s shares, when sold or redeemed, may be worth more or less than the original cost. Current performance data may be higher or lower than actual data quoted. The Fund imposes a maximum Contingent Deferred Sales Charge (“CDSC”) of 1.00% to shares redeemed within the first 12 months after a purchase in excess of $1 million. Performance data does not reflect the CDSC, which if reflected would reduce the performance quoted. For the most current month-end performance data, please call (866) 759-5679.
| 1 | Net Asset Value (NAV) is the share price without sales charges. |
| 2 | Maximum Offering Price (MOP) includes sales charges. Class A returns include effects of the Fund’s maximum sales charge of 5.50%; Class C returns include the 1.00% CDSC. |
| 3 | S&P 500 Total Return Index is the Standard & Poor’s composite index of 500 stocks, a widely recognized, unmanaged index of common stock prices. An investor may not invest directly in the index. |
| ^ | Fund inception date of 8/2/2010. |
| * | What You Pay reflects the Adviser and Sub-Adviser’s decision to contractually limit expenses through August 31, 2012. Please see the prospectus for additional information. |
The table does not reflect the deduction of taxes that a shareholder would pay on Fund distributions or the redemption of Fund shares.
The Fund is less than a year old and has limited operating history. This Fund is not suitable for all investors. Subject to investment risks, including possible loss of the principal amount invested.
53 | April 30, 2011
| | | | |
RiverFront Moderate Growth Fund |
| | | Management Commentary | | April 30, 2011 (Unaudited) |
Top Ten Holdings (as a % of Net Assets) †
| | | | |
Vanguard MSCI Emerging Markets ETF | | | 6.14 | % |
iShares S&P 100 Index Fund | | | 4.81 | % |
WisdomTree Dreyfus Emerging Currency Fund | | | 4.44 | % |
Vanguard MSCI EAFE ETF | | | 4.41 | % |
WisdomTree Dreyfus Commodity Currency Fund | | | 3.47 | % |
First Trust Dow Jones Select Micro-Cap Index Fund | | | 3.11 | % |
PowerShares Dividend Achievers Portfolio | | | 2.98 | % |
iShares MSCI Canada Index Fund | | | 2.51 | % |
PowerShares Zacks Micro-Cap Portfolio | | | 2.23 | % |
iShares MSCI ACWI ex US Index Fund | | | 2.06 | % |
Top Ten Holdings | | | 36.16 | % |
| † | Holdings are subject to change. |
Portfolio Composition (as a % of Net Assets)

54 | April 30, 2011
| | | | |
RiverFront Moderate Growth Fund |
| | | Disclosure of Fund Expenses | | April 30, 2011 (Unaudited) |
As a shareholder of the Fund you will incur two types of costs: (1) transaction costs, including applicable sales charges (loads) and redemption fees; and (2) ongoing costs, including management fees, distribution and service (12b-1) fees, shareholder service fees and other Fund expenses. The following examples are intended to help you understand your ongoing costs (in dollars) of investing in the Fund and to compare these costs with the ongoing costs of investing in other mutual funds. The examples are based on an investment of $1,000 invested on November 1, 2010 and held until April 30, 2011.
Actual Expenses. The first line of the table on the next page provides information about actual account values and actual expenses. You may use the information in this line, together with the amount you invested, to estimate the expenses that you paid over the period. Simply divide your account value by $1,000 (for example, an $8,600 account value divided by $1,000 = 8.6), then multiply the result by the number in the first line under the heading “Expense Paid During Period” to estimate the expenses you paid on your account during this period.
Hypothetical Example for Comparison Purposes. The second line of the table on the next page provides information about hypothetical account values and hypothetical expenses based on the Fund’s actual expense ratio and an assumed rate of return of 5% per year before expenses, which is not the Fund’s actual return. The hypothetical account values and expenses may not be used to estimate the actual ending account balance or expenses you paid for the period. You may use this information to compare the ongoing costs of investing in the Fund and other mutual funds. To do so, compare this 5% hypothetical example with the 5% hypothetical examples that appear in the shareholder reports of the other funds.
The expenses shown in the table are meant to highlight ongoing Fund costs only and do not reflect transaction fees, such as sales charges, redemption fees or exchange fees. Therefore, the second line of the table on the next page is useful in comparing ongoing costs only, and may not help you determine the relative total costs of owning different funds. In addition, if these transactional costs were included, your costs would have been higher.
| | | | | | | | | | | | | | | | |
| | | Beginning Account Value
11/1/10 | | | Ending Account Value
4/30/11 | | | Expense
Ratio(a) | | | Expense Paid
During Period(b)
11/1/10 - 4/30/11 | |
Class A | | | | | | | | | | | | | | | | |
Actual | | | $1,000.00 | | | | $1,108.10 | | | | 1.30% | | | | $6.80 | |
Hypothetical (5% return before expenses) | | | $1,000.00 | | | | $1,018.35 | | | | 1.30% | | | | $6.51 | |
| | | | |
Class C | | | | | | | | | | | | | | | | |
Actual | | | $1,000.00 | | | | $1,103.40 | | | | 2.05% | | | | $10.69 | |
Hypothetical (5% return before expenses) | | | $1,000.00 | | | | $1,014.63 | | | | 2.05% | | | | $10.24 | |
| | | | |
Class I | | | | | | | | | | | | | | | | |
Actual | | | $1,000.00 | | | | $1,107.80 | | | | 1.05% | | | | $5.49 | |
Hypothetical (5% return before expenses) | | | $1,000.00 | | | | $1,019.59 | | | | 1.05% | | �� | | $5.26 | |
| (a) | The Fund’s expense ratios have been based on the Fund’s most recent fiscal half-year expenses. |
| (b) | Expenses are equal to the Fund’s annualized expense ratio multiplied by the average account value over the period, multiplied by the number of days in the most recent fiscal half year (181), then divided by 365. |
55 | April 30, 2011
| | | | |
RiverFront Moderate Growth Fund |
| | | Statement of Investments | | April 30, 2011 |
| | | | | | | | |
| | | Shares | | | Value (Note 1) | |
COMMON STOCKS (30.29%) | | | | | | | | |
Basic Materials (2.02%) | | | | | | | | |
Chemicals (0.89%) | | | | | | | | |
Monsanto Co. | | | 1,421 | | | $ | 96,685 | |
Sensient Technologies Corp. | | | 1,110 | | | | 42,058 | |
| | | | | | | | |
| | | | | | | 138,743 | |
| | | | | | | | |
| | |
Forest Products & Paper (0.64%) | | | | | | | | |
MeadWestvaco Corp. | | | 2,947 | | | | 99,284 | |
| | | | | | | | |
| | |
Iron & Steel (0.49%) | | | | | | | | |
Steel Dynamics, Inc. | | | 4,174 | | | | 75,925 | |
| | | | | | | | |
| | |
TOTAL BASIC MATERIALS | | | | | | | 313,952 | |
| | | | | | | | |
| | |
Communications (2.39%) | | | | | | | | |
Advertising (0.60%) | | | | | | | | |
Omnicom Group, Inc. | | | 1,899 | | | | 93,412 | |
| | | | | | | | |
| | |
Telecommunications (1.79%) | | | | | | | | |
Harris Corp. | | | 1,535 | | | | 81,555 | |
QUALCOMM, Inc. | | | 2,055 | | | | 116,806 | |
Verizon Communications, Inc. | | | 2,099 | | | | 79,300 | |
| | | | | | | | |
| | | | | | | 277,661 | |
| | | | | | | | |
| | |
TOTAL COMMUNICATIONS | | | | | | | 371,073 | |
| | | | | | | | |
| | |
Consumer, Cyclical (2.36%) | | | | | | | | |
Entertainment (0.51%) | | | | | | | | |
Penn National Gaming, Inc. (a) | | | 1,993 | | | | 79,740 | |
| | | | | | | | |
| | |
Leisure Time (0.23%) | | | | | | | | |
WMS Industries, Inc. (a) | | | 1,112 | | | | 36,474 | |
| | | | | | | | |
| | |
Retail (1.30%) | | | | | | | | |
Darden Restaurants, Inc. | | | 1,118 | | | | 52,512 | |
Dollar Tree, Inc. (a) | | | 1,484 | | | | 85,330 | |
The Gap, Inc. | | | 2,723 | | | | 63,283 | |
| | | | | | | | |
| | | | | | | 201,125 | |
| | | | | | | | |
| | |
Toys, Games & Hobbies (0.32%) | | | | | | | | |
Hasbro, Inc. | | | 1,055 | | | | 49,416 | |
| | | | | | | | |
| | |
TOTAL CONSUMER, CYCLICAL | | | | | | | 366,755 | |
| | | | | | | | |
| | |
Consumer, Non-cyclical (7.04%) | | | | | | | | |
Agriculture (0.59%) | | | | | | | | |
Altria Group, Inc. | | | 3,399 | | | | 91,229 | |
| | | | | | | | |
| | |
Commercial Services (2.13%) | | | | | | | | |
Automatic Data Processing, Inc. | | | 1,930 | | | | 104,896 | |
Iron Mountain, Inc. | | | 3,572 | | | | 113,768 | |
| | | | | | | | |
| | | Shares | | | Value (Note 1) | |
Commercial Services (Continued) | | | | | | | | |
Manpower, Inc. | | | 842 | | | $ | 55,783 | |
Moody’s Corp. | | | 1,431 | | | | 56,009 | |
| | | | | | | | |
| | | | | | | 330,456 | |
| | | | | | | | |
| | |
Healthcare Products (2.22%) | | | | | | | | |
CareFusion Corp. (a) | | | 4,453 | | | | 130,785 | |
Henry Schein, Inc. (a) | | | 1,031 | | | | 75,335 | |
Hologic, Inc. (a) | | | 2,991 | | | | 65,862 | |
PSS World Medical, Inc. (a) | | | 2,532 | | | | 72,820 | |
| | | | | | | | |
| | | | | | | 344,802 | |
| | | | | | | | |
| | |
Household Products & Wares (0.53%) | | | | | | | | |
The Scotts Miracle-Gro Co., Class A | | | 1,462 | | | | 82,559 | |
| | | | | | | | |
| | |
Pharmaceuticals (1.57%) | | | | | | | | |
Omnicare, Inc. | | | 3,081 | | | | 96,805 | |
Pfizer, Inc. | | | 6,979 | | | | 146,280 | |
| | | | | | | | |
| | | | | | | 243,085 | |
| | | | | | | | |
| | |
TOTAL CONSUMER, NON-CYCLICAL | | | | | | | 1,092,131 | |
| | | | | | | | |
| | |
Energy (4.11%) | | | | | | | | |
Oil & Gas (3.58%) | | | | | | | | |
Chevron Corp. | | | 1,852 | | | | 202,683 | |
Exxon Mobil Corp. | | | 2,361 | | | | 207,768 | |
Forest Oil Corp. (a) | | | 2,222 | | | | 79,792 | |
Petrohawk Energy Corp. (a) | | | 2,408 | | | | 65,040 | |
| | | | | | | | |
| | | | | | | 555,283 | |
| | | | | | | | |
| | |
Oil & Gas Services (0.53%) | | | | | | | | |
Superior Energy Services, Inc. (a) | | | 2,143 | | | | 82,334 | |
| | | | | | | | |
| | |
TOTAL ENERGY | | | | | | | 637,617 | |
| | | | | | | | |
| | |
Financials (3.14%) | | | | | | | | |
Banks (0.56%) | | | | | | | | |
East West Bancorp, Inc. | | | 4,109 | | | | 86,823 | |
| | | | | | | | |
| | |
Insurance (0.55%) | | | | | | | | |
HCC Insurance Holdings, Inc. | | | 2,598 | | | | 84,539 | |
| | | | | | | | |
| | |
Real Estate Investment Trusts (1.47%) | | | | | | | | |
American Campus Communities, Inc. | | | 1,879 | | | | 66,047 | |
Corporate Office Properties Trust | | | 1,889 | | | | 66,511 | |
DuPont Fabros Technology, Inc. | | | 1,992 | | | | 48,724 | |
Weingarten Realty Investors | | | 1,778 | | | | 46,957 | |
| | | | | | | | |
| | | | | | | 228,239 | |
| | | | | | | | |
56 | April 30, 2011
| | | | |
RiverFront Moderate Growth Fund |
| | | Statement of Investments | | April 30, 2011 |
| | | | | | | | |
| | | Shares | | | Value
(Note 1) | |
Savings & Loans (0.56%) | | | | | | | | |
People’s United Financial, Inc. | | | 6,395 | | | $ | 87,548 | |
| | | | | | | | |
| | |
TOTAL FINANCIALS | | | | | | | 487,149 | |
| | | | | | | | |
| | |
Industrials (5.98%) | | | | | | | | |
Aerospace & Defense (2.48%) | | | | | |
Esterline Technologies Corp. (a) | | | 1,319 | | | | 94,704 | |
L-3 Communications Holdings, Inc. | | | 681 | | | | 54,609 | |
Lockheed Martin Corp. | | | 1,675 | | | | 132,744 | |
United Technologies Corp. | | | 1,156 | | | | 103,554 | |
| | | | | | | | |
| | | | | | | 385,611 | |
| | | | | | | | |
| | |
Electronics (0.54%) | | | | | | | | |
PerkinElmer, Inc. | | | 2,956 | | | | 83,566 | |
| | | | | | | | |
|
Engineering & Construction (0.39%) | |
Aecom Technology Corp. (a) | | | 2,199 | | | | 59,945 | |
| | | | | | | | |
|
Hand & Machine Tools (0.44%) | |
Snap-On, Inc. | | | 1,112 | | | | 68,688 | |
| | | | | | | | |
|
Machinery, Construction & Mining (0.66%) | |
Caterpillar, Inc. | | | 887 | | | | 102,369 | |
| | | | | | | | |
|
Packaging & Containers (0.75%) | |
Ball Corp. | | | 3,107 | | | | 115,922 | |
| | | | | | | | |
|
Transportation (0.72%) | |
United Parcel Service, Inc., Class B | | | 1,483 | | | | 111,181 | |
| | | | | | | | |
| | |
TOTAL INDUSTRIALS | | | | | | | 927,282 | |
| | | | | | | | |
| | |
Technology (3.25%) | | | | | | | | |
| | |
Computers (1.95%) | | | | | | | | |
Accenture PLC, Class A | | | 1,738 | | | | 99,292 | |
Apple, Inc. (a) | | | 253 | | | | 88,102 | |
International Business Machines Corp. | | | 679 | | | | 115,825 | |
| | | | | | | | |
| | | | | | | 303,219 | |
| | | | | | | | |
| | |
Semiconductors (0.51%) | | | | | | | | |
Microchip Technology, Inc. | | | 1,937 | | | | 79,494 | |
| | | | | | | | |
| | |
Software (0.79%) | | | | | | | | |
BMC Software, Inc. (a) | | | 912 | | | | 45,810 | |
Fiserv, Inc. (a) | | | 1,243 | | | | 76,208 | |
| | | | | | | | |
| | | | | | | 122,018 | |
| | | | | | | | |
| | | | | | | | |
| | | Shares | | | Value (Note 1) | |
| | |
TOTAL COMMON STOCKS (Cost $4,325,166) | | | | | | $ | 4,700,690 | |
| | | | | | | | |
| | |
EXCHANGE TRADED FUNDS (61.67%) | | | | | | | | |
Asset Allocation (4.43%) | | | | | |
WisdomTree Dreyfus Emerging Currency Fund (a) | | | 29,151 | | | | 688,255 | |
| | | | | | | | |
|
Consumer Discretionary (0.63%) | |
Powershares Dynamic Leisure & Entertainment Portfolio | | | 5,036 | | | | 97,497 | |
| | | | | | | | |
| | |
Debt (2.77%) | | | | | | | | |
iShares iBoxx $ High Yield Corporate Bond Fund | | | 2,240 | | | | 207,984 | |
PowerShares Senior Loan Portfolio | | | 8,756 | | | | 221,352 | |
| | | | | | | | |
| | | | | | | 429,336 | |
| | | | | | | | |
|
Emerging Market Equity (8.84%) | |
Global X China Consumer ETF | | | 3,672 | | | | 67,785 | |
iShares MSCI Emerging Markets Index Fund | | | 4,097 | | | | 204,850 | |
SPDR S&P Emerging Markets Small-Cap ETF | | | 2,613 | | | | 146,694 | |
Vanguard MSCI Emerging Markets ETF | | | 18,829 | | | | 952,371 | |
| | | | | | | | |
| | | | | | | 1,371,700 | |
| | | | | | | | |
| | |
Energy (0.68%) | | | | | | | | |
SPDR S&P Oil & Gas Equipment & Services ETF | | | 2,397 | | | | 105,684 | |
| | | | | | | | |
| | |
Equity (11.25%) | | | | | | | | |
iShares MSCI ACWI ex US Index Fund | | | 6,709 | | | | 320,152 | |
iShares MSCI South Korea Index Fund | | | 2,305 | | | | 158,976 | |
iShares S&P Latin America 40 Index Fund | | | 2,851 | | | | 154,439 | |
Powershares Dynamic Media Portfolio | | | 6,225 | | | | 97,235 | |
PowerShares S&P Small-Cap Health Care Portfolio | | | 2,406 | | | | 82,165 | |
PowerShares S&P Small-Cap Industrials Portfolio | | | 2,220 | | | | 68,753 | |
PowerShares S&P Small-Cap Information Technology Portfolio | | | 3,789 | | | | 123,787 | |
SPDR KBW Capital Markets ETF | | | 3,699 | | | | 144,731 | |
Vanguard FTSE All World ex-US Small-Cap ETF | | | 2,911 | | | | 312,000 | |
WisdomTree Japan Hedged Equity Fund | | | 7,701 | | | | 283,012 | |
| | | | | | | | |
| | | | | | | 1,745,250 | |
| | | | | | | | |
57 | April 30, 2011
| | | | |
RiverFront Moderate Growth Fund |
| | | Statement of Investments | | April 30, 2011 |
| | | | | | | | |
| | | Shares | | | Value (Note 1) | |
Financial Services (0.75%) | | | | | | | | |
Financial Select Sector SPDR Fund (b) | | | 7,128 | | | $ | 116,685 | |
| | | | | | | | |
Fixed Income / High Yield (2.36%) | | | | | | | | |
PowerShares Fundamental High Yield Corporate Bond Portfolio | | | 6,771 | | | | 126,347 | |
SPDR Barclays Capital High Yield Bond ETF | | | 5,849 | | | | 239,224 | |
| | | | | | | | |
| | | | | | | 365,571 | |
| | | | | | | | |
| | |
Foreign Bond (3.47%) | | | | | | | | |
WisdomTree Dreyfus Commodity
Currency Fund (a) | | | 19,185 | | | | 538,523 | |
| | | | | | | | |
| | |
Growth Large-Cap (4.81%) | | | | | | | | |
iShares S&P 100 Index Fund | | | 12,241 | | | | 746,089 | |
| | | | | | | | |
| | |
Growth Mid-Cap (1.89%) | | | | | | | | |
SPDR S&P Mid-Cap 400 ETF Trust | | | 1,588 | | | | 293,161 | |
| | | | | | | | |
| | |
Growth Small-Cap (1.02%) | | | | | | | | |
Vanguard Small-Cap ETF | | | 1,942 | | | | 157,904 | |
| | | | | | | | |
| | |
International Equity (6.92%) | | | | | | | | |
iShares MSCI Canada Index Fund | | | 11,570 | | | | 389,909 | |
Vanguard MSCI EAFE ETF | | | 17,280 | | | | 684,634 | |
| | | | | | | | |
| | | | | | | 1,074,543 | |
| | | | | | | | |
| | |
Large-Cap (2.98%) | | | | | | | | |
PowerShares Dividend Achievers Portfolio | | | 30,215 | | | | 461,987 | |
| | | | | | | | |
| | |
Micro-Cap (7.32%) | | | | | | | | |
First Trust Dow Jones Select Micro-Cap Index Fund | | | 19,949 | | | | 483,365 | |
PowerShares Zacks Micro-Cap Portfolio | | | 27,756 | | | | 346,672 | |
Wilshire Micro-Cap ETF | | | 15,094 | | | | 305,880 | |
| | | | | | | | |
| | | | | | | 1,135,917 | |
| | | | | | | | |
| | |
Real Estate Investment Trust (REIT) (0.61%) | | | | | | | | |
iShares Dow Jones U.S. Real Estate Index Fund | | | 1,527 | | | | 94,949 | |
| | | | | | | | |
| | |
Technology (0.94%) | | | | | | | | |
iShares S&P North American Technology-Software Index Fund (a) | | | 2,263 | | | | 145,873 | |
| | | | | | | | |
| | |
TOTAL EXCHANGE TRADED FUNDS (Cost $9,057,948) | | | | | | | 9,568,924 | |
| | | | | | | | |
| | | | | | | | |
| | | Shares | | | Value (Note 1) | |
EXCHANGE TRADED NOTES (2.91%) | | | | | | | | |
Master Limited Partnerships (MLPs) (2.91%) | | | | | | | | |
JPMorgan Alerian MLP Index ETN | | | 7,753 | | | $ | 303,917 | |
UBS E-TRACS Alerian MLP Infrastructure ETN | | | 4,644 | | | | 148,376 | |
| | | | | | | | |
| | | | | | | 452,293 | |
| | | | | | | | |
| | |
TOTAL EXCHANGE TRADED NOTES (Cost $423,071) | | | | | | | 452,293 | |
| | | | | | | | |
| | | | | | | | |
| 7-Day Yield | | Shares | | | Value (Note 1) | |
| | |
SHORT TERM INVESTMENTS (4.56%) | | | | | | | | |
Money Market Fund (4.56%) | | | | | | | | |
Dreyfus Cash Management Fund, Institutional Class 0.102% | | | 706,812 | | | $ | 706,812 | |
| | | | | | | | |
TOTAL SHORT TERM INVESTMENTS
(Cost $706,812) | | | | | | | 706,812 | |
| | | | | | | | |
| | |
TOTAL INVESTMENTS (99.43%)
(Cost $14,512,997) | | | | | | $ | 15,428,719 | |
| | |
Other Assets In Excess Of
Liabilities (0.57%) | | | | | | | 88,892 | |
| | | | | | | | |
| | |
NET ASSETS (100.00%) | | | | | | $ | 15,517,611 | |
| | | | | | | | |
| (a) | Non-Income Producing Security. |
| (b) | Affiliated Company. See Note 6 to Financial Statements. |
Common Abbreviations:
| ACWI | - All Country World Index. |
| EAFE | - Europe, Australia, and Far East. |
| | |
| E-TRACS - | | Enhanced Tax Revenue Assessment and Collection System. |
| ETF | - Exchange Traded Fund. |
| ETN | - Exchange Traded Note. |
| FTSE | - Financial Times and the London Stock Exchange. |
| MLP | - Master Limited Partnership. |
| MSCI | - Morgan Stanley Capital International. |
| PLC | - Public Limited Company. |
| KBW | - Keefe, Bruyette & Woods. |
| S&P | - Standard and Poor’s. |
| SPDR | - Standard and Poor’s Depositary Receipt. |
For Fund compliance purposes, the Fund’s industry classifications refer to any one or more of the industry sub-classifications used by one or more widely recognized market indexes or ratings group indexes, and/or as defined by Fund management. This definition may not apply for purposes of this report, which may combine industry sub-classifications for reporting ease. Industries are shown as a percent of net assets. These industry classifications are based on third party definitions and are unaudited. The definitions are industry terms and do not reflect the legal status of any of the investments or the companies in which the Fund has invested.
See Notes to Financial Statements.
58 | April 30, 2011
| | | | |
RiverFront Moderate Growth & Income Fund |
| | | Management Commentary | | April 30, 2011 (Unaudited) |
For the period ending April 30, 2011, the RiverFront Moderate Growth & Income Fund’s (the “Fund”) Class A Shares, RMIAX, delivered a net return of 11.70% at Net Asset Value (Class A delivered a net return of 5.58% at MOP, Class C, RMICX, was +10.24% with CDSC, Class I, RMIIX, was +11.92%). The Fund’s performance was below that of the broad based S&P 500 Total Return Index (+22.92%), without taking into account sales charges for Class A and C Shares.
Over the course of the past year, financial markets have gone through several distinct mood swings. Post recession enthusiasm was replaced by concerns about domestic and global economic growth. The realization that a double-dip was unlikely, along with additional monetary stimulus on the part of the Federal Reserve, sparked an uptrend in the equity markets that is still in place. We believe this resilience supports our belief that many segments of the equity markets are reasonably valued and conditions for a sustainable recovery are in place. With that said, we are keeping a keen eye on inflationary pressures. Inflation has been of little concern to investors for much of the past three decades. A cyclical downturn in inflation that began in the late 1970s has continued in recent years. Steady declines in inflation and interest rates have allowed bonds to provide stability rocked by repeated equity market crises. In addition to this stability, bonds delivered an income stream that more than offset inflation. That is no longer the case.
The collapse in corporate yield spreads over the past year means that many fixed income asset classes now offer returns well below inflation. We believe that these depressed yields are a direct result of the Federal Reserve’s policy of keeping short-term rates close to 0%. If the Fed continues this policy, an extended period of negative inflation-adjusted yields will erode the purchasing power of fixed income investments, in our view. Conversely, if the Fed ends its zero interest rate policy, rising yields could cause bond prices to fall sharply. Either way, bonds’ traditional role of protecting investors from short-term volatility must increasingly come at the expense of exposure to significant longer-term investment risks. By contrast, we think equities provide more inflation protection than is generally recognized and, given current price levels, offer a viable alternative to overbought commodities.
We began 2011 overweight emerging markets; underweight developed international and overweight high yield bonds. Our domestic equity allocation was skewed towards high quality, income-oriented stocks which have been solid performers thus far. The emerging markets equities, however, failed to keep pace with the gains from 2010. Emerging market stock indexes have diverged significantly from developed markets this year as many emerging market central banks have begun to tighten more aggressively to fight rising inflation. We think many emerging market central banks are still behind the inflation curve and, until they get ahead, emerging market underperformance will likely continue. Our emerging markets weighting proved to be a detractor from performance. Since we expect the rising interest rate trend to continue in emerging markets for the next several months, we have lowered our weighting in emerging market equities despite our long term confidence in this asset class. We chose to neutralize our position in developed international. Our Price Matters™ framework continues to suggest that this asset class is attractively price relative to long term trends, however concerns about the financial stability of various European countries has caused these stocks to lag the S&P 500 on a year to date basis. In summary, both the emerging and international equity areas have contributed negatively to performance over the period.
Positive contributors have been stock selection in our Industrials and Technology sectors. In addition, Energy proved to be a positive contributor during the first quarter, both from an allocation and selection standpoint. Lastly, our overweight in high yield for much of this year was a positive contributor. High yield bonds saw their third consecutive quarter of significant spread tightening during the first quarter of this year, making them the best performing fixed income sector.
59 | April 30, 2011
| | | | |
RiverFront Moderate Growth & Income Fund |
| | | Management Commentary | | April 30, 2011 (Unaudited) |
Performance of $10,000 Initial Investment (as of April 30, 2011)
Comparison of change in value of a $10,000 investment (includes applicable sales loads)
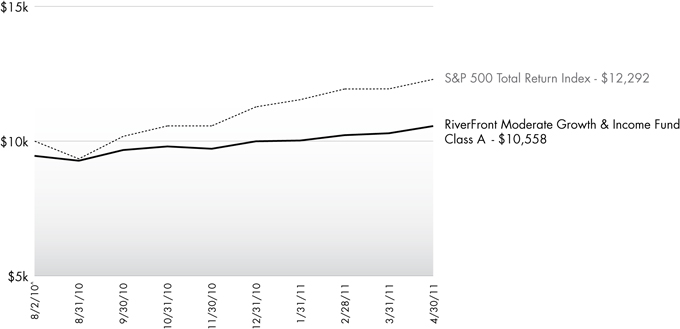
The chart above represents historical performance of a hypothetical investment of $10,000 in the Fund since inception. Past performance does not guarantee future results. This chart does not reflect the deduction of taxes that a shareholder would pay on Fund distributions or the redemption of Fund shares.
Cumulative Return (as of April 30, 2011)
| | | | | | |
| | | Since Inception^ | | Total Expense Ratio | | What You Pay* |
Class A (NAV)1 | | 11.70% | | 2.01% | | 1.51% |
Class A (MOP)2 | | 5.58% | | |
Class C (NAV)1 | | 11.24% | | 2.76% | | 2.26% |
Class C (CDSC)2 | | 10.24% | | |
Class I | | 11.92% | | 1.76% | | 1.26% |
S&P 500 Total Return Index3 | | 22.92% | | | | |
Performance data quoted represents past performance. Past performance does not guarantee future results. Investment return and principal value of an investment will fluctuate so that an investor’s shares, when sold or redeemed, may be worth more or less than the original cost. Current performance data may be higher or lower than actual data quoted. The Fund imposes a maximum Contingent Deferred Sales Charge (“CDSC”) of 1.00% to shares redeemed within the first 12 months after a purchase in excess of $1 million. Performance data does not reflect the CDSC, which if reflected would reduce the performance quoted. For the most current month-end performance data, please call (866) 759-5679.
| 1 | Net Asset Value (NAV) is the share price without sales charges. |
| 2 | Maximum Offering Price (MOP) includes sales charges. Class A returns include effects of the Fund’s maximum sales charge of 5.50%; Class C returns include the 1.00% CDSC. |
| 3 | S&P 500 Total Return Index is the Standard & Poor’s composite index of 500 stocks, a widely recognized, unmanaged index of common stock prices. An investor may not invest directly in the index. |
| ^ | Fund inception date of 8/2/2010. |
| * | What You Pay reflects the Adviser and Sub-Adviser’s decision to contractually limit expenses through August 31, 2012. Please see the prospectus for additional information. |
The table does not reflect the deduction of taxes that a shareholder would pay on Fund distributions or the redemption of Fund shares.
The Fund is less than a year old and has limited operating history. This Fund is not suitable for all investors. Subject to investment risks, including possible loss of the principal amount invested.
60 | April 30, 2011
| | | | |
RiverFront Moderate Growth & Income Fund |
| | | Management Commentary | | April 30, 2011 (Unaudited) |
Top Ten Holdings (as a % of Net Assets) †
| | | | | | |
Vanguard Short-Term Corporate Bond ETF | | | | | 15.50 | % |
Vanguard MSCI Emerging Markets ETF | | | | | 4.92 | % |
SPDR Barclays Capital High Yield Bond ETF | | | | | 4.79 | % |
PowerShares Fundamental High Yield Corporate Bond Portfolio | | | | | 4.54 | % |
WisdomTree Dreyfus Emerging Currency Fund | | | | | 4.47 | % |
WisdomTree Dreyfus Commodity Currency Fund | | | | | 3.48 | % |
iShares S&P 100 Index Fund | | | | | 3.02 | % |
Chevron Corp. | | | | | 2.58 | % |
JPMorgan Alerian MLP Index ETN | | | | | 2.52 | % |
iShares MSCI EAFE Index Fund | | | | | 2.48 | % |
Top Ten Holdings | | | | | 48.30 | % |
| † | Holdings are subject to change. |
Portfolio Composition (as a % of Net Assets)
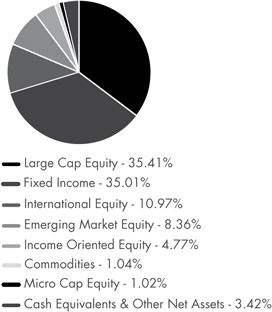
61 | April 30, 2011
| | | | |
RiverFront Moderate Growth & Income Fund |
| | | Disclosure of Fund Expenses | | April 30, 2011 (Unaudited) |
As a shareholder of the Fund you will incur two types of costs: (1) ‘transaction costs, including applicable sales charges (loads) and redemption fees; and (2) ongoing costs, including management fees, distribution and service (12b-1) fees, shareholder service fees and other Fund expenses. The following examples are intended to help you understand your ongoing costs (in dollars) of investing in the Fund and to compare these costs with the ongoing costs of investing in other mutual funds. The examples are based on an investment of $1,000 invested on November 1, 2010 and held until April 30, 2011.
Actual Expenses. The first line of the table on the next page provides information about actual account values and actual expenses. You may use the information in this line, together with the amount you invested, to estimate the expenses that you paid over the period. Simply divide your account value by $1,000 (for example, an $8,600 account value divided by $1,000 = 8.6), then multiply the result by the number in the first line under the heading “Expense Paid During Period” to estimate the expenses you paid on your account during this period.
Hypothetical Example for Comparison Purposes. The second line of the table on the next page provides information about hypothetical account values and hypothetical expenses based on the Fund’s actual expense ratio and an assumed rate of return of 5% per year before expenses, which is not the Fund’s actual return. The hypothetical account values and expenses may not be used to estimate the actual ending account balance or expenses you paid for the period. You may use this information to compare the ongoing costs of investing in the Fund and other mutual funds. To do so, compare this 5% hypothetical example with the 5% hypothetical examples that appear in the shareholder reports of the other funds.
The expenses shown in the table are meant to highlight ongoing Fund costs only and do not reflect transaction fees, such as sales charges, redemption fees or exchange fees. Therefore, the second line of the table on the next page is useful in comparing ongoing costs only, and may not help you determine the relative total costs of owning different funds. In addition, if these transactional costs were included, your costs would have been higher.
| | | | | | | | | | | | | | | | |
| | | Beginning Account Value
11/1/10 | | | Ending Account Value
4/30/11 | | | Expense Ratio(a) | | | Expense Paid
During Period(b)
11/1/10 - 4/30/11 | |
Class A | | | | | | | | | | | | | | | | |
| | | | |
Actual | | | $1,000.00 | | | | $1,077.20 | | | | 1.30% | | | | $6.70 | |
Hypothetical (5% return before expenses) | | | $1,000.00 | | | | $1,018.35 | | | | 1.30% | | | | $6.51 | |
| | | | |
Class C | | | | | | | | | | | | | | | | |
| | | | |
Actual | | | $1,000.00 | | | | $1,073.80 | | | | 2.05% | | | | $10.54 | |
Hypothetical (5% return before expenses) | | | $1,000.00 | | | | $1,014.63 | | | | 2.05% | | | | $10.24 | |
| | | | |
Class I | | | | | | | | | | | | | | | | |
| | | | |
Actual | | | $1,000.00 | | | | $1,078.30 | | | | 1.05% | | | | $5.41 | |
Hypothetical (5% return before expenses) | | | $1,000.00 | | | | $1,019.59 | | | | 1.05% | | | | $5.26 | |
| (a) | The Fund’s expense ratios have been based on the Fund’s most recent fiscal half-year expenses. |
| (b) | Expenses are equal to the Fund’s annualized expense ratio multiplied by the average account value over the period, multiplied by the number of days in the most recent fiscal half year (181), then divided by 365. |
62 | April 30, 2011
| | | | |
RiverFront Moderate Growth & Income Fund |
| | | Statement of Investments | | April 30, 2011 |
| | | | | | | | |
| | | Shares | | | Value (Note 1) | |
COMMON STOCKS (30.75%) | | | | | | | | |
Basic Materials (2.28%) | | | | | | | | |
Chemicals (1.26%) | | | | | | | | |
Monsanto Co. | | | 8,103 | | | $ | 551,328 | |
| | | | | | | | |
| |
Forest Products & Paper (1.02%) | | | | | |
MeadWestvaco Corp. | | | 13,230 | | | | 445,719 | |
| | | | | | | | |
| | |
TOTAL BASIC MATERIALS | | | | | | | 997,047 | |
| | | | | | | | |
| | |
Communications (4.73%) | | | | | | | | |
Advertising (1.22%) | | | | | | | | |
Omnicom Group, Inc. | | | 10,853 | | | | 533,859 | |
| | | | | | | | |
| |
Telecommunications (3.51%) | | | | | |
BCE, Inc. | | | 13,612 | | | | 509,497 | |
QUALCOMM, Inc. | | | 10,927 | | | | 621,091 | |
Verizon Communications, Inc. | | | 10,717 | | | | 404,888 | |
| | | | | | | | |
| | | | | | | 1,535,476 | |
| | | | | | | | |
| | |
TOTAL COMMUNICATIONS | | | | | | | 2,069,335 | |
| | | | | | | | |
| | |
Consumer, Cyclical (3.83%) | | | | | | | | |
Retail (3.83%) | | | | | | | | |
Darden Restaurants, Inc. | | | 4,298 | | | | 201,877 | |
The Gap, Inc. | | | 18,131 | | | | 421,364 | |
McDonald’s Corp. | | | 7,743 | | | | 606,355 | |
Tiffany & Co. | | | 6,453 | | | | 448,096 | |
| | | | | | | | |
| | | | | | | 1,677,692 | |
| | | | | | | | |
| |
TOTAL CONSUMER, CYCLICAL | | | | 1,677,692 | |
| | | | | | | | |
| |
Consumer, Non-cyclical (5.41%) | | | | | |
Agriculture (0.66%) | | | | | | | | |
Altria Group, Inc. | | | 10,787 | | | | 289,523 | |
| | | | | | | | |
| |
Commercial Services (3.28%) | | | | | |
Automatic Data Processing, Inc. | | | 8,207 | | | | 446,050 | |
Iron Mountain, Inc. | | | 15,457 | | | | 492,305 | |
Moody’s Corp. | | | 12,724 | | | | 498,018 | |
| | | | | | | | |
| | | | | | | 1,436,373 | |
| | | | | | | | |
| | |
Pharmaceuticals (1.47%) | | | | | | | | |
Pfizer, Inc. | | | 30,577 | | | | 640,894 | |
| | | | | | | | |
| |
TOTAL CONSUMER, NON-CYCLICAL | | | | 2,366,790 | |
| | | | | | | | |
| | |
Energy (5.54%) | | | | | | | | |
Oil & Gas (4.11%) | | | | | | | | |
Chevron Corp. | | | 10,299 | | | | 1,127,124 | |
Exxon Mobil Corp. | | | 7,644 | | | | 672,672 | |
| | | | | | | | |
| | | | | | | 1,799,796 | |
| | | | | | | | |
| | | | | | | | |
| | | Shares | | | Value (Note 1) | |
Pipelines (1.43%) | | | | | | | | |
ONEOK, Inc. | | | 8,927 | | | $ | 624,354 | |
| | | | | | | | |
| | |
TOTAL ENERGY | | | | | | | 2,424,150 | |
| | | | | | | | |
| | |
Financials (2.37%) | | | | | | | | |
Diversified Financial Services (0.85%) | | | | | |
American Express Co. | | | 7,516 | | | | 368,885 | |
| | | | | | | | |
| | |
Insurance (1.52%) | | | | | | | | |
Chubb Corp. | | | 10,219 | | | | 666,177 | |
| | | | | | | | |
| | |
TOTAL FINANCIALS | | | | | | | 1,035,062 | |
| | | | | | | | |
| | |
Industrials (3.75%) | | | | | | | | |
Aerospace & Defense (1.38%) | | | | | |
Lockheed Martin Corp. | | | 7,614 | | | | 603,409 | |
| | | | | | | | |
| |
Machinery, Construction & Mining (1.06%) | | | | | |
Caterpillar, Inc. | | | 4,033 | | | | 465,449 | |
| | | | | | | | |
| | |
Transportation (1.31%) | | | | | | | | |
United Parcel Service, Inc., Class B | | | 7,620 | | | | 571,271 | |
| | | | | | | | |
| | |
TOTAL INDUSTRIALS | | | | | | | 1,640,129 | |
| | | | | | | | |
| | |
Technology (2.84%) | | | | | | | | |
Computers (2.84%) | | | | | | | | |
Accenture PLC, Class A | | | 7,835 | | | | 447,614 | |
International Business Machines Corp. | | | 4,663 | | | | 795,414 | |
| | | | | | | | |
| | | | | | | 1,243,028 | |
| | | | | | | | |
| | |
TOTAL TECHNOLOGY | | | | | | | 1,243,028 | |
| | | | | | | | |
| | |
TOTAL COMMON STOCKS (Cost $12,071,075) | | | | | | | 13,453,233 | |
| | | | | | | | |
| |
EXCHANGE TRADED FUNDS (63.67%) | | | | | |
Asset Allocation (4.47%) | | | | | | | | |
WisdomTree Dreyfus Emerging Currency Fund (a) | | | 82,749 | | | | 1,953,704 | |
| | | | | | | | |
| | |
Commodity (1.05%) | | | | | | | | |
SPDR Gold Shares (a) | | | 3,004 | | | | 457,689 | |
| | | | | | | | |
| | |
Debt (2.37%) | | | | | | | | |
iShares iBoxx $ High Yield Corporate Bond Fund | | | 4,442 | | | | 412,440 | |
PowerShares Senior Loan Portfolio | | | 24,766 | | | | 626,084 | |
| | | | | | | | |
| | | | | | | 1,038,524 | |
| | | | | | | | |
63 | April 30, 2011
| | | | |
RiverFront Moderate Growth & Income Fund |
| | | Statement of Investments | | April 30, 2011 |
| | | | | | | | |
| | | Shares | | | Value (Note 1) | |
Emerging Market Equity (6.37%) | | | | | | | | |
Global X China Consumer ETF | | | 11,005 | | | $ | 203,152 | |
Vanguard MSCI Emerging Markets ETF | | | 42,525 | | | | 2,150,915 | |
WisdomTree Emerging Markets Small-Cap Dividend Fund | | | 7,643 | | | | 431,982 | |
| | | | | | | | |
| | | | | | | 2,786,049 | |
| | | | | | | | |
| | |
Equity (12.03%) | | | | | | | | |
iShares Dow Jones U.S. Real Estate Index Fund | | | 15,959 | | | | 992,331 | |
iShares MSCI ACWI ex US Index Fund | | | 19,249 | | | | 918,562 | |
iShares MSCI EAFE Index Fund | | | 17,093 | | | | 1,084,721 | |
iShares MSCI South Korea Index Fund | | | 6,514 | | | | 449,271 | |
iShares S&P Latin America 40 Index Fund | | | 8,053 | | | | 436,231 | |
PowerShares Dynamic Industrials Sector Portfolio | | | 11,351 | | | | 368,453 | |
SPDR S&P Oil & Gas Equipment & Services ETF | | | 9,152 | | | | 403,512 | |
WisdomTree Japan Hedged Equity Fund | | | 16,556 | | | | 608,433 | |
| | | | | | | | |
| | | | | | | 5,261,514 | |
| | | | | | | | |
| | |
Fixed Income / Corporate Bonds (15.50%) | | | | | | | | |
Vanguard Short-Term Corporate Bond ETF | | | 86,702 | | | | 6,780,097 | |
| | | | | | | | |
| | |
Fixed Income / High Yield (9.33%) | | | | | | | | |
PowerShares Fundamental High Yield Corporate Bond Portfolio | | | 106,371 | | | | 1,984,883 | |
SPDR Barclays Capital High Yield Bond ETF | | | 51,226 | | | | 2,095,143 | |
| | | | | | | | |
| | | | | | | 4,080,026 | |
| | | | | | | | |
| | |
Foreign Bond (3.48%) | | | | | | | | |
WisdomTree Dreyfus Commodity Currency Fund (a) | | | 54,294 | | | | 1,524,033 | |
| | | | | | | | |
| | |
Growth Large-Cap (3.01%) | | | | | | | | |
iShares S&P 100 Index Fund | | | 21,640 | | | | 1,318,958 | |
| | | | | | | | |
| | |
International Equity (5.04%) | | | | | | | | |
iShares MSCI Canada Index Fund | | | 26,821 | | | | 903,869 | |
Vanguard FTSE All World ex-US Small-Cap ETF | | | 8,086 | | | | 866,657 | |
Vanguard MSCI EAFE ETF | | | 10,920 | | | | 432,650 | |
| | | | | | | | |
| | | | | | | 2,203,176 | |
| | | | | | | | |
| | |
Micro-Cap (1.02%) | | | | | | | | |
PowerShares Zacks Micro-Cap Portfolio | | | 35,841 | | | | 447,654 | |
| | | | | | | | |
| | | | | | | | |
| | | Shares | | | Value (Note 1) | |
TOTAL EXCHANGE TRADED FUNDS (Cost $26,851,263) | | | | | | $ | 27,851,424 | |
| | | | | | | | |
| | |
EXCHANGE TRADED NOTES (2.52%) | | | | | | | | |
Master Limited Partnerships (MLPs) (2.52%) | | | | | | | | |
JPMorgan Alerian MLP Index ETN | | | 28,095 | | | | 1,101,324 | |
| | | | | | | | |
| | |
TOTAL EXCHANGE TRADED NOTES (Cost $1,010,811) | | | | | | | 1,101,324 | |
| | | | | | | | |
| | |
| 7-Day Yield | | Shares | | | Value (Note 1) | |
SHORT TERM INVESTMENTS (3.44%) | | | | | | | | |
Money Market Fund (3.44%) | | | | | | | | |
Dreyfus Cash Management Fund, Institutional Class 0.102% | | | 1,503,635 | | | $ | 1,503,635 | |
| | | | | | | | |
TOTAL SHORT TERM INVESTMENTS (Cost $1,503,635) | | | | | | | 1,503,635 | |
| | | | | | | | |
| | |
TOTAL INVESTMENTS (100.38%) (Cost $41,436,784) | | | | | | $ | 43,909,616 | |
| | |
Liabilities In Excess Of Other Assets (-0.38%) | | | | | | | (165,621 | ) |
| | | | | | | | |
| | |
NET ASSETS (100.00%) | | | | | | $ | 43,743,995 | |
| | | | | | | | |
| (a) | Non-Income Producing Security. |
Common Abbreviations:
ACWI - All Country World Index.
EAFE - Europe, Australia, and Far East.
ETF - Exchange Traded Fund.
ETN - Exchange Traded Note.
FTSE - Financial Times and the London Stock Exchange.
MLP - Master Limited Partnership.
MSCI - Morgan Stanley Capital International.
PLC - Public Limited Company.
S&P - Standard and Poor’s.
SPDR - Standard and Poor’s Depositary Receipt.
For Fund compliance purposes, the Fund’s industry classifications refer to any one or more of the industry sub-classifications used by one or more widely recognized market indexes or ratings group indexes, and/or as defined by Fund management. This definition may not apply for purposes of this report, which may combine industry sub-classifications for reporting ease. Industries are shown as a percent of net assets. These industry classifications are based on third party definitions and are unaudited. The definitions are industry terms and do not reflect the legal status of any of the investments or the companies in which the Fund has invested.
See Notes to Financial Statements.
64 | April 30, 2011
| | | | |
Statements of Assets and Liabilities |
| | | April 30, 2011 |
| | | | | | | | | | | | |
| | | ALPS | Red Rocks Listed Private Equity Fund | | | ALPS | WMC Value Intersection
Fund(a) | | | Clough China
Fund | |
ASSETS | | | | | | | | | | | | |
Investments, at value | | $ | 195,181,743 | | | $ | 78,196,455 | | | $ | 97,888,936 | |
Cash | | | 760,937 | | | | – | | | | – | |
Foreign currency, at value
(Cost $1,597,576,$0, and $4,475,197, respectively) | | | 1,602,568 | | | | – | | | | 4,478,743 | |
Receivable for investments sold | | | 82,518 | | | | 412,702 | | | | – | |
Receivable for shares sold | | | 572,938 | | | | 826 | | | | 50,621 | |
Dividends and interest receivable | | | 191,765 | | | | 68,419 | | | | 286,779 | |
Prepaid expenses and other assets | | | 46,096 | | | | 25,655 | | | | 32,365 | |
Total Assets | | | 198,438,565 | | | | 78,704,057 | | | | 102,737,444 | |
| | | |
LIABILITIES | | | | | | | | | | | | |
Payable for investments purchased | | | 3,572,871 | | | | 410,621 | | | | – | |
Payable for shares redeemed | | | 207,903 | | | | 27,207 | | | | 29,909 | |
Investment advisory fees payable | | | 87,409 | | | | 39,747 | | | | 84,679 | |
Administration and transfer agency fees payable | | | 23,914 | | | | 19,060 | | | | 34,493 | |
Distribution and services fees payable | | | 40,856 | | | | 9,872 | | | | 22,292 | |
Directors’ fees and expenses payable | | | 5,430 | | | | 2,256 | | | | 3,205 | |
Overdraft payable | | | – | | | | – | | | | 2,658 | |
Accrued expenses and other liabilities | | | 80,664 | | | | 31,282 | | | | 42,613 | |
Total Liabilities | | | 4,019,047 | | | | 540,045 | | | | 219,849 | |
NET ASSETS | | $ | 194,419,518 | | | $ | 78,164,012 | | | $ | 102,517,595 | |
| | | | | | | | | | | | | |
| | | |
NET ASSETS CONSIST OF | | | | | | | | | | | | |
Paid-in capital | | $ | 169,768,252 | | | $ | 74,089,003 | | | $ | 86,089,221 | |
Undistributed/(overdistributed) net investment income | | | (7,510,989 | ) | | | 167,434 | | | | (144,276 | ) |
Accumulated net realized loss on investments and foreign currency transactions | | | (18,074,596 | ) | | | (12,713,460 | ) | | | (485,179 | ) |
Net unrealized appreciation on investments and translation of assets and liabilities in foreign currencies | | | 50,236,851 | | | | 16,621,035 | | | | 17,057,829 | |
NET ASSETS | | $ | 194,419,518 | | | $ | 78,164,012 | | | $ | 102,517,595 | |
| | | | | | | | | | | | | |
| | | |
INVESTMENTS, AT COST | | $ | 144,952,423 | | | $ | 61,575,420 | | | $ | 80,834,911 | |
See Notes to Financial Statements.
65 | April 30, 2011
| | | | |
Statements of Assets and Liabilities |
| | | April 30, 2011 |
| | | | | | | | | | | | |
| | | ALPS | Red Rocks
Listed Private
Equity Fund | | | ALPS | WMC Value Intersection Fund | | | Clough China Fund | |
PRICING OF SHARES | | | | | | | | | | | | |
Class A: | | | | | | | | | | | | |
Net Asset Value, offering and redemption price per share(b) | | $ | 6.44 | | | $ | 8.64 | | | $ | 21.02 | |
Net Assets | | $ | 124,874,458 | | | $ | 48,898,987 | | | $ | 44,616,124 | |
Shares of beneficial interest outstanding (unlimited number of shares, no par value common stock authorized) | | | 19,395,238 | | | | 5,658,125 | | | | 2,122,435 | |
Maximum offering price per share (NAV/0.9450), based on maximum sales charge of 5.50% of the offering price) | | $ | 6.81 | | | $ | 9.14 | | | $ | 22.24 | |
| | | |
Class C: | | | | | | | | | | | | |
Net Asset Value, offering and redemption price per share(b) | | $ | 6.37 | | | $ | 8.62 | | | $ | 20.58 | |
Net Assets | | $ | 2,566,193 | | �� | $ | 13,544 | | | $ | 16,847,615 | |
Shares of beneficial interest outstanding (unlimited number of shares, no par value common stock authorized) | | | 402,610 | | | | 1,571 | | | | 818,709 | |
| | | |
Class I: | | | | | | | | | | | | |
Net Asset Value, offering and redemption price per share | | $ | 6.47 | | | $ | 8.71 | | | $ | 21.30 | |
Net Assets | | $ | 66,853,607 | | | $ | 29,251,481 | | | $ | 41,053,856 | |
Shares of beneficial interest outstanding (unlimited number of shares, no par value common stock authorized) | | | 10,336,606 | | | | 3,359,399 | | | | 1,927,751 | |
| | | |
Class R: | | | | | | | | | | | | |
Net Asset Value, offering and redemption price per share | | $ | 5.82 | | | | N/A | | | | N/A | |
Net Assets | | $ | 125,260 | | | | N/A | | | | N/A | |
Shares of beneficial interest outstanding (unlimited number of shares, no par value common stock authorized) | | | 21,508 | | | | N/A | | | | N/A | |
| (a) | Prior to August 31, 2010, the ALPS | WMC Value Intersection Fund was known as the Activa Value Fund |
| (b) | Redemption price per share may be reduced for any applicable contingent deferred sales charge. For a description of a possible sales charge, please see the Fund’s Prospectus. |
See Notes to Financial Statements.
66 | April 30, 2011
| | | | |
Statements of Assets and Liabilities |
| | | |
| | | | | | | | | | | | | | | | |
| | | RiverFront Long-Term Growth Fund | | | RiverFront Long-Term Growth & Income Fund | | | RiverFront Moderate Growth Fund | | | RiverFront Moderate Growth & Income Fund | |
ASSETS | | | | | | | | | | | | | | | | |
Investments, at value | | $ | 87,266,910 | | | $ | 18,434,803 | | | $ | 15,312,034 | | | $ | 43,909,616 | |
Investments in affiliates, at value | | | 628,903 | | | | – | | | | 116,685 | | | | – | |
Receivable for investments sold | | | 494,183 | | | | 307,384 | | | | 551,752 | | | | 854,913 | |
Receivable for shares sold | | | 122,991 | | | | 138,619 | | | | 260,582 | | | | 264,978 | |
Dividends and interest receivable | | | 29,556 | | | | 9,932 | | | | 5,363 | | | | 34,491 | |
Prepaid expenses and other assets | | | 26,372 | | | | 11,661 | | | | 12,654 | | | | 12,235 | |
Total Assets | | | 88,568,915 | | | | 18,902,399 | | | | 16,259,070 | | | | 45,076,233 | |
| | | | |
LIABILITIES | | | | | | | | | | | | | | | | |
Payable for investments purchased | | | 1,171,599 | | | | 587,685 | | | | 687,110 | | | | 1,224,661 | |
Payable for shares redeemed | | | 61,291 | | | | – | | | | – | | | | – | |
Investment advisory fees payable | | | 44,962 | | | | 26,002 | | | | 7,202 | | | | 45,129 | |
Administration and transfer agency fees payable | | | 16,343 | | | | 2,815 | | | | 3,271 | | | | 7,974 | |
Distribution and services fees payable | | | 11,013 | | | | 7,862 | | | | 7,232 | | | | 20,741 | |
Directors’ fees and expenses payable | | | 2,636 | | | | 371 | | | | 318 | | | | 1,047 | |
Accrued expenses and other liabilities | | | 43,428 | | | | 30,714 | | | | 36,326 | | | | 32,686 | |
Total Liabilities | | | 1,351,272 | | | | 655,449 | | | | 741,459 | | | | 1,332,238 | |
NET ASSETS | | $ | 87,217,643 | | | $ | 18,246,950 | | | $ | 15,517,611 | | | $ | 43,743,995 | |
| | | | | | | | | | | | | | | | | |
| | | | |
NET ASSETS CONSIST OF | | | | | | | | | | | | | | | | |
Paid-in capital | | $ | 70,386,404 | | | $ | 16,973,784 | | | $ | 14,592,080 | | | $ | 41,290,438 | |
Undistributed/(overdistributed) net investment income | | | 16,211 | | | | – | | | | – | | | | 28,354 | |
Accumulated net realized gain/(loss) on investments | | | 3,397,044 | | | | (18,909 | ) | | | 9,809 | | | | (47,629 | ) |
Net unrealized appreciation on investments | | | 13,417,984 | | | | 1,292,075 | | | | 915,722 | | | | 2,472,832 | |
NET ASSETS | | $ | 87,217,643 | | | $ | 18,246,950 | | | $ | 15,517,611 | | | $ | 43,743,995 | |
| | | | | | | | | | | | | | | | | |
| | | | |
INVESTMENTS, AT COST | | $ | 73,858,529 | | | $ | 17,142,728 | | | $ | 14,397,886 | | | $ | 41,436,784 | |
INVESTMENTS IN AFFILIATES, AT COST | | $ | 619,300 | | | $ | – | | | $ | 115,111 | | | $ | – | |
See Notes to Financial Statements.
67 | April 30, 2011
| | | | |
Statements of Assets and Liabilities |
| | | April 30, 2011 |
| | | | | | | | | | | | | | | | |
| | | RiverFront
Long-Term
Growth Fund | | | RiverFront
Long-Term
Growth &
Income Fund | | | RiverFront
Moderate
Growth Fund | | | RiverFront
Moderate
Growth &
Income Fund | |
PRICING OF SHARES | | | | | | | | | | | | | | | | |
Class A: | | | | | | | | | | | | | | | | |
Net Asset Value, offering and redemption price per share(a) | | $ | 15.65 | | | $ | 11.73 | | | $ | 11.66 | | | $ | 11.08 | |
Net Assets | | $ | 12,307,493 | | | $ | 5,722,869 | | | $ | 4,686,499 | | | $ | 12,147,780 | |
Shares of beneficial interest outstanding (unlimited number of shares, no par value common stock authorized) | | | 786,280 | | | | 487,837 | | | | 402,036 | | | | 1,096,044 | |
Maximum offering price per share (NAV/0.9450), based on maximum sales charge of 5.50% of the offering price) | | $ | 16.56 | | | $ | 12.41 | | | $ | 12.34 | | | $ | 11.72 | |
| | | | |
Class C: | | | | | | | | | | | | | | | | |
Net Asset Value, offering and redemption price per share(a) | | $ | 15.60 | | | $ | 11.67 | | | $ | 11.64 | | | $ | 11.06 | |
Net Assets | | $ | 6,155,797 | | | $ | 9,222,725 | | | $ | 8,925,691 | | | $ | 24,060,915 | |
Shares of beneficial interest outstanding (unlimited number of shares, no par value common stock authorized) | | | 394,640 | | | | 790,404 | | | | 767,006 | | | | 2,176,297 | |
| | | | |
Class I: | | | | | | | | | | | | | | | | |
Net Asset Value, offering and redemption price per share | | $ | 15.67 | | | $ | 11.64 | | | $ | 11.42 | | | $ | 11.07 | |
Net Assets | | $ | 4,508,081 | | | $ | 3,301,356 | | | $ | 1,905,421 | | | $ | 7,535,300 | |
Shares of beneficial interest outstanding (unlimited number of shares, no par value common stock authorized) | | | 287,707 | | | | 283,502 | | | | 166,812 | | | | 680,416 | |
| | | | |
Class L: | | | | | | | | | | | | | | | | |
Net Asset Value, offering and redemption price per share | | $ | 15.65 | | | | N/A | | | | N/A | | | | N/A | |
Net Assets | | $ | 42,976,605 | | | | N/A | | | | N/A | | | | N/A | |
Shares of beneficial interest outstanding (unlimited number of shares, no par value common stock authorized) | | | 2,745,945 | | | | N/A | | | | N/A | | | | N/A | |
| | | | |
Investor Class: | | | | | | | | | | | | | | | | |
Net Asset Value, offering and redemption price per share | | $ | 15.59 | | | | N/A | | | | N/A | | | | N/A | |
Net Assets | | $ | 21,269,667 | | | | N/A | | | | N/A | | | | N/A | |
Shares of beneficial interest outstanding (unlimited number of shares, no par value common stock authorized) | | | 1,364,021 | | | | N/A | | | | N/A | | | | N/A | |
| (a) | Redemption price per share may be reduced for any applicable contingent deferred sales charge. For a description of a possible sales charge, please see the Fund’s Prospectus. |
See Notes to Financial Statements.
68 | April 30, 2011
| | | | |
Consolidated Statements of Assets and Liabilities |
| | | April 30, 2011 |
| | | | | | | | |
| | | ALPS | Kotak India Growth Fund(a) | | | Jefferies Asset Management Commodity Strategy Allocation Fund(b) | |
ASSETS | | | | | | | | |
Investments, at value | | $ | 1,381,219 | | | $ | 113,639,022 | |
Cash | | | 258,957 | | | | 6,612,990 | |
Foreign currency, at value (Cost $37,005 and $22,665, respectively) | | | 37,103 | | | | 22,851 | |
Foreign currency held at broker for futures contracts (Cost $107,949 and $0, respectively) | | | 108,560 | | | | – | |
Unrealized appreciation on total return swap contracts | | | – | | | | 684,840 | |
Receivable for investments sold | | | 10,926 | | | | 2,055,979 | |
Receivable for shares sold | | | 374,520 | | | | 3,409,919 | |
Variation margin receivable | | | – | | | | 861,844 | |
Total return swap receivable | | | – | | | | 1,782,689 | �� |
Receivable due from broker for futures contracts | | | 942 | | | | – | |
Dividends and interest receivable | | | 82 | | | | 227,339 | |
Receivable due from adviser | | | 49,695 | | | | – | |
Prepaid offering costs | | | 32,527 | | | | 16,156 | |
Prepaid expenses and other assets | | | 6,001 | | | | 35,317 | |
Total Assets | | | 2,260,532 | | | | 129,348,946 | |
| | |
LIABILITIES | | | | | | | | |
Payable for investments purchased | | | 211,397 | | | | 10,212,690 | |
Payable for variation margin | | | 5,225 | | | | 634,216 | |
Payable due to broker for futures contracts | | | – | | | | 100,469 | |
Payable for shares redeemed | | | – | | | | 3,481 | |
Unrealized depreciation on total return swap contracts | | | – | | | | 177,670 | |
Investment advisory fees payable | | | – | | | | 45,869 | |
Administration and transfer agency fees payable | | | 13,108 | | | | 16,989 | |
Distribution and services fees payable | | | 551 | | | | 22,095 | |
Directors’ fees and expenses payable | | | 828 | | | | 2,127 | |
Accrued expenses and other liabilities | | | 61,169 | | | | 91,330 | |
Total Liabilities | | | 292,278 | | | | 11,306,936 | |
NET ASSETS | | $ | 1,968,254 | | | $ | 118,042,010 | |
| | |
| | |
NET ASSETS CONSIST OF | | | | | | | | |
Paid-in capital | | $ | 1,937,425 | | | $ | 105,952,830 | |
Undistributed/(Overdistributed) net investment income | | | (3,343 | ) | | | 6,734,165 | |
Accumulated net realized gain on investments, forward contracts, futures contracts, swaps and foreign currency transactions | | | 3,472 | | | | 182,789 | |
Net unrealized appreciation on investments, futures contracts, swaps and translation of assets and liabilities in foreign currencies | | | 30,700 | | | | 5,172,226 | |
NET ASSETS | | $ | 1,968,254 | | | $ | 118,042,010 | |
| | |
| | |
INVESTMENTS, AT COST | | $ | 1,345,754 | | | $ | 109,195,172 | |
See Notes to Financial Statements.
69 | April 30, 2011
| | | | |
Consolidated Statements of Assets and Liabilities |
| | | April 30, 2011 |
| | | | | | | | |
| | | ALPS | Kotak India Growth
Fund(a) | | | Jefferies Asset
Management
Commodity
Strategy
Allocation Fund(b) | |
PRICING OF SHARES | | | | | | | | |
Class A: | | | | | | | | |
Net Asset Value, offering and redemption price per share(c) | | $ | 10.35 | | | $ | 14.28 | |
Net Assets | | $ | 934,703 | | | $ | 37,060,422 | |
Shares of beneficial interest outstanding
(unlimited number of shares, no par value common stock authorized) | | | 90,346 | | | | 2,595,041 | |
Maximum offering price per share (NAV/0.9450), based on maximum sales charge of 5.50% of the offering price) | | $ | 10.95 | | | $ | 15.11 | |
| | |
Class C: | | | | | | | | |
Net Asset Value, offering and redemption price per share(c) | | $ | 10.32 | | | $ | 14.19 | |
Net Assets | | $ | 465,636 | | | $ | 7,351,504 | |
Shares of beneficial interest outstanding
(unlimited number of shares, no par value common stock authorized) | | | 45,104 | | | | 518,196 | |
| | |
Class I: | | | | | | | | |
Net Asset Value, offering and redemption price per share | | $ | 10.34 | | | $ | 14.25 | |
Net Assets | | $ | 567,915 | | | $ | 73,630,084 | |
Shares of beneficial interest outstanding
(unlimited number of shares, no par value common stock authorized) | | | 54,915 | | | | 5,167,886 | |
| (a) | Consolidated Statement of Assets and Liabilities for ALPS | Kotak India Growth Fund is consolidated and includes the balances of Kotak Mauritius Portfolio (wholly-owned subsidiary). Accordingly, all interfund balances have been eliminated. |
| (b) | Consolidated Statement of Assets and Liabilities for Jefferies Asset Management Commodity Strategy Allocation Fund is consolidated and includes the balances of Jefferies Asset Management Cayman Trust (wholly-owned subsidiary). Accordingly, all interfund balances have been eliminated. |
| (c) | Redemption price per share may be reduced for any applicable contingent deferred sales charge. For a description of a possible sales charge, please see the Fund’s Prospectus. |
See Notes to Financial Statements.
70 | April 30, 2011
| | | | |
Statements of Operations |
| | | For the Year Ended April 30, 2011 | | |
| | | | | | | | | | | | |
| | | ALPS | Red Rocks Listed Private
Equity Fund | | | ALPS | WMC Value Intersection
Fund(a) | | | Clough China
Fund | |
INVESTMENT INCOME | | | | | | | | | | | | |
Dividends | | $ | 3,118,327 | | | $ | 1,303,793 | | | $ | 1,320,720 | |
Foreign taxes withheld on dividends | | | (280,666 | ) | | | – | | | | (61,558 | ) |
Interest and other income | | | 5 | | | | 1,676 | | | | 13,717 | |
Total Investment Income | | | 2,837,666 | | | | 1,305,469 | | | | 1,272,879 | |
| | | |
EXPENSES | | | | | | | | | | | | |
Investment advisory fee | | | 1,112,523 | | | | 577,167 | | | | 1,079,443 | |
Administrative and transfer agency fee | | | 218,540 | | | | 156,483 | | | | 139,412 | |
Distribution and service fees | | | | | | | | | | | | |
Class A | | | 333,320 | | | | 109,354 | | | | 98,361 | |
Class C(b) | | | 9,920 | | | | 98 | | | | 120,672 | |
Class R | | | 339 | | | | N/A | | | | N/A | |
Legal fees | | | 23,132 | | | | 10,871 | | | | 11,773 | |
Audit fees | | | 36,517 | | | | 18,248 | | | | 28,883 | |
Networking fees | | | | | | | | | | | | |
Class A | | | 7,811 | | | | – | | | | 8,512 | |
Class C(b) | | | 204 | | | | – | | | | 6,275 | |
Class I | | | 33,174 | | | | – | | | | 13,329 | |
Class R | | | 51 | | | | N/A | | | | N/A | |
Reports to shareholders and printing fees | | | 92,945 | | | | 52,461 | | | | 41,306 | |
State registration fees | | | 69,795 | | | | 34,699 | | | | 28,866 | |
Insurance | | | 10,480 | | | | 5,611 | | | | 4,236 | |
Custody fees | | | 93,943 | | | | 9,356 | | | | 82,897 | |
Directors’ fees and expenses | | | 25,598 | | | | 11,855 | | | | 15,814 | |
Miscellaneous | | | 1,437 | | | | 11,597 | | | | 9,789 | |
Total Expense | | | 2,069,729 | | | | 997,800 | | | | 1,689,568 | |
Less fees waived/reimbursed by investment adviser and sub-adviser | | | | | | | | | | | | |
Class A | | | (162,305 | ) | | | (136,238 | ) | | | (72,686 | ) |
Class C(b) | | | (544 | ) | | | (33 | ) | | | (19,301 | ) |
Class I | | | (50,714 | ) | | | (53,400 | ) | | | (93,096 | ) |
Class R | | | (81 | ) | | | N/A | | | | N/A | |
Net Expenses | | | 1,856,085 | | | | 808,129 | | | | 1,504,485 | |
Net Investment Income/(Loss) | | | 981,581 | | | | 497,340 | | | | (231,606 | ) |
Net realized gain on investments | | | 13,104,379 | | | | 2,229,121 | | | | 4,827,132 | |
Net realized gain/(loss) on foreign currency transactions | | | 194,532 | | | | – | | | | (185,002 | ) |
Net change in unrealized appreciation of investments | | | 29,978,702 | | | | 7,881,516 | | | | 7,695,127 | |
Net change in unrealized appreciation on translation of assets and liabilities in foreign currencies | | | 8,447 | | | | – | | | | 3,843 | |
NET REALIZED AND UNREALIZED GAIN ON INVESTMENTS | | | 43,286,060 | | | | 10,110,637 | | | | 12,341,100 | |
NET INCREASE IN NET ASSETS RESULTING FROM OPERATIONS | | $ | 44,267,641 | | | $ | 10,607,977 | | | $ | 12,109,494 | |
| | |
| (a) | Prior to August 31, 2010, the ALPS | WMC Value Intersection Fund was known as the Activa Value Fund. |
| (b) | Class C shares commenced operations on July 2, 2010 for the ALPS | Red Rocks Listed Private Equity Fund and ALPS | WMC Value Intersection Fund. |
See Notes to Financial Statements.
71 | April 30, 2011
| | | | | | | | | | | | | | | | | | | | |
| | | RiverFront Long-Term Growth Fund | | | RiverFront
Long-Term
Growth &
Income Fund | | | RiverFront
Moderate
Growth Fund | | | RiverFront
Moderate
Growth &
Income Fund | |
| | | For the Period
January 1, 2011 to April 30, 2011(a) | | | For the Year Ended
December 31,
2010 | | | For the Period August 2, 2010 (Inception) to April 30, 2011 | |
INVESTMENT INCOME | | | | | | | | | | | | | | | | | | | | |
Dividends | | $ | 213,826 | | | $ | 1,028,056 | | | $ | 146,163 | | | $ | 94,372 | | | $ | 504,341 | |
Dividends from affiliated securities | | | – | | | | 18,340 | | | | – | | | | – | | | | – | |
Foreign taxes withheld on dividends | | | – | | | | – | | | | – | | | | – | | | | (1,464 | ) |
Interest and other income | | | 1,656 | | | | 47,256 | | | | 533 | | | | 462 | | | | 1,823 | |
Total Investment Income | | | 215,482 | | | | 1,093,652 | | | | 146,696 | | | | 94,834 | | | | 504,700 | |
| | | | | |
EXPENSES | | | | | | | | | | | | | | | | | | | | |
Investment advisory fee | | | 233,937 | | | | 403,220 | | | | 48,964 | | | | 38,605 | | | | 140,277 | |
Administrative and transfer agency fee | | | 31,502 | | | | 65,485 | | | | 8,369 | | | | 6,878 | | | | 23,665 | |
Distribution and service fees | | | | | | | | | | | | | | | | | | | | |
Class A | | | 6,414 | | | | 546 | | | | 4,237 | | | | 3,794 | | | | 10,132 | |
Class C | | | 12,447 | | | | 2,140 | | | | 27,435 | | | | 21,933 | | | | 88,987 | |
Investor Class | | | 17,487 | | | | 49,477 | | | | N/A | | | | N/A | | | | N/A | |
Legal fees | | | 93 | | | | 78,098 | | | | 522 | | | | 344 | | | | 1,654 | |
Audit fees | | | 23,431 | | | | 13,933 | | | | 17,300 | | | | 17,300 | | | | 17,300 | |
Reports to shareholders and printing fees | | | 3,757 | | | | 19,455 | | | | 1,368 | | | | 653 | | | | 3,823 | |
State registration fees | | | 6,288 | | | | 25,407 | | | | 1,911 | | | | 2,651 | | | | 1,819 | |
Insurance | | | 3,092 | | | | 500 | | | | 16 | | | | 9 | | | | 32 | |
Custody fees | | | 7,519 | | | | 13,255 | | | | 30,752 | | | | 46,048 | | | | 33,673 | |
Directors’ fees and expenses | | | 12,197 | | | | 54,411 | | | | 988 | | | | 822 | | | | 2,908 | |
Miscellaneous | | | 12,481 | | | | 3,224 | | | | 4,476 | | | | 3,925 | | | | 9,077 | |
Total Expense | | | 370,645 | | | | 729,151 | | | | 146,338 | | | | 142,962 | | | | 333,347 | |
Less fees waived/reimbursed by investment adviser and sub-adviser | | | | | | | | | | | | | | | | | | | | |
Class A | | | (19,632 | ) | | | (2,709 | ) | | | (13,771 | ) | | | (24,859 | ) | | | (13,722 | ) |
Class C | | | (9,645 | ) | | | (2,631 | ) | | | (27,343 | ) | | | (24,383 | ) | | | (42,882 | ) |
Class I | | | (8,420 | ) | | | (1,245 | ) | | | (13,445 | ) | | | (20,691 | ) | | | (12,931 | ) |
Class L | | | (89,284 | ) | | | (195,927 | ) | | | N/A | | | | N/A | | | | N/A | |
Investor Class | | | (44,393 | ) | | | (110,797 | ) | | | N/A | | | | N/A | | | | N/A | |
Less fees waived/reimbursed by administrator | | | | | | | | | | | | | | | | | | | | |
Class A | | | – | | | | – | | | | (927 | ) | | | (893 | ) | | | (171 | ) |
Class C | | | – | | | | – | | | | (1,529 | ) | | | (1,072 | ) | | | (681 | ) |
Class I | | | – | | | | – | | | | (526 | ) | | | (299 | ) | | | (185 | ) |
Net Expenses | | | 199,271 | | | | 415,842 | | | | 88,797 | | | | 70,765 | | | | 262,775 | |
Net Investment Income | | | 16,211 | | | | 677,810 | | | | 57,899 | | | | 24,069 | | | | 241,925 | |
Net realized gain/(loss) on investments | | | 2,595,174 | | | | 1,387,125 | | | | (20,246 | ) | | | 13,320 | | | | (53,228 | ) |
Net realized gain/(loss) on investments -affiliated securities | | | 81,251 | | | | (410 | ) | | | – | | | | 3,246 | | | | – | |
Net change in unrealized appreciation of investments | | | 2,761,426 | | | | 5,485,730 | | | | 1,292,075 | | | | 915,722 | | | | 2,472,832 | |
NET REALIZED AND UNREALIZED GAIN ON INVESTMENTS | | | 5,437,851 | | | | 6,872,445 | | | | 1,271,829 | | | | 932,288 | | | | 2,419,604 | |
NET INCREASE IN NET ASSETS RESULTING FROM OPERATIONS | | $ | 5,454,062 | | | $ | 7,550,255 | | | $ | 1,329,728 | | | $ | 956,357 | | | $ | 2,661,529 | |
| | |
| (a) | Effective March 8, 2011, the Board approved changing the fiscal year–end of the Fund from December 31 to April 30. |
See Notes to Financial Statements.
72 | April 30, 2011
| | | | |
Consolidated Statements of Operations |
| | | | | |
| | | | | | | | |
| | | ALPS | Kotak
India Growth
Fund(a) | | | Jefferies Asset
Management
Commodity
Strategy
Allocation Fund(b) | |
| | | For the Period
February 14,
2011 (Inception)
to April 30, 2011 | | | For the Period
June 29, 2010
(Inception) to
April 30, 2011 | |
INVESTMENT INCOME | | | | | | | | |
Dividends | | $ | 282 | | | $ | 169,115 | |
Foreign taxes withheld on dividends | | | – | | | | (8,890 | ) |
Interest and other income | | | 10 | | | | 546,217 | |
Total Investment Income | | | 292 | | | | 706,442 | |
| | |
EXPENSES | | | | | | | | |
Investment advisory fee | | | 1,924 | | | | 249,199 | |
Administrative and transfer agency fee | | | 25,479 | | | | 112,505 | |
Distribution and service fees | | | | | | | | |
Class A | | | 312 | | | | 27,342 | |
Class C | | | 517 | | | | 18,411 | |
Legal fees | | | 2,100 | | | | 8,315 | |
Audit fees | | | 41,905 | | | | 48,450 | |
Networking fees | | | | | | | | |
Class I | | | – | | | | 20,641 | |
Reports to shareholders and printing fees | | | 1,501 | | | | 5,611 | |
State registration fees | | | 3 | | | | 3,377 | |
Insurance | | | – | | | | 410 | |
Custody fees | | | 17,975 | | | | 82,471 | |
Directors’ fees and expenses | | | 828 | | | | 4,156 | |
Offering costs | | | 18,712 | | | | 82,127 | |
Miscellaneous | | | 2,633 | | | | 9,719 | |
Total Expense | | | 113,889 | | | | 672,734 | |
Less fees waived/reimbursed by investment adviser and sub-adviser | | | | | | | | |
Class A | | | (53,116 | ) | | | (78,228 | ) |
Class C | | | (34,720 | ) | | | (35,882 | ) |
Class I | | | (22,760 | ) | | | (184,396 | ) |
Net Expenses | | | 3,293 | | | | 374,228 | |
Net Investment Income/(Loss) | | | (3,001 | ) | | | 332,214 | |
Net realized gain on investments | | | 2,604 | | | | 181,906 | |
Net realized gain/(loss) on futures contracts | | | 899 | | | | (270,469 | ) |
Net realized gain on total return swaps | | | – | | | | 8,814,860 | |
Net realized gain/(loss) on foreign currency transactions | | | (985 | ) | | | 4,050 | |
Net change in unrealized appreciation of investments, swaps and futures contracts | | | 30,240 | | | | 5,177,487 | |
Net change in unrealized appreciation/(depreciation) on translation of assets and liabilities in foreign currencies | | | 460 | | | | (5,261 | ) |
NET REALIZED AND UNREALIZED GAIN ON INVESTMENTS | | | 33,218 | | | | 13,902,573 | |
NET INCREASE IN NET ASSETS RESULTING FROM OPERATIONS | | $ | 30,217 | | | $ | 14,234,787 | |
| | |
| (a) | Consolidated Statement of Operations for ALPS | Kotak India Growth Fund is consolidated and includes the balances of Kotak Mauritius Portfolio (wholly-owned subsidiary). Accordingly, all interfund balances have been eliminated. |
| (b) | Consolidated Statement of Operations for Jefferies Asset Management Commodity Strategy Allocation Fund is consolidated and includes the balances of Jefferies Asset Management Cayman Trust (wholly-owned subsidiary). Accordingly, all interfund balances have been eliminated. |
See Notes to Financial Statements.
73 | April 30, 2011
| | | | |
Statements of Changes in Net Assets |
| | | | | |
| | | | | | | | |
| | | ALPS | Red Rocks
Listed Private Equity Fund | |
| | |
| | | For the
Year Ended
April 30, 2011 | | | For the
Year Ended
April 30, 2010 | |
OPERATIONS | | | | | | | | |
Net investment income/(loss) | | $ | 981,581 | | | $ | 412,685 | |
Net increase for payment by affiliate (Note 2) | | | – | | | | – | |
Net realized gain/(loss) on investments | | | 13,104,379 | | | | (7,644,127 | ) |
Net realized gain/(loss) on foreign currency transactions | | | 194,532 | | | | 764,702 | |
Net change in unrealized appreciation/(depreciation) of investments and translation of assets and liabilities in foreign currencies | | | 29,987,149 | | | | 38,489,257 | |
Net Increase in Net Assets Resulting from Operations | | | 44,267,641 | | | | 32,022,517 | |
| | |
DISTRIBUTIONS | | | | | | | | |
Dividends to shareholders from net investment income | | | | | | | | |
Class A | | | (5,899,806 | ) | | | (5,410,948 | ) |
Class C(d) | | | (94,035 | ) | | | N/A | |
Class I(e)(f) | | | (3,002,644 | ) | | | (2,409,866 | ) |
Class R | | | (3,513 | ) | | | (2,124 | ) |
Class Z(g) | | | N/A | | | | N/A | |
Net Decrease in Net Assets from Distributions | | | (8,999,998 | ) | | | (7,822,938 | ) |
| | |
BENEFICIAL INTEREST TRANSACTIONS (NOTE 4) | | | | | | | | |
Shares sold | | | | | | | | |
Class A | | | 43,946,883 | | | | 32,648,787 | |
Class C(d) | | | 2,116,008 | | | | N/A | |
Class I(e)(f) | | | 31,556,257 | | | | 32,137,386 | |
Class R | | | 133,223 | | | | 17,750 | |
Class Z(g) | | | N/A | | | | N/A | |
Dividends reinvested | | | | | | | | |
Class A | | | 5,477,003 | | | | 5,282,397 | |
Class C(d) | | | 68,533 | | | | N/A | |
Class I(e)(f) | | | 1,434,792 | | | | 1,760,196 | |
Class R | | | 3,513 | | | | 2,123 | |
Class Z(g) | | | N/A | | | | N/A | |
Shares redeemed | | | | | | | | |
Class A | | | (14,394,569 | ) | | | (13,844,500 | ) |
Class C(d) | | | (5,350 | ) | | | N/A | |
Class I(e)(f) | | | (23,491,255 | ) | | | (10,644,215 | ) |
Class R | | | (47,561 | ) | | | (3,079 | ) |
Class Z(g) | | | N/A | | | | N/A | |
Net Increase/(Decrease) in Net Assets Derived from Beneficial Interest Transactions | | | 46,797,477 | | | | 47,356,845 | |
| | |
Net increase/(decrease) in net assets | | | 82,065,120 | | | | 71,556,424 | |
| | |
Net Assets | | | | | | | | |
Beginning of period | | | 112,354,398 | | | | 40,797,974 | |
End of year* | | $ | 194,419,518 | | | $ | 112,354,398 | |
| | |
| | |
* Includes undistributed/(overdistributed) net investment income of: | | $ | (7,510,989 | ) | | $ | (4,922,899 | ) |
| (a) | Prior to August 31, 2010, the ALPS | WMC Value Intersection Fund was known as the Activa Value Fund. |
| (b) | Effective March 9, 2010, the Board approved changing the fiscal year-end of the Fund from December 31 to April 30. |
| (c) | Effective March 9, 2010, the Board approved changing the fiscal year-end of the Fund from July 31 to April 30. |
| (d) | Class C shares commenced operations on July 2, 2010 for the ALPS | Red Rocks Listed Private Equity Fund and ALPS | WMC Value Intersection Fund. |
| (e) | Prior to close of business August 28, 2009, Class I of the ALPS | WMC Value Intersection Fund was known as Class R of the Predecessor Fund. |
| (f) | Prior to the close of business on January 15, 2010, Class I of the Clough China Fund was known as Institutional Class of the Predecessor Fund. |
| (g) | As a result of the reorganization (Note 1), the Clough China Fund no longer offers Class Z shares. Effective as of the close of business January 15, 2010, holders of Class Z shares of the Predecessor Fund received Class A shares of the Fund. |
See Notes to Financial Statements.
74 | April 30, 2011
| | | | | | | | | | | | | | | | | | | | | | |
| ALPS | WMC Value Intersection Fund(a) | | | Clough China Fund | |
For the Year Ended
April 30, 2011 | | | For the Period
January 1, 2010
to April 30,
2010(b) | | | For the Year Ended
December 31,
2009 | | | For the Year Ended
April 30, 2011 | | | For the Period
August 1, 2010
to April 30,
2010(c) | | | For the
Year Ended
July 31, 2009
(000s) | |
| | | | | |
| | $497,340 | | | $ | 155,014 | | | $ | 758,257 | | | $ | (231,606 | ) | | $ | (163,882 | ) | | $ | 221 | |
| | – | | | | – | | | | – | | | | – | | | | – | | | | 1 | |
| | 2,229,121 | | | | 138,322 | | | | (2,572,827 | ) | | | 4,827,132 | | | | 7,475,435 | | | | (7,544 | ) |
| | – | | | | – | | | | – | | | | (185,002 | ) | | | (24,039 | ) | | | (53 | ) |
| | | | | |
| | 7,881,516 | | | | 5,191,701 | | | | 16,108,515 | | | | 7,698,970 | | | | (2,468,901 | ) | | | 8,482 | |
| | 10,607,977 | | | | 5,485,037 | | | | 14,293,945 | | | | 12,109,494 | | | | 4,818,613 | | | | 1,107 | |
| | | | | |
| | (401,895) | | | | – | | | | (602,511 | ) | | | (199,271 | ) | | | (59,414 | ) | | | (182 | ) |
| | (68) | | | | N/A | | | | N/A | | | | (3,157 | ) | | | – | | | | (18 | ) |
| | (173,038) | | | | – | | | | (197,487 | ) | | | (225,291 | ) | | | (87,067 | ) | | | (187 | ) |
| | N/A | | | | N/A | | | | N/A | | | | N/A | | | | N/A | | | | N/A | |
| | N/A | | | | N/A | | | | N/A | | | | N/A | | | | (95,371 | ) | | | (73 | ) |
| | (575,001) | | | | – | | | | (799,998 | ) | | | (427,719 | ) | | | (241,852 | ) | | | (460 | ) |
| | | | | |
| | 1,830,732 | | | | 1,703,692 | | | | 2,575,630 | | | | 24,544,347 | | | | 22,831,904 | | | | 5,929 | |
| | 10,070 | | | | N/A | | | | N/A | | | | 11,178,373 | | | | 2,058,570 | | | | 1,796 | |
| | 12,722,957 | | | | 1,570,054 | | | | 11,456,364 | | | | 24,427,700 | | | | 4,220,994 | | | | 13 | |
| | N/A | | | | N/A | | | | N/A | | | | N/A | | | | N/A | | | | N/A | |
| | N/A | | | | N/A | | | | N/A | | | | N/A | | | | 14,440,499 | | | | 7,001 | |
| | | | | |
| | 384,676 | | | | – | | | | 585,747 | | | | 132,703 | | | | 37,489 | | | | 120 | |
| | 68 | | | | N/A | | | | N/A | | | | 1,344 | | | | – | | | | 9 | |
| | 173,038 | | | | – | | | | 197,487 | | | | 103,992 | | | | 87,068 | | | | 187 | |
| | N/A | | | | N/A | | | | N/A | | | | N/A | | | | N/A | | | | N/A | |
| | N/A | | | | N/A | | | | N/A | | | | N/A | | | | 94,027 | | | | 71 | |
| | | | | |
| | (5,419,274) | | | | (22,940,410 | ) | | | (4,161,769 | ) | | | (14,519,282 | ) | | | (10,253,870 | ) | | | (8,473 | ) |
| | (68) | | | | N/A | | | | N/A | | | | (3,597,895 | ) | | | (3,451,765 | ) | | | (3,205 | ) |
| | (3,685,425) | | | | (2,432,434 | ) | | | (2,918,243 | ) | | | (2,794,871 | ) | | | (3,956 | ) | | | (12 | ) |
| | N/A | | | | N/A | | | | N/A | | | | N/A | | | | N/A | | | | N/A | |
| | N/A | | | | N/A | | | | N/A | | | | N/A | | | | (28,012,416 | ) | | | (1,831 | ) |
| | 6,016,774 | | | | (22,099,098 | ) | | | 7,735,216 | | | | 39,476,411 | | | | 2,048,544 | | | | 1,605 | |
| | 16,049,750 | | | | (16,614,061 | ) | | | 21,229,163 | | | | 51,158,186 | | | | 6,625,305 | | | | 2,252 | |
| | | | | |
| | 62,114,262 | | | | 78,728,323 | | | | 57,499,160 | | | | 51,359,409 | | | | 44,734,104 | | | | 42,482 | |
| | $78,164,012 | | | $ | 62,114,262 | | | $ | 78,728,323 | | | $ | 102,517,595 | | | $ | 51,359,409 | | | $ | 44,734 | |
| | | |
| | | | | |
| | $167,434 | | | $ | 245,095 | | | $ | 90,081 | | | $ | (144,276 | ) | | $ | (147,621 | ) | | $ | 22 | |
75 | April 30, 2011
| | | | |
Statements of Changes in Net Assets |
| | | | | |
| | | | | | | | | | | | |
| | | RiverFront Long-Term Growth Fund | |
| | | |
| | | For the Period
January 1, 2011 to
April 30, 2011(a) | | | For the
Year Ended
December 31, 2010 | | | For the
Year Ended
December 31, 2009 | |
OPERATIONS | | | | | | | | | | | | |
Net investment income | | $ | 16,211 | | | $ | 677,810 | | | $ | 256,209 | |
Net realized gain/(loss) on investments | | | 2,595,174 | | | | 1,387,125 | | | | 83,824 | |
Net realized gain/(loss) on investments - affiliated securities | | | 81,251 | | | | (410 | ) | | | – | |
Net change in unrealized appreciation of investments | | | 2,761,426 | | | | 5,485,730 | | | | 5,035,621 | |
Net Increase in Net Assets Resulting from Operations | | | 5,454,062 | | | | 7,550,255 | | | | 5,375,654 | |
| | | |
DISTRIBUTIONS | | | | | | | | | | | | |
Dividends to shareholders from net investment income | | | | | | | | | | | | |
Class A | | | – | | | | (17,765 | ) | | | N/A | |
Class C | | | – | | | | (16,050 | ) | | | N/A | |
Class I | | | – | | | | (7,114 | ) | | | N/A | |
Class L | | | – | | | | (433,125 | ) | | | (183,786 | ) |
Investor Class | | | – | | | | (189,956 | ) | | | (79,120 | ) |
Dividends to shareholders from net realized gains | | | | | | | | | | | | |
Class A | | | – | | | | (17,553 | ) | | | N/A | |
Class C | | | – | | | | (17,494 | ) | | | N/A | |
Class I | | | – | | | | (6,746 | ) | | | N/A | |
Class L | | | – | | | | (401,355 | ) | | | – | |
Investor Class | | | – | | | | (221,742 | ) | | | – | |
Dividends to shareholders from tax return of capital | | | | | | | | | | | | |
Class A | | | – | | | | – | | | | N/A | |
Class C | | | – | | | | – | | | | N/A | |
Class I | | | – | | | | – | | | | N/A | |
Class L | | | – | | | | – | | | | – | |
Investor Class | | | – | | | | – | | | | – | |
Net Decrease in Net Assets from Distributions | | | | | | | (1,328,900 | ) | | | (262,906 | ) |
| | | |
BENEFICIAL INTEREST TRANSACTIONS (NOTE 4) | | | | | | | | | | | | |
Shares sold | | | | | | | | | | | | |
Class A | | | 9,892,152 | | | | 1,873,880 | | | | N/A | |
Class C | | | 4,004,850 | | | | 1,977,787 | | | | N/A | |
Class I | | | 2,025,191 | | | | 2,241,130 | | | | N/A | |
Class L | | | 3,420,948 | | | | 17,118,139 | | | | 19,773,680 | |
Investor Class | | | 680,249 | | | | 10,282,445 | | | | 12,871,509 | |
Dividends reinvested | | | | | | | | | | | | |
Class A | | | – | | | | 30,821 | | | | N/A | |
Class C | | | – | | | | 32,260 | | | | N/A | |
Class I | | | – | | | | 10,823 | | | | N/A | |
Class L | | | – | | | | 803,434 | | | | 176,343 | |
Investor Class | | | – | | | | 372,558 | | | | 75,986 | |
Shares redeemed | | | | | | | | | | | | |
Class A | | | (110,731 | ) | | | (8,866 | ) | | | N/A | |
Class C | | | (189,168 | ) | | | – | | | | N/A | |
Class I | | | (62,593 | ) | | | – | | | | N/A | |
Class L | | | (6,570,126 | ) | | | (6,407,084 | ) | | | (3,570,027 | ) |
Investor Class | | | (4,386,252 | ) | | | (3,134,097 | ) | | | (660,468 | ) |
Net Increase in Net Assets Derived from Beneficial
Interest Transactions | | | 8,704,520 | | | | 25,193,230 | | | | 28,667,023 | |
| | | |
Net increase in net assets | | | 14,158,582 | | | | 31,414,585 | | | | 33,779,771 | |
| | | |
Net Assets | | | | | | | | | | | | |
Beginning of period | | | 73,059,061 | | | | 41,644,476 | | | | 7,864,705 | |
End of year* | | $ | 87,217,643 | | | $ | 73,059,061 | | | $ | 41,644,476 | |
| | |
| | | |
* Includes undistributed/(overdistributed) net investment income of: | | $ | 16,211 | | | $ | 12,313 | | | $ | – | |
(a) Effective March 8, 2011, the Board approved changing the fiscal year–end of the Fund from December 31 to April 30.
See Notes to Financial Statements.
76 | April 30, 2011
| | | | | | | | | | |
RiverFront
Long-Term Growth
& Income Fund | | | RiverFront
Moderate
Growth Fund | | | RiverFront
Moderate Growth &
Income Fund | |
For the Period
August 2, 2010
(Inception) to
April 30, 2011 | | | For the Period
August 2, 2010
(Inception) to
April 30, 2011 | | | For the Period
August 2, 2010
(Inception) to
April 30, 2011 | |
| | |
| $ | 57,899 | | | $ | 24,069 | | | $ | 241,925 | |
| | (20,246 | ) | | | 13,320 | | | | (53,228 | ) |
| | – | | | | 3,246 | | | | – | |
| | 1,292,075 | | | | 915,722 | | | | 2,472,832 | |
| | 1,329,728 | | | | 956,357 | | | | 2,661,529 | |
| | |
| | (15,716 | ) | | | (11,628 | ) | | | (63,382 | ) |
| | (17,218 | ) | | | (2,887 | ) | | | (88,032 | ) |
| | (21,546 | ) | | | (16,490 | ) | | | (54,282 | ) |
| | N/A | | | | N/A | | | | N/A | |
| | N/A | | | | N/A | | | | N/A | |
| | (824 | ) | | | – | | | | (1,103 | ) |
| | (1,199 | ) | | | – | | | | (2,552 | ) |
| | (382 | ) | | | – | | | | (720 | ) |
| | N/A | | | | N/A | | | | N/A | |
| | N/A | | | | N/A | | | | N/A | |
| | (542 | ) | | | – | | | | – | |
| | (593 | ) | | | – | | | | – | |
| | (743 | ) | | | – | | | | – | |
| | N/A | | | | N/A | | | | N/A | |
| | N/A | | | | N/A | | | | N/A | |
| | (58,763 | ) | | | (31,005 | ) | | | (210,071 | ) |
| | |
| | 5,357,498 | | | | 4,504,410 | | | | 12,858,464 | |
| | 8,597,674 | | | | 8,470,366 | | | | 23,157,729 | |
| | 3,066,587 | | | | 1,882,771 | | | | 7,392,425 | |
| | N/A | | | | N/A | | | | N/A | |
| | N/A | | | | N/A | | | | N/A | |
| | 16,672 | | | | 10,502 | | | | 57,036 | |
| | 18,501 | | | | 2,839 | | | | 73,322 | |
| | 22,175 | | | | 16,490 | | | | 52,429 | |
| | N/A | | | | N/A | | | | N/A | |
| | N/A | | | | N/A | | | | N/A | |
| | (45,073 | ) | | | (161,953 | ) | | | (1,394,094 | ) |
| | (41,242 | ) | | | (32,609 | ) | | | (576,368 | ) |
| | (16,807 | ) | | | (100,557 | ) | | | (328,406 | ) |
| | N/A | | | | N/A | | | | N/A | |
| | N/A | | | | N/A | | | | N/A | |
| | |
| | 16,975,985 | | | | 14,592,259 | | | | 41,292,537 | |
| | 18,246,950 | | | | 15,517,611 | | | | 43,743,995 | |
| | |
| | – | | | | – | | | | – | |
| $ | 18,246,950 | | | $ | 15,517,611 | | | $ | 43,743,995 | |
| | | |
| | |
| $ | – | | | $ | – | | | $ | 28,354 | |
77 | April 30, 2011
| | | | |
| Consolidated Statements of Changes in Net Assets |
| | | | | |
| | | | | | | | |
| | | ALPS | Kotak
India Growth
Fund(a) | | | Jefferies Asset
Management
Commodity
Strategy
Allocation Fund(b) | |
| | | For the Period
February 14, 2011
(Inception) to
April 30, 2011 | | | For the Period
June 29, 2010
(Inception) to
April 30, 2011 | |
OPERATIONS | | | | | | | | |
Net investment income/(loss) | | $ | (3,001 | ) | | $ | 332,214 | |
Net realized gain on investments | | | 2,604 | | | | 181,904 | |
Net realized gain on forward contracts | | | – | | | | 2 | |
Net realized gain/(loss) on futures contracts | | | 899 | | | | (270,469 | ) |
Net realized gain on total return swaps | | | – | | | | 8,814,860 | |
Net realized gain/(loss) on foreign currency transactions | | | (985 | ) | | | 4,050 | |
Net change in unrealized appreciation of investments, futures contracts, swaps and translation of assets and liabilities in foreign currencies | | | 30,700 | | | | 5,172,226 | |
Net Increase in Net Assets Resulting from Operations | | | 30,217 | | | | 14,234,787 | |
| | |
DISTRIBUTIONS | | | | | | | | |
Dividends to shareholders from net investment income | | | | | | | | |
Class A | | | – | | | | (528,187 | ) |
Class C | | | – | | | | (173,053 | ) |
Class I | | | – | | | | (1,491,694 | ) |
Net Decrease in Net Assets from Distributions | | | – | | | | (2,192,934 | ) |
| | |
BENEFICIAL INTEREST TRANSACTIONS (NOTE 4) | | | | | | | | |
Shares sold | | | | | | | | |
Class A | | | 920,378 | | | | 40,033,145 | |
Class C | | | 452,986 | | | | 7,949,510 | |
Class I | | | 568,500 | | | | 69,266,578 | |
Dividends reinvested | | | | | | | | |
Class A | | | – | | | | 468,992 | |
Class C | | | – | | | | 132,186 | |
Class I | | | – | | | | 916,223 | |
Shares redeemed | | | | | | | | |
Class A | | | (3,827 | ) | | | (6,229,163 | ) |
Class C | | | – | | | | (1,406,988 | ) |
Class I | | | – | | | | (5,130,326 | ) |
Net Increase in Net Assets Derived from Beneficial Interest Transactions | | | 1,938,037 | | | | 106,000,157 | |
| | |
Net increase in net assets | | | 1,968,254 | | | | 118,042,010 | |
| | |
Net Assets | | | | | | | | |
Beginning of period | | | – | | | | – | |
End of year* | | $ | 1,968,254 | | | $ | 118,042,010 | |
| | |
| | |
* Includes undistributed/(overdistributed) net investment income of: | | $ | (3,343 | ) | | $ | (6,734,165 | ) |
| (a) | Consolidated Statement of Changes for ALPS | Kotak India Growth Fund is consolidated and includes the balances of Kotak Mauritius Portfolio (wholly-owned subsidiary). Accordingly, all interfund balances have been eliminated. |
| (b) | Consolidated Statement of Changes for Jefferies Asset Management Commodity Strategy Allocation Fund is consolidated and includes the balances of Jefferies Asset Management Cayman Trust (wholly-owned subsidiary). Accordingly, all interfund balances have been eliminated. |
See Notes to Financial Statements.
78 | April 30, 2011
| | | | |
| Financial Highlights |
| | | Selected data for a share of beneficial interest outstanding throughout the periods indicated: |
| | | | | | | | | | | | | | | | |
| | | ALPS | Red Rocks Listed Private Equity Fund - Class A | |
| | | For the Year Ended April 30, | | | For the Period
from December
31, 2007 (Inception) to April 30, 2008 | |
| | | 2011 | | | 2010 | | | 2009 | | |
Net asset value, beginning of period | | $ | 5.17 | | | $ | 3.56 | | | $ | 9.47 | | | $ | 10.00 | |
| | | | |
INCOME/(LOSS) FROM INVESTMENT OPERATIONS: | | | | | | | | | | | | | | | | |
Net investment income | | | 0.04 | (a) | | | 0.14 | | | | 0.08 | (a) | | | 0.11 | |
Net realized and unrealized gain/(loss) | | | 1.61 | | | | 1.99 | | | | (5.97 | ) | | | (0.64 | ) |
Total from investment operations | | | 1.65 | | | | 2.13 | | | | (5.89 | ) | | | (0.53 | ) |
| | | | |
DISTRIBUTIONS: | | | | | | | | | | | | | | | | |
From net investment income | | | (0.38 | ) | | | (0.52 | ) | | | (0.03 | ) | | | – | |
From net realized gains | | | – | | | | – | | | | (0.00 | )(b) | | | – | |
Total distributions | | | (0.38 | ) | | | (0.52 | ) | | | (0.03 | ) | | | – | |
| | | | |
REDEMPTION FEES ADDED TO PAID-IN CAPITAL (NOTE 4) | | | 0.00 | (b) | | | 0.00 | (b) | | | 0.01 | | | | – | |
Net increase/(decrease) in net asset value | | | 1.27 | | | | 1.61 | | | | (5.91 | ) | | | (0.53 | ) |
Net asset value, end of year | | $ | 6.44 | | | $ | 5.17 | | | $ | 3.56 | | | $ | 9.47 | |
| | | | | | | | | | | | | | | | | |
TOTAL RETURN(c) | | | 33.22 | % | | | 61.68 | % | | | (62.01 | )% | | | (5.30 | )% |
| | | | |
RATIOS/SUPPLEMENTAL DATA: | | | | | | | | | | | | | | | | |
Net assets, end of year (000s) | | $ | 124,874 | | | $ | 67,192 | | | $ | 27,860 | | | $ | 832 | |
Ratio of net investment income to average net assets | | | 0.67 | % | | | 0.42 | % | | | 2.16 | % | | | 4.68 | %(d) |
Ratio of expenses to average net assets including fee waivers and reimbursements | | | 1.50 | % | | | 1.44 | %(e) | | | 1.25 | % | | | 1.25 | %(d) |
Ratio of expenses to average net assets excluding fee waivers and reimbursements | | | 1.70 | % | | | 1.71 | % | | | 2.08 | % | | | 39.07 | %(d) |
Portfolio turnover rate(f) | | | 43 | % | | | 54 | % | | | 59 | % | | | 15 | % |
| (a) | Calculated using the average shares method. |
| (b) | Less than $0.005 and $(0.005) per share. |
| (c) | Total returns are for the period indicated and have not been annualized. Total returns would have been lower had certain expenses not been waived during the period. Returns shown do not reflect the deduction of taxes that a shareholder would pay on Fund distributions or the redemption of Fund shares. Returns shown exclude any applicable sales charges. |
| (e) | Effective September 1, 2009, the net expense ratio limitation changed from 1.00% to 1.25%. |
| (f) | Portfolio turnover rate for periods less than one full year have not been annualized. |
See Notes to Financial Statements.
79 | April 30, 2011
| | | | |
| Financial Highlights |
| | | Selected data for a share of beneficial interest outstanding throughout the period indicated: |
| | | | | |
| | | ALPS | Red Rocks Listed Private Equity Fund - Class C |
| | | For the Period July 2, 2010 (Inception) to April 30, 2011 |
Net asset value, beginning of period | | | $ | 4.39 | |
| |
INCOME/(LOSS) FROM INVESTMENT OPERATIONS: | | | | | |
Net investment loss | | | | (0.01 | )(a) |
Net realized and unrealized gain | | | | 2.36 | |
Total from investment operations | | | | 2.35 | |
| |
DISTRIBUTIONS: | | | | | |
From net investment income | | | | (0.37 | ) |
Total distributions | | | | (0.37 | ) |
| |
REDEMPTION FEES ADDED TO PAID-IN CAPITAL (NOTE 4) | | | | 0.00 | (b) |
Net increase in net asset value | | | | 1.98 | |
Net asset value, end of year | | | $ | 6.37 | |
| | | | | | |
TOTAL RETURN(c) | | | | 55.32 | % |
| |
RATIOS/SUPPLEMENTAL DATA: | | | | | |
Net assets, end of year (000s) | | | $ | 2,566 | |
Ratio of net investment loss to average net assets | | | | (0.19 | )%(d) |
Ratio of expenses to average net assets including fee waivers and reimbursements | | | | 2.25 | %(d) |
Ratio of expenses to average net assets excluding fee waivers and reimbursements | | | | 2.31 | %(d) |
Portfolio turnover rate(e) | | | | 43 | %(f) |
| (a) | Calculated using the average shares method. |
| (b) | Less than $0.005 per share. |
| (c) | Total returns are for the period indicated and have not been annualized. Total returns would have been lower had certain expenses not been waived during the period. Returns shown do not reflect the deduction of taxes that a shareholder would pay on Fund distributions or the redemption of Fund shares. Returns shown exclude any applicable sales charges. |
| (e) | Portfolio turnover rate for periods less than one full year have not been annualized. |
| (f) | Portfolio turnover rate is calculated at the Fund Level and represents the year ended April 30, 2011. |
See Notes to Financial Statements.
80 | April 30, 2011
| | | | |
Financial Highlights |
| | | Selected data for a share of beneficial interest outstanding throughout the periods indicated: |
| | | | | | | | | | | | | | | | |
| | | ALPS | Red Rocks Listed Private Equity Fund - Class
I | |
| | | For the Year Ended April 30, | | | For the Period Ended April 30, 2008(a) | |
| | | 2011 | | | 2010 | | | 2009 | | |
Net asset value, beginning of period | | $ | 5.19 | | | $ | 3.57 | | | $ | 9.47 | | | $ | 10.00 | |
| | | | |
INCOME/(LOSS) FROM INVESTMENT OPERATIONS: | | | | | | | | | | | | | | | | |
Net investment income | | | 0.05 | (b) | | | 0.28 | | | | 0.10 | (b) | | | 0.13 | |
Net realized and unrealized gain/(loss) | | | 1.62 | | | | 1.87 | | | | (5.97 | ) | | | (0.66 | ) |
Total from investment operations | | | 1.67 | | | | 2.15 | | | | (5.87 | ) | | | (0.53 | ) |
| | | | |
DISTRIBUTIONS: | | | | | | | | | | | | | | | | |
From net investment income | | | (0.39 | ) | | | (0.53 | ) | | | (0.05 | ) | | | – | |
From net realized gains | | | – | | | | – | | | | (0.00 | )(c) | | | – | |
Total distributions | | | (0.39 | ) | | | (0.53 | ) | | | (0.05 | ) | | | – | |
| | | | |
REDEMPTION FEES ADDED TO PAID IN CAPITAL (NOTE 4) | | | 0.00 | (c) | | | 0.00 | (c) | | | 0.02 | | | | – | |
Net increase/(decrease) in net asset value | | | 1.28 | | | | 1.62 | | | | (5.90 | ) | | | (0.53 | ) |
Net asset value, end of year | | $ | 6.47 | | | $ | 5.19 | | | $ | 3.57 | | | $ | 9.47 | |
| | |
TOTAL RETURN(d) | | | 33.47 | % | | | 62.09 | % | | | (61.79 | )% | | | (5.30 | )% |
| | | | |
RATIOS/SUPPLEMENTAL DATA: | | | | | | | | | | | | | | | | |
Net assets, end of year (000s) | | $ | 66,854 | | | $ | 45,144 | | | $ | 12,938 | | | $ | 21 | |
Ratio of net investment income to average net assets | | | 0.91 | % | | | 0.78 | % | | | 2.56 | % | | | 6.11 | %(e) |
Ratio of expenses to average net assets including fee waivers and reimbursements | | | 1.25 | % | | | 1.19 | %(f) | | | 1.00 | % | | | 1.00 | %(e) |
Ratio of expenses to average net assets excluding fee waivers and reimbursements | | | 1.36 | % | | | 1.47 | % | | | 2.05 | % | | | 35.33 | %(e) |
Portfolio turnover rate(g) | | | 43 | % | | | 54 | % | | | 59 | % | | | 15 | % |
| (a) | The Fund commenced operations on December 31, 2007. |
| (b) | Calculated using the average shares method. |
| (c) | Less than $0.005 and $(0.005) per share. |
| (d) | Total returns are for the period indicated and have not been annualized. Total returns would have been lower had certain expenses not been waived during the period. Returns shown do not reflect the deduction of taxes that a shareholder would pay on Fund distributions or the redemption of Fund shares. |
| (f) | Effective September 1, 2009, the net expense ratio limitation changed from 1.00% to 1.25%. |
| (g) | Portfolio turnover rate for periods less than one full year have not been annualized. |
See Notes to Financial Statements.
81 | April 30, 2011
| | | | |
Financial Highlights |
| | | Selected data for a share of beneficial interest outstanding throughout the periods indicated: |
| | | | | | | | | | | | | | | | |
| | | ALPS | Red Rocks Listed Private Equity Fund - Class R | |
| | | For the Year Ended April 30, | | | For the Period Ended April 30, 2008(a) | |
| | | 2011 | | | 2010 | | | 2009 | | |
Net asset value, beginning of period | | $ | 4.73 | | | $ | 3.31 | | | $ | 9.46 | | | $ | 10.00 | |
| | | | |
INCOME/(LOSS) FROM INVESTMENT OPERATIONS: | | | | | | | | | | | | | | | | |
Net investment income/(loss) | | | 0.03 | (b) | | | (0.09 | ) | | | 0.15 | (b) | | | 0.12 | |
Net realized and unrealized gain/(loss) | | | 1.43 | | | | 2.02 | | | | (6.05 | ) | | | (0.66 | ) |
Total from investment operations | | | 1.46 | | | | 1.93 | | | | (5.90 | ) | | | (0.54 | ) |
| | | | |
DISTRIBUTIONS: | | | | | | | | | | | | | | | | |
From net investment income | | | (0.37 | ) | | | (0.51 | ) | | | (0.26 | ) | | | – | |
From net realized gains | | | – | | | | – | | | | (0.00 | )(c) | | | – | |
Total distributions | | | (0.37 | ) | | | (0.51 | ) | | | (0.26 | ) | | | – | |
| | | | |
REDEMPTION FEES ADDED TO PAID IN CAPITAL (NOTE 4) | | | – | | | | – | | | | 0.01 | | | | – | |
Net increase/(decrease) in net asset value | | | 1.09 | | | | 1.42 | | | | (6.15 | ) | | | (0.54 | ) |
Net asset value, end of year | | $ | 5.82 | | | $ | 4.73 | | | $ | 3.31 | | | $ | 9.46 | |
| | |
TOTAL RETURN(d) | | | 32.47 | % | | | 60.92 | % | | | (62.10 | )% | | | (5.40 | )% |
| | | | |
RATIOS/SUPPLEMENTAL DATA: | | | | | | | | | | | | | | | | |
Net assets, end of year (000s) | | $ | 125 | | | $ | 18 | | | $ | – | (e) | | $ | 1 | |
Ratio of net investment income/(loss) to average net assets | | | 0.66 | % | | | (0.24 | )% | | | 2.72 | % | | | 3.90 | %(f) |
Ratio of expenses to average net assets including fee waivers and reimbursements | | | 1.75 | % | | | 1.75 | %(g) | | | 1.50 | % | | | 1.50 | %(f) |
Ratio of expenses to average net assets excluding fee waivers and reimbursements | | | 1.87 | % | | | 2.27 | % | | | 6.08 | % | | | 43.39 | %(f) |
Portfolio turnover rate(h) | | | 43 | % | | | 54 | % | | | 59 | % | | | 15 | % |
| (a) | The Fund commenced operations on December 31, 2007. |
| (b) | Calculated using the average shares method. |
| (c) | Less than $(0.005) per share. |
| (d) | Total returns are for the period indicated and have not been annualized. Total returns would have been lower had certain expenses not been waived during the period. Returns shown do not reflect the deduction of taxes that a shareholder would pay on Fund distributions or the redemption of Fund shares. |
| (g) | Effective September 1, 2009, the net expense ratio limitation changed from 1.50% to 1.75%. |
| (h) | Portfolio turnover rate for periods less than one full year have not been annualized. |
See Notes to Financial Statements.
82 | April 30, 2011
| | | | |
Financial Highlights |
| | | Selected data for a share of beneficial interest outstanding throughout the periods indicated: |
| | | | | | | | | | | | | | | | | | | | | | | | | | | | |
| | | | | | ALPS | WMC Value Intersection Fund(a) - Class A | | | | |
| | | For the Year Ended
April 30, | | | For the
Period
January 1,
2010 to
April 30, | | | For the Year Ended December 31, | |
| | | 2011 | | | 2010(b) | | | 2009 | | | 2008 | | | 2007 | | | 2006 | | | 2005 | |
Net asset value, beginning of period | | $ | 7.43 | | | $ | 6.92 | | | $ | 5.86 | | | $ | 9.35 | | | $ | 9.81 | | | $ | 8.65 | | | $ | 8.06 | |
| | | | | | | |
INCOME/(LOSS) FROM INVESTMENT OPERATIONS: | | | | | | | | | | | | | | | | | | | | | | | | | | | | |
Net investment income | | | 0.06 | (c) | | | 0.03 | | | | 0.07 | | | | 0.08 | | | | 0.14 | | | | 0.13 | | | | 0.09 | |
Net realized and unrealized gain/(loss) | | | 1.22 | | | | 0.48 | | | | 1.06 | | | | (3.49 | ) | | | 0.09 | | | | 1.49 | | | | 0.59 | |
Total from investment operations | | | 1.28 | | | | 0.51 | | | | 1.13 | | | | (3.41 | ) | | | 0.23 | | | | 1.62 | | | | 0.68 | |
| | | | | | | |
DISTRIBUTIONS: | | | | | | | | | | | | | | | | | | | | | | | | | | | | |
From net investment income | | | (0.07 | ) | | | – | | | | (0.07 | ) | | | (0.08 | ) | | | (0.14 | ) | | | (0.13 | ) | | | (0.09 | ) |
From net realized gains | | | – | | | | – | | | | – | | | | – | | | | (0.55 | ) | | | (0.33 | ) | | | – | |
Total distributions | | | (0.07 | ) | | | – | | | | (0.07 | ) | | | (0.08 | ) | | | (0.69 | ) | | | (0.46 | ) | | | (0.09 | ) |
| | | | | | | |
Net increase/(decrease) in net asset value | | | 1.21 | | | | 0.51 | | | | 1.06 | | | | (3.49 | ) | | | (0.46 | ) | | | 1.16 | | | | 0.59 | |
Net asset value, end of year | | $ | 8.64 | | | $ | 7.43 | | | $ | 6.92 | | | $ | 5.86 | | | $ | 9.35 | | | $ | 9.81 | | | $ | 8.65 | |
| | |
TOTAL RETURN(d) | | | 17.34 | % | | | 7.22 | % | | | 19.24 | % | | | (36.45 | )% | | | 2.43 | % | | | 18.80 | % | | | 8.47 | % |
| | | | | | | |
RATIOS/SUPPLEMENTAL DATA: | | | | | | | | | | | | | | | | | | | | | | | | | | | | |
Net assets, end of year (000s) | | $ | 48,899 | | | $ | 45,300 | | | $ | 62,264 | | | $ | 53,841 | | | $ | 88,679 | | | $ | 125,459 | | | $ | 132,597 | |
Ratio of net investment income to average net assets | | | 0.77 | % | | | 0.60 | %(e) | | | 1.12 | % | | | 1.1 | % | | | 1.4 | % | | | 1.4 | % | | | 1.1 | % |
Ratio of expenses to average net assets including fee waivers and reimbursements | | | 1.40 | % | | | 1.40 | %(e) | | | 1.62 | % | | | 1.5 | % | | | 1.2 | % | | | 1.1 | % | | | 1.2 | % |
Ratio of expenses to average net assets excluding fee waivers and reimbursements | | | 1.71 | % | | | 1.70 | %(e) | | | N/A | | | | N/A | | | | N/A | | | | N/A | | | | N/A | |
Portfolio turnover(f) | | | 44 | % | | | 11 | % | | | 56 | % | | | 83 | % | | | 52 | % | | | 64 | % | | | 54 | % |
| (a) | Prior to August 31, 2010, the ALPS | WMC Value Intersection Fund was known as the Activa Value Fund. |
| (b) | Effective March 9, 2010, the Board approved changing the fiscal year-end of the Fund from December 31 to April 30. |
| (c) | Calculated using the average shares method. |
| (d) | Total returns are for the period indicated and have not been annualized. Total returns would have been lower had certain expenses not been waived during the period. Returns shown do not reflect the deduction of taxes that a shareholder would pay on Fund distributions or the redemption of Fund shares. Returns shown exclude any applicable sales charges. |
| (f) | Portfolio turnover rate for periods less than one full year have not been annualized. |
See Notes to Financial Statements.
83 | April 30, 2011
| | | | |
Financial Highlights |
| | | Selected data for a share of beneficial interest outstanding throughout the period indicated: |
| | | | | | | | |
| | | ALPS | WMC Value Intersection Fund(a) - Class C |
| | | For the Period July 2, 2010 (Inception) to April 30, 2011 |
Net asset value, beginning of period | | | | $ | 6.40 | | | |
| | | |
INCOME/(LOSS) FROM INVESTMENT OPERATIONS: | | | | | | | | |
Net investment loss(b) | | | | | (0.01 | ) | | |
Net realized and unrealized gain | | | | | 2.27 | | | |
Total from investment operations | | | | | 2.26 | | | |
| | | |
DISTRIBUTIONS: | | | | | | | | |
From net investment income | | | | | (0.04 | ) | | |
Total distributions | | | | | (0.04 | ) | | |
| | | |
Net increase in net asset value | | | | | 2.22 | | | |
Net asset value, end of year | | | | $ | 8.62 | | | |
| |
TOTAL RETURN(c) | | | | | 35.44 | % | | |
| | | |
RATIOS/SUPPLEMENTAL DATA: | | | | | | | | |
Net assets, end of year (000s) | | | | $ | 14 | | | |
Ratio of net investment loss to average net assets | | | | | (0.09 | )%(d) | | |
Ratio of expenses to average net assets including fee waivers and reimbursements | | | | | 2.15 | %(d) | | |
Ratio of expenses to average net assets excluding fee waivers and reimbursements | | | | | 2.49 | %(d) | | |
Portfolio turnover rate(e) | | | | | 44 | %(f) | | |
| (a) | Prior to August 31, 2010, the ALPS | WMC Value Intersection Fund was known as the Activa Value Fund. |
| (b) | Calculated using the average shares method. |
| (c) | Total returns are for the period indicated and have not been annualized. Total returns would have been lower had certain expenses not been waived during the period. Returns shown do not reflect the deduction of taxes that a shareholder would pay on Fund distributions or the redemption of Fund shares. |
| (e) | Portfolio turnover rate for periods less than one full year have not been annualized. |
| (f) | Portfolio turnover rate is calculated at the Fund Level and represents the year ended April 30, 2011. |
See Notes to Financial Statements.
84 | April 30, 2011
| | | | |
Financial Highlights |
| | | Selected data for a share of beneficial interest outstanding throughout the periods indicated: |
| | | | | | | | | | | | | | | | | | | | | | | | | | | | |
| | | ALPS | WMC Value Intersection Fund(a) - Class I(b) | |
| | | For the Year Ended
April 30, 2011 | | | For the
Period
January 1,
2010 to
April 30, 2010(c) | | | For the Year Ended December 31, | |
| | | | | 2009 | | | 2008 | | | 2007 | | | 2006 | | | 2005 | |
Net asset value, beginning of period | | $
| 7.48
|
| | $ | 6.96 | | | $ | 5.89 | | | $ | 9.41 | | | $ | 9.86 | | | $ | 8.69 | | | $ | 8.10 | |
| | | | | | | |
INCOME/(LOSS) FROM INVESTMENT OPERATIONS: | | | | | | | | | | | | | | | | | | | | | | | | | | | | |
Net investment income | | | 0.07 | (d) | | | 0.02 | | | | 0.07 | | | | 0.09 | | | | 0.15 | | | | 0.14 | | | | 0.10 | |
Net realized and unrealized gain/(loss) | | | 1.24 | | | | 0.50 | | | | 1.08 | | | | (3.52 | ) | | | 0.10 | | | | 1.50 | | | | 0.59 | |
Total from investment operations | | | 1.31 | | | | 0.52 | | | | 1.15 | | | | (3.43 | ) | | | 0.25 | | | | 1.64 | | | | 0.69 | |
| | | | | | | |
DISTRIBUTIONS: | | | | | | | | | | | | | | | | | | | | | | | | | | | | |
From net investment income | | | (0.08 | ) | | | – | | | | (0.08 | ) | | | (0.09 | ) | | | (0.15 | ) | | | (0.14 | ) | | | (0.10 | ) |
From net realized gains | | | – | | | | – | | | | – | | | | – | | | | (0.55 | ) | | | (0.33 | ) | | | – | |
Total distributions | | | (0.08 | ) | | | – | | | | (0.08 | ) | | | (0.09 | ) | | | (0.70 | ) | | | (0.47 | ) | | | (0.10 | ) |
Net increase/(decrease) in net asset value | | | 1.23 | | | | 0.52 | | | | 1.07 | | | | (3.52 | ) | | | (0.45 | ) | | | 1.17 | | | | 0.59 | |
Net asset value, end of year | | $ | 8.71 | | | $ | 7.48 | | | $ | 6.96 | | | $ | 5.89 | | | $ | 9.41 | | | $ | 9.86 | | | $ | 8.69 | |
| | |
TOTAL RETURN(e) | | | 17.67 | % | | | 7.47 | % | | | 19.59 | % | | | (36.38 | )% | | | 2.59 | % | | | 18.89 | % | | | 8.52 | % |
| | | | | | | |
RATIOS/SUPPLEMENTAL DATA: | | | | | | | | | | | | | | | | | | | | | | | | | | | | |
Net assets, end of year (000s) | | $
| 29,251
|
| | $ | 16,814 | | | $ | 16,465 | | | $ | 3,658 | | | $ | 5,422 | | | $ | 4,956 | | | $ | 4,264 | |
Ratio of net investment income to average net assets | | | 0.95 | % | | | 0.77 | %(f) | | | 1.17 | % | | | 1.3 | % | | | 1.4 | % | | | 1.4 | % | | | 1.2 | % |
Ratio of expenses to average net assets including fee waivers and reimbursements | | | 1.15 | % | | | 1.15 | %(f) | | | 1.46 | % | | | 1.4 | % | | | 1.1 | % | | | 1.1 | % | | | 1.1 | % |
Ratio of expenses to average net assets excluding fee waivers and reimbursements | | | 1.46 | % | | | 1.49 | %(f) | | | N/A | | | | N/A | | | | N/A | | | | N/A | | | | N/A | |
Portfolio turnover(g) | | | 44 | % | | | 11 | % | | | 56 | % | | | 83 | % | | | 52 | % | | | 64 | % | | | 54 | % |
| (a) | Prior to August 31, 2010, the ALPS | WMC Value Intersection Fund was known as the Activa Value Fund. |
| (b) | Prior to the close of business on August 28, 2009, Class I was known as Class R of the Predecessor Fund. |
| (c) | Effective March 9, 2010, the Board approved changing the fiscal year-end of the Fund from December 31 to April 30. |
| (d) | Calculated using the average shares method. |
| (e) | Total returns are for the period indicated and have not been annualized. Total returns would have been lower had certain expenses not been waived during the period. Returns shown do not reflect the deduction of taxes that a shareholder would pay on Fund distributions or the redemption of Fund shares. |
| (g) | Portfolio turnover rate for periods less than one full year have not been annualized. |
See Notes to Financial Statements.
85 | April 30, 2011
| | | | |
Financial Highlights |
| | | Selected data for a share of beneficial interest outstanding throughout the periods indicated: |
| | | | | | | | | | | | | | | | | | | | | | | | |
| | | | | | | | | Clough China Fund - Class A | | | | |
| | | | |
| | | For the Year Ended April 30, 2011 | | | For the Period August 1, 2009 to April 30, 2010(a) | | | For the Year Ended July 31, | | | For the Period December 30, 2005 (Inception) to July 31, 2006 | |
| | | | | 2009 | | | 2008 | | | 2007 | | |
Net asset value, beginning of period | | $ | 18.21 | | | $ | 16.32 | | | $ | 15.81 | | | $ | 22.46 | | | $ | 13.23 | | | $ | 10.00 | |
| | | | | | |
INCOME/(LOSS) FROM INVESTMENT OPERATIONS: | | | | | | | | | | | | | | | | | | | | | | | | |
Net investment income/(loss) | | | (0.04 | )(b) | | | 0.10 | | | | 0.09 | (b) | | | (0.01 | )(b) | | | 0.06 | (b) | | | 0.01 | (b) |
Net realized and unrealized gain/(loss) | | | 2.94 | | | | 1.85 | | | | 0.62 | (c) | | | (1.73 | ) | | | 9.59 | | | | 3.22 | |
Total from investment operations | | | 2.90 | | | | 1.95 | | | | 0.71 | | | | (1.74 | ) | | | 9.65 | | | | 3.23 | |
| | | | | | |
DISTRIBUTIONS: | | | | | | | | | | | | | | | | | | | | | | | | |
From net investment income | | | (0.09 | ) | | | (0.07 | ) | | | (0.20 | ) | | | (0.03 | ) | | | (0.05 | ) | | | – | |
From net realized gains | | | – | | | | – | | | | – | | | | (4.88 | ) | | | (0.37 | ) | | | – | |
Total distributions | | | (0.09 | ) | | | (0.07 | ) | | | (0.20 | ) | | | (4.91 | ) | | | (0.42 | ) | | | – | |
| | | | | | |
REDEMPTION FEES ADDED TO PAID IN CAPITAL (NOTE 4) | | | 0.00 | (b)(d) | | | 0.01 | | | | 0.00 | (b)(d) | | | – | | | | – | | | | – | |
Net increase/(decrease) in net asset value | | | 2.81 | | | | 1.89 | | | | 0.51 | | | | (6.65 | ) | | | 9.23 | | | | 3.23 | |
Net asset value, end of year | | $ | 21.02 | | | $ | 18.21 | | | $ | 16.32 | | | $ | 15.81 | | | $ | 22.46 | | | $ | 13.23 | |
| | | | | | | | | | | | | | | | | | | | | | | | | |
TOTAL RETURN(e) | | | 16.00 | % | | | 12.07 | % | | | 5.00 | %(c) | | | (13.91 | )% | | | 73.81 | % | | | 32.30 | % |
| | | | | | |
RATIOS/SUPPLEMENTAL DATA: | | | | | | | | | | | | | | | | | | | | | | | | |
Net assets, end of year (000s) | | $ | 44,616 | | | $ | 28,695 | | | $ | 15,069 | | | $ | 17,927 | | | $ | 25,976 | | | $ | 2,532 | |
Ratio of net investment income/ (loss) to average net assets | | | (0.22 | )% | | | (0.53 | )%(f) | | | 0.70 | % | | | (0.06 | )% | | | 0.31 | % | | | 0.12 | %(f) |
Ratio of expenses to average net assets including fee waivers and reimbursements | | | 1.89 | %(i) | | | 1.87 | %(f)(g) | | | 1.95 | % | | | 2.02 | % | | | 2.10 | % | | | 2.10 | %(f) |
Ratio of expenses to average net assets excluding fee waivers and reimbursements | | | 2.07 | % | | | 2.24 | %(f) | | | 2.62 | % | | | 2.34 | % | | | 2.42 | % | | | 6.65 | %(f) |
Portfolio turnover(h) | | | 170 | % | | | 110 | % | | | 120 | % | | | 178 | % | | | 193 | % | | | 51 | % |
| (a) | Effective March 9, 2010, the Board approved changing the fiscal year-end of the Fund from July 31 to April 30. |
| (b) | Calculated using the average shares method. |
| (c) | Impact of payment by affiliate was less than $0.01 per share and 0.01%, respectively (See Note 2). |
| (d) | Less than $0.005 per share. |
| (e) | Total returns are for the period indicated and have not been annualized. Total returns would have been lower had certain expenses not been waived during the period. Returns shown do not reflect the deduction of taxes that a shareholder would pay on Fund distributions or the redemption of Fund shares. Returns shown exclude any applicable sales charges. |
| (g) | Effective January 1, 2010, the net expense ratio limitation changed from 1.95% to 1.85%. |
| (h) | Portfolio turnover rate for periods of less than one full year have not been annualized. |
| (i) | Effective January 1, 2011, the net expense ratio limitation changed from 1.85% to 1.95%. |
See Notes to Financial Statements.
86 | April 30, 2011
| | | | |
Financial Highlights |
| | | Selected data for a share of beneficial interest outstanding throughout the periods indicated: |
| | | | | | | | | | | | | | | | | | | | | | | | |
| | | | | | | | | Clough China Fund - Class C | | | | |
| | | | |
| | | For the
Year Ended April 30, 2011 | | | For the Period
August 1,
2009 to April 30, 2010(a) | | | | | | For the Period
December 30, 2005 (Inception) to July 31, 2006 | |
| | | | For the Year Ended July 31, | | |
| | | | 2009 | | | 2008 | | | 2007 | | |
Net asset value, beginning of period | | $ | 17.89 | | | $ | 16.08 | | | $ | 15.48 | | | $ | 22.26 | | | $ | 13.18 | | | $ | 10.00 | |
| | | | | | |
INCOME/(LOSS) FROM INVESTMENT OPERATIONS: | | | | | | | | | | | | | | | | | | | | | | | | |
Net investment loss | | | (0.21 | )(b) | | | (0.17 | ) | | | (0.01 | )(b) | | | (0.17 | )(b) | | | (0.06 | )(b) | | | (0.06 | )(b) |
Net realized and unrealized gain/(loss) | | | 2.90 | | | | 1.98 | | | | 0.65 | (c) | | | (1.64 | ) | | | 9.52 | | | | 3.24 | |
Total from investment operations | | | 2.69 | | | | 1.81 | | | | 0.64 | | | | (1.81 | ) | | | 9.46 | | | | 3.18 | |
| | | | | | |
DISTRIBUTIONS: | | | | | | | | | | | | | | | | | | | | | | | | |
From net investment income | | | (0.00 | )(d) | | | – | | | | (0.04 | ) | | | (0.09 | ) | | | (0.02 | ) | | | – | |
From net realized gains | | | – | | | | – | | | | – | | | | (4.88 | ) | | | (0.37 | ) | | | – | |
Total distributions | | | – | | | | – | | | | (0.04 | ) | | | (4.97 | ) | | | (0.39 | ) | | | – | |
| | | | | | |
REDEMPTION FEES ADDED TO PAID IN CAPITAL (NOTE 4) | | | 0.00 | (d) | | | – | | | | – | | | | – | | | | 0.01 | | | | – | |
Net increase/(decrease) in net asset value | | | 2.69 | | | | 1.81 | | | | 0.60 | | | | (6.78 | ) | | | 9.08 | | | | 3.18 | |
Net asset value, end of year | | $ | 20.58 | | | $ | 17.89 | | | $ | 16.08 | | | $ | 15.48 | | | $ | 22.26 | | | $ | 13.18 | |
| | | | | | | | | | | | | | | | | | | | | | | | | |
TOTAL RETURN(e) | | | 15.13 | % | | | 11.26 | % | | | 4.21 | %(c) | | | (14.49 | )% | | | 76.27 | % | | | 31.80 | % |
| | | | | | |
RATIOS/SUPPLEMENTAL DATA: | | | | | | | | | | | | | | | | | | | | | | | | |
Net assets, end of year (000s) | | $ | 16,848 | | | $ | 7,594 | | | $ | 8,267 | | | $ | 9,991 | | | $ | 15,497 | | | $ | 793 | |
Ratio of net investment (loss) to average net assets | | | (1.10 | )% | | | (1.26 | )%(f) | | | (0.05 | )% | | | (0.85 | )% | | | (0.33 | )% | | | (0.76 | )%(f) |
Ratio of expenses to average net assets including fee waivers and reimbursements | | | 2.70 | % | | | 2.70 | %(f) | | | 2.70 | % | | | 2.77 | % | | | 2.85 | % | | | 2.85 | %(f) |
Ratio of expenses to average net assets excluding fee waivers and reimbursements | | | 2.86 | % | | | 3.18 | %(f) | | | 3.43 | % | | | 3.15 | % | | | 3.33 | % | | | 11.53 | %(f) |
Portfolio turnover(g) | | | 170 | % | | | 110 | % | | | 120 | % | | | 178 | % | | | 193 | % | | | 51 | % |
| (a) | Effective March 9, 2010, the Board approved changing the fiscal year-end of the Fund from July 31 to April 30. |
| (b) | Calculated using the average shares method. |
| (c) | Impact of payment by affiliate was less than $0.01 per share and 0.01%, respectively (See Note 2). |
| (d) | Less than $0.005 and $(0.005) per share. |
| (e) | Total returns are for the period indicated and have not been annualized. Total returns would have been lower had certain expenses not been waived during the period. Returns shown do not reflect the deduction of taxes that a shareholder would pay on Fund distributions or the redemption of Fund shares. |
| (g) | Portfolio turnover rate for periods of less than one full year have not been annualized. |
See Notes to Financial Statements.
87 | April 30, 2011
| | | | |
Financial Highlights |
| | | Selected data for a share of beneficial interest outstanding throughout the periods indicated: |
| | | | | | | | | | | | | | | | | | | | | | | | |
| | | Clough China Fund - Class I(a) | |
| | | | |
| | | For the Year Ended April 30, 2011 | | | For the Period August 1, 2009 to April 30, 2010(b) | | | For the Year Ended July 31, | | | For the Period December 30, 2005 (Inception) to July 31, 2006 | |
| | | | 2009 | | | 2008 | | | 2007 | | |
Net asset value, beginning
of period | | $ | 18.41 | | | $ | 16.52 | | | $ | 16.10 | | | $ | 22.65 | | | $ | 13.27 | | | $ | 10.00 | |
|
INCOME/(LOSS) FROM
INVESTMENT OPERATIONS: | |
|
Net investment income/(loss) | | | (0.01 | )(c) | | | 0.01 | | | | 0.15 | (c) | | | 0.13 | (c) | | | 0.19 | (c) | | | 0.08 | (c) |
Net realized and unrealized
gain/(loss) | | | 3.03 | | | | 2.03 | | | | 0.60 | (d) | | | (1.80 | ) | | | 9.63 | | | | 3.19 | |
Total from investment operations | | | 3.02 | | | | 2.04 | | | | 0.75 | | | | (1.67 | ) | | | 9.82 | | | | 3.27 | |
| | | | | | |
DISTRIBUTIONS: | | | | | | | | | | | | | | | | | | | | | | | | |
From net investment income | | | (0.13 | ) | | | (0.15 | ) | | | (0.33 | ) | | | – | | | | (0.07 | ) | | | – | |
From net realized gains | | | – | | | | – | | | | – | | | | (4.88 | ) | | | (0.37 | ) | | | – | |
Total distributions | | | (0.13 | ) | | | (0.15 | ) | | | (0.33 | ) | | | (4.88 | ) | | | (0.44 | ) | | | – | |
| | | | | | |
REDEMPTION FEES ADDED TO PAID IN CAPITAL (NOTE 4) | | | 0.00 | (e) | | | – | | | | – | | | | – | | | | – | | | | – | |
Net increase/(decrease) in net asset value | | | 2.89 | | | | 1.89 | | | | 0.42 | | | | (6.55 | ) | | | 9.38 | | | | 3.27 | |
Net asset value, end of year | | $ | 21.30 | | | $ | 18.41 | | | $ | 16.52 | | | $ | 16.10 | | | $ | 22.65 | | | $ | 13.27 | |
| | | | | | | | | | | | | | | | | | | | | | | | | |
TOTAL RETURN(f) | | | 16.45 | % | | | 12.36 | % | | | 5.51 | %(d) | | | (13.41 | )% | | | 74.91 | % | | | 32.70 | % |
| | | | | | |
RATIOS/SUPPLEMENTAL DATA: | | | | | | | | | | | | | | | | | | | | | | | | |
Net assets, end of year (000s) | | $ | 41,054 | | | $ | 15,071 | | | $ | 9,744 | | | $ | 9,231 | | | $ | 22,303 | | | $ | 12,622 | |
Ratio of net investment income/ (loss) to average net assets | | | (0.03 | )% | | | 0.08 | %(g) | | | 1.20 | % | | | 0.62 | % | | | 1.06 | % | | | 1.07 | %(g) |
Ratio of expenses to average net assets including fee waivers and reimbursements | | | 1.53 | %(i) | | | 1.40 | %(g) | | | 1.40 | % | | | 1.47 | % | | | 1.55 | % | | | 1.55 | %(g) |
Ratio of expenses to average net assets excluding fee waivers and reimbursements | | | 1.85 | % | | | 1.86 | %(g) | | | 1.97 | % | | | 1.76 | % | | | 1.75 | % | | | 2.58 | %(g) |
Portfolio turnover(h) | | | 170 | % | | | 110 | % | | | 120 | % | | | 178 | % | | | 193 | % | | | 51 | % |
| (a) | Prior to the close of business on January 15, 2010, Class I of the Clough China Fund was known as Institutional Class of the Predecessor Fund. |
| (b) | Effective March 9, 2010, the Board approved changing the fiscal year-end of the Fund from July 31 to April 30. |
| (c) | Calculated using the average shares method. |
| (d) | Impact of payment by affiliate was less than $0.01 per share and 0.01%, respectively (See Note 2). |
| (e) | Less than $0.005 and $(0.005) per share. |
| (f) | Total returns are for the period indicated and have not been annualized. Total returns would have been lower had certain expenses not been waived during the period. Returns shown do not reflect the deduction of taxes that a shareholder would pay on Fund distributions or the redemption of Fund shares. |
| (h) | Portfolio turnover rate for periods of less than one full year have not been annualized. |
| (i) | Effective January 1, 2011, the net expense ratio limitation changed from 1.40% to 1.70%. |
See Notes to Financial Statements.
88 | April 30, 2011
| | | | |
Financial Highlights |
| | | Selected data for a share of beneficial interest outstanding throughout the periods indicated: |
| | | | | | | | | | |
| | | RiverFront Long-Term Growth Fund - Class A |
| | | For the Period January 1, 2011 to April 30, 2011(a) | | For the Period September 27, 2010 (Inception) to December 31, 2010 |
| | |
Net asset value, beginning of period | | | $ | 14.66 | | | | $ | 13.68 | |
| | |
INCOME FROM INVESTMENT OPERATIONS: | | | | | | | | | | |
Net investment income after reimbursements(b) | | | | 0.00 | (c) | | | | 0.23 | |
Net realized and unrealized gain | | | | 0.99 | | | | | 1.03 | |
Total from investment operations | | | | 0.99 | | | | | 1.26 | |
| | |
DISTRIBUTIONS: | | | | | | | | | | |
From net investment income after reimbursements | | | | – | | | | | (0.14 | ) |
From net realized gains | | | | – | | | | | (0.14 | ) |
Total distributions | | | | – | | | | | (0.28 | ) |
| | |
Net increase in net asset value | | | | 0.99 | | | | | 0.98 | |
Net asset value, end of year | | | $ | 15.65 | | | | $ | 14.66 | |
| | | | | | | | | | | |
TOTAL RETURN(d) | | | | 6.75 | % | | | | 9.22 | % |
| | |
RATIOS/SUPPLEMENTAL DATA: | | | | | | | | | | |
Net assets, end of year (000s) | | | $ | 12,307 | | | | $ | 1,934 | |
Ratio of net investment income after reimbursements to average net assets | | | | 0.06 | %(e) | | | | 6.20 | %(e) |
Ratio of expenses to average net assets including fee waivers and reimbursements (includes acquired fund fee reimbursements) | | | | 0.81 | %(e) | | | | 0.91 | %(e) |
Ratio of expenses to average net assets including fee waivers and reimbursements (excludes acquired fund fee reimbursements) | | | | 1.15 | %(e) | | | | 1.15 | %(e) |
Ratio of expenses to average net assets excluding fee waivers and reimbursements | | | | 1.58 | %(e) | | | | 2.15 | %(e) |
Portfolio turnover rate(f) | | | | 34 | % | | | | 99 | % |
| (a) | Effective March 8, 2011, the Board approved changing the fiscal year-end of the Fund from December 31 to April 30. |
| (b) | Calculated using the average shares method. |
| (c) | Less then $0.005 per share. |
| (d) | Total returns are for the period indicated and have not been annualized. Total returns would have been lower had certain expenses not been waived during the period. Returns shown do not reflect the deduction of taxes that a shareholder would pay on Fund distributions or the redemption of Fund shares. Returns shown exclude any applicable sales charges. |
| (f) | Portfolio turnover rate for periods less than one full year have not been annualized. |
See Notes to Financial Statements.
89 | April 30, 2011
| | | | |
| Financial Highlights |
| | | Selected data for a share of beneficial interest outstanding throughout the periods indicated: |
| | | | | | | | | | | | |
| | | RiverFront Long-Term Growth Fund - Class C |
| | | For the Period January 1, 2011 to Apr il 30, 2011(a) | | For the Period September 27, 2010 (Inception) to December 31, 2010 |
Net asset value, beginning of period | | | $ 14.63 | | | | | | $ 13.68 | | | |
| | | | |
INCOME/(LOSS) FROM INVESTMENT OPERATIONS: | | | | | | | | | | | | |
Net investment income/(loss)after reimbursements(b) | | | (0.04 | ) | | | | | 0.20 | | | |
Net realized and unrealized gain | | | 1.01 | | | | | | 1.02 | | | |
Total from investment operations | | | 0.97 | | | | | | 1.22 | | | |
| | | | |
DISTRIBUTIONS: | | | | | | | | | | | | |
From net investment income after reimbursements | | | – | | | | | | (0.13 | ) | | |
From net realized gains | | | – | | | | | | (0.14 | ) | | |
Total distributions | | | – | | | | | | (0.27 | ) | | |
| | | | |
Net increase in net asset value | | | 0.97 | | | | | | 0.95 | | | |
Net asset value, end of year | | | $ 15.60 | | | | | | $ 14.63 | | | |
| | | | | | | | | | | | | |
TOTAL RETURN(c) | | | 6.63 | % | | | | | 8.91 | % | | |
| | | | |
RATIOS/SUPPLEMENTAL DATA: | | | | | | | | | | | | |
Net assets, end of year (000s) | | | $ 6,156 | | | | | | $ 2,050 | | | |
Ratio of net investment income/(loss) after reimbursements to average net assets | | | (0.72 | )%(d) | | | | | 5.36 | %(d) | | |
Ratio of expenses to average net assets including fee waivers and reimbursements (includes acquired fund fee reimbursements) | | | 1.55 | %(d) | | | | | 1.66 | %(d) | | |
Ratio of expenses to average net assets including fee waivers and reimbursements (excludes acquired fund fee reimbursements) | | | 1.90 | %(d) | | | | | 1.90 | %(d) | | |
Ratio of expenses to average net assets excluding fee waivers and reimbursements | | | 2.33 | %(d) | | | | | 2.89 | %(d) | | |
Portfolio turnover rate(e) | | | 34 | % | | | | | 99 | % | | |
| (a) | Effective March 8, 2011, the Board approved changing the fiscal year-end of the Fund from December 31 to April 30. |
| (b) | Calculated using the average shares method. |
| (c) | Total returns are for the period indicated and have not been annualized. Total returns would have been lower had certain expenses not been waived during the period. Returns shown do not reflect the deduction of taxes that a shareholder would pay on Fund distributions or the redemption of Fund shares. Returns shown exclude any applicable sales charges. |
| (e) | Portfolio turnover rate for periods less than one full year have not been annualized. |
See Notes to Financial Statements.
90 | April 30, 2011
| | | | |
| Financial Highlights |
| | | Selected data for a share of beneficial interest outstanding throughout the periods indicated: |
| | | | | | | | | | | | |
| | | RiverFront Long-Term Growth Fund - Class I |
| | | For the Period January 1, 2011 to April 30, 2011(a) | | For the Period September 27, 2010
(Inception) to December 31, 2010 |
Net asset value, beginning of period | | | $ 14.65 | | | | | $ | 13.68 | | | |
| | | | |
INCOME FROM INVESTMENT OPERATIONS: | | | | | | | | | | | | |
Net investment income after reimbursements(b) | | | 0.01 | | | | | | 0.17 | | | |
Net realized and unrealized gain | | | 1.01 | | | | | | 1.09 | | | |
Total from investment operations | | | 1.02 | | | | | | 1.26 | | | |
| | | | |
DISTRIBUTIONS: | | | | | | | | | | | | |
From net investment income after reimbursements | | | – | | | | | | (0.15 | ) | | |
From net realized gains | | | – | | | | | | (0.14 | ) | | |
Total distributions | | | – | | | | | | (0.29 | ) | | |
Net increase in net asset value | | | 1.02 | | | | | | 0.97 | | | |
Net asset value, end of year | | | $ 15.67 | | | | | $ | 14.65 | | | |
| | | | | | | | | | | | | |
TOTAL RETURN(c) | | | 7.04 | % | | | | | 9.12 | % | | |
| | | | |
RATIOS/SUPPLEMENTAL DATA: | | | | | | | | | | | | |
Net assets, end of year (000s) | | | $ 4,508 | | | | | $ | 2,280 | | | |
Ratio of net investment income after reimbursements to average net assets | | | 0.23 | %(d) | | | | | 4.70 | %(d) | | |
Ratio of expenses to average net assets including fee waivers and reimbursements (includes acquired fund fee reimbursements) | | | 0.61 | %(d) | | | | | 0.66 | %(d) | | |
Ratio of expenses to average net assets including fee waivers and reimbursements (excludes acquired fund fee reimbursements) | | | 0.90 | %(d) | | | | | 0.90 | %(d) | | |
Ratio of expenses to average net assets excluding fee waivers and reimbursements | | | 1.30 | %(d) | | | | | 1.74 | %(d) | | |
Portfolio turnover rate(e) | | | 34 | % | | | | | 99 | % | | |
| (a) | Effective March 8, 2011, the Board approved changing the fiscal year-end of the Fund from December 31 to April 30. |
| (b) | Calculated using the average shares method. |
| (c) | Total returns are for the period indicated and have not been annualized. Total returns would have been lower had certain expenses not been waived during the period. Returns shown do not reflect the deduction of taxes that a shareholder would pay on Fund distributions or the redemption of Fund shares. |
| (e) | Portfolio turnover rate for periods less than one full year have not been annualized. |
See Notes Financial Statements.
91 | April 30, 2011
| | | | |
Financial Highlights |
| | | Selected data for a share of beneficial interest outstanding throughout the periods indicated: |
| | | | | | | | | | | | | | | | | | | | | | | | |
| | | RiverFront Long-Term Growth Fund - Class L^ | | | |
| | | For the Period
January 1, 2011
to April 30,
2011(a) | | For the
Year Ended
December 31,
2010 | | For the Year Ended
December 31, 2009 | | For the Period
October 28,
2008 (Inception)
to December 31,
2008 |
Net asset value, beginning of period | | | $ 14.63 | | | | | | $ 13.22 | | | | | | $ 10.49 | | | | | $ | 10.00 | | | |
| | | | | | | | |
INCOME FROM INVESTMENT OPERATIONS: | | | | | | | | | | | | | | | | | | | | | | | | |
Net investment income after reimbursements(b) | | | 0.01 | | | | | | 0.18 | | | | | | 0.16 | | | | | | 0.12 | | | |
Net realized and unrealized gain | | | 1.01 | | | | | | 1.52 | | | | | | 2.66 | | | | | | 0.46 | | | |
Total from investment operations | | | 1.02 | | | | | | 1.70 | | | | | | 2.82 | | | | | | 0.58 | | | |
| | | | | | | | |
DISTRIBUTIONS: | | | | | | | | | | | | | | | | | | | | | | | | |
From net investment income after reimbursements | | | – | | | | | | (0.15 | ) | | | | | (0.09 | ) | | | | | (0.09 | ) | | |
From net realized gains | | | – | | | | | | (0.14 | ) | | | | | – | | | | | | – | | | |
Total distributions | | | – | | | | | | (0.29 | ) | | | | | (0.09 | ) | | | | | (0.09 | ) | | |
| | | | | | | | |
Net increase in net asset value | | | 1.02 | | | | | | 1.41 | | | | | | 2.73 | | | | | | 0.49 | | | |
Net asset value, end of year | | $ | 15.65 | | | | | $ | 14.63 | | | | | $ | 13.22 | | | | | $ | 10.49 | | | |
TOTAL RETURN(c) | | | 6.97 | % | | | | | 12.87 | % | | | | | 26.86 | % | | | | | 5.81 | % | | |
| | | | | | | | | | | | | | | | | | | | | | | | | |
| | | | | | | | |
RATIOS/SUPPLEMENTAL DATA: | | | | | | | | | | | | | | | | | | | | | | | | |
Net assets, end of year (000s) | | $ | 42,977 | | | | | $ | 43,240 | | | | | $ | 27,763 | | | | | $ | 7,439 | | | |
Ratio of net investment income after reimbursements to average net assets | | | 0.19 | %(d) | | | | | 1.33 | % | | | | | 1.34 | % | | | | | 7.55 | %(d) | | |
Ratio of expenses to average net assets including fee waivers and reimbursements (includes acquired fund fee reimbursements) | | | 0.64 | %(d) | | | | | 0.66 | % | | | | | N/A | | | | | | N/A | | | |
Ratio of expenses to average net assets including fee waivers and reimbursements (excludes acquired fund fee reimbursements) | | | 0.90 | %(d) | | | | | 0.90 | % | | | | | 0.90 | % | | | | | 0.90 | %(d) | | |
Ratio of expenses to average net assets excluding fee waivers and reimbursements | | | 1.28 | %(d) | | | | | 1.22 | % | | | | | 1.53 | % | | | | | 4.97 | %(d) | | |
Portfolio turnover rate(e) | | | 34 | % | | | | | 99 | % | | | | | 67 | % | | | | | 13 | % | | |
| ^ | Prior to close of business on September 24, 2010, Class L was known as Institutional Class of the Predecessor Fund. |
| (a) | Effective March 8, 2011, the Board approved changing the fiscal year-end of the Fund from December 31 to April 30. |
| (b) | Calculated using the average shares method. |
| (c) | Total returns are for the period indicated and have not been annualized. Total returns would have been lower had certain expenses not been waived during the period. Returns shown do not reflect the deduction of taxes that a shareholder would pay on Fund distributions or the redemption of Fund shares. |
| (e) | Portfolio turnover rate for periods less than one full year have not been annualized. |
See Notes to Financial Statements.
92 | April 30, 2011
| | | | |
Financial Highlights |
| | | Selected data for a share of beneficial interest outstanding throughout the periods indicated: |
| | | | | | | | | | | | | | | | | | | | | | | | | | |
| | | RiverFront Long-Term Growth Fund - Investor Class | | | | |
| | | For the Period
January 1, 2011
to April 30,
2011(a) | | For the Year Ended
December 31, 2010 | | For the Year Ended
December 31,
2009 | | For the Period
October 28,
2008 (Inception)
to December 31,
2008 | |
Net asset value, beginning of period | | | $ 14.59 | | | | | | $ 13.19 | | | | | | $ 10.49 | | | | | | $ 10.00 | | | | | |
| | | | | | | | |
INCOME/(LOSS) FROM INVESTMENT OPERATIONS: | | | | | | | | | | | | | | | | | | | | | | | | | | |
Net investment income/(loss)after reimbursements(b) | | | (0.00 | )(c) | | | | | 0.12 | | | | | | 0.13 | | | | | | 0.12 | | | | | |
Net realized and unrealized gain | | | 1.00 | | | | | | 1.54 | | | | | | 2.65 | | | | | | 0.46 | | | | | |
Total from investment operations | | | 1.00 | | | | | | 1.66 | | | | | | 2.78 | | | | | | 0.58 | | | | | |
| | | | | | | | |
DISTRIBUTIONS: | | | | | | | | | | | | | | | | | | | | | | | | | | |
From net investment income after reimbursements | | | – | | | | | | (0.12 | ) | | | | | (0.08 | ) | | | | | (0.09 | ) | | | | |
From net realized gains | | | – | | | | | | (0.14 | ) | | | | | – | | | | | | – | | | | | |
Total distributions | | | – | | | | | | (0.26 | ) | | | | | (0.08 | ) | | | | | (0.09 | ) | | | | |
| | | | | | | | |
Net increase in net asset value | | | 1.00 | | | | | | 1.40 | | | | | | 2.70 | | | | | | 0.49 | | | | | |
Net asset value, end of year | | | $ 15.59 | | | | | | $ 14.59 | | | | | | $ 13.19 | | | | | | $ 10.49 | | | | | |
| | | | | | | | | | | | | | | | | | | | | | | | | | | |
TOTAL RETURN(d) | | | 6.79 | % | | | | | 12.58 | % | | | | | 26.58 | % | | | | | 5.68 | % | | | | |
| | | | | | | | |
RATIOS/SUPPLEMENTAL DATA: | | | | | | | | | | | | | | | | | | | | | | | | | | |
Net assets, end of year (000s) | | | $ 21,270 | | | | | | $ 23,556 | | | | | | $ 13,882 | | | | | | $ 426 | | | | | |
Ratio of net investment income/(loss) after reimbursements to average net assets | | | (0.08 | )%(e) | | | | | 0.93 | % | | | | | 1.09 | % | | | | | 7.30 | %(e) | | | | |
Ratio of expenses to average net assets including fee waivers and reimbursements (includes acquired fund fee reimbursements) | | | 0.89 | %(e) | | | | | 0.91 | % | | | | | N/A | | | | | | N/A | | | | | |
Ratio of expenses to average net assets including fee waivers and reimbursements (excludes acquired fund fee reimbursements) | | | 1.15 | %(e) | | | | | 1.15 | % | | | | | 1.15 | % | | | | | 1.15 | %(e) | | | | |
Ratio of expenses to average net assets excluding fee waivers and reimbursements | | | 1.53 | %(e) | | | | | 1.47 | % | | | | | 1.78 | % | | | | | 5.22 | %(e) | | | | |
Portfolio turnover rate(f) | | | 34 | % | | | | | 99 | % | | | | | 67 | % | | | | | 13 | % | | | | |
| (a) | Effective March 8, 2011, the Board approved changing the fiscal year-end of the Fund from December 31 to April 30. |
| (b) | Calculated using the average shares method. |
| (c) | Less than $0.005 per share. |
| (d) | Total returns are for the period indicated and have not been annualized. Total returns would have been lower had certain expenses not been waived during the period. Returns shown do not reflect the deduction of taxes that a shareholder would pay on Fund distributions or the redemption of Fund shares. |
| (f) | Portfolio turnover rate for periods less than one full year have not been annualized. |
See Notes to Financial Statements.
93 | April 30, 2011
| | | | |
| Financial Highlights |
| | | Selected data for a share of beneficial interest outstanding throughout the period indicated: |
| | | | | | |
| | | RiverFront Long-Term Growth & Income Fund - Class A |
| | | For the Period August 2, 2010 (Inception) to April 30, 2011 |
Net asset value, beginning of period | | | $ 10.00 | | | |
| | |
INCOME FROM INVESTMENT OPERATIONS: | | | | | | |
Net investment income(a) | | | 0.12 | | | |
Net realized and unrealized gain | | | 1.67 | | | |
Total from investment operations | | | 1.79 | | | |
| | |
DISTRIBUTIONS: | | | | | | |
From net investment income | | | (0.06 | ) | | |
From net realized gains | | | (0.00 | )(b) | | |
Tax return of capital | | | (0.00 | )(b) | | |
Total distributions | | | (0.06 | ) | | |
| | |
Net increase in net asset value | | | 1.73 | | | |
Net asset value, end of year | | | $ 11.73 | | | |
| | | | | | | |
TOTAL RETURN(c) | | | 17.99 | % | | |
| | |
RATIOS/SUPPLEMENTAL DATA: | | | | | | |
Net assets, end of year (000s) | | | $ 5,723 | | | |
Ratio of net investment income to average net assets | | | 1.48 | %(d) | | |
Ratio of expenses to average net assets including fee waivers and reimbursements | | | 1.30 | %(d) | | |
Ratio of expenses to average net assets excluding fee waivers and reimbursements | | | 2.17 | %(d) | | |
Portfolio turnover rate(e) | | | 66 | % | | |
| (a) | Calculated using the average shares method. |
| (b) | Less than $0.005 per share. |
| (c) | Total returns are for the period indicated and have not been annualized. Total returns would have been lower had certain expenses not been waived during the period. Returns shown do not reflect the deduction of taxes that a shareholder would pay on Fund distributions or the redemption of Fund shares. Returns shown exclude any applicable sales charges. |
| (e) | Portfolio turnover rate for periods less than one full year have not been annualized. |
See Notes to Financial Statements.
94 | April 30, 2011
| | | | |
Financial Highlights |
| | | Selected data for a share of beneficial interest outstanding throughout the period indicated: |
| | | | | | |
| | | RiverFront Long-Term Growth & Income Fund - Class C |
| | | For the Period August 2, 2010 (Inception) to April 30, 2011 |
Net asset value, beginning of period | | | $ 10.00 | | | |
| | |
INCOME FROM INVESTMENT OPERATIONS: | | | | | | |
Net investment income(a) | | | 0.05 | | | |
Net realized and unrealized gain | | | 1.67 | | | |
Total from investment operations | | | 1.72 | | | |
| | |
DISTRIBUTIONS: | | | | | | |
From net investment income | | | (0.05 | ) | | |
From net realized gains | | | (0.00 | )(b) | | |
Tax return of capital | | | (0.00 | )(b) | | |
Total distributions | | | (0.05 | ) | | |
| | |
Net increase in net asset value | | | 1.67 | | | |
Net asset value, end of year | | | $ 11.67 | | | |
| | | | | | | |
TOTAL RETURN(c) | | | 17.32 | % | | |
| | |
RATIOS/SUPPLEMENTAL DATA: | | | | | | |
Net assets, end of year (000s) | | | $ 9,223 | | | |
Ratio of net investment income to average net assets | | | 0.65 | %(d) | | |
Ratio of expenses to average net assets including fee waivers and reimbursements | | | 2.05 | %(d) | | |
Ratio of expenses to average net assets excluding fee waivers and reimbursements | | | 3.10 | %(d) | | |
Portfolio turnover rate(e) | | | 66 | % | | |
| (a) | Calculated using the average shares method. |
| (b) | Less than $0.005 per share. |
| (c) | Total returns are for the period indicated and have not been annualized. Total returns would have been lower had certain expenses not been waived during the period. Returns shown do not reflect the deduction of taxes that a shareholder would pay on Fund distributions or the redemption of Fund shares. |
| (e) | Portfolio turnover rate for periods less than one full year have not been annualized. |
See Notes to Financial Statements.
95 | April 30, 2011
| | | | |
Financial Highlights |
| | | Selected data for a share of beneficial interest outstanding throughout the period indicated: |
| | | | | | |
| | | RiverFront Long-Term Growth & Income Fund - Class I |
| | | For the Period August 2, 2010 (Inception) to April 30, 2011 |
Net asset value, beginning of period | | | $ 10.00 | | | |
| | |
INCOME FROM INVESTMENT OPERATIONS: | | | | | | |
Net investment income(a) | | | 0.12 | | | |
Net realized and unrealized gain | | | 1.68 | | | |
Total from investment operations | | | 1.80 | | | |
| | |
DISTRIBUTIONS: | | | | | | |
From net investment income | | | (0.15 | ) | | |
From net realized gains | | | (0.00 | )(b) | | |
Tax return of capital | | | (0.01 | ) | | |
Total distributions | | | (0.16 | ) | | |
| | |
Net increase in net asset value | | | 1.64 | | | |
Net asset value, end of year | | | $ 11.64 | | | |
| | | | | | | |
TOTAL RETURN(c) | | | 18.21 | % | | |
| | |
RATIOS/SUPPLEMENTAL DATA: | | | | | | |
Net assets, end of year (000s) | | | $ 3,301 | | | |
Ratio of net investment income to averagenet assets | | | 1.49 | %(d) | | |
Ratio of expenses to average net assets including fee waivers and reimbursements | | | 1.05 | %(d) | | |
Ratio of expenses to average net assets excluding fee waivers and reimbursements | | | 2.44 | %(d) | | |
Portfolio turnover rate(e) | | | 66 | % | | |
| (a) | Calculated using the average shares method. |
| (b) | Less than $0.005 per share. |
| (c) | Total returns are for the period indicated and have not been annualized. Total returns would have been lower had certain expenses not been waived during the period. Returns shown do not reflect the deduction of taxes that a shareholder would pay on Fund distributions or the redemption of Fund shares. |
| (e) | Portfolio turnover rate for periods less than one full year have not been annualized. |
See Notes to Financial Statements
96 | April 30, 2011
| | | | |
Financial Highlights |
| | | Selected data for a share of beneficial interest outstanding throughout the period indicated: |
| | | | | | |
| | | RiverFront Moderate Growth Fund - Class A |
| | | For the Period August 2, 2010 (Inception) to April 30, 2011 |
Net asset value, beginning of period | | | $ 10.00 | | | |
| | |
INCOME FROM INVESTMENT OPERATIONS: | | | | | | |
Net investment income(a) | | | 0.10 | | | |
Net realized and unrealized gain | | | 1.61 | | | |
Total from investment operations | | | 1.71 | | | |
| | |
DISTRIBUTIONS: | | | | | | |
From net investment income | | | (0.05 | ) | | |
Total distributions | | | (0.05 | ) | | |
| | |
Net increase in net asset value | | | 1.66 | | | |
Net asset value, end of year | | | $ 11.66 | | | |
| | | | | | | |
TOTAL RETURN(b) | | | 17.12 | % | | |
| | |
RATIOS/SUPPLEMENTAL DATA: | | | | | | |
Net assets, end of year (000s) | | | $ 4,686 | | | |
Ratio of net investment income to average net assets | | | 1.16 | %(c) | | |
Ratio of expenses to average net assets including fee waivers and reimbursements | | | 1.30 | %(c) | | |
Ratio of expenses to average net assets excluding fee waivers and reimbursements | | | 3.00 | %(c) | | |
Portfolio turnover rate(d) | | | 77 | % | | |
| (a) | Calculated using the average shares method. |
| (b) | Total returns are for the period indicated and have not been annualized. Total returns would have been lower had certain expenses not been waived during the period. Returns shown do not reflect the deduction of taxes that a shareholder would pay on Fund distributions or the redemption of Fund shares. Returns shown exclude any applicable sales charges. |
| (d) | Portfolio turnover rate for periods less than one full year have not been annualized. |
See Notes to Financial Statements.
97 | April 30, 2011
| | | | |
Financial Highlights |
| | | Selected data for a share of beneficial interest outstanding throughout the period indicated: |
| | | | | | |
| | | RiverFront Moderate Growth Fund - Class C |
| | | For the Period August 2, 2010 (Inception) to April 30, 2011 |
Net asset value, beginning of period | | | $ 10.00 | | | |
| | |
INCOME FROM INVESTMENT OPERATIONS: | | | | | | |
Net investment income(a) | | | 0.00 | (b) | | |
Net realized and unrealized gain | | | 1.65 | | | |
Total from investment operations | | | 1.65 | | | |
| | |
DISTRIBUTIONS: | | | | | | |
From net investment income | | | (0.01 | ) | | |
Total distributions | | | (0.01 | ) | | |
| | |
Net increase in net asset value | | | 1.64 | | | |
Net asset value, end of year | | | $ 11.64 | | | |
| | | | | | | |
TOTAL RETURN(c) | | | 16.52 | % | | |
| | |
RATIOS/SUPPLEMENTAL DATA: | | | | | | |
Net assets, end of year (000s) | | | $ 8,926 | | | |
Ratio of net investment income to average net assets | | | 0.04 | %(d) | | |
Ratio of expenses to average net assets including fee waivers and reimbursements | | | 2.05 | %(d) | | |
Ratio of expenses to average net assets excluding fee waivers and reimbursements | | | 3.21 | %(d) | | |
Portfolio turnover rate(e) | | | 77 | % | | |
| (a) | Calculated using the average shares method. |
| (b)�� | Less than $0.005 per share. |
| (c) | Total returns are for the period indicated and have not been annualized. Total returns would have been lower had certain expenses not been waived during the period. Returns shown do not reflect the deduction of taxes that a shareholder would pay on Fund distributions or the redemption of Fund shares. |
| (e) | Portfolio turnover rate for periods less than one full year have not been annualized. |
See Notes to Financial Statements.
98 | April 30, 2011
| | | | |
Financial Highlights |
| | | Selected data for a share of beneficial interest outstanding throughout the period indicated: |
| | | | | | |
| | | RiverFront Moderate Growth Fund - Class I |
| | | For the Period August 2, 2010 (Inception) to April 30, 2011 |
Net asset value, beginning of period | | | $ 10.00 | | | |
| | |
INCOME FROM INVESTMENT OPERATIONS: | | | | | | |
Net investment income(a) | | | 0.08 | | | |
Net realized and unrealized gain | | | 1.62 | | | |
Total from investment operations | | | 1.70 | | | |
| | |
DISTRIBUTIONS: | | | | | | |
From net investment income | | | (0.28 | ) | | |
Total distributions | | | (0.28 | ) | | |
| | |
Net increase in net asset value | | | 1.42 | | | |
Net asset value, end of year | | | $ 11.42 | | | |
| | | | | | | |
TOTAL RETURN(b) | | | 17.20 | % | | |
| | |
RATIOS/SUPPLEMENTAL DATA: | | | | | | |
Net assets, end of year (000s) | | | $ 1,905 | | | |
Ratio of net investment income to average net assets | | | 0.98 | %(c) | | |
Ratio of expenses to average net assets including fee waivers and reimbursements | | | 1.05 | %(c) | | |
Ratio of expenses to average net assets excluding fee waivers and reimbursements | | | 4.68 | %(c) | | |
Portfolio turnover rate(d) | | | 77 | % | | |
| (a) | Calculated using the average shares method. |
| (b) | Total returns are for the period indicated and have not been annualized. Total returns would have been lower had certain expenses not been waived during the period. Returns shown do not reflect the deduction of taxes that a shareholder would pay on Fund distributions or the redemption of Fund shares. |
| (d) | Portfolio turnover rate for periods less than one full year have not been annualized. |
See Notes to Financial Statements.
99 | April 30, 2011
| | | | |
Financial Highlights |
| | | Selected data for a share of beneficial interest outstanding throughout the period indicated: |
| | | | | | |
| | | RiverFront Moderate Growth & Income Fund - Class A |
| | | For the Period August 2, 2010 (Inception) to April 30, 2011 |
Net asset value, beginning of period | | | $ 10.00 | | | |
| | |
INCOME FROM INVESTMENT OPERATIONS: | | | | | | |
Net investment income(a) | | | 0.15 | | | |
Net realized and unrealized gain | | | 1.01 | | | |
Total from investment operations | | | 1.16 | | | |
| | |
DISTRIBUTIONS: | | | | | | |
From net investment income | | | (0.08 | ) | | |
From net realized gains | | | (0.00 | )(b) | | |
Total distributions | | | (0.08 | ) | | |
| | |
Net increase in net asset value | | | 1.08 | | | |
Net asset value, end of year | | | $ 11.08 | | | |
| | | | | | | |
TOTAL RETURN(c) | | | 11.70 | % | | |
| | |
RATIOS/SUPPLEMENTAL DATA: | | | | | | |
Net assets, end of year (000s) | | | $ 12,148 | | | |
Ratio of net investment income to average net assets | | | 1.89 | %(d) | | |
Ratio of expenses to average net assets including fee waivers and reimbursements | | | 1.30 | %(d) | | |
Ratio of expenses to average net assets excluding fee waivers and reimbursements | | | 1.64 | %(d) | | |
Portfolio turnover rate(e) | | | 69 | % | | |
| (a) | Calculated using the average shares method. |
| (b) | Less than $0.005 per share. |
| (c) | Total returns are for the period indicated and have not been annualized. Total returns would have been lower had certain expenses not been waived during the period. Returns shown do not reflect the deduction of taxes that a shareholder would pay on Fund distributions or the redemption of Fund shares. Returns shown exclude any applicable sales charges. |
| (e) | Portfolio turnover rate for periods less than one full year have not been annualized. |
See Notes to Financial Statements.
100 | April 30, 2011
| | | | |
Financial Highlights |
| | | Selected data for a share of beneficial interest outstanding throughout the periods indicated: |
| | | | | | |
| | | RiverFront Moderate Growth & Income Fund - Class C |
| | | For the Period August 2, 2010 (Inception) to April 30, 2011 |
Net asset value, beginning of period | | | $ 10.00 | | | |
| | |
INCOME FROM INVESTMENT OPERATIONS: | | | | | | |
Net investment income(a) | | | 0.10 | | | |
Net realized and unrealized gain | | | 1.02 | | | |
Total from investment operations | | | 1.12 | | | |
| | |
DISTRIBUTIONS: | | | | | | |
From net investment income | | | (0.06 | ) | | |
From net realized gains | | | (0.00 | )(b) | | |
Total distributions | | | (0.06 | ) | | |
| | |
Net increase in net asset value | | | 1.06 | | | |
Net asset value, end of year | | | $ 11.06 | | | |
| | | | | | | |
TOTAL RETURN(c) | | | 11.24 | % | | |
| | |
RATIOS/SUPPLEMENTAL DATA: | | | | | | |
Net assets, end of year (000s) | | | $ 24,061 | | | |
Ratio of net investment income to average net assets | | | 1.22 | %(d) | | |
Ratio of expenses to average net assets including fee waivers and reimbursements | | | 2.05 | %(d) | | |
Ratio of expenses to average net assets excluding fee waivers and reimbursements | | | 2.54 | %(d) | | |
Portfolio turnover rate(e) | | | 69 | % | | |
| (a) | Calculated using the average shares method. |
| (b) | Less than $0.005 per share. |
| (c) | Total returns are for the period indicated and have not been annualized. Total returns would have been lower had certain expenses not been waived during the period. Returns shown do not reflect the deduction of taxes that a shareholder would pay on Fund distributions or the redemption of Fund shares. |
| (e) | Portfolio turnover rate for periods less than one full year have not been annualized. |
See Notes to Financial Statements.
101 | April 30, 2011
| | | | |
Financial Highlights |
| | | Selected data for a share of beneficial interest outstanding throughout the period indicated: |
| | | | | | |
| | | RiverFront Moderate Growth & Income Fund - Class I |
| | | For the Period August 2, 2010 (Inception) to April 30, 2011 |
Net asset value, beginning of period | | | $ 10.00 | | | |
| | |
INCOME FROM INVESTMENT OPERATIONS: | | | | | | |
Net investment income(a) | | | 0.17 | | | |
Net realized and unrealized gain | | | 1.01 | | | |
Total from investment operations | | | 1.18 | | | |
| | |
DISTRIBUTIONS: | | | | | | |
From net investment income | | | (0.11 | ) | | |
From net realized gains | | | (0.00 | )(b) | | |
Total distributions | | | (0.11 | ) | | |
| | |
Net increase in net asset value | | | 1.07 | | | |
Net asset value, end of year | | | $ 11.07 | | | |
| | | | | | | |
TOTAL RETURN(c) | | | 11.92 | % | | |
| | |
RATIOS/SUPPLEMENTAL DATA: | | | | | | |
Net assets, end of year (000s) | | | $ 7,535 | | | |
Ratio of net investment income to average net assets | | | 2.16 | %(d) | | |
Ratio of expenses to average net assets including fee waivers and reimbursements | | | 1.05 | %(d) | | |
Ratio of expenses to average net assets excluding fee waivers and reimbursements | | | 1.55 | %(d) | | |
Portfolio turnover rate(e) | | | 69 | % | | |
| (a) | Calculated using the average shares method. |
| (b) | Less than $0.005 per share. |
| (c) | Total returns are for the period indicated and have not been annualized. Total returns would have been lower had certain expenses not been waived during the period. Returns shown do not reflect the deduction of taxes that a shareholder would pay on Fund distributions or the redemption of Fund shares. |
| (e) | Portfolio turnover rate for periods less than one full year have not been annualized. |
See Notes to Financial Statements.
102 | April 30, 2011
| | | | |
| Consolidated Financial Highlights |
| | | Selected data for a share of beneficial interest outstanding throughout the period indicated: |
| | | | | | |
| | | ALPS | Kotak India Growth Fund - Class A |
| | | For the Period February 14, 2011 (Inception) to April 30, 2011 |
Net asset value, beginning of period | | | $10.00 | | | |
| | |
INCOME/(LOSS) FROM INVESTMENT OPERATIONS: | | | | | | |
Net investment loss(a) | | | (0.04 | ) | | |
Net realized and unrealized gain | | | 0.39 | | | |
Total from investment operations | | | 0.35 | | | |
REDEMPTION FEES ADDED TO PAID-IN CAPITAL (NOTE 4) | | | 0.00 | (b) | | |
Net increase in net asset value | | | 0.35 | | | |
Net asset value, end of year | | | $10.35 | | | |
| | | | | | | |
TOTAL RETURN(c) | | | 3.40 | % | | |
| | |
RATIOS/SUPPLEMENTAL DATA: | | | | | | |
Net assets, end of year (000s) | | | $935 | | | |
Ratio of net investment loss to average net assets | | | (1.82 | )%(d) | | |
Ratio of expenses to average net assets including fee waivers and reimbursements | | | 2.00 | %(d) | | |
Ratio of expenses to average net assets excluding fee waivers and reimbursements | | | 69.96 | %(d) | | |
Portfolio turnover rate(e) | | | 9 | % | | |
| (a) | Calculated using the average shares method. |
| (b) | Less than $0.005 per share. |
| (c) | Total returns are for the period indicated and have not been annualized. Total returns would have been lower had certain expenses not been waived during the period. Returns shown do not reflect the deduction of taxes that a shareholder would pay on Fund distributions or the redemption of Fund shares. Returns shown exclude any applicable sales charges. |
| (e) | Portfolio turnover rate for periods less than one full year have not been annualized. |
See Notes to Financial Statements.
103 | April 30, 2011
| | | | |
| Consolidated Financial Highlights |
| | | Selected data for a share of beneficial interest outstanding throughout the period indicated: |
| | | | | | |
| | | ALPS | Kotak India Growth Fund - Class C |
| | | For the Period February 14, 2011 (Inception) to April 30, 2011 |
Net asset value, beginning of period | | | $ 10.00 | | | |
| | |
INCOME/(LOSS) FROM INVESTMENT OPERATIONS: | | | | | | |
Net investment loss(a) | | | (0.05 | ) | | |
Net realized and unrealized gain | | | 0.37 | | | |
Total from investment operations | | | 0.32 | | | |
| | |
Net increase in net asset value | | | 0.32 | | | |
Net asset value, end of year | | | $ 10.32 | | | |
| | | | | | | |
TOTAL RETURN(b) | | | 3.20 | % | | |
| | |
RATIOS/SUPPLEMENTAL DATA: | | | | | | |
Net assets, end of year (000s) | | | $ 466 | | | |
Ratio of net investment loss to average net assets | | | (2.42 | )%(c) | | |
Ratio of expenses to average net assets including fee waivers and reimbursements | | | 2.60 | %(c) | | |
Ratio of expenses to average net assets excluding fee waivers and reimbursements | | | 69.64 | %(c) | | |
Portfolio turnover rate(d) | | | 9 | % | | |
| (a) | Calculated using the average shares method. |
| (b) | Total returns are for the period indicated and have not been annualized. Total returns would have been lower had certain expenses not been waived during the period. Returns shown do not reflect the deduction of taxes that a shareholder would pay on Fund distributions or the redemption of Fund shares. Returns shown exclude any applicable sales charges. |
| (d) | Portfolio turnover rate for periods less than one full year have not been annualized. |
See Notes to Financial Statements.
104 | April 30, 2011
| | | | |
Consolidated Financial Highlights |
| | | Selected data for a share of beneficial interest outstanding throughout the period indicated: |
| | | | | | |
| | | ALPS | Kotak India Growth Fund - Class I |
| | | For the Period February 14, 2011 (Inception) to April 30, 2011 |
Net asset value, beginning of period | | | $ 10.00 | | | |
| | |
INCOME/(LOSS) FROM INVESTMENT OPERATIONS: | | | | | | |
Net investment loss(a) | | | (0.03 | ) | | |
Net realized and unrealized gain | | | 0.37 | | | |
Total from investment operations | | | 0.34 | | | |
Net increase in net asset value | | | 0.34 | | | |
| | |
Net asset value, end of year | | | $ 10.34 | | | |
| | | | | | | |
TOTAL RETURN(b) | | | 3.50 | % | | |
| | |
RATIOS/SUPPLEMENTAL DATA: | | | | | | |
Net assets, end of year (000s) | | | $ 568 | | | |
Ratio of net investment loss to average net assets | | | (1.36 | )%(c) | | |
Ratio of expenses to average net assets including fee waivers and reimbursements | | | 1.60 | %(c) | | |
Ratio of expenses to average net assets excluding fee waivers and reimbursements | | | 96.67 | %(c) | | |
Portfolio turnover rate(d) | | | 9 | % | | |
| (a) | Calculated using the average shares method. |
| (b) | Total returns are for the period indicated and have not been annualized. Total returns would have been lower had certain expenses not been waived during the period. Returns shown do not reflect the deduction of taxes that a shareholder would pay on Fund distributions or the redemption of Fund shares. |
| (d) | Portfolio turnover rate for periods less than one full year have not been annualized. |
See Notes to Financial Statements.
105 | April 30, 2011
| | | | |
Consolidated Financial Highlights |
| | | Selected data for a share of beneficial interest outstanding throughout the period indicated: |
| | | | |
| | | Jefferies Asset Management Commodity Strategy Allocation Fund - Class A |
| | | For the Period June 29, 2010 (Inception) to April 30, 2011 |
Net asset value, beginning of period | | $ 10.00 | | |
| | |
INCOME FROM INVESTMENT OPERATIONS: | | | | |
Net investment income(a) | | 0.12 | | |
Net realized and unrealized gain | | 4.87 | | |
Total from investment operations | | 4.99 | | |
| | |
DISTRIBUTIONS: | | | | |
From net investment income | | (0.71) | | |
Total distributions | | (0.71) | | |
| | |
REDEMPTION FEES ADDED TO PAID-IN CAPITAL (NOTE 4) | | 0.00(b) | | |
Net increase in net asset value | | 4.28 | | |
Net asset value, end of year | | $ 14.28 | | |
| | | | | |
TOTAL RETURN(c) | | 51.41% | | |
| | |
RATIOS/SUPPLEMENTAL DATA: | | | | |
Net assets, end of year (000s) | | $ 37,060 | | |
Ratio of net investment income to average net assets | | 1.08%(d) | | |
Ratio of expenses to average net assets including fee waivers and reimbursements | | 1.45%(d) | | |
Ratio of expenses to average net assets excluding fee waivers and reimbursements | | 2.59%(d) | | |
Portfolio turnover rate(e) | | 59% | | |
| (a) | Calculated using the average shares method. |
| (b) | Less than $0.005 and $(0.005) per share. |
| (c) | Total returns are for the period indicated and have not been annualized. Total returns would have been lower had certain expenses not been waived during the period. Returns shown do not reflect the deduction of taxes that a shareholder would pay on Fund distributions or the redemption of Fund shares. Returns shown exclude any applicable sales charges. |
| (e) | Portfolio turnover rate for periods less than one full year have not been annualized. |
See Notes to Financial Statements.
106 | April 30, 2011
| | | | |
Consolidated Financial Highlights |
| | | Selected data for a share of beneficial interest outstanding throughout the period indicated: |
| | | | | | |
| | | Jefferies Asset Management Commodity Strategy Allocation Fund - Class C |
| | | For the Period June 29, 2010 (Inception) to April 30, 2011 |
Net asset value, beginning of period | | | $ 10.00 | | | |
| | |
INCOME FROM INVESTMENT OPERATIONS: | | | | | | |
Net investment income(a) | | | 0.08 | | | |
Net realized and unrealized gain | | | 4.87 | | | |
Total from investment operations | | | 4.95 | | | |
| | |
DISTRIBUTIONS: | | | | | | |
From net investment income | | | (0.76 | ) | | |
Total distributions | | | (0.76 | ) | | |
| | |
REDEMPTION FEES ADDED TO PAID-IN CAPITAL (NOTE 4) | | | 0.00 | (b) | | |
Net increase in net asset value | | | 4.19 | | | |
Net asset value, end of year | | | $ 14.19 | | | |
| | | | | | | |
TOTAL RETURN(c) | | | 50.90 | % | | |
| | |
RATIOS/SUPPLEMENTAL DATA: | | | | | | |
Net assets, end of year (000s) | | | $ 7,352 | | | |
Ratio of net investment income to average net assets | | | 0.72 | %(d) | | |
Ratio of expenses to average net assets including fee waivers and reimbursements | | | 2.05 | %(d) | | |
Ratio of expenses to average net assets excluding fee waivers and reimbursements | | | 4.00 | %(d) | | |
Portfolio turnover rate(e) | | | 59 | % | | |
| (a) | Calculated using the average shares method. |
| (b) | Less than $0.005 per share. |
| (c) | Total returns are for the period indicated and have not been annualized. Total returns would have been lower had certain expenses not been waived during the period. Returns shown do not reflect the deduction of taxes that a shareholder would pay on Fund distributions or the redemption of Fund shares. Returns shown exclude any applicable sales charges. |
| (e) | Portfolio turnover rate for periods less than one full year have not been annualized. |
See Notes to Financial Statements.
107 | April 30, 2011
| | | | |
Consolidated Financial Highlights |
| | | Selected data for a share of beneficial interest outstanding throughout the period indicated: |
| | | | | | |
| | | Jefferies Asset Management Commodity Strategy Allocation Fund - Class I |
| | | For the Period June 29, 2010 (Inception) to April 30, 2011 |
Net asset value, beginning of period | | | $ 10.00 | | | |
| | |
INCOME FROM INVESTMENT OPERATIONS: | | | | | | |
Net investment income(a) | | | 0.13 | | | |
Net realized and unrealized gain | | | 4.89 | | | |
Total from investment operations | | | 5.02 | | | |
| | |
DISTRIBUTIONS: | | | | | | |
From net investment income | | | (0.77 | ) | | |
Total distributions | | | (0.77 | ) | | |
| | |
REDEMPTION FEES ADDED TO PAID-IN CAPITAL (NOTE 4) | | | 0.00 | (b) | | |
Net increase in net asset value | | | 4.25 | | | |
Net asset value, end of year | | | $ 14.25 | | | |
| | | | | | | |
TOTAL RETURN(c) | | | 51.74 | % | | |
| | |
RATIOS/SUPPLEMENTAL DATA: | | | | | | |
Net assets, end of year (000s) | | | $ 73,630 | | | |
Ratio of net investment income to average net assets | | | 1.19 | %(d) | | |
Ratio of expenses to average net assets including fee waivers and reimbursements | | | 1.15 | %(d) | | |
Ratio of expenses to average net assets excluding fee waivers and reimbursements | | | 2.04 | %(d) | | |
Portfolio turnover rate(e) | | | 59 | % | | |
| (a) | Calculated using the average shares method. |
| (b) | Less than $0.005 per share. |
| (c) | Total returns are for the period indicated and have not been annualized. Total returns would have been lower had certain expenses not been waived during the period. Returns shown do not reflect the deduction of taxes that a shareholder would pay on Fund distributions or the redemption of Fund shares. Returns shown exclude any applicable sales charges. |
| (e) | Portfolio turnover rate for periods less than one full year have not been annualized. |
See Notes to Financial Statements.
108 | April 30, 2011
| | | | |
Notes to Financial Statements |
| | | April 30, 2011 |
1. ORGANIZATION
Financial Investors Trust (the “Trust”) was organized as a Delaware statutory trust on November 30, 1993 and registered as an open-end management investment company under the Investment Company Act of 1940, as amended (“1940 Act”). ALPS | Kotak India Growth Fund, ALPS | Red Rocks Listed Private Equity Fund, ALPS | WMC Value Intersection Fund (formerly Activa Value Fund), Clough China Fund, Jefferies Asset Management Commodity Strategy Allocation Fund, RiverFront Long-Term Growth Fund, RiverFront Long-Term Growth & Income Fund, RiverFront Moderate Growth Fund, and RiverFront Moderate Growth & Income Fund (each, a “Fund” and collectively, the “Funds”) are nine of eleven separate funds offered to the public under the Trust as of April 30, 2011. The Trust consists of eleven separate portfolios which include multiple classes of shares, with differing investment objectives and policies. Each class differs as to sales and redemption charges and ongoing fees. All classes of shares have identical rights to earnings, assets and voting privileges, except for class-specific expenses and exclusive rights to vote on matters affecting only individual classes. Class A shares of the Fund are subject to an initial sales charge of up to 5.50%. Class A shares and Class C shares of the Fund, as applicable, for which no initial sales charge was paid are subject to a contingent deferred sales charge of 1% if the shares are sold within twelve months after a purchase in excess of $1 million.
The classes differ principally in the applicable distribution and shareholder service fees. Shareholders of each class also bear certain expenses that pertain to that particular class. All shareholders bear the common expenses of the Fund and earn income and realized gains/losses from the Fund pro rata based on the average daily net assets of each class, without distinction between share classes. Dividends to shareholders are determined separately for each class based on income and expenses allocable to each class. Realized gain distributions to shareholders are allocated to each class pro rata based on the shares outstanding of each class on the date of distribution. Differences in per share dividend rates generally result from differences in separate class expenses, including distribution and shareholder service fees, if applicable.
On February 14, 2011, ALPS | Kotak India Growth Fund, (the "Kotak Fund") commenced operations.
On December 31, 2007, ALPS | Red Rocks Listed Private Equity Fund commenced operations.
On August 29, 2009, Activa Value Fund (“predecessor Activa Fund”) a series of the Activa Mutual Funds Trust, participated in a tax-free reorganization. Through the reorganization, the predecessor Activa Fund merged into the newly created Activa Value Fund series of the Trust. The Activa Value Fund has
carried over the historic performance and financial statements of the predecessor Activa Fund. The predecessor Activa Fund commenced operations on August 10, 1971. On September 1, 2010, the Activa Value Fund changed its name to ALPS | WMC Value Intersection Fund.
On January 16, 2010, Old Mutual China Fund (“predecessor China Fund”), a series of the Old Mutual Funds I, participated in a tax-free reorganization. Through the reorganization, the predecessor China Fund merged into the newly created Clough China Fund series of the Trust. The Clough China Fund has carried over the historic performance and financial statements of the predecessor China Fund. The predecessor China Fund commenced operations on December 30, 2005.
On June 29, 2010, Jefferies Asset Management Commodity Strategy Allocation Fund commenced operations.
On September 24, 2010, RiverFront Long-Term Growth Fund (the “Predecessor RiverFront Fund”), a series of Baird Funds, Inc., participated in a tax-free reorganization whereby the Predecessor RiverFront Fund merged into the newly created RiverFront Long-Term Growth Fund, a series of the Financial Investors Trust. For financial reporting purposes, the Predecessor RiverFront Fund was considered the acquirer and as such the Fund has carried over the historic performance and financial results of the Predecessor RiverFront Fund. The Predecessor RiverFront Fund commenced operations on October 28, 2008.
On August 2, 2010, RiverFront Long-Term Growth & Income Fund, RiverFront Moderate Growth Fund, and RiverFront Moderate Growth & Income Fund commenced operations.
Basis of Consolidation for the Kotak Fund
The Kotak Fund invests in the equity securities of Indian companies by investing in shares of a wholly owned, collective investment vehicle. The Kotak Mauritius Portfolio (the "Portfolio") is registered with and regulated by the Mauritius Financial Services Commission. The Portfolio was formed for the purpose of facilitating the Kotak Fund’s purchase of securities of a wide selection of Indian companies, consistent with the Kotak Fund’s investment strategies. The Portfolio is a private company limited by shares incorporated under the Mauritius Companies Act 2001. As a wholly owned subsidiary of the Kotak Fund, all assets and liabilities, income and expenses of the Portfolio are consolidated in the financial statements and financial highlights of the Kotak Fund. All investments held by the Portfolio are disclosed in the accounts of the Kotak Fund.
The Portfolio prices its portfolio investments pursuant to the same pricing and valuation methodologies and procedures used by the Kotak Fund, which require, among other things, that each of the Portfolio’s investments be marked-to-market (that is, the value
109 | April 30, 2011
| | | | |
Notes to Financial Statements |
| | | April 30, 2011 |
on the Portfolio’s books changes) each business day to reflect changes in the market value of each investment. The value of shares of the Portfolio fluctuates with the value of the Portfolio’s portfolio investments.
Basis of Consolidation for the Jefferies Asset
Management Commodity Strategy Allocation Fund
Jefferies Asset Management Cayman Commodity Fund Ltd. (the “Subsidiary”), a Cayman Islands exempted company, was incorporated on April 23, 2010 and is a wholly owned subsidiary of the Jefferies Asset Management Commodity Strategy Fund. The Subsidiary acts as an investment vehicle for the Fund in order to effect certain commodity-related investments on behalf of the Fund. The Fund is the sole shareholder of the Subsidiary pursuant to a subscription agreement dated as of June 14, 2010, and it is intended that the Fund will remain the sole shareholder and will continue to control the Subsidiary. Under the Articles of Association of the Subsidiary, shares issued by the Subsidiary confer upon a shareholder the right to vote at general meetings of the Subsidiary and certain rights in connection with any winding-up or repayment of capital, as well as the right to participate in the profits or assets of the Subsidiary. The Fund may invest up to 25% of its total assets in shares of the Subsidiary. As a wholly owned subsidiary of the Jefferies Asset Management Commodity Strategy Allocation Fund, all assets and liabilities, income and expenses of the Subsidiary are consolidated in the financial statements and financial highlights of the Fund. All investments held by the Subsidiary are disclosed in the accounts of the Jefferies Asset Management Commodity Strategy Allocation Fund.
The Subsidiary prices its portfolio investments pursuant to the same pricing and valuation methodologies and procedures used by the Fund, which require, among other things, that each of the Subsidiary’s portfolio investments be marked-to-market (that is, the value on the Subsidiary’s books changes) each business day to reflect changes in the market value of each investment. The value of shares of the Subsidiary fluctuates with the value of the Subsidiary’s portfolio investments.
2. SIGNIFICANT ACCOUNTING POLICIES
The following is a summary of significant accounting policies consistently followed by the Funds in the preparation of their financial statements. The accompanying financial statements were prepared in accordance with accounting principles generally accepted in the United States of America (“U.S. GAAP”). The preparation of financial statements in conformity with U.S. GAAP requires management to make certain estimates and assumptions that affect the reported amounts of assets and liabilities and disclosures of contingent assets and liabilities at the date of the financial statements and the reported amounts of revenue and expenses during the period. Actual results could differ from those estimates.
Investment Valuation: The Funds generally value their securities based on market prices determined at the close of regular trading on the New York Stock Exchange (“NYSE”), normally 4:00 p.m. Eastern Time, on each day the NYSE is open for trading. A Fund's net asset value (“NAV”) is computed by dividing the value of all assets of the Fund (including accrued interest and dividends), less all liabilities (including accrued expenses and dividends declared but unpaid), by the total number of shares outstanding.
For equity securities and funds that are traded on an exchange, the market price is usually the closing sale or official closing price on that exchange. In the case of equity securities not traded on an exchange, or if such closing prices are not otherwise available, the market price is typically determined by independent third party pricing vendors approved by the Board of Trustees (the “Board”) using a variety of pricing techniques and methodologies. The market price for debt obligations is generally the price supplied by an independent third-party pricing service approved by the Board, which may use a matrix, formula or other objective method that takes into consideration market indices, yield curves and other specific adjustments. Short–term debt obligations that will mature in 60 days or less are valued at amortized cost, unless it is determined that using this method would not reflect an investment’s fair value. If vendors are unable to supply a price, or if the price supplied is deemed to be unreliable, the market price may be determined using quotations received from one or more brokers–dealers that make a market in the security. Investments in non-exchange traded funds are fair valued at their respective net asset values.
Futures and swap contracts that are listed or traded on a national securities exchange, commodities exchange, contract market or comparable over the counter market, and that are freely transferable, are valued at their closing settlement price on the exchange on which they are primarily traded or based upon the current settlement price for a like instrument acquired on the day on which the instrument is being valued. A settlement price may not be used if the market makes a limit move with respect to a particular commodity. Over-the-counter futures and swap contracts for which market quotations are readily available are valued based on quotes received from independent pricing services or one or more dealers that make markets in such securities.
Portfolio securities that are primarily traded on foreign securities exchanges are valued at the preceding closing values of such securities on their respective exchanges, except when an occurrence subsequent to the time a value was so established is likely to have changed such value. In such an event, the fair values of those securities are determined in good faith through consideration of other factors in accordance with procedures established by and under the general supervision of the Board.
Forward currency exchange contracts have a market value determined by the prevailing foreign currency exchange daily rates and current foreign currency exchange forward rates. The foreign currency exchange forward rates are calculated using
110 | April 30, 2011
| | | | |
Notes to Financial Statements |
| | | April 30, 2011 |
an automated system that estimates rates on the basis of the current day foreign currency exchange rates and forward foreign currency exchange rates supplied by a pricing service. Foreign exchange rates and forward foreign currency exchange rates may generally be obtained at the close of the NYSE, normally 4:00 p.m. Eastern Time.
Redeemable securities issued by open-end registered investment companies are valued at the investment company’s applicable net asset value, with the exception of exchange-traded open-end investment companies, which are priced as equity securities.
When such prices or quotations are not available, or when the Fair Value Committee appointed by the Board believes that they are unreliable, securities may be priced using fair value procedures approved by the Board. The Funds may also use fair value procedures if the Fair Value Committee determines that a significant event has occurred between the time at which a market price is determined and the time at which a Fund’s NAV is calculated. In particular, the value of non-U.S. securities may be materially affected by events occurring after the close of the foreign exchange on which they are traded, but before a Fund prices its shares.
The Funds disclose the classification of their fair value measurements following a three-tier hierarchy based on the inputs used to measure fair value. Inputs refer broadly to the assumptions that market participants would use in pricing the asset or liability, including
assumptions about risk. Inputs may be observable or unobservable. Observable inputs reflect the assumptions market participants would use in pricing the asset or liability that are developed based on market data obtained from sources independent of the reporting entity. Unobservable inputs reflect the reporting entity’s own assumptions about the assumptions market participants would use in pricing the asset or liability that are developed based on the best information available.
Various inputs are used in determining the value of each Fund’s investments as of the end of the reporting period. When inputs used fall into different levels of the fair value hierarchy, the level in the hierarchy within which the fair value measurement falls is determined based on the lowest level input that is significant to the fair value measurement in its entirety. The designated input levels are not necessarily an indication of the risk or liquidity associated with these investments. These inputs are categorized in the following hierarchy under applicable financial accounting standards:
| | |
Level 1 – | | unadjusted quoted prices in active markets for identical investments |
| |
Level 2 – | | other significant observable inputs (including quoted prices for similar securities, interest rates, prepayment speeds, credit risk, etc.) |
| |
Level 3 – | | significant unobservable inputs (including the Fund’s own assumptions in determining the fair value of investments) |
The following is a summary of each Fund's investments/financial instruments in the fair value hierarchy as of April 30, 2011:
| | | | | | | | | | | | | | | | |
| Investments in Securities at Value | | Level 1 – Unadjusted Quoted Prices | | | Level 2 – Other Significant Observable Inputs | | | Level 3 – Significant
Unobservable Inputs | | | Total | |
| | |
| ALPS | Kotak India Growth Fund (a) | | | | | | | | | | | | |
Common Stocks - Consumer,
Non-cyclical | | $ | 12,433 | | | $ | 177,216 | | | $ | – | | | $ | 189,649 | |
Common Stocks - Financials | | | 18,662 | | | | 382,413 | | | | – | | | | 401,075 | |
Common Stocks - Industrials | | | 4,715 | | | | 154,974 | | | | – | | | | 159,689 | |
Other Common Stocks (b) | | | – | | | | 621,238 | | | | – | | | | 621,238 | |
Short Term Investments | | | 9,568 | | | | – | | | | – | | | | 9,568 | |
| | |
TOTAL | | $ | 45,378 | | | $ | 1,335,841 | | | $ | – | | | $ | 1,381,219 | |
| | |
Other Financial Instruments | | | | | | | | | | | | | | | | |
Liabilities: | | | | | | | | | | | | | | | | |
Futures Contracts (c) | | $ | (5,225 | ) | | | – | | | | – | | | $ | (5,225 | ) |
| | |
TOTAL | | $ | (5,225 | ) | | $ | – | | | $ | – | | | $ | (5,225 | ) |
| | |
ALPS | Red Rocks Listed Private Equity Fund | | | | | | | | | | | | | | | | |
Common Stocks (b) | | $ | 190,829,711 | | | $ | 1,486,771 | | | $ | – | | | $ | 192,316,482 | |
Short Term Investments | | | 2,865,261 | | | | – | | | | – | | | | 2,865,261 | |
| | |
TOTAL | | $ | 193,694,972 | | | $ | 1,486,771 | | | $ | – | | | $ | 195,181,743 | |
| | |
ALPS | WMC Value Intersection Fund (d) | | | | | | | | | | | | | | | | |
Common Stocks (b) | | $ | 76,780,324 | | | $ | – | | | $ | – | | | $ | 76,780,324 | |
Exchange Traded Funds | | | 927,827 | | | | – | | | | – | | | | 927,827 | |
Short Term Investments | | | 488,304 | | | | – | | | | – | | | | 488,304 | |
| | |
TOTAL | | $ | 78,196,455 | | | $ | – | | | $ | – | | | $ | 78,196,455 | |
| | |
111 | April 30, 2011
| | | | |
Notes to Financial Statements |
| | | April 30, 2011 |
| | | | | | | | | | | | | | | | |
| Investments in Securities at Value | | Level 1 –
Unadjusted
Quoted Prices | | | Level 2 –
Other Significant
Observable Inputs | | | Level 3 – Significant
Unobservable Inputs | | | Total | |
Clough China Fund | | | | | | | | | | | | | | | | |
Common Stocks - Consumer Discretionary | | $ | 2,501,463 | | | $ | 9,034,546 | | | $ | – | | | $ | 11,536,009 | |
Common Stocks - Energy | | | 2,844,439 | | | | 5,749,300 | | | | – | | | | 8,593,739 | |
Common Stocks - Industrials | | | – | | | | 9,446,616 | | | | – | | | | 9,446,616 | |
Common Stocks - Information Technology | | | 1,819,072 | | | | 11,997,465 | | | | – | | | | 13,816,537 | |
Other Common Stocks (b) | | | – | | | | 49,264,947 | | | | – | | | | 49,264,947 | |
Rights | | | 117,971 | | | | – | | | | – | | | | 117,971 | |
Short Term Investments | | | 5,113,117 | | | | – | | | | – | | | | 5,113,117 | |
TOTAL | | $ | 12,396,062 | | | $ | 85,492,874 | | | $ | – | | | $ | 97,888,936 | |
| | |
Jefferies Asset Management Commodity Strategy Allocation Fund | | | | | | | | | | | | | | | | |
Common Stocks (b) | | $ | 42,457,955 | | | $ | – | | | $ | – | | | $ | 42,457,955 | |
Exchange Traded Funds | | | 5,454,003 | | | | – | | | | – | | | | 5,454,003 | |
Warrant | | | 53 | | | | – | | | | – | | | | 53 | |
Government Bonds | | | – | | | | 65,727,011 | | | | – | | | | 65,727,011 | |
TOTAL | | $ | 47,912,011 | | | $ | 65,727,011 | | | $ | – | | | $ | 113,639,022 | |
| | |
Other Financial Instruments | | | | | | | | | | | | | | | | |
Assets: | | | | | | | | | | | | | | | | |
Futures Contracts (c) | | $ | 861,844 | | | $ | – | | | $ | – | | | $ | 861,844 | |
Total Return Swap Contracts | | | – | | | | 684,840 | | | | – | | | | 684,840 | |
Liabilities: | | | | | | | | | | | | | | | | |
Futures Contracts (c) | | | (634,216 | ) | | | – | | | | – | | | | (634,216 | ) |
Total Return Swap Contracts (c) | | | – | | | | (177,670 | ) | | | – | | | | (177,670 | ) |
TOTAL | | $ | 227,628 | | | $ | 507,170 | | | $ | – | | | $ | 734,798 | |
| | |
RiverFront Long-Term Growth Fund | | | | | | | | | | | | | | | | |
Common Stocks (b) | | $ | 30,945,406 | | | $ | – | | | $ | – | | | $ | 30,945,406 | |
Exchange Traded Funds | | | 51,181,500 | | | | – | | | | – | | | | 51,181,500 | |
Exchange Traded Notes | | | 2,497,704 | | | | – | | | | – | | | | 2,497,704 | |
Short Term Investments | | | 3,271,203 | | | | – | | | | – | | | | 3,271,203 | |
TOTAL | | $ | 87,895,813 | | | $ | – | | | $ | – | | | $ | 87,895,813 | |
| | |
RiverFront Long-Term Growth & Income Fund | | | | | | | | | | | | | | | | |
Common Stocks (b) | | $ | 6,077,186 | | | $ | – | | | $ | – | | | $ | 6,077,186 | |
Exchange Traded Funds | | | 11,033,093 | | | | – | | | | – | | | | 11,033,093 | |
Exchange Traded Notes | | | 563,186 | | | | – | | | | – | | | | 563,186 | |
Short Term Investments | | | 761,338 | | | | – | | | | – | | | | 761,338 | |
TOTAL | | $ | 18,434,803 | | | $ | – | | | $ | – | | | $ | 18,434,803 | |
| | |
RiverFront Moderate Growth Fund | | | | | | | | | | | | | | | | |
Common Stocks (b) | | $ | 4,700,690 | | | $ | – | | | $ | – | | | $ | 4,700,690 | |
Exchange Traded Funds | | | 9,568,924 | | | | – | | | | – | | | | 9,568,924 | |
Exchange Traded Notes | | | 452,293 | | | | – | | | | – | | | | 452,293 | |
Short Term Investments | | | 706,812 | | | | – | | | | – | | | | 706,812 | |
TOTAL | | $ | 15,428,719 | | | $ | – | | | $ | – | | | $ | 15,428,719 | |
| | |
RiverFront Moderate Growth & Income Fund | | | | | | | | | | | | | | | | |
Common Stocks (b) | | $ | 13,453,233 | | | $ | – | | | $ | – | | | $ | 13,453,233 | |
Exchange Traded Funds | | | 27,851,424 | | | | – | | | | – | | | | 27,851,424 | |
Exchange Traded Notes | | | 1,101,324 | | | | – | | | | – | | | | 1,101,324 | |
Short Term Investments | | | 1,503,635 | | | | – | | | | – | | | | 1,503,635 | |
TOTAL | | $ | 43,909,616 | | | $ | – | | | $ | – | | | $ | 43,909,616 | |
| | |
| (a) | Consolidated Fair Value measurements for ALPS | Kotak India Growth Fund is consolidated and includes the balances of Kotak Mauritius Portfolio (wholly-owned subsidiary). Accordingly, all interfund balances have been eliminated. |
| (b) | For detailed descriptions of sector and industry, see the accompanying Statement of Investments. |
| (c) | Only current day’s variation margin is reported within the Statement of Assets and Liabilities. The variation margin is included in the open futures cummulative appreciation/(depreciation) of $(5,225) and $227,678 for the ALPS | Kotak India Growth Fund and the Jefferies Asset Management Commodity Strategy Allocation Fund, respectively. |
| (d) | Prior to August 31, 2010, the ALPS | WMC Value Intersection Fund was known as the Activa Value Fund. |
112 | April 30, 2011
| | | | |
Notes to Financial Statements |
| | | April 30, 2011 |
For the period ended April 30, 2011, the Funds did not have any significant transfers between Level 1 and Level 2 securities, except the Clough China Fund. The Clough China Fund utilizes a fair value evaluation service with respect to international securities with an earlier market closing than the Fund’s net asset value computation cutoff. As such, international securities can transfer between Level 1 and Level 2 based on triggers being met without disclosure detailing the transfers into and out of Level 1 and Level 2.
Risk Exposure and the Use of Derivative Instruments: The Funds’ investment objectives not only permit the Funds to purchase investment securities, they also allow the Funds to enter in various types of derivatives contracts. In doing so, the Funds will employ strategies in differing combinations to permit them to increase, decrease, or change the level or types of exposure to market factors. Central to those strategies are features inherent in derivatives that make them more attractive for this purpose than equity or debt securities; they require little or no initial cash investment, they can focus exposure on only certain selected risk factors, and they may not require the ultimate receipt or delivery of the underlying security (or securities) to the contract. This may allow the Funds to pursue their objectives more quickly and efficiently than if they were to make direct purchases or sales of securities capable of affecting a similar response to market factors.
Risk Factors: In pursuit of its investment objectives, the Fund’s may seek to use derivatives to increase or decrease its exposure to the following risk factors:
Foreign Exchange Rate Risk: Foreign exchange rate risk relates to the change in the U.S. dollar value of a security held that is denominated in a foreign currency. The U.S. dollar value of a foreign currency denominated security will decrease as the dollar appreciates against the currency, while the U.S. dollar value will increase as the dollar depreciates against the currency.
Equity Risk: Equity risk relates to the change in value of equity securities as they relate to increases or decreases in the general market.
Risk of Investing in Derivatives: The Funds’ use of derivatives can result in losses due to unanticipated changes in the market risk factors and the overall market. In instances where the Funds are using derivatives to decrease, or hedge, exposures to market risk factors for securities held by the Funds, there are also risks that those derivatives may not perform as expected resulting in losses for the combined or hedged positions.
Derivatives may have little or no initial cash investment relative to their market value exposure and therefore can produce significant gains or losses in excess of their cost. This use of embedded leverage allows the Fund to increase its market value exposure relative to it net assets and can substantially increase the volatility of the Funds’ performance.
Additional associated risks from investing in derivatives also exist and potentially could have significant effects on the valuation of the derivative and the Funds. Typically, the associated risks are not the risks that the Funds are attempting to increase or decrease exposure to, per their investment objectives, but are the additional risks from investing in derivatives.
Examples of these associated risks are liquidity risk, which is the risk that the Funds will not be able to sell or close out the derivative in a timely manner, and counterparty credit risk, which is the risk that the counterparty will not fulfill its obligation to the Funds. Associated risks can be different for each type of derivative and are discussed by each derivative type in the notes that follow.
Swap Contracts: The Jefferies Asset Management Commodity Strategy Allocation Fund may enter into swap transactions for hedging purposes or to seek to increase total return. At the present time, the Jefferies Asset Management Commodity Strategy Allocation Fund primarily enters into swap transactions for the purpose of increasing total return. Risks may arise as a result of the failure of the counterparty to the swap contract to comply with the terms of the swap contract. The loss incurred by the failure of a counterparty is generally limited to the net payment to be received by the Jefferies Asset Management Commodity Strategy Allocation Fund and/or the termination value at the end of the contract.
Therefore, the Jefferies Asset Management Commodity Strategy Allocation Fund considers the creditworthiness of each counterparty to a contract in evaluating potential credit risk. Additionally, risks may arise from unanticipated movements in interest rates or in the value of the underlying reference asset or index. Entering into these agreements involves, to varying degrees, market risk, liquidity risk and elements of credit, legal and documentation risk that are not directly reflected in the amounts recognized in the Statements of Assets and Liabilities.
The Jefferies Asset Management Commodity Strategy Allocation Fund may pay or receive cash as collateral on these contracts which may be recorded as an asset and/or liability. The Jefferies Asset Management Commodity Strategy Allocation Fund must set aside liquid assets, or engage in other appropriate measures, to cover its obligations under these contracts. Swaps are marked to market daily using either pricing vendor quotations, counterparty prices or model prices and the change in value, if any, is recorded as an unrealized gain or loss. Upfront payments made and/or received by the Jefferies Asset Management Commodity Strategy Allocation Fund are recorded as an asset and/or liability and realized gains or losses are recognized ratably over the contract’s term/event, with the exception of forward starting interest rate swaps, whose realized gains or losses are recognized ratably from the effective start date. Periodic payments received or made on swap contracts are recorded as realized gains or losses. Gains or losses are realized upon termination of a swap contract and are recorded on the Statements of Operations.
113 | April 30, 2011
| | | | |
Notes to Financial Statements |
| | | April 30, 2011 |
The Jefferies Asset Management Commodity Strategy Allocation Fund invests in total return swaps. A total return swap is an agreement that gives a fund the right to receive the appreciation in the value of a specified security, index or other instrument in return for a fee paid to the counterparty, which will typically be an agreed upon interest rate. If the underlying asset declines in value over the term of the swap, a fund may also be required to pay the dollar value of that decline to the counterparty. Swap agreements held at April 30, 2011 are disclosed in the Statement of Investments.
The number of swap contracts held at April 30, 2011 is representative of swap contract activity during the period ended April 30, 2011.
Forward Foreign Currency Transactions: Each Fund may engage in currency transactions with counterparties to hedge the value of portfolio securities denominated in particular currencies against fluctuations in relative value, to gain or reduce exposure to certain currencies, or to generate income or gains. All commitments are marked to market daily at the applicable exchange rates and any resulting unrealized gains or losses are recorded in the Fund’s financial statements. Each Fund records realized gains or losses at the time a forward contract is offset by entry into a closing transaction or extinguished by delivery of the currency. None of the Funds had open forward foreign currency contracts at April 30, 2011.
Derivatives Instruments: The following tables disclose the amounts related to each Fund’s use of derivative instruments.
The effect of derivatives instruments on the Balance Sheet as of April 30, 2011:
| | | | | | | | | | | | |
| | | Asset Derivatives | | | Liability Derivatives | |
| Derivatives Instruments | | Balance Sheet Location | | Fair Value | | | Balance Sheet Location | | Fair Value | |
ALPS | Kotak India Growth Fund (a) | | | | | | | | | | |
Equity Contracts (futures) | | N/A | | $ | – | | | Payable for variation margin | | $ | 5,225 | |
Total | | | | $ | – | | | | | $ | 5,225 | |
| | |
Jefferies Asset Management Commodity Strategy Allocation Fund(b) | |
Equity Contracts (futures) | | Variation margin receivable | | $ | 861,844 | | | Payable for variation margin | | $ | 634,216 | |
Equity Contracts (swaps) | | Unrealized appreciation on total return swap contracts | | | 684,840 | | | Unrealized depreciation on total return swap contracts | | | 177,670 | |
Total | | | | $ | 1,546,684 | | | | | $ | 811,886 | |
| | |
The effect of derivatives instruments on the Statement of Operations for the period ended April 30, 2011:
| | | | | | | | | | |
| Derivatives Instruments | | Location of Gain/(Loss) On
Derivatives Recognized in Income | | Realized Gain On
Derivatives Recognized
in Income | | | Change in Unrealized Gain/(Loss) On Derivatives
Recognized in Income | |
ALPS | Kotak India Growth Fund (a) | | | | | | | | |
Equity Contracts (futures) | | Net realized gain on futures contracts/Net change in unrealized appreciation on investments, swaps and futures contracts | | $ | 899 | | | $ | (5,225 | ) |
Total | | | | $ | 899 | | | $ | (5,225 | ) |
| | |
Jefferies Asset Management Commodity Strategy Allocation Fund(b) | |
Equity Contracts (futures) | | Net realized loss on futures contracts/Net change in unrealized appreciation on investments, swaps and futures contracts | | | (270,469 | ) | | | 227,628 | |
Equity Contracts (swaps) | | Net realized gain on total return swaps/Net change in unrealized appreciation on investments, swaps and futures contracts | | | 8,814,860 | | | | 507,170 | |
Total | | | | $ | 8,544,391 | | | $ | 734,798 | |
| | |
| (a) | Consolidated derivatives instruments for ALPS | Kotak India Growth Fund are consolidated and include the balances of Kotak Mauritius Portfolio (wholly-owned subsidiary). Accordingly, all interfund balances have been eliminated. |
| (b) | Consolidated derivatives instruments for Jefferies Asset Management Commodity Strategy Allocation Fund are consolidated and include the balances of Jefferies Asset Management Cayman Trust (wholly-owned subsidiary). Accordingly, all interfund balances have been eliminated. |
114 | April 30, 2011
| | | | |
Notes to Financial Statements |
| | | April 30, 2011 |
Futures: Certain Funds may invest in futures contracts in accordance with their investment objectives. Each Fund does so for a variety of reasons including for cash management, hedging or non-hedging purposes in an attempt to achieve investment returns consistent with the Fund’s investment objective. A futures contract provides for the future sale by one party and purchase by another party of a specified quantity of the security or other financial instrument at a specified price and time. A futures contract on an index is an agreement pursuant to which two parties agree to take or make delivery of an amount of cash equal to the difference between the value of the index at the close of the last trading day of the contract and the price at which the index contract was originally written. Futures transactions may result in losses in excess of the amount invested in the futures contract. There can be no guarantee that there will be a correlation between price movements in the hedging vehicle and in the portfolio securities being hedged. An incorrect correlation could result in a loss on both the hedged securities in a Fund and the hedging vehicle so that the portfolio return might have been greater had hedging not been attempted. There can be no assurance that a liquid market will exist at a time when a Fund seeks to close out a futures contract or a futures option position. Lack of a liquid market for any reason may prevent a Fund from liquidating an unfavorable position, and the Fund would remain obligated to meet margin requirements until the position is closed. In addition, a Fund could be exposed to risk if the counterparties to the contracts are unable to meet the terms of their contracts. With exchange traded futures, there is minimal counterparty credit risk to the Funds since futures are exchange traded and the exchange’s clearinghouse, as counterparty to all exchange traded futures, guarantees the futures against default.
When a purchase or sale of a futures contract is made by a Fund, the Fund is required to deposit with its custodian (or broker, if legally permitted) a specified amount of liquid assets (“initial margin”). The margin required for a futures contract is set by the exchange on which the contract is traded and may be modified during the term of the contract. The initial margin is in the nature of a performance bond or good faith deposit on the futures contract that is returned to a Fund upon termination of the contract, assuming all contractual obligations have been satisfied. Each day a Fund may pay or receive cash, called “variation margin,” equal to the daily change in value of the futures contract. Such payments or receipts are recorded for financial statement purposes as unrealized gains or losses by a Fund. Variation margin does not represent a borrowing or loan by a Fund but is instead a settlement between a Fund and the broker of the amount one would owe the other if the futures contract expired. When the contract is closed, a Fund records a realized gain or loss equal to the difference between the value of the contract at the time it was opened and the value at the time it was closed. As of April 30, 2011, ALPS| Kotak India Growth Fund and the Jefferies Asset Management Commodity Strategy Allocation Fund had futures contracts outstanding with an unrealized loss of $5,225 and a net unrealized gain of $227,628, respectively. The other Funds held no futures contracts at April 30, 2011. The number of futures contracts held at April 30, 2011 is representative of futures contracts activity during the period ended April 30, 2011.
Treasury Inflation Protected-Securities: The Funds may invest in treasury inflation protected securities (“TIPS”), including structured bonds in which the principal amount is adjusted daily to keep pace with inflation, as measured by the U.S. Consumer Pricing Index for Urban Consumers. The adjustments to principal due to inflation/ deflation are reflected as increases/decreases to interest income with a corresponding adjustment to cost. Such adjustments may have a significant impact on a Fund’s distributions and may result in a return of capital to shareholders. The repayment of the original bond principal upon maturity is guaranteed by the full faith and credit of the U.S. Government.
Investment Transactions: Investment and shareholder transactions are accounted for on the date the investments are purchased or sold (trade date). Realized gains and losses from investment transactions are reported on an identified cost basis. Interest income, which includes accretion of discounts, is accrued and recorded as earned. Dividend income is recognized on the ex-dividend date or for certain foreign securities, as soon as information is available to the Fund.
Foreign Securities: Each Fund may directly purchase securities of foreign issuers. Investing in securities of foreign issuers involves special risks not typically associated with investing in securities of U.S. issuers. The risks include possible reevaluation of currencies, the inability to repatriate foreign currency, less complete financial information about companies and possible future adverse political and economic developments. Moreover, securities of many foreign issuers and their markets may be less liquid and their prices more volatile than those of securities of comparable U.S. issuers.
Foreign Currency Translation: The books and records of the Funds are maintained in U.S. dollars. Investment valuations and other assets and liabilities initially expressed in foreign currencies are converted each business day into U.S. dollars based upon current exchange rates. Prevailing foreign exchange rates may generally be obtained at the close of the NYSE (normally, 4:00 p.m. Eastern time). The portion of realized and unrealized gains or losses on investments due to fluctuations in foreign currency exchange rates is not separately disclosed and is included in realized and unrealized gains or losses on investments, when applicable.
Foreign Currency Spot Contracts: The Funds may enter into foreign currency spot contracts to facilitate transactions in foreign securities or to convert foreign currency receipts into U.S. dollars. A foreign currency spot contract is an agreement between two parties to buy and sell currencies at the current market rate, for settlement generally within two business days. The U.S. dollar value of the contracts is determined using current currency exchange rates supplied by a pricing service. The contract is marked-to-market daily for settlements beyond one day and any change in market value is recorded as an unrealized gain or loss. When the contract is closed, the Fund records a realized gain or loss equal to the difference between the value on the open and close date. Losses may arise from changes in the value of the foreign currency, or if the counterparties do not perform under the contract’s terms. The maximum potential loss from such contracts is the aggregate face value in U.S. dollars at the time the contract was opened.
115 | April 30, 2011
| | | | |
Notes to Financial Statements |
| | | April 30, 2011 |
Trust Expenses: Some expenses of the Trust can be directly attributed to a Fund or a specific share class of a Fund. Expenses which cannot be directly attributed are apportioned among all Funds in the Trust based on average net assets of each share class within a Fund.
Payment by Affiliates: During the year ended July 31, 2009, the predecessor China Fund was reimbursed $1,000 by Clay Finlay LLC (the predecessor China Fund's former sub-adviser) for a trading error.
During the year ended April 30, 2011, the ALPS | Red Rocks Listed Private Equity Fund was reimbursed $2,088 by Red Rocks Capital LLC for a trading error.
Federal Income Taxes: The Funds comply with the requirements under Subchapter M of the Internal Revenue Code applicable to regulated investment companies and intend to distribute substantially all of their net taxable income and net capital gains, if any, each year. The Funds are not subject to income taxes to the extent such distributions are made.
As of and during the fiscal year ended April 30, 2011, the Funds did not have a liability for any unrecognized tax benefits in the accompanying financial statements. The Funds file income tax returns in the U.S. federal jurisdiction and Colorado. For the years ended December 31, 2006 through April 30, 2011 for the U.S. federal jurisdiction, for the years ended December 31, 2005
through December 31, 2008 for Michigan, and for the year ended April 30, 2011 for Colorado, the predecessor Activa Fund’s and the current ALPS | WMC Value Intersection Fund’s returns are still open to examination by the appropriate taxing authority. For the periods ended December 31, 2008 through December 31, 2010, the predecessor RiverFront Fund’s returns are still open to examination by the appropriate taxing authority.
Distributions to Shareholders: Each Fund, except the Jefferies Asset Management Commodity Strategy Allocation Fund, normally pays dividends and distributes capital gains, if any, on an annual basis. The Jefferies Asset Management Commodity Strategy Allocation Fund pays dividends, if any, on a quarterly basis and distributes capital gains annually. Income dividend distributions are derived from interest and other income each Fund receives from its investments, including distributions of short-term capital gains. Capital gain distributions are derived from gains realized when a Fund sells a security it has owned for more than a year. Each Fund may make additional distributions and dividends at other times if the portfolio manager believes doing so may be necessary for the Fund to avoid or reduce taxes. Net investment income/(loss) and net realized gain/(loss) may differ for financial statement and tax purposes. The character of distributions made during the year from net investment income or net realized gains may differ from its ultimate characterization for federal income tax purposes. Also, due to the timing of dividend distributions, the fiscal year in which amounts are distributed may differ from the fiscal year in which the income or realized gain were recorded by a Fund.
The tax character of distributions paid by the Funds for the fiscal year or period ended April 30, 2011 is as follows:
| | | | | | | | | | | | |
| | | Distributions paid from: | | | | |
| Fund | | Ordinary Income | | | Long-Term capital gain | | | Return of Capital | |
ALPS | Kotak India Growth Fund | | $ | – | | | $ | – | | | $ | – | |
ALPS | Red Rocks Listed Private Equity Fund | | | 8,999,998 | | | | – | | | | – | |
ALPS | WMC Value Intersection Fund | | | 575,001 | | | | – | | | | – | |
Clough China Fund | | | 352,105 | | | | 75,614 | | | | – | |
Jefferies Asset Management Commodity Strategy Allocation Fund | | | 2,192,934 | | | | – | | | | – | |
RiverFront Long-Term Growth Fund | | | – | | | | – | | | | – | |
RiverFront Long-Term Growth & Income Fund | | | 56,880 | | | | 5 | | | | 1,878 | |
RiverFront Moderate Growth Fund | | | 31,005 | | | | – | | | | – | |
RiverFront Moderate Growth & Income Fund | | | 210,053 | | | | 18 | | | | – | |
Components of Earnings: At April 30, 2011, permanent differences in book and tax accounting were reclassified. These differences had no effect on net assets and were primarily attributed to differences in the treatment of commodity related exchange-traded funds and certain other investments. The reclassifications were as follows:
| | | | | | | | | | | | |
| Fund | | Undistributed/
(Overdistributed) Net
Investment Income | | | Accumulated Net Realized Gain/(Loss) | | | Paid-in Capital | |
ALPS | Kotak India Growth Fund | | $ | (342 | ) | | $ | 954 | | | $ | (612 | ) |
ALPS | Red Rocks Listed Private Equity Fund | | | 5,430,327 | | | | (5,417,321 | ) | | | (13,006 | ) |
ALPS | WMC Value Intersection Fund | | | – | | | | – | | | | – | |
Clough China Fund | | | 662,670 | | | | (457,661 | ) | | | (205,009 | ) |
Jefferies Asset Management Commodity Strategy Allocation Fund | | | 8,594,885 | | | | (8,547,558 | ) | | | (47,327 | ) |
RiverFront Long-Term Growth Fund | | | (12,313 | ) | | | 12,313 | | | | – | |
RiverFront Long-Term Growth & Income Fund | | | (3,419 | ) | | | 3,742 | | | | (323 | ) |
RiverFront Moderate Growth Fund | | | 6,936 | | | | (6,757 | ) | | | (179 | ) |
RiverFront Moderate Growth & Income Fund | | | (7,875 | ) | | | 9,974 | | | | (2,099 | ) |
116 | April 30, 2011
| | | | |
Notes to Financial Statements |
| | | April 30, 2011 |
Post October Losses: Under current tax law, capital and currency losses realized after October 31 may be deferred and treated as occurring on the first day of the following fiscal year. The following capital or currency losses were deferred for the period ended April 30, 2011.
| | | | | | | | |
| Fund | | Capital Loss | | | Currency Loss | |
ALPS | Kotak India Growth Fund | | $ | 1,549 | | | $ | 984 | |
ALPS | Red Rocks Listed Private Equity Fund | | | – | | | | 65,244 | |
ALPS | WMC Value Intersection Fund | | | – | | | | – | |
Clough China Fund | | | – | | | | – | |
Jefferies Asset Management Commodity Strategy Allocation Fund | | | – | | | | – | |
RiverFront Long-Term Growth Fund | | | – | | | | – | |
RiverFront Long-Term Growth & Income Fund | | | 12,558 | | | | – | |
RiverFront Moderate Growth Fund | | | – | | | | – | |
RiverFront Moderate Growth & Income Fund | | | 20,817 | | | | – | |
As of April 30, 2011, the components of distributable earnings on a tax basis were as follows:
| | | | | | | | | | | | | | | | |
| Fund | | Accumulated
Capital Gain/(Loss)
Undistributed _ | | | Ordinary Income
Undistributed | | | Net Unrealized
Appreciation | | | Other Cumulative
Effect of Timing
Differences | |
ALPS | Kotak India Growth Fund | | $ | (1,549 | ) | | $ | 1,686 | | | $ | 28,230 | | | $ | 2,462 | |
ALPS | Red Rocks Listed Private Equity Fund | | | (8,314,055 | ) | | | 13,187,530 | | | | 19,844,617 | | | | (66,826 | ) |
ALPS | WMC Value Intersection Fund | | | (12,385,274 | ) | | | 167,434 | | | | 16,292,849 | | | | – | |
Clough China Fund | | | – | | | | – | | | | 16,428,374 | | | | – | |
Jefferies Asset Management Commodity Strategy Allocation Fund | | | 34 | | | | 7,174,872 | | | | 5,140,329 | | | | (226,055 | ) |
RiverFront Long-Term Growth Fund | | | 1,500,914 | | | | 2,007,326 | | | | 13,322,999 | | | | – | |
RiverFront Long-Term Growth & Income Fund | | | (12,558 | ) | | | – | | | | 1,285,724 | | | | – | |
RiverFront Moderate Growth Fund | | | 6,669 | | | | 8,003 | | | | 910,859 | | | | – | |
RiverFront Moderate Growth & Income Fund | | | (20,817 | ) | | | 28,354 | | | | 2,446,020 | | | | – | |
Capital Loss Carry Forwards: Accumulated capital losses noted below represent net capital loss carryovers as of April 30, 2011 that may be available to offset future realized capital gains and thereby reduce future taxable gains distributions. The following table shows the expiration dates of the carryovers.
| | | | | | | | | | | | |
| Fund | | Expiring
4/30/2016 | | | Expiring
4/30/2017 | | | Expiring
4/30/2018 | |
ALPS | Kotak India Growth Fund | | $ | – | | | $ | – | | | $ | – | |
ALPS | Red Rocks Listed Private Equity Fund | | | – | | | | – | | | | 8,314,055 | |
ALPS | WMC Value Intersection Fund | | | 9,604,992 | | | | 2,780,282 | | | | – | |
Clough China Fund | | | – | | | | – | | | | – | |
Jefferies Asset Management Commodity Strategy Allocation Fund | | | – | | | | – | | | | – | |
RiverFront Long-Term Growth Fund | | | – | | | | – | | | | – | |
RiverFront Long-Term Growth & Income Fund | | | – | | | | – | | | | – | |
RiverFront Moderate Growth Fund | | | – | | | | – | | | | – | |
RiverFront Moderate Growth & Income Fund | | | – | | | | – | | | | – | |
Unrealized Appreciation and Depreciation on Investments: As of April 30, 2011, the costs of investments for federal income tax purposes and accumulated net unrealized appreciation/(depreciation) on investments were as follows:
| | | | | | | | | | | | | | | | | | | | |
| Fund | | Gross
Appreciation
(excess of value
over tax cost) | | | Gross
Depreciation
(excess of tax
cost over value) | | | Net Appreciation/
(Depreciation) of
Foreign Currency
and Derivatives | | | Net Unrealized
Appreciation | | | Cost of
Investments for Income Tax Purposes | |
ALPS | Kotak India Growth Fund | | $ | 76,194 | | | $ | (43,199 | ) | | $ | (4,765 | ) | | $ | 28,230 | | | $ | 1,348,224 | |
ALPS | Red Rocks Listed Private Equity Fund | | | 21,269,271 | | | | (1,432,185 | ) | | | 7,531 | | | | 19,844,617 | | | | 175,344,657 | |
ALPS | WMC Value Intersection Fund | | | 17,671,474 | | | | (1,378,625 | ) | | | – | | | | 16,292,849 | | | | 61,903,606 | |
Clough China Fund | | | 17,458,507 | | | | (1,033,937 | ) | | | 3,804 | | | | 16,428,374 | | | | 81,464,366 | |
Jefferies Asset Management Commodity Strategy Allocation Fund | | | 4,937,583 | | | | (525,630 | ) | | | 728,376 | | | | 5,140,329 | | | | 109,227,069 | |
RiverFront Long-Term Growth Fund | | | 13,576,017 | | | | (253,018 | ) | | | – | | | | 13,322,999 | | | | 74,572,814 | |
RiverFront Long-Term Growth & Income Fund | | | 1,317,340 | | | | (31,616 | ) | | | – | | | | 1,285,724 | | | | 17,149,079 | |
RiverFront Moderate Growth Fund | | | 951,970 | | | | (41,111 | ) | | | – | | | | 910,859 | | | | 14,517,860 | |
RiverFront Moderate Growth & Income Fund | | | 2,524,016 | | | | (77,996 | ) | | | – | | | | 2,446,020 | | | | 41,463,596 | |
117 | April 30, 2011
| | | | |
Notes to Financial Statements |
| | | April 30, 2011 |
3. SECURITIES TRANSACTIONS
Purchases and sales of securities, excluding short-term securities during the fiscal year or period ended April 30, 2011 were as follows:
| | | | | | | | |
| Fund | | Purchases of
Securities | | | Proceeds from
Sales of Securities | |
ALPS | Kotak India Growth Fund (a) | | | $ 1,398,219 | | | | $ 64,638 | |
ALPS | Red Rocks Listed Private Equity Fund | | | 93,788,582 | | | | 55,448,649 | |
ALPS | WMC Value Intersection Fund (b) | | | 32,340,142 | | | | 26,433,269 | |
Clough China Fund | | | 152,301,639 | | | | 116,600,859 | |
Jefferies Asset Management Commodity Strategic Allocation Fund (c) | | | 68,943,968 | | | | 24,493,327 | |
RiverFront Long-Term Growth Fund | | | 36,879,762 | | | | 25,889,313 | |
RiverFront Long-Term Growth & Income Fund | | | 21,712,973 | | | | 5,307,152 | |
RiverFront Moderate Growth Fund | | | 18,646,311 | | | | 4,852,928 | |
RiverFront Moderate Growth & Income Fund | | | 55,389,690 | | | | 15,385,462 | |
Investment Transactions in U.S. Government Obligations for the period ended April 30, 2011 were as follows:
| | | | | | | | |
| Fund | | Purchases of
Securities | | | Proceeds from
Sales of Securities | |
Jefferies Asset Management Commodity Strategy Allocation Fund (c) | | $ | 71,975,081 | | | $ | 7,703,457 | |
| (a) | Purchases and Sales for ALPS | Kotak India Growth Fund is consolidated and includes the balances of Kotak Mauritius Portfolio (wholly- owned subsidiary). Accordingly, all interfund balances have been eliminated. |
| (b) | Prior to August 31, 2010, the ALPS | WMC Value Intersection Fund was known as the Activa Value Fund. |
| (c) | Purchases and Sales for the Jefferies Asset Management Commodity Strategy Allocation Fund are consolidated and include the balances of Jefferies Asset Management Cayman Trust (a wholly owned subsidiary of the Fund). |
4. CAPITAL SHARE TRANSACTIONS
Shares redeemed within 90 days of purchase may incur a 2% short-term redemption fee deducted from the redemption amount, with the exception of ALPS | WMC Value Intersection Fund, RiverFront Long-Term Growth Fund, RiverFront Long-Term Growth & Income Fund, RiverFront Moderate Growth Fund, and RiverFront Moderate Growth & Income Fund shares. For the fiscal year or period ended April 30, 2011, the amounts listed below were retained by the Funds. These amounts are reflected in “Shares redeemed” in the Statement of Changes in Net Assets.
| | | | | | |
| Fund | | Redemption Fee Retained |
ALPS | Kotak India Growth Fund – Class A Shares | | | $ 31 | | | |
ALPS | Red Rocks Listed Private Equity Fund – Class A Shares | | | 14,716 | | | |
ALPS | Red Rocks Listed Private Equity Fund – Class C Shares | | | 101 | | | |
ALPS | Red Rocks Listed Private Equity Fund – Class I Shares | | | 3,756 | | | |
Clough China Fund – Class A Shares | | | 3,906 | | | |
Clough China Fund – Class C Shares | | | 446 | | | |
Clough China Fund – Class I Shares | | | 180 | | | |
Jefferies Asset Management Commodity Strategy Allocation Fund – Class A Shares | | | 1,832 | | | |
Jefferies Asset Management Commodity Strategy Allocation Fund – Class C Shares | | | 108 | | | |
Jefferies Asset Management Commodity Strategy Allocation Fund – Class I Shares | | | 4,398 | | | |
118 | April 30, 2011
| | | | |
Notes to Financial Statements |
| | | April 30, 2011 |
Transactions in shares of capital stock for the last two fiscal years or period ended April 30, 2011 were as follows:
| | | | | | | | |
| | | ALPS | Kotak India Growth Fund | | | Jefferies Asset Management
Commodity Strategy Allocation Fund | |
| | | For the Period February 14, 2011 to April 30, 2011 | | | For the Period June 29, 2010 to April 30, 2011 | |
Class A | | | | | | | | |
Shares sold | | | 90,726 | | | | 3,046,349 | |
Dividends reinvested | | | – | | | | 36,215 | |
Shares redeemed | | | (380 | ) | | | (487,523 | ) |
Net increase in shares outstanding | | | 90,346 | | | | 2,595,041 | |
| | |
Class C | | | | | | | | |
Shares sold | | | 45,104 | | | | 622,478 | |
Dividends reinvested | | | – | | | | 10,639 | |
Shares redeemed | | | – | | | | (114,921 | ) |
Net increase in shares outstanding | | | 45,104 | | | | 518,196 | |
| | |
Class I | | | | | | | | |
Shares sold | | | 54,915 | | | | 5,511,506 | |
Dividends reinvested | | | – | | | | 71,054 | |
Shares redeemed | | | – | | | | (414,674 | ) |
Net increase in shares outstanding | | | 54,915 | | | | 5,167,886 | |
| | |
| |
| | | ALPS | Red Rocks Listed Private Equity Fund | |
| | | For the Year Ended April 30, 2011 | | | For the Year Ended April 30, 2010 | |
Class A | | | | | | | | |
Shares sold | | | 8,117,147 | | | | 6,906,283 | |
Dividends reinvested | | | 1,008,656 | | | | 1,155,886 | |
Shares redeemed | | | (2,716,528 | ) | | | (2,893,408 | ) |
Net increase in shares outstanding | | | 6,409,275 | | | | 5,168,761 | |
| | |
Class C (a) | | | | | | | | |
Shares sold | | | 390,859 | | | | N/A | |
Dividends reinvested | | | 12,715 | | | | N/A | |
Shares redeemed | | | (964 | ) | | | N/A | |
Net increase in shares outstanding | | | 402,610 | | | | N/A | |
| | |
Class I | | | | | | | | |
Shares sold | | | 5,769,906 | | | | 6,896,703 | |
Dividends reinvested | | | 263,265 | | | | 384,322 | |
Shares redeemed | | | (4,392,609 | ) | | | (2,206,417 | ) |
Net increase in shares outstanding | | | 1,640,562 | | | | 5,074,608 | |
| | |
Class R | | | | | | | | |
Shares sold | | | 28,026 | | | | 4,030 | |
Dividends reinvested | | | 716 | | | | 508 | |
Shares redeemed | | | (11,145 | ) | | | (735 | ) |
Net increase in shares outstanding | | | 17,597 | | | | 3,803 | |
| | |
| (a) | The Fund’s Class C shares commenced operations on July 2, 2010. |
119 | April 30, 2011
| | | | |
Notes to Financial Statements |
| | | April 30, 2011 |
| | | | | | | | | | | | |
| | | ALPS | WMC Value Intersection Fund(a) | |
| | | For the Year Ended
April 30, 2011 | | | For the Period January 1,
2010 to April 30, 2010 (b) | | | For the Year Ended
December 31, 2009 | |
Class A | | | | | | | | | | | | |
Shares sold | | | 229,623 | | | | 236,002 | | | | 433,024 | |
Dividends reinvested | | | 49,572 | | | | – | | | | 84,159 | |
Shares redeemed | | | (715,760 | ) | | | (3,133,694 | ) | | | (715,207 | ) |
Net decrease in shares outstanding | | | (436,565 | ) | | | (2,897,692 | ) | | | (198,024 | ) |
| | |
Class C (c) | | | | | | | | | | | | |
Shares sold | | | 1,572 | | | | N/A | | | | N/A | |
Dividends reinvested | | | 9 | | | | N/A | | | | N/A | |
Shares redeemed | | | (10 | ) | | | N/A | | | | N/A | |
Net increase in shares outstanding | | | 1,571 | | | | N/A | | | | N/A | |
| | |
Class I (d) | | | | | | | | | | | | |
Shares sold | | | 1,578,339 | | | | 217,071 | | | | 2,184,008 | |
Dividends reinvested | | | 22,156 | | | | – | | | | 28,213 | |
Shares redeemed | | | (489,424 | ) | | | (334,099 | ) | | | (468,350 | ) |
Net increase/(decrease) in shares outstanding | | | 1,111,071 | | | | (117,028 | ) | | | 1,743,871 | |
| | |
| |
| | | Clough China Fund | |
| | | For the Year Ended
April 30, 2011 | | | For the Period August 1,
2009 to April 30, 2010 (e) | | | For the Year Ended
July 31, 2009 (000s) | |
Class A | | | | | | | | | | | | |
Shares sold | | | 1,302,276 | | | | 1,255,330 | | | | 458 | |
Dividends reinvested | | | 6,645 | | | | 2,123 | | | | 10 | |
Shares redeemed | | | (762,675 | ) | | | (604,582 | ) | | | (679 | ) |
Net increase/(decrease) in shares outstanding | | | 546,246 | | | | 652,871 | | | | (211 | ) |
| | |
Class C | | | | | | | | | | | | |
Shares sold | | | 578,312 | | | | 118,832 | | | | 144 | |
Dividends reinvested | | | 69 | | | | – | | | | 1 | |
Shares redeemed | | | (184,236 | ) | | | (208,520 | ) | | | (276 | ) |
Net increase/(decrease) in shares outstanding | | | 394,145 | | | | (89,688 | ) | | | (131 | ) |
| | |
Class I (f) | | | | | | | | | | | | |
Shares sold | | | 1,242,194 | | | | 224,363 | | | | 1 | |
Dividends reinvested | | | 5,145 | | | | 4,881 | | | | 16 | |
Shares redeemed | | | (138,307 | ) | | | (216 | ) | | | (1 | ) |
Net increase in shares outstanding | | | 1,109,032 | | | | 229,028 | | | | 16 | |
| | |
Class Z (g) | | | | | | | | | | | | |
Shares sold | | | N/A | | | | 828,700 | | | | 507 | |
Dividends reinvested | | | N/A | | | | 5,297 | | | | 6 | |
Shares redeemed | | | N/A | | | | (1,543,589 | ) | | | (137 | ) |
Net increase/(decrease) in shares outstanding | | | N/A | | | | (709,592 | ) | | | 376 | |
| | |
| (a) | Prior to August 31, 2010, the ALPS | WMC Value Intersection Fund was known as the Activa Value Fund. |
| (b) | Effective March 9, 2010, the Board approved changing the fiscal year-end of the Fund from December 31 to April 30. |
| (c) | The Fund’s Class C shares commenced operations on July 2, 2010. |
| (d) | Prior to close of business August 28, 2009, Class I of the ALPS | WMC Value Intersection Fund was known as Class R of the Predecessor Fund. |
| (e) | Effective March 9, 2010, the Board approved changing the fiscal year-end of the Fund from July 31 to April 30. |
| (f) | Prior to the close of business on January 15, 2010, Class I of the Clough China Fund was known as Institutional Class of the Predecessor Fund. |
| (g) | As a result of the reorganization (Note 1), the Clough China Fund no longer offers Class Z shares. Effective as of the close of business January 15, 2010, holders of Class Z shares of the Predecessor Fund received Class A shares of the Fund. |
120 | April 30, 2011
| | | | |
Notes to Financial Statements |
| | | April 30, 2011 |
| | | | | | | | | | | | |
| | | RiverFront Long-Term Growth Fund | |
| | | For the Period January 1,
2011 to April 30, 2011(a) | | | For the Year Ended
December 31, 2010 | | | For the Year Ended
December 31, 2009 | |
Class A | | | | | | | | | | | | |
Shares sold | | | 661,721 | | | | 130,462 | | | | N/A | |
Dividends reinvested | | | – | | | | 2,115 | | | | N/A | |
Shares redeemed | | | (7,391 | ) | | | (627 | ) | | | N/A | |
Net increase in shares outstanding | | | 654,330 | | | | 131,950 | | | | N/A | |
| | |
Class C | | | | | | | | | | | | |
Shares sold | | | 267,185 | | | | 137,900 | | | | N/A | |
Dividends reinvested | | | – | | | | 2,219 | | | | N/A | |
Shares redeemed | | | (12,664 | ) | | | – | | | | N/A | |
Net increase in shares outstanding | | | 254,521 | | | | 140,119 | | | | N/A | |
| | |
Class I | | | | | | | | | | | | |
Shares sold | | | 136,221 | | | | 154,892 | | | | N/A | |
Dividends reinvested | | | – | | | | 744 | | | | N/A | |
Shares redeemed | | | (4,150 | ) | | | – | | | | N/A | |
Net increase in shares outstanding | | | 132,071 | | | | 155,636 | | | | N/A | |
| | |
Class L | | | | | | | | | | | | |
Shares sold | | | 230,991 | | | | 1,286,522 | | | | 1,709,014 | |
Dividends reinvested | | | – | | | | 55,257 | | | | 13,072 | |
Shares redeemed | | | (440,408 | ) | | | (486,215 | ) | | | (331,302 | ) |
Net increase/(decrease) in shares outstanding | | | (209,417 | ) | | | 855,564 | | | | 1,390,784 | |
| | |
Investor Class | | | | | | | | | | | | |
Shares sold | | | 45,758 | | | | 771,332 | | | | 1,060,950 | |
Dividends reinvested | | | – | | | | 25,694 | | | | 5,717 | |
Shares redeemed | | | (296,425 | ) | | | (234,795 | ) | | | (54,832 | ) |
Net increase/(decrease) in shares outstanding | | | (250,667 | ) | | | 562,231 | | | | 1,011,835 | |
| | |
| | | |
| | | RiverFront Long-Term Growth & Income Fund | | | RiverFront Moderate
Growth Fund | | | RiverFront Moderate Growth & Income Fund | |
| | | For the Period August 2, 2010 to April 30, 2011 | |
Class A | | | | | | | | | | | | |
Shares sold | | | 490,350 | | | | 415,659 | | | | 1,221,781 | |
Dividends reinvested | | | 1,515 | | | | 963 | | | | 5,387 | |
Shares redeemed | | | (4,028 | ) | | | (14,586 | ) | | | (131,124 | ) |
Net increase in shares outstanding | | | 487,837 | | | | 402,036 | | | | 1,096,044 | |
| | |
Class C | | | | | | | | | | | | |
Shares sold | | | 792,427 | | | | 769,684 | | | | 2,223,222 | |
Dividends reinvested | | | 1,704 | | | | 260 | | | | 6,978 | |
Shares redeemed | | | (3,727 | ) | | | (2,938 | ) | | | (53,903 | ) |
Net increase in shares outstanding | | | 790,404 | | | | 767,006 | | | | 2,176,297 | |
| | |
Class I | | | | | | | | | | | | |
Shares sold | | | 283,008 | | | | 174,619 | | | | 706,293 | |
Dividends reinvested | | | 2,023 | | | | 1,544 | | | | 4,959 | |
Shares redeemed | | | (1,529 | ) | | | (9,351 | ) | | | (30,836 | ) |
Net increase in shares outstanding | | | 283,502 | | | | 166,812 | | | | 680,416 | |
| | |
| (a) | Effective March 8, 2011, the Board approved changing the fiscal year–end of the Fund from December 31 to April 30. |
121 | April 30, 2011
| | | | |
Notes to Financial Statements |
| | | April 30, 2011 |
5. MANAGEMENT AND RELATED-PARTY TRANSACTIONS
ALPS Advisors, Inc. (“AAI” or “Adviser”), subject to the authority of the Board, is responsible for the overall management and administration of each Fund’s business affairs. AAI has delegated daily management of the Funds listed below to the corresponding sub-adviser listed in the table below. Each Sub-Adviser manages the investments of the Fund in accordance with its investment objective, policies and limitations and investment guidelines established jointly by the Adviser and the Board.
| | |
| Fund | | Sub-Adviser |
ALPS | Kotak India Growth Fund | | Kotak Mahindra (UK) Limited |
ALPS | Red Rocks Listed Private Equity Fund | | Red Rocks Capital LLC |
ALPS | WMC Value Intersection Fund | | Wellington Management Company, LLP |
Clough China Fund | | Clough Capital Partners, LP |
Jefferies Asset Management Commodity Strategy Allocation Fund | | Jefferies Asset Management, Inc. |
RiverFront Long-Term Growth Fund | | RiverFront Investment Group, LLC |
RiverFront Long-Term Growth & Income Fund | | RiverFront Investment Group, LLC |
RiverFront Moderate Growth Fund | | RiverFront Investment Group, LLC |
RiverFront Moderate Growth & Income Fund | | RiverFront Investment Group, LLC |
Pursuant to the Investment Advisory Agreement (the “Advisory Agreement”), each Fund pays the Adviser an annual management fee which is based on the Fund’s average daily net assets. The management fee is paid on a monthly basis. The following table reflects the Funds’ contractual management fee rates (expressed as an annual rate).
| | |
| Fund | | Contractual
Management Fee |
ALPS | Kotak India Growth Fund | | 1.25% |
ALPS | Red Rocks Listed Private Equity Fund | | 0.85% |
ALPS | WMC Value Intersection Fund | | 0.95%* |
Clough China Fund | | 1.35% |
Jefferies Asset Management Commodity Strategy Allocation Fund | | 0.85% |
RiverFront Long-Term Growth Fund | | 0.90% |
RiverFront Long-Term Growth & Income Fund | | 0.90% |
RiverFront Moderate Growth Fund | | 0.90% |
RiverFront Moderate Growth & Income Fund | | 0.90% |
| * | The contractual management fee is 0.95% for the first $250 million of net assets, 0.85% for the next $250 million of net assets, and 0.75% for net assets in excess of $500 million. |
Pursuant to an Investment Sub-advisory Agreement, the Adviser pays each sub-adviser an annual sub-advisory management fee which is based on each Fund’s average daily assets. The Adviser is required to pay all fees due to each sub-adviser out of the management fee the Adviser receives from each Fund. The following table reflects the Funds’ contractual sub-advisory fee rates.
| | | | |
| Fund | | Average Daily Net Assets of the Fund | | Contractual
Sub-Advisory
Fee |
ALPS | Kotak India
Growth Fund | | First $50 Million Over $50 Million | | 1.15%
1.05% |
ALPS | Red Rocks Listed Private Equity Fund | | All Asset Levels | | 0.57% |
ALPS | WMC Value
Intersection Fund | | First $250 Million $250 Million -$500 Million Over $500 Million | | 0.40%
0.40% 0.30% |
Clough China Fund | | All Asset Levels | | 0.90% |
Jefferies Asset Management Commodity Strategy Allocation Fund | | All Asset Levels | | 0.75% |
RiverFront Long-Term Growth Fund | | All Asset Levels | | 0.60% |
RiverFront Long-Term Growth & Income Fund | | All Asset Levels | | 0.60% |
RiverFront Moderate Growth Fund | | All Asset Levels | | 0.60% |
RiverFront Moderate Growth & Income Fund | | All Asset Levels | | 0.60% |
The Adviser has contractually agreed to limit the amount of each Fund’s total annual expenses (exclusive of distribution and service (12b-1) fees (except Clough China Class A, Class C, and Class I shares), shareholder service fees (except ALPS | Red Rocks Listed Private Equity Class A shares, ALPS | WMC Value Intersection Class A shares, and Clough China Class C shares), acquired fund fees and expenses, brokerage expenses, interest expense, short sale dividend expense, taxes and extraordinary expenses) that exceed the following annual rates below. These agreements are reevaluated on an annual basis. Without these agreements, expenses could be higher.
| | | | |
| Fund | | Expense
Limit % | | Term of Expense
Limit Agreement |
ALPS | Kotak India Growth Fund | | 1.60% | | 2/14/11- 8/31/12 |
ALPS | Red Rocks Listed Private Equity Fund | | 1.25% | | 3/9/10 - 8/31/11 |
ALPS | WMC Value Intersection Fund | | 1.15% | | 3/9/10 - 8/31/11 |
Clough China Fund - Class A Shares | | 1.95% | | 1/1/11 - 8/31/12 |
Clough China Fund - Class C Shares | | 2.70% | | 1/1/11 - 8/31/12 |
122 | April 30, 2011
| | | | |
Notes to Financial Statements |
| | | April 30, 2011 |
| | | | | | | | |
| Fund | | Expense
Limit % | | | Term of Expense
Limit Agreement | |
Clough China Fund - Class I Shares | | | 1.70 | % | | | 1/1/11 - 8/31/12 | |
Jefferies Asset Management Commodity Strategy Allocation Fund - Class A Shares and Class C Shares | | | 1.05 | % | | | 6/27/10 - 8/31/11 | |
Jefferies Asset Management Commodity Strategy Allocation Fund - Class I Shares | | | 1.15 | % | | | 6/27/10 - 8/31/11 | |
RiverFront Long-Term Growth Fund | | | 0.90 | % | | | 9/27/10 - 12/31/12 | |
RiverFront Long-Term Growth & Income Fund | | | 1.05 | % | | | 8/2/10 - 12/31/12 | |
RiverFront Moderate Growth Fund | | | 1.05 | % | | | 8/2/10 - 12/31/12 | |
RiverFront Moderate Growth & Income Fund | | | 1.05 | % | | | 8/2/10 - 12/31/12 | |
The Adviser and Sub-Adviser have contractually agreed to reimburse Acquired Fund Fees and Expenses of the RiverFront Long-Term Growth Fund.
The Adviser and the Sub-Adviser are permitted to recover expenses they have waived or reimbursed, on a class-by-class basis, through the agreements described above to the extent that expenses in later periods fall below the annual limits set forth in these agreements. The ALPS | Red Rocks Listed Private Equity Fund, ALPS | WMC Value Intersection Fund and Clough China Fund are not obligated to pay any such waived or reimbursed fees and expenses more than one year after the end of the fiscal year in which the fees or expenses were waived or reimbursed. The ALPS | Kotak India Growth Fund, Jefferies Asset Management Commodity Strategy Allocation Fund, RiverFront Long-Term Growth Fund, RiverFront Long-Term Growth & Income Fund, RiverFront Moderate Growth Fund and RiverFront Moderate Growth & Income Fund are not obligated to pay any such waived or reimbursed fees and expenses more than three years after the end of the fiscal year in which the fees or expenses were waived or reimbursed. At April 30, 2011, the Adviser and Sub-Adviser may seek reimbursement of previously waived and reimbursed fees as follows:
| | | | | | | | | | | | | | | | |
| Fund | | Expires
2012 | | | Expires
2013 | | | Expires
2014 | | | Total | |
ALPS | Kotak India Growth Fund | | | N/A | | | | N/A | | | $ | 110,596 | | | $ | 110,596 | |
ALPS | Red Rocks Listed Private Equity Fund | | $ | 213,644 | | | | N/A | | | | N/A | | | | 213,644 | |
| | | | | | | | | | | | | | | | |
| Fund | | Expires
2012 | | | Expires
2013 | | | Expires
2014 | | | Total | |
ALPS | WMC Value Intersection Fund | | $ | 189,671 | | | | N/A | | | | N/A | | | $ | 189,671 | |
Clough China Fund | | | 185,083 | | | | N/A | | | | N/A | | | | 185,083 | |
Jefferies Asset Management Commodity Strategy Allocation Fund | | | N/A | | | | N/A | | | | 298,479 | | | | 298,479 | |
RiverFront Long- Term Growth Fund | | | N/A | | | | 151,401 | | | | 171,374 | | | | 322,775 | |
RiverFront Long- Term Growth & Income Fund | | | N/A | | | | N/A | | | | 57,541 | | | | 57,541 | |
RiverFront Moderate Growth Fund | | | N/A | | | | N/A | | | | 72,197 | | | | 72,197 | |
RiverFront Moderate Growth & Income Fund | | | N/A | | | | N/A | | | | 70,572 | | | | 70,572 | |
Prior to close of business on September��24, 2010, the RiverFront Long-Term Growth Fund (the “Predecessor Fund”), a series of Baird Funds, Inc., had an Investment Advisory Agreement with Baird Funds, Inc. for the provision of investment advisory services. Pursuant to that agreement, Baird Funds, Inc. was entitled to receive a fee, calculated daily and payable monthly, at the annual rate of 0.65% of the Predecessor Fund’s average daily net assets. Baird Funds, Inc. also maintained a Sub-Advisory Agreement with RiverFront Investment Group, LLC under which the Sub-Adviser was responsible for daily management of the Predecessor Fund. Pursuant to that Sub-Advisory Agreement, Baird Funds, Inc. was responsible for paying a sub-advisory fee at an annual rate of 0.45% of the Predecessor Fund’s average daily net assets. This agreement was in effect with Baird Funds, Inc. until September 24, 2010 and is currently in effect with the Adviser and the Sub-Adviser through December 31, 2012 and will be reevaluated on an annual basis thereafter.
ALPS Fund Services, Inc. (“AFS”) serves as administrator to the RiverFront Long-Term Growth & Income Fund, RiverFront Moderate Growth Fund, and RiverFront Moderate Growth & Income Fund (collectively the “RiverFront Funds”). AFS has contractually agreed to waive its administrative fees, billed monthly at a rate of 0.10%, based on each RiverFront Fund’s average daily net assets, annualized, pursuant to an Administrative Agreement. The Administrative Agreement is currently in effect with ALPS through August 31, 2012 and will be reevaluated on an annual basis thereafter.
123 | April 30, 2011
| | | | |
Notes to Financial Statements |
| | | April 30, 2011 |
ALPS Distributors, Inc. (an affiliate of ALPS and AAI) (“ADI” or the “Distributor”) acts as the distributor of the Funds’ shares pursuant to a Distribution Agreement with the Trust. Shares are sold on a continuous basis by ADI as agent for the Funds, and ADI has agreed to use its best efforts to solicit orders for the sale of Funds’ shares, although it is not obliged to sell any particular amount of shares. ADI is not entitled to any compensation for its services as Distributor. ADI is registered as a broker-dealer with the Securities and Exchange Commission.
Each Fund has adopted a Distribution and Services Plan (the “Plan”) pursuant to Rule 12b-1 of the 1940 Act for the Class A, Class C, Class R (ALPS | Red Rocks Listed Private Equity Fund only), and Investor Class (RiverFront Long-Term Growth Fund only) shares. The Plan allows a Fund to use Class A, Class C, Class R and Investor Class assets to pay fees in connection with the distribution and marketing of Class A, Class C, Class R and Investor Class shares and/or the provision of shareholder services to Class A, Class C, Class R and Investor Class shareholders. The Plan permits payment for services in connection with the administration of plans or programs that use Class A, Class C, Class R and Investor Class shares of a Fund, if any, as their funding medium and for related expenses. The Plan permits a Fund to make total payments at an annual rate of up to 0.25% of a Fund’s average daily net assets attributable to its Class A and Investor Class shares, 0.75% of a Fund’s average daily net assets attributable to its Class C shares and 0.50% of the ALPS | Red Rocks Listed Private Equity Fund’s average daily net assets attributable to its Class R shares. Because these fees are paid out of a Fund’s Class A, Class C, Class R and Investor Class assets, if any, on an ongoing basis, over time they will increase the cost of an investment in Class A, Class C, Class R and Investor Class shares, if any, and Plan fees may cost an investor more than other types of sales charges.
Prior to the close of business on September 24, 2010, the Predecessor RiverFront Fund had a Distribution and Services Plan with Robert W. Baird & Co. Inc. that allowed it to use Investor Class assets to pay fees of up to 0.25% of the Predecessor RiverFront Fund’s Investor Class average net assets in connection with the distribution and marketing of Investor Class shares and/or the provision of shareholder services to Investor Class shareholders.
The ALPS | Kotak India Growth Fund Class A and Class C shares, ALPS | Red Rocks Listed Private Equity Fund Class A and Class C shares, ALPS | WMC Value Intersection Fund Class C shares, Clough China Fund Class C shares, Jefferies Commodity Strategy Allocation Fund Class A and Class C shares, RiverFront Long-Term Growth Fund Class C shares, RiverFront Long-Term Growth & Income Fund Class C shares, RiverFront Moderate Growth Fund Class C shares, and the RiverFront Moderate Growth & Income Fund Class C shares have adopted a shareholder services plan (“Shareholder Services Plan”). Under the Shareholder Services Plan for each Fund, the Funds are authorized to pay banks and their affiliates and other institutions, including broker-dealers and Fund affiliates (“Participating Organizations”), an aggregate fee in an amount not
to exceed on an annual basis 0.15% for ALPS | Kotak India Growth Fund Class A shares, ALPS | Red Rocks Listed Private Equity Fund Class A shares, and Jefferies Commodity Strategy Allocation Fund Class A shares, and not to exceed 0.25% for the ALPS | Kotak India Growth Fund Class C shares, ALPS | Red Rocks Listed Private Equity Fund Class C shares, ALPS | WMC Value Intersection Fund Class C shares, Clough China Fund Class C shares, Jefferies Commodity Strategy Allocation Fund Class C shares, RiverFront Long-Term Growth Fund Class C shares, RiverFront Long-Term Growth & Income Fund Class C shares, RiverFront Moderate Growth Fund Class C shares, and RiverFront Moderate Growth & Income Fund Class C shares of the average daily net asset value of the Class A shares and Class C shares, respectively, attributable to or held in the name of a Participating Organization for its clients as compensation for providing shareholder service activities, which do not include distribution services, pursuant to an agreement with a Participating Organization. Shareholder Services plan fees are included with distribution and service fees on the Statement of Operations.
ALPS Fund Services, Inc. (“ALPS”) (an affiliate of ADI and AAI) serves as administrator to the Funds and the Funds have agreed to pay expenses incurred in connection with its administrative activities. Pursuant to an Administrative Agreement, ALPS provides operational services to the Funds including, but not limited to fund accounting and fund administration and generally assists in the Funds’ operations. The Annual Administrative Fee is based on each Fund’s average daily net assets and will be billed monthly, at the following:
| | | | |
| Fund | | Average Daily Net
Assets of the Fund | | Annual
Administrative
Fee |
ALPS | Kotak India Growth Fund | | All Asset Levels | | 0.15% |
ALPS | Red Rocks Listed Private Equity Fund | | First $500 Million
$500 Million - $1 Billion Over $1 Billion | | 0.08%
0.06% 0.04% |
ALPS | WMC Value Intersection Fund | | All Asset Levels | | 0.15% |
Clough China Fund | | All Asset Levels | | 0.15% |
Jefferies Asset Management Commodity Strategy Allocation Fund | | All Asset Levels | | 0.10% |
RiverFront Long-Term Growth Fund | | All Asset Levels | | 0.10% |
RiverFront Long-Term Growth & Income Fund | | All Asset Levels | | 0.10% |
RiverFront Moderate Growth Fund | | All Asset Levels | | 0.10% |
RiverFront Moderate Growth & Income Fund | | All Asset Levels | | 0.10% |
124 | April 30, 2011
| | | | |
Notes to Financial Statements |
| | | April 30, 2011 |
6. TRANSACTIONS WITH AFFILIATES
For the period ending April 30, 2011, the following Funds recorded distributions from affiliated investment companies as affiliated dividend income, and had the following affiliated purchases and sales:
RiverFront Long-Term Growth Fund
| | | | | | | | | | | | | | | | | | | | | | | | | | | | |
| Security Name | | Share
Balance
January 1,
2011 | | | Purchases | | | Sales | | | Share
Balance
April 30,
2011 | | | Dividend
Income | | | Realized
Gain | | | Market
Value
April 30,
2011 | |
Financial Select Sector SPDR Fund | | | – | | | | 38,418 | | | | – | | | | 38,418 | | | $ | – | | | $ | – | | | $ | 628,903 | |
Materials Select Sector SPDR ETF | | | 16,498 | | | | 1,153 | | | | 17,651 | | | | – | | | | – | | | | 81,251 | | | | – | |
| | | | | | | | | | | | | | | | | | $ | – | | | $ | 81,251 | | | $ | 628,903 | |
| | |
RiverFront Moderate Growth Fund
| | | | | | | | | | | | | | | | | | | | | | | | | | | | |
| Security Name | | Share
Balance
August 2,
2010 | | | Purchases | | | Sales | | | Share
Balance
April 30,
2011 | | | Dividend
Income | | | Realized
Gain | | | Market
Value
April 30,
2011 | |
Financial Select Sector SPDR Fund | | | – | | | | 7,128 | | | | – | | | | 7,128 | | | $ | – | | | $ | – | | | $ | 116,685 | |
Materials Select Sector SPDR ETF | | | – | | | | 1,935 | | | | 1,935 | | | | – | | | | – | | | | 3,246 | | | | – | |
| | | | | | | | | | | | | | | | | | $ | – | | | $ | 3,246 | | | $ | 116,685 | |
| | |
The above securities are deemed affiliated investment companies because the Fund’s Distributor is also the distributor of the Select Sector SPDR exchange traded funds (the “Underlying Sector ETFs”). As required by exemptive relief obtained by the Underlying Sector ETFs, the Adviser will reimburse the Fund an amount equal to the distribution fee received by ADI from the Underlying Sector ETFs attributable to the Fund’s investment in the Underlying Sector ETFs, for so long as ADI acts as the distributor to the Fund and the Underlying Sector ETFs.
7. INDEMNIFICATIONS
Under the Trust’s organizational documents, its officers and Trustees are indemnified against certain liability arising out of the performance of their duties to the Trust. Additionally, in the normal course of business, the Trust enters into contracts with service providers that contain general indemnification clauses. The Trust’s maximum exposure under these arrangements is unknown, as this would involve future claims
125 | April 30, 2011
| | | | |
Report of Independent Registered Public Accounting Firm |
| | | |
To the Shareholders and Board of Trustees of Financial Investors Trust:
We have audited the accompanying statements of assets and liabilities, including the statements of investments, of ALPS | Red Rocks Listed Private Equity Fund, ALPS | WMC Value Intersection Fund (formerly known as “Activa Value Fund”), Clough China Fund, RiverFront Long-Term Growth Fund, RiverFront Long-Term Growth & Income Fund, RiverFront Moderate Growth Fund, and RiverFront Moderate Growth & Income Fund, seven of the portfolios of Financial Investors Trust (the “Trust”), as of April 30, 2011, and the related statements of operations for the year then ended for the ALPS | Red Rocks Listed Private Equity Fund, ALPS | WMC Value Intersection Fund, and Clough China Fund, for the period January 1, 2011 to April 30, 2011 and for the year ended December 31, 2010 for RiverFront Long-Term Growth Fund, and for the period August 2, 2010 (inception) to April 30, 2011 for RiverFront Long-Term Growth & Income Fund, RiverFront Moderate Growth Fund, and RiverFront Moderate Growth & Income Fund; the statements of changes in net assets for each of the two years in the period ended April 30, 2011 for the ALPS | Red Rocks Listed Private Equity Fund, for the year ended April 30, 2011, for the period January 1, 2010 to April 30, 2010, and for the year ended December 31, 2009 for the ALPS | WMC Value Intersection Fund, for the year ended April 30, 2011, for the period August 1, 2010 to April 30, 2010, and for the year ended July 31, 2009 for the Clough China Fund, for the period January 1, 2011 to April 30, 2011, and the year ended December 31, 2010 for the RiverFront Long-Term Growth Fund, and for the period August 2, 2010 (inception) to April 30, 2011 for the RiverFront Long-Term Growth & Income Fund, RiverFront Moderate Growth Fund, and RiverFront Moderate Growth & Income Fund; and the financial highlights for the periods presented for the ALPS | Red Rocks Listed Private Equity Fund, RiverFront Long-Term Growth & Income Fund, RiverFront Moderate Growth Fund, and the RiverFront Moderate Growth & Income Fund, for the year ended April 30, 2011, for the period January 1, 2010 to April 30, 2010, and for the year ended December 31, 2009 for the ALPS | WMC Value Intersection Fund, for the year ended April 30, 2011 and for the period August 1, 2009 to April 30, 2010 for the Clough China Fund, for the period January 1, 2011 to April 30, 2011 and the year ended December 31, 2010 for the RiverFront Long-Term Growth Fund. We have also audited the accompanying consolidated statements of assets and liabilities, including the consolidated statements of investments, of ALPS | Kotak India Growth Fund and Jefferies Asset Management Commodity Strategy Allocation Fund, two of the portfolios of the Trust, as of April 30, 2011, and the related consolidated statements of operations, consolidated statements of changes in net assets and the financial highlights for the period February 14, 2011 (inception) to April 30, 2011 for the ALPS | Kotak India Growth Fund and for the period June 29, 2010 (inception) to April 30, 2011 for the Jefferies Asset Management Commodity Strategy Allocation Fund. These financial statements and financial highlights are the responsibility of the Trust’s management. Our responsibility is to express an opinion on these financial statements and financial highlights based on our audits. The financial highlights of the ALPS | WMC Value Intersection Fund for each of the three years in the period ended December 31, 2008, were audited by other auditors whose report, dated February 17, 2009, expressed an unqualified opinion on such financial highlights. The statement of changes in net assets for the Clough China Fund for the year ended July 31, 2009 and the financial highlights of the Clough China Fund for each of the three years in the period ended July 31, 2009 and the period December 30, 2005 (inception) to July 31, 2006, were audited by other auditors whose report, dated September 21, 2009, expressed an unqualified opinion on such statement of changes in net assets and financial highlights. The statement of changes in net assets for the RiverFront Long-Term Growth Fund for the year ended December 31, 2009 and the financial highlights for RiverFront Long-Term Growth Fund for the year ended December 31, 2009 and the period October 28,
2008 (inception) through December 31, 2008, were audited by other auditors whose report, dated February 26, 2010, expressed an unqualified opinion on such statement of changes in net assets and financial highlights.
We conducted our audits in accordance with the standards of the Public Company Accounting Oversight Board (United States). Those standards require that we plan and perform the audit to obtain reasonable assurance about whether the financial statements and financial highlights are free of material misstatement. The Trust is not required to have, nor were we engaged to perform, an audit of its internal control over financial reporting. Our audits included consideration of internal control over financial reporting as a basis for designing audit procedures that are appropriate in the circumstances, but not for the purpose of expressing an opinion on the effectiveness of the Trust’s internal control over financial reporting. Accordingly, we express no such opinion. An audit also includes examining, on a test basis, evidence supporting the amounts and disclosures in the financial statements, assessing the accounting principles used and significant estimates made by management, as well as evaluating the overall financial statement presentation. Our procedures included confirmation of securities owned as of April 30, 2011, by correspondence with the custodian and brokers; where replies were not received from brokers, we performed other auditing procedures. We believe that our audits provide a reasonable basis for our opinion.
In our opinion the financial statements and financial highlights referred to above present fairly, in all material respects, the financial position of each of the portfolios constituting Financial Investors Trust, as of April 30, 2011, the results of their operations for the periods then ended; the changes in their net assets for the each of the two years in the period ended April 30, 2011 for the ALPS | Red Rocks Listed Private Equity Fund, for the year ended April 30, 2011, for the period January 1, 2010 to April 30, 2010, and for the year ended December 31, 2009 for the ALPS | WMC Value Intersection Fund, for the year ended April 30, 2011, for the period August 1, 2010 to April 30, 2010, and for the year ended July 31, 2009 for the Clough China Fund, for the period January 1, 2011 to April 30, 2011, and the year ended December 31, 2010 for the RiverFront Long-Term Growth Fund, for the period August 2, 2010 (inception) to April 30, 2011 for the RiverFront Long-Term Growth & Income Fund, RiverFront Moderate Growth Fund, and RiverFront Moderate Growth & Income Fund, for the period February 14, 2011 (inception) to April 30, 2011 for the ALPS | Kotak India Growth Fund, and for the period June 29, 2010 (inception) to April 30, 2011 for the Jefferies Asset Management Commodity Strategy Allocation Fund; and the financial highlights for the periods presented for the ALPS | Red Rocks Listed Private Equity Fund, RiverFront Long-Term Growth & Income Fund, RiverFront Moderate Growth Fund, and the RiverFront Moderate Growth & Income Fund, for the year ended April 30, 2011, for the period January 1, 2010 to April 30, 2010, and for the year ended December 31, 2009 for the ALPS | WMC Value Intersection Fund, for the year ended April 30, 2011 and for the period August 1, 2009 to April 30, 2010 for the Clough China Fund, for the period January 1, 2011 to April 30, 2011 and the year ended December 31, 2010 for the RiverFront Long-Term Growth Fund, for the period February 14, 2011 (inception) to April 30, 2011 for the ALPS | Kotak India Growth Fund, and for the period June 29, 2010 (inception) to April 30, 2011 for the Jefferies Asset Management Commodity Strategy Allocation Fund, in conformity with accounting principles generally accepted in the United States of America.
DELOITTE & TOUCHE LLP
Denver, Colorado
June 29, 2011
126 | April 30, 2011
| | | | |
Additional Information |
| | | April 30, 2011 (Unaudited) |
1. FUND HOLDINGS
The Funds file their complete schedule of portfolio holdings with the Securities and Exchange Commission (the “SEC”) for the first and third quarters of each fiscal year on Form N-Q within 60 days after the end of the period. Copies of the Funds’ Form N-Q are available without charge on the SEC website at http:// www.sec.gov. You may also review and copy the Form N-Q at the SEC’s Public Reference Room in Washington, D.C. For more information about the operation of the Public Reference Room, please call the SEC at 1-800-SEC-0330.
| 2. | FUND PROXY VOTING POLICIES, PROCEDURES AND SUMMARIES |
Fund policies and procedures used in determining how to vote proxies and information regarding how each of the Funds voted proxies relating to portfolio securities during the most recent prior 12-month period ending June 30 will be available without charge, (1) upon request, by calling (866) 759-5679 and (2) on the SEC’s website at http://www.sec.gov.
3. TAX DESIGNATIONS
The Funds designate the following for federal income tax purposes for the fiscal year ended April 30, 2011:
| | | | | | | | |
| | | Qualified
Dividend
Income | | | Dividend
Received
Deduction | |
ALPS | Kotak India Growth Fund | | | 0.00 | % | | | 0.00 | % |
ALPS | Red Rocks Listed Private Equity Fund | | | 8.28 | % | | | 0.61 | % |
ALPS | WMC Value Intersection Fund | | | 100.00 | % | | | 100.00 | % |
Clough China Fund | | | 0.00 | % | | | 0.00 | % |
Jefferies Asset Management Commodity Strategy Allocation Fund | | | 5.21 | % | | | 2.15 | % |
RiverFront Long-Term Growth Fund | | | 0.00 | % | | | 0.00 | % |
RiverFront Long-Term Growth & Income Fund | | | 87.70 | % | | | 86.30 | % |
RiverFront Moderate Growth Fund | | | 72.21 | % | | | 75.03 | % |
RiverFront Moderate Growth & Income Fund | | | 67.14 | % | | | 65.34 | % |
Pursuant to Section 853(c) of the Internal Revenue Code, the Clough China Fund designates $61,558 as foreign taxes paid and $1,158,648 as foreign source income earned as of April 30, 2011.
Pursuant to Section 852(b)(3) of the Internal Revenue Code, Clough China Fund designated $75,614, RiverFront Long-Term Growth & Income Fund designated $5, and the RiverFront Moderate Growth & Income Fund designated $18 as long-term capital gain dividends.
| 4. | DISCLOSURE REGARDING APPROVAL OF FUND ADVISORY AGREEMENTS |
ALPS | Kotak India Growth Fund
On September 14, 2010, the Trustees met in person to discuss, among other things, the approval of the Investment Advisory Agreement between the Trust and ALPS Advisors (the “Advisory Agreement”) and the Sub-Advisory Agreement among the Trust, the Adviser and Kotak Mahindra (UK) Limited (“Kotak Mahindra”), the sub-adviser for the ALPS | Kotak India Growth Fund (the “Sub-Advisory Agreement”, together with the Advisory Agreement, the “Fund Advisory Agreements”) in accordance with Section 15(a) of the 1940 Act. The Trustees were informed that ALPS Advisors, as the investment adviser, has responsibility for the investment and management of the Fund’s assets and securities. The Independent Trustees met with independent legal counsel during executive session and discussed the Fund Advisory Agreements and other related materials.
In approving the Advisory Agreement with ALPS Advisors and the Sub-Advisory Agreement with Kotak Mahindra, the Trustees, including the Independent Trustees, considered the following factors with respect to the Kotak Fund:
Investment Advisory Fee Rate: The Trustees reviewed and considered the contractual annual advisory fee to be paid by (a) the Trust, on behalf of the Kotak Fund, to ALPS Advisors of 1.25% of the Fund’s daily average net assets and (b) by ALPS Advisors to Kotak Mahindra of (i) 1.15% of the Fund’s daily average net assets on the first $50 million and 1.05% of the Fund’s daily average net assets over $50 million, in light of the extent and quality of the advisory services provided by the ALPS Advisors and Kotak Mahindra to the Kotak Fund.
The Board received and considered information comparing the Kotak Fund’s contractual advisory fees and overall expenses with those of funds in both the relevant expense group and universe of funds provided by Lipper, an independent provider of investment company data, as well as the Kotak Fund’s direct competitors and similar products advised by ALPS Advisors and by Kotak Mahindra.
Based on such information, the Trustees further determined that the contractual annual advisory fees set forth above and the total expense ratio of 1.75% (exclusive of Rule 12b-1 fees and various other items) for Class A shares, Class C shares, and Class I shares of the Kotak Fund, taking into account the contractual fee waivers in place, is comparable to others within such Fund’s peer universe.
127 | April 30, 2011
| | | | |
Additional Information |
| | | April 30, 2011 (Unaudited) |
Nature, Extent and Quality of the Services under the Advisory Agreement and the Sub-Advisory Agreement: The Trustees received and considered information regarding the nature, extent and quality of services provided to the Kotak Fund under the Advisory Agreement and the Sub-Advisory Agreement. The Trustees reviewed certain background materials supplied by ALPS Advisors and Kotak Mahindra in each of their presentations, including their Forms ADV.
The Trustees reviewed and considered ALPS Advisors’ and Kotak Mahindra’s investment advisory personnel, their history as asset managers, their performance and the amount of assets currently under management by ALPS Advisors and Kotak Mahindra. The Trustees also reviewed the research and decision-making processes utilized by ALPS Advisors and Kotak Mahindra, including the methods adopted to seek to achieve compliance with the investment objectives, policies and restrictions of the Kotak Fund.
The Trustees considered the background and experience of ALPS Advisors’ and Kotak Mahindra’s management in connection with the Kotak Fund, including reviewing the qualifications, backgrounds and responsibilities of the management team primarily responsible for the day-to-day portfolio management of the Kotak Fund and the extent of the resources devoted to research and analysis of actual and potential investments.
The Trustees also reviewed, among other things, ALPS Advisors’ and Kotak Mahindra’s insider trading policies and procedures and a description of their Codes of Ethics.
Performance: The Trustees noted that since the Kotak Fund has not yet begun operations, there was no performance to be reviewed or analyzed at this time.
The Advisers’ Profitability: The Trustees received and considered a profitability analysis prepared by ALPS Advisors based on the fees payable under the Advisory Agreement. The Trustees considered the profits, if any, anticipated to be realized by ALPS Advisors in connection with the operation of the Kotak Fund. The Board then reviewed ALPS Advisors’ and Kotak Mahindra’s financial statements in order to analyze the financial condition and stability and profitability of each adviser.
Economies of Scale: The Trustees considered whether economies of scale in the provision of services to the Kotak Fund were being passed along to the shareholders.
Other Benefits to the Advisers: The Trustees reviewed and considered any other benefits derived or to be derived by ALPS Advisors and Kotak Mahindra from their relationship with the Kotak Fund, including soft dollar arrangements.
In selecting ALPS Advisors as the Kotak Fund’s investment adviser and Kotak Mahindra as the Kotak Fund’s sub-adviser and approving the Advisory Agreement and Sub-Advisory Agreement and the fees charged under each agreement, the Trustees concluded that no single factor reviewed by the Trustees was identified by the Trustees to be determinative as the principal factor in whether to approve the Advisory Agreement and Sub-Advisory Agreement. Further, the Independent Trustees were advised by separate independent legal counsel throughout the process. The Trustees, including all of the Independent Trustees, concluded that:
| | » | the investment advisory fees to be received by ALPS Advisors with respect to the Kotak Fund were comparable to others within such Fund’s peer universe, as well as similar products advised by ALPS Advisors and by Kotak Mahindra; |
| | » | the nature, extent and quality of services rendered by ALPS Advisors under the Advisory Agreement and by Kotak Mahindra under the Sub-Advisory Agreement were adequate; |
| | » | there was no performance to be reviewed or analyzed at this time since the Kotak Fund was not yet in operation; |
| | » | the profit, if any, anticipated to be realized by ALPS Advisors in connection with the operation of the Kotak Fund is fair to the Trust, especially in light of the fee waiver agreement among the Trust, ALPS Advisors and Kotak Mahindra; and |
| | » | there were no material other benefits accruing to ALPS Advisors or Kotak Mahindra in connection with its relationship with the Kotak Fund. |
Based on the Trustees’ deliberations and their evaluation of the information described above, the Trustees, including all of the Independent Trustees, concluded that ALPS Advisors’ and Kotak Mahindra’s compensation for investment advisory services is consistent with the best interests of the Kotak Fund and its shareholders.
128 | April 30, 2011
| | | | |
Trustees and Officers |
| | | April 30, 2011 (Unaudited) |
INDEPENDENT TRUSTEES
| | | | | | | | | | |
Name,
Address & Age* | | Position(s) Held
with Funds | | Term of Office and Length of Time Served | | Principal Occupation(s)
During Past 5 Years** | | Number of Funds in Fund
Complex
Overseen
by
Trustee*** | | Other Directorships Held by Trustee |
Mary K. Anstine, age 70 | | Trustee | | Ms. Anstine was elected at a special meeting of shareholders held on March 21, 1997 and re-elected at a special meeting of shareholders held on August 7, 2009. | | Ms. Anstine was President/Chief Executive Officer of HealthONE Alliance, Denver, Colorado, and former Executive Vice President of First Interstate Bank of Denver. Ms. Anstine is also Trustee/Director of AV Hunter Trust and Colorado Uplift Board. Ms. Anstine was formerly a Director of the Trust Bank of Colorado (later purchased and now known as Northern Trust Bank), HealthONE and Denver Area Council of the Boy Scouts of America, and a member of the American Bankers Association Trust Executive Committee. | | 25 | | Ms. Anstine is a Trustee of ALPS ETF Trust (9 funds); Financial Investors Variable Insurance Trust (5 funds); Reaves Utility Income Fund (1 fund); and Westcore Trust (12 funds). |
John R. Moran, Jr., age 80 | | Trustee | | Mr. Moran was elected at a special meeting of shareholders held on March 21, 1997 and re-elected at a special meeting of shareholders held on August 7, 2009. | | Mr. Moran is formerly President and CEO of The Colorado Trust, a private foundation serving the health and hospital community in the state of Colorado. An attorney, Mr. Moran was formerly a partner with the firm of Kutak Rock & Campbell in Denver, Colorado and a member of the Colorado House of Representatives. Currently, Mr. Moran is a member of the Treasurer’s Investment Advisory Committee for the University of Colorado. | | 11 | | None. |
Jeremy W. Deems, age 34 | | Trustee | | Mr. Deems was appointed as a Trustee at the March 11, 2008 meeting of the Board of Trustees and elected at a special meeting of shareholders held on August 7, 2009. | | Mr. Deems is the Co-Founder, Chief Compliance Officer and Chief Financial Officer of Green Alpha Advisors, LLC. Prior to joining Green Alpha Advisors, Mr. Deems was CFO and Treasurer of Forward Management, LLC, an investment management company, ReFlow Management Co., LLC, a liquidity resourcing company, ReFlow Fund, LLC, a private investment fund, and Sutton Place Management, LLC, an administrative services company (from 2004 to June 2007). Prior to this, Mr. Deems served as Controller of Forward Management, LLC, ReFlow Management Co., LLC, ReFlow Fund, LLC and Sutton Place Management, LLC. | | 25 | | Mr. Deems is a Trustee of ALPS ETF Trust (9 funds); ALPS Variable Insurance Trust (1 fund); Financial Investors Variable Insurance
Trust (5 funds) and Reaves Utility Income Fund (1 fund). |
| * | All communications to Trustees and Officers may be directed to Financial Investors Trust c/o 1290 Broadway, Suite 1100, Denver, CO 80203. |
| ** | Except as otherwise indicated, each individual has held the office shown or other offices in the same company for the last five years. |
| *** | The Fund Complex includes all series of the Trust and any other investment companies for which ALPS Advisors, Inc., Kotak Mahindra (UK) Limited, Red Rocks Capital LLC, Wellington Management Company, LLP, Clough Capital Partners, LP, Jefferies Asset Management, LLC, and RiverFront Investment Group, LLC, provides investment advisory services. |
129 | April 30, 2011
| | | | |
Trustees and Officers |
| | | April 30, 2011(Unaudited) |
INDEPENDENT TRUSTEES (Continued)
| | | | | | | | | | |
Name,
Address & Age* | | Position(s) Held
with Funds | | Term of Office and Length of Time Served | | Principal Occupation(s)
During Past 5 Years** | | Number of Funds in Fund
Complex
Overseen
by
Trustee*** | | Other Directorships Held by Trustee |
| Jerry G. Rutledge, age 66 | | Trustee | | Mr. Rutledge was elected at a special meeting of shareholders held on August 7, 2009. | | Mr. Rutledge is the President and owner of Rutledge’s Inc., a retail clothing business. Mr. Rutledge is currently Director of the American National Bank. He was from 1994 to 2007 a Regent of the University of Colorado. | | 14 | | Mr. Rutledge is a Trustee of Clough Global Allocation Fund (1 fund), Clough Global Equity Fund (1 fund) and Clough Global Opportunities Fund (1 fund). |
Michael “Ross” Shell, age 40 | | Trustee | | Mr. Shell was elected at a special meeting of shareholders held on August 7, 2009. | | Mr. Shell is Founder and CEO of Red Idea, LLC, a strategic consulting/early stage venture firm (since June 2008). From 1999 to 2009, he was a part-owner and Director of Tesser, Inc., a brand agency. From December 2005 to May 2008, he was Director, Marketing and Investor Relations, of Woodbourne, a REIT/real estate hedge fund and private equity firm. Prior to this, from May 2004 to November 2005, he worked as a business strategy consultant; from June 2003 to April 2004, he was on the Global Client Services team of IDEO, a product design/ innovation firm; and from 1999 to 2003, he was President of Tesser, Inc. Mr. Shell graduated with honors from Stanford University with a degree in Political Science. | | 11 | | None. |
| * | All communications to Trustees and Officers may be directed to Financial Investors Trust c/o 1290 Broadway, Suite 1100, Denver, CO 80203. |
| ** | Except as otherwise indicated, each individual has held the office shown or other offices in the same company for the last five years. |
| *** | The Fund Complex includes all series of the Trust and any other investment companies for which ALPS Advisors, Inc., Kotak Mahindra (UK) Limited, Red Rocks Capital LLC, Wellington Management Company, LLP, Clough Capital Partners, LP, Jefferies Asset Management, LLC, and RiverFront Investment Group, LLC, provides investment advisory services. |
130 | April 30, 2011
| | | | |
Trustees and Officers |
| | | April 30, 2011(Unaudited) |
INTERESTED TRUSTEE
| | | | | | | | | | |
Name,
Address & Age* | | Position(s) Held
with Funds | | Term of Office and Length of Time Served | | Principal Occupation(s)
During Past 5 Years** | | Number of Funds in Fund
Complex
Overseen
by
Trustee*** | | Other Directorships Held by Trustee |
Edmund J. Burke, age 50 | | Trustee, Chairman and President | | Mr. Burke was elected as Chairman at the August 28, 2009 meeting of the Board of Trustees. Mr. Burke was elected as Trustee at a special meeting of shareholders held on August 7, 2009. Mr. Burke was elected President of the Trust at the December 17, 2002 meeting of the Board of Trustees. | | Mr. Burke is Chief Executive Officer and a Director of ALPS Holdings, Inc. (“AHI”) (since 2005) and Director of ALPS Advisors, Inc. (“AAI”), ALPS Distributors, Inc. (“ADI”), ALPS Fund Services, Inc. (“AFS”) and FTAM Distributors, Inc. (“FDI”) and from 2001-2008, was President of AAI, ADI, AFS and FDI. Because of his positions with AHI, AAI, ADI, AFS and FDI, Mr. Burke is deemed an affiliate of the Trust as defined under the 1940 Act. Mr. Burke is Trustee and President of the Clough Global Allocation Fund (Trustee since 2006; President since 2004); Trustee and President of the Clough Global Equity Fund (Trustee since 2006; President since 2005); Trustee and President of the Clough Global Opportunities Fund (since 2006); Trustee of the Liberty All-Star Equity Fund; and Director of the Liberty All-Star Growth Fund, Inc. | | 16 | | Mr. Burke is a Trustee of Clough Global Allocation Fund (1 fund); Clough Global Equity Fund (1 fund); Clough Global Opportunities Fund (1 fund); Trustee of the Liberty All-Star Equity Fund (1 fund); and Director of the Liberty All-Star Growth Fund, Inc. (1 fund). |
| * | All communications to Trustees and Officers may be directed to Financial Investors Trust c/o 1290 Broadway, Suite 1100, Denver, CO 80203. |
| ** | Except as otherwise indicated, each individual has held the office shown or other offices in the same company for the last five years. |
| *** | The Fund Complex includes all series of the Trust and any other investment companies for which ALPS Advisors, Inc., Kotak Mahindra (UK) Limited, Red Rocks Capital LLC, Wellington Management Company, LLP, Clough Capital Partners, LP, Jefferies Asset Management, LLC, and RiverFront Investment Group, LLC, provides investment advisory services. |
131 | April 30, 2011
| | | | |
Trustees and Officers |
| | | April 30, 2011 (Unaudited) |
OFFICERS
| | | | | | |
Name, Address & Age* | | Position(s) Held with Funds | | Term of Office and Length of Time Served | | Principal Occupation(s) During Past 5 Years** |
| Jeremy O. May, age 40 | | Treasurer | | Mr. May was elected Treasurer of the Trust at the October 7, 1997 meeting of the Board of Trustees. | | Mr. May joined ALPS in 1995 and is currently President and Director of AFS and Executive Vice President and Director of AHI, AAI, ADI and FDI. Because of his positions with these entities, Mr. May is deemed an affiliate of the Trust as defined under the 1940 Act. Mr. May is also the Treasurer of the Liberty All-Star Equity Fund, Liberty All-Star Growth Fund, Inc., Clough Global Allocation Fund, Clough Global Equity Fund, Clough Global Opportunities Fund, Financial Investors Trust and Financial Investors Variable Insurance Trust. Mr. May is also President, Chairman and Trustee of the ALPS Variable Insurance Trust and Chairman and Trustee of the Reaves Utility Income Fund. Mr. May is currently on the Board of Directors and is Chairman of the Audit Committee of the University of Colorado Foundation. |
JoEllen L. Legg, age 49 | | Secretary | | Ms. Legg was elected Secretary of the Trust at the November 13, 2007 meeting of the Board of Trustees. | | Ms. Legg joined ALPS in October 2007 and is currently Vice President and Associate Counsel of ALPS, AAI, ADI and FDI. Prior to joining ALPS, Ms. Legg served as Senior Counsel - Law (Corporate & Securities) for Adelphia Communications Corporation from February 2005 to March 2007. Prior to this, Ms. Legg held associate positions at Fried Frank Harris Shriver & Jacobson LLP (1998 - 2004) and at Patton Boggs LLP (2004 - 2005). Because of her position with ALPS, Ms. Legg is deemed an affiliate of the Trust as defined under the 1940 Act. Ms. Legg is also the Secretary of Transparent Value Trust, Assistant Secretary of James Advantage Funds, Stone Harbor Investment Funds, Stone Harbor Emerging Markets Debt Fund and WesMark Funds and Vice President and Assistant Secretary of Oak Associates Funds. |
Ted Uhl, age 35 | | Chief Compliance
Officer (“CCO”) | | Mr. Uhl was appointed CCO of the Trust at the June 8, 2010 meeting of the Board of Trustees. | | Mr. Uhl joined ALPS in October 2006, and is currently Deputy Compliance Officer of ALPS. Prior to his current role, Mr. Uhl served as Senior Risk Manager for ALPS from October 2006 until June 2010. Before joining ALPS, Mr. Uhl served a Sr. Analyst with Enenbach and Associates (RIA), and a Sr. Financial Analyst at Sprint. Because of his position with ALPS, Mr. Uhl is deemed an affiliate of the Trust as defined under the 1940 Act. |
Kimberly R. Storms, age 38 | | Assistant Treasurer | | Ms. Storms was elected Assistant Treasurer of the Trust at the June 14, 2005 meeting of the Board of Trustees. | | Ms. Storms is Senior Vice President - Director of Fund Administration of ALPS. Ms. Storms joined ALPS in 1998 as Assistant Controller. Because of her position with ALPS, Ms. Storms is deemed an affiliate of the Trust as defined under the 1940 Act. Ms. Storms is also Treasurer of ALPS ETF Trust and ALPS Variable Insurance Trust; Assistant Treasurer of Liberty All-Star Equity Fund and Liberty All-Star Growth Fund, Inc.; and Assistant Secretary of Ameristock Mutual Fund, Inc. |
Monette R. Nickels, age 40 | | Tax Officer | | Ms. Nickels was elected Tax Officer of the Trust at the December 8, 2009 meeting of the Board of Trustees. | | Ms. Nickels is Senior Vice President and Director of Tax Administration of ALPS. Ms. Nickels joined ALPS in 2004 as Director of Tax Administration. Because of her position with ALPS, Ms. Nickels is deemed an affiliate of the Trust as defined under the 1940 Act. Ms. Nickels is also Tax Officer of ALPS Variable Insurance Trust, ALPS ETF Trust, Liberty All- Star Equity Fund, Liberty All-Star Growth Fund, Inc., Reaves Utility Income Fund, Clough Global Allocation Fund, Clough Global Opportunities Fund, Clough Global Equity Fund and Financial Investors Variable Insurance Trust. |
| * | All communications to Trustees and Officers may be directed to Financial Investors Trust c/o 1290 Broadway, Suite 1100, Denver, CO 80203. |
| ** | Except as otherwise indicated, each individual has held the office shown or other offices in the same company for the last five years. |
132 | April 30, 2011


Table of Contents
April 30, 2011
| | |
| | www.vulcanvaluepartners.com |
Shareholder Letter
April 30, 2011 (Unaudited)
Dear Shareholders:
We are pleased to report Vulcan Value Partners is off to a solid start in 2011; however, progress was uneven between the Funds. For the year ended April 30, 2011, Vulcan Value Partners Fund returned 10.82% and Vulcan Value Partners Small Cap Fund returned 21.75% (all returns are net of fees).
As we have said many times before, we place no weight on short term results, good or bad, and neither should you. We are focused on producing superior real rates of return over our five year time horizon. Everything we do is with that goal in mind, even if it hurts our results in the short run. We encourage you to place more weight on our longer term historical results and a great deal of weight on our long-term prospects. Performance is detailed below.
In our view, there are several quantifiable reasons why Vulcan Value Partners Fund’s and Vulcan Value Partners Small Cap Fund’s results, as of April 30, 2011, diverged, both on an absolute level and relative to their respective benchmarks. We view these reasons as short term noise as we explain in this paragraph. First, we have very little exposure to energy related businesses in Vulcan Value Partners Small Cap Fund and no exposure in Vulcan Value Partners Fund. Energy was by far and away the best performing group within the broader market with a year to date return of 18.66%. Why didn’t we own energy stocks? Simply put, we found more compelling long term investments outside of the energy sector. Second, in Vulcan Value Partners Fund we purchased new positions and added to existing positions at the end of last year, and during the first part of this year that hurt our results on both a relative and, more important, an absolute basis. Third, we had one position (out of twenty four) in Vulcan Value Partners Fund that reported results below our expectations, which hurt our estimated value and its stock price. Last, we simply had better recognition of values in the Vulcan Value Partners Small Cap Fund with one of our companies taken away from us through merger or acquisition. As we have mentioned before, as credit markets continue to improve, we believe it is not surprising that initially Small Caps would benefit more than Large Caps.
Now the important point: We seek to buy fantastic businesses that produce ample amounts of free cash flow(a) and we buy them at discounts to our estimate of fair value.(b) The better the business and the larger the discount to our estimate of fair value, the more we like it and the more we buy. Right now the higher quality companies that we prefer to own are often the most discounted, and this is especially true in the Large Cap fund. What we are concerned about is the underlying value growth of the businesses we own. Every quarter, and sometimes more often than quarterly, if there is significant news, we update the value of our businesses. On average, our companies are growing their values well in excess of our long term expectations. Our estimated values are distinct from quoted stock prices. In the short run, price and value can deviate substantially. When our values are rising and stock prices are falling we usually buy more. This investment activity, which is fundamental to our philosophy of producing superior long term results, may hurt our short term results. If our estimates are correct, over our five-year time horizon, we believe price and the increasing value of the businesses we own should converge, resulting in outsized long-term gains while simultaneously helping to reduce risk. By taking advantage of short-term price declines and adding to companies with improving price to value ratios,(c) we believe that we set the stage for long term compounding. The cost of creating this pleasant long term outcome is quarterly or short term results that can deviate, sometimes substantially, from benchmarks. We think the cost is modest because it should enable us to deviate substantially from the benchmarks in the long run as well.in a positive direction.
| | |
| Annual | April 30, 2011 | | 1 |
Shareholder Letter
April 30, 2011 (Unaudited)
Because we have been able to find sufficient numbers of exceptional businesses at equally exceptional discounts to our estimate of fair value, across all market caps, we are feeling very good about our long term prospects. We have no idea what will happen to our portfolios or the market over the balance of the year. We are willing to sacrifice short term performance if we think we can improve our prospects for long term compounding. Regardless of quarterly, or even annual, market price derived performance, know that we, together, own a collection of outstanding businesses with stable, steadily rising values. We own them at a substantial discount to any reasonable estimate of their intrinsic worth. When their results are properly weighed, as they inevitably will be, we believe that we should be rewarded as price rises to reflect value.
Please note in the commentary that follows regarding each Fund, we generally define material contributors and detractors as those having a greater than 1% impact on the Fund portfolio.
Vulcan Value Partners Fund Review
Top contributors to performance included Mastercard Inc. and Direct TV. Year to date, our results were held back by a heavy weighting in technology companies which, in the aggregate, delivered negative returns. We added to our positions in this part of the portfolio, which had a further negative effect on our short term results. If our assessments of these businesses are close to accurate, then adding to the size of our investments should, in our view, deliver outstanding long term returns. We believe that all of our companies have very strong balance sheets, produce ample free cash flow, and have sustainable competitive advantages in the markets they serve. Several of them are aggressively buying in their stock at large discounts, according to our estimate of intrinsic worth, thereby further improving our growth in value per share.
As an example, Microsoft is one of our largest positions. Over the course of the twelve months prior to April 30, 2011, Microsoft’s stock price declined, resulting in a single digit negative year to date return. In contrast, our estimate of value has grown consistently through the company’s production of free cash flow, all of which has been used to repurchase stock at large discounts to our estimate of fair value, and solid bottom line growth. Microsoft’s stock price seems to be depressed because of fears that laptops and PCs will be displaced by new, smaller devices resulting in a waning demand for Microsoft’s PC centric products. Our belief is that the long term global demand for PCs and laptops will remain robust. We also believe that PCs and laptops will remain the anchor for work related tasks and that Microsoft will continue to dominate this business. Tablets and, to a lesser extent, smart phones, should continue to grow and will access data from “anchor” PCs through the cloud. Moreover, Microsoft is well positioned in the cloud based services that will provide the bulk of software used by tablets and smart phones. While Microsoft may or may not have success with consumer functions on tablets and smart phones, its anchor products will most likely continue to be important applications for these devices. Our value for Microsoft is not dependent on the company being successful outside of its existing business lines.
Year to date, our media investments, including Direct TV, Comcast, Walt Disney, and Time Warner Cable, have performed well. We believe they, like Microsoft, are all growing their values steadily, producing ample free cash flow, and allocating capital wisely.
During the year, we have exited Harley Davidson, Dr. Pepper Snapple, Church & Dwight, and Johnson & Johnson. All of these companies were very successful investments for us. Harley Davidson deserves special mention. We started buying Harley Davidson in the Vulcan Value Partners Fund during
| | |
| 2 | | www.vulcanvaluepartners.com |
Shareholder Letter
April 30, 2011 (Unaudited)
February 2010. Despite cyclically depressed results, the company continued to produce free cash flow and did a fantastic job protecting their brand and managing margins during the recession. With a 52.6% gain in the stock since we purchased it, the price rose to reflect value, our margin of safety eroded and we sold it to buy more discounted names including Microsoft and Cisco Systems.
At April 30, 2011, the Vulcan Value Partners Fund is fully invested.
Vulcan Value Partners Small Cap Fund Review
I applaud our research team for their fine work in Small Cap. I do not mean to complement them on our good performance in the quarter – short term performance is a function of the timing of value recognition that we cannot control and for which we should not take credit. Instead, I am pleased with our research productivity. As of April 30, 2011, we have exited four companies but also purchased five new names at attractive discounts to our estimate of fair value. As a result, our price to value ratio has been amazingly constant, despite an extended period of double digit returns.
There were no material detractors to performance. Top contributors to performance included Heartland Payment System and Fair Isaac. Fair Isaac provides sophisticated financial analytics and software products to the financial services industry and is best known for its FICO scores. Their customer base has been severely affected by the credit crisis but they are recovering. Unlike their customers, Fair Isaac has a strong balance sheet and continued to produce strong free cash flow throughout the financial crisis to the present. They recently announced a cost cutting plan and the stock has risen as a result.
Year to date, we have exited four positions:
Genoptix was taken away from us in a buyout.
We sold Harley Davidson. We started buying Harley, in our separate accounts,(d) during the 2008 downturn at absurdly low prices. When we opened Vulcan Value Partners Small Cap Fund, it was one of our initial holdings. Despite cyclically depressed results, the company continued to produce free cash flow and did a fantastic job protecting their brand and managing margins during the recession. With a 55.3% gain in the stock since we purchased it in Vulcan Value Partners Small Cap Fund, the price rose to reflect value, our margin of safety eroded and we sold it to buy more discounted names. When we started buying Harley Davison, it was a small cap. The position became a “small” large cap as its price rose from extremely discounted levels, but it was still too discounted to sell. When it approached our estimate of fair value, we exited the position, and it was a large cap stock. We used the proceeds from Harley Davidson to purchase new small cap stocks. Depending on their value growth and the timing of the recognition of value, these new small caps may or may not be small when we sell them. We will always look for small caps when we sell a position but we will not sell a high quality, discounted company just because it is no longer technically a small cap.
We sold Global Payments. Global Payments is an interesting story. It is a credit card processor and was a solid investment for us. When we bought it, we were not only aware of, but we quantified a meaningful pension fund deficit. We deducted this deficit from our value. We are only able to get detailed information on the pension and other hidden assets and liabilities once a year in the annual 10-K. Allen Cox, a fine analyst who joined us in 2007, had just received the 10-K(e) and discovered that the pension deficit had gotten materially worse compared to previous disclosures. Our estimated
| | |
| Annual | April 30, 2011 | | 3 |
Shareholder Letter
April 30, 2011 (Unaudited)
value dropped, which always sets off alarm bells. By contrast, stock price declines, in and of themselves, do not bother us in the least. Almost simultaneously with our revised valuation, an unnamed Wall Street firm came out with a strong buy on Global Payments, sending the stock price materially higher. One of the rationales for their recommendation was that because the stock had performed well, Global Payments would be able to issue shares for acquisitions. Thanks to Allen’s timely work and our friends on Wall Street, we were able to exit this position at fair value with a substantial gain.
We are very pleased with the new companies we have purchased. As of April 30, 2011, cash levels were approximately 6.31%. This cash is frictional. We are using limit orders and hope to have orders completely filled soon. We are also doing due diligence on several companies that could take our frictional cash to zero quickly. We always expect to be fully invested but frictional cash levels will fluctuate when value recognition is high, as it has been recently.
Closing
Regardless if you are in one or both of our Funds, they are managed the same way. We can control what we invest in and what we pay. We cannot control the timing of when we will get paid. If we focus on the former, the latter will take care of itself. So, at the risk of being repetitive, we caution you that we do not place importance on short term results and will willingly move against the crowd for the opportunity to generate superior long term returns. Our time horizon is five years and yours, as our investment partners, should be as well.
We thank you for the confidence you have placed in us and look forward to updating you again in our next report.
Sincerely,
C.T. Fitzpatrick
Chief Investment Officer
| (a) | Free cash flow – the cash that a company is able to generate after laying out the money required to maintain or expand its asset base. |
| (b) | Fair value – the estimated value of all assets and liabilities of an acquired company used to consolidate the financial statements of both companies. |
| (c) | Price to value ratio – the ratio of current price to intrinsic value of a company. |
| (d) | Separate account – a privately managed investment account opened through a brokerage or financial advisor that uses pooled money to buy individual assets. |
| (e) | Form 10-K – audited document required by the SEC and sent to a public company’s or mutual fund’s shareholders at the end of each fiscal year, reporting the financial results for the year. |
The Shareholder Letter included in this shareholder report contains certain forward-looking statements about the factors that may affect the performance of the Funds in the future. These statements are based on Fund management’s predictions and expectations concerning certain future events and their expected impact on the Funds, such as performance of the economy as a whole and of specific industry sectors, changes in the levels of interest rates, the impact of developing world events, and other factors that may influence the future performance of the Funds. Management believes these forward-looking statements to be reasonable, although they are inherently uncertain and difficult to predict. Actual events may cause adjustments in portfolio management strategies from those currently expected to be employed.
| | |
| 4 | | www.vulcanvaluepartners.com |
Fund Overview
April 30, 2011 (Unaudited)
VULCAN VALUE PARTNERS FUND
Average Annual Total Returns (as of 04/30/2011)
| | | | | | | | | | | | | | | | |
| | | Annualized | | | Expense Ratios ** | |
| | | 1 Year | | | Since Inception* | | | Gross | | | Net*** | |
Vulcan Value Partners Fund | | | 10.82 | % | | | 12.61 | % | | | 4.98 | % | | | 1.51 | % |
| | | | |
Russell 1000® Value Index | | | 18.02 | % | | | 18.79 | % | | | | | | | | |
| | | | |
S&P 500 Total Return Index | | | 17.22 | % | | | 17.69 | % | | | | | | | | |
Performance data quoted represents past performance. Past performance does not guarantee future results. Investment return and principal value of an investment will fluctuate so that an investor’s shares, when sold or redeemed, may be worth more or less than the original cost. Current performance data may be higher or lower than actual data quoted. For the most current month-end performance data, please call 1-877-421-5078.
The table does not reflect the deduction of taxes that a shareholder would pay on Fund distributions or the redemption of Fund shares.
Subject to investment risks, including possible loss of the principal amount invested.
| * | Fund Inception date of 12/30/09. |
| ** | The gross and net expense ratios are as stated in the “Fees and Expenses of the Fund” in the Fund’s current prospectus. |
| *** | Vulcan Value Partners, LLC (“Vulcan” or the “Adviser”) has given a contractual agreement to the Fund that to the extent the Total Annual Fund Operating Expenses (as defined in Item 3 of Form N-1A) with respect to the Fund (exclusive of Acquired Fund Fees and Expenses (if any), brokerage expenses, interest expense, taxes and extraordinary expenses) (“Designated Annual Fund Operating Expenses”) exceed 1.50% of the Fund’s average daily net assets for a particular fiscal year of the Fund, the Adviser will reduce the Management Fee and/or Other Expenses otherwise payable to the Adviser with respect to the Fund for the fiscal year by an amount equal to such excess, and/or the Adviser shall reimburse the Fund by the amount of such excess. This agreement is in effect through August 31, 2011 and will be reevaluated on an annual basis thereafter. Without this agreement, expenses could be higher. If the Adviser foregoes any fees and/or reimburses the Fund pursuant to this letter agreement with respect to a particular fiscal year, then the Adviser shall be entitled to recover from the Fund the amount foregone or reimbursed to the extent Designated Annual Fund Operating Expenses are less than 1.50% of the Fund’s average daily net assets during any fiscal year following such fiscal year. |
| | |
| Annual | April 30, 2011 | | 5 |
Fund Overview
April 30, 2011 (Unaudited)
Performance of $10,000 Initial Investment (as of 04/30/2011)
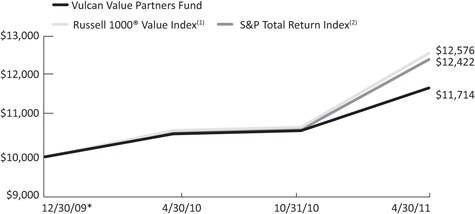
The chart above represents historical performance of a hypothetical investment of $10,000 in the Fund since inception. Past performance does not guarantee future results. This chart does not reflect the deduction of taxes that a shareholder would pay on Fund distributions or the redemption of Fund shares.
| * | Fund Inception date of 12/30/09. |
| (1) | The Russell 1000® Value Index measures the performance of the large-cap value segment of the U.S. equity universe. It includes those Russell 1000® companies with lower price-to-book ratios and lower expected growth values. |
| (2) | The S&P 500 Total Return Index is an unmanaged index of 500 common stocks chosen for market size, liquidity and industry group representation. It is a market-value weighted index. The S&P 500 Index figures do not reflect any fees, expenses or taxes. |
An investor cannot invest directly in an index.
Investing in the Fund is subject to investment risks, including possible loss of the principal amount invested.
Industry Allocation (as a % of Net Assets)
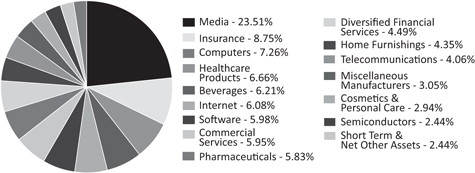
| | |
| 6 | | www.vulcanvaluepartners.com |
Disclosure of Fund Expenses
April 30, 2011 (Unaudited)
As a shareholder of the Vulcan Value Partners Fund (the “Fund”), you will incur two types of costs: (1) transaction costs, including applicable redemptions fees; and (2) ongoing costs, including management fees and other Fund expenses. The following examples are intended to help you understand your ongoing costs (in dollars) of investing in the Fund and to compare these costs with the ongoing costs of investing in other mutual funds. The examples are based on an investment of $1,000 invested on November 1, 2010 and held until April 30, 2011.
Actual Expenses. The first line of each table below provides information about actual account values and actual expenses. You may use the information in this line, together with the amount you invested, to estimate the expenses that you paid over the period. Simply divide your account value by $1,000 (for example, an $8,600 account value divided by $1,000 = 8.6), then multiply the result by the number in the first line under the heading “Expenses Paid During Period” to estimate the expenses you paid on your account during this period.
Hypothetical Example for Comparison Purposes. The second line of the table below provides information about hypothetical account values and hypothetical expenses based on the Fund’s actual expense ratio and an assumed rate of return of 5% per year before expenses, which is not the Fund’s actual return. The hypothetical account values and expenses may not be used to estimate the actual ending account balance or expenses you paid for the period. You may use this information to compare the ongoing costs of investing in the Fund and other mutual funds. To do so, compare this 5% hypothetical example with the 5% hypothetical examples that appear in the shareholder reports of the other funds. The expenses shown in the table are meant to highlight ongoing Fund costs only and do not reflect transaction fees, such as redemption fees or exchange fees. Therefore, the second line of each table below is useful in comparing ongoing costs only, and may not help you determine the relative total costs of owning different funds. In addition, if these transactional costs were included, your costs would have been higher.
Vulcan Value Partners Fund
| | | | | | | | | | | | | | | | |
| | | Beginning Account
Value
11/1/10 | | | Ending Account
Value
4/30/11 | | | Expense
Ratio (a) | | | Expenses Paid
During period
11/1/10 -4/30/11(b) | |
Actual | | $ | 1,000.00 | | | $ | 1,099.90 | | | | 1.50 | % | | $ | 7.81 | |
Hypothetical (5% return before expenses) | | $ | 1,000.00 | | | $ | 1,017.36 | | | | 1.50 | % | | $ | 7.50 | |
| (a) | The Fund’s expense ratios have been annualized based on the Fund’s most recent fiscal half-year expenses. |
| (b) | Expenses are equal to the Fund’s annualized expense ratio, multiplied by the average account value over the period, multiplied by the number of days in the most recent fiscal half-year (181)/365. |
| | |
| Annual | April 30, 2011 | | 7 |
| | | | |
| Statement of Investments | | | Vulcan Value Partners Fund | |
April 30, 2011
| | | | | | | | |
| | | Shares | | | Value (Note 1) | |
COMMON STOCKS (97.56%) | | | | | | | | |
COMMUNICATIONS (33.65%) | | | | | | | | |
Internet (6.08%) Google, Inc., Class A(a) | | | 5,447 | | | $ | 2,963,713 | |
| | | | | | | | |
| | |
Media (23.51%) | | | | | | | | |
Comcast Corp., Class A | | | 91,296 | | | | 2,241,317 | |
DIRECTV, Class A(a) | | | 62,317 | | | | 3,027,982 | |
Discovery Communications, Inc., Class A(a) | | | 16,540 | | | | 732,060 | |
Time Warner Cable, Inc. | | | 28,995 | | | | 2,265,379 | |
Time Warner, Inc. | | | 39,210 | | | | 1,484,491 | |
The Walt Disney Co. | | | 39,595 | | | | 1,706,545 | |
| | | | | | | | |
| | | | | | | 11,457,774 | |
| | | | | | | | |
| | |
Telecommunications (4.06%) | | | | | | | | |
Cisco Systems, Inc. | | | 112,759 | | | | 1,980,048 | |
| | | | | | | | |
| | |
TOTAL COMMUNICATIONS | | | | | | | 16,401,535 | |
| | | | | | | | |
| | |
CONSUMER, CYCLICAL (4.35%) | | | | | | | | |
Home Furnishings (4.35%) Whirlpool Corp. | | | 24,626 | | | | 2,122,269 | |
| | | | | | | | |
| | |
TOTAL CONSUMER, CYCLICAL | | | | | | | 2,122,269 | |
| | | | | | | | |
| | |
CONSUMER, NON-CYCLICAL (27.59%) | | | | | | | | |
Beverages (6.21%) | | | | | | | | |
The Coca-Cola Co. | | | 27,711 | | | | 1,869,384 | |
Diageo PLC, Sponsored ADR | | | 14,213 | | | | 1,156,512 | |
| | | | | | | | |
| | | | | | | 3,025,896 | |
| | | | | | | | |
| | |
Commercial Services (5.95%) | | | | | | | | |
Mastercard, Inc., Class A | | | 10,522 | | | | 2,902,915 | |
| | | | | | | | |
| | |
Cosmetics & Personal Care (2.94%) | | | | | | | | |
The Procter & Gamble Co. | | | 22,058 | | | | 1,431,564 | |
| | | | | | | | |
| | |
Healthcare-Products (6.66%) | | | | | | | | |
C.R. Bard, Inc. | | | 9,318 | | | | 994,697 | |
Medtronic, Inc. | | | 53,990 | | | | 2,254,082 | |
| | | | | | | | |
| | | | | | | 3,248,779 | |
| | | | | | | | |
| | |
| 8 | | www.vulcanvaluepartners.com |
| | | | |
Vulcan Value Partners Fund | | | Statement of Investments | |
April 30, 2011
| | | | | | | | |
| | | Shares | | | Value (Note 1) | |
CONSUMER, NON-CYCLICAL (continued) | | | | | | | | |
Pharmaceuticals (5.83%) | | | | | | | | |
Teva Pharmaceutical Industries, Ltd.,
Sponsored ADR | | | 62,174 | | | $ | 2,843,217 | |
| | | | | | | | |
TOTAL CONSUMER, NON-CYCLICAL | | | | | | | 13,452,371 | |
| | | | | | | | |
| | |
FINANCIALS (13.24%) | | | | | | | | |
Diversified Financial Services (4.49%) | | | | | | | | |
The NASDAQ OMX Group, lnc.(a) | | | 80,845 | | | | 2,190,899 | |
| | | | | | | | |
| | |
Insurance (8.75%) | | | | | | | | |
Chubb Corp. | | | 33,686 | | | | 2,195,990 | |
Everest Re Group, Ltd. | | | 22,723 | | | | 2,070,520 | |
| | | | | | | | |
| | | | | | | 4,266,510 | |
| | | | | | | | |
| | |
TOTAL FINANCIALS | | | | | | | 6,457,409 | |
| | | | | | | | |
| | |
INDUSTRIALS (3.05%) | | | | | | | | |
Miscellaneous Manufacturers (3.05%) Dover Corp. | | | 21,870 | | | | 1,488,035 | |
| | | | | | | | |
| | |
TOTAL INDUSTRIALS | | | | | | | 1,488,035 | |
| | | | | | | | |
| | |
TECHNOLOGY (15.68%) | | | | | | | | |
Computers (7.26%) | | | | | | | | |
Apple, lnc.(a) | | | 4,070 | | | | 1,417,296 | |
Hewlett-Packard Co. | | | 52,499 | | | | 2,119,386 | |
| | | | | | | | |
| | | | | | | 3,536,682 | |
| | | | | | | | |
| | |
Semiconductors (2.44%) | | | | | | | | |
Texas Instruments, Inc. | | | 33,527 | | | | 1,191,214 | |
| | | | | | | | |
| | |
Software (5.98%) | | | | | | | | |
Microsoft Corp. | | | 112,074 | | | | 2,916,165 | |
| | | | | | | | |
| | |
TOTAL TECHNOLOGY | | | | | | | 7,644,061 | |
| | |
| | | | | | | | |
| | |
TOTAL COMMON STOCKS (Cost $43,470,949) | | | | | | | 47,565,680 | |
| | |
| Annual | April 30, 2011 | | 9 |
| | |
| Statement of Investments | | Vulcan Value Partners Fund |
April 30, 2011
| | | | | | | | | | |
| | | 7-Day Yield | | Shares | | | Value
(Note 1) | |
SHORT TERM INVESTMENTS (0.53%) | | | | | | | | | | |
MONEY MARKET FUND (0.53%) | | | | | | | | | | |
Dreyfus Treasury Prime Cash Management Fund, Institutional Shares | | 0.01000% | | | 257,744 | | | $ | 257,744 | |
| | | | | | | | | | |
| | | |
TOTAL SHORT TERM INVESTMENTS | | | | | | | | | | |
(Cost $257,744) | | | | | | | | | 257,744 | |
| | | |
TOTAL INVESTMENTS (98.09%) | | | | | | | | | | |
(Cost $43,728,693) | | | | | | | | $ | 47,823,424 | |
| | | |
Other Assets In Excess Of Liabilities (1.91%) | | | | | | | | | 933,798 | |
| | | |
NET ASSETS (100.00%) | | | | | | | | $ | 48,757,222 | |
| | | | | | | | | | | |
| (a) | Non-Income Producing Security. |
Common Abbreviations:
ADR – American Depositary Receipt.
Ltd. – Limited.
PLC – Public Limited Co.
Holdings are subject to change.
For Fund compliance purposes, the Fund’s industry classifications refer to any one or more of the industry sub-classifications used by one or more widely recognized market indexes or ratings group indexes, and/or as defined by Fund management. This definition may not apply for purposes of this report, which may combine industry subclassifications for reporting ease. Industries are shown as a percent of net assets. These industry classifications are based on third-party definitions. The definitions are industry terms and do not reflect the legal status of any of the investments or the companies in which the Fund has invested.
See Accompanying Notes to Financial Statements.
| | |
| 10 | | www.vulcanvaluepartners.com |
Fund Overview
April 30, 2011 (Unaudited)
VULCAN VALUE PARTNERS SMALL CAP FUND
Average Annual Total Returns (as of 04/30/2011)
| | | | | | | | | | | | | | | | |
| | | Annualized | | | Expense Ratios** | |
| | | 1 Year | | | Since Inception* | | | Gross | | | Net*** | |
Vulcan Value Partners Small Cap Fund | | | 21.75 | % | | | 29.60 | % | | | 7.33 | % | | | 1.52 | % |
| | | | |
Russell 2000® Value Index | | | 14.57 | % | | | 23.85 | % | | | | | | | | |
| | | | |
Russell 2000® Index | | | 22.20 | % | | | 27.89 | % | | | | | | | | |
Performance data quoted represents past performance. Past performance does not guarantee future results. Investment return and principal value of an investment will fluctuate so that an investor’s shares, when sold or redeemed, may be worth more or less than the original cost. Current performance data may be higher or lower than actual data quoted. For the most current month-end performance data, please call 1-877-421-5078.
The table does not reflect the deduction of taxes that a shareholder would pay on Fund distributions or the redemption of Fund shares.
Subject to investment risks, including possible loss of the principal amount invested.
| * | Fund Inception date of 12/30/09. |
| ** | The gross and net expense ratios are as stated in the “Fees and Expenses of the Fund” in the Fund’s current prospectus. |
| *** | Vulcan Value Partners, LLC (“Vulcan” or the “Adviser”) has given a contractual agreement to the Fund that to the extent the Total Annual Fund Operating Expenses (as defined in Item 3 of Form N-1A) with respect to the Fund (exclusive of Acquired Fund Fees and Expenses (if any), brokerage expenses, interest expense, taxes and extraordinary expenses) (“Designated Annual Fund Operating Expenses”) exceed 1.50% of such Fund’s average daily net assets for a particular fiscal year of the Fund, the Adviser will reduce the Management Fee and/or Other Expenses otherwise payable to the Adviser with respect to the Fund for such fiscal year by an amount equal to such excess, and/or the Adviser shall reimburse the Fund by the amount of such excess. This agreement is in effect through August 31, 2011 and will be reevaluated on an annual basis thereafter. Without this agreement, expenses could be higher. If the Adviser foregoes any fees and/or reimburses the Fund pursuant to this letter agreement with respect to a particular fiscal year, then the Adviser shall be entitled to recover from the Fund the amount foregone or reimbursed to the extent Designated Annual Fund Operating Expenses are less than 1.50% of the Fund’s average daily net assets during any fiscal year following such fiscal year. |
| | |
| Annual | April 30, 2011 | | 11 |
Fund Overview
April 30, 2011 (Unaudited)
Performance of $10,000 Initial Investment (as of 04/30/2011)
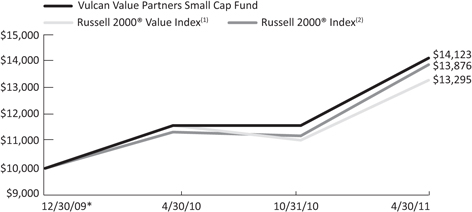
The chart above represents historical performance of a hypothetical investment of $10,000 in the Fund since inception. Past performance does not guarantee future results. This chart does not reflect the deduction of taxes that a shareholder would pay on Fund distributions or the redemption of Fund shares.
| * | Fund Inception date of 12/30/09. |
| (1) | The Russell 2000® Value Index measures the performance of small-cap value segment of the U.S. equity universe. It includes those Russell 2000® companies with lower price-to-book ratios and lower forecasted growth values. |
| (2) | The Russell 2000® Index measures the performance of the small-cap segment of the U.S. equity universe. The Russell 2000® Index is a subset of the Russell 3000® Index representing approximately 8% of the total market capitalization of that index. It includes approximately 2,000 of the smallest securities based on a combination of their market cap and current index membership. |
An investor cannot invest directly in an index.
Investing in the Fund is subject to investment risks, including possible loss of the principal amount invested.
Industry Allocation (as a % of Net Assets)
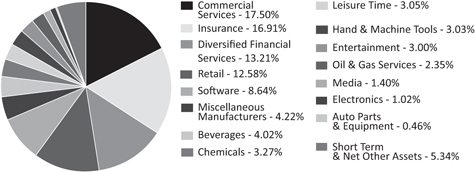
| | |
| 12 | | www.vulcanvaluepartners.com |
Disclosure of Fund Expenses
April 30, 2011 (Unaudited)
As a shareholder of the Vulcan Value Partners Small Cap Fund (the “Fund”), you will incur two types of costs: (1) transaction costs, including applicable redemptions fees; and (2) ongoing costs, including management fees and other Fund expenses. The following examples are intended to help you understand your ongoing costs (in dollars) of investing in the Fund and to compare these costs with the ongoing costs of investing in other mutual funds. The examples are based on an investment of $1,000 invested on November 1, 2010 and held until April 30, 2011.
Actual Expenses. The first line of each table below provides information about actual account values and actual expenses. You may use the information in this line, together with the amount you invested, to estimate the expenses that you paid over the period. Simply divide your account value by $1,000 (for example, an $8,600 account value divided by $1,000 = 8.6), then multiply the result by the number in the first line under the heading “Expenses Paid During Period” to estimate the expenses you paid on your account during this period.
Hypothetical Example for Comparison Purposes. The second line of the table below provides information about hypothetical account values and hypothetical expenses based on the Fund’s actual expense ratio and an assumed rate of return of 5% per year before expenses, which is not the Fund’s actual return. The hypothetical account values and expenses may not be used to estimate the actual ending account balance or expenses you paid for the period. You may use this information to compare the ongoing costs of investing in the Fund and other mutual funds. To do so, compare this 5% hypothetical example with the 5% hypothetical examples that appear in the shareholder reports of the other funds. The expenses shown in the table are meant to highlight ongoing Fund costs only and do not reflect transaction fees, such as redemption fees or exchange fees. Therefore, the second line of each table below is useful in comparing ongoing costs only, and may not help you determine the relative total costs of owning different funds. In addition, if these transactional costs were included, your costs would have been higher.
Vulcan Value Partners Small Cap Fund
| | | | | | | | |
| | | Beginning Account
Value 11/1/10 | | Ending Account Value 4/30/11 | | Expense
Ratio(a) | | Expenses Paid
During period
11/1/10 - 4/30/11(b) |
| | | | |
Actual | | $ 1,000.00 | | $ 1,217.50 | | 1.50% | | $ 8.25 |
Hypothetical (5% return before expenses) | | $ 1,000.00 | | $ 1,017.36 | | 1.50% | | $ 7.50 |
| (a) | The Fund’s expense ratios have been annualized based on the Fund’s most recent fiscal half-year expenses. |
| (b) | Expenses are equal to the Fund’s annualized expense ratio, multiplied by the average account value over the period, multiplied by the number of days in the most recent fiscal half-year (181)/365. |
| | |
| Annual | April 30, 2011 | | 13 |
| | |
| Statement of Investments | | Vulcan Value Partners Small Cap Fund |
April 30, 2011
| | | | | | | | |
| | | Shares | | | Value
(Note 1) | |
COMMON STOCKS (94.66%) | | | | | | | | |
BASIC MATERIALS (3.27%) | | | | | | | | |
Chemicals (3.27%) | | | | | | | | |
KMG Chemicals, Inc. | | | 57,665 | | | $ | 1,187,322 | |
| | | | | | | | |
| | |
TOTAL BASIC MATERIALS | | | | | | | 1,187,322 | |
| | | | | | | | |
| | |
COMMUNICATIONS (1.40%) | | | | | | | | |
Media (1.40%) | | | | | | | | |
Discovery Communications, Inc., Class A(a) | | | 11,476 | | | | 507,928 | |
| | | | | | | | |
| | |
TOTAL COMMUNICATIONS | | | | | | | 507,928 | |
| | | | | | | | |
| | |
CONSUMER, CYCLICAL (19.09%) | | | | | | | | |
Auto Parts & Equipment (0.46%) | | | | | | | | |
Miller Industries, Inc. | | | 10,470 | | | | 165,635 | |
| | | | | | | | |
| | |
Entertainment (3.00%) | | | | | | | | |
Speedway Motorsports, Inc. | | | 69,971 | | | | 1,090,148 | |
| | | | | | | | |
| | |
Leisure Time (3.05%) | | | | | | | | |
Interval Leisure Group, Inc.(a) | | | 68,940 | | | | 1,107,866 | |
| | | | | | | | |
| | |
Retail (12.58%) | | | | | | | | |
Jos A Bank Clothiers, lnc.(a) | | | 22,944 | | | | 1,202,724 | |
Nathan’s Famous, lnc.(a) | | | 79,981 | | | | 1,377,273 | |
Sonic Corp.(a) | | | 178,054 | | | | 1,997,767 | |
| | | | | | | | |
| | | | | | | 4,577,764 | |
| | | | | | | | |
TOTAL CONSUMER, CYCLICAL | | | | | | | 6,941,413 | |
| | | | | | | | |
| | |
CONSUMER, NON-CYCLICAL (21.52%) | | | | | | | | |
Beverages (4.02%) | | | | | | | | |
Dr Pepper Snapple Group, Inc. | | | 37,300 | | | | 1,462,160 | |
| | | | | | | | |
| | |
Commercial Services (17.50%) | | | | | | | | |
CoreLogic, lnc.(a) | | | 88,655 | | | | 1,632,139 | |
Heartland Payment Systems, Inc. | | | 75,880 | | | | 1,514,565 | |
Lender Processing Services, Inc. | | | 56,694 | | | | 1,668,504 | |
| | |
| 14 | | www.vulcanvaluepartners.com |
| | |
| Vulcan Value Partners Small Cap Fund | | Statement of Investments |
April 30, 2011
| | | | | | | | |
| | | Shares | | | Value
(Note 1) | |
CONSUMER, NON-CYCLICAL (continued) | | | | | | | | |
Commercial Services (continued) | | | | | | | | |
Towers Watson & Co., Class A | | | 26,965 | | | $ | 1,546,712 | |
| | | | | | | | |
| | | | | | | 6,361,920 | |
| | | | | | | | |
| | |
TOTAL CONSUMER, NON-CYCLICAL | | | | | | | 7,824,080 | |
| | | | | | | | |
| | |
ENERGY (2.35%) | | | | | | | | |
Oil & Gas Services (2.35%) | | | | | | | | |
Bolt Technology Corp.(a) | | | 58,399 | | | | 854,961 | |
| | | | | | | | |
| | |
TOTAL ENERGY | | | | | | | 854,961 | |
| | | | | | | | |
| | |
FINANCIALS (30.12%) | | | | | | | | |
Diversified Financial Services (13.21%) | | | | | | | | |
Investment Technology Group, lnc.(a) | | | 93,681 | | | | 1,602,882 | |
Janus Capital Group, Inc. | | | 130,675 | | | | 1,590,315 | |
The NASDAQ OMX Group, lnc.(a) | | | 59,388 | | | | 1,609,414 | |
| | | | | | | | |
| | | | | | | 4,802,611 | |
| | | | | | | | |
| | |
Insurance (16.91%) | | | | | | | | |
Endurance Specialty Holdings, Ltd. | | | 32,050 | | | | 1,421,097 | |
Everest Re Group, Ltd. | | | 25,297 | | | | 2,305,063 | |
Markel Corp.(a) | | | 1,575 | | | | 657,216 | |
ProAssurance Corp.(a) | | | 26,636 | | | | 1,768,630 | |
| | | | | | | | |
| | | | | | | 6,152,006 | |
| | | | | | | | |
| | |
TOTAL FINANCIALS | | | | | | | 10,954,617 | |
| | | | | | | | |
| | |
INDUSTRIALS (8.27%) | | | | | | | | |
Electronics (1.02%) | | | | | | | | |
Ituran Location and Control Ltd. | | | 22,826 | | | | 371,151 | |
| | | | | | | | |
| | |
Hand & Machine Tools (3.03%) | | | | | | | | |
Lincoln Electric Holdings, Inc. | | | 14,016 | | | | 1,101,377 | |
| | | | | | | | |
| | |
Miscellaneous Manufacturers (4.22%) | | | | | | | | |
Donaldson Co., Inc. | | | 25,068 | | | | 1,534,914 | |
| | | | | | | | |
| | |
TOTAL INDUSTRIALS | | | | | | | 3,007,442 | |
| | | | | | | | |
| | |
| Annual | April 30, 2011 | | 15 |
| | |
Statement of Investments | | Vulcan Value Partners Small Cap Fund |
| April 30, 2011 | | |
| | | | | | | | | | | | |
| | | | | | Shares | | | Value
(Note 1) | |
TECHNOLOGY (8.64%) | | | | | | | | | | | | |
Software (8.64%) | | | | | | | | | | | | |
Dun & Bradstreet Corp. | | | | | | | 19,597 | | | $ | 1,610,481 | |
Fair Isaac Corp. | | | | | | | 51,279 | | | | 1,532,217 | |
| | | | | | | | | | | | |
| | | | | | | | | | | 3,142,698 | |
| | | | | | | | | | | | |
TOTAL TECHNOLOGY | | | | | | | | | | | 3,142,698 | |
| | | | | | | | | | | | |
| | | | | | | | | | | | |
TOTAL COMMON STOCKS (Cost $30,340,923) | | | | | | | | | | | 34,420,461 | |
| | | |
| | | 7-Day Yield | | | Shares | | | Value (Note 1) | |
SHORT TERM INVESTMENTS (6.37%) | | | | | | | | | | | | |
MONEY MARKET FUND (6.37%) | | | | | | | | | | | | |
Dreyfus Treasury Prime Cash Management Fund, Institutional Shares | | | 0.01000 | % | | | 2,316,285 | | | | 2,316,285 | |
| | | | | | | | | | | | |
| | | |
TOTAL SHORT TERM INVESTMENTS (Cost $2,316,285) | | | | | | | | | | | 2,316,285 | |
| | | |
TOTAL INVESTMENTS (101.03%) | | | | | | | | | | | | |
(Cost $32,657,208) | | | | | | | | | | $ | 36,736,746 | |
| | | |
Liabilities In Excess Of Other Assets (-1.03%) | | | | | | | | | | | (373,928) | |
| | | |
NET ASSETS (100.00%) | | | | | | | | | | $ | 36,362,818 | |
| | |
| (a) | Non-Income Producing Security. |
Common Abbreviations:
ADR – American Depositary Receipt.
Ltd. – Limited.
PLC – Public Limited Co.
Holdings are subject to change.
For Fund compliance purposes, the Fund’s industry classifications refer to any one or more of the industry sub-classifications used by one or more widely recognized market indexes or ratings group indexes, and/or as defined by Fund management. This definition may not apply for purposes of this report, which may combine industry subclassifications for reporting ease. Industries are shown as a percent of net assets. These industry classifications are based on third-party definitions. The definitions are industry terms and do not reflect the legal status of any of the investments or the companies in which the Fund has invested.
See Accompanying Notes to Financial Statements.
| | |
| 16 | | www.vulcanvaluepartners.com |
Statements of Assets and Liabilities
April 30, 2011
| | | | | | | | |
| | | Vulcan Value Partners
Fund | | | Vulcan Value Partners
Small Cap Fund | |
ASSETS: | | | | | | | | |
Investments, at value | | $ | 47,823,424 | | | $ | 36,736,746 | |
Cash | | | 500 | | | | – | |
Receivable for investments sold | | | 978,289 | | | | – | |
Receivable for shares sold | | | – | | | | 33,544 | |
Interest and dividends receivable | | | 19,270 | | | | 6,553 | |
Other assets | | | 11,709 | | | | 13,611 | |
Total assets | | | 48,833,192 | | | | 36,790,454 | |
| | |
LIABILITIES: | | | | | | | | |
Payable for investments purchased | | | – | | | | 366,724 | |
Payable to adviser | | | 31,591 | | | | 19,333 | |
Payable for administration fees | | | 10,620 | | | | 8,057 | |
Payable for transfer agency fees | | | 6,287 | | | | 7,016 | |
Payable to trustees | | | 2,107 | | | | 1,489 | |
Accrued expenses and other liabilities | | | 25,365 | | | | 25,017 | |
Total liabilities | | | 75,970 | | | | 427,636 | |
| | | | | | | | | |
NET ASSETS | | $ | 48,757,222 | | | $ | 36,362,818 | |
| | | | | | | | | |
| | |
NET ASSETS CONSIST OF: | | | | | | | | |
| | |
Paid-in capital | | $ | 43,896,030 | | | $ | 30,374,384 | |
Undistibuted net investment income | | | 969 | | | | – | |
Accumulated net realized gain on investments | | | 765,492 | | | | 1,908,896 | |
Net unrealized appreciation in value of investments | | | 4,094,731 | | | | 4,079,538 | |
| | |
NET ASSETS | | $ | 48,757,222 | | | $ | 36,362,818 | |
| | | | | | | | | |
| | |
INVESTMENTS, AT COST | | $ | 43,728,693 | | | $ | 32,657,208 | |
| | |
PRICING OF SHARES: | | | | | | | | |
Net Asset Value, offering and redemption price per share | | $ | 11.66 | | | $ | 13.72 | |
Shares of beneficial interest outstanding (unlimited number of shares, no par value common stock authorized) | | | 4,181,839 | | | | 2,650,028 | |
See Accompanying Notes to Financial Statements.
| | |
| Annual | April 30, 2011 | | 17 |
Statements of Operations
For the Year Ended April 30, 2011
| | | | | | | | |
| | | Vulcan Value Partners
Fund | | | Vulcan Value Partners
Small Cap Fund | |
INVESTMENT INCOME: | | | | | | | | |
Dividends | | $ | 416,390 | | | $ | 158,371 | |
Foreign taxes withheld | | | (784 | ) | | | – | |
Interest | | | 83 | | | | 72 | |
Total investment income | | | 415,689 | | | | 158,443 | |
| | |
EXPENSES: | | | | | | | | |
Investment advisory fees | | | 264,916 | | | | 249,270 | |
Administrative fees | | | 120,950 | | | | 95,975 | |
Transfer agency fees | | | 51,174 | | | | 59,721 | |
Legal and audit fees | | | 21,885 | | | | 22,438 | |
Offering cost | | | 27,473 | | | | 27,634 | |
Custodian fees | | | 12,000 | | | | 12,000 | |
Trustees’ fees and expenses | | | 5,655 | | | | 4,231 | |
Other | | | 27,363 | | | | 27,388 | |
Total expenses before waiver | | | 531,416 | | | | 498,657 | |
Less fees waived/reimbursed by investment advisor | | | (134,059 | ) | | | (199,532 | ) |
Total net expenses | | | 397,357 | | | | 299,125 | |
| | |
NET INVESTMENT INCOME/(LOSS) | | | 18,332 | | | | (140,682 | ) |
| | |
Net realized gain on investments | | | 879,538 | | | | 2,221,811 | |
Net change in unrealized appreciation of investments | | | 3,194,574 | | | | 3,389,029 | |
NET REALIZED AND UNREALIZED GAIN ON INVESTMENTS | | | 4,074,112 | | | | 5,610,840 | |
NET INCREASE IN NET ASSETS RESULTING FROM OPERATIONS | | $ | 4,092,444 | | | $ | 5,470,158 | |
| | | | | | | | | |
See Accompanying Notes to Financial Statements.
| | |
| 18 | | www.vulcanvaluepartners.com |
Statements of Changes in Net Assets
| | | | | | | | |
| | | Vulcan Value Partners Fund | |
| | |
| | | For the Year Ended April 30, 2011 | | | For the Period
December 30, 2009
(Inception) to April 30, 2010 | |
OPERATIONS: | | | | | | | | |
Net investment income/(loss) | | $ | 18,332 | | | $ | (1,471 | ) |
Net realized gain/(loss) on investments | | | 879,538 | | | | (1,652 | ) |
Net change in unrealized appreciation on investments | | | 3,194,574 | | | | 900,157 | |
Net increase in net assets resulting from operations | | | 4,092,444 | | | | 897,034 | |
| | |
DISTRIBUTIONS TO SHAREHOLDERS (Note 1): | | | | | | | | |
From net investment income | | | (44,569 | ) | | | – | |
From net realized gains on investments | | | (112,394 | ) | | | – | |
Total distributions | | | (156,963 | ) | | | – | |
| | |
SHARE TRANSACTIONS: (Note 3) | | | | | | | | |
Proceeds from sales of shares | | | 32,541,935 | | | | 12,180,711 | |
Issued to shareholders in reinvestment of distributions | | | 148,586 | | | | – | |
Cost of shares redeemed, net of redemption fees | | | (675,867 | ) | | | (270,658 | ) |
Net increase from share transactions | | | 32,014,654 | | | | 11,910,053 | |
| | |
Net increase in net assets | | | 35,950,135 | | | | 12,807,087 | |
| | |
NET ASSETS: | | | | | | | | |
Beginning of period | | | 12,807,087 | | | | – | |
End of year* | | $ | 48,757,222 | | | $ | 12,807,087 | |
| | | | | | | | | |
| | |
*Includes undistributed net investment income/(loss) of: | | $ | 969 | | | $ | 3,496 | |
See Accompanying Notes to Financial Statements.
| | |
| Annual | April 30, 2011 | | 19 |
Statements of Changes in Net Assets
| | | | | | | | |
| | | Vulcan Value Partners Small Cap Fund | |
| | |
| | | For the
Year Ended
April 30, 2011 | | | For the Period
December 30, 2009
(Inception) to
April 30, 2010 | |
OPERATIONS: | | | | | | | | |
Net investment loss | | $ | (140,682 | ) | | $ | (7,493 | ) |
Net realized gain on investments | | | 2,221,811 | | | | 334,390 | |
Net change in unrealized appreciation on investments | | | 3,389,029 | | | | 690,509 | |
Net increase in net assets resulting from operations | | | 5,470,158 | | | | 1,017,406 | |
| | |
DISTRIBUTIONS TO SHAREHOLDERS (Note 1): | | | | | | | | |
From net realized gains on investments | | | (524,784 | ) | | | – | |
Total distributions | | | (524,784 | ) | | | – | |
| | |
SHARE TRANSACTIONS: (Note 3) | | | | | | | | |
Proceeds from sales of shares | | | 25,881,789 | | | | 6,207,738 | |
Issued to shareholders in reinvestment of distributions | | | 518,379 | | | | – | |
Cost of shares redeemed, net of redemption fees | | | (2,207,868 | ) | | | – | |
Net increase from share transactions | | | 24,192,300 | | | | 6,207,738 | |
| | |
Net increase in net assets | | | 29,137,674 | | | | 7,225,144 | |
| | |
| | |
NET ASSETS: | | | | | | | | |
Beginning of period | | | 7,225,144 | | | | – | |
End of year* | | $ | 36,362,818 | | | $ | 7,225,144 | |
| | | | | | | | | |
| | |
*Includes undistributed net investment income/(loss) of: | | $ | 0 | | | $ | 0 | |
See Accompanying Notes to Financial Statements.
| | |
| 20 | | www.vulcanvaluepartners.com |
| | | | |
Vulcan Value Partners Fund | | Financial Highlights |
| For a share outstanding throughout the periods presented |
| | | | | | | | |
| | | For the Year Ended
April 30, 2011 | | | For the Period
December 30, 2009
(Inception) to
April 30, 2010 | |
NET ASSET VALUE, BEGINNING OF PERIOD | | $ | 10.57 | | | $ | 10.00 | |
INCOME/(LOSS) FROM OPERATIONS: | | | | | | | | |
Net investment income | | | 0.01 | (a) | | | (0.00 | )(b) |
Net realized and unrealized gain on investments | | | 1.13 | | | | 0.57 | |
Total from investment operations | | | 1.14 | | | | 0.57 | |
| | |
LESS DISTRIBUTIONS TO SHAREHOLDERS: | | | | | | | | |
From net investment income | | | (0.01 | ) | | | – | |
Distributions from net realized gain on investments | | | (0.04 | ) | | | – | |
Total distributions | | | (0.05 | ) | | | – | |
| | |
Redemption fees added to paid in capital (Note 3) | | | 0.00 | (b) | | | 0.00 | (b) |
Increase in net asset value | | | 1.09 | | | | 0.57 | |
NET ASSET VALUE, END OF YEAR | | $ | 11.66 | | | $ | 10.57 | |
| | | | | | | | | |
| | |
Total return | | | 10.82 | % | | | 5.70 | %(c) |
| | |
RATIOS AND SUPPLEMENTAL DATA: | | | | | | | | |
Net assets, end of period (000’s) | | $ | 48,757 | | | $ | 12,807 | |
Ratio of expenses to average net assets including fee waivers/reimbursements | | | 1.50 | % | | | 1.50 | %(d) |
Ratio of expenses to average net assets without fee waivers/reimbursements | | | 2.01 | % | | | 4.97 | %(d) |
Net investment income/loss) to average net assets including fee waivers/reimbursements | | | 0.07 | % | | | (0.06 | %)(d) |
Portfolio turnover rate | | | 44 | % | | | 24 | % |
| (a) | Per share numbers have been calculated using the average shares method. |
| (b) | Less than $0.005 per share. |
See Accompanying Notes to Financial Statements.
| | |
| Annual | April 30, 2011 | | 21 |
| | | | |
Financial Highlights | | Vulcan Value Partners Small Cap Fund |
| For a share outstanding throughout the periods presented |
| | | | | | | | |
| | | For the Year Ended
April 30, 2011 | | | For the Period
December 30, 2009
(Inception) to
April 30, 2010 | |
NET ASSET VALUE, BEGINNING OF PERIOD | | $ | 11.60 | | | $ | 10.00 | |
INCOME/(LOSS) FROM OPERATIONS: | | | | | | | | |
Net investment loss | | | (0.09 | )(a) | | | (0.00 | )(b) |
Net realized and unrealized gain on investments | | | 2.55 | | | | 1.60 | |
Total from investment operations | | | 2.46 | | | | 1.60 | |
| | |
LESS DISTRIBUTIONS TO SHAREHOLDERS: | | | | | | | | |
Distributions from net realized gain on investments | | | (0.34 | ) | | | – | |
Total distributions | | | (0.34 | ) | | | – | |
| | |
Redemption fees added to paid in capital (Note 3) | | | 0.00 | (b) | | | | |
Increase in net asset value | | | 2.12 | | | | 1.60 | |
NET ASSET VALUE, END OF YEAR | | $ | 13.72 | | | $ | 11.60 | |
| | | | | | | | | |
| | |
Total return | | | 21.75 | % | | | 16.00 | %(c) |
| | |
RATIOS AND SUPPLEMENTAL DATA: | | | | | | | | |
Net assets, end of period (000’s) | | $ | 36,363 | | | $ | 7,225 | |
Ratio of expenses to average net assets including fee waivers/reimbursements | | | 1.50 | % | | | 1.50 | %(d) |
Ratio of expenses to average net assets without fee waivers/reimbursements | | | 2.50 | % | | | 7.31 | %(d) |
Net investment loss to average net assets including fee waivers/reimbursements | | | (0.71 | %) | | | (0.57 | %)(d) |
Portfolio turnover rate | | | 60 | % | | | 33 | % |
| (a) | Per share numbers have been calculated using the average shares method. |
| (b) | Less than $0.005 per share. |
See Accompanying Notes to Financial Statements.
| | |
| 22 | | www.vulcanvaluepartners.com |
Notes to Financial Statements
April 30, 2011
1. ORGANIZATION AND SIGNIFICANT ACCOUNTING POLICIES
Financial Investors Trust (the “Trust”) was organized as a Delaware statutory trust on November 30, 1993, and registered as an open-end management investment company under the Investment Company Act of 1940, as amended (“1940 Act”). Vulcan Value Partners Fund and Vulcan Value Partners Small Cap Fund (the “Funds”) are two of eleven separate funds offered to the public under the Trust as of April 30, 2011. Each Fund commenced operations on December 30, 2009, has one class of shares authorized, and seeks to achieve long-term capital appreciation.
The following is a summary of significant accounting policies consistently followed by each Fund in the preparation of its financial statements. The policies are in conformity with accounting principles generally accepted in the United States of America (“GAAP”) for investment companies.
Investment Valuation: The Board of Trustees (“Board” or ‘Trustees”) has approved procedures to be used to value each Fund’s securities for the purposes of determining each Fund’s net asset value (“NAV”). The valuation of the securities of the Funds is determined in good faith by or under the direction of the Board. The Board has delegated certain valuation functions for the Funds to ALPS Fund Services, Inc. (“ALPS” or the “Administrator”).
Each Fund generally values its securities based on market prices determined at the close of regular trading on the New York Stock Exchange (“NYSE”), normally 4:00 p.m. Eastern time.
For equity securities and funds that are traded on an exchange, the market price is usually the closing sale or official closing price on that exchange. In the case of equity securities not traded on an exchange, or if such closing prices are not otherwise available, the market price is typically determined by independent third party pricing vendors approved by the Board using a variety of pricing techniques and methodologies. The market price for debt obligations is generally the price supplied by an independent third-party pricing service approved by the Board, which may use a matrix, formula or other objective method that takes into consideration market indices, yield curves and other specific adjustments. Short-term debt obligations that will mature in 60 days or less are valued at amortized cost, unless it is determined that using this method would not reflect an investment’s fair value. If vendors are unable to supply a price, or if the price supplied is deemed to be unreliable, the market price may be determined using quotations received from one or more brokers-dealers that make a market in the security. Investments in non-exchange traded funds are fair valued at their respective net asset values.
When such prices or quotations are not available, or when the Fair Value Committee appointed by the Board believes that they are unreliable, securities may be priced using fair value procedures approved by the Board. The Funds may also use fair value procedures if the Fair Value Committee determines that a significant event has occurred between the time at which a market price is determined and the time at which a Fund’s NAV is calculated. In particular, the value of non-U.S. securities may be materially affected by events occurring after the close of the foreign exchange on which they are traded, but before a Fund prices its shares. In addition, a Fund may utilize modeling tools provided by third-party vendors to determine fair values of non-U.S. securities. The Funds’ use of fair value pricing may help deter “stale price arbitrage.”
| | |
| Annual | April 30, 2011 | | 23 |
Notes to Financial Statements
April 30, 2011
The Funds disclose the classification of their fair value measurements following a three-tier hierarchy based on the inputs used to measure fair value. Inputs refer broadly to the assumptions that market participants would use in pricing the asset or liability, including assumptions about risk. Inputs may be observable or unobservable. Observable inputs reflect the assumptions market participants would use in pricing the asset or liability that are developed based on market data obtained from sources independent of the reporting entity. Unobservable inputs reflect the reporting entity’s own assumptions about the assumptions market participants would use in pricing the asset or liability that are developed based on the best information available.
Various inputs are used in determining the value of each Fund’s investments as of the end of the reporting period. When inputs used fall into different levels of the fair value hierarchy, the level in the hierarchy within which the fair value measurement falls is determined based on the lowest level input that is significant to the fair value measurement in its entirety. The designated input levels are not necessarily an indication of the risk or liquidity associated with these investments. These inputs are categorized in the following hierarchy under applicable financial accounting standards:
| | |
Level 1 – | | Unadjusted quoted prices in active markets for identical investments |
Level 2 – | | Other significant observable inputs (including quoted prices for similar investments, interest rates, prepayment speeds, credit risk, etc.) |
Level 3 – | | Significant unobservable inputs (including the Fund’s own assumptions in determining the fair value of investments) |
The following is a summary of each Fund’s investments in the fair value hierarchy as of April 30, 2011.
Vulcan Value Partners Fund:
| | | | | | | | | | | | | | | | |
| Investments in Securities at Value | | Level 1 -
Unadjusted
Quoted Prices | | | Level 2 - Other
Significant
Observable
Inputs | | | Level 3 -
Significant
Unobservable
Inputs | | | Total | |
Common Stocks(a) | | $ | 47,565,680 | | | $ | – | | | $ | – | | | $ | 47,565,680 | |
Short Term Investments | | | 257,744 | | | | – | | | | – | | | | 257,744 | |
| | |
TOTAL | | $ | 47,823,424 | | | $ | – | | | $ | – | | | $ | 47,823,424 | |
| | |
Vulcan Value Partners Small Cap Fund:
| | | | | | | | | | | | | | | | |
| Investments in Securities at Value | | Level 1 -
Unadjusted
Quoted Prices | | | Level 2 - Other
Significant
Observable
Inputs | | | Level 3 -
Significant
Unobservable
Inputs | | | Total | |
Common Stocks(a) | | $ | 34,420,461 | | | $ | – | | | $ | – | | | $ | 34,420,461 | |
Short Term Investments | | | 2,316,285 | | | | – | | | | – | | | | 2,316,285 | |
| | |
TOTAL | | $ | 36,736,746 | | | $ | – | | | $ | – | | | $ | 36,736,746 | |
| | |
| (a) | For detailed descriptions, see the accompanying Statements of Investments. |
| | |
| 24 | | www.vulcanvaluepartners.com |
Notes to Financial Statements
April 30, 2011
For the year ended April 30, 2011, the Funds did not have any significant transfers between Level 1 and Level 2 securities. The Funds did not have any securities which used significant unobservable inputs (Level 3) in determining fair value.
Investment Transactions: Investment and shareholder transactions are accounted for on the date the investments are purchased or sold (trade date). Realized gains and losses from investment transactions are reported on an identified cost basis, which is the same basis the Funds use for federal income tax purposes. Interest income, which includes accretion of discounts, is accrued and recorded as earned. Dividend income is recognized on the ex-dividend date or for certain foreign securities, as soon as information is available to the Funds.
Foreign Securities: The Funds may directly purchase securities of foreign issuers. Investing in securities of foreign issuers involves special risks not typically associated with investing in securities of U.S. issuers. The risks include possible reevaluation of currencies, the inability to repatriate foreign currency, less complete financial information about companies and possible future adverse political and economic developments. Moreover, securities of many foreign issuers and their markets may be less liquid and their prices more volatile than those of securities of comparable U.S. issuers.
Expenses: Some expenses of the Trust can be directly attributed to the Funds. Expenses which cannot be directly attributed are apportioned among all funds in the Trust based on average net assets.
Offering costs of open-end mutual funds are amortized to expense over 12 months on a straight-line basis. During the year ended April 30, 2011, the Vulcan Value Partners Fund and Vulcan Value Partners Small Cap Fund expensed all remaining deferred offering costs of $27,473 and $27,634, respectively.
Use of Estimates: Each Fund’s financial statements are prepared in accordance with GAAP. This requires management to make estimates and assumptions that affect (a) the reported amounts of assets and liabilities and disclosure of contingent assets and liabilities at the date of the financial statements, and (b) the reported amounts of increases and decreases in net assets from operations during the reporting period. Actual results could differ from these estimates.
Federal Income Taxes: Each Fund complies with the requirements under Subchapter M of the Internal Revenue Code applicable to regulated investment companies and intends to distribute substantially all of its net taxable income and net capital gains, if any, each year. The Funds are not subject to income taxes to the extent such distributions are made.
During the fiscal period ended April 30, 2011, the Funds did not have liability for any unrecognized tax benefits in the accompanying financial statements. The Funds file income tax returns in the U.S. federal jurisdiction and the State of Colorado.
Distributions to Shareholders: Each Fund normally pays dividends and distributes capital gains, if any, on an annual basis. Income dividend distributions are derived from interest and other income each Fund receives from its investments, including distributions of short-term capital gains. Capital gain distributions are derived from gains realized when each Fund sells a security it has owned for more than a year. Each Fund may make additional distributions and dividends at other times if the portfolio manager believes doing so may be necessary for each Fund to avoid or reduce taxes. Net
| | |
| Annual | April 30, 2011 | | 25 |
Notes to Financial Statements
April 30, 2011
investment income/(loss) and net realized gain/(loss) may differ for financial statement and tax purposes. The character of distributions made during the year from net investment income or net realized gains may differ from its ultimate characterization for federal income tax purposes.
Also, due to the timing of dividend distributions, the fiscal year in which amounts are distributed may differ from the fiscal year in which the income or realized gain were recorded by each Fund.
Components of Earnings: At April 30, 2011, permanent differences in book and tax accounting were reclassified. These differences had no effect on net assets and were primarily attributed to stock issuance costs and treatment of net investment loss. The reclassifications were as follows:
| | | | | | | | |
| | | Vulcan Value Partners
Fund | | | Vulcan Value Partners
Small Cap Fund | |
Decrease Paid In-Capital | | $ | (23,710 | ) | | $ | (22,401 | ) |
| | |
Increase Accumulated | | | | | | | | |
Net Investment Income | | | 23,710 | | | | 140,682 | |
| | |
Decrease Accumulated | | | | | | | | |
Net Realized Loss | | $ | 0 | | | $ | (118,281 | ) |
| | |
As of April 30, 2011, the components of distributable earnings on a tax basis were as follows:
| | | | | | | | |
| | | Vulcan Value Partners
Fund | | | Vulcan Value Partners
Small Cap Fund | |
Undistributed ordinary income | | $ | 799,536 | | | $ | 1,921,510 | |
Accumulated net realized gain | | | 17,414 | | | | 71,283 | |
Unrealized Appreciation | | | 4,044,242 | | | | 3,995,641 | |
| | |
Total | | $ | 4,861,192 | | | $ | 5,988,434 | |
| | |
The differences between book-basis and tax-basis are primarily due to the deferral of post October losses and wash sale losses.
As of April 30, 2011, the cost of securities on a tax basis and gross unrealized appreciation/(depreciation) on investments for federal income tax purposes were as follows:
| | | | | | | | |
| | | Vulcan Value Partners
Fund | | | Vulcan Value Partners
Small Cap Fund | |
Gross appreciation | | | | | | | | |
(excess of value over tax cost) | | $ | 5,215,754 | | | $ | 4,368,218 | |
Gross depreciation | | | | | | | | |
(excess of tax cost over value) | | | (1,171,512 | ) | | | (372,577 | ) |
| | |
Net unrealized appreciation | | | 4,044,242 | | | | 3,995,641 | |
| | |
Cost of investments for income tax purposes | | $ | 43,779,182 | | | $ | 32,741,105 | |
| | |
Post October Losses: Under current tax law, capital and currency losses realized after October 31 may be deferred and treated as occurring on the first day of the following fiscal year. For the fiscal period ended April 30, 2011, the Funds elected to defer losses occurring between November 1, 2010 and April 30, 2011 in the amounts of $0 for the Vulcan Value Partners Fund and $0 for the Vulcan Value Partners Small Cap Fund.
| | |
| 26 | | www.vulcanvaluepartners.com |
Notes to Financial Statements
April 30, 2011
2. SECURITIES TRANSACTIONS
The cost of purchases and proceeds from sales of securities (excluding short-term securities) during the year ended April 30, 2011, was as follows:
| | | | | | | | |
| Fund | | Purchase
of Securities | | | Proceeds from Sales
of Securities | |
Vulcan Value Partners Fund | | $ | 42,726,783 | | | $ | 11,916,055 | |
Vulcan Value Partners Small Cap Fund | | | 33,036,105 | | | | 11,353,193 | |
3. CAPITAL SHARE TRANSACTIONS
Shares redeemed within 90 days of purchase may incur a 2% short-term redemption fee deducted from the redemption amount. The Vulcan Value Partners Fund and the Vulcan Value Partners Small Cap Fund retained $6,106 and $3,076, respectively, for year ended April 30, 2011, which is reflected in the “Shares redeemed” in the Statement of Changes in Net Assets. Transactions in shares of capital stock for the dates listed below were as follows:
Vulcan Value Partners Fund
| | | | | | | | |
| | | For the Year Ended
April 30, 2011 | | | For the Period
December 30, 2009
(Inception) to
April 30, 2010 | |
Shares Sold | | | 3,016,906 | | | | 1,237,792 | |
Shares Issued in Reinvestment of Dividends | | | 14,011 | | | | – | |
Less Shares Redeemed | | | (61,203 | ) | | | (25,667 | ) |
| | |
Net Increase | | | 2,969,714 | | | | 1,212,125 | |
| | |
Vulcan Value Partners Small Cap Fund
| | | | | | | | |
| | | For the Year Ended
April 30, 2011 | | | For the Period
December 30, 2009
(Inception) to
April 30, 2010 | |
Shares Sold | | | 2,157,470 | | | | 622,805 | |
Shares Issued in Reinvestment of Dividends | | | 44,382 | | | | – | |
Less Shares Redeemed | | | (174,629 | ) | | | – | |
| | |
Net Increase | | | 2,027,223 | | | | 622,805 | |
| | |
4. MANAGEMENT AND RELATED-PARTY TRANSACTIONS
Vulcan, subject to the authority of the Board, is responsible for the overall management and administration of the Funds’ business affairs. Vulcan manages the investments of the Funds in accordance with each Fund’s investment objective, policies and limitations and investment guidelines established jointly by the Adviser and the Trustees. Pursuant to the Investment Advisory Agreement (the “Advisory Agreement”), the Funds pay Vulcan an annual management fee of 1.00% and 1.25% for Vulcan Value Partners Fund and Vulcan Value Partners Small Cap Fund, respectively, based on each Fund’s average daily net assets. Vulcan has contractually agreed with the Funds to limit the amount of each Fund’s total annual expenses (exclusive of distribution and service (12b-l) fees, acquired fund fees and expenses, brokerage expenses, interest expense, taxes and extraordinary expenses) to 1.50% of each Fund’s average daily net assets. This agreement is in effect through August 31, 2011 and is reevaluated on an annual basis. Without this agreement,
| | |
| Annual | April 30, 2011 | | 27 |
Notes to Financial Statements
April 30, 2011
expenses could be higher. The Adviser is permitted to recover expenses it has borne through the agreement described above to the extent that each Fund’s expenses in later periods fall below the annual rates set forth in the relevant agreement. If the Adviser foregoes any fees and/or reimburses a Fund pursuant to this agreement with respect to a particular fiscal year, then the Adviser shall be entitled to recover from the Fund the amount forgone or reimbursed to the extent Designated Annual Fund Operating Expenses are less than 1.50% of the Fund’s average daily net assets during any fiscal year following such fiscal year.
Distributor: ALPS Distributors, Inc. (an affiliate of ALPS) (“ADI” or the “Distributor”) acts as the distributor of each Fund’s shares pursuant to a Distribution Agreement with the Trust. Shares are sold on a continuous basis by ADI as agent for the Funds, and ADI has agreed to use its best efforts to solicit orders for the sale of each Fund’s shares, although it is not obliged to sell any particular amount of shares. ADI is not entitled to any compensation for its services as Distributor. ADI is registered as a broker-dealer with the Securities and Exchange Commission.
Administrator: ALPS (an affiliate of ADI and AAI) serves as administrator to the Funds, and each Fund has agreed to pay expenses incurred in connection with its administrative activities. Pursuant to the Administration, Bookkeeping and Pricing Services Agreement (the “Agreement”), ALPS will provide operational services to the Funds including, but not limited to fund accounting and fund administration and generally assist in each Fund’s operations. The table below describes the administrative fee paid by the Funds to ALPS pursuant to the Agreement during the year ended April 30, 2011:
Annual Administrative Fee, billed monthly, in the amount of the greater of $220,500 annual minimum or:
| | (i) | 5.0 basis points of the Funds’ average net assets between $0 – $500 million; and |
| | (ii) | 3.0 basis points of the Funds’ average net assets between $500 million – $1 billion; and |
| | (iii) | 2.0 basis points of the Funds’ average net assets over $1 billion. |
5. INDEMNIFICATIONS
Under the Trust’s organizational documents, its officers and Trustees are indemnified against certain liability arising out of the performance of their duties to the Trust. Additionally, in the normal course of business, the Trust enters into contracts with service providers that contain general indemnification clauses. The Trust’s maximum exposure under these arrangements is unknown, as this would involve future claims that may be made against the Trust that have not yet occurred.
| | |
| 28 | | www.vulcanvaluepartners.com |
Report of Independent Registered Public Accounting Firm
To the Shareholders and Board of Trustees of Financial Investors Trust:
We have audited the accompanying statements of assets and liabilities of Vulcan Value Partners Fund and Vulcan Value Partners Small Cap Fund, two of the portfolios of Financial Investors Trust (the “Funds”), including the statements of investments, as of April 30, 2011, the related statements of operations for the year then ended, and the statements of changes in net assets and the financial highlights for the year ended April 30, 2011 and for the period from December 30, 2009 (inception) to April 30, 2010. These financial statements and financial highlights are the responsibility of the Funds’ management. Our responsibility is to express an opinion on these financial statements and financial highlights based on our audits.
We conducted our audits in accordance with the standards of the Public Company Accounting Oversight Board (United States). Those standards require that we plan and perform the audit to obtain reasonable assurance about whether the financial statements and financial highlights are free of material misstatement. The Funds are not required to have, nor were we engaged to perform, an audit of its internal control over financial reporting. Our audits included consideration of internal control over financial reporting as a basis for designing audit procedures that are appropriate in the circumstances, but not for the purpose of expressing an opinion on the effectiveness of the Funds’ internal control over financial reporting. Accordingly, we express no such opinion. An audit also includes examining, on a test basis, evidence supporting the amounts and disclosures in the financial statements, assessing the accounting principles used and significant estimates made by management, as well as evaluating the overall financial statement presentation. Our procedures included confirmation of securities owned as of April 30, 2011, by correspondence with the custodian and brokers; where replies were not received from brokers, we performed other auditing procedures. We believe that our audits provide a reasonable basis for our opinion.
In our opinion the financial statements and financial highlights referred to above present fairly, in all material respects, the financial position of Vulcan Value Partners Fund and Vulcan Value Partners Small Cap Fund as of April 30, 2011, the results of their operations for the year then ended, the changes in their net assets and the financial highlights for the year ended April 30, 2011 and the period from December 30, 2009 (inception) to April 30, 2010 in conformity with accounting principles generally accepted in the United States of America.
DELOITTE & TOUCHE LLP
Denver, Colorado
June 29, 2011
| | |
| Annual | April 30, 2011 | | 29 |
Additional Information
April 30, 2011 (Unaudited)
1. FUND HOLDINGS
The Funds file their complete schedule of portfolio holdings with the Securities and Exchange Commission (the “SEC”) for the first and third quarters of each fiscal year on Form N-Q within 60 days after the end of the period. Copies of the Funds’ Form N-Q are available without charge on the SEC website at http://www.sec.gov. You may also review and copy the Form N-Q at the SEC’s Public Reference Room in Washington, DC. For more information about the operation of the Public Reference Room, please call the SEC at 1-800-SEC-0330.
2. FUND PROXY VOTING POLICIES, PROCEDURES AND SUMMARIES
Each Fund’s policies and procedures used in determining how to vote proxies and information regarding how the Funds voted proxies relating to portfolio securities during the most recent prior 12-month period ending June 30 will be available without charge, (1) upon request, by calling (866) 759-5679 and (2) on the SEC’s website at http://www.sec.gov.
3. TAX DESIGNATIONS
The Funds designate the following for federal income tax purposes for the fiscal year ended April 30, 2011:
| | | | | | | | |
| | | Qualified Dividend
Income | | | Dividend Received
Deduction | |
Vulcan Value Partners Fund | | | 100.00 | % | | | 100.00 | % |
Vulcan Value Partners Small Cap Fund | | | 29.30 | % | | | 29.78 | % |
The tax character of distributions paid by the Funds for the fiscal year ended April 30, 2011 is as follows:
| | | | | | | | |
| | | Ordinary Income | | | Long-Term Capital Gain | |
Vulcan Value Partners Fund | | $ | 156,963 | | | $ | 0 | |
Vulcan Value Partners Small Cap Fund | | | 444,658 | | | | 80,126 | |
| | |
| 30 | | www.vulcanvaluepartners.com |
Trustees and Officers
April 30, 2011 (Unaudited)
INDEPENDENT TRUSTEES (continued)
| | | | | | | | | | |
Name,
Address*
& Age | | Position(s)
Held with
Funds | | Term of
Office and
Length of
Time
Served | | Principal Occupation(s) During Past 5 Years** | | Number of
Funds in
Fund
Complex
Overseen
by
Trustee*** | | Other Directorships
Held by Trustee |
Mary K. Anstine, age 70 | | Trustee | | Ms. Anstine was elected at a special meeting of shareholders held on March 21, 1997 and re-elected at a special meeting of shareholders held on August 7, 2009. | | Ms. Anstine was President/Chief Executive Officer of HealthONE Alliance, Denver, Colorado, and former Executive Vice President of First Interstate Bank of Denver. Ms. Anstine is also Trustee/Director of AV Hunter Trust and Colorado Uplift Board. Ms. Anstine was formerly a Director of the Trust Bank of Colorado (later purchased and now known as Northern Trust Bank), HealthONE and Denver Area Council of the Boy Scouts of America, and a member of the American Bankers Association Trust Executive Committee. | | 11 | | Ms. Anstine is a Trustee of ALPS ETF Trust (9 funds); Financial Investors Variable Insurance Trust (5 funds); Reaves Utility Income Fund (1 fund); and Westcore Trust (12 funds). |
| |
John R. Moran, Jr., age 80 | | Trustee | | Mr. Moran was elected at a special meeting of shareholders held on March 21, 1997 and re-elected at a special meeting of shareholders held on August 7, 2009. | | Mr. Moran is formerly President and CEO of The Colorado Trust, a private foundation serving the health and hospital community in the state of Colorado. An attorney, Mr. Moran was formerly a partner with the firm of Kutak Rock & Campbell in Denver, Colorado and a member of the Colorado House of Representatives. Currently, Mr. Moran is a member of the Treasurer’s Investment Advisory Committee for the University of Colorado. | | 11 | | None. |
| |
Jeremy W. Deems, age 34 | | Trustee | | Mr. Deems was appointed as a Trustee at the March 11, 2008 meeting of the Board of Trustees and elected at a special meeting of shareholder s held on August 7, 2009. | | Mr. Deems is the Co-Founder, Chief Compliance Officer and Chief Financial Officer of Green Alpha Advisors, LLC. Prior to joining Green Alpha Advisors, Mr. Deems was CFO and Treasurer of Forward Management, LLC, an investment management company, ReFlow Management Co., LLC, a liquidity resourcing company, ReFlow Fund, LLC, a private investment fund, and Sutton Place Management, LLC, an administrative services company (from 2004 to June 2007). Prior to this, Mr. Deems served as Controller of Forward Management, LLC, ReFlow Management Co., LLC, ReFlow Fund, LLC and Sutton Place Management, LLC. | | 11 | | Mr. Deems is a Trustee of ALPS ETF Trust (9 funds); ALPS Variable Insurance Trust (1 fund); Financial Investors Variable Insurance Trust (5 funds) and Reaves Utility Income Fund (1 fund). |
| | |
| Annual | April 30, 2011 | | 31 |
Trustees and Officers
April 30, 2011 (Unaudited)
INDEPENDENT TRUSTEES
| | | | | | | | | | |
Name,
Address*
& Age | | Position(s)
Held with
Funds | | Term of
Office and
Length of
Time
Served | | Principal Occupation(s)
During Past 5 Years** | | Number of
Funds in
Fund
Complex
Overseen
by
Trustee*** | | Other Directorships
Held by Trustee |
Jerry G. Rutledge, age 66 | | Trustee | | Mr. Rutledge was elected at a special meeting of shareholder s held on August 7, 2009. | | Mr. Rutledge is the President and owner of Rutledge’s Inc., a retail clothing business. Mr. Rutledge is currently Director of the American National Bank. He was from 1994 to 2007 a Regent of the University of Colorado. | | 11 | | Mr. Rutledge is a Trustee of Clough Global Allocation Fund (1 fund), Clough Global Equity Fund (1 fund) and Clough Global Opportunities Fund (1 fund). |
| |
Michael “Ross” Shell, age 40 | | Trustee | | Mr. Shell was elected at a special meeting of shareholder s held on August 7, 2009. | | Mr. Shell is Founder and CEO of Red Idea, LLC, a strategic consulting/early stage venture firm (since June 2008). From 1999 to 2009, he was a part-owner and Director of Tesser, Inc., a brand agency. From December 2005 to May 2008, he was Director, Marketing and Investor Relations, of Woodbourne, a REIT/real estate hedge fund and private equity firm. Prior to this, from May 2004 to November 2005, he worked as a business strategy consultant; from June 2003 to April 2004, he was on the Global Client Services team of IDEO, a product design/innovation firm; and from 1999 to 2003, he was President of Tesser, Inc. Mr. Shell graduated with honors from Stanford University with a degree in Political Science. | | 11 | | None. |
| * | All communications to Trustees and Officers may be directed to Financial Investors Trust c/o 1290 Broadway, Suite 1100, Denver, CO 80203. |
| ** | Except as otherwise indicated, each individual has held the office shown or other offices in the same company for the last five years. |
| *** | The Fund Complex includes all series of the Trust and any other investment companies for which Vulcan Value Partners, LLC provides investment advisory services. |
| | |
| 32 | | www.vulcanvaluepartners.com |
Trustees and Officers
April 30, 2011 (Unaudited)
INTERESTED TRUSTEE
| | | | | | | | | | |
Name,
Address*
& Age | | Position(s)
Held with
Funds | | Term of
Office and
Length of
Time Served | | Principal Occupation(s)
During Past 5 Years** | | Number
of Funds
in Fund
Complex
Overseen
by
Trustee*** | | Other
Directorships
Held by
Trustee |
Edmund J. Burke, age 50 | | Trustee, Chairman and President | | Mr. Burke was elected as Chairman at the August 28, 2009 meeting of the Board of Trustees.
Mr. Burke was elected as Trustee at a special meeting of shareholders held on August 7, 2009. Mr. Burke was elected President of the Trust at the December 17, 2002 meeting of the Board of Trustees. | | Mr. Burke is Chief Executive Officer and a Director of ALPS Holdings, Inc. (“AHI”) (since 2005) and Director of ALPS Advisors, Inc. (“AAI”), ALPS Distributors, Inc. (“ADI”), ALPS Fund Services, Inc. (“AFS”) and FTAM Distributors, Inc. (“FDI”) and from 2001-2008, was President of AAI, ADI, AFS and FDI. Because of his positions with AMI, AAI, ADI, AFS and FDI, Mr. Burke is deemed an affiliate of the Trust as defined under the 1940 Act. Mr. Burke is Trustee and President of the Clough Global Allocation Fund (Trustee since 2006; President since 2004); Trustee and President of the Clough Global Equity Fund (Trustee since 2006; President since 2005); Trustee and President of the Clough Global Opportunities Fund (since 2006); Trustee of the Liberty All-Star Equity Fund; and Director of the Liberty All-Star Growth Fund, Inc. | | 11 | | Mr. Burke is a Trustee of Clough Global Allocation Fund (1 fund); Clough Global Equity Fund (1 fund); Clough Global Opportunities Fund (1 fund); Trustee of the Liberty All-Star Equity Fund (1 fund); and Director of the Liberty All-Star Growth Fund, Inc. (1 fund). |
| | |
| Annual | April 30, 2011 | | 33 |
Trustees and Officers
April 30, 2011 (Unaudited)
OFFICERS (continued)
| | | | | | |
Name,
Address*
& Age | | Position(s)
Held with
Funds | | Term of
Office and
Length of
Time
Served | | Principal Occupation(s) During
Past 5 Years** |
Jeremy 0. May, age 40 | | Treasurer | | Mr. May was elected Treasurer of the Trust at the October 7, 1997 meeting of the Board of Trustees. | | Mr. May joined ALPS in 1995 and is currently President and Director of AFS and Executive Vice President and Director of AHI, AAI, ADI and FDI. Because of his positions with these entities, Mr. May is deemed an affiliate of the Trust as defined under the 1940 Act. Mr. May is also the Treasurer of the Liberty All-Star Equity Fund, Liberty All-Star Growth Fund, Inc., Clough Global Allocation Fund, Clough Global Equity Fund, Clough Global Opportunities Fund, Financial Investors Trust and Financial Investors Variable Insurance Trust. Mr. May is also President, Chairman and Trustee of the ALPS Variable Insurance Trust and Chairman and Trustee of the Reaves Utility Income Fund. Mr. May is currently on the Board of Directors and is Chairman of the Audit Committee of the University of Colorado Foundation. |
| |
JoEllen L. Legg, age 49 | | Secretary | | Ms. Legg was elected Secretary of the Trust at the November 13, 2007 meeting of the Board of Trustees. | | Ms. Legg joined ALPS in October 2007 and is currently Vice President and Associate Counsel of ALPS, AAI, ADI and FDI. Prior to joining ALPS, Ms. Legg served as Senior Counsel - Law (Corporate & Securities) for Adelphia Communications Corporation from February 2005 to March 2007. Prior to this, Ms. Legg held associate positions at Fried Frank Harris Shriver & Jacobson LLP (1998 - 2004) and at Patton Boggs LLP (2004 - 2005). Because of her position with ALPS, Ms. Legg is deemed an affiliate of the Trust as defined under the 1940 Act. Ms. Legg is also the Secretary of Transparent Value Trust, Assistant Secretary of James Advantage Funds, Stone Harbor Investment Funds, Stone Harbor Emerging Markets Debt Fund and WesMark Funds and Vice President and Assistant Secretary of Oak Associates Funds. |
| |
Ted Uhl, age 35 | | Chief Compliance Officer (“CCO”) | | Mr. Uhl was appointed CCO of the Trust at the June 8, 2010 meeting of the Board of Trustees. | | Mr. Uhl joined ALPS in October 2006, and is currently Deputy Compliance Officer of ALPS. Prior to his current role, Mr. Uhl served as Senior Risk Manager for ALPS from October 2006 until June 2010. Before joining ALPS, Mr. Uhl served a Sr. Analyst with Enenbach and Associates (RIA), and a Sr. Financial Analyst at Sprint. Because of his position with ALPS, Mr. Uhl is deemed an affiliate of the Trust as defined under the 1940 Act. |
| | |
| 34 | | www.vulcanvaluepartners.com |
Trustees and Officers
April 30, 2011 (Unaudited)
OFFICERS
| | | | | | |
Name,
Address*
& Age | | Position(s)
Held with
Funds | | Term of Office and
Length
of Time Served | | Principal Occupation(s) During
Past 5 Years** |
Kimberly R. Storms, age 38 | | Assistant Treasurer | | Ms. Storms was elected Assistant Treasurer of the Trust at the June 14, 2005 meeting of the Board of Trustees. | | Ms. Storms is Senior Vice President - Director of Fund Administration of ALPS. Ms. Storms joined ALPS in 1998 as Assistant Controller. Because of her position with ALPS, Ms. Storms is deemed an affiliate of the Trust as defined under the 1940 Act. Ms. Storms is also Treasurer of ALPS ETF Trust and ALPS Variable Insurance Trust; Assistant Treasurer of Liberty All-Star Equity Fund and Liberty All-Star Growth Fund, Inc.; and Assistant Secretary of Ameristock Mutual Fund, Inc. |
| |
Monette R. Nickels, age 40 | | Tax Officer | | Ms. Nickels was elected Tax Officer of the Trust at the December 8, 2009 meeting of the Board of Trustees. | | Ms. Nickels is Senior Vice President and Director of Tax Administration of ALPS. Ms. Nickels joined ALPS in 2004 as Director of Tax Administration. Because of her position with ALPS, Ms. Nickels is deemed an affiliate of the Trust as defined under the 1940 Act. Ms. Nickels is also Tax Officer of ALPS Variable Insurance Trust, ALPS ETF Trust, Liberty All-Star Equity Fund, Liberty All-Star Growth Fund, Inc., Reaves Utility Income Fund, Clough Global Allocation Fund, Clough Global Opportunities Fund, Clough Global Equity Fund and Financial Investors Variable Insurance Trust. |
| * | All communications to Trustees and Officers may be directed to Financial Investors Trust c/o 1290 Broadway, Suite 1100, Denver, Colorado 80203. |
| ** | Except as otherwise indicated, each individual has held the office shown or other offices in the same company for the last five years. |
| *** | The Fund complex includes all series of the Trust and any other investment companies for which Vulcan Value Partners, LLC provides investment advisory services. |
| | |
| Annual | April 30, 2011 | | 35 |
THIS PAGE INTENTIONALLY LEFT BLANK
The Funds are neither insured nor guaranteed by the U. S. Government, the FDIC, the Federal Reserve Board or any other governmental agency or insurer.
For more information about the Funds, including a prospectus, please visit www.vulcan.valuepartners. com or call 1.877.421.5078.
This material must be accompanied or proceeded by a prospectus.
Managed Accounts are available only for institutional and private clients of Vulcan Value Partners, LLC, a federally registered investment advisor. Vulcan Value Partners Funds are distributed by ALPS Distributors, Inc. Separately Managed Accounts and related investment advisory services are provided by Vulcan Value Partners, LLC, a federally regulated investment advisor. ALPS Distributors, Inc. is not affiliated with Vulcan Value Partners, LLC.
Item 2. Code of Ethics.
| | (a) | The Registrant, as of the end of the period covered by this report, has adopted a code of ethics that applies to the Registrant’s principal executive officer, principal financial officer, principal accounting officer or controller or any persons performing similar functions on behalf of the Registrant. |
| | (c) | During the period covered by this report, no amendments to the provisions of the code of ethics adopted in Item 2(a) above were made. |
| | (d) | During the period covered by this report, no implicit or explicit waivers to the provisions of the code of ethics adopted in Item 2(a) above were granted. |
| | (f) | The Registrant’s Code of Ethics is attached as an Exhibit to this report. |
Item 3. Audit Committee Financial Expert.
The Board of Trustees of the Registrant has determined that the Registrant has at least one Audit Committee Financial Expert serving on its audit committee. The Board of Trustees of the Registrant has designated Jeremy W. Deems as the Registrant’s “Audit Committee Financial Expert.” Mr. Deems is “independent” as defined in paragraph (a)(2) of Item 3 to Form N-CSR.
Item 4. Principal Accountant Fees and Services.
| | (a) | Audit Fees: For the Registrant’s fiscal years ended April 30, 2010 and April 30, 2011, the aggregate fees billed for professional services rendered by the principal accountant for the audit of the Registrant’s annual financial statements were $105,340 and $252,500, respectively. |
| | (b) | Audit-Related Fees: For the Registrant’s fiscal years ended April 30, 2010 and April 30, 2011, the aggregate fees billed for professional services rendered by the principal accountant for the verification of the Registrant’s securities and similar investments in accordance with Rule 17f-2 under the Investment Company Act of 1940 were $10,000 and $10,000, respectively. |
| | (c) | Tax Fees: For the Registrant’s fiscal years ended April 30, 2010 and April 30, 2011, the aggregate fees billed for professional services rendered by the principal accountant for tax compliance, tax advice and tax planning were $26,770 and $57,800, respectively. The fiscal year 2010 and 2011 tax fees were for services for dividend calculation, excise tax preparation and tax return preparation. |
| | (d) | All Other Fees: For the Registrant’s fiscal years ended April 30, 2010 and April 30, 2011, no fees were billed to Registrant by the principal accountant for services other than the services reported in paragraphs (a) through (c) of this Item. |
| | (e)(1) | Audit Committee Pre-Approval Policies and Procedures: All services to be performed by the Registrant’s principal accountant must be pre-approved by the Registrant’s audit committee. |
| | (e)(2) | No services described in paragraphs (b) through (d) of this Item were approved by the Registrant’s audit committee pursuant to paragraph (c)(7)(i)(C) of Rule 2-01 of Regulation S-X. |
| | (g) | The aggregate non-audit fees billed by the Registrant’s accountant in each of the last two fiscal years of the Registrant were $166,770 in 2010 and $379,800 in 2011. These fees consisted of non-audit fees billed to (i) the Registrant of $26,770 in 2010 and $57,800 in 2011 as described in response to paragraph (c) above and (ii) to ALPS Fund Services, Inc. (“AFS”), an entity under common control with ALPS Advisors, Inc., the Registrant’s investment adviser, of $140,000 in 2010 and $322,000 in 2011. The non-audit fees billed to AFS related to SAS 70 services and other compliance-related matters. |
| | (h) | The Registrant’s audit committee has considered whether the provision of non-audit services that were rendered to the Registrant’s investment adviser (not including any sub-adviser whose role is primarily portfolio management and is subcontracted with or overseen by another investment adviser), and any entity controlling, controlled by, or under common control with the investment adviser that provides ongoing services to the Registrant that were not pre-approved pursuant to paragraph (c)(7)(ii) of Rule 2-01 of Regulation S-X, is compatible with maintaining the principal accountant’s independence. The Registrant’s audit committee determined that the provision of such non-audit services is compatible with maintaining the principal accountant’s independence. |
Item 5. Audit Committee of Listed Registrants.
Not applicable.
Item 6. Investments.
| | |
(a) Schedule of Investments is included as part of the Reports to Stockholders filed under Item 1 of this Form N-CSR. |
|
(b) Not applicable. |
| |
Item 7. | | Disclosure of Proxy Voting Policies and Procedures for Closed-End Management Investment Companies. |
|
Not applicable to Registrant. |
|
| Item 8. Portfolio Managers of Closed-End Management Investment Companies. |
|
Not applicable to Registrant. |
| |
Item 9. | | Purchases of Equity Securities by Closed-End Management Investment Company and Affiliated Purchasers. |
|
Not applicable to Registrant. |
Item 10. Submission of Matters to a Vote of Security Holders.
There have been no material changes to the procedures by which shareholders may recommend nominees to the Registrant’s Board of Trustees, where those changes were implemented after the Registrant last provided disclosure in response to the requirements of Item 407(c)(2) of Regulation S-K, or this Item.
Item 11. Controls and Procedures.
| | (a) | The Registrant’s principal executive officer and principal financial officer have concluded that the Registrant’s disclosure controls and procedures (as defined in Rule 30a-3(c) under the Investment Company Act of 1940, as amended) are effective based on their evaluation of these controls and procedures as of a date within 90 days of the filing date of this report. |
| | (b) | There was no change in the Registrant’s internal control over financial reporting (as defined in Rule 30a-3(d) under the Investment Company Act of 1940, as amended) during the second fiscal quarter of the period covered by this report that has materially affected, or is reasonably likely to materially affect, the Registrant’s internal control over financial reporting. |
Item 12. Exhibits.
| | (a)(1) | Registrant’s Code of Ethics for Senior Financial Officers, which is the subject of the disclosure required by Item 2 of Form N-CSR, was filed as Exhibit 12(a)(1) to |
| | the Registrant’s Certified Shareholder Report on Form N-CSR, File No. 811-8194, on July 7, 2008. |
| | (a)(2) | The certifications required by Rule 30a-2(a) of the Investment Company Act of 1940, as amended, and Section 302 of the Sarbanes-Oxley Act of 2002 are attached hereto as Exhibit 99.Cert. |
| | (b) | The certifications by the Registrant’s principal executive officer and principal financial officer, as required by Rule 30a-2(b) of the Investment Company Act of 1940, as amended, and Section 906 of the Sarbanes-Oxley Act of 2002 are attached hereto as Exhibit 99.906Cert. |
SIGNATURES
Pursuant to the requirements of the Securities Exchange Act of 1934 and the Investment Company Act of 1940, the Registrant has duly caused this report to be signed on its behalf by the undersigned, thereunto duly authorized.
FINANCIAL INVESTORS TRUST
| | | | |
By: | | /s/ Edmund J. Burke | | |
| | Edmund J. Burke (Principal Executive Officer) | | |
| | President | | |
| | |
Date: | | July 1, 2011 | | |
Pursuant to the requirements of the Securities Exchange Act of 1934 and the Investment Company Act of 1940, this report has been signed below by the following persons on behalf of the Registrant and in the capacities and on the dates indicated.
FINANCIAL INVESTORS TRUST
| | | | |
By: | | /s/ Edmund J. Burke | | |
| | Edmund J. Burke (Principal Executive Officer) | | |
| | President | | |
| | |
Date: | | July 1, 2011 | | |
| | |
By: | | /s/ Jeremy O. May | | |
| | Jeremy O. May (Principal Financial Officer) | | |
| | Treasurer | | |
| | |
Date: | | July 1, 2011 | | |