UNITED STATES
SECURITIES AND EXCHANGE COMMISSION
Washington, D.C. 20549
FORM N-CSR
CERTIFIED SHAREHOLDER REPORT OF REGISTERED
MANAGEMENT INVESTMENT COMPANIES
Investment Company Act file number: 811-8194
FINANCIAL INVESTORS TRUST
(Exact name of registrant as specified in charter)
1290 Broadway, Suite 1100, Denver, Colorado 80203
(Address of principal executive offices) (Zip code)
David T. Buhler, Secretary
Financial Investors Trust
1290 Broadway, Suite 1100
Denver, Colorado 80203
(Name and address of agent for service)
Registrant’s telephone number, including area code: 303-623-2577
Date of fiscal year end: April 30
Date of reporting period: May 1, 2012 - April 30, 2013
| Item 1. | Reports to Stockholders. |
| | |
| Disclosure of Fund Expenses | | |
| | April 30, 2013 (Unaudited) |
As a shareholder of the Funds, you will incur two types of costs: (1) transaction costs, including applicable sales charges (loads) and redemption fees; and (2) ongoing costs, including management fees, distribution and service (12b-1) fees, shareholder service fees and other Fund expenses. The following examples are intended to help you understand your ongoing costs (in dollars) of investing in the Fund and to compare these costs with the ongoing costs of investing in other mutual funds. The examples are based on an investment of $1,000 invested on November 1, 2012 and held until April 30, 2013.
Actual Expenses. The first line of the table on the next page provides information about actual account values and actual expenses. You may use the information in this line, together with the amount you invested, to estimate the expenses that you paid over the period. Simply divide your account value by $1,000 (for example, an $8,600 account value divided by $1,000 = 8.6), then multiply the result by the number in the first line under the heading “Expense Paid During Period” to estimate the expenses you paid on your account during this period.
Hypothetical Example for Comparison Purposes. The second line of the table on the next page provides information about hypothetical account values and hypothetical expenses based on the Fund’s actual expense ratio and an assumed rate of return of 5% per year before expenses, which is not the Fund’s actual return. The hypothetical account values and expenses may not be used to estimate the actual ending account balance or expenses you paid for the period. You may use this information to compare the ongoing costs of investing in the Fund and other mutual funds. To do so, compare this 5% hypothetical example with the 5% hypothetical examples that appear in the shareholder reports of the other funds.
The expenses shown in the table are meant to highlight ongoing Fund costs only and do not reflect transaction fees, such as sales charges, redemption fees, or exchange fees. Therefore, the second line of the table on the next page is useful in comparing ongoing costs only, and may not help you determine the relative total costs of owning different funds. In addition, if these transactional costs were included, your costs would have been higher.
| | |
| Disclosure of Fund Expenses | | |
| | April 30, 2013 (Unaudited) |
| | | | | | | | |
| | | Beginning Account Value
November 1, 2012 | | Ending Account Value
April 30, 2013 | | Expense Ratio(a) | | Expense Paid During Period November 1, 2012 -
April 30, 2013(b) |
ALPS | Alerian MLP Infrastructure Index Fund |
Class A | | | | | | | | |
Actual(c) | | $ 1,000.00 | | $ 1,126.80 | | 1.25% | | $ 4.37 |
Hypothetical (5% return before expenses) | | $ 1,000.00 | | $ 1,018.60 | | 1.25% | | $ 6.26 |
Class C | | | | | | | | |
Actual(c) | | $ 1,000.00 | | $ 1,125.80 | | 1.85% | | $ 6.46 |
Hypothetical (5% return before expenses) | | $ 1,000.00 | | $ 1,015.62 | | 1.85% | | $ 9.25 |
Class I | | | | | | | | |
Actual(c) | | $ 1,000.00 | | $ 1,127.80 | | 0.85% | | $ 2.97 |
Hypothetical (5% return before expenses) | | $ 1,000.00 | | $ 1,020.58 | | 0.85% | | $ 4.26 |
ALPS | CoreCommodity Management CompleteCommoditiesSM Strategy Fund(d) |
Class A | | | | | | | | |
Actual | | $ 1,000.00 | | $ 971.00 | | 1.36% | | $ 6.65 |
Hypothetical (5% return before expenses) | | $ 1,000.00 | | $ 1,018.05 | | 1.36% | | $ 6.81 |
Class C | | | | | | | | |
Actual | | $ 1,000.00 | | $ 968.00 | | 2.05% | | $ 10.00 |
Hypothetical (5% return before expenses) | | $ 1,000.00 | | $ 1,014.63 | | 2.05% | | $ 10.24 |
Class I | | | | | | | | |
Actual | | $ 1,000.00 | | $ 972.70 | | 1.15% | | $ 5.62 |
Hypothetical (5% return before expenses) | | $ 1,000.00 | | $ 1,019.09 | | 1.15% | | $ 5.76 |
ALPS | Kotak India Growth Fund(e) |
Class A | | | | | | | | |
Actual | | $ 1,000.00 | | $ 1,062.80 | | 2.00% | | $ 10.23 |
Hypothetical (5% return before expenses) | | $ 1,000.00 | | $ 1,014.88 | | 2.00% | | $ 9.99 |
Class C | | | | | | | | |
Actual | | $ 1,000.00 | | $ 1,061.40 | | 2.60% | | $ 13.29 |
Hypothetical (5% return before expenses) | | $ 1,000.00 | | $ 1,011.90 | | 2.60% | | $ 12.97 |
Class I | | | | | | | | |
Actual | | $ 1,000.00 | | $ 1,065.80 | | 1.60% | | $ 8.20 |
Hypothetical (5% return before expenses) | | $ 1,000.00 | | $ 1,016.86 | | 1.60% | | $ 8.00 |
ALPS | Red Rocks Listed Private Equity Fund |
Class A | | | | | | | | |
Actual | | $ 1,000.00 | | $ 1,240.40 | | 1.48% | | $ 8.22 |
Hypothetical (5% return before expenses) | | $ 1,000.00 | | $ 1,017.46 | | 1.48% | | $ 7.40 |
Class C | | | | | | | | |
Actual | | $ 1,000.00 | | $ 1,235.50 | | 2.25% | | $ 12.47 |
Hypothetical (5% return before expenses) | | $ 1,000.00 | | $ 1,013.64 | | 2.25% | | $ 11.23 |
Class I | | | | | | | | |
Actual | | $ 1,000.00 | | $ 1,243.00 | | 1.25% | | $ 6.95 |
Hypothetical (5% return before expenses) | | $ 1,000.00 | | $ 1,018.60 | | 1.25% | | $ 6.26 |
Class R | | | | | | | | |
Actual | | $ 1,000.00 | | $ 1,245.80 | | 1.75% | | $ 9.74 |
Hypothetical (5% return before expenses) | | $ 1,000.00 | | $ 1,016.12 | | 1.75% | | $ 8.75 |
ALPS | WMC Disciplined Value Fund |
Class A | | | | | | | | |
Actual | | $ 1,000.00 | | $ 1,168.40 | | 1.40% | | $ 7.53 |
Hypothetical (5% return before expenses) | | $ 1,000.00 | | $ 1,017.85 | | 1.40% | | $ 7.00 |
Class C | | | | | | | | |
Actual | | $ 1,000.00 | | $ 1,161.70 | | 2.15% | | $ 11.52 |
Hypothetical (5% return before expenses) | | $ 1,000.00 | | $ 1,014.13 | | 2.15% | | $ 10.74 |
Class I | | | | | | | | |
Actual | | $ 1,000.00 | | $ 1,168.50 | | 1.15% | | $ 6.18 |
Hypothetical (5% return before expenses) | | $ 1,000.00 | | $ 1,019.09 | | 1.15% | | $ 5.76 |
| | |
| Disclosure of Fund Expenses | | |
| | April 30, 2013 (Unaudited) |
| | | | | | | | |
| | | Beginning Account Value
November 1, 2012 | | Ending Account Value April 30, 2013 | | Expense Ratio(a) | | Expense Paid
During Period
November 1, 2012 -
April 30, 2013(b) |
Clough China Fund |
Class A | | | | | | | | |
Actual | | $ 1,000.00 | | $ 1,150.40 | | 1.94% | | $ 10.34 |
Hypothetical (5% return before expenses) | | $ 1,000.00 | | $ 1,015.17 | | 1.94% | | $ 9.69 |
Class C | | | | | | | | |
Actual | | $ 1,000.00 | | $ 1,146.10 | | 2.70% | | $ 14.37 |
Hypothetical (5% return before expenses) | | $ 1,000.00 | | $ 1,011.41 | | 2.70% | | $ 13.47 |
Class I | | | | | | | | |
Actual | | $ 1,000.00 | | $ 1,152.90 | | 1.71% | | $ 9.13 |
Hypothetical (5% return before expenses) | | $ 1,000.00 | | $ 1,016.31 | | 1.71% | | $ 8.55 |
RiverFront Conservative Income Builder Fund |
Class A | | | | | | | | |
Actual(f) | | $ 1,000.00 | | $ 1,052.00 | | 1.15% | | $ 5.85 |
Hypothetical (5% return before expenses) | | $ 1,000.00 | | $ 1,019.09 | | 1.15% | | $ 5.76 |
Class C | | | | | | | | |
Actual(f) | | $ 1,000.00 | | $ 1,048.70 | | 1.90% | | $ 9.65 |
Hypothetical (5% return before expenses) | | $ 1,000.00 | | $ 1,015.37 | | 1.90% | | $ 9.49 |
Class I | | | | | | | | |
Actual(f) | | $ 1,000.00 | | $ 1,053.20 | | 0.90% | | $ 4.58 |
Hypothetical (5% return before expenses) | | $ 1,000.00 | | $ 1,020.33 | | 0.90% | | $ 4.51 |
RiverFront Dynamic Equity Income Fund |
Class A | | | | | | | | |
Actual | | $ 1,000.00 | | $ 1,102.50 | | 1.15% | | $ 6.00 |
Hypothetical (5% return before expenses) | | $ 1,000.00 | | $ 1,019.09 | | 1.15% | | $ 5.76 |
Class C | | | | | | | | |
Actual | | $ 1,000.00 | | $ 1,097.60 | | 1.90% | | $ 9.88 |
Hypothetical (5% return before expenses) | | $ 1,000.00 | | $ 1,015.37 | | 1.90% | | $ 9.49 |
Class I | | | | | | | | |
Actual | | $ 1,000.00 | | $ 1,103.80 | | 0.90% | | $ 4.69 |
Hypothetical (5% return before expenses) | | $ 1,000.00 | | $ 1,020.33 | | 0.90% | | $ 4.51 |
RiverFront Global Allocation Fund |
Class A | | | | | | | | |
Actual | | $ 1,000.00 | | $ 1,105.50 | | 1.15% | | $ 6.00 |
Hypothetical (5% return before expenses) | | $ 1,000.00 | | $ 1,019.09 | | 1.15% | | $ 5.76 |
Class C | | | | | | | | |
Actual | | $ 1,000.00 | | $ 1,101.80 | | 1.90% | | $ 9.90 |
Hypothetical (5% return before expenses) | | $ 1,000.00 | | $ 1,015.37 | | 1.90% | | $ 9.49 |
Class I | | | | | | | | |
Actual | | $ 1,000.00 | | $ 1,107.90 | | 0.90% | | $ 4.70 |
Hypothetical (5% return before expenses) | | $ 1,000.00 | | $ 1,020.33 | | 0.90% | | $ 4.51 |
| | |
| Disclosure of Fund Expenses | | |
| | April 30, 2013 (Unaudited) |
| | | | | | | | |
| | | Beginning Account Value November 1, 2012 | | Ending Account Value April 30, 2013 | | Expense Ratio(a) | | Expense Paid
During Period
November 1, 2012 - April 30, 2013(b) |
RiverFront Global Growth Fund |
Class A | | | | | | | | |
Actual | | $ 1,000.00 | | $ 1,122.20 | | 1.03% | | $ 5.42 |
Hypothetical (5% return before expenses) | | $ 1,000.00 | | $ 1,019.69 | | 1.03% | | $ 5.16 |
Class C | | | | | | | | |
Actual | | $ 1,000.00 | | $ 1,117.30 | | 1.81% | | $ 9.50 |
Hypothetical (5% return before expenses) | | $ 1,000.00 | | $ 1,015.82 | | 1.81% | | $ 9.05 |
Class I | | | | | | | | |
Actual | | $ 1,000.00 | | $ 1,122.70 | | 0.80% | | $ 4.21 |
Hypothetical (5% return before expenses) | | $ 1,000.00 | | $ 1,020.83 | | 0.80% | | $ 4.01 |
Class L | | | | | | | | |
Actual | | $ 1,000.00 | | $ 1,123.40 | | 0.81% | | $ 4.26 |
Hypothetical (5% return before expenses) | | $ 1,000.00 | | $ 1,020.78 | | 0.81% | | $ 4.06 |
Investor Class | | | | | | | | |
Actual | | $ 1,000.00 | | $ 1,121.40 | | 1.06% | | $ 5.58 |
Hypothetical (5% return before expenses) | | $ 1,000.00 | | $ 1,019.54 | | 1.06% | | $ 5.31 |
RiverFront Moderate Growth & Income Fund |
Class A | | | | | | | | |
Actual | | $ 1,000.00 | | $ 1,079.40 | | 1.15% | | $ 5.93 |
Hypothetical (5% return before expenses) | | $ 1,000.00 | | $ 1,019.09 | | 1.15% | | $ 5.76 |
Class C | | | | | | | | |
Actual | | $ 1,000.00 | | $ 1,075.00 | | 1.90% | | $ 9.78 |
Hypothetical (5% return before expenses) | | $ 1,000.00 | | $ 1,015.37 | | 1.90% | | $ 9.49 |
Class I | | | | | | | | |
Actual | | $ 1,000.00 | | $ 1,080.00 | | 0.90% | | $ 4.64 |
Hypothetical (5% return before expenses) | | $ 1,000.00 | | $ 1,020.33 | | 0.90% | | $ 4.51 |
| (a) | Annualized, based on the Fund’s most recent fiscal half year expenses. |
| (b) | Expenses are equal to the Fund’s annualized expense ratio multiplied by the average account value over the period, multiplied by the number of days in the most recent fiscal half year (181), divided by 365. |
| (c) | The Fund commenced operations on January 2, 2013. For purposes of calculating the “Actual” figures on page 2, actual number of days from commencement of operations through April 30, 2013 were used (120 days). |
| (d) | Includes expenses of the Jefferies Asset Management Cayman Trust (wholly-owned subsidiary), exclusive of the subsidiary’s management fee. |
| (e) | Includes expenses of the Kotak Mauritius Portfolio (wholly-owned subsidiary), exclusive of subsidiary’s management fee. |
| (f) | The Fund commenced operations on September 4, 2012. |
| | |
| ALPS | Alerian MLP Infrastructure Index Fund |
| Management Commentary | | April 30, 2013 (Unaudited) |
Performance
Since the Fund’s inception on December 31, 2012, the Alerian MLP Infrastructure Index Fund, the Fund’s Class A Shares delivered a net return of 12.68% at Net Asset Value (Class A delivered a net return of 6.50% at MOP, Class C was 11.58% with CDSC, and Class I was 12.78%). Master limited partnerships benefited from strong gains in early 2013 as uncertainty surrounding the fiscal cliff and tax changes during the latter part of 2012 ended.
Distribution growth1 for the asset class continues to remain strong. The weighted average distribution growth2 on a year-over-year basis for the first quarter of 2013 was 8.54%.
The International Energy Agency (IEA) notes that the global energy map is being redrawn by the resurgence in oil and gas production in the United States. The United States is one of the leading producers of natural gas and within this decade, it may overtake Saudi Arabia as the world’s largest oil producer. This surge in production has boosted the economy with investment capital inflows, the creation of thousands of jobs, and more importantly, the need for adequate energy infrastructure to move, store, and process such production.
Because of new supply and shifting demand areas, the US is in the process of being re-piped. In 2013 alone, industry analysts expect MLPs will invest $30 billion in infrastructure growth projects to address takeaway constraints. Such projects include converting existing natural gas pipelines to transport crude oil from Canada or the Bakken Shale in North Dakota, as well as building ethane or natural gas liquid (NGL) pipelines from the Marcellus Shale in the Northeast to major NGL hubs such as Mont Belvieu, Texas. They also include investments in response to new energy trends, such as expanding rail terminal facilities because more crude oil is being transported by railroad, or building out liquefied petroleum gas (LPG) export facilities because there is increased demand to ship cost-advantaged feedstock such as propane, butane, and isobutene to overseas customers.
Mergers and Acquisitions and Initial Public Offering activity thrived in 2012 and in early 2013 as the MLP structure has historically been an optimal way for corporations and private firms to monetize assets while simultaneously providing investors access to stable cash flow and distributions, in our view. During 2013, several companies with major infrastructure assets have announced intentions to form MLPs, many of which may come to market late 2013 or early 2014.
Significant changes in the North American production profile have created vast opportunities for MLPs to participate in the energy infrastructure build-out of North America. These opportunities, along with cash flow underpinned with toll-road business models and long-term contracts have made MLPs a compelling opportunity for investors seeking after-tax yield.
The views and information discussed in this commentary are as of the date of publication, are subject to change, and may not reflect the writer’s current views. The views expressed represent an assessment of market conditions at a specific point in time, are opinions only and should not be relied upon as investment advice regarding a particular investment or markets in general. Such information does not constitute a recommendation to buy or sell specific securities or investment vehicles. It should not be assumed that any investment will be profitable or will equal the performance of the fund(s) or any securities or any sectors mentioned herein. The subject matter contained herein has been derived from several sources believed to be reliable and accurate at the time of compilation. Alerian does not accept any liability for losses either direct or consequential caused by the use of this information.
| 1 | Distribution growth is the amount by which a partnership increases its quarterly or annual distributions; the MLP terminology for distributions is similar to C corporation terminology for dividends. |
| 2 | Weighted average distribution growth is calculated by multiplying the weight of each constituent in the AMZI (Alerian MLP Infrastructure Index- the index is not actively managed and does not reflect any deductions for fees, expenses or taxes; an investor may not invest directly in an index) at March 31, 2013 by the constituent’s year-over-year distribution growth percentage. |
| | |
| ALPS | Alerian MLP Infrastructure Index Fund |
| Performance Update | | April 30, 2013 (Unaudited) |
Performance of $10,000 Initial Investment (as of April 30, 2013)
Comparison of change in value of a $10,000 investment (includes maximum sales charges of 5.50%)
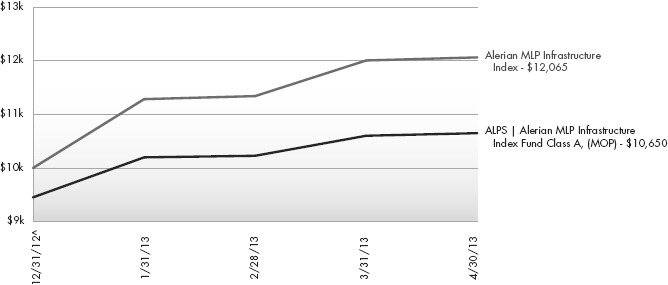
The chart above represents historical performance of a hypothetical investment of $10,000 in the Fund since inception. Past performance does not guarantee future results. This chart does not reflect the deduction of taxes that a shareholder would pay on Fund distributions or the redemption of Fund shares.
Average Annual Total Returns (as of April 30, 2013)
| | | | | | | | |
| | | 3 Month | | Since Inception ^ | | Total Expense Ratio * | | What You Pay ** |
Class A (NAV)1 | | 4.43% | | 12.68% | | 1.49% | | 1.25% |
Class A (MOP)2 | | -1.33% | | 6.50% | | |
Class C (NAV)1 | | 4.34% | | 12.58% | | 2.09% | | 1.85% |
Class C (CDSC)2 | | 3.34% | | 11.58% | | |
Class I | | 4.43% | | 12.78% | | 1.09% | | 0.85% |
Alerian MLP Infrastructure Index3 | | 6.91% | | 20.65% | | | | |
Performance data quoted represents past performance. Past performance does not guarantee future results. Investment return and principal value of an investment will fluctuate so that an investor’s shares, when sold or redeemed, may be worth more or less than the original cost. Current performance data may be higher or lower than actual data quoted. The Fund imposes a 2.00% redemption fee on shares held for less than 30 days. The Fund imposes a maximum Contingent Deferred Sales Charge (“CDSC”) of 1.00% to shares redeemed within the first 12 months after a purchase, and on Class A shares redeemed within the first 12 months after a purchase in excess of $1 million. Performance shown does not reflect the redemption fee or the CDSC, which if reflected would reduce the performance quoted. For the most current month-end performance data please call 1-866-759-5679.
Investments in securities of MLPs involve risks that differ from an investment in common stock. MLPs are controlled by their general partners, which generally have conflicts of interest and limited fiduciary duties to the MLP, which may permit the general partner to favor its own interests over the MLPs. The benefit you are expected to derive from the Fund’s investment in MLPs depends largely on the MLPs being treated as partnerships for federal income tax purposes. As a partnership, an MLP has no federal income tax liability at the entity level. Therefore, treatment of one or more MLPs as a corporation for federal income tax purposes could affect the Fund’s ability to meet its investment objective and would reduce the amount of cash available to pay or distribute to you. Legislative, judicial, or administrative changes and differing interpretations, possibly on a retroactive basis, could negatively impact the value of an investment in MLPs and therefore the value of your investment in the Fund.
| | |
| ALPS | Alerian MLP Infrastructure Index Fund |
| Performance Update | | April 30, 2013 (Unaudited) |
| 1 | Net Asset Value (NAV) is the share price without sales charges. |
| 2 | Maximum Offering Price (MOP) includes sales charges. Class A returns include effects of the Fund’s maximum sales charge of 5.50%; Class C returns include the 1.00% CDSC. |
| 3 | Alerian MLP Infrastructure Index is comprised of 25 midstream energy Master Limited Partnerships. The index is not actively managed and does not reflect any deductions for fees, expenses or taxes. An investor may not invest directly in an index. |
| ^ | Fund inception date of December 31, 2012. The Fund commenced operations on January 2, 2013. |
| * | Excludes current and deferred income tax expense. |
| ** | What You Pay reflects the Advisor’s and Sub-Advisor’s decision to contractually limit expenses through August 31, 2013. Please see the prospectus for additional information. |
The table does not reflect the deduction of taxes that a shareholder would pay on Fund distributions or the redemption of Fund shares.
This Fund is not suitable for all investors and is subject to investment risks, including possible loss of the principal amount invested.
There is no guarantee that the Fund will continue to hold any one particular security or stay invested in any one particular company. The composition of the Fund’s top holdings is subject to change. Performance figures are historical and reflect the change in share price, reinvested distributions, changes in net asset value, sales charges and capital gains distributions, if any.
Mutual funds are not insured or guaranteed by the FDIC or by any other government agency or government sponsored agency of the federal government or any state, not deposits, obligations or guaranteed by any bank or its affiliates and are subject to investment risks, including possible loss of the principal amount invested.
Top Ten Long Holdings (as a % of Net Assets) †
| | | | | |
Enterprise Products Partners LP | | | | 10.08% | |
Kinder Morgan Energy Partners LP | | | | 9.94% | |
Magellan Midstream Partners LP | | | | 7.48% | |
Energy Transfer Partners LP | | | | 7.47% | |
Plains All American Pipeline LP | | | | 7.47% | |
MarkWest Energy Partners LP | | | | 6.48% | |
Enbridge Energy Partners LP | | | | 4.92% | |
Williams Partners LP | | | | 4.92% | |
Buckeye Partners LP | | | | 4.86% | |
ONEOK Partners LP | | | | 4.80% | |
Top Ten Holdings | | | | 68.42% | |
| † | Holdings are subject to change. Table presents indicative values only. |
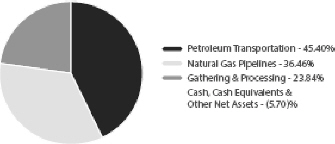
Industry Sector Allocation (as a % of Net Assets)
| | |
| ALPS | Alerian MLP Infrastructure Index Fund | | |
Statement of Investments | | April 30, 2013 |
| | | | | | | | |
| | | Shares | | | Value (Note 2) | |
| |
MASTER LIMITED PARTNERSHIPS (105.70%) | |
Gathering & Processing (23.84%) | |
Pipelines (23.84%) | | | | | | | | |
Copano Energy LLC | | | 2,339 | | | $ | 94,004 | |
DCP Midstream Partners LP | | | 1,674 | | | | 82,227 | |
MarkWest Energy Partners LP | | | 3,839 | | | | 242,625 | |
PVR Partners LP | | | 2,884 | | | | 72,100 | |
Targa Resources Partners LP | | | 2,638 | | | | 119,765 | |
Western Gas Partners LP | | | 1,625 | | | | 98,248 | |
Williams Partners LP | | | 3,372 | | | | 184,280 | |
| | | | | | | | |
| | | | | | | 893,249 | |
| | | | | | | | |
| |
TOTAL GATHERING & PROCESSING | | | | 893,249 | |
| | | | | | | | |
|
Natural Gas Pipelines (36.46%) | |
Pipelines (36.46%) | | | | | | | | |
Atlas Pipeline Partners LP | | | 1,758 | | | | 63,886 | |
Boardwalk Pipeline Partners LP | | | 3,126 | | | | 94,499 | |
El Paso Pipeline Partners LP | | | 3,735 | | | | 160,007 | |
Energy Transfer Partners LP | | | 5,621 | | | | 279,869 | |
Enterprise Products Partners LP | | | 6,224 | | | | 377,486 | |
ONEOK Partners LP | | | 3,327 | | | | 179,991 | |
Regency Energy Partners LP | | | 4,329 | | | | 112,987 | |
Spectra Energy Partners LP | | | 1,216 | | | | 46,135 | |
TC Pipelines LP | | | 1,084 | | | | 50,948 | |
| | | | | | | | |
| | | | | | | 1,365,808 | |
| | | | | | | | |
| |
TOTAL NATURAL GAS PIPELINES | | | | 1,365,808 | |
| | | | | | | | |
| |
Petroleum Transportation (45.40%) | | | | | |
Pipelines (45.40%) | | | | | | | | |
Access Midstream Partners LP | | | 1,896 | | | | 78,248 | |
Buckeye Partners LP | | | 2,945 | | | | 181,942 | |
Enbridge Energy Partners LP | | | 6,191 | | | | 184,492 | |
Genesis Energy LP | | | 2,010 | | | | 96,621 | |
Kinder Morgan Energy Partners LP | | | 4,208 | | | | 372,198 | |
Magellan Midstream Partners LP | | | 5,282 | | | | 280,104 | |
NuStar Energy LP | | | 1,943 | | | | 97,305 | |
Plains All American Pipeline LP | | | 4,872 | | | | 279,750 | |
Sunoco Logistics Partners LP | | | 2,092 | | | | 129,934 | |
| | | | | | | | |
| | | | | | | 1,700,594 | |
| | | | | | | | |
| |
TOTAL PETROLEUM TRANSPORTATION | | | | 1,700,594 | |
| | | | | | | | |
| |
TOTAL MASTER LIMITED PARTNERSHIPS
(Cost $3,325,728) | | | | 3,959,651 | |
| | | | | | | | |
| | | | | | | | | | | | |
| | | 7-Day
Yield | | | Shares | | | Value (Note 2) | |
| |
SHORT TERM INVESTMENTS (0.41%) | |
Money Market Fund (0.41%) | |
Dreyfus Treasury Prime Cash Management Fund, Institutional Shares | | | 0.00004 | % | | | 15,384 | | | $ | 15,384 | |
| | | | | | | | | | | | |
| |
TOTAL SHORT TERM INVESTMENTS (Cost $15,384) | | | | 15,384 | |
| | | | | | | | | | | | |
| |
TOTAL INVESTMENTS (106.11%) (Cost $3,341,112) | | | $ | 3,975,035 | |
| |
Liabilities In Excess Of Other
Assets (-6.11%) | | | | (228,965) | |
| | | | | | | | | | | | |
| |
NET ASSETS (100.00%) | | | $ | 3,746,070 | |
| | | | | | | | | | | | |
Common Abbreviations:
LLC - Limited Liability Company.
LP - Limited Partnerships.
For Fund compliance purposes, the Fund’s industry classifications refer to any one or more of the industry sub-classifications used by one or more widely recognized market indexes or ratings group indexes, and/or as defined by Fund management. This definition may not apply for purposes of this report, which may combine industry sub-classifications for reporting ease. Industries are shown as a percent of net assets.
See Notes to Financial Statements.
| | |
| ALPS | Alerian MLP Infrastructure Index Fund | | |
| Statement of Assets and Liabilities | | April 30, 2013 |
| | | | |
ASSETS | | | | |
Investments, at value | | $ | 3,975,035 | |
Receivable for shares sold | | | 2,500 | |
Dividends receivable | | | 19,026 | |
Prepaid offering costs | | | 46,017 | |
Prepaid expenses and other assets | | | 3,182 | |
| |
Total Assets | | | 4,045,760 | |
| |
LIABILITIES | | | | |
Payable for investments purchased | | | 31,546 | |
Deferred tax liability | | | 225,947 | |
Investment advisory fees payable | | | 16,736 | |
Administration and transfer agency fees payable | | | 926 | |
Distribution and services fees payable | | | 973 | |
Trustees’ fees and expenses payable | | | 49 | |
Legal fees payable | | | 128 | |
Audit and tax fees payable | | | 18,000 | |
Accrued expenses and other liabilities | | | 5,385 | |
| |
Total Liabilities | | | 299,690 | |
| |
NET ASSETS | | $ | 3,746,070 | |
| |
NET ASSETS CONSIST OF | | | | |
Paid-in capital | | $ | 3,351,285 | |
Accumulated net investment loss, net of deferred income taxes | | | (7,626 | ) |
Accumulated net realized loss on investments, net of deferred income taxes | | | (764 | ) |
Net unrealized appreciation on investments, net of deferred income taxes | | | 403,175 | |
| |
NET ASSETS | | $ | 3,746,070 | |
| |
INVESTMENTS, AT COST | | $ | 3,341,112 | |
| |
| |
PRICING OF SHARES | | | | |
Class A: | | | | |
Net Asset Value, offering and redemption price per share(a) | | $ | 11.10 | |
Net Assets | | $ | 927,816 | |
Shares of beneficial interest outstanding (unlimited number of shares, no par value common stock authorized) | | | 83,576 | |
Maximum offering price per share ((NAV/0.9450), based on maximum sales charge of 5.50% of the offering price) | | $ | 11.75 | |
Class C: | | | | |
Net Asset Value, offering and redemption price per share(a) | | $ | 11.09 | |
Net Assets | | $ | 562,725 | |
Shares of beneficial interest outstanding (unlimited number of shares, no par value common stock authorized) | | | 50,758 | |
Class I: | | | | |
Net Asset Value, offering and redemption price per share | | $ | 11.11 | |
Net Assets | | $ | 2,255,529 | |
Shares of beneficial interest outstanding (unlimited number of shares, no par value common stock authorized) | | | 203,031 | |
| (a) | Redemption price per share may be reduced for any applicable contingent deferred sales charge. For a description of a possible sales charge, please see the Fund’s Prospectus. |
See Notes to Financial Statements.
| | |
| ALPS | Alerian MLP Infrastructure Index Fund | | |
| Statement of Operations For the Period January 2, 2013 (Commencement) to April 30, 2013 |
| | | | |
INVESTMENT INCOME | | | | |
Distributions from master limited partnerships | | $ | 69,393 | |
Less return of capital distributions | | | (69,393) | |
| |
Total Investment Income | | | – | |
| |
| |
EXPENSES | | | | |
Investment advisory fees | | | 7,698 | |
Administrative and transfer agency fees | | | 1,876 | |
Distribution and service fees | | | | |
Class A | | | 892 | |
Class C | | | 1,753 | |
Legal fees | | | 147 | |
Audit and tax fees | | | 18,000 | |
Reports to shareholders and printing fees | | | 274 | |
State registration fees | | | 218 | |
SEC registration fees | | | 609 | |
Custody fees | | | 4,102 | |
Trustees’ fees and expenses | | | 94 | |
Offering costs | | | 25,068 | |
State registration fees | | | 1,737 | |
NASDAQ fees | | | 1,500 | |
Miscellaneous expenses | | | 2,762 | |
| |
Total Expense | | | 66,730 | |
Less fees waived/reimbursed by investment advisor (Note 7) | | | | |
Class A | | | (9,499) | |
Class C | | | (9,045) | |
Class I | | | (36,196) | |
| |
Net Expenses | | | 11,990 | |
| |
Net Investment Loss, Before Deferred Income Taxes | | | (11,990) | |
Deferred income tax benefit | | | 4,364 | |
| |
Net Investment Loss, Net of Deferred Income Taxes | | | (7,626) | |
| |
| |
REALIZED AND UNREALIZED GAIN/(LOSS) | | | | |
Net realized loss on investments, before deferred income taxes | | | (1,201) | |
Deferred income tax benefit | | | 437 | |
| |
Net Realized Loss on investments, Net of Deferred Income Taxes | | | (764) | |
| |
| |
Net change in unrealized appreciation on investment, before deferred income taxes | | | 633,923 | |
Deferred income tax expense | | | (230,748) | |
| |
Net Change in Unrealized Appreciation on Investments | | | 403,175 | |
| |
NET REALIZED AND UNREALIZED GAIN ON INVESTMENTS, NET OF DEFERRED INCOME TAXES | | | 402,411 | |
| |
NET INCREASE IN NET ASSETS RESULTING FROM OPERATIONS | | $ | 394,785 | |
| |
See Notes to Financial Statements.
| | |
| ALPS | Alerian MLP Infrastructure Index Fund | | |
| Statement of Changes in Net Assets | | |
| | | | |
| | | For the Period
January 2, 2013
(Commencement) to April 30, 2013 | |
| |
OPERATIONS | | | | |
Net investment loss, net of deferred income taxes | | $ | (7,626) | |
Net realized loss on investments, net of deferred income taxes | | | (764) | |
Net change in unrealized appreciation on investments, net of deferred income taxes | | | 403,175 | |
| |
Net Increase in Net Assets Resulting from Operations | | | 394,785 | |
| |
| |
DISTRIBUTIONS | | | | |
Dividends to shareholders from tax return of capital | | | | |
Class A | | | (8,653) | |
Class C | | | (8,137) | |
Class I | | | (32,548) | |
| |
Net Decrease in Net Assets from Distributions | | | (49,338) | |
| |
| |
BENEFICIAL INTEREST TRANSACTIONS (NOTE 6) | | | | |
Shares sold | | | | |
Class A | | | 851,295 | |
Class C | | | 500,010 | |
Class I | | | 2,000,010 | |
Dividends reinvested | | | | |
Class A | | | 8,653 | |
Class C | | | 8,137 | |
Class I | | | 32,548 | |
Shares redeemed | | | | |
Class A | | | (10) | |
Class C | | | (10) | |
Class I | | | (10) | |
| |
Net Increase in Net Assets Derived from Beneficial Interest Transactions | | | 3,400,623 | |
| |
| |
Net increase in net assets | | | 3,746,070 | |
| |
NET ASSETS | | | | |
Beginning of period | | | – | |
| |
End of year * | | $ | 3,746,070 | |
| |
| *Including accumulated net investment loss, net of deferred income taxes of: | | $ | (7,626) | |
See Notes to Financial Statements.
| | |
| ALPS | Alerian MLP Infrastructure Index Fund – Class A |
Financial Highlights Selected data for a share of beneficial interest outstanding throughout the period indicated: |
| | |
| | | For the Period
January 2, 2013
(Commencement) to April 30, 2013 |
|
Net asset value, beginning of period | | $10.00 |
| |
INCOME/(LOSS) FROM INVESTMENT OPERATIONS: | | |
Net investment loss(a) | | (0.03) |
Net realized and unrealized gain | | 1.29 |
|
Total from investment operations | | 1.26 |
|
| |
DISTRIBUTIONS: | | |
From tax return of capital | | (0.16) |
|
Total distributions | | (0.16) |
|
| |
Net increase in net asset value | | 1.10 |
|
Net asset value, end of year | | $11.10 |
|
TOTAL RETURN(b) | | 12.68% |
| |
RATIOS/SUPPLEMENTAL DATA: | | |
Net assets, end of year (000s) | | $928 |
| |
Ratio of expenses to average net assets before waivers and income tax expense | | 5.51%(c)(g) |
Ratio of expense waivers to average net assets | | (4.26%)(c)(g) |
|
Ratio of expenses to average net assets net of waivers and before income tax expense | | 1.25%(c)(g) |
Ratio of deferred income tax expense to average net assets(d) | | 20.55%(c) |
|
Ratio of total expenses to average net assets | | 21.80%(c) |
|
| |
Ratio of investment loss to average net assets before waivers and income tax expense | | (5.51%)(c)(g) |
Ratio of expense waivers to average net assets | | (4.26%)(c)(g) |
|
Ratio of investment loss to average net assets net of waivers and before income tax expense | | (1.25%)(c)(g) |
Ratio of deferred income tax benefit to average net assets(e) | | 0.40%(c) |
|
Ratio of net investment loss to average net assets | | (0.85%)(c) |
|
| |
Portfolio turnover rate(f) | | 3% |
|
| (a) | Calculated using the average shares method. |
| (b) | Total returns are for the period indicated and have not been annualized. Total returns would have been lower had certain expenses not been waived during the period. Returns shown do not reflect the deduction of taxes that a shareholder would pay on Fund distributions or the redemption of Fund shares. Returns shown exclude any applicable sales charges. |
| (d) | Deferred income tax expense estimate for the ratio calculation is derived from the net investment loss, and realized and unrealized gains/losses. |
| (e) | Deferred income tax benefit for the ratio calculation is derived from net investment loss only. |
| (f) | Portfolio turnover rate for periods less than one full year have not been annualized. |
| (g) | Expense ratios before reductions for startup periods may not be representative of longer term operating periods. |
See Notes to Financial Statements.
| | |
| ALPS | Alerian MLP Infrastructure Index Fund – Class C |
| Financial Highlights | | |
| Selected data for a share of beneficial interest outstanding throughout the period indicated: |
| | |
| | | For the Period
January 2, 2013
(Commencement) to April 30, 2013 |
|
Net asset value, beginning of period | | $10.00 |
| |
INCOME/(LOSS) FROM INVESTMENT OPERATIONS: | | |
Net investment loss(a) | | (0.05) |
Net realized and unrealized gain | | 1.30 |
|
Total from investment operations | | 1.25 |
|
| |
DISTRIBUTIONS: | | |
From tax return of capital | | (0.16) |
|
Total distributions | | (0.16) |
|
| |
Net increase in net asset value | | 1.09 |
|
Net asset value, end of year | | $11.09 |
|
TOTAL RETURN(b) | | 12.58% |
| |
RATIOS/SUPPLEMENTAL DATA: | | |
Net assets, end of year (000s) | | $563 |
| |
Ratio of expenses to average net assets before waivers and income tax expense | | 7.01%(c)(g) |
Ratio of expense waivers to average net assets | | (5.16%)(c)(g) |
|
Ratio of expenses to average net assets net of waivers and before income tax expense | | 1.85%(c)(g) |
Ratio of deferred income tax expense to average net assets(d) | | 20.55%(c) |
|
Ratio of total expenses to average net assets | | 22.40%(c) |
|
| |
Ratio of investment loss to average net assets before waivers and income tax expense | | (7.01%)(c)(g) |
Ratio of expense waivers to average net assets | | (5.16%)(c)(g) |
|
Ratio of investment loss to average net assets net of waivers and before income tax expense | | (1.85%)(c)(g) |
Ratio of deferred income tax benefit to average net assets(e) | | 0.40%(c) |
|
Ratio of net investment loss to average net assets | | (1.45%)(c) |
|
| |
Portfolio turnover rate(f) | | 3% |
|
| (a) | Calculated using the average shares method. |
| (b) | Total returns are for the period indicated and have not been annualized. Total returns would have been lower had certain expenses not been waived during the period. Returns shown do not reflect the deduction of taxes that a shareholder would pay on Fund distributions or the redemption of Fund shares. Returns shown exclude any applicable sales charges. |
| (d) | Deferred income tax expense estimate for the ratio calculation is derived from the net investment loss, and realized and unrealized gains/losses. |
| (e) | Deferred income tax benefit for the ratio calculation is derived from net investment loss only. |
| (f) | Portfolio turnover rate for periods less than one full year have not been annualized. |
| (g) | Expense ratios before reductions for startup periods may not be representative of longer term operating periods. |
See Notes to Financial Statements.
| | |
| ALPS | Alerian MLP Infrastructure Index Fund – Class I |
| Financial Highlights | | |
Selected data for a share of beneficial interest outstanding throughout the period indicated:
| | |
| | | For the Period January 2, 2013 (Commencement) to April 30, 2013 |
|
Net asset value, beginning of period | | $10.00 |
| |
INCOME/(LOSS) FROM INVESTMENT OPERATIONS: | | |
Net investment loss(a) | | (0.02) |
Net realized and unrealized gain | | 1.29 |
|
Total from investment operations | | 1.27 |
|
| |
DISTRIBUTIONS: | | |
From tax return of capital | | (0.16) |
|
Total distributions | | (0.16) |
|
| |
Net increase in net asset value | | 1.11 |
|
Net asset value, end of year | | $11.11 |
|
TOTAL RETURN(b) | | 12.78% |
| |
RATIOS/SUPPLEMENTAL DATA: | | |
Net assets, end of year (000s) | | $2,256 |
| |
Ratio of expenses to average net assets before waivers and income tax expense | | 6.01%(c)(g) |
Ratio of expense waivers to average net assets | | (5.16%)(c)(g) |
|
Ratio of expenses to average net assets net of waivers and before income tax expense | | 0.85%(c)(g) |
Ratio of deferred income tax expense to average net assets(d) | | 20.55%(c) |
|
Ratio of total expenses to average net assets | | 21.40%(c) |
|
| |
Ratio of investment loss to average net assets before waivers and income tax expense | | (6.01%)(c)(g) |
Ratio of expense waivers to average net assets | | (5.16%)(c)(g) |
|
Ratio of investment loss to average net assets net of waivers and before income tax expense | | (0.85%)(c)(g) |
Ratio of deferred income tax benefit to average net assets(e) | | 0.40%(c) |
|
Ratio of net investment loss to average net assets | | (0.45%)(c) |
|
| |
Portfolio turnover rate(f) | | 3% |
|
| (a) | Calculated using the average shares method. |
| (b) | Total returns are for the period indicated and have not been annualized. Total returns would have been lower had certain expenses not been waived during the period. Returns shown do not reflect the deduction of taxes that a shareholder would pay on Fund distributions or the redemption of Fund shares. |
| (d) | Deferred income tax expense estimate for the ratio calculation is derived from the net investment loss, and realized and unrealized gains/losses. |
| (e) | Deferred income tax benefit for the ratio calculation is derived from net investment loss only. |
| (f) | Portfolio turnover rate for periods less than one full year have not been annualized. |
| (g) | Expense ratios before reductions for startup periods may not be representative of longer term operating periods. |
|
See Notes to Financial Statements. 14 | April 30, 2013 |
| | |
ALPS | CoreCommodity Management CompleteCommoditiesSM Strategy Fund |
| Management Commentary | | April 30, 2013 (Unaudited) |
The twelve months ended April 30, 2013 produced modestly negative results for the commodity markets. Commodity futures, as measured by the diversified Thomson Reuters/Jefferies CRB Total Return Index1 (CRYTR), were down marginally, -5.74%. Commodity equities, evaluated against the Standard & Poor’s® Global Natural Resources Total Return Index2 (SPGNRN), were also down, -1.74%. ALPS | CoreCommodity Management CompleteCommoditiesSM Strategy Fund (which prior to April 30, 2013 was known as the Jefferies Asset Management Commodity Strategy Allocation Fund) (JCRIX) delivered a net negative return of -6.16% for the period (JCRAX was -11.58% at MOP and JCRCX was down -8.02% with CDSC).
The Fund underperformed its benchmark, the Thomson Reuters/Jefferies CRB Index, by approximately 51 basis points3 in the twelve month period ending April 30, 2013 (measured against the performance of the “I” shares). The Fund employs a strategy that combines an actively managed portfolio of commodity futures related exposure (collateralized by Treasury Inflation Protected Securities – TIPS), commodity equities, and physical commodity ETF’s. While the exact composition of the fund changes from time to time in response to structural and value opportunities identified by the Fund Policy Committee, the Fund allocated approximately 65% of its assets toward commodity futures related investments and approximately 35% of its assets in commodity equities on average throughout the year. The Fund was about 97.5% invested by the end of April.
With a few exceptions, commodity prices were subdued for the year. Some of the performance can be explained by the relative strength of the US Dollar. The Dollar was up approximately 3.77% for the previous twelve months (April 30, 2012 – April 30, 2013) as measured by the US Dollar Index. Banking worries in Cyprus and a more concerted effort to stimulate the Japanese economy through massive quantitative easing policies pressured the value of the Euro and Yen respectively. Since most commodities are priced in Dollars, an increase in the value of the Dollar usually translates into lower commodity prices, excluding other factors.
Certain sectors and specific commodities fared better than others during the period. Energy prices were mixed. Natural gas posted a 27.44% gain for the year. The relative low cost of gas versus coal prompted a number of power generation plants to switch to gas for fuel. This demand helped to reduce some of the natural gas supply overhang. Crude oil (West Texas Intermediate - WTI) prices declined, -10.09% for the year. Gasoline (reformulated blendstock for oxygenate blending – RBOB) was down 4.02%. Prices for the refined product declined in the month of April 2013 after retail prices of gasoline hit historic seasonal highs in the month of February.
Agricultural commodity prices exhibited sharp contrasts. Crops with a higher degree of North American production displayed better price performance. Residual concerns about crop yields and low levels of stocks caused by last summer’s drought kept some prices relatively buoyant. Corn and soybean prices, as measured by futures contracts maturing in July 2013, gained 13.99% and 4.83%, respectively. Cotton futures with the same maturity lost -1.51% for the twelve
months ending in April 2013. Lean hog prices, as measured by the June 2013 futures contract, went up 5.56% for the year. On the other hand, exceptional growing conditions in South America led to sizable price declines in other commodities. As measured by their July 2013 futures contracts, Sugar fell by 20.97% and coffee prices dropped 29.71% for the year.
Base and precious metals prices declined noticeably this past year. August 2013 Gold futures prices dipped,
-12.27%. July 2013 Silver and July 2013 COMEX copper were down 22.44% and 16.73% respectively. Dollar strength played a role in metals prices, in our opinion. Additionally, concern about diminished global industrial activity weighed on base metal prices. Short term technical pressure was probably a major factor pushing precious metals down. Leverage and overconcentration may have also contributed to the significant downward move gold and silver experienced in mid-April 2013.
{The Fund’s top equity holdings at the end of April 2013 included Monsanto (MON) +42.38%, Exxon/Mobil (XOM) +5.80%, Syngenta AG (SYNN) +24.61%, Potash (POT) +1.11%, Deere & Company (DE) +10.91%, Chevron Corporation (CVX) +18.39%, Archer Daniels Midland Co. (ADM) +12.87%, The Mosaic Company (MOS) +18.90%, Royal Dutch Shell PLC (RDSA) +.72%, CF Industries (CF) -2.60%, and Agrium Inc. (AGU) +5.95%}
U.S. Treasury Inflation Protected Bonds or TIPS are held by the fund to invest excess cash and as collateral for commodity futures related investments held in our Cayman Island subsidiary. Nominal yields on the benchmark 10 year note began the year at 1.91%. Rates moved lower, to 1.67%, at the end of April. The most recent announcements from the Japanese central bank relating to their large quantitative easing package helped to lower rates globally as currency flows from Tokyo accelerated and found new homes in US fixed income amongst other yield seeking maneuvers. Despite the efforts by the Federal Reserve and other central banks to maintain historically low interest rates, we believe we may be nearing the end of what has been a significant multi-year rally in US treasury prices. As a result, we continue to invest in TIPS with limited duration exposure. At the end of April, our weighted average maturity was approximately 2.6 years in our TIPS portfolio.
We strongly believe that the long term fundamental drivers of commodity demand and ultimately higher prices are still in place. The recent underperformance of commodity prices relative to the Standard and Poor’s 500 Index® (S&P)4 may be a temporary phenomenon. Population growth is likely to remain unabated regardless of the economic environment in the US and Europe. A billion more people will probably be added to the world population over the next decade. The trend of wealth distribution to the developing world as those economies grow at rapid rates relative to the slow or negative growth occurring in the developed countries is contributing to ever increasing demand for raw materials and food. Incremental gains in disposable income in the developing nations have led to competition for the commodities needed for more complex and costly lifestyles. In a world with limited supplies of food, fuel, building materials, and other necessities of life, price may
| | |
ALPS | CoreCommodity Management CompleteCommoditiesSM Strategy Fund |
| Management Commentary | | April 30, 2013 (Unaudited) |
become the ultimate allocator. Additionally, the aggressively accommodative central bank monetary policies recently announced coupled with measures already in place globally are likely to make commodities and other real assets more attractive over time as currencies, including the US Dollar, may decline in value.
The views and information discussed in this commentary are as of the date of publication, are subject to change, and may not reflect the writer’s current views. The views expressed represent an assessment of market conditions at a specific point in time, are opinions only and should not be relied upon as investment advice regarding a particular investment or markets in general. Such information does not constitute a recommendation to buy or sell specific securities or investment vehicles. It should not be assumed that any investment will be profitable or will equal the performance of the fund(s) or any securities or any sectors mentioned herein. The subject matter contained herein has been derived from several sources believed to be reliable and accurate at the time of compilation. CoreCommodity Management, LLC does not accept any liability for losses either direct or consequential caused by the use of this information.
| 1 | Thomson Reuters/Jefferies CRB Total Return Index – is comprised of a basket of 19 commodities, with 39% allocated to energy contracts; 41% to agriculture; 7% to precious metals and 13% to industrial metals. The index acts as a representative indicator or today’s global commodity markets. The index is not actively managed and does not reflect any deductions for fees, expenses or taxes. An investor may not invest directly in an index. |
| 2 | Standard & Poor’s (S&P) Global Natural Resources Total Return Index – is comprised of 90 of the largest publicly traded companies, based on capitalization, in global natural resources and commodities businesses that meet certain investability requirements, offering investors diversified, liquid and investable equity exposure across 3 primary commodity-related sectors: Agribusiness, Energy, and Metals & Mining. The index is not actively managed and does not reflect any deductions for fees, expenses or taxes. An investor may not invest directly in an index. |
| 3 | Basis Points or bps is a unit that is equal to 1/100th of 1%, and is used to denote the change in a financial instrument. |
| 4 | Standard & Poor’s (S&P) 500® Index – measures the performance of 500 large cap stocks, which together represent about 75% of the total U.S. equities market. The index is not actively managed and does not reflect any deductions for fees, expenses or taxes. An investor may not invest directly in an index. |
| | |
ALPS | CoreCommodity Management CompleteCommoditiesSM Strategy Fund |
| Performance Update | | April 30, 2013 (Unaudited) |
Performance of $10,000 Initial Investment (as of April 30, 2013)
Comparison of change in value of a $10,000 investment (includes maximum sales charges of 5.50%)
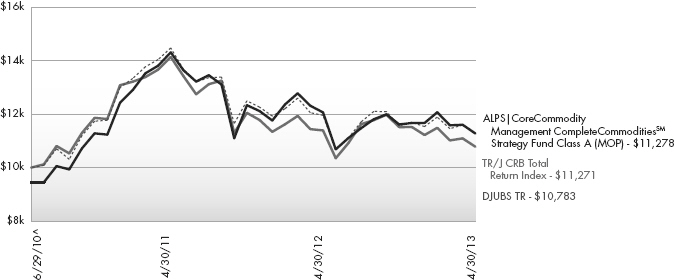
The chart above represents historical performance of a hypothetical investment of $10,000 in the Fund since inception. Past performance does not guarantee future results. This chart does not reflect the deduction of taxes that a shareholder would pay on Fund distributions or the redemption of Fund shares.
Average Annual Total Returns (as of April 30, 2013)
| | | | | | | | |
| | | 1 Year | | Since Inception ^ | | Total Expense Ratio | | What You Pay * |
Class A (NAV)1 | | -6.44% | | 6.43% | | 1.66% | | 1.47% |
Class A (MOP)2 | | -11.58% | | 4.33% | | |
Class C (NAV)1 | | -7.10% | | 5.85% | | 2.26% | | 2.07% |
Class C (CDSC)2 | | -8.02% | | 5.85% | | |
Class I | | -6.16% | | 6.75% | | 1.36% | | 1.17% |
TR/J CRB Total Return Index3 | | -5.74% | | 4.31% | | | | |
DJUBS Commodity TR3 | | -5.34% | | 2.70% | | | | |
Performance data quoted represents past performance. Past performance does not guarantee future results. Investment return and principal value of an investment will fluctuate so that an investor’s shares, when sold or redeemed, may be worth more or less than the original cost. Current performance data may be higher or lower than actual data quoted. The Fund imposes a 2.00% redemption fee on shares held for less than 30 days. The Fund imposes a maximum Contingent Deferred Sales Charge (“CDSC”) of 1.00% to shares redeemed within the first 12 months after a purchase, and on Class A shares redeemed within the first 12 months after a purchase in excess of $1 million. Performance data does not reflect the redemption fee or the CDSC, which if reflected would reduce the performance quoted. For the most current month-end performance data, please call 1-866-759-5679.
| | |
ALPS | CoreCommodity Management CompleteCommoditiesSM Strategy Fund |
| Performance Update | | April 30, 2013 (Unaudited) |
| 1 | Net Asset Value (NAV) is the share price without sales charges. |
| 2 | Maximum Offering Price (MOP) includes sales charges. Class A returns include effects of the Fund’s maximum sales charge of 5.50%; Class C returns include the 1.00% CDSC. |
| 3 | Thomson Reuters / Jefferies CRB Index and the Dow Jones-UBS Commodity Index are unmanaged indices used as a measurement of change in commodity market conditions based on the performance of a basket of different commodities. The indices are not actively managed and do not reflect any deduction for fees, expenses or taxes. An investor may not invest directly in an index. |
| ^ | Fund inception date of June 29, 2010. |
| * | What You Pay reflects the Sub-Advisor’s decision to contractually limit expenses through August 31, 2013. Please see the prospectus for additional information. |
The table does not reflect the deduction of taxes that a shareholder would pay on Fund distributions or the redemption of Fund shares.
There is no guarantee that the Fund will continue to hold any one particular security or stay invested in any one particular company. The composition of the Fund’s top holdings is subject to change. Performance figures are historical and reflect the change in share price, reinvested distributions, changes in net asset value, sales charges and capital gains distributions, if any.
Mutual funds are not insured or guaranteed by the FDIC or by any other government agency or government sponsored agency of the federal government or any state, not deposits, obligations or guaranteed by any bank or its affiliates and are subject to investment risks, including possible loss of the principal amount invested.
This Fund is not suitable for all investors, and is subject to investment risks, including possible loss of the principal amount invested.
Investing in commodity-related securities involves risk and considerations not present when investing in more conventional securities. The Fund may be more susceptible to high volatility of commodity markets.
Derivatives generally are more sensitive to changes in economic or market conditions than other types of investments; this could result in losses that significantly exceed the Fund’s original investment.
Commodity Futures Related Investments: 50.79%
(as a % of Net Assets)*
| | | | |
WTI Crude Oil | | | 10.42 | % |
Gold** | | | 5.99 | % |
Coffee | | | 5.25 | % |
Brent Crude Oil | | | 5.06 | % |
Corn | | | 4.33 | % |
Soybeans | | | 4.08 | % |
Live Cattle | | | 4.08 | % |
Aluminum | | | 4.04 | % |
Copper | | | 3.87 | % |
Cocoa | | | 3.67 | % |
Commodity-Equities: 17.93%
(as a % of Net Assets)
| | | | |
Monsanto Co. (MON) | | | 3.16 | % |
Exxon Mobil Corp. (XOM) | | | 2.94 | % |
Syngenta AG (SYNN) | | | 2.25 | % |
Potash Corp. of Saskatchewan, Inc. (POT) | | | 2.13 | % |
Deere & Co. (DE) | | | 1.68 | % |
Chevron Corp. (CVX) | | | 1.66 | % |
Archer-Daniels-Midland Co. (ADM) | | | 1.11 | % |
The Mosaic Co. (MOS) | | | 1.06 | % |
BP PLC (BP) | | | 1.01 | % |
Royal Dutch Shell PLC (RDSA) | | | 0.93 | % |
| * | Participation in commodities is generally achieved through investments in over-the-counter commodity swap contracts. |
| ** | Participation in Gold can be achieved through investments in ETFs that hold physical gold, and/or futures or other derivative contracts that are directly tied to the price performance of Gold. |
As of April 30, 2013 the portfolio composition data presented above is an estimate and may not include, among other things, investment expenses, dividends or interest payments, advisory fees or other expenses incurred by the Fund.
| | |
ALPS | CoreCommodity Management CompleteCommoditiesSM Strategy Fund |
| Consolidated Statement of Investments | | April 30, 2013 |
| | | | | | | | |
| | | Shares | | | Value (Note 2) | |
| |
COMMON STOCKS (37.50%) | | | | | | | | |
Australia (0.49%) | | | | | | | | |
Fortescue Metals Group, Ltd. | | | 31,313 | | | $ | 113,618 | |
Iluka Resources, Ltd. | | | 7,779 | | | | 72,177 | |
Incitec Pivot, Ltd. | | | 254,126 | | | | 761,377 | |
Newcrest Mining, Ltd. | | | 11,624 | | | | 202,570 | |
Woodside Petroleum, Ltd. | | | 9,366 | | | | 364,697 | |
| | | | | | | | |
| | | | | | | 1,514,439 | |
| | | | | | | | |
| | |
Brazil (0.44%) | | | | | | | | |
Cia Siderurgica Nacional SA, ADR | | | 1,580 | | | | 6,320 | |
Gerdau SA, ADR | | | 10,527 | | | | 82,637 | |
Petroleo Brasileiro SA, ADR | | | 23,163 | | | | 443,572 | |
Vale SA, ADR | | | 48,193 | | | | 823,618 | |
| | | | | | | | |
| | | | | | | 1,356,147 | |
| | | | | | | | |
| | |
Canada (4.87%) | | | | | | | | |
Agnico-Eagle Mines, Ltd. | | | 8,452 | | | | 272,915 | |
Agrium, Inc. | | | 24,076 | | | | 2,207,047 | |
Barrick Gold Corp. | | | 14,607 | | | | 287,904 | |
Cameco Corp. | | | 5,892 | | | | 114,953 | |
Canadian Natural Resources, Ltd. | | | 5,377 | | | | 157,761 | |
Eldorado Gold Corp. | | | 15,540 | | | | 123,077 | |
Encana Corp. | | | 19,209 | | | | 354,406 | |
First Quantum Minerals, Ltd. | | | 16,847 | | | | 294,147 | |
Goldcorp, Inc. | | | 24,178 | | | | 715,185 | |
IAMGOLD Corp. | | | 20,363 | | | | 109,349 | |
Kinross Gold Corp. | | | 77,002 | | | | 418,891 | |
New Gold, Inc.(a) | | | 18,238 | | | | 145,539 | |
Osisko Mining Corp.(a) | | | 19 | | | | 80 | |
Pan American Silver Corp. | | | 28,778 | | | | 379,870 | |
Potash Corp. of Saskatchewan, Inc. | | | 153,857 | | | | 6,477,380 | |
Silver Wheaton Corp. | | | 23,234 | | | | 569,930 | |
Suncor Energy, Inc. | | | 32,817 | | | | 1,022,249 | |
Teck Resources, Ltd., Class B | | | 14,026 | | | | 372,671 | |
TransCanada Corp. | | | 12,731 | | | | 631,085 | |
Turquoise Hill Resources, Ltd.(a) | | | 20,919 | | | | 147,061 | |
Yamana Gold, Inc. | | | 27,176 | | | | 334,265 | |
| | | | | | | | |
| | | | | | | 15,135,765 | |
| | | | | | | | |
| | |
Chile (0.17%) | | | | | | | | |
Sociedad Quimica y Minera de Chile SA, ADR | | | 10,655 | | | | 527,316 | |
| | | | | | | | |
| | |
China (0.48%) | | | | | | | | |
China Petroleum & Chemical Corp., Class H | | | 245,224 | | | | 268,287 | |
China Shenhua Energy Co., Ltd., Class H | | | 58,216 | | | | 205,928 | |
CNOOC, Ltd. | | | 250,001 | | | | 466,488 | |
Jiangxi Copper Co., Ltd., Class H | | | 27,185 | | | | 52,687 | |
PetroChina Co., Ltd., Class H | | | 330,045 | | | | 419,778 | |
| | | | | | | | |
| | | Shares | | | Value (Note 2) | |
| |
China (continued) | | | | | | | | |
Zijin Mining Group Co., Ltd., Class H | | | 214,020 | | | $ | 63,157 | |
| | | | | | | | |
| | | | | | | 1,476,325 | |
| | | | | | | | |
| | |
France (0.58%) | | | | | | | | |
Total SA | | | 35,634 | | | | 1,795,943 | |
| | | | | | | | |
| | |
Germany (0.51%) | | | | | | | | |
K+S AG | | | 34,170 | | | | 1,510,656 | |
ThyssenKrupp AG(a) | | | 3,937 | | | | 71,214 | |
| | | | | | | | |
| | | | | | | 1,581,870 | |
| | | | | | | | |
| | |
India (0.13%) | | | | | | | | |
Reliance Industries, Ltd., GDR(b) | | | 13,626 | | | | 401,558 | |
Sterlite Industries India, Ltd., ADR | | | 2,057 | | | | 14,872 | |
| | | | | | | | |
| | | | | | | 416,430 | |
| | | | | | | | |
| | |
Israel (0.33%) | | | | | | | | |
Israel Chemicals, Ltd. | | | 55,718 | | | | 662,710 | |
The Israel Corp., Ltd. | | | 574 | | | | 369,057 | |
| | | | | | | | |
| | | | | | | 1,031,767 | |
| | | | | | | | |
| | |
Italy (0.60%) | | | | | | | | |
Eni SpA, ADR | | | 39,236 | | | | 1,875,873 | |
| | | | | | | | |
| | |
Japan (0.15%) | | | | | | | | |
Inpex Corp. | | | 85 | | | | 409,807 | |
Nippon Steel & Sumitomo Metal Corp. | | | 20,342 | | | | 54,045 | |
| | | | | | | | |
| | | | | | | 463,852 | |
| | | | | | | | |
| | |
Jersey (0.07%) | | | | | | | | |
Randgold Resources, Ltd., ADR | | | 2,744 | | | | 224,404 | |
| | | | | | | | |
| | |
Luxembourg (0.14%) | | | | | | | | |
ArcelorMittal | | | 19,466 | | | | 243,130 | |
Tenaris SA, ADR | | | 4,150 | | | | 184,634 | |
| | | | | | | | |
| | | | | | | 427,764 | |
| | | | | | | | |
| | |
Mexico (0.26%) | | | | | | | | |
Grupo Mexico SAB de CV, Series B | | | 54,387 | | | | 195,245 | |
Industrias Penoles SAB de CV | | | 14,794 | | | | 621,316 | |
| | | | | | | | |
| | | | | | | 816,561 | |
| | | | | | | | |
| | |
Netherlands (1.21%) | | | | | | | | |
CNH Global N.V. | | | 13,138 | | | | 540,366 | |
Nutreco N.V. | | | 4,220 | | | | 400,531 | |
Royal Dutch Shell PLC, ADR | | | 41,488 | | | | 2,819,940 | |
| | | | | | | | |
| | | | | | | 3,760,837 | |
| | | | | | | | |
| | |
Norway (0.57%) | | | | | | | | |
Norsk Hydro ASA | | | 17,863 | | | | 83,638 | |
| | |
ALPS | CoreCommodity Management CompleteCommoditiesSM Strategy Fund |
| Consolidated Statement of Investments | | April 30, 2013 |
| | | | | | | | |
| | | Shares | | | Value (Note 2) | |
| |
Norway (continued) | | | | | | | | |
Yara International ASA | | | 36,159 | | | $ | 1,693,043 | |
| | | | | | | | |
| | | | | | | 1,776,681 | |
| | | | | | | | |
| | |
Peru (0.10%) | | | | | | | | |
Cia de Minas Buenaventura SA, ADR | | | 15,310 | | | | 306,506 | |
| | | | | | | | |
| | |
Russia (2.03%) | | | | | | | | |
Gazprom OAO, ADR | | | 159,410 | | | | 1,264,918 | |
LUKOIL OAO, ADR | | | 18,380 | | | | 1,165,292 | |
Mechel Steel Group, ADR | | | 16,800 | | | | 68,544 | |
MMC Norilsk Nickel OJSC, ADR(a) | | | 90,197 | | | | 1,381,818 | |
NovaTek OAO, GDR(c) | | | 1,817 | | | | 183,880 | |
Rosneft Oil Co. OAO, GDR(c) | | | 53,474 | | | | 365,495 | |
Severstal OAO, GDR(c) | | | 7,314 | | | | 61,840 | |
Uralkali OJSC, GDR(c) | | | 50,441 | | | | 1,825,460 | |
| | | | | | | | |
| | | | | | | 6,317,247 | |
| | | | | | | | |
| | |
Singapore (0.51%) | | | | | | | | |
Golden Agri-Resources, Ltd. | | | 780,586 | | | | 335,886 | |
Olam International, Ltd. | | | 258,948 | | | | 352,146 | |
Wilmar International, Ltd. | | | 330,439 | | | | 893,368 | |
| | | | | | | | |
| | | | | | | 1,581,400 | |
| | | | | | | | |
| | |
South Africa (0.47%) | | | | | | | | |
Anglo Platinum, Ltd.(a) | | | 435 | | | | 16,501 | |
AngloGold Ashanti, Ltd., ADR | | | 16,970 | | | | 330,915 | |
Gold Fields, Ltd., ADR | | | 33,120 | | | | 247,075 | |
Harmony Gold Mining Co., Ltd., ADR | | | 34,631 | | | | 177,657 | |
Impala Platinum Holdings, Ltd. | | | 17,765 | | | | 242,436 | |
Kumba Iron Ore, Ltd. | | | 1,186 | | | | 62,552 | |
Sasol, Ltd. | | | 7,880 | | | | 340,570 | |
Sibanye Gold, Ltd., ADR(a) | | | 8,280 | | | | 31,878 | |
| | | | | | | | |
| | | | | | | 1,449,584 | |
| | | | | | | | |
| | |
South Korea (0.15%) | | | | | | | | |
POSCO, ADR | | | 6,322 | | | | 455,121 | |
| | | | | | | | |
| | |
Switzerland (2.64%) | | | | | | | | |
Glencore International PLC | | | 53,696 | | | | 264,364 | |
Syngenta AG | | | 15,982 | | | | 6,830,767 | |
Transocean, Ltd. | | | 5,923 | | | | 304,857 | |
Weatherford International, Ltd.(a) | | | 20,498 | | | | 262,169 | |
Xstrata PLC | | | 36,382 | | | | 544,512 | |
| | | | | | | | |
| | | | | | | 8,206,669 | |
| | | | | | | | |
| | |
United Kingdom (2.28%) | | | | | | | | |
Anglo American PLC | | | 27,213 | | | | 661,546 | |
Antofagasta PLC | | | 7,696 | | | | 107,292 | |
BG Group PLC | | | 55,192 | | | | 929,769 | |
BHP Billiton PLC, ADR | | | 19,473 | | | | 1,100,809 | |
BP PLC, ADR | | | 70,011 | | | | 3,052,479 | |
Kazakhmys PLC | | | 4,437 | | | | 23,868 | |
Lonmin PLC(a) | | | 5,780 | | | | 24,152 | |
| | | | | | | | |
| | | Shares | | | Value (Note 2) | |
| |
United Kingdom (continued) | | | | | | | | |
Petropavlovsk PLC | | | 10,162 | | | $ | 22,888 | |
Rio Tinto PLC, ADR | | | 25,578 | | | | 1,178,123 | |
| | | | | | | | |
| | | | | | | 7,100,926 | |
| | | | | | | | |
| | |
United States (18.32%) | | | | | | | | |
AGCO Corp. | | | 21,171 | | | | 1,127,356 | |
Alcoa, Inc. | | | 15,849 | | | | 134,717 | |
Allegheny Technologies, Inc. | | | 2,193 | | | | 59,167 | |
Allied Nevada Gold Corp.(a) | | | 5,428 | | | | 58,080 | |
Anadarko Petroleum Corp. | | | 8,568 | | | | 726,224 | |
Apache Corp. | | | 6,230 | | | | 460,272 | |
Archer-Daniels-Midland Co. | | | 99,128 | | | | 3,364,404 | |
Baker Hughes, Inc. | | | 10,070 | | | | 457,077 | |
Bunge, Ltd. | | | 13,968 | | | | 1,008,629 | |
Cameron International Corp.(a) | | | 3,864 | | | | 237,829 | |
CF Industries Holdings, Inc. | | | 13,489 | | | | 2,515,833 | |
Chevron Corp. | | | 41,377 | | | | 5,048,408 | |
Cliffs Natural Resources, Inc. | | | 7,741 | | | | 165,193 | |
Coeur d’Alene Mines Corp.(a) | | | 7,051 | | | | 107,457 | |
ConocoPhillips | | | 17,965 | | | | 1,085,984 | |
Deere & Co. | | | 57,208 | | | | 5,108,674 | |
Detour Gold Corp.(a) | | | 299 | | | | 3,597 | |
Devon Energy Corp. | | | 7,294 | | | | 401,608 | |
Ensco PLC, Class A | | | 402 | | | | 23,187 | |
EOG Resources, Inc. | | | 3,313 | | | | 401,403 | |
Exxon Mobil Corp. | | | 100,178 | | | | 8,914,840 | |
Freeport-McMoRan Copper & Gold, Inc. | | | 12,421 | | | | 377,971 | |
Halliburton Co. | | | 17,195 | | | | 735,430 | |
Hecla Mining Co. | | | 32,478 | | | | 110,425 | |
Hess Corp. | | | 3,917 | | | | 282,729 | |
Ingredion, Inc. | | | 17,065 | | | | 1,228,851 | |
Intrepid Potash, Inc. | | | 15,406 | | | | 283,625 | |
Kinder Morgan, Inc. | | | 8,702 | | | | 340,248 | |
Marathon Oil Corp. | | | 29,459 | | | | 962,426 | |
Marathon Petroleum Corp. | | | 5,700 | | | | 446,652 | |
Monsanto Co. | | | 89,728 | | | | 9,584,745 | |
The Mosaic Co. | | | 52,099 | | | | 3,208,778 | |
National Oilwell Varco, Inc. | | | 6,952 | | | | 453,410 | |
Newmont Mining Corp. | | | 19,590 | | | | 634,716 | |
Noble Energy, Inc. | | | 4,608 | | | | 522,040 | |
Nucor Corp. | | | 4,606 | | | | 200,914 | |
Occidental Petroleum Corp. | | | 17,874 | | | | 1,595,433 | |
Peabody Energy Corp. | | | 5,399 | | | | 108,304 | |
Phillips 66 | | | 7,700 | | | | 469,315 | |
Pioneer Natural Resources Co. | | | 2,572 | | | | 314,376 | |
Royal Gold, Inc. | | | 1,944 | | | | 108,048 | |
Schlumberger, Ltd. | | | 24,045 | | | | 1,789,669 | |
Southern Copper Corp. | | | 3,937 | | | | 131,220 | |
Southwestern Energy Co.(a) | | | 7,208 | | | | 269,723 | |
Spectra Energy Corp. | | | 697 | | | | 21,976 | |
Valero Energy Corp. | | | 22,250 | | | | 897,120 | |
| | |
ALPS | CoreCommodity Management CompleteCommoditiesSM Strategy Fund |
| Consolidated Statement of Investments | | April 30, 2013 |
| | | | | | | | |
| | | Shares | | | Value (Note 2) | |
| |
United States (continued) | | | | | | | | |
The Williams Co., Inc. | | | 12,274 | | | $ | 468,008 | |
| | | | | | | | |
| | | | | | | 56,956,091 | |
| | | | | | | | |
| |
TOTAL COMMON STOCKS | | | | | |
(Cost $116,740,633) | | | | | | | 116,555,518 | |
| | | | | | | | |
| |
EXCHANGE TRADED FUNDS (1.82%) | | | | | |
iShares® Gold Trust(a) | | | 218,898 | | | | 3,141,186 | |
SPDR® Gold Trust(a) | | | 17,688 | | | | 2,525,316 | |
| | | | | | | | |
| |
TOTAL EXCHANGE TRADED FUNDS | | | | | |
(Cost $6,391,017) | | | | | | | 5,666,502 | |
| | | | | | | | |
| | |
WARRANTS (0.00%)(d) | | | | | | | | |
Canada (0.00%)(d) | | | | | | | | |
Kinross Gold Corp., Strike Price $21.30, Expires 9/17/14(a) | | | 19 | | | | 3 | |
| | | | | | | | |
| | |
United States (0.00%)(d) | | | | | | | | |
Magnum Hunter Resources Corp., Strike Price $10.50, Expires 10/14/13(a) | | | 629 | | | | 88 | |
| | | | | | | | |
| |
TOTAL WARRANTS | | | | | |
(Cost $69) | | | | | | | 91 | |
| | | | | | | | |
| | |
| | | Principal Amount | | | Value (Note 2) | |
| |
GOVERNMENT BONDS (55.08%) | | | | | |
U.S. Treasury Bonds (55.08%) | | | | | |
United States Treasury Inflation Indexed Bonds | | | | | |
1.875%, 7/15/13(e)(f) | | $ | 5,800,521 | | | | 5,830,428 | |
2.000%, 1/15/14(f) | | | 6,249,297 | | | | 6,374,770 | |
1.250%, 4/15/14(e) | | | 8,718,924 | | | | 8,895,343 | |
2.000%, 7/15/14 | | | 11,389,895 | | | | 11,884,649 | |
1.625%, 1/15/15(e)(f) | | | 13,644,549 | | | | 14,340,639 | |
0.500%, 4/15/15(f) | | | 11,700,894 | | | | 12,125,051 | |
1.875%, 7/15/15 | | | 8,651,208 | | | | 9,353,443 | |
2.000%, 1/15/16 | | | 9,063,005 | | | | 9,950,192 | |
0.125%, 4/15/16 | | | 21,556,365 | | | | 22,592,084 | |
2.500%, 7/15/16 | | | 11,208,698 | | | | 12,771,784 | |
2.375%, 1/15/17(f) | | | 10,070,725 | | | | 11,582,119 | |
0.125%, 4/15/17(e)(f) | | | 14,817,405 | | | | 15,781,692 | |
2.625%, 7/15/17(f) | | | 14,278,470 | | | | 16,946,759 | |
1.625%, 1/15/18 | | | 11,079,100 | | | | 12,765,206 | |
| | | | | | | | |
| | | | | | | 171,194,159 | |
| | | | | | | | |
TOTAL GOVERNMENT BONDS | | | | | | | | |
(Cost $170,654,312) | | | | | | | 171,194,159 | |
| | | | | | | | |
| | | | | | | | |
| | | 7-Day Yield | | Shares | | Value (Note 2) | |
| |
SHORT TERM INVESTMENTS (8.85%) | |
Money Market Fund (8.85%) | |
Dreyfus Treasury Prime Cash Management Fund, Institutional Shares | | 0.00004% | | 27,503,104 | | $ | 27,503,104 | |
| | | | | | | | |
| |
TOTAL SHORT TERM INVESTMENTS | | | | |
(Cost $27,503,104) | | | | | 27,503,104 | |
| | | | | | | | |
| |
TOTAL INVESTMENTS (103.25%) | | | | |
(Cost $321,289,135) | | $ | 320,919,374 | |
| |
Liabilities in Excess of Other Assets (-3.25%) | | | (10,095,587 | ) |
| |
NET ASSETS - 100.00% | | $ | 310,823,787 | |
| |
| (a) | Non-Income Producing Security. |
| (b) | Security exempt from registration under rule 144A of the securities act of 1933. This security may be resold in transactions exempt from registration, normally to qualified institutional buyers. At period end, the market value of those securities was $401,558, representing 0.13% of the Fund’s net assets. |
| (c) | These securities initially sold to other parties pursuant to Regulation S under the 1933 Act and subsequently resold to the Fund. At period end, the aggregate market value of those securities was $2,436,675, representing 0.78% of the Fund’s net assets. |
| (e) | Security, or portion of security, is being held as collateral for futures contracts. |
| (f) | Security, or portion of security, is being held as collateral for total return swap contracts. |
Common Abbreviations:
|
ADR - American Depositary Receipt. |
AG - Aktiengesellschaft is a German term that refers to a corporation that is limited by shares, i.e., owned by shareholders. |
ASA - Allmennaksjeselskap is the Norwegian term for public limited company. |
GDR - Global Depositary Receipt. |
Ltd. - Limited. |
N.V. - Naamloze vennootschap is the Dutch term for a public limited liability corporation. |
OAO - Russian open joint stock company. |
OJSC - Open joint stock company. |
PLC - Public Limited Co. |
SA - Generally designated corporations in various countries, mostly those employing the civil law. |
SAB de CV - A variable capital company. |
SPDR - Standard & Poor’s Depository Receipt. |
| | |
ALPS | CoreCommodity Management CompleteCommoditiesSM Strategy Fund |
| Consolidated Statement of Investments | | April 30, 2013 |
For Fund compliance purposes, the Fund’s industry and geographical classifications refer to any one or more of the industry sub-classifications used by one or more widely recognized market indexes or ratings group indexes, and/or as defined by Fund management. This definition may not apply for purposes of this report, which may combine sub-classifications for reporting ease. Industries and regions are shown as a percent of net assets.
See Notes to Financial Statements.
| | |
ALPS | CoreCommodity Management CompleteCommoditiesSM Strategy Fund |
| Consolidated Statement of Investments | | April 30, 2013 |
FUTURES CONTRACTS
| | | | | | | | | | | | | | | | |
| Description | | Position | | Contracts | | Expiration Date | | | Value (Note 2) | | | Unrealized Appreciation | |
| |
Silver Future | | Short | | (1) | | | 12/30/13 | | | $ | (121,510 | ) | | $ | 52,978 | |
WTI Crude Future | | Long | | 4 | | | 5/21/13 | | | | 373,840 | | | | 114 | |
WTI Crude Future | | Short | | (4) | | | 5/22/13 | | | | (373,840 | ) | | | 19,552 | |
WTI Crude Future | | Short | | (55) | | | 7/22/13 | | | | (5,151,850 | ) | | | 178,789 | |
| | | | | | | | | | | | |
| | | | | | | | | | $ | (5,273,360 | ) | | $ | 251,433 | |
| | | | | | | | | | | | |
| | | | | |
| Description | | Position | | Contracts | | Expiration Date | | | Value (Note 2) | | | Unrealized Depreciation | |
| |
Brent Crude Future | | Long | | 150 | | | 5/17/13 | | | $ | 15,355,500 | | | $ | (798,361 | ) |
Gold 100 Oz. Future | | Long | | 48 | | | 6/27/13 | | | | 7,066,080 | | | | (438,128 | ) |
S&P 500® Mini Future | | Short | | (190) | | | 6/24/13 | | | | (15,125,900 | ) | | | (421,894 | ) |
Silver Future | | Long | | 1 | | | 12/30/14 | | | | 122,445 | | | | (51,122 | ) |
WTI Crude Future | | Short | | (185) | | | 8/20/13 | | | | (17,280,850 | ) | | | (214,742 | ) |
WTI Crude Future | | Long | | 70 | | | 11/20/13 | | | | 6,447,700 | | | | (242,113 | ) |
| | | | | | | | | | | | |
| | | | | | | | | | $ | (3,415,025 | ) | | $ | (2,166,360 | ) |
| | | | | | | | | | | | |
TOTAL RETURN SWAP CONTRACTS(a)
| | | | | | | | | | | | | | |
| Swap Counterparty | | Reference Obligation | | Notional Dollars | | | Rate Paid by
the Fund | | Termination Date | | Unrealized Appreciation | |
| |
| Bank of America - Merrill Lynch | | ML Index Robusta | | $ | (5,800,000 | ) | | 0.10% | | 6/28/13 | | $ | 0 | |
| Bank of America - Merrill Lynch | | MLCS Coffee J-F3 | | | (3,847,086 | ) | | 0.10% | | 6/28/13 | | | 136,221 | |
| Bank of America - Merrill Lynch | | MLCS Copper J-F3 | | | (5,777,117 | ) | | 0.10% | | 6/28/13 | | | 399,502 | |
| Bank of America - Merrill Lynch | | MLCS Silver J-F3 | | | (925,492 | ) | | 0.10% | | 6/28/13 | | | 136,825 | |
| Bank of America - Merrill Lynch | | MLCX Aluminum J-F3 | | | (5,224,011 | ) | | 0.10% | | 6/28/13 | | | 95,575 | |
| Bank of America - Merrill Lynch | | MLCX GoldT-F3 | | | (6,234,777 | ) | | 0.10% | | 6/28/13 | | | 484,657 | |
| | | | | | | | | | | | | | |
| | | | | | | | | | | | $ | 1,252,780 | |
| | | | | | | | | | | | | | |
| | | | | |
| Swap Counterparty | | Reference Obligation | | Notional
Dollars | | | Rate Paid
by the Fund | | Termination
Date | | Unrealized
Depreciation | |
| |
Bank of America - Merrill Lynch | | CRB 3 Month Forward Total Return Index | | $ | 80,838,741 | | | 0.48% | | 6/28/13 | | $ | (1,890,216 | ) |
Bank of America - Merrill Lynch | | ML Aluminum GA6 | | | 5,183,044 | | | 0.10% | | 6/28/13 | | | (73,781 | ) |
Bank of America - Merrill Lynch | | ML eXtra Coffee ER | | | 6,000,000 | | | 0.30% | | 6/28/13 | | | (176,702 | ) |
Bank of America - Merrill Lynch | | ML eXtra Coffee GA6 | | | 3,873,631 | | | 0.10% | | 6/28/13 | | | (142,808 | ) |
Bank of America - Merrill Lynch | | ML eXtra Copper GA6 | | | 5,824,597 | | | 0.10% | | 6/28/13 | | | (402,865 | ) |
Bank of America - Merrill Lynch | | ML eXtra Silver GA6 | | | 928,115 | | | 0.10% | | 6/28/13 | | | (137,052 | ) |
Bank of America - Merrill Lynch | | Natural Gas Future | | | (6,012,000 | ) | | 0.00% | | 6/30/13 | | | (502,500 | ) |
Societe Generale | | CRB 3 Month Forward Total Return Index | | | 51,640,528 | | | 0.35% | | 11/29/13 | | | (1,207,487 | ) |
UBS | | CRB 3 Month Forward Total Return Index | | | 74,277,193 | | | 0.40% | | 11/29/13 | | | (1,736,791 | ) |
| | | | | | | | | | | | | | |
| | | | | | | | | | | | $ | (6,270,202 | ) |
| | | | | | | | | | | | | | |
| (a) | The Fund receives monthly payments based on any positive monthly return of the Reference Obligation. The Fund makes payments on any negative monthly return of such Reference Obligation. |
See Notes to Financial Statements.
| | |
ALPS | CoreCommodity Management CompleteCommoditiesSM Strategy Fund |
| Consolidated Statement of Assets and Liabilities | | April 30, 2013 |
| | | | |
ASSETS | | | | |
Investments, at value | | $ | 320,919,374 | |
Cash | | | 979,637 | |
Foreign currency, at value (Cost $516,087) | | | 519,021 | |
Unrealized appreciation on total return swap contracts | | | 1,252,780 | |
Receivable for investments sold | | | 28,961,955 | |
Receivable for shares sold | | | 743,322 | |
Receivable due from broker for total return swap contracts | | | 84,812 | |
Deposit with broker for futures contracts | | | 3,426,676 | |
Dividends and interest receivable | | | 805,693 | |
Prepaid expenses and other assets | | | 17,052 | |
| |
Total Assets | | | 357,710,322 | |
| |
LIABILITIES | | | | |
Payable for investments purchased | | | 37,972,151 | |
Payable for variation margin | | | 1,914,927 | |
Payable for shares redeemed | | | 199,198 | |
Unrealized depreciation on total return swap contracts | | | 6,270,202 | |
Investment advisory fees payable | | | 208,256 | |
Administration and transfer agency fees payable | | | 43,613 | |
Distribution and services fees payable | | | 155,465 | |
Trustees’ fees and expenses payable | | | 3,845 | |
Legal fees payable | | | 1,562 | |
Audit and tax fees payable | | | 36,615 | |
Accrued expenses and other liabilities | | | 80,701 | |
| |
Total Liabilities | | | 46,886,535 | |
| |
NET ASSETS | | $ | 310,823,787 | |
| |
NET ASSETS CONSIST OF | | | | |
Paid-in capital | | $ | 323,667,411 | |
Accumulated net investment income | | | 1,091 | |
Accumulated net realized loss on investments, written options, futures contracts, total return swap contracts, securities sold short and foreign currency transactions | | | (5,543,648) | |
Net unrealized depreciation on investments, futures contracts, total return swap contracts, securities sold short and translation of assets and liabilities denominated in foreign currencies | | | (7,301,067) | |
| |
NET ASSETS | | $ | 310,823,787 | |
| |
INVESTMENTS, AT COST | | $ | 321,289,135 | |
| |
| |
PRICING OF SHARES | | | | |
Class A: | | | | |
Net Asset Value, offering and redemption price per share(a) | | $ | 10.40 | |
Net Assets | | $ | 104,233,545 | |
Shares of beneficial interest outstanding (unlimited number of shares, no par value common stock authorized) | | | 10,020,549 | |
Maximum offering price per share ((NAV/0.9450), based on maximum sales charge of 5.50% of the offering price) | | $ | 11.01 | |
Class C: | | | | |
Net Asset Value, offering and redemption price per share(a) | | $ | 10.31 | |
Net Assets | | $ | 19,444,247 | |
Shares of beneficial interest outstanding (unlimited number of shares, no par value common stock authorized) | | | 1,885,780 | |
Class I: | | | | |
Net Asset Value, offering and redemption price per share | | $ | 10.37 | |
Net Assets | | $ | 187,145,995 | |
Shares of beneficial interest outstanding (unlimited number of shares, no par value common stock authorized) | | | 18,050,739 | |
| (a) | Redemption price per share may be reduced for any applicable contingent deferred sales charge. For a description of a possible sales charge, please see the Fund’s Prospectus. |
See Notes to Financial Statements.
| | |
ALPS | CoreCommodity Management CompleteCommoditiesSM Strategy Fund |
| Consolidated Statement of Operations | | For the Year Ended April 30, 2013 |
| | | | |
INVESTMENT INCOME | | | | |
Dividends | | $ | 2,352,151 | |
Foreign taxes withheld on dividends | | | (174,996) | |
Interest and other income | | | 682,663 | |
| |
Total Investment Income | | | 2,859,818 | |
| |
| |
EXPENSES | | | | |
Investment advisory fees | | | 2,166,879 | |
Administrative and transfer agency fees | | | 430,140 | |
Distribution and service fees | | | | |
Class A | | | 357,161 | |
Class C | | | 189,135 | |
Legal fees | | | 11,856 | |
Audit and tax fees | | | 38,006 | |
Networking fees | | | | |
Class I | | | 30,183 | |
Reports to shareholders and printing fees | | | 79,858 | |
State registration fees | | | 55,160 | |
SEC registration fees | | | 22,085 | |
Insurance fees | | | 7,563 | |
Custody fees | | | 63,764 | |
Trustees’ fees and expenses | | | 20,077 | |
Miscellaneous expenses | | | 16,636 | |
| |
Total Expense | | | 3,488,503 | |
Less fees waived/reimbursed by investment advisor (Note 7) | | | | |
Class A | | | (91,338) | |
Class C | | | (17,117) | |
Class I | | | (21,636) | |
| |
Net Expenses | | | 3,358,412 | |
| |
Net Investment Loss | | | (498,594) | |
| |
Net realized loss on investments | | | (360,838) | |
Net realized gain on written options | | | 197,875 | |
Net realized loss on futures contracts | | | (1,652,573) | |
Net realized loss on total return swap contracts | | | (7,488,628) | |
Net realized loss on securities sold short | | | (6,647) | |
Net realized loss on foreign currency transactions | | | (25,171) | |
Net change in unrealized appreciation on investments | | | 808,734 | |
Net change in unrealized depreciation on futures contracts | | | (1,913,390) | |
Net change in unrealized depreciation on total return swap contracts | | | (3,555,096) | |
Net change in unrealized appreciation on securities sold short | | | 6,647 | |
Net change in unrealized appreciation on translation of assets and liabilities denominated in foreign currencies | | | 10,604 | |
| |
NET REALIZED AND UNREALIZED LOSS ON INVESTMENTS | | | (13,978,483) | |
| |
NET DECREASE IN NET ASSETS RESULTING FROM OPERATIONS | | $ | (14,477,077) | |
| |
See Notes to Financial Statements.
| | |
ALPS | CoreCommodity Management CompleteCommoditiesSM Strategy Fund |
| Consolidated Statements of Changes in Net Assets |
| | | | | | | | |
| | | For the Year Ended
April 30, 2013 | | | For the Year Ended April 30, 2012 | |
OPERATIONS | | | | | | | | |
Net investment income/(loss) | | $ | (498,594) | | | $ | 723,730 | |
Net realized loss on investments, written options, futures contracts, total return swap contracts, securities sold short and foreign currency transactions | | | (9,335,982) | | | | (16,419,885) | |
Net change in unrealized depreciation on investments, futures contracts, total return swap contracts, securities sold short and translation of assets and liabilities denominated in foreign currencies | | | (4,642,501) | | | | (7,830,792) | |
| |
Net Decrease in Net Assets Resulting from Operations | | | (14,477,077) | | | | (23,526,947) | |
| |
| | |
DISTRIBUTIONS | | | | | | | | |
Dividends to shareholders from net investment income | | | | | | | | |
Class A | | | – | | | | (3,099,336) | |
Class C | | | – | | | | (650,148) | |
Class I | | | – | | | | (5,302,231) | |
Dividends to shareholders from net realized gains | | | | | | | | |
Class A | | | – | | | | (76,847) | |
Class C | | | – | | | | (22,661) | |
Class I | | | – | | | | (98,964) | |
Dividends to shareholders from tax return of capital | | | | | | | | |
Class A | | | (532,988) | | | | – | |
Class C | | | (84,918) | | | | – | |
Class I | | | (699,604) | | | | – | |
| |
Net Decrease in Net Assets from Distributions | | | (1,317,510) | | | | (9,250,187) | |
| |
| | |
BENEFICIAL INTEREST TRANSACTIONS (NOTE 6) | | | | | | | | |
Shares sold | | | | | | | | |
Class A | | | 90,054,418 | | | | 82,119,588 | |
Class C | | | 8,548,230 | | | | 14,395,546 | |
Class I | | | 157,098,320 | | | | 66,432,636 | |
Dividends reinvested | | | | | | | | |
Class A | | | 395,824 | | | | 2,497,583 | |
Class C | | | 51,810 | | | | 450,106 | |
Class I | | | 542,393 | | | | 3,994,738 | |
Shares redeemed | | | | | | | | |
Class A | | | (66,182,451) | | | | (24,121,608) | |
Class C | | | (5,831,034) | | | | (1,620,551) | |
Class I | | | (45,457,181) | | | | (42,014,869) | |
| |
Net Increase in Net Assets Derived from Beneficial Interest Transactions | | | 139,220,329 | | | | 102,133,169 | |
| |
| | |
Net increase in net assets | | | 123,425,742 | | | | 69,356,035 | |
| | |
NET ASSETS | | | | | | | | |
Beginning of year | | | 187,398,045 | | | | 118,042,010 | |
| |
End of year * | | $ | 310,823,787 | | | $ | 187,398,045 | |
| |
*Including accumulated net investment income/(loss) of: | | $ | 1,091 | | | $ | (130,632) | |
See Notes to Financial Statements.
| | |
ALPS | CoreCommodity Management CompleteCommoditiesSM Strategy Fund – Class A |
| Consolidated Financial Highlights |
Selected data for a share of beneficial interest outstanding throughout the periods indicated:
| | | | | | |
| | | For the Year Ended
April 30, 2013(a)(b) | | For the Year Ended
April 30, 2012(a) | | For the Period
June 29, 2010
(Inception) to
April 30, 2011(a) |
|
Net asset value, beginning of period | | $11.18 | | $14.28 | | $10.00 |
| | | |
INCOME/(LOSS) FROM INVESTMENT OPERATIONS: | | | | | | |
Net investment income/(loss)(c) | | (0.03) | | 0.04 | | 0.12 |
Net realized and unrealized gain/(loss) | | (0.69) | | (2.29) | | 4.87 |
|
Total from investment operations | | (0.72) | | (2.25) | | 4.99 |
|
| | | |
DISTRIBUTIONS: | | | | | | |
From net investment income | | – | | (0.83) | | (0.71) |
From net realized gains | | – | | (0.02) | | – |
Tax return of capital | | (0.06) | | – | | – |
|
Total distributions | | (0.06) | | (0.85) | | (0.71) |
|
| | | |
REDEMPTION FEES ADDED TO PAID-IN CAPITAL (NOTE 6) | | 0.00(d) | | 0.00(d) | | 0.00(d) |
|
Net increase/(decrease) in net asset value | | (0.78) | | (3.10) | | 4.28 |
|
Net asset value, end of year | | $10.40 | | $11.18 | | $14.28 |
|
TOTAL RETURN(e) | | (6.44)% | | (15.77)% | | 51.41% |
| | | |
RATIOS/SUPPLEMENTAL DATA: | | | | | | |
Net assets, end of year (000s) | | $104,234 | | $85,805 | | $37,060 |
Ratio of expenses to average net assets excluding fee waivers and reimbursements | | 1.50% | | 1.64% | | 2.59%(f) |
Ratio of expenses to average net assets including fee waivers and reimbursements | | 1.40%(h) | | 1.45% | | 1.45%(f) |
Ratio of net investment income/(loss) to average net assets | | (0.30)% | | 0.36% | | 1.08%(f) |
Portfolio turnover rate(g) | | 117% | | 264% | | 59% |
|
| (a) | Per share amounts and ratios to average net assets include income and expenses of the Jefferies Asset Management Cayman Trust (wholly-owned subsidiary). |
| (b) | Prior to April 30, 2013 the ALPS | CoreCommodity Management CompleteCommoditiesSM Strategy Fund was known as the Jefferies Asset Management Commodity Strategy Allocation Fund. |
| (c) | Calculated using the average shares method. |
| (d) | Less than $0.005 per share. |
| (e) | Total returns are for the period indicated and have not been annualized. Total returns would have been lower had certain expenses not been waived during the period. Returns shown do not reflect the deduction of taxes that a shareholder would pay on Fund distributions or the redemption of Fund shares. Returns shown exclude any applicable sales charges. |
| (g) | Portfolio turnover rate for periods less than one full year have not been annualized. |
| (h) | According to the Fund’s shareholder services plan with respect to the Fund’s Class A shares, any amount of such payment not paid during the Fund’s fiscal year for such service activities shall be reimbursed to the Fund as soon as practicable after the end of the fiscal year. Fees were reimbursed to the Fund during the year ended April 30, 2013, for the prior fiscal year in the amount of 0.05% of average net assets of Class A shares. |
See Notes to Financial Statements.
| | |
ALPS | CoreCommodity Management CompleteCommoditiesSM Strategy Fund – Class C |
| Consolidated Financial Highlights | | |
Selected data for a share of beneficial interest outstanding throughout the periods indicated:
| | | | | | |
| | | For the Year Ended
April 30, 2013(a)(b) | | For the Year Ended
April 30, 2012(a) | | For the Period
June 29, 2010
(Inception) to
April 30, 2011(a) |
|
Net asset value, beginning of period | | $11.15 | | $14.19 | | $10.00 |
| | | |
INCOME/(LOSS) FROM INVESTMENT OPERATIONS: | | | | | | |
Net investment income/(loss)(c) | | (0.10) | | (0.05) | | 0.08 |
Net realized and unrealized gain/(loss) | | (0.69) | | (2.26) | | 4.87 |
|
Total from investment operations | | (0.79) | | (2.31) | | 4.95 |
|
| | | |
DISTRIBUTIONS: | | | | | | |
From net investment income | | – | | (0.71) | | (0.76) |
From net realized gains | | – | | (0.02) | | – |
Tax return of capital | | (0.05) | | – | | – |
|
Total distributions | | (0.05) | | (0.73) | | (0.76) |
|
| | | |
REDEMPTION FEES ADDED TO PAID-IN CAPITAL (NOTE 6) | | 0.00(d) | | 0.00(d) | | 0.00(d) |
|
Net increase/(decrease) in net asset value | | (0.84) | | (3.04) | | 4.19 |
|
Net asset value, end of year | | $10.31 | | $11.15 | | $14.19 |
|
TOTAL RETURN(e) | | (7.10)% | | (16.26)% | | 50.90% |
| | | |
RATIOS/SUPPLEMENTAL DATA: | | | | | | |
Net assets, end of year (000s) | | $19,444 | | $18,095 | | $7,352 |
Ratio of expenses to average net assets excluding fee waivers and reimbursements | | 2.14% | | 2.24% | | 4.00%(f) |
Ratio of expenses to average net assets including fee waivers and reimbursements | | 2.05% | | 2.05% | | 2.05%(f) |
Ratio of net investment income/(loss) to average net assets | | (0.92)% | | (0.42)% | | 0.72%(f) |
Portfolio turnover rate(g) | | 117% | | 264% | | 59% |
|
| (a) | Per share amounts and ratios to average net assets include income and expenses of the Jefferies Asset Management Cayman Trust (wholly-owned subsidiary), exclusive of the subsidiary’s management fee. |
| (b) | Prior to April 30, 2013 the ALPS | CoreCommodity Management CompleteCommoditiesSM Strategy Fund was known as the Jefferies Asset Management Commodity Strategy Allocation Fund. |
| (c) | Calculated using the average shares method. |
| (d) | Less than $0.005 per share. |
| (e) | Total returns are for the period indicated and have not been annualized. Total returns would have been lower had certain expenses not been waived during the period. Returns shown do not reflect the deduction of taxes that a shareholder would pay on Fund distributions or the redemption of Fund shares. Returns shown exclude any applicable sales charges. |
| (g) | Portfolio turnover rate for periods less than one full year have not been annualized. |
See Notes to Financial Statements.
| | |
ALPS | CoreCommodity Management CompleteCommoditiesSM Strategy Fund – Class I |
Consolidated Financial Highlights Selected data for a share of beneficial interest outstanding throughout the periods indicated: |
| | | | | | |
| | | For the Year Ended
April 30, 2013(a)(b) | | For the Year Ended
April 30, 2012(a) | | For the Period
June 29, 2010
(Inception) to
April 30, 2011(a) |
|
Net asset value, beginning of period | | $11.12 | | $14.25 | | $10.00 |
| | | |
INCOME/(LOSS) FROM INVESTMENT OPERATIONS: | | | | | | |
Net investment income/(loss)(c) | | (0.00)(d) | | 0.10 | | 0.13 |
Net realized and unrealized gain/(loss) | | (0.69) | | (2.32) | | 4.89 |
|
Total from investment operations | | (0.69) | | (2.22) | | 5.02 |
|
| | | |
DISTRIBUTIONS: | | | | | | |
From net investment income | | – | | (0.89) | | (0.77) |
From net realized gains | | – | | (0.02) | | – |
Tax return of capital | | (0.06) | | – | | – |
|
Total distributions | | (0.06) | | (0.91) | | (0.77) |
|
| | | |
REDEMPTION FEES ADDED TO PAID-IN CAPITAL (NOTE 6) | | 0.00(d) | | 0.00(d) | | 0.00(d) |
|
Net increase/(decrease) in net asset value | | (0.75) | | (3.13) | | 4.25 |
|
Net asset value, end of year | | $10.37 | | $11.12 | | $14.25 |
|
TOTAL RETURN(e) | | (6.16)% | | (15.53)% | | 51.74% |
| | | |
RATIOS/SUPPLEMENTAL DATA: | | | | | | |
Net assets, end of year (000s) | | $187,146 | | $83,497 | | $73,630 |
Ratio of expenses to average net assets excluding fee waivers and reimbursements | | 1.17% | | 1.33% | | 2.04%(f) |
Ratio of expenses to average net assets including fee waivers and reimbursements | | 1.15% | | 1.15% | | 1.15%(f) |
Ratio of net investment income/(loss) to average net assets | | (0.02)% | | 0.82% | | 1.19%(f) |
Portfolio turnover rate(g) | | 117% | | 264% | | 59% |
|
| (a) | Per share amounts and ratios to average net assets include income and expenses of the Jefferies Asset Management Cayman Trust (wholly-owned subsidiary). |
| (b) | Prior to April 30, 2013 the ALPS | CoreCommodity Management CompleteCommoditiesSM Strategy Fund was known as the Jefferies Asset Management Commodity Strategy Allocation Fund. |
| (c) | Calculated using the average shares method. |
| (d) | Less than $0.005 and ($0.005) per share. |
| (e) | Total returns are for the period indicated and have not been annualized. Total returns would have been lower had certain expenses not been waived during the period. Returns shown do not reflect the deduction of taxes that a shareholder would pay on Fund distributions or the redemption of Fund shares. |
| (g) | Portfolio turnover rate for periods less than one full year have not been annualized. |
See Notes to Financial Statements.
| | |
| ALPS | Kotak India Growth Fund | | |
| Management Commentary | | April 30, 2013 (Unaudited) |
Performance
ALPS | Kotak India Growth Fund (the “Fund”) was launched on February 14, 2011. During the 12-month period ended 04/30/2013 (hereinafter referred to as “the period”), the Fund’s Class A Shares, INDAX, delivered a net return of 15.21% at Net Asset Value (Class A delivered a net return of 8.85% at MOP, Class C, INFCX, was 13.60% with CDSC, Class I, INDIX, was 15.76%). The Fund’s performance was above that of the 10.90% gained by the CNX 500 Index (“CNX 500”)1, without taking into account sales charges for Class A and C Shares.
During the period, the Indian equity markets rallied along with the global markets with the broader market index CNX 500 returning 9.10% in the period, CNX Nifty Index (“Nifty”) 2 returning 10.97% and Midcap Index (“CNX Midcap”)3 returning 2.78% (all in United States Dollar (“USD”) terms). The investment environment during this period was impacted by the following, with May 2012 and September 2012 marking the worst and best monthly change respectively (CNX 500 returned
-12.49% in May 2012 and 14.53% in September 2012).
| | » | Global equity markets rallied in the period with investor sentiment improving in Euro-area countries after the European Central Bank (ECB) established the European Stability Mechanism (ESM)4 and Outright Monetary Transaction (OMT)5 to eligible countries. In the US, improving macroeconomic data and the announcement of open ended stimulus to the tune of USD85 billion (“bn”)/month helped the US equities markets rally to a record high in April 2013, countering the uncertainty pertaining to fiscal cliff6 concerns at the end of 2012. In Japan, Bank of Japan (BoJ) also announced massive stimulus to reach 2% target inflation in 2 years. In India, the announcement of several key reforms activities, strong FII (Foreign Institutional Investor) flows to the tune of USD27bn during the period, several policy rate cuts, and falling inflation trend helped the performance of the Indian equity market and countered the weakness seen at the beginning of the period due to uncertainty on the GAAR7 (General Anti Avoidance Rule) issue. |
| | » | During the period, the Reserve Bank of India (RBI) cut its policy rate by cumulative 50 basis points (“bps”)8 through its January 2013 (25bps) and March 2013 (25bps) policy meetings, bringing repo9 and reverse repo rate10 to 7.5% and 6.5% respectively. In addition, RBI also cut CRR (Cash Reserve Ratio) to 4% in the period. The move was in-line with the consensus expectation. In the policy statement, the language of the statement remained hawkish and sounded cautious in the wake of high headline inflation and persistence of a high current account deficit. Despite that, we expect the RBI to cut rates by another 50bps this year, bringing the repo rate to 7%. |
| | » | For the quarter ending December 2012 (Q3FY13), real Gross Domestic Product (“GDP”) growth came in at 4.5%, lower than previous quarter number of 5.3% and Bloomberg consensus expectation of 4.8%. This is also the lowest quarterly growth rate in a decade in India. Services slowed down to 6.1% Year over Year (“YoY”) (v/s 7.2% in |
| | Q2FY13) and agriculture remained weak. On a positive note, industrial growth improved to 3.3% (v/s 2.7% in Q2FY13). The gross fixed capital formation (GFCF)11 grew at 4.2% YoY (v/s 4.1% in Q2FY13). It recovered to 6% Quarter over Quarter (“QoQ”) in Q3FY13 from a low -0.1% in Q2FY13. Government’s final consumption expenditure slowed to 1.9%, indicating a cut in planned expenditure to curb fiscal deficit. On the other hand, private final consumption expenditure recovered to 4.6% from a low of 2% in Q2FY13. The 9 month FY13 GDP growth has been at 5% (v/s 6.6% in 9 month FY12). The decline was across all the three major segments. |
| | » | After persistently staying at around 9% for most of 2011, the wholesale price inflation number (WPI)12 declined to average of 7% in 2012. The latest inflation data (March 2013) showed a further decline in the inflation number which stood at 5.96%, lowest in at least 4 years. All three broad components - primary articles, fuel and power, and manufactured product inflation - rose at slower pace than February’s. Core inflation also slowed further to 3.5%, lowest since February 2010, and within RBI comfort level of 4%. Food inflation also slowed significantly to 8.1%. |
| | » | The Finance Minister announced the Union Budget13 in at the end of February 2013, which seems to be progressive yet balanced. In the context of anticipated populism ahead of general elections in 2014, it has vowed a path of fiscal consolidation. The budget has assumed a nominal GDP growth of 13.5%. It has projected a fiscal deficit of 4.8% for FY14 and has estimated the current year fiscal deficit at 5.2%, much closer to its budget estimate of 5.1%. |
| | » | The government also announced several key reforms activities during the period. In May 2012, the Government finally hiked gas prices by Indian Rupee (“INR”) 7.5/liter or around 10% (highest ever) with a follow up on diesel price (INR5/liter hike or around 12%) in September 2012. Besides that, in September 2012, the government also announced a series of major reform activities, surprising the market on the upside. The government announced the opening of Foreign Direct Investment (FDI)14 in multi brand retailing (up to 51%), aviation (up to 49%), broadcasting (49% to 74%), and power-trading exchanges (up to 49%). In October 2012, reforms activities continue with the announcement of FDI in insurance companies (up to 49%) and pension funds (up to 26%). In December 2012, the Cabinet approved the Land Acquisition Bill15 and set up a Cabinet Committee on Investment (CCI)16, formally known as the National Investment Board (NIB), which will be chaired by the Prime Minister and will look at projects worth INR10bn or more. In January 2013, the government announced a decision authorizing OMCs (Oil marketing companies such as BPCL, HPCL and Indian Oil) to make small incremental increases in diesel prices periodically and fully deregulate diesel price for bulk customers. |
| | » | The period also saw changes in the Finance Ministry of the Government of India. Mr. P. Chidambaram came back as finance minister after replacing Mr. Pranab Mukherjee who left the post to become the 13th President of India in |
| | |
| ALPS | Kotak India Growth Fund | | |
| Management Commentary | | April 30, 2013 (Unaudited) |
| | July. This has raised expectations of the economic reforms process getting stepped up with some reforms that eventually materialized in September. |
| | » | On the political front, the Indian coalition Central Government’s stability was once again put to test when the largest coalition partner (Dravida Munnetra with 19 Madhya Pradesh’s) walked out of the coalition on the issue of India’s unclear stand on a United Nations (“UN”) resolution on Srilankan Tamils. We do not expect the government to lose majority to govern due to the external support it enjoys from two major regional parties (Samajwadi Party, Bahujan Samaj Party). Nevertheless, any bickering with these external parties in future could usher in an early election by couple of months. |
| | » | The Q4FY13 results have started coming in. The Information Technology sector results were a mixed lot but clearly indicative of the fact that there are topline growth concerns as well as margin compression issues. The Banking sector numbers are clearly in favor of private sector banks which have shown Net Interest Margin (“NIM”) expansion lead by robust fee income. The Oil & Gas sector results are reflective of falling refining margins but the valuations already seem to reflect that. It remains to be seen how the recent oil de-regulation affects the earnings of oil marketing companies. In the Automobile sector the four wheeler segment seems to be doing better than the two wheeler segment. In the midcap space, early trends in the chemicals & pesticide sectors seem positive. |
Portfolio Composition
The portfolio is constructed to potentially benefit from the strong macro-economic growth in the Indian economy across four broad themes in India – consumption lead by favourable demographics, financial services, infrastructure and outsourcing. The Fund has the flexibility to invest across market capitalizations – depending on market conditions, valuation differential, earnings growth, liquidity, etc.
For the 12-month period ending 30th April 2013, sectorally the key changes have been in Banking & Finance (added 320 bps), Auto & Auto Ancillary (added 220 bps), Fast Moving Consumer Goods (“FMCG”) (added 200 bps), Metal & Metal Products (reduced 150 bps), Media (reduced 150 bps), and Utilities (reduced 140 bps). Thematically, Consumption (at about 36%) and Financials (at about 28%) are the largest themes in the portfolio while infrastructure exposure is only around 10% due to poor policy initiatives by the government. Over the last 12 months, exposure to midcap and small-cap companies in the fund has moved from 26.25% in April 2012 to 25.69% in October 2012 and 22.38% in April 2013.
Sectorally, the portfolio is overweight Pharmaceutical, Infrastructure, and Real Estate while underweight Oil & Gas, FMCG, and Utilities as of 30th April 2013.
Outlook
The monetary policy announcement in the first week by the central bank is expected to result in higher volatility but also set the future direction for the market. Though we expect a 25 basis point cut in the policy rate, anything higher could be a positive surprise. The Q4 results of the midcap companies would keep trickling in during the next one month and may determine the respective stock price movement. Net FII flows would also have a bearing on the market. One of the key states (Karnataka) is going to polls in the first week. This election outcome may become a harbinger for electoral alliances ahead of the 2014 general elections and hence would be closely watched by the markets.
Post the Q4 results and the credit policy announcement, we expect money to flow out of the technology sector and get anchored to the interest rate sensitive sectors like Banking, Automobiles, and to a limited extent into infrastructure related sectors. The Unilever Plc. triggered partial buyback of its Indian subsidiary has raised expectation of investors for more Multinational Corporations (“MNC”) to follow suit. The rise in prices across the MNC pack and the consumer goods sector raises further concern on already rich valuations. Pharmaceuticals continue to demonstrate both domestic as well as global growth and hence may continue to offer potential upsides and yet remain defensive during times of volatility.
In the portfolios post the Q4 results we would undertake appropriate sector evaluation and re-calibrate our exposures to the Banking, Consumption, Offshoring and Infrastructure themes. We shall also on a bottom-up basis look for valuation differential and growth opportunities to populate the portfolios.
The CNX Nifty is trading at 15.53X FY13 & 13.53XFY14 Earnings Per Share (“EPS”), respectively. The CNX Midcap Index is trading at 13.48X FY13 & 10.92X FY14 EPS respectively. An improving macro-economic scenario could potentially see further participation by global players and liquidity could expand current Price-Earnings Ratio (“P/E”)17 multiples in the medium term. With the midcaps at current levels, trading at a discount of nearly 20% to the largecaps, it does provide an opportunity for investors to buy into a wider diaspora of growing sectors of the Indian economy.
| 1 | The CNX 500 is India’s first broad based benchmark of the Indian capital market. The CNX 500 companies are disaggregated into 72 industry indices. Industry weightages in the index reflect the industry weightages in the market. An investor may not invest directly in an index. | |
| 2 | CNX Nifty Index is a stock market index and benchmark index for the Indian equity market. It is a free float market capitalization weighted index. The index is not actively managed and does not reflect any deductions for fees, expenses or taxes. An investor may not invest directly in an index. | |
| 3 | The CNX Midcap Index is a free float capitalization-weighted index designed to represent the midcap segment of the market in India. The index was developed with a base value of 1000 as of January 1, 2003. This index replaces the old CNX Midcap 200 Index which was discontinued effective July 18, 2005. The index is not actively managed and does not reflect any deductions for fees, expenses or taxes. An investor may not invest directly in an index. | |
| | |
| ALPS | Kotak India Growth Fund | | |
| Management Commentary | | April 30, 2013 (Unaudited) |
| 4 | The European Stability Mechanism (ESM) is an international organisation located in Luxembourg which was established on 27 September 2012 as a permanent firewall for the eurozone to safeguard and provide instant access to financial assistance programs for member states of the eurozone in financial difficulty, with a maximum lending capacity of €500 billion. | |
| 5 | Outright Monetary Transactions (OMT) is a program of the European Central Bank under which the bank makes purchases (outright transactions) in secondary, sovereign bond markets, under certain conditions, of bonds issued by Eurozone member-states. | |
| 6 | Fiscal Cliff is a term used to describe the situation that the U.S. government will face at the end of 2012, when the terms of the Budget Control Act of 2011 are scheduled to go into effect. Fiscal cliff is an USD600bn automatic tax increase and spending cuts to reduce U.S. fiscal deficit that will take effect on 1st Jan 2013 should Congress not act. The U.S. Congressional Budget Office estimated that if no changes are made, there is a high probability that U.S. will fall into recession in 2013. | |
| 7 | Tax Avoidance is an area of concern across the world. The rules are framed in different countries to minimize such avoidance of tax. Such rules in simple terms are known as “General Anti Avoidance Rules” or GAAR. Thus GAAR is a set of general rules enacted so as to check the tax avoidance. | |
| 8 | Basis Points or bps is a unit that is equal to 1/100th of 1%, and is used to denote the change in a financial instrument. | |
| 9 | The rate at which the RBI lends money to commercial banks is called repo rate. | |
| 10 | The rate at which the RBI borrows money from commercial banks is called the Reverse Repo rate. | |
| 11 | Gross fixed capital formation (GFCF) is a macroeconomic concept used in official national accounts. Statistically it measures the value of acquisitions of new or existing fixed assets by the business sector, governments and “pure” households (excluding their unincorporated enterprises) less disposals of fixed assets. GFCF is a component of the expenditure on GDP, and thus shows something about how much of the new value added in the economy is invested rather than consumed. | |
| 12 | The Wholesale Price Index (WPI) is the price of a representative basket of wholesale goods. India uses WPI changes as a central measure of inflation. | |
| 13 | Union budget is the annual budget of the Republic of India, presented each year on the last working day of February by the Finance Minister of India in Parliament. | |
| 14 | Foreign direct investment is a direct investment into production or business in a country by a company in another country, either by buying a company in the target country or by expanding operations of an existing business in that country.
| |
| 15 | Land Acquisition, Rehabilitation and Resettlement Bill in India is a much awaited bill for Land acquisition reforms and rehabilitation for the development projects in India. The bill was introduced in Lok Sabha in India on 7 September 2011. The bill will be central legislation in India for the rehabilitation and resettlement of families affected by land acquisitions. | |
| 16 | Cabinet committee on investment was formed by Government of India cabinet ministers to deliberate on Investments in India. | |
| 17 | Price-earnings ratio is a valuation ratio of a company’s current share price compared to its per-share earnings. | |
The views and information discussed in this commentary are as of the date of publication, are subject to change, and may not reflect the writer’s current views. The views expressed represent an assessment of market conditions at a specific point in time, are opinions only and should not be relied upon as investment advice regarding a particular investment or markets in general. Such information does not constitute a recommendation to buy or sell specific securities or investment vehicles. It should not be assumed that any investment will be profitable or will equal the performance of the fund(s) or any securities or any sectors mentioned herein. The subject matter contained herein has been derived from several sources believed to be reliable and accurate at the time of compilation. Kotak Mahindra (UK) Limited does not accept any liability for losses either direct or consequential caused by the use of this information.
| | |
| ALPS | Kotak India Growth Fund | | |
| Performance Update | | April 30, 2013 (Unaudited) |
Performance of $10,000 Initial Investment (as of April 30, 2013)
Comparison of change in value of a $10,000 investment (includes maximum sales charges of 5.50%)
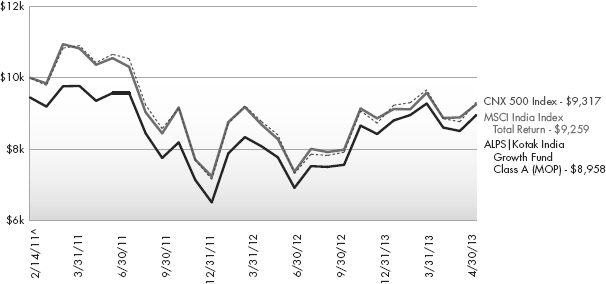
The chart above represents historical performance of a hypothetical investment of $10,000 in the Fund since inception. Past performance does not guarantee future results. This chart does not reflect the deduction of taxes that a shareholder would pay on Fund distributions or the redemption of Fund shares.
Average Annual Total Returns (as of April 30, 2013)
| | | | | | | | |
| | | 1 Year | | Since Inception ^ | | Total Expense Ratio | | What You Pay * |
Class A (NAV)1 | | 15.21% | | -2.41% | | 12.50% | | 2.00% |
Class A (MOP)2 | | 8.85% | | -4.87% | | |
Class C (NAV)1 | | 14.60% | | -3.02% | | 13.10% | | 2.60% |
Class C (CDSC)2 | | 13.60% | | -3.02% | | |
Class I | | 15.76% | | -2.03% | | 12.10% | | 1.60% |
CNX 500 Index3 | | 10.90% | | -3.15% | | | | |
MSCI India Index Total Return4 | | 11.77% | | -3.43% | | | | |
Performance data quoted represents past performance. Past performance does not guarantee future results. Investment return and principal value of an investment will fluctuate so that an investor’s shares, when sold or redeemed, may be worth more or less than the original cost. Current performance data may be higher or lower than actual data quoted. The Fund imposes a 2.00% redemption fee on shares held for less than 30 days. The Fund imposes a maximum Contingent Deferred Sales Charge (“CDSC”) of 1.00% to shares redeemed within the first 12 months after a purchase, and on Class A shares redeemed within the first 12 months after a purchase in excess of $1 million. Performance shown does not reflect the redemption fee or the CDSC, which if reflected would reduce the performance quoted. For the most current month-end performance data please call 1-866-759-5679.
Investing in the Fund is subject to investment risks, including possible loss of the principal amount invested. Derivatives generally are more sensitive to changes in economic or market conditions than other types of investments; this could result in losses that significantly exceed the funds original investment.
| 1 | Net Asset Value (NAV) is the share price without sales charges. |
| 2 | Maximum Offering Price (MOP) includes sales charges. Class A returns include effects of the Fund’s maximum sales charge of 5.50%; Class C returns include the 1.00% CDSC. |
| 3 | CNX 500 - India’s first broad based benchmark of the Indian capital market. The CNX 500 companies are disaggregated into 72 industry indices. Industry weightages in the market. The index is not actively managed and does not reflect any deduction for fees, expenses or taxes. An investor may not invest directly in an index. |
| | |
| ALPS | Kotak India Growth Fund | | |
| Performance Update | | April 30, 2013 (Unaudited) |
| 4 | MSCI India Index - a free float weighted equity index. It was developed with a base value of 100 as-of December 31, 1992. The index is not actively managed and does not reflect any deduction for fees, expenses or taxes. An investor may not invest directly in an index. |
| ^ | Fund inception date of February 14, 2011. |
| * | What You Pay reflects the Advisor’s and Sub-Advisor’s decision to contractually limit expenses through August 31, 2013. Please see the prospectus for additional information. |
The table does not reflect the deduction of taxes that a shareholder would pay on Fund distributions or the redemption of Fund shares.
This Fund is not suitable for all investors and is subject to investment risks, including possible loss of the principal amount invested.
There is no guarantee that the Fund will continue to hold any one particular security or stay invested in any one particular company. The composition of the Fund’s top holdings is subject to change. Performance figures are historical and reflect the change in share price, reinvested distributions, changes in net asset value, sales charges and capital gains distributions, if any.
Mutual funds are not insured or guaranteed by the FDIC or by any other government agency or government sponsored agency of the federal government or any state, not deposits, obligations or guaranteed by any bank or its affiliates and are subject to investment risks, including possible loss of the principal amount invested.
Investing in India involves risk and considerations not present when investing in more established securities markets. The Fund may be more susceptible to economic, market, political and local risks of the region than a fund that is more geographically diversified. Investments in India are subject to a number of risks including, but not limited to, risk of losing some or all of the capital invested, high market volatility, variable market liquidity, geopolitical risks (including political instability), exchange rate fluctuations (between the currency of the fund’s share class and the Indian Rupee), changes in tax regime and restrictions on investment activities of foreign investors.
Top Ten Long Holdings (as a % of Net Assets)†
| | | | |
ITC, Ltd. | | | 7.16% | |
ICICI Bank, Ltd. | | | 6.32% | |
HDFC Bank, Ltd. | | | 5.27% | |
Infosys, Ltd. | | | 4.15% | |
Larsen & Toubro, Ltd. | | | 3.53% | |
Reliance Industries, Ltd. | | | 3.52% | |
Housing Development Finance Corp. | | | 3.50% | |
State Bank of India | | | 3.18% | |
Tata Motors, Ltd. | | | 2.85% | |
Tata Consultancy Services, Ltd. | | | 2.59% | |
Top Ten Holdings | | | 42.07% | |
| † | Holdings are subject to change. Table presents indicative values only. |
Industry Sector Allocation
(as a % of Net Assets)
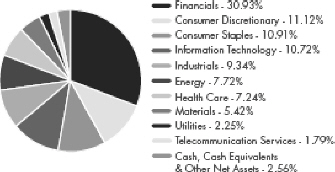
| | |
| ALPS | Kotak India Growth Fund | | |
| Consolidated Statement of Investments | | April 30, 2013 |
| | | | | | | | |
| | | Shares | | | Value
(Note 2) | |
| |
COMMON STOCKS (97.44%) | | | | | |
Consumer Discretionary (11.12%) | | | | | |
Auto Components (1.08%) | | | | | |
Motherson Sumi Systems, Ltd. | | | 23,000 | | | $ | 83,409 | |
| | | | | | | | |
| |
Automobiles (5.85%) | | | | | |
Bajaj Auto, Ltd. | | | 2,460 | | | | 85,980 | |
Mahindra & Mahindra, Ltd. | | | 8,560 | | | | 147,066 | |
Tata Motors, Ltd. | | | 40,025 | | | | 220,836 | |
| | | | | | | | |
| | | | | | | 453,882 | |
| | | | | | | | |
| |
Hotels Restaurants & Leisure (1.01%) | | | | | |
Mahindra Holidays & Resorts India, Ltd. | | | 16,260 | | | | 78,092 | |
| | | | | | | | |
| |
Media (1.12%) | | | | | |
Sun TV Network, Ltd. | | | 11,200 | | | | 86,872 | |
| | | | | | | | |
| |
Textiles, Apparel & Luxury Goods (2.06%) | | | | | |
Bata India, Ltd. | | | 6,480 | | | | 89,806 | |
Raymond, Ltd. | | | 13,035 | | | | 70,362 | |
| | | | | | | | |
| | | | | | | 160,168 | |
| | | | | | | | |
| |
TOTAL CONSUMER DISCRETIONARY | | | | 862,423 | |
| | | | | | | | |
| |
Consumer Staples (10.91%) | | | | | |
Food Products (1.26%) | | | | | |
Britannia Industries, Ltd. | | | 7,459 | | | | 80,384 | |
GlaxoSmithKline Consumer Healthcare, Ltd. | | | 232 | | | | 17,326 | |
| | | | | | | | |
| | | | | | | 97,710 | |
| | | | | | | | |
| |
Household Products (1.51%) | | | | | |
Hindustan Unilever, Ltd. | | | 10,805 | | | | 117,190 | |
| | | | | | | | |
| |
Personal Products (0.98%) | | | | | |
Emami, Ltd. | | | 6,400 | | | | 76,212 | |
| | | | | | | | |
| | |
Tobacco (7.16%) | | | | | | | | |
ITC, Ltd. | | | 90,812 | | | | 554,904 | |
| | | | | | | | |
| |
TOTAL CONSUMER STAPLES | | | | 846,016 | |
| | | | | | | | |
| | |
Energy (7.72%) | | | | | | | | |
Oil, Gas & Consumable
Fuels (7.72%) | | | | | |
Cairn India, Ltd. | | | 12,841 | | | | 74,511 | |
Hindustan Petroleum Corp., Ltd. | | | 12,550 | | | | 71,657 | |
Oil & Natural Gas Corp., Ltd. | | | 17,200 | | | | 104,495 | |
Oil India, Ltd. | | | 7,344 | | | | 75,046 | |
| | | | | | | | |
| | | Shares | | | Value (Note 2) | |
| |
Oil, Gas & Consumable Fuels (continued) | | | | | |
Reliance Industries, Ltd. | | | 18,618 | | | $ | 272,745 | |
| | | | | | | | |
| | | | | | | 598,454 | |
| | | | | | | | |
| |
TOTAL ENERGY | | | | 598,454 | |
| | | | | | | | |
| |
Financials (30.93%) | | | | | |
Commercial Banks (22.35%) | | | | | |
Axis Bank, Ltd. | | | 4,454 | | | | 123,656 | |
Federal Bank, Ltd. | | | 11,250 | | | | 95,382 | |
HDFC Bank, Ltd. | | | 32,201 | | | | 408,865 | |
ICICI Bank, Ltd. | | | 22,575 | | | | 490,233 | |
IndusInd Bank, Ltd. | | | 16,700 | | | | 145,074 | |
State Bank of India | | | 5,855 | | | | 246,524 | |
Union Bank of India | | | 29,700 | | | | 135,172 | |
Yes Bank, Ltd. | | | 9,475 | | | | 88,351 | |
| | | | | | | | |
| | | | | | | 1,733,257 | |
| | | | | | | | |
| |
Consumer Finance (1.89%) | | | | | |
Bajaj Finance, Ltd. | | | 3,280 | | | | 74,658 | |
Shriram Transport Finance Co., Ltd. | | | 5,200 | | | | 71,997 | |
| | | | | | | | |
| | | | | | | 146,655 | |
| | | | | | | | |
| |
Diversified Financial Services (1.10%) | | | | | |
Bajaj Holdings and Investment, Ltd. | | | 5,154 | | | | 85,225 | |
| | | | | | | | |
| |
Real Estate Management &
Development (2.09%) | | | | | |
DLF, Ltd. | | | 16,580 | | | | 73,580 | |
Prestige Estates Projects, Ltd. | | | 28,308 | | | | 88,139 | |
| | | | | | | | |
| | | | | | | 161,719 | |
| | | | | | | | |
| |
Thrifts & Mortgage
Finance (3.50%) | | | | | |
Housing Development Finance Corp. | | | 17,245 | | | | 271,650 | |
| | | | | | | | |
| |
TOTAL FINANCIALS | | | | 2,398,506 | |
| | | | | | | | |
| |
Health Care (7.24%) | | | | | |
Pharmaceuticals (7.24%) | | | | | |
Cipla, Ltd. | | | 16,548 | | | | 124,676 | |
Dr. Reddy’s Laboratories, Ltd. | | | 2,453 | | | | 92,530 | |
Glenmark Pharmaceuticals, Ltd. | | | 8,100 | | | | 73,295 | |
Lupin, Ltd. | | | 9,135 | | | | 119,307 | |
Sun Pharmaceutical Industries, Ltd. | | | 8,600 | | | | 151,910 | |
| | | | | | | | |
| | | | | | | 561,718 | |
| | | | | | | | |
| | |
TOTAL HEALTH CARE | | | | | | | 561,718 | |
| | | | | | | | |
| |
Industrials (9.34%) | | | | | |
Construction &
Engineering (4.43%) | | | | | |
GMR Infrastructure, Ltd.(a) | | | 183,750 | | | | 69,573 | |
| | |
| ALPS | Kotak India Growth Fund | | |
| Consolidated Statement of Investments | | April 30, 2013 |
| | | | | | | | |
| | | Shares | | | Value
(Note 2) | |
| |
Construction & Engineering (continued) | | | | | |
Larsen & Toubro, Ltd. | | | 9,735 | | | $ | 273,709 | |
| | | | | | | | |
| | | | | | | 343,282 | |
| | | | | | | | |
| |
Industrial
Conglomerates (1.08%) | | | | | |
Jaiprakash Associates, Ltd. | | | 59,600 | | | | 83,459 | |
| | | | | | | | |
| | |
Machinery (2.82%) | | | | | | | | |
SKF India, Ltd. | | | 10,760 | | | | 110,766 | |
Thermax, Ltd. | | | 10,113 | | | | 107,746 | |
| | | | | | | | |
| | | | | | | 218,512 | |
| | | | | | | | |
| |
Transportation
Infrastructure (1.01%) | | | | | |
IL&FS Transportation Networks, Ltd. | | | 24,087 | | | | 78,764 | |
| | | | | | | | |
| | |
TOTAL INDUSTRIALS | | | | | | | 724,017 | |
| | | | | | | | |
| |
Information Technology (10.72%) | | | | | |
Electronic Equipment, Instruments &
Components (1.24%) | | | | | |
Redington India, Ltd. | | | 65,460 | | | | 95,995 | |
| | | | | | | | |
| |
Internet Software &
Services (0.93%) | | | | | |
Info Edge India, Ltd. | | | 11,000 | | | | 72,003 | |
| | | | | | | | |
| |
IT Services (8.55%) | | | | | |
Hexaware Technologies, Ltd. | | | 45,000 | | | | 68,599 | |
Infosys, Ltd. | | | 7,768 | | | | 321,757 | |
Tata Consultancy Services, Ltd. | | | 7,850 | | | | 200,923 | |
Tech Mahindra, Ltd. | | | 4,025 | | | | 71,526 | |
| | | | | | | | |
| | | | | | | 662,805 | |
| | | | | | | | |
| |
TOTAL INFORMATION TECHNOLOGY | | | | 830,803 | |
| | | | | | | | |
| | |
Materials (5.42%) | | | | | | | | |
Chemicals (0.96%) | | | | | | | | |
Coromandel International, Ltd. | | | 20,446 | | | | 73,871 | |
| | | | | | | | |
| |
Construction
Materials (2.34%) | | | | | |
Century Textiles & Industries, Ltd. | | | 12,513 | | | | 66,950 | |
Shree Cement, Ltd. | | | 1,370 | | | | 114,647 | |
| | | | | | | | |
| | | | | | | 181,597 | |
| | | | | | | | |
| |
Metals & Mining (2.12%) | | | | | |
Hindalco Industries, Ltd. | | | 38,750 | | | | 70,230 | |
Hindustan Zinc, Ltd. | | | 42,549 | | | | 94,134 | |
| | | | | | | | |
| | | | | | | 164,364 | |
| | | | | | | | |
| | |
TOTAL MATERIALS | | | | | | | 419,832 | |
| | | | | | | | |
| | | | | | | | |
| | | Shares | | | Value
(Note 2) | |
| |
Telecommunication
Services (1.79%) | | | | | |
| |
Wireless Telecommunication Services (1.79%) | | | | | |
Bharti Airtel, Ltd. | | | 23,450 | | | $ | 139,068 | |
| | | | | | | | |
| |
TOTAL TELECOMMUNICATION SERVICES | | | | 139,068 | |
| | | | | | | | |
| | |
Utilities (2.25%) | | | | | | | | |
| |
Independent Power Producers & Energy Traders (2.25%) | | | | | |
NTPC, Ltd. | | | 27,000 | | | | 78,909 | |
PTC India, Ltd. | | | 85,948 | | | | 95,809 | |
| | | | | | | | |
| | | | | | | 174,718 | |
| | | | | | | | |
| | |
TOTAL UTILITIES | | | | | | | 174,718 | |
| | | | | | | | |
| | |
TOTAL COMMON STOCKS (Cost $7,057,749) | | | | | | | 7,555,555 | |
| | | | | | | | |
| | | | | | | | | | | | |
| | | 7-Day
Yield | | | Shares | | | Value (Note 2) | |
| |
SHORT TERM INVESTMENTS (0.16%) | | | | | |
Money Market Fund (0.16%) | | | | | |
Dreyfus Cash Advantage Fund, Institutional Class | | | 0.069 | % | | | 12,653 | | | | 12,653 | |
| | | | | | | | | | | | |
| |
TOTAL SHORT TERM INVESTMENTS (Cost $12,653) | | | | 12,653 | |
| | | | | | | | | | | | |
| |
TOTAL INVESTMENTS (97.60%) (Cost $7,070,402) | | | $ | 7,568,208 | |
| |
Other Assets In Excess Of Liabilities (2.40%) | | | | 186,004 | |
| | | | | | | | | | | | |
| |
NET ASSETS (100.00%) | | | $ | 7,754,212 | |
| | | | | | | | | | | | |
| (a) | Non-Income Producing Security. |
Common Abbreviations:
Ltd. - Limited.
For Fund compliance purposes, the Fund’s industry classifications refer to any one or more of the industry sub-classifications used by one or more widely recognized market indexes or ratings group indexes, and/or as defined by Fund management. This definition may not apply for purposes of this report, which may combine industry sub-classifications for reporting ease. Industries are shown as a percent of net assets.
See Notes to Financial Statements.
| | |
| ALPS | Kotak India Growth Fund | | |
| Consolidated Statement of Assets and Liabilities | | April 30, 2013 |
| | | | |
ASSETS | | | | |
Investments, at value | | $ | 7,568,208 | |
Cash | | | 47,744 | |
Foreign currency, at value (Cost $151,153) | | | 151,731 | |
Foreign currency held at broker for futures contracts (Cost $60,050) | | | 60,410 | |
Receivable for investments sold | | | 48,703 | |
Receivable for shares sold | | | 999 | |
Dividends receivable | | | 2,634 | |
Receivable due from advisor | | | 34,855 | |
Prepaid expenses and other assets | | | 22,119 | |
| |
Total Assets | | | 7,937,403 | |
| |
LIABILITIES | | | | |
Payable for investments purchased | | | 64,234 | |
Administration and transfer agency fees payable | | | 19,581 | |
Distribution and services fees payable | | | 7,367 | |
Trustees’ fees and expenses payable | | | 1,203 | |
Legal fees payable | | | 470 | |
Audit and tax fees payable | | | 39,580 | |
Accrued expenses and other liabilities | | | 50,756 | |
| |
Total Liabilities | | | 183,191 | |
| |
NET ASSETS | | $ | 7,754,212 | |
| |
NET ASSET CONSIST OF | | | | |
Paid-in capital | | $ | 7,695,620 | |
Accumulated net investment loss | | | (45,369) | |
Accumulated net realized loss on investments, futures contracts and foreign currency transactions | | | (394,905) | |
Net unrealized appreciation on investments and translation of assets and liabilities denominated in foreign currencies | | | 498,866 | |
| |
NET ASSETS | | $ | 7,754,212 | |
| |
INVESTMENTS, AT COST | | $ | 7,070,402 | |
| |
| |
PRICING OF SHARES | | | | |
Class A: | | | | |
Net Asset Value, offering and redemption price per share(a) | | $ | 9.47 | |
Net Assets | | $ | 4,681,119 | |
Shares of beneficial interest outstanding (unlimited number of shares, no par value common stock authorized) | | | 494,070 | |
Maximum offering price per share ((NAV/0.9450), based on maximum sales charge of 5.50% of the offering price) | | $ | 10.02 | |
Class C: | | | | |
Net Asset Value, offering and redemption price per share(a) | | $ | 9.34 | |
Net Assets | | $ | 923,698 | |
Shares of beneficial interest outstanding (unlimited number of shares, no par value common stock authorized) | | | 98,916 | |
Class I: | | | | |
Net Asset Value, offering and redemption price per share | | $ | 9.55 | |
Net Assets | | $ | 2,149,395 | |
Shares of beneficial interest outstanding (unlimited number of shares, no par value common stock authorized) | | | 225,185 | |
| (a) | Redemption price per share may be reduced for any applicable contingent deferred sales charge. For a description of a possible sales charge, please see the Fund’s Prospectus. |
See Notes to Financial Statements.
| | |
| ALPS | Kotak India Growth Fund | | |
| Consolidated Statement of Operations | | For the Year Ended April 30, 2013 |
| | | | |
INVESTMENT INCOME | | | | |
Dividends | | $ | 68,098 | |
| |
Total Investment Income | | | 68,098 | |
| |
EXPENSES | | | | |
Investment advisory fees | | | 72,202 | |
Administrative and transfer agency fees | | | 143,790 | |
Distribution and service fees | | | | |
Class A | | | 12,559 | |
Class C | | | 6,324 | |
Legal fees | | | 3,869 | |
Audit and tax fees | | | 43,421 | |
Reports to shareholders and printing fees | | | 1,965 | |
State registration fees | | | 39,873 | |
SEC registration fees | | | 462 | |
Insurance fees | | | 163 | |
Custody fees | | | 97,837 | |
Trustees’ fees and expenses | | | 6,278 | |
Miscellaneous expenses | | | 29,516 | |
| |
Total Expense | | | 458,259 | |
Less fees waived/reimbursed by investment advisor (Note 7) | | | | |
Class A | | | (188,194) | |
Class C | | | (37,562) | |
Class I | | | (121,202) | |
| |
Net Expenses | | | 111,301 | |
| |
Net Investment Loss | | | (43,203) | |
| |
Net realized gain on investments | | | 171,984 | |
Net realized gain on futures contracts | | | 5,567 | |
Net realized gain on foreign currency transactions | | | 4,096 | |
Net change in unrealized appreciation on investments | | | 623,065 | |
Net change in unrealized appreciation on translation of assets and liabilities denominated in foreign currencies | | | 4,124 | |
| |
NET REALIZED AND UNREALIZED GAIN ON INVESTMENTS | | | 808,836 | |
| |
NET INCREASE IN NET ASSETS RESULTING FROM OPERATIONS | | $ | 765,633 | |
| |
See Notes to Financial Statements.
| | |
| ALPS | Kotak India Growth Fund | | |
| Consolidated Statements of Changes in Net Assets |
| | | | | | | | |
| | | For the
Year Ended
April 30, 2013 | | | For the
Year Ended
April 30, 2012 | |
| |
OPERATIONS | | | | | | | | |
Net investment loss | | $ | (43,203) | | | $ | (28,880) | |
Net realized gain/(loss) on investments, futures contracts and foreign currency transactions | | | 181,647 | | | | (581,197) | |
Net change in unrealized appreciation/(depreciation) on investments, futures contracts and translation of assets and liabilities denominated in foreign currencies | | | 627,189 | | | | (159,023) | |
| |
Net Increase/(Decrease) in Net Assets Resulting from Operations | | | 765,633 | | | | (769,100) | |
| |
| | |
DISTRIBUTIONS | | | | | | | | |
Dividends to shareholders from net realized gains | | | | | | | | |
Class��A | | | – | | | | (1,040) | |
Class C | | | – | | | | (511) | |
Class I | | | – | | | | (1,048) | |
| |
Net Decrease in Net Assets from Distributions | | | – | | | | (2,599) | |
| |
| | |
BENEFICIAL INTEREST TRANSACTIONS (NOTE 6) | | | | | | | | |
Shares sold | | | | | | | | |
Class A | | | 3,239,533 | | | | 2,225,793 | |
Class C | | | 532,616 | | | | 604,159 | |
Class I | | | 744,593 | | | | 1,530,305 | |
Dividends reinvested | | | | | | | | |
Class A | | | – | | | | 923 | |
Class C | | | – | | | | 505 | |
Class I | | | – | | | | 964 | |
Shares redeemed | | | | | | | | |
Class A | | | (1,327,483) | | | | (455,302) | |
Class C | | | (118,894) | | | | (439,459) | |
Class I | | | (530,127) | | | | (216,102) | |
| |
Net Increase in Net Assets Derived from Beneficial Interest Transactions | | | 2,540,238 | | | | 3,251,786 | |
| |
| | |
Net increase in net assets | | | 3,305,871 | | | | 2,480,087 | |
| | |
NET ASSETS | | | | | | | | |
Beginning of year | | | 4,448,341 | | | | 1,968,254 | |
| |
End of year * | | $ | 7,754,212 | | | $ | 4,448,341 | |
| |
*Including accumulated net investment loss of: | | $ | (45,369) | | | $ | (34,534) | |
See Notes to Financial Statements.
| | |
| ALPS | Kotak India Growth Fund – Class A |
Consolidated Financial Highlights Selected data for a share of beneficial interest outstanding throughout the periods indicated: |
| | | | | | |
| | | For the Year Ended
April 30, 2013(a) | | For the Year Ended
April 30, 2012(a) | | For the Period
February 14, 2011
(Inception) to
April 30, 2011(a) |
|
Net asset value, beginning of period | | $8.22 | | $10.35 | | $10.00 |
| | | |
INCOME/(LOSS) FROM INVESTMENT OPERATIONS: | | | | | | |
Net investment loss(b) | | (0.07) | | (0.08) | | (0.04) |
Net realized and unrealized gain/(loss) | | 1.32 | | (2.04) | | 0.39 |
|
Total from investment operations | | 1.25 | | (2.12) | | 0.35 |
|
| | | |
DISTRIBUTIONS: | | | | | | |
From net realized gains | | – | | (0.01) | | – |
|
Total distributions | | – | | (0.01) | | – |
|
| | | |
REDEMPTION FEES ADDED TO PAID-IN CAPITAL (NOTE 6) | | 0.00(c) | | 0.00(c) | | 0.00(c) |
|
Net increase/(decrease) in net asset value | | 1.25 | | (2.13) | | 0.35 |
|
Net asset value, end of year | | $9.47 | | $8.22 | | $10.35 |
|
TOTAL RETURN(d) | | 15.21% | | (20.44)% | | 3.40% |
| | | |
RATIOS/SUPPLEMENTAL DATA: | | | | | | |
Net assets, end of year (000s) | | $4,681 | | $2,404 | | $935 |
Ratio of expenses to average net assets excluding fee waivers and reimbursements | | 7.99% | | 12.42% | | 69.96%(e) |
Ratio of expenses to average net assets including fee waivers and reimbursements | | 2.00% | | 2.00% | | 2.00%(e) |
Ratio of net investment loss to average net assets | | (0.82)% | | (0.89)% | | (1.82)%(e) |
Portfolio turnover rate(f) | | 93% | | 114% | | 9% |
|
| (a) | Per share amounts and ratios to average net assets include income and expenses of the Kotak Mauritius Portfolio (wholly-owned subsidiary). |
| (b) | Calculated using the average shares method. |
| (c) | Less than $0.005 per share. |
| (d) | Total returns are for the period indicated and have not been annualized. Total returns would have been lower had certain expenses not been waived during the period. Returns shown do not reflect the deduction of taxes that a shareholder would pay on Fund distributions or the redemption of Fund shares. Returns shown exclude any applicable sales charges. |
| (f) | Portfolio turnover rate for periods less than one full year have not been annualized. |
See Notes to Financial Statements.
| | |
| ALPS | Kotak India Growth Fund – Class C |
Consolidated Financial Highlights Selected data for a share of beneficial interest outstanding throughout the periods indicated: |
| | | | | | |
| | | For the Year Ended
April 30, 2013(a) | | For the Year Ended
April 30, 2012(a) | | For the Period
February 14, 2011
(Inception) to
April 30, 2011(a) |
|
Net asset value, beginning of period | | $8.15 | | $10.32 | | $10.00 |
| | | |
INCOME/(LOSS) FROM INVESTMENT OPERATIONS: | | | | | | |
Net investment loss(b) | | (0.12) | | (0.13) | | (0.05) |
Net realized and unrealized gain/(loss) | | 1.31 | | (2.03) | | 0.37 |
|
Total from investment operations | | 1.19 | | (2.16) | | 0.32 |
|
| | | |
DISTRIBUTIONS: | | | | | | |
From net realized gains | | – | | (0.01) | | – |
|
Total distributions | | – | | (0.01) | | – |
|
| | | |
REDEMPTION FEES ADDED TO PAID-IN CAPITAL (NOTE 6) | | – | | 0.00(c) | | – |
|
Net increase/(decrease) in net asset value | | 1.19 | | (2.17) | | 0.32 |
|
Net asset value, end of year | | $9.34 | | $8.15 | | $10.32 |
|
TOTAL RETURN(d) | | 14.60% | | (20.97)% | | 3.20% |
| | |
RATIOS/SUPPLEMENTAL DATA: | | | | |
Net assets, end of year (000s) | | $924 | | $435 | | $466 |
Ratio of expenses to average net assets excluding fee waivers and reimbursements | | 8.54% | | 13.39% | | 69.64%(e) |
Ratio of expenses to average net assets including fee waivers and reimbursements | | 2.60% | | 2.60% | | 2.60%(e) |
Ratio of net investment loss to average net assets | | (1.42)% | | (1.49)% | | (2.42)%(e) |
Portfolio turnover rate(f) | | 93% | | 114% | | 9% |
|
| (a) | Per share amounts and ratios to average net assets include income and expenses of the Kotak Mauritius Portfolio (wholly-owned subsidiary). |
| (b) | Calculated using the average shares method. |
| (c) | Less than $0.005 per share. |
| (d) | Total returns are for the period indicated and have not been annualized. Total returns would have been lower had certain expenses not been waived during the period. Returns shown do not reflect the deduction of taxes that a shareholder would pay on Fund distributions or the redemption of Fund shares. Returns shown exclude any applicable sales charges. |
| (f) | Portfolio turnover rate for periods less than one full year have not been annualized. |
See Notes to Financial Statements.
| | |
| ALPS | Kotak India Growth Fund – Class I |
Consolidated Financial Highlights Selected data for a share of beneficial interest outstanding throughout the periods indicated: |
| | | | | | |
| | | For the Year Ended
April 30, 2013(a) | | For the Year Ended
April 30, 2012(a) | | For the Period February 14, 2011
(Inception) to
April 30, 2011(a) |
|
Net asset value, beginning of period | | $8.25 | | $10.34 | | $10.00 |
| | | |
INCOME/(LOSS) FROM INVESTMENT OPERATIONS: | | | | | | |
Net investment loss(b) | | (0.04) | | (0.04) | | (0.03) |
Net realized and unrealized gain/(loss) | | 1.34 | | (2.04) | | 0.37 |
|
Total from investment operations | | 1.30 | | (2.08) | | 0.34 |
|
| | | |
DISTRIBUTIONS: | | | | | | |
From net realized gains | | – | | (0.01) | | – |
|
Total distributions | | – | | (0.01) | | – |
|
| | | |
REDEMPTION FEES ADDED TO PAID-IN CAPITAL (NOTE 6) | | 0.00(c) | | 0.00(c) | | – |
|
Net increase/(decrease) in net asset value | | 1.30 | | (2.09) | | 0.34 |
|
Net asset value, end of year | | $9.55 | | $8.25 | | $10.34 |
|
TOTAL RETURN(d) | | 15.76% | | (20.23)% | | 3.50% |
| | |
RATIOS/SUPPLEMENTAL DATA: | | | | |
Net assets, end of year (000s) | | $2,149 | | $1,609 | | $568 |
Ratio of expenses to average net assets excluding fee waivers and reimbursements | | 7.65% | | 12.05% | | 96.67%(e) |
Ratio of expenses to average net assets including fee waivers and reimbursements | | 1.60% | | 1.60% | | 1.60%(e) |
Ratio of net investment loss to average net assets | | (0.42)% | | (0.49)% | | (1.36)%(e) |
Portfolio turnover rate(f) | | 93% | | 114% | | 9% |
|
| (a) | Per share amounts and ratios to average net assets include income and expenses of the Kotak Mauritius Portfolio (wholly-owned subsidiary). |
| (b) | Calculated using the average shares method. |
| (c) | Less than $0.005 per share. |
| (d) | Total returns are for the period indicated and have not been annualized. Total returns would have been lower had certain expenses not been waived during the period. Returns shown do not reflect the deduction of taxes that a shareholder would pay on Fund distributions or the redemption of Fund shares. |
| (f) | Portfolio turnover rate for periods less than one full year have not been annualized. |
See Notes to Financial Statements.
| | |
| ALPS | Red Rocks Listed Private Equity Fund |
| Management Commentary | | April 30, 2013 (Unaudited) |
Overview
Last year we said that “stability on a global macro basis will do more to prove out the value of the private equity asset class and potentially create organic growth opportunities than most anything else that we can see.” That appears to have been an accurate observation. Now that the year is behind us, it’s clear that values in the private equity asset class benefited from a stable environment; even more so for Listed Private Equity.
So why has this happened? It wasn’t due to the fiscal situation getting fixed in the US; although there may be glimmers as I write this annual update - Washington DC may actually pass a budget for the first time in several years. It wasn’t due to the European Union (EU) solving their ongoing issues because several countries continue to struggle with banking/credit worthiness (Spain, Greece, Cyprus to name a few), taxation/business friendliness (France) plus a general lack of GDP growth (we believe with the exception of Germany, there is next to none). No, private equity values, and hence current returns, are moving upward for other reasons.
Some of the reasons are:
| | • | | Deal activity is picking up, and the (M&A) market is open for business. I likened this to the much-needed grease that allows the financial gears of private equity to keep operating. |
| | • | | Exits are occurring at uplifts (higher prices) to most recent valuations. |
| | • | | Acquisitions are occurring - and at reasonable valuations. Private equity firms are putting capital to work. Mind you, not at a blistering pace - at a moderate pace; and at valuations that generally look rational. Investors like moderation and rationale. |
| | • | | The credit markets are open for business. Credit from almost all sources, with the exception of a certain number of banks, is available on reasonable terms and pricing. Private equity likes this. |
| | • | | And last, but certainly not least, investors are beginning to shift significant sums of their capital from the debt focused asset class to equity; private equity included. |
Listed Private Equity (LPE) has benefited from all of the aforementioned. In addition, what has continued to enhance the return to LPE investors has been the steady contraction of discounts to their stated Net Asset Value (NAV): discounts that were once broad (most every LPE vehicle traded at a discount a year ago) and deep (most were trading at 25% -40% discounts), have contracted substantially over the past several quarters. We’re now seeing some LPE vehicles trading at single digit percentage discounts. Some are even trading at close to NAV. That’s a far cry from where we were just 15 months ago.
In summary, the last year has been a good one.
Portfolio Review
For the year ended April 30, 2013, the Fund’s Class A shares, LPEFX, returned 31.75%, (Class A delivered a net return of 24.55% at MOP), compared with 16.70% and 35.67% for the MSCI World Index and the S&P® Listed Private Equity Index, respectively.
During the year, we exited four securities, including 3I Group PLC, Brookfield Infrastructure Partners LP, Fosun International and GIMV N.V. We added seven securities, including Aker ASA, American Capital Ltd, Carlyle Group, Hosken Consolidated Investments Ltd, Investor AB, NB Private Equity Partners and Oaktree Capital Group to the Fund.
While this may be an obvious restatement, diversification continues to be the cornerstone of how we manage exposure and risk in the Fund. The Fund held approximately 40 holdings in what we believe are some of the top performing private equity firms/funds around the globe. Or put another way - the Fund offers investors fully diversified private equity exposure. We think that’s a good thing.
Net contributors to performance for the year included:
| | • | | Apollo Global Management LLC |
| | • | | AP Alternative Assets LP |
Net detractors to performance for the year included:
| | • | | Leucadia National Corporation |
Outlook
The outlook for private equity continues to be positive, assuming all the usual caveats; war in the Middle East, Korea, et al doesn’t break out, the EU and/or Euro doesn’t unravel, the US Treasury/Federal Reserve continues to have easy access to the credit markets as they add to their balance sheet. Private equity has adapted quite well to the current state of affairs around the globe. No easy feat. However, this is something they’re good at over the long run. Certainty is a good thing. Uncertainty, not so much. Let’s hope we see more of the former and less of the latter.
As always, we appreciate your continued support and interest in Red Rocks and the Listed Private Equity strategy.
Adam Goldman
Co-Portfolio Manager
The views and information discussed in this commentary are as of the date of publication, are subject to change, and may not reflect the writer’s current views. The views expressed represent an assessment of market conditions at a specific point in time, are opinions only and should not be relied upon as investment advice regarding a particular investment or markets in general. Such information does not constitute a recommendation to buy or sell specific securities or investment vehicles. It should not be assumed that any investment will be profitable or will equal the performance of the fund(s) or any securities or any sectors mentioned herein. The subject matter contained herein has been derived from several sources believed to be reliable and accurate at the time of compilation. Red Rocks Capital LLC does not accept any liability for losses either direct or consequential caused by the use of this information.
Diversification cannot guarantee gain or prevent losses.
| | |
| ALPS | Red Rocks Listed Private Equity Fund |
| Performance Update | | April 30, 2013 (Unaudited) |
Performance of $10,000 Initial Investment (as of April 30, 2013)
Comparison of change in value of a $10,000 investment (includes maximum sales charges of 5.50%)
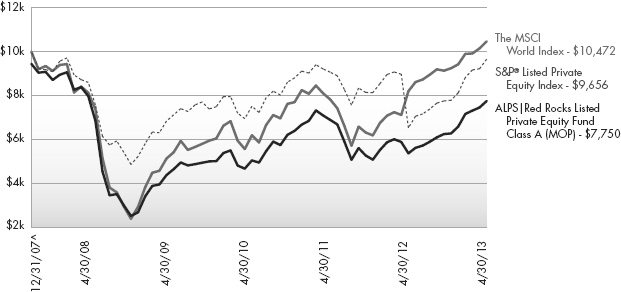
The chart above represents historical performance of a hypothetical investment of $10,000 in the Fund since inception. Past performance does not guarantee future results. This chart does not reflect the deduction of taxes that a shareholder would pay on Fund distributions or the redemption of Fund shares.
Average Annual Total Returns (as of April 30, 2013)
| | | | | | | | | | | | |
| | | 1 Year | | 3 Year | | 5 Year | | Since Inception ^ | | Total Expense
Ratio | | What You Pay * |
Class A (NAV)1 | | 31.75% | | 12.13% | | -2.84% | | -3.65% | | 3.34% | | 3.28% |
Class A (MOP)2 | | 24.55% | | 10.04% | | -3.93% | | -4.67% | | |
Class C (NAV)1 | | 30.55% | | 11.06% | | -3.69% | | -4.49% | | 4.00% | | 3.88% |
Class C (CDSC)2 | | 29.55% | | 11.06% | | -3.69% | | -4.49% | | |
Class I (NAV)1 | | 31.99% | | 12.34% | | -2.57% | | -3.40% | | 3.04% | | 2.88% |
Class R | | 32.05% | | 11.89% | | -3.16% | | -3.97% | | 3.52% | | 3.38% |
S&P® LPE Total Return Index3 | | 35.67% | | 12.23% | | 0.54% | | -0.65% | | | | |
MSCI World Index4 | | 16.70% | | 9.59% | | 1.81% | | 0.87% | | | | |
Performance data quoted represents past performance. Past performance does not guarantee future results. Investment return and principal value of an investment will fluctuate so that an investor’s shares, when sold or redeemed, may be worth more or less than the original cost. Current performance data may be higher or lower than actual data quoted. The Fund imposes a 2.00% redemption fee on shares held for less than 90 days. The Fund imposes a maximum Contingent Deferred Sales Charge (“CDSC”) of 1.00% on Class C shares redeemed within the first 12 months after a purchase, and on Class A shares redeemed within the first 12 months after a purchase in excess of $1 million. Performance data does not reflect the redemption fee or the CDSC, which if reflected would reduce the performance quoted. For the most current month-end performance data, please call 1-866-759-5679.
Performance shown for Class C shares prior to June 30, 2010 reflects the historical performance of the Fund’s Class A shares, calculated using the fees and expenses of Class C shares.
| 1 | Net Asset Value (NAV) is the share price without sales charges. The performance data shown does not reflect the decution of the sales charge or the redemption fee or CDSC, and that, if reflected, the charge or fee would reduce the performance quoted. |
| 2 | Maximum Offering Price (MOP) for Class A shares includes the Fund’s maximum sales charge of 5.50%. CDSC performance for Class C shares includes a 1% contingent deferred sales charge (CDSC) on C shares redeemed within 12 months of purchase. Performance shown at NAV does not include these sales charges and would have been lower had it been taken into account. |
44 | April 30, 2013
| | |
| ALPS | Red Rocks Listed Private Equity Fund | | |
| Performance Update | | April 30, 2013 (Unaudited) |
| 3 | S&P® Listed Private Equity Index: The S&P® Listed Private Equity Index is comprised of 30 leading listed private equity companies that meet size, liquidity, exposure, and activity requirements. The index is designed to provide tradable exposure to the leading publicly listed companies in the private equity space. The index is not actively managed and does not reflect any deduction for fees, expenses or taxes. An investor may not invest directly in an index. |
| 4 | MSCI World Index: Morgan Stanley Capital International’s market capitalization weighted index is composed of companies representative of the market structure of 22 developed market countries in North America, Europe and the Asia/Pacific Region. The index is not actively managed and does not reflect any deduction for fees, expenses or taxes. An investor may not invest directly in an index. |
| ^ | Fund inception date of December 31, 2007. |
| * | What You Pay reflects the Advisor’s and Sub-Advisor’s decision to contractually limit expenses through August 31, 2013. Please see the prospectus for additional information. |
The table does not reflect the deduction of taxes that a shareholder would pay on Fund distributions or the redemption of Fund shares.
Listed Private Equity Companies are subject to various risks depending on their underlying investments, which could include, but are not limited to, additional liquidity risk, industry risk, non-U.S. security risk, currency risk, credit risk, managed portfolio risk and derivatives risk (derivatives risk is the risk that the value of the Listed Private Equity Companies’ derivative investments will fall because of pricing difficulties or lack of correlation with the underlying investment).
There are inherent risks in investing in private equity companies, which encompass financial institutions or vehicles whose principal business is to invest in and lend capital to privately held companies. Generally, little public information exists for private and thinly traded companies, and there is a risk that investors may not be able to make a fully informed investment decision.
Listed Private Equity Companies may have relatively concentrated investment portfolios, consisting of a relatively small number of holdings. A consequence of this limited number of investments is that the aggregate returns realized may be adversely impacted by the poor performance of a small number of investments, or even a single investment, particularly if a company experiences the need to write down the value of an investment.
Certain of the Fund’s investments may be exposed to liquidity risk due to low trading volume, lack of a market maker or legal restrictions limiting the ability of the Fund to sell particular securities at an advantageous price and/or time. As a result, these securities may be more difficult to value. Foreign investing involves special risks, such as currency fluctuations and political uncertainty. The Fund invests in derivatives and is subject to the risk that the value of those derivative investments will fall because of pricing difficulties or lack of correlation with the underlying investment.
There is no guarantee that the Fund will continue to hold any one particular security or stay invested in any one particular company. The composition of the Fund’s top holdings is subject to change. Performance figures are historical and reflect the change in share price, reinvested distributions, changes in net asset value, sales charges and capital gains distributions, if any.
Mutual funds are not insured or guaranteed by the FDIC or by any other government agency or government sponsored agency of the federal government or any state, not deposits, obligations or guaranteed by any bank or its affiliates and are subject to investment risks, including possible loss of the principal amount invested.
Top Ten Holdings (as a % of Net Assets) †
| | |
Electra Private Equity PLC | | 5.28% |
KKR & Co. LP | | 5.19% |
SVG Capital PLC | | 4.88% |
Blackstone Group LP | | 4.88% |
Apollo Global Management LLC, Class A | | 4.66% |
Onex Corp. | | 4.39% |
AP Alternative Assets LP | | 4.31% |
American Capital, Ltd. | | 3.96% |
Eurazeo | | 3.89% |
Brookfield Asset Management, Inc., Class A | | 3.70% |
Top Ten Holdings | | 45.14% |
| † | Holdings are subject to change. Table presents indicative values only. |
Industry Sector Allocation (as a % of Net Assets)
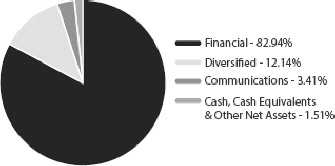
| | |
| ALPS | Red Rocks Listed Private Equity Fund |
| Statement of Investments | | April 30, 2013 |
| | | | | | | | |
| | | Shares | | | Value (Note 2) | |
| |
COMMON STOCKS (98.49%) | | | | | |
Communications (3.41%) | | | | | |
Internet (3.41%) | | | | | | | | |
ICG Group, Inc.(a) | | | 363,900 | | | $ | 4,319,493 | |
Safeguard Scientifics,
Inc.(a) | | | 256,000 | | | | 4,131,840 | |
| | | | | | | | |
| | | | | | | 8,451,333 | |
| | | | | | | | |
| |
TOTAL COMMUNICATIONS | | | | 8,451,333 | |
| | | | | | | | |
| |
Diversified (12.14%) | | | | | |
| |
Holding Companies-Diversified
Operations (12.14%) | | | | | |
Ackermans & van Haaren N.V. | | | 42,900 | | | | 3,651,413 | |
Aker ASA, Class A | | | 152,100 | | | | 4,695,014 | |
Leucadia National Corp. | | | 73,968 | | | | 2,284,872 | |
Remgro, Ltd. | | | 185,000 | | | | 3,730,924 | |
Schouw & Co. | | | 250,083 | | | | 8,282,942 | |
Wendel Investissement | | | 68,856 | | | | 7,459,332 | |
| | | | | | | | |
| | | | | | | 30,104,497 | |
| | | | | | | | |
| |
TOTAL DIVERSIFIED | | | | 30,104,497 | |
| | | | | | | | |
| |
Financial (82.94%) | | | | | |
| |
Closed-End Funds (35.09%) | | | | | |
AP Alternative Assets LP(a) | | | 512,469 | | | | 10,684,978 | |
Candover Investments PLC(a) | | | 212,000 | | | | 1,251,378 | |
Castle Private Equity, Ltd.(a) | | | 276,000 | | | | 4,259,626 | |
Conversus Capital LP | | | 465,370 | | | | 451,409 | |
Electra Private Equity PLC(a) | | | 379,059 | | | | 13,101,050 | |
Graphite Enterprise Trust PLC | | | 842,341 | | | | 6,437,575 | |
HarbourVest Global Private | | | | | | | | |
Equity, Ltd.(a) | | | 943,200 | | | | 8,724,600 | |
HBM Healthcare Investments AG, Class A(a) | | | 65,500 | | | | 3,522,263 | |
HgCapital Trust PLC | | | 398,385 | | | | 7,116,559 | |
NB Private Equity Partners, Ltd. | | | 290,421 | | | | 2,555,705 | |
Pantheon International Participations PLC, Ordinary Shares(a) | | | 311,516 | | | | 5,017,974 | |
Pantheon International Participations PLC, Redeemable Shares(a) | | | 143,200 | | | | 2,291,129 | |
Princess Private Equity Holding, Ltd. | | | 696,941 | | | | 6,195,398 | |
Standard Life European Private Equity Trust PLC, Ordinary Shares | | | 1,150,275 | | | | 3,287,674 | |
SVG Capital
PLC(a) | | | 1,957,815 | | | | 12,106,904 | |
| | | | | | | | |
| | | | | | | 87,004,222 | |
| | | | | | | | |
| |
Diversified Financial Services (16.53%) | | | | | |
Blackstone Group LP | | | 588,300 | | | | 12,089,565 | |
Intermediate Capital Group PLC | | | 785,000 | | | | 5,150,660 | |
KKR & Co. LP | | | 613,047 | | | | 12,873,987 | |
| | | | | | | | |
| | | Shares | | | Value (Note 2) | |
| |
Diversified Financial Services (continued) | | | | | |
Onex Corp. | | | 218,150 | | | $ | 10,880,974 | |
| | | | | | | | |
| | | | | | | 40,995,186 | |
| | | | | | | | |
| |
Investment
Companies (5.20%) | | | | | |
Hosken Consolidated Investments, Ltd. | | | 273,000 | | | | 3,434,747 | |
Investor AB, B Shares | | | 177,000 | | | | 5,216,284 | |
Oaktree Capital Group LLC | | | 81,600 | | | | 4,236,672 | |
| | | | | | | | |
| | | | | | | 12,887,703 | |
| | | | | | | | |
| |
Private Equity (22.42%) | | | | | |
Altamir Amboise(a) | | | 560,000 | | | | 6,585,806 | |
American Capital,
Ltd.(a) | | | 649,500 | | | | 9,826,935 | |
Apollo Global Management LLC, Class A | | | 429,450 | | | | 11,560,794 | |
Aurelius AG | | | 95,387 | | | | 7,411,577 | |
Bure Equity AB | | | 102,718 | | | | 359,772 | |
The Carlyle Group LP | | | 141,289 | | | | 4,589,067 | |
Deutsche Beteiligungs AG | | | 25,207 | | | | 611,975 | |
Eurazeo | | | 182,300 | | | | 9,656,020 | |
IP Group PLC(a) | | | 1,130,116 | | | | 2,720,972 | |
Ratos AB, B Shares | | | 237,000 | | | | 2,272,710 | |
| | | | | | | | |
| | | | | | | 55,595,628 | |
| | | | | | | | |
| |
Real Estate (3.70%) | | | | | |
Brookfield Asset Management, Inc., Class A | | | 237,500 | | | | 9,165,125 | |
| | | | | | | | |
| | |
TOTAL FINANCIAL | | | | | | | 205,647,864 | |
| | | | | | | | |
| | |
TOTAL COMMON STOCKS (Cost $187,409,855) | | | | | | | 244,203,694 | |
| | | | | | | | |
| | | | | | |
| | | |
| | | 7-Day Yield | | Shares | | Value (Note 2) |
|
SHORT TERM INVESTMENTS (1.00%) | | | | |
Money Market Fund (1.00%) | | | | | | |
Dreyfus Treasury Prime Cash Manage-
ment Fund, Investor Shares | | 0.00004% | | 2,485,362 | | 2,485,362 |
| | | | | | |
| | |
TOTAL SHORT TERM INVESTMENTS (Cost $2,485,362) | | | | 2,485,362 |
| | | | | | |
| | |
| ALPS | Red Rocks Listed Private Equity Fund | | |
| Statement of Investments | | April 30, 2013 |
| | | | |
| | | Value (Note 2) | |
| |
TOTAL INVESTMENTS (99.49%) (Cost $189,895,217) | | $ | 246,689,056 | |
| |
Other Assets In Excess Of Liabilities (0.51%) | | | 1,263,702 | |
| | | | |
| |
NET ASSETS (100.00%) | | $ | 247,952,758 | |
| | | | |
| (a) | Non-Income Producing Security. |
Common Abbreviations:
|
AB - Aktiebolag is the Swedish equivalent of the term corporation. |
AG - Aktiengesellschaft is a German term that refers to a corporation that is limited by shares, i.e., owned by shareholders. |
ASA - Allmenn Aksjeselskap is a Swedish term for “joint stock company”. |
LLC - Limited Liability Company. LP - Limited Partnership. Ltd. - Limited. |
N.V. - Naamloze Vennootschap is the Dutch term for a public limited liability corporation. |
PLC - Public Limited Company. |
For Fund compliance purposes, the Fund’s industry classifications refer to any one or more of the industry sub-classifications used by one or more widely recognized market indexes or ratings group indexes, and/or as defined by Fund management. This definition may not apply for purposes of this report, which may combine industry subclassifications for reporting ease. Industries are shown as a percent of net assets.
See Notes to Financial Statements.
| | |
| ALPS | Red Rocks Listed Private Equity Fund | | |
| Statement of Assets and Liabilities | | April 30, 2013 |
| | | | |
ASSETS | | | | |
Investments, at value | | $ | 246,689,056 | |
Cash | | | 79,823 | |
Foreign currency, at value (Cost $1,130,976) | | | 1,140,694 | |
Receivable for investments sold | | | 925,349 | |
Receivable for shares sold | | | 293,069 | |
Dividends and interest receivable | | | 721,499 | |
Prepaid expenses and other assets | | | 26,433 | |
| |
Total Assets | | | 249,875,923 | |
| |
LIABILITIES | | | | |
Payable for investments purchased | | | 1,459,531 | |
Payable for shares redeemed | | | 87,603 | |
Investment advisory fees payable | | | 155,766 | |
Administration and transfer agency fees payable | | | 44,984 | |
Distribution and services fees payable | | | 54,196 | |
Trustees’ fees and expenses payable | | | 2,988 | |
Legal fees payable | | | 627 | |
Audit and tax fees payable | | | 24,703 | |
Custody fees payable | | | 40,276 | |
Accrued expenses and other liabilities | | | 52,491 | |
| |
Total Liabilities | | | 1,923,165 | |
| |
NET ASSETS | | $ | 247,952,758 | |
| |
| |
NET ASSETS CONSIST OF | | | | |
Paid-in capital | | $ | 221,366,945 | |
Accumulated net investment loss | | | (8,376,470) | |
Accumulated net realized loss on investments and foreign currency transactions | | | (21,840,941) | |
Net unrealized appreciation on investments and translation of assets and liabilities denominated in foreign currencies | | | 56,803,224 | |
| |
NET ASSETS | | $ | 247,952,758 | |
| |
| |
INVESTMENTS, AT COST | | $ | 189,895,217 | |
| |
| |
PRICING OF SHARES | | | | |
Class A: | | | | |
Net Asset Value, offering and redemption price per share(a) | | $ | 6.05 | |
Net Assets | | $ | 105,488,427 | |
Shares of beneficial interest outstanding (unlimited number of shares, no par value common stock authorized) | | | 17,441,426 | |
Maximum offering price per share ((NAV/0.9450), based on maximum sales charge of 5.50% of the offering price) | | $ | 6.40 | |
Class C: | | | | |
Net Asset Value, offering and redemption price per share(a) | | $ | 5.92 | |
Net Assets | | $ | 4,417,067 | |
Shares of beneficial interest outstanding (unlimited number of shares, no par value common stock authorized) | | | 745,774 | |
Class I: | | | | |
Net Asset Value, offering and redemption price per share | | $ | 6.08 | |
Net Assets | | $ | 137,856,038 | |
Shares of beneficial interest outstanding (unlimited number of shares, no par value common stock authorized) | | | 22,679,246 | |
Class R: | | | | |
Net Asset Value, offering and redemption price per share | | $ | 5.41 | |
Net Assets | | $ | 191,226 | |
Shares of beneficial interest outstanding (unlimited number of shares, no par value common stock authorized) | | | 35,338 | |
| (a) | Redemption price per share may be reduced for any applicable contingent deferred sales charge. For a description of a possible sales charge, please see the Fund’s Prospectus. | |
See Notes to Financial Statements.
| | |
| ALPS | Red Rocks Listed Private Equity Fund | | |
| Statement of Operations | | For the Year Ended April 30, 2013 |
| | | | |
INVESTMENT INCOME | | | | |
Dividends | | $ | 6,471,958 | |
Foreign taxes withheld on dividends | | | (419,450) | |
Interest and other income | | | 51,464 | |
| |
Total Investment Income | | | 6,103,972 | |
| |
| |
EXPENSES | | | | |
Investment advisory fees | | | 1,573,541 | |
Administrative and transfer agency fees | | | 334,660 | |
Distribution and service fees | | | | |
Class A | | | 266,523 | |
Class C | | | 31,420 | |
Class R | | | 311 | |
Legal fees | | | 8,123 | |
Audit and tax fees | | | 24,782 | |
Networking fees | | | | |
Class A | | | 29,777 | |
Class C | | | 1,700 | |
Class I | | | 93,788 | |
Class R | | | 104 | |
Reports to shareholders and printing fees | | | 60,526 | |
State registration fees | | | 64,417 | |
SEC registration fees | | | 4,691 | |
Insurance fees | | | 5,988 | |
Custody fees | | | 76,730 | |
Trustees’ fees and expenses | | | 13,232 | |
Repayment of previously waived fees | | | | |
Class C | | | 648 | |
Miscellaneous expenses | | | 14,234 | |
| |
Total Expense | | | 2,605,195 | |
Less fees waived/reimbursed by investment advisor (Note 7) | | | | |
Class A | | | (11,372) | |
Class C | | | (143) | |
Class I | | | (23,023) | |
Class R | | | (60) | |
| |
Net Expenses | | | 2,570,597 | |
| |
Net Investment Income | | | 3,533,375 | |
| |
Net realized gain on investments | | | 4,983,177 | |
Net realized loss on foreign currency transactions | | | (63,846) | |
Net change in unrealized appreciation on investments | | | 46,631,868 | |
Net change in unrealized appreciation on translation of assets and liabilities denominated in foreign currencies | | | 14,117 | |
| |
NET REALIZED AND UNREALIZED GAIN ON INVESTMENTS | | | 51,565,316 | |
| |
NET INCREASE IN NET ASSETS RESULTING FROM OPERATIONS | | $ | 55,098,691 | |
| |
| |
See Notes to Financial Statements.
| | |
| ALPS | Red Rocks Listed Private Equity Fund | | |
| Statements of Changes in Net Assets | | |
| | | | | | | | |
| | | For the Year Ended
April 30, 2013 | | | For the Year Ended
April 30, 2012 | |
| |
OPERATIONS | | | | | | | | |
Net investment income | | $ | 3,533,375 | | | $ | 2,252,886 | |
Net realized gain/(loss) on investments and foreign currency transactions | | | 4,919,331 | | | | (1,997,056) | |
Net change in unrealized appreciation/(depreciation) on investments and translation of assets and liabilities denominated in foreign currencies | | | 46,645,985 | | | | (40,079,612) | |
| |
Net Increase/(Decrease) in Net Assets Resulting from Operations | | | 55,098,691 | | | | (39,823,782) | |
| |
| | |
DISTRIBUTIONS | | | | | | | | |
Dividends to shareholders from net investment income | | | | | | | | |
Class A | | | (1,393,693) | | | | (7,773,831) | |
Class C | | | (36,855) | | | | (232,203) | |
Class I | | | (1,868,287) | | | | (5,228,944) | |
Class R | | | (1,190) | | | | (9,179) | |
| |
Net Decrease in Net Assets from Distributions | | | (3,300,025) | | | | (13,244,157) | |
| |
| | |
BENEFICIAL INTEREST TRANSACTIONS (NOTE 6) | | | | | | | | |
Shares sold | | | | | | | | |
Class A | | | 29,478,167 | | | | 55,043,701 | |
Class C | | | 1,238,806 | | | | 1,787,116 | |
Class I | | | 60,979,444 | | | | 50,688,416 | |
Class R | | | 148,586 | | | | 41,342 | |
Dividends reinvested | | | | | | | | |
Class A | | | 1,275,595 | | | | 6,987,024 | |
Class C | | | 30,465 | | | | 172,533 | |
Class I | | | 656,092 | | | | 1,952,666 | |
Class R | | | 813 | | | | 8,650 | |
Shares redeemed | | | | | | | | |
Class A | | | (33,853,264) | | | | (67,995,564) | |
Class C | | | (541,528) | | | | (718,469) | |
Class I | | | (29,674,718) | | | | (22,792,481) | |
Class R | | | (25,800) | | | | (85,079) | |
| |
Net Increase in Net Assets Derived from Beneficial Interest Transactions | | | 29,712,658 | | | | 25,089,855 | |
| |
| | |
Net increase/(decrease) in net assets | | | 81,511,324 | | | | (27,978,084) | |
| | |
NET ASSETS | | | | | | | | |
Beginning of year | | | 166,441,434 | | | | 194,419,518 | |
| |
End of year * | | $ | 247,952,758 | | | $ | 166,441,434 | |
| |
| |
*Includingaccumulated net investment loss of: | | $ | (8,376,470) | | | $ | (10,542,204) | |
See Notes to Financial Statements.
| | |
| ALPS | Red Rocks Listed Private Equity Fund – Class A |
| | |
| Financial Highlights | | Selected data for a share of beneficial interest outstanding throughout the periods indicated: |
| | | | | | | | | | |
| | | For the
Year Ended
April 30, 2013 | | For the
Year Ended
April 30, 2012 | | For the
Year Ended
April 30, 2011 | | For the
Year Ended
April 30, 2010 | | For the
Year Ended
April 30, 2009 |
|
Net asset value, beginning of period | | $4.67 | | $6.44 | | $5.17 | | $3.56 | | $9.47 |
|
INCOME/(LOSS) FROM INVESTMENT OPERATIONS: |
Net investment income | | 0.08(a) | | 0.07(a) | | 0.04(a) | | 0.14 | | 0.08(a) |
Net realized and unrealized gain/(loss) | | 1.39 | | (1.41) | | 1.61 | | 1.99 | | (5.97) |
|
Total from investment operations | | 1.47 | | (1.34) | | 1.65 | | 2.13 | | (5.89) |
|
| | | | | |
DISTRIBUTIONS: | | | | | | | | | | |
From net investment income | | (0.09) | | (0.43) | | (0.38) | | (0.52) | | (0.03) |
From net realized gains | | – | | – | | – | | – | | (0.00)(b) |
|
Total distributions | | (0.09) | | (0.43) | | (0.38) | | (0.52) | | (0.03) |
|
| | | | | |
REDEMPTION FEES ADDED TO
PAID-IN CAPITAL (NOTE 6) | | 0.00(b) | | 0.00(b) | | 0.00(b) | | 0.00(b) | | 0.01 |
|
Net increase/(decrease) in net asset value | | 1.38 | | (1.77) | | 1.27 | | 1.61 | | (5.91) |
|
Net asset value, end of year | | $6.05 | | $4.67 | | $6.44 | | $5.17 | | $3.56 |
|
|
TOTAL RETURN(c) | | 31.75% | | (19.68)% | | 33.22% | | 61.68% | | (62.01)% |
| | | | | |
RATIOS/SUPPLEMENTAL DATA: | | | | | | | | | | |
Net assets, end of year (000s) | | $105,488 | | $85,807 | | $124,874 | | $67,192 | | $27,860 |
Ratio of expenses to average net assets excluding fee waivers and reimbursements(d) | | 1.53% | | 1.71% | | 1.70% | | 1.71% | | 2.08% |
Ratio of expenses to average net assets including fee waivers and reimbursements(d) | | 1.51%(e) | | 1.50% | | 1.50% | | 1.44%(f) | | 1.25% |
Ratio of net investment income to average net assets(d) | | 1.54% | | 1.34% | | 0.67% | | 0.42% | | 2.16% |
Portfolio turnover rate | | 32% | | 72% | | 43% | | 54% | | 59% |
|
| (a) | Calculated using the average shares method. |
| (b) | Less than $0.005 and ($0.005) per share. |
| (c) | Total returns are for the period indicated and have not been annualized. Total returns would have been lower had certain expenses not been waived during the period. Returns shown do not reflect the deduction of taxes that a shareholder would pay on Fund distributions or the redemption of Fund shares. Returns shown exclude any applicable sales charges. |
| (d) | The ratios exclude the impact of expenses of the underlying funds in which the Fund invests as represented in the Statement of Investments. |
| (e) | Contractual expense limitation changed from 1.50% to 1.65% effective September 1, 2012. |
| (f) | Contractual expense limitation changed from 1.25% to 1.50% effective September 1, 2009. |
See Notes to Financial Statements.
| | |
| ALPS | Red Rocks Listed Private Equity Fund – Class C |
| | |
| Financial Highlights | | Selected data for a share of beneficial interest outstanding throughout the periods indicated: |
| | | | | | |
| | | For the Year Ended
April 30, 2013 | | For the Year Ended
April 30, 2012 | | For the Period
July 2, 2010
(Inception) to
April 30, 2011 |
|
Net asset value, beginning of period | | $4.59 | | $6.37 | | $4.39 |
|
INCOME/(LOSS) FROM INVESTMENT OPERATIONS: |
Net investment income/(loss)(a) | | 0.04 | | 0.03 | | (0.01) |
Net realized and unrealized gain/(loss) | | 1.35 | | (1.39) | | 2.36 |
|
Total from investment operations | | 1.39 | | (1.36) | | 2.35 |
|
| | | |
DISTRIBUTIONS: | | | | | | |
From net investment income | | (0.06) | | (0.42) | | (0.37) |
|
Total distributions | | (0.06) | | (0.42) | | (0.37) |
|
| | | |
REDEMPTION FEES ADDED TO PAID-IN CAPITAL (NOTE 6) | | 0.00(b) | | 0.00(b) | | 0.00(b) |
|
Net increase/(decrease) in net asset value | | 1.33 | | (1.78) | | 1.98 |
|
Net asset value, end of year | | $5.92 | | $4.59 | | $6.37 |
|
|
TOTAL RETURN(c) | | 30.55% | | (20.33)% | | 55.32% |
| | | |
RATIOS/SUPPLEMENTAL DATA: | | | | | | |
Net assets, end of year (000s) | | $4,417 | | $2,838 | | $2,566 |
Ratio of expenses to average net assets excluding fee waivers and reimbursements(d) | | 2.25% | | 2.37% | | 2.31%(e) |
Ratio of expenses to average net assets including fee waivers and reimbursements(d) | | 2.25% | | 2.25% | | 2.25%(e)
|
Ratio of net investment income/(loss) to average net
assets(d) | | 0.79% | | 0.59% | | (0.19)%(e)
|
Portfolio turnover rate | | 32% | | 72% | | 43%(f) |
|
| (a) | Calculated using the average shares method. |
| (b) | Less than $0.005 per share. |
| (c) | Total returns are for the period indicated and have not been annualized. Total returns would have been lower had certain expenses not been waived during the period. Returns shown do not reflect the deduction of taxes that a shareholder would pay on Fund distributions or the redemption of Fund shares. Returns shown exclude any applicable sales charges. |
| (d) | The ratios exclude the impact of expenses of the underlying funds in which the Fund invests as represented in the Statement of Investments. |
| (f) | Portfolio turnover rate is calculated at the Fund Level and represents the year ended April 30, 2011. |
See Notes to Financial Statements.
| | |
| ALPS | Red Rocks Listed Private Equity Fund – Class I |
| | |
| Financial Highlights | | Selected data for a share of beneficial interest outstanding throughout the periods indicated: |
| | | | | | | | | | |
| | | For the
Year Ended
April 30, 2013 | | For the
Year Ended
April 30, 2012 | | For the
Year Ended
April 30, 2011 | | For the
Year Ended
April 30, 2010 | | For the
Year Ended
April 30, 2009 |
|
Net asset value, beginning of period | | $4.69 | | $6.47 | | $5.19 | | $3.57 | | $9.47 |
|
INCOME/(LOSS) FROM INVESTMENT OPERATIONS: |
Net investment income | | 0.12(a) | | 0.08(a) | | 0.05(a) | | 0.28 | | 0.10(a) |
Net realized and unrealized gain/(loss) | | 1.36 | | (1.42) | | 1.62 | | 1.87 | | (5.97) |
|
Total from investment operations | | 1.48 | | (1.34) | | 1.67 | | 2.15 | | (5.87) |
|
| | | | | |
DISTRIBUTIONS: | | | | | | | | | | |
From net investment income | | (0.09) | | (0.44) | | (0.39) | | (0.53) | | (0.05) |
From net realized gains | | – | | – | | – | | – | | (0.00)(b) |
|
Total distributions | | (0.09) | | (0.44) | | (0.39) | | (0.53) | | (0.05) |
|
| | | | | |
REDEMPTION FEES ADDED TO
PAID-IN CAPITAL (NOTE 6) | | 0.00(b) | | 0.00(b) | | 0.00(b) | | 0.00(b) | | 0.02 |
|
Net increase/(decrease) in net asset value | | 1.39 | | (1.78) | | 1.28 | | 1.62 | | (5.90) |
|
Net asset value, end of year | | $6.08 | | $4.69 | | $6.47 | | $5.19 | | $3.57 |
|
|
TOTAL RETURN(c) | | 31.99% | | (19.52)% | | 33.47% | | 62.09% | | (61.79)% |
| | | | | |
RATIOS/SUPPLEMENTAL DATA: | | | | | | | | | | |
Net assets, end of year (000s) | | $137,856 | | $77,750 | | $66,854 | | $45,144 | | $12,938 |
Ratio of expenses to average net assets excluding fee waivers and reimbursements(d) | | 1.27% | | 1.41% | | 1.36% | | 1.47% | | 2.05% |
Ratio of expenses to average net assets including fee waivers and reimbursements(d) | | 1.25% | | 1.25% | | 1.25% | | 1.19%(e) | | 1.00% |
Ratio of net investment income to average net assets(d) | | 2.27% | | 1.60% | | 0.91% | | 0.78% | | 2.56% |
Portfolio turnover rate | | 32% | | 72% | | 43% | | 54% | | 59% |
|
| (a) | Calculated using the average shares method. |
| (b) | Less than $0.005 and ($0.005) per share. |
| (c) | Total returns are for the period indicated and have not been annualized. Total returns would have been lower had certain expenses not been waived during the period. Returns shown do not reflect the deduction of taxes that a shareholder would pay on Fund distributions or the redemption of Fund shares. |
| (d) | The ratios exclude the impact of expenses of the underlying funds in which the Fund invests as represented in the Statement of Investments. |
| (e) | Contractual expense limitation changed from 1.00% to 1.25% effective September 1, 2009. |
See Notes to Financial Statements.
| | |
| ALPS | Red Rocks Listed Private Equity Fund – Class R |
| | |
| Financial Highlights | | Selected data for a share of beneficial interest outstanding throughout the periods indicated: |
| | | | | | | | | | |
| | | For the
Year Ended
April 30, 2013 | | For the
Year Ended
April 30, 2012 | | For the
Year Ended
April 30, 2011 | | For the
Year Ended
April 30, 2010 | | For the
Year Ended
April 30, 2009 |
|
Net asset value, beginning of period | | $4.17 | | $5.82 | | $4.73 | | $3.31 | | $9.46 |
|
INCOME/(LOSS) FROM INVESTMENT OPERATIONS: |
Net investment income/(loss) | | 0.08(a) | | 0.05(a) | | 0.03(a) | | (0.09) | | 0.15(a) |
Net realized and unrealized gain/(loss) | | 1.24 | | (1.27) | | 1.43 | | 2.02 | | (6.05) |
|
Total from investment operations | | 1.32 | | (1.22) | | 1.46 | | 1.93 | | (5.90) |
|
| | | | | |
DISTRIBUTIONS: | | | | | | | | | | |
From net investment income | | (0.08) | | (0.43) | | (0.37) | | (0.51) | | (0.26) |
From net realized gains | | – | | – | | – | | – | | (0.00)(b) |
|
Total distributions | | (0.08) | | (0.43) | | (0.37) | | (0.51) | | (0.26) |
|
| | | | | |
REDEMPTION FEES ADDED TO
PAID-IN CAPITAL (NOTE 6) | | – | | – | | – | | – | | 0.01 |
|
Net increase/(decrease) in net asset value | | 1.24 | | (1.65) | | 1.09 | | 1.42 | | (6.15) |
|
Net asset value, end of year | | $5.41 | | $4.17 | | $5.82 | | $4.73 | | $3.31 |
|
|
TOTAL RETURN(c) | | 32.05% | | (19.93)% | | 32.47% | | 60.92% | | (62.10)% |
| | | | | |
RATIOS/SUPPLEMENTAL DATA: | | | | | | | | | | |
Net assets, end of year (000s) | | $191 | | $46 | | $125 | | $18 | | $ - (d) |
Ratio of expenses to average net assets excluding fee waivers and reimbursements(e) | | 1.85% | | 1.89% | | 1.87% | | 2.27% | | 6.08% |
Ratio of expenses to average net assets including fee waivers and reimbursements(e) | | 1.75% | | 1.75% | | 1.75% | | 1.75%(f) | | 1.50% |
Ratio of net investment income/(loss) to average net assets(e) | | 1.80% | | 1.10% | | 0.66% | | (0.24)% | | 2.72% |
Portfolio turnover rate | | 32% | | 72% | | 43% | | 54% | | 59% |
|
| (a) | Calculated using the average shares method. |
| (b) | Less than ($0.005) per share. |
| (c) | Total returns are for the period indicated and have not been annualized. Total returns would have been lower had certain expenses not been waived during the period. Returns shown do not reflect the deduction of taxes that a shareholder would pay on Fund distributions or the redemption of Fund shares. |
| (e) | The ratios exclude the impact of expenses of the underlying funds in which the Fund invests as represented in the Statement of Investments. |
| (f) | Contractual expense limitation changed from 1.50% to 1.75% effective September 1, 2009. |
See Notes to Financial Statements.
| | |
| ALPS | WMC Disciplined Value Fund |
| Management Commentary | | April 30, 2013 (Unaudited) |
Market Comment
US equities finished the period at or near all-time highs. Investors bid up risk assets throughout the period amid further signs of a strengthening US housing market. Markets around the world were also aided by central bank interventions, including the announcement of a third round of quantitative easing by the US Federal Reserve in the third quarter of 2012. Despite ongoing concerns regarding a global economic slowdown, investors were emboldened by better-than-feared corporate earnings and a deal at the start of 2013 to avoid the fiscal cliff in the US.
Within the Russell 1000® Value Index1, results were strong as all ten sectors posted a positive return. Consumer discretionary, consumer staples, and health care performed best while materials, energy, and information technology lagged on a relative basis.
Fund Review
The Fund modestly underperformed its benchmark for the period. Security selection was positive overall, as strong selection in energy and health care was partially offset by weak selection in consumer staples and discretionary. However, negative relative results from sector allocation, a residual of our bottom-up stock selection process, offset positive stock selection.
Top detractors from relative performance included Lorillard (consumer staples), Newfield Exploration (energy), and Teradata (information technology). Shares of Lorillard, a US-based tobacco company, declined after the firm reported lackluster results and investors voiced concerns about potential new regulation of menthol cigarettes. Shares of Newfield Exploration, a diversified oil and gas exploration and production company, traded lower following lower-than-expected production guidance and plans to divest international assets. Shares of Teradata, a company engaged in analytic data solutions including data warehousing, big data analytics, and business applications, declined after the company posted weaker-than-expected revenue. Additionally, investors were disappointed as management guided to the low end of their previous full year revenue view.
Among the top contributors to relative performance were Gilead Sciences (health care), Hertz Global (industrials), and Marathon Petroleum (energy). Shares of Gilead Sciences, a biopharmaceutical company, rose due to positive news flows, including passing the first hurdle for the acceptance of the firm’s Hepatitis C single tablet regimen. Shares of Hertz Global, a US-based car and equipment rental company, gained after the company released strong earnings results with higher-than-expected revenue and profit margins. Shares of Marathon Petroleum, a US refiner and marketer of petroleum products, benefited from continued low feedstock costs relative to global oil prices. Marathon also recently announced an incremental share repurchase program.
Outlook
The medium-term growth prospects in the US are favorable. The consumer is expected to be resilient this year, helped by improving net worth from rising house and equity market prices as well as steady job gains. The key drivers of US growth are expected to be capital
spending and the housing and automotive sectors over the course of the next year. Capital investment spending should finally rise as capacity utilization levels normalize, while vehicle sales and new home constructions, despite their strong recent advance, still have a lot of pent-up demand behind them. An improving economy and healing labor market notwithstanding, the US Federal Reserve Bank is unlikely to abandon its quantitative easing program any time soon.
The Fund attempts to add value by combining Wellington Management’s proprietary fundamental and quantitative research in a disciplined framework to build a portfolio of the most attractive stocks. Within this framework, the Fund ended the period most overweight the health care and information technology sectors and most underweight the financials, telecommunication services, and utilities sectors.
The views and information discussed in this commentary are as of the date of publication, are subject to change, and may not reflect the writer’s current views. The views expressed represent an assessment of market conditions at a specific point in time, are opinions only and should not be relied upon as investment advice regarding a particular investment or markets in general. Such information does not constitute a recommendation to buy or sell specific securities or investment vehicles. It should not be assumed that any investment will be profitable or will equal the performance of the portfolios or any securities or any sectors mentioned herein. The subject matter contained herein has been derived from several sources believed to be reliable and accurate at the time of compilation. Wellington Management Company, LLP does not accept any liability for losses either direct or consequential caused by the use of this information.
| 1 | The Russell 1000® Value Index measures the performance of those Russell 1000® companies with lower price-to-book ratios and lower forecasted growth values. The index is not actively managed and does not reflect any deduction for fees, expenses or taxes. An investor may not invest directly in an index. |
| | |
| ALPS | WMC Disciplined Value Fund |
| Performance Update | | April 30, 2013 (Unaudited) |
Performance of $10,000 Initial Investment (as of April 30, 2013)
Comparison of change in value of a $10,000 investment (includes maximum sales charges of 5.50%)
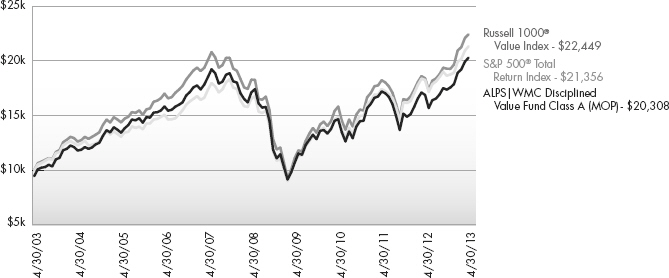
The chart above represents historical performance of a hypothetical investment of $10,000 in the Fund for the last ten years. Past performance does not guarantee future results. This chart does not reflect the deduction of taxes that a shareholder would pay on Fund distributions or the redemption of Fund shares.
Average Annual Total Returns (as of April 30, 2013)
| | | | | | | | | | |
| | | 1 Year | | 5 Year | | 10 Year | | Total
Expense Ratio | | What You Pay * |
Class A (NAV)1 | | 20.17% | | 3.45% | | 7.95% | | 1.58% | | 1.40% |
Class A (MOP)2 | | 13.56% | | 2.28% | | 7.34% | | |
Class C (NAV)1 | | 19.07% | | 2.67% | | 7.14% | | 2.33% | | 2.15% |
Class C (CDSC)2 | | 18.07% | | 2.67% | | 7.14% | | |
Class I | | 20.43% | | 3.69% | | 8.12% | | 1.33% | | 1.15% |
Russell 1000® Value Index3 | | 21.80% | | 4.17% | | 8.42% | | | | |
S&P 500® Total Return Index4 | | 16.89% | | 5.21% | | 7.88% | | | | |
Performance data quoted represents past performance. Past performance does not guarantee future results. Investment return and principal value of an investment will fluctuate so that an investor’s shares, when sold or redeemed, may be worth more or less than the original cost. Current performance data may be higher or lower than actual data quoted. The Fund imposes a maximum Contingent Deferred Sales Charge (“CDSC”) of 1.00% on Class C shares redeemed within the first 12 months after a purchase, and on Class A shares redeemed within the first 12 months after a purchase in excess of $1 million. Performance data does not reflect the CDSC, which if reflected would reduce the performance quoted. For the most current month-end performance data, please call 1-866-759-5679.
Performance shown for Class C shares prior to June 30, 2010 reflects the historical performance of the Fund’s Class A shares, calculated using the fees and expenses of Class C shares.
The performance shown for the ALPS | WMC Disciplined Value Fund (the “Fund”) for periods prior to August 29, 2009, reflects the performance of the Activa Mutual Funds Trust – Activa Value Fund (as result of a prior reorganization of Activa Mutual Funds Trust – Activa Value Fund into the Fund).
| | |
| ALPS | WMC Disciplined Value Fund |
| Performance Update | | April 30, 2013 (Unaudited) |
| 1 | Net Asset Value (NAV) is the share price without sales charges. |
| 2 | Maximum Offering Price (MOP) for Class A shares includes the Fund’s maximum sales charge of 5.50%. CDSC performance for Class C shares includes a 1% CDSC on C shares redeemed within 12 months of purchase. Performance shown at NAV does not include these sales charges and would have been lower had it been taken into account. |
| 3 | The Russell 1000® Value Index measures the performance of those Russell 1000® companies with lower price-to-book ratios and lower forecasted growth values. The index is not actively managed and does not reflect any deduction for fees, expenses or taxes. An investor may not invest directly in an index. |
| 4 | The S&P 500® Index is the Standard & Poor’s composite index of 500 stocks, a widely recognized, unmanaged index of common stock prices. The index is not actively managed and does not reflect any deduction for fees, expenses or taxes. An investor may not invest directly in an index. |
| * | What You Pay reflects the Advisor’s decision to contractually limit expenses through August 31, 2013. Please see the prospectus for additional information. |
The table does not reflect the deduction of taxes that a shareholder would pay on Fund distributions or the redemption of Fund shares.
Mutual funds are not insured or guaranteed by the FDIC or by any other government agency or government sponsored agency of the federal government or any state, not deposits, obligations or guaranteed by any bank or its affiliates and are subject to investment risks, including possible loss of the principal amount invested.
There is no guarantee that the Fund will continue to hold any one particular security or stay invested in any one particular company. The composition of the Fund’s top holdings is subject to change. Performance figures are historical and reflect the change in share price, reinvested distributions, changes in net asset value, sales charges and capital gains distributions, if any.
Investing in the Fund is subject to investment risks, including possible loss of the principal amount invested. Derivatives generally are more sensitive to changes in economic or market conditions than other types of investments; this could result in losses that significantly exceed the Fund’s original investment.
Top Ten Holdings (as a % of Net Assets) †
| | | | |
Chevron Corp. | | | 4.08 | % |
JPMorgan Chase & Co. | | | 3.46 | % |
Wells Fargo & Co. | | | 3.24 | % |
Exxon Mobil Corp. | | | 2.72 | % |
Merck & Co., Inc. | | | 2.63 | % |
Citigroup, Inc. | | | 2.41 | % |
iShares® Russell 1000® Value Index Fund | | | 2.01 | % |
ACE, Ltd. | | | 2.00 | % |
AT&T, Inc. | | | 1.99 | % |
CVS Caremark Corp. | | | 1.95 | % |
Top Ten Holdings | | | 26.49 | % |
| † | Holdings are subject to change. Table presents indicative values only. |
Industry Sector Allocation (as a % of Net Assets)
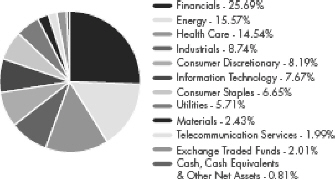
| | |
| ALPS | WMC Disciplined Value Fund |
| Statement of Investments | | April 30, 2013 |
| | | | | | | | |
| | | Shares | | | Value (Note 2) | |
| |
COMMON STOCKS (97.18%) | | | | | | | | |
Consumer Discretionary (8.19%) | | | | | |
Automobiles & Components (1.18%) | | | | | |
TRW Automotive Holdings Corp.(a) | | | 17,600 | | | $ | 1,057,232 | |
| | | | | | | | |
| | |
Consumer Durables & Apparel (1.01%) | | | | | | | | |
PVH Corp. | | | 7,820 | | | | 902,506 | |
| | | | | | | | |
| | |
Media (2.38%) | | | | | | | | |
News Corp., Class A | | | 44,245 | | | | 1,370,268 | |
Viacom, Inc.,
Class B | | | 11,980 | | | | 766,600 | |
| | | | | | | | |
| | | | | | | 2,136,868 | |
| | | | | | | | |
| | |
Retailing (3.62%) | | | | | | | | |
Dollar Tree,
Inc.(a) | | | 19,190 | | | | 912,676 | |
Lowe’s Cos., Inc. | | | 36,165 | | | | 1,389,459 | |
TJX Cos., Inc. | | | 19,280 | | | | 940,286 | |
| | | | | | | | |
| | | | | | | 3,242,421 | |
| | | | | | | | |
| | |
TOTAL CONSUMER DISCRETIONARY | | | | | | | 7,339,027 | |
| | | | | | | | |
| | |
Consumer Staples (6.65%) | | | | | | | | |
Food & Staples Retailing (1.95%) | | | | | | | | |
CVS Caremark Corp. | | | 30,015 | | | | 1,746,273 | |
| | | | | | | | |
| | |
Food Beverage & Tobacco (4.70%) | | | | | | | | |
Altria Group, Inc. | | | 31,470 | | | | 1,148,970 | |
Hillshire Brands Co. | | | 15,010 | | | | 539,009 | |
The JM Smucker Co. | | | 10,580 | | | | 1,092,173 | |
Lorillard, Inc. | | | 10,730 | | | | 460,209 | |
Philip Morris International, Inc. | | | 10,225 | | | | 977,408 | |
| | | | | | | | |
| | | | | | | 4,217,769 | |
| | | | | | | | |
| | |
TOTAL CONSUMER STAPLES | | | | | | | 5,964,042 | |
| | | | | | | | |
| | |
Energy (15.57%) | | | | | | | | |
Energy (15.57%) | | | | | | | | |
Anadarko Petroleum Corp. | | | 17,780 | | | | 1,507,033 | |
Chesapeake Energy Corp. | | | 26,640 | | | | 520,546 | |
Chevron Corp. | | | 29,959 | | | | 3,655,298 | |
ConocoPhillips | | | 8,560 | | | | 517,452 | |
Exxon Mobil Corp. | | | 27,404 | | | | 2,438,682 | |
Halliburton Co. | | | 15,465 | | | | 661,438 | |
Marathon Oil Corp. | | | 26,430 | | | | 863,468 | |
Marathon Petroleum Corp. | | | 8,800 | | | | 689,568 | |
National Oilwell Varco, Inc. | | | 9,925 | | | | 647,308 | |
Newfield Exploration Co.(a) | | | 16,000 | | | | 348,640 | |
Patterson-UTI Energy, Inc. | | | 26,500 | | | | 558,885 | |
PBF Energy, Inc. | | | 15,870 | | | | 483,241 | |
Phillips 66 | | | 17,540 | | | | 1,069,063 | |
| | | | | | | | |
| | |
TOTAL ENERGY | | | | | | | 13,960,622 | |
| | | | | | | | |
| | | | | | | | |
| | | Shares | | | Value (Note 2) | |
| |
Financials (25.69%) | | | | | | | | |
Banks (5.00%) | | | | | | | | |
The PNC Financial Services Group, Inc. | | | 15,660 | | | $ | 1,063,001 | |
Wells Fargo & Co. | | | 76,530 | | | | 2,906,609 | |
Zions Bancorporation | | | 20,890 | | | | 514,312 | |
| | | | | | | | |
| | | | | | | 4,483,922 | |
| | | | | | | | |
| | |
Diversified Financials (11.08%) | | | | | | | | |
Ameriprise Financial, Inc. | | | 20,380 | | | | 1,518,921 | |
BlackRock, Inc. | | | 4,360 | | | | 1,161,940 | |
Citigroup, Inc. | | | 46,245 | | | | 2,157,792 | |
Invesco, Ltd. | | | 37,370 | | | | 1,186,124 | |
JPMorgan Chase & Co. | | | 63,213 | | | | 3,098,069 | |
Morgan Stanley | | | 36,620 | | | | 811,133 | |
| | | | | | | | |
| | | | | | | 9,933,979 | |
| | | | | | | | |
| | |
Insurance (6.66%) | | | | | | | | |
ACE, Ltd. | | | 20,160 | | | | 1,797,063 | |
American International Group, Inc.(a) | | | 30,720 | | | | 1,272,422 | |
Aon PLC | | | 17,640 | | | | 1,064,574 | |
Lincoln National Corp. | | | 27,320 | | | | 929,153 | |
Prudential Financial, Inc. | | | 15,050 | | | | 909,321 | |
| | | | | | | | |
| | | | | | | 5,972,533 | |
| | | | | | | | |
| | |
Real Estate (2.95%) | | | | | | | | |
Camden Property Trust | | | 11,435 | | | | 827,208 | |
Equity Lifestyle Properties, Inc. | | | 8,550 | | | | 694,687 | |
Forest City Enterprises, Inc., Class A(a) | | | 60,050 | | | | 1,121,134 | |
| | | | | | | | |
| | | | | | | 2,643,029 | |
| | | | | | | | |
| | |
TOTAL FINANCIALS | | | | | | | 23,033,463 | |
| | | | | | | | |
| | |
Health Care (14.54%) | | | | | | | | |
Health Care Equipment & Services (4.32%) | | | | | | | | |
Aetna, Inc. | | | 10,650 | | | | 611,736 | |
Covidien PLC | | | 12,880 | | | | 822,259 | |
McKesson Corp. | | | 5,180 | | | | 548,147 | |
UnitedHealth Group, Inc. | | | 20,420 | | | | 1,223,771 | |
Zimmer Holdings, Inc. | | | 8,720 | | | | 666,644 | |
| | | | | | | | |
| | | | | | | 3,872,557 | |
| | | | | | | | |
| | |
Pharmaceuticals, Biotechnology & Life Sciences (10.22%) | | | | | | | | |
Actavis, Inc.(a) | | | 10,250 | | | | 1,083,732 | |
Amgen, Inc. | | | 8,810 | | | | 918,090 | |
Eli Lilly & Co. | | | 19,265 | | | | 1,066,896 | |
Forest Laboratories,
Inc.(a) | | | 27,453 | | | | 1,027,017 | |
Gilead Sciences, Inc.(a) | | | 22,070 | | | | 1,117,625 | |
Merck & Co., Inc. | | | 50,100 | | | | 2,354,700 | |
Pfizer, Inc. | | | 31,470 | | | | 914,833 | |
| | |
| ALPS | WMC Disciplined Value Fund |
| Statement of Investments | | April 30, 2013 |
| | | | | | | | |
| | | Shares | | | Value (Note 2) | |
| |
Pharmaceuticals, Biotechnology & Life Sciences (continued) | | | | | |
Thermo Fisher Scientific, Inc. | | | 8,430 | | | $ | 680,132 | |
| | | | | | | | |
| | | | | | | 9,163,025 | |
| | | | | | | | |
| | |
TOTAL HEALTH CARE | | | | | | | 13,035,582 | |
| | | | | | | | |
| | |
Industrials (8.74%) | | | | | | | | |
Capital Goods (4.50%) | | | | | | | | |
The Boeing Co. | | | 7,660 | | | | 700,201 | |
Dover Corp. | | | 10,860 | | | | 749,123 | |
General Electric Co. | | | 47,475 | | | | 1,058,218 | |
Parker Hannifin Corp. | | | 6,550 | | | | 580,133 | |
United Technologies Corp. | | | 10,370 | | | | 946,677 | |
| | | | | | | | |
| | | | | | | 4,034,352 | |
| | | | | | | | |
| |
Commercial & Professional Services (2.40%) | | | | | |
Equifax, Inc. | | | 14,110 | | | | 863,532 | |
Towers Watson & Co., Class A | | | 12,030 | | | | 877,228 | |
Verisk Analytics, Inc.,
Class A(a) | | | 6,720 | | | | 411,869 | |
| | | | | | | | |
| | | | | | | 2,152,629 | |
| | | | | | | | |
Transportation (1.84%) | | | | | | | | |
Hertz Global Holdings, Inc.(a) | | | 45,455 | | | | 1,094,556 | |
United Continental Holdings, Inc.(a) | | | 17,150 | | | | 553,945 | |
| | | | | | | | |
| | | | | | | 1,648,501 | |
| | | | | | | | |
| | |
TOTAL INDUSTRIALS | | | | | | | 7,835,482 | |
| | | | | | | | |
| | |
Information Technology (7.67%) | | | | | | | | |
Semiconductors & Semiconductor Equipment (0.62%) | | | | | |
Xilinx, Inc. | | | 14,560 | | | | 551,970 | |
| | | | | | | | |
| | |
Software & Services (5.21%) | | | | | | | | |
Accenture PLC, Class A | | | 10,095 | | | | 822,136 | |
eBay, Inc.(a) | | | 10,420 | | | | 545,904 | |
Genpact, Ltd. | | | 41,345 | | | | 769,017 | |
Oracle Corp. | | | 26,410 | | | | 865,720 | |
Teradata Corp.(a) | | | 7,950 | | | | 406,006 | |
VeriSign, Inc.(a) | | | 9,770 | | | | 450,104 | |
Visa, Inc., A Shares | | | 4,830 | | | | 813,662 | |
| | | | | | | | |
| | | | | | | 4,672,549 | |
| | | | | | | | |
| |
Technology Hardware & Equipment (1.84%) | | | | | |
Cisco Systems, Inc. | | | 79,090 | | | | 1,654,563 | |
| | | | | | | | |
| |
TOTAL INFORMATION TECHNOLOGY | | | | 6,879,082 | |
| | | | | | | | |
| | |
Materials (2.43%) | | | | | | | | |
Materials (2.43%) | | | | | | | | |
Crown Holdings, Inc.(a) | | | 13,905 | | | | 593,466 | |
The Dow Chemical Co. | | | 36,988 | | | | 1,254,263 | |
| | | | | | | | |
| | | Shares | | | Value (Note 2) | |
| |
Materials (continued) | | | | | | | | |
Newmont Mining Corp. | | | 10,311 | | | $ | 334,076 | |
| | | | | | | | |
| | |
TOTAL MATERIALS | | | | | | | 2,181,805 | |
| | | | | | | | |
| |
Telecommunication Services (1.99%) | | | | | |
Telecommunication Services (1.99%) | | | | | |
AT&T, Inc. | | | 47,645 | | | | 1,784,782 | |
| | | | | | | | |
| | |
TOTAL TELECOMMUNICATION SERVICES | | | | | | | 1,784,782 | |
| | | | | | | | |
| | |
Utilities (5.71%) | | | | | | | | |
Utilities (5.71%) | | | | | | | | |
American Electric Power Co., Inc | | | 21,940 | | | | 1,128,374 | |
NextEra Energy, Inc. | | | 18,630 | | | | 1,528,219 | |
PG&E Corp. | | | 24,700 | | | | 1,196,468 | |
Xcel Energy, Inc. | | | 39,810 | | | | 1,265,560 | |
| | | | | | | | |
| | |
TOTAL UTILITIES | | | | | | | 5,118,621 | |
| | | | | | | | |
| | |
TOTAL COMMON STOCKS (Cost $64,644,718) | | | | | | | 87,132,508 | |
| | | | | | | | |
| |
EXCHANGE TRADED FUNDS (2.01%) | | | | | |
Equity Fund (2.01%) | | | | | | | | |
iShares® Russell 1000® Value Index Fund | | | 21,890 | | | | 1,803,517 | |
| | | | | | | | |
| | |
TOTAL EXCHANGE TRADED FUNDS (Cost $1,761,075) | | | | | | | 1,803,517 | |
| | | | | | | | |
| | | | | | | | | | | | |
| | | 7-Day
Yield | | | Shares | | | Value (Note 2) | |
| |
SHORT TERM INVESTMENTS (1.25%) | | | | | | | | | | | | |
Money Market Fund (1.25%) | | | | | | | | | |
Fidelity Institutional - Money Market Portfolio, Class I | | | 0.098 | % | | | 1,117,732 | | | | 1,117,732 | |
| | | | | | | | | | | | |
| | |
TOTAL SHORT TERM INVESTMENTS (Cost $1,117,732) | | | | | | | | 1,117,732 | |
| | | | | | | | | | | | |
| | |
TOTAL INVESTMENTS (100.44%) (Cost $67,523,525) | | | | | | | $ | 90,053,757 | |
| | |
Liabilities In Excess Of Other
Assets (-0.44%) | | | | | | | | (393,897 | ) |
| | | | | | | | | | | | |
| | |
NET ASSETS (100.00%) | | | | | | | $ | 89,659,860 | |
| | | | | | | | | | | | |
| | |
| ALPS | WMC Disciplined Value Fund | | |
| Statement of Investments | | April 30, 2013 |
| (a) | Non-Income Producing Security. |
Common Abbreviations:
Ltd. - Limited.
PLC - Public Limited Company.
For Fund compliance purposes, the Fund’s industry classifications refer to any one or more of the industry sub-classifications used by one or more widely recognized market indexes or ratings group indexes, and/or as defined by Fund management. This definition may not apply for purposes of this report, which may combine industry sub-classifications for reporting ease. Industries are shown as a percent of net assets.
See Notes to Financial Statements.
| | |
| ALPS | WMC Disciplined Value Fund |
| Statement of Assets and Liabilities | | April 30, 2013 |
| | | | |
ASSETS | | | | |
Investments, at value | | $ | 90,053,757 | |
Receivable for investments sold | | | 400,886 | |
Dividends receivable | | | 60,682 | |
Prepaid expenses and other assets | | | 13,321 | |
| |
Total Assets | | | 90,528,646 | |
| |
LIABILITIES | | | | |
Payable for investments purchased | | | 502,786 | |
Payable for shares redeemed | | | 243,035 | |
Investment advisory fees payable | | | 63,187 | |
Administration and transfer agency fees payable | | | 19,828 | |
Distribution and services fees payable | | | 10,268 | |
Trustees’ fees and expenses payable | | | 2,357 | |
Legal fees payable | | | 423 | |
Audit and tax fees payable | | | 15,506 | |
Accrued expenses and other liabilities | | | 11,396 | |
| |
Total Liabilities | | | 868,786 | |
| |
NET ASSETS | | $ | 89,659,860 | |
| |
| |
NET ASSETS CONSIST OF | | | | |
Paid-in capital | | $ | 73,238,324 | |
Accumulated net investment income | | | 240,154 | |
Accumulated net realized loss on investments | | | (6,348,850 | ) |
Net unrealized appreciation on investments | | | 22,530,232 | |
| |
NET ASSETS | | $ | 89,659,860 | |
| |
| |
INVESTMENTS, AT COST | | $ | 67,523,525 | |
| |
| |
PRICING OF SHARES | | | | |
Class A: | | | | |
Net Asset Value, offering and redemption price per share(a) | | $ | 10.01 | |
Net Assets | | $ | 50,142,342 | |
Shares of beneficial interest outstanding (unlimited number of shares, no par value common stock authorized) | | | 5,011,629 | |
Maximum offering price per share ((NAV/0.9450), based on maximum sales charge of 5.50% of the offering price) | | $ | 10.59 | |
Class C: | | | | |
Net Asset Value, offering and redemption price per share(a) | | $ | 9.93 | |
Net Assets | | $ | 100,215 | |
Shares of beneficial interest outstanding (unlimited number of shares, no par value common stock authorized) | | | 10,088 | |
Class I: | | | | |
Net Asset Value, offering and redemption price per share | | $ | 10.10 | |
Net Assets | | $ | 39,417,303 | |
Shares of beneficial interest outstanding (unlimited number of shares, no par value common stock authorized) | | | 3,903,395 | |
| (a) | Redemption price per share may be reduced for any applicable contingent deferred sales charge. For a description of a possible sales charge, please see the Fund’s Prospectus. |
See Notes to Financial Statements.
| | |
| ALPS | WMC Disciplined Value Fund |
| Statement of Operations | | For the Year Ended April 30, 2013 |
| | | | |
INVESTMENT INCOME | | | | |
Dividends | | $ | 1,854,933 | |
| |
Total Investment Income | | | 1,854,933 | |
| |
| |
EXPENSES | | | | |
Investment advisory fees | | | 749,684 | |
Administrative and transfer agency fees | | | 138,163 | |
Distribution and service fees | | | | |
Class A | | | 113,632 | |
Class C | | | 824 | |
Legal fees | | | 3,306 | |
Audit and tax fees | | | 16,691 | |
Reports to shareholders and printing fees | | | 26,090 | |
State registration fees | | | 32,452 | |
SEC registration fees | | | 87 | |
Insurance fees | | | 2,777 | |
Custody fees | | | 10,391 | |
Trustees’ fees and expenses | | | 5,664 | |
Miscellaneous expenses | | | 9,214 | |
| |
Total Expense | | | 1,108,975 | |
Less fees waived/reimbursed by investment advisor (Note 7) | | | | |
Class A | | | (50,013 | ) |
Class C | | | (90 | ) |
Class I | | | (36,903 | ) |
| |
Net Expenses | | | 1,021,969 | |
| |
Net Investment Income | | | 832,964 | |
| |
Net realized gain on investments | | | 3,959,551 | |
Net change in unrealized appreciation on investments | | | 10,023,480 | |
| |
NET REALIZED AND UNREALIZED GAIN ON INVESTMENTS | | | 13,983,031 | |
| |
NET INCREASE IN NET ASSETS RESULTING FROM OPERATIONS | | $ | 14,815,995 | |
| |
| |
See Notes to Financial Statements.
| | |
| ALPS | WMC Disciplined Value Fund |
| Statements of Changes in Net Assets | | |
| | | | | | | | |
| | | For the
Year Ended
April 30, 2013 | | | For the
Year Ended
April 30, 2012 | |
| |
OPERATIONS | | | | | | | | |
Net investment income | | $ | 832,964 | | | $ | 662,413 | |
Net realized gain on investments | | | 3,959,551 | | | | 2,407,417 | |
Net change in unrealized appreciation/(depreciation) on investments | | | 10,023,480 | | | | (4,114,283 | ) |
| |
Net Increase/(Decrease) in Net Assets Resulting from Operations | | | 14,815,995 | | | | (1,044,453 | ) |
| |
| | |
DISTRIBUTIONS | | | | | | | | |
Dividends to shareholders from net investment income | | | | | | | | |
Class A | | | (495,861 | ) | | | (293,376 | ) |
Class C | | | (501 | ) | | | (25 | ) |
Class I | | | (393,650 | ) | | | (241,602 | ) |
| |
Net Decrease in Net Assets from Distributions | | | (890,012 | ) | | | (535,003 | ) |
| |
| | |
BENEFICIAL INTEREST TRANSACTIONS (NOTE 6) | | | | | | | | |
Shares sold | | | | | | | | |
Class A | | | 2,079,629 | | | | 2,056,325 | |
Class C | | | 6,300 | | | | 65,000 | |
Class I | | | 5,541,680 | | | | 8,493,521 | |
Dividends reinvested | | | | | | | | |
Class A | | | 472,006 | | | | 281,298 | |
Class C | | | 501 | | | | 25 | |
Class I | | | 393,650 | | | | 241,601 | |
Shares redeemed | | | | | | | | |
Class A | | | (5,504,904 | ) | | | (4,947,805 | ) |
Class I | | | (6,958,371 | ) | | | (3,071,135 | ) |
| |
Net Increase/(Decrease) in Net Assets Derived from Beneficial Interest Transactions | | | (3,969,509 | ) | | | 3,118,830 | |
| |
| | |
Net increase in net assets | | | 9,956,474 | | | | 1,539,374 | |
| | |
NET ASSETS | | | | | | | | |
Beginning of year | | | 79,703,386 | | | | 78,164,012 | |
| |
End of year * | | $ | 89,659,860 | | | $ | 79,703,386 | |
| |
| |
| *Including accumulated net investment income of: | | $ | 240,154 | | | $ | 294,844 | |
See Notes to Financial Statements.
| | |
| ALPS | WMC Disciplined Value Fund – Class A |
| | |
| Financial Highlights | | Selected data for a share of beneficial interest outstanding throughout the periods indicated: |
| | | | | | | | | | | | |
| | | For the Year
Ended
April 30, 2013(a) | | For the Year
Ended
April 30, 2012 | | For the Year
Ended
April 30, 2011(b) | | For the Period
January 1, 2010 to
April 30, 2010(c) | | For the Year
Ended
December 31,
2009 | | For the Year
Ended
December 31,
2008 |
|
Net asset value, beginning of period | | $8.42 | | $8.64 | | $7.43 | | $6.92 | | $5.86 | | $9.35 |
| |
INCOME/(LOSS) FROM INVESTMENT OPERATIONS: | | |
Net investment income | | 0.08(d) | | 0.06(d) | | 0.06(d) | | 0.03 | | 0.07 | | 0.08 |
Net realized and unrealized gain/(loss) | | 1.61 | | (0.23) | | 1.22 | | 0.48 | | 1.06 | | (3.49) |
|
Total from investment operations | | 1.69 | | (0.17) | | 1.28 | | 0.51 | | 1.13 | | (3.41) |
|
| |
DISTRIBUTIONS: | | |
From net investment income | | (0.10) | | (0.05) | | (0.07) | | – | | (0.07) | | (0.08) |
|
Total distributions | | (0.10) | | (0.05) | | (0.07) | | – | | (0.07) | | (0.08) |
|
Net increase/(decrease) in net asset value | | 1.59 | | (0.22) | | 1.21 | | 0.51 | | 1.06 | | (3.49) |
|
Net asset value, end of year | | $10.01 | | $8.42 | | $8.64 | | $7.43 | | $6.92 | | $5.86 |
|
|
TOTAL RETURN(e) | | 20.17% | | (1.81)% | | 17.34% | | 7.22% | | 19.24% | | (36.45)% |
| |
RATIOS/SUPPLEMENTAL DATA: | | |
Net assets, end of year (000s) | | $50,142 | | $44,989 | | $48,899 | | $45,300 | | $62,264 | | $53,841 |
Ratio of expenses to average net assets excluding fee waivers and reimbursements | | 1.51% | | 1.58% | | 1.71% | | 1.70%(f) | | N/A | | N/A |
Ratio of expenses to average net assets including fee waivers and reimbursements | | 1.40% | | 1.40% | | 1.40% | | 1.40%(f) | | 1.62% | | 1.50% |
Ratio of net investment income to average net assets | | 0.95% | | 0.83% | | 0.77% | | 0.60%(f) | | 1.12% | | 1.10% |
Portfolio turnover rate(g) | | 34% | | 46% | | 44% | | 11% | | 56% | | 83% |
|
| (a) | Prior to August 31, 2012, the ALPS | WMC Value Disciplined Fund was known as the ALPS | WMC Value Intersection Fund. |
| (b) | Prior to August 31, 2010, the ALPS | WMC Value Intersection Fund was known as the Activa Value Fund (as a result of the reorganization of Activa Mutual Funds Trust - Activa Value Fund into the Fund). |
| (c) | Effective March 9, 2010, the Board approved changing the fiscal year-end of the Fund from December 31 to April 30. |
| (d) | Calculated using the average shares method. |
| (e) | Total returns are for the period indicated and have not been annualized. Total returns would have been lower had certain expenses not been waived during the period. Returns shown do not reflect the deduction of taxes that a shareholder would pay on Fund distributions or the redemption of Fund shares. Returns shown exclude any applicable sales charges. |
| (g) | Portfolio turnover rate for periods less than one full year have not been annualized. |
See Notes to Financial Statements.
| | |
| ALPS | WMC Disciplined Value Fund – Class C |
| | |
| Financial Highlights | | Selected data for a share of beneficial interest outstanding throughout the periods indicated: |
| | | | | | |
| | | For the Year Ended
April 30, 2013(a) | | For the Year Ended
April 30, 2012 | | For the Period
July 2, 2010
(Inception) to
April 30, 2011(b) |
|
Net asset value, beginning of period | | $8.39 | | $8.62 | | $6.40 |
| | | |
INCOME/(LOSS) FROM INVESTMENT OPERATIONS: | | | | | | |
Net investment income/(loss)(c) | | 0.02 | | (0.01) | | (0.01) |
Net realized and unrealized gain/(loss) | | 1.57 | | (0.20) | | 2.27 |
|
Total from investment operations | | 1.59 | | (0.21) | | 2.26 |
|
| | | |
DISTRIBUTIONS: | | | | | | |
From net investment income | | (0.05) | | (0.02) | | (0.04) |
|
Total distributions | | (0.05) | | (0.02) | | (0.04) |
|
| | | |
Net increase/(decrease) in net asset value | | 1.54 | | (0.23) | | 2.22 |
|
Net asset value, end of year | | $9.93 | | $8.39 | | $8.62 |
|
|
TOTAL RETURN(d) | | 19.07% | | (2.45)% | | 35.44% |
| | | |
RATIOS/SUPPLEMENTAL DATA: | | | | | | |
Net assets, end of year (000s) | | $100 | | $79 | | $14 |
Ratio of expenses to average net assets excluding fee waivers and reimbursements | | 2.26% | | 2.38% | | 2.49%(e) |
Ratio of expenses to average net assets including fee waivers and reimbursements | | 2.15% | | 2.15% | | 2.15%(e)
|
Ratio of net investment income/(loss) to average net assets | | 0.19% | | (0.16)% | | (0.09)%(e)
|
Portfolio turnover rate | | 34% | | 46% | | 44%(f) |
|
| (a) | Prior to August 31, 2012, the ALPS | WMC Value Disciplined Fund was known as the ALPS | WMC Value Intersection Fund. |
| (b) | Prior to August 31, 2010, the ALPS | WMC Value Intersection Fund was known as the Activa Value Fund (as a result of the reorganization of Activa Mutual Funds Trust - Activa Value Fund into the Fund). |
| (c) | Calculated using the average shares method. |
| (d) | Total returns are for the period indicated and have not been annualized. Total returns would have been lower had certain expenses not been waived during the period. Returns shown do not reflect the deduction of taxes that a shareholder would pay on Fund distributions or the redemption of Fund shares. Returns shown exclude any applicable sales charges. |
| (f) | Portfolio turnover rate is calculated at the Fund Level and represents the year ended April 30, 2011. |
See Notes to Financial Statements.
| | |
| ALPS | WMC Disciplined Value Fund – Class I |
| | |
| Financial Highlights | | Selected data for a share of beneficial interest outstanding throughout the periods indicated: |
| | | | | | | | | | | | |
| | | For the Year
Ended
April 30, 2013(a) | | For the Year
Ended
April 30, 2012 | | For the Year
Ended
April 30, 2011(b) | | For the Period
January 1, 2010 to
April 30, 2010(c) | | For the Year
Ended
December 31, 2009 | | For the Year
Ended
December 31, 2008 |
|
Net asset value, beginning of period | | $8.49 | | $8.71 | | $7.48 | | $6.96 | | $5.89 | | $9.41 |
| |
INCOME/(LOSS) FROM INVESTMENT OPERATIONS: | | |
Net investment income | | 0.11(d) | | 0.09(d) | | 0.07(d) | | 0.02 | | 0.07 | | 0.09 |
Net realized and unrealized gain/(loss) | | 1.61 | | (0.24) | | 1.24 | | 0.50 | | 1.08 | | (3.52) |
|
Total from investment operations | | 1.72 | | (0.15) | | 1.31 | | 0.52 | | 1.15 | | (3.43) |
|
| |
DISTRIBUTIONS: | | |
From net investment income | | (0.11) | | (0.07) | | (0.08) | | – | | (0.08) | | (0.09) |
|
Total distributions | | (0.11) | | (0.07) | | (0.08) | | – | | (0.08) | | (0.09) |
|
| | | | | | |
Net increase/(decrease) in net asset value | | 1.61 | | (0.22) | | 1.23 | | 0.52 | | 1.07 | | (3.52) |
|
Net asset value, end of year | | $10.10 | | $8.49 | | $8.71 | | $7.48 | | $6.96 | | $5.89 |
|
|
TOTAL RETURN(e) | | 20.43% | | (1.62)% | | 17.67% | | 7.47% | | 19.59% | | (36.38)% |
| |
RATIOS/SUPPLEMENTAL DATA: | | |
Net assets, end of year (000s) | | $39,417 | | $34,636 | | $29,251 | | $16,814 | | $16,465 | | $3,658 |
Ratio of expenses to average net assets excluding fee waivers and reimbursements | | 1.26% | | 1.33% | | 1.46% | | 1.49%(f) | | N/A | | N/A |
Ratio of expenses to average net assets including fee waivers and reimbursements | | 1.15% | | 1.15% | | 1.15% | | 1.15%(f) | | 1.46% | | 1.40% |
Ratio of net investment income to average net assets | | 1.20% | | 1.08% | | 0.95% | | 0.77%(f) | | 1.17% | | 1.30% |
Portfolio turnover rate(g) | | 34% | | 46% | | 44% | | 11% | | 56% | | 83% |
|
| (a) | Prior to August 31, 2012, the ALPS | WMC Value Disciplined Fund was known as the ALPS | WMC Value Intersection Fund. |
| (b) | Prior to August 31, 2010, the ALPS | WMC Value Intersection Fund was known as the Activa Value Fund (as a result of the reorganization of Activa Mutual Funds Trust - Activa Value Fund into the Fund). |
| (c) | Effective March 9, 2010, the Board approved changing the fiscal year-end of the Fund from December 31 to April 30. |
| (d) | Calculated using the average shares method. |
| (e) | Total returns are for the period indicated and have not been annualized. Total returns would have been lower had certain expenses not been waived during the period. Returns shown do not reflect the deduction of taxes that a shareholder would pay on Fund distributions or the redemption of Fund shares. |
| (g) | Portfolio turnover rate for periods less than one full year have not been annualized. |
See Notes to Financial Statements.
| | |
| Clough China Fund | | |
| Management Commentary | | April 30, 2013 (Unaudited) |
During the fiscal year ended April 30, 2013, the Clough China Fund rose 16.54%, outperforming the MSCI China Index1, which increased 4.12% over the same period. The market went through two different phases during these twelve months. May to the beginning of September 2012 was a period of weakness and range trading when Chinese corporate earnings deteriorated and fell steadily while economic growth stabilized at a relatively lower level than usual. Gross Domestic Product (“GDP”) growth averaged 7.5% over the second and third quarters2. Equities then began a rally in September, mainly boosted by a recovery in earnings growth. Industrial companies’ profits rose in September for the first time in six months and with the pickup in activity, GDP growth accelerated to 7.9% in the fourth quarter2. From September onwards, the Fund widened the performance gap vs. the MSCI China by gaining over 25% compared to the 16.1% gain for benchmark index. The Fund’s outperformance was primarily due to two factors. First, the Fund’s composition is markedly different than the benchmark as we focus on the new market leaders benefiting from China’s new “private sector driven” growth model. Indeed, the Fund has approximately 50% of its exposure to privately-owned listed companies, as opposed to State-owned Enterprises (SOEs). SOES on the other hand represent more than 70% of the benchmark index weighting. The second factor is more stock specific and relates to the increased exposure of the Fund to mid-sized stocks involved in unconventional oil & gas and alternative energy sectors. Our exposure to this theme increased from 0.4% in September to 5% by the end of December. These stocks generated much higher returns than the benchmark index and we expect this trend to continue in the current year.
Portfolio Composition
Our holdings in the consumer discretionary, energy and consumer staples sectors had a positive influence on the Fund’s relative performance whereas the financial and telecoms sectors contributed negatively. Looking at individual positions, the three major positive contributors were:
| | » | Great Wall Motors is the largest SUV (sports utility vehicle) manufacturer in China. Great Wall saw growth accelerate as SUV demand surges in China. Revenue increased 43% in 2012 on the back of a 90% jump in SUV shipments. This mix shift and operating leverage also boosted profit margins and contributed to net profit growth of 66%. The success of the Haval model as the nation’s top selling SUV is continuing in 2013. Year-to-date sales through April 2013 increased 45%; again driven by the SUV segment which grew revenues more than 90% over the period. The company’s return on equity (ROE) is high at 33% and the company remains modestly valued in our opinion at just 11.2x expected earnings for the next fiscal year3. |
| | » | China State Construction International (CSCI) is one of the largest commercial construction firms in Hong Kong and Macau. CSCI now generates about half of its revenue from Mainland China, where they began expansion in 2008 and where they are now the largest builder of affordable housing. This is a well managed, fast growing group in our opinion. Revenue grew 21% and net profit 41% in 2012. The company reported that their new contract backlog |
| | | rose 90% in the first four months of 2013; bringing them to more than half of their bookings target for the year4. In our view this growth momentum is not fully reflected in the company’s valuation of just 14.4x expected earnings for next year. |
| | » | Shenzhou International Group is a leading independent garment maker for well known global and domestic sportswear brands such as Adidas (approximately 22% of sales), Nike (19%) and Puma (10%), as well as casual wear retailers such as the Japanese Uniqlo brand (24%). A capacity increase of 10 – 15% in China and Cambodia will drive earnings growth this year and we believe a special dividend payment is possible if cotton prices remain stable. The company’s balance sheet continues to be comfortable with a net cash position and valuation remains inexpensive in our view at just 12x expected earnings for the next fiscal year. |
The major detractors did not have a significant influence on the Fund’s overall performance. They were:
| | » | China Shenhua Energy is China’s largest coal producer was dragged down by falling coal prices and questions on the future of this industry as China chooses to limit pollution and to focus more on renewable and alternative energies. China Shenhua has made significant investments in its distribution network, which should help shield it from some of the pressures created by weak coal prices and help help future profitability. |
| | » | PetroChina Co. Ltd is involved in upstream and downstream oil and gas sectors. The Company had a disappointing year in 2012 when net profit fell 11%. First quarter 2013 operating performance were not much better with earnings declining 8% and the oil refining and chemical divisions still suffering operating losses5. This stock is no longer in the portfolio. |
| | » | China Resources Cement is one of the largest cement and clinker producers in Southern China. The company was hurt by weakening demand and selling prices while several regions maintained overcapacity. Profit margins deteriorated and net profit for last year declined -44% on sales which actually grew 9%. The lack of visibility in this cyclical business led us to eliminate this holding from the Fund. |
Outlook
The Chinese economy has entered a transition phase. It is not specifically and only related to the speed of its development and expansion. It implies a change in growth engines as well as an increased qualitative focus. GDP growth has decelerated from 9 – 10% per year in the last 5 years and to a more reasonable pace of 7% – 8% this year2. It may slow down even more over the next few years. A shift in growth engines from investment to consumption is already under way starting in 2011. In line with a policy trend already announced by the previous leadership in Beijing, President Xi Jin Ping recently said that the country will not sacrifice the environment to ensure temporary economic growth. This confirms
| | |
| Clough China Fund | | |
| Management Commentary | | April 30, 2013 (Unaudited) |
how the priorities of China’s economic policy are changing from “breakneck” growth at all cost to what appears to be a more sustainable, albeit slower growth pattern.
Global investors have grown frustrated by the lack of policy stimulus in China, especially in light of the unprecedented central bank activity in the G-7 economies6. We do not share their frustration however. First, we see the current growth of 7.7% in the recent first quarter as quite fast enough and reasonable, especially given that Chinese economy is now very large at $8.3 Trillion (nearly half the size of the United States economy)2. Second, we expect the new government to announce reforms that will bring stronger structural support to consumer spending such as gradually relaxing the urban residency permit system (known as Hukou). Third, growth engines such as the vibrant private sector are huge long-term opportunities in China, and are underestimated by international investors. Keep in mind the private sector in China has been the primary job creator for many years now. It represents 82% of urban employment today vs. 40% in 1994. Further, private enterprises now account for a larger proportion of industrial profits than SOEs and those profits are rising at a significantly faster rate7. As the Prime Minister Li Keqiang intends to make more room for market forces and reduce the direct role of the State in the economy, we expect the private sector and entrepreneurs to benefit in the future. Finally, given the dramatic deterioration of water and air quality in recent years and months the reaction has been to place a higher priority to environmental protection creating new and attractive investment opportunities for active managers.
We are happy with the Fund’s performance, especially in light of challenging market conditions. We benefit by not constraining ourselves by “benchmark considerations” when structuring our portfolio. This is an advantage over many of our peers. We believe many investors in China are overly focused on macro data and do not place enough focus on indentifying leading investment themes and individual companies.
Sources: Bloomberg, NBS, CLSA Sinology – Profits of Reforms, May 27, 2013.
| 1 | The Morgan Stanley Capital International (“MSCI”) China Index is designed to measure the performance of the top 85% of equity securities by market capitalization in the Chinese equity markets. The index is not actively managed and does not reflect any deduction for fees, expenses or taxes. An investor may not invest directly in an index. Source: MSCI. Neither MSCI nor any other party involved in or related to compiling, computing or creating the MSCI data makes any express or implied warranties or representations with respect to such data (or the result to be obtained by the use thereof), and all such parties hereby expressly disclaim all warranties of originality, accuracy, completeness, merchantability or fitness for a particular purpose with respect to any of such data. Without limiting any of the foregoing, in no event shall MSCI, any of its affiliates or any third party involved in or related to compiling, computing or creating the data have any liability for any direct, indirect, special, punitive, consequential or any other damages (including lost profits) even if notified of the possibility of such damages. No further distribution or | |
dissemination of the MSCI data is permitted without MSCI’s express written consent.
| 2 | National Bureau of Statics (NBS), January 12, 2013 |
| 3 | Great Wall Motors company report, March 21, 2013, May 21, 2013 |
| 4 | China State Construction International company report, May 13, 2013 |
| 5 | PetroChina Co. Ltd company report, April 25, 2013 |
| 6 | G-7 economies – A forum of the world’s seven most industrialized economies: the United States, the United Kingdom, France, Germany, Italy, Japan, and Canada. |
The views and information discussed in this commentary are as of the date of publication, are subject to change, and may not reflect the writer’s current views. The views expressed represent an assessment of market conditions at a specific point in time, are opinions only and should not be relied upon as investment advice regarding a particular investment or markets in general. Such information does not constitute a recommendation to buy or sell specific securities or investment vehicles. It should not be assumed that any investment will be profitable or will equal the performance of the fund(s) or any securities or any sectors mentioned herein. The subject matter contained herein has been derived from several sources believed to be reliable and accurate at the time of compilation. Clough Capital Partners, LP does not accept any liability for losses either direct or consequential caused by the use of this information.
| | |
| Clough China Fund | | |
| Performance Update | | April 30, 2013 (Unaudited) |
Performance of $10,000 Initial Investment (as of April 30, 2013)
Comparison of change in value of a $10,000 investment (includes maximum sales charges of 5.50%)
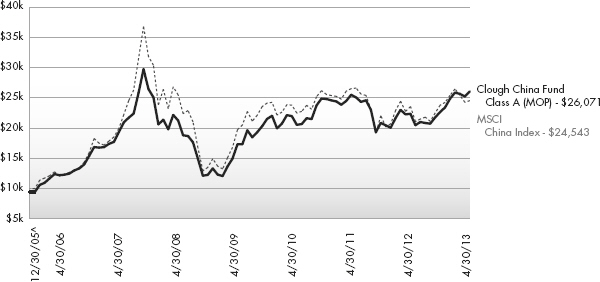
The chart above represents historical performance of a hypothetical investment of $10,000 in the Fund since inception. Past performance does not guarantee future results. This chart does not reflect the deduction of taxes that a shareholder would pay on Fund distributions or the redemption of Fund shares.
Average Annual Total Returns (as of April 30, 2013)
| | | | | | | | | | | | |
| | | 1 Year | | 3 Year | | 5 Year | | Since Inception ^ | | Total Expense
Ratio | | What You Pay * |
Class A (NAV)1 | | 16.54% | | 5.83% | | 3.28% | | 14.84% | | 2.09% | | 1.96% |
Class A (MOP)2 | | 10.15% | | 3.85% | | 2.12% | | 13.96% | | |
Class C (NAV)1 | | 15.70% | | 5.03% | | 2.47% | | 13.99% | | 2.89% | | 2.71% |
Class C (CDSC)2 | | 14.63% | | 5.03% | | 2.47% | | 13.99% | | |
Class I 3 | | 16.95% | | 6.16% | | 3.68% | | 15.36% | | 1.86% | | 1.71% |
MSCI China Index4 | | 4.12% | | 1.04% | | -1.76% | | 13.03% | | | | |
Performance data quoted represents past performance. Past performance does not guarantee future results. Investment return and principal value of an investment will fluctuate so that an investor’s shares, when sold or redeemed, may be worth more or less than the original cost. Current performance data may be higher or lower than actual data quoted. The Fund imposes a 2.00% redemption fee on shares held for less than 30 days. The Fund imposes a maximum Contingent Deferred Sales Charge (“CDSC”) of 1.00% on Class C shares redeemed within the first 12 months after a purchase, and on Class A shares redeemed within the first 12 months after a purchase in excess of $1 million. Performance data does not reflect the redemption fee or the CDSC, which if reflected would reduce the performance quoted. For the most current month-end performance data, please call 1-877-256-8445.
The performance shown for the Clough China Fund for periods prior to January 15, 2010, reflects the performance of the Old Mutual China Fund, a series of Old Mutual Funds I (as a result of a prior reorganization of the Old Mutual China Fund into the Clough China Fund).
| 1 | Net Asset Value (NAV) is the share price without sales charges. |
| 2 | Maximum Offering Price (MOP) includes sales charges. Class A returns include effects of the Fund’s maximum sales charge of 5.50%; Class C returns include the 1.00% CDSC. |
| 3 | Prior to close of business on January 15, 2010, Class I was known as Institutional Class of the Old Mutual China Fund. |
| 4 | The Morgan Stanley Capital International (“MSCI”) China Index is constructed according to the MSCI Global Investable Market Index (GIMI) family. The MSCI China Index is part of the MSCI Emerging Markets Index. The index is not actively managed and does not reflect any deduction for fees, expenses or taxes. An investor may not invest directly in an index. |
| ^ | Fund Inception date of December 30, 2005. |
| | |
| Clough China Fund | | |
| Performance Update | | April 30, 2013 (Unaudited) |
| * | What You Pay reflects the Advisor’s decision to contractually limit expenses through August 31, 2013. Please see the prospectus for additional information. |
The table does not reflect the deduction of taxes that a shareholder would pay on Fund distributions or the redemption of Fund shares.
There is no guarantee that the Fund will continue to hold any one particular security or stay invested in any one particular company. The composition of the Fund’s top holdings is subject to change. Performance figures are historical and reflect the change in share price, reinvested distributions, changes in net asset value, sales charges and capital gains distributions, if any.
Mutual funds are not insured or guaranteed by the FDIC or by any other government agency or government sponsored agency of the federal government or any state, not deposits, obligations or guaranteed by any bank or its affiliates and are subject to investment risks, including possible loss of the principal amount invested.
Investing in the Fund is subject to investment risks, including possible loss of the principal amount invested.
Investing in China, Hong Kong and Taiwan involves risk and considerations not present when investing in more established securities markets. The Fund may be more susceptible to the economic, market, political and local risks of these regions than a fund that is more geographically diversified.
This Fund is not suitable for all investors.
Top Ten Holdings (as a % of Net Assets) †
| | |
Industrial & Commercial Bank of China, Ltd., Class H | | 5.96% |
China Construction Bank Corp., Class H | | 5.17% |
China State Construction International Holdings, Ltd. | | 4.68% |
Shenzhou International Group Holdings, Ltd. | | 4.39% |
Great Wall Motor Co., Ltd., Class H | | 4.06% |
Tencent Holdings, Ltd. | | 3.52% |
Techtronic Industries Co. | | 3.13% |
China Petroleum & Chemical Corp.,
Class H | | 2.92% |
China Gas Holdings, Ltd. | | 2.87% |
VTech Holdings, Ltd. | | 2.49% |
Top Ten Holdings | | 39.19% |
| † | Holdings are subject to change. Table presents indicative values only. |
Industry Sector Allocation (as a % of Net Assets)
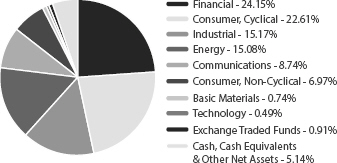
| | |
| Clough China Fund | | |
| Statement of Investments | | April 30, 2013 |
| | | | | | | | |
| | | Shares | | | Value (Note 2) | |
| |
COMMON STOCKS (93.95%) | | | | | |
Basic Materials (0.74%) | | | | | |
Iron/Steel (0.74%) | | | | | |
Angang Steel Co., Ltd., Class H(a) | | | 884,000 | | | $ | 522,748 | |
| | | | | | | | |
| |
TOTAL BASIC MATERIALS | | | | 522,748 | |
| | | | | | | | |
| |
Communications (8.74%) | | | | | |
Internet (3.52%) | | | | | |
Tencent Holdings, Ltd. | | | 72,400 | | | | 2,497,674 | |
| | | | | | | | |
| |
Telecommunications (5.22%) | | | | | |
China Communications Services Corp., Ltd., Class H | | | 826,000 | | | | 605,110 | |
China Telecom Corp., Ltd., Class H | | | 2,592,000 | | | | 1,328,029 | |
VTech Holdings, Ltd. | | | 138,400 | | | | 1,766,063 | |
| | | | | | | | |
| | | | | | | 3,699,202 | |
| | | | | | | | |
| |
TOTAL COMMUNICATIONS | | | | 6,196,876 | |
| | | | | | | | |
| |
Consumer, Cyclical (22.61%) | | | | | |
Airlines (1.78%) | | | | | |
Air China, Ltd., Class H | | | 1,560,000 | | | | 1,264,620 | |
| | | | | | | | |
| |
Apparel (4.40%) | | | | | |
Shenzhou International Group Holdings, Ltd. | | | 1,075,000 | | | | 3,116,673 | |
| | | | | | | | |
| |
Auto Manufacturers (5.08%) | | | | | |
Geely Automobile Holdings, Ltd. | | | 1,430,000 | | | | 720,842 | |
Great Wall Motor Co., Ltd., Class H | | | 663,500 | | | | 2,882,893 | |
| | | | | | | | |
| | | | | | | 3,603,735 | |
| | | | | | | | |
| |
Home Furnishings (2.23%) | | | | | |
Skyworth Digital Holdings, Ltd. | | | 1,916,477 | | | | 1,583,077 | |
| | | | | | | | |
| |
Lodging (1.89%) | | | | | |
Sands China, Ltd. | | | 254,400 | | | | 1,337,625 | |
| | | | | | | | |
| |
Retail (6.42%) | | | | | |
Belle International Holdings, Ltd. | | | 206,000 | | | | 336,776 | |
Giordano International, Ltd. | | | 836,000 | | | | 836,911 | |
Man Wah Holdings, Ltd. | | | 1,248,000 | | | | 1,215,601 | |
SA SA International Holdings, Ltd. | | | 1,192,000 | | | | 1,242,835 | |
Stelux Holdings International, Ltd. | | | 2,713,600 | | | | 920,977 | |
| | | | | | | | |
| | | | | | | 4,553,100 | |
| | | | | | | | |
| | | | | | | | |
| | | Shares | | | Value (Note 2) | |
| |
Textiles (0.81%) | | | | | |
Pacific Textile Holdings, Ltd. | | | 467,000 | | | $ | 577,013 | |
| | | | | | | | |
| |
TOTAL CONSUMER, CYCLICAL | | | | 16,035,843 | |
| | | | | | | | |
| |
Consumer, Non-Cyclical (6.97%) | | | | | |
Cosmetics/Personal Care (0.78%) | | | | | |
Prince Frog International Holdings, Ltd. | | | 889,000 | | | | 556,542 | |
| | | | | | | | |
| |
Food (1.06%) | | | | | |
Want Want China Holdings, Ltd. | | | 472,000 | | | | 749,822 | |
| | | | | | | | |
| |
Healthcare-Products (1.89%) | | | | | |
China Medical System Holdings, Ltd. | | | 723,000 | | | | 710,996 | |
Hengan International Group Co., Ltd. | | | 60,500 | | | | 626,286 | |
| | | | | | | | |
| | | | | | | 1,337,282 | |
| | | | | | | | |
| |
Household Products/Wares (3.24%) | | | | | |
Biostime International Holdings, Ltd. | | | 301,000 | | | | 1,736,828 | |
Samsonite International SA | | | 227,400 | | | | 560,821 | |
| | | | | | | | |
| | | | | | | 2,297,649 | |
| | | | | | | | |
| |
TOTAL CONSUMER, NON-CYCLICAL | | | | 4,941,295 | |
| | | | | | | | |
| |
Energy (15.08%) | | | | | |
| |
Coal (1.20%) | | | | | |
China Shenhua Energy Co., Ltd., Class H | | | 240,000 | | | | 851,007 | |
| | | | | | | | |
| |
Energy-Alternate Sources (1.53%) | | | | | |
China Suntien Green Energy Corp., Ltd., Class H | | | 3,739,000 | | | | 1,085,239 | |
| | | | | | | | |
| |
Oil & Gas (4.90%) | | | | | |
China Petroleum & Chemical Corp., Class H | | | 1,877,000 | | | | 2,071,391 | |
PetroChina Co., Ltd., Class H | | | 1,102,000 | | | | 1,404,641 | |
| | | | | | | | |
| | | | | | | 3,476,032 | |
| | | | | | | | |
| |
Oil & Gas Services (4.58%) | | | | | |
Anton Oilfield Services Group | | | 2,204,000 | | | | 1,764,222 | |
CIMC Enric Holdings, Ltd. | | | 428,000 | | | | 464,233 | |
Hilong Holding, Ltd. | | | 1,413,000 | | | | 578,980 | |
SPT Energy Group, Inc. | | | 902,000 | | | | 440,924 | |
| | | | | | | | |
| | | | | | | 3,248,359 | |
| | | | | | | | |
| | |
| Clough China Fund | | |
| Statement of Investments | | April 30, 2013 |
| | | | | | | | |
| | | Shares | | | Value (Note 2) | |
| |
Pipelines (2.87%) | | | | | |
China Gas Holdings, Ltd. | | | 2,066,000 | | | $ | 2,038,745 | |
| | | | | | | | |
| |
TOTAL ENERGY | | | | 10,699,382 | |
| | | | | | | | |
| |
Financial (24.15%) | | | | | |
Banks (13.33%) | | | | | |
Bank of China, Ltd., Class H | | | 3,316,300 | | | | 1,553,800 | |
China Construction Bank Corp., Class H | | | 4,373,080 | | | | 3,670,372 | |
Industrial & Commercial Bank of China, Ltd., Class H | | | 5,998,967 | | | | 4,228,704 | |
| | | | | | | | |
| | | | | | | 9,452,876 | |
| | | | | | | | |
| |
Insurance (4.78%) | | | | | |
AIA Group, Ltd. | | | 156,800 | | | | 697,518 | |
China Life Insurance Co., Ltd., Class H | | | 605,000 | | | | 1,673,420 | |
Ping An Insurance Group Co. of China, Ltd., Class H | | | 129,000 | | | | 1,023,859 | |
| | | | | | | | |
| | | | | | | 3,394,797 | |
| | | | | | | | |
| |
Real Estate (6.04%) | | | | | |
CapitaMalls Asia, Ltd. | | | 647,000 | | | | 1,106,248 | |
China Merchants Property Development Co., Ltd. | | | 151,700 | | | | 469,777 | |
China Overseas Grand Oceans Group, Ltd. | | | 202,000 | | | | 318,420 | |
China Overseas Land & Investment, Ltd. | | | 234,000 | | | | 714,463 | |
Kaisa Group Holdings,
Ltd.(a) | | | 1,381,000 | | | | 432,955 | |
Shimao Property Holdings, Ltd. | | | 260,500 | | | | 562,203 | |
Sun Hung Kai Properties, Ltd. | | | 47,000 | | | | 679,624 | |
| | | | | | | | |
| | | | | | | 4,283,690 | |
| | | | | | | | |
| |
TOTAL FINANCIAL | | | | 17,131,363 | |
| | | | | | | | |
| |
Industrial (15.17%) | | | | | |
Building Materials (3.38%) | | | | | |
Anhui Conch Cement Co., Ltd., Class H | | | 204,500 | | | | 742,449 | |
Far East Global Group, Ltd.(a) | | | 5,048,000 | | | | 1,653,960 | |
| | | | | | | | |
| | | | | | | 2,396,409 | |
| | | | | | | | |
| |
Engineering & Construction (4.68%) | | | | | |
China State Construction International Holdings, Ltd. | | | 2,276,000 | | | | 3,320,558 | |
| | | | | | | | |
| |
Environmental Control (0.68%) | | | | | |
China Everbright International, Ltd. | | | 618,000 | | | | 478,418 | |
| | | | | | | | |
| | | | | | | | |
| | | Shares | | | Value (Note 2) | |
| |
Hand/Machine Tools (3.13%) | | | | | |
Techtronic Industries Co. | | | 927,500 | | | $ | 2,222,674 | |
| | | | | | | | |
| |
Machinery-Diversified (1.85%) | | | | | |
Honghua Group, Ltd. | | | 2,685,000 | | | | 1,312,426 | |
| | | | | | | | |
| |
Miscellaneous Manufacturing (0.92%) | | | | | |
Sunny Optical Technology Group Co., Ltd. | | | 490,000 | | | | 650,211 | |
| | | | | | | | |
| |
Packaging & Containers (0.53%) | | | | | |
CPMC Holdings, Ltd. | | | 481,000 | | | | 378,661 | |
| | | | | | | | |
| |
TOTAL INDUSTRIAL | | | | 10,759,357 | |
| | | | | | | | |
| |
Technology (0.49%) | | | | | |
Software (0.49%) | | | | | |
Kingsoft Corp., Ltd. | | | 305,000 | | | | 351,540 | |
| | | | | | | | |
| |
TOTAL TECHNOLOGY | | | | 351,540 | |
| | | | | | | | |
| |
TOTAL COMMON STOCKS (Cost $52,781,558) | | | | 66,638,404 | |
| | | | | | | | |
| |
EXCHANGE TRADED FUNDS (0.91%) | | | | | |
Equity Fund (0.91%) | | | | | | | | |
iShares® FTSE A50 China Index ETF | | | 485,100 | | | | 642,620 | |
| | | | | | | | |
| |
TOTAL EXCHANGE TRADED FUNDS (Cost $652,440) | | | | 642,620 | |
| | | | | | | | |
| | | | | | | | | | | | |
| | | 7-Day Yield | | | Shares | | | Value (Note 2) | |
| |
SHORT TERM INVESTMENTS (3.80%) | | | | | |
Money Market Fund (3.80%) | | | | | |
Dreyfus Cash Management Fund, Institutional Class | | | 0.050 | % | | | 2,697,470 | | | | 2,697,470 | |
| | | | | | | | | | | | |
| |
TOTAL SHORT TERM INVESTMENTS (Cost $2,697,470) | | | | 2,697,470 | |
| | | | | | | | | | | | |
| |
TOTAL INVESTMENTS (98.66%) (Cost $56,131,468) | | | $ | 69,978,494 | |
| |
Other Assets In Excess Of Liabilities (1.34%) | | | | 952,625 | |
| | | | | | | | | | | | |
| |
NET ASSETS (100.00%) | | | $ | 70,931,119 | |
| | | | | | | | | | | | |
| | |
| Clough China Fund | | |
| Statement of Investments | | April 30, 2013 |
| (a) | Non-Income Producing Security. |
Common Abbreviations:
ETF - Exchange Traded Fund.
FTSE - Financial Times Stock Exchange.
Ltd. - Limited.
SA - Generally designated corporations in various countries,
mostly those employing civil law.
For Fund compliance purposes, the Fund’s industry classifications refer to any one or more of the industry sub-classifications used by one or more widely recognized market indexes or ratings group indexes, and/or as defined by Fund management. This definition may not apply for purposes of this report, which may combine industry sub-classifications for reporting ease. Industries are shown as a percent of net assets.
See Notes to Financial Statements.
| | |
| Clough China Fund | | |
| Statement of Assets and Liabilities | | April 30, 2013 |
| | | | |
ASSETS | | | | |
Investments, at value | | $ | 69,978,494 | |
Foreign currency, at value (Cost $1,076,753) | | | 1,077,443 | |
Receivable for investments sold | | | 851,756 | |
Receivable for shares sold | | | 115,270 | |
Dividends receivable | | | 13,583 | |
Prepaid expenses and other assets | | | 17,251 | |
| |
Total Assets | | | 72,053,797 | |
| |
LIABILITIES | | | | |
Payable for investments purchased | | | 921,892 | |
Payable for shares redeemed | | | 25,511 | |
Payable due to custodian - overdraft | | | 75 | |
Investment advisory fees payable | | | 45,215 | |
Administration and transfer agency fees payable | | | 15,890 | |
Distribution and services fees payable | | | 16,071 | |
Trustees’ fees and expenses payable | | | 2,034 | |
Legal fees payable | | | 350 | |
Audit and tax fees payable | | | 23,775 | |
Accrued expenses and other liabilities | | | 71,865 | |
| |
Total Liabilities | | | 1,122,678 | |
| |
NET ASSETS | | $ | 70,931,119 | |
| |
| |
NET ASSETS CONSIST OF | | | | |
Paid-in capital | | $ | 60,861,468 | |
Accumulated net investment income | | | 336,688 | |
Accumulated net realized loss on investments and foreign currency transactions | | | (4,114,691) | |
Net unrealized appreciation on investments and translation of assets and liabilities denominated in foreign currencies | | | 13,847,654 | |
| |
NET ASSETS | | $ | 70,931,119 | |
| |
| |
INVESTMENTS, AT COST | | $ | 56,131,468 | |
| |
| |
PRICING OF SHARES | | | | |
Class A: | | | | |
Net Asset Value, offering and redemption price per share(a) | | $ | 21.45 | |
Net Assets | | $ | 32,708,735 | |
Shares of beneficial interest outstanding (unlimited number of shares, no par value common stock authorized) | | | 1,524,997 | |
Maximum offering price per share ((NAV/0.9450), based on maximum sales charge of 5.50% of the offering price) | | $ | 22.70 | |
Class C: | | | | |
Net Asset Value, offering and redemption price per share(a) | | $ | 20.71 | |
Net Assets | | $ | 12,250,535 | |
Shares of beneficial interest outstanding (unlimited number of shares, no par value common stock authorized) | | | 591,554 | |
Class I: | | | | |
Net Asset Value, offering and redemption price per share | | $ | 21.82 | |
Net Assets | | $ | 25,971,849 | |
Shares of beneficial interest outstanding (unlimited number of shares, no par value common stock authorized) | | | 1,190,070 | |
| (a) | Redemption price per share may be reduced for any applicable contingent deferred sales charge. For a description of a possible sales charge, please see the Fund’s Prospectus. |
See Notes to Financial Statements.
| | |
| Clough China Fund | | |
| Statement of Operations | | For the Year Ended April 30, 2013 |
| | | | |
INVESTMENT INCOME | | | | |
Dividends | | $ | 1,745,803 | |
Foreign taxes withheld on dividends | | | (79,762) | |
| |
Total Investment Income | | | 1,666,041 | |
| |
| |
EXPENSES | | | | |
Investment advisory fees | | | 863,550 | |
Administrative and transfer agency fees | | | 117,986 | |
Distribution and service fees | | | | |
Class A | | | 72,241 | |
Class C | | | 104,805 | |
Legal fees | | | 3,249 | |
Audit and tax fees | | | 21,130 | |
Networking fees | | | | |
Class A | | | 11,356 | |
Class C | | | 8,772 | |
Class I | | | 26,642 | |
Reports to shareholders and printing fees | | | 17,852 | |
State registration fees | | | 39,675 | |
Insurance fees | | | 3,017 | |
Custody fees | | | 93,451 | |
Trustees’ fees and expenses | | | 4,322 | |
Miscellaneous expenses | | | 15,938 | |
| |
Total Expense | | | 1,403,986 | |
Less fees waived/reimbursed by investment advisor (Note 7) | | | | |
Class A | | | (56,397) | |
Class C | | | (25,059) | |
Class I | | | (58,050) | |
| |
Net Expenses | | | 1,264,480 | |
| |
Net Investment Income | | | 401,561 | |
| |
Net realized gain on investments | | | 1,143,130 | |
Net realized gain on foreign currency transactions | | | 8,308 | |
Net change in unrealized appreciation on investments | | | 5,526,441 | |
Net change in unrealized depreciation on translation of assets and liabilities denominated in foreign currencies | | | (4,927) | |
| |
NET REALIZED AND UNREALIZED GAIN ON INVESTMENTS | | | 6,672,952 | |
| |
NET INCREASE IN NET ASSETS RESULTING FROM OPERATIONS | | $ | 7,074,513 | |
| |
| |
See Notes to Financial Statements.
| | |
| Clough China Fund | | |
| Statements of Changes in Net Assets | | |
| | | | | | | | |
| | | For the Year Ended April 30, 2013 | | | For the Year Ended April 30, 2012 | |
| |
OPERATIONS | | | | | | | | |
Net investment income | | $ | 401,561 | | | $ | 71,792 | |
Net realized gain/(loss) on investments and foreign currency transactions | | | 1,151,438 | | | | (4,673,323) | |
Net change in unrealized appreciation/(depreciation) on investments and translation of assets and liabilities denominated in foreign currencies | | | 5,521,514 | | | | (8,731,689) | |
| |
Net Increase/(Decrease) in Net Assets Resulting from Operations | | | 7,074,513 | | | | (13,333,220) | |
| |
| | |
DISTRIBUTIONS | | | | | | | | |
Dividends to shareholders from net investment income | | | | | | | | |
Class A | | | (38,487) | | | | – | |
Class I | | | (61,529) | | | | – | |
| |
Net Decrease in Net Assets from Distributions | | | (100,016) | | | | – | |
| |
| | |
BENEFICIAL INTEREST TRANSACTIONS (NOTE 6) | | | | | | | | |
Shares sold | | | | | | | | |
Class A | | | 8,119,247 | | | | 3,954,505 | |
Class C | | | 2,575,377 | | | | 2,225,325 | |
Class I | | | 41,213,968 | | | | 3,554,515 | |
Dividends reinvested | | | | | | | | |
Class A | | | 25,075 | | | | – | |
Class I | | | 18,451 | | | | – | |
Shares redeemed | | | | | | | | |
Class A | | | (10,136,711) | | | | (12,417,845) | |
Class C | | | (3,351,866) | | | | (5,066,931) | |
Class I | | | (45,590,967) | | | | (10,349,896) | |
| |
Net Decrease in Net Assets Derived from Beneficial Interest Transactions | | | (7,127,426) | | | | (18,100,327) | |
| |
| | |
Net decrease in net assets | | | (152,929) | | | | (31,433,547) | |
| | |
NET ASSETS | | | | | | | | |
Beginning of year | | | 71,084,048 | | | | 102,517,595 | |
| |
End of year * | | $ | 70,931,119 | | | $ | 71,084,048 | |
| |
| |
*Including accumulated net investment income/(loss) of: | | $ | 336,688 | | | $ | (40,554) | |
See Notes to Financial Statements.
| | |
| Clough China Fund – Class A |
| Financial Highlights | | Selected data for a share of beneficial interest outstanding throughout the periods indicated: |
| | | | | | | | | | | | |
| | | For the Year Ended
April 30, 2013 | | For the Year
Ended
April 30, 2012 | | For the Year
Ended
April 30, 2011 | | For the Period
August 1, 2009 to April 30, 2010(a)(b) | | For the Year
Ended
July 31, 2009 | | For the Year
Ended
July 31, 2008 |
|
Net asset value, beginning of period | | $18.43 | | $21.02 | | $18.21 | | $16.32 | | $15.81 | | $22.46 |
| | | | |
INCOME/(LOSS) FROM INVESTMENT OPERATIONS: | | | | | | | | |
Net investment income/(loss) | | 0.15(c) | | 0.02(c) | | (0.04)(c) | | 0.10 | | 0.09(c) | | (0.01)(c) |
Net realized and unrealized gain/(loss) | | 2.90 | | (2.61) | | 2.94 | | 1.85 | | 0.62(d) | | (1.73) |
|
Total from investment operations | | 3.05 | | (2.59) | | 2.90 | | 1.95 | | 0.71 | | (1.74) |
|
| | | | | | |
DISTRIBUTIONS: | | | | | | | | | | | | |
From net investment income | | (0.03) | | – | | (0.09) | | (0.07) | | (0.20) | | (0.03) |
From net realized gains | | – | | – | | – | | – | | – | | (4.88) |
|
Total distributions | | (0.03) | | – | | (0.09) | | (0.07) | | (0.20) | | (4.91) |
|
| | | | | | |
REDEMPTION FEES ADDED TO PAID-IN CAPITAL (NOTE 6) | | 0.00(e) | | 0.00(e) | | 0.00(c)(e) | | 0.01 | | 0.00(c)(e) | | – |
|
Net increase/(decrease) in net asset value | | 3.02 | | (2.59) | | 2.81 | | 1.89 | | 0.51 | | (6.65) |
|
Net asset value, end of year | | $21.45 | | $18.43 | | $21.02 | | $18.21 | | $16.32 | | $15.81 |
|
TOTAL RETURN(f) | | 16.54% | | (12.32)% | | 16.00% | | 12.07% | | 5.00%(d) | | (13.91)% |
| | | | | | |
RATIOS/SUPPLEMENTAL DATA: | | | | | | | | | | | | |
Net assets, end of year (000s) | | $32,709 | | $30,542 | | $44,616 | | $28,695 | | $15,069 | | $17,927 |
Ratio of expenses to average net assets excluding fee waivers and reimbursements | | 2.14% | | 2.08% | | 2.07% | | 2.24%(g) | | 2.62% | | 2.34% |
Ratio of expenses to average net assets including fee waivers and reimbursements | | 1.95% | | 1.95% | | 1.89%(h) | | 1.87%(g)(i) | | 1.95% | | 2.02% |
Ratio of net investment income/ (loss) to average net assets | | 0.78% | | 0.13% | | (0.22)% | | (0.53)%(g) | | 0.70% | | (0.06)% |
Portfolio turnover rate(j) | | 221% | | 174% | | 170% | | 110% | | 120% | | 178% |
|
| (a) | Effective March 9, 2010, the Board approved changing the fiscal year-end of the Fund from July 31 to April 30. |
| (b) | Prior to its reorganization on January 15, 2010, the Clough China Fund, the Fund was known as the Old Mutual China Fund. |
| (c) | Calculated using the average shares method. |
| (d) | Impact of payment by affiliate was less than $0.01 per share and 0.01%, respectively. |
| (e) | Less than $0.005 per share. |
| (f) | Total returns are for the period indicated and have not been annualized. Total returns would have been lower had certain expenses not been waived during the period. Returns shown do not reflect the deduction of taxes that a shareholder would pay on Fund distributions or the redemption of Fund shares. Returns shown exclude any applicable sales charges. |
| (h) | Contractual expense limitation changed from 1.85% to 1.95% effective January 1, 2011. |
| (i) | Contractual expense limitation changed from 1.95% to 1.85% effective January 1, 2010. |
| (j) | Portfolio turnover rate for periods less than one full year have not been annualized. |
See Notes to Financial Statements.
| | |
| Clough China Fund – Class C |
| Financial Highlights | | Selected data for a share of beneficial interest outstanding throughout the periods indicated: |
| | | | | | | | | | | | |
| | | For the Year
Ended
April 30, 2013 | | For the Year
Ended
April 30, 2012 | | For the Year
Ended
April 30, 2011 | | For the Period
August 1, 2009 to
April 30, 2010(a)(b) | | For the Year
Ended
July 31, 2009 | | For the Year
Ended
July 31, 2008 |
|
Net asset value, beginning of period | | $17.90 | | $20.58 | | $17.89 | | $16.08 | | $15.48 | | $22.26 |
| | | | |
INCOME/(LOSS) FROM INVESTMENT OPERATIONS: | | | | | | | | |
Net investment income/(loss) | | 0.01(c) | | (0.11)(c) | | (0.21)(c) | | (0.17) | | (0.01)(c) | | (0.17)(c) |
Net realized and unrealized gain/(loss) | | 2.80 | | (2.57) | | 2.90 | | 1.98 | | 0.65(d) | | (1.64) |
|
Total from investment operations | | 2.81 | | (2.68) | | 2.69 | | 1.81 | | 0.64 | | (1.81) |
|
| | | | | | |
DISTRIBUTIONS: | | | | | | | | | | | | |
From net investment income | | – | | – | | (0.00)(e) | | – | | (0.04) | | (0.09) |
From net realized gains | | – | | – | | – | | – | | – | | (4.88) |
|
Total distributions | | – | | – | | – | | – | | (0.04) | | (4.97) |
|
| | | | | | |
REDEMPTION FEES ADDED TO PAID-IN CAPITAL (NOTE 6) | | 0.00(e) | | 0.00(e) | | 0.00(e) | | – | | – | | – |
|
Net increase/(decrease) in net asset value | | 2.81 | | (2.68) | | 2.69 | | 1.81 | | 0.60 | | (6.78) |
|
Net asset value, end of year | | $20.71 | | $17.90 | | $20.58 | | $17.89 | | $16.08 | | $15.48 |
|
TOTAL RETURN(f) | | 15.70% | | (13.02)% | | 15.13% | | 11.26% | | 4.21%(d) | | (14.49)% |
| | | | | |
RATIOS/SUPPLEMENTAL DATA: | | | | | | | | | | |
Net assets, end of year (000s) | | $12,251 | | $11,674 | | $16,848 | | $7,594 | | $8,267 | | $9,991 |
Ratio of expenses to average net assets excluding fee waivers and reimbursements | | 2.94% | | 2.88% | | 2.86% | | 3.18%(g) | | 3.43% | | 3.15% |
Ratio of expenses to average net assets including fee waivers and reimbursements | | 2.70% | | 2.70% | | 2.70% | | 2.70%(g) | | 2.70% | | 2.77% |
Ratio of net investment income/ (loss) to average net assets | | 0.07% | | (0.62)% | | (1.10)% | | (1.26)%(g) | | (0.05)% | | (0.85)% |
Portfolio turnover
rate(h) | | 221% | | 174% | | 170% | | 110% | | 120% | | 178% |
|
| (a) | Effective March 9, 2010, the Board approved changing the fiscal year-end of the Fund from July 31 to April 30. |
| (b) | Prior to its reorganization on January 15, 2010, the Clough China Fund, the Fund was known as the Old Mutual China Fund. |
| (c) | Calculated using the average shares method. |
| (d) | Impact of payment by affiliate was less than $0.01 per share and 0.01%, respectively. |
| (e) | Less than $0.005 and ($0.005) per share. |
| (f) | Total returns are for the period indicated and have not been annualized. Total returns would have been lower had certain expenses not been waived during the period. Returns shown do not reflect the deduction of taxes that a shareholder would pay on Fund distributions or the redemption of Fund shares. Returns shown exclude any applicable sales charges. |
| (h) | Portfolio turnover rate for periods less than one full year have not been annualized. |
See Notes to Financial Statements.
| | |
| Clough China Fund – Class I |
| Financial Highlights | | Selected data for a share of beneficial interest outstanding throughout the periods indicated: |
| | | | | | | | | | | | |
| | | For the Year
Ended
April 30, 2013 | | For the Year
Ended
April 30, 2012 | | For the Year
Ended
April 30, 2011 | | For the Period
August 1, 2009 to
April 30, 2010(a)(b) | | For the Year
Ended
July 31, 2009 | | For the Year
Ended
July 31, 2008 |
|
Net asset value, beginning of period | | $18.71 | | $21.30 | | $18.41 | | $16.52 | | $16.10 | | $22.65 |
| | | | |
INCOME/(LOSS) FROM INVESTMENT OPERATIONS: | | | | | | | | |
Net investment income/(loss) | | 0.13(c) | | 0.06(c) | | (0.01)(c) | | 0.01 | | 0.15(c) | | 0.13(c) |
Net realized and unrealized gain/(loss) | | 3.02 | | (2.65) | | 3.03 | | 2.03 | | 0.60(d) | | (1.80) |
|
Total from investment operations | | 3.15 | | (2.59) | | 3.02 | | 2.04 | | 0.75 | | (1.67) |
|
| | | | | | |
DISTRIBUTIONS: | | | | | | | | | | | | |
From net investment income | | (0.06) | | – | | (0.13) | | (0.15) | | (0.33) | | – |
From net realized gains | | – | | – | | – | | – | | – | | (4.88) |
|
Total distributions | | (0.06) | | – | | (0.13) | | (0.15) | | (0.33) | | (4.88) |
|
| | | | | | |
REDEMPTION FEES ADDED TO PAID-IN CAPITAL (NOTE 6) | | 0.02 | | 0.00(e) | | 0.00(e) | | – | | – | | – |
|
Net increase/(decrease) in net asset value | | 3.11 | | (2.59) | | 2.89 | | 1.89 | | 0.42 | | (6.55) |
|
Net asset value, end of year | | $21.82 | | $18.71 | | $21.30 | | $18.41 | | $16.52 | | $16.10 |
|
TOTAL RETURN(f) | | 16.95% | | (12.16)% | | 16.45% | | 12.36% | | 5.51%(d) | | (13.41)% |
| | | | | |
RATIOS/SUPPLEMENTAL DATA: | | | | | | | | | | |
Net assets, end of year (000s) | | $25,972 | | $28,868 | | $41,054 | | $15,071 | | $9,744 | | $9,231 |
Ratio of expenses to average net assets excluding fee waivers and reimbursements | | 1.94% | | 1.85% | | 1.85% | | 1.86%(g) | | 1.97% | | 1.76% |
Ratio of expenses to average net assets including fee waivers and reimbursements | | 1.70% | | 1.70% | | 1.53%(h) | | 1.40%(g) | | 1.40% | | 1.47% |
Ratio of net investment income/ (loss) to average net assets | | 0.69% | | 0.33% | | (0.03)% | | 0.08%(g) | | 1.20% | | 0.62% |
Portfolio turnover
rate(i) | | 221% | | 174% | | 170% | | 110% | | 120% | | 178% |
|
| (a) | Effective March 9, 2010, the Board approved changing the fiscal year-end of the Fund from July 31 to April 30. |
| (b) | Prior to its reorganization on January 15, 2010, the Clough China Fund, the Fund was known as the Old Mutual China Fund and Class I was known as the Institutional Class. |
| (c) | Calculated using the average shares method. |
| (d) | Impact of payment by affiliate was less than $0.01 per share and 0.01%, respectively. |
| (e) | Less than $0.005 per share. |
| (f) | Total returns are for the period indicated and have not been annualized. Total returns would have been lower had certain expenses not been waived during the period. Returns shown do not reflect the deduction of taxes that a shareholder would pay on Fund distributions or the redemption of Fund shares. |
| (h) | Contractual expense limitation changed from 1.40% to 1.70% effective January 1, 2011. |
| (i) | Portfolio turnover rate for periods less than one full year have not been annualized. |
See Notes to Financial Statements.
| | |
| RiverFront Global Allocation Series |
| Management Commentary | | April 30, 2013 (Unaudited) |
Year in Review
When charged with the task of summarizing twelve months of global market activity, the natural tendency is to try to seize on one theme that ties everything together in a neat package. In looking back through the regular RiverFront commentaries, recurring topics included “policy purgatory,” quantitative easing, fiscal cliff, loss of purchasing power, improving economic growth, risk on/risk off – and all those were just in reference to what investors needed to consider when analyzing US markets. Consider those same types of issues duplicated across global economies and markets, often in greater magnitude, and it is no wonder investors may feel as though it has been one big blur. Mercifully, some of the anxiety of that blur has been lessened by the reality of the market’s rise to new highs. Resolutions for many of the issues facing governments, corporations and consumers may not have been as positive as forecasters hoped. However, history has shown that “less bad,” as it relates to economic growth and corporate profits, coupled with attractive valuations can be enough. Fears of the markets dropping have been replaced by anxiety about the next correction – when will it come and how much will the market drop?
Monetary support from virtually every major central bank helped fuel powerful rallies in global equity and credit markets over the past twelve months, but we believe there is no reason for investors to panic at this juncture and that we will likely see what is considered a “normal” pullback. The S&P 500® climbed almost without interruption from a low of 1353 last November to 1593 on April 11, 2013. Since that peak, economic data has softened, and markets have dropped slightly, prompting fears of market declines similar to the volatile summers of 2010 and 2011.
After rising at a 40% annualized pace for nearly six months, we think equity markets are due for a pullback and/or period of consolidation. We believe that the deep and protracted market declines of 2010 and 2011 are extremely unlikely. Rather, we expect any pullback will be short and relatively shallow, with a worst-case scenario resembling the brief 10% decline seen in 2012 (see chart below). Since that 2012 market correction, the Federal Reserve has committed to printing $85 billion per month; the Bank of Japan (BOJ) has committed to twice that level of Quantitative Easing (QE) as a percentage of its economy; and the European Central Bank (ECB) has pledged unlimited support for Italy and Spain. All this liquidity flooding into financial markets should limit the depth and duration of any pullback, in our view. Thus referring back to the S&P®, investors may experience only a minimal correction to about 1530 (which was almost hit on April 18th). The next level of strong support is at 1500, and we would expect a worst-case correction to find support at about 1470.

Source: RiverFront Investment Group; Past performance is no guarantee of future results.
We believe that the “Optimistic Scenario” from our 2013 Outlook is playing out in the US (see circled scenario in table below), although the political maneuvering leading to that outcome is different than we expected. As a result, we think the S&P 500® is likely to finish the year well above 1600 and could approach our fair value level of about 1700. Overseas, Japan is also executing an Optimistic Scenario set of policies that should allow it to continue posting the best returns of all the major global equity markets. Europe has thus far embraced “Muddling Through” policies, with the initial bailout proposal for Cyprus raising concerns that it could make the kind of policy mistakes outlined in our “Pessimistic Scenario.” Despite this start to the year, more recent policy developments in Europe are encouraging, and we expect these policies plus a more aggressive ECB to help European markets catch up to the US by the end of 2013. Finally, emerging markets rise and fall based upon China, in our view, and the new Chinese leadership team has thus far embraced the policy options in our Pessimistic Scenario. With investor sentiment for emerging markets now overwhelmingly negative, any positive policy developments should prompt a market recovery. Unless new Chinese policies diverge sharply from existing trends, we will likely use any rebound in emerging markets as an opportunity to further underweight our strategic targets.
| | |
| RiverFront Global Allocation Series |
| Management Commentary | | April 30, 2013 (Unaudited) |
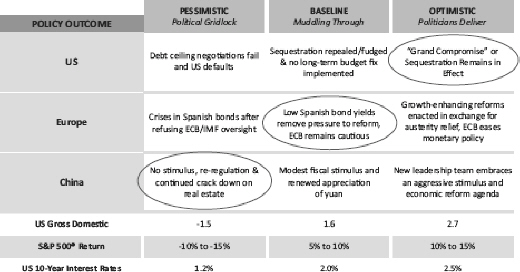
Source: RiverFront Investment Group; This table links our pessimistic, baseline, and optimistic scenarios with the major political issues faced by the US, Europe and China that will have the greatest impact on the global economy in 2013, in our view. Our assessment of each scenario’s probability is also shown. Each scenario includes our expectations for GDP, stocks and interest rates. We assume that China’s policy decisions will drive outcomes across all the emerging markets. RiverFront’s opinions are subject to change and actual events may reflect some combination of the scenarios referenced in the table.
We continue to be less optimistic on fixed income. In September 1981, at the end of a 30-year bear market for bonds, 10-year Treasury yields were 15.3% and the S&P 500® was at 118 with a 5.5% dividend yield. The chart shows relative total return – stocks are outperforming when the line is rising. Despite a positive environment for bonds since their bear market trough, during which 10-year Treasury yields fell below 2%, the S&P 500® has delivered roughly 70% more total return, but volatility has been significant. Indeed, the two stock bear markets of 2000 to 2003 and 2007 to 2009 wiped out all of the significant relative gains from the 1990s by the bottom in early 2009. We believe stocks have begun a sustainable trend of outperformance supported by low bond yields and reasonable stock valuations.
Performance Discussion
Any discussion of the performance of the RiverFront funds over the past year must include a snapshot of the variance in performance of the various asset classes that constitute the investable universe for each. All of the funds, regardless of investment time horizon, are globally allocated. Our Price Matters® framework prescribes the parameters for the various asset classes – domestic equity, developed international and emerging markets – as we work through the RiverFront Capital Market Assumptions annually. In addition to being globally allocated, four of the funds have a fixed income component. Bond investors are well aware that there was a significant disparity between performance in the equity and fixed income markets over the past twelve months.
As of April 30, 2013, the performance results for the indices representing RiverFront’s investable asset classes were as follows:
| | |
Benchmark Indexes2 | | 1-YR Return |
S&P 500® Total Return1 | | 16.89% |
S&P 1000® Total Return3 | | 18.38% |
MSCI EAFE Index (Net)4 | | 19.39% |
MSCI Emerging Markets Index (Net)5 | | 3.97% |
MSCI All Country World Index (Net)6 | | 15.02% |
Barclays U.S. Aggregate Bond Index7 | | 3.68% |
Barclays U.S. Treasury Index8 | | 2.56% |
Barclays U.S. Short Treasury Index
(1-3M)9 | | 0.09% |
Data as of 4/30/2013
The managers are charged with constructing the strategies based on the following mandates:
RiverFront Growth Funds – investment time horizons range from 7-10 years.
Using RiverFront’s proprietary portfolio optimization process, these funds are built using longer time horizons and thus investors should be willing to expect more volatility.
| | » | The RiverFront Global Growth strategy is invested based on a 100% allocation to the MSCI All Country World Index Net. |
| | |
| RiverFront Global Allocation Series |
| Management Commentary | | April 30, 2013 (Unaudited) |
| | » | The RiverFront Global Allocation strategy is invested according to a blend of 80% MSCI All Country World Index Net/20% Barclays U.S. Aggregate Bond Index. |
| | » | The RiverFront Dynamic Equity Income strategy is invested according to a blend of 70% MSCI All Country World Index Net/30% Barclays U.S. Aggregate Bond Index. |
RiverFront Balanced Funds – investment time horizons range from 3-7 years.
| | » | The RiverFront Moderate Growth & Income strategy is invested according to a blend of 50% S&P 500®/50% Barclays U.S. Aggregate Bond Index. |
| | » | The RiverFront Conservative Income Builder strategy is invested according to a blend of 30% S&P 500®/70% Barclays U.S. Aggregate Bond Index. |
Performance Contributors:
Across all funds, our decision to add exposure to Japan proved positive. We initiated our original positions late in 2012 and continued to add throughout early 2013, going overweight in the RiverFront Growth funds. We have been increasing exposure to Japan since the fourth quarter of last year based on our expectations for a concerted effort on the part of government/central bank leaders to boost the country’s longstanding economic malaise. With a new governor in place at the Bank of Japan, we have now begun to see announcements of actual purchases of bonds and increases to the monetary base – both of which exceeded expectations.
Another positive contributor to performance, within equities, was our increased weighting to more cyclical, higher beta10 equities in sectors such as industrials, materials and other sectors that are more economically sensitive. This higher beta positioning was a shift away from the quality bias we had previously.
Our preference for Master Limited Partnerships (MLPs) in the Balanced funds was a positive contributor. MLPs had a period of underperformance for part of 2012 given investors’ worries about changes in the tax laws potentially being disadvantageous. So far, the tax status for MLPs is unchanged and relative performance has improved. Additionally, we believe valuations and yields are still attractive.
Negative Factors:
Our Balanced funds underperformed when compared to a simple equity benchmark given their fixed income positioning. Despite being underweight traditional fixed income, this exposure created a drag. We continue to prefer stocks to bonds given our belief that bond investors will suffer continued erosion of purchasing power and considerable opportunity cost.
Exposure to emerging markets had a negative impact during the twelve month period as it was the worst performing equity asset class as illustrated by the table above. The thesis on emerging markets hinges on China and the moves there to re-stimulate that economy. There have been some concerns (i.e. weakening in
Chinese bank stocks) that there actually could be tightening in China which would be “hawkish” for emerging markets. We continue to monitor our positions here with a risk management plan in place.
There was some negative impact due to individual security selection within domestic equity.
Past performance is no guarantee of future results. Dividends are not guaranteed and are subject to change or elimination. Investments in international and emerging markets securities include exposure to risks such as currency fluctuations, foreign taxes and regulations, and the potential for illiquid markets and political instability.
The views and information discussed in this commentary are as of the date of publication, are subject to change, and may not reflect the writer’s current views. The views expressed represent an assessment of market conditions at a specific point in time, are opinions only and should not be relied upon as investment advice regarding a particular investment or markets in general. Such information does not constitute a recommendation to buy or sell specific securities or investment vehicles. It should not be assumed that any investment will be profitable or will equal the performance of the fund(s) or any securities or any sectors mentioned herein. The subject matter contained herein has been derived from several sources believed to be reliable and accurate at the time of compilation. RiverFront Investment Group, LLC does not accept any liability for losses either direct or consequential caused by the use of this information.
| 1 | Standard & Poor’s (S&P) 500® Index – measures the performance of 500 large cap stocks, which together represent about 75% of the total U.S. equities market. Net total return indices reinvest dividends after the deduction of withholding taxes, using (for international indices) a tax rate applicable to non-resident institutional investors who do not benefit from double taxation treaties. The index is not actively managed and does not reflect any deductions for fees, expenses or taxes. An investor may not invest directly in an index. |
| 2 | Benchmark Indexes – The primary objective of a benchmark is to provide investors/portfolio managers with a framework in which to establish return objectives and risk tolerance levels. Indexes are not actively managed and do not reflect any deduction for fees, expenses or taxes. An investor may not invest directly in an index. |
| 3 | Standard & Poor’s (S&P) 1000® Total Return – measures the performance of widely available and highly liquid stocks, which makes it an appropriate mid-small cap index for investors seeking to replicate the performance of the U.S. equity market. Net total return indices reinvest dividends after the deduction of withholding taxes, using (for international indices) a tax rate applicable to non-resident institutional investors who do not benefit from double taxation treaties. |
| 4 | MSCI EAFE Index (Net) – is a free float-adjusted market capitalization index that is designed to measure the equity market performance of developed markets, excluding the US & Canada. The MSCI EAFE Index consists of the following 22 developed market country indices: Australia, Austria, Belgium, Denmark, Finland, France, Germany, Greece, Hong Kong, Ireland, Israel, Italy, Japan, the Netherlands, New Zealand, Norway, Portugal, Singapore, Spain, Sweden, Switzerland, and the United Kingdom. Net total return indices reinvest dividends after the deduction of withholding taxes, using (for international indices) a tax rate applicable to non-resident institutional investors who do not benefit from double taxation treaties. |
| | |
| RiverFront Global Allocation Series |
| Management Commentary | | April 30, 2013 (Unaudited) |
| 5 | MSCI Emerging Markets Index (Net) – is a free float-adjusted market capitalization weighted index that is designed to measure the equity market performance of the emerging market countries of Europe, the Middle East & Africa. The MSCI EM EMEA Index consists of the following 8 emerging market country indices: Czech Republic, Hungary, Poland, Russia, Turkey, Egypt, Morocco, and South Africa. Net total return indices reinvest dividends after the deduction of withholding taxes, using (for international indices) a tax rate applicable to non-resident institutional investors who do not benefit from double taxation treaties. |
| 6 | MSCI All Country World Index (Net) – is a free float-adjusted market capitalization weighted index that is designed to measure the equity market performance of developed markets. The MSCI World Index consists of the following 24 developed market country indices: Australia, Austria, Belgium, Canada, Denmark, Finland, France, Germany, Greece, Hong Kong, Ireland, Israel, Italy, Japan, Netherlands, New Zealand, Norway, Portugal, Singapore, Spain, Sweden, Switzerland, the United Kingdom, and the United States. Net total return indices reinvest dividends after the deduction of withholding taxes, using (for international indices) a tax rate applicable to non-resident institutional investors who do not benefit from double taxation treaties. |
| 7 | Barclays U.S. Aggregate Bond Index – measures the performance of U.S. denominated, investment-grade, fixed-income instruments. Net total return indices reinvest dividends after the deduction of withholding taxes, using (for international indices) a tax rate applicable to non-resident institutional investors who do not benefit from double taxation treaties. |
| 8 | Barclays U.S. Treasury Index – measures the performance of government bonds issued by the US Treasury. The Term Index methodology is a unique concept in bond indexing developed by Barclays Capital. The Term indices only include bonds near to their original term, rather than selecting all bonds in a maturity range, and use the standard market capitalization weighting methodology to weight the bonds. Term Indices have a very similar yield; duration and risk/return characteristics to standard maturity based indices but are more compact and tend to be more liquid than their maturity band equivalent. Net total return indices reinvest dividends after the deduction of withholding taxes, using (for international indices) a tax rate applicable to non-resident institutional investors who do not benefit from double taxation treaties. |
| 9 | Barclays U.S. Short Treasury Index – measures the performance of short-term government bonds issued by the US Treasury. The Term Index methodology is a unique concept in bond indexing developed by Barclays Capital. The Term indices only include bonds near to their original term, rather than selecting all bonds in a maturity range, and use the standard market capitalization weighting methodology to weight the bonds. Term Indices have a very similar yield; duration and risk/return characteristics to standard maturity based indices but are more compact and tend to be more liquid than their maturity band equivalent. Net total return indices reinvest dividends after the deduction of withholding taxes, using (for international indices) a tax rate applicable to non-resident institutional investors who do not benefit from double taxation treaties. |
| 10 | Beta – Is the measure of volatility, or systematic risk, of a security or a portfolio in comparison to the market as a whole. Beta is used in the capital asset pricing model (CAPM), a model that calculates the expected return of an asset based on its beta and expected market returns. |
| | |
| RiverFront Conservative Income Builder Fund | | |
| Performance Update | | April 30, 2013 (Unaudited) |
Performance of $10,000 Initial Investment (as of April 30, 2013)
Comparison of change in value of a $10,000 investment (includes maximum sales charges of 5.50%)
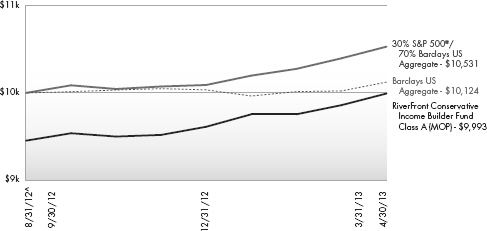
The chart above represents historical performance of a hypothetical investment of $10,000 in the Fund since inception. Past performance does not guarantee future results. This chart does not reflect the deduction of taxes that a shareholder would pay on Fund distributions or the redemption of Fund shares.
Average Annual Total Returns (as of April 30, 2013)
| | | | | | | | |
| | | 3 Month | | Since Inception ^ | | Total Expense Ratio | | What You Pay * |
Class A (NAV)1 | | 2.44% | | 5.72% | | 1.89% | | 1.38% |
Class A (MOP)2 | | -3.23% | | -0.07% | | |
Class C (NAV)1 | | 2.32% | | 5.29% | | 2.64% | | 2.13% |
Class C (CDSC)2 | | 1.32% | | 4.29% | | |
Class I | | 2.59% | | 5.95% | | 1.64% | | 1.13% |
Barclays Capital US Aggregate Bond Index3 | | 1.60% | | 1.24% | | | | |
30% S&P 500® and 70% Barclays US Aggregate4 | | 3.26% | | 5.31% | | | | |
Performance data quoted represents past performance. Past performance does not guarantee future results. Investment return and principal value of an investment will fluctuate so that an investor’s shares, when sold or redeemed, may be worth more or less than the original cost. Current performance data may be higher or lower than actual data quoted. The Fund imposes a maximum Contingent Deferred Sales Charge (“CDSC”) of 1.00% on Class C shares redeemed within the first 12 months after a purchase, and on Class A shares redeemed within the first 12 months after a purchase in excess of $1 million. Performance data does not reflect the CDSC, which if reflected would reduce the performance quoted. For the most current month-end performance data, please call 1-866-759-5679.
| | |
| RiverFront Conservative Income Builder Fund | | |
| Performance Update | | April 30, 2013 (Unaudited) |
| 1 | Net Asset Value (NAV) is the share price without sales charges. |
| 2 | Maximum Offering Price (MOP) includes sales charges. Class A returns include effects of the Fund’s maximum sales charge of 5.50%; Class C returns include the 1.00% CDSC. |
| 3 | The Barclay’s U.S. Aggregate Bond Index is a broad-based benchmark that measures the investment grade, U.S. dollar-denominated, fixed-rate taxable bond market, including Treasuries, government-related and corporate securities, MBS (agency fixed-rate and hybrid ARM passthroughs), ABS, and CMBS. The index is not actively managed and does not reflect any deductions for fees, expenses or taxes. An investor may not invest directly in an index. |
| 4 | S&P 500® Index - S&P 500® Index is the Standard & Poor’s composite index of 500 stocks, a widely recognized, unmanaged index of common stock prices. |
Barclays Capital U.S. Aggregate Bond Index - An unmanaged index composed of securities from the Barclays Capital Government/Corporate Bond Index, Mortgage-Backed Securities Index and the Asset-Backed Securities Index. Total return comprises price appreciation/depreciation and income as a percentage of the original investment. Indices are rebalanced monthly by market capitalization. The index is not actively managed and does not reflect any deductions for fees, expenses or taxes. An investor may not invest directly in an index.
| ^ | Fund inception date of August 31, 2012. The Fund commenced operations September 4, 2012. |
| * | What You Pay reflects the Advisor’s and Sub-Advisor’s decision to contractually limit expenses through August 31, 2013. Please see the prospectus for additional information. |
The table does not reflect the deduction of taxes that a shareholder would pay on Fund distributions or the redemption of Fund shares.
This Fund is not suitable for all investors. Subject to investment risks, including possible loss of the principal amount invested.
There is no guarantee that the Fund will continue to hold any one particular security or stay invested in any one particular company. The composition of the Fund’s top holdings is subject to change. Performance figures are historical and reflect the change in share price, reinvested distributions, changes in net asset value, sales charges and capital gains distributions, if any.
Mutual funds are not insured or guaranteed by the FDIC or by any other government agency or government sponsored agency of the federal government or any state, not deposits, obligations or guaranteed by any bank or its affiliates and are subject to investment risks, including possible loss of the principal amount invested.
Top Ten Holdings (as a % of Net Assets) †
| | | | |
Vanguard® Short-Term Corporate Bond ETF | | | 18.19 | % |
iShares® Barclays 1-3 Year Credit Bond Fund | | | 17.25 | % |
WisdomTree® LargeCap Dividend Fund | | | 6.61 | % |
iShares® iBoxx $ High Yield Corporate Bond Fund | | | 5.82 | % |
SPDR® Barclays Capital High Yield Bond ETF | | | 5.81 | % |
WisdomTree® Japan Hedged Equity Fund | | | 3.78 | % |
PowerShares® Senior Loan Portfolio | | | 3.70 | % |
PowerShares® S&P 500® Low Volatility Portfolio | | | 3.15 | % |
Vanguard® Dividend Appreciation ETF | | | 3.13 | % |
WisdomTree® Europe Hedged Equity Fund | | | 2.84 | % |
Top Ten Holdings | | | 70.28 | % |
| † | Holdings are subject to change. Table presents indicative values only. |
Portfolio Composition (as a % of Net Assets)
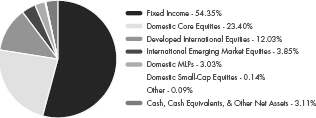
| | |
| RiverFront Dynamic Equity Income Fund | | |
| Performance Update | | April 30, 2013 (Unaudited) |
Performance of $10,000 Initial Investment (as of April 30, 2013)
Comparison of change in value of a $10,000 investment (includes maximum sales charges of 5.50%)
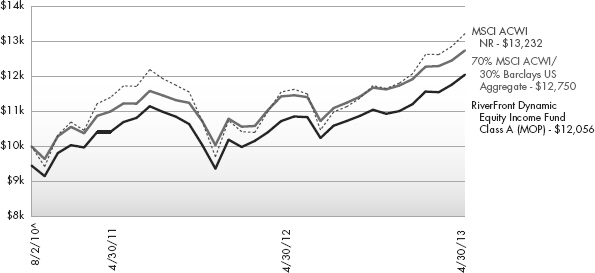
The chart above represents historical performance of a hypothetical investment of $10,000 in the Fund since inception. Past performance does not guarantee future results. This chart does not reflect the deduction of taxes that a shareholder would pay on Fund distributions or the redemption of Fund shares.
The MSCI ACWI replaced the S&P 500® Index as the Fund’s primary index because it better reflects the Fund’s portfolio. The MSCI ACWI is a free float-adjusted market capitalization weighted index that is designed to measure the equity market performance of developed and emerging markets.
The MSCI ACWI consists of 45 country indices comprising 24 developed and 21 emerging market country indices. The index includes reinvestment of dividends, net of foreign withholding taxes.
Average Annual Total Returns (as of April 30, 2013)
| | | | | | | | |
| | | 1 Year | | Since Inception ^ | | Total Expense Ratio | | What You Pay * |
Class A (NAV)1 | | 11.22% | | 9.28% | | 1.94% | | 1.40% |
Class A (MOP)2 | | 5.14% | | 7.06% | | |
Class C (NAV)1 | | 10.41% | | 8.44% | | 2.69% | | 2.15% |
Class C (CDSC)2 | | 9.41% | | 8.44% | | |
Class I | | 11.47% | | 9.53% | | 1.69% | | 1.15% |
MSCI All Country World Index3 | | 15.02% | | 10.75% | | | | |
70% ACWI and 30% Barclays US Aggregate3,4 | | 11.71% | | 9.26% | | | | |
Performance data quoted represents past performance. Past performance does not guarantee future results. Investment return and principal value of an investment will fluctuate so that an investor’s shares, when sold or redeemed, may be worth more or less than the original cost. Current performance data may be higher or lower than actual data quoted. The Fund imposes a maximum Contingent Deferred Sales Charge (“CDSC”) of 1.00% on Class C shares redeemed within the first 12 months after a purchase, and on Class A shares redeemed within the first 12 months after a purchase in excess of $1 million. Performance data does not reflect the CDSC, which if reflected would reduce the performance quoted. For the most current month-end performance data, please call 1-866-759-5679.
| | |
| RiverFront Dynamic Equity Income Fund | | |
| Performance Update | | April 30, 2013 (Unaudited) |
| 1 | Net Asset Value (NAV) is the share price without sales charges. |
| 2 | Maximum Offering Price (MOP) includes sales charges. Class A returns include effects of the Fund’s maximum sales charge of 5.50%; Class C returns include the 1.00% CDSC. |
| 3 | The MSCI ACWI is a free float-adjusted market capitalization weighted index that is designed to measure the equity market performance of developed and emerging markets. The MSCI ACWI consists of 45 country indices comprising 24 developed and 21 emerging market country indices. The index includes reinvestment of dividends, net of foreign withholding taxes. The index is not actively managed and does not reflect any deductions for fees, expenses or taxes. An investor may not invest directly in an index. |
| 4 | An unmanaged index composed of securities from the Barclays Capital Government/Corporate Bond Index, Mortgage-Backed Securities Index and the Asset-Backed Securities Index. Total return comprises price appreciation/depreciation and income as a percentage of the original investment. Indices are rebalanced monthly by market capitalization. The index is not actively managed and does not reflect any deductions for fees, expenses or taxes. An investor may not invest directly in an index. |
| ^ | Fund inception date of August 2, 2010. |
| * | What You Pay reflects the Advisor’s and Sub-Advisor’s decision to contractually limit expenses through August 31, 2013. Please see the prospectus for additional information. |
The table does not reflect the deduction of taxes that a shareholder would pay on Fund distributions or the redemption of Fund shares.
This Fund is not suitable for all investors. Subject to investment risks, including possible loss of the principal amount invested.
There is no guarantee that the Fund will continue to hold any one particular security or stay invested in any one particular company. The composition of the Fund’s top holdings is subject to change. Performance figures are historical and reflect the change in share price, reinvested distributions, changes in net asset value, sales charges and capital gains distributions, if any.
Mutual funds are not insured or guaranteed by the FDIC or by any other government agency or government sponsored agency of the federal government or any state, not deposits, obligations or guaranteed by any bank or its affiliates and are subject to investment risks, including possible loss of the principal amount invested.
Top Ten Holdings (as a % of Net Assets) †
| | | | |
WisdomTree® LargeCap Dividend Fund | | | 18.91 | % |
PowerShares® S&P 500® High Beta Port ETF | | | 7.36 | % |
iShares® MSCI EAFE Index Fund | | | 6.52 | % |
SPDR® Barclays Capital High Yield Bond ETF | | | 6.39 | % |
WisdomTree® Japan Hedged Equity Fund | | | 6.26 | % |
Vanguard® FTSE® Europe ETF | | | 5.54 | % |
iShares® iBoxx $ High Yield Corporate Bond Fund | | | 3.95 | % |
Vanguard® FTSE® Emerging Markets ETF | | | 3.45 | % |
PowerShares® Senior Loan Portfolio | | | 3.35 | % |
WisdomTree® Europe Hedged Equity Fund | | | 2.92 | % |
Top Ten Holdings | | | 64.65 | % |
| † | Holdings are subject to change. Table presents indicative values only. |
Portfolio Composition (as a % of Net Assets)
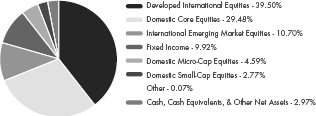
| | |
| RiverFront Global Allocation Fund | | |
| Performance Update | | April 30, 2013 (Unaudited) |
Performance of $10,000 Initial Investment (as of April 30, 2013)
Comparison of change in value of a $10,000 investment (includes maximum sales charges of 5.50%)
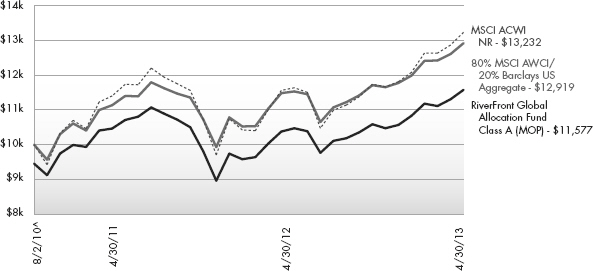
The chart above represents historical performance of a hypothetical investment of $10,000 in the Fund since inception. Past performance does not guarantee future results. This chart does not reflect the deduction of taxes that a shareholder would pay on Fund distributions or the redemption of Fund shares.
The MSCI ACWI replaced the S&P 500® Index as the Fund’s primary index because it better reflects the Fund’s portfolio. The MSCI ACWI is a free float-adjusted market capitalization weighted index that is designed to measure the equity market performance of developed and emerging markets.
The MSCI ACWI consists of 45 country indices comprising 24 developed and 21 emerging market country indices. The index includes reinvestment of dividends, net of foreign withholding taxes.
Average Annual Total Returns (as of April 30, 2013)
| | | | | | | | |
| | | 1 Year | | Since Inception ^ | | Total Expense Ratio | | What You Pay * |
Class A (NAV)1 | | 11.47% | | 7.67% | | 2.02% | | 1.40% |
Class A (MOP)2 | | 5.35% | | 5.48% | | |
Class C (NAV)1 | | 10.59% | | 6.88% | | 2.77% | | 2.15% |
Class C (CDSC) 2 | | 9.59% | | 6.88% | | |
Class I (NAV)1 | | 11.73% | | 7.93% | | 1.77% | | 1.15% |
MSCI All Country World Index3 | | 15.02% | | 10.75% | | | | |
80% ACWI and 20% Barclays US Aggregate3,4 | | 12.83% | | 9.79% | | | | |
Performance data quoted represents past performance. Past performance does not guarantee future results. Investment return and principal value of an investment will fluctuate so that an investor’s shares, when sold or redeemed, may be worth more or less than the original cost. Current performance data may be higher or lower than actual data quoted. The Fund imposes a maximum Contingent Deferred Sales Charge (“CDSC”) of 1.00% on Class C shares redeemed within the first 12 months after a purchase, and on Class A shares redeemed within the first 12 months after a purchase in excess of $1 million. Performance data does not reflect the CDSC, which if reflected would reduce the performance quoted. For the most current month-end performance data, please call 1-866-759-5679.
| | |
| RiverFront Global Allocation Fund | | |
| Performance Update | | April 30, 2013 (Unaudited) |
| 1 | Net Asset Value (NAV) is the share price without sales charges. |
| 2 | Maximum Offering Price (MOP) includes sales charges. Class A returns include effects of the Fund’s maximum sales charge of 5.50%; Class C returns include the 1.00% CDSC. |
| 3 | The MSCI ACWI is a free float-adjusted market capitalization weighted index that is designed to measure the equity market performance of developed and emerging markets. The MSCI ACWI consists of 45 country indices comprising 24 developed and 21 emerging market country indices. The index includes reinvestment of dividends, net of foreign withholding taxes. The index is not actively managed and does not reflect any deductions for fees, expenses or taxes. An investor may not invest directly in an index. |
| 4 | An unmanaged index composed of securities from the Barclays Capital Government/Corporate Bond Index, Mortgage-Backed Securities Index and the Asset-Backed Securities Index. Total return comprises price appreciation/depreciation and income as a percentage of the original investment. Indices are rebalanced monthly by market capitalization. The index is not actively managed and does not reflect any deductions for fees, expenses or taxes. An investor may not invest directly in an index. |
| ^ | Fund inception date of August 2, 2010. |
| * | What You Pay reflects the Advisor’s and Sub-Advisor’s decision to contractually limit expenses through August 31, 2013. Please see the prospectus for additional information. |
The table does not reflect the deduction of taxes that a shareholder would pay on Fund distributions or the redemption of Fund shares.
This Fund is not suitable for all investors. Subject to investment risks, including possible loss of the principal amount invested.
There is no guarantee that the Fund will continue to hold any one particular security or stay invested in any one particular company. The composition of the Fund’s top holdings is subject to change. Performance figures are historical and reflect the change in share price, reinvested distributions, changes in net asset value, sales charges and capital gains distributions, if any.
Mutual funds are not insured or guaranteed by the FDIC or by any other government agency or government sponsored agency of the federal government or any state, not deposits, obligations or guaranteed by any bank or its affiliates and are subject to investment risks, including possible loss of the principal amount invested.
Top Ten Holdings (as a % of Net Assets) †
| | | | |
PowerShares® S&P 500® High Beta Port ETF | | | 7.82 | % |
iShares® MSCI EAFE Index Fund | | | 7.32 | % |
Vanguard® Large-Cap ETF | | | 7.29 | % |
WisdomTree® Japan Hedged Equity Fund | | | 6.41 | % |
Vanguard® FTSE® Emerging Markets ETF | | | 5.49 | % |
Vanguard® MSCI EAFE ETF | | | 4.16 | % |
Vanguard® FTSE® Europe ETF | | | 3.96 | % |
PowerShares® Senior Loan Portfolio | | | 3.92 | % |
WisdomTree® Europe Hedged Equity Fund | | | 2.91 | % |
iShares® S&P SmallCap 600® Index Fund | | | 2.56 | % |
Top Ten Holdings | | | 51.84 | % |
| † | Holdings are subject to change. Table presents indicative values only. |
Portfolio Composition (as a % of Net Assets)

| | |
| RiverFront Global Growth Fund | | |
| Performance Update | | April 30, 2013 (Unaudited) |
Performance of $10,000 Initial Investment (as of April 30, 2013)
Comparison of change in value of a $10,000 investment (includes maximum sales charges of 5.50%)
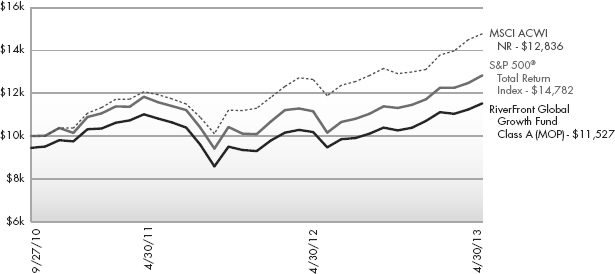
The chart above represents historical performance of a hypothetical investment of $10,000 in the Fund since inception. Past performance does not guarantee future results. This chart does not reflect the deduction of taxes that a shareholder would pay on Fund distributions or the redemption of Fund shares.
The MSCI ACWI replaced the S&P 500® Index as the Fund’s primary index because it better reflects the Fund’s portfolio. The MSCI ACWI is a free float-adjusted market capitalization weighted index that is designed to measure the equity market performance of developed and emerging markets.
The MSCI ACWI consists of 45 country indices comprising 24 developed and 21 emerging market country indices. The index includes reinvestment of dividends, net of foreign withholding taxes.
Average Annual Total Returns (as of April 30, 2013)
| | | | | | | | | | |
| | | 1 Year | | 3 Year | | Since Inception ^ | | Total Expense Ratio | | What You Pay * |
Class A (NAV)1 | | 13.14% | | 6.25% | | 12.31% | | 1.69% | | 1.36% |
Class A (MOP)2 | | 6.90% | | 4.27% | | 10.91% | | |
Class C (NAV)1 | | 12.31% | | 5.47% | | 11.48% | | 2.44% | | 2.11% |
Class C (CDSC) 2 | | 11.31% | | 5.47% | | 11.48% | | |
Class I (NAV)1 | | 13.36% | | 6.52% | | 12.59% | | 1.44% | | 1.11% |
Class L (NAV)1, 3 | | 13.43% | | 6.48% | | 12.56% | | 1.11% | | 1.44% |
Investor (NAV)2 | | 13.07% | | 6.23% | | 12.26% | | 1.69% | | 1.36% |
S&P 500® Total Return Index4 | | 16.89% | | 12.80% | | 15.02% | | | | |
MSCI All Country World Index5 | | 15.02% | | 8.73% | | 14.95% | | | | |
Performance data quoted represents past performance. Past performance does not guarantee future results. Investment return and principal value of an investment will fluctuate so that an investor’s shares, when sold or redeemed, may be worth more or less than the original cost. Current performance data may be higher or lower than actual data quoted. The Fund imposes a maximum Contingent Deferred Sales Charge (“CDSC”) of 1.00% on Class C shares redeemed within the first 12 months after a purchase, and on Class A shares redeemed within the first 12 months after a purchase in excess of $1 million. Performance data does not reflect the CDSC, which if reflected would reduce the performance quoted. For the most current month-end performance data, please call 1-866-759-5679.
| | |
| RiverFront Global Growth Fund | | |
| Performance Update | | April 30, 2013 (Unaudited) |
| 1 | Net Asset Value (NAV) is the share price without sales charges. |
| 2 | Maximum Offering Price (MOP) includes sales charges. Class A returns include effects of the Fund’s maximum sales charge of 5.50%; Class C returns include the 1.00% CDSC. |
| 3 | Prior to close of business on September 24, 2010, Class L was known as Institutional Class of the Baird Funds, Inc. - RiverFront Long-Term Growth Fund. |
| 4 | S&P 500® Total Return Index is the Standard & Poor’s composite index of 500 stocks, a widely recognized, unmanaged index of common stock prices. The index is not actively managed and does not reflect any deduction for fees, expenses or taxes. An investor may not invest directly in an index. |
| 5 | The MSCI ACWI is a free float-adjusted market capitalization weighted index that is designed to measure the equity market performance of developed and emerging markets. The MSCI ACWI consists of 45 country indices comprising 24 developed and 21 emerging market country indices. The index includes reinvestment of dividends, net of foreign withholding taxes. The index is not actively managed and does not reflect any deductions for fees, expenses or taxes. An investor may not invest directly in an index. |
| ^ | Fund inception date of October 28, 2008. |
| * | What You Pay reflects the Advisor’s and Sub-Advisor’s decision to contractually limit expenses through August 31, 2013. Please see the prospectus for additional information. |
The Class A, C, I and L shares performance shown for periods prior to September 27, 2010 reflects the performance of the Baird Funds, Inc. – RiverFront Long-Term Growth Fund’s Institutional Class shares (as result of the reorganization of the Baird Funds, Inc. – RiverFront Long-Term Growth Fund into the Fund).
The Investor Class performance shown for periods prior to September 27, 2010 reflects the performance of the Baird Funds, Inc. – RiverFront Long-Term Growth Fund’s Investor Class shares (as result of the reorganization of the Baird Funds, Inc. – RiverFront Long-Term Growth Fund into the Fund).
The table does not reflect the deduction of taxes that a shareholder would pay on Fund distributions or the redemption of Fund shares.
This Fund is not suitable for all investors. Subject to investment risks, including possible loss of the principal amount invested.
There is no guarantee that the Fund will continue to hold any one particular security or stay invested in any one particular company. The composition of the Fund’s top holdings is subject to change. Performance figures are historical and reflect the change in share price, reinvested distributions, changes in net asset value, sales charges and capital gains distributions, if any.
Mutual funds are not insured or guaranteed by the FDIC or by any other government agency or government sponsored agency of the federal government or any state, not deposits, obligations or guaranteed by any bank or its affiliates and are subject to investment risks, including possible loss of the principal amount invested.
Top Ten Holdings (as a % of Net Assets) †
| | | | |
PowerShares® S&P 500® High Beta Port ETF | | | 8.87% | |
WisdomTree® Japan Total Dividend Fund | | | 7.61% | |
Vanguard® FTSE® Europe ETF | | | 7.35% | |
Vanguard® FTSE® Emerging Markets ETF | | | 6.03% | |
iShares® MSCI EAFE Index Fund | | | 4.75% | |
Vanguard® MSCI EAFE ETF | | | 4.49% | |
WisdomTree® LargeCap Dividend Fund | | | 3.66% | |
Vanguard® Large-Cap ETF | | | 3.63% | |
WisdomTree® Europe Hedged Equity Fund | | | 2.94% | |
iShares® MSCI Emerging Markets Index Fund | | | 2.84% | |
Top Ten Holdings | | | 52.17% | |
| † | Holdings are subject to change. Table presents indicative values only. |
Portfolio Composition (as a % of Net Assets)
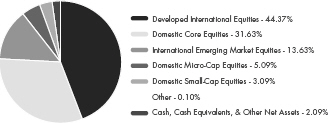
| | |
| RiverFront Moderate Growth & Income Fund |
| Performance Update | | April 30, 2013 (Unaudited) |
Performance of $10,000 Initial Investment (as of April 30, 2013)
Comparison of change in value of a $10,000 investment (includes maximum sales charges of 5.50%)
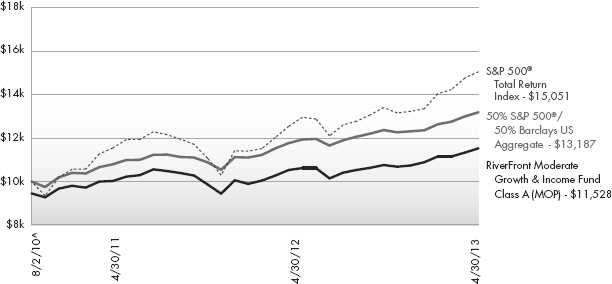
The chart above represents historical performance of a hypothetical investment of $10,000 in the Fund since inception. Past performance does not guarantee future results. This chart does not reflect the deduction of taxes that a shareholder would pay on Fund distributions or the redemption of Fund shares.
Average Annual Total Returns (as of April 30, 2013)
| | | | | | | | |
| | | 1 Year | | Since Inception ^ | | Total Expense Ratio | | What You Pay * |
| Class A (NAV)1 | | 8.59% | | 7.51% | | 1.71% | | 1.41% |
| Class A (MOP)2 | | 2.59% | | 5.32% | | |
| Class C (NAV)1 | | 7.83% | | 6.72% | | 2.46% | | 2.16% |
| Class C (CDSC)2 | | 6.83% | | 6.72% | | |
| Class I (NAV)1 | | 8.94% | | 7.78% | | 1.46% | | 1.16% |
S&P 500® Total Return Index3 | | 16.89% | | 16.08% | | | | |
50% S&P 500® and 50% Barclays US Aggregate3,4 | | 10.26% | | 10.61% | | | | |
Performance data quoted represents past performance. Past performance does not guarantee future results. Investment return and principal value of an investment will fluctuate so that an investor’s shares, when sold or redeemed, may be worth more or less than the original cost. Current performance data may be higher or lower than actual data quoted. The Fund imposes a maximum Contingent Deferred Sales Charge (“CDSC”) of 1.00% on Class C shares redeemed within the first 12 months after a purchase, and on Class A shares redeemed within the first 12 months after a purchase in excess of $1 million. Performance data does not reflect the CDSC, which if reflected would reduce the performance quoted. For the most current month-end performance data, please call 1-866-759-5679.
| 1 | Net Asset Value (NAV) is the share price without sales charges. |
| 2 | Maximum Offering Price (MOP) includes sales charges. Class A returns include effects of the Fund’s maximum sales charge of 5.50%; Class C returns include the 1.00% CDSC. |
| 3 | S&P 500® Total Return Index is the Standard & Poor’s composite index of 500 stocks, a widely recognized, unmanaged index of common stock prices. The index is not actively managed and does not reflect any deduction for fees, expenses or taxes. An investor may not invest directly in an index. |
| 4 | An unmanaged index composed of securities from the Barclays Capital Government/Corporate Bond Index, Mortgage-Backed Securities Index and the Asset-Backed Securities Index. Total return comprises price appreciation/depreciation and income as a percentage of the original investment. Indices are rebalanced monthly by market capitalization. The index is not actively managed and does not reflect any deduction for fees, expenses or taxes. An investor may not invest directly in an index. |
| | |
| RiverFront Moderate Growth & Income Fund |
| Performance Update | | April 30, 2013 (Unaudited) |
| ^ | Fund inception date of August 2, 2010. |
| * | What You Pay reflects the Advisor’s and Sub-Advisor’s decision to contractually limit expenses through August 31, 2013. Please see the prospectus for additional information. |
The table does not reflect the deduction of taxes that a shareholder would pay on Fund distributions or the redemption of Fund shares.
This Fund is not suitable for all investors. Subject to investment risks, including possible loss of the principal amount invested.
There is no guarantee that the Fund will continue to hold any one particular security or stay invested in any one particular company. The composition of the Fund’s top holdings is subject to change. Performance figures are historical and reflect the change in share price, reinvested distributions, changes in net asset value, sales charges and capital gains distributions, if any.
Mutual funds are not insured or guaranteed by the FDIC or by any other government agency or government sponsored agency of the federal government or any state, not deposits, obligations or guaranteed by any bank or its affiliates and are subject to investment risks, including possible loss of the principal amount invested.
| | |
| Top Ten Holdings (as a % of Net Assets) † | | |
| | | | |
WisdomTree® LargeCap Dividend Fund | | | 12.24% | |
Vanguard® Short-Term Corporate Bond ETF | | | 11.32% | |
iShares® Barclays 1-3 Year Credit Bond Fund | | | 7.35% | |
Vanguard® FTSE® Emerging Markets ETF | | | 7.14% | |
SPDR® Barclays Capital High Yield Bond ETF | | | 5.40% | |
iShares® iBoxx $ High Yield Corporate Bond Fund | | | 4.82% | |
WisdomTree® Japan Hedged Equity Fund | | | 4.74% | |
Vanguard® Dividend Appreciation ETF | | | 4.63% | |
PowerShares® S&P 500® High Beta Port ETF | | | 4.55% | |
PowerShares® Senior Loan Portfolio | | | 3.72% | |
Top Ten Holdings | | | 65.91% | |
| † | Holdings are subject to change. Table presents indicative values only. |
Portfolio Composition (as a % of Net Assets)
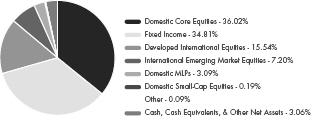
| | |
| RiverFront Conservative Income Builder Fund |
| Statement of Investments | | April 30, 2013 |
| | | | | | | | |
| | | Shares | | | Value
(Note 2) | |
| |
COMMON STOCKS (3.69%) | |
Basic Materials (0.74%) | | | | | |
Forest Products & Paper (0.74%) | |
MeadWestvaco Corp. | | | 767 | | | $ | 26,446 | |
| | | | | | | | |
| |
TOTAL BASIC MATERIALS | | | | 26,446 | |
| | | | | | | | |
|
Communications (0.46%) | |
Media (0.46%) | | | | | | | | |
Time Warner, Inc. | | | 275 | | | | 16,440 | |
| | | | | | | | |
| |
TOTAL COMMUNICATIONS | | | | 16,440 | |
| | | | | | | | |
|
Consumer, Cyclical (1.09%) | |
Retail (1.09%) | | | | | | | | |
Dollar Tree, Inc.(a) | | | 365 | | | | 17,359 | |
McDonald’s Corp. | | | 214 | | | | 21,858 | |
| | | | | | | | |
| | | | | | | 39,217 | |
| | | | | | | | |
| |
TOTAL CONSUMER, CYCLICAL | | | | 39,217 | |
| | | | | | | | |
|
Consumer, Non-Cyclical (0.68%) | |
Pharmaceuticals (0.68%) | | | | | |
Johnson & Johnson | | | 287 | | | | 24,461 | |
| | | | | | | | |
| |
TOTAL CONSUMER, NON-CYCLICAL | | | | 24,461 | |
| | | | | | | | |
| | |
Industrial (0.48%) | | | | | | | | |
Electronics (0.48%) | | | | | | | | |
Agilent Technologies, Inc. | | | 413 | | | | 17,115 | |
| | | | | | | | |
| | |
TOTAL INDUSTRIAL | | | | | | | 17,115 | |
| | | | | | | | |
| | |
Technology (0.24%) | | | | | | | | |
Computers (0.24%) | | | | | | | | |
Apple, Inc. | | | 19 | | | | 8,412 | |
| | | | | | | | |
| |
TOTAL TECHNOLOGY | | | | 8,412 | |
| | | | | | | | |
| |
TOTAL COMMON STOCKS | | | | | |
(Cost $121,919) | | | | | | | 132,091 | |
| | | | | | | | |
|
EXCHANGE TRADED FUNDS (87.24%) | |
Debt (52.69%) | | | | | | | | |
iShares® Barclays 1-3 Year Credit Bond Fund | | | 5,860 | | | | 618,757 | |
iShares® iBoxx $ High Yield Corporate Bond Fund | | | 2,179 | | | | 208,857 | |
PIMCO 0-5 Year High Yield Corporate Bond Index ETF | | | 326 | | | | 34,474 | |
PowerShares® Senior Loan Portfolio | | | 5,272 | | | | 132,802 | |
SPDR® Barclays Capital High Yield Bond ETF | | | 4,990 | | | | 208,333 | |
| | | | | | | | |
| | | Shares | | | Value
(Note 2) | |
| |
Debt (continued) | | | | | | | | |
SPDR® Barclays Short Term High Yield Bond ETF | | | 1,103 | | | $ | 34,347 | |
Vanguard® Short-Term Corporate Bond ETF | | | 8,094 | | | | 652,215 | |
| | | | | | | | |
| | | | | | | 1,889,785 | |
| | | | | | | | |
| | |
Equity (34.55%) | | | | | | | | |
Guggenheim S&P 500® Equal Weight Healthcare ETF | | | 312 | | | | 28,368 | |
iShares® MSCI Canada Index Fund | | | 926 | | | | 25,947 | |
iShares® MSCI EAFE Index Fund | | | 1,161 | | | | 71,912 | |
iShares® MSCI Emerging Markets Index Fund | | | 2,313 | | | | 100,130 | |
iShares® MSCI Pacific ex-Japan Index Fund | | | 362 | | | | 18,679 | |
PowerShares® Buyback Achievers Portfolio | | | 521 | | | | 18,042 | |
PowerShares® FTSE® RAFI Developed Markets ex-U.S. Portfolio | | | 901 | | | | 35,238 | |
PowerShares® S&P 500® High Beta Port ETF | | | 3,084 | | | | 73,492 | |
PowerShares® S&P 500® Low Volatility Portfolio | | | 3,516 | | | | 113,145 | |
SPDR® S&P® Insurance ETF | | | 1,220 | | | | 64,684 | |
Vanguard® Dividend Appreciation ETF | | | 1,682 | | | | 112,358 | |
Vanguard® FTSE® Emerging Markets ETF | | | 752 | | | | 32,908 | |
Vanguard® FTSE® Europe ETF | | | 538 | | | | 27,632 | |
Vanguard® Industrials ETF | | | 215 | | | | 16,964 | |
Vanguard® Information Technology ETF | | | 343 | | | | 25,138 | |
WisdomTree® Europe Hedged Equity Fund | | | 2,014 | | | | 101,908 | |
WisdomTree® Japan Hedged Equity Fund | | | 2,849 | | | | 135,498 | |
WisdomTree® LargeCap Dividend Fund | | | 3,930 | | | | 237,018 | |
| | | | | | | | |
| | | | | | | 1,239,061 | |
| | | | | | | | |
|
TOTAL EXCHANGE TRADED FUNDS | |
(Cost $3,039,100) | | | | | | | 3,128,846 | |
| | | | | | | | |
|
EXCHANGE TRADED NOTES (2.94%) | |
Equity (2.94%) | | | | | | | | |
Credit Suisse Cushing® 30 MLP Index ETN | | | 1,931 | | | | 56,211 | |
| | |
| RiverFront Conservative Income Builder Fund |
| Statement of Investments | | April 30, 2013 |
| | | | | | | | |
| | | Shares | | | Value
(Note 2) | |
| |
Equity (continued) | | | | | | | | |
ETRACS Alerian MLP Infrastructure Index ETN | | | 1,295 | | | $ | 49,314 | |
| | | | | | | | |
| | | | | | | 105,525 | |
| | | | | | | | |
| |
TOTAL EXCHANGE TRADED NOTES | | | | | |
(Cost $96,359) | | | | | | | 105,525 | |
| | | | | | | | |
| | | | | | | | | | | | |
| | | 7-Day
Yield | | | Shares | | | Value
(Note 2) | |
| |
SHORT TERM INVESTMENTS (1.68%) | |
Money Market Fund (1.68%) | |
Dreyfus Cash Management Fund, Institutional Class | | | 0.050% | | | | 60,242 | | | | 60,242 | |
| | | | | | | | | | | | |
| |
TOTAL SHORT TERM INVESTMENTS | | | | | |
(Cost $60,242) | | | | | | | | | | | 60,242 | |
| | | | | | | | | | | | |
| |
TOTAL INVESTMENTS (95.55%) | | | | | |
(Cost $3,317,620) | | | | | | | | | | $ | 3,426,704 | |
| |
Other Assets In Excess Of Liabilities (4.45%) | | | | 159,658 | |
| | | | | | | | | | | | |
| |
NET ASSETS (100.00%) | | | $ | 3,586,362 | |
| | | | | | | | | | | | |
| (a) | Non-Income Producing Security. |
Common Abbreviations:
EAFE - Europe, Australia, and Far East.
ETF - Exchange Traded Fund.
ETN - Exchange Traded Note.
ETRACS - UBS AG Exchange Traded Access Securities.
FTSE - Financial Times and the London Stock Exchange.
MLP - Master Limited Partnership.
MSCI - Morgan Stanley Capital International.
RAFI - Research Affiliates Fundamental Index.
S&P - Standard and Poor’s.
SPDR - Standard and Poor’s Depositary Receipt.
For Fund compliance purposes, the Fund’s industry classifications refer to any one or more of the industry sub-classifications used by one or more widely recognized market indexes or ratings group indexes, and/or as defined by Fund management. This definition may not apply for purposes of this report, which may combine industry sub-classifications for reporting ease. Industries are shown as a percent of net assets.
See Notes to Financial Statements.
| | |
| RiverFront Dynamic Equity Income Fund | | |
| Statement of Investments | | April 30, 2013 |
| | | | | | | | |
| | | Shares | | | Value (Note 2) | |
| |
COMMON STOCKS (6.62%) | |
Basic Materials (1.12%) | |
Forest Products & Paper (1.12%) | | | | | |
MeadWestvaco Corp. | | | 11,223 | | | $ | 386,969 | |
| | | | | | | | |
| |
TOTAL BASIC MATERIALS | | | | 386,969 | |
| | | | | | | | |
| |
Communications (0.86%) | | | | | |
Media (0.86%) | | | | | | | | |
Time Warner, Inc. | | | 4,984 | | | | 297,944 | |
| | | | | | | | |
| |
TOTAL COMMUNICATIONS | | | | 297,944 | |
| | | | | | | | |
| |
Consumer, Cyclical (2.02%) | | | | | |
Retail (2.02%) | | | | | | | | |
Dollar Tree, Inc.(a) | | | 5,015 | | | | 238,514 | |
McDonald’s Corp. | | | 4,509 | | | | 460,549 | |
| | | | | | | | |
| | | | | | | 699,063 | |
| | | | | | | | |
| |
TOTAL CONSUMER, CYCLICAL | | | | 699,063 | |
| | | | | | | | |
| |
Consumer, Non-Cyclical (1.41%) | | | | | |
Pharmaceuticals (1.41%) | | | | | |
Johnson & Johnson | | | 5,728 | | | | 488,197 | |
| | | | | | | | |
| |
TOTAL CONSUMER, NON-CYCLICAL | | | | 488,197 | |
| | | | | | | | |
| | |
Industrial (0.67%) | | | | | | | | |
Electronics (0.67%) | | | | | |
Agilent Technologies, Inc. | | | 5,625 | | | | 233,100 | |
| | | | | | | | |
| |
TOTAL INDUSTRIAL | | | | 233,100 | |
| | | | | | | | |
|
Technology (0.54%) | |
Computers (0.54%) | | | | | |
Apple, Inc. | | | 419 | | | | 185,512 | |
| | | | | | | | |
| |
TOTAL TECHNOLOGY | | | | 185,512 | |
| | | | | | | | |
| |
TOTAL COMMON STOCKS (Cost $1,907,694) | | | | 2,290,785 | |
| | | | | | | | |
|
EXCHANGE TRADED FUNDS (87.18%) | |
Debt (17.00%) | | | | | | | | |
iShares® iBoxx $ High Yield Corporate Bond Fund | | | 14,278 | | | | 1,368,546 | |
PIMCO 0-5 Year High Yield Corporate Bond Index ETF | | | 3,220 | | | | 340,515 | |
PowerShares® Senior Loan Portfolio | | | 46,050 | | | | 1,159,999 | |
SPDR® Barclays Capital High Yield Bond ETF | | | 52,953 | | | | 2,210,788 | |
| | | | | | | | |
| | | Shares | | | Value (Note 2) | |
| |
Debt (continued) | | | | | | | | |
SPDR® Barclays Short Term High Yield Bond ETF | | | 10,889 | | | $ | 339,083 | |
Vanguard® Short-Term Corporate Bond ETF | | | 5,763 | | | | 464,383 | |
| | | | | | | | |
| | | | | | | 5,883,314 | |
| | | | | | | | |
| | |
Equity (70.18%) | | | | | | | | |
Global X FTSE® ASEAN 40 ETF | | | 18,341 | | | | 337,869 | |
Guggenheim S&P 500® Equal Weight Healthcare ETF | | | 2,270 | | | | 206,393 | |
iShares® MSCI All Country Asia ex Japan Index Fund | | | 5,585 | | | | 337,446 | |
iShares® MSCI Australia Index Fund | | | 7,494 | | | | 210,581 | |
iShares® MSCI Canada Index Fund | | | 11,419 | | | | 319,960 | |
iShares® MSCI EAFE Index Fund | | | 36,436 | | | | 2,256,846 | |
iShares® MSCI Emerging Markets Index Fund | | | 11,308 | | | | 489,523 | |
iShares® MSCI EMU Index Fund | | | 8,151 | | | | 281,454 | |
iShares® MSCI Japan Index Fund | | | 20,265 | | | | 237,101 | |
iShares® MSCI Pacific ex-Japan Index Fund | | | 12,110 | | | | 624,876 | |
PowerShares® Buyback Achievers Portfolio | | | 10,183 | | | | 352,637 | |
PowerShares® FTSE® RAFI Developed Markets ex-U.S. Portfolio | | | 19,302 | | | | 754,901 | |
PowerShares® S&P 500® High Beta Port ETF | | | 106,903 | | | | 2,547,499 | |
SPDR® S&P® Insurance ETF | | | 10,386 | | | | 550,666 | |
Vanguard® Dividend Appreciation ETF | | | 10,500 | | | | 701,400 | |
Vanguard® FTSE® Emerging Markets ETF | | | 27,295 | | | | 1,194,429 | |
Vanguard® FTSE® Europe ETF | | | 37,365 | | | | 1,919,066 | |
Vanguard® Industrials ETF | | | 4,279 | | | | 337,613 | |
Vanguard® Information Technology ETF | | | 4,813 | | | | 352,745 | |
WisdomTree® Emerging Markets Small-Cap Dividend Fund | | | 10,646 | | | | 560,725 | |
WisdomTree® Europe Hedged Equity Fund | | | 19,959 | | | | 1,009,925 | |
WisdomTree® Japan Hedged Equity Fund | | | 45,539 | | | | 2,165,835 | |
| | |
| RiverFront Dynamic Equity Income Fund | | |
| Statement of Investments | | April 30, 2013 |
| | | | | | | | |
| | | Shares | | | Value (Note 2) | |
| |
Equity (continued) | | | | | |
WisdomTree® LargeCap Dividend Fund | | | 108,551 | | | $ | 6,546,711 | |
| | | | | | | | |
| | | | | | | 24,296,201 | |
| | | | | | | | |
| |
TOTAL EXCHANGE TRADED FUNDS (Cost $28,015,624) | | | | 30,179,515 | |
| | | | | | | | |
|
EXCHANGE TRADED NOTES (2.87%) | |
Equity (2.87%) | | | | | | | | |
Credit Suisse Cushing® 30 MLP Index ETN | | | 19,471 | | | | 566,801 | |
ETRACS Alerian MLP Infrastructure Index ETN | | | 11,238 | | | | 427,943 | |
| | | | | | | | |
| | | | | | | 994,744 | |
| | | | | | | | |
| |
TOTAL EXCHANGE TRADED NOTES (Cost $839,111) | | | | 994,744 | |
| | | | | | | | |
| | | | | | | | | | | | |
| | | 7-Day
Yield | | | Shares | | | Value (Note 2) | |
| |
SHORT TERM INVESTMENTS (3.30%) | |
Money Market Fund (3.30%) | |
Dreyfus Cash Management Fund, Institutional Class | | | 0.050 | % | | | 1,141,671 | | | | 1,141,671 | |
| | | | | | | | | | | | |
| |
TOTAL SHORT TERM INVESTMENTS (Cost $1,141,671) | | | | 1,141,671 | |
| | | | | | | | | | | | |
| |
TOTAL INVESTMENTS (99.97%) (Cost $31,904,100) | | | $ | 34,606,715 | |
| |
Other Assets In Excess Of Liabilities (0.03%) | | | | 10,495 | |
| | | | | | | | | | | | |
| |
NET ASSETS (100.00%) | | | $ | 34,617,210 | |
| | | | | | | | | | | | |
| (a) | Non-Income Producing Security. |
Common Abbreviations:
ASEAN - Association of Southeast Asian Nations.
EAFE - Europe, Australia, and Far East.
EMU - European Monetary Union.
ETF - Exchange Traded Fund.
ETN - Exchange Traded Note.
ETRACS - UBS AG Exchange Traded Access Securities.
FTSE - Financial Times and the London Stock Exchange.
MLP - Master Limited Partnership.
MSCI - Morgan Stanley Capital International.
RAFI - Research Affiliates Fundamental Index.
S&P - Standard and Poor’s.
SPDR - Standard and Poor’s Depositary Receipt.
For Fund compliance purposes, the Fund’s industry classifications refer to any one or more of the industry sub-classifications used by one or more widely recognized market indexes or ratings group indexes, and/or as defined by Fund management. This definition may not apply for purposes of this report, which may combine industry sub-classifications for reporting ease. Industries are shown as a percent of net assets.
See Notes to Financial Statements.
| | |
| RiverFront Global Allocation Fund | | |
| Statement of Investments | | April 30, 2013 |
| | | | | | |
| | | Shares | | | Value (Note 2) |
|
COMMON STOCKS (5.67%) |
Basic Materials (0.63%) |
Forest Products & Paper (0.63%) |
MeadWestvaco Corp. | | | 4,465 | | | $ 153,953 |
| | | | | | |
| |
TOTAL BASIC MATERIALS | | | 153,953 |
| | | | | | |
| | |
Communications (0.81%) | | | | | | |
Media (0.81%) | | | |
Time Warner, Inc. | | | 3,340 | | | 199,665 |
| | | | | | |
| |
TOTAL COMMUNICATIONS | | | 199,665 |
| | | | | | |
| |
Consumer, Cyclical (1.35%) | | | |
Retail (1.35%) | | | | | | |
Dollar Tree, Inc.(a) | | | 3,553 | | | 168,981 |
McDonald’s Corp. | | | 1,591 | | | 162,505 |
| | | | | | |
| | | | | | 331,486 |
| | | | | | |
| |
TOTAL CONSUMER, CYCLICAL | | | 331,486 |
| | | | | | |
|
Consumer, Non-Cyclical (1.25%) |
Pharmaceuticals (1.25%) |
Johnson & Johnson | | | 1,847 | | | 157,420 |
Omnicare, Inc. | | | 3,452 | | | 151,094 |
| | | | | | |
| | | | | | 308,514 |
| | | | | | |
| |
TOTAL CONSUMER, NON-CYCLICAL | | | 308,514 |
| | | | | | |
| | |
Industrial (1.08%) | | | | | | |
Electronics (0.48%) | | | | | | |
Agilent Technologies, Inc. | | | 2,842 | | | 117,772 |
| | | | | | |
|
Miscellaneous Manufacturing (0.60%) |
Danaher Corp. | | | 2,418 | | | 147,353 |
| | | | | | |
| | |
TOTAL INDUSTRIAL | | | | | | 265,125 |
| | | | | | |
| | |
Technology (0.55%) | | | | | | |
Computers (0.55%) | | | |
Apple, Inc. | | | 307 | | | 135,924 |
| | | | | | |
| | |
TOTAL TECHNOLOGY | | | | | | 135,924 |
| | | | | | |
| |
TOTAL COMMON STOCKS (Cost $1,196,636) | | | 1,394,667 |
| | | | | | |
|
EXCHANGE TRADED FUNDS (90.76%) |
Debt (9.85%) | | | | | | |
iShares® Barclays 1-3 Year Credit Bond Fund | | | 4,252 | | | 448,969 |
PIMCO 0-5 Year High Yield Corporate Bond Index ETF | | | 2,277 | | | 240,793 |
| | | | | | |
| | | Shares | | | Value (Note 2) |
|
Debt (continued) | | | | | | |
PowerShares® Senior Loan Portfolio | | | 38,250 | | | $ 963,517 |
SPDR® Barclays Short Term High Yield Bond ETF | | | 7,730 | | | 240,712 |
Vanguard® Short-Term Corporate Bond ETF | | | 6,565 | | | 529,008 |
| | | | | | |
| | | | | | 2,422,999 |
| | | | | | |
| | |
Equity (80.91%) | | | | | | |
First Trust Dow Jones® Internet Index Fund(a) | | | 3,003 | | | 130,150 |
First Trust Dow Jones® Select Micro-Cap Index Fund | | | 22,199 | | | 550,091 |
Global X FTSE® ASEAN 40 ETF | | | 13,296 | | | 244,932 |
Guggenheim S&P 500® Equal Weight Healthcare ETF | | | 1,696 | | | 154,204 |
iShares® MSCI ACWI ex US Index Fund | | | 10,042 | | | 445,363 |
iShares® MSCI Australia Index Fund | | | 7,076 | | | 198,836 |
iShares® MSCI Canada Index Fund | | | 14,227 | | | 398,641 |
iShares® MSCI EAFE Index Fund | | | 29,060 | | | 1,799,976 |
iShares® MSCI Emerging Markets Index Fund | | | 11,606 | | | 502,424 |
iShares® MSCI EMU Index Fund | | | 7,614 | | | 262,911 |
iShares® MSCI Germany Index Fund | | | 18,634 | | | 474,608 |
iShares® MSCI Japan Index Fund | | | 32,473 | | | 379,934 |
iShares® MSCI Pacific ex-Japan Index Fund | | | 10,255 | | | 529,158 |
iShares® MSCI Switzerland Index Fund | | | 8,742 | | | 266,631 |
iShares® MSCI United Kingdom Index Fund | | | 10,971 | | | 206,145 |
iShares® S&P SmallCap 600® Index Fund | | | 7,233 | | | 628,692 |
Market Vectors® Oil Service ETF | | | 2,757 | | | 117,917 |
PowerShares® Buyback Achievers Portfolio | | | 7,256 | | | 251,275 |
Powershares® DWA Technical Leaders Portfolio | | | 16,142 | | | 512,509 |
PowerShares® FTSE® RAFI Developed Markets ex-U.S. Portfolio | | | 9,356 | | | 365,913 |
PowerShares® S&P 500® High Beta Port ETF | | | 80,738 | | | 1,923,987 |
SPDR® S&P® Insurance ETF | | | 6,890 | | | 365,308 |
SPDR® S&P® Semiconductor ETF | | | 2,436 | | | 120,511 |
Vanguard® FTSE® Emerging Markets ETF | | | 30,885 | | | 1,351,528 |
Vanguard® FTSE® Europe ETF | | | 18,985 | | | 975,070 |
Vanguard® Large-Cap ETF | | | 24,529 | | | 1,794,787 |
Vanguard® MSCI EAFE ETF | | | 26,728 | | | 1,024,484 |
| | |
| RiverFront Global Allocation Fund | | |
| Statement of Investments | | April 30, 2013 |
| | | | | | | | |
| | | Shares | | | Value (Note 2) | |
| |
Equity (continued) | | | | | | | | |
Wilshire Micro-Cap ETF | | | 26,788 | | | $ | 571,120 | |
WisdomTree® Emerging Markets Small-Cap Dividend Fund | | | 10,435 | | | | 549,611 | |
WisdomTree® Europe Hedged Equity Fund | | | 14,150 | | | | 715,990 | |
WisdomTree® Japan Hedged Equity Fund | | | 33,163 | | | | 1,577,232 | |
WisdomTree® LargeCap Dividend Fund | | | 8,602 | | | | 518,787 | |
| | | | | | | | |
| | | | | | | 19,908,725 | |
| | | | | | | | |
| |
TOTAL EXCHANGE TRADED FUNDS (Cost $20,468,197) | | | | 22,331,724 | |
| | | | | | | | |
| | | | | | | | | | | | |
| | | 7-Day
Yield | | | Shares | | | Value (Note 2) | |
| |
SHORT TERM INVESTMENTS (3.23%) | |
Money Market Fund (3.23%) | | | | | |
Dreyfus Cash Management Fund, Institutional Class | | | 0.050 | % | | | 794,854 | | | | 794,854 | |
| | | | | | | | | | | | |
| |
TOTAL SHORT TERM INVESTMENTS (Cost $794,854) | | | | 794,854 | |
| | | | | | | | | | | | |
| |
TOTAL INVESTMENTS (99.66%) (Cost $22,459,687) | | | $ | 24,521,245 | |
| |
Other Assets In Excess Of Liabilities (0.34%) | | | | 83,318 | |
| | | | | | | | | | | | |
| |
NET ASSETS (100.00%) | | | $ | 24,604,563 | |
| | | | | | | | | | | | |
| (a) | Non-Income Producing Security. |
Common Abbreviations:
ACWI - All Country World Index.
ASEAN - Association of Southeast Asian Nations.
DWA - Dorsey Wright & Associates.
EAFE - Europe, Australia, and Far East.
EMU - European Monetary Union.
ETF - Exchange Traded Fund.
FTSE - Financial Times and the London Stock Exchange.
MSCI - Morgan Stanley Capital International.
RAFI - Research Affiliates Fundamental Index.
S&P - Standard and Poor’s.
SPDR - Standard and Poor’s Depositary Receipt.
For Fund compliance purposes, the Fund’s industry classifications refer to any one or more of the industry sub-classifications used by one or more widely recognized market indexes or ratings group indexes, and/or as defined by Fund management. This definition may not apply for purposes of this report, which may combine industry sub-classifications for reporting ease. Industries are shown as a percent of net assets.
See Notes to Financial Statements.
| | |
| RiverFront Global Growth Fund | | |
| Statement of Investments | | April 30, 2013 |
| | | | | | | | |
| | | Shares | | |
| Value
(Note 2) |
|
| |
COMMON STOCKS (6.57%) | | | | | |
Basic Materials (0.60%) | | | | | | | | |
Forest Products & Paper (0.60%) | |
MeadWestvaco Corp. | | | 9,695 | | | $ | 334,284 | |
| | | | | | | | |
| |
TOTAL BASIC MATERIALS | | | | 334,284 | |
| | | | | | | | |
|
Communications (1.05%) | |
Media (1.05%) | | | | | | | | |
Time Warner, Inc. | | | 9,873 | | | | 590,208 | |
| | | | | | | | |
| |
TOTAL COMMUNICATIONS | | | | 590,208 | |
| | | | | | | | |
| |
Consumer, Cyclical (1.42%) | | | | | |
Retail (1.42%) | | | | | | | | |
Dollar Tree, Inc.(a) | | | 8,070 | | | | 383,809 | |
McDonald’s Corp. | | | 4,033 | | | | 411,931 | |
| | | | | | | | |
| | | | | | | 795,740 | |
| | | | | | | | |
TOTAL CONSUMER, CYCLICAL | | | | 795,740 | |
| | | | | | | | |
| |
Consumer, Non-Cyclical (1.57%) | | | | | |
Pharmaceuticals (1.57%) | | | | | |
Johnson & Johnson | | | 5,641 | | | | 480,782 | |
Omnicare, Inc. | | | 9,209 | | | | 403,078 | |
| | | | | | | | |
| | | | | | | 883,860 | |
| | | | | | | | |
| |
TOTAL CONSUMER, NON-CYCLICAL | | | | 883,860 | |
| | | | | | | | |
| | |
Industrial (1.37%) | | | | | | | | |
Electronics (0.67%) | | | | | | | | |
Agilent Technologies, Inc. | | | 9,101 | | | | 377,145 | |
| | | | | | | | |
| |
Miscellaneous Manufacturing (0.70%) | | | | | |
Danaher Corp. | | | 6,383 | | | | 388,980 | |
| | | | | | | | |
| | |
TOTAL INDUSTRIAL | | | | | | | 766,125 | |
| | | | | | | | |
| |
Technology (0.56%) | | | | | |
Computers (0.56%) | | | | | |
Apple, Inc. | | | 710 | | | | 314,353 | |
| | | | | | | | |
| |
TOTAL TECHNOLOGY | | | | 314,353 | |
| | | | | | | | |
| |
TOTAL COMMON STOCKS (Cost $2,979,381) | | | | 3,684,570 | |
| | | | | | | | |
|
EXCHANGE TRADED FUNDS (91.59%) | |
Equity (91.59%) | | | | | | | | |
First Trust Dow Jones®
Internet Index Fund(a) | | | 9,429 | | | | 408,653 | |
First Trust Dow Jones®
Select Micro-Cap Index Fund | | | 56,397 | | | | 1,397,518 | |
| | | | | | | | |
| | | Shares | | |
| Value
(Note 2) |
|
| |
Equity (continued) | | | | | | | | |
Global X FTSE® ASEAN 40 ETF | | | 30,574 | | | $ | 563,219 | |
Guggenheim S&P 500® Equal Weight Healthcare ETF | | | 4,449 | | | | 404,512 | |
iShares® MSCI ACWI ex US Index Fund | | | 22,913 | | | | 1,016,192 | |
iShares® MSCI All Country Asia ex Japan Index Fund | | | 14,388 | | | | 869,323 | |
iShares® MSCI Australia Index Fund | | | 16,025 | | | | 450,303 | |
iShares® MSCI Canada Index Fund | | | 38,123 | | | | 1,068,206 | |
iShares® MSCI EAFE Index Fund | | | 43,012 | | | | 2,664,163 | |
iShares® MSCI Emerging Markets Index Fund | | | 36,786 | | | | 1,592,466 | |
iShares® MSCI EMU Index Fund | | | 27,398 | | | | 946,053 | |
iShares® MSCI Germany Index Fund | | | 55,334 | | | | 1,409,357 | |
iShares® MSCI Japan Index Fund | | | 91,999 | | | | 1,076,388 | |
iShares® MSCI Pacific ex-Japan Index Fund | | | 30,199 | | | | 1,558,268 | |
iShares® MSCI Switzerland Index Fund | | | 19,968 | | | | 609,024 | |
iShares® MSCI United Kingdom Index Fund | | | 23,774 | | | | 446,713 | |
iShares® S&P SmallCap 600® Index Fund | | | 17,926 | | | | 1,558,128 | |
Market Vectors® Oil Service ETF | | | 9,461 | | | | 404,647 | |
PowerShares® Buyback Achievers Portfolio | | | 16,527 | | | | 572,330 | |
Powershares® DWA Technical Leaders Portfolio | | | 36,958 | | | | 1,173,417 | |
PowerShares® FTSE® RAFI Developed Markets ex-U.S. Portfolio | | | 28,399 | | | | 1,110,685 | |
PowerShares® S&P 500® High Beta Port ETF | | | 208,833 | | | | 4,976,490 | |
SPDR® S&P® Insurance ETF | | | 24,069 | | | | 1,276,138 | |
SPDR® S&P® Semiconductor ETF | | | 5,425 | | | | 268,380 | |
Vanguard® FTSE® Emerging Markets ETF | | | 77,364 | | | | 3,385,449 | |
Vanguard® FTSE® Europe ETF | | | 80,304 | | | | 4,124,413 | |
Vanguard® Industrials ETF | | | 3,541 | | | | 279,385 | |
Vanguard® Information Technology ETF | | | 7,787 | | | | 570,709 | |
Vanguard® Large-Cap ETF | | | 27,807 | | | | 2,034,638 | |
Vanguard® MSCI EAFE ETF | | | 65,692 | | | | 2,517,974 | |
Wilshire Micro-Cap ETF | | | 67,562 | | | | 1,440,422 | |
WisdomTree® Emerging Markets Small-Cap Dividend Fund | | | 23,659 | | | | 1,246,120 | |
WisdomTree® Europe Hedged Equity Fund | | | 32,568 | | | | 1,647,941 | |
| | |
| RiverFront Global Growth Fund | | |
| Statement of Investments | | April 30, 2013 |
| | | | | | | | |
| | | Shares | | | Value (Note 2) | |
| |
Equity (continued) | | | | | | | | |
WisdomTree® Japan Hedged
Equity Fund | | | 89,759 | | | $ | 4,268,938 | |
WisdomTree® LargeCap
Dividend Fund | | | 34,005 | | | | 2,050,842 | |
| | | | | | | | |
| | | | | | | 51,387,404 | |
| | | | | | | | |
| |
TOTAL EXCHANGE TRADED FUNDS (Cost $44,571,776) | | | | 51,387,404 | |
| | | | | | | | |
| | | | | | | | | | | | |
| | | |
| | | 7-Day
Yield | | | Shares | | | Value (Note 2) | |
| |
SHORT TERM INVESTMENTS (2.02%) | | | | | |
Money Market Fund (2.02%) | | | | | |
Dreyfus Cash
Management
Fund, Institutional
Class | | | 0.050 | % | | | 1,131,271 | | | | 1,131,271 | |
| | | | | | | | | | | | |
| |
TOTAL SHORT TERM INVESTMENTS (Cost $1,131,271) | | | | 1,131,271 | |
| | | | | | | | | | | | |
| |
TOTAL INVESTMENTS (100.18%) (Cost $48,682,428) | | | $ | 56,203,245 | |
| | | | | | | | | | | | |
| |
Liabilities In Excess Of Other Assets
(-0.18%) | | | | (99,675 | ) |
| | | | | | | | | | | | |
| |
NET ASSETS (100.00%) | | | $ | 56,103,570 | |
| | | | | | | | | | | | |
| (a) | Non-Income Producing Security. |
Common Abbreviations:
|
| ACWI - All Country World Index. |
ASEAN - Association of Southeast Asian Nations. DWA - Dorsey Wright & Associates. |
EAFE - Europe, Australia, and Far East. ETF - Exchange Traded Fund. |
| EMU - European Monetary Union |
| FTSE - Financial Times and the London Stock Exchange. MSCI - Morgan Stanley Capital International. |
RAFI - Research Affiliates Fundamental Index. S&P - Standard and Poor’s. |
| SPDR - Standard and Poor’s Depositary Receipt. |
For Fund compliance purposes, the Fund’s industry classifications refer to any one or more of the industry sub-classifications used by one or more widely recognized market indexes or ratings group indexes, and/or as defined by Fund management. This definition may not apply for purposes of this report, which may combine industry sub-classifications for reporting ease. Industries are shown as a percent of net assets.
See Notes to Financial Statements.
| | |
| RiverFront Moderate Growth & Income Fund |
| Statement of Investments | | April 30, 2013 |
| | | | | | |
| | | Shares | | | Value (Note 2) |
|
COMMON STOCKS (5.49%) | | | |
Basic Materials (0.95%) | | | |
Forest Products & Paper (0.95%) |
MeadWestvaco Corp. | | | 29,524 | | | $ 1,017,987 |
| | | | | | |
| |
TOTAL BASIC MATERIALS | | | 1,017,987 |
| | | | | | |
| |
Communications (0.68%) | | | |
Media (0.68%) | | | | | | |
Time Warner, Inc. | | | 12,250 | | | 732,305 |
| | | | | | |
| |
TOTAL COMMUNICATIONS | | | 732,305 |
| | | | | | |
| |
Consumer, Cyclical (1.69%) | | | |
Retail (1.69%) | | | | | | |
Dollar Tree, Inc.(a) | | | 15,429 | | | 733,803 |
McDonald’s Corp. | | | 10,675 | | | 1,090,345 |
| | | | | | |
| | | | | | 1,824,148 |
| | | | | | |
| |
TOTAL CONSUMER, CYCLICAL | | | 1,824,148 |
| | | | | | |
Consumer, Non-Cyclical (1.11%) |
Pharmaceuticals (1.11%) | | | |
Johnson & Johnson | | | 14,026 | | | 1,195,436 |
| | | | | | |
| |
TOTAL CONSUMER, NON-CYCLICAL | | | 1,195,436 |
| | | | | | |
| |
Industrial (0.58%) | | | |
Electronics (0.58%) | | | |
Agilent Technologies, Inc. | | | 15,056 | | | 623,921 |
| | | | | | |
| |
TOTAL INDUSTRIAL | | | 623,921 |
| | | | | | |
| |
Technology (0.48%) | | | |
Computers (0.48%) | | | |
Apple, Inc. | | | 1,166 | | | 516,246 |
| | | | | | |
| |
TOTAL TECHNOLOGY | | | 516,246 |
| | | | | | |
| |
TOTAL COMMON STOCKS (Cost $4,943,534) | | | 5,910,043 |
| | | | | | |
|
EXCHANGE TRADED FUNDS (87.56%) |
Debt (34.56%) | | | | | | |
iShares® Barclays 1-3 Year Credit Bond Fund | | | 74,842 | | | 7,902,567 |
iShares® iBoxx $ High Yield Corporate Bond Fund | | | 54,055 | | | 5,181,172 |
PIMCO 0-5 Year High Yield
Corporate Bond Index ETF | | | 9,898 | | | 1,046,713 |
PowerShares® Senior Loan Portfolio | | | 158,719 | | | 3,998,132 |
| | | | | | | | |
| | | Shares | | | Value (Note 2) | |
| |
Debt (continued) | | | | | | | | |
SPDR® Barclays Capital High Yield Bond ETF | | | 139,124 | | | $ | 5,808,427 | |
SPDR® Barclays Short Term High Yield Bond ETF | | | 33,742 | | | | 1,050,726 | |
Vanguard® Short-Term Corporate Bond ETF | | | 151,118 | | | | 12,177,088 | |
| | | | | | | | |
| | | | | | | 37,164,825 | |
| | | | | | | | |
Equity (53.00%) | | | | | | | | |
Guggenheim S&P 500® Equal Weight Healthcare ETF | | | 12,560 | | | | 1,141,980 | |
iShares® MSCI Canada Index Fund | | | 28,207 | | | | 790,360 | |
iShares® MSCI EAFE Index Fund | | | 38,492 | | | | 2,384,195 | |
iShares® MSCI Pacific ex-Japan Index Fund | | | 21,843 | | | | 1,127,099 | |
PowerShares® Buyback Achievers Portfolio | | | 31,421 | | | | 1,088,109 | |
PowerShares® FTSE® RAFI Developed Markets ex-U.S. Portfolio | | | 40,883 | | | | 1,598,934 | |
PowerShares® S&P 500® High Beta Port ETF | | | 205,431 | | | | 4,895,421 | |
PowerShares® S&P 500® Low Volatility Portfolio | | | 115,347 | | | | 3,711,867 | |
SPDR® S&P® Insurance ETF | | | 38,165 | | | | 2,023,508 | |
Vanguard® Dividend Appreciation ETF | | | 74,605 | | | | 4,983,614 | |
Vanguard® FTSE® Emerging Markets ETF | | | 175,589 | | | | 7,683,775 | |
Vanguard® FTSE® Europe ETF | | | 46,334 | | | | 2,379,714 | |
Vanguard® Industrials ETF | | | 9,176 | | | | 723,986 | |
Vanguard® Information Technology ETF | | | 15,030 | | | | 1,101,549 | |
WisdomTree® Europe Hedged Equity Fund | | | 61,519 | | | | 3,112,861 | |
WisdomTree® Japan Hedged Equity Fund | | | 107,136 | | | | 5,095,388 | |
WisdomTree® LargeCap Dividend Fund | | | 218,195 | | | | 13,159,341 | |
| | | | | | | | |
| | | | | | | 57,001,701 | |
| | | | | | | | |
TOTAL EXCHANGE TRADED FUNDS (Cost $88,296,011) | | | | 94,166,526 | |
| | | | | | | | |
| |
EXCHANGE TRADED NOTES (3.05%) | | | | | |
Equity (3.05%) | | | | | | | | |
Credit Suisse Cushing® 30 MLP Index ETN | | | 69,289 | | | | 2,017,003 | |
| | |
| RiverFront Moderate Growth & Income Fund |
| Statement of Investments | | April 30, 2013 |
| | | | | | | | |
| | | Shares | | | Value (Note 2) | |
| |
Equity (continued) | | | | | | | | |
ETRACS Alerian MLP
Infrastructure Index ETN | | | 33,045 | | | $ | 1,258,353 | |
| | | | | | | | |
| | | | | | | 3,275,356 | |
| | | | | | | | |
TOTAL EXCHANGE TRADED NOTES (Cost $2,841,872) | | | | | | | 3,275,356 | |
| | | | | | | | |
| | | | | | | | | | | | |
| | | |
| . | | 7-Day
Yield | | | Shares | | | Value (Note 2) | |
| |
SHORT TERM INVESTMENTS (3.84%) | | | | | |
Money Market Fund (3.84%) | | | | | |
Dreyfus Cash Management Fund,Institutional Class | | | 0.050 | % | | | 4,127,174 | | | | 4,127,174 | |
| | | | | | | | | | | | |
| | | | | | | | | | | | |
TOTAL SHORT TERM INVESTMENTS (Cost $4,127,174) | | | | 4,127,174 | |
| | | | | | | | | | | | |
| |
TOTAL INVESTMENTS (99.94%) (Cost $100,208,591) | | | | | |
| | |
| | | | | | | $ | 107,479,099 | |
| | | | | | | | | | | | |
| |
Other Assets In Excess Of Liabilities (0.06%) | | | | 64,629 | |
| | | | | | | | | | | | |
| | |
NET ASSETS (100.00%) | | | | | | | $ | 107,543,728 | |
| | | | | | | | | | | | |
| (a) | Non-Income Producing Security. |
Common Abbreviations:
|
EAFE - Europe, Australia, and Far East. ETF - Exchange Traded Fund. |
| ETN - Exchange Traded Note. |
ETRACS - UBS AG Exchange Traded Access Securities. FTSE - Financial Times and the London Stock Exchange. MLP - Master Limited Partnership. |
MSCI - Morgan Stanley Capital International. RAFI - Research Affiliates Fundamental Index. S&P - Standard and Poor’s. |
SPDR - Standard and Poor’s Depositary Receipt. |
For Fund compliance purposes, the Fund’s industry classifications refer to any one or more of the industry sub-classifications used by one or more widely recognized market indexes or ratings group indexes, and/or as defined by Fund management. This definition may not apply for purposes of this report, which may combine industry sub-classifications for reporting ease. Industries are shown as a percent of net assets.
See Notes to Financial Statements.
| | |
| RiverFront Global Allocation Series |
| Statements of Assets and Liabilities | | April 30, 2013 |
| | | | | | | | | | | | | | | | | | | | |
| | | RiverFront Conservative Income Builder Fund | | | RiverFront Dynamic Equity Income Fund | | | RiverFront
Global Allocation Fund | | | RiverFront
Global Growth
Fund | | | RiverFront
Moderate Growth
& Income Fund | |
| |
ASSETS | | | | | | | | | | | | | | | | | | | | |
Investments, at value | | $ | 3,426,704 | | | $ | 34,606,715 | | | $ | 24,521,245 | | | $ | 56,203,245 | | | $ | 107,479,099 | |
Receivable for investments sold | | | 51,533 | | | | – | | | | – | | | | – | | | | – | |
Receivable for shares sold | | | 100,000 | | | | 53,794 | | | | 114,128 | | | | 11,186 | | | | 199,419 | |
Dividends and interest receivable | | | 1,243 | | | | 4,650 | | | | 2,712 | | | | 2,491 | | | | 28,412 | |
Receivable due from adviser | | | 277 | | | | – | | | | – | | | | – | | | | – | |
Prepaid offering costs | | | 19,356 | | | | – | | | | – | | | | – | | | | – | |
Prepaid expenses and other assets | | | 10,427 | | | | 10,724 | | | | 10,345 | | | | 19,079 | | | | 11,326 | |
| |
Total Assets | | | 3,609,540 | | | | 34,675,883 | | | | 24,648,430 | | | | 56,236,001 | | | | 107,718,256 | |
| |
LIABILITIES | | | | | | | | | | | | | | | | | | | | |
Payable for shares redeemed | | | – | | | | 3,060 | | | | – | | | | 63,021 | | | | 27,971 | |
Investment advisory fees payable | | | – | | | | 12,138 | | | | 7,981 | | | | 26,647 | | | | 48,440 | |
Administration and transfer agency fees payable | | | 490 | | | | 4,083 | | | | 3,006 | | | | 6,221 | | | | 12,148 | |
Distribution and services fees payable | | | 1,837 | | | | 14,390 | | | | 9,299 | | | | 9,286 | | | | 47,950 | |
Trustees’ fees and expenses payable | | | 41 | | | | 415 | | | | 296 | | | | 695 | | | | 1,324 | |
Legal fees payable | | | 31 | | | | 292 | | | | 226 | | | | 488 | | | | 1,011 | |
Audit and tax fees payable | | | 15,395 | | | | 15,427 | | | | 15,414 | | | | 15,461 | | | | 15,510 | |
Custody fees payable | | | 4,682 | | | | 4,140 | | | | 4,430 | | | | 4,304 | | | | 4,706 | |
Printing fees payable | | | 196 | | | | 3,207 | | | | 2,326 | | | | 5,022 | | | | 9,227 | |
Accrued expenses and other liabilities | | | 506 | | | | 1,521 | | | | 889 | | | | 1,286 | | | | 6,241 | |
| |
Total Liabilities | | | 23,178 | | | | 58,673 | | | | 43,867 | | | | 132,431 | | | | 174,528 | |
| |
NET ASSETS | | $ | 3,586,362 | | | $ | 34,617,210 | | | $ | 24,604,563 | | | $ | 56,103,570 | | | $ | 107,543,728 | |
| |
NET ASSETS CONSIST OF | | | | | | | | | | | | | | | | | | | | |
Paid-in capital | | $ | 3,452,106 | | | $ | 31,311,028 | | | $ | 22,475,377 | | | $ | 45,634,757 | | | $ | 98,373,090 | |
Accumulated net investment income/(loss) | | | 8,505 | | | | 21,202 | | | | (19,166 | ) | | | (47,361 | ) | | | 83,800 | |
Accumulated net realized gain on investments | | | 16,667 | | | | 582,365 | | | | 86,794 | | | | 2,995,357 | | | | 1,816,330 | |
Net unrealized appreciation in value on investments | | | 109,084 | | | | 2,702,615 | | | | 2,061,558 | | | | 7,520,817 | | | | 7,270,508 | |
| |
NET ASSETS | | $ | 3,586,362 | | | $ | 34,617,210 | | | $ | 24,604,563 | | | $ | 56,103,570 | | | $ | 107,543,728 | |
| |
INVESTMENTS, AT COST | | $ | 3,317,620 | | | $ | 31,904,100 | | | $ | 22,459,687 | | | $ | 48,682,428 | | | $ | 100,208,591 | |
| |
See Notes to Financial Statements.
| | |
| RiverFront Global Allocation Series |
| Statements of Assets and Liabilities (continued) | | April 30, 2013 |
| | | | | | | | | | | | | | | | | | | | |
| | | RiverFront
Conservative
Income Builder
Fund | | | RiverFront
Dynamic Equity
Income Fund | | | RiverFront
Global Allocation
Fund | | | RiverFront
Global Growth
Fund | | | RiverFront
Moderate Growth
& Income Fund | |
| |
| | | | | |
PRICING OF SHARES | | | | | | | | | | | | | | | | | | | | |
Class A: | | | | | | | | | | | | | | | | | | | | |
Net Asset Value, offering and redemption price per share(a) | | $ | 10.48 | | | $ | 12.24 | | | $ | 11.93 | | | $ | 14.89 | | | $ | 11.66 | |
Net Assets | | $ | 606,650 | | | $ | 8,087,275 | | | $ | 8,243,778 | | | $ | 8,524,630 | | | $ | 29,066,102 | |
Shares of beneficial interest outstanding (unlimited number of shares, no par value common stock authorized) | | | 57,883 | | | | 660,933 | | | | 691,049 | | | | 572,644 | | | | 2,492,793 | |
Maximum offering price per share ((NAV/0.9450), based on maximum sales charge of 5.50% of the offering price) | | $ | 11.09 | | | $ | 12.95 | | | $ | 12.62 | | | $ | 15.76 | | | $ | 12.34 | |
Class C: | | | | | | | | | | | | | | | | | | | | |
Net Asset Value, offering and redemption price per share(a) | | $ | 10.51 | | | $ | 12.13 | | | $ | 11.84 | | | $ | 14.76 | | | $ | 11.62 | |
Net Assets | | $ | 2,264,461 | | | $ | 16,069,703 | | | $ | 9,686,120 | | | $ | 7,181,590 | | | $ | 52,579,411 | |
Shares of beneficial interest outstanding (unlimited number of shares, no par value common stock authorized) | | | 215,502 | | | | 1,324,887 | | | | 818,008 | | | | 486,498 | | | | 4,524,214 | |
Class I: | | | | | | | | | | | | | | | | | | | | |
Net Asset Value, offering and redemption price per share | | $ | 10.29 | | | $ | 12.16 | | | $ | 11.72 | | | $ | 14.92 | | | $ | 11.65 | |
Net Assets | | $ | 715,251 | | | $ | 10,460,232 | | | $ | 6,674,665 | | | $ | 7,769,234 | | | $ | 25,898,215 | |
Shares of beneficial interest outstanding (unlimited number of shares, no par value common stock authorized) | | | 69,517 | | | | 860,436 | | | | 569,626 | | | | 520,554 | | | | 2,222,965 | |
Class L: | | | | | | | | | | | | | | | | | | | | |
Net Asset Value, offering and redemption price per share | | | N/A | | | | N/A | | | | N/A | | | $ | 14.90 | | | | N/A | |
Net Assets | | | N/A | | | | N/A | | | | N/A | | | $ | 23,453,997 | | | | N/A | |
Shares of beneficial interest outstanding (unlimited number of shares, no par value common stock authorized) | | | N/A | | | | N/A | | | | N/A | | | | 1,573,943 | | | | N/A | |
Investor Class: | | | | | | | | | | | | | | | | | | | | |
Net Asset Value, offering and redemption price per share | | | N/A | | | | N/A | | | | N/A | | | $ | 14.82 | | | | N/A | |
Net Assets | | | N/A | | | | N/A | | | | N/A | | | $ | 9,174,119 | | | | N/A | |
Shares of beneficial interest outstanding (unlimited number of shares, no par value common stock authorized) | | | N/A | | | | N/A | | | | N/A | | | | 618,889 | | | | N/A | |
| (a) | Redemption price per share may be reduced for any applicable contingent deferred sales charge. For a description of a possible sales charge, please see the Fund’s Prospectus. |
See Notes to Financial Statements.
| | |
| RiverFront Global Allocation Series |
| Statements of Operations | | For the Year Ended April 30, 2013 |
| | | | | | | | | | | | | | | | | | | | |
| | | RiverFront
Conservative
Income Builder
Fund(a) | | | RiverFront
Dynamic Equity
Income Fund | | | RiverFront
Global Allocation
Fund | | | RiverFront
Global Growth Fund | | | RiverFront
Moderate Growth
& Income Fund | |
| |
INVESTMENT INCOME | | | | | | | | | | | | | | | | | | | | |
Dividends | | $ | 35,587 | | | $ | 961,507 | | | $ | 509,882 | | | $ | 1,152,632 | | | $ | 2,918,872 | |
Foreign taxes withheld on dividends | | | (11) | | | | (1,479) | | | | (427) | | | | (1,261) | | | | (3,943) | |
Other income | | | – | | | | 160 | | | | 70 | | | | 202 | | | | 339 | |
| |
Total Investment Income | | | 35,576 | | | | 960,188 | | | | 509,525 | | | | 1,151,573 | | | | 2,915,268 | |
| |
| | | | | |
EXPENSES | | | | | | | | | | | | | | | | | | | | |
Investment advisory fees | | | 10,979 | | | | 247,219 | | | | 173,240 | | | | 435,643 | | | | 748,999 | |
Administrative and transfer agency fees | | | 2,369 | | | | 36,127 | | | | 26,584 | | | | 63,990 | | | | 104,343 | |
Distribution and service fees | | | | | | | | | | | | | | | | | | | | |
Class A | | | 345 | | | | 16,721 | | | | 16,789 | | | | 16,687 | | | | 59,648 | |
Class C | | | 8,379 | | | | 141,954 | | | | 90,128 | | | | 66,817 | | | | 447,430 | |
Investor Class | | | – | | | | – | | | | – | | | | 22,758 | | | | – | |
Legal fees | | | 554 | | | | 2,718 | | | | 1,915 | | | | 4,192 | | | | 8,073 | |
Audit and tax fees | | | 16,547 | | | | 15,934 | | | | 14,618 | | | | 14,712 | | | | 20,153 | |
Reports to shareholders and printing fees | | | 313 | | | | 8,582 | | | | 6,017 | | | | 14,717 | | | | 22,038 | |
State registration fees | | | 785 | | | | 42,291 | | | | 40,984 | | | | 60,076 | | | | 48,140 | |
Insurance fees | | | 6 | | | | 995 | | | | 786 | | | | 2,270 | | | | 2,589 | |
Custody fees | | | 9,493 | | | | 13,139 | | | | 13,603 | | | | 13,817 | | | | 13,625 | |
Trustees’ fees and expenses | | | 87 | | | | 2,029 | | | | 1,390 | | | | 3,544 | | | | 6,284 | |
Offering costs | | | 33,600 | | | | – | | | | – | | | | – | | | | – | |
Miscellaneous expenses | | | 3,463 | | | | 10,299 | | | | 8,431 | | | | 13,776 | | | | 23,473 | |
| |
Total Expense | | | 86,920 | | | | 538,008 | | | | 394,485 | | | | 732,999 | | | | 1,504,795 | |
Less fees waived/reimbursed by investment advisor (Note 7) | | | | | | | | | | | | | | | | | | | | |
Class A | | | (6,224) | | | | (25,434) | | | | (32,881) | | | | (33,985) | | | | (49,603) | |
Class C | | | (38,763) | | | | (54,152) | | | | (44,218) | | | | (34,650) | | | | (92,197) | |
Class I | | | (21,584) | | | | (29,280) | | | | (21,009) | | | | (27,901) | | | | (38,570) | |
Class L | | | – | | | | – | | | | – | | | | (116,964) | | | | – | |
Investor Class | | | – | | | | – | | | | – | | | | (47,518) | | | | – | |
| |
Net Expenses | | | 20,349 | | | | 429,142 | | | | 296,377 | | | | 471,981 | | | | 1,324,425 | |
| |
Net Investment Income | | | 15,227 | | | | 531,046 | | | | 213,148 | | | | 679,592 | | | | 1,590,843 | |
| |
Net realized gain on investments | | | 16,667 | | | | 1,802,700 | | | | 1,215,328 | | | | 4,550,863 | | | | 3,679,508 | |
Net change in unrealized appreciation on investments | | | 109,084 | | | | 764,280 | | | | 803,271 | | | | 1,032,501 | | | | 2,504,601 | |
| |
NET REALIZED AND UNREALIZED GAIN ON INVESTMENTS | | | 125,751 | | | | 2,566,980 | | | | 2,018,599 | | | | 5,583,364 | | | | 6,184,109 | |
| |
NET INCREASE IN NET ASSETS RESULTING FROM OPERATIONS | | $ | 140,978 | | | $ | 3,098,026 | | | $ | 2,231,747 | | | $ | 6,262,956 | | | $ | 7,774,952 | |
| |
| (a) | The Fund commenced operations on September 4, 2012. |
See Notes to Financial Statements.
| | |
| RiverFront Conservative Income Builder Fund |
| Statements of Changes in Net Assets | | |
| | | | |
| | | For the Period
September 4, 2012
(Commencement) to
April 30, 2013 | |
| |
OPERATIONS | | | | |
Net investment income | | $ | 15,227 | |
Net realized gain on investments | | | 16,667 | |
Net change in unrealized appreciation on investments | | | 109,084 | |
| |
Net Increase in Net Assets Resulting from Operations | | | 140,978 | |
| |
| |
DISTRIBUTIONS | | | | |
Dividends to shareholders from net investment income | | | | |
Class A | | | (895) | |
Class C | | | (3,477) | |
Class I | | | (12,108) | |
| |
Net Decrease in Net Assets from Distributions | | | (16,480) | |
| |
| |
BENEFICIAL INTEREST TRANSACTIONS (NOTE 6) | | | | |
Shares sold | | | | |
Class A | | | 590,998 | |
Class C | | | 2,176,853 | |
Class I | | | 745,479 | |
Dividends reinvested | | | | |
Class A | | | 475 | |
Class C | | | 2,582 | |
Class I | | | 12,108 | |
Shares redeemed | | | | |
Class C | | | (6,853) | |
Class I | | | (59,778) | |
| |
Net Increase in Net Assets Derived from Beneficial Interest Transactions | | | 3,461,864 | |
| |
| |
Net increase in net assets | | | 3,586,362 | |
| |
NET ASSETS | | | | |
Beginning of period | | | – | |
| |
End of year * | | $ | 3,586,362 | |
| |
*Including accumulated net investment income of: | | $ | 8,505 | |
See Notes to Financial Statements.
| | |
| RiverFront Dynamic Equity Income Fund |
| Statements of Changes in Net Assets | | |
| | | | | | | | |
| | | For the Year Ended
April 30, 2013 | | | For the Year Ended
April 30, 2012 | |
| |
OPERATIONS | | | | | | | | |
Net investment income | | $ | 531,046 | | | $ | 288,918 | |
Net realized gain/(loss) on investments | | | 1,802,700 | | | | (1,202,441) | |
Net change in unrealized appreciation on investments | | | 764,280 | | | | 646,260 | |
| |
Net Increase/(Decrease) in Net Assets Resulting from Operations | | | 3,098,026 | | | | (267,263) | |
| |
DISTRIBUTIONS | | | | | | | | |
Dividends to shareholders from net investment income | | | | | | | | |
Class A | | | (140,732) | | | | (87,846) | |
Class C | | | (192,727) | | | | (114,982) | |
Class I | | | (177,578) | | | | (86,665) | |
Dividends to shareholders from tax return of capital | | | | | | | | |
Class A | | | – | | | | (4,982) | |
Class C | | | – | | | | (6,644) | |
Class I | | | – | | | | (5,785) | |
| |
Net Decrease in Net Assets from Distributions | | | (511,037) | | | | (306,904) | |
| |
BENEFICIAL INTEREST TRANSACTIONS (NOTE 6) | | | | | | | | |
Shares sold | | | | | | | | |
Class A | | | 3,202,766 | | | | 5,884,180 | |
Class C | | | 4,609,418 | | | | 6,381,158 | |
Class I | | | 5,250,086 | | | | 5,159,764 | |
Dividends reinvested | | | | | | | | |
Class A | | | 129,832 | | | | 89,572 | |
Class C | | | 180,549 | | | | 114,439 | |
Class I | | | 159,280 | | | | 88,904 | |
Shares redeemed | | | | | | | | |
Class A | | | (2,936,263) | | | | (4,149,403) | |
Class C | | | (3,724,460) | | | | (1,768,723) | |
Class I | | | (2,581,492) | | | | (1,732,169) | |
| |
Net Increase in Net Assets Derived from Beneficial Interest Transactions | | | 4,289,716 | | | | 10,067,722 | |
| |
Net increase in net assets | | | 6,876,705 | | | | 9,493,555 | |
NET ASSETS | | | | | | | | |
Beginning of year | | | 27,740,505 | | | | 18,246,950 | |
| |
End of year * | | $ | 34,617,210 | | | $ | 27,740,505 | |
| |
*Including accumulated net investment income of: | | $ | 21,202 | | | $ | – | |
See Notes to Financial Statements.
| | |
| RiverFront Global Allocation Fund |
| Statements of Changes in Net Assets | | |
| | | | | | | | |
| | | For the Year Ended
April 30, 2013 | | | For the Year Ended
April 30, 2012 | |
| |
OPERATIONS | | | | | | | | |
Net investment income | | $ | 213,148 | | | $ | 134,141 | |
Net realized gain/(loss) on investments | | | 1,215,328 | | | | (1,124,310) | |
Net change in unrealized appreciation on investments | | | 803,271 | | | | 342,565 | |
| |
Net Increase/(Decrease) in Net Assets Resulting from Operations | | | 2,231,747 | | | | (647,604) | |
| |
DISTRIBUTIONS | | | | | | | | |
Dividends to shareholders from net investment income | | | | | | | | |
Class A | | | (97,608) | | | | (60,313) | |
Class C | | | (82,166) | | | | (22,209) | |
Class I | | | (70,616) | | | | (32,904) | |
Dividends to shareholders from net realized gains | | | | | | | | |
Class A | | | – | | | | (5,804) | |
Class C | | | – | | | | (6,150) | |
Class I | | | – | | | | (2,718) | |
| |
Net Decrease in Net Assets from Distributions | | | (250,390) | | | | (130,098) | |
| |
BENEFICIAL INTEREST TRANSACTIONS (NOTE 6) | | | | | | | | |
Shares sold | | | | | | | | |
Class A | | | 3,042,104 | | | | 6,877,768 | |
Class C | | | 2,492,791 | | | | 4,698,847 | |
Class I | | | 4,368,510 | | | | 4,167,358 | |
Dividends reinvested | | | | | | | | |
Class A | | | 89,657 | | | | 62,009 | |
Class C | | | 76,038 | | | | 26,544 | |
Class I | | | 68,350 | | | | 35,623 | |
Shares redeemed | | | | | | | | |
Class A | | | (1,396,094) | | | | (5,737,887) | |
Class C | | | (3,584,254) | | | | (3,041,562) | |
Class I | | | (1,712,016) | | | | (2,650,489) | |
| |
Net Increase in Net Assets Derived from Beneficial Interest Transactions | | | 3,445,086 | | | | 4,438,211 | |
| |
Net increase in net assets | | | 5,426,443 | | | | 3,660,509 | |
NET ASSETS | | | | | | | | |
Beginning of year | | | 19,178,120 | | | | 15,517,611 | |
| |
End of year * | | $ | 24,604,563 | | | $ | 19,178,120 | |
| |
*Including accumulated net investment income/(loss) of: | | $ | (19,166) | | | $ | 18,154 | |
See Notes to Financial Statements.
| | |
| RiverFront Global Growth Fund |
| Statements of Changes in Net Assets | | |
| | | | | | | | |
| | | For the Year Ended
April 30, 2013 | | | For the Year Ended
April 30, 2012 | |
| |
OPERATIONS | | | | | | | | |
Net investment income | | $ | 679,592 | | | $ | 657,945 | |
Net realized gain/(loss) on investments | | | 4,550,863 | | | | (1,463,487) | |
Net change in unrealized appreciation/(depreciation) on investments | | | 1,032,501 | | | | (6,929,668) | |
| |
Net Increase/(Decrease) in Net Assets Resulting from Operations | | | 6,262,956 | | | | (7,735,210) | |
| |
DISTRIBUTIONS | | | | | | | | |
Dividends to shareholders from net investment income | | | | | | | | |
Class A | | | (116,274) | | | | (68,584) | |
Class C | | | (75,361) | | | | (36,657) | |
Class I | | | (79,598) | | | | (67,523) | |
Class L | | | (390,061) | | | | (306,995) | |
Investor Class | | | (141,444) | | | | (115,639) | |
Dividends to shareholders from net realized gains | | | | | | | | |
Class A | | | – | | | | (420,162) | |
Class C | | | – | | | | (428,017) | |
Class I | | | – | | | | (367,485) | |
Class L | | | – | | | | (1,570,587) | |
Investor Class | | | – | | | | (705,783) | |
| |
Net Decrease in Net Assets from Distributions | | | (802,738) | | | | (4,087,432) | |
| |
BENEFICIAL INTEREST TRANSACTIONS (NOTE 6) | | | | | | | | |
Shares sold | | | | | | | | |
Class A | | | 6,220,932 | | | | 2,906,251 | |
Class C | | | 2,331,909 | | | | 3,379,153 | |
Class I | | | 3,837,874 | | | | 3,272,520 | |
Class L | | | 2,863,936 | | | | 7,116,023 | |
Investor Class | | | 228,451 | | | | 335,689 | |
Dividends reinvested | | | | | | | | |
Class A | | | 110,123 | | | | 475,706 | |
Class C | | | 73,619 | | | | 455,331 | |
Class I | | | 76,336 | | | | 426,249 | |
Class L | | | 375,201 | | | | 1,789,306 | |
Investor Class | | | 120,142 | | | | 755,405 | |
Shares redeemed | | | | | | | | |
Class A | | | (3,873,219) | | | | (8,714,023) | |
Class C | | | (2,747,755) | | | | (2,177,829) | |
Class I | | | (2,778,845) | | | | (1,484,244) | |
Class L | | | (6,924,206) | | | | (21,589,251) | |
Investor Class | | | (2,240,520) | | | | (9,371,913) | |
| |
Net Decrease in Net Assets Derived from Beneficial Interest Transactions | | | (2,326,022) | | | | (22,425,627) | |
| |
Net increase/(decrease) in net assets | | | 3,134,196 | | | | (34,248,269) | |
NET ASSETS | | | | | | | | |
Beginning of year | | | 52,969,374 | | | | 87,217,643 | |
| |
End of year * | | $ | 56,103,570 | | | $ | 52,969,374 | |
| |
*Including accumulated net investment income/(loss) of: | | $ | (47,361) | | | $ | 76,006 | |
See Notes to Financial Statements.
| | |
| RiverFront Moderate Growth & Income Fund |
| Statements of Changes in Net Assets | | |
| | | | | | | | |
| | | For the Year Ended
April 30, 2013 | | | For the Year Ended
April 30, 2012 | |
| |
OPERATIONS | | | | | | | | |
Net investment income | | $ | 1,590,843 | | | $ | 733,268 | |
Net realized gain/(loss) on investments | | | 3,679,508 | | | | (1,821,063) | |
Net change in unrealized appreciation on investments | | | 2,504,601 | | | | 2,293,075 | |
| |
Net Increase in Net Assets Resulting from Operations | | | 7,774,952 | | | | 1,205,280 | |
| |
DISTRIBUTIONS | | | | | | | | |
Dividends to shareholders from net investment income | | | | | | | | |
Class A | | | (490,109) | | | | (264,650) | |
Class C | | | (586,750) | | | | (296,849) | |
Class I | | | (434,898) | | | | (197,488) | |
Dividends to shareholders from tax return of capital | | | | | | | | |
Class A | | | – | | | | (8,956) | |
Class C | | | – | | | | (11,913) | |
Class I | | | – | | | | (6,512) | |
| |
Net Decrease in Net Assets from Distributions | | | (1,511,757) | | | | (786,368) | |
| |
BENEFICIAL INTEREST TRANSACTIONS (NOTE 6) | | | | | | | | |
Shares sold | | | | | | | | |
Class A | | | 11,313,240 | | | | 14,528,189 | |
Class C | | | 18,703,383 | | | | 21,335,610 | |
Class I | | | 20,012,679 | | | | 11,507,426 | |
Dividends reinvested | | | | | | | | |
Class A | | | 440,510 | | | | 247,545 | |
Class C | | | 482,949 | | | | 249,701 | |
Class I | | | 392,082 | | | | 183,575 | |
Shares redeemed | | | | | | | | |
Class A | | | (5,157,175) | | | | (6,318,830) | |
Class C | | | (8,693,372) | | | | (6,776,170) | |
Class I | | | (8,863,522) | | | | (6,470,194) | |
| |
Net Increase in Net Assets Derived from Beneficial Interest Transactions | | | 28,630,774 | | | | 28,486,852 | |
| |
Net increase in net assets | | | 34,893,969 | | | | 28,905,764 | |
NET ASSETS | | | | | | | | |
Beginning of year | | | 72,649,759 | | | | 43,743,995 | |
| |
End of year * | | $ | 107,543,728 | | | $ | 72,649,759 | |
| |
*Including accumulated net investment income of: | | $ | 83,800 | | | $ | – | |
See Notes to Financial Statements.
| | |
| RiverFront Conservative Income Builder Fund – Class A |
| Financial Highlights Selected data for a share of beneficial interest outstanding throughout the period indicated: |
| | |
| | | For the Period
September 4, 2012
(Commencement) to
April 30, 2013 |
|
Net asset value, beginning of period | | $10.00 |
| |
INCOME FROM INVESTMENT OPERATIONS: | | |
Net investment income(a) | | 0.09 |
Net realized and unrealized gain | | 0.48 |
|
Total from investment operations | | 0.57 |
|
| |
DISTRIBUTIONS: | | |
From net investment income | | (0.09) |
|
Total distributions | | (0.09) |
|
| |
Net increase in net asset value | | 0.48 |
|
Net asset value, end of year | | $10.48 |
|
TOTAL RETURN(b) | | 5.72% |
| |
RATIOS/SUPPLEMENTAL DATA: | | |
Net assets, end of year (000s) | | $607 |
Ratio of expenses to average net assets excluding fee waivers and reimbursements | | 5.65%(c)(e) |
Ratio of expenses to average net assets including fee waivers and reimbursements | | 1.15%(c)(e) |
Ratio of net investment income to average net assets | | 1.37%(c)(e) |
Portfolio turnover rate(d) | | 73% |
|
| (a) | Calculated using the average shares method. |
| (b) | Total returns are for the period indicated and have not been annualized. Total returns would have been lower had certain expenses not been waived during the period. Returns shown do not reflect the deduction of taxes that a shareholder would pay on Fund distributions or the redemption of Fund shares. Returns shown exclude any applicable sales charges. |
| (d) | Portfolio turnover rate for periods less than one full year have not been annualized. |
| (e) | Expense ratios before reductions for startup periods may not be representative of longer term operating periods. |
See Notes to Financial Statements.
| | |
| RiverFront Conservative Income Builder Fund – Class C |
| Financial Highlights Selected data for a share of beneficial interest outstanding throughout the period indicated: |
| | |
| | | For the Period
September 4, 2012
(Commencement) to
April 30, 2013 |
|
Net asset value, beginning of period | | $10.00 |
| |
INCOME FROM INVESTMENT OPERATIONS: | | |
Net investment income(a) | | 0.06 |
Net realized and unrealized gain | | 0.47 |
|
Total from investment operations | | 0.53 |
|
| |
DISTRIBUTIONS: | | |
From net investment income | | (0.02) |
|
Total distributions | | (0.02) |
|
| |
Net increase in net asset value | | 0.51 |
|
Net asset value, end of year | | $10.51 |
|
TOTAL RETURN(b) | | 5.29% |
| |
RATIOS/SUPPLEMENTAL DATA: | | |
Net assets, end of year (000s) | | $2,264 |
Ratio of expenses to average net assets excluding fee waivers and reimbursements | | 6.53%(c)(e) |
Ratio of expenses to average net assets including fee waivers and reimbursements | | 1.90%(c)(e) |
Ratio of net investment income to average net assets | | 0.90%(c)(e) |
Portfolio turnover rate(d) | | 73% |
|
| (a) | Calculated using the average shares method. |
| (b) | Total returns are for the period indicated and have not been annualized. Total returns would have been lower had certain expenses not been waived during the period. Returns shown do not reflect the deduction of taxes that a shareholder would pay on Fund distributions or the redemption of Fund shares. Returns shown exclude any applicable sales charges. |
| (d) | Portfolio turnover rate for periods less than one full year have not been annualized. |
| (e) | Expense ratios before reductions for startup periods may not be representative of longer term operating periods. |
See Notes to Financial Statements.
| | |
| RiverFront Conservative Income Builder Fund – Class I |
| Financial Highlights Selected data for a share of beneficial interest outstanding throughout the period indicated: |
| | |
| | | For the Period
September 4, 2012
(Commencement) to
April 30, 2013 |
|
Net asset value, beginning of period | | $10.00 |
| |
INCOME FROM INVESTMENT OPERATIONS: | | |
Net investment income(a) | | 0.12 |
Net realized and unrealized gain | | 0.46 |
|
Total from investment operations | | 0.58 |
|
| |
DISTRIBUTIONS: | | |
From net investment income | | (0.29) |
|
Total distributions | | (0.29) |
|
| |
Net increase in net asset value | | 0.29 |
|
Net asset value, end of year | | $10.29 |
|
TOTAL RETURN(b) | | 5.95% |
| |
RATIOS/SUPPLEMENTAL DATA: | | |
Net assets, end of year (000s) | | $715 |
Ratio of expenses to average net assets excluding fee waivers and reimbursements | | 7.74%(c)(e) |
Ratio of expenses to average net assets including fee waivers and reimbursements | | 0.90%(c)(e) |
Ratio of net investment income to average net assets | | 1.84%(c)(e) |
Portfolio turnover rate(d) | | 73% |
|
| (a) | Calculated using the average shares method. |
| (b) | Total returns are for the period indicated and have not been annualized. Total returns would have been lower had certain expenses not been waived during the period. Returns shown do not reflect the deduction of taxes that a shareholder would pay on Fund distributions or the redemption of Fund shares. |
| (d) | Portfolio turnover rate for periods less than one full year have not been annualized. |
| (e) | Expense ratios before reductions for startup periods may not be representative of longer term operating periods. |
See Notes to Financial Statements.
| | |
| RiverFront Dynamic Equity Income Fund – Class A |
| Financial Highlights Selected data for a share of beneficial interest outstanding throughout the periods indicated: |
| | | | | | |
| | | For the Year Ended
April 30, 2013 | | For the Year Ended
April 30, 2012(a) | | For the Period
August 2, 2010
(Inception) to
April 30, 2011 |
|
Net asset value, beginning of period | | $11.24 | | $11.73 | | $10.00 |
| | | |
INCOME/(LOSS) FROM INVESTMENT OPERATIONS: | | | | | | |
Net investment income(b) | | 0.25 | | 0.16 | | 0.12 |
Net realized and unrealized gain/(loss) | | 0.99 | | (0.49) | | 1.67 |
|
Total from investment operations | | 1.24 | | (0.33) | | 1.79 |
|
| | | |
DISTRIBUTIONS: | | | | | | |
From net investment income | | (0.24) | | (0.15) | | (0.06) |
From net realized gains | | – | | – | | (0.00)(c) |
Tax return of capital | | – | | (0.01) | | (0.00)(c) |
|
Total distributions | | (0.24) | | (0.16) | | (0.06) |
|
| | | |
Net increase/(decrease) in net asset value | | 1.00 | | (0.49) | | 1.73 |
|
Net asset value, end of year | | $12.24 | | $11.24 | | $11.73 |
|
TOTAL RETURN(d) | | 11.22% | | (2.80)% | | 17.99% |
| | | |
RATIOS/SUPPLEMENTAL DATA: | | | | | | |
Net assets, end of year (000s) | | $8,087 | | $7,114 | | $5,723 |
Ratio of expenses to average net assets excluding fee waivers and reimbursements | | 1.58% | | 1.73% | | 2.17%(e) |
Ratio of expenses to average net assets including fee waivers and reimbursements | | 1.20%(f) | | 1.30% | | 1.30%(e) |
Ratio of net investment income to average net assets | | 2.17% | | 1.50% | | 1.48%(e) |
Portfolio turnover rate(g) | | 136% | | 133% | | 66% |
|
| (a) | Prior to January 1, 2012, the RiverFront Dynamic Equity Income Fund was known as the RiverFront Long-Term Growth & Income Fund. |
| (b) | Calculated using the average shares method. |
| (c) | Less than ($0.005) per share. |
| (d) | Total returns are for the period indicated and have not been annualized. Total returns would have been lower had certain expenses not been waived during the period. Returns shown do not reflect the deduction of taxes that a shareholder would pay on Fund distributions or the redemption of Fund shares. Returns shown exclude any applicable sales charges. |
| (f) | Contractual expense limitation change from 1.30% to 1.15% effective September 1, 2012. |
| (g) | Portfolio turnover rate for periods less than one full year have not been annualized. |
See Notes to Financial Statements.
| | |
| RiverFront Dynamic Equity Income Fund – Class C |
Financial Highlights Selected data for a share of beneficial interest outstanding throughout the periods indicated: |
| | | | | | |
| | | For the Year Ended
April 30, 2013 | | For the Year Ended
April 30, 2012(a) | | For the Period
August 2, 2010
(Inception) to
April 30, 2011 |
|
Net asset value, beginning of period | | $11.14 | | $11.67 | | $10.00 |
|
INCOME/(LOSS) FROM INVESTMENT OPERATIONS: |
Net investment income(b) | | 0.16 | | 0.09 | | 0.05 |
Net realized and unrealized gain/(loss) | | 0.98 | | (0.51) | | 1.67 |
|
Total from investment operations | | 1.14 | | (0.42) | | 1.72 |
|
| | | |
DISTRIBUTIONS: | | | | | | |
From net investment income | | (0.15) | | (0.10) | | (0.05) |
From net realized gains | | – | | – | | (0.00)(c) |
Tax return of capital | | – | | (0.01) | | (0.00)(c) |
|
Total distributions | | (0.15) | | (0.11) | | (0.05) |
|
| | | |
Net increase/(decrease) in net asset value | | 0.99 | | (0.53) | | 1.67 |
|
Net asset value, end of year | | $12.13 | | $11.14 | | $11.67 |
|
TOTAL RETURN(d) | | 10.41% | | (3.60)% | | 17.32% |
|
RATIOS/SUPPLEMENTAL DATA: |
Net assets, end of year (000s) | | $16,070 | | $13,729 | | $9,223 |
Ratio of expenses to average net assets excluding fee waivers and reimbursements | | 2.33% | | 2.49% | | 3.10%(e) |
Ratio of expenses to average net assets including fee waivers and reimbursements | | 1.95%(f) | | 2.05% | | 2.05%(e) |
Ratio of net investment income to average net assets | | 1.44% | | 0.84% | | 0.65%(e) |
Portfolio turnover rate(g) | | 136% | | 133% | | 66% |
|
| (a) | Prior to January 1, 2012, the RiverFront Dynamic Equity Income Fund was known as the RiverFront Long-Term Growth & Income Fund. |
| (b) | Calculated using the average shares method. |
| (c) | Less than ($0.005) per share. |
| (d) | Total returns are for the period indicated and have not been annualized. Total returns would have been lower had certain expenses not been waived during the period. Returns shown do not reflect the deduction of taxes that a shareholder would pay on Fund distributions or the redemption of Fund shares. Returns shown exclude any applicable sales charges. |
| (f) | Contractual expense limitation change from 2.05% to 1.90% effective September 1, 2012. |
| (g) | Portfolio turnover rate for periods less than one full year have not been annualized. |
See Notes to Financial Statements.
| | |
| RiverFront Dynamic Equity Income Fund – Class I |
Financial Highlights Selected data for a share of beneficial interest outstanding throughout the periods indicated: |
| | | | | | |
| | | For the Year Ended
April 30, 2013 | | For the Year Ended
April 30, 2012(a) | | For the Period
August 2, 2010
(Inception) to
April 30, 2011 |
|
Net asset value, beginning of period | | $11.17 | | $11.64 | | $10.00 |
|
INCOME/(LOSS) FROM INVESTMENT OPERATIONS: |
Net investment income(b) | | 0.27 | | 0.20 | | 0.12 |
Net realized and unrealized gain/(loss) | | 0.99 | | (0.50) | | 1.68 |
|
Total from investment operations | | 1.26 | | (0.30) | | 1.80 |
|
| | | |
DISTRIBUTIONS: | | | | | | |
From net investment income | | (0.27) | | (0.16) | | (0.15) |
From net realized gains | | – | | – | | (0.00)(c) |
Tax return of capital | | – | | (0.01) | | (0.01) |
|
Total distributions | | (0.27) | | (0.17) | | (0.16) |
|
| | | |
Net increase/(decrease) in net asset value | | 0.99 | | (0.47) | | 1.64 |
|
Net asset value, end of year | | $12.16 | | $11.17 | | $11.64 |
|
TOTAL RETURN(d) | | 11.47% | | (2.58)% | | 18.21% |
| | | |
RATIOS/SUPPLEMENTAL DATA: | | | | | | |
Net assets, end of year (000s) | | $10,460 | | $6,897 | | $3,301 |
Ratio of expenses to average net assets excluding fee waivers and reimbursements | | 1.33% | | 1.49% | | 2.44%(e) |
Ratio of expenses to average net assets including fee waivers and reimbursements | | 0.95%(f) | | 1.05% | | 1.05%(e) |
Ratio of net investment income to average net assets | | 2.36% | | 1.88% | | 1.49%(e) |
Portfolio turnover rate(g) | | 136% | | 133% | | 66% |
|
| (a) | Prior to January 1, 2012, the RiverFront Dynamic Equity Income Fund was known as the RiverFront Long-Term Growth & Income Fund. |
| (b) | Calculated using the average shares method. |
| (c) | Less than ($0.005) per share. |
| (d) | Total returns are for the period indicated and have not been annualized. Total returns would have been lower had certain expenses not been waived during the period. Returns shown do not reflect the deduction of taxes that a shareholder would pay on Fund distributions or the redemption of Fund shares. |
| (f) | Contractual expense limitation change from 1.05% to 0.90% effective September 1, 2012. |
| (g) | Portfolio turnover rate for periods less than one full year have not been annualized. |
See Notes to Financial Statements.
| | |
| RiverFront Global Allocation Fund – Class A |
Financial Highlights Selected data for a share of beneficial interest outstanding throughout the periods indicated: |
| | | | | | |
| | | For the Year Ended
April 30, 2013 | | For the Year Ended
April 30, 2012(a) | | For the Period
August 2, 2010
(Inception) to
April 30, 2011 |
|
Net asset value, beginning of period | | $10.86 | | $11.66 | | $10.00 |
|
INCOME/(LOSS) FROM INVESTMENT OPERATIONS: |
Net investment income(b) | | 0.15 | | 0.12 | | 0.10 |
Net realized and unrealized gain/(loss) | | 1.08 | | (0.84) | | 1.61 |
|
Total from investment operations | | 1.23 | | (0.72) | | 1.71 |
|
| | | |
DISTRIBUTIONS: | | | | | | |
From net investment income | | (0.16) | | (0.07) | | (0.05) |
From net realized gains | | – | | (0.01) | | – |
|
Total distributions | | (0.16) | | (0.08) | | (0.05) |
|
| | | |
Net increase/(decrease) in net asset value | | 1.07 | | (0.80) | | 1.66 |
|
Net asset value, end of year | | $11.93 | | $10.86 | | $11.66 |
|
TOTAL RETURN(c) | | 11.47% | | (6.18)% | | 17.12% |
| | | |
RATIOS/SUPPLEMENTAL DATA: | | | | | | |
Net assets, end of year (000s) | | $8,244 | | $5,791 | | $4,686 |
Ratio of expenses to average net assets excluding fee waivers and reimbursements | | 1.68% | | 1.80% | | 3.00%(d) |
Ratio of expenses to average net assets including fee waivers and reimbursements | | 1.19%(e) | | 1.30% | | 1.30%(d) |
Ratio of net investment income to average net assets | | 1.32% | | 1.10% | | 1.16%(d) |
Portfolio turnover rate(f) | | 113% | | 163% | | 77% |
|
| (a) | Prior to January 1, 2012, the RiverFront Global Allocation Fund was known as the RiverFront Moderate Growth Fund. |
| (b) | Calculated using the average shares method. |
| (c) | Total returns are for the period indicated and have not been annualized. Total returns would have been lower had certain expenses not been waived during the period. Returns shown do not reflect the deduction of taxes that a shareholder would pay on Fund distributions or the redemption of Fund shares. Returns shown exclude any applicable sales charges. |
| (e) | Contractual expense limitation change from 1.30% to 1.15% effective September 1, 2012. |
| (f) | Portfolio turnover rate for periods less than one full year have not been annualized. |
See Notes to Financial Statements.
| | |
| RiverFront Global Allocation Fund – Class C |
Financial Highlights Selected data for a share of beneficial interest outstanding throughout the periods indicated: |
| | | | | | |
| | | For the Year Ended
April 30, 2013 | | For the Year Ended
April 30, 2012(a) | | For the Period
August 2, 2010
(Inception) to
April 30, 2011 |
|
Net asset value, beginning of period | | $10.81 | | $11.64 | | $10.00 |
|
INCOME/(LOSS) FROM INVESTMENT OPERATIONS: |
Net investment income(b) | | 0.07 | | 0.02 | | 0.00(c) |
Net realized and unrealized gain/(loss) | | 1.07 | | (0.82) | | 1.65 |
|
Total from investment operations | | 1.14 | | (0.80) | | 1.65 |
|
| | | |
DISTRIBUTIONS: | | | | | | |
From net investment income | | (0.11) | | (0.02) | | (0.01) |
From net realized gains | | – | | (0.01) | | – |
|
Total distributions | | (0.11) | | (0.03) | | (0.01) |
|
| | | |
Net increase/(decrease) in net asset value | | 1.03 | | (0.83) | | 1.64 |
|
Net asset value, end of year | | $11.84 | | $10.81 | | $11.64 |
|
TOTAL RETURN(d) | | 10.59% | | (6.86)% | | 16.52% |
| | | |
RATIOS/SUPPLEMENTAL DATA: | | | | | | |
Net assets, end of year (000s) | | $9,686 | | $9,891 | | $8,926 |
Ratio of expenses to average net assets excluding fee waivers and reimbursements | | 2.44% | | 2.58% | | 3.21%(e) |
Ratio of expenses to average net assets including fee waivers and reimbursements | | 1.95%(f) | | 2.05% | | 2.05%(e) |
Ratio of net investment income to average net assets | | 0.66% | | 0.17% | | 0.04%(e) |
Portfolio turnover rate(g) | | 113% | | 163% | | 77% |
|
| (a) | Prior to January 1, 2012, the RiverFront Global Allocation Fund was known as the RiverFront Moderate Growth Fund. |
| (b) | Calculated using the average shares method. |
| (c) | Less than $0.005 per share. |
| (d) | Total returns are for the period indicated and have not been annualized. Total returns would have been lower had certain expenses not been waived during the period. Returns shown do not reflect the deduction of taxes that a shareholder would pay on Fund distributions or the redemption of Fund shares. Returns shown exclude any applicable sales charges. |
| (f) | Contractual expense limitation change from 2.05% to 1.90% effective September 1, 2012. |
| (g) | Portfolio turnover rate for periods less than one full year have not been annualized. |
See Notes to Financial Statements.
| | |
| RiverFront Global Allocation Fund – Class I |
Financial Highlights Selected data for a share of beneficial interest outstanding throughout the periods indicated: |
| | | | | | |
| | | For the Year Ended
April 30, 2013 | | For the Year Ended
April 30, 2012(a) | | For the Period
August 2, 2010
(Inception) to
April 30, 2011 |
|
Net asset value, beginning of period | | $10.66 | | $11.42 | | $10.00 |
|
INCOME/(LOSS) FROM INVESTMENT OPERATIONS: |
Net investment income(b) | | 0.17 | | 0.13 | | 0.08 |
Net realized and unrealized gain/(loss) | | 1.07 | | (0.80) | | 1.62 |
|
Total from investment operations | | 1.24 | | (0.67) | | 1.70 |
|
| | | |
DISTRIBUTIONS: | | | | | | |
From net investment income | | (0.18) | | (0.08) | | (0.28) |
From net realized gains | | – | | (0.01) | | – |
|
Total distributions | | (0.18) | | (0.09) | | (0.28) |
|
| | | |
Net increase/(decrease) in net asset value | | 1.06 | | (0.76) | | 1.42 |
|
Net asset value, end of year | | $11.72 | | $10.66 | | $11.42 |
|
TOTAL RETURN(c) | | 11.73% | | (5.86)% | | 17.20% |
|
RATIOS/SUPPLEMENTAL DATA: |
Net assets, end of year (000s) | | $6,675 | | $3,496 | | $1,905 |
Ratio of expenses to average net assets excluding fee waivers and reimbursements | | 1.43% | | 1.55% | | 4.68%(d) |
Ratio of expenses to average net assets including fee waivers and reimbursements | | 0.94%(e) | | 1.05% | | 1.05%(d) |
Ratio of net investment income to average net assets | | 1.52% | | 1.28% | | 0.98%(d) |
Portfolio turnover rate(f) | | 113% | | 163% | | 77% |
|
| (a) | Prior to January 1, 2012, the RiverFront Global Allocation Fund was known as the RiverFront Moderate Growth Fund. |
| (b) | Calculated using the average shares method. |
| (c) | Total returns are for the period indicated and have not been annualized. Total returns would have been lower had certain expenses not been waived during the period. Returns shown do not reflect the deduction of taxes that a shareholder would pay on Fund distributions or the redemption of Fund shares. |
| (e) | Contractual expense limitation change from 1.05% to 0.90% effective September 1, 2012. |
| (f) | Portfolio turnover rate for periods less than one full year have not been annualized. |
See Notes to Financial Statements.
| | |
| RiverFront Global Growth Fund – Class A |
Financial Highlights Selected data for a share of beneficial interest outstanding throughout the periods indicated: |
| | | | | | | | |
| | | For the Year Ended
April 30, 2013 | | For the Year Ended
April 30, 2012(a) | | For the Period
January 1, 2011 to
April 30, 2011(b) | | For the Period
September 27, 2010
(Inception) to
December 31, 2010 |
|
Net asset value, beginning of period | | $13.37 | | $15.65 | | $14.66 | | $13.68 |
|
INCOME/(LOSS) FROM INVESTMENT OPERATIONS: |
Net investment income after reimbursements(c) | | 0.17 | | 0.14 | | 0.00(d) | | 0.23 |
Net realized and unrealized gain/(loss) | | 1.57 | | (1.41) | | 0.99 | | 1.03 |
|
Total from investment operations | | 1.74 | | (1.27) | | 0.99 | | 1.26 |
|
| | | | |
DISTRIBUTIONS: | | | | | | | | |
From net investment income | | (0.22) | | (0.14) | | – | | (0.14) |
From net realized gains | | – | | (0.87) | | – | | (0.14) |
|
Total distributions | | (0.22) | | (1.01) | | – | | (0.28) |
|
| | | | |
Net increase/(decrease) in net asset value | | 1.52 | | (2.28) | | 0.99 | | 0.98 |
|
Net asset value, end of year | | $14.89 | | $13.37 | | $15.65 | | $14.66 |
|
TOTAL RETURN(e) | | 13.14% | | (7.51)% | | 6.75% | | 9.22% |
|
RATIOS/SUPPLEMENTAL DATA: |
Net assets, end of year (000s) | | $8,525 | | $5,241 | | $12,307 | | $1,934 |
Ratio of expenses to average net assets excluding fee waivers and reimbursements | | 1.49% | | 1.52% | | 1.58%(f) | | 2.15%(f) |
Ratio of expenses to average net assets including fee waivers and reimbursements (includes acquired fund fee reimbursements) | | 0.98%(g) | | 0.92% | | 0.81%(f) | | 0.91%(f) |
Ratio of expenses to average net assets including fee waivers and reimbursements (excludes acquired fund fee reimbursements) | | 1.15% | | 1.15% | | 1.15%(f) | | 1.15%(f) |
Ratio of net investment income to average net assets | | 1.23% | | 0.99% | | 0.06%(f) | | 6.20%(f) |
Portfolio turnover rate(h) | | 113% | | 119% | | 34% | | 99% |
|
| (a) | Prior to January 1, 2012, the RiverFront Global Growth Fund was known as the RiverFront Long-Term Growth Fund. |
| (b) | Effective March 8, 2011, the Board approved changing the fiscal year-end of the Fund from December 31 to April 30. |
| (c) | Calculated using the average shares method. |
| (d) | Less than $0.005 per share. |
| (e) | Total returns are for the period indicated and have not been annualized. Total returns would have been lower had certain expenses not been waived during the period. Returns shown do not reflect the deduction of taxes that a shareholder would pay on Fund distributions or the redemption of Fund shares. Returns shown exclude any applicable sales charges. |
| (g) | Prior to January 1, 2013, all acquired fund fees were reimbursed. |
| (h) | Portfolio turnover rate for periods less than one full year have not been annualized. |
See Notes to Financial Statements.
| | |
| RiverFront Global Growth Fund – Class C |
Financial Highlights Selected data for a share of beneficial interest outstanding throughout the periods indicated: |
| | | | | | | | |
| | | For the Year Ended
April 30, 2013 | | For the Year Ended
April 30, 2012(a) | | For the Period
January 1, 2011 to
April 30, 2011(b) | | For the Period
September 27, 2010
(Inception) to
December 31, 2010 |
|
Net asset value, beginning of period | | $13.29 | | $15.60 | | $14.63 | | $13.68 |
|
INCOME/(LOSS) FROM INVESTMENT OPERATIONS: |
Net investment income/(loss) after reimbursements(c) | | 0.08 | | 0.05 | | (0.04) | | 0.20 |
Net realized and unrealized gain/(loss) | | 1.54 | | (1.42) | | 1.01 | | 1.02 |
|
Total from investment operations | | 1.62 | | (1.37) | | 0.97 | | 1.22 |
|
| | | | |
DISTRIBUTIONS: | | | | | | | | |
From net investment income | | (0.15) | | (0.07) | | – | | (0.13) |
From net realized gains | | – | | (0.87) | | – | | (0.14) |
|
Total distributions | | (0.15) | | (0.94) | | – | | (0.27) |
|
| | | | |
Net increase/(decrease) in net asset value | | 1.47 | | (2.31) | | 0.97 | | 0.95 |
|
Net asset value, end of year | | $14.76 | | $13.29 | | $15.60 | | $14.63 |
|
TOTAL RETURN(d) | | 12.31% | | (8.22)% | | 6.63% | | 8.91% |
|
RATIOS/SUPPLEMENTAL DATA: |
Net assets, end of year (000s) | | $7,182 | | $6,808 | | $6,156 | | $2,050 |
Ratio of expenses to average net assets excluding fee waivers and reimbursements | | 2.25% | | 2.29% | | 2.33%(e) | | 2.89%(e) |
Ratio of expenses to average net assets including fee waivers and reimbursements (includes acquired fund fee reimbursements) | | 1.73%(f) | | 1.67% | | 1.55%(e) | | 1.66%(e) |
Ratio of expenses to average net assets including fee waivers and reimbursements (excludes acquired fund fee reimbursements) | | 1.90% | | 1.90% | | 1.90%(e) | | 1.90%(e) |
Ratio of net investment income/(loss) to average net assets | | 0.57% | | 0.34% | | (0.72)%(e) | | 5.36%(e) |
Portfolio turnover rate(g) | | 113% | | 119% | | 34% | | 99% |
|
| (a) | Prior to January 1, 2012, the RiverFront Global Growth Fund was known as the RiverFront Long-Term Growth Fund. |
| (b) | Effective March 8, 2011, the Board approved changing the fiscal year-end of the Fund from December 31 to April 30. |
| (c) | Calculated using the average shares method. |
| (d) | Total returns are for the period indicated and have not been annualized. Total returns would have been lower had certain expenses not been waived during the period. Returns shown do not reflect the deduction of taxes that a shareholder would pay on Fund distributions or the redemption of Fund shares. Returns shown exclude any applicable sales charges. |
| (f) | Prior to January 1, 2013, all acquired fund fees were reimbursed. |
| (g) | Portfolio turnover rate for periods less than one full year have not been annualized. |
See Notes to Financial Statements.
| | |
| RiverFront Global Growth Fund – Class I |
| Financial Highlights | | Selected data for a share of beneficial interest outstanding throughout the periods indicated: |
| | | | | | | | |
| | | For the Year Ended
April 30, 2013 | | For the Year Ended
April 30, 2012(a) | | For the Period
January 1, 2011 to
April 30, 2011(b) | | For the Period September 27, 2010 (Inception) to
December 31, 2010 |
|
Net asset value, beginning of period | | $13.40 | | $15.67 | | $14.65 | | $13.68 |
| | | |
INCOME/(LOSS) FROM INVESTMENT OPERATIONS: | | | | | | |
Net investment income after reimbursements(c) | | 0.20 | | 0.19 | | 0.01 | | 0.17 |
Net realized and unrealized gain/(loss) | | 1.57 | | (1.43) | | 1.01 | | 1.09 |
|
Total from investment operations | | 1.77 | | (1.24) | | 1.02 | | 1.26 |
|
| | | | |
DISTRIBUTIONS: | | | | | | | | |
From net investment income | | (0.25) | | (0.16) | | – | | (0.15) |
From net realized gains | | – | | (0.87) | | – | | (0.14) |
|
Total distributions | | (0.25) | | (1.03) | | – | | (0.29) |
|
| | | | |
Net increase/(decrease) in net asset value | | 1.52 | | (2.27) | | 1.02 | | 0.97 |
|
Net asset value, end of year | | $14.92 | | $13.40 | | $15.67 | | $14.65 |
|
TOTAL RETURN(d) | | 13.36% | | (7.31)% | | 7.04% | | 9.12% |
| | | |
RATIOS/SUPPLEMENTAL DATA: | | | | | | |
Net assets, end of year (000s) | | $7,769 | | $6,022 | | $4,508 | | $2,280 |
Ratio of expenses to average net assets excluding fee waivers and reimbursements | | 1.25% | | 1.30% | | 1.30%(e) | | 1.74%(e) |
Ratio of expenses to average net assets including fee waivers and reimbursements (includes acquired fund fee reimbursements) | | 0.73%(f) | | 0.67% | | 0.61%(e) | | 0.66%(e) |
Ratio of expenses to average net assets including fee waivers and reimbursements (excludes acquired fund fee reimbursements) | | 0.90% | | 0.90% | | 0.90%(e) | | 0.90%(e) |
Ratio of net investment income to average net assets | | 1.45% | | 1.40% | | 0.23%(e) | | 4.70%(e) |
Portfolio turnover rate(g) | | 113% | | 119% | | 34% | | 99% |
|
| (a) | Prior to January 1, 2012, the RiverFront Global Growth Fund was known as the RiverFront Long-Term Growth Fund. |
| (b) | Effective March 8, 2011, the Board approved changing the fiscal year-end of the Fund from December 31 to April 30. |
| (c) | Calculated using the average shares method. |
| (d) | Total returns are for the period indicated and have not been annualized. Total returns would have been lower had certain expenses not been waived during the period. Returns shown do not reflect the deduction of taxes that a shareholder would pay on Fund distributions or the redemption of Fund shares. |
| (f) | Prior to January 1, 2013, all acquired fund fees were reimbursed. |
| (g) | Portfolio turnover rate for periods less than one full year have not been annualized. |
|
See Notes to Financial Statements. 123 | April 30, 2013 |
| | |
| RiverFront Global Growth Fund – Class L |
| Financial Highlights | | Selected data for a share of beneficial interest outstanding throughout the periods indicated: |
| | | | | | | | | | | | |
| | | For the Year
Ended
April 30, 2013 | | For the Year
Ended
April 30, 2012(a) | | For the Period
January 1, 2011 to
April 30, 2011(b) | | For the Year Ended December 31, 2010 | | For the Year Ended December 31, 2009 | | For the Period
October 28, 2008
(Inception) to
December 31, 2008 |
|
Net asset value, beginning of period | | $13.37 | | $15.65 | | $14.63 | | $13.22 | | $10.49 | | $10.00 |
| | | | |
INCOME/(LOSS) FROM INVESTMENT OPERATIONS: | | | | | | | | |
Net investment income after reimbursements(c) | | 0.22 | | 0.17 | | 0.01 | | 0.18 | | 0.16 | | 0.12 |
Net realized and unrealized gain/(loss) | | 1.56 | | (1.41) | | 1.01 | | 1.52 | | 2.66 | | 0.46 |
|
Total from investment operations | | 1.78 | | (1.24) | | 1.02 | | 1.70 | | 2.82 | | 0.58 |
|
| | | | | | |
DISTRIBUTIONS: | | | | | | | | | | | | |
From net investment income | | (0.25) | | (0.17) | | – | | (0.15) | | (0.09) | | (0.09) |
From net realized gains | | – | | (0.87) | | – | | (0.14) | | – | | – |
|
Total distributions | | (0.25) | | (1.04) | | – | | (0.29) | | (0.09) | | (0.09) |
|
| | | | | | |
Net increase/(decrease) in net asset value | | 1.53 | | (2.28) | | 1.02 | | 1.41 | | 2.73 | | 0.49 |
|
Net asset value, end of year | | $14.90 | | $13.37 | | $15.65 | | $14.63 | | $13.22 | | $10.49 |
|
TOTAL RETURN(d) | | 13.43% | | (7.31)% | | 6.97% | | 12.87% | | 26.86% | | 5.81% |
| | | | | |
RATIOS/SUPPLEMENTAL DATA: | | | | | | | | | | |
Net assets, end of year (000s) | | $23,454 | | $24,765 | | $42,977 | | $43,240 | | $27,763 | | $7,439 |
Ratio of expenses to average net assets excluding fee waivers and reimbursements | | 1.25% | | 1.08% | | 1.28%(e) | | 1.22% | | 1.53% | | 4.97%(e) |
Ratio of expenses to average net assets including fee waivers and reimbursements (includes acquired fund fee reimbursements) | | 0.73%(f) | | 0.67% | | 0.64%(e) | | 0.66% | | N/A | | N/A |
Ratio of expenses to average net assets including fee waivers and reimbursements (excludes acquired fund fee reimbursements) | | 0.90% | | 0.90% | | 0.90%(e) | | 0.90% | | 0.90% | | 0.90%(e) |
Ratio of net investment income to average net assets | | 1.59% | | 1.26% | | 0.19%(e) | | 1.33% | | 1.34% | | 7.55%(e) |
Portfolio turnover rate(g) | | 113% | | 119% | | 34% | | 99% | | 67% | | 13% |
|
| (a) | Prior to January 1, 2012, the RiverFront Global Growth Fund was known as the RiverFront Long-Term Growth Fund. |
| (b) | Effective March 8, 2011, the Board approved changing the fiscal year-end of the Fund from December 31 to April 30. |
| (c) | Calculated using the average shares method. |
| (d) | Total returns are for the period indicated and have not been annualized. Total returns would have been lower had certain expenses not been waived during the period. Returns shown do not reflect the deduction of taxes that a shareholder would pay on Fund distributions or the redemption of Fund shares. |
| (f) | Prior to January 1, 2013, all acquired fund fees were reimbursed. |
| (g) | Portfolio turnover rate for periods less than one full year have not been annualized. |
|
See Notes to Financial Statements. 124 | April 30, 2013 |
| | |
| RiverFront Global Growth Fund – Investor Class |
| Financial Highlights | | Selected data for a share of beneficial interest outstanding throughout the periods indicated: |
| | | | | | | | | | | | |
| | | For the Year
Ended
April 30, 2013 | | For the Year Ended April 30, 2012(a) | | For the Period
January 1, 2011 to April 30, 2011(b) | | For the Year Ended December 31, 2010 | | For the Year Ended December 31, 2009 | | For the Period
October 28, 2008 (Inception) to December 31, 2008 |
|
Net asset value, beginning of period | | $13.32 | | $15.59 | | $14.59 | | $13.19 | | $10.49 | | $10.00 |
| | | | |
INCOME/(LOSS) FROM INVESTMENT OPERATIONS: | | | | | | | | |
Net investment income after reimbursements(c) | | 0.18 | | 0.13 | | 0.00(d) | | 0.12 | | 0.13 | | 0.12 |
Net realized and unrealized gain/(loss) | | 1.54 | | (1.39) | | 1.00 | | 1.54 | | 2.65 | | 0.46 |
|
Total from investment operations | | 1.72 | | (1.26) | | 1.00 | | 1.66 | | 2.78 | | 0.58 |
|
| | | | | | |
DISTRIBUTIONS: | | | | | | | | | | | | |
From net investment income | | (0.22) | | (0.14) | | – | | (0.12) | | (0.08) | | (0.09) |
From net realized gains | | – | | (0.87) | | – | | (0.14) | | – | | – |
|
Total distributions | | (0.22) | | (1.01) | | – | | (0.26) | | (0.08) | | (0.09) |
|
| | | | | | |
Net increase/(decrease) in net asset value | | 1.50 | | (2.27) | | 1.00 | | 1.40 | | 2.70 | | 0.49 |
|
Net asset value, end of year | | $14.82 | | $13.32 | | $15.59 | | $14.59 | | $13.19 | | $10.49 |
|
TOTAL RETURN(e) | | 13.07% | | (7.47)% | | 6.79% | | 12.58% | | 26.58% | | 5.68% |
| | | | | |
RATIOS/SUPPLEMENTAL DATA: | | | | | | | | | | |
Net assets, end of year (000s) | | $9,174 | | $10,133 | | $21,270 | | $23,556 | | $13,882 | | $426 |
Ratio of expenses to average net assets excluding fee waivers and reimbursements | | 1.50% | | 1.93% | | 1.53%(f) | | 1.47% | | 1.78% | | 5.22%(f) |
Ratio of expenses to average net assets including fee waivers and reimbursements (includes acquired fund fee reimbursements) | | 0.98%(g) | | 0.92% | | 0.89%(f) | | 0.91% | | N/A | | N/A |
Ratio of expenses to average net assets including fee waivers and reimbursements (excludes acquired fund fee reimbursements) | | 1.15% | | 1.15% | | 1.15%(f) | | 1.15% | | 1.15% | | 1.15%(f) |
Ratio of net investment income/ (loss) to average net assets | | 1.36% | | 0.97% | | (0.08)%(f) | | 0.93% | | 1.09% | | 7.30%(f) |
Portfolio turnover rate(h) | | 113% | | 119% | | 34% | | 99% | | 67% | | 13% |
|
| (a) | Prior to January 1, 2012, the RiverFront Global Growth Fund was known as the RiverFront Long-Term Growth Fund. |
| (b) | Effective March 8, 2011, the Board approved changing the fiscal year-end of the Fund from December 31 to April 30. |
| (c) | Calculated using the average shares method. |
| (d) | Less than $0.005 per share. |
| (e) | Total returns are for the period indicated and have not been annualized. Total returns would have been lower had certain expenses not been waived during the period. Returns shown do not reflect the deduction of taxes that a shareholder would pay on Fund distributions or the redemption of Fund shares. |
| (g) | Prior to January 1, 2013, all acquired fund fees were reimbursed. |
| (h) | Portfolio turnover rate for periods less than one full year have not been annualized. |
|
See Notes to Financial Statements. 125 | April 30, 2013 |
| | |
| RiverFront Moderate Growth & Income Fund – Class A |
| Financial Highlights | | Selected data for a share of beneficial interest outstanding throughout the periods indicated: |
| | | | | | |
| | | For the Year Ended
April 30, 2013 | | For the Year Ended
April 30, 2012 | | For the Period
August 2, 2010
(Inception) to
April 30, 2011 |
|
Net asset value, beginning of period | | $10.96 | | $11.08 | | $10.00 |
| | |
INCOME/(LOSS) FROM INVESTMENT OPERATIONS: | | | | |
Net investment income(a) | | 0.24 | | 0.17 | | 0.15 |
Net realized and unrealized gain/(loss) | | 0.69 | | (0.12) | | 1.01 |
|
Total from investment operations | | 0.93 | | 0.05 | | 1.16 |
|
| | | |
DISTRIBUTIONS: | | | | | | |
From net investment income | | (0.23) | | (0.17) | | (0.08) |
From net realized gains | | – | | – | | (0.00)(b) |
Tax return of capital | | – | | (0.00)(b) | | – |
|
Total distributions | | (0.23) | | (0.17) | | (0.08) |
|
| | | |
Net increase/(decrease) in net asset value | | 0.70 | | (0.12) | | 1.08 |
|
Net asset value, end of year | | $11.66 | | $10.96 | | $11.08 |
|
TOTAL RETURN(c) | | 8.59% | | 0.55% | | 11.70% |
| | | |
RATIOS/SUPPLEMENTAL DATA: | | | | | | |
Net assets, end of year (000s) | | $29,066 | | $20,754 | | $12,148 |
Ratio of expenses to average net assets excluding fee waivers and reimbursements | | 1.40% | | 1.50% | | 1.64%(d) |
Ratio of expenses to average net assets including fee waivers and reimbursements | | 1.19%(e) | | 1.30% | | 1.30%(d) |
Ratio of net investment income to average net assets | | 2.17% | | 1.65% | | 1.89%(d) |
Portfolio turnover rate(f) | | 108% | | 128% | | 69% |
|
| (a) | Calculated using the average shares method. |
| (b) | Less than ($0.005) per share. |
| (c) | Total returns are for the period indicated and have not been annualized. Total returns would have been lower had certain expenses not been waived during the period. Returns shown do not reflect the deduction of taxes that a shareholder would pay on Fund distributions or the redemption of Fund shares. Returns shown exclude any applicable sales charges. |
| (e) | Contractual expense limitation change from 1.30% to 1.15% effective September 1, 2012. |
| (f) | Portfolio turnover rate for periods less than one full year have not been annualized. |
|
See Notes to Financial Statements. 126 | April 30, 2013 |
| | |
| RiverFront Moderate Growth & Income Fund – Class C |
| Financial Highlights | | Selected data for a share of beneficial interest outstanding throughout the periods indicated: |
| | | | | | |
| | | For the Year Ended
April 30, 2013 | | For the Year Ended
April 30, 2012 | | For the Period
August 2, 2010
(Inception) to
April 30, 2011 |
|
Net asset value, beginning of period | | $10.92 | | $11.06 | | $10.00 |
| | |
INCOME/(LOSS) FROM INVESTMENT OPERATIONS: | | | | |
Net investment income(a) | | 0.16 | | 0.09 | | 0.10 |
Net realized and unrealized gain/(loss) | | 0.68 | | (0.13) | | 1.02 |
|
Total from investment operations | | 0.84 | | (0.04) | | 1.12 |
|
| | | |
DISTRIBUTIONS: | | | | | | |
From net investment income | | (0.14) | | (0.10) | | (0.06) |
From net realized gains | | – | | – | | (0.00)(b) |
Tax return of capital | | – | | (0.00)(b) | | – |
|
Total distributions | | (0.14) | | (0.10) | | (0.06) |
|
| | | |
Net increase/(decrease) in net asset value | | 0.70 | | (0.14) | | 1.06 |
|
Net asset value, end of year | | $11.62 | | $10.92 | | $11.06 |
|
TOTAL RETURN(c) | | 7.83% | | (0.37)% | | 11.24% |
| | | |
RATIOS/SUPPLEMENTAL DATA: | | | | | | |
Net assets, end of year (000s) | | $52,579 | | $39,015 | | $24,061 |
Ratio of expenses to average net assets excluding fee waivers and reimbursements | | 2.15% | | 2.25% | | 2.54%(d) |
Ratio of expenses to average net assets including fee waivers and reimbursements | | 1.95%(e) | | 2.05% | | 2.05%(d) |
Ratio of net investment income to average net assets | | 1.43% | | 0.88% | | 1.22%(d) |
Portfolio turnover rate(f) | | 108% | | 128% | | 69% |
|
| (a) | Calculated using the average shares method. |
| (b) | Less than ($0.005) per share. |
| (c) | Total returns are for the period indicated and have not been annualized. Total returns would have been lower had certain expenses not been waived during the period. Returns shown do not reflect the deduction of taxes that a shareholder would pay on Fund distributions or the redemption of Fund shares. Returns shown exclude any applicable sales charges. |
| (e) | Contractual expense limitation change from 2.05% to 1.90% effective September 1, 2012. |
| (f) | Portfolio turnover rate for periods less than one full year have not been annualized. |
|
See Notes to Financial Statements. 127 | April 30, 2013 |
| | |
| RiverFront Moderate Growth & Income Fund – Class I |
| Financial Highlights | | Selected data for a share of beneficial interest outstanding throughout the periods indicated: |
| | | | | | |
| | | For the Year Ended | | For the Year Ended | | For the Period
August 2, 2010
(Inception) to |
| | | April 30, 2013 | | April 30, 2012 | | April 30, 2011 |
|
Net asset value, beginning of period | | $10.94 | | $11.07 | | $10.00 |
| | |
INCOME/(LOSS) FROM INVESTMENT OPERATIONS: | | | | |
Net investment income(a) | | 0.26 | | 0.20 | | 0.17 |
Net realized and unrealized gain/(loss) | | 0.70 | | (0.13) | | 1.01 |
|
Total from investment operations | | 0.96 | | 0.07 | | 1.18 |
|
| | | |
DISTRIBUTIONS: | | | | | | |
From net investment income | | (0.25) | | (0.19) | | (0.11) |
From net realized gains | | – | | – | | (0.00)(b) |
Tax return of capital | | – | | (0.01) | | – |
|
Total distributions | | (0.25) | | (0.20) | | (0.11) |
|
| | | |
Net increase/(decrease) in net asset value | | 0.71 | | (0.13) | | 1.07 |
|
Net asset value, end of year | | $11.65 | | $10.94 | | $11.07 |
|
TOTAL RETURN(c) | | 8.94% | | 0.71% | | 11.92% |
| | | |
RATIOS/SUPPLEMENTAL DATA: | | | | | | |
Net assets, end of year (000s) | | $25,898 | | $12,880 | | $7,535 |
Ratio of expenses to average net assets excluding fee waivers and reimbursements | | 1.15% | | 1.26% | | 1.55%(d) |
Ratio of expenses to average net assets including fee waivers and reimbursements | | 0.94%(e) | | 1.05% | | 1.05%(d) |
Ratio of net investment income to average net assets | | 2.39% | | 1.91% | | 2.16%(d) |
Portfolio turnover rate(f) | | 108% | | 128% | | 69% |
|
| (a) | Calculated using the average shares method. |
| (b) | Less than ($0.005) per share. |
| (c) | Total returns are for the period indicated and have not been annualized. Total returns would have been lower had certain expenses not been waived during the period. Returns shown do not reflect the deduction of taxes that a shareholder would pay on Fund distributions or the redemption of Fund shares. |
| (e) | Contractual expense limitation change from 1.05% to 0.90% effective September 1, 2012. |
| (f) | Portfolio turnover rate for periods less than one full year have not been annualized. |
|
See Notes to Financial Statements. 128 | April 30, 2013 |
| | |
| Notes to Financial Statements | | |
| | April 30, 2013 |
1. ORGANIZATION
Financial Investors Trust (the “Trust”), a Delaware statutory trust, is an open-end management investment company registered under the Investment Company Act of 1940, as amended (“1940 Act”). As of April 30, 2013, the Trust had 26 registered funds. This annual report describes the following funds; ALPS | Alerian MLP Infrastructure Index Fund (which commenced operations on January 2, 2013), ALPS | CoreCommodity Management CompleteCommoditiesSM Strategy Fund (prior to April 30, 2013, known as the Jefferies Asset Management Commodity Strategy Allocation Fund), ALPS | Kotak India Growth Fund, ALPS | Red Rocks Listed Private Equity Fund, ALPS | WMC Disciplined Value Fund (prior to August 31, 2012, known as the ALPS | WMC Value Intersection Fund), Clough China Fund, RiverFront Conservative Income Builder Fund (which commenced operations on September 4, 2012), RiverFront Dynamic Equity Income Fund, RiverFront Global Allocation Fund, RiverFront Global Growth Fund and RiverFront Moderate Growth & Income Fund (each, a “Fund” and collectively, the “Funds”).
ALPS | Alerian MLP Infrastructure Index Fund seeks investment results that correspond (before fees and expenses) generally to the price and yield performance of its underlying index, the Alerian MLP Infrastructure Index. The ALPS | CoreCommodity Management CompleteCommoditiesSM Strategy Fund seeks to maximize real returns, consistent with prudent investment management. ALPS | Kotak India Growth Fund seeks to achieve long-term capital appreciation. ALPS | Red Rocks Listed Private Equity Fund seeks to maximize total return, which consists of appreciation on its investments and a variable income stream. ALPS | WMC Disciplined Value Fund seeks long-term capital appreciation. Dividend income may be a factor in portfolio selection but is secondary to the Fund’s principal objective. The Clough China Fund seeks to provide investors with long-term capital appreciation. The RiverFront Conservative Income Builder Fund seeks to provide current income and potential for that income to grow over time, primarily through investments in fixed-income securities, including high- and low-grade corporate debt, with the balance of the Fund (typically 20%-50%) invested in a diversified basket of dividend-paying stocks, including small-and mid-cap domestic and foreign securities. The RiverFront Dynamic Equity Income Fund seeks to achieve long-term growth and income through a combination of capital appreciation and rising dividend payments that exceeds the average yield on global stocks generally. The RiverFront Global Allocation Fund seeks to provide high total investment return through a fully managed investment policy utilizing United States and foreign equity securities, debt and money market securities, the combination of which will be varied from time to time both with respect to types of securities and markets in response to changing market and economic trends. Total investment return means the combination of capital appreciation and investment income. The RiverFront Global Growth Fund seeks to achieve long-term capital appreciation through a fully managed investment policy utilizing United States and foreign equity securities, debt and money market securities, the combination of which will be varied from time to time both with respect to types of securities and markets in response to changing market and economic trends. The RiverFront Moderate Growth & Income Fund has two primary investment objectives. It seeks (1) to provide a level of current income that exceeds the average yield on U.S. stocks in general and (2) to provide a growing stream of income over the years. The Fund’s secondary objective is to provide growth of capital.
The classes of each fund differ principally in the applicable distribution and shareholder service fees. Shareholders of each class also bear certain expenses that pertain to that particular class. All shareholders bear the common expenses of the Fund and earn income and realized gains/losses from the Fund pro rata based on the average daily net assets of each class, without distinction between share classes. Dividends to shareholders are determined separately for each class based on income and expenses allocable to each class. Realized gain distributions to shareholders are allocated to each class pro rata based on the shares outstanding of each class on the date of distribution. Differences in per share dividend rates generally result from differences in separate class expenses, including distribution and shareholder service fees, if applicable.
Basis of Consolidation for the ALPS | Kotak India Growth Fund
ALPS | Kotak India Growth Fund, (the “Kotak Fund”) invests in the equity securities of Indian companies through its wholly owned, collective investment vehicle, the India Premier Equity Portfolio (the “Portfolio”). The Portfolio is registered with and regulated by the Mauritius Financial Services Commission. The Portfolio was formed for the purpose of facilitating the Kotak Fund’s purchase of securities of a wide selection of Indian companies, consistent with the Kotak Fund’s investment strategies. The Portfolio is a private company limited by shares incorporated under the Mauritius Companies Act 2001. As a wholly owned subsidiary of the Kotak Fund, financial statements of the Portfolio are included in the consolidated financial statements and financial highlights of the Kotak Fund. All investments held by the Portfolio are disclosed in the accounts of the Kotak Fund.
The Portfolio established residency in Mauritius allowing the Fund to receive the beneficial tax treatment under the Treaty between India and Mauritius. If the benefits of the Treaty are denied or if the Portfolio is held to have a permanent establishment in India, gains derived by the Portfolio due to the sale of securities, may be subject to taxation in India. Currently, India has introduced legislation on General Anti-Avoidance Rules (“GAAR”) which contain treaty override provisions. The GAAR may be used by the Indian tax authorities to declare any arrangement whose main purpose or one of the main purposes is to obtain a tax benefit, as an “impermissible avoidance arrangement”. Originally, GAAR was to be effective from April 1, 2012; however GAAR has been deferred until April 1, 2015.
Basis of Consolidation for the ALPS | CoreCommodity Management CompleteCommoditiesSM Strategy Fund
Jefferies Asset Management Cayman Commodity Fund Ltd. (the “Subsidiary”), a Cayman Islands exempted company, was incorporated on April 23, 2010 and is a wholly owned subsidiary of the ALPS | CoreCommodity Management CompleteCommoditiesSM Strategy Fund (the “CoreCommodity Fund”). The Subsidiary acts as an investment vehicle for the CoreCommodity Fund in order to effect certain commodity-related investments on
| | |
| Notes to Financial Statements | | |
| | April 30, 2013 |
behalf of the CoreCommodity Fund. CoreCommodity Fund is the sole shareholder of the Subsidiary pursuant to a subscription agreement dated as of June 14, 2010, and it is intended that the CoreCommodity Fund will remain the sole shareholder and will continue to wholly own and control the Subsidiary. Under the Articles of Association of the Subsidiary, shares issued by the Subsidiary confer upon a shareholder the right to vote at general meetings of the Subsidiary and certain rights in connection with any winding-up or repayment of capital, as well as the right to participate in the profits or assets of the Subsidiary. The CoreCommodity Fund may invest up to 25% of its total assets in shares of the Subsidiary. As a wholly owned subsidiary of the CoreCommodity Fund, the financial statements of the Subsidiary are included in the consolidated financial statements and financial highlights of the CoreCommodity Fund. All investments held by the Subsidiary are disclosed in the accounts of the CoreCommodity Fund. As of April 30 2013, net assets of the CoreCommodity Fund were $310,823,787, of which $63,702,888, or 20.49%, represented the CoreCommodity Fund’s ownership of all issued shares and voting rights of the Subsidiary.
2. SIGNIFICANT ACCOUNTING POLICIES
The accompanying financial statements were prepared in accordance with accounting principles generally accepted in the United States of America (“U.S. GAAP”). The preparation of financial statements in conformity with U.S. GAAP requires management to make certain estimates and assumptions that affect the reported amounts of assets and liabilities and disclosures of contingent assets and liabilities at the date of the financial statements and the reported amounts of revenue and expenses during the period. Actual results could differ from those estimates. The following is a summary of significant accounting policies consistently followed by the Funds and subsidiaries, as applicable, in preparation of their financial statements.
Investment Valuation: The Funds generally value their securities based on market prices determined at the close of regular trading on the New York Stock Exchange (“NYSE”), normally 4:00 p.m. Eastern Time, on each day the NYSE is open for trading.
For equity securities and mutual funds that are traded on an exchange, the market price is usually the closing sale or official closing price on that exchange. In the case of equity securities not traded on an exchange, or if such closing prices are not otherwise available, the securities are valued at the mean of the most recent bid and ask prices on such day.
The market price for debt obligations is generally the price supplied by an independent third-party pricing service approved by the Board of Trustees (the “Board”), which may use a matrix, formula or other objective method that takes into consideration quotations from dealers, market transactions in comparable investments, market indices and yield curves. If vendors are unable to supply a price, or if the price supplied is deemed to be unreliable, the market price may be determined using quotations received from one or more brokers–dealers that make a market in the security. Short–term debt obligations that will mature in 60 days or less are valued at amortized cost; unless it is determined that using this method would not reflect an investment’s fair value. Investments in non-exchange traded funds are fair valued at their respective net asset values.
Futures contracts that are listed or traded on a national securities exchange, commodities exchange, contract market or comparable over the counter market, and that are freely transferable, are valued at their closing settlement price on the exchange on which they are primarily traded or based upon the current settlement price for a like instrument acquired on the day on which the instrument is being valued. A settlement price may not be used if the market makes a limit move with respect to a particular commodity. Over-the-counter swap contracts for which market quotations are readily available are valued based on quotes received from independent pricing services or one or more dealers that make markets in such securities.
Equity securities that are primarily traded on foreign securities exchanges are valued at the closing values of such securities on their respective foreign exchanges, except when an event occurs subsequent to the close of the foreign exchange and the close of the NYSE that was likely to have changed such value. In such an event, the fair value of those securities are determined in good faith through consideration of other factors in accordance with procedures established by and under the general supervision of the Board. The Funds will use a fair valuation model provided by an independent pricing service, which is intended to reflect fair value when a security’s value or a meaningful portion of the Fund’s portfolio is believed to have been materially affected by an valuation event that has occurred between the close of the exchange or market on which the security is traded and the close of the regular trading day on the NYSE. The Funds’ valuation procedures set forth certain triggers which instruct when to use the fair valuation model.
Forward currency exchange contracts have a market value determined by the prevailing foreign currency exchange daily rates and current foreign currency exchange forward rates. The foreign currency exchange forward rates are calculated using an automated system that estimates rates on the basis of the current day foreign currency exchange rates and forward foreign currency exchange rates supplied by a pricing service. Foreign exchange rates and forward foreign currency exchange rates may generally be obtained at the close of the NYSE, normally 4:00 p.m. Eastern Time.
When such prices or quotations are not available, or when the Fair Value Committee appointed by the Board believes that they are unreliable, securities may be priced using fair value procedures approved by the Board.
Fair Value Measurements: The Funds disclose the classification of their fair value measurements following a three-tier hierarchy based on the inputs used to measure fair value. Inputs refer broadly to the assumptions that market participants would use in pricing the asset or liability,
| | |
| Notes to Financial Statements | | |
| | April 30, 2013 |
including assumptions about risk. Inputs may be observable or unobservable. Observable inputs reflect the assumptions market participants would use in pricing the asset or liability that are developed based on market data obtained from sources independent of the reporting entity. Unobservable inputs reflect the reporting entity’s own assumptions about the assumptions market participants would use in pricing the asset or liability that are developed based on the best information available.
Various inputs are used in determining the value of each Fund’s investments as of the end of the reporting period. When inputs used fall into different levels of the fair value hierarchy, the level in the hierarchy within which the fair value measurement falls is determined based on the lowest level input that is significant to the fair value measurement in its entirety. The designated input levels are not necessarily an indication of the risk or liquidity associated with these investments. These inputs are categorized in the following hierarchy under applicable financial accounting standards:
| | |
Level 1 – | | Unadjusted quoted prices in active markets for identical investments, unrestricted assets or liabilities that a Fund has the ability to access at the measurement date; |
| |
Level 2 – | | Quoted prices which are not active, quoted prices for similar assets or liabilities in active markets or inputs other than quoted prices that are observable (either directly or indirectly) for substantially the full term of the asset or liability; and |
| |
Level 3 – | | Significant unobservable prices or inputs (including the Fund’s own assumptions in determining the fair value of investments) where there is little or no market activity for the asset or liability at the measurement date. |
The following is a summary of each Fund’s investments/financial instruments in the fair value hierarchy as of April 30, 2013:
| | | | | | | | | | | | | | | | |
| Investments in Securities at Value | | Level 1 - Unadjusted Quoted Prices | | | Level 2 - Other Significant
Observable Inputs | | | Level 3 - Significant
Unobservable Inputs | | | Total | |
| |
ALPS | Alerian MLP Infrastructure Index Fund | |
Master Limited Partnerships Shares(a) | | $ | 3,959,651 | | | $ | – | | | $ | – | | | $ | 3,959,651 | |
Short Term Investments | | | 15,384 | | | | – | | | | – | | | | 15,384 | |
| |
Total | | $ | 3,975,035 | | | $ | – | | | $ | – | | | $ | 3,975,035 | |
| |
| | | | |
| Investments in Securities at Value | | Level 1 - Unadjusted
Quoted Prices | | | Level 2 - Other Significant
Observable Inputs | | | Level 3 - Significant
Unobservable Inputs | | | Total | |
| |
ALPS | CoreCommodity Management CompleteCommoditiesSM Strategy Fund | |
Common Stocks(a) | | $ | 116,555,518 | | | $ | – | | | $ | – | | | $ | 116,555,518 | |
Exchange Traded Funds | | | 5,666,502 | | | | – | | | | – | | | | 5,666,502 | |
Warrants | | | 91 | | | | – | | | | – | | | | 91 | |
Government Bonds | | | – | | | | 171,194,159 | | | | – | | | | 171,194,159 | |
Short Term Investments | | | 27,503,104 | | | | – | | | | – | | | | 27,503,104 | |
| |
Total | | $ | 149,725,215 | | | $ | 171,194,159 | | | $ | – | | | $ | 320,919,374 | |
| |
Other Financial Instruments | | | | | | | | | |
| |
Assets | | | | | | | | | | | | | | | | |
Futures Contracts | | $ | 251,433 | | | $ | – | | | $ | – | | | $ | 251,433 | |
Total Return Swap Contracts | | | – | | | | 1,252,780 | | | | – | | | | 1,252,780 | |
Liabilities | | | | | | | | | | | | | | | | |
Futures Contracts | | | (2,166,360 | ) | | | – | | | | – | | | | (2,166,360 | ) |
Total Return Swap Contracts | | | – | | | | (6,270,202 | ) | | | – | | | | (6,270,202 | ) |
| |
Total | | $ | (1,914,927 | ) | | $ | (5,017,422 | ) | | $ | – | | | $ | (6,932,349 | ) |
| |
| | |
| Notes to Financial Statements | | |
| | April 30, 2013 |
| | | | | | | | | | | | | | | | |
Investments in Securities at Value | | Level 1 - Unadjusted Quoted Prices | | | Level 2 - Other Significant
Observable Inputs | | | Level 3 - Significant
Unobservable Inputs | | | Total | |
| |
ALPS | Kotak India Growth Fund | |
Common Stocks | | | | | | | | | | | | | | | | |
Consumer Discretionary | | $ | – | | | $ | 862,423 | | | $ | – | | | $ | 862,423 | |
Consumer Staples | | | – | | | | 846,016 | | | | – | | | | 846,016 | |
Energy | | | – | | | | 598,454 | | | | – | | | | 598,454 | |
Financials | | | – | | | | 2,398,506 | | | | – | | | | 2,398,506 | |
Health Care | | | – | | | | 561,718 | | | | – | | | | 561,718 | |
Industrials | | | 110,766 | | | | 613,251 | | | | – | | | | 724,017 | |
Information Technology | | | 72,003 | | | | 758,800 | | | | – | | | | 830,803 | |
Materials | | | 73,871 | | | | 345,961 | | | | – | | | | 419,832 | |
Telecommunication Services | | | – | | | | 139,068 | | | | – | | | | 139,068 | |
Utilities | | | – | | | | 174,718 | | | | – | | | | 174,718 | |
Short Term Investments | | | 12,653 | | | | – | | | | – | | | | 12,653 | |
| |
Total | | $ | 269,293 | | | $ | 7,298,915 | | | $ | – | | | $ | 7,568,208 | |
| |
| | | | |
| Investments in Securities at Value | | Level 1 - Unadjusted Quoted Prices | | | Level 2 - Other Significant
Observable Inputs | | | Level 3 - Significant
Unobservable Inputs | | | Total | |
| |
ALPS | Red Rocks Listed Private Equity Fund | |
Common Stocks(a) | | $ | 244,203,694 | | | $ | – | | | $ | – | | | $ | 244,203,694 | |
Short Term Investments | | | 2,485,362 | | | | – | | | | – | | | | 2,485,362 | |
| |
Total | | $ | 246,689,056 | | | $ | – | | | $ | – | | | $ | 246,689,056 | |
| |
| | | | |
Investments in Securities at Value | | Level 1 - Unadjusted Quoted Prices | | | Level 2 - Other Significant
Observable Inputs | | | Level 3 - Significant
Unobservable Inputs | | | Total | |
| |
ALPS | WMC Disciplined Value Fund | |
Common Stocks(a) | | $ | 87,132,508 | | | $ | – | | | $ | – | | | $ | 87,132,508 | |
Exchange Traded Funds | | | 1,803,517 | | | | – | | | | – | | | | 1,803,517 | |
Short Term Investments | | | 1,117,732 | | | | – | | | | – | | | | 1,117,732 | |
| |
Total | | $ | 90,053,757 | | | $ | – | | | $ | – | | | $ | 90,053,757 | |
| |
| | | | |
Investments in Securities at Value | | Level 1 - Unadjusted Quoted Prices | | | Level 2 - Other Significant
Observable Inputs | | | Level 3 - Significant
Unobservable Inputs | | | Total | |
| |
Clough China Fund | | | | | | | | | | | | | | | | |
Common Stocks(a) | | $ | – | | | $ | 66,638,404 | | | $ | – | | | $ | 66,638,404 | |
Exchange Traded Funds | | | 642,620 | | | | – | | | | – | | | | 642,620 | |
Short Term Investments | | | 2,697,470 | | | | – | | | | – | | | | 2,697,470 | |
| |
Total | | $ | 3,340,090 | | | $ | 66,638,404 | | | $ | – | | | $ | 69,978,494 | |
| |
| | | | |
Investments in Securities at Value | | Level 1 - Unadjusted Quoted Prices | | | Level 2 - Other Significant
Observable Inputs | | | Level 3 - Significant
Unobservable Inputs | | | Total | |
| |
RiverFront Conservative Income Builder Fund | | | | | |
Common Stocks(a) | | $ | 132,091 | | | $ | – | | | $ | – | | | $ | 132,091 | |
Exchange Traded Funds(a) | | | 3,128,846 | | | | – | | | | – | | | | 3,128,846 | |
Exchange Traded Notes(a) | | | 105,525 | | | | – | | | | – | | | | 105,525 | |
Short Term Investments | | | 60,242 | | | | – | | | | – | | | | 60,242 | |
| |
Total | | $ | 3,426,704 | | | $ | – | | | $ | – | | | $ | 3,426,704 | |
| |
| | |
| Notes to Financial Statements | | |
| | April 30, 2013 |
| | | | | | | | | | | | | | | | |
| Investments in Securities at Value | | Level 1 - Unadjusted Quoted Prices | | | Level 2 - Other Significant
Observable Inputs | | | Level 3 - Significant
Unobservable Inputs | | | Total | |
| |
RiverFront Dynamic Equity Income Fund | |
Common Stocks(a) | | $ | 2,290,785 | | | $ | – | | | $ | – | | | $ | 2,290,785 | |
Exchange Traded Funds(a) | | | 30,179,515 | | | | – | | | | – | | | | 30,179,515 | |
Exchange Traded Notes(a) | | | 994,744 | | | | – | | | | – | | | | 994,744 | |
Short Term Investments | | | 1,141,671 | | | | – | | | | – | | | | 1,141,671 | |
| |
Total | | $ | 34,606,715 | | | $ | – | | | $ | – | | | $ | 34,606,715 | |
| |
| | | | |
| Investments in Securities at Value | | Level 1 - Unadjusted Quoted Prices | | | Level 2 - Other Significant
Observable Inputs | | | Level 3 - Significant
Unobservable Inputs | | | Total | |
| |
RiverFront Global Allocation Fund | |
Common Stocks(a) | | $ | 1,394,667 | | | $ | – | | | $ | – | | | $ | 1,394,667 | |
Exchange Traded Funds(a) | | | 22,331,724 | | | | – | | | | – | | | | 22,331,724 | |
Short Term Investments | | | 794,854 | | | | – | | | | – | | | | 794,854 | |
| |
Total | | $ | 24,521,245 | | | $ | – | | | $ | – | | | $ | 24,521,245 | |
| |
| | | | |
| Investments in Securities at Value | | Level 1 - Unadjusted Quoted Prices | | | Level 2 - Other Significant
Observable Inputs | | | Level 3 - Significant
Unobservable Inputs | | | Total | |
| |
RiverFront Global Growth Fund | | | | | |
Common Stocks(a) | | $ | 3,684,570 | | | $ | – | | | $ | – | | | $ | 3,684,570 | |
Exchange Traded Funds(a) | | | 51,387,404 | | | | – | | | | – | | | | 51,387,404 | |
Short Term Investments | | | 1,131,271 | | | | – | | | | – | | | | 1,131,271 | |
| |
Total | | $ | 56,203,245 | | | $ | – | | | $ | – | | | $ | 56,203,245 | |
| |
| | | | |
| Investments in Securities at Value | | Level 1 - Unadjusted Quoted Prices | | | Level 2 - Other Significant
Observable Inputs | | | Level 3 - Significant
Unobservable Inputs | | | Total | |
| |
RiverFront Moderate Growth & Income Fund | |
Common Stocks(a) | | $ | 5,910,043 | | | $ | – | | | $ | – | | | $ | 5,910,043 | |
Exchange Traded Funds(a) | | | 94,166,526 | | | | – | | | | – | | | | 94,166,526 | |
Exchange Traded Notes(a) | | | 3,275,356 | | | | – | | | | – | | | | 3,275,356 | |
Short Term Investments | | | 4,127,174 | | | | – | | | | – | | | | 4,127,174 | |
| |
Total | | $ | 107,479,099 | | | $ | – | | | $ | – | | | $ | 107,479,099 | |
| |
| (a) | For detailed descriptions of country, sector and/or industry, see the accompanying Statement of Investments. |
The Funds recognize transfers between levels as of the end of the period. For the year ended April 30, 2013, the Funds did not have any transfers between Level 1 and Level 2 securities, except ALPS | Kotak India Growth Fund, which had a security with a market value of $186,304, transfer from Level 1 to Level 2 due to the Fund’s utilization of a fair value evaluation service with respect to international securities with an earlier market closing than the Fund’s net asset value computation cutoff. The Funds did not have any securities that used significant unobservable inputs (Level 3) in determining fair value.
Offering Costs: The ALPS | Alerian MLP Infrastructure Index Fund and RiverFront Conservative Income Builder Fund incurred offering costs during the year ended April 30, 2013. These offering costs, including fees for printing initial prospectuses, legal, and registration fees, are being amortized over the first twelve months from the inception date of each Fund. Amounts amortized through April 30, 2013 are shown on each Fund’s Statement of Operations and amounts that remain to be amortized are shown on each Fund’s Statement of Assets and Liabilities.
Fund and Class Expenses: Some expenses of the Trust can be directly attributed to a Fund or a specific share class of a Fund. Expenses which cannot be directly attributed are apportioned among all Funds in the Trust based on average net assets of each share class within a Fund.
Federal Income Taxes: The Funds, except for ALPS | Alerian MLP Infrastructure Index Fund, comply with the
requirements under Subchapter M of the Internal Revenue Code of 1986 applicable to regulated investment companies and intend to distribute substantially all of their net taxable income and net capital gains, if any, each year. Those Funds are not subject to income taxes to the extent such distributions are made.
| | |
| Notes to Financial Statements | | |
| | April 30, 2013 |
The ALPS | Alerian MLP Infrastructure Index Fund is taxed as a regular corporation (or so-called subchapter “C” corporation) for federal income tax purposes, and will be subject to tax on its taxable income at rates applicable to corporations. Currently, the maximum marginal regular federal income tax rate for a corporation is 35 percent. The ALPS | Alerian MLP Infrastructure Index Fund may be subject to a 20 percent federal alternative minimum tax on its federal alternative taxable income to the extent that its alternative minimum tax exceeds its regular federal income tax. This differs from most investment companies, which elect to be treated as “regulated investment companies” under the Code in order to avoid paying entity level income taxes. Under current law, the ALPS | Alerian MLP Infrastructure Index Fund is not eligible to elect treatment as a regulated investment company due to its investments, primarily in Master Limited Partnerships (“MLPs”) invested in energy assets. As a result, the ALPS | Alerian MLP Infrastructure Index Fund will be obligated to pay applicable federal and state corporate income taxes on its taxable income as opposed to most other investment companies which are not so obligated. As discussed below, the ALPS | Alerian MLP Infrastructure Index Fund expects that a portion of the distributions it receives from MLPs may be treated as a tax-deferred return of capital, thus reducing the Fund’s current tax liability. However, the amount of taxes currently paid by the ALPS | Alerian MLP Infrastructure Index Fund will vary depending on the amount of income and gains derived from investments and/or sales of MLP interests and such taxes will reduce the return from an investment in the Fund. See further disclosure regarding MLPs below.
As of and during the period ended April 30, 2013, the Funds did not have a liability for any unrecognized tax benefits. The Funds file U.S. federal, state, and local tax returns as required. The Funds’ tax returns are subject to examination by the relevant tax authorities until expiration of the applicable statute of limitations which is generally three years after the filing of the tax return, but may extend to four years in certain jurisdictions. Tax returns for open years have incorporated no uncertain tax positions that require a provision for income taxes.
Distributions to Shareholders: Each Fund, except the ALPS | CoreCommodity Management CompleteCommoditiesSM Strategy Fund, RiverFront Conservative Income Builder Fund, RiverFront Dynamic Equity Income Fund, and RiverFront Moderate Growth & Income Fund normally pays dividends and distributes capital gains, if any, on an annual basis. The ALPS | CoreCommodity Management CompleteCommoditiesSM Strategy Fund, RiverFront Conservative Income Builder Fund, RiverFront Dynamic Equity Income Fund, and RiverFront Moderate Growth & Income Fund pay dividends, if any, on a quarterly basis and distribute capital gains annually. Income dividend distributions are derived from interest and other income the Fund receives from its investments, including distributions of short-term capital gains. Capital gain distributions are derived from gains realized when the Fund sells a security it has owned for more than a year. Each Fund may make additional distributions and dividends at other times if its portfolio manager or managers believe doing so may be necessary for the Fund to avoid or reduce taxes.
Distributions received from the ALPS | Alerian MLP Infrastructure Index Fund’s investments in MLPs generally are comprised of income and return of capital. The Fund records investment income and return of capital based on estimates made at the time such distributions are received. Such estimates are based on historical information available from each MLP and other industry sources. These estimates may subsequently be revised based on information received from MLPs after their tax reporting periods are concluded. Return of capital distributions are not taxable income to the shareholder, but reduce the investor’s tax basis in the investor’s Fund shares. Such a reduction in tax basis will result in larger taxable gains and/or lower tax losses on a subsequent sale of Fund shares. Shareholders who periodically receive the payment of dividends or other distributions consisting of a return of capital may be under the impression that they are receiving net profits from the Fund when, in fact, they are not. Shareholders should not assume that the source of the distributions is from the net profits of the Fund.
Cash distributions from MLPs to the ALPS | Alerian MLP Infrastructure Index Fund that exceed such Fund’s allocable share of such MLP’s net taxable income are considered a tax-deferred return of capital that will reduce the Fund’s adjusted tax basis in the equity securities of the MLP. These reductions in such Fund’s adjusted tax basis in the MLP equity securities will increase the amount of gain (or decrease the amount of loss) recognized by the Fund on a subsequent sale of the securities. The Fund will accrue deferred income taxes for any future tax liability associated with (i) that portion of MLP distributions considered to be a tax-deferred return of capital as well as (ii) capital appreciation of its investments. Upon the sale of an MLP security, the Fund may be liable for previously deferred taxes. The Fund will rely to some extent on information provided by the MLPs, which is not necessarily timely, to estimate deferred tax liability for purposes of financial statement reporting and determining the NAV. From time to time, ALPS Advisors, Inc. will modify the estimates or assumptions related to the Fund’s deferred tax liability as new information becomes available. The Fund will generally compute deferred income taxes based on the marginal regular federal income tax rate applicable to corporations and an assumed rate attributable to state taxes.
Investment Transactions and Investment Income: Investment transactions are accounted for on the date the investments are purchased or sold (trade date basis). Net realized gains and losses from investment transactions are reported on an identified cost basis. Interest income, which includes accretion of discounts and amortization of premiums, is accrued and recorded as earned. Dividend income is recognized on the ex-dividend date or for certain foreign securities, as soon as information is available to each Fund.
Foreign Securities: Each Fund may directly purchase securities of foreign issuers. Investing in securities of foreign issuers involves special risks not typically associated with investing in securities of U.S. issuers. The risks include possible reevaluation of currencies, the inability to repatriate foreign currency, less complete financial information about companies and possible future adverse political and economic developments.
| | |
| Notes to Financial Statements | | |
| | April 30, 2013 |
Moreover, securities of many foreign issuers and their markets may be less liquid and their prices more volatile than those of securities of comparable U.S. issuers.
Foreign Currency Translation: The books and records of the Funds are maintained in U.S. dollars. Investment valuations and other assets and liabilities initially expressed in foreign currencies are converted each business day into U.S. dollars based upon current exchange rates. The portion of realized and unrealized gains or losses on investments due to fluctuations in foreign currency exchange rates is not separately disclosed and is included in realized and unrealized gains or losses on investments, when applicable.
Foreign Currency Spot Contracts: The Funds may enter into foreign currency spot contracts to facilitate transactions in foreign securities or to convert foreign currency receipts into U.S. dollars. A foreign currency spot contract is an agreement between two parties to buy and sell currencies at the current market rate, for settlement generally within two business days. The U.S. dollar value of the contracts is determined using current currency exchange rates supplied by a pricing service. The contract is marked-to-market daily for settlements beyond one day and any change in market value is recorded as an unrealized gain or loss. When the contract is closed, the Fund records a realized gain or loss equal to the difference between the value on the open and close date. Losses may arise from changes in the value of the foreign currency, or if the counterparties do not perform under the contract’s terms. The maximum potential loss from such contracts is the aggregate face value in U.S. dollars at the time the contract was opened.
Real Estate Investment Trusts (“REITs”): The Funds may invest a portion of their assets in REITs and are subject to certain risks associated with direct investment in REITs. REITs may be affected by changes in the value of their underlying properties and by defaults by borrowers or tenants. REITs depend generally on their ability to generate cash flow to make distributions to shareowners, and certain REITs have self-liquidation provisions by which mortgages held may be paid in full and distributions of capital returns may be made at any time. In addition, the performance of a REIT may be affected by its failure to qualify for tax-free pass-through of income under the Internal Revenue Code of 1986, as amended (the “Code”), or its failure to maintain exemption from registration under the 1940 Act.
Treasury Inflation Protected-Securities: The Funds may invest in treasury inflation protected securities (“TIPS”), including structured bonds in which the principal amount is adjusted daily to keep pace with inflation, as measured by the U.S. Consumer Pricing Index for Urban Consumers. The adjustments to principal due to inflation/deflation are reflected as increases/decreases to interest income with a corresponding adjustment to cost. Such adjustments may have a significant impact on a Fund’s distributions and may result in a return of capital to shareholders. The repayment of the original bond principal upon maturity is guaranteed by the full faith and credit of the U.S. Government.
Master Limited Partnerships: MLPs are publicly traded partnerships engaged in the transportation, storage and processing of minerals and natural resources. By confining their operations to these specific activities, their interests, or units, are able to trade on public securities exchanges exactly like the shares of a corporation, without entity level taxation. Of the seventy MLPs eligible for inclusion in the Index, approximately two-thirds trade on the NYSE and the rest trade on the NASDAQ. To qualify as a MLP and to not be taxed as a corporation, a partnership must receive at least 90% of its income from qualifying sources as set forth in Section 7704(d) of the Internal Revenue Code of 1986, as amended (the “Code”). These qualifying sources include natural resource based activities such as the processing, transportation and storage of mineral or natural resources. MLPs generally have two classes of owners, the general partner and limited partners. The general partner of an MLP is typically owned by a major energy company, an investment fund, the direct management of the MLP, or is an entity owned by one or more of such parties. The general partner may be structured as a private or publicly traded corporation or other entity. The general partner typically controls the operations and management of the MLP through an up to 2% equity interest in the MLP plus, in many cases, ownership of common units and subordinated units. Limited partners typically own the remainder of the partnership, through ownership of common units, and have a limited role in the partnership’s operations and management. MLPs are typically structured such that common units and general partner interests have first priority to receive quarterly cash distributions up to an established minimum amount (“minimum quarterly distributions” or “MQD”). Common and general partner interests also accrue arrearages in distributions to the extent the MQD is not paid. Once common and general partner interests have been paid, subordinated units receive distributions of up to the MQD; however, subordinated units do not accrue arrearages. Distributable cash in excess of the MQD is paid to both common and subordinated units and is distributed to both common and subordinated units generally on a pro rata basis. The general partner is also eligible to receive incentive distributions if the general partner operates the business in a manner which results in distributions paid per common unit surpassing specified target levels. As the general partner increases cash distributions to the limited partners, the general partner receives an increasingly higher percentage of the incremental cash distributions.
Short Sales: Each Fund may make short sales of securities consistent with its strategies. A short sale is a transaction in which a Fund sells a security it does not own in anticipation that the market price of that security will decline. During the year, ALPS | CoreCommodity Management CompleteCommoditiesSM Strategy Fund engaged in short sales; but as of April 30, 2013 there were no outstanding positions.
| | |
| Notes to Financial Statements | | |
| | April 30, 2013 |
When a Fund makes a short sale, it must borrow the security sold short and deliver it to the broker dealer through which it made the short sale as collateral for its obligation to deliver the security upon conclusion of the sale. The Fund may have to pay a fee to borrow particular securities and is often obligated to pay over any accrued interest and dividends on such borrowed securities.
If the price of the security sold short increases between the time of the short sale and the time that a Fund replaces the borrowed security, the Fund will incur a loss; conversely, if the price declines, the Fund will realize a capital gain. Any gain will be decreased, and any loss increased, by the transaction costs described above. The successful use of short selling may be adversely affected by imperfect correlation between movements in the price of the security sold short and the securities being hedged.
To the extent that a Fund engages in short sales, it will provide collateral to the broker-dealer and (except in the case of short sales “against the box”) will maintain additional asset coverage in the form of segregated or “earmarked” assets determined to be liquid in accordance with procedures established by the Board and that is equal to the current market value of the securities sold short, or will ensure that such positions are covered by “offsetting” positions, until the Fund replaces the borrowed security. A short sale is “against the box” to the extent that the Fund contemporaneously owns, or has the right to obtain at no added cost, securities identical to those sold short. Each Fund may engage in short selling to the extent permitted by the federal securities laws and rules and interpretations thereunder. To the extent a Fund engages in short selling in foreign (non-U.S.) jurisdictions, the Fund will do so to the extent permitted by the laws and regulations of such jurisdiction.
3. DERIVATIVE INSTRUMENTS
As a part of their principal investment strategy, ALPS | Kotak India Growth Fund and ALPS | CoreCommodity Management CompleteCommoditiesSM Strategy Fund permits the Funds to purchase investment securities, they also allow the Funds to enter in various types of derivatives contracts. The other funds including ALPS | Alerian MLP Infrastructure Index Fund, ALPS | Red Rocks Listed Private Equity Fund, ALPS | WMC Disciplined Value Fund, Clough China Fund, RiverFront Conservative Income Builder Fund, RiverFront Dynamic Equity Income Fund, RiverFront Global Allocation Fund, RiverFront Global Growth Fund and RiverFront Moderate Growth & Income Fund may invest to a lesser extent in derivatives contracts. In doing so, the Funds will employ strategies in differing combinations to permit them to increase, decrease, or change the level or types of exposure to market factors. Central to those strategies are features inherent in derivatives that make them more attractive for this purpose than equity or debt securities; they require little or no initial cash investment, they can focus exposure on only certain selected risk factors, and they may not require the ultimate receipt or delivery of the underlying security (or securities) to the contract. This may allow the Funds to pursue their objectives more quickly and efficiently than if they were to make direct purchases or sales of securities capable of affecting a similar response to market factors.
Risk of Investing in Derivatives: The Funds’ use of derivatives can result in losses due to unanticipated changes in the market risk factors and the overall market. In instances where the Funds are using derivatives to decrease, or hedge, exposures to market risk factors for securities held by the Funds, there are also risks that those derivatives may not perform as expected resulting in losses for the combined or hedged positions.
Derivatives may have little or no initial cash investment relative to their market value exposure and therefore can produce significant gains or losses in excess of their cost. This use of embedded leverage allows the Fund to increase its market value exposure relative to it net assets and can substantially increase the volatility of the Funds’ performance.
Additional associated risks from investing in derivatives also exist and potentially could have significant effects on the valuation of the derivative and the Funds. Typically, the associated risks are not the risks that the Funds are attempting to increase or decrease exposure to, per their investment objectives, but are the additional risks from investing in derivatives.
Examples of these associated risks are liquidity risk, which is the risk that the Funds will not be able to sell or close out the derivative in a timely manner, and counterparty credit risk, which is the risk that the counterparty will not fulfill its obligation to the Funds. In addition, use of derivatives may increase or decrease exposure to the following risk factors:
Equity Risk: Equity risk relates to the change in value of equity securities as they relate to increases or decreases in the general market. Associated risks can be different for each type of derivative and are discussed by each derivative type in the notes that follow.
Commodity Risk: Exposure to the commodities markets may subject the Fund to greater volatility than investments in traditional securities. Prices of various commodities may also be affected by factors, such as drought, floods, weather, livestock disease, embargoes, tariffs and other regulatory developments, which are unpredictable. The prices of commodities can also fluctuate widely due to supply and demand disruptions in major producing or consuming regions.
Foreign Currency Risk: Currency trading involves significant risks, including market risk, interest rate risk, country risk, counterparty credit risk and short sale risk. Market risk results from the price movement of foreign currency values in response to shifting market supply and demand.
| | |
| Notes to Financial Statements | | |
| | April 30, 2013 |
Interest rate risk arises whenever a country changes its stated interest rate target associated with its currency. Country risk arises because virtually every country has interfered with international transactions in its currency.
Interest Rate Risk: Interest rate risk is the risk that fixed income securities will decline in value because of changes in interest rates. As nominal interest rates rise, the value of fixed income securities held by the Fund are likely to decrease. Securities with longer durations tend to be more sensitive to changes in interest rates, and are usually more volatile than securities.
Swap Contracts: The CoreCommodity Fund may enter into swap transactions for hedging purposes or to seek to increase total return. At the present time, the CoreCommodity Fund primarily enters into swap transactions for the purpose of increasing total return. Risks may arise as a result of the failure of the counterparty to the swap contract to comply with the terms of the swap contract. The loss incurred by the failure of a counterparty is generally limited to the net payment to be received by the CoreCommodity Fund and/or the termination value at the end of the contract.
Therefore, the CoreCommodity Fund considers the creditworthiness of each counterparty to a contract in evaluating potential credit risk. Additionally, risks may arise from unanticipated movements in interest rates or in the value of the underlying reference asset or index. Entering into these agreements involves, to varying degrees, market risk, liquidity risk and elements of credit, legal and documentation risk that are not directly reflected in the amounts recognized in the Statements of Assets and Liabilities.
The CoreCommodity Fund may pay or receive cash as collateral on these contracts which may be recorded as an asset and/or liability. The CoreCommodity Fund must set aside liquid assets, or engage in other appropriate measures, to cover its obligations under these contracts. Swaps are marked to market daily using either pricing vendor quotations, counterparty prices or model prices and the change in value, if any, is recorded as an unrealized gain or loss. Upfront payments made and/or received by the CoreCommodity Fund are recorded as an asset and/or liability and realized gains or losses are recognized ratably over the contract’s term/event, with the exception of forward starting interest rate swaps, whose realized gains or losses are recognized ratably from the effective start date. Periodic payments received or made on swap contracts are recorded as realized gains or losses. Gains or losses are realized upon termination of a swap contract and are recorded on the Statement of Operations.
The CoreCommodity Fund invests in total return swaps to obtain exposure to a security or market without owning such security or investing directly in that market or to transfer the risk/return of one market (e.g., fixed income) to another market (e.g., equity) (equity risk and/or interest rate risk). Total return swaps are agreements in which there is an exchange of cash flows whereby one party commits to make payments based on the total return (coupons plus capital gains/losses) of an underlying instrument in exchange for fixed or floating rate interest payments. To the extent the total return of the instrument or index underlying the transaction exceeds or falls short of the offsetting interest rate obligation, the Fund will receive a payment from or make a payment to the counterparty. Swap agreements held at April 30, 2013 are disclosed after the Statement of Investments.
The number of swap contracts held at April 30, 2013 is representative of swap contract activity for the year ended April 30, 2013.
Futures: Certain Funds may invest in futures contracts in accordance with their investment objectives. Each Fund does so for a variety of reasons including for cash management, hedging or non-hedging purposes in an attempt to achieve investment returns consistent with the Fund’s investment objective. A futures contract provides for the future sale by one party and purchase by another party of a specified quantity of the security or other financial instrument at a specified price and time. A futures contract on an index is an agreement pursuant to which two parties agree to take or make delivery of an amount of cash equal to the difference between the value of the index at the close of the last trading day of the contract and the price at which the index contract was originally written. Futures transactions may result in losses in excess of the amount invested in the futures contract. There can be no guarantee that there will be a correlation between price movements in the hedging vehicle and in the portfolio securities being hedged. An incorrect correlation could result in a loss on both the hedged securities in a Fund and the hedging vehicle so that the portfolio return might have been greater had hedging not been attempted. There can be no assurance that a liquid market will exist at a time when a Fund seeks to close out a futures contract or a futures option position. Lack of a liquid market for any reason may prevent a Fund from liquidating an unfavorable position, and the Fund would remain obligated to meet margin requirements until the position is closed. In addition, a Fund could be exposed to risk if the counterparties to the contracts are unable to meet the terms of their contracts. With exchange traded futures, there is minimal counterparty credit risk to the Funds since futures are exchange traded and the exchange’s clearinghouse, as counterparty to all exchange traded futures, guarantees the futures against default.
When a purchase or sale of a futures contract is made by a Fund, the Fund is required to deposit with its custodian (or broker, if legally permitted) a specified amount of liquid assets (“initial margin”). The margin required for a futures contract is set by the exchange on which the contract is traded and may be modified during the term of the contract. The initial margin is in the nature of a performance bond or good faith deposit on the futures contract that is returned to a Fund upon termination of the contract, assuming all contractual obligations have been satisfied. Each day a Fund may pay or receive cash, called “variation margin,” equal to the daily change in value of the futures contract. Such payments or receipts are recorded for financial statement purposes as unrealized gains or losses by a Fund. Variation margin does not represent a borrowing or loan by a Fund but is instead a settlement between a Fund and the broker of the amount one would owe the other if the futures contract expired. When the contract is closed, a Fund
| | |
| Notes to Financial Statements | | |
| | April 30, 2013 |
records a realized gain or loss equal to the difference between the value of the contract at the time it was opened and the value at the time it was closed. As of April 30, 2013, the CoreCommodity Fund had futures contracts outstanding with a net unrealized depreciation of $1,914,927. The number of futures contracts held at April 30, 2013 is representative of futures contracts activity during the year ended April 30, 2013.
Option Contracts: Each Fund may enter into options transactions for hedging purposes and for non-hedging purposes such as seeking to enhance return. Each Fund may write covered put and call options on any stocks or stock indices, currencies traded on domestic and foreign securities exchanges, or futures contracts on stock indices, interest rates and currencies traded on domestic and, to the extent permitted by the CFTC, foreign exchanges. A call option on an asset written by a Fund obligates the Fund to sell the specified asset to the holder (purchaser) at a stated price (the exercise price) if the option is exercised before a specified date (the expiration date). A put option on an asset written by a Fund obligates the Fund to buy the specified asset from the purchaser at the exercise price if the option is exercised before the expiration date. Premiums received when writing options are recorded as liabilities and are subsequently adjusted to the current value of the options written. Premiums received from writing options that expire are treated as realized gains. Premiums received from writing options, which are either exercised or closed, are offset against the proceeds received or amount paid on the transaction to determine realized gains or losses which are recorded on the Statement of Operations.
The CoreCommodity Fund had the following transactions in written covered call/put options during the year ended April 30, 2013:
| | | | | | | | | | |
| | | Number of Contracts | | | Premiums | | | |
|
Options Outstanding, Beginning of Year | | | – | | | $ | – | | | |
Options written | | | (160) | | | | (247,865 | ) | | |
Options closed | | | 95 | | | | 134,000 | | | |
Options exercised | | | 10 | | | | 19,500 | | | |
Options expired | | | 55 | | | | 94,365 | | | |
|
Options Outstanding, End of Year | | | – | | | $ | – | | | |
|
Derivatives Instruments: The following tables disclose the amounts related to each Fund’s use of derivative instruments.
The effect of derivatives instruments on the Consolidated Statement of Assets and Liabilities as of April 30, 2013:
| | | | | | | | | | | | |
| Risk Exposure | | Statement of Assets and Liabilities Location | | Fair Value | | | Statement of Assets and Liabilities Location | | Fair Value | |
| |
ALPS | CoreCommodity Management CompleteCommoditiesSM Strategy Fund | |
Futures Contracts* | | Receivable for variation margin | | $ | – | | | Payable for variation margin | | $ | 1,914,927 | |
Commodity Contracts
(total return swap contracts) | | Unrealized appreciation on total return swap contracts | | | 1,432,480 | | | Unrealized depreciation on total return swap contracts | | | 6,270,202 | |
| |
Total | | | | $ | 1,432,480 | | | | | $ | 8,185,129 | |
| |
| | * Risk Exposure to Fund | | | | | | | |
| | Commodity Contracts | | $ | – | | | | | $ | 1,493,033 | |
| | Equity Contracts | | | – | | | | | | 421,894 | |
| | | | | | |
| | | | $ | – | | | | | $ | 1,914,927 | |
| | | | | | |
| | |
| Notes to Financial Statements | | |
| | April 30, 2013 |
The effect of derivatives instruments on the Consolidated Statement of Operations for the year ended April 30, 2013:
| | | | | | | | | | |
| Risk Exposure | | Statement of Operations Location | | Realized Gain/(Loss)
on Derivatives Recognized in Income | | | Change in Unrealized Gain/(Loss) on Derivatives Recognized in Income | |
| |
ALPS | CoreCommodity Management CompleteCommoditiesSM Strategy Fund | | | | | |
Equity Contracts
(written options) | | Net realized gain on written options/Net change in unrealized appreciation/(depreciation) on written options | | $ | 197,875 | | | $ | – | |
Futures Contracts* | | Net realized loss on futures contracts/Net change in unrealized depreciation on futures contracts | | | (1,652,573 | ) | | | (1,913,390 | ) |
Commodity Contracts
(total return swap contracts) | | Net realized loss on total return swap contracts/Net change in unrealized depreciation on total return swap contracts | | | (7,668,328 | ) | | | (3,375,396 | ) |
| |
Total | | | | $ | (9,123,026 | ) | | $ | (5,288,786 | ) |
| |
| | | |
| | *Risk Exposure to Fund | | | | | | | | |
| | Commodity Contracts | | $ | 506,161 | | | $ | (1,491,496 | ) |
| | Equity Contracts | | | (2,158,845 | ) | | | (421,894 | ) |
| | Interest Rate Contracts | | | 597 | | | | – | |
| | Foreign Currency Contracts | | | (486 | ) | | | – | |
| | | | | | |
| | | | $ | (1,652,573 | ) | | $ | (1,913,390 | ) |
| | | | | | |
| ALPS | Kotak India Growth Fund | | | | | | | | |
Equity Contracts
(futures contracts) | | Net realized gain on futures contracts/Net change in unrealized appreciation/(depreciation) on futures contracts | | $ | 5,567 | | | $ | – | |
| |
Total | | | | $ | 5,567 | | | $ | – | |
| |
4. TAX BASIS INFORMATION
Tax Basis of Distributions to Shareholders: The character of distributions made during the year from net investment income or net realized gains may differ from its ultimate characterization for federal income tax purposes. Also, due to the timing of dividend distributions, the fiscal year in which amounts are distributed may differ from the fiscal year in which the income or realized gain were recorded by a Fund. The amounts and characteristics of tax basis distributions and composition of distributable earnings/(accumulated losses) are shown below.
The tax character of distributions paid by the Funds for the fiscal year or period ended April 30, 2013 is as follows:
| | | | | | | | | | | | |
| Fund | | Ordinary Income | | | Long-Term Capital Gain | | | Return of Capital | |
| |
ALPS | Alerian MLP Infrastructure Index Fund | | $ | – | | | $ | – | | | $ | 49,338 | |
ALPS | CoreCommodity Management
CompleteCommoditiesSM Strategy Fund | | | – | | | | – | | | | 1,317,510 | |
ALPS | Kotak India Growth Fund | | | – | | | | – | | | | – | |
ALPS | Red Rocks Listed Private Equity Fund | | | 3,300,025 | | | | – | | | | – | �� |
ALPS | WMC Disciplined Value Fund | | | 890,012 | | | | – | | | | – | |
Clough China Fund | | | 100,016 | | | | – | | | | – | |
RiverFront Conservative Income Builder Fund | | | 16,480 | | | | – | | | | – | |
RiverFront Dynamic Equity Income Fund | | | 511,037 | | | | – | | | | – | |
RiverFront Global Allocation Fund | | | 250,390 | | | | – | | | | – | |
RiverFront Global Growth Fund | | | 802,738 | | | | – | | | | – | |
RiverFront Moderate Growth & Income Fund | | | 1,511,757 | | | | – | | | | – | |
| | |
| Notes to Financial Statements | | |
| | April 30, 2013 |
The tax character of distributions paid by the Funds for the fiscal year or period ended April 30, 2012 is as follows:
| | | | | | | | | | | | |
| Fund | | Ordinary Income | | | Long-Term Capital Gain | | | Return of Capital | |
| |
ALPS | Alerian MLP Infrastructure Index Fund | | $ | – | | | $ | – | | | $ | – | |
ALPS | CoreCommodity Management
CompleteCommoditiesSM Strategy Fund | | | 8,501,893 | | | | 639,478 | | | | – | |
ALPS | Kotak India Growth Fund | | | 2,599 | | | | – | | | | – | |
ALPS | Red Rocks Listed Private Equity Fund | | | 13,244,157 | | | | – | | | | – | |
ALPS | WMC Disciplined Value Fund | | | 535,003 | | | | – | | | | – | |
Clough China Fund | | | – | | | | – | | | | – | |
RiverFront Conservative Income Builder Fund | | | – | | | | – | | | | – | |
RiverFront Dynamic Equity Income Fund | | | 289,493 | | | | – | | | | 17,411 | |
RiverFront Global Allocation Fund | | | 123,429 | | | | 6,669 | | | | – | |
RiverFront Global Growth Fund | | | 2,586,518 | | | | 1,500,914 | | | | – | |
RiverFront Moderate Growth & Income Fund | | | 758,987 | | | | – | | | | 27,381 | |
Components of Distributable Earnings on a Tax Basis: At April 30, 2013, permanent differences in book and tax accounting were reclassified. These differences had no effect on net assets and were primarily attributed to differences in the treatment of commodity related exchange-traded funds, the differing tax treatment of foreign currency, investments in partnerships Passive Foreign Investment Companies (“PFICs”) and certain other investments.
For the year ended April 30, 2013, the following reclassifications, which had no impact on results of operations or net assets, were recorded to reflect tax character:
| | | | | | | | | | | | |
| Fund | | Paid-in Capital | | | Accumulated Net
Investment Income/(Loss) | | | Accumulated Net Realized
Gain/(Loss) on Investments | |
| |
ALPS | CoreCommodity Management
CompleteCommoditiesSM Strategy Fund | | $ | (11,074,086) | | | $ | 630,317 | | | $ | 10,443,769 | |
ALPS | Kotak India Growth Fund | | | 610 | | | | 32,368 | | | | (32,978) | |
ALPS | Red Rocks Listed Private Equity Fund | | | 17,697 | | | | 1,932,384 | | | | (1,950,081) | |
ALPS | WMC Disciplined Value Fund | | | – | | | | 2,358 | | | | (2,358) | |
Clough China Fund | | | – | | | | 75,697 | | | | (75,697) | |
RiverFront Conservative Income Builder Fund | | | (9,758) | | | | 9,758 | | | | – | |
RiverFront Dynamic Equity Income Fund | | | (1,713) | | | | 1,193 | | | | 520 | |
RiverFront Global Allocation Fund | | | – | | | | (78) | | | | 78 | |
RiverFront Global Growth Fund | | | – | | | | (221) | | | | 221 | |
RiverFront Moderate Growth & Income Fund | | | (5,342) | | | | 4,714 | | | | 628 | |
Included in the amounts reclassified was a net operating loss offset to Paid-in-Capital as follows:
| | | | |
| Fund | | Amount | |
| |
ALPS | CoreCommodity Management CompleteCommoditiesSM Strategy Fund | | $ | 388,650 | |
As of April 30, 2013, the components of distributable earnings on a tax basis were as follows:
| | | | | | | | | | | | | | | | | | | | |
| Fund | | Undistributed net investment income | | | Accumulated net
realized gain/(loss) on investments | | | Other cumulative effect of timing differences | | | Net unrealized appreciation/ (depreciation) on investments | | | Total | |
| |
ALPS | CoreCommodity Mgmt CompleteCommoditiesSM Strategy Fund | | $ | – | | | $ | (3,658,680) | | | $ | 1,166 | | | $ | (9,186,110) | | | $ | (12,843,624) | |
ALPS | Kotak India Growth Fund | | | 9,597 | | | | (81,560) | | | | – | | | | 130,555 | | | | 58,592 | |
ALPS | Red Rocks Listed Private Equity Fund | | | 15,753,927 | | | | (16,759,740) | | | | 3,352 | | | | 27,588,274 | | | | 26,585,813 | |
ALPS | WMC Disciplined Value Fund | | | 386,627 | | | | (6,342,039) | | | | – | | | | 22,376,948 | | | | 16,421,536 | |
Clough China Fund | | | 447,861 | | | | (2,201,190) | | | | – | | | | 11,822,980 | | | | 10,069,651 | |
RiverFront Conservative Income Builder Fund | | | 26,631 | | | | 369 | | | | – | | | | 107,256 | | | | 134,256 | |
RiverFront Dynamic Equity Income Fund | | | 21,202 | | | | 640,781 | | | | – | | | | 2,644,199 | | | | 3,306,182 | |
RiverFront Global Allocation Fund | | | 18,054 | | | | 214,324 | | | | (37,220) | | | | 1,934,028 | | | | 2,129,186 | |
RiverFront Global Growth Fund | | | 28,039 | | | | 3,014,797 | | | | (75,400) | | | | 7,501,377 | | | | 10,468,813 | |
RiverFront Moderate Growth & Income Fund | | | 83,800 | | | | 1,884,385 | | | | – | | | | 7,202,453 | | | | 9,170,638 | |
| | |
| Notes to Financial Statements | | |
| | April 30, 2013 |
The Fund elects to defer to the year ended April 30, 2014, late year ordinary losses in the amount of:
| | | | |
| Fund | | Amount | |
| |
RiverFront Global Allocation Fund | | $ | 37,220 | |
RiverFront Global Growth Fund | | | 75,400 | |
Capital Losses: As of April 30, 2013 the following Funds had capital loss carryforwards which may reduce the Funds’ taxable income arising from future net realized gains on investments, if any, to the extent permitted by the Code and thus may reduce the amount of the distributions to shareholders which would otherwise be necessary to relieve the Funds of any liability for federal tax. Pursuant to the Code, such capital loss carryforwards will expire as follows:
Pre-Enactment Capital Losses:
| | | | | | | | | | | | |
| Fund | | Expiring in 2016 | | | Expiring in 2017 | | | Expiring in 2018 | |
| |
ALPS | Red Rocks Listed Private Equity Fund | | $ | – | | | $ | – | | | $ | 8,281,739 | |
ALPS | WMC Disciplined Value Fund | | | 3,561,757 | | | | 2,780,282 | | | | – | |
Under the recently enacted Regulated Investment Company Modernization Act of 2010, capital losses incurred by each fund in tax years beginning after December 22, 2010 will not be subject to expiration. In addition, such losses must be utilized prior to the losses incurred in the years preceding enactment.
Capital loss carryovers utilized during the period ended April 30, 2013, were:
| | | | |
| Fund | | Amount | |
| |
ALPS | WMC Disciplined Value Fund | | $ | 3,584,375 | |
Post-Enactment Capital Losses*:
Capital losses deferred to next tax year were as follows:
| | | | | | | | |
| Fund | | Short-Term | | | Long-Term | |
| |
ALPS | CoreCommodity Management CompleteCommoditiesSM Strategy Fund | | $ | 3,658,680 | | | $ | – | |
ALPS | Kotak India Growth Fund | | | 57,984 | | | | 23,576 | |
ALPS | Red Rocks Listed Private Equity Fund | | | 6,448,167 | | | | 1,995,842 | |
Clough China Fund | | | 2,201,190 | | | | – | |
| | |
Capital loss carryovers utilized during the period ended April 30, 2013, were: | | | | | | | | |
| | |
| Fund | | Short-Term | | | Long-Term | |
| |
ALPS | Kotak India Growth Fund | | $ | 73,317 | | | $ | – | |
RiverFront Dynamic Equity Income Fund | | | 702,912 | | | | – | |
RiverFront Global Allocation Fund | | | 763,613 | | | | 2,317 | |
RiverFront Moderate Growth & Income Fund | | | 1,279,511 | | | | – | |
The Fund elects to defer to the year ended April 30, 2014, capital losses recognized during the period November 1, 2011 to April 30, 2013 in the amount of:
| | | | |
| Fund | | Amount | |
| |
ALPS | Red Rocks Listed Private Equity Fund | | $ | 33,992 | |
| * | Post-Enactment Capital Losses arise in fiscal years beginning after December 22, 2010, and exclude any election for late year capital loss (during the period November 1st to December 31st) deferred for the current fiscal year. As a result of the enactment of the Regulated Investment Company Act of 2010, pre-enactment capital loss carryforwards may be more likely to expire unused. Additionally, post-enactment capital losses that are carried forward will retain their character as either short-term or long-term losses rather than being considered all short-term as under previous law. |
| | |
| Notes to Financial Statements | | |
| | April 30, 2013 |
Unrealized Appreciation and Depreciation on Investments: As of April 30, 2013, the costs of investments for federal income tax purposes and accumulated net unrealized appreciation/(depreciation) on investments were as follows:
| | | | | | | | | | | | | | | | | | | | |
| | | Gross | | | Gross | | | Net Appreciation/ | | | | | | | |
| | | Appreciation | | | Depreciation | | | (Depreciation) of | | | Net Unrealized | | | Cost of Investments | |
| | | (excess of value | | | (excess of tax | | | Foreign Currency | | | Appreciation/ | | | for Income Tax | |
| Fund | | over tax cost) | | | cost over value) | | | and Derivatives | | | (Depreciation) | | | Purposes | |
| |
ALPS | Alerian MLP Infrastructure Index Fund | | $ | 636,448 | | | $ | (2,919 | ) | | $ | – | | | $ | 633,529 | | | $ | 3,341,506 | |
ALPS | CoreCommodity Management
CompleteCommoditiesSM Strategy Fund | | | 15,054,056 | | | | (17,308,860 | ) | | | (6,931,306 | ) | | | (9,186,110 | ) | | | 323,174,178 | |
ALPS | Kotak India Growth Fund | | | 1,190,039 | | | | (1,060,544 | ) | | | 1,060 | | | | 130,555 | | | | 7,438,713 | |
ALPS | Red Rocks Listed Private Equity Fund | | | 31,199,210 | | | | (3,620,321 | ) | | | 9,385 | | | | 27,588,274 | | | | 219,110,167 | |
ALPS | WMC Disciplined Value Fund | | | 23,169,045 | | | | (792,097 | ) | | | – | | | | 22,376,948 | | | | 67,676,809 | |
Clough China Fund | | | 12,558,474 | | | | (736,122 | ) | | | 628 | | | | 11,822,980 | | | | 58,156,142 | |
RiverFront Conservative Income Builder Fund | | | 112,400 | | | | (5,144 | ) | | | – | | | | 107,256 | | | | 3,319,448 | |
RiverFront Dynamic Equity Income Fund | | | 2,669,230 | | | | (25,031 | ) | | | – | | | | 2,644,199 | | | | 31,962,516 | |
RiverFront Global Allocation Fund | | | 1,967,053 | | | | (33,025 | ) | | | – | | | | 1,934,028 | | | | 22,587,217 | |
RiverFront Global Growth Fund | | | 7,560,597 | | | | (59,220 | ) | | | – | | | | 7,501,377 | | | | 48,701,868 | |
RiverFront Moderate Growth & Income Fund | | | 7,270,759 | | | | (68,306 | ) | | | – | | | | 7,202,453 | | | | 100,276,646 | |
Deferred Tax Liability for ALPS | Alerian MLP Infrastructure Index Fund
Since the ALPS | Alerian MLP Infrastructure Index Fund will be subject to taxation on its taxable income, the NAV of Fund shares will also be reduced by the accrual of any deferred tax liabilities. The Index however is calculated without any adjustments for taxes. As a result, the Fund’s after tax performance could differ significantly from the Index even if the pretax performance of the Fund and the performance of the Index are closely correlated.
The Fund’s income tax expense/(benefit) consists of the following:
| | | | | | | | | | |
| April 30, 2013 | | Current | | Deferred | | | Total | |
| |
Federal | | – | | $ | 211,650 | | | $ | 211,650 | |
State | | – | | | 14,297 | | | | 14,297 | |
| | | |
Total tax expense | | – | | $ | 225,947 | | | $ | 225,947 | |
| | | |
Deferred income taxes reflect the net tax effect of temporary differences between the carrying amounts of assets and liabilities for financial reporting and tax purposes.
Components of the Fund’s deferred tax assets and liabilities are as follows:
| | | | |
| | | As of April 30, 2013 | |
| |
Non-current Deferred tax assets: | | | | |
Net Operating Loss Carryforward | | $ | 3,710 | |
Capital Loss Carryforward | | | 293 | |
Other | | | – | |
Less Non-current Deferred tax liabilities: | | | | |
Net unrealized gain on investment securities | | $ | (229,950 | ) |
| | | | |
Net Deferred tax liability | | $ | (225,947 | ) |
| | | | |
Although the Fund currently has a net deferred tax liability, it reviews the recoverability of its deferred tax assets based upon the weight of available evidence. When assessing the recoverability of its deferred tax assets, significant weight was given to the effects of potential future realized and unrealized gains on investments and the period over which these deferred tax assets can be realized. Currently, any capital losses that may be generated by the Fund in the future are eligible to be carried back up to three years and can be carried forward for five years to offset capital gains recognized by the fund in those years. Net operating losses that may be generated by the Fund in the future are eligible to be carried back up to two years and can be carried forward for 20 years to offset income generated by the Fund in those years.
Based upon the Fund’s assessment, it has determined that it is more likely than not that its deferred tax assets will be realized through future taxable income of the appropriate character. Accordingly, no valuation allowance has been established for the Fund’s deferred tax assets. The Fund will continue to assess the need for a valuation allowance in the future. Significant declines in the fair value of its portfolio of investments may
| | |
| Notes to Financial Statements | | |
| | April 30, 2013 |
change the Fund’s assessment of the recoverability of these assets and may result in the recording of a valuation allowance against all or a portion of the Fund’s gross deferred tax assets.
Total income tax benefit (current and deferred) differs from the amount computed by applying the federal statutory income tax rate of 35% to net investment and realized and unrealized gain/(losses) on investment before taxes as follows:
| | | | |
| | | For the Period January 2, 2013 | |
| | | (Commencement) to April 30, 2013 | |
| |
Income tax expense at statutory rate | | $ | 211,650 | |
State income taxes (net of federal benefit) | | | 14,297 | |
| | | | |
Net income tax expense | | $ | 225,947 | |
| | | | |
5. SECURITIES TRANSACTIONS
Purchases and sales of securities, excluding short-term securities and U.S. Government Obligations during the year or period ended April 30, 2013 were as follows:
| | | | | | | | |
| | | | | | Proceeds from Sales of | |
| Fund | | Purchases of Securities | | | Securities | |
| |
ALPS | Alerian MLP Infrastructure Index Fund | | $ | 3,503,833 | | | $ | 107,511 | |
ALPS | CoreCommodity Management CompleteCommoditiesSM Strategy Fund(a) | | | 230,366,499 | | | | 177,597,642 | |
ALPS | Kotak India Growth Fund(b) | | | 7,706,036 | | | | 5,189,652 | |
ALPS | Red Rocks Listed Private Equity Fund | | | 97,158,017 | | | | 59,234,470 | |
ALPS | WMC Disciplined Value Fund | | | 27,005,136 | | | | 31,114,047 | |
Clough China Fund | | | 133,354,046 | | | | 138,560,719 | |
RiverFront Conservative Income Builder Fund | | | 4,560,423 | | | | 1,319,318 | |
RiverFront Dynamic Equity Income Fund | | | 41,512,080 | | | | 37,257,589 | |
RiverFront Global Allocation Fund | | | 24,997,404 | | | | 21,651,930 | |
RiverFront Global Growth Fund | | | 55,135,015 | | | | 56,912,726 | |
RiverFront Moderate Growth & Income Fund | | | 116,481,393 | | | | 87,294,344 | |
Purchases and sales of U.S. Government Obligations during the year or period ended April 30, 2013 were as follows:
| | | | | | | | |
| | | | | | Proceeds from Sales of | |
| Fund | | Purchases of Securities | | | Securities | |
| |
ALPS | CoreCommodity Management CompleteCommoditiesSM Strategy Fund | | $ | 156,128,410 | | | $ | 106,128,119 | |
| (a) | Purchases and Sales for ALPS | CoreCommodity Management CompleteCommoditiesSM Strategy Fund are consolidated and include the balances of Jeffereies Asset Management Cayman Trust (wholly owned subsidiary). |
| (b) | Purchases and Sales for ALPS | Kotak India Growth Fund are consolidated and include the balances of Kotak Mauritius Portfolio (wholly owned subsidiary). |
6. BENEFICIAL INTEREST TRANSACTIONS
Shares redeemed within 90 days of purchase for ALPS | Red Rocks Listed Private Equity Fund and 30 days of purchase for ALPS | CoreCommodity Management CompleteCommoditiesSM Strategy Fund, ALPS | Kotak India Growth Fund, and Clough China Fund, may incur a 2% short-term redemption fee deducted from the redemption amount, with the exception of ALPS | Alerian MLP Infrastructure Index Fund, ALPS | WMC Disciplined Value Fund, RiverFront Conservative Income Builder Fund, RiverFront Dynamic Equity Income Fund, RiverFront Global Allocation Fund, RiverFront Global Growth Fund, and RiverFront Moderate Growth & Income Fund shares. For the year ended April 30, 2013, the amounts listed below were retained by the Funds. These amounts are reflected in “Shares redeemed” in the Statements of Changes in Net Assets.
| | |
| Notes to Financial Statements | | |
| | April 30, 2013 |
| | | | | | | | |
| | | Redemption Fee Retained | |
| Fund | | For the Year Ended
April 30, 2013 | | | For the
Year Ended
April 30, 2012 | |
| |
ALPS | CoreCommodity Management CompleteCommoditiesSM Strategy Fund - Class A | | $ | 17,040 | | | $ | 13,838 | |
ALPS | CoreCommodity Management CompleteCommoditiesSM Strategy Fund - Class C | | | 186 | | | | 444 | |
ALPS | CoreCommodity Management CompleteCommoditiesSM Strategy Fund - Class I | | | 10,053 | | | | 21,699 | |
ALPS | Kotak India Growth Fund - Class A | | | 393 | | | | 642 | |
ALPS | Kotak India Growth Fund - Class C | | | – | | | | 275 | |
ALPS | Kotak India Growth Fund - Class I | | | 196 | | | | 91 | |
ALPS | Red Rocks Listed Private Equity Fund - Class A | | | 15,999 | | | | 51,757 | |
ALPS | Red Rocks Listed Private Equity Fund - Class C | | | 228 | | | | 1,796 | |
ALPS | Red Rocks Listed Private Equity Fund - Class I | | | 9,757 | | | | 8,016 | |
Clough China Fund - Class A | | | 564 | | | | 437 | |
Clough China Fund - Class C | | | 2 | | | | 139 | |
Clough China Fund - Class I | | | 22,029 | | | | 478 | |
Transactions in shares of capital stock were as follows:
| | | | |
| | | ALPS | Alerian MLP
Infrastructure Index Fund | |
| | | For the Period January 2, 2013
(Commencement) to April 30, 2013 | |
| |
Class A | | | | |
Shares sold | | | 82,771 | |
Dividends reinvested | | | 806 | |
Shares redeemed | | | (1) | |
| |
Net increase in shares outstanding | | | 83,576 | |
| |
Class C | | | | |
Shares sold | | | 50,001 | |
Dividends reinvested | | | 758 | |
Shares redeemed | | | (1) | |
| |
Net increase in shares outstanding | | | 50,758 | |
| |
Class I | | | | |
Shares sold | | | 200,001 | |
Dividends reinvested | | | 3,031 | |
Shares redeemed | | | (1) | |
| |
Net increase in shares outstanding | | | 203,031 | |
| |
| | |
| Notes to Financial Statements | | |
| | April 30, 2013 |
| | | | | | | | |
| | | ALPS | CoreCommodity Management
CompleteCommoditiesSM Strategy Fund | |
| | | For the Year Ended April 30, 2013 | | | For the Year Ended April 30, 2012 | |
| |
Class A | | | | | | | | |
Shares sold | | | 8,530,181 | | | | 6,933,626 | |
Dividends reinvested | | | 38,287 | | | | 218,828 | |
Shares redeemed | | | (6,220,651) | | | | (2,074,763) | |
| |
Net increase in shares outstanding | | | 2,347,817 | | | | 5,077,691 | |
| |
Class C | | | | | | | | |
Shares sold | | | 806,811 | | | | 1,202,707 | |
Dividends reinvested | | | 4,974 | | | | 39,730 | |
Shares redeemed | | | (549,258) | | | | (137,380) | |
| |
Net increase in shares outstanding | | | 262,527 | | | | 1,105,057 | |
| |
Class I | | | | | | | | |
Shares sold | | | 14,771,425 | | | | 5,629,924 | |
Dividends reinvested | | | 52,410 | | | | 353,517 | |
Shares redeemed | | | (4,279,108) | | | | (3,645,315) | |
| |
Net increase in shares outstanding | | | 10,544,727 | | | | 2,338,126 | |
| |
| |
| | | ALPS | Kotak India Growth Fund | |
| | | For the Year Ended April 30, 2013 | | | For the Year Ended April 30, 2012 | |
| |
Class A | | | | | | | | |
Shares sold | | | 358,458 | | | | 260,500 | |
Dividends reinvested | | | – | | | | 131 | |
Shares redeemed | | | (156,778) | | | | (58,587) | |
| |
Net increase in shares outstanding | | | 201,680 | | | | 202,044 | |
| |
Class C | | | | | | | | |
Shares sold | | | 58,597 | | | | 70,152 | |
Dividends reinvested | | | – | | | | 72 | |
Shares redeemed | | | (13,079) | | | | (61,930) | |
| |
Net increase in shares outstanding | | | 45,518 | | | | 8,294 | |
| |
Class I | | | | | | | | |
Shares sold | | | 86,660 | | | | 166,157 | |
Dividends reinvested | | | – | | | | 137 | |
Shares redeemed | | | (56,376) | | | | (26,308) | |
| |
Net increase in shares outstanding | | | 30,284 | | | | 139,986 | |
| |
| | |
| Notes to Financial Statements | | |
| | April 30, 2013 |
| | | | | | | | |
| | | ALPS | Red Rocks Listed Private Equity Fund | |
| | | For the Year Ended April 30, 2013 | | | For the Year Ended April 30, 2012 | |
| |
Class A | | | | | | | | |
Shares sold | | | 5,739,840 | | | | 11,295,795 | |
Dividends reinvested | | | 248,170 | | | | 1,751,134 | |
Shares redeemed | | | (6,914,956) | | | | (14,073,795) | |
| |
Net decrease in shares outstanding | | | (926,946) | | | | (1,026,866) | |
| |
Class C | | | | | | | | |
Shares sold | | | 237,926 | | | | 326,458 | |
Dividends reinvested | | | 6,033 | | | | 43,901 | |
Shares redeemed | | | (116,850) | | | | (154,304) | |
| |
Net increase in shares outstanding | | | 127,109 | | | | 216,055 | |
| |
Class I | | | | | | | | |
Shares sold | | | 11,839,555 | | | | 10,460,936 | |
Dividends reinvested | | | 127,149 | | | | 488,167 | |
Shares redeemed | | | (5,867,506) | | | | (4,705,661) | |
| |
Net increase in shares outstanding | | | 6,099,198 | | | | 6,243,442 | |
| |
Class R | | | | | | | | |
Shares sold | | | 29,401 | | | | 8,748 | |
Dividends reinvested | | | 178 | | | | 2,430 | |
Shares redeemed | | | (5,330) | | | | (21,597) | |
| |
Net increase/(decrease) in shares outstanding | | | 24,249 | | | | (10,419) | |
| |
| |
| | | ALPS | WMC Disciplined Value Fund | |
| | | For the Year Ended April 30, 2013 | | | For the Year Ended April 30, 2012 | |
| |
Class A | | | | | | | | |
Shares sold | | | 237,314 | | | | 264,467 | |
Dividends reinvested | | | 53,334 | | | | 39,233 | |
Shares redeemed | | | (620,571) | | | | (620,273) | |
| |
Net decrease in shares outstanding | | | (329,923) | | | | (316,573) | |
| |
Class C | | | | | | | | |
Shares sold | | | 653 | | | | 7,803 | |
Dividends reinvested | | | 57 | | | | 4 | |
Shares redeemed | | | – | | | | – | |
| |
Net increase in shares outstanding | | | 710 | | | | 7,807 | |
| |
Class I | | | | | | | | |
Shares sold | | | 596,565 | | | | 1,067,103 | |
Dividends reinvested | | | 44,131 | | | | 33,463 | |
Shares redeemed | | | (815,605) | | | | (381,661) | |
| |
Net increase/(decrease) in shares outstanding | | | (174,909) | | | | 718,905 | |
| |
| | |
| Notes to Financial Statements | | |
| | April 30, 2013 |
| | | | | | | | |
| | | Clough China Fund | |
| | | For the
Year Ended
April 30, 2013 | | | For the
Year Ended
April 30, 2012 | |
| |
Class A | | | | | | | | |
Shares sold | | | 403,248 | | | | 209,926 | |
Dividends reinvested | | | 1,259 | | | | – | |
Shares redeemed | | | (537,081 | ) | | | (674,790 | ) |
| |
Net decrease in shares outstanding | | | (132,574 | ) | | | (464,864 | ) |
| |
Class C | | | | | | | | |
Shares sold | | | 129,593 | | | | 122,497 | |
Dividends reinvested | | | – | | | | – | |
Shares redeemed | | | (190,104 | ) | | | (289,141 | ) |
| |
Net decrease in shares outstanding | | | (60,511 | ) | | | (166,644 | ) |
| |
Class I | | | | | | | | |
Shares sold | | | 1,926,116 | | | | 188,409 | |
Dividends reinvested | | | 912 | | | | – | |
Shares redeemed | | | (2,279,485 | ) | | | (573,633 | ) |
| |
Net decrease in shares outstanding | | | (352,457 | ) | | | (385,224 | ) |
| |
| | | | |
| | | RiverFront Conservative
Income Builder Fund | |
| | | For the Period September 4, 2012
(Commencement) to April 30, 2013 | |
| |
Class A | | | | |
Shares sold | | | 57,836 | |
Dividends reinvested | | | 47 | |
Shares redeemed | | | – | |
| |
Net increase in shares outstanding | | | 57,883 | |
| |
Class C | | | | |
Shares sold | | | 215,910 | |
Dividends reinvested | | | 250 | |
Shares redeemed | | | (658 | ) |
| |
Net increase in shares outstanding | | | 215,502 | |
| |
Class I | | | | |
Shares sold | | | 74,254 | |
Dividends reinvested | | | 1,217 | |
Shares redeemed | | | (5,954 | ) |
| |
Net increase in shares outstanding | | | 69,517 | |
| |
| | |
| Notes to Financial Statements | | |
| | April 30, 2013 |
| | | | | | | | |
| | | RiverFront Dynamic Equity Income Fund | |
| | | For the Year Ended April 30, 2013 | | | For the Year Ended April 30, 2012 | |
| |
Class A | | | | | | | | |
Shares sold | | | 281,177 | | | | 530,316 | |
Dividends reinvested | | | 11,503 | | | | 8,166 | |
Shares redeemed | | | (264,787) | | | | (393,279) | |
| |
Net increase in shares outstanding | | | 27,893 | | | | 145,203 | |
| |
Class C | | | | | | | | |
Shares sold | | | 407,618 | | | | 593,935 | |
Dividends reinvested | | | 16,294 | | | | 10,526 | |
Shares redeemed | | | (331,282) | | | | (162,608) | |
| |
Net increase in shares outstanding | | | 92,630 | | | | 441,853 | |
| |
Class I | | | | | | | | |
Shares sold | | | 459,512 | | | | 484,688 | |
Dividends reinvested | | | 14,180 | | | | 8,154 | |
Shares redeemed | | | (230,931) | | | | (158,669) | |
| |
Net increase in shares outstanding | | | 242,761 | | | | 334,173 | |
| |
| |
| | | RiverFront Global Allocation Fund | |
| | | For the Year Ended April 30, 2013 | | | For the Year Ended April 30, 2012 | |
| |
Class A | | | | | | | | |
Shares sold | | | 276,072 | | | | 663,389 | |
Dividends reinvested | | | 8,077 | | | | 6,128 | |
Shares redeemed | | | (126,146) | | | | (538,507) | |
| |
Net increase in shares outstanding | | | 158,003 | | | | 131,010 | |
| |
Class C | | | | | | | | |
Shares sold | | | 224,493 | | | | 437,383 | |
Dividends reinvested | | | 6,887 | | | | 2,628 | |
Shares redeemed | | | (328,407) | | | | (291,982) | |
| |
Net increase/(decrease) in shares outstanding | | | (97,027) | | | | 148,029 | |
| |
Class I | | | | | | | | |
Shares sold | | | 394,681 | | | | 411,287 | |
Dividends reinvested | | | 6,276 | | | | 3,591 | |
Shares redeemed | | | (159,373) | | | | (253,648) | |
| |
Net increase in shares outstanding | | | 241,584 | | | | 161,230 | |
| |
| | |
| Notes to Financial Statements | | |
| | April 30, 2013 |
| | | | | | | | |
| | | RiverFront Global Growth Fund | |
| | | For the Year Ended April 30, 2013 | | | For the Year Ended April 30, 2012 | |
| |
Class A | | | | | | | | |
Shares sold | | | 449,097 | | | | 209,866 | |
Dividends reinvested | | | 8,021 | | | | 38,770 | |
Shares redeemed | | | (276,448) | | | | (642,942) | |
| |
Net increase/(decrease) in shares outstanding | | | 180,670 | | | | (394,306) | |
| |
Class C | | | | | | | | |
Shares sold | | | 171,120 | | | | 246,379 | |
Dividends reinvested | | | 5,393 | | | | 37,231 | |
Shares redeemed | | | (202,053) | | | | (166,212) | |
| |
Net increase/(decrease) in shares outstanding | | | (25,540) | | | | 117,398 | |
| |
Class I | | | | | | | | |
Shares sold | | | 272,611 | | | | 239,739 | |
Dividends reinvested | | | 5,552 | | | | 34,683 | |
Shares redeemed | | | (207,050) | | | | (112,688) | |
| |
Net increase in shares outstanding | | | 71,113 | | | | 161,734 | |
| |
Class L | | | | | | | | |
Shares sold | | | 206,678 | | | | 525,916 | |
Dividends reinvested | | | 27,327 | | | | 145,946 | |
Shares redeemed | | | (511,817) | | | | (1,566,052) | |
| |
Net decrease in shares outstanding | | | (277,812) | | | | (894,190) | |
| |
Investor Class | | | | | | | | |
Shares sold | | | 16,623 | | | | 24,645 | |
Dividends reinvested | | | 8,789 | | | | 61,817 | |
Shares redeemed | | | (167,484) | | | | (689,522) | |
| |
Net decrease in shares outstanding | | | (142,072) | | | | (603,060) | |
| |
| |
| | | RiverFront Moderate Growth & Income Fund | |
| | | For the Year Ended April 30, 2013 | | | For the Year Ended April 30, 2012 | |
| |
Class A | | | | | | | | |
Shares sold | | | 1,025,931 | | | | 1,379,834 | |
Dividends reinvested | | | 40,069 | | | | 23,351 | |
Shares redeemed | | | (467,697) | | | | (604,739) | |
| |
Net increase in shares outstanding | | | 598,303 | | | | 798,446 | |
| |
Class C | | | | | | | | |
Shares sold | | | 1,700,686 | | | | 2,019,096 | |
Dividends reinvested | | | 44,339 | | | | 23,356 | |
Shares redeemed | | | (792,564) | | | | (646,996) | |
| |
Net increase in shares outstanding | | | 952,461 | | | | 1,395,456 | |
| |
Class I | | | | | | | | |
Shares sold | | | 1,805,781 | | | | 1,088,980 | |
Dividends reinvested | | | 35,557 | | | | 17,351 | |
Shares redeemed | | | (795,302) | | | | (609,818) | |
| |
Net increase in shares outstanding | | | 1,046,036 | | | | 496,513 | |
| |
7. MANAGEMENT AND RELATED-PARTY TRANSACTIONS
ALPS Advisors, Inc. (“AAI” or “Advisor”), subject to the authority of the Board, is responsible for the overall management and administration of each Fund’s business affairs. AAI has delegated daily management of the Funds listed below to the corresponding Sub-Advisor listed in the table below. Each Sub-Advisor manages the investments of the Fund in accordance with its investment objective, policies and limitations and investment guidelines established jointly by the Advisor and the Board.
| | |
| Notes to Financial Statements | | |
| | April 30, 2013 |
| | |
| Fund | | Sub-Advisor |
ALPS | CoreCommodity Management CompleteCommoditiesSM Strategy Fund | | CoreCommodity Management, LLC (formerly CoreCommodity Asset Management, LLC) |
ALPS | Kotak India Growth Fund | | Kotak Mahindra (UK) Limited |
ALPS | Red Rocks Listed Private Equity Fund | | Red Rocks Capital LLC |
ALPS | WMC Disciplined Value Fund | | Wellington Management Company, LLP |
Clough China Fund | | Clough Capital Partners, LP |
RiverFront Conservative Income Builder Fund | | RiverFront Investment Group, LLC |
RiverFront Dynamic Equity Income Fund | | RiverFront Investment Group, LLC |
RiverFront Global Allocation Fund | | RiverFront Investment Group, LLC |
RiverFront Global Growth Fund | | RiverFront Investment Group, LLC |
RiverFront Moderate Growth & Income Fund | | RiverFront Investment Group, LLC |
Pursuant to the Investment Advisory Agreement (the “Advisory Agreement”), each Fund pays the Advisor an annual management fee which is based on the Fund’s average daily net assets. The management fee is paid on a monthly basis. The following table reflects the Funds’ contractual management fee rates (expressed as an annual rate).
| | |
| Fund | | Contractual Management Fee |
ALPS | Alerian MLP Infrastructure Index Fund | | 0.70% |
ALPS | CoreCommodity Management CompleteCommoditiesSM Strategy Fund | | 0.85% |
ALPS | Kotak India Growth Fund | | 1.25% |
ALPS | Red Rocks Listed Private Equity Fund | | 0.85% |
ALPS | WMC Disciplined Value Fund | | 0.95%(a) |
Clough China Fund | | 1.35% |
RiverFront Conservative Income Builder Fund | | 0.85% |
RiverFront Dynamic Equity Income Fund | | 0.85%(b) |
RiverFront Global Allocation Fund | | 0.85%(b) |
RiverFront Global Growth Fund | | 0.85%(b) |
RiverFront Moderate Growth & Income Fund | | 0.85%(b) |
| (a) | The contractual management fee is 0.95% for the first $250 million of net assets, 0.85% for the next $250 million of net assets, and 0.75% for net assets in excess of $500 million. |
| (b) | Prior to August 31, 2012, the contractual management fee was 0.90%. |
Pursuant to an Investment Sub-advisory Agreement, the Advisor pays each sub-advisor an annual sub-advisory management fee which is based on each Fund’s average daily assets. The Advisor is required to pay all fees due to each sub-advisor out of the management fee the Advisor receives from each Fund. The following table reflects the Funds’ contractual sub-advisory fee rates.
| | | | |
| Fund | | Average Daily Net Assets
of the Fund | | Contractual Sub-Advisory Fee |
ALPS | CoreCommodity Management CompleteCommoditiesSM Strategy Fund | | All Asset Levels | | 0.75% |
ALPS | Kotak India Growth Fund | | First $50 Million | | 1.15% |
| | Over $50 Million | | 1.05% |
ALPS | Red Rocks Listed Private Equity Fund | | All Asset Levels | | 0.57% |
ALPS | WMC Disciplined Value Fund | | First $250 Million | | 0.50% |
| | $250 Million - $500 Million | | 0.40% |
| | Over $500 Million | | 0.30% |
Clough China Fund | | All Asset Levels | | 0.90% |
RiverFront Conservative Income Builder Fund | | All Asset Levels | | 0.60% |
RiverFront Dynamic Equity Income Fund | | All Asset Levels | | 0.60% |
RiverFront Global Allocation Fund | | All Asset Levels | | 0.60% |
RiverFront Global Growth Fund | | All Asset Levels | | 0.60% |
RiverFront Moderate Growth & Income Fund | | All Asset Levels | | 0.60% |
| | |
| Notes to Financial Statements | | |
| | April 30, 2013 |
The Advisor and the Sub-Advisor have contractually agreed to limit the amount of each Fund’s total annual expenses, exclusive of distribution and service (12b-1) fees (except Clough China Class A, Class C and Class I shares), shareholder service fees (except ALPS | Red Rocks Listed Private Equity Class A shares, ALPS | WMC Disciplined Value Class A shares, and Clough China Class C shares), acquired fund fees and expenses, brokerage expenses, interest expense, short sale dividend expense, taxes and extraordinary expenses, that exceed the following annual rates below. These agreements are reevaluated on an annual basis based on the terms disclosed below.
| | | | | | | | | | | | | | | | | | | | | | | | | | | | | | | | | | | |
| Fund | | Class A | | Class C | | Class I | | Class Inv | | Class L | | Class R | | Term of Expense
Limit Agreement |
ALPS | Alerian MLP Infrastructure Index Fund | | | | 0.85 | % | | | | 0.85 | % | | | | 0.85 | % | | | | N/A | | | | | N/A | | | | | N/A | | | 12/31/12 - 8/31/14 |
ALPS | CoreCommodity Management CompleteCommoditiesSM Strategy Fund | | | | 1.05 | % | | | | 1.05 | % | | | | 1.15 | % | | | | N/A | | | | | N/A | | | | | N/A | | | 9/1/12 - 8/31/13 |
ALPS | Kotak India Growth Fund | | | | 1.60 | % | | | | 1.60 | % | | | | 1.60 | % | | | | N/A | | | | | N/A | | | | | N/A | | | 9/1/12 - 8/31/13 |
ALPS | Red Rocks Listed Private Equity Fund | | | | 1.25 | % | | | | 1.25 | % | | | | 1.25 | % | | | | N/A | | | | | N/A | | | | | 1.25% | | | 9/1/12 - 8/31/13 |
ALPS | WMC Disciplined Value Fund | | | | 1.15 | % | | | | 1.15 | % | | | | 1.15 | % | | | | N/A | | | | | N/A | | | | | N/A | | | 9/1/12 - 8/31/13 |
Clough China Fund | | | | 1.95 | % | | | | 2.70 | % | | | | 1.70 | % | | | | N/A | | | | | N/A | | | | | N/A | | | 9/1/12 - 8/31/13 |
RiverFront Conservative Income Builder Fund | | | | 0.90 | % | | | | 0.90 | % | | | | 0.90 | % | | | | N/A | | | | | N/A | | | | | N/A | | | 9/1/12 - 8/31/13 |
RiverFront Dynamic Equity Income Fund | | | | 0.90 | %(a) | | | | 0.90 | %(a) | | | | 0.90 | %(a) | | | | N/A | | | | | N/A | | | | | N/A | | | 9/1/12 - 8/31/13 |
RiverFront Global Allocation Fund | | | | 0.90 | %(a) | | | | 0.90 | %(a) | | | | 0.90 | %(a) | | | | N/A | | | | | N/A | | | | | N/A | | | 9/1/12 - 8/31/13 |
RiverFront Global Growth Fund | | | | 0.90 | % | | | | 0.90 | % | | | | 0.90 | % | | | | 0.90% | | | | | 0.90% | | | | | N/A | | | 9/1/12 - 8/31/13 |
RiverFront Moderate Growth & Income Fund | | | | 0.90 | %(a) | | | | 0.90 | %(a) | | | | 0.90 | %(a) | | | | N/A | | | | | N/A | | | | | N/A | | | 9/1/12 - 8/31/13 |
| (a) | Prior to September 1, 2012, the Advisor and the Sub-Advisor had contractually agreed to limit the amount of each Fund’s total annual expenses, to 1.05% for Class A, Class C and Class I, respectively. |
Prior to January 1, 2013, the Adviser and Sub-Adviser had contractually agreed to reimburse Acquired Fund Fees and Expenses of the RiverFront Global Growth Fund.
The Advisor and each Sub-Advisor are permitted to recover expenses they have waived or reimbursed, on a class-by-class basis, through the agreements described above to the extent that expenses in later periods fall below the annual limits set forth in these agreements. Clough China Fund is not obligated to pay any such waived or reimbursed fees and expenses more than one year after the end of the fiscal year in which the fees or expenses were waived or reimbursed. The ALPS | CoreCommodity Management CompleteCommoditiesSM Strategy Fund is not obligated to pay any such waived or reimbursed fees and expenses more than two years after the end of the fiscal year in which the fees or expenses were waived or reimbursed. The ALPS | Alerian MLP Infrastructure Index Fund, ALPS | Kotak India Growth Fund, ALPS | Red Rocks Listed Private Equity Fund, ALPS | WMC Disciplined Value Fund, RiverFront Conservative Income Builder Fund, RiverFront Global Growth Fund, RiverFront Dynamic Equity Income Fund, RiverFront Global Allocation Fund and RiverFront Moderate Growth & Income Fund are not obligated to pay any such waived or reimbursed fees and expenses more than three years after the end of the fiscal year in which the fees or expenses were waived or reimbursed. At April 30, 2013, the Advisor and Sub-Advisor may seek reimbursement of previously waived and reimbursed fees as follows:
| | | | | | | | | | | | | | | | |
| Fund | | Expires 2014 | | | Expires 2015 | | | Expires 2016 | | | Total | |
ALPS | Alerian MLP Infrastructure Index Fund | | $ | N/A | | | $ | N/A | | | $ | 54,740 | | | $ | 54,740 | |
ALPS | CoreCommodity Management CompleteCommoditiesSM Strategy Fund | | | 248,300 | | | | 130,091 | | | | N/A | | | | 378,391 | |
ALPS | Kotak India Growth Fund | | | 110,597 | | | | 376,235 | | | | 346,958 | | | | 833,790 | |
ALPS | Red Rocks Listed Private Equity Fund | | | 210,227 | | | | 296,218 | | | | 34,598 | | | | 541,043 | |
ALPS | WMC Disciplined Value Fund | | | 189,671 | | | | 127,336 | | | | 87,006 | | | | 404,013 | |
Clough China Fund | | | 139,506 | | | | N/A | | | | N/A | | | | 139,506 | |
RiverFront Conservative Income Builder Fund | | | N/A | | | | N/A | | | | 66,571 | | | | 66,571 | |
RiverFront Dynamic Equity Income Fund | | | 54,560 | | | | 100,877 | | | | 108,866 | | | | 264,303 | |
RiverFront Global Allocation Fund | | | 69,932 | | | | 103,414 | | | | 98,108 | | | | 271,454 | |
RiverFront Global Growth Fund | | | 171,374 | | | | 369,241 | | | | 261,018 | | | | 801,633 | |
RiverFront Moderate Growth & Income Fund | | | 69,535 | | | | 117,687 | | | | 180,370 | | | | 367,592 | |
ALPS Portfolio Solutions Distributor, Inc. (the “Distributor”) acts as the distributor of the Funds’ shares pursuant to a Distribution Agreement with the Trust. Prior to April 30, 2013, the Distributor was ALPS Distributors, Inc. Shares are sold on a continuous basis by the Distributor, as agent for
| | |
| Notes to Financial Statements | | |
| | April 30, 2013 |
the Funds, and the Distributor has agreed to use its best efforts to solicit orders for the sale of Funds’ shares, although it is not obliged to sell any particular amount of shares. The Distributor is not entitled to any compensation for its services. The Distributor is registered as a broker-dealer with the Securities and Exchange Commission. The Funds’ Distributor is also the distributor of the Select Sector SPDR exchange traded funds (the “Underlying Sector ETFs”). As required by exemptive relief obtained by the Underlying Sector ETFs, the Advisor will reimburse any applicable Fund an amount equal to the distribution fee received by the Distributor from the Underlying Sector ETFs attributable to such Fund’s investment in the Underlying Sector ETFs, for so long as the Distributor acts as distributor to such Fund and the Underlying Sector ETFs.
Each Fund has adopted a Distribution and Services Plan (the “Plan”) pursuant to Rule 12b-1 of the 1940 Act for the Class A, Class C, Class R (ALPS | Red Rocks Listed Private Equity Fund only), and Investor Class (RiverFront Global Growth Fund only) shares. The Plan allows a Fund to use Class A, Class C, Class R and Investor Class assets to pay fees in connection with the distribution and marketing of Class A, Class C, Class R and Investor Class shares and/or the provision of shareholder services to Class A, Class C, Class R and Investor Class shareholders. The Plan permits payment for services in connection with the administration of plans or programs that use Class A, Class C, Class R and Investor Class shares of a Fund, if any, as their funding medium and for related expenses. The Plan permits a Fund to make total payments at an annual rate of up to 0.25% of a Fund’s average daily net assets attributable to its Class A and Investor Class shares, 0.75% of a Fund’s average daily net assets attributable to its Class C shares and 0.50% of the ALPS | Red Rocks Listed Private Equity Fund’s average daily net assets attributable to its Class R shares. Because these fees are paid out of a Fund’s Class A, Class C, Class R and Investor Class assets, if any, on an ongoing basis, over time they will increase the cost of an investment in Class A, Class C, Class R and Investor Class shares, if any, and Plan fees may cost an investor more than other types of sales charges.
The ALPS | Alerian MLP Infrastructure Index Fund Class A and Class C shares, ALPS | Kotak India Growth Fund Class A and Class C shares, ALPS | Red Rocks Listed Private Equity Fund Class A and Class C shares, ALPS | WMC Disciplined Value Fund Class C shares, Clough China Fund Class C shares, ALPS | CoreCommodity Management CompleteCommoditiesSM Strategy Fund Class A and Class C shares, RiverFront Conservative Income Builder Fund Class C shares, RiverFront Dynamic Equity Income Fund Class C shares, RiverFront Global Allocation Fund Class C shares, RiverFront Global Growth Fund Class C Shares, and the RiverFront Moderate Growth & Income Fund Class C shares have adopted a shareholder services plan (“Shareholder Services Plan”). Under the Shareholder Services Plan for each Fund, the Funds are authorized to pay banks and their affiliates and other institutions, including broker-dealers and Fund affiliates (“Participating Organizations”), an aggregate fee in an amount not to exceed on an annual basis 0.15% for ALPS | Alerian MLP Infrastructure Index Fund Class A shares, ALPS | Kotak India Growth Fund Class A shares, ALPS | Red Rocks Listed Private Equity Fund Class A shares, and ALPS | CoreCommodity Management CompleteCommoditiesSM Strategy Fund Class A shares, and not to exceed 0.25% for the ALPS | Alerian MLP Infrastructure Index Fund Class C shares, ALPS | Kotak India Growth Fund Class C shares, ALPS | Red Rocks Listed Private Equity Fund Class C shares, ALPS | WMC Disciplined Value Fund Class C shares, Clough China Fund Class C shares, ALPS | CoreCommodity Management CompleteCommoditiesSM Strategy Fund Class C shares, RiverFront Conservative Income Builder Fund Class C shares, RiverFront Dynamic Equity Income Fund Class C shares, RiverFront Global Allocation Fund Class C shares, RiverFront Global Growth Fund Class C Shares, and the RiverFront Moderate Growth & Income Fund Class C shares of the average daily net asset value of the Class A shares and Class C shares, respectively, attributable to or held in the name of a Participating Organization for its clients as compensation for providing shareholder service activities, which do not include distribution services, pursuant to an agreement with a Participating Organization. Shareholder Services plan fees are included with distribution and service fees on the Statements of Operations.
Certain intermediaries may charge networking, omnibus account or other administrative fees with respect to transactions in shares of each Fund. Transactions may be processed through the National Securities Clearing Corporation or similar systems or processed on a manual basis. These fees are paid by the Fund to the Distributor, which uses such fees to reimburse intermediaries. In the event an intermediary receiving payments from the Distributor on behalf of the Fund converts from a networking structure to an omnibus account structure or otherwise experiences increased costs, fees borne by the Fund may increase. Networking fees are shown in the Statements of Operations, if applicable to the Fund.
ALPS Fund Services, Inc. (“ALPS”) serves as administrator to the Funds and the Funds have agreed to pay expenses incurred in connection with their administrative activities. Pursuant to an Administrative Agreement, ALPS provides operational services to the Funds including, but not limited to fund accounting and fund administration and generally assists in the Funds’ operations.
ALPS Price MeadowsSM (“APM”), a division of ALPS, provides administration services to the Jefferies Asset Management Cayman Commodity Fund Ltd. and receives an annual fee of $50,000 for such services.
| | |
| Notes to Financial Statements | | |
| | April 30, 2013 |
The Annual Administrative Fee is based on each Fund’s average daily net assets and will be billed monthly, at the following:
| | | | | | | |
| Fund | | Average Daily Net Assets
of the Fund | | Annual Administrative Fee |
ALPS | Alerian MLP Infrastructure Index Fund | | All Asset Levels | | | | 0.10 | % |
ALPS | CoreCommodity Management CompleteCommoditiesSM Strategy Fund | | All Asset Levels | | | | 0.10 | %* |
ALPS | Kotak India Growth Fund | | All Asset Levels | | | | 0.15 | %** |
ALPS | Red Rocks Listed Private Equity Fund | | First $500 Million | | | | 0.08 | % |
| | $500 Million - $1 Billion | | | | 0.06 | % |
| | Over $1 Billion | | | | 0.04 | % |
ALPS | WMC Disciplined Value Fund | | All Asset Levels | | | | 0.15 | % |
Clough China Fund | | All Asset Levels | | | | 0.15 | % |
RiverFront Conservative Income Builder Fund | | All Asset Levels | | | | 0.10 | % |
RiverFront Dynamic Equity Income Fund | | All Asset Levels | | | | 0.10 | % |
RiverFront Global Allocation Fund | | All Asset Levels | | | | 0.10 | % |
RiverFront Global Growth Fund | | All Asset Levels | | | | 0.10 | % |
RiverFront Moderate Growth & Income Fund | | All Asset Levels | | | | 0.10 | % |
| * | Subject to a minimum annual fee of $57,140. |
| ** | Subject to a minimum annual fee of $100,000. |
8. NEW ACCOUNTING PRONOUNCEMENTS
In December 2011, the Financial Accounting Standards Board issued Accounting Standards Update (“ASU”) No. 2011-11 “Related Disclosures about Offsetting Assets and Liabilities”. The amendments in this ASU require an entity to disclose information about offsetting and related arrangements to enable users of its financial statements to understand the effect of those arrangements on its financial position. The ASU is effective for annual reporting periods beginning on or after January 1, 2013, and interim periods within those annual periods. The guidance requires retrospective application for all comparative periods presented. Management is currently evaluating the impact ASU 2011-11 may have on the financial statement disclosures.
9. INDEMNIFICATIONS
Under the Trust’s organizational documents, its officers and Trustees are indemnified against certain liability arising out of the performance of their duties to the Trust. Additionally, in the normal course of business, the Trust enters into contracts with service providers that may contain general indemnification clauses which may permit indemnification to the extent permissible under applicable law. The Trust’s maximum exposure under these arrangements is unknown, as this would involve future claims that may be made against the Trust that have not yet occurred.
| | |
| Report of Independent Registered Public Accounting Firm |
| | |
To the Shareholders and Board of Trustees of Financial Investors Trust:
We have audited the accompanying statements of assets and liabilities, including the statements of investments, of ALPS | Red Rocks Listed Private Equity Fund, ALPS | WMC Disciplined Value Fund (formerly known as “ALPS | WMC Value Intersection Fund”), Clough China Fund, ALPS | Alerian MLP Infrastructure Index Fund, RiverFront Conservative Income Builder Fund, RiverFront Global Growth Fund, RiverFront Dynamic Equity Income Fund, RiverFront Global Allocation Fund, RiverFront Moderate Growth & Income Fund, nine of the funds of Financial Investors Trust (the “Trust”), as of April 30, 2013, and the related statements of operations for the year then ended, the statements of changes in net assets for each of the two years in the period then ended, and the financial highlights for the periods presented (as to the ALPS | Alerian MLP Infrastructure Index Fund and the RiverFront Conservative Income Builder Fund, the related statements of operations, statements of changes in net assets, and the financial highlights for the period from January 2, 2013 (Commencement) to April 30, 2013, and the period from September 4, 2012 (Commencement) to April 30, 2013, respectively) (as to the ALPS | WMC Disciplined Value Fund, the financial highlights for each of the three years in the period ended April 30, 2013, the period January 1, 2010 to April 30, 2010, and for the year ended December 31, 2009) (as to the Clough China Fund, the financial highlights for each of the three years in the period ended April 30, 2013, and the period August 1, 2009 to April 30, 2010) (as to the RiverFront Global Growth Fund, the financial highlights for each of the two years in the period ended April 30, 2013, the period January 1, 2011 to April 30, 2011, and the year ended December 31, 2010). We have also audited the accompanying consolidated statements of assets and liabilities, including the consolidated statements of investments, of ALPS | Kotak India Growth Fund and ALPS | CoreCommodity Management CompleteCommodities Strategy Fund (formerly known as “Jefferies Asset Management Commodity Strategy Allocation Fund”), two of the funds of the Trust, as of April 30, 2013, and the related consolidated statements of operations for the year then ended, the consolidated statements of changes in net assets for each of the two years in the period then ended, and the consolidated financial highlights for each of the periods presented. These financial statements and financial highlights for these eleven funds are the responsibility of the Trust’s management. Our responsibility is to express an opinion on these financial statements and financial highlights based on our audits. The financial highlights of the ALPS | WMC Disciplined Value Fund for the year ended December 31, 2008, were audited by other auditors whose report, dated February 17, 2009, expressed an unqualified opinion on such financial highlights. The financial highlights of the Clough China Fund for each of the two years in the period ended July 31, 2009, were audited by other auditors whose report, dated September 21, 2009, expressed an unqualified opinion on such financial highlights. The financial highlights for RiverFront Global Growth Fund, for the year ended December 31, 2009 and the period October 28, 2008 (Inception) through December 31, 2008, were audited by other auditors whose report, dated February 26, 2010, expressed an unqualified opinion on such financial highlights.
We conducted our audits in accordance with the standards of the Public Company Accounting Oversight Board (United States). Those standards require that we plan and perform the audit to obtain reasonable assurance about whether the financial statements and financial highlights are free of material misstatement. The Trust is not required to have, nor were we engaged to perform, an audit of its internal control over financial reporting. Our audits included consideration of internal control over financial reporting as a basis for designing audit procedures that are appropriate in the circumstances, but not for the purpose of expressing an opinion on the effectiveness of the Trust’s internal control over financial reporting. Accordingly, we express no such opinion. An audit also includes examining, on a test basis, evidence supporting the amounts and disclosures in the financial statements, assessing the accounting principles used and significant estimates made by management, as well as evaluating the overall financial statement presentation. Our procedures included confirmation of securities owned as of April 30, 2013, by correspondence with the custodian and brokers, where replies were not received from brokers, we performed other auditing procedures. We believe that our audits provide a reasonable basis for our opinion.
In our opinion, the financial statements and financial highlights referred to above present fairly, in all material respects, the financial position of each of the eleven funds constituting Financial Investors Trust as of April 30, 2013, the results of their operations for the year then ended, the changes in their net assets for each of the two years in the period then ended, and the financial highlights for the periods presented, in conformity with accounting principles generally accepted in the United States of America (as to the ALPS | Alerian MLP Infrastructure Index Fund and the RiverFront Conservative Income Builder Fund, the related statements of operations, statements of changes in net assets, and the financial highlights for the period from January 2, 2013 (Commencement) to April 30, 2013, and the period from September 4, 2012 (Commencement) to April 30, 2013, respectively) (as to the ALPS | WMC Disciplined Value Fund, the financial highlights for each of the three years in the period ended April 30, 2013, the period January 1, 2010 to April 30, 2010, and for the year ended December 31, 2009) (as to the Clough China Fund, the financial highlights for each of the three years in the period ended April 30, 2013, and the period August 1, 2009 to April 30, 2010) (as to the RiverFront Global Growth Fund, the financial highlights for each of the two years in the period ended April 30, 2013, the period January 1, 2011 to April 30, 2011, and the year ended December 31, 2010).
DELOITTE & TOUCHE LLP
Denver, Colorado
June 27, 2013
| | |
| Additional Information | | |
| | April 30, 2013 (Unaudited) |
1. FUND HOLDINGS
The Funds file their complete schedule of portfolio holdings with the Securities and Exchange Commission (the “SEC”) for the first and third quarters of each fiscal year on Form N-Q within 60 days after the end of the period. Copies of the Funds’ Form N-Q are available without charge on the SEC website at http:// www.sec.gov. You may also review and copy the Form N-Q at the SEC’s Public Reference Room in Washington, D.C. For more information about the operation of the Public Reference Room, please call the SEC at 1-800-SEC-0330.
2. FUND PROXY VOTING POLICIES, PROCEDURES AND SUMMARIES
Fund policies and procedures used in determining how to vote proxies and information regarding how each of the Funds voted proxies relating to portfolio securities during the most recent prior 12-month period ending June 30 are available without charge, (1) upon request, by calling (toll-free) (866) 759-5679 and (2) on the SEC’s website at http://www.sec.gov.
3. TAX DESIGNATIONS
The Funds designate the following as a percentage of taxable ordinary income distributions, or up to the maximum amount allowable, for the calendar year ended December 31, 2012:
| | | | | | | | | | |
| | | Qualified Dividend Income | | Dividend Received Deduction |
ALPS | Red Rocks Listed Private Equity Fund | | | | 23.16 | % | | | | 0.05 | % |
ALPS | WMC Value Intersection Fund | | | | 100.00 | % | | | | 100.00 | % |
Clough China Fund | | | | 100.00 | % | | | | 24.06 | % |
RiverFront Conservative Income Builder Fund | | | | 6.24 | % | | | | 9.59 | % |
RiverFront Dynamic Equity Income Fund | | | | 41.26 | % | | | | 38.96 | % |
RiverFront Global Allocation Fund | | | | 46.76 | % | | | | 45.16 | % |
RiverFront Global Growth Fund | | | | 42.96 | % | | | | 41.54 | % |
RiverFront Moderate Growth & Income Fund | | | | 34.24 | % | | | | 32.13 | % |
Pursuant to Section 853 (c) of the Internal Revenue Code, the Clough China Fund, designates $72,711, as foreign taxes paid, and $1,731,755, as foreign source income earned between May 1, 2012 and April 30, 2013.
4. DISCLOSURE REGARDING APPROVAL OF FUND ADVISORY AGREEMENTS
ALPS | Alerian MLP Infrastructure Index Fund (the “MLP Fund”)
On September 11, 2012, the Trustees met in person to discuss, among other things, the approval of the Investment Advisory Agreement between the Trust and ALPS Advisors, Inc. (“ALPS Advisors”) (the “MLP Fund Advisory Agreement”) in accordance with Section 15(c) of the 1940 Act. The Independent Trustees met with independent legal counsel during executive session and discussed the MLP Fund Advisory Agreement and other related materials.
In approving the MLP Fund Advisory Agreement with ALPS Advisors, the Trustees, including the Independent Trustees, considered the following factors with respect to the MLP Fund:
Investment Advisory Fee Rate: The Trustees reviewed and considered the contractual annual advisory fee to be paid by the Trust, on behalf of the MLP Fund, to ALPS Advisors of 0.70% of the Fund’s daily net assets, in light of the extent and quality of the advisory services to be provided by ALPS Advisors to the MLP Fund.
The Trustees considered the information they received comparing the MLP Fund’s contractual annual advisory fee and overall expenses with those of funds in both the relevant expense group and universe of funds provided by an independent provider of investment company data.
The Trustees also considered information regarding compensation to be paid to affiliates of ALPS Advisors under other agreements, such as the proposed amended Fund Accounting and Administration Agreement with ALPS.
Based on such information, the Trustees further determined that the contractual annual advisory fee of 0.70% of the MLP Fund and the total expense ratio of 1.25% for MLP Fund, taking into account the contractual fee waiver in place, is comparable to others within the MLP Fund’s anticipated peer universe.
Nature, Extent and Quality of the Services under the Investment Advisory Agreement: The Trustees received and considered information regarding the nature, extent and quality of services to be provided to the MLP Fund under the MLP Fund Advisory Agreement. The Trustees reviewed certain background materials supplied by ALPS Advisors in its presentation, including its Form ADV.
| | |
| Additional Information | | |
| | April 30, 2013 (Unaudited) |
The Trustees reviewed and considered ALPS Advisors’ investment advisory personnel, its history as an asset manager and its performance and the amount of assets currently under management by ALPS Advisors and its affiliated entities. The Trustees also reviewed the research and decision-making processes utilized by ALPS Advisors, including the methods adopted to seek to achieve compliance with the investment objectives, policies and restrictions of the MLP Fund.
The Trustees considered the background and experience of ALPS Advisors’ management in connection with the MLP Fund, including reviewing the qualifications, backgrounds and responsibilities of the management team primarily responsible for the day-to-day portfolio management of the MLP Fund and the extent of the resources devoted to research and analysis of actual and potential investments.
The Trustees also reviewed, among other things, ALPS Advisors’ Code of Ethics.
Performance: The Trustees noted that since the MLP Fund has not yet begun operations, there is no fund performance to be reviewed or analyzed at this time. The Trustees considered ALPS Advisors’ reputation generally and its investment techniques, risk management controls and decision-making processes.
The Adviser’s Profitability: The Trustees received and considered a projected profitability analysis prepared by ALPS Advisors based on the fees payable under the MLP Fund Advisory Agreement. The Trustees considered the profits, if any, anticipated to be realized by ALPS Advisors in connection with the operation of the MLP Fund.
Economies of Scale: The Trustees considered whether economies of scale in the provision of services to the MLP Fund would be passed along to the shareholders.
Other Benefits to the Adviser: The Trustees reviewed and considered any other incidental benefits derived or to be derived by ALPS Advisors from its relationship with the MLP Fund, including soft dollar arrangements.
In selecting ALPS Advisors as the MLP Fund’s investment adviser and approving the MLP Fund Advisory Agreement and the fees charged under the MLP Fund Advisory Agreement, the Trustees concluded that no single factor reviewed by the Trustees was identified by the Trustees to be determinative as the principal factor in whether to approve the MLP Fund Advisory Agreement. Further, the Independent Trustees were advised by independent legal counsel throughout the process. The Trustees, including all of the Independent Trustees, concluded that:
| | — | | the investment advisory fees to be received by ALPS Advisors with respect to the MLP Fund were comparable to others within the MLP Fund’s peer universe; |
| | — | | the nature, extent and quality of services to be rendered by ALPS Advisors under the MLP Fund Advisory Agreement were adequate; |
| | — | | there was no performance history for the MLP Fund for the Board to consider; |
| | — | | the terms of the proposed fee waiver and expense limitation agreement between the Trust, on behalf of the MLP Fund, and ALPS Advisors, were not unreasonable; |
| | — | | the profit, if any, anticipated to be realized by ALPS Advisors in connection with the operation of the MLP Fund is not unreasonable to the MLP Fund; and |
| | — | | there were no material economies of scale or other incidental benefits accruing to ALPS Advisors in connection with its relationship with the MLP Fund. |
Based on the Trustees’ deliberations and their evaluation of the information described above, the Trustees, including all of the Independent Trustees, concluded that ALPS Advisors’ compensation for investment advisory services is consistent with the best interests of the MLP Fund and its shareholders.
| | |
| Trustees and Officers | | |
| | April 30, 2013 (Unaudited) |
INDEPENDENT TRUSTEES
| | | | | | | | | | |
Name, Address* & Age | | Position(s) Held with Fund | | Term of Office and Length of Time Served** | | Principal Occupation(s) During Past 5 Years*** | | Number of Funds in Fund Complex Overseen by Trustee**** | | Other Directorships Held by Trustee During Past 5 Years |
| | | | | |
Mary K. Anstine, age 72 | | Trustee | | Ms. Anstine was elected at a special meeting of shareholders held on March 21, 1997 and re-elected at a special meeting of shareholders held on August 7, 2009. | | Ms. Anstine was President/Chief Executive Officer of HealthONE Alliance, Denver, Colorado, and former Executive Vice President of First Interstate Bank of Denver. Ms. Anstine is also Trustee/Director of AV Hunter Trust and Colorado Uplift Board. Ms. Anstine was formerly a Director of the Trust Bank of Colorado (later purchased and now known as Northern Trust Bank), HealthONE and Denver Area Council of the Boy Scouts of America, and a member of the American Bankers Association Trust Executive Committee. | | 46 | | Ms. Anstine is a Trustee of ALPS ETF Trust (13 funds); ALPS Variable Investment Trust (7 funds); Reaves Utility Income Fund (1 fund); and Westcore Trust (12 funds). |
| | | | | |
| John R. Moran, Jr., age 82 | | Trustee | | Mr. Moran was elected at a special meeting of shareholders held on March 21, 1997 and re-elected at a special meeting of shareholders held on August 7, 2009. | | Mr. Moran is formerly President and CEO of The Colorado Trust, a private foundation serving the health and hospital community in the state of Colorado. An attorney, Mr. Moran was formerly a partner with the firm of Kutak Rock & Campbell in Denver, Colorado and a member of the Colorado House of Representatives. Currently, Mr. Moran is a member of the Treasurer’s Investment Advisory Committee for the University of Colorado. | | 26 | | None. |
| | | | | |
Jeremy W. Deems, age 36 | | Trustee | | Mr. Deems was appointed as a Trustee at the March 11, 2008 meeting of the Board of Trustees and elected at a special meeting of shareholders held on August 7, 2009. | | Mr. Deems is the Co-Founder, Chief Operations Officer and Chief Financial Officer of Green Alpha Advisors, LLC. Prior to joining Green Alpha Advisors, Mr. Deems was CFO and Treasurer of Forward Management, LLC, an investment management company, ReFlow Management Co., LLC, a liquidity resourcing company, ReFlow Fund, LLC, a private investment fund, and Sutton Place Management, LLC, an administrative services company (from 2004 to June 2007). Prior to this, Mr. Deems served as Controller of Forward Management, LLC, ReFlow Management Co., LLC, ReFlow Fund, LLC and Sutton Place Management, LLC. | | 46 | | Mr. Deems is a Trustee of ALPS ETF Trust (13 funds); ALPS Variable Investment Trust (7 funds) and Reaves Utility Income Fund (1 fund). |
| * | All communications to Trustees and Officers may be directed to Financial Investors Trust c/o 1290 Broadway, Suite 1100, Denver, CO 80203. |
| ** | This is the period for which the Trustee began serving the Trust. Each Trustee or Officer serves an indefinite term, until his successor is elected. |
| *** | Except as otherwise indicated, each individual has held the office shown or other offices in the same company for the last five years. |
| **** | The Fund Complex includes all series of the Trust, currently 26, and any other investment companies for which ALPS Advisors, Red Rocks, Wellington Management, Clough Capital, RiverFront or Kotak provides investment advisory services (currently 33 funds, 0 funds, 0 funds, 3 funds, 0 funds and 0 funds, respectively). |
| | |
| Trustees and Officers | | |
| | April 30, 2013 (Unaudited) |
INDEPENDENT TRUSTEES
| | | | | | | | | | |
Name, Address* & Age | | Position(s) Held with Fund | | Term of Office and Length of Time Served** | | Principal Occupation(s) During Past 5
Years*** | | Number of Funds in Fund Complex Overseen by Trustee**** | | Other Directorships Held by Trustee During Past 5 Years |
| | | | | |
Jerry G. Rutledge, age 68 | | Trustee | | Mr. Rutledge was elected at a special meeting of shareholders held on August 7, 2009. | | Mr. Rutledge is the President and owner of Rutledge’s Inc., a retail clothing business. Mr. Rutledge is currently Director of the American National Bank. He was from 1994 to 2007 a Regent of the University of Colorado. | | 29 | | Mr. Rutledge is a Trustee of Clough Global Allocation Fund (1 fund), Clough Global Equity Fund (1 fund) and Clough Global Opportunities Fund (1 fund). |
| | | | | |
Michael “Ross” Shell, age 42 | | Trustee | | Mr. Shell was elected at a special meeting of shareholders held on August 7, 2009. | | Mr. Shell is Founder and CEO* of Red Idea, LLC, a strategic consulting/early stage venture firm (since June 2008). From 1999 to 2009, he was a part- owner and Director of Tesser, Inc., a brand agency. From December 2005 to May 2008, he was Director, Marketing and Investor Relations, of Woodbourne, a REIT/real estate hedge fund and private equity firm. Prior to this, from May 2004 to November 2005, he worked as a business strategy consultant; from June 2003 to April 2004, he was on the Global Client Services team of IDEO, a product design/innovation firm; and from 1999 to 2003, he was President of Tesser, Inc. Mr. Shell graduated with honors from Stanford University with a degree in Political Science. | | 26 | | None. |
| * | All communications to Trustees and Officers may be directed to Financial Investors Trust c/o 1290 Broadway, Suite 1100, Denver, CO 80203. |
| ** | This is the period for which the Trustee began serving the Trust. Each Trustee or Officer serves an indefinite term, until his successor is elected. |
| *** | Except as otherwise indicated, each individual has held the office shown or other offices in the same company for the last five years. |
| **** | The Fund Complex includes all series of the Trust, currently 26, and any other investment companies for which ALPS Advisors, Red Rocks, Wellington Management, Clough Capital, RiverFront or Kotak provides investment advisory services (currently 33 funds, 0 funds, 0 funds, 3 funds, 0 funds and 0 funds, respectively). |
| | |
| Trustees and Officers | | |
| | April 30, 2013 (Unaudited) |
INTERESTED TRUSTEE
| | | | | | | | | | |
Name, Address* & Age | | Position(s) Held with Fund | | Term of Office and Length of Time Served** | | Principal Occupation(s) During Past 5 Years*** | | Number of Funds in Fund Complex Overseen by Trustee**** | | Other Directorships Held by Trustee During Past 5 Years |
| | | | | |
Edmund J. Burke, age 52 | | Trustee, Chairman and President | | Mr. Burke was elected as Chairman at the August 28, 2009 meeting of the Board of Trustees. Mr. Burke was elected as Trustee at a special meeting of shareholders held on August 7, 2009. Mr. Burke was elected President of the Trust at the December 17, 2002 meeting of the Board of Trustees. | | Mr. Burke is President and a Director of ALPS Holdings, Inc. (“AHI”) (since 2005) and Director of ALPS Advisors, Inc. (“AAI”), ALPS Distributors, Inc. (“ADI”), ALPS Fund Services, Inc. (“AFS”) and ALPS Portfolio Solutions Distributor, Inc. (“APSD”) and from 2001-2008, was President of AAI, ADI, AFS and APSD. Because of his positions with AHI, AAI, ADI, AFS and APSD, Mr. Burke is deemed an affiliate of the Trust as defined under the 1940 Act. Mr. Burke is Trustee and President of the Clough Global Allocation Fund (Trustee since 2006; President since 2004); Trustee and President of the Clough Global Equity Fund (Trustee since 2006; President since 2005); Trustee and President of the Clough Global Opportunities Fund (since 2006); Trustee of the Liberty All-Star Equity Fund; and Director of the Liberty All-Star Growth Fund, Inc. | | 32 | | Mr. Burke is a Trustee of Clough Global Allocation Fund (1 fund); Clough Global Equity Fund (1 fund); Clough Global Opportunities Fund (1 fund); Trustee of the Liberty All-Star Equity Fund (1 fund); and Director of the Liberty All-Star Growth Fund, Inc. (1 fund). |
| * | All communications to Trustees and Officers may be directed to Financial Investors Trust c/o 1290 Broadway, Suite 1100, Denver, CO 80203. |
| ** | This is the period for which the Trustee began serving the Trust. Each Trustee or Officer serves an indefinite term, until his successor is elected. |
| *** | Except as otherwise indicated, each individual has held the office shown or other offices in the same company for the last five years. |
| **** | The Fund Complex includes all series of the Trust, currently 26, and any other investment companies for which ALPS Advisors, Red Rocks, Wellington Management, Clough Capital, RiverFront or Kotak provides investment advisory services (currently 33 funds, 0 funds, 0 funds, 3 funds, 0 funds and 0 funds, respectively). |
| | |
| Trustees and Officers | | |
| | April 30, 2013 (Unaudited) |
OFFICERS
| | | | | | |
| Name, Address* & Age | | Position(s) Held with Fund | | Term of Office and Length of Time Served** | | Principal Occupation(s) During Past 5 Years*** |
| | | |
Kimberly R. Storms, age 40 | | Treasurer | | Ms. Storms was elected Treasurer of the Trust at the March 12, 2013 meeting of the Board of Trustees. | | Ms. Storms is Senior Vice President - Director of Fund Administration of ALPS. Ms. Storms joined ALPS in 1998 as Assistant Controller. Because of her position with ALPS, Ms. Storms is deemed an affiliate of the Trust as defined under the 1940 Act. Ms. Storms is also Treasurer of BPV Family of Funds and ALPS Series Trust; Assistant Treasurer of Liberty All-Star Equity Fund and Liberty All-Star Growth Fund, Inc.; Assistant Treasurer of Tilson Funds; and Chief Financial Officer of The Arbitrage Funds. |
| | | |
David T. Buhler, age 41 | | Secretary | | Mr. Buhler was elected Secretary of the Trust at the September 11, 2012 meeting of the Board of Trustees. | | Mr. Buhler joined ALPS in June 2010, and is currently Vice President and Associate Counsel of ALPS, AAI, ADI and APSD. Prior to joining ALPS, Mr. Buhler served as Associate General Counsel and Assistant Secretary of Founders Asset Management LLC from 2006 to 2009. Because of his position with ALPS, Mr. Buhler is deemed an affiliate of the Trust as defined under the 1940 Act. Mr. Buhler is also the Secretary of ALPS Variable Investment Trust and Westcore Trust. |
| | | |
Ted Uhl, age 37 | | Chief Compliance Officer (“CCO”) | | Mr. Uhl was appointed CCO of the Trust at the June 8, 2010 meeting of the Board of Trustees. | | Mr. Uhl joined ALPS in October 2006, and is currently Deputy Compliance Officer of ALPS. Prior to his current role, Mr. Uhl served as Senior Risk Manager for ALPS from October 2006 until June 2010. Before joining ALPS, Mr. Uhl served a Sr. Analyst with Enenbach and Associates (RIA), and a Sr. Financial Analyst at Sprint. Because of his position with ALPS, Mr. Uhl is deemed an affiliate of the Trust as defined under the 1940 Act. Mr. Uhl is also CCO of the Clough Global Funds, Reaves Utility Income Fund, Drexel Hamilton Funds and Transparent Value Trust. |
| * | All communications to Trustees and Officers may be directed to Financial Investors Trust c/o 1290 Broadway, Suite 1100, Denver, CO 80203. |
| ** | This is the period for which the Trustee began serving the Trust. Each Trustee serves an indefinite term, until his successor is elected. |
| *** | Except as otherwise indicated, each individual has held the office shown or other offices in the same company for the last five years. |
| | |
 | | Annual Report | April 30, 2013 |
The Management Commentaries included in this shareholder report contain certain forward-looking statements about the factors that may affect the performance of the Funds in the future. These statements are based on Fund management’s predictions and expectations concerning certain future events and their expected impact on the Funds, such as performance of the economy as a whole and of specific industry sectors, changes in the levels of interest rates, the impact of developing world events, and other factors that may influence the future performance of the Funds. Management believes these forward-looking statements to be reasonable, although they are inherently uncertain and difficult to predict. Actual events may cause adjustments in portfolio management strategies from those currently expected to be employed.
Must be accompanied or preceded by a prospectus. Investors are reminded to read the prospectus carefully before investing.
| | | | |
| ALPS Portfolio Solutions Distributor, Inc., distributor. | | | ALP000592 | |
TABLE OF CONTENTS
| | |
| Aspen Managed Futures Strategy Fund | | Manager Commentary |
| | April 30, 2013 (Unaudited) |
Market Conditions
Stocks enjoyed mid-teen gains over the last twelve month period ending April 30, 2013. The period has been punctuated by what didn’t happen. The failure of Congress to come to a budget agreement didn’t torpedo the rally in U.S. stocks; the European economy didn’t collapse due to Cyprus and other problematic members of the EU; and the slowdown in the once red-hot Chinese property markets failed to incite market panic. Once again, risk assets climbed a wall of worry, with the Dow Jones Industrial Average posting an all-new closing high. Fixed income market returns were flat to slightly negative, reflecting the preference of investors to own risk assets.
Performance Results
For the twelve-month period ending April 30, 2013, the Class I shares of the Aspen Managed Futures Strategy Fund posted a total return of 4.23%. Per its mandate, the Fund maintained very tight correlation to the Aspen Managed Futures Beta Index1. The index used a combination of trend and countertrend algorithms to determine exposures to 23 futures markets. In following the index, the Fund can take long or short exposures to each of the eligible markets. A long position in a futures market will profit if the price of the futures contract rises, and a short position will profit if the price of the futures contract falls.
The Newedge CTA Index2, a managed futures benchmark, returned 1.7% in the same timeframe. Another benchmark, the Barclay BTOP50 Index3, returned 1.9%. It is important to note that there are substantive differences between the Fund and these indices in terms of construction. These differences include portfolio construction methodology, markets traded, and timing of market entries and exits. There were no significant changes to the Fund strategy during this period.
Explanation of Fund Performance
A downturn in risk assets (e.g., stocks and commodities) and the accompanying “flight to quality” in May 2012 proved beneficial to positions in the Fund’s trend model (particularly long positions in sovereign fixed income futures), propelling the Fund to a 3.45% gain for the month.
The bulk of those gains were given back with the advent of a risk rally in the first two weeks of June 2012. Thereafter, the summer months were characterized by low volatility, with little opportunity for the formation of trends. The trend model’s positions in most currencies, equity indices, and commodities changed positions multiple times over the summer, while fixed income positions remained long throughout the period. The Fund’s counter-trend positions posted positive attribution throughout the summer months, almost precisely canceling the small losses from the trend model (which always constitutes the bulk of the Fund’s overall positions), such that the Fund’s NAVs on June 20 and September 27 were the same. Following the Fund’s returns in June (-2.69%), July (+2.43%), August (-0.97%), and September (-1.74%), the Fund was up just 0.33% for the five months ending September 30, 2012.
With fierce whipsaws in the prices of all major asset classes, the month of October 2012 proved to be one of the worst months in years for many stalwarts of the managed futures industry. Trend-following models performed particularly badly. The Newedge CTA Index return was -3.07%, and the Newedge CTA Trend Sub-Index return was -4.87% for the month. Although the Aspen Managed Futures Strategy Fund posted losses for the month as well, the model’s dynamic risk indicator proved its mettle in October, reducing exposures across the portfolio early in the month, and increasing allocations to the counter-trend model in a timely fashion later in the month. As a result, the Fund was down only 1.00% in October, significantly outperforming most of its peers.
By the end of October, the lack of sustained trends had resulted in mixed portfolios (i.e., some long and some short positions) in the currency, equity, and commodity asset classes. Although all fixed income markets remained long, the trends in those markets were substantially weakened, such that the portfolio could not be said to be meaningfully “risk-on“4 or “risk off“4 heading into November.
Over the entire May-to-October period, ten markets contributed positively to Fund performance, and twelve markets contributed negatively. Cash equivalents in the portfolio contributed an almost negligible positive amount to performance, due to the low interest rate environment. The markets with the largest gains were Corn (which sustained a very large uptrend in prices due to drought conditions in the Midwest), UK Gilt, Australian Dollar, Soybeans, and US 10-Year Treasuries. The markets with the largest losses were Euro Stoxx 50, Nikkei (USD)5, Copper, FTSE 1006, and Crude Oil.
Annualized volatility of daily returns for the Fund was about 6.76% for the May 1, 2012 through October 31, 2012 period. By comparison, the volatility of the S&P 500 Index7 was approximately 13.49% for the same period. The correlation of daily returns between the Fund and the S&P 500 Index was -0.43 (where 1.00 represents perfect positive correlation and -1.00 represents perfect negative correlation), indicating that the Fund remained strongly diversified relative to traditional risk assets.
In both November and December 2012, the inability of commodity markets to establish lasting trends caused the commodity asset class to contribute negatively to Fund performance. In November, small gains in currencies and flat performance in equity and fixed income positions were insufficient to overcome the commodity losses, resulting in Fund returns of -0.34% for the month. In December, gains in financial sectors were sufficient to overcome commodity losses, and the Fund returned 0.90%.
| | |
| Annual Report | April 30, 2013 | | 1 |
| | |
| Aspen Managed Futures Strategy Fund | | Manager Commentary |
| | April 30, 2013 (Unaudited) |
A nearly straight-line rally in equities and a strong negative trend in the Japanese Yen (the latter brought on by the election of a new government with a strict inflation mandate) caused substantial gains beginning in late December and continuing through early February. The Fund returned 3.79% in January 2013.
Throughout January, the “risk-on” upward trend in equities was matched by a “risk-on” downward trend in sovereign fixed income. However, in February, while equity indices mostly continued to post small gains, fixed income trends reversed as sovereign rates contracted. Losses in fixed income positions were the primary contributor to a -1.29% return in the Fund in February. By early March 2013, short fixed income trends had weakened or flipped long and fixed income became a smaller, but positive contributor to Fund performance; combined with gains in other financial trends, as well as solid gains from the Fund’s counter-trend positions, the Fund reversed the February losses with a gain of 1.31% in March.
Trend gains continued in April 2013, but the counter-trend strategy lost steam toward the end of the month, resulting in Fund gains of just 0.54% for the month.
Over the entire November-to-April period, twelve markets contributed positively to Fund performance, and ten markets contributed negatively. Cash equivalents in the portfolio contributed an almost negligible positive amount to performance, due to the low interest rate environment. The markets with the largest gains were Japanese Yen, Nikkei (USD), New Zealand Dollar, S&P 500 (E-Mini)8, and FTSE 100. The markets with the largest losses were Euro, Corn, Crude Oil, US 10-Year Treasuries, and Soybeans.
Annualized volatility of daily returns for the Fund was about 5.95% for the November 1, 2012 through April 30, 2013 period. By comparison, the volatility of the S&P 500 Total Return Index was approximately 12.05% for the same period. The correlation of daily returns between the Fund and the S&P 500 Total Return Index was 0.44 (where 1.00 represents perfect positive correlation and -1.00 represents perfect negative correlation); although that correlation represents an explanatory power (“R-squared”)9 of only about 20%, the meaningfully positive correlation is nonetheless indicative of the strong “risk-on” trends that drove much of fund performance over this period.
Market Outlook
Stocks may be climbing the wall of worry, but investors seem more earthbound. The reasons for this vary, of course, but consider the following:
| | — | | Psychology Today10 recently reported that negative news stories outnumber positive ones by a staggering 17:1 ratio. |
| | — | | According to media expert Owen Spencer-Thomas, bad news is more likely to be prominently reported than good news because it is perceived to have higher value by newspapers, television, and other outlets. |
| | — | | Economic Correspondent Paul Solman reported on Jim Lehrer’s NewsHour that people watching continual bad news stories are more likely to make questionable decisions, including becoming overly pessimistic or selling all their investments at a huge loss to avoid an “impending” economic collapse. |
There is little doubt that we live in a culture swimming in negativity. John Q. Public is well aware of troubles in Cyprus and recent sabre rattling by North Korea, but not as likely to know that the total interest paid on the U.S. national debt is less now than in 1998 (Source: TreasuryDirect.gov). Nor does he realize that, contrary to popular belief, the U.S. is far from drowning in a sea of debt. Current net external liabilities are about 30% of GDP, well below the levels that triggered problems in other countries. According to Capital Economics11, there is very little risk of either a collapse in the dollar or a spike in long-term interest rates based on our current borrowing.
The popularity of bad news has significant repercussions for the investing public. Boston-based consultant DALBAR Inc.12 has collected transaction data from brokerage firms for years, in an attempt to discern the investment performance achieved by individual investors. In nearly all cases, the general public is apt to invest only after a significant run-up in asset prices, and to exit during a bad period – putting the “buy low, high“13 mantra on its head.
We are not suggesting that we have suddenly found ourselves in a perfect economic environment, but it does appear that things are better than most people realize. Corporate profits are robust, interest rates are low, and there are indications that the economy is getting back on track. With more money to spend, consumers are snapping up big-ticket items, as evidenced by the spike in car sales. And domestic housing inventories have continued to drop, which has propped up real estate prices and contributed to the so-called wealth effect.
But advertisers simply aren’t interested in such benign statistics. Bad news brings eyeballs, and in the media culture in which we live, perception trumps reality. This partially explains why, as stock prices continue to rise, equity ownership remains pitifully low.
A review of the current economic landscape helps to explain our encouraging stance toward risk assets. The current price/earnings ratio of the market is 15, which is about average from a historical standpoint. However, the current low interest rate (and low inflation) environment must be taken into account. According to Wells Fargo, during similar periods the P/E ratio14 is typically between 18 and 20. When one includes profit growth and increased capacity utilization, as well as improvements in the labor market, the case for continued market upside has clear merit.
| | |
| 2 | | www.aspenfuturesfund.com |
| | |
| Aspen Managed Futures Strategy Fund | | Manager Commentary |
| | April 30, 2013 (Unaudited) |
We believe there is a behavioral case to be made for stocks as well. With so many investors sitting on the sidelines, the recovery in equity prices has been especially frustrating. According to money flow data from EPFR15, retail investors are finally starting to re-enter the market, especially in the small cap sector. The first quarter of 2013 showed bigger flows to equity funds than to fixed income funds for the first time since 2007, and we expect that trend to continue.
Bonds are a different matter. The risks of rising rates brought about by increased economic activity should be taken into consideration. Although we do not see rates suddenly shooting higher, the total returns from fixed income seem likely to be less robust as the last few decades. This reality, in our view, makes investing in managed futures increasingly an increasingly relevant strategy.
Sincerely,
Bryan R. Fisher
Kenneth E. Banwart
William Ware Bush
Performance data quoted represents past performance. Past performance does not guarantee future results. Investment return and principal value of an investment will fluctuate so that an investor’s shares, when sold or redeemed, may be worth more or less than the original cost. Current performance data may be higher or lower than actual data quoted. For the most current month-end performance data please call 1-855-845-9444.
The views and information discussed in this commentary are as of the date of publication, are subject to change, and may not reflect the writers’ current views. The views expressed represent an assessment of market conditions at a specific point in time, are opinions only and should not be relied upon as investment advice regarding a particular investment or markets in general. Such information does not constitute a recommendation to buy or sell specific securities or investment vehicles. It should not be assumed that any investment will be profitable or will equal the performance of the Fund or any securities or any sectors mentioned herein. The subject matter contained herein has been derived from several sources believed to be reliable and accurate at the time of compilation. The Fund does not accept any liability for losses either direct or consequential caused by the use of this information.
| 1 | Aspen Managed Futures Beta Index - The Managed Futures Beta Index is constructed using a quantitative, rules-based model designed to replicate the trend-following and counter-trend exposure of futures markets by allocating assets to liquid futures contracts of certain financial and commodities futures markets. The Index therefore seeks to reflect the performance of strategies and exposures common to a broad universe of futures markets, i.e., managed futures beta. You cannot invest directly in the index. |
| 2 | The Newedge CTA Index provides the market with a reliable daily performance benchmark of major commodity trading advisors (CTAs). The Newedge CTA Index calculates the daily rate of return for a pool of CTAs selected from the larger managers that are open to new investment. Selection of the pool of qualified CTAs used in construction of the Index will be conducted annually, with re-balancing on January 1st of each year. A committee of industry professionals has been established to monitor the methodology of the index on a regular basis. You cannot invest directly in the index. |
| 3 | Barclay BTOP50 Index is an index of the largest investable CTA programs as measured by assets under management. The index is not actively managed and does not reflect any deduction for fees, expenses or taxes. You cannot invest directly in the index. |
| 4 | During a market sentiment of ‘Risk on,’ the market is optimistic and more willing to take risk in exchange for possibly better returns. At this time there will be a greater interest in shares or stocks and commodities. When the market sentiment is ‘Risk off,’ there is pessimism in the market and it will favor perceived lower risk investments such as U.S. Treasuries or U.S. dollars. http://en.wikipedia.org. |
| 5 | The Nikkei 225 Stock Average is a price-weighted index comprised of Japan’s top 225 blue-chip companies traded on the Tokyo Stock Exchange. The Nikkei (USD) is a futures contract traded on the Chicago Mercantile Exchange which tracks the Nikkei 225 Stock Average and is priced in US Dollars. The index is not actively managed and does not reflect any deduction for fees, expenses or taxes. You cannot invest directly in the index. |
| 6 | The FTSE 100 is an index of the largest 100 blue-chip stocks traded on the London Stock Exchange. The index is not actively managed and does not reflect any deduction for fees, expenses or taxes. You cannot invest directly in the index. |
| 7 | The S&P 500® Total Return Index is an unmanaged index of 500 common stocks chosen for marketsize, liquidity and industry group representation. It is a market-value weighted index. The Index is not actively managed and do not reflect any deduction for fees, expenses or taxes. You cannot invest directly in the index. |
| 8 | S&P 500 (E-Mini) is an electronically traded futures contract on the Chicago Mercantile Exchange that represents a portion of the normal futures contracts, and is one-fifth the size of the standard S&P 500 futures contract. |
| 9 | R-squared is a statistical measure that represents the percentage of a fund or security’s movements that can be explained by movements in a benchmark index. |
| 10 | Psychology Today is a magazine published every two months in the United States. It is a psychology-based magazine covering a wide range of topics - such as neuroscience, relationships, health, work, the psychological aspects of current affairs - written for a mass audience of non-psychologists. |
| 11 | Capital Economics is one of the leading independent macro-economic research companies in the world, providing research on the US, Canada, Europe, Africa, Asia and Australasia, Latin America, the Middle East and the UK, as well as analysis of financial markets, commodities and the consumer and property sectors. |
| | |
| Annual Report | April 30, 2013 | | 3 |
| | |
| Aspen Managed Futures Strategy Fund | | Manager Commentary |
| | April 30, 2013 (Unaudited) |
| 12 | DALBAR, Inc. is a financial services market research firm and performs a variety of ratings and evaluations of practices and communications in the financial services and healthcare industries. |
| 13 | Buy Low, Sell High is the practice of buying a security when its price is (or is perceived to be) low and selling it when its price is high. The ability to buy low and sell high requires one to be able to determine roughly when the low and high prices for a security occur. There are a number of technical indicators analysts use to find these, but critics of the practice contend it is impossible or at least excessively risky. |
| 14 | P/E ratio is the valuation ratio of a company’s current share price compared to its per-share earnings. |
| 15 | EPFR is the acronym for Emerging Portfolio Fund Research Inc, a company that provides fund flows and asset allocation data to financial institutions around the world. Its market moving data services include daily, weekly, and monthly equity and fixed income fund flows and monthly fund allocations by country, sector, and security. |
| | |
| 4 | | www.aspenfuturesfund.com |
| | |
| Aspen Managed Futures Strategy Fund | | Manager Commentary |
| | April 30, 2013 (Unaudited) |
Cumulative Total Return Performance as of April 30, 2013
| | | | | | | | | | |
| Aspen Managed Futures Strategy Fund | | Calendar
Year-to-Date | | 1 Year | | Since
Inception* | | | | Portfolio Composition as of April 30, 2013 As a percentage of Net Assets 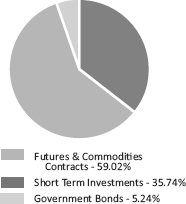
|
Aspen Managed Futures Strategy Fund - Class A (NAV) 1 | | 4.15% | | 3.80% | | -4.13% | | |
Aspen Managed Futures Strategy Fund - Class A (MOP)2 | | -1.59% | | -1.90% | | -7.18% | | |
Aspen Managed Futures Strategy Fund - Class I | | 4.35% | | 4.23% | | -3.72% | | |
Newedge CTA Index3 | | 4.36% | | 0.79% | | -1.95% | | |
Aspen Managed Futures Beta Index4 | | 4.83% | | 3.99% | | -3.71% | | |
Performance data quoted represents past performance. Past performance does not guarantee future results. Investment return and principal value of an investment will fluctuate so that an investor’s shares, when sold or redeemed, may be worth more or less than the original cost. Current performance data may be higher or lower than actual data quoted. For the most current month-end performance data please call 1-855-845-9444. The table does not reflect the deduction of taxes that a shareholder would pay on Fund distributions or the redemption of Fund shares. * Fund Inception date of August 2, 2011. 1 Net Asset Value (NAV) is the share price without sales charges. 2 Maximum Offering Price (MOP) includes sales charges. Class A returns include effects of the Fund’s maximum sales charge of 5.50%. 3 The Newedge CTA Index provides the market with a reliable daily performance benchmark of major commodity trading advisors (CTAs). The Newedge CTA Index calculates the daily rate of return for a pool of CTAs selected from the larger managers that are open to new investment. Selection of the pool of qualified CTAs used in construction of the Index will be conducted annually, with re-balancing on January 1st of each year. A committee of industry professionals has been established to monitor the methodology of the index on a regular basis. You cannot invest directly in the index. 4 Aspen Managed Futures Beta Index - The Managed Futures Beta Index is constructed using a quantitative, rules-based model designed to replicate the trend-following and counter-trend exposure of futures markets by allocating assets to liquid futures contracts of certain financial and commodities futures markets. The Index therefore seeks to reflect the performance of strategies and exposures common to a broad universe of futures markets, i.e., managed futures beta. | | |
Performance of $10,000 Initial Investment (as of April 30, 2013)
Comparison of change in value of a $10,000 investment (includes applicable sales loads)
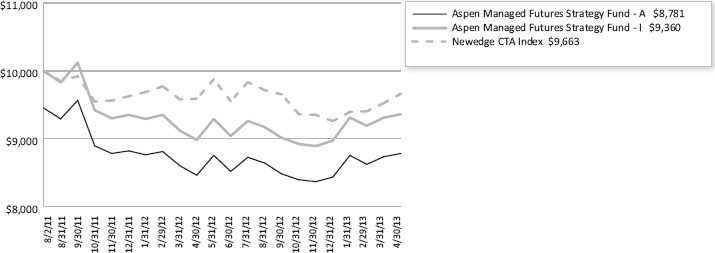
The chart represents historical performance of a hypothetical investment of $10,000 in the Fund since inception. Past performance does not guarantee future results. This chart does not reflect the deduction of taxes that a shareholder would pay on Fund distributions or the redemption of Fund shares.
The Aspen Managed Futures Beta Index and the Newedge CTA Index are not actively managed and do not reflect any deduction for fees, expenses or taxes. It is not possible to invest directly in an index.
| | |
| Annual Report | April 30, 2013 | | 5 |
| | |
| Aspen Managed Futures Strategy Fund | | Consolidated Disclosure of Fund Expenses |
| | April 30, 2013 (Unaudited) |
As a shareholder of a Fund, you incur two types of costs: (1) transaction costs, including applicable sales charges (loads), redemption fees, wire fees and low balance fees; and (2) ongoing costs, including management fees, distribution and service (12b-1) fees, shareholder services fees and other Fund expenses. This example is intended to help you understand your indirect costs, also referred to as “ongoing costs” (in dollars), of investing in the Fund and to compare these costs with the ongoing costs of investing in other mutual funds.
This example is based on an investment of $1,000 invested at the beginning of the period and held for the entire six-month period of November 1, 2012 through April 30, 2013.
Actual Expenses The first line of the table below provides information about actual account values and actual expenses. You may use the information in this line, together with the amount you invested at the beginning of the period, to estimate the expenses that you paid over the period. Simply divide your account value by $1,000 (for example, an $8,600 account value divided by $1,000 = 8.6), then multiply the result by the number in the first line under the heading “Expenses Paid During Period” to estimate the expenses you paid on your account during this period.
Hypothetical Example for Comparison Purposes The second line of the table provides information about hypothetical account values and hypothetical expenses based on the Fund’s actual expense ratio and an assumed rate of return of 5% per year before expenses, which is not the Fund’s actual return. The hypothetical account values and expenses may not be used to estimate the actual ending account balance or expenses you paid for the period. You may use this information to compare ongoing costs of investing in the Fund and other funds. To do so, compare this 5% hypothetical example with the 5% hypothetical examples that appear in the shareholder reports of other funds.
Please note that the expenses shown in the table are meant to highlight your ongoing costs only and do not reflect any transactional costs, such as applicable sales charges (loads), redemption fees, wire fees and low balance fees. Therefore, the second line of the table is useful in comparing ongoing costs only and will not help you determine the relative total costs of owning different funds. In addition, if these transaction costs were included, your costs would be higher.
| | | | | | | | |
| | | Beginning
Account Value
11/1/12 | | Ending
Account Value
4/30/13 | | Expense Ratio(a) | | Expenses Paid
During period
11/1/12 - 4/30/13(b) |
|
| | | | |
Class A | | | | | | | | |
Actual | | $1,000.00 | | $1,046.20 | | 1.80% | | $9.13 |
Hypothetical (5% return before expenses) | | $1,000.00 | | $1,015.87 | | 1.80% | | $9.00 |
Class I | | | | | | | | |
Actual | | $1,000.00 | | $1,049.30 | | 1.12% | | $5.69 |
Hypothetical (5% return before expenses) | | $1,000.00 | | $1,019.24 | | 1.12% | | $5.61 |
| (a) | The Fund’s expense ratios have been based on the Fund’s most recent fiscal half-year expenses. |
| (b) | Expenses are equal to the Fund’s annualized expense ratio, multiplied by the average account value over the period, multiplied by the number of days in the most recent fiscal half-year (181)/365. |
| | |
| 6 | | www.aspenfuturesfund.com |
| | |
| Aspen Managed Futures Strategy Fund | | Consolidated Schedule of Investments |
| | April 30, 2013 |
| | | | | | | | |
| | | Principal Amount/ | | | Value | |
| | | Shares | | | (Note 2) | |
| |
GOVERNMENT BONDS (5.24%) | | | | | | | | |
U.S. TREASURY NOTES (5.24%) | | | | | | | | |
0.250%, 04/30/2014 | | $ | 6,495,000 | | | $ | 6,502,865 | |
| | |
TOTAL GOVERNMENT BONDS | | | | | | | | |
| | | | | | | | |
(Cost $6,502,449) | | | | | | | 6,502,865 | |
| | | | | | | | |
| | |
SHORT TERM INVESTMENTS (35.74%) | | | | | | | | |
MONEY MARKET FUND (8.76%) | | | | | | | | |
Dreyfus Treasury & Agency Cash Management Fund - Institutional Shares, 7-day yield, 0.010% | | | 10,867,814 | | | | 10,867,814 | |
| | | | | | | | |
| | |
U.S. TREASURY BILLS (26.98%) | | | | | | | | |
0.024%, 07/11/2013(a) | | $ | 6,750,000 | | | | 6,749,737 | |
0.036%, 08/01/2013(a) | | | 6,750,000 | | | | 6,749,183 | |
0.073%, 10/10/2013(a) | | | 6,750,000 | | | | 6,747,725 | |
0.076%, 10/17/2013(a) | | | 6,750,000 | | | | 6,747,543 | |
0.100%, 04/03/2014(a) | | | 6,500,000 | | | | 6,493,923 | |
| | | | | | | | |
| | | | | | | 33,488,111 | |
| | | | | | | | |
| | |
TOTAL SHORT TERM INVESTMENTS (Cost $44,356,139) | | | | | | | 44,355,925 | |
| | | | | | | | |
| | |
TOTAL INVESTMENTS (40.98%) (Cost $50,858,588) | | | | | | $ | 50,858,790 | |
| | | | | | | | |
| | |
Other Assets In Excess Of Liabilities (59.02%) | | | | | | | 73,261,014 | (b) |
| | | | | | | | |
| | |
NET ASSETS (100.00%) | | | | | | $ | 124,119,804 | |
| | | | | | | | |
| (a) | Rate shown represents the bond equivalent yield to maturity at date of purchase. |
| (b) | Includes cash which is being held as collateral for futures contracts. |
FUTURES CONTRACTS
At April 30, 2013, the Fund had outstanding futures contracts:
| | | | | | | | | | | | | | |
| Description | | Position | | Contracts | | Expiration
Date | | Underlying Face
Amount at Value | | | Unrealized
Appreciation | |
| |
Commodity Contracts | | | | | | | | | | | | | | |
Gold 100 Oz Future | | Short | | 28 | | 06/28/2013 | | $ | (4,121,880 | ) | | $ | 140,792 | |
Equity Contracts | | | | | | | | | | | | | | |
Euro STOXX 50® Index Future | | Long | | 147 | | 06/24/2013 | | | 5,166,963 | | | | 107,018 | |
Nikkei 225 Index Future | | Long | | 109 | | 06/14/2013 | | | 7,580,950 | | | | 886,750 | |
S&P 500® E-Mini Future | | Long | | 96 | | 06/24/2013 | | | 7,642,560 | | | | 207,322 | |
Fixed Income Contracts | | | | | | | | | | | | | | |
Canadian 10 Year Bond Future | | Long | | 185 | | 06/20/2013 | | | 25,109,832 | | | | 120,509 | |
Euro-Bund Future | | Long | | 130 | | 06/07/2013 | | | 25,095,018 | | | | 336,741 | |
Long Gilt Future | | Long | | 134 | | 06/27/2013 | | | 24,979,946 | | | | 286,585 | |
U.S. 10 Year Treasury Note Future | | Long | | 122 | | 06/20/2013 | | | 16,269,847 | | | | 37,372 | |
Foreign Currency Contracts | | | | | | | | | | | | | | |
New Zealand Dollar Currency Future | | Long | | 337 | | 06/18/2013 | | | 28,783,170 | | | | 679,807 | |
| | | | | | | | | | |
| | | | | | | | $ | 136,506,406 | | | $ | 2,802,896 | |
| | | | | | | | | | |
| | |
| Annual Report | April 30, 2013 | | 7 |
| | |
| Aspen Managed Futures Strategy Fund | | Consolidated Schedule of Investments |
| | April 30, 2013 |
| | | | | | | | | | | | | | |
| Description | | Position | | Contracts | | Expiration
Date | | Underlying Face
Amount at Value | | | Unrealized
Depreciation | |
| |
Commodity Contracts | | | | | | | | | | | | | | |
Copper Future | | Short | | 53 | | 07/30/13 | | $ | (4,223,438 | ) | | $ | (26,836 | ) |
Corn Future | | Short | | 89 | | 07/15/13 | | | (2,892,500 | ) | | | (144,582 | ) |
Heating Oil Future | | Short | | 34 | | 06/03/13 | | | (4,054,949 | ) | | | (17,137 | ) |
Silver Future | | Short | | 36 | | 07/30/13 | | | (4,353,300 | ) | | | (228,702 | ) |
Soybean Future | | Short | | 40 | | 07/15/13 | | | (2,798,000 | ) | | | (91,396 | ) |
Sugar No. 11 (World) Future | | Short | | 205 | | 07/01/13 | | | (4,040,960 | ) | | | (54,581 | ) |
WTI Crude Future | | Short | | 45 | | 05/22/13 | | | (4,205,700 | ) | | | (220,880 | ) |
Equity Contracts | | | | | | | | | | | | | | |
FTSE® 100 Index Future | | Long | | 77 | | 06/24/13 | | | 7,635,172 | | | | (12,823 | ) |
Foreign Currency Contracts | | | | | | | | | | | | | | |
Australian Dollar Currency Future | | Long | | 124 | | 06/18/13 | | | 12,803,000 | | | | (135,342 | ) |
Canadian Dollar Currency Future | | Short | | 239 | | 06/19/13 | | | (23,694,460 | ) | | | (454,810 | ) |
Euro FX Currency Future | | Short | | 220 | | 06/18/13 | | | (36,206,500 | ) | | | (394,780 | ) |
Japanese Yen Currency Future | | Short | | 187 | | 06/18/13 | | | (23,978,075 | ) | | | (1,917 | ) |
Swiss Franc Currency Future | | Short | | 213 | | 06/18/13 | | | (28,661,812 | ) | | | (280,243 | ) |
| | | | | | | | | | |
| | | | | | | | $ | (118,671,522 | ) | | $ | (2,064,029 | ) |
| | | | | | | | | | |
Common Abbreviations:
FTSE - Financial Times and the London Stock Exchange
FX - Foreign
No. - Number
Oz - Ounce
S&P - Standard and Poor’s
Holdings are subject to change.
For Fund compliance purposes, the Fund’s industry classifications refer to any one or more of the industry sub-classifications used by one or more widely recognized market indexes or ratings group indexes, and/or as defined by Fund management. This definition may not apply for purposes of this report, which may combine industry sub-classifications for reporting ease. Industries are shown as a percent of net assets.
See accompanying notes to financial statements.
| | |
| 8 | | www.aspenfuturesfund.com |
| | |
| Aspen Managed Futures Strategy Fund | | Consolidated Statement of Assets & Liabilities |
| | April 30, 2013 |
| | | | |
ASSETS: | | | | |
Investments, at value | | $ | 50,858,790 | |
Cash | | | 33,294 | |
Foreign currency, at value (Cost $649,099) | | | 649,036 | |
Deposit with broker for futures contracts | | | 71,937,345 | |
Receivable for shares sold | | | 101,723 | |
Variation margin receivable | | | 738,867 | |
Interest receivable | | | 348 | |
Prepaid and other assets | | | 9,301 | |
| |
Total assets | | | 124,328,704 | |
| |
| |
LIABILITIES: | | | | |
Payable to advisor | | | 76,594 | |
Payable for shares redeemed | | | 35,746 | |
Payable for administration fees | | | 18,643 | |
Payable for distribution and service fees | | | | |
Class A | | | 688 | |
Payable for transfer agency fees | | | 8,135 | |
Payable for trustee fees and expenses | | | 3,552 | |
Payable for audit fees | | | 31,249 | |
Payable for legal fees | | | 9,240 | |
Payable for chief compliance officer fees | | | 7,750 | |
Payable for principal financial officer fees | | | 1,250 | |
Accrued expenses and other liabilities | | | 16,053 | |
| |
Total liabilities | | | 208,900 | |
| |
NET ASSETS | | $ | 124,119,804 | |
| |
| |
NET ASSETS CONSIST OF: | | | | |
| |
Paid-in capital (Note 5) | | $ | 123,313,981 | |
Accumulated net investment loss | | | (1,112,263 | ) |
Accumulated net realized gain on futures contracts and foreign currency transactions | | | 1,179,080 | |
Net unrealized appreciation on investments, futures contracts and foreign currency translations | | | 739,006 | |
| |
NET ASSETS | | $ | 124,119,804 | |
| |
| |
INVESTMENTS, AT COST | | $ | 50,858,588 | |
| |
PRICING OF SHARES: | | | | |
Class A: | | | | |
Net Asset Value, offering and redemption price per share | | $ | 9.29 | |
Net Assets | | $ | 3,350,477 | |
Shares of beneficial interest outstanding | | | 360,700 | |
Maximum offering price per share (NAV/0.9450), based on maximum sales charge of 5.50% of the offering price | | $ | 9.83 | |
| |
Class I: | | | | |
Net Asset Value, offering and redemption price per share | | $ | 9.36 | |
Net Assets | | $ | 120,769,327 | |
Shares of beneficial interest outstanding | | | 12,900,036 | |
See Notes to Consolidated Financial Statements.
| | |
| Annual Report | April 30, 2013 | | 9 |
| | |
| Aspen Managed Futures Strategy Fund | | Consolidated Statement of Operations |
| | For the Year Ended April 30, 2013 |
| | | | |
| |
INVESTMENT INCOME: | | | | |
Interest | | $ | 57,629 | |
Dividends | | | 1,074 | |
| |
Total Investment Income | | | 58,703 | |
| |
| |
EXPENSES: | | | | |
Investment advisory fees | | | 821,853 | |
Recoupment of previously waived fees | | | | |
Class A | | | 8,419 | |
Class I | | | 74,999 | |
Administrative fees | | | 212,938 | |
Distribution and service fees | | | | |
Class A | | | 5,486 | |
Transfer agency fees | | | 47,092 | |
Legal and audit fees | | | 48,257 | |
Offering costs | | | 38,212 | |
Custodian fees | | | 10,562 | |
Trustee fees and expenses | | | 20,330 | |
Principal financial officer fees | | | 5,000 | |
Chief compliance officer fees | | | 30,250 | |
Other | | | 59,905 | |
| |
Total Net Expenses | | | 1,383,303 | |
| |
NET INVESTMENT LOSS | | | (1,324,600 | ) |
| |
| |
Net realized gain on futures contracts | | | 5,078,145 | |
Net realized gain on foreign currency transactions | | | 15,705 | |
Net change in unrealized appreciation of investments | | | 202 | |
Net change in unrealized appreciation on futures contracts | | | 1,008,392 | |
Net change in unrealized depreciation on translation of assets and liabilities denominated in foreign currency transactions | | | (269 | ) |
| |
NET REALIZED AND UNREALIZED GAIN ON INVESTMENTS | | | 6,102,175 | |
| |
NET INCREASE IN NET ASSETS RESULTING FROM OPERATIONS | | $ | 4,777,575 | |
| |
See Notes to Consolidated Financial Statements.
| | |
| 10 | | www.aspenfuturesfund.com |
| | |
| Aspen Managed Futures Strategy Fund | | Consolidated Statements of Changes in Net Assets |
| | |
| | | | | | | | |
| | | For the Year Ended
April 30, 2013 | | | For the Period
August 2, 2011
(Inception) to
April 30, 2012 | |
| |
OPERATIONS: | | | | | | | | |
Net investment loss | | $ | (1,324,600 | ) | | $ | (637,508 | ) |
Net realized gain/(loss) on investments, futures contracts and foreign currency transactions | | | 5,093,850 | | | | (5,063,338 | ) |
Net change in unrealized appreciation/(depreciation) on investments, futures contracts and foreign currency translations | | | 1,008,325 | | | | (269,319 | ) |
| |
Net increase/(decrease) in net assets resulting from operations | | | 4,777,575 | | | | (5,970,165 | ) |
| |
| | |
SHARE TRANSACTIONS (Note 5): | | | | | | | | |
Class A | | | | | | | | |
Proceeds from sales of shares | | | 2,819,184 | | | | 11,355,891 | |
Cost of shares redeemed | | | (830,242 | ) | | | (9,450,244 | ) |
Redemption fees | | | 455 | | | | – | |
Class I | | | | | | | | |
Proceeds from sales of shares | | | 55,964,668 | | | | 120,133,964 | |
Cost of shares redeemed | | | (30,316,921 | ) | | | (24,374,693 | ) |
Redemption fees | | | 1,069 | | | | 9,263 | |
| |
Net increase from share transactions | | | 27,638,213 | | | | 97,674,181 | |
| |
| | |
Net increase in net assets | | | 32,415,788 | | | | 91,704,016 | |
| |
| | |
NET ASSETS: | | | | | | | | |
Beginning of period | | | 91,704,016 | | | | – | |
| |
End of period* | | $ | 124,119,804 | | | $ | 91,704,016 | |
| |
*Includes accumulated net investment loss of: | | $ | (1,112,263 | ) | | $ | (677,175 | ) |
| | |
Other Information: | | | | | | | | |
SHARE TRANSACTIONS: | | | | | | | | |
Class A | | | | | | | | |
Sold | | | 311,862 | | | | 1,141,658 | |
Redeemed | | | (91,293 | ) | | | (1,001,527 | ) |
| |
Net increase in shares outstanding | | | 220,569 | | | | 140,131 | |
| |
| | |
Class I | | | | | | | | |
Sold | | | 6,129,373 | | | | 12,696,132 | |
Redeemed | | | (3,306,806 | ) | | | (2,618,663 | ) |
| |
Net increase in shares outstanding | | | 2,822,567 | | | | 10,077,469 | |
| |
See Notes to Consolidated Financial Statements.
| | |
| Annual Report | April 30, 2013 | | 11 |
| | |
| Aspen Managed Futures Strategy Fund – Class A | | Consolidated Financial Highlights |
| For a share outstanding throughout the periods presented. |
| | | | | | | | |
| | | For the Year Ended
April 30, 2013 (a) | | | For the Period
August 2, 2011
(Inception) to
April 30, 2012 (a) | |
| |
NET ASSET VALUE, BEGINNING OF PERIOD | | $ | 8.95 | | | $ | 10.00 | |
INCOME/(LOSS) FROM OPERATIONS: | | | | | | | | |
Net investment loss(b) | | | (0.16) | | | | (0.13) | |
Net realized and unrealized gain/(loss) on investments | | | 0.50 | | | | (0.92) | |
| |
Total from investment operations | | | 0.34 | | | | (1.05) | |
| |
REDEMPTION FEES ADDED TO PAID IN CAPITAL | | | 0.00 | (c) | | | – | |
| |
INCREASE/(DECREASE) IN NET ASSET VALUE | | | 0.34 | | | | (1.05) | |
| |
NET ASSET VALUE, END OF PERIOD | | $ | 9.29 | | | $ | 8.95 | |
| |
| | |
TOTAL RETURN(d) | | | 3.80% | | | | (10.50%) | (e) |
| | |
RATIOS AND SUPPLEMENTAL DATA: | | | | | | | | |
Net assets, end of period (000’s) | | $ | 3,350 | | | $ | 1,254 | |
| | |
RATIOS TO AVERAGE NET ASSETS: | | | | | | | | |
Operating expenses excluding fee waivers/reimbursements | | | 1.80% | | | | 2.53% | (f) |
Operating expenses including fee waivers/reimbursements | | | 1.80% | | | | 1.80% | (f) |
Net investment loss including fee waivers/reimbursements | | | (1.75%) | | | | (1.79%) | (f) |
| | |
PORTFOLIO TURNOVER RATE | | | 0% | | | | 0% | (e) |
| (a) | Per share amounts and ratios to average net assets include income and expenses of the Aspen Futures Fund Ltd. (subsidiary), exclusive of the subsidiary’s management fee. |
| (b) | Per share numbers have been calculated using the average shares method. |
| (c) | Less than $0.005 per share. |
| (d) | Total return does not reflect the effect of sales charges. |
See Notes to Consolidated Financial Statements.
| | |
| 12 | | www.aspenfuturesfund.com |
| | |
| Aspen Managed Futures Strategy Fund – Class I | | Consolidated Financial Highlights |
| For a share outstanding throughout the periods presented. |
| | | | | | | | |
| | | For the
Year Ended
April 30, 2013 (a) | | | For the Period
August 2, 2011
(Inception) to
April 30, 2012 (a) | |
| |
NET ASSET VALUE, BEGINNING OF PERIOD | | $ | 8.98 | | | $ | 10.00 | |
INCOME/(LOSS) FROM OPERATIONS: | | | | | | | | |
Net investment loss(b) | | | (0.11) | | | | (0.11) | |
Net realized and unrealized gain/(loss) on investments | | | 0.49 | | | | (0.91) | |
| |
Total from investment operations | | | 0.38 | | | | (1.02) | |
| |
REDEMPTION FEES ADDED TO PAID IN CAPITAL | | | 0.00 | (c) | | | 0.00 | (c) |
| |
INCREASE/(DECREASE) IN NET ASSET VALUE | | | 0.38 | | | | (1.02) | |
| |
NET ASSET VALUE, END OF PERIOD | | $ | 9.36 | | | $ | 8.98 | |
| |
| | |
TOTAL RETURN | | | 4.23% | | | | (10.20%) | (d) |
| | |
RATIOS AND SUPPLEMENTAL DATA: | | | | | | | | |
Net assets, end of period (000’s) | | $ | 120,769 | | | $ | 90,450 | |
| | |
RATIOS TO AVERAGE NET ASSETS: | | | | | | | | |
Operating expenses excluding fee waivers/reimbursements | | | 1.25% | | | | 1.75% | (e) |
Operating expenses including fee waivers/reimbursements | | | 1.25% | | | | 1.55% | (e) |
Net investment loss including fee waivers/reimbursements | | | (1.20%) | | | | (1.54%) | (e) |
| | |
PORTFOLIO TURNOVER RATE | | | 0% | | | | 0% | (d) |
| (a) | Per share amounts and ratios to average net assets include income and expenses of the Aspen Futures Fund Ltd. (subsidiary), exclusive of the subsidiary’s management fee. |
| (b) | Per share numbers have been calculated using the average shares method. |
| (c) | Less than $0.005 per share. |
See Notes to Consolidated Financial Statements.
| | |
| Annual Report | April 30, 2013 | | 13 |
| | |
| Aspen Managed Futures Strategy Fund | | Notes to Consolidated Financial Statements |
| | April 30, 2013 |
1. ORGANIZATION
Financial Investors Trust (the “Trust”), a Delaware statutory trust, is an open-end management investment company registered under the Investment Company Act of 1940, as amended (“1940 Act”). As of April 30, 2013, the Trust had 26 registered funds. This annual report describes the Aspen Managed Futures Strategy Fund (the “Fund”). The Fund seeks investment results that replicate as closely as possible, before fees and expenses, the price and yield performance of the Aspen Managed Futures Beta Index (the “MFBI” or “Index”). The Aspen Managed Futures Strategy Fund offers Class A and Class I shares. All classes of shares have identical rights to earnings, assets and voting privileges, except for class specific expenses and exclusive rights to vote on matters affecting only individual classes.
Basis of Consolidation for the Aspen Futures Fund, Ltd.
Aspen Futures Fund, Ltd. (the “Subsidiary”), a Cayman Islands exempted company, is a wholly owned subsidiary of the Fund. The Subsidiary’s investment objective is designed to enhance the ability of the Fund to obtain exposure to equities, financial, currency and commodities markets consistent with the limits of the U.S. federal tax law requirements applicable to registered investment companies. The Subsidiary is subject to substantially the same investment policies and investment restrictions as the Fund. The Subsidiary acts as an investment vehicle for the Fund in order to effect certain commodity-related investments on behalf of the Fund. Investments in the Subsidiary are expected to provide the Fund with exposure to the commodity markets within the limitations of Subchapter M of the Internal Revenue Code of 1986, as amended (the “Code”), and recent IRS revenue rulings, as discussed below under “Federal Income Taxes”. The Fund is the sole shareholder of the Subsidiary pursuant to a subscription agreement dated as of August 2, 2011, and it is intended that the Fund will remain the sole shareholder and will continue to control the Subsidiary. Under the Articles of Association of the Subsidiary, shares issued by the Subsidiary confer upon a shareholder the right to wholly own and vote at general meetings of the Subsidiary and certain rights in connection with any winding-up or repayment of capital, as well as the right to participate in the profits or assets of the Subsidiary. The Fund may invest up to 25% of its total assets in shares of the Subsidiary. As a wholly owned subsidiary of the Fund, all assets and liabilities, income and expenses of the Subsidiary are consolidated in the financial statements and financial highlights of the Fund. All investments held by the Subsidiary are disclosed in the accounts of the Fund. As of April 30, 2013, net assets of the Fund were $124,119,804, of which $22,485,968 or 18.12%, represented the Fund’s ownership of all issued shares and voting rights of the Subsidiary.
2. SIGNIFICANT ACCOUNTING POLICIES
The accompanying financial statements were prepared in accordance with accounting principles generally accepted in the United States of America (“U.S. GAAP”). The preparation of financial statements in conformity with U.S. GAAP requires management to make certain estimates and assumptions that affect the reported amounts of assets and liabilities and disclosures of contingent assets and liabilities at the date of the financial statements and the reported amounts of revenue and expenses during the period. Actual results could differ from those estimates. The following is a summary of significant accounting policies consistently followed by the Fund and subsidiary in preparation of the financial statements.
Investment Valuation: The Fund generally values its securities based on market prices determined at the close of regular trading on the New York Stock Exchange (“NYSE”), normally 4:00 p.m. Eastern Time, on each day the NYSE is open for trading.
For equity securities and mutual funds that are traded on an exchange, the market price is usually the closing sale or official closing price on that exchange. In the case of equity securities not traded on an exchange, or if such closing prices are not otherwise available, the securities are valued at the mean of the most recent bid and ask prices on such day. Redeemable securities issued by open-end registered investment companies are valued at the investment company’s applicable net asset value, with the exception of exchange-traded open-end investment companies, which are priced as equity securities.
The market price for debt obligations is generally the price supplied by an independent third-party pricing service approved by the Board of Trustees (the “Board”), which may use a matrix, formula or other objective method that takes into consideration quotations from dealers, market transactions in comparable investments, market indices and yield curves. If vendors are unable to supply a price, or if the price supplied is deemed to be unreliable, the market price may be determined using quotations received from one or more brokers–dealers that make a market in the security. Short–term debt obligations that will mature in 60 days or less are valued at amortized cost, unless it is determined that using this method would not reflect an investment’s fair value.
Futures contracts that are listed or traded on a national securities exchange, commodities exchange, contract market or comparable over-the-counter market, and that are freely transferable, are valued at their closing settlement price on the exchange on which they are primarily traded or based upon the current settlement price for a like instrument acquired on the day on which the instrument is being valued. A settlement price may not be used if the market makes a limit move with respect to a particular commodity.
Forward currency exchange contracts have a market value determined by the prevailing foreign currency exchange daily rates and current foreign currency exchange forward rates. The foreign currency exchange forward rates are calculated using an automated system that estimates rates on the basis of the current day foreign currency exchange rates and forward foreign currency exchange rates supplied by a pricing service.
| | |
| 14 | | www.aspenfuturesfund.com |
| | |
| Aspen Managed Futures Strategy Fund | | Notes to Consolidated Financial Statements |
| | April 30, 2013 |
Investment securities that are primarily traded on foreign securities exchanges are valued at the preceding closing values of such securities on their respective exchanges, except when an occurrence subsequent to the time a value was so established is likely to have changed such value. In such an event, the fair value of those securities are determined in good faith through consideration of other factors in accordance with procedures established by and under the general supervision of the Board.
When such prices or quotations are not available, or when the Fair Value Committee appointed by the Board believes that they are unreliable, securities may be priced using fair value procedures approved by the Board.
Fair Value Measurements: The Fund discloses the classification of its fair value measurements following a three-tier hierarchy based on the inputs used to measure fair value. Inputs refer broadly to the assumptions that market participants would use in pricing the asset or liability, including assumptions about risk. Inputs may be observable or unobservable. Observable inputs reflect the assumptions market participants would use in pricing the asset or liability that are developed based on market data obtained from sources independent of the reporting entity. Unobservable inputs reflect the reporting entity’s own assumptions about the assumptions market participants would use in pricing the asset or liability that are developed based on the best information available.
Various inputs are used in determining the value of the Fund’s investments as of the end of the reporting period. When inputs used fall into different levels of the fair value hierarchy, the level in the hierarchy within which the fair value measurement falls is determined based on the lowest level input that is significant to the fair value measurement in its entirety. The designated input levels are not necessarily an indication of the risk or liquidity associated with these investments. These inputs are categorized in the following hierarchy under applicable financial accounting standards:
| | | | |
| Level 1 | | – | | Unadjusted quoted prices in active markets for identical investments, unrestricted assets or liabilities that the Fund has the ability to access at the measurement date; |
| | |
| Level 2 | | – | | Quoted prices which are not active, quoted prices for similar assets or liabilities in active markets or inputs other than quoted prices that are observable (either directly or indirectly) for substantially the full term of the asset or liability; and |
| | |
| Level 3 | | – | | Significant unobservable prices or inputs (including the Fund’s own assumptions in determining the fair value of investments) where there is little or no market activity for the asset or liability at the measurement date. |
The following is a summary of each input used to value the Fund as of April 30, 2013:
| | | | | | | | | | | | | | | | |
| Investments in Securities at Value | | Level 1 -
Quoted Prices | | | Level 2 -
Other Significant
Observable Inputs | | | Level 3 -
Significant Unobservable
Inputs | | | Total | |
| |
Government Bonds | | $ | – | | | $ | 6,502,865 | | | $ | – | | | $ | 6,502,865 | |
Short Term Investments | | | 10,867,814 | | | | 33,488,111 | | | | – | | | | 44,355,925 | |
| |
TOTAL | | $ | 10,867,814 | | | $ | 39,990,976 | | | $ | – | | | $ | 50,858,790 | |
| |
Other Financial Instruments | | | | | | | | | | | | | | | | |
Assets: | | | | | | | | | | | | | | | | |
Futures Contracts | | | | | | | | | | | | | | | | |
Commodity Contracts | | $ | 140,792 | | | $ | – | | | $ | – | | | $ | 140,792 | |
Equity Contracts | | | 1,201,090 | | | | – | | | | – | | | | 1,201,090 | |
Fixed Income Contracts | | | 781,207 | | | | – | | | | – | | | | 781,207 | |
Foreign Currency Contracts | | | 679,807 | | | | – | | | | – | | | | 679,807 | |
Liabilities: | | | | | | | | | | | | | | | | |
Futures Contracts | | | | | | | | | | | | | | | | |
Commodity Contracts | | | (784,114) | | | | – | | | | – | | | | (784,114) | |
Equity Contracts | | | (12,823) | | | | – | | | | – | | | | (12,823) | |
Foreign Currency Contracts | | | (1,267,092) | | | | – | | | | – | | | | (1,267,092) | |
| |
TOTAL | | $ | 738,867 | | | $ | – | | | $ | – | | | $ | 738,867 | |
| |
The Fund recognizes transfers between levels as of the end of the period. For the year ended April 30, 2013, the Fund did not have any transfers between Level 1 and Level 2 securities. For the year ended April 30, 2013, the Fund did not have any securities that used significant unobservable inputs (Level 3) in determining fair value.
Investment Transactions and Investment Income: Investment transactions are accounted for on the date the investments are purchased or sold (trade date). Realized gains and losses from investment transactions are reported on an identified cost basis. Interest income, which includes accretion of discounts, is accrued and recorded as earned. Dividend income is recognized on the ex-dividend date or for certain foreign securities,
| | |
| Annual Report | April 30, 2013 | | 15 |
| | |
| Aspen Managed Futures Strategy Fund | | Notes to Consolidated Financial Statements |
| | April 30, 2013 |
as soon as information is available to the Fund. All of the realized and unrealized gains and losses and net investment income, are allocated daily to each class in proportion to its average daily net assets.
Foreign Securities: The Fund may directly purchase securities of foreign issuers. Investing in securities of foreign issuers involves special risks not typically associated with investing in securities of U.S. issuers. The risks include possible reevaluation of currencies, the inability to repatriate foreign currency, less complete financial information about companies and possible future adverse political and economic developments. Moreover, securities of many foreign issuers and their markets may be less liquid and their prices more volatile than those of securities of comparable U.S. issuers.
Foreign Currency Translation: The books and records of the Fund are maintained in U.S. dollars. Investment valuations and other assets and liabilities initially expressed in foreign currencies are converted each business day into U.S. dollars based upon current exchange rates. Prevailing foreign exchange rates may generally be obtained at the close of the NYSE (normally, 4:00 p.m. Eastern Time). The portion of realized and unrealized gains or losses on investments due to fluctuations in foreign currency exchange rates is not separately disclosed and is included in realized and unrealized gains or losses on investments, when applicable.
Foreign Currency Spot Contracts: The Fund may enter into foreign currency spot contracts to facilitate transactions in foreign securities or to convert foreign currency receipts into U.S. dollars. A foreign currency spot contract is an agreement between two parties to buy and sell currencies at the current market rate, for settlement generally within two business days. The U.S. dollar value of the contracts is determined using current currency exchange rates supplied by a pricing service. The contract is marked-to-market daily for settlements beyond one day and any change in market value is recorded as an unrealized gain or loss. When the contract is closed, the Fund records a realized gain or loss equal to the difference between the value on the open and close date. Losses may arise from changes in the value of the foreign currency, or if the counterparties do not perform under the contract’s terms. The maximum potential loss from such contracts is the aggregate face value in U.S. dollars at the time the contract was opened.
Trust Expenses: Some expenses of the Trust can be directly attributed to the Fund. Expenses which cannot be directly attributed to the Fund are apportioned among all funds in the Trust based on average net assets of each fund.
Fund and Class Expenses: Expenses that are specific to a class of shares of the Fund are charged directly to that share class. All expenses of the Fund, other than class specific expenses, are allocated daily to each class in proportion to its average daily net assets. Fees provided under the distribution (Rule 12b-1) for a particular class of the Fund are charged to the operations of such class.
Offering Costs: Offering costs, including costs of printing initial prospectuses, legal and registration fees, are being amortized over twelve months from the inception date of the Fund. As of April 30, 2013, all offering costs have been amortized by the Fund.
Federal Income Taxes: The Fund complies with the requirements under Subchapter M of the Internal Revenue Code of 1986, as amended, applicable to regulated investment companies and intends to distribute substantially all of their net taxable income and net capital gains, if any, each year so that it will not be subject to excise tax on distributed income and gains. The Fund is not subject to income taxes to the extent such distributions are made.
As of and during the year ended April 30, 2013, the Fund did not have a liability for any unrecognized tax benefits. The Fund files U.S. federal, state, and local tax returns as required. The Fund’s tax returns are subject to examination by the relevant tax authorities until expiration of the applicable statute of limitations, which is generally three years after the filing of the tax return for federal purposes and four years for most state returns. Tax returns for open years have incorporated no uncertain tax positions that require a provision for income taxes.
Distributions to Shareholders: The Fund normally pays dividends and distributes capital gains, if any, on an annual basis. Income dividend distributions are derived from interest and other income the Fund receives from its investments, including short term capital gains. Long term capital gains distributions are derived from gains realized when the Fund sells a security it has owned for more than a year. The Fund may make additional distributions and dividends at other times if the portfolio manager believes doing so may be necessary for the Fund to avoid or reduce taxes.
3. DERIVATIVE INSTRUMENTS
The Fund uses derivatives (including futures) to pursue its investment objective. The Fund’s use of derivative instruments involves risks different from, or possibly greater than, the risks associated with investing directly in securities and other traditional investments. These risks may include (i) the risk that the counterparty to a derivative transaction may not fulfill its contractual obligations, (ii) risk of mispricing or improper valuation, and (iii) the risk that changes in the value of the derivative may not correlate perfectly with the underlying asset, rate or index. These risks could cause the Fund to lose more than the principal amount invested. In addition, investments in derivatives involve leverage, which means a small percentage of assets invested in derivatives can have a disproportionately large impact on the Fund.
The Fund’s use of derivatives can result in losses due to unanticipated changes in the market risk factors and the overall market. In instances where the Fund is using derivatives to decrease, or hedge, exposures to market risk factors for securities held by the Fund, there are also risks that those derivatives may not perform as expected resulting in losses for the combined or hedged positions. Derivatives may have little or no initial cash investment relative to their market value exposure and therefore can produce significant gains or losses in excess of their cost. This use of
| | |
| 16 | | www.aspenfuturesfund.com |
| | |
| Aspen Managed Futures Strategy Fund | | Notes to Consolidated Financial Statements |
| | April 30, 2013 |
embedded leverage allows the Fund to increase its market value exposure relative to its net assets and can substantially increase the volatility of the Fund’s performance.
In addition, use of derivatives may increase or decrease exposure to the following risk factors:
| | — | | Equity Risk: Equity risk relates to the change in value of equity securities as they relate to increases or decreases in the general market. |
| | — | | Fixed Income Risk: When the Fund invests in fixed-income securities or derivatives, the value of an investment in the Fund will fluctuate with changes in interest rates. Typically, a rise in interest rates causes a decline in the value of fixed-income securities or derivatives owned by the Fund. In general, the market price of debt securities with longer maturities will increase or decrease more in response to changes in interest rates than shorter-term securities. Other risk factors include credit risk (the debtor may default) and prepayment risk (the debtor may pay its obligation early, reducing the amount of interest payments). |
| | — | | Foreign Currency Risk: Currency trading involves significant risks, including market risk, interest rate risk, country risk, counterparty credit risk and short sale risk. Market risk results from the price movement of foreign currency values in response to shifting market supply and demand. Interest rate risk arises whenever a country changes its stated interest rate target associated with its currency. Country risk arises because virtually every country has interfered with international transactions in its currency. Counterparty credit risk arises when the counterparty will not fulfill its obligations to the Fund. Short sale risk arises from the sale of a security that is not owned, or any sale that is completed by the delivery of a security borrowed. |
| | — | | Commodity Risk: Exposure to the commodities markets may subject the Fund to greater volatility than investments in traditional securities. Commodity prices are influenced by unfavorable weather, animal and plant disease, geologic and environmental factors, as well as changes in government regulation such as tariffs, embargoes or burdensome production rules and restrictions. |
Futures: The Fund and the Subsidiary may enter into futures contracts. Futures contracts are agreements between two parties to buy and sell a particular commodity, instrument or index for a specified price on a specified future date. When the Fund or the Subsidiary enters into a futures contract, it is required to deposit with (or for the benefit of) its broker an amount of cash or short-term high-quality securities as “initial margin”. The margin requirements are set by the exchange on which the contract is traded and may be modified during the term of the contract. The initial margin is in the nature of a performance bond or good faith deposit on the futures contract that is returned to the Fund upon termination of the contract, assuming all contractual obligations have been satisfied. As the value of the contract changes, the value of the futures contract position increases or declines. Subsequent payments, known as “variation margin”, are made or received by the Fund or the Subsidiary, depending on the price fluctuations in the fair value of the contract and the value of cash or securities on deposit with the broker. The aggregate principal amounts of the contracts are not recorded in the financial statements. Fluctuations in the value of the contracts are recorded in the Consolidated Statements of Assets and Liabilities as an asset (liability) and in the Consolidated Statements of Operations as unrealized appreciation (depreciation) until the contracts are closed, when they are recorded as realized gains (losses). Realized gain or loss on a futures position is equal to the difference between the value of the contract at the time it was opened and the value at the time it was closed, minus brokerage commissions. When the Fund or the Subsidiary enters into a futures contract certain risks may arise, such as illiquidity in the futures market, which may limit the Fund’s or the Subsidiary’s ability to close out a futures contract prior to settlement date, and unanticipated movements in the value of securities, commodities or interest rates. Futures contracts are exchange-traded. Exchange-traded futures are standardized contracts and are settled through a clearing house with fulfillment supported by the credit of the exchange. Therefore, counterparty credit risk to the Fund and the Subsidiary is reduced. In addition, the Fund could be exposed to risk if the counterparties to the contracts are unable to meet the terms of their contracts. With exchange traded futures, there is minimal counterparty credit risk to the Funds since futures are exchange traded and the exchange’s clearinghouse, as a counterparty to all exchange traded futures, guarantees the futures against default.
Balance Sheet – Fair Value of Derivative Instruments as of April 30, 2013(a):
| | | | | | | | | | | | |
| Derivatives Instruments | | Asset Derivatives Balance Sheet Location | | Fair Value | | | Liabilities Derivatives
Balance Sheet Location | | Fair Value | |
| |
Futures Contracts* | | Variation Margin Receivable | | $ | 738,867 | | | Variation Margin Payable | | | $ – | |
| | | | | | | | | | | | |
| | | | $ | 738,867 | | | | | | $ – | |
| | | | | | | | | | | | |
| | *Risk Exposure to Fund | | | | | | | | | | |
| | Commodity Contracts | | $ | (643,322 | ) | | | | | | |
| | Equity Contracts | | | 1,188,267 | | | | | | | |
| | Fixed Income Contracts | | | 781,207 | | | | | | | |
| | Foreign Currency Contracts | | | (587,285 | ) | | | | | | |
| | | | | | | | | | | | |
| | | | $ | 738,867 | | | | | | | |
| | | | | | | | | | | | |
| (a) | For open derivative instruments as of April 30, 2013, see the Consolidated Schedule of Investments, which is also indicative of the activity for the year ended April 30, 2013. |
| | |
| Annual Report | April 30, 2013 | | 17 |
| | |
| Aspen Managed Futures Strategy Fund | | Notes to Consolidated Financial Statements |
| | April 30, 2013 |
Consolidated Statement of Operations – The effect of Derivative Instruments for the year ended April 30, 2013:
| | | | | | | | | | |
| Derivatives Instruments | | Location of Gain/(Loss) on Derivatives
Recognized in Income | | Realized Gain/(Loss) on Derivatives Recognized in Income | | | Change in Unrealized Gain/
(Loss) on Derivatives Recognized in Income | |
| |
Futures Contracts* | | Net realized gain on futures contracts/Net change in unrealized appreciation on futures contracts | | $ | 5,078,145 | | | $ | 1,008,392 | |
| | | | | | |
| | | | $ | 5,078,145 | | | $ | 1,008,392 | |
| | | | | | |
| | | |
| | *Risk Exposure to Fund | | | | | | | | |
| | Commodity Contracts | | $ | 162,600 | | | $ | (613,847) | |
| | Equity Contracts | | | 1,779,493 | | | | 1,172,611 | |
| | Fixed Income Contracts | | | (140,814) | | | | 543,298 | |
| | Foreign Currency Contracts | | | 3,276,866 | | | | (93,670) | |
| | | | | | |
| | | | $ | 5,078,145 | | | $ | 1,008,392 | |
| | | | | | |
4. TAX BASIS INFORMATION
Reclassifications: Reclassifications to paid-in capital relate primarily to differing book/tax treatment of ordinary net investment losses. Investment in subsidiary and foreign currency also impact the book/tax treatment differences. For the year ended April 30, 2013, the following reclassifications, which had no impact on results of operations or net assets, were recorded to reflect tax character:
| | | | | | | | | | | | |
| Fund | | Paid-in Capital | | | Accumulated Net
Investment Income | | | Accumulated Net
Realized Loss on
Futures Contracts | |
| |
Aspen Managed Futures Strategy Fund | | $ | (593,957 | ) | | | 889,512 | | | | (295,555 | ) |
Included in the amounts reclassified was a net operating loss offset to Paid-in-capital of $666,326.
Tax Basis of Investments: As of April 30, 2013, the aggregate cost of investments, gross unrealized appreciation/(depreciation) and net unrealized appreciation for Federal tax purposes was as follows:
| | | | | | | | | | | | | | | | |
| | | Cost of Investments | | | Gross Appreciation
(excess of value
over tax cost) | | | Gross Depreciation
(excess of tax cost
over value) | | | Net Appreciation/
(Depreciation) of
Investments, Futures
Contracts and
Foreign Currency | |
| |
Aspen Managed Futures Strategy Fund | | $ | 50,866,618 | | | $ | 267,264 | | | $ | (275,092 | ) | | $ | 738,804 | |
Components of Distributable Earnings: At April 30, 2013, components of distributable earnings were on a tax basis as follows:
| | | | |
| | | Aspen Managed Futures Strategy Fund | |
Accumulated net capital gains | | $ | 2,117,510 | |
Net unrealized appreciation on futures contracts | | | 730,976 | |
Other cumulative effect of timing differences | | | (2,042,663) | |
| |
Total distributable earnings | | $ | 805,823 | |
| |
As of April 30, 2013, the Fund elects to defer to the period ending April 30, 2014 late year ordinary losses in the amount of $1,104,233.
Capital Losses: As of April 30, 2013, the Fund has no accumulated capital loss carryforwards.
During the year ended April 30, 2013, the Fund utilized capital losses in the amounts of $627,443 for short-term and $ 704,192 for long-term.
Tax Basis of Distributions to Shareholders: Distributions are determined in accordance with federal income tax regulations, which differ from GAAP, and, therefore, may differ significantly in amount or character from net investment income and realized gains for financial reporting purposes. Financial reporting records are adjusted for permanent book/tax differences to reflect tax character but are not adjusted for temporary differences. During the year ended April 30, 2013 and the period ended April 30, 2012, the Fund did not make any distributions.
| | |
| 18 | | www.aspenfuturesfund.com |
| | |
| Aspen Managed Futures Strategy Fund | | Notes to Consolidated Financial Statements |
| | April 30, 2013 |
5. SHARES OF BENEFICIAL INTEREST
The capitalization of the Trust consists of an unlimited number of shares of beneficial interest with no par value per share. Holders of the shares of the Fund of the Trust have one vote for each share held and a proportionate fraction of a vote for each fractional share. All shares issued and outstanding are fully paid and are non-assessable, transferable and redeemable at the option of the shareholder. Shares have no pre-emptive rights.
Fund shares redeemed within 30 days of purchase may incur a 2% short-term redemption fee deducted from the redemption amount. The amount of redemption fees received during the period are presented in the Consolidated Statement of Changes in Net Assets.
6. MANAGEMENT AND RELATED-PARTY TRANSACTIONS
Aspen Partners Ltd. (the “Adviser” or “Aspen”), subject to the authority of the Board, is responsible for the overall management and administration of the Fund’s business affairs. The Adviser manages the investments of the Fund in accordance with the Fund’s investment objective, policies and limitations and investment guidelines established jointly by the Adviser and the Board. Pursuant to the Investment Advisory Agreement, (the “Advisory Agreement”), the Fund will pay the Adviser an annual management fee of 0.75%, based on the Fund’s average daily net assets. The management fee is paid on a monthly basis.
The Subsidiary has entered into a separate advisory agreement (the “Subsidiary Advisory Agreement”) with Aspen, the Subsidiary’s investment adviser and the Fund’s investment adviser, for the management of the Subsidiary’s portfolio pursuant to which the Subsidiary is obligated to pay the Adviser a management fee at the same rate that the Fund pays the Adviser for investment advisory services provided to the Fund. The Adviser has agreed to waive the advisory fee it receives from the Fund in an amount equal to the management fee paid by the Subsidiary. This waiver may not be terminated or modified without the consent of the Board.
The Adviser has contractually agreed to waive and/or reimburse fees or expenses in order to limit total annual fund operating expenses after fee waiver/expense reimbursements (excluding distribution and service (12b-1) fees, shareholder services fees, acquired fund fees and expenses, brokerage expenses, interest expenses, taxes and extraordinary expenses) to 1.55% of the Fund’s average daily net assets. This agreement is in effect through August 31, 2013. This agreement may not be terminated or modified prior to this date except with the approval of the Board.
Pursuant to this agreement, the Fund will reimburse the Adviser for any fee waivers and expense reimbursements made by the Adviser, provided that any such reimbursements made by the Fund to the Adviser will not cause the Fund’s expense limitation to exceed expense limitations in existence at the time the expense was incurred, or at the time of the reimbursement, whichever is lower, and the reimbursement is made within three years after the expenses were incurred.
For the year ended April 30, 2013, the fee waivers and/or reimbursements were as follows:
| | | | | | | | |
| | | Fees Waived/ Reimbursed | | | Recoupment of Previously | |
| Fund | | By Adviser | | | Waived Fees By Adviser | |
| |
Aspen Managed Futures Strategy Fund - Class A | | $ | – | | | $ | 8,419 | |
Aspen Managed Futures Strategy Fund - Class I | | $ | – | | | $ | 74,999 | |
As of April 30, 2013, the balances of recoupable expenses for the Fund were as follows:
| | | | | | | | | | | | |
| Fund | | 2015 | | | 2016 | | | TOTAL | |
| |
Aspen Managed Futures Strategy Fund - Class A | | $ | 13,354 | | | $ | – | | | $ | 13,354 | |
Aspen Managed Futures Strategy Fund - Class I | | | – | | | | – | | | | – | |
Fund Accounting Fees and Expenses
ALPS Fund Services, Inc. (“ALPS” and the “Administrator”) (an affiliate of ALPS Distributors, Inc.) serves as administrator to the Fund and Subsidiary. The Fund has agreed to pay expenses incurred in connection with its administrative activities. Pursuant to the Administration, Bookkeeping and Pricing Services Agreement (the “Agreement”), ALPS will provide operational services to the Fund including, but not limited to fund accounting and fund administration and generally assist in the Fund’s operations.
The Fund’s administration fee is accrued on a daily basis, and paid on a monthly basis following the end of the month, based on the greater of (a) an annual total fee of $165,000, subject to a 5% increase per annum, from the first to the last, or projected last, day of the then current year of service under the Administration Agreement; or (b) the following basis point fee schedule:
| | | | | | |
| Average Total Net Assets | | Contractual Fee | | | |
|
Between $0-$500M | | | 0.05 | % | | |
$500M-$1B | | | 0.03 | % | | |
Above $1B | | | 0.02 | % | | |
The Subsidiary’s administration fee is based on an annual rate of $37,500 through July 2012 and $45,000 thereafter.
| | |
| Annual Report | April 30, 2013 | | 19 |
| | |
| Aspen Managed Futures Strategy Fund | | Notes to Consolidated Financial Statements |
| | April 30, 2013 |
The Administrator is also reimbursed by the Fund for certain out-of-pocket expenses.
Transfer Agent
ALPS serves as transfer, dividend paying and shareholder servicing agent for the Fund. ALPS is compensated based upon a $20,000 annual base fee, subject to a 5% increase per annum for the Fund, and annually $9 per direct open account and $7 per open account through the National Securities Clearing Corporation. ALPS is also reimbursed by the Fund for certain out-of-pocket expenses.
Compliance Services
ALPS provides services as the Fund’s Chief Compliance Officer to assist the Trust’s Chief Compliance Officer in monitoring and testing the policies and procedures of the Trust in conjunction with requirements under Rule 38a-1 under the 1940 Act and receives an annual base fee of $30,000, subject to a 5% increase per annum.
Principal Financial Officer
ALPS receives an annual fee of $5,000 for providing Principal Financial Officer services to the Fund.
Distributor
ALPS Distributors, Inc. (“ADI” or the “Distributor”) (an affiliate of ALPS) acts as the distributor of the Fund’s shares pursuant to a Distribution Agreement with the Trust. Shares are sold on a continuous basis by ADI as agent for the Fund, and ADI has agreed to use its best efforts to solicit orders for the sale of the Fund’s shares, although it is not obliged to sell any particular amount of shares. ADI is not entitled to any compensation for its services as Distributor. ADI is registered as a broker-dealer with the Securities and Exchange Commission.
The Fund has adopted a plan of distribution for Class A shares pursuant to Rule 12b-1 under the 1940 Act (the “Plan”). The Plan allows the Fund to use Class A assets to pay fees in connection with the distribution and marketing of Class A shares and/or the provision of shareholder services to Class A shareholders. The Plan permits payment for services in connection with the administration of plans or programs that use Class A shares as their funding medium and for related expenses. The Plan permits the Fund to use its Class A assets to make total payments at an annual rate of up to 0.25% of the Fund’s average daily net assets attributable to its Class A shares. The expenses of the plan are reflected as distribution and service fees in the Consolidated Statement of Operations.
7. SECURITIES TRANSACTIONS
The cost of purchases and proceeds from sales of U.S. Government securities (excluding short-term securities) during the year ended April 30, 2013 were as follows:
| | | | |
| Aspen Managed Futures Strategy Fund | | | |
| |
Cost of Investments Purchased | | $ | 6,502,613 | |
Proceeds from Investments Sold | | $ | – | |
8. INDEMNIFICATIONS
Under the Trust’s organizational documents, its officers and Trustees are indemnified against certain liability arising out of the performance of their duties to the Trust. Additionally, in the normal course of business, the Trust enters into contracts with service providers that may contain general indemnification clauses, which may permit indemnification to the extent permissible under applicable law. The Trust’s maximum exposure under these arrangements is unknown, as this would involve future claims that may be made against the Trust that have not yet occurred.
9. NEW ACCOUNTING PRONOUNCEMENTS
In December 2011, the Financial Accounting Standards Board issued Accounting Standards Update (“ASU”) No. 2011-11 “Related Disclosures about Offsetting Assets and Liabilities.” The amendments in this ASU require an entity to disclose information about offsetting and related arrangements to enable users of its financial statements to understand the effect of those arrangements on its financial position. The ASU is effective for annual reporting periods beginning on or after January 1, 2013, and interim periods within those annual periods. The guidance requires retrospective application for all comparative periods presented. Management is currently evaluating the impact ASU 2011-11 may have on the financial statement disclosures.
10. SUBSEQUENT EVENT
The Fund has entered into an Index Licensing Agreement with Quantitative Equity Strategies, LLC (“QES”) and the Adviser, joint owners of the Index, pursuant to which the Fund pays QES a licensing fee for the right to use the Index in connection with the Fund. This agreement will take effect on July 1, 2013. In addition, the Adviser has contractually agreed that the fee waiver and reimbursement agreement for the Fund, effective during the year ended April 30, 2013, shall continue through August 31, 2016.
| | |
| 20 | | www.aspenfuturesfund.com |
| | |
| Aspen Managed Futures Strategy Fund | | Report of Independent Registered Public Accounting Firm |
| | |
To the Shareholders and Board of Trustees of Financial Investors Trust:
We have audited the accompanying consolidated statement of assets and liabilities, including the consolidated schedule of investments, of Aspen Managed Futures Strategy Fund and subsidiary (the “Fund”), one of the funds constituting Financial Investors Trust, as of April 30, 2013, the related consolidated statement of operations for the year then ended, and the consolidated statements of changes in net assets and the consolidated financial highlights for the year then ended and for the period from August 2, 2011 (inception) to April 30, 2012. These financial statements and financial highlights are the responsibility of the Fund’s management. Our responsibility is to express an opinion on these financial statements and financial highlights based on our audit.
We conducted our audit in accordance with the standards of the Public Company Accounting Oversight Board (United States). Those standards require that we plan and perform the audit to obtain reasonable assurance about whether the financial statements and financial highlights are free of material misstatement. The Fund is not required to have, nor were we engaged to perform, an audit of its internal control over financial reporting. Our audit included consideration of internal control over financial reporting as a basis for designing audit procedures that are appropriate in the circumstances, but not for the purpose of expressing an opinion on the effectiveness of the Fund’s internal control over financial reporting. Accordingly, we express no such opinion. An audit also includes examining, on a test basis, evidence supporting the amounts and disclosures in the financial statements, assessing the accounting principles used and significant estimates made by management, as well as evaluating the overall financial statement presentation. Our procedures included confirmation of securities owned as of April 30, 2013, by correspondence with the custodian and broker. We believe that our audit provides a reasonable basis for our opinion.
In our opinion, the consolidated financial statements and financial highlights referred to above present fairly, in all material respects, the financial position of Aspen Managed Futures Strategy Fund and subsidiary of the Financial Investors Trust, as of April 30, 2013, the results of their operations for the year then ended, and the changes in their net assets and the financial highlights for the year then ended and for the period from August 2, 2011 (inception) to April 30, 2012, in conformity with accounting principles generally accepted in the United States of America.
DELOITTE & TOUCHE LLP
Denver, Colorado
June 27, 2013
| | |
| Annual Report | April 30, 2013 | | 21 |
| | |
| Aspen Managed Futures Strategy Fund | | Additional Information |
| | April 30, 2013 (Unaudited) |
1. FUND HOLDINGS
The Fund files its complete schedule of portfolio holdings with the Securities and Exchange Commission (the “SEC”) for the first and third quarters of each fiscal year on Form N-Q within 60 days after the end of the period. Copies of the Fund’s Form N-Q are available without charge on the SEC website at http://www.sec.gov. You may also review and copy the Form N-Q at the SEC’s Public Reference Room in Washington, DC. For more information about the operation of the Public Reference Room, please call the SEC at 1-800-SEC-0330.
2. FUND PROXY VOTING POLICIES, PROCEDURES AND SUMMARIES
The Fund’s policies and procedures used in determining how to vote proxies and information regarding how the Fund voted proxies relating to portfolio securities during the most recent prior 12-month period ending June 30 are available without charge, (1) upon request, by calling (toll-free) 1-855-845-9444 and (2) on the SEC’s website at http://www.sec.gov.
3. DISCLOSURE REGARDING APPROVAL OF FUND ADVISORY AGREEMENT
Aspen Managed Futures Strategy Fund (the “Aspen Fund”)
On March 12, 2013, the Trustees met in person to discuss, among other things, the approval of the Investment Advisory Agreement between the Trust and Aspen Partners, Ltd. (“Aspen”) (the “Aspen Fund Advisory Agreement”) in accordance with Section 15(c) of the 1940 Act. The Independent Trustees met with independent legal counsel during executive session and discussed the Aspen Fund Advisory Agreement and other related materials.
In renewing and approving the Aspen Fund Advisory Agreement with Aspen, the Trustees, including the Independent Trustees, considered the following factors with respect to the Aspen Fund:
Investment Advisory Fee Rate: The Trustees reviewed and considered the contractual annual advisory fee to be paid by the Trust, on behalf of the Aspen Fund, to Aspen of 0.75% of the Aspen Fund’s daily average net assets, in light of the extent and quality of the advisory services provided by Aspen to the Aspen Fund.
The Trustees considered the information they received comparing the Aspen Fund’s contractual advisory fees and overall expenses with those of funds in both the relevant expense group and universe of funds provided by an independent provider of investment company data.
Based on such information, the Trustees further determined that the contractual annual advisory fees set forth above and the total expense ratio of 1.55% for each share class the Aspen Fund, taking into account the contractual fee waivers in place (subject to certain exclusions), is comparable to others within the Fund’s anticipated peer universe.
Nature, Extent and Quality of the Services under the Aspen Fund Advisory Agreement: The Trustees received and considered information regarding the nature, extent and quality of services provided to the Aspen Fund under the Aspen Fund Advisory Agreement. The Trustees reviewed certain background materials supplied by Aspen in its presentation, including its Form ADV.
The Trustees reviewed and considered Aspen’s investment advisory personnel, its history as an asset manager, its performance and the amount of assets currently under management by Aspen. The Trustees also reviewed the research and decision-making processes utilized by Aspen, including the methods adopted to seek to achieve compliance with the investment objectives, policies and restrictions of the Aspen Fund.
The Trustees considered the background and experience of Aspen’s management in connection with the Aspen Fund, including reviewing the qualifications, backgrounds and responsibilities of the management team primarily responsible for the day-to-day portfolio management of the Aspen Fund and the extent of the resources devoted to research and analysis of actual and potential investments.
The Trustees also reviewed the accompanying compliance-related materials and further noted that they have received reports on these services and compliance issues at each regular Board meeting throughout the year related to the services rendered by Aspen with respect to the Aspen Fund.
Performance: The Trustees reviewed performance information for the Aspen Fund for the three-month and 1-year periods ended December 31, 2012. That review included a comparison of the Aspen Fund’s performance to the performance of a group of comparable funds selected by FUSE. The Trustees noted the favorable performance of the Aspen Fund over the three-month and 1-year periods ended December 31, 2012 compared against funds identified by FUSE. The Trustees also considered Aspen’s discussion of the Aspen Fund’s underlying portfolio diversification categories, its top contributors and top detractors, as well as Aspen’s performance and reputation generally and its investment techniques, risk management controls and decision-making processes.
| | |
| 22 | | www.aspenfuturesfund.com |
| | |
| Aspen Managed Futures Strategy Fund | | Additional Information |
| | April 30, 2013 (Unaudited) |
The Adviser’s Profitability: The Trustees received and considered a projected profitability analysis prepared by Aspen based on the fees payable under the Aspen Fund Advisory Agreement. The Trustees considered the profits, if any, anticipated to be realized by Aspen in connection with the operation of the Aspen Fund. The Board then reviewed Aspen’s financial statements in order to analyze the financial condition and stability and profitability of the adviser.
Economies of Scale: The Trustees considered whether economies of scale in the provision of services to the Aspen Fund will be passed along to the shareholders under the proposed agreements.
Other Benefits to the Adviser: The Trustees reviewed and considered any other benefits derived or to be derived by Aspen from its relationship with the Aspen Fund, including soft dollar arrangements.
The Board summarized its deliberations with respect to the Aspen Fund Advisory Agreement with Aspen. In selecting Aspen and approving the Aspen Fund Advisory Agreement and fees under such agreement, the Trustees concluded that no single factor reviewed by the Trustees was identified by the Trustees to be determinative as the principal factor in whether to approve the investment advisory agreement. Further, the Independent Trustees were advised by separate independent legal counsel throughout the process. The Trustees, including all of the Independent Trustees, concluded that:
| | — | | the investment advisory fees to be received by Aspen with respect to the Aspen Fund were comparable to others with in the Fund’s peer universe; |
| | — | | the nature, extent and quality of services rendered by Aspen under the Aspen Fund Advisory Agreement were adequate; |
| | — | | the performance of the Aspen Fund was generally comparable, and to some extent, favorable, to the performance of the funds in its FUSE Research Network, LLC peer group; |
| | — | | the profit, if any, anticipated to be realized by Aspen in connection with the operation of the Aspen Fund is fair to the Trust, especially in light of the fee waiver agreement between the Trust and Aspen; and |
| | — | | there were no material economies of scale or other benefits accruing to Aspen in connection with its relationship with the Aspen Fund. |
Based on the Trustees’ deliberations and their evaluation of the information described above, the Trustees, including all of the Independent Trustees, concluded that Aspen’s compensation for investment advisory services is consistent with the best interests of the Aspen Fund and its shareholders.
| | |
| Annual Report | April 30, 2013 | | 23 |
| | |
| Aspen Managed Futures Strategy Fund | | Trustees and Officers |
| | April 30, 2013 (Unaudited) |
INDEPENDENT TRUSTEES
| | | | | | | | | | |
Name, Address* & Age | | Position(s) Held with Fund | | Term of Office and Length of Time Served** | | Principal Occupation(s) During Past 5 Years*** | | Number of
Funds in Fund Complex Overseen by Trustee**** | | Other Directorships Held by Trustee During Past 5 Years |
|
Mary K. Anstine, age 72 | | Trustee | | Ms. Anstine was elected at a special meeting of shareholders held on March 21, 1997 and re-elected at a special meeting of shareholders held on August 7, 2009. | | Ms. Anstine was President/Chief Executive Officer of HealthONE Alliance, Denver, Colorado, and former Executive Vice President of First Interstate Bank of Denver. Ms. Anstine is also Trustee/Director of AV Hunter Trust and Colorado Uplift Board. Ms. Anstine was formerly a Director of the Trust Bank of Colorado (later purchased and now known as Northern Trust Bank), HealthONE and Denver Area Council of the Boy Scouts of America, and a member of the American Bankers Association Trust Executive Committee. | | 26 | | Ms. Anstine is a Trustee of ALPS ETF Trust (13 funds); ALPS Variable Investment Trust (7 funds); Reaves Utility Income Fund (1 fund); and Westcore Trust (12 funds). |
|
John R. Moran, Jr., age 82 | | Trustee | | Mr. Moran was elected at a special meeting of shareholders held on March 21, 1997 and re-elected at a special meeting of shareholders held on August 7, 2009. | | Mr. Moran is formerly President and CEO of The Colorado Trust, a private foundation serving the health and hospital community in the state of Colorado. An attorney, Mr. Moran was formerly a partner with the firm of Kutak Rock & Campbell in Denver, Colorado and a member of the Colorado House of Representatives. Currently, Mr. Moran is a member of the Treasurer’s Investment Advisory Committee for the University of Colorado. | | 26 | | None. |
|
Jeremy W. Deems, age 36 | | Trustee | | Mr. Deems was appointed as a Trustee at the March 11, 2008 meeting of the Board of Trustees and elected at a special meeting of shareholders held on August 7, 2009. | | Mr. Deems is the Co-Founder, Chief Operations Officer and Chief Financial Officer of Green Alpha Advisors, LLC. Prior to joining Green Alpha Advisors, Mr. Deems was CFO and Treasurer of Forward Management, LLC, an investment management company, ReFlow Management Co., LLC, a liquidity resourcing company, ReFlow Fund, LLC, a private investment fund, and Sutton Place Management, LLC, an administrative services company (from 2004 to June 2007). Prior to this, Mr. Deems served as Controller of Forward Management, LLC, ReFlow Management Co., LLC, ReFlow Fund, LLC and Sutton Place Management, LLC. | | 26 | | Mr. Deems is a Trustee of ALPS ETF Trust (13 funds); ALPS Variable Investment Trust (7 funds) and Reaves Utility Income Fund (1 fund). |
|
| Jerry G. Rutledge, age 68 | | Trustee | | Mr. Rutledge was elected at a special meeting of shareholders held on August 7, 2009. | | Mr. Rutledge is the President and owner of Rutledge’s Inc., a retail clothing business. Mr. Rutledge is currently Director of the American National Bank. He was from 1994 to 2007 a Regent of the University of Colorado. | | 26 | | Mr. Rutledge is a Trustee of Clough Global Allocation Fund (1 fund), Clough Global Equity Fund (1 fund) and Clough Global Opportunities Fund (1 fund). |
|
Michael “Ross” Shell, age 42 | | Trustee | | Mr. Shell was elected at a special meeting of shareholders held on August 7, 2009. | | Mr. Shell is Founder and CEO* of Red Idea, LLC, a strategic consulting/early stage venture firm (since June 2008). From 1999 to 2009, he was a part-owner and Director of Tesser, Inc., a brand agency. From December 2005 to May 2008, he was Director, Marketing and Investor Relations, of Woodbourne, a REIT/real estate hedge fund and private equity firm. Prior to this, from May 2004 to November 2005, he worked as a business strategy consultant; from June 2003 to April 2004, he was on the Global Client Services team of IDEO, a product design/innovation firm; and from 1999 to 2003, he was President of Tesser, Inc. Mr. Shell graduated with honors from Stanford University with a degree in Political Science. | | 26 | | None. |
|
| | |
| 24 | | www.aspenfuturesfund.com |
| | |
| Aspen Managed Futures Strategy Fund | | Trustees and Officers |
| | April 30, 2013 (Unaudited) |
INTERESTED TRUSTEE
| | | | | | | | | | |
Name,
Address*
& Age | | Position(s) Held with Fund | | Term of Office and Length of Time Served** | | Principal Occupation(s) During Past 5 Years*** | | Number of Funds in Fund Complex Overseen by
Trustee**** | | Other Directorships Held by Trustee During Past 5 Years |
|
Edmund J. Burke, age 52 | | Trustee, Chairman and President | | Mr. Burke was elected as Chairman at the August 28, 2009 meeting of the Board of Trustees. Mr. Burke was elected as Trustee at a special meeting of shareholders held on August 7, 2009. Mr. Burke was elected President of the Trust at the December 17, 2002 meeting of the Board of Trustees. | | Mr. Burke is President and a Director of ALPS Holdings, Inc. (“AHI”) (since 2005) and Director of ALPS Advisors, Inc. (“AAI”), ALPS Distributors, Inc. (“ADI”), ALPS Fund Services, Inc. (“AFS”) and ALPS Portfolio Solutions Distributor, Inc. (“APSD”) and from 2001-2008, was President of AAI, ADI, AFS and APSD. Because of his positions with AHI, AAI, ADI, AFS and APSD, Mr. Burke is deemed an affiliate of the Trust as defined under the 1940 Act. Mr. Burke is Trustee and President of the Clough Global Allocation Fund (Trustee since 2006; President since 2004); Trustee and President of the Clough Global Equity Fund (Trustee since 2006; President since 2005); Trustee and President of the Clough Global Opportunities Fund (since 2006); Trustee of the Liberty All-Star Equity Fund; and Director of the Liberty All-Star Growth Fund, Inc. | | 26 | | Mr. Burke is a Trustee of Clough Global Allocation Fund (1 fund); Clough Global Equity Fund (1 fund); Clough Global Opportunities Fund (1 fund); Trustee of the Liberty All-Star Equity Fund (1 fund); and Director of the Liberty All-Star Growth Fund, Inc. (1 fund). |
|
OFFICERS
| | | | | | |
Name,
Address*
& Age | | Position(s) Held with Fund | | Term of Office and Length of Time Served** | | Principal Occupation(s) During Past 5 Years*** |
|
Kimberly R. Storms, age 40 | | Treasurer | | Ms. Storms was elected Treasurer of the Trust at the March 12, 2013 meeting of the Board of Trustees. | | Ms. Storms is Senior Vice President - Director of Fund Administration of ALPS. Ms. Storms joined ALPS in 1998 as Assistant Controller. Because of her position with ALPS, Ms. Storms is deemed an affiliate of the Trust as defined under the 1940 Act. Ms. Storms is also Treasurer of BPV Family of Funds and ALPS Series Trust; Assistant Treasurer of Liberty All-Star Equity Fund and Liberty All-Star Growth Fund, Inc.; Assistant Treasurer of Tilson Funds; and Chief Financial Officer of The Arbitrage Funds. |
|
David T. Buhler, age 41 | | Secretary | | Mr. Buhler was elected Secretary of the Trust at the September 11, 2012 meeting of the Board of Trustees. | | Mr. Buhler joined ALPS in June 2010, and is currently Vice President and Associate Counsel of ALPS, AAI, ADI and APSD. Prior to joining ALPS, Mr. Buhler served as Associate General Counsel and Assistant Secretary of Founders Asset Management LLC from 2006 to 2009. Because of his position with ALPS, Mr. Buhler is deemed an affiliate of the Trust as defined under the 1940 Act. Mr. Buhler is also the Secretary of ALPS Variable Investment Trust and Westcore Trust. |
|
| Ted Uhl, age 37 | | Chief Compliance Officer (“CCO”) | | Mr. Uhl was appointed CCO of the Trust at the June 8, 2010 meeting of the Board of Trustees. | | Mr. Uhl joined ALPS in October 2006, and is currently Deputy Compliance Officer of ALPS. Prior to his current role, Mr. Uhl served as Senior Risk Manager for ALPS from October 2006 until June 2010. Before joining ALPS, Mr. Uhl served a Sr. Analyst with Enenbach and Associates (RIA), and a Sr. Financial Analyst at Sprint. Because of his position with ALPS, Mr. Uhl is deemed an affiliate of the Trust as defined under the 1940 Act. Mr. Uhl is also CCO of the Clough Global Funds, Reaves Utility Income Fund, Drexel Hamilton Funds and Transparent Value Trust. |
|
| * | All communications to Trustees and Officers may be directed to Financial Investors Trust c/o 1290 Broadway, Suite 1100, Denver, CO 80203. |
| ** | This is the period for which the Trustee/Officer began serving the Trust. Each Trustee/Officer serves an indefinite term, until his successor is elected. |
| *** | Except as otherwise indicated, each individual has held the office shown or other offices in the same company for the last five years. |
| **** | The Fund Complex includes all series of the Trust (currently 26) and any other investment companies for which Aspen Partners, Ltd. provides investment advisory services (currently none). |
| | |
| Annual Report | April 30, 2013 | | 25 |


| | |
| The Disciplined Growth Investors Fund | | Shareholder Letter |
| | April 30, 2013 (Unaudited) |
Total return for the year ending 4/30/2013 was an increase of 9.93%. This performance lagged the Fund’s stated benchmark, Standard & Poor’s 500 Index, by 6.96%. Returns from the bond portfolio were 5.75%, which we consider adequate given prevailing bond yields. However, these bond returns did create a performance drag compared against the all-equity benchmark. We are pleased with the equity portion of the portfolio’s 11.93% return for the last twelve months, despite the fact that it trailed the S&P 500 return. This underperformance can be attributed to the both the relative underperformance of mid caps stocks vis-à-vis large cap stocks and the lack luster performance of three holdings. Edwards Lifesciences, Plexus Corp, and Select Comfort Corp all experienced setbacks that we believe to be temporary, but did hurt performance over the last 12 months.
The Disciplined Growth Investors mutual fund is a balanced fund, invested with a significant exposure to both stocks and bonds. Because our research shows the expected return from our portfolio of stocks over the next seven years is considerably higher than the expected return from our bond portfolios, we are presently maintaining the stock exposure in the fund at the high end of the target range; about 70%. We are maintaining tight maturity and credit control over the bonds in the fund.
In our estimation, the largest issue facing the capital markets is the high and rising level of U.S. Treasury debt. We discuss this issue at length in a recent white paper we published, “U.S. Treasury Debt: Virtuous Circles, Vicious Circles, and Mathematical Intersections”. In the article, we assert that U.S. Treasury debt is overvalued and that market is very large. We also assert that the U.S. Treasury has been in a virtuous circle since 1981. We also forecast that the U.S. Treasury debt will likely enter a vicious circle, one that is likely to last a long time, perhaps a decade or longer.
We believe the Treasury debt problems plus the problems with the European economies and currency and the re-emergence of terror attacks are likely to keep investors on edge for the foreseeable future.
The Silver lining in a dark cloud
Lest our mutual fund shareholders assume we are filled with doom and gloom because of our concerns over the U.S. Treasury debt market, we see a terrific story emerging in corporate America.
The story arguably begins in the middle 1990’s. At that time public corporations were being sued by law firms whenever the company missed quarterly earnings forecasts. In return for litigation relief the companies agreed to provide much more information in their SEC filings. The Safe Harbor act became law in 1995.
The second stimulus to improved corporate performance came after the Enron and Worldcom debacles. The Sarbanes-Oxley Act was a response to fraudulent corporate reporting and was passed into law in 2002. One of the key provisions of the law was the requirement that the CEO and CFO each sign financial statements, attesting to their accuracy.
These two laws dramatically improved the promptness and accuracy of financial statements. They also forced massive improvements in the internal record-keeping of corporations.
The third recent development in corporate America was the proliferation of the web. The increased availability of network computing has enabled a quiet and far-reaching renovation of corporate America. Businesses now have far more timely and accurate internal reporting and
| | |
| Annual Report | April 30, 2013 | | 1 |
| | |
| The Disciplined Growth Investors Fund | | Shareholder Letter |
| | April 30, 2013 (Unaudited) |
management efficiency has skyrocketed. Twenty years ago employees spent much of their day storing, finding and retrieving information. Today employees spend a minimum of time handling information. Of equal importance the web has enabled quantum leaps in the ability of large organizations to coordinate their efforts.
These factors have led to surprisingly good profitability for corporate America. This profitability has not been achieved at the expenses of investments in the future, such as new product development.
The generally grim macroeconomic picture and excellent corporate profitability have kept stock valuations generally reasonable. To us, this seems to be a very good environment for the long-term investor in stocks.
Buy-and-Hold no longer works- NOT!
It seems like the prevailing wisdom on how to invest in stocks changes after severe bear markets. This time is no exception. Since 2000 the U.S. has endured two of the five worst bear markets of the last century. Naturally many stock market “investors” now declare that the new key to success in the stock market is to be a nimble trader. This is nonsense. We believe prudently buying excellent companies when their stocks are at favorable prices and carefully holding those positions for years has always been and will always be the key to long-term success in the stock market.
Thanks to the DGI Shareholders
We are grateful that you have chosen to entrust your assets to our care.
Fred Martin,
Chief Investment Officer
The views and information discussed in this commentary are as of the date of publication, are subject to change, and may not reflect the writer’s current views. The views expressed represent an assessment of market conditions at a specific point in time, are opinions only and should not be relied upon as investment advice regarding a particular investment or markets in general. Such information does not constitute a recommendation to buy or sell specific securities or investment vehicles. It should not be assumed that any investment will be profitable or will equal the performance of the Fund or any securities or any sectors mentioned herein. The subject matter contained herein has been derived from several sources believed to be reliable and accurate at the time of compilation. The Fund does not accept any liability for losses either direct or consequential caused by the use of this information.
The index is not actively managed and does not reflect any deductions for fees, expenses or taxes. An investor may not invest directly in an index.
Fred Martin is a registered representative of ALPS Distributors, Inc.
| | |
| 2 | | 1-855-DGI-FUND (344-3863) | www.DGIfund.com |
| | |
| The Disciplined Growth Investors Fund | | Performance Update |
| | April 30, 2013 (Unaudited) |
Cumulative Total Return Performance (for the period ended April 30, 2013)
| | | | | | | | | | |
| | | 1 month | | 3 month | | 2013 YTD | | 1 Year | | Since Inception* |
|
Disciplined Growth Investors Fund | | 0.84% | | 2.49% | | 6.38% | | 9.93% | | 18.44% |
S&P 500® Total Return Index(1) | | 1.93% | | 7.18% | | 12.74% | | 16.89% | | 22.03% |
| * | Fund Inception date of August 12, 2011 |
| (1) | The S&P 500® Total Return Index is an unmanaged index of 500 common stocks chosen for market size, liquidity and industry group representation. It is a market-value weighted index. The S&P 500® Total Return Index is not actively managed and do not reflect any deduction for fees, expenses or taxes. It is not possible to invest directly in an index. |
The returns shown above do not reflect the deductions of taxes a shareholder would pay on Fund distributions or redemptions of Fund shares.
Returns less than one year are cumulative.
Performance data quoted represents past performance. Past performance does not guarantee future results. Investment return and principal value of an investment will fluctuate so that an investor’s shares, when sold or redeemed, may be worth more or less than the original cost. Current performance data may be higher or lower than actual data quoted. For the most current month-end performance data please call 855-DGI-FUND.
Growth of $10,000 Investment in the Fund (for the period ended April 30, 2013)
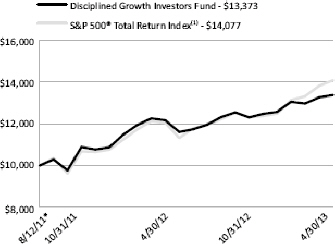
The chart represents historical performance of a hypothetical investment of $10,000 in the Fund since inception. Past performance does not guarantee future results. This chart does not reflect the deduction of taxes that a shareholder would pay on Fund distributions or the redemption of Fund shares.
Investing in the Fund is subject to investment risks, including possible loss of the principal amount invested.
| | |
| Annual Report | April 30, 2013 | | 3 |
| | |
| The Disciplined Growth Investors Fund | | Performance Update |
| | April 30, 2013 (Unaudited) |
Industry Sector Allocation (as a % of Net Assets)*
| | | | |
Technology | | | 23.13 | % |
Consumer Discretionary | | | 21.82 | % |
Producer Durables | | | 10.60 | % |
Utilities | | | 1.26 | % |
Health Care | | | 5.84 | % |
Energy | | | 2.00 | % |
Financial Services | | | 3.57 | % |
Industrials | | | 0.73 | % |
Asset/Mortgage Backed Securities | | | 0.30 | % |
Corporate Bond | | | 26.42 | % |
Foreign Government Bonds | | | 1.23 | % |
Government & Agency Obligations | | | 0.32 | % |
Other Assets in Excess of Liabilities | | | 2.78 | % |
Top Ten Holdings (as a % of Net Assets)*
| | | | |
TJX Cos., Inc. | | | 4.62 | % |
Intuit, Inc. | | | 3.39 | % |
Cabela’s, Inc. | | | 2.91 | % |
Eaton Corp. PLC | | | 2.77 | % |
Seagate Technology PLC | | | 2.53 | % |
Limited Brands, Inc. | | | 2.44 | % |
Edwards Lifesciences Corp. | | | 2.43 | % |
Trimble Navigation Ltd. | | | 2.27 | % |
Open Text Corp. | | | 2.26 | % |
Middleby Corp. | | | 2.22 | % |
Top Ten Holdings | | | 27.84 | % |
| * | Holdings are subject to change. Tables present indicative values only. |
| | |
| 4 | | 1-855-DGI-FUND (344-3863) | www.DGIfund.com |
| | |
| The Disciplined Growth Investors Fund | | Disclosure of Fund Expenses |
| | April 30, 2013 (Unaudited) |
As a shareholder of a Fund, you incur two types of costs: direct costs, such as short-term redemption fees and wire fees, balance fees, and indirect costs, including management fees, and other fund operating expenses. This example is intended to help you understand your indirect costs, also referred to as “ongoing costs” (in dollars), of investing in the Fund and to compare these costs with the ongoing costs of investing in other mutual funds.
This example is based on an investment of $1,000 invested at the beginning of the period and held for the entire six-month period of November 1, 2012 through April 30, 2013.
Actual Expenses The first line of the table below provides information about actual account values and actual expenses. You may use the information in this line, together with the amount you invested at the beginning of the period, to estimate the expenses that you paid over the period. Simply divide your account value by $1,000 (for example, an $8,600 account value divided by $1,000 = 8.6), then multiply the result by the number in the first line under the heading “Expenses Paid During Period” to estimate the expenses you paid on your account during this period.
Hypothetical Example for Comparison Purposes The second line of the table provides information about hypothetical account values and hypothetical expenses based on the Fund’s actual expense ratio and an assumed rate of return of 5% per year before expenses, which is not the Fund’s actual return. The hypothetical account values and expenses may not be used to estimate the actual ending account balance or expenses you paid for the period. You may use this information to compare ongoing costs of investing in the Fund and other funds. To do so, compare this 5% hypothetical example with the 5% hypothetical examples that appear in the shareholder reports of other funds.
Please note that the expenses shown in the table are meant to highlight your ongoing costs only and do not reflect any direct costs, such as wire fees or low balance fees. Therefore, the second line of the table is useful in comparing ongoing costs only and will not help you determine the relative total costs of owning different funds. In addition, if these direct costs were included, your costs would be higher.
| | | | | | | | |
| | | Beginning Account
Value 11/1/2012 | | Ending Account
Value 4/30/13 | | Expense
Ratio(a) | | Expenses Paid
During period
11/1/2012 -4/30/13(b) |
|
| | | | |
Actual | | $1,000.00 | | $1,086.90 | | 0.78% | | $4.04 |
Hypothetical (5% return before expenses) | | $1,000.00 | | $1,020.93 | | 0.78% | | $3.91 |
| (a) | The Fund’s expense ratios have been annualized based on the Fund’s most recent fiscal half-year expenses. |
| (b) | Expenses are equal to the Fund’s annualized expense ratio, multiplied by the average account value over the period, multiplied by the number of days in the most recent fiscal half-year 181/365. |
| | |
| Annual Report | April 30, 2013 | | 5 |
| | |
| The Disciplined Growth Investors Fund | | Portfolio of Investments |
| | April 30, 2013 |
| | | | | | | | |
| | | Shares | | | Value (Note 2) | |
| |
COMMON STOCKS (68.95%) | | | | | | | | |
CONSUMER DISCRETIONARY (21.82%) | | | | | | | | |
Auto & Auto Parts (1.34%) | | | | | | | | |
Gentex Corp. | | | 39,975 | | | $ | 899,438 | |
| | | | | | | | |
| | |
Commercial Services (1.33%) | | | | | | | | |
The Corporate Executive Board Co. | | | 15,775 | | | | 889,079 | |
| | | | | | | | |
| | |
Consumer Products (6.35%) | | | | | | | | |
Ethan Allen Interiors, Inc. | | | 37,819 | | | | 1,107,340 | |
Garmin Ltd. | | | 21,613 | | | | 758,184 | |
Ralph Lauren Corp. | | | 7,681 | | | | 1,394,716 | |
Select Comfort Corp.(a) | | | 46,749 | | | | 992,014 | |
| | | | | | | | |
| | | | | | | 4,252,254 | |
| | | | | | | | |
| | |
Consumer Services (0.13%) | | | | | | | | |
Nutrisystem, Inc. | | | 10,682 | | | | 86,524 | |
| | | | | | | | |
| | |
Leisure (2.01%) | | | | | | | | |
The Cheesecake Factory, Inc. | | | 12,050 | | | | 479,831 | |
Royal Caribbean Cruises Ltd. | | | 23,725 | | | | 866,674 | |
| | | | | | | | |
| | | | | | | 1,346,505 | |
| | | | | | | | |
Media (0.70%) | | | | | | | | |
DreamWorks Animation SKG, Inc. - Class A(a) | | | 24,212 | | | | 466,807 | |
| | | | | | | | |
| | |
Retail (9.96%) | | | | | | | | |
Cabela’s, Inc.(a) | | | 30,375 | | | | 1,950,075 | |
Limited Brands, Inc. | | | 32,405 | | | | 1,633,536 | |
TJX Cos., Inc. | | | 63,375 | | | | 3,090,799 | |
| | | | | | | | |
| | | | | | | 6,674,410 | |
| | | | | | | | |
TOTAL CONSUMER DISCRETIONARY | | | | | | | 14,615,017 | |
| | | | | | | | |
| | |
ENERGY (2.00%) | | | | | | | | |
Energy Equipment & Services (1.35%) Noble Corp. | | | 24,157 | | | | 905,888 | |
| | | | | | | | |
| | |
| 6 | | 1-855-DGI-FUND (344-3863) | www.DGIfund.com |
| | |
| The Disciplined Growth Investors Fund | | Portfolio of Investments |
| | April 30, 2013 |
| | | | | | | | |
| | | Shares | | | Value (Note 2) | |
| |
ENERGY (continued) | | | | | | | | |
Oil & Gas (0.65%) | | | | | | | | |
Ultra Petroleum Corp.(a) | | | 20,300 | | | $ | 434,420 | |
| | | | | | | | |
| | |
TOTAL ENERGY | | | | | | | 1,340,308 | |
| | | | | | | | |
| | |
FINANCIAL SERVICES (3.57%) | | | | | | | | |
Banks (0.71%) | | | | | | | | |
TCF Financial Corp. | | | 32,800 | | | | 477,240 | |
| | | | | | | | |
| | |
Consumer Finance & Credit Services (1.76%) | | | | | | | | |
FactSet Research Systems, Inc. | | | 12,494 | | | | 1,175,311 | |
| | | | | | | | |
| | |
Investment Banking & Brokerage (1.10%) | | | | | | | | |
E*Trade Financial Corp.(a) | | | 25,381 | | | | 261,170 | |
Janus Capital Group, Inc. | | | 53,200 | | | | 474,544 | |
| | | | | | | | |
| | | | | | | 735,714 | |
| | | | | | | | |
TOTAL FINANCIAL SERVICES | | | | | | | 2,388,265 | |
| | | | | | | | |
| | |
HEALTH CARE (5.84%) | | | | | | | | |
Medical Equipment & Services (5.02%) | | | | | | | | |
Edwards Lifesciences Corp.(a) | | | 25,550 | | | | 1,629,834 | |
Intuitive Surgical, Inc.(a) | | | 1,737 | | | | 855,108 | |
Varian Medical Systems, Inc.(a) | | | 13,450 | | | | 876,133 | |
| | | | | | | | |
| | | | | | | 3,361,075 | |
| | | | | | | | |
Medical Specialties (0.78%) | | | | | | | | |
Align Technology, Inc.(a) | | | 15,700 | | | | 519,984 | |
| | | | | | | | |
| | |
Pharmaceuticals & Biotech (0.04%) | | | | | | | | |
Incyte Corp. Ltd.(a) | | | 1,400 | | | | 31,010 | |
| | | | | | | | |
| | |
TOTAL HEALTH CARE | | | | | | | 3,912,069 | |
| | | | | | | | |
| | |
INDUSTRIALS (0.73%) | | | | | | | | |
Machinery-Diversified (0.73%) | | | | | | | | |
Graco, Inc. | | | 8,050 | | | | 487,266 | |
| | | | | | | | |
| | |
TOTAL INDUSTRIALS | | | | | | | 487,266 | |
| | | | | | | | |
| | |
| Annual Report | April 30, 2013 | | 7 |
| | |
| The Disciplined Growth Investors Fund | | Portfolio of Investments |
| | April 30, 2013 |
| | | | | | | | |
| | | Shares | | | Value (Note 2) | |
| |
PRODUCER DURABLES (10.60%) | | | | | | | | |
Commercial Services (0.59%) | | | | | | | | |
Paychex, Inc. | | | 10,900 | | | $ | 396,869 | |
| | | | | | | | |
| | |
Machinery (2.22%) | | | | | | | | |
Middleby Corp.(a) | | | 9,918 | | | | 1,483,534 | |
| | | | | | | | |
| | |
Manufacturing & Production (2.77%) | | | | | | | | |
Eaton Corp. PLC | | | 30,214 | | | | 1,855,442 | |
| | | | | | | | |
| | |
Scientific Instruments & Services (2.82%) | | | | | | | | |
Brady Corp. - Class A | | | 10,900 | | | | 369,292 | |
Trimble Navigation Ltd.(a) | | | 52,950 | | | | 1,521,783 | |
| | | | | | | | |
| | | | | | | 1,891,075 | |
| | | | | | | | |
Transportation & Freight (2.20%) | | | | | | | | |
JetBlue Airways Corp.(a) | | | 68,750 | | | | 473,688 | |
Landstar System, Inc. | | | 18,250 | | | | 997,545 | |
| | | | | | | | |
| | | | | | | 1,471,233 | |
| | | | | | | | |
TOTAL PRODUCER DURABLES | | | | | | | 7,098,153 | |
| | | | | | | | |
| | |
TECHNOLOGY (23.13%) | | | | | | | | |
Computers (0.62%) | | | | | | | | |
IHS, Inc. - Class A(a) | | | 4,200 | | | | 409,206 | |
Imation Corp.(a) | | | 800 | | | | 2,944 | |
| | | | | | | | |
| | | | | | | 412,150 | |
| | | | | | | | |
Electronics (7.09%) | | | | | | | | |
ARM Holdings PLC ADR | | | 25,037 | | | | 1,170,480 | |
Microchip Technology, Inc. | | | 17,900 | | | | 651,918 | |
Open Text Corp. | | | 23,156 | | | | 1,514,171 | |
Plexus Corp.(a) | | | 52,425 | | | | 1,413,902 | |
| | | | | | | | |
| | | | | | | 4,750,471 | |
| | | | | | | | |
| | |
| 8 | | 1-855-DGI-FUND (344-3863) | www.DGIfund.com |
| | |
| The Disciplined Growth Investors Fund | | Portfolio of Investments |
| | April 30, 2013 |
| | | | | | | | |
| | | Shares | | | Value (Note 2) | |
| |
TECHNOLOGY (continued) | | | | | | | | |
Information Technology (13.15%) | | | | | | | | |
Akamai Technologies, Inc.(a) | | | 30,300 | | | $ | 1,330,473 | |
Apple, Inc. | | | 1,183 | | | | 523,773 | |
Autodesk, Inc.(a) | | | 34,850 | | | | 1,372,393 | |
Dolby Laboratories, Inc. - Class A | | | 13,275 | | | | 436,084 | |
Intuit, Inc. | | | 38,025 | | | | 2,267,811 | |
Seagate Technology PLC | | | 46,081 | | | | 1,691,173 | |
Yahoo!, Inc.(a) | | | 48,000 | | | | 1,187,040 | |
| | | | | | | | |
| | | | | | | 8,808,747 | |
| | | | | | | | |
Telecommunications (2.27%) | | | | | | | | |
Aviat Networks, Inc.(a) | | | 42,775 | | | | 136,880 | |
Plantronics, Inc. | | | 24,475 | | | | 1,072,494 | |
ViaSat, Inc.(a) | | | 6,419 | | | | 311,129 | |
| | | | | | | | |
| | | | | | | 1,520,503 | |
| | | | | | | | |
TOTAL TECHNOLOGY | | | | | | | 15,491,871 | |
| | | | | | | | |
| | |
UTILITIES (1.26%) | | | | | | | | |
Utilities (1.26%) | | | | | | | | |
tw telecom, Inc.(a) | | | 31,200 | | | | 844,896 | |
| | | | | | | | |
| | |
TOTAL UTILITIES | | | | | | | 844,896 | |
| | | | | | | | |
| | |
TOTAL COMMON STOCKS (Cost $39,174,453) | | | | | | | 46,177,845 | |
| | | | | | | | |
| | |
| |
| Principal
Amount |
| |
| Value
(Note 2 |
) |
| |
ASSET/MORTGAGE BACKED SECURITIES (0.30%) | | | | | | | | |
Government National Mortgage Association, Series 2005-93 | | | | | | | | |
5.500% 12/20/2034 | | $ | 185,000 | | | | 199,870 | |
| | | | | | | | |
| | |
TOTAL ASSET/MORTGAGE BACKED SECURITIES (Cost $204,337) | | | | | | | 199,870 | |
| | | | | | | | |
| | |
CORPORATE BONDS (26.42%) | | | | | | | | |
Affiliated Computer Services, Inc. | | | | | | | | |
5.125% 06/01/2015 | | | 118,000 | | | | 126,430 | |
Alliant Energy Corp. | | | | | | | | |
4.000% 10/15/2014 | | | 226,000 | | | | 236,485 | |
| | |
| Annual Report | April 30, 2013 | | 9 |
| | |
| The Disciplined Growth Investors Fund | | Portfolio of Investments |
| | April 30, 2013 |
| | | | | | | | |
| | | Principal
Amount | | | Value
(Note 2) | |
| |
CORPORATE BONDS (continued) | | | | | | | | |
Ameren Illinois Co. | | | | | | | | |
9.750% 11/15/2018 | | $ | 162,000 | | | $ | 228,483 | |
American Express Co. | | | | | | | | |
7.250% 05/20/2014 | | | 209,000 | | | | 223,542 | |
Anheuser-Busch InBev Worldwide, Inc. | | | | | | | | |
5.375% 01/15/2020 | | | 216,000 | | | | 263,239 | |
Arizona Public Service Co. | | | | | | | | |
8.750% 03/01/2019 | | | 185,000 | | | | 250,313 | |
AT&T, Inc. | | | | | | | | |
5.500% 02/01/2018 | | | 414,000 | | | | 489,950 | |
BB&T Corp. | | | | | | | | |
5.700% 04/30/2014 | | | 199,000 | | | | 209,477 | |
BP Capital Markets PLC | | | | | | | | |
5.250% 11/07/2013 | | | 216,000 | | | | 221,458 | |
Burlington Northern Santa Fe LLC | | | | | | | | |
4.875% 01/15/2015 | | | 221,000 | | | | 237,009 | |
Carolina Power & Light Co. | | | | | | | | |
5.125% 09/15/2013 | | | 133,000 | | | | 135,347 | |
CenterPoint Energy Resources Corp. | | | | | | | | |
4.500% 01/15/2021 | | | 123,000 | | | | 142,293 | |
Coca-Cola HBC Finance BV | | | | | | | | |
5.500% 09/17/2015 | | | 221,000 | | | | 240,854 | |
Comcast Cable Communications Holdings, Inc. | | | | | | | | |
9.455% 11/15/2022 | | | 162,000 | | | | 250,630 | |
Commonwealth Edison Co. | | | | | | | | |
5.800% 03/15/2018 | | | 109,000 | | | | 131,479 | |
The Connecticut Light & Power Co., Series 09-A | | | | | | | | |
5.500% 02/01/2019 | | | 114,000 | | | | 138,159 | |
Consolidated Edison Co. of New York, Inc. | | | | | | | | |
7.125% 12/01/2018 | | | 382,000 | | | | 496,534 | |
Corporacion Andina de Fomento | | | | | | | | |
5.750% 01/12/2017 | | | 1,000 | | | | 1,148 | |
8.125% 06/04/2019 | | | 182,000 | | | | 237,547 | |
CSX Corp. | | | | | | | | |
7.375% 02/01/2019 | | | 105,000 | | | | 134,552 | |
The Dayton Power & Light Co. | | | | | | | | |
5.125% 10/01/2013 | | | 154,000 | | | | 156,895 | |
Diageo Capital PLC | | | | | | | | |
5.750% 10/23/2017 | | | 415,000 | | | | 496,559 | |
Dominion Resources, Inc. | | | | | | | | |
2.250% 09/01/2015 | | | 765,000 | | | | 791,679 | |
Emerson Electric Co. | | | | | | | | |
5.000% 04/15/2019 | | | 130,000 | | | | 154,738 | |
| | |
| 10 | | 1-855-DGI-FUND (344-3863) | www.DGIfund.com |
| | |
| The Disciplined Growth Investors Fund | | Portfolio of Investments |
| | April 30, 2013 |
| | | | | | | | |
| | | Principal
Amount | | | Value
(Note 2) | |
| |
CORPORATE BONDS (continued) | | | | | | | | |
Energy Transfer Partners LP | | | | | | | | |
9.700% 03/15/2019 | | $ | 100,000 | | | $ | 136,624 | |
Enterprise Products Operating LLC | | | | | | | | |
3.700% 06/01/2015 | | | 213,000 | | | | 225,539 | |
Fluor Corp. | | | | | | | | |
3.375% 09/15/2021 | | | 131,000 | | | | 140,648 | |
General Electric Capital Corp. | | | | | | | | |
5.875% 01/14/2038 | | | 228,000 | | | | 277,581 | |
Hewlett-Packard Co. | | | | | | | | |
3.750% 12/01/2020 | | | 151,000 | | | | 150,918 | |
International Business Machines Corp. | | | | | | | | |
7.625% 10/15/2018 | | | 371,000 | | | | 491,751 | |
Johnson & Johnson | | | | | | | | |
5.850% 07/15/2038 | | | 184,000 | | | | 251,478 | |
Joy Global, Inc. | | | | | | | | |
6.000% 11/15/2016 | | | 429,000 | | | | 493,383 | |
JPMorgan Chase & Co. | | | | | | | | |
3.700% 01/20/2015 | | | 420,000 | | | | 440,865 | |
Lockheed Martin Corp. | | | | | | | | |
4.250% 11/15/2019 | | | 216,000 | | | | 243,214 | |
Lubrizol Corp. | | | | | | | | |
8.875% 02/01/2019 | | | 159,000 | | | | 220,850 | |
McDonald’s Corp. | | | | | | | | |
6.300% 03/01/2038 | | | 171,000 | | | | 242,126 | |
Merck & Co., Inc. | | | | | | | | |
5.950% 12/01/2028 | | | 106,000 | | | | 140,027 | |
Mondelez International, Inc. | | | | | | | | |
5.375% 02/10/2020 | | | 221,000 | | | | 264,777 | |
National Rural Utilities Cooperative Finance Corp. | | | | | | | | |
10.375% 11/01/2018 | | | 340,000 | | | | 495,189 | |
Nevada Power Co. | | | | | | | | |
7.125% 03/15/2019 | | | 170,000 | | | | 219,621 | |
News America, Inc. | | | | | | | | |
6.900% 03/01/2019 | | | 115,000 | | | | 145,479 | |
Nisource Finance Corp. | | | | | | | | |
6.800% 01/15/2019 | | | 115,000 | | | | 141,794 | |
Noble Energy, Inc. | | | | | | | | |
8.250% 03/01/2019 | | | 186,000 | | | | 244,827 | |
Northeast Utilities | | | | | | | | |
5.650% 06/01/2013 | | | 5,000 | | | | 5,020 | |
Ohio Power Co., Series M | | | | | | | | |
5.375% 10/01/2021 | | | 193,000 | | | | 235,375 | |
Oncor Electric Delivery Co. LLC | | | | | | | | |
7.000% 09/01/2022 | | | 182,000 | | | | 243,863 | |
| | |
| Annual Report | April 30, 2013 | | 11 |
| | |
| The Disciplined Growth Investors Fund | | Portfolio of Investments |
| | April 30, 2013 |
| | | | | | | | |
| | | Principal
Amount | | | Value (Note
2) | |
| |
CORPORATE BONDS (continued) | | | | | | | | |
ONEOK Partners LP | | | | | | | | |
6.150% 10/01/2016 | | $ | 343,000 | | | $ | 396,421 | |
The Pepsi Bottling Group, Inc., Series B | | | | | | | | |
7.000% 03/01/2029 | | | 157,000 | | | | 220,758 | |
Plains All American Pipeline LP / Plains All American Finance Corp. | | | | | | | | |
3.950% 09/15/2015 | | | 19,000 | | | | 20,430 | |
8.750% 05/01/2019 | | | 155,000 | | | | 211,193 | |
PSEG Power LLC | | | | | | | | |
5.320% 09/15/2016 | | | 440,000 | | | | 497,560 | |
Republic Services, Inc. | | | | | | | | |
5.500% 09/15/2019 | | | 119,000 | | | | 141,422 | |
Rio Tinto Finance USA Ltd. | | | | | | | | |
9.000% 05/01/2019 | | | 166,000 | | | | 229,961 | |
Royal Bank of Scotland Group PLC, Series 1 | | | | | | | | |
9.118% Perpetual Maturity (b) | | | 3,000 | | | | 3,054 | |
Safeway, Inc. | | | | | | | | |
5.625% 08/15/2014 | | | 31,000 | | | | 32,767 | |
Sempra Energy | | | | | | | | |
6.500% 06/01/2016 | | | 428,000 | | | | 497,990 | |
The Southern Co., Series A | | | | | | | | |
2.375% 09/15/2015 | | | 911,000 | | | | 946,619 | |
TCI Communications, Inc. | | | | | | | | |
8.750% 08/01/2015 | | | 691,000 | | | | 812,668 | |
Texas Gas Transmission LLC | | | | | | | | |
4.600% 06/01/2015 | | | 183,000 | | | | 195,979 | |
TransCanada PipeLines Ltd. | | | | | | | | |
7.250% 08/15/2038 | | | 180,000 | | | | 257,108 | |
Unilever Capital Corp. | | | | | | | | |
4.800% 02/15/2019 | | | 118,000 | | | | 139,469 | |
United Parcel Service, Inc. | | | | | | | | |
6.200% 01/15/2038 | | | 173,000 | | | | 240,205 | |
United Technologies Corp. | | | | | | | | |
5.375% 12/15/2017 | | | 177,000 | | | | 210,256 | |
US Bank | | | | | | | | |
3.778% 04/29/2020 (c) | | | 226,000 | | | | 238,825 | |
4.800% 04/15/2015 | | | 70,000 | | | | 75,611 | |
Viacom, Inc. | | | | | | | | |
4.250% 09/15/2015 | | | 464,000 | | | | 499,904 | |
Wal-Mart Stores, Inc. | | | | | | | | |
6.200% 04/15/2038 | | | 181,000 | | | | 247,410 | |
| | |
| 12 | | 1-855-DGI-FUND (344-3863) | www.DGIfund.com |
| | |
| The Disciplined Growth Investors Fund | | Portfolio of Investments |
| | April 30, 2013 |
| | | | | | | | | | |
| | | | | Principal
Amount | | | Value (Note 2) | |
| |
CORPORATE BONDS (continued) | | | | | | | | | | |
Waste Management, Inc. | | | | | | | | | | |
7.375% 03/11/2019 | | | | $ | 102,000 | | | $ | 129,109 | |
| | | | | | | | | | |
| | | |
TOTAL CORPORATE BONDS (Cost $17,257,078) | | | | | | | | | 17,690,468 | |
| | | | | | | | | | |
| | | |
FOREIGN GOVERNMENT BONDS (1.23%) | | | | | | | | | | |
Israel Government AID Bonds | | | | | | | | | | |
5.500% 12/04/2023 | | | | | 184,000 | | | | 242,528 | |
Israel Government AID Bonds, Zero Coupon, Series 8-Z | | | | | | | | | | |
02/15/2020 | | | | | 66,000 | | | | 60,410 | |
Province of British Columbia | | | | | | | | | | |
4.300% 05/30/2013 | | | | | 43,000 | | | | 43,133 | |
Province of Ontario Canada | | | | | | | | | | |
0.950% 05/26/2015 | | | | | 228,000 | | | | 230,501 | |
Province of Quebec Canada, Series NN | | | | | | | | | | |
7.125% 02/09/2024 | | | | | 176,000 | | | | 246,965 | |
| | | | | | | | | | |
| | | |
TOTAL FOREIGN GOVERNMENT BONDS (Cost $799,381) | | | | | | | | | 823,537 | |
| | | | | | | | | | |
| | | |
GOVERNMENT & AGENCY OBLIGATIONS (0.32%) | | | | | | | | | | |
Tennessee Valley Authority, Series B | | | | | | | | | | |
4.700% 07/15/2033 | | | | | 55,000 | | | | 65,661 | |
U.S. Treasury Bonds | | | | | | | | | | |
4.250% 08/15/2013 | | | | | 3,000 | | | | 3,037 | |
4.750% 05/15/2014 | | | | | 65,000 | | | | 68,108 | |
6.500% 11/15/2026 | | | | | 28,000 | | | | 42,617 | |
U.S. Treasury Notes | | | | | | | | | | |
4.500% 11/15/2015 | | | | | 16,000 | | | | 17,711 | |
4.500% 02/15/2016 | | | | | 13,000 | | | | 14,524 | |
| | | | | | | | | | |
| | | |
TOTAL GOVERNMENT & AGENCY OBLIGATIONS (Cost $208,188) | | | | | | | | | 211,658 | |
| | | | | | | | | | |
| | | |
| | | 7-Day
Yield | | Shares | | | Value (Note 2) | |
| |
SHORT TERM INVESTMENTS (2.16%) | | | | | | | | | | |
Fidelity Institutional Money Market Government Portfolio - Class I | | 0.01% | | | 1,448,406 | | | | 1,448,406 | |
| | | | | | | | | | |
| | | |
TOTAL SHORT TERM INVESTMENTS (Cost $1,448,406) | | | | | | | | | 1,448,406 | |
| | | | | | | | | | |
| | |
| Annual Report | April 30, 2013 | | 13 |
| | |
| The Disciplined Growth Investors Fund | | Portfolio of Investments |
| | April 30, 2013 |
| | | | |
| | | Value (Note 2) | |
TOTAL INVESTMENTS (99.38%) (Cost $59,091,843) | | $ | 66,551,784 | |
| |
Other Assets In Excess Of Liabilities (0.62%) | | | 415,602 | |
| | | | |
| |
NET ASSETS (100.00%) | | $ | 66,967,386 | |
| | | | |
| (a) | Non-Income Producing Security. |
| (b) | This security has no contractual maturity date, is not redeemable and contractually pays an indefinite stream of interest. |
| (c) | The coupon rate shown on floating or adjustable rate securities represents the rate at period end. |
Common Abbreviations:
ADR - American Depository Receipt.
AID - Agency for International Development.
BV - Besloten Vennootschap.
LLC - Limited Liability Company.
LP - Limited Partnership.
Ltd. - Limited.
PLC - Public Limited Company.
Holdings are subject to change.
For Fund compliance purposes, the Fund’s industry classifications refer to any one or more of the industry sub-classifications used by one or more widely recognized market indexes or ratings group indexes, and/or as defined by Fund management. This definition may not apply for purposes of this report, which may combine industry sub-classifications for reporting ease. Industries are shown as a percent of net assets.
See Notes to Financial Statements.
| | |
| 14 | | 1-855-DGI-FUND (344-3863) | www.DGIfund.com |
| | |
| The Disciplined Growth Investors Fund | | Statement of Assets and Liabilities |
| | April 30, 2013 |
| | | | |
| |
ASSETS | | | | |
Investments, at value | | $ | 66,551,784 | |
Cash | | | 200,000 | |
Receivable for shares sold | | | 20,000 | |
Dividends and interest receivable | | | 237,619 | |
| |
Total assets | | | 67,009,403 | |
| |
| |
LIABILITIES | | | | |
Payable to adviser | | | 42,017 | |
| |
Total liabilities | | | 42,017 | |
| |
NET ASSETS | | $ | 66,967,386 | |
| |
| |
NET ASSETS CONSIST OF | | | | |
Paid-in capital (Note 5) | | $ | 59,284,029 | |
Accumulated net investment income | | | 18,206 | |
Accumulated net realized gain on investments | | | 205,210 | |
Net unrealized appreciation on investments | | | 7,459,941 | |
| |
NET ASSETS | | $ | 66,967,386 | |
| |
| |
INVESTMENTS, AT COST | | $ | 59,091,843 | |
| |
PRICING OF SHARES | | | | |
Net Asset Value, offering and redemption price per share | | $ | 13.17 | |
Shares of beneficial interest outstanding | | | 5,084,771 | |
See Notes to Financial Statements.
| | |
| Annual Report | April 30, 2013 | | 15 |
| | |
| The Disciplined Growth Investors Fund | | Statement of Operations |
| | |
| | | | |
| | | For the Year Ended April 30, 2013 | |
| |
INVESTMENT INCOME | | | | |
Dividends | | $ | 462,777 | |
Foreign taxes withheld | | | (539) | |
Interest | | | 312,002 | |
| |
Total investment income | | | 774,240 | |
| |
| |
EXPENSES | | | | |
Investment advisory fees (Note 6) | | | 359,232 | |
| |
Total expenses | | | 359,232 | |
| |
NET INVESTMENT INCOME | | | 415,008 | |
| |
| |
REALIZED AND UNREALIZED GAIN ON INVESTMENTS | | | | |
Net realized gain on investments | | | 261,618 | |
Net change in unrealized appreciation on investments | | | 4,182,524 | |
| |
NET REALIZED AND UNREALIZED GAIN ON INVESTMENTS | | | 4,444,142 | |
| |
NET INCREASE IN NET ASSETS RESULTING FROM OPERATIONS | | $ | 4,859,150 | |
| |
See Notes to Financial Statements.
| | |
| 16 | | 1-855-DGI-FUND (344-3863) | www.DGIfund.com |
| | |
| The Disciplined Growth Investors Fund | | Statements of Changes in Net Assets |
| | |
| | | | | | | | |
| | | For the Year Ended April 30, 2013 | | | For the Period August 12, 2011 (Inception) to April 30, 2012 | |
| |
OPERATIONS | | | | | | | | |
Net investment income | | $ | 415,008 | | | $ | 74,458 | |
Net realized gain on investments | | | 261,618 | | | | 91,019 | |
Net change in unrealized appreciation on investments | | | 4,182,524 | | | | 3,277,417 | |
| |
Net increase in net assets resulting from operations | | | 4,859,150 | | | | 3,442,894 | |
| |
| | |
DISTRIBUTIONS | | | | | | | | |
From net investment income | | | (383,921) | | | | (58,339) | |
From net realized gains on investments | | | (176,427) | | | | – | |
| |
Net decrease in net assets from distributions | | | (560,348) | | | | (58,339) | |
| |
| | |
CAPITAL SHARE TRANSACTIONS (Note 5) | | | | | | | | |
Proceeds from sales of shares | | | 29,863,013 | | | | 32,628,566 | |
Issued to shareholders in reinvestment of distributions | | | 560,205 | | | | 58,309 | |
Cost of shares redeemed, net of redemption fees | | | (3,432,700) | | | | (393,364) | |
| |
Net increase from capital share transactions | | | 26,990,518 | | | | 32,293,511 | |
| |
| | |
Net increase in net assets | | | 31,289,320 | | | | 35,678,066 | |
| |
| | |
NET ASSETS | | | | | | | | |
Beginning of period | | | 35,678,066 | | | | – | |
| |
End of period* | | $ | 66,967,386 | | | $ | 35,678,066 | |
| |
| | |
*Including accumulated net investment income of: | | $ | 18,206 | | | $ | 16,119 | |
| | |
OTHER INFORMATION | | | | | | | | |
Share Transactions | | | | | | | | |
Issued | | | 2,376,536 | | | | 2,969,119 | |
Issued in lieu of cash distributions | | | 45,306 | | | | 5,081 | |
Redeemed | | | (277,179) | | | | (34,092) | |
| |
Net increase in share transactions | | | 2,144,663 | | | | 2,940,108 | |
| |
See Notes to Financial Statements.
| | |
| Annual Report | April 30, 2013 | | 17 |
| | |
| The Disciplined Growth Investors Fund | | Financial Highlights |
| For a share outstanding during the periods presented | | |
| | | | | | | | |
| | | For the Year Ended April 30, 2013 | | | For the Period August 12, 2011 (Inception) to April 30, 2012 | |
| |
NET ASSET VALUE, BEGINNING OF PERIOD | | | $ 12.13 | | | | $ 10.00 | |
| | |
INCOME FROM OPERATIONS | | | | | | | | |
Net investment income(a) | | | 0.11 | | | | 0.05 | |
Net realized and unrealized gain on investments | | | 1.09 | | | | 2.11 | |
| |
Total from investment operations | | | 1.20 | | | | 2.16 | |
| |
| | |
DISTRIBUTIONS | | | | | | | | |
From net investment income | | | (0.11) | | | | (0.03) | |
From net realized gain on investments | | | (0.05) | | | | – | |
| |
Total distributions | | | (0.16) | | | | (0.03) | |
| |
| | |
REDEMPTION FEES ADDED TO PAID-IN CAPITAL | | | – | | | | – | |
| |
| | |
INCREASE IN NET ASSET VALUE | | | 1.04 | | | | 2.13 | |
| |
NET ASSET VALUE, END OF PERIOD | | | $ 13.17 | | | | $ 12.13 | |
| |
| | |
TOTAL RETURN | | | 9.93% | | | | 21.65% | (b) |
| | |
RATIOS AND SUPPLEMENTAL DATA | | | | | | | | |
Net assets, end of period (000’s) | | | $ 66,967 | | | | $ 35,678 | |
| | |
RATIOS TO AVERAGE NET ASSETS | | | | | | | | |
Expenses | | | 0.78% | | | | 0.77% | (c) |
Net investment income | | | 0.90% | | | | 0.60% | (c) |
| | |
PORTFOLIO TURNOVER RATE | | | 10% | | | | 6% | (b) |
| (a) | Per share numbers have been calculated using the average shares method. |
See Notes to Financial Statements.
| | |
| 18 | | 1-855-DGI-FUND (344-3863) | www.DGIfund.com |
| | |
| The Disciplined Growth Investors Fund | | Notes to Financial Statements |
| | April 30, 2013 |
1. ORGANIZATION
Financial Investors Trust (the “Trust”), a Delaware statutory trust, is an open-end management investment company registered under the Investment Company Act of 1940, as amended (“1940 Act”). As of April 30, 2013, the Trust had 26 registered funds. This annual report describes The Disciplined Growth Investors Fund (the “Fund”). The Fund seeks long-term capital growth and as a secondary objective, modest income with reasonable risk. The Fund pursues its investment objective by normally investing approximately 60% of its assets in equity securities and approximately 40% in fixed-income securities and cash equivalent.
2. SIGNIFICANT ACCOUNTING POLICIES
The accompanying financial statements were prepared in accordance with accounting principles generally accepted in the United States of America (“U.S. GAAP”). The preparation of financial statements in conformity with U.S. GAAP requires management to make certain estimates and assumptions that affect the reported amounts of assets and liabilities and disclosures of contingent assets and liabilities at the date of the financial statements and the reported amounts of revenue and expenses during the period. Actual results could differ from those estimates. The following is a summary of significant accounting policies consistently followed by the Fund in preparation of their financial statements.
Investment Valuation: The Fund generally values its securities based on market prices determined at the close of regular trading on the New York Stock Exchange (“NYSE”), normally 4:00 p.m. Eastern Time, on each day the NYSE is open for trading.
For equity securities and mutual funds that are traded on an exchange, the market price is usually the closing sale or official closing price on that exchange. In the case of equity securities not traded on an exchange, or if such closing prices are not otherwise available, the securities are valued at the mean of the most recent bid and ask prices on such day. Redeemable securities issued by open-end registered investment companies are valued at the investment company’s applicable net asset value, with the exception of exchange-traded open-end investment companies, which are priced as equity securities.
The market price for debt obligations is generally the price supplied by an independent third-party pricing service approved by the Board of Trustees (the “Board”), which may use a matrix, formula or other objective method that takes into consideration quotations from dealers, market transactions in comparable investments, market indices and yield curves. If vendors are unable to supply a price, or if the price supplied is deemed to be unreliable, the market price may be determined using quotations received from one or more broker–dealers that make a market in the security. Short–term debt obligations that will mature in 60 days or less are valued at amortized cost, unless it is determined that using this method would not reflect an investment’s fair value.
When such prices or quotations are not available, or when the Fair Value Committee appointed by the Board believes that they are unreliable, securities may be priced using fair value procedures approved by the Board.
Fair Value Measurements: The Fund discloses the classification of its fair value measurements following a three-tier hierarchy based on the inputs used to measure fair value. Inputs refer broadly to the assumptions that market participants would use in pricing the asset or liability,
| | |
| Annual Report | April 30, 2013 | | 19 |
| | |
| The Disciplined Growth Investors Fund | | Notes to Financial Statements |
| | April 30, 2013 |
including assumptions about risk. Inputs may be observable or unobservable. Observable inputs reflect the assumptions market participants would use in pricing the asset or liability that are developed based on market data obtained from sources independent of the reporting entity. Unobservable inputs reflect the reporting entity’s own assumptions about the assumptions market participants would use in pricing the asset or liability that are developed based on the best information available.
Various inputs are used in determining the value of the Fund’s investments as of the end of the reporting period. When inputs used fall into different levels of the fair value hierarchy, the level in the hierarchy within which the fair value measurement falls is determined based on the lowest level input that is significant to the fair value measurement in its entirety. The designated input levels are not necessarily an indication of the risk or liquidity associated with these investments. These inputs are categorized in the following hierarchy under applicable financial accounting standards:
| | | | |
| Level 1 | | – | | Unadjusted quoted prices in active markets for identical investments, unrestricted assets or liabilities that the Fund has the ability to access at the measurement date; |
| | |
| Level 2 | | – | | Quoted prices which are not active, quoted prices for similar assets or liabilities in active markets or inputs other than quoted prices that are observable (either directly or indirectly) for substantially the full term of the asset or liability; and |
| | |
| Level 3 | | – | | Significant unobservable prices or inputs (including the Fund’s own assumptions in determining the fair value of investments) where there is little or no market activity for the asset or liability at the measurement date. |
The following is a summary of each input used to value the Fund as of April 30, 2013:
| | | | | | | | | | | | | | | | |
Investments in Securities at Value | | Level 1 - Unadjusted Quoted Prices | | | Level 2 - Other Significant Observable Inputs | | | Level 3 - Significant Unobservable Inputs | | | Total | |
| |
Common Stocks(a) | | $ | 46,177,845 | | | $ | – | | | $ | – | | | $ | 46,177,845 | |
Asset/Mortgage Backed Securities | | | – | | | | 199,870 | | | | – | | | | 199,870 | |
Corporate Bonds | | | – | | | | 17,690,468 | | | | – | | | | 17,690,468 | |
Foreign Government Bonds | | | – | | | | 823,537 | | | | – | | | | 823,537 | |
Government & Agency Obligations | | | – | | | | 211,658 | | | | – | | | | 211,658 | |
Short Term Investments | | | 1,448,406 | | | | – | | | | – | | | | 1,448,406 | |
| |
TOTAL | | $ | 47,626,251 | | | $ | 18,925,533 | | | $ | – | | | $ | 66,551,784 | |
| |
| (a) | For detailed descriptions of the underlying industries, see the accompanying Portfolio of Investments. |
The Fund recognizes transfers between levels as of the end of the period. For the year ended April 30, 2013, the Fund did not have any transfers between Level 1 and Level 2 securities. For the year ended April 30, 2013, the Fund did not have any securities that used unobservable inputs (Level 3) in determining fair value.
| | |
| 20 | | 1-855-DGI-FUND (344-3863) | www.DGIfund.com |
| | |
| The Disciplined Growth Investors Fund | | Notes to Financial Statements |
| | April 30, 2013 |
Investment Transactions and Investment Income: Investment transactions are accounted for on the date the investments are purchased or sold (trade date). Realized gains and losses from investment transactions are reported on an identified cost basis. Interest income, which includes accretion of discounts, is accrued and recorded as earned. Dividend income is recognized on the ex-dividend date or for certain foreign securities, as soon as information is available to the Fund.
Trust Expenses: Some expenses of the Trust can be directly attributed to the Fund. Expenses which cannot be directly attributed to the Fund are apportioned among all funds in the Trust based on average net assets of each fund.
Fund Expenses: Expenses that are specific to the Fund are charged directly to the Fund.
Federal Income Taxes: The Fund complies with the requirements under Subchapter M of the Internal Revenue Code of 1986, as amended, applicable to regulated investment companies and intends to distribute substantially all of their net taxable income and net capital gains, if any, each year so that it will not be subject to excise tax on undistributed income and gains. The Fund is not subject to income taxes to the extent such distributions are made.
As of and during the year ended April 30, 2013, the Fund did not have a liability for any unrecognized tax benefits. The Fund files U.S. federal, state, and local tax returns as required. The Fund’s tax returns are subject to examination by the relevant tax authorities until expiration of the applicable statute of limitations, which is generally three years after the filing of the tax return for federal purposes and four years for most state returns. Tax returns for open years have incorporated no uncertain tax positions that require a provision for income taxes.
Distributions to Shareholders: The Fund normally pays dividends, if any, quarterly and distributes capital gains, if any, on an annual basis. Income dividend distributions are derived from interest and other income the Fund receives from its investments, including short term capital gains. Long term capital gain distributions are derived from gains realized when the Fund sells a security it has owned for more than a year. The Fund may make additional distributions and dividends at other times if the portfolio manager believes doing so may be necessary for the Fund to avoid or reduce taxes.
3. TAX BASIS INFORMATION
Reclassifications: Reclassifications are made to the Fund’s capital accounts for permanent tax differences to reflect income and gains available for distribution (or available capital loss carryforwards) under income tax regulations. If, for any calendar year, the total distributions made under the distribution policy exceed the Fund’s net investment income and net realized capital gains, the excess will generally be treated as a non-taxable return of capital, reducing the shareholder’s adjusted basis in his or her shares. These reclassifications were as follows:
| | | | | | | | | | | | |
| Fund | | Paid-in Capital | | | Accumulated Net
Investment Loss | | | Accumulated Net
Realized Gain on
Investments | |
| |
The Disciplined Growth Investors Fund | | $ | – | | | $ | (29,000) | | | $ | 29,000 | |
These differences were primarily attributed to book/tax distribution differences.
| | |
| Annual Report | April 30, 2013 | | 21 |
| | |
| The Disciplined Growth Investors Fund | | Notes to Financial Statements |
| | April 30, 2013 |
Tax Basis of Investments: As of April 30, 2013, the aggregate cost of investments, gross unrealized appreciation/ (depreciation) and net unrealized appreciation for Federal tax purposes was as follows:
| | | | |
| | | Disciplined Growth
Investors Fund | |
| |
Gross appreciation
(excess of value over tax cost) | | $ | 8,535,269 | |
Gross depreciation
(excess of tax cost over value) | | | (1,075,328) | |
| |
Net unrealized appreciation | | $ | 7,459,941 | |
| |
Cost of investments for income tax purposes | | $ | 59,091,843 | |
| |
|
| Components of Earnings: As of April 30, 2013, components of distributable earnings were as follows: | |
| |
Undistributed ordinary income | | $ | 18,206 | |
Accumulated capital gains | | | 205,210 | |
Net unrealized appreciation on investments | | | 7,459,941 | |
| |
Total | | $ | 7,683,357 | |
| |
Capital Losses: As of April 30, 2013, the Fund has no accumulated capital loss carryforwards.
Tax Basis of Distributions to Shareholders: The character of distributions made during the year from net investment income or net realized gains may differ from its ultimate characterization for federal income tax purposes. Also, due to the timing of dividend distributions, the fiscal year in which amounts are distributed may differ from the fiscal year in which the income or realized gain was recorded by the Fund.
The tax character of distributions paid during the year ended April 30, 2013, were as follows:
| | | | | | | | |
| | | Ordinary Income | | | Long-Term Capital
Gain | |
| |
The Disciplined Growth Investors Fund | | $ | 560,348 | | | $ | – | |
|
The tax character of distributions paid during the period ended April 30, 2012, were as follows: | |
| | |
| | | Ordinary Income | | | Long-Term Capital
Gain | |
| |
The Disciplined Growth Investors Fund | | $ | 58,339 | | | $ | – | |
4. SECURITIES TRANSACTIONS
During the year ended April 30, 2013, equity holdings, asset/mortgage backed securities, fixed income and rights were transferred in-kind. The intent of the transfers was to save on equity transaction costs both for the new shareholders at the institution they transferred from and for the Fund on the addition of assets. The assets of five separate accounts were transferred-in-kind into the Fund in the amount of $14,165,128.
| | |
| 22 | | 1-855-DGI-FUND (344-3863) | www.DGIfund.com |
| | |
| The Disciplined Growth Investors Fund | | Notes to Financial Statements |
| | April 30, 2013 |
The cost of purchases and proceeds from sales of securities (excluding short-term securities, transfers-in-kind, and U.S. Government Obligations) during the year ended April 30, 2013, were as follows:
| | | | | | | | |
| Fund | | Purchases of
Securities | | | Proceeds From Sales of
Securities | |
| |
The Disciplined Growth Investors Fund | | $ | 17,945,934 | | | $ | 4,279,241 | |
|
| Investment transactions in U.S. government and agency securities (excluding transfers-in-kind) for the year ended April 30, 2013 were as follows: | |
| | |
| Fund | | Purchases of
Securities | | | Proceeds From Sales of Securities | |
| |
The Disciplined Growth Investors Fund | | $ | – | | | $ | 40,000 | |
5. SHARES OF BENEFICIAL INTEREST
The capitalization of the Trust consists of an unlimited number of shares of beneficial interest with no par value per share. Holders of the shares of the Fund of the Trust have one vote for each share held and a proportionate fraction of a vote for each fractional share. All shares issued and outstanding are fully paid and are non-assessable, transferable and redeemable at the option of the shareholder. Shares have no pre-emptive rights.
Shares redeemed within 90 days of purchase may incur a 2% short-term redemption fee deducted from the redemption amount. For the year ended April 30, 2013 and the period ended April 30, 2012, the Fund did not receive any redemption fees.
6. MANAGEMENT AND RELATED-PARTY TRANSACTIONS
Disciplined Growth Investors, Inc. (the “Adviser” or “DGI”), subject to the authority of the Board, is responsible for the overall management and administration of the Fund’s business affairs. DGI manages the investments of the Fund in accordance with the Fund’s investment objective, policies and limitations and investment guidelines established jointly by the Adviser and the Trustees. Pursuant to the Advisory Agreement, the Fund pays the Adviser a unitary fee for the services and facilities it provides payable on a monthly basis at the annual rate of 0.78% of the Fund’s average daily net assets.
Out of the unitary management fee, the Adviser pays substantially all expenses of the Fund, including the cost of transfer agency, custody, fund administration, legal, audit and other services, except for interest expenses, distribution fees, brokerage expenses, taxes and extraordinary expenses not incurred in the ordinary course of the Fund’s business. Also included are Trustee fees which were $3,291 for the year ended April 30, 2013.
Fund Accounting Fees and Expenses
ALPS Fund Services, Inc. (“ALPS” and the “Administrator”) (an affiliate of ALPS Distributors, Inc.) serves as administrator to the Fund, and has agreed to pay expenses incurred in connection with its administrative activities. Pursuant to the Administration, Bookkeeping and Pricing Services Agreement (the “Agreement”), ALPS will provide operational services to the Fund including, but not limited to fund accounting and fund administration and generally assist in the Fund’s operations.
| | |
| Annual Report | April 30, 2013 | | 23 |
| | |
| The Disciplined Growth Investors Fund | | Notes to Financial Statements |
| | April 30, 2013 |
Annual Administrative Fee, billed monthly, in the amount of the greater of (a) $150,000 annual minimum or (b) following basis point fee schedule:
| | |
| Average Total Net Assets | | Contractual Fee |
|
Between $0-$500M | | 0.05% |
$500M-$1B | | 0.03% |
Above $1B | | 0.02% |
The Administrator is also reimbursed by the Fund for certain out-of-pocket expenses. The administrative fee and out-of-pocket expenses are included in the unitary fee paid to the Adviser.
Transfer Agent
ALPS serves as transfer, dividend paying and shareholder servicing agent for the Fund under a Transfer Agency and Services Agreement with the Trust. Under this Agreement, ALPS is paid an annual base fee of $25,000 plus fees for open accounts and is reimbursed for certain out-of-pocket expenses. The fee is included in the unitary fee paid to the Adviser.
Compliance Services
ALPS provides services that assist the Trust’s Chief Compliance Officer in monitoring and testing the policies and procedures of the Trust in conjunction with requirements under Rule 38a-1 under the 1940 Act under the Chief Compliance Officer Services Agreement with the Trust. Under this Agreement, ALPS is paid an annual base fee of $30,000 and is reimbursed for certain out-of-pocket expenses. The fee is included in the unitary fee paid to the Adviser.
Principal Financial Officer
ALPS receives an annual fee of $10,000 for providing Principal Financial Officer (“PFO”) services to the Fund. The fee is included in the unitary fee paid to the Adviser.
Distributor: ALPS Distributors, Inc. (“ADI” or the “Distributor”) (an affiliate of ALPS) acts as the distributor of the Fund’s shares pursuant to a Distribution Agreement with the Trust. Shares are sold on a continuous basis by ADI as agent for the Fund, and ADI has agreed to use its best efforts to solicit orders for the sale of the Fund’s shares, although it is not obliged to sell any particular amount of shares. ADI is not entitled to any compensation for its services as Distributor. ADI is registered as a broker-dealer with the Securities and Exchange Commission.
7. INDEMNIFICATIONS
Under the Trust’s organizational documents, its officers and Trustees are indemnified against certain liability arising out of the performance of their duties to the Trust. Additionally, in the normal course of business, the Trust enters into contracts with service providers that may contain general indemnification clauses, which may permit indemnification to the extent permissible under applicable law. The Trust’s maximum exposure under these arrangements is unknown, as this would involve future claims that may be made against the Trust that have not yet occurred.
| | |
| 24 | | 1-855-DGI-FUND (344-3863) | www.DGIfund.com |
| | |
| The Disciplined Growth Investors Fund | | Report of Independent Registered Public Accounting Firm |
To the Shareholders and Board of Trustees of Financial Investors Trust:
We have audited the accompanying statement of assets and liabilities, including the portfolio of investments, of The Disciplined Growth Investors Fund (the “Fund”), one of the funds constituting Financial Investors Trust, as of April 30, 2013, the related statement of operations for the year then ended, and the statements of changes in net assets and the financial highlights for the year then ended and for the period from August 12, 2011 (inception) to April 30, 2012. These financial statements and financial highlights are the responsibility of the Fund’s management. Our responsibility is to express an opinion on these financial statements and financial highlights based on our audit.
We conducted our audit in accordance with the standards of the Public Company Accounting Oversight Board (United States). Those standards require that we plan and perform the audit to obtain reasonable assurance about whether the financial statements and financial highlights are free of material misstatement. The Fund is not required to have, nor were we engaged to perform, an audit of its internal control over financial reporting. Our audit included consideration of internal control over financial reporting as a basis for designing audit procedures that are appropriate in the circumstances, but not for the purpose of expressing an opinion on the effectiveness of the Fund’s internal control over financial reporting. Accordingly, we express no such opinion. An audit also includes examining, on a test basis, evidence supporting the amounts and disclosures in the financial statements, assessing the accounting principles used and significant estimates made by management, as well as evaluating the overall financial statement presentation. Our procedures included confirmation of securities owned as of April 30, 2013, by correspondence with the custodian and brokers. We believe that our audit provides a reasonable basis for our opinion.
In our opinion, the financial statements and financial highlights referred to above present fairly, in all material respects, the financial position of The Disciplined Growth Investors Fund of Financial Investors Trust, as of April 30, 2013, the results of its operations for the year then ended, and the changes in its net assets and the financial highlights for the year then ended and for the period from August 12, 2011 (inception) to April 30, 2012, in conformity with accounting principles generally accepted in the United States of America.
DELOITTE & TOUCHE LLP
Denver, Colorado
June 27, 2013
| | |
| Annual Report | April 30, 2013 | | 25 |
| | |
| The Disciplined Growth Investors Fund | | Additional Information |
| | April 30, 2013 (Unaudited) |
1. FUND HOLDINGS
The Fund files its complete schedule of portfolio holdings with the Securities and Exchange Commission (the “SEC”) for the first and third quarters of each fiscal year on Form N-Q within 60 days after the end of the period. Copies of the Fund’s Form N-Q are available without charge on the SEC website at http://www.sec.gov. You may also review and copy the Form N-Q at the SEC’s Public Reference Room in Washington, DC. For more information about the operation of the Public Reference Room, please call the SEC at 1-800-SEC-0330.
2. FUND PROXY VOTING POLICIES, PROCEDURES AND SUMMARIES
The Fund’s policies and procedures used in determining how to vote proxies and information regarding how the Fund voted proxies relating to portfolio securities during the most recent prior 12-month period ending June 30 are available without charge, (1) upon request, by calling (toll free) 855-DGI-FUND and (2) on the SEC’s website at http://www.sec.gov.
3. TAX DESIGNATIONS
The Fund designates the following for federal income tax purposes for distributions made during the calendar year ended December 31, 2012:
| | | | |
Dividend Received Deduction | | | 52.93 | % |
Qualified Dividend Income | | | 72.66 | % |
In early 2013, if applicable, shareholders of record received this information for the distributions paid to them by the Fund during the calendar year 2012 via Form 1099. The Fund will notify shareholders in early 2014 of amounts paid to them by the Fund, if any, during the calendar year 2013.
| | |
| 26 | | 1-855-DGI-FUND (344-3863) | www.DGIfund.com |
| | |
| The Disciplined Growth Investors Fund | | Trustees and Officers |
| | April 30, 2013 (Unaudited) |
INDEPENDENT TRUSTEES
| | | | | | | | | | |
Name, Address*
& Age | | Position(s) Held with Fund | | Term of Office and Length of Time Served** | | Principal Occupation(s) During Past 5 Years*** | | Number of
Funds in
Fund
Complex
Overseen
by
Trustee**** | | Other Directorships Held by Trustee During Past 5 Years |
|
Mary K. Anstine, age 72 | | Trustee | | Ms. Anstine was elected at a special meeting of shareholders held on March 21,1997 and re-elected at a special meeting of shareholders held on August 7, 2009. | | Ms. Anstine was President/Chief Executive Officer of HealthONE Alliance, Denver, Colorado, and former Executive Vice President of First Interstate Bank of Denver. Ms. Anstine is also Trustee/Director of AV Hunter Trust and Colorado Uplift Board. Ms. Anstine was formerly a Director of the Trust Bank of Colorado (later purchased and now known as Northern Trust Bank), HealthONE and Denver Area Council of the Boy Scouts of America, and a member of the American Bankers Association Trust Executive Committee. | | 26 | | Ms. Anstine is a Trustee of ALPS ETF Trust (13 funds); ALPS Variable Investment Trust (7 funds); Reaves Utility Income Fund (1 fund); and Westcore Trust (12 funds). |
|
John R. Moran, Jr., age 82 | | Trustee | | Mr. Moran was elected at a special meeting of shareholders held on March 21,1997 and re-elected at a special meeting of shareholders held on August 7, 2009. | | Mr. Moran is formerly President and CEO of The Colorado Trust, a private foundation serving the health and hospital community in the state of Colorado. An attorney, Mr. Moran was formerly a partner with the firm of Kutak Rock & Campbell in Denver, Colorado and a member of the Colorado House of Representatives. Currently, Mr. Moran is a member of the Treasurer’s Investment Advisory Committee for the University of Colorado. | | 26 | | None. |
|
| * | All communications to Trustees and Officers may be directed to Financial Investors Trust c/o 1290 Broadway, Suite 1100, Denver, CO 80203. |
| ** | This is the period for which the Trustee/Officer began serving the Trust. Each Trustee/Officer serves an indefinite term, until his successor is elected. |
| *** | Except as otherwise indicated, each individual has held the office shown or other offices in the same company for the last five years. |
| **** | The Fund Complex includes all series of the Trust (currently 26) and any other investment companies for which Disciplined Growth Investors, Inc. provides investment advisory services (currently none). |
| | |
| Annual Report | April 30, 2013 | | 27 |
| | |
| The Disciplined Growth Investors Fund | | Trustees and Officers |
| | April 30, 2013 (Unaudited) |
| |
| INDEPENDENT TRUSTEES (continued) | | |
| | | | | | | | | | |
Name, Address*
& Age | | Position(s) Held with Fund | | Term of Office and Length of Time Served** | | Principal Occupation(s) During Past 5 Years*** | | Number of
Funds in
Fund
Complex
Overseen
by
Trustee**** | | Other Directorships Held by Trustee During Past 5 Years |
|
Jeremy W. Deems, age 36 | | Trustee | | Mr. Deems was appointed as a Trustee at the March 11, 2008 meeting of the Board of Trustees and elected at a special meeting of shareholders held on August 7, 2009. | | Mr. Deems is the Co-Founder, Chief Operations Officer and Chief Financial Officer of Green Alpha Advisors, LLC. Prior to joining Green Alpha Advisors, Mr. Deems was CFO and Treasurer of Forward Management, LLC, an investment management company, ReFlow Management Co., LLC, a liquidity resourcing company, ReFlow Fund, LLC, a private investment fund, and Sutton Place Management, LLC, an administrative services company (from 2004 to June 2007). Prior to this, Mr. Deems served as Controller of Forward Management, LLC, ReFlow Management Co., LLC, ReFlow Fund,LLC and Sutton Place Management, LLC. | | 26 | | Mr. Deems is a Trustee of ALPS ETF Trust (13 funds); ALPS Variable Investment Trust (7 funds) and Reaves Utility Income Fund (1 fund). |
|
Jerry G. Rutledge, age 68 | | Trustee | | Mr. Rutledge was elected at a special meeting of shareholders held on August 7, 2009. | | Mr. Rutledge is the President and owner of Rutledge’s Inc., a retail clothing business. Mr. Rutledge is currently Director of the American National Bank. He was from 1994 to 2007 a Regent of the University of Colorado. | | 26 | | Mr.Rutledge is a Trustee of Clough Global Allocation Fund (1 fund), Clough Global Equity Fund (1 fund) and Clough Global Opportunities Fund (1 fund). |
|
| * | All communications to Trustees and Officers may be directed to Financial Investors Trust c/o 1290 Broadway, Suite 1100, Denver, CO 80203. |
| ** | This is the period for which the Trustee/Officer began serving the Trust. Each Trustee/Officer serves an indefinite term, until his successor is elected. |
| *** | Except as otherwise indicated, each individual has held the office shown or other offices in the same company for the last five years. |
| **** | The Fund Complex includes all series of the Trust (currently 26) and any other investment companies for which Disciplined Growth Investors, Inc. provides investment advisory services (currently none). |
| | |
| 28 | | 1-855-DGI-FUND (344-3863) | www.DGIfund.com |
| | |
| The Disciplined Growth Investors Fund | | Trustees and Officers |
| | April 30, 2013 (Unaudited) |
| |
| INDEPENDENT TRUSTEES (continued) | | |
| | | | | | | | | | |
Name, Address*
& Age | | Position(s) Held with Fund | | Term of Office and Length of Time Served** | | Principal Occupation(s) During Past 5 Years*** | | Number of
Funds in
Fund
Complex
Overseen
by
Trustee**** | | Other Directorships Held by Trustee During Past 5 Years |
|
| Michael “Ross” Shell, age 42 | | Trustee | | Mr. Shell was elected at a special meeting of shareholders held on August 7, 2009. | | Mr. Shell is Founder and CEO* of Red Idea, LLC, a strategic consulting/early stage venture firm (since June 2008). From 1999 to 2009, he was a part-owner and Director of Tesser, Inc., a brand agency. From December 2005 to May 2008, he was Director, Marketing and Investor Relations, of Woodbourne, a REIT/real estate hedge fund and private equity firm. Prior to this, from May 2004 to November 2005, he worked as a business strategy consultant; from June 2003 to April 2004, he was on the Global Client Services team of IDEO, a product design/innovation firm; and from 1999 to 2003, he was President of Tesser, Inc. Mr. Shell graduated with honors from Stanford University with a degree in Political Science. | | 26 | | None. |
|
| * | All communications to Trustees and Officers may be directed to Financial Investors Trust c/o 1290 Broadway, Suite 1100, Denver, CO 80203. |
| ** | This is the period for which the Trustee/Officer began serving the Trust. Each Trustee/Officer serves an indefinite term, until his successor is elected. |
| *** | Except as otherwise indicated, each individual has held the office shown or other offices in the same company for the last five years. |
| **** | The Fund Complex includes all series of the Trust (currently 26) and any other investment companies for which Disciplined Growth Investors, Inc. provides investment advisory services (currently none). |
| | |
| Annual Report | April 30, 2013 | | 29 |
| | |
| The Disciplined Growth Investors Fund | | Trustees and Officers |
| | April 30, 2013 (Unaudited) |
INTERESTED TRUSTEE
| | | | | | | | | | |
Name, Address*
& Age | | Position(s) Held with Fund | | Term of Office and Length of Time Served** | | Principal Occupation(s) During Past 5 Years*** | | Number of
Funds in
Fund
Complex
Overseen
by
Trustee**** | | Other Directorships Held by Trustee |
|
Edmund J. Burke, age 52 | | Trustee, Chairman and President | | Mr. Burke was elected as Chairman at the August 28, 2009 meeting of the Board of Trustees. Mr. Burke was elected as Trustee at a special meeting of shareholders held on August 7, 2009. Mr. Burke was elected President of the Trust at the December 17, 2002 meeting of the Board of Trustees. | | Mr. Burke is President and a Director of ALPS Holdings, Inc. (“AHI”) (since 2005) and Director of ALPS Advisors, Inc. (“AAI”), ALPS Distributors, Inc. (“ADI”), ALPS Fund Services, Inc. (”AFS”) and ALPS Portfolio Solutions Distributor, Inc. (“APSD”) and from 2001-2008, was President of AAI, ADI, AFS and APSD. Because of his positions with AHI, AAI, ADI, AFS and APSD, Mr. Burke is deemed an affiliate of the Trust as defined under the 1940 Act. Mr. Burke is Trustee and President of the Clough Global Allocation Fund (Trustee since 2006; President since 2004); Trustee and President of the Clough Global Equity Fund (Trustee since 2006; President since 2005); Trustee and President of the Clough Global Opportunities Fund (since 2006); Trustee of the Liberty All-Star Equity Fund; and Director of the Liberty All-Star Growth Fund, Inc. | | 26 | | Mr. Burke is a Trustee of Clough Global Allocation Fund (1 fund); Clough Global Equity Fund (1 fund); Clough Global Opportunities Fund (1 fund); Trustee of the Liberty All-Star Equity Fund (1 fund); and Director of the Liberty All-Star Growth Fund, Inc. (1 fund). |
|
| * | All communications to Trustees and Officers may be directed to Financial Investors Trust c/o 1290 Broadway, Suite 1100, Denver, CO 80203. |
| ** | This is the period for which the Trustee/Officer began serving the Trust. Each Trustee/Officer serves an indefinite term, until his successor is elected. |
| *** | Except as otherwise indicated, each individual has held the office shown or other offices in the same company for the last five years. |
| **** | The Fund Complex includes all series of the Trust (currently 26) and any other investment companies for which Disciplined Growth Investors, Inc. provides investment advisory services (currently none). |
| | |
| 30 | | 1-855-DGI-FUND (344-3863) | www.DGIfund.com |
| | |
| The Disciplined Growth Investors Fund | | Trustees and Officers |
| | April 30, 2013 (Unaudited) |
OFFICERS
| | | | | | |
Name, Address* & Age | | Position(s)
Held with
Fund | | Term of Office and
Length of Time
Served** | | Principal Occupation(s) During Past 5 Years*** |
|
Kimberly R. Storms, age 40 | | Treasurer | | Ms. Storms was elected Treasurer of the Trust at the March 12, 2013 meeting of the Board of Trustees. | | Ms. Storms is Senior Vice President - Director of Fund Administration of ALPS. Ms. Storms joined ALPS in 1998 as Assistant Controller. Because of her position with ALPS, Ms. Storms is deemed an affiliate of the Trust as defined under the 1940 Act. Ms. Storms is also Treasurer of BPV Family of Funds and ALPS Series Trust; Assistant Treasurer of Liberty All-Star Equity Fund and Liberty All-Star Growth Fund, Inc.; Assistant Treasurer of Tilson Funds; and Chief Financial Officer of The Arbitrage Funds. |
|
David T. Buhler, age 41 | | Secretary | | Mr. Buhler was elected Secretary of the Trust at the September 11, 2012 meeting of the Board of Trustees. | | Mr. Buhler joined ALPS in June 2010, and is currently Vice President and Associate Counsel of ALPS, AAI, ADI and APSD. Prior to joining ALPS, Mr. Buhler served as Associate General Counsel and Assistant Secretary of Founders Asset Management LLC from 2006 to 2009. Because of his position with ALPS, Mr. Buhler is deemed an affiliate of the Trust as defined under the 1940 Act. Mr. Buhler is also the Secretary of ALPS Variable Investment Trust and Westcore Trust. |
|
Ted Uhl, age 37 | | Chief Compliance Officer (“CCO”) | | Mr. Uhl was appointed CCO of the Trust at the June 8, 2010 meeting of the Board of Trustees. | | Mr. Uhl joined ALPS in October 2006, and is currently Deputy Compliance Officer of ALPS. Prior to his current role, Mr. Uhl served as Senior Risk Manager for ALPS from October 2006 until June 2010. Before joining ALPS, Mr. Uhl served a Sr. Analyst with Enenbach and Associates (RIA), and a Sr. Financial Analyst at Sprint. Because of his position with ALPS, Mr. Uhl is deemed an affiliate of the Trust as defined under the 1940 Act. Mr. Uhl is also CCO of the Clough Global Funds, Reaves Utility Income Fund, Drexel Hamilton Funds and Transparent Value Trust. |
|
| * | All communications to Trustees and Officers may be directed to Financial Investors Trust c/o 1290 Broadway, Suite 1100, Denver, CO 80203. |
| ** | This is the period for which the Trustee/Officer began serving the Trust. Each Trustee/Officer serves an indefinite term, until his successor is elected. |
| *** | Except as otherwise indicated, each individual has held the office shown or other offices in the same company for the last five years. |
| | |
| Annual Report | April 30, 2013 | | 31 |


TABLE OF CONTENTS
| | |
| Emerald Banking and Finance Fund | | Manager Commentary |
| | April 30, 2013 (Unaudited) |
Dear Shareholder:
While small cap bank stocks (SNL Small Cap U.S. Bank & Thrift Index1 up 12.37%) have underperformed the broader market (S&P 500 Index2 up 13.64%; Russell 2000 Index3 up 16.13%) during the past fiscal year, the strong returns of the financial sector continue to be driven by loan growth, albeit tepid loan growth, solid mortgage banking income, ongoing credit leverage, and stability or dare we say strength in the housing markets. The Emerald Banking & Finance Fund’s Class A shares (without sales load) posted a total return of 18.40% for the twelve months ended April 30, 2013, compared with 17.69% for the Russell 2000 Index. While headwinds persists such as net interest margin (NIM) pressure, lower yields on interest earning assets and heightened macro concerns we remain optimistic about the current “new bull” market and the health of the banking and financial services sector. Fortunately, the Emerald Banking and Finance Fund continued to outperform the broad market and the SNL Small Cap U.S. Bank & Thrift in having posted a positive return for the last twelve months of 18.68% (without sales load). Large Cap banks have not suffered the same fate as their small cap brethren though as large cap stocks have led the broad market higher (SNL Large Cap U.S. Bank & Thrift Index4 up 18.06% versus the S&P 500 up 13.64% over the same period). The fact that small cap banks have not outperformed the broader market is somewhat disconcerting to us since Banks (and Financials in general) should lead the market higher during bull markets, not lag. Large cap banks tend to lead the market initially during a new bull market phase, but this bull market began in March 2009 and we believe small cap banks are long overdue for a reversal of their relative performance trend to take control of the bank sector and provide outsized gains versus large cap banks.
While headwinds persist, we believe the positives outweigh the negatives. We previously stated that improvements in the housing sector and the belief that housing has finally bounced off a bottom should continue to increase lending activity and keep mortgage origination income robust, thus helping to sustain relative valuations. We continue to support this thesis despite slower mortgage originations in the first quarter of 2013 which we believe was simply the result of seasonality. In fact, the underlying data remains robust. CoreLogic Inc. said May 7th that home prices in March rose 10.5% compared to the year-ago period, the biggest year-over-year gain since March 2006 and the 13th consecutive monthly rise in home prices nationally.
Data released by the Federal Reserve on Friday, April 25th shows that the recovery is not “just” a housing recovery as Commercial and Industrial (C&I) loans outstanding expanded 11.9% year-over-year for the week of April 24, 2013, with C&I loans outstanding at record levels after increasing 35% from the recent trough in June 2010. Yes, the pace of C&I growth has decelerated significantly thus far in 2013, which was not unexpected given the “pull-forward” in C&I loans in the fourth quarter of 2012 but we are optimistic that C&I loan growth will remain robust throughout the remainder of 2013 after seeing a pick-up in overall activity in April and commentary from several community bankers at the Gulf South Bank Conference regarding increasing loan pipelines in the second quarter of 2013.
Finally, we believe there is still some upside to earnings power that will come from the continued improvement in overall credit quality for the banking sector. Drastically lower net charge-offs were the bright spot in the first quarter of 2013 as credit quality metrics for U.S. commercial banks continued to improve. Net charge-offs were down to $14.91 billion from $17.31 billion at the end of 2012. As a percent of average loans, net charge-offs fell to 0.85% from 1%, according to SNL. Other than a slight increase from the second quarter of 2011 to the third quarter of 2011 and a blip in the third quarter of 2012, the percentage has fallen steadily since the first quarter of 2011.
But not everything in the banking sector is “unicorns and rainbows.” For the last twelve months, the number one concerns for bank investors and CEOs alike has been the flat yield curve and the resulting difficult interest rate environment. In fact, John Allison, Chairman of Home BancShares, Inc., recently stated to us that the only thing that keeps him up at night is net interest margin compression. In April, the slope of the yield curve decreased 16 basis points5 as the 10-year yield decreased by 18 basis points and the three-month Treasury bill yield ticked two basis points lower. At 163 basis points, the slope of the yield curve fell below the 20-year-plus average slope of approximately 180 basis points for the eleventh time in the past twelve months. Over the past 25 years, bank stocks typically under-perform the broader market (S&P 500) by roughly 7.5% annualized when the yield curve is flatter than average. However, over the past twelve months despite such a rate environment, the SNL Large Cap U.S. Bank & Thrift index outperformed the S&P 500 by 4.42%, up 18.06% versus a 13.64% increase in the S&P 500 over the same period.6
In this type of economic atmosphere, not all bank stocks are created equal and Emerald’s goal is to be able to continue to differentiate itself through our ten step research process and our ability to identify those bank management teams with the ability to navigate the headwinds in the sector, such as a slowdown in global growth and looming political and regulatory landmines, by growing loans organically or through acquisitions while reducing their cost of funds and implementing efficiency initiatives that should sustain earnings momentum throughout 2013. We believe that banks with earnings diversity, scale and growth will command a premium over the next twelve to eighteen months.
We also continue to focus on the inevitable mergers & acquisitions wave for banks with less than $1 billion in assets that we believe is being driven by Basel III7 requirements and regulatory expenses. We have witnessed an increase in the deal pace in 2012 but the bid/ask spread has not yet closed enough to see substantial activity in the first half of 2013.
| | |
| Annual Report | April 30, 2013 | | 1 |
| | |
| Emerald Banking and Finance Fund | | Manager Commentary |
| | April 30, 2013 (Unaudited) |
We look forward to the continued opportunity to provide experienced portfolio management to our shareholders via our ten step research process and believe that this type of bifurcated market is exactly the type of environment where our stock picking capabilities differentiate the Fund from its peers.
| | | | |
| Top Five Contributors to Return Included: | | Top Five Detractors to Return Included: | | |
Bank of the Ozarks, Inc. (OZRK) BofI Holdings, Inc. (BOFI) First Financial Bankshares, Inc. (FFIN) Western Alliance Bancorp (WAL) Texas Capital Bancshares, Inc. (TCBI) | | Bankrate, Inc. (RATE) Flagstar Bancorp, Inc. (FBC) HomeStreet, Inc. (HMST) Ares Commercial Real Estate Corp. (ACRE) The Bancorp, Inc. (TBBK) | | |
| | |
 | |  | | |
| | |
Kenneth G. Mertz II, CFA Chief Investment Officer Portfolio Manager | | Steven E. Russell, Esq. Portfolio Manager | | |
Emerald Mutual Fund Advisers Trust
| (1) | SNL Small Cap Bank & Thrift Index: Includes all publicly traded (NYSE, NYSE Amex, NASDAQ, OTC BB, Pink Sheets) Banks and Thrifts in SNL’s coverage universe with $250M to $1B Total Common Market Capitalization as of most recent pricing data. Source: SNL Financial, data as of April 30, 2013. |
| (2) | The S&P 500® Total Return Index is an unmanaged index of 500 common stocks chosen for the market size, liquidity and industry group representation. It is a market-value weighted index. The index is not actively managed and does not reflect any deduction for fees, expenses or taxes. An investor cannot invest directly into the index. |
| (3) | The Russell 2000® Index measures the performance of the small-cap segment of the U.S. equity universe. The Russell 2000® is a subset of the Russell 3000® Index representing approximately 10% of the total market capitalization of that index. It includes approximately 2000 of the smallest securities based on a combination of their market cap and current index membership. The index is not actively managed and does not reflect any deduction for fees, expenses or taxes. An investor cannot invest directly into the index. |
| (4) | SNL Large Cap U.S. Bank & Thrift Index: Includes all publicly traded (NYSE, NYSE Amex, NASDAQ, OTC BB, Pink Sheets) Banks and Thrifts in SNL’s coverage universe with greater than $5 billion Total Common Market Capitalization as of most recent pricing data. Source: SNL Financial, data as of April 30, 2013. |
| (5) | A basis point is a unit of equal to 1/100th of 1%, and is commonly used to denote the change in a financial instrument. |
| (6) | Wunderlich Securities; “Bank Shots: A Monthly Snapshot of the Banking Sector” May 8, 2013. |
| (7) | Basel III is a global regulatory standard on bank capital adequacy, stress testing and market liquidity risk agreed upon by the members of the Basel Committee on Banking Supervision in 2010–11, and scheduled to be introduced from 2013 until 2018. |
| | |
| 2 | | www.emeraldmutualfunds.com |
| | |
| Emerald Banking and Finance Fund | | Manager Commentary |
| | April 30, 2013 (Unaudited) |
| | | | | | |
TOP TEN HOLDINGS (as a % of Net Assets)* | | | | | |
Bank of the Ozarks, Inc. | | | 3.84% | | |
| | |
Independent Bank Group, Inc. | | | 2.81% | | |
| | |
ConnectOne Bancorp, Inc. | | | 2.56% | | |
| | |
Pacific Premier Bancorp, Inc. | | | 2.45% | | |
| | |
SVB Financial Group | | | 2.38% | | |
| | |
Eagle Bancorp, Inc. | | | 2.30% | | |
| | |
EverBank Financial Corp. | | | 2.28% | | |
| | |
Signature Bank | | | 2.22% | | |
| | |
Home BancShares, Inc. | | | 2.09% | | |
| | |
Horizon Bancorp | | | 2.06% | | |
| | |
Top Ten Holdings | | | 24.99% | | |
| | |
INDUSTRY SECTOR ALLOCATION (as a % of Net Assets) | | |
Banks: Diversified | | | 70.72% | | |
| | |
Real Estate Investment Trusts (REITs) | | | 11.51% | | |
| | |
Banks: Savings, Thrift & Mortgage | | | 6.65% | | |
| | |
Insurance: Property-Casualty | | | 2.24% | | |
| | |
Insurance: Multi-Line | | | 1.48% | | |
| | |
Financial Data & Systems | | | 1.38% | | |
| | |
Commerical Finance & Mortgage | | | 1.37% | | |
| | |
Consumer Lending | | | 1.03% | | |
| | |
Diversified Financial Services | | | 0.98% | | |
| | |
Asset Management & Custodian | | | 0.07% | | |
| | |
Cash, Cash Equivalents, & Other Net Assets | | | 2.57% | | |
| | |
| |
| * Holdings are subject to change. Tables present indicative values only. | | | |
| | | | | | |
| | | | | | |
| | | | | | |
| | | | | | |
| | | | | | |
| | | | | | |
| | | | | | |
GROWTH OF $10,000 INVESTMENT IN THE FUND (for the year ended April 30, 2013)
Comparison of change in value of a $10,000 investment (includes applicable sales loads)
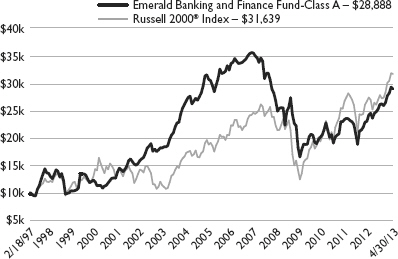
The chart represents historical performance of a hypothetical investment of $10,000 in the Fund since inception. Past performance does not guarantee future results. This chart does not reflect the deduction of taxes that a shareholder would pay on Fund distributions or the redemption of Fund shares.
AVERAGE ANNUAL TOTAL RETURN (for the year ended April 30, 2013)
| | | | | | | | | | | | | | | | | | | | | | | | | | | | |
| | | | | | | | | | | | | | | Since | | | Expense Ratio | |
| | | 1 Year | | | 3 Year | | | 5 Year | | | 10 Year | | | Inception1 | | | Gross2 | | | Net2 | |
| |
Class A (NAV) | | | 18.40% | | | | 8.48% | | | | 2.60% | | | | 3.96% | | | | 7.09% | | | | 2.07% | | | | 1.84% | |
| |
Class A (MOP) | | | 12.75% | | | | 6.74% | | | | 1.61% | | | | 3.46% | | | | 6.77% | | | | 2.07% | | | | 1.84% | |
| |
Russell 2000® Index† | | | 17.69% | | | | 11.25% | | | | 7.27% | | | | 10.47% | | | | 7.37% | | | | | | | | | |
| |
Class C (NAV) | | | 17.58% | | | | 7.81% | | | | 1.94% | | | | 3.31% | | | | 7.03% | | | | 2.72% | | | | 2.49% | |
| |
Class C (CDSC) | | | 16.58% | | | | 7.81% | | | | 1.94% | | | | 3.31% | | | | 7.03% | | | | 2.72% | | | | 2.49% | |
| |
Russell 2000® Index | | | 17.69% | | | | 11.25% | | | | 7.27% | | | | 10.47% | | | | 6.23% | | | | | | | | | |
| |
Investor Class | | | 18.34% | | | | 6.90% | | | | – | | | | – | | | | 8.63% | | | | N/A | | | | 1.89% | |
| |
Russell 2000® Index | | | 17.69% | | | | – | | | | – | | | | – | | | | 13.30% | | | | | | | | | |
| |
Institutional Class | | | 18.81% | | | | – | | | | – | | | | – | | | | 17.40% | | | | 2.12% | | | | 1.54% | |
| |
Russell 2000® Index | | | 17.69% | | | | 11.25% | | | | – | | | | – | | | | 12.73% | | | | | | | | | |
| |
The performance quoted represents past performance, does not guarantee future results and current performance may be lower or higher than the data quoted. The investment return and principal value of an investment will fluctuate so that shares, when redeemed, may be worth more or less than their original cost. Performance data current to the most recent month end may be obtained at www.emeraldmutualfunds.com.
Performance shown for periods prior to March 16, 2012, reflects the performance of the Forward Banking & Finance Fund, a series of Forward Funds as a result of a reorganization of the Forward Banking & Finance Fund into the Emerald Banking & Finance Fund.
Maximum Offering Price (MOP) for Class A shares includes the Fund’s maximum sales charge of 4.75%. Performance shown at NAV does not include these sales charges and would have been lower had it been taken into account.
A Contingent Deferred Sales Charge (CDSC) of 1.00% may apply to Class C shares redeemed within the first 12 months after a purchase.
| | |
| Annual Report | April 30, 2013 | | 3 |
| | |
| Emerald Banking and Finance Fund | | Manager Commentary |
| | April 30, 2013 (Unaudited) |
|
1 Inception Dates - Class A: 02/18/1997, Class C: 07/01/2000, Class Institutional: 03/19/2012, Class Investor: 03/16/2010 2 Emerald Mutual Fund Advisers Trust (“Emerald” or the “Adviser”) has agreed contractually to waive a portion of its fees and reimburse other expenses until August 31, 2014 in amounts necessary to limit the Fund’s operating expenses (exclusive of Acquired Fund Fees and Expenses, brokerage expenses, interest expenses, taxes and extraordinary expense) for Class A, Class C, Institutional Class, and Investor Class shares to an annual rate (as percentage of the Fund’s average daily net assets) of 1.84%, 2.49%, 1.54% and 1.89% respectively. The Adviser will be permitted to recover, on a class-by-class basis, expenses it has borne through the agreement described above to the extent that the Fund’s expenses in later periods fall below the annual rates set forth in the relevant agreement. The Fund will not be obligated to pay any such deferred fees and expenses more than three years after the year(s) in which the fees and expense were incurred. The Adviser may not discontinue this waiver prior to August 31, 2014, without the approval by the Fund’s Board of Trustees. † The Russell 2000® Index measures the performance of the small-cap segment of the U.S. equity universe. The Russell 2000® is a subset of the Russell 3000® Index representing approximately 10% of the total market capitalization of that index. It includes approximately 2000 of the smallest securities based on a combination of their market cap and current index membership. Each index is not actively managed and does not reflect any deduction for fees, expenses or taxes. An investor cannot invest directly into an index. Important Risks The views and information discussed in this commentary are as of the date of publication, are subject to change, and may not reflect the writer’s current views. The views expressed represent an assessment of market conditions at a specific point in time, are opinions only and should not be relied upon as investment advice regarding a particular investment or markets in general. Such information does not constitute a recommendation to buy or sell specific securities or investment vehicles. It should not be assumed that any investment will be profitable or will equal the performance of the Fund or any securities or any sectors mentioned herein. The subject matter contained herein has been derived from several sources believed to be reliable and accurate at the time of compilation. The Fund does not accept any liability for losses either direct or consequential caused by the use of this information. A fund that concentrates in a particular industry will involve a greater degree of risk than a fund with a more diversified portfolio. Investing in smaller companies generally will present greater investment risks, including: greater price volatility, greater sensitivity to changing economic conditions and less liquidity than the securities of larger, more mature companies. |
| | |
| 4 | | www.emeraldmutualfunds.com |
| | |
| Emerald Growth Fund | | Manager Commentary |
| | April 30, 2013 (Unaudited) |
Dear Shareholder:
The U.S. equity market successfully navigated another year wrought with macroeconomic and fiscal uncertainty, the U.S. Presidential Election, unforeseen tragedies (Super Storm Sandy, and Sandy Hook), the end of the Mayan calendar, the fiscal cliff and most recently the implementation of the sequester. While most market participants have seemingly been reluctant bulls, the better than expected economic data and strong equity inflows continued to provide underlying support to the market’s advance. The strength in equity inflows on a year –to-date basis through April 3, 2013 as reported by the Lipper FMI/AMG fund flows database was particularly notable at nearly $48 billion and while only $18 billion of those dollars flowed into domestic equities, this marked a notable reversal from the outflows experienced throughout 2012, fueling speculation that the great rotation into equities had finally begun.
The housing recovery that began in 2012 has continued in earnest and has remained an underlying source of strength in the domestic economy through the early part of 2013. Total single family home prices rose 10.2% year-over-year in February, according to CoreLogic. The CoreLogic Home Price Index is a repeat-sales index that tracks increases and decreases in sales prices for the same homes over time, including single-family attached and single-family detached homes. The CoreLogic HPI provides a multi-tier market evaluation of repeat sales transactions based on price, time between sales, property type, loan type (conforming vs. nonconforming) and distressed sales. The increases were fairly broad-based with 47 states showing year-over-year increases in pricing. The trend seems set to continue as the CoreLogic Pending Home Price Index indicates that March prices will rise 10.2%. The Mortgage Bankers Association (MBA) has a similarly optimistic forecast expecting the dollar volume of purchase mortgage originations to grow 19% year-over-year in 2013 and 20% year over year in 2014. Non-residential construction is showing signs of life as well through ongoing advance in the Architecture Billings Index(ABI). The ABI, a monthly survey of architects regarding current billings trends, serves as a leading economic indicator as it typically leads to improvement in the nonresidential construction market by 9-12 months. The February 2013, released on March 20, 2013, ABI rose 0.7 points to 54.9, above the January levels of 54.2 and representing the seventh consecutive positive reading for the index, and the highest individual monthly reading since November 2007. The improvement in the index has been broad based with all regions and sectors reflecting expansion. Manufacturing statistics have strengthened since the end of the fourth quarter and retail sales in aggregate have been fairly stable despite the increase in the payroll tax, rising gas prices and the headwind from delayed tax refunds. Although economic growth has been generally better than expected, Federal Reserve Chairman Bernanke and Vice Chairwoman Yellen, did their best to convince the market that the U.S economy is still a long way from the point where the Federal Reserve would reconsider its position on stimulating the economy, further lending support to the broad market advance.
Results
The Emerald Growth Fund’s Class A shares (without sales load) posted a total return of 9.14% for the twelve months ended April 30, 2013, compared with the 14.52% for the Russell 2000 Growth Index1. While disappointed with the twelve month trailing performance, over both the three and five year periods the portfolio has continued to outpace the Russell 2000 Growth Index benchmark. For the three year period ended April 30, the Emerald Growth Fund’s Class A shares (without sales load) had an average total return of 16.91%, compared to 14.75% for the Russell 2000 Growth Index. Similarly for the five year period the Emerald Growth Fund’s Class A shares (without sales load) had an average total return of 10.66%, compared to 9.04% for the Russell 2000 Growth Index.
Investment Analysis
The healthcare, financial services and energy sectors made significant contributions to the fund over the last twelve months. In health care, Acadia Healthcare was the largest contributor to return. As a client of Emerald you have likely heard a member or members of the Emerald team mention the firm’s propensity to follow a successful entrepreneur into his or her next venture. Emerald’s holding in Acadia Healthcare exemplifies that strategy. Acadia, an operator of behavioral/psychiatric health care facilities, is the second go round for CEO Joey Jacobs. Mr. Jacob’s, was the prior CEO of behavioral/psychiatric facility operator Psychiatric Solutions, an Emerald holding until the time of its acquisition by Universal Health Services. Psychiatric Solutions’ revenue and profitability grew substantially during Emerald’s holding period as Mr. Jacobs and team aggressively rolled-up competing facilities and enhanced their productivity. Given Emerald’s prior success investing alongside of Mr. Jacob’s and our understanding of the industry it was our assessment that there was a significant opportunity for appreciation if Acadia was successful in emulating the Psychiatric Solutions model for growth. To date this thesis remains intact as evidenced by the relative outperformance of Acadia’s shares during the period. Emerald believes there remains ample opportunity for Acadia to continue to scale its operations and profitability through both acquisitions and same center revenue and profitability gains.
Within the energy and financial services sectors, shares of exploration company Gulfport Energy Corp., and community bank, Bank of the Ozarks Inc. were the top contributors to return.
Offsetting the aforementioned however was performance within the fund’s consumer discretionary, technology, materials and producer durables holdings which produced weaker returns when compared with the same sectors in the Russell 2000 Growth index. Body Central, a specialty retailer of women’s fashions and FARO Technologies, a manufacturer of 3-D measurement and imaging systems, were the largest detractors to return.
| | |
| Annual Report | April 30, 2013 | | 5 |
| | |
| Emerald Growth Fund | | Manager Commentary |
| | April 30, 2013 (Unaudited) |
| | |
Top Five Contributors to Return Included Hovnanian Enterprises Inc. Cl A (HOV) Acadia Healthcare Co Inc (ACHC) Sarepta Therapeutics Inc (SRPT) Sinclair Broadcast Group Inc. Cl A (SBGI) MWI Veterinary Supply Inc. (MWIV) | | Top Five Detractors to Return Included Body Central Corp. (BODY) FARO Technologies Inc. (FARO) Magnum Hunter Resources Corp. (MHR) Brightcove Inc. (BCOV) Millennial Media Inc. (MM) |
Looking Ahead
Sell in May and go away? In each of the last three years (2010, 2011 and 2012) had you sold in April you would have avoided three wicked corrections during which the S&P 500 declined 16%, 19.4% and 9.9%, respectively according to Yardeni Research. In each of those years, much in the way that economic data during the first quarter of 2013 has been better than expected, the economy started the year strong and then weakened during the spring and summer, correlating in part to rising tension in the Eurozone. Given the strength in the market during the first quarter of 2013 and the subsequent post quarter-end string of disappointing economic releases (retail sales, consumer confidence, unemployment, etc.) fears are growing that market performance during 2013 may mimic that of the last three years. While this year certainly could follow a different path, it may not. The implementation of the sequester which is set to reduce federal agencies’ spending authority by $85 billion by year-end and resulting near-term pressure on the economy, could be setting us up for a similar phenomenon this year.
That being said, there are plenty of reasons to be optimistic. From a macro-economic perspective housing is recovering, liquidity is abundant, interest rates are low, earnings are expanding, inflation remains subdued, cash on corporate balance sheets remains high as a percentage of market capitalization and the global easing cycle remains ongoing. At the stock level, we remain enthusiastic about the level of innovation and growth opportunities reflected in the portfolio holdings. At the sector level, Emerald’s bottom-up approach to stock selection has resulted in overweight positions relative to the Russell 2000 Growth benchmark in healthcare, financial services, and the consumer discretionary sectors and the most significant underweight positions in the producer durables, materials and consumer staples sectors.
Emerald, as it has for the past twenty years, remains focused on utilizing its fundamental bottom-up research process to identify the best growth companies within the small capitalization universe.
| | | | |
 | |  | |  |
| Kenneth G. Mertz II, CFA | | Stacey L. Sears | | Joseph W. Garner |
| Chief Investment Officer | | Portfolio Manager | | Portfolio Manager |
| Portfolio Manager | | | | |
Emerald Mutual Fund Advisers Trust
| (1) | The Russell 2000® Index measures the performance of the small-cap segment of the U.S. equity universe. The Russell 2000® is a subset of the Russell 3000® Index representing approximately 10% of the total market capitalization of that index. It includes approximately 2000 of the smallest securities based on a combination of their market cap and current index membership. The index is not actively managed and does not reflect any deduction for fees, expenses or taxes. An investor cannot invest directly into the index. |
| | |
| 6 | | www.emeraldmutualfunds.com |
| | |
| Emerald Growth Fund | | Manager Commentary |
| | April 30, 2013 (Unaudited) |
| | | | | | |
TOP TEN HOLDINGS (as a % of Net Assets)* | | | |
MWI Veterinary Supply, Inc. | | | 2.87 | % | | |
Trex Co., Inc | | | 2.17 | % | | |
Akorn, Inc. | | | 2.15 | % | | |
Bank of the Ozarks, Inc. | | | 2.04 | % | | |
Acadia Healthcare Co., Inc. | | | 1.96 | % | | |
Spirit Airlines, Inc. | | | 1.94 | % | | |
Triumph Group, Inc. | | | 1.79 | % | | |
Multimedia Games Holding Co., Inc | | | 1.75 | % | | |
Red Robin Gourmet Burgers, Inc. | | | 1.74 | % | | |
Jazz Pharmaceuticals PLC | | | 1.71 | % | | |
Top Ten Holdings | | | 20.12 | % | | |
| |
INDUSTRY SECTOR ALLOCATION (as a % of Net Assets) | | | |
Health Care | | | 25.45 | % | | |
Consumer Discretionary | | | 19.16 | % | | |
Technology | | | 17.01 | % | | |
Financial Services | | | 12.32 | % | | |
Producer Durables | | | 11.56 | % | | |
Materials & Processing | | | 6.89 | % | | |
Energy | | | 4.39 | % | | |
Consumer Staples | | | 1.84 | % | | |
Utilities | | | 0.50 | % | | |
Cash, Cash Equivalents, & Other Net Assets | | | 0.88 | % | | |
* Holdings are subject to change. Tables present indicative values only. |
| |
| | | |
| |
| | | |
GROWTH OF $10,000 INVESTMENT IN THE FUND (for the year ended April 30, 2013)
Comparison of change in value of a $10,000 investment (includes applicable sales loads)
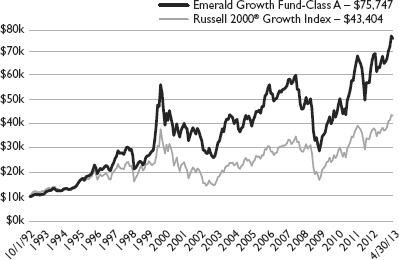
The chart represents historical performance of a hypothetical investment of $10,000 in the Fund since inception. Past performance does not guarantee future results. This chart does not reflect the deduction of taxes that a shareholder would pay on Fund distributions or the redemption of Fund shares.
AVERAGE ANNUAL TOTAL RETURN (for the year ended April 30, 2013)
| | | | | | | | | | | | | | | | | | | | | | | | | | | | |
| | | | | | | | | | | | | | | Since | | | Expense Ratio | |
| | | 1 Year | | | 3 Year | | | 5 Year | | | 10 Year | | | Inception1 | | | Gross2 | | | Net2 | |
Class A (NAV) | | | 9.14 | % | | | 14.46 | % | | | 9.38 | % | | | 9.99 | % | | | 10.60 | % | | | 1.43 | % | | | 1.29 | % |
Class A (MOP) | | | 3.94 | % | | | 12.61 | % | | | 8.32 | % | | | 9.46 | % | | | 10.34 | % | | | 1.43 | % | | | 1.29 | % |
Russell 2000® Growth Index† | | | 15.67 | % | | | 12.94 | % | | | 7.81 | % | | | 10.53 | % | | | 7.39 | % | | | | | | | | |
Class C (NAV) | | | 8.43 | % | | | 13.71 | % | | | 8.72 | % | | | 9.33 | % | | | 3.61 | % | | | 2.08 | % | | | 1.94 | % |
Class C (CDSC) | | | 7.48 | % | | | 13.71 | % | | | 8.72 | % | | | 9.33 | % | | | 3.61 | % | | | 2.08 | % | | | 1.94 | % |
Russell 2000® Growth Index | | | 15.67 | % | | | 12.94 | % | | | 7.81 | % | | | 10.53 | % | | | 2.60 | % | | | | | | | | |
Investor Class | | | 9.08 | % | | | - | | | | - | | | | - | | | | 5.90 | % | | | 1.48 | % | | | 1.34 | % |
Russell 2000® Growth Index | | | 15.67 | % | | | 12.94 | % | | | - | | | | - | | | | 16.74 | % | | | | | | | | |
Institutional Class | | | 9.47 | % | | | 14.80 | % | | | - | | | | - | | | | 16.51 | % | | | 1.13 | % | | | 0.99 | % |
Russell 2000® Growth Index | | | 15.67 | % | | | - | | | | - | | | | - | | | | 5.87 | % | | | | | | | | |
The performance quoted represents past performance, does not guarantee future results and current performance may be lower or higher than the data quoted. The investment return and principal value of an investment will fluctuate so that shares, when redeemed, may be worth more or less than their original cost. Performance data current to the most recent month end may be obtained at www.emeraldmutualfunds.com.
Performance shown for periods prior to March 16, 2012, reflects the performance of the Forward Growth Fund, a series of Forward Funds (as a result of a reorganization of the Forward Growth Fund into the Emerald Growth Fund.
Maximum Offering Price (MOP) for Class A shares includes the Fund’s maximum sales charge of 4.75%. Performance shown at NAV does not include these sales charges and would have been lower had it been taken into account.
| | |
| Annual Report | April 30, 2013 | | 7 |
| | |
| Emerald Growth Fund | | Manager Commentary |
| | April 30, 2013 (Unaudited) |
A Contingent Deferred Sales Charge (CDSC) of 1.00% may apply to Class C shares redeemed within the first 12 months after a purchase.
| 1 | Inception Dates - Class A: 10/01/1992, Class C: 07/01/2000, Class Institutional: 10/21/2008, Class Investor: 05/01/2011 |
| 2 | Emerald Mutual Fund Advisers Trust (“Emerald” or the “Adviser”) has agreed contractually to waive a portion of its fees and reimburse other expenses until August 31, 2013 in amounts necessary to limit the Fund’s operating expenses (exclusive of Acquired Fund Fees and Expenses, brokerage expenses, interest expenses, taxes and extraordinary expense) for Class A, Class C, Institutional Class, and Investor Class shares to an annual rate (as percentage of the Fund’s average daily net assets) of 1.29%, 1.94%, 0.99% and 1.34% respectively. The Adviser will be permitted to recover, on a class-by-class basis, expenses it has borne through the agreement described above to the extent that the Fund’s expenses in later periods fall below the annual rates set forth in the relevant agreement. The Fund will not be obligated to pay any such deferred fees and expenses more than three years after the year(s) in which the fees and expense were incurred. The Adviser may not discontinue this waiver prior to August 31, 2013, without the approval by the Fund’s Board of Trustees. |
† The Russell 2000® Growth Index measures the performance of the small-cap growth segment of the U.S. equity universe. It includes those Russell 2000® Index companies with higher price-to-value ratios and higher forecasted growth values.
The index is not actively managed and does not reflect any deduction for fees, expenses or taxes. An Investor cannot invest directly into an index.
Important Risks
The views and information discussed in this commentary are as of the date of publication, are subject to change, and may not reflect the writer’s current views. The views expressed represent an assessment of market conditions at a specific point in time, are opinions only and should not be relied upon as investment advice regarding a particular investment or markets in general. Such information does not constitute a recommendation to buy or sell specific securities or investment vehicles. It should not be assumed that any investment will be profitable or will equal the performance of the Fund or any securities or any sectors mentioned herein. The subject matter contained herein has been derived from several sources believed to be reliable and accurate at the time of compilation. The Fund does not accept any liability for losses either direct or consequential caused by the use of this information.
Investing in smaller companies generally will present greater investment risks, including: greater price volatility, greater sensitivity to changing economic conditions and less liquidity than the securities of larger, more mature companies.
| | |
| 8 | | www.emeraldmutualfunds.com |
| | |
| Emerald Funds | | Disclosure of Fund Expenses |
| | April 30, 2013 (Unaudited) |
As a shareholder of the Funds, you incur two types of costs: (1) transaction costs, including applicable sales charges (loads); and (2) ongoing costs, including management fees, distribution and service (12b-1) fees, shareholder services fees and other Fund expenses. This example is intended to help you understand your ongoing costs (in dollars) of investing in the Funds and to compare these costs with the ongoing costs of investing in other mutual funds. The example is based on an investment of $1,000 invested at the beginning of the (six-month) period and held for the entire period November 1, 2012 through April 30, 2013.
Actual Expenses
The first line for each share class of each Fund in the table provides information about actual account values and actual expenses. You may use this information, together with the amount you invested, to estimate the expenses that you paid over the period. Simply divide your account value by $1,000 (for example, an $8,600 account value divided by $1,000 = 8.6), then multiply the result by the number in the applicable line under the heading entitled “Expenses Paid During Period” to estimate the expenses you paid on your account during this period.
Hypothetical Example For Comparison Purposes
The second line for each share class of each Fund in the table below provides information about hypothetical account values and hypothetical expenses based on the Fund’s actual expense ratio and an assumed rate of return of 5% per year before expenses, which is not the Fund’s actual return. The hypothetical account values and expenses may not be used to estimate the actual ending account balance or expenses you paid for the period. You may use this information to compare the ongoing costs of investing in the Funds and other funds. To do so, compare this 5% hypothetical example with the 5% hypothetical examples that appear in the shareholder reports of other funds.
Please note that the expenses shown in the table below are meant to highlight your ongoing costs only and do not reflect any transactional costs, such as sales charges (loads), redemption fees or exchange fees. Therefore, the second line for each share class of each Fund within the table is useful in comparing ongoing costs only, and will not help you determine the relative total costs of owning different funds. If these transactional costs were included, your costs would have been higher.
| | | | | | | | | | | | | | | | |
| EMERALD BANKING AND FINANCE FUND | | BEGINNING ACCOUNT VALUE 11/01/12 | | | ENDING ACCOUNT VALUE 04/30/13 | | | EXPENSE RATIO(a) | | | Expense Paid During Period 11/01/12 - 4/30/13(b) | |
Class A | | | | | | | | | | | | | | | | |
Actual | | $ | 1,000.00 | | | $ | 1,105.10 | | | | 1.84 | % | | $ | 9.60 | |
Hypothetical (5% return before expenses) | | $ | 1,000.00 | | | $ | 1,015.67 | | | | 1.84 | % | | $ | 9.20 | |
| | | | | | | | | | | | | | | | |
Class C | | | | | | | | | | | | | | | | |
Actual | | $ | 1,000.00 | | | $ | 1,101.40 | | | | 2.49 | % | | $ | 12.97 | |
Hypothetical (5% return before expenses) | | $ | 1,000.00 | | | $ | 1,012.45 | | | | 2.49 | % | | $ | 12.42 | |
| | | | | | | | | | | | | | | | |
Institutional Class | | | | | | | | | | | | | | | | |
Actual | | $ | 1,000.00 | | | $ | 1,107.10 | | | | 1.54 | % | | $ | 8.05 | |
Hypothetical (5% return before expenses) | | $ | 1,000.00 | | | $ | 1,017.16 | | | | 1.54 | % | | $ | 7.70 | |
| | | | | | | | | | | | | | | | |
Investor Class | | | | | | | | | | | | | | | | |
Actual | | $ | 1,000.00 | | | $ | 1,105.20 | | | | 1.89 | % | | $ | 9.87 | |
Hypothetical (5% return before expenses) | | $ | 1,000.00 | | | $ | 1,015.42 | | | | 1.89 | % | | $ | 9.44 | |
| (a) | The Fund’s expense ratios have been based on the Fund’s most recent fiscal half-year expenses. |
| (b) | Expenses are equal to the Fund’s annualized expense ratio multiplied by the average account value over the period, multiplied by the number of days in the most recent fiscal half year (181), then divided by 365. |
| | |
| Annual Report | April 30, 2013 | | 9 |
| | |
| Emerald Funds | | Disclosure of Fund Expenses |
| | April 30, 2013 (Unaudited) |
| | | | | | | | | | | | | | | | |
| EMERALD GROWTH FUND | | BEGINNING ACCOUNT VALUE 11/01/12 | | | ENDING ACCOUNT VALUE 04/30/13 | | | EXPENSE RATIO(a) | | | Expense Paid During Period 11/01/12 - 4/30/13(b) | |
Class A | | | | | | | | | | | | | | | | |
Actual | | $ | 1,000.00 | | | $ | 1,159.40 | | | | 1.29 | % | | $ | 6.91 | |
Hypothetical (5% return before expenses) | | $ | 1,000.00 | | | $ | 1,018.40 | | | | 1.29 | % | | $ | 6.46 | |
| | | | | | | | | | | | | | | | |
Class C | | | | | | | | | | | | | | | | |
Actual | | $ | 1,000.00 | | | $ | 1,155.70 | | | | 1.94 | % | | $ | 10.37 | |
Hypothetical (5% return before expenses) | | $ | 1,000.00 | | | $ | 1,015.17 | | | | 1.94 | % | | $ | 9.69 | |
| | | | | | | | | | | | | | | | |
Institutional Class | | | | | | | | | | | | | | | | |
Actual | | $ | 1,000.00 | | | $ | 1,161.30 | | | | 0.99 | % | | $ | 5.31 | |
Hypothetical (5% return before expenses) | | $ | 1,000.00 | | | $ | 1,019.89 | | | | 0.99 | % | | $ | 4.96 | |
| | | | | | | | | | | | | | | | |
Investor Class | | | | | | | | | | | | | | | | |
Actual | | $ | 1,000.00 | | | $ | 1,158.90 | | | | 1.34 | % | | $ | 7.17 | |
Hypothetical (5% return before expenses) | | $ | 1,000.00 | | | $ | 1,018.15 | | | | 1.34 | % | | $ | 6.71 | |
| (a) | The Fund’s expense ratios have been based on the Fund’s most recent fiscal half-year expenses. |
| (b) | Expenses are equal to the Fund’s annualized expense ratio multiplied by the average account value over the period, multiplied by the number of days in the most recent fiscal half year (181), then divided by 365. |
| | |
| 10 | | www.emeraldmutualfunds.com |
| | |
| Emerald Banking and Finance Fund | | Schedule of Investments |
| | April 30, 2013 |
| | | | | | | | |
| Shares | | | | | Value (Note 2) | |
| COMMON STOCKS: 97.43% | | | | |
| Financial Services: 97.43% | | | | |
| Asset Management & Custodian: 0.07% | |
| | 1,000 | | | Artisan Partners Asset Management, Inc.(a) | | | $37,300 | |
| | | | | | | | | |
| Banks: Diversified: 70.72% | | | | |
| | 52,209 | | | Access National Corp. | | | 656,267 | |
| | 25,432 | | | American Business Bank(a) | | | 743,886 | |
| | 19,330 | | | Ameris Bancorp(a) | | | 268,107 | |
| | 31,650 | | | Atlas Financial Holdings, Inc.(a) | | | 231,045 | |
| | 50,398 | | | Bank of the Ozarks, Inc. | | | 2,062,790 | |
| | 26,770 | | | Bofl Holding, Inc.(a) | | | 1,091,681 | |
| | 28,500 | | | Bridge Bancorp, Inc. | | | 575,415 | |
| | 18,290 | | | Bryn Mawr Bank Corp. | | | 424,877 | |
| | 1,600 | | | California Republic Bancorp(a) | | | 32,400 | |
| | 15,510 | | | Capital Bank Financial Corp., Class A(a) | | | 277,164 | |
| | 47,140 | | | Cardinal Financial Corp. | | | 718,885 | |
| | 17,704 | | | Center Bancorp, Inc. | | | 206,252 | |
| | 34,580 | | | Central Valley Community Bancorp | | | 276,640 | |
| | 7,211 | | | Citizens Financial Services, Inc. | | | 350,094 | |
| | 124,563 | | | CoBiz Financial, Inc. | | | 1,066,259 | |
| | 47,400 | | | ConnectOne Bancorp, Inc.(a) | | | 1,374,600 | |
| | 700 | | | Consumers Bancorp, Inc. | | | 11,200 | |
| | 19,926 | | | Cortland Bancorp | | | 201,253 | |
| | 77,229 | | | CU Bancorp(a) | | | 1,081,206 | |
| | 53,546 | | | Eagle Bancorp, Inc.(a) | | | 1,238,519 | |
| | 19,720 | | | East West Bancorp, Inc. | | | 479,788 | |
| | 4,400 | | | Enterprise Financial Services Corp. | | | 63,272 | |
| | 15,950 | | | Evans Bancorp, Inc. | | | 284,229 | |
| | 76,625 | | | EverBank Financial Corp. | | | 1,226,000 | |
| | 104,453 | | | Farmers National Banc Corp. | | | 689,390 | |
| | 25,125 | | | First Business Financial Services, Inc. | | | 691,440 | |
| | 6,140 | | | First Community Bancshares, Inc. | | | 95,231 | |
| | 21,150 | | | First Financial Bankshares, Inc. | | | 1,045,021 | |
| | 26,150 | | | First of Long Island Corp. | | | 789,991 | |
| | 33,680 | | | First Security Group, Inc.(a) | | | 135,730 | |
| | 44,450 | | | Flagstar Bancorp, Inc.(a) | | | 551,624 | |
| | 112,530 | | | Guaranty Bancorp | | | 238,564 | |
| | 71,360 | | | Heritage Oaks Bancorp(a) | | | 393,907 | |
| | 28,270 | | | Home BancShares, Inc. | | | 1,122,884 | |
| | 16,003 | | | HopFed Bancorp, Inc. | | | 174,593 | |
| | 57,383 | | | Horizon Bancorp | | | 1,107,492 | |
| | 59,296 | | | Howard Bancorp, Inc.(a) | | | 437,308 | |
| | 15,250 | | | Independent Bank Corp. | | | 473,360 | |
| | 53,000 | | | Independent Bank Group, Inc.(a) | | | 1,512,620 | |
| | 34,233 | | | Investors Bancorp, Inc. | | | 677,813 | |
| | 27,563 | | | Lakeland Financial Corp. | | | 738,688 | |
| | 9,697 | | | Meridian Interstate Bancorp,
Inc.(a) | | | 177,358 | |
| | 12,669 | | | MidSouth Bancorp, Inc. | | | 199,030 | |
| | 31,740 | | | Monarch Financial Holdings, Inc. | | | 339,301 | |
| | 6,320 | | | NBT Bancorp, Inc. | | | 127,980 | |
| | 52,180 | | | Northeast Bancorp | | | 494,145 | |
| | | | | | | | |
| Shares | | | | | Value (Note 2) | |
| Banks: Diversified (continued) | |
| | 6,224 | | | Oak Valley Bancorp(a) | | | $49,356 | |
| | 60,705 | | | Old Line Bancshares, Inc. | | | 749,100 | |
| | 6,700 | | | Old National Bancorp | | | 81,606 | |
| | 10,392 | | | Orrstown Financial Services, Inc.(a) | | | 154,217 | |
| | 108,566 | | | Pacific Premier Bancorp, Inc.(a) | | | 1,319,077 | |
| | 14,550 | | | PacWest Bancorp | | | 403,472 | |
| | 22,050 | | | Park Sterling Corp.(a) | | | 126,347 | |
| | 16,002 | | | Peoples Bancorp, Inc. | | | 326,121 | |
| | 14,460 | | | Pinnacle Financial Partners, Inc.(a) | | | 350,944 | |
| | 5,760 | | | Prosperity Bancshares, Inc. | | | 264,614 | |
| | 5,909 | | | QCR Holdings, Inc. | | | 94,367 | |
| | 12,860 | | | Renasant Corp. | | | 293,465 | |
| | 15,170 | | | Republic Bancorp, Inc., Class A | | | 336,774 | |
| | 11,340 | | | SCBT Financial Corp. | | | 541,712 | |
| | 16,680 | | | Signature Bank(a) | | | 1,194,455 | |
| | 20,188 | | | Southern National Bancorp of Virginia, Inc. | | | 203,293 | |
| | 8,750 | | | State Bank Financial Corp. | | | 128,713 | |
| | 22,286 | | | Susquehanna Bancshares, Inc. | | | 260,078 | |
| | 18,008 | | | SVB Financial Group(a) | | | 1,280,549 | |
| | 14,190 | | | Texas Capital Bancshares,
Inc.(a) | | | 591,155 | |
| | 7,520 | | | Tompkins Financial Corp. | | | 314,336 | |
| | 122,567 | | | United Community Financial
Corp.(a) | | | 507,427 | |
| | 27,003 | | | ViewPoint Financial Group, Inc. | | | 502,796 | |
| | 24,349 | | | Washington Banking Co. | | | 336,016 | |
| | 22,657 | | | Western Alliance Bancorp(a) | | | 333,284 | |
| | 24,650 | | | Xenith Bankshares, Inc.(a) | | | 134,096 | |
| | | | | | | 38,032,669 | |
| | | | | | | | | |
| Banks: Savings, Thrift & Mortgage: 6.65% | |
| | 19,950 | | | Berkshire Hills Bancorp, Inc. | | | 515,907 | |
| | 48,225 | | | Capitol Federal Financial, Inc. | | | 570,984 | |
| | 7,875 | | | Elmira Savings Bank | | | 186,756 | |
| | 21,600 | | | First Pactrust Bancorp, Inc. | | | 245,376 | |
| | 12,500 | | | Flushing Financial Corp. | | | 189,750 | |
| | 14,850 | | | Heritage Financial Corp. | | | 207,157 | |
| | 3,300 | | | Hingham Institution for Savings | | | 224,433 | |
| | 11,680 | | | Home Bancorp, Inc.(a) | | | 211,408 | |
| | 16,830 | | | Provident New York Bancorp | | | 152,143 | |
| | 16,999 | | | Teche Holding Co. | | | 700,359 | |
| | 8,830 | | | Territorial Bancorp, Inc. | | | 206,445 | |
| | 25,000 | | | WSB Holdings, Inc.(a) | | | 163,750 | |
| | | | | | | 3,574,468 | |
| | | | | | | | | |
| Commercial Finance & Mortgage: 1.37% | |
| | 41,410 | | | Walker & Dunlop, Inc.(a) | | | 737,512 | |
| | | | | | | | | |
| Consumer Lending: 1.03% | | | | |
| | 27,087 | | | Tree.com, Inc. | | | 554,471 | |
| | |
| Annual Report | April 30, 2013 | | 11 |
| | |
| Emerald Banking and Finance Fund | | Schedule of Investments |
| | April 30, 2013 |
| | | | | | | | |
| Shares | | | | | Value (Note 2) | |
| Diversified Financial Services: 0.98% | |
| | 13,960 | | | Evercore Partners, Inc., Class A | | | $526,990 | |
| | | | | | | | | |
| Financial Data & Systems: 1.38% | |
| | 17,722 | | | Cass Information Systems, Inc. | | | 740,780 | |
| | | | | | | | | |
| Insurance: Multi-Line: 1.48% | | | | |
| | 53,048 | | | Health Insurance Innovations, Inc., Class A(a) | | | 795,720 | |
| | | | | | | | | |
| Insurance: Property-Casualty: 2.24% | |
| | 20,028 | | | Amtrust Financial Services, Inc. | | | 634,087 | |
| | 98,165 | | | United Insurance Holdings Corp. | | | 568,375 | |
| | | | | | | 1,202,462 | |
| | | | | | | | | |
| Real Estate Investment Trusts (REITs): 11.51% | |
| | 8,720 | | | American Campus Communities, Inc. | | | 389,261 | |
| | 35,023 | | | Campus Crest Communities, Inc. | | | 478,414 | |
| | 56,708 | | | CapitalSource, Inc. | | | 507,536 | |
| | 21,230 | | | CubeSmart | | | 373,011 | |
| | 55,060 | | | DiamondRock Hospitality Co. | | | 549,499 | |
| | 63,190 | | | Glimcher Realty Trust, REIT | | | 792,403 | |
| | 44,350 | | | Hersha Hospitality Trust, Priority A Shares | | | 265,213 | |
| | 16,870 | | | PennyMac Mortgage Investment Trust | | | 425,967 | |
| | 8,840 | | | Saul Centers, Inc. | | | 396,032 | |
| | 3,700 | | | Sovran Self Storage, Inc. | | | 253,820 | |
| | 90,210 | | | Summit Hotel Properties, Inc., REIT | | | 901,198 | |
| | 5,290 | | | Tanger Factory Outlet Centers, Inc. | | | 196,365 | |
| | 22,180 | | | Urstadt Biddle Properties, Inc., Class A | | | 493,949 | |
| | 10,250 | | | Whitestone, Class B | | | 169,125 | |
| | | | | | | 6,191,793 | |
| | |
| | | | Total Common Stocks (Cost $39,585,271) | | | 52,394,165 | |
| |
| RIGHTS: 0.00% | | | | |
| | 40,100 | | | United Community Financial Corp.,Strike Price $2.75, (expiring 05/31/2013)(a) | | | 0 | |
| | |
| | | | Total Rights (Cost $0) | | | 0 | |
| | | | | | | | | |
| SHORT TERM INVESTMENTS: 3.12% | |
| | 1,677,501 | | | Dreyfus Government Cash Management Fund - Institutional Class 0.010%
(7-Day Yield) | | | 1,677,501 | |
| | |
| | | | Total Short Term Investments (Cost $1,677,501) | | | 1,677,501 | |
| | | | | | |
| Shares | | | | Value (Note 2) | |
| | Total Investments: 100.55% (Cost $41,262,772) | | $ | 54,071,666 | |
| | |
| | Liabilities In Excess Of Other Assets: (0.55)% | | | (294,942 | ) |
| | |
| | Net Assets: 100.00% | | $ | 53,776,724 | |
| (a) | Non-income producing security. |
Holdings are subject to change.
For Fund compliance purposes, the Fund’s industry classifications refer to any one or more of the industry sub-classifications used by one or more widely recognized market indexes or ratings group indexes, and/or as defined by Fund management. This definition may not apply for purposes of this report, which may combine industry sub-classifications for reporting ease. Industries are shown as a percent of net assets.
See Notes to Financial Statements.
| | |
| 12 | | www.emeraldmutualfunds.com |
| | |
| Emerald Growth Fund | | Schedule of Investments |
| | April 30, 2013 |
| | | | | | | | |
| Shares | | | | | Value (Note 2) | |
| COMMON STOCKS: 99.12% | | | | |
| Consumer Discretionary: 19.16% | | | | |
| | 22,469 | | | BJ’s Restaurants, Inc.(a) | | | $770,687 | |
| | 85,256 | | | Black Diamond, Inc.(a) | | | 835,509 | |
| | 40,038 | | | Carmike Cinemas, Inc.(a) | | | 703,067 | |
| | 68,420 | | | Christopher & Banks Corp.(a) | | | 475,519 | |
| | 23,682 | | | Chuy’s Holdings, Inc.(a) | | | 774,401 | |
| | 28,510 | | | Diversified Restaurant Holdings, Inc.(a) | | | 198,144 | |
| | 102,910 | | | Fifth & Pacific Cos., Inc.(a) | | | 2,122,004 | |
| | 19,283 | | | Five Below, Inc.(a) | | | 693,995 | |
| | 24,151 | | | Francesca’s Holdings Corp.(a) | | | 689,753 | |
| | 13,661 | | | Hibbett Sports, Inc.(a) | | | 749,306 | |
| | 36,365 | | | HomeAway, Inc.(a) | | | 1,110,951 | |
| | 177,567 | | | Hovnanian Enterprises, Inc., Class A(a) | | | 967,740 | |
| | 22,927 | | | Jack in the Box, Inc.(a) | | | 821,933 | |
| | 15,570 | | | Lithia Motors, Inc., Class A | | | 771,026 | |
| | 27,765 | | | Mattress Firm Holding Corp.(a) | | | 1,063,955 | |
| | 36,969 | | | Meritage Homes Corp.(a) | | | 1,803,718 | |
| | 99,291 | | | Multimedia Games Holding Co., Inc(a) | | | 2,448,516 | |
| | 50,318 | | | Red Robin Gourmet Burgers, Inc.(a) | | | 2,433,882 | |
| | 49,827 | | | SHFL Entertainment, Inc.(a) | | | 787,267 | |
| | 61,539 | | | Sinclair Broadcast Group, Inc., Class A | | | 1,649,245 | |
| | 136,276 | | | Standard Pacific Corp.(a) | | | 1,233,298 | |
| | 28,509 | | | Taylor Morrison Home Corp., Class A(a) | | | 734,962 | |
| | 51,723 | | | Tile Shop Holdings, Inc.(a) | | | 1,282,730 | |
| | 47,382 | | | Tilly’s, Inc., Class A(a) | | | 684,196 | |
| | 19,371 | | | Vitamin Shoppe, Inc.(a) | | | 952,085 | |
| | | | | | | 26,757,889 | |
| | | | | | | | | |
| Consumer Staples: 1.84% | | | | |
| | 134,180 | | | Female Health Co. | | | 1,029,160 | |
| | 25,405 | | | GNC Holdings, Inc., Class A | | | 1,151,609 | |
| | 24,112 | | | PhotoMedex, Inc.(a) | | | 393,026 | |
| | | | | | | 2,573,795 | |
| | | | | | | | | |
| Energy: 4.39% | | | | |
| | 8,756 | | | Bonanza Creek Energy, Inc.(a) | | | 300,769 | |
| | 18,357 | | | Delek US Holdings, Inc. | | | 662,504 | |
| | 52,214 | | | Diamondback Energy, Inc.(a) | | | 1,371,140 | |
| | 31,555 | | | Gulfport Energy Corp.(a) | | | 1,646,855 | |
| | 48,740 | | | Kodiak Oil & Gas Corp.(a) | | | 381,634 | |
| | 257,254 | | | Magnum Hunter Resources Corp.(a) | | | 699,731 | |
| | 66,008 | | | Rex Energy Corp.(a) | | | 1,060,748 | |
| | | | | | | 6,123,381 | |
| | | | | | | | | |
| Financial Services: 12.32% | | | | |
| | 40,414 | | | Amtrust Financial Services, Inc. | | | 1,279,507 | |
| | 69,562 | | | Bank of the Ozarks, Inc. | | | 2,847,173 | |
| | 9,347 | | | Blackhawk Network Holdings, Inc.(a) | | | 223,767 | |
| | 26,164 | | | Cardinal Financial Corp. | | | 399,001 | |
| | 88,491 | | | CoBiz Financial, Inc. | | | 757,483 | |
| | 29,369 | | | EverBank Financial Corp. | | | 469,904 | |
| | 34,616 | | | Evercore Partners, Inc., Class A | | | 1,306,754 | |
| | | | | | | | |
| Shares | | | | | Value (Note 2) | |
| Financial Services (continued) | | | | |
| | 12,912 | | | Financial Engines, Inc. | | $ | 469,609 | |
| | 71,394 | | | Glimcher Realty Trust, REIT | | | 895,281 | |
| | 56,789 | | | Health Insurance Innovations, Inc., Class A(a) | | | 851,835 | |
| | 118,203 | | | Howard Bancorp, Inc.(a) | | | 871,747 | |
| | 45,359 | | | Pacific Premier Bancorp, Inc.(a) | | | 551,112 | |
| | 89,944 | | | Summit Hotel Properties, Inc., REIT | | | 898,541 | |
| | 85,813 | | | Susquehanna Bancshares, Inc. | | | 1,001,438 | |
| | 30,001 | | | SVB Financial Group(a) | | | 2,133,371 | |
| | 23,976 | | | Texas Capital Bancshares, Inc.(a) | | | 998,840 | |
| | 69,920 | | | Walker & Dunlop, Inc.(a) | | | 1,245,275 | |
| | | | | | | 17,200,638 | |
| | | | | | | | | |
| Health Care: 25.45% | | | | |
| | 37,503 | | | Abaxis, Inc. | | | 1,601,003 | |
| | 86,721 | | | Acadia Healthcare Co., Inc.(a) | | | 2,736,048 | |
| | 93,366 | | | Achillion Pharmaceuticals, Inc.(a) | | | 703,980 | |
| | 39,001 | | | Aegerion Pharmaceuticals, Inc.(a) | | | 1,639,602 | |
| | 199,931 | | | Akorn, Inc.(a) | | | 3,008,962 | |
| | 40,817 | | | Alnylam Pharmaceuticals, Inc.(a) | | | 977,567 | |
| | 139,964 | | | BioScrip, Inc.(a) | | | 1,939,901 | |
| | 32,490 | | | Cambrex Corp.(a) | | | 405,800 | |
| | 125,282 | | | Celldex Therapeutics, Inc.(a) | | | 1,634,930 | |
| | 50,716 | | | Cepheid, Inc.(a) | | | 1,933,801 | |
| | 41,575 | | | Conceptus, Inc.(a) | | | 1,289,241 | |
| | 68,022 | | | Exact Sciences Corp.(a) | | | 635,325 | |
| | 39,180 | | | Greatbatch, Inc.(a) | | | 1,094,689 | |
| | 20,028 | | | HMS Holdings Corp.(a) | | | 504,906 | |
| | 68,490 | | | Incyte Corp., Ltd.(a) | | | 1,517,053 | |
| | 26,519 | | | Infinity Pharmaceuticals, Inc.(a) | | | 1,142,704 | |
| | 40,920 | | | Jazz Pharmaceuticals PLC(a) | | | 2,387,682 | |
| | 34,061 | | | MWI Veterinary Supply, Inc.(a) | | | 4,009,320 | |
| | 168,013 | | | NPS Pharmaceuticals, Inc.(a) | | | 2,256,415 | |
| | 38,934 | | | Omnicell, Inc.(a) | | | 701,591 | |
| | 103,680 | | | Regulus Therapeutics, Inc.(a) | | | 727,834 | |
| | 47,046 | | | Sarepta Therapeutics, Inc.(a) | | | 1,366,216 | |
| | 17,976 | | | Synageva BioPharma Corp.(a) | | | 929,179 | |
| | 39,682 | | | Verastem, Inc.(a) | | | 389,677 | |
| | | | | | | 35,533,426 | |
| | | | | | | | | |
| Materials & Processing: 6.89% | | | | |
| | 19,080 | | | Acuity Brands, Inc. | | | 1,392,077 | |
| | 57,533 | | | Apogee Enterprises, Inc. | | | 1,465,941 | |
| | 25,585 | | | Boise Cascade Co.(a) | | | 819,487 | |
| | 17,377 | | | Eagle Materials, Inc. | | | 1,177,292 | |
| | 62,293 | | | Trex Co., Inc(a) | | | 3,032,423 | |
| | 66,875 | | | USG Corp.(a) | | | 1,738,081 | |
| | | | | | | 9,625,301 | |
| | | | | | | | | |
| Producer Durables: 11.56% | | | | |
| | 9,095 | | | Chart Industries, Inc.(a) | | | 771,347 | |
| | 40,133 | | | FARO Technologies, Inc.(a) | | | 1,556,759 | |
| | |
| Annual Report | April 30, 2013 | | 13 |
| | |
| Emerald Growth Fund | | Schedule of Investments |
| | April 30, 2013 |
| | | | | | | | |
| Shares | | | | | Value (Note 2) | |
| | |
| Producer Durables (continued) | |
| | 27,980 | | | H&E Equipment Services, Inc. | | | $569,673 | |
| | 12,292 | | | Middleby Corp.(a) | | | 1,838,637 | |
| | 28,470 | | | Mistras Group, Inc.(a) | | | 539,507 | |
| | 84,747 | | | Roadrunner Transportation Systems, Inc.(a) | | | 1,907,655 | |
| | 101,353 | | | Spirit Airlines, Inc.(a) | | | 2,706,125 | |
| | 31,316 | | | Triumph Group, Inc. | | | 2,502,148 | |
| | 31,354 | | | United Rentals, Inc.(a) | | | 1,649,534 | |
| | 29,300 | | | WESCO International, Inc.(a) | | | 2,100,517 | |
| | | | | | | 16,141,902 | |
|
| | |
| Technology: 17.01% | | | | |
| | 17,016 | | | 3D Systems Corp.(a) | | | 650,692 | |
| | 69,757 | | | Aruba Networks, Inc.(a) | | | 1,568,835 | |
| | 74,171 | | | Brightcove, Inc.(a) | | | 446,509 | |
| | 37,106 | | | Cavium, Inc.(a) | | | 1,166,984 | |
| | 60,521 | | | EPAM Systems, Inc.(a) | | | 1,301,201 | |
| | 94,863 | | | ExactTarget, Inc.(a) | | | 1,857,417 | |
| | 52,142 | | | Finisar Corp.(a) | | | 669,503 | |
| | 25,550 | | | Fortinet, Inc.(a) | | | 458,878 | |
| | 34,150 | | | Guidewire Software,
Inc.(a) | | | 1,368,732 | |
| | 76,158 | | | Infoblox, Inc.(a) | | | 1,683,853 | |
| | 35,889 | | | IPG Photonics Corp. | | | 2,285,411 | |
| | 97,219 | | | Ixia, Inc.(a) | | | 1,601,197 | |
| | 74,203 | | | Jive Software, Inc.(a) | | | 1,008,419 | |
| | 19,815 | | | Microsemi Corp.(a) | | | 412,152 | |
| | 60,323 | | | Mindspeed Technologies,
Inc.(a) | | | 138,140 | |
| | 13,083 | | | Peregrine Semiconductor Corp.(a) | | | 126,382 | |
| | 50,957 | | | QLIK Technologies, Inc.(a) | | | 1,325,392 | |
| | 125,261 | | | Saba Software, Inc.(a) | | | 1,139,875 | |
| | 45,784 | | | Sourcefire, Inc.(a) | | | 2,186,644 | |
| | 16,640 | | | Ultimate Software Group,
Inc.(a) | | | 1,607,258 | |
| | 20,905 | | | Uni-Pixel, Inc.(a) | | | 743,173 | |
| | | | | | | 23,746,647 | |
|
| | |
| Utilities: 0.50% | | | | |
| | 96,753 | | | 8x8, Inc.(a) | | | 699,524 | |
| | | | | | | 699,524 | |
| | |
| | | | Total Common Stocks (Cost $100,225,064) | | | 138,402,503 | |
|
| | |
| WARRANTS: 0.00%(b) | | | | |
| | 22,283 | | | Magnum Hunter Resources Corp.,
Strike Price $10.50 (expiring 10/14/13)(a)(c) | | | 3,120 | |
| | |
| | | | Total Warrants (Cost $0) | | | 3,120 | |
| | | | | | |
| Shares | | | | Value (Note 2) | |
| |
SHORT TERM INVESTMENTS: 1.28% | |
| 1,787,701 | | Dreyfus Government Cash Management Fund - Institutional Class 0.010% (7-Day Yield) | | | $1,787,701 | |
| | |
| | Total Short Term Investments (Cost $1,787,701) | | | 1,787,701 | |
| | Total Investments: 100.40% (excluding investments purchased with cash collateral from securities loaned) (Cost $102,012,765) | | | 140,193,324 | |
|
| |
| INVESTMENTS PURCHASED WITH CASH COLLATERAL FROM SECURITIES LOANED: 0.02% | |
| 22,051 | | Short-Term Investments Trust, Liquid Assets Portfolio Institutional
Class, 0.110% (7 Day Yield)(d) | | | 22,051 | |
| | |
| | Total Investments Purchased with Cash Collateral From Securities Loaned (Cost $22,051) | | | 22,051 | |
| | |
| | Total Investments: 100.42% (Cost $102,034,816) | | | 140,215,375 | |
| | |
| | Liabilities In Excess Of Other Assets: (0.42)% | | | (583,994 | ) |
| | |
| | Net Assets: 100.00% | | | $139,631,381 | |
| (a) | Non-income producing security. |
| (b) | Less than 0.0005% of Net Assets. |
| (c) | Security, or portion of security, is currently on loan. |
| (d) | The security has been segregated to satisfy the commitment to return the cash collateral received in securities lending transactions upon the borrower’s return of the securities loaned. (Note 2). |
Holdings are subject to change.
For Fund compliance purposes, the Fund’s industry classifications refer to any one or more of the industry sub-classifications used by one or more widely recognized market indexes or ratings group indexes, and/or as defined by Fund management. This definition may not apply for purposes of this report, which may combine industry sub-classifications for reporting ease. Industries are shown as a percent of net assets.
See Notes to Financial Statements.
| | |
| 14 | | www.emeraldmutualfunds.com |
| | |
| Emerald Funds | | Statements of Assets and Liabilities |
| | April 30, 2013 |
| | | | | | | | |
| | | EMERALD
BANKING
AND
FINANCE
FUND | | | EMERALD
GROWTH
FUND | |
ASSETS: | | | | | | | | |
Investments, at value(a) | | $ | 54,071,666 | | | $ | 140,215,375 | |
Cash | | | – | | | | 9,769 | |
Receivable for investments sold | | | – | | | | 138,335 | |
Receivable for shares sold | | | 94,674 | | | | 8,821 | |
Interest and dividends receivable | | | 26,246 | | | | 24,727 | |
Other assets | | | 18,337 | | | | 18,113 | |
| | | | | | | | |
Total Assets | | | 54,210,923 | | | | 140,415,140 | |
| | | | | | | | |
LIABILITIES: | | | | | | | | |
Payable for investments purchased | | | 298,976 | | | | 473,582 | |
Payable for shares redeemed | | | 33,163 | | | | 127,971 | |
Payable for collateral upon return of securities loaned | | | – | | | | 22,051 | |
Payable to advisor | | | 28,544 | | | | 74,382 | |
Payable to fund accounting and administration | | | 5,598 | | | | 12,830 | |
Payable for distribution and service fees | | | 29,252 | | | | 30,882 | |
Payable for trustee fees and expenses | | | 739 | | | | 1,762 | |
Payable to transfer agents | | | 11,273 | | | | 7,218 | |
Payable for chief compliance officer fee | | | 985 | | | | 2,348 | |
Payable for principal financial officer fee | | | 246 | | | | 587 | |
Payable for audit fee | | | 16,446 | | | | 16,576 | |
Accrued expenses and other liabilities | | | 8,977 | | | | 13,570 | |
| | | | | | | | |
Total Liabilities | | | 434,199 | | | | 783,759 | |
| | | | | | | | |
NET ASSETS | | $ | 53,776,724 | | | $ | 139,631,381 | |
| | | | | | | | |
NET ASSETS CONSIST OF: | | | | | | | | |
Paid-in capital (Note 5) | | $ | 52,188,446 | | | $ | 96,562,006 | |
Accumulated net investment loss | | | – | | | | (390,898 | ) |
Accumulated net realized gain/(loss) on investments | | | (11,220,616 | ) | | | 5,279,714 | |
Net unrealized appreciation on investments | | | 12,808,894 | | | | 38,180,559 | |
| | | | | | | | |
NET ASSETS | | $ | 53,776,724 | | | $ | 139,631,381 | |
| | | | | | | | |
INVESTMENTS, AT COST | | $ | 41,262,772 | | | $ | 102,034,816 | |
PRICING OF SHARES | | | | | | | | |
Class A: (b) | | | | | | | | |
Net Asset Value, offering and redemption price per share | | $ | 20.08 | | | $ | 15.60 | |
Net Assets | | $ | 25,496,020 | | | $ | 46,604,977 | |
Shares of beneficial interest outstanding | | | 1,269,915 | | | | 2,987,574 | |
Maximum offering price per share (NAV/.9525, based on maximum sales charge of 4.75% of the offering price) | | $ | 21.08 | | | $ | 16.38 | |
Class C: (b) | | | | | | | | |
Net Asset Value, offering and redemption price per share | | $ | 18.46 | | | $ | 14.07 | |
Net Assets | | $ | 17,704,878 | | | $ | 4,945,616 | |
Shares of beneficial interest outstanding | | | 958,916 | | | | 351,537 | |
Institutional Class: | | | | | | | | |
Net Asset Value, offering and redemption price per share | | $ | 20.15 | | | $ | 15.86 | |
Net Assets | | $ | 4,321,035 | | | $ | 86,238,428 | |
Shares of beneficial interest outstanding | | | 214,485 | | | | 5,437,988 | |
Investor Class: | | | | | | | | |
Net Asset Value, offering and redemption price per share | | $ | 19.23 | | | $ | 15.57 | |
Net Assets | | $ | 6,254,791 | | | $ | 1,842,360 | |
Shares of beneficial interest outstanding | | | 325,295 | | | | 118,332 | |
| (a) | At April 30, 2013, securities with a market value of $- and $3,120, respectively, were on loan to brokers. |
| (b) | Redemption price per share may be reduced for any applicable contingent deferred sales charge. For a description of a possible sales charge, please see the Funds’ Prospectus. |
See Notes to Financial Statements.
| | |
| Annual Report | April 30, 2013 | | 15 |
| | |
| Emerald Funds | | Statements of Operations |
| | For the Year Ended April 30, 2013 |
| | | | | | | | |
| | | EMERALD
BANKING AND
FINANCE
FUND | | | EMERALD
GROWTH
FUND | |
INVESTMENT INCOME: | | | | | | | | |
Dividends | | $ | 782,825 | | | $ | 348,177 | |
Foreign taxes withheld | | | (27) | | | | – | |
Securities lending income | | | – | | | | 79 | |
| | | | | | | | |
Total Investment Income | | | 782,798 | | | | 348,256 | |
| | | | | | | | |
| | |
EXPENSES: | | | | | | | | |
Investment advisory fee | | | 437,752 | | | | 920,598 | |
Administration fee | | | 44,249 | | | | 115,522 | |
Custodian fee | | | 6,786 | | | | 15,234 | |
Legal and audit fee | | | 23,210 | | | | 30,491 | |
Transfer agent fee | | | 78,073 | | | | 60,394 | |
Trustee fees and expenses | | | 3,149 | | | | 8,816 | |
Registration/filing fees | | | 48,115 | | | | 49,473 | |
Reports to shareholder and printing fees | | | 8,306 | | | | 11,766 | |
Distribution and service fees | | | | | | | | |
Class A | | | 82,741 | | | | 142,661 | |
Class C | | | 153,129 | | | | 35,422 | |
Institutional Class | | | 673 | | | | 38,530 | |
Investor Class | | | 13,906 | | | | 5,536 | |
Chief compliance officer fee | | | 10,497 | | | | 29,503 | |
Principal financial officer fee | | | 2,624 | | | | 7,376 | |
Other | | | 9,668 | | | | 17,481 | |
| | | | | | | | |
Total expenses before waiver | | | 922,878 | | | | 1,488,803 | |
Less fees waived/reimbursed by investment adviser (Note 6) | | | (20,178) | | | | (112,836) | |
| | | | | | | | |
Total Net Expenses | | | 902,700 | | | | 1,375,967 | |
| | | | | | | | |
| | |
NET INVESTMENT LOSS: | | | (119,902) | | | | (1,027,711) | |
| | | | | | | | |
Net realized gain on investments | | | 5,057,984 | | | | 11,995,509 | |
Net change in unrealized appreciation on investments | | | 2,441,099 | | | | 148,175 | |
| | | | | | | | |
NET REALIZED AND UNREALIZED GAIN ON INVESTMENTS | | | 7,499,083 | | | | 12,143,684 | |
| | | | | | | | |
NET INCREASE IN NET ASSETS RESULTING FROM OPERATIONS | | $ | 7,379,181 | | | $ | 11,115,973 | |
| | | | | | | | |
See Notes to Financial Statements.
| | |
| 16 | | www.emeraldmutualfunds.com |
| | |
| Emerald Banking and Finance Fund | | Statements of Changes in Net Assets |
| | | | | | | | | | | | |
| | | Year Ended
April 30, 2013 | | | For the Period
January 1, 2012 to
April 30, 2012 (a)(b) | | | Year Ended
December 31, 2011 | |
OPERATIONS: | | | | | | | | | | | | |
Net investment loss | | $ | (119,902) | | | $ | (55,289) | | | $ | (171,307) | |
Net realized gain on investments | | | 5,057,984 | | | | 377,708 | | | | 1,403,730 | |
Net change in unrealized appreciation/(depreciation) on investments | | | 2,441,099 | | | | 3,624,786 | | | | (3,408,071) | |
| | | | | | | | | | | | |
Net increase/(decrease) in net assets resulting from operations | | | 7,379,181 | | | | 3,947,205 | | | | (2,175,648) | |
| | | | | | | | | | | | |
| | | |
SHARE TRANSACTIONS (NOTE 5): | | | | | | | | | | | | |
Class A | | | | | | | | | | | | |
Proceeds from sale of shares | | | 16,828,917 | | | | 558,884 | | | | 7,104,262 | |
Cost of shares redeemed | | | (16,569,563) | | | | (1,955,508) | | | | (12,134,100) | |
| | | | | | | | | | | | |
Net increase/(decrease) from share transactions | | | 259,354 | | | | (1,396,624) | | | | (5,029,838) | |
| | | | | | | | | | | | |
Class C | | | | | | | | | | | | |
Proceeds from sale of shares | | | 3,125,343 | | | | 289,945 | | | | 925,478 | |
Cost of shares redeemed | | | (2,586,830) | | | | (833,416) | | | | (4,259,179) | |
| | | | | | | | | | | | |
Net increase/(decrease) from share transactions | | | 538,513 | | | | (543,471) | | | | (3,333,701) | |
| | | | | | | | | | | | |
Institutional Class | | | | | | | | | | | | |
Proceeds from sale of shares | | | 4,004,050 | | | | 7,500 | | | | – | |
Cost of shares redeemed | | | (26,445) | | | | – | | | | – | |
| | | | | | | | | | | | |
Net increase from share transactions | | | 3,977,605 | | | | 7,500 | | | | – | |
| | | | | | | | | | | | |
Investor Class | | | | | | | | | | | | |
Proceeds from sale of shares | | | 4,980,596 | | | | 553,960 | | | | 192,346 | |
Cost of shares redeemed | | | (111,720) | | | | (38,595) | | | | (62,335) | |
| | | | | | | | | | | | |
Net increase from share transactions | | | 4,868,876 | | | | 515,365 | | | | 130,011 | |
| | | | | | | | | | | | |
Net increase/(decrease) in net assets | | $ | 17,023,529 | | | $ | 2,529,975 | | | $ | (10,409,176) | |
| | | | | | | | | | | | |
NET ASSETS: | | | | | | | | | | | | |
Beginning of period | | | 36,753,195 | | | | 34,223,220 | | | | 44,632,396 | |
| | | | | | | | | | | | |
End of period (including accumulated net investment income of $0, $0 and $0, respectively) | | $ | 53,776,724 | | | $ | 36,753,195 | | | $ | 34,223,220 | |
| | | | | | | | | | | | |
| | | |
Other Information: | | | | | | | | | | | | |
SHARE TRANSACTIONS: | | | | | | | | | | | | |
Class A | | | | | | | | | | | | |
Sold | | | 900,183 | | | | 34,567 | | | | 459,338 | |
Redeemed | | | (889,933) | | | | (121,170) | | | | (796,670) | |
| | | | | | | | | | | | |
Net increase/(decrease) in shares outstanding | | | 10,250 | | | | (86,603) | | | | (337,332) | |
| | | | | | | | | | | | |
Class C | | | | | | | | | | | | |
Sold | | | 179,911 | | | | 19,157 | | | | 64,376 | |
Redeemed | | | (156,661) | | | | (55,919) | | | | (297,678) | |
| | | | | | | | | | | | |
Net increase/(decrease) in shares outstanding | | | 23,250 | | | | (36,762) | | | | (233,302) | |
| | | | | | | | | | | | |
Institutional Class | | | | | | | | | | | | |
Sold | | | 215,452 | | | | 445 | | | | – | |
Redeemed | | | (1,412) | | | | – | | | | – | |
| | | | | | | | | | | | |
Net increase in shares outstanding | | | 214,040 | | | | 445 | | | | – | |
| | | | | | | | | | | | |
Investor Class | | | | | | | | | | | | |
Sold | | | 289,184 | | | | 35,715 | | | | 13,276 | |
Redeemed | | | (6,528) | | | | (2,485) | | | | (4,161) | |
| | | | | | | | | | | | |
Net increase in shares outstanding | | | 282,656 | | | | 33,230 | | | | 9,115 | |
| | | | | | | | | | | | |
| (a) | The Fund began offering Institutional Class shares on March 16, 2012. |
| (b) | Effective March 13, 2012, the Board approved changing the fiscal year-end of the Fund from December 31 to April 30. |
See Notes to Financial Statements.
| | |
| Annual Report | April 30, 2013 | | 17 |
| | |
| Emerald Growth Fund | | Statements of Changes in Net Assets |
| | | | | | | | | | | | |
| | | Year Ended
April 30, 2013 | | | For the Period
January 1, 2012 to
April 30, 2012 (a) | | | Year Ended
December 31, 2011 (b) | |
OPERATIONS: | | | | | | | | | | | | |
Net investment loss | | $ | (1,027,711) | | | $ | (343,635) | | | $ | (998,270) | |
Net realized gain on investments | | | 11,995,509 | | | | 4,975,489 | | | | 17,632,425 | |
Net change in unrealized appreciation/(depreciation) on investments | | | 148,175 | | | | 17,806,862 | | | | (18,505,164) | |
| | | | | | | | | | | | |
Net increase/(decrease) in net assets resulting from operations | | | 11,115,973 | | | | 22,438,716 | | | | (1,871,009) | |
| | | | | | | | | | | | |
| | | |
DISTRIBUTIONS TO SHAREHOLDERS: | | | | | | | | | | | | |
From net realized gains on investments | | | | | | | | | | | | |
Class A | | | (4,685,787) | | | | – | | | | – | |
Class C | | | (490,319) | | | | – | | | | – | |
Institutional Class | | | (8,763,223) | | | | – | | | | – | |
Investor Class | | | (164,347) | | | | – | | | | – | |
| | | | | | | | | | | | |
Net decrease in net assets from distributions | | | (14,103,676) | | | | – | | | | – | |
| | | | | | | | | | | | |
SHARE TRANSACTIONS (NOTE 5): | | | | | | | | | | | | |
Class A | | | | | | | | | | | | |
Proceeds from sale of shares | | | 8,448,904 | | | | 1,322,264 | | | | 6,495,536 | |
Issued to shareholders in reinvestment of distributions | | | 4,124,748 | | | | – | | | | – | |
Cost of shares redeemed | | | (7,040,533) | | | | (4,049,586) | | | | (15,702,192) | |
| | | | | | | | | | | | |
Net increase/(decrease) from share transactions | | | 5,533,119 | | | | (2,727,322) | | | | (9,206,656) | |
| | | | | | | | | | | | |
Class C | | | | | | | | | | | | |
Proceeds from sale of shares | | | 2,232,832 | | | | 160,186 | | | | 598,742 | |
Issued to shareholders in reinvestment of distributions | | | 398,442 | | | | – | | | | – | |
Cost of shares redeemed | | | (635,817) | | | | (440,586) | | | | (652,998) | |
| | | | | | | | | | | | |
Net increase/(decrease) from share transactions | | | 1,995,457 | | | | (280,400) | | | | (54,256) | |
| | | | | | | | | | | | |
Institutional Class | | | | | | | | | | | | |
Proceeds from sale of shares | | | 11,472,743 | | | | 6,741,602 | | | | 14,532,788 | |
Issued to shareholders in reinvestment of distributions | | | 8,744,099 | | | | – | | | | – | |
Cost of shares redeemed | | | (15,124,866) | | | | (2,499,170) | | | | (13,251,443) | |
| | | | | | | | | | | | |
Net increase from share transactions | | | 5,091,976 | | | | 4,242,432 | | | | 1,281,345 | |
| | | | | | | | | | | | |
Investor Class | | | | | | | | | | | | |
Proceeds from sale of shares | | | 773,551 | | | | 24,856 | | | | 942,919 | |
Issued to shareholders in reinvestment of distributions | | | 164,347 | | | | – | | | | – | |
Cost of shares redeemed | | | (190,984) | | | | (6,289) | | | | (8,611) | |
| | | | | | | | | | | | |
Net increase from share transactions | | | 746,914 | | | | 18,567 | | | | 934,308 | |
| | | | | | | | | | | | |
Net increase/(decrease) in net assets | | $ | 10,379,763 | | | $ | 23,691,993 | | | $ | (8,916,268) | |
| | | | | | | | | | | | |
NET ASSETS: | | | | | | | | | | | | |
Beginning of period | | | 129,251,618 | | | | 105,559,625 | | | | 114,475,893 | |
| | | | | | | | | | | | |
End of period (including accumulated net investment income/(loss) of $(390,898), $0 and $0, respectively) | | $ | 139,631,381 | | | $ | 129,251,618 | | | $ | 105,559,625 | |
| | | | | | | | | | | | |
| | |
| 18 | | www.emeraldmutualfunds.com |
| | |
| Emerald Growth Fund | | Statements of Changes in Net Assets |
| | |
| | | | | | | | | | | | |
| | | Year Ended
April 30, 2013 | | | For the Period
January 1, 2012 to
April 30, 2012 (a) | | | Year Ended
December 31, 2011 (b) | |
Other Information: | | | | | | | | | | | | |
SHARE TRANSACTIONS: | | | | | | | | | | | | |
Class A | | | | | | | | | | | | |
Sold | | | 563,949 | | | | 86,928 | | | | 459,368 | |
Distributions reinvested | | | 297,172 | | | | – | | | | – | |
Redeemed | | | (465,853) | | | | (263,330) | | | | (1,139,141) | |
| | | | | | | | | | | | |
Net increase/(decrease) in shares outstanding | | | 395,268 | | | | (176,402) | | | | (679,773) | |
| | | | | | | | | | | | |
Class C | | | | | | | | | | | | |
Sold | | | 163,382 | | | | 10,962 | | | | 48,633 | |
Distributions reinvested | | | 31,748 | | | | – | | | | – | |
Redeemed | | | (46,882) | | | | (30,490) | | | | (49,356) | |
| | | | | | | | | | | | |
Net increase/(decrease) in shares outstanding | | | 148,248 | | | | (19,528) | | | | (723) | |
| | | | | | | | | | | | |
Institutional Class | | | | | | | | | | | | |
Sold | | | 745,549 | | | | 428,209 | | | | 1,000,591 | |
Distributions reinvested | | | 620,149 | | | | – | | | | – | |
Redeemed | | | (1,001,795) | | | | (160,803) | | | | (938,781) | |
| | | | | | | | | | | | |
Net increase in shares outstanding | | | 363,903 | | | | 267,406 | | | | 61,810 | |
| | | | | | | | | | | | |
Investor Class | | | | | | | | | | | | |
Sold | | | 51,913 | | | | 1,619 | | | | 66,493 | |
Distributions reinvested | | | 11,857 | | | | – | | | | – | |
Redeemed | | | (12,514) | | | | (400) | | | | (636) | |
| | | | | | | | | | | | |
Net increase in shares outstanding | | | 51,256 | | | | 1,219 | | | | 65,857 | |
| | | | | | | | | | | | |
| (a) | Effective March 13, 2012, the Board approved changing the fiscal year-end of the Fund from December 31 to April 30. |
| (b) | The Fund began offering Investor Class shares on May 2, 2011. |
See Notes to Financial Statements.
| | |
| Annual Report | April 30, 2013 | | 19 |
| | |
| Emerald Banking and Finance Fund | | Financial Highlights |
| | For a share outstanding throughout the periods presented |
| | | | | | | | | | | | | | | | | | | | | | | | |
| | | CLASS A | |
| |
| | | Year Ended
April 30, 2013 | | | For the Period
January 1, 2012 to
April 30, 2012 (a)(b) | | | Year Ended
December 31, 2011 | | | Year Ended
December 31, 2010 | | | Year Ended
December 31, 2009 | | | Year Ended
December 31, 2008 (c) | |
NET ASSET VALUE, BEGINNING OF PERIOD | | $ | 16.96 | | | $ | 15.16 | | | $ | 15.89 | | | $ | 13.62 | | | $ | 15.39 | | | $ | 19.61 | |
INCOME/(LOSS) FROM OPERATIONS:(d) | | | | | | | | | | | | | | | | | | | | | |
Net investment income/(loss) | | | (0.01) | (e) | | | (0.01) | (e) | | | (0.03) | (e) | | | (0.04) | | | | 0.02 | (e) | | | 0.08 | |
Net realized and unrealized gain/(loss) on investments | | | 3.13 | | | | 1.81 | | | | (0.70) | | | | 2.31 | | | | (1.76) | | | | (4.28) | |
| | | | | | | | | | | | | | | | | | | | | | | | |
Total from Investment Operations | | | 3.12 | | | | 1.80 | | | | (0.73) | | | | 2.27 | | | | (1.74) | | | | (4.20) | |
| | | | | | | | | | | | | | | | | | | | | | | | |
| | | | | | |
LESS DISTRIBUTIONS: | | | | | | | | | | | | | | | | | | | | | | | | |
From investment income | | | – | | | | – | | | | – | | | | – | | | | (0.03) | | | | (0.02) | |
| | | | | | | | | | | | | | | | | | | | | | | | |
Total Distributions | | | – | | | | – | | | | – | | | | – | | | | (0.03) | | | | (0.02) | |
| | | | | | | | | | | | | | | | | | | | | | | | |
NET INCREASE/(DECREASE) IN NET ASSET VALUE | | | 3.12 | | | | 1.80 | | | | (0.73) | | | | 2.27 | | | | (1.77) | | | | (4.22) | |
| | | | | | | | | | | | | | | | | | | | | | | | |
NET ASSET VALUE, END OF PERIOD | | $ | 20.08 | | | $ | 16.96 | | | $ | 15.16 | | | $ | 15.89 | | | $ | 13.62 | | | $ | 15.39 | |
| | | | | | | | | | | | | | | | | | | | | | | | |
| | | | | | |
TOTAL RETURN(f) | | | 18.40 | % | | | 11.87 | %(g) | | | (4.59) | % | | | 16.67 | % | | | (11.29) | % | | | (21.41) | % |
RATIOS/SUPPLEMENTAL DATA: | | | | | | | | | | | | | | | | | | | | | | | | |
Net Assets, End of Period (000s) | | $ | 25,496 | | | $ | 21,363 | | | $ | 20,412 | | | $ | 26,756 | | | $ | 22,675 | | | $ | 48,460 | |
RATIOS TO AVERAGE NET ASSETS: | | | | | | | | | | | | | | | | | | | | | | | | |
Net Investment income/(loss) | | | (0.06) | % | | | (0.24) | %(h) | | | (0.22) | % | | | (0.22) | % | | | 0 .15 | % | | | 0 .36 | % |
Operating expenses excluding reimbursement/waiver | | | 1 .88 | % | | | 1.96 | %(h) | | | 1 .90 | % | | | 1 .95 | % | | | 1 .88 | % | | | 1 .65 | % |
Operating expenses including reimbursement/waiver | | | 1 .84 | % | | | 1.85 | %(h) | | | n/a | | | | n/a | | | | n/a | | | | n/a | |
PORTFOLIO TURNOVER RATE | | | 53 | % | | | 9 | %(g) | | | 27 | % | | | 48 | % | | | 43 | % | | | 61 | % |
| (a) | Prior to its March 16, 2012 reorganization with and into the Emerald Banking and Finance Fund, the Fund was known as the Forward Banking and Finance Fund. |
| (b) | Effective March 13, 2012 the Board approved changing the fiscal year-end of the Fund from December 31 to April 30. |
| (c) | Prior to May 1, 2008, the Forward Banking and Finance Fund was known as the Forward Emerald Banking and Finance Fund. |
| (d) | The amount shown for a share outstanding throughout the period may not correlate with the Statement of Operations for the period due to the timing of sales and redemptions of Fund shares in relation to income earned and/or fluctuating market value of the investments of the Fund. |
| (e) | Per share amounts are based upon average shares outstanding. |
| (f) | Total return does not reflect the effect of sales charges. |
See Notes to Financial Statements.
| | |
| 20 | | www.emeraldmutualfunds.com |
| | |
| Emerald Banking and Finance Fund | | Financial Highlights |
| For a share outstanding throughout the periods presented |
| | | | | | | | | | | | | | | | | | | | | | | | |
| | | CLASS C | |
| |
| | | Year Ended
April 30, 2013 | | | For the Period
January 1, 2012 to
April 30, 2012 (a)(b) | | | Year Ended
December 31, 2011 | | | Year Ended
December 31, 2010 | | | Year Ended
December 31, 2009 | | | Year Ended
December 31, 2008 (c) | |
NET ASSET VALUE, BEGINNING OF PERIOD | | $ | 15.70 | | | $ | 14.06 | | | $ | 14.82 | | | $ | 12.77 | | | $ | 14.52 | | | $ | 18.60 | |
INCOME/(LOSS) FROM
OPERATIONS:(d) | | | | | | | | | | | | | | | | | |
Net investment loss | | | (0.11) | (e) | | | (0.04) | (e) | | | (0.11) | (e) | | | (0.18) | | | | (0.19) | | | | (0.19) | |
Net realized and unrealized gain/(loss) on investments | | | 2.87 | | | | 1.68 | | | | (0.65) | | | | 2.23 | | | | (1.56) | | | | (3.89) | |
| | | | | | | | | | | | | | | | | | | | | | | | |
Total from Investment Operations | | | 2.76 | | | | 1.64 | | | | (0.76) | | | | 2.05 | | | | (1.75) | | | | (4.08) | |
| | | | | | | | | | | | | | | | | | | | | | | | |
| | | | | | |
NET INCREASE/(DECREASE) IN NET ASSET VALUE | | | 2.76 | | | | 1.64 | | | | (0.76) | | | | 2.05 | | | | (1.75) | | | | (4.08) | |
| | | | | | | | | | | | | | | | | | | | | | | | |
NET ASSET VALUE, END OF PERIOD | | $ | 18.46 | | | $ | 15.70 | | | $ | 14.06 | | | $ | 14.82 | | | $ | 12.77 | | | $ | 14.52 | |
| | | | | | | | | | | | | | | | | | | | | | | | |
| | | | | | |
TOTAL RETURN(f) | | | 17.58 | % | | | 11.66 | %(g) | | | (5.13) | % | | | 16.05 | % | | | (12.05) | % | | | (21.94) | % |
RATIOS/SUPPLEMENTAL DATA: | | | | | | | | | | | | | | | | | | | | | | | | |
Net Assets, End of Period (000s) | | $ | 17,705 | | | $ | 14,690 | | | $ | 13,675 | | | $ | 17,872 | | | $ | 16,907 | | | $ | 23,486 | |
RATIOS TO AVERAGE NET ASSETS: | | | | | | | | | | | | | | | | | | | | | | | | |
Net Investment loss | | | (0.68) | % | | | (0.82) | %(h) | | | (0.77) | % | | | (0.77) | % | | | (0.47) | % | | | (0.30) | % |
Operating expenses excluding reimbursement/waiver | | | 2 .54 | % | | | 2.55 | %(h) | | | 2 .45 | % | | | 2 .50 | % | | | 2 .49 | % | | | 2 .30 | % |
Operating expenses including reimbursement/waiver | | | 2 .49 | % | | | 2.44 | %(h) | | | n/a | | | | n/a | | | | n/a | | | | n/a | |
PORTFOLIO TURNOVER RATE | | | 53 | % | | | 9 | %(g) | | | 27 | % | | | 48 | % | | | 43 | % | | | 61 | % |
| (a) | Prior to its March 16, 2012 reorganization with and into the Emerald Banking and Finance Fund, the Fund was known as the Forward Banking and Finance Fund. |
| (b) | Effective March 13, 2012 the Board approved changing the fiscal year-end of the Fund from December 31 to April 30. |
| (c) | Prior to May 1, 2008, the Forward Banking and Finance Fund was known as the Forward Emerald Banking and Finance Fund. |
| (d) | The amount shown for a share outstanding throughout the period may not correlate with the Statement of Operations for the period due to the timing of sales and redemptions of Fund shares in relation to income earned and/or fluctuating market value of the investments of the Fund. |
| (e) | Per share amounts are based upon average shares outstanding. |
| (f) | Total return does not reflect the effect of sales charges. |
See Notes to Financial Statements.
| | |
| Annual Report | April 30, 2013 | | 21 |
| | |
| Emerald Banking and Finance Fund | | Financial Highlights |
| | For a share outstanding throughout the periods presented |
| | | | | | | | |
| | | INSTITUTIONAL CLASS | |
| |
| | | Year Ended
April 30,
2013 | | | For the Period March 16, 2012 to
April 30, 2012 (a) | |
NET ASSET VALUE, BEGINNING OF PERIOD | | $ | 16.96 | | | $ | 16.85 | |
INCOME/(LOSS) FROM OPERATIONS: | |
Net investment income/(loss)(b) | | | 0.01 | | | | (0.01) | |
Net realized and unrealized gain on investments | | | 3.18 | | | | 0.12 | |
| | | | | | | | |
Total from Investment Operations | | | 3.19 | | | | 0.11 | |
| | | | | | | | |
| | |
NET INCREASE IN NET ASSET VALUE | | | 3.19 | | | | 0.11 | |
| | | | | | | | |
NET ASSET VALUE, END OF PERIOD | | $ | 20.15 | | | $ | 16.96 | |
| | | | | | | | |
| | |
TOTAL RETURN | | | 18.81 | % | | | 0.65 | %(c) |
RATIOS/SUPPLEMENTAL DATA: | | | | | | | | |
Net Assets, End of Period (000s) | | $ | 4,321 | | | $ | 8 | |
RATIOS TO AVERAGE NET ASSETS: | | | | | | | | |
Net Investment income/(loss) | | | 0.06 | % | | | (0.27) | %(d) |
Operating expenses excluding reimbursement/waiver | | | 1.62 | % | | | 1.83 | %(d) |
Operating expenses including reimbursement/waiver | | | 1.54 | % | | | 1.53 | %(d) |
PORTFOLIO TURNOVER RATE | | | 53 | % | | | 9 | %(c)(e) |
| (a) | The Fund began offering Institutional Class shares on March 16, 2012. |
| (b) | Per share amounts are based upon average shares outstanding. |
| (e) | Portfolio turnover rate is calculated at the Fund level and represents the period ended April 30, 2012. |
See Notes to Financial Statements.
| | |
| 22 | | www.emeraldmutualfunds.com |
| | |
| Emerald Banking and Finance Fund | | Financial Highlights |
| For a share outstanding throughout the periods presented |
| | | | | | | | | | | | | | | | |
| | | INVESTOR CLASS | |
| |
| | | Year Ended
April 30,
2013 | | | For the Period
January 1, 2012 to
April 30, 2012 (a)(b) | | | Year Ended
December 31, 2011 | | | Period Ended December 31,
2010 (c) | |
NET ASSET VALUE, BEGINNING OF PERIOD | | $ | 16.25 | | | $ | 14.50 | | | $ | 15.14 | | | $ | 14.85 | |
INCOME/(LOSS) FROM OPERATIONS:(d) | | | | | | | | | |
| | | | | | | | | |
Net investment income/(loss)(e) | | | (0.01) | | | | (0.00) | (f) | | | 0.07 | | | | (0.02) | |
Net realized and unrealized gain/(loss) on investments | | | 2.99 | | | | 1.75 | | | | (0.71) | | | | 0.31 | |
| | | | | | | | | | | | | | | | |
Total from Investment Operations | | | 2.98 | | | | 1.75 | | | | (0.64) | | | | 0.29 | |
| | | | | | | | | | | | | | | | |
| | | | |
NET INCREASE/(DECREASE) IN NET ASSET VALUE | | | 2.98 | | | | 1.75 | | | | (0.64) | | | | 0.29 | |
| | | | | | | | | | | | | | | | |
NET ASSET VALUE, END OF PERIOD | | $ | 19.23 | | | $ | 16.25 | | | $ | 14.50 | | | $ | 15.14 | |
| | | | | | | | | | | | | | | | |
| | | | |
TOTAL RETURN | | | 18.34 | % | | | 12.07 | %(g) | | | (4.23) | % | | | 1.95 | %(g) |
RATIOS/SUPPLEMENTAL DATA: | | | | | | | | | | | | | | | | |
Net Assets, End of Period (000s) | | $ | 6,255 | | | $ | 693 | | | $ | 136 | | | $ | 4 | |
RATIOS TO AVERAGE NET ASSETS: | | | | | | | | | | | | | | | | |
Net Investment income/(loss) | | | (0.08) | % | | | (0.07) | %(h) | | | 0.47 | % | | | (0.20) | %(h) |
Operating expenses excluding reimbursement/waiver | | | 1.94 | % | | | 1.88 | %(h) | | | 1.48 | % | | | 1.83 | %(h) |
Operating expenses including reimbursement/waiver | | | 1.89 | % | | | 1.72 | %(h) | | | n/a | | | | n/a | |
PORTFOLIO TURNOVER RATE | | | 53 | % | | | 9 | %(g) | | | 27 | % | | | 48 | %(i) |
| (a) | Prior to its March 16, 2012 reorganization with and into the Emerald Banking and Finance Fund, the Fund was known as the Forward Banking and Finance Fund. |
| (b) | Effective March 13, 2012 the Board approved changing the fiscal year-end of the Fund from December 31 to April 30. |
| (c) | The Fund began offering Investor Class shares on March 16, 2010. |
| (d) | The amount shown for a share outstanding throughout the period may not correlate with the Statement of Operations for the period due to the timing of sales and redemptions of Fund shares in relation to income earned and/or fluctuating market value of the investments of the Fund. |
| (e) | Per share amounts are based upon average shares outstanding. |
| (f) | Less than $0.005 per share. |
| (i) | Portfolio turnover rate is calculated at the Fund level and represents the year ended December 31, 2010. |
See Notes to Financial Statements.
| | |
| Annual Report | April 30, 2013 | | 23 |
| | |
| Emerald Growth Fund | | Financial Highlights |
| | For a share outstanding throughout the periods presented |
| | | | | | | | | | | | | | | | | | | | | | | | |
| | | CLASS A | |
| |
| | | Year Ended
April 30,
2013 | | | For the Period
January 1, 2012 to
April 30, 2012 (a)(b) | | | Year Ended
December 31,
2011 | | | Year Ended
December 31,
2010 | | | Year Ended
December 31,
2009 | | | Year Ended December 31,
2008 (c) | |
NET ASSET VALUE, BEGINNING OF PERIOD | | $ | 16.20 | | | $ | 13.37 | | | $ | 13.57 | | | $ | 10.63 | | | $ | 7.99 | | | $ | 12.73 | |
INCOME/(LOSS) FROM OPERATIONS: | | | | | | | | | | | | | | | | | | | | | |
Net investment loss | | | (0.15 | ) (d) | | | (0.05 | ) (d) | | | (0.14 | ) (d) | | | (0.12 | ) | | | (0.11 | ) | | | (0.11 | ) |
Net realized and unrealized gain/(loss) on investments | | | 1.40 | | | | 2.88 | | | | (0.06 | ) | | | 3.06 | | | | 2.75 | | | | (4.59 | ) |
| | | | | | | | | | | | | | | | | | | | | | | | |
Total from Investment Operations | | | 1.25 | | | | 2.83 | | | | (0.20 | ) | | | 2.94 | | | | 2.64 | | | | (4.70 | ) |
| | | | | | | | | | | | | | | | | | | | | | | | |
| | | | | | |
LESS DISTRIBUTIONS: | | | | | | | | | | | | | | | | | | | | | | | | |
From capital gains | | | (1.85 | ) | | | – | | | | – | | | | – | | | | – | | | | (0.04 | ) |
| | | | | | | | | | | | | | | | | | | | | | | | |
Total Distributions | | | (1.85 | ) | | | – | | | | – | | | | – | | | | – | | | | (0.04 | ) |
| | | | | | | | | | | | | | | | | | | | | | | | |
NET INCREASE/(DECREASE) IN NET ASSET VALUE | | | (0.60 | ) | | | 2.83 | | | | (0.20 | ) | | | 2.94 | | | | 2.64 | | | | (4.74 | ) |
| | | | | | | | | | | | | | | | | | | | | | | | |
NET ASSET VALUE, END OF PERIOD | | $ | 15.60 | | | $ | 16.20 | | | $ | 13.37 | | | $ | 13.57 | | | $ | 10.63 | | | $ | 7.99 | |
| | | | | | | | | | | | | | | | | | | | | | | | |
| | | | | | |
TOTAL RETURN(e) | | | 9.14 | % | | | 21.17 | %(f) | | | (1.47 | )% | | | 27.66 | % | | | 33.04 | % | | | (36.91 | )% |
RATIOS/SUPPLEMENTAL DATA: | | | | | | | | | | | | | | | | | | | | | | | | |
Net Assets, End of Period (000s) | | $ | 46,605 | | | $ | 41,991 | | | $ | 37,008 | | | $ | 46,785 | | | $ | 51,177 | | | $ | 92,675 | |
RATIOS TO AVERAGE NET ASSETS: | | | | | | | | | | | | | | | | | | | | | | | | |
Net Investment loss | | | (1.01 | )% | | | (1.02 | )%(g) | | | (1.03 | )% | | | (0.85 | )% | | | (1.03 | )% | | | (0.95 | )% |
Operating expenses excluding reimbursement/waiver | | | 1.38 | % | | | 1.36 | %(g) | | | 1.36 | % | | | 1.41 | % | | | 1.38 | % | | | 1.35 | % |
Operating expenses including reimbursement/waiver | | | 1.29 | % | | | 1.29 | %(g) | | | 1.29 | % | | | 1.29 | % | | | 1.29 | %(h) | | | n/a | |
PORTFOLIO TURNOVER RATE | | | 78 | % | | | 28 | %(f) | | | 75 | % | | | 78 | % | | | 113 | % | | | 108 | % |
| (a) | Prior to its March 16, 2012 reorganization with and into the Emerald Growth Fund, the Fund was known as the Forward Growth Fund. |
| (b) | Effective March 13, 2012 the Board approved changing the fiscal year-end of the Fund from December 31 to April 30. |
| (c) | Prior to May 1, 2008, the Forward Growth Fund was known as the Forward Emerald Growth Fund. |
| (d) | Per share amounts are based upon average shares outstanding. |
| (e) | Total return does not reflect the effect of sales charges. |
| (h) | Effective January 1, 2009, the Advisor agreed to limit expenses at 1.29%. |
See Notes to Financial Statements.
| | |
| 24 | | www.emeraldmutualfunds.com |
| | |
| Emerald Growth Fund | | Financial Highlights |
| | For a share outstanding throughout the periods presented |
| | | | | | | | | | | | | | | | | | | | | | | | |
| | | CLASS C | |
| | | Year Ended
April 30, 2013 | | | For the Period
January 1, 2012 to April 30, 2012(a)(b) | | | Year Ended
December 31, 2011 | | | Year Ended
December 31, 2010 | | | Year Ended
December 31, 2009 | | | Year Ended
December 31, 2008(c) | |
NET ASSET VALUE, BEGINNING OF PERIOD | | $ | 14.89 | | | $ | 12.31 | | | $ | 12.58 | | | $ | 9.92 | | | $ | 7.49 | | | $ | 12.03 | |
INCOME/(LOSS) FROM
OPERATIONS: | | | | | | | | | | | | | | | | | |
Net investment loss | | | (0.23) | (d) | | | (0.08) | (d) | | | (0.22) | (d) | | | (0.03) | | | | (0.36) | | | | (0.48) | |
Net realized and unrealized gain/(loss) on investments | | | 1.26 | | | | 2.66 | | | | (0.05) | | | | 2.69 | | | | 2.79 | | | | (4.02) | |
| | | | | | | | | | | | | | | | | | | | | | | | |
Total from Investment Operations | | | 1.03 | | | | 2.58 | | | | (0.27) | | | | 2.66 | | | | 2.43 | | | | (4.50) | |
| | | | | | | | | | | | | | | | | | | | | | | | |
| | | |
LESS DISTRIBUTIONS: | | | | | | | | | | | | | |
From capital gains | | | (1.85) | | | | – | | | | – | | | | – | | | | – | | | | (0.04) | |
| | | | | | | | | | | | | | | | | | | | | | | | |
Total Distributions | | | (1.85) | | | | – | | | | – | | | | – | | | | – | | | | (0.04) | |
| | | | | | | | | | | | | | | | | | | | | | | | |
NET INCREASE/(DECREASE) IN NET ASSET VALUE | | | (0.82) | | | | 2.58 | | | | (0.27) | | | | 2.66 | | | | 2.43 | | | | (4.54) | |
| | | | | | | | | | | | | | | | | | | | | | | | |
NET ASSET VALUE, END OF PERIOD | | $ | 14.07 | | | $ | 14.89 | | | $ | 12.31 | | | $ | 12.58 | | | $ | 9.92 | | | $ | 7.49 | |
| | | | | | | | | | | | | | | | | | | | | | | | |
| | | | | | |
TOTAL RETURN(e) | | | 8.43 | % | | | 20.96 | %(f) | | | (2.15) | % | | | 26.81 | % | | | 32.44 | % | | | (37.40) | % |
RATIOS/SUPPLEMENTAL
DATA: | | | | | | | | | | | | | | | | | |
Net Assets, End of Period (000s) | | $ | 4,946 | | | $ | 3,026 | | | $ | 2,743 | | | $ | 2,812 | | | $ | 2,555 | | | $ | 2,623 | |
RATIOS TO AVERAGE
NET ASSETS: | | | | | | | | | | | | | | | | | |
Net Investment loss | | | (1.65) | % | | | (1.67) | %(g) | | | (1.68) | % | | | (1.48) | % | | | (1.68) | % | | | (1.65) | % |
Operating expenses excluding reimbursement/waiver | | | 2.03 | % | | | 2.01 | %(g) | | | 2.01 | % | | | 2.06 | % | | | 2.04 | % | | | 2.04 | % |
Operating expenses including reimbursement/
waiver | | | 1.94 | % | | | 1.94 | %(g) | | | 1 94 | % | | | 1.94 | % | | | 1.94 | %(h) | | | n/a | |
PORTFOLIO TURNOVER RATE | | | 78 | % | | | 28 | %(f) | | | 75 | % | | | 78 | % | | | 113 | % | | | 108 | % |
| (a) | Prior to its March 16, 2012 reorganization with and into the Emerald Growth Fund, the Fund was known as the Forward Growth Fund. |
| (b) | Effective March 13, 2012 the Board approved changing the fiscal year-end of the Fund from December 31 to April 30. |
| (c) | Prior to May 1, 2008, the Forward Growth Fund was known as the Forward Emerald Growth Fund. |
| (d) | Per share amounts are based upon average shares outstanding. |
| (e) | Total return does not reflect the effect of sales charges. |
| (h) | Effective January 1, 2009, the Advisor agreed to limit expenses at 1.94%. |
See Notes to Financial Statements.
| | |
| Annual Report | April 30, 2013 | | 25 |
| | |
| Emerald Growth Fund | | Financial Highlights |
| | For a share outstanding throughout the periods presented |
| | | | | | | | | | | | | | | | | | | | | | | | |
| | | INSTITUTIONAL CLASS | |
| | | Year Ended
April 30, 2013 | | | For the Period
January 1, 2012 to April 30, 2012(a)(b) | | | Year Ended
December 31, 2011 | | | Year Ended
December 31, 2010 | | | Year Ended
December 31, 2009 | | | Period Ended
December 31, 2008(c)(d) | |
NET ASSET VALUE, BEGINNING OF PERIOD | | $ | 16.39 | | | $ | 13.51 | | | $ | 13.67 | | | $ | 10.68 | | | $ | 8.00 | | | $ | 9.03 | |
INCOME/(LOSS) FROM
OPERATIONS: | | | | | | | | | | | | | | | | | |
Net investment loss | | | (0.11) | (e) | | | (0.04) | (e) | | | (0.10) | (e) | | | (0.06) | | | | (0.17) | | | | (0.01) | |
Net realized and unrealized gain/(loss) on investments | | | 1.43 | | | | 2.92 | | | | (0.06) | | | | 3.05 | | | | 2.85 | | | | (0.98) | |
| | | | | | | | | | | | | | | | | | | | | | | | |
Total from Investment Operations | | | 1.32 | | | | 2.88 | | | | (0.16) | | | | 2.99 | | | | 2.68 | | | | (0.99) | |
| | | | | | | | | | | | | | | | | | | | | | | | |
| | | | |
LESS DISTRIBUTIONS: | | | | | | | | | | | | | | | | | |
From capital gains | | | (1.85) | | | | – | | | | – | | | | – | | | | – | | | | (0.04) | |
| | | | | | | | | | | | | | | | | | | | | | | | |
Total Distributions | | | (1.85) | | | | – | | | | – | | | | – | | | | – | | | | (0.04) | |
| | | | | | | | | | | | | | | | | | | | | | | | |
NET INCREASE/(DECREASE) IN NET ASSET VALUE | | | (0.53) | | | | 2.88 | | | | (0.16) | | | | 2.99 | | | | 2.68 | | | | (1.03) | |
| | | | | | | | | | | | | | | | | | | | | | | | |
NET ASSET VALUE, END OF PERIOD | | $ | 15.86 | | | $ | 16.39 | | | $ | 13.51 | | | $ | 13.67 | | | $ | 10.68 | | | $ | 8.00 | |
| | | | | | | | | | | | | | | | | | | | | | | | |
| | | | | | |
TOTAL RETURN | | | 9 .47 | % | | | 21.32 | %(f) | | | (1.17) | % | | | 28.00 | % | | | 33.50 | % | | | (10.95) | %(f) |
RATIOS/SUPPLEMENTAL
DATA: | | | | | | | | | | | | | | | | | |
Net Assets, End of Period (000s) | | $ | 86,238 | | | $ | 83,149 | | | $ | 64,930 | | | $ | 64,880 | | | $ | 47,091 | | | $ | 908 | |
RATIOS TO AVERAGE
NET ASSETS: | | | | | | | | | | | | | | | | | |
Net Investment loss | | | (0.71) | % | | | (0.72) | %(g) | | | (0.72) | % | | | (0.52) | % | | | (0.73) | % | | | (0.45) | %(g) |
Operating expenses excluding reimbursement/waiver | | | 1 .08 | % | | | 1.06 | %(g) | | | 1.06 | % | | | 1.11 | % | | | 1.08 | % | | | 1.08 | %(g) |
Operating expenses including reimbursement/
waiver | | | 0.99 | % | | | 0.99 | %(g) | | | 0.99 | % | | | 0.99 | % | | | 0.99 | %(h) | | | n/a | |
PORTFOLIO TURNOVER RATE | | | 78 | % | | | 28 | %(f) | | | 75 | % | | | 78 | % | | | 113 | % | | | 108 | %(i) |
| (a) | Prior to its March 16, 2012 reorganization with and into the Emerald Growth Fund, the Fund was known as the Forward Growth Fund. |
| (b) | Effective March 13, 2012 the Board approved changing the fiscal year-end of the Fund from December 31 to April 30. |
| (c) | The Fund began offering Institutional Class shares on October 21, 2008. |
| (d) | Prior to May 1, 2008, the Forward Growth Fund was known as the Forward Emerald Growth Fund. |
| (e) | Per share amounts are based upon average shares outstanding. |
| (h) | Effective January 1, 2009, the Advisor agreed to limit expenses at 0.99%. |
| (i) | Portfolio turnover rate is calculated at the Fund level and represents the year ended December 31, 2008. |
See Notes to Financial Statements.
| | |
| 26 | | www.emeraldmutualfunds.com |
| | |
| Emerald Growth Fund | | Financial Highlights |
| | For a share outstanding throughout the periods presented |
| | | | | | | | | | | | |
| | | INVESTOR CLASS | |
| | | Year Ended
April 30, 2013 | | | For the Period
January 1, 2012
to April 30, 2012(a)(b) | | | Period Ended
December 31, 2011(c) | |
NET ASSET VALUE, BEGINNING OF PERIOD | | $ | 16.18 | | | $ | 13.35 | | | $ | 15.74 | |
INCOME/(LOSS) FROM OPERATIONS: | | | | | | | | | | | | |
Net investment loss(d) | | | (0.16) | | | | (0.05) | | | | (0.09) | |
Net realized and unrealized gain/(loss) on investments | | | 1.40 | | | | 2.88 | | | | (2.30) | |
| | | | | | | | | | | | |
Total from Investment Operations | | | 1.24 | | | | 2.83 | | | | (2.39) | |
| | | | | | | | | | | | |
| | | |
LESS DISTRIBUTIONS: | | | | | | | | | | | | |
From capital gains | | | (1.85) | | | | – | | | | – | |
| | | | | | | | | | | | |
Total Distributions | | | (1.85) | | | | – | | | | – | |
| | | | | | | | | | | | |
NET INCREASE/(DECREASE) IN NET ASSET VALUE | | | (0.61) | | | | 2.83 | | | | (2.39) | |
| | | | | | | | | | | | |
NET ASSET VALUE, END OF PERIOD | | $ | 15.57 | | | $ | 16.18 | | | $ | 13.35 | |
| | | | | | | | | | | | |
| | | |
TOTAL RETURN | | | 9 .08% | | | | 21.20% | (e) | | | (15.18)% | (e) |
RATIOS/SUPPLEMENTAL DATA: | | | | | | | | | | | | |
Net Assets, End of Period (000s) | | $ | 1,842 | | | $ | 1,085 | | | $ | 879 | |
RATIOS TO AVERAGE NET ASSETS: | | | | | |
Net Investment loss | | | (1.05)% | | | | (1.07)% | (f) | | | (1 .00)% | (f) |
Operating expenses excluding reimbursement/waiver | | | 1 .43% | | | | 1 .41% | (f) | | | 1 .43% | (f) |
Operating expenses including reimbursement/waiver | | | 1 .34% | | | | 1 .34% | (f) | | | 1 .34% | (f) |
PORTFOLIO TURNOVER RATE | | | 78 % | | | | 28% | (e) | | | 75% | (g) |
| (a) | Prior to its March 16, 2012 reorganization with and into the Emerald Growth Fund, the Fund was known as the Forward Growth Fund. |
| (b) | Effective March 13, 2012 the Board approved changing the fiscal year-end of the Fund from December 31 to April 30. |
| (c) | The Fund began offering Investor Class shares on May 2, 2011. |
| (d) | Per share amounts are based upon average shares outstanding. |
| (g) | Portfolio turnover is calculated at the Fund level and represents the year ended December 31, 2011. |
See Notes to Financial Statements.
| | |
| Annual Report | April 30, 2013 | | 27 |
| | |
| Emerald Funds | | Notes to Financial Statements |
| | April 30, 2013 |
1. ORGANIZATION
Financial Investors Trust (the “Trust”), Delaware statutory trust, is an open-end management investment company registered under the Investment Company Act of 1940, as amended (the “1940 Act”). As of April 30, 2013, the Trust had 26 registered funds. This annual report describes the Emerald Banking and Finance Fund and Emerald Growth Fund (each a “Fund” and collectively, the “Funds”). Prior to March 16, 2012, the Emerald Banking and Finance Fund was known as the Forward Banking and Finance Fund and the Emerald Growth Fund was known as the Forward Growth Fund. Effective March 13, 2012, the Board of Trustees (the “Board”) approved changing the fiscal year end of the Funds from December 31 to April 30.
The Emerald Banking and Finance Fund seeks to achieve long term growth through capital appreciation with income as a secondary objective and invests primarily in equity securities of companies principally engaged in the banking or financial services industries.
The Emerald Growth Fund seeks to achieve long-term growth through capital appreciation and invests in equity securities, including common stocks, preferred stocks, and securities convertible into common or preferred stocks.
2. SIGNIFICANT ACCOUNTING POLICIES
The accompanying financial statements were prepared in accordance with accounting principles generally accepted in the United States of America (“U.S. GAAP”). The preparation of financial statements in conformity with U.S. GAAP requires management to make certain estimates and assumptions that affect the reported amounts of assets and liabilities and disclosures of contingent assets and liabilities at the date of the financial statements and the reported amounts of revenue and expenses during the period. Actual results could differ from those estimates. The following is a summary of significant accounting policies consistently followed by the Funds in preparation of their financial statements.
Investment Valuation: The Funds generally value their securities based on market prices determined at the close of regular trading on the New York Stock Exchange (“NYSE”), normally, 4:00 p.m. Eastern time, on each business day the NYSE is open for trading.
For equity securities and mutual funds that are traded on an exchange, the market price is usually the closing sale or official closing price on that exchange. In the case of equity securities not traded on an exchange, or if such closing prices are not otherwise available, the securities are valued at the mean of the most recent bid and ask prices on such day. Redeemable securities issued by open-end registered investment companies are valued at the investment company’s applicable net asset value.
The market price for debt obligations is generally the price supplied by an independent third-party pricing service approved by the Board of Trustees (the “Board”), which may use a matrix, formula or other objective method that takes into consideration quotations from dealers, market transactions in comparable investments, market indices and yield curves. If vendors are unable to supply a price, or if the price supplied is deemed to be unreliable, the market price may be determined using quotations received from one or more brokers–dealers that make a market in the security. Short–term debt obligations that will mature in 60 days or less are valued at amortized cost, unless it is determined that using this method would not reflect an investment’s fair value. Investments in non-exchange traded funds are fair valued at their respective net asset values.
Equity securities that are primarily traded on foreign securities exchanges are valued at the preceding closing values of such securities on their respective exchanges, except when an occurrence subsequent to the time a value was so established is likely to have changed such value. In such an event, the fair values of those securities are determined in good faith through consideration of other factors in accordance with procedures established by and under the general supervision of the Board.
When such prices or quotations are not available, or when the Fair Value Committee appointed by the Board believes that they are unreliable, securities may be priced using fair value procedures approved by the Board.
Fair Value Measurements: A three-tier hierarchy has been established to classify fair value measurements for disclosure purposes. Inputs refer broadly to the assumptions that market participants would use in pricing the asset or liability, including assumptions about risk. Inputs may be observable or unobservable. Observable inputs are inputs that reflect the assumptions market participants would use in pricing the asset or liability that are developed based on market data obtained from sources independent of the reporting entity. Unobservable inputs are inputs that reflect the reporting entity’s own assumptions about the assumptions market participants would use in pricing the asset or liability that are developed based on the best information available. Various inputs are used in determining the value of each Fund’s investments as of the reporting period end. The designated input levels are not necessarily an indication of the risk or liquidity associated with these investments. These inputs are categorized in the following hierarchy under applicable financial accounting standards:
| | | | |
| | Level 1 – | | Unadjusted quoted prices in active markets for identical investments, unrestricted assets or liabilities that the Funds have the ability to access at the measurement date; |
| | Level 2 – | | Quoted prices which are not active, quoted prices for similar assets or liabilities in active markets or inputs other than quoted prices that are observable (either directly or indirectly) for substantially the full term of the asset or liability; and |
| | |
| 28 | | www.emeraldmutualfunds.com |
| | |
| Emerald Funds | | Notes to Financial Statements |
| | April 30, 2013 |
| | | | |
| | Level 3 – | | Significant unobservable prices or inputs (including the Funds’ own assumptions in determining the fair value of investments) where there is little or no market activity for the asset or liability at the measurement date. |
The following is a summary of each input used to value the Funds as of April 30, 2013.
| | | | | | | | | | | | | | | | |
| Investments in Securities at Value | | Level 1 -
Quoted Prices | | | Level 2 - Other Significant
Observable Inputs | | | Level 3 -
Significant
Unobservable
Inputs | | | Total | |
| |
Emerald Banking and Finance Fund | |
Common Stocks | | | | | | | | | | | | | | | | |
Asset Management & Custodian | | $ | 37,300 | | | $ | – | | | $ | – | | | $ | 37,300 | |
Banks: Diversified | | | 37,288,783 | | | | 743,886 | | | | – | | | | 38,032,669 | |
Banks: Savings, Thrift & Mortgage | | | 3,574,468 | | | | – | | | | – | | | | 3,574,468 | |
Commercial Finance & Mortgage | | | 737,512 | | | | – | | | | – | | | | 737,512 | |
Consumer Lending | | | 554,471 | | | | – | | | | – | | | | 554,471 | |
Diversified Financial Services | | | 526,990 | | | | – | | | | – | | | | 526,990 | |
Financial Data & Systems | | | 740,780 | | | | – | | | | – | | | | 740,780 | |
Insurance: Multi-Line | | | 795,720 | | | | – | | | | – | | | | 795,720 | |
Insurance: Property-Casualty | | | 1,202,462 | | | | – | | | | – | | | | 1,202,462 | |
Real Estate Investment Trusts (REITs) | | | 6,191,793 | | | | – | | | | – | | | | 6,191,793 | |
Rights | | | – | | | | – | | | | 0 | | | | 0 | |
Short Term Investments | | | 1,677,501 | | | | – | | | | – | | | | 1,677,501 | |
| |
TOTAL | | $ | 53,327,780 | | | $ | 743,886 | | | $ | 0 | | | $ | 54,071,666 | |
| |
| | | | |
| Investments in Securities at Value | | Level 1 -
Quoted Prices | | | Level 2 - Other Significant
Observable Inputs | | | Level 3 -
Significant
Unobservable
Inputs | | | Total | |
| |
Emerald Growth Fund | | | | | | | | | | | | | | | | |
Common Stocks(a) | | $ | 138,402,503 | | | $ | – | | | $ | – | | | $ | 138,402,503 | |
Warrants | | | 3,120 | | | | – | | | | – | | | | 3,120 | |
Short Term Investments | | | 1,787,701 | | | | – | | | | – | | | | 1,787,701 | |
Investments Purchased with Cash Collateral From Securities Loaned | | | 22,051 | | | | – | | | | – | | | | 22,051 | |
| |
TOTAL | | $ | 140,215,375 | | | $ | – | | | $ | – | | | $ | 140,215,375 | |
| |
| (a) | For detailed descriptions of sector and industry, see the accompanying Schedule of Investments. |
The Funds recognize transfers between levels as of the end of the period. During the year ended April 30, 2013, there were no transfers between Level 1 and Level 2 securities.
For the year ended April 30, 2013, the Emerald Growth Fund did not have transfers between significant unobservable inputs (Level 3) used in determining fair value. For the year ended April 30, 2013, the Emerald Banking and Finance Fund had received rights at $0 cost and $0 market value in a level 3. Therefore, a reconciliation of assets in which unobservable inputs (Level 3) were used in determining fair value is not applicable.
Investment Transactions and Investment Income: Investment transactions are accounted for on the date the investments are purchased or sold (trade date). Realized gains and losses from investment transactions are reported on an identified cost basis, which is the same basis the Funds use for federal income tax purposes. Interest income, which includes accretion of discounts, is accrued and recorded as earned. Dividend income is recognized on the ex-dividend date or for certain foreign securities, as soon as information is available to the Funds. All of the realized and unrealized gains and losses and net investment income, are allocated daily to each class in proportion to its average daily net assets.
Real Estate Investment Trusts (“REITs”): The Funds may invest a portion of their assets in REITs and are subject to certain risks associated with direct investment in REITs. REITs may be affected by changes in the value of their underlying properties and by defaults by borrowers or tenants. REITs depend generally on their ability to generate cash flow to make distributions to shareowners, and certain REITs have self-liquidation provisions by which mortgages held may be paid in full and distributions of capital returns may be made at any time. In addition, the performance
| | |
| Annual Report | April 30, 2013 | | 29 |
| | |
| Emerald Funds | | Notes to Financial Statements |
| | April 30, 2013 |
of a REIT may be affected by its failure to qualify for tax-free pass-through of income under the Internal Revenue Code of 1986, as amended (the “Code”), or its failure to maintain exemption from registration under the Investment Company Act of 1940, as amended (the “1940 Act”).
Lending of Portfolio Securities: Prior to March 16, 2012, each Fund from time to time had lent portfolio securities to broker-dealers, banks or institutional borrowers of securities. The loans were secured by collateral in the form of cash that was equal to at least 102% of the fair value of the securities loaned plus accrued interest, if any. Upon lending its securities to third parties, a Fund receives compensation in the form of income on the investment of the cash collateral. Gain or loss in the fair value of the securities loaned that may occur during the term of the loan will be for the account of the Fund. The Fund has the right under the lending agreement to recover the securities from the borrower on demand, and loans are subject to termination by the lending Fund or the borrower at any time. While the lending Fund does not have the right to vote securities on loan, it intends, to the extent practicable, to terminate the loan and regain the right to vote if the matter to be voted upon is considered significant with respect to the investment. Additionally, the Fund does not have the right to sell or repledge collateral received in the form of securities unless the borrower goes into default. Each Fund receives cash collateral which is invested in the Short-Term Investment Trust Liquid Assets Portfolio Institutional Class. The risks to a Fund of securities lending are that the borrower may not provide additional collateral when required or return the securities when due. This collateral must be valued daily and should the market value of the loaned securities increase, the borrower must furnish additional collateral to the lending Fund. The Fund bears the risk of any income or gains and losses from investing and reinvesting cash pledged as collateral. During the time portfolio securities are on loan, the borrower pays the lending Fund the economic equivalent of any dividends or interest paid on such securities. In the event the borrower defaults on its obligation to the lending Fund, the lending Fund could experience delays in recovering its securities and possible capital losses. As of April 30, 2013, the Emerald Growth Fund had securities on loan valued at $3,120 and received cash collateral with a value of $22,051. The current security on loan (Magnum Hunter Resources Corp. Warrants) is held at the custodian Brown Brothers Harriman & Co. (“BBH”), and the warrants are due to expire on October 14, 2013. Once the warrant expires, BBH can recall and transfer the current quantity to Union Bank of California, the current custodian to the Funds.
Trust Expenses: Some expenses of the Trust can be directly attributed to the Funds. Expenses which cannot be directly attributed to the Funds are apportioned among all funds in the Trust based on average net assets of each fund.
Fund and Class Expenses: Expenses that are specific to a Fund or class of shares of a Fund are charged directly to that Fund or share class. All expenses of the Fund, other than class specific expenses, are allocated daily to each class in proportion to its average daily net assets. Expenses that are common to the Funds generally are allocated among the Funds in proportion to their average daily net assets. Fees provided under the distribution (Rule 12b-1) and/or shareholder service plans for a particular class of the Funds are charged to the operations of such class.
Federal Income Taxes: Each Fund complies with the requirements under Subchapter M of the Internal Revenue Code of 1986, as amended, applicable to regulated investment companies and intends to distribute substantially all of its net taxable income and net capital gains, if any, each year so that the Funds will not be subject to excise tax on undistributed income and gains. The Funds are not subject to income taxes to the extent such distributions are made.
As of and during the year ended April 30, 2013, the Funds did not have a liability for any unrecognized tax benefits. The Funds file U.S. federal, state, and local tax returns as required. The Funds’ tax returns are subject to examination by the relevant tax authorities until expiration of the applicable statute of limitations, which is generally three years after the filing of the tax return for federal purposes and four years for most state returns. Tax returns for open years have incorporated no uncertain tax positions that require a provision for income taxes.
Distributions to Shareholders: Each Fund normally pays dividends and distributes capital gains, if any, on an annual basis. Income dividend distributions are derived from interest and other income each Fund receives from its investments, including short-term capital gains. Long term capital gain distributions are derived from gains realized when each Fund sells a security it has owned for more than a year. Each Fund may make additional distributions and dividends at other times if the portfolio manager believes doing so may be necessary for each Fund to avoid or reduce taxes.
3. TAX BASIS INFORMATION
Reclassifications: As of April 30, 2013, permanent differences on book and tax accounting were reclassified. These differences had no effect on net assets and were primarily attributed to treatment of certain investments and net investment loss. These reclassifications were as follows:
| | | | | | | | | | | | |
| | | Accumulated Net
Investment Income | | | Accumulated Net
Realized Gain/(Loss)
on Investments | | | Paid-in Capital | |
Emerald Banking and Finance Fund | | $ | 119,902 | | | $ | – | | | $ | (119,902 | ) |
Emerald Growth Fund | | | 636,813 | | | | – | | | | (636,813 | ) |
| | |
| 30 | | www.emeraldmutualfunds.com |
| | |
| Emerald Funds | | Notes to Financial Statements |
| | April 30, 2013 |
Included in those amounts reclassified was a net operating loss offset to Paid-in capital for the Emerald Banking and Finance Fund for $119,902 and Emerald Growth Fund $636,813.
Tax Basis of Investments: As of April 30, 2013 the aggregate cost of investments, gross unrealized appreciation/ (depreciation) and net unrealized appreciation/depreciation for Federal tax purposes was as follows:
| | | | | | | | | | | | | | | | |
| | | Gross Appreciation
(excess of value
over tax cost) | | | Gross Depreciation
(excess of tax cost over value) | | | Net Unrealized
Appreciation/
(Depreciation) | | | Cost of Investments for
Income Tax Purposes | |
| |
Emerald Banking and Finance Fund | | $ | 13,248,591 | | | $ | (462,137 | ) | | $ | 12,786,454 | | | $ | 41,285,212 | |
Emerald Growth Fund | | | 41,191,957 | | | | (3,155,037 | ) | | | 38,036,920 | | | | 102,178,455 | |
Components of Earnings: As of April 30, 2013, components of distributable earnings were as follows:
| | | | | | | | |
| | | Emerald Banking and
Finance Fund | | | Emerald Growth Fund | |
| |
Accumulated capital gains/(losses) | | $ | (11,198,176 | ) | | $ | 5,423,353 | |
Net unrealized appreciation on investments | | | 12,786,454 | | | | 38,036,920 | |
Other cumulative effect of timing differences | | | – | | | | (390,898 | ) |
| |
Total | | $ | 1,588,278 | | | $ | 43,069,375 | |
| |
As of April 30, 2013, Emerald Growth Fund elects to defer to the period ending April 30, 2014, late year ordinary losses in the amount of $390,898.
Capital Losses: As of April 30, 2013, the Funds had capital loss carryforwards which may reduce the Funds’ taxable income arising from future net realized gains on investments, if any, to the extent permitted by the Code and thus may reduce the amount of the distributions to shareholders which would otherwise be necessary to relieve the Funds of any liability for federal tax. Pursuant to the Code, such capital loss carryforwards will expire as follows:
| | | | | | | | |
| | | Expiring in 2017 | | | Expiring in 2018 | |
| |
Emerald Banking and Finance Fund | | $ | 9,827,290 | | | $ | 1,370,886 | |
During the year ended April 30, 2013, $5,047,204 of capital loss carryforwards were utilized by the Emerald Banking and Finance Fund.
Tax Basis of Distributions to Shareholders: The character of distributions made during the year from net investment income or net realized gains may differ from its ultimate characterization for federal income tax purposes. Also, due to the timing of dividend distributions, the fiscal year in which amounts are distributed may differ from the fiscal year in which the income or realized gain were recorded by each Fund.
The tax character of distributions paid by the Funds for the fiscal year ended April 30, 2013, were as follows:
| | | | | | | | |
| | | Ordinary Income | | | Long-Term Capital Gain | |
| |
Emerald Banking and Finance Fund | | $ | – | | | $ | – | |
Emerald Growth Fund | | | – | | | | 14,103,676 | |
During the period ended April 30, 2012 and the year ended December 31, 2011, the Funds did not make any distributions.
4. SECURITIES TRANSACTIONS
The cost of purchases and proceeds from sales of securities (excluding short-term securities) during the year ended April 30, 2013, was as follows:
| | | | | | | | |
| Funds | | Cost of Investments
Purchased | | | Proceeds from
Investments Sold | |
| |
Emerald Banking and Finance Fund | | $ | 31,446,601 | | | $ | 22,857,700 | |
Emerald Growth Fund | | | 95,559,631 | | | | 96,539,610 | |
| | |
| Annual Report | April 30, 2013 | | 31 |
| | |
| Emerald Funds | | Notes to Financial Statements |
| | April 30, 2013 |
5. SHARES OF BENEFICIAL INTEREST
The capitalization of the Trust consists of an unlimited number of shares of beneficial interest with no par value per share. Holders of the shares of the Funds of the Trust have one vote for each share held and a proportionate fraction of a vote for each fractional share. All shares issued and outstanding are fully paid and are non-assessable, transferable and redeemable at the option of the shareholder. Shares have no pre-emptive rights.
6. MANAGEMENT AND RELATED-PARTY TRANSACTIONS
Emerald Mutual Fund Advisers Trust, (“the Adviser”), subject to the authority of the Board, is responsible for the overall management and administration of the Funds’ business affairs. The Adviser manages the investments of the Funds in accordance with the Funds’ investment objective, policies and limitations and investment guidelines established jointly by the Adviser and the Trustees. Pursuant to the Advisory Agreement, the Funds pay the Adviser fees for the services and facilities it provides payable on a monthly basis at the annual rate set forth below of the Funds’ average daily net assets.
Emerald Banking and Finance Fund
| | |
| Average Total Net Assets | | Contractual Fee |
|
Between $0-$100M | | 1.00% |
Above $100M | | 0.90% |
| |
Emerald Growth Fund | | |
| Average Total Net Assets | | Contractual Fee |
|
Between $0-$250M | | 0.75% |
$250M-$500M | | 0.65% |
$500M-$750M | | 0.55% |
Above $750M | | 0.45% |
The Adviser has contractually agreed to limit the total amount of “Management Fees” and “Other Expenses” that it is entitled to receive from the Emerald Banking and Finance Fund through August 31, 2014 and the Emerald Growth Fund through August 31, 2013, respectively, with respect to the Funds’ different classes, to the extent the Total Annual Fund Operating Expenses of a Fund (exclusive of acquired fund fees and expenses, brokerage expenses, interest expense, taxes and extraordinary expenses) exceed the annual rates (as a percentage of each Funds average daily net assets) set forth on the tables below. The Adviser will reduce the fee payable with respect to such Fund to the extent of such excess, and/or shall reimburse the Fund (or class) by the amount of such excess. The waiver or reimbursement shall be allocated to each class of the Fund in the same manner as the underlying expenses or fees were allocated.
| | | | | | |
Emerald Banking and Finance Fund | | | | |
| Class A | | Class C | | Institutional Class | | Investor Class |
|
1.84% | | 2.49% | | 1.54% | | 1.89% |
| | | |
Emerald Growth Fund | | | | | | |
| Class A | | Class C | | Institutional Class | | Investor Class |
|
1.29% | | 1.94% | | 0.99% | | 1.34% |
For the year ended April 30, 2013, the fee waivers and/or reimbursements were as follows:
| | | | | | | | |
| Fund | | Fees Waived/Reimbursed by Adviser | | | Recoupment of Past Waived Fees by Adviser | |
| |
Emerald Banking and Finance Fund | | | | | |
Class A | | $ | 9,691 | | | $ | – | |
Class C | | | 7,599 | | | | – | |
Institutional Class | | | 1,062 | | | | – | |
Investor Class | | | 1,826 | | | | – | |
| |
Emerald Growth Fund | | | | | |
Class A | | $ | 37,509 | | | $ | – | |
Class C | | | 3,189 | | | | – | |
Institutional Class | | | 70,871 | | | | – | |
Investor Class | | | 1,267 | | | | – | |
| | |
| 32 | | www.emeraldmutualfunds.com |
| | |
| Emerald Funds | | Notes to Financial Statements |
| | April 30, 2013 |
As of April 30, 2013, the balances of recoupable expenses for each Fund were as follows:
| | | | | | | | | | | | |
| Fund | | Expires 2015 | | | Expires 2016 | | | Total | |
| |
Emerald Banking and Finance Fund | | | | | | | | | |
Class A | | $ | 7,504 | | | $ | 9,691 | | | $ | 17,195 | |
Class C | | | 5,168 | | | | 7,599 | | | | 12,767 | |
Institutional Class | | | 2 | | | | 1,062 | | | | 1,064 | |
Investor Class | | | 228 | | | | 1,826 | | | | 2,054 | |
Emerald Growth Fund | | | | | | | | | | | | |
Class A | | $ | 6,877 | | | $ | 37,509 | | | $ | 44,386 | |
Class C | | | 518 | | | | 3,189 | | | | 3,707 | |
Institutional Class | | | 13,614 | | | | 70,871 | | | | 84,485 | |
Investor Class | | | 177 | | | | 1,267 | | | | 1,444 | |
The Emerald Banking and Finance and Emerald Growth Funds will not be obligated to pay any such deferred fees and expenses more than three years after the year(s) in which the fees and expense were incurred.
Distributor: ALPS Distributors, Inc. (“ADI” or the “Distributor”) (an affiliate of ALPS Fund Services Inc. (“ALPS”)) acts as the distributor of the Funds’ shares pursuant to a Distribution Agreement with the Trust. Shares are sold on a continuous basis by ADI as agent for the Funds, and ADI has agreed to use its best efforts to solicit orders for the sale of Funds’ shares, although it is not obliged to sell any particular amount of shares. ADI is not entitled to any compensation for its services as Distributor. ADI is registered as a broker-dealer with the Securities and Exchange Commission.
Each Fund has adopted a separate Distribution and Services Plan (each a “Plan” and collectively, the “Plans”) pursuant to Rule 12b-1 of the 1940 Act. The Plans allow each Fund, as applicable, to use each Fund’s assets to pay fees in connection with the distribution and marketing of the Funds’ shares and/or the provision of shareholder services to the Funds’ shareholders. The Plan permits payment for services in connection with the administration of plans or programs that use shares of each Fund as their funding medium and for related expenses. The Plans permit each Fund to make total payments at an annual rate of up to 0.35%, 0.75% and 0.25% of the average daily net asset value of Class A, Class C and Investor Class, respectively. Because these fees are paid out of the Funds’ assets on an ongoing basis, over time they will increase the cost of an investment in the Funds, and Plan fees may cost an investor more than other types of sales charges.
Each Fund has adopted a Shareholder Services Plan (a “Shareholder Services Plan”) with respect to its shares. Under the Shareholder Services Plan, each Fund is authorized to pay banks and their affiliates and other institutions, including broker-dealers and Fund affiliates (“Participating Organizations”), an aggregate fee in an amount not to exceed on an annual basis 0.25%, 0.05% and 0.15% of the average daily net asset value of Class C, Institutional Class and Investor Class, respectively, of the Funds attributable to or held in the name of a Participating Organization for its clients as compensation for providing services pursuant to an agreement with a Participating Organization. Any amount of such payment not paid during the Funds’ fiscal year for such service activities shall be reimbursed to the Funds as soon as practicable after the end of the fiscal year. Shareholder Services Plan fees are included with distribution and service fees on the Statement of Operations.
Administrator: ALPS (an affiliate of ADI) serves as administrator to the Funds, and each Fund has agreed to pay expenses incurred in connection with its administrative activities. Pursuant to the Administration, Bookkeeping and Pricing Services Agreement (the “Agreement”), ALPS will provide operational services to the Funds including, but not limited to, fund accounting and fund administration and generally assist in each Fund’s operations.
The annual administrative fee, billed monthly in total and allocated to each Fund, in the amount of the greater of (a) the annual minimum for all Funds of $140,000 in Year 1 of operations and $200,000 in subsequent years or (b) following basis point fee schedule:
| | | | |
| Average Total Net Assets | | Contractual Fee | |
| |
Between $0-$500M | | | 0.06% | |
$500M-$1B | | | 0.04% | |
Above $1B | | | 0.025% | |
The Administrator is also reimbursed by the Funds for certain out-of-pocket expenses.
Transfer Agent: ALPS serves as transfer, dividend paying and shareholder servicing agent for the Funds. ALPS is compensated based upon a $25,000 annual base fee per Fund, and annually $9 per direct open account and $7 per open account through NSCC. ALPS is also reimbursed by the Funds for certain out-of-pocket expenses.
| | |
| Annual Report | April 30, 2013 | | 33 |
| | |
| Emerald Funds | | Notes to Financial Statements |
| | April 30, 2013 |
Compliance Services: ALPS provides services which assist the Trust’s Chief Compliance Officer, in monitoring and testing the policies and procedures of the Trust in conjunction with requirements under Rule 38a-1 under the 1940 Act and receives an annual base fee for all Funds of $40,000. ALPS is reimbursed for certain out-of-pocket expenses. The annual fee is billed monthly in total and allocated to each Fund.
Principal Financial Officer: ALPS receives an annual fee for both Funds of $10,000 for providing Principal Financial Officer (“PFO”) services to the Funds. The annual fee is billed monthly in total and allocated to each Fund.
7. INDEMNIFICATIONS
Under the Trust’s organizational documents, its officers and Trustees are indemnified against certain liability arising out of the performance of their duties to the Trust. Additionally, in the normal course of business, the Trust enters into contracts with service providers that may contain general indemnification clauses, which may permit indemnification to the extent permissible under applicable law. The Trust’s maximum exposure under these arrangements is unknown, as this would involve future claims that may be made against the Trust that have not yet occurred.
| | |
| 34 | | www.emeraldmutualfunds.com |
| | |
| Report of Independent Registered Public Accounting Firm |
| | |
To the Shareholders and Board of Trustees of Financial Investors Trust:
We have audited the accompanying statements of assets and liabilities, including the schedules of investments, of Emerald Banking and Finance Fund and Emerald Growth Fund (the “Funds”), two of the funds of Financial Investors Trust, as of April 30, 2013, the related statements of operations for the year then ended, and the statements of changes in net assets and the financial highlights for the year then ended and the period from January 1, 2012 to April 30, 2012. These financial statements and financial highlights are the responsibility of the Funds’ management. Our responsibility is to express an opinion on these financial statements and financial highlights based on our audits. The statements of changes in net assets for the year ended December 31, 2011, and the financial highlights for each of the four years in the period ended December 31, 2011 were audited by other auditors whose report, dated February 28, 2012, expressed an unqualified opinion on such financial statements and financial highlights.
We conducted our audits in accordance with the standards of the Public Company Accounting Oversight Board (United States). Those standards require that we plan and perform the audit to obtain reasonable assurance about whether the financial statements and financial highlights are free of material misstatement. The Funds are not required to have, nor were we engaged to perform, an audit of their internal control over financial reporting. Our audits included consideration of internal control over financial reporting as a basis for designing audit procedures that are appropriate in the circumstances, but not for the purpose of expressing an opinion on the effectiveness of the Funds’ internal control over financial reporting. Accordingly, we express no such opinion. An audit also includes examining, on a test basis, evidence supporting the amounts and disclosures in the financial statements, assessing the accounting principles used and significant estimates made by management, as well as evaluating the overall financial statement presentation. Our procedures included confirmation of securities owned as of April 30, 2013, by correspondence with the custodian and brokers, where replies were not received from brokers, we performed other auditing procedures. We believe that our audits provide a reasonable basis for our opinion.
In our opinion, the financial statements and financial highlights referred to above present fairly, in all material respects, the financial position of Emerald Banking and Finance Fund and Emerald Growth Fund of Financial Investors Trust as of April 30, 2013, the results of their operations for the year then ended, and the changes in their net assets and the financial highlights for the year then ended and the period from January 1, 2012 to April 30, 2012, in conformity with accounting principles generally accepted in the United States of America.
DELOITTE & TOUCHE LLP
Denver, Colorado
June 27, 2013
| | |
| Annual Report | April 30, 2013 | | 35 |
| | |
| Emerald Funds | | Additional Information |
| | April 30, 2013 (Unaudited) |
1. FUND HOLDINGS
The Funds file their complete schedule of portfolio holdings with the Securities and Exchange Commission (the “SEC”) for the first and third quarters of each fiscal year on Form N-Q within 60 days after the end of the period. Copies of the Funds’ Form N-Q are available without charge on the SEC website at http://www.sec.gov. You may also review and copy the Form N-Q at the SEC’s Public Reference Room in Washington, DC. For more information about the operation of the Public Reference Room, please call the SEC at 1-800-SEC-0330.
2. FUND PROXY VOTING POLICIES, PROCEDURES AND SUMMARIES
Each Fund’s policies and procedures used in determining how to vote proxies and information regarding how the Funds voted proxies relating to portfolio securities during the most recent prior 12-month period ending June 30 are available without charge, (1) upon request, by calling (toll-free) (855) 828-9909 and (2) on the SEC’s website at http://www.sec.gov.
3. FEDERAL TAX INFORMATION
Pursuant to Section 852(b)(3) of the Internal Revenue Code, the Emerald Growth Fund designates $14,103,676 as long-term capital gain dividends.
| | |
| 36 | | www.emeraldmutualfunds.com |
| | |
| Emerald Funds | | Trustees & Officers |
| | April 30, 2013 (Unaudited) |
INDEPENDENT TRUSTEES
| | | | | | | | | | |
Name, Address* & Age | | Position(s) Held with Fund | | Term of Office and Length of Time Served** | | Principal Occupation(s) During Past 5 Years*** | | Number of
Funds in
Fund
Complex
Overseen
by Trustee**** | | Other Directorships Held by Trustee During Past 5 Years |
| | | | | |
Mary K. Anstine, age 72 | | Trustee | | Ms. Anstine was elected at a special meeting of shareholders held on March 21, 1997 and re-elected at a special meeting of shareholders held on August 7, 2009. | | Ms. Anstine was President/Chief Executive Officer of HealthONE Alliance, Denver, Colorado, and former Executive Vice President of First Interstate Bank of Denver. Ms. Anstine is also Trustee/Director of AV Hunter Trust and Colorado Uplift Board. Ms. Anstine was formerly a Director of the Trust Bank of Colorado (later purchased and now known as Northern Trust Bank), HealthONE and Denver Area Council of the Boy Scouts of America, and a member of the American Bankers Association Trust Executive Committee. | | 26 | | Ms. Anstine is a Trustee of ALPS ETF Trust (13 funds); ALPS Variable Investment Trust (7 funds); Reaves Utility Income Fund (1 fund); and Westcore Trust (12 funds). |
| | | | | |
John R. Moran, Jr., age 82 | | Trustee | | Mr. Moran was elected at a special meeting of shareholders held on March 21, 1997 and re-elected at a special meeting of shareholders held on August 7, 2009. | | Mr. Moran is formerly President and CEO of The Colorado Trust, a private foundation serving the health and hospital community in the state of Colorado. An attorney, Mr. Moran was formerly a partner with the firm of Kutak Rock & Campbell in Denver, Colorado and a member of the Colorado House of Representatives. Currently, Mr. Moran is a member of the Treasurer’s Investment Advisory Committee for the University of Colorado. | | 26 | | None. |
| * | All communications to Trustees and Officers may be directed to Financial Investors Trust c/o 1290 Broadway, Suite 1100, Denver, CO 80203. |
| ** | This is the period for which the Trustee/Officer began serving the Trust. Each Trustee/Officer serves an indefinite term, until his successor is elected. |
| *** | Except as otherwise indicated, each individual has held the office shown or other offices in the same company for the last five years. |
| **** | The Fund Complex includes all series of the Trust (currently 26) and any other investment companies for which Emerald Mutual Fund Advisers Trust provides investment advisory services (currently none). |
| | |
| Annual Report | April 30, 2013 | | 37 |
| | |
| Emerald Funds | | Trustees & Officers |
| | April 30, 2013 (Unaudited) |
INDEPENDENT TRUSTEES
| | | | | | | | | | |
Name, Address* & Age | | Position(s) Held with Fund | | Term of Office and Length of Time Served** | | Principal Occupation(s) During Past 5 Years*** | | Number of
Funds in
Fund
Complex
Overseen
by Trustee**** | | Other Directorships Held by Trustee During Past 5 Years |
| | | | | |
Jeremy W. Deems, age 36 | | Trustee | | Mr. Deems was appointed as a Trustee at the March 11, 2008 meeting of the Board of Trustees and elected at a special meeting of shareholders held on August 7, 2009. | | Mr. Deems is the Co-Founder, Chief Operations Officer and Chief Financial Officer of Green Alpha Advisors, LLC. Prior to joining Green Alpha Advisors, Mr. Deems was CFO and Treasurer of Forward Management, LLC, an investment management company, ReFlow Management Co., LLC, a liquidity resourcing company, ReFlow Fund, LLC, a private investment fund, and Sutton Place Management, LLC, an administrative services company (from 2004 to June 2007). Prior to this, Mr. Deems served as Controller of Forward Management, LLC, ReFlow Management Co., LLC, ReFlow Fund, LLC and Sutton Place Management, LLC. | | 26 | | Mr. Deems is a Trustee of ALPS ETF Trust (13 funds); ALPS Variable Investment Trust (7 funds) and Reaves Utility Income Fund (1 fund). |
| | | | | |
Jerry G. Rutledge, age 68 | | Trustee | | Mr. Rutledge was elected at a special meeting of shareholders held on August 7, 2009. | | Mr. Rutledge is the President and owner of Rutledge’s Inc., a retail clothing business. Mr. Rutledge is currently Director of the American National Bank. He was from 1994 to 2007 a Regent of the University of Colorado. | | 26 | | Mr. Rutledge is a Trustee of Clough Global Allocation Fund (1 fund), Clough Global Equity Fund (1 fund) and Clough Global Opportunities Fund (1 fund). |
| | | | | |
Michael “Ross” Shell, age 42 | | Trustee | | Mr. Shell was elected at a special meeting of shareholders held on August 7, 2009. | | Mr. Shell is Founder and CEO* of Red Idea, LLC, a strategic consulting/early stage venture firm (since June 2008). From 1999 to 2009, he was a part-owner and Director of Tesser, Inc., a brand agency. From December 2005 to May 2008, he was Director, Marketing and Investor Relations, of Woodbourne, a REIT/real estate hedge fund and private equity firm. Prior to this, from May 2004 to November 2005, he worked as a business strategy consultant; from June 2003 to April 2004, he was on the Global Client Services team of IDEO, a product design/innovation firm; and from 1999 to 2003, he was President of Tesser, Inc. Mr. Shell graduated with honors from Stanford University with a degree in Political Science. | | 26 | | None. |
| * | All communications to Trustees and Officers may be directed to Financial Investors Trust c/o 1290 Broadway, Suite 1100, Denver, CO 80203. |
| ** | This is the period for which the Trustee/Officer began serving the Trust. Each Trustee/Officer serves an indefinite term, until his successor is elected. |
| *** | Except as otherwise indicated, each individual has held the office shown or other offices in the same company for the last five years. |
| **** | The Fund Complex includes all series of the Trust (currently 26) and any other investment companies for which Emerald Mutual Fund Advisers Trust provides investment advisory services (currently none). |
| | |
| 38 | | www.emeraldmutualfunds.com |
| | |
| Emerald Funds | | Trustees & Officers |
| | April 30, 2013 (Unaudited) |
INTERESTED TRUSTEE
| | | | | | | | | | |
Name, Address* & Age | | Position(s) Held with Fund | | Term of Office and Length of Time Served** | | Principal Occupation(s) During Past 5 Years*** | | Number of
Funds in
Fund
Complex
Overseen
by Trustee**** | | Other Directorships Held by Trustee |
| | | | | |
Edmund J. Burke, age 52 | | Trustee,
Chairman
and
President | | Mr. Burke was elected as Chairman at the August 28, 2009 meeting of the Board of Trustees. Mr. Burke was elected as Trustee at a special meeting of shareholders held on August 7, 2009. Mr. Burke was elected President of the Trust at the December 17, 2002 meeting of the Board of Trustees. | | Mr. Burke is President and a Director of ALPS Holdings, Inc. (“AHI”) (since 2005) and Director of ALPS Advisors, Inc. (“AAI”), ALPS Distributors, Inc. (“ADI”), ALPS Fund Services, Inc. (“AFS”) and ALPS Portfolio Solutions Distributor, Inc. (“APSD”) and from 2001-2008, was President of AAI, ADI, AFS and APSD. Because of his positions with AHI, AAI, ADI, AFS and APSD, Mr. Burke is deemed an affiliate of the Trust as defined under the 1940 Act. Mr. Burke is Trustee and President of the Clough Global Allocation Fund (Trustee since 2006; President since 2004); Trustee and President of the Clough Global Equity Fund (Trustee since 2006; President since 2005); Trustee and President of the Clough Global Opportunities Fund (since 2006); Trustee of the Liberty All-Star Equity Fund; and Director of the Liberty All-Star Growth Fund, Inc. | | 26 | | Mr. Burke is a Trustee of Clough Global Allocation Fund (1 fund); Clough Global Equity Fund (1 fund); Clough Global Opportunities Fund (1 fund); Trustee of the Liberty All-Star Equity Fund (1 fund); and Director of the Liberty All-Star Growth Fund, Inc. (1 fund). |
| * | All communications to Trustees and Officers may be directed to Financial Investors Trust c/o 1290 Broadway, Suite 1100, Denver, CO 80203. |
| ** | This is the period for which the Trustee/Officer began serving the Trust. Each Trustee/Officer serves an indefinite term, until his successor is elected. |
| *** | Except as otherwise indicated, each individual has held the office shown or other offices in the same company for the last five years. |
| **** | The Fund Complex includes all series of the Trust (currently 26) and any other investment companies for which Emerald Mutual Fund Advisers Trust provides investment advisory services (currently none). |
| | |
| Annual Report | April 30, 2013 | | 39 |
| | |
| Emerald Funds | | Trustees & Officers |
| | April 30, 2013 (Unaudited) |
OFFICERS
| | | | | | |
| Name, Address* & Age | | Position(s) Held with Fund | | Term of Office and Length of Time Served** | | Principal Occupation(s) During Past 5 Years*** |
| | | |
Kimberly R. Storms, age 40 | | Treasurer | | Ms. Storms was elected Treasurer of the Trust at the March 12, 2013 meeting of the Board of Trustees. | | Ms. Storms is Senior Vice President - Director of Fund Administration of ALPS. Ms. Storms joined ALPS in 1998 as Assistant Controller. Because of her position with ALPS, Ms. Storms is deemed an affiliate of the Trust as defined under the 1940 Act. Ms. Storms is also Treasurer of BPV Family of Funds and ALPS Series Trust; Assistant Treasurer of Liberty All-Star Equity Fund and Liberty All-Star Growth Fund, Inc.; Assistant Treasurer of Tilson Funds; and Chief Financial Officer of The Arbitrage Funds. |
| | | |
David T. Buhler, Age 41 | | Secretary | | Mr. Buhler was elected Secretary of the Trust at the September 11, 2012 meeting of the Board of Trustees. | | Mr. Buhler joined ALPS in June 2010, and is currently Vice President and Associate Counsel of ALPS, AAI, ADI and APSD. Prior to joining ALPS, Mr. Buhler served as Associate General Counsel and Assistant Secretary of Founders Asset Management LLC from 2006 to 2009. Because of his position with ALPS, Mr. Buhler is deemed an affiliate of the Trust as defined under the 1940 Act. Mr. Buhler is also the Secretary of ALPS Variable Investment Trust and Westcore Trust. |
| | | |
Ted Uhl, age 37 | | Chief Compliance Officer (“CCO”) | | Mr. Uhl was appointed CCO of the Trust at the June 8, 2010 meeting of the Board of Trustees. | | Mr. Uhl joined ALPS in October 2006, and is currently Deputy Compliance Officer of ALPS. Prior to his current role, Mr. Uhl served as Senior Risk Manager for ALPS from October 2006 until June 2010. Before joining ALPS, Mr. Uhl served a Sr. Analyst with Enenbach and Associates (RIA), and a Sr. Financial Analyst at Sprint. Because of his position with ALPS, Mr. Uhl is deemed an affiliate of the Trust as defined under the 1940 Act. Mr. Uhl is also CCO of the Clough Global Funds, Reaves Utility Income Fund, Drexel Hamilton Funds and Transparent Value Trust. |
| * | All communications to Trustees and Officers may be directed to Financial Investors Trust c/o 1290 Broadway, Suite 1100, Denver, CO 80203. |
| ** | This is the period for which the Trustee/Officer began serving the Trust. Each Trustee/Officer serves an indefinite term, until his successor is elected. |
| *** | Except as otherwise indicated, each individual has held the office shown or other offices in the same company for the last five years. |
| | |
| 40 | | www.emeraldmutualfunds.com |


| | |
| Grandeur Peak Funds® | | Shareholder Letter |
| | April 30, 2013 (Unaudited) |

Dear Fellow Shareholders,
As you are no doubt aware, the S&P 500 Index has pushed into record territory this year. That the S&P 500 hit a new all-time high at a time of severe disequilibrium in our monetary policy, fiscal situation and term structure of interest rates has left a lot of market observers scratching their heads. There are plenty of economic challenges abroad as well, with continuing struggles in Europe and slowing growth in emerging countries, to make one wonder why the market is so optimistic.
The U.S. isn’t the only market hitting all-time highs. Malaysia, Turkey, Mexico, South Africa, Denmark, Indonesia, Philippines, and even Venezuela recently hit all-time highs as well. However, this story is not universally true around the world. Of the markets that we actively cover, there are 19 that remain below their peaks reached in 2006–2008, there are 6 that have yet to recover from the fallout of the tech bubble in 2000, Thailand and Taiwan are still off from their highs hit in 1994 and 1990 respectively, and Japan is still below its 1989 peak.1
So, the good news is that despite the broad advances there are still some markets that have reasonable valuations. The bad news is that the first quarter (Q1 ‘13) earnings season was mediocre—again not consistent with the continuing broad market gains. Our companies are doing okay, but not as well as we’d like. Europe’s issues have clearly gotten measurably worse, Japan’s mega stimulus is encouraging in some ways but Japan still face big challenges, and the emerging markets have seen a significant deceleration in their growth while facing serious inflationary pressure. Consequently, we wouldn’t be surprised to see a pullback in several markets in the coming months. We don’t try to time the markets, but there are markets that feel pricey and we’d love to see a pull back to get a better buying opportunity for some of our Watch A2 names.
| 1 | Source: Bloomberg, April 30, 2013. |
| 2 | Watch A names are stocks we actively follow that we’d love to own but think they are currently too expensive. |
| | |
| Annual Report | April 30, 2013 | | 1 |
| | |
| Grandeur Peak Funds® | | Shareholder Letter |
| | April 30, 2013 (Unaudited) |
A big question we’ve been hearing among U.S.-centric investors lately has been: “are we hitting yet another bubble top?” We actually don’t think so. Here too we wouldn’t be surprised to see the U.S. market retreat sometime this year—since valuations are stretched and the global economy is still plagued with serious issues—but we don’t believe we are in “bubble” territory. When the S&P 500 hit its peak in August, 2000 the Shiller P/E was 44.20, many standard deviations above the long term median of 15.87. When it hit its peak in October, 2007, the Shiller P/E was 27.10, almost 2 standard deviations above the median. As of April 30, 2013, the Shiller P/E was 22.67, about 1 standard deviation above median. Not great, but not in bubble territory.
Of course one advantage of holding an active portfolio instead of a passive index fund is that you don’t have to own the expensive stocks. Active management allows investors to customize the portfolio to take advantage of the opportunities that exist in any environment. So, we’re currently keeping our heads down and trying to find great companies at reasonable prices that we believe can grow even through unfavorable macro issues. We focus first on quality because we believe these companies will be the long-term winners. As these companies are discovered and become expensive, we rotate to other lesser known high quality companies that we find through our constant screening of the global equity universe.
Portfolio Performance
For the year ended April 30, 2013, the Global Opportunities Fund - Investor Class was up 22.34%, about six percentage points ahead of the Russell Global Small Cap Index’s gain of 16.21%. Meanwhile, the International Opportunities Fund - Investor Class increased 24.57% during the year, outpacing the Russell Global ex US Small Cap Index’s 15.38% return by over nine percentage points. Both Funds did very well in calendar 2012 and have slightly outpaced the benchmark so far in 2013.
We had a lot of inflows into the Funds over the first four months of 2013, which created a challenge in staying fully invested while stock prices continued to run. Along with the inflows, we also trimmed positions where valuations became expensive. On average, we had 8-10% cash in the Funds over this period. We’ve been working hard researching the nearly 200 companies on our red hot list to find a few new names to rotate into as the bull market marches forward. Holding cash has clearly been a performance drag so far in 2013, but we’ve remained pleased with our stock picking. We outperformed across most regions and sectors in Q1. The only sector where we lagged was in Consumer—where we had trouble with some of our retailers, restaurants and apparel stocks. Nothing major, but a slight drag on the quarter.
The two strongest regions in the benchmark for the past year were Western Europe and Asia. We were overweight Europe and underweight in Asia—not a macro call, simply where our bottom-up approach took us. The good news is that our stock selections handily outperformed in both regions over this period.
The strongest sectors over the past year were Financials, Healthcare, and Consumer. Our underweight in Financials hurt us, although we more than made up for the underweight through the performance of our financial holdings. In Health Care we were slightly overweight, and we outperformed nicely. We struggled in Consumer where we were slightly underweight and also underperformed, as mentioned above. We did catch a nice tail wind by being underweight in Energy & Materials, the only two segments that were down over this
| | |
| 2 | | 1.855.377.7325 | www.GrandeurPeakGlobal.com |
| | |
| Grandeur Peak Funds® | | Shareholder Letter |
| | April 30, 2013 (Unaudited) |
period—again a bottom-up call, in sectors that we have traditionally found fewer companies that fit our investment approach.
Business Update
We continue to add to our senior team, both on the research side and in the back office. Zach Larkin joined us in research and Juliette Campbell joined Amy Hone in trading and operations. We have known and respected Zach and Juliette for years and were thrilled to lure them each back to Salt Lake to join our team. Our research team now includes 7 senior members and 7 junior members. We’re really excited about how the team has come together. We feel we are knocking the cover off the ball in terms of the front end screening process, idea generation and visiting companies. We still have some more work to do to tighten things up on the back-end of the process, so we’re really glad to have Zach, Juliette, and a full junior team on board to help us add greater back-end discipline. It’s worth specifically mentioning how pleased we are with the development of the junior research team. The junior analysts have been terrific and there is no question that they have been an important resource in helping us improve our process over the past year.
We soft closed the Grandeur Peak Global Opportunities Fund and the Grandeur Peak International Opportunities Fund on May 1st. This announcement is of great importance. We believe that limiting our assets is a critical element in achieving the long-term success we desire for our clients. Failure to limit assets is also one of the most common reasons why great small cap firms lose their luster over time. As we’ve reiterated time and again, we founded Grandeur Peak to be a world-class global small cap manager, and to help us achieve this mission we are committed to remaining small & nimble.
Among the short list of other global small cap and international small cap funds, there are very few managers truly committed to the small/micro space. Most of our closest peer funds are, or have become, midcap products. We believe there is a truly unique investment opportunity in global small and micro cap companies, but it takes a significant commitment in resources and discipline to analyze the universe of over 30,000 companies. With the cost and effort to do this work, and limited revenue potential for managers who cap their assets appropriately, few other managers have chosen to pursue this compelling segment.
In founding Grandeur Peak we laid out a product roadmap for the global small cap space. There are 6-7 strategies that we would ultimately like to manage within this arena. Given the expected overlap of our portfolios, it is important to look at capacity constraints at the firm level, as well as at the individual portfolio level. We soft closed the Global Opportunities and International Opportunities Funds not because we are already feeling a capacity pinch, but because we wanted to make sure to leave room for existing shareholders to continue investing, for potential growth from performance, and for the future small and micro cap funds that we intend to launch.
We expect to launch our next fund, the Global Reach Fund, this summer. Joining us as portfolio managers on the Global Reach Fund we are pleased to name Amy Hu Sunderland, Randy Pearce, and Spencer Stewart as Associate Portfolio Managers. Like all Grandeur Peak Funds, the entire research team will be involved. We have a very collaborative approach, with a unified goal of delivering for our shareholders. Amy, Randy, and Spencer joined Grandeur Peak when we founded the firm in 2011. They are great analysts and have been instrumental in the success our existing
| | |
| Annual Report | April 30, 2013 | | 3 |
| | |
| Grandeur Peak Funds® | | Shareholder Letter |
| | April 30, 2013 (Unaudited) |
funds have experienced to date. More information about the team and this new Fund are available on our website at www.grandeurpeakglobal.com.
Thank you for your continued trust.
| | |
Sincerely, | | |
| Robert Gardiner | | Blake Walker |
| Chief Executive Officer & Portfolio Manager | | Chief Investment Officer & Portfolio Manager |
The objective of all Grandeur Peak Funds is long-term growth of capital. The Grandeur Peak Global Reach Fund is new with limited operating history.
RISKS: Mutual fund investing involves risks and loss of principal is possible. Investing in small and micro cap funds will be more volatile, and loss of principal could be greater than investing in large cap or more diversified funds. Investing in foreign securities entails special risks, such as currency fluctuations and political uncertainties, which are described in more detail in the prospectus. Investments in emerging markets are subject to the same risks as other foreign securities and may be subject to greater risks than investments in foreign countries with more established economies and securities markets.
An investor should consider investment objectives, risks, charges, and expenses carefully before investing. To obtain a Grandeur Peak Funds prospectus, containing this and other information, visit www.grandeurpeakglobal.com or call 1-855-377-PEAK (7325). Please read it carefully before investing.
The views and information discussed in this commentary are as of the date of publication, are subject to change, and may not reflect the writer’s current views. The views expressed represent an assessment of market conditions at a specific point in time, are opinions only and should not be relied upon as investment advice regarding a particular investment or markets in general. Such information does not constitute a recommendation to buy or sell specific securities or investment vehicles. It should not be assumed that any investment will be profitable or will equal the performance of the Funds or any securities or any sectors mentioned herein. The subject matter contained herein has been derived from several sources believed to be reliable and accurate at the time of compilation. The Funds do not accept any liability for losses either direct or consequential caused by the use of this information.
The S&P 500® Index is an index of 500 stocks, it is designed to be a leading indicator of U.S. equities. The Russell Global Small Cap Index offers investors access to the small-cap segment of the global equity universe. It is constructed to provide a comprehensive and unbiased barometer for the small-cap segment and is completely reconstituted annually to accurately reflect the changes in the market over time. The Russell Global ex-U.S. Small Cap Index measures the performance of the small-cap segment of the global equity universe, excluding companies assigned to the United States. You cannot invest directly in these or any indices.
The Shiller PE is the price of the stock market divided by the average of ten years worth of earnings.
Valuation is the process of determining the current worth of an asset or company.
Standard Deviation is a measure of the dispersion of a set of data from its mean. The more spread apart the data, the higher the deviation. Standard deviation is calculated as the square root of variance.
CFA® is a trademark owned by CFA Institute.
| | |
| 4 | | 1.855.377.7325 | www.GrandeurPeakGlobal.com |
| | |
| Grandeur Peak Global Opportunities Fund | | Performance Update |
| | April 30, 2013 (Unaudited) |
| | | | | | | | | | | | | | | | | | | | |
| Cumulative Total Return Performance for the periods ended April 30, 2013 | |
| | | | | | | | | Since | | | Expense Ratio | |
| | | 6 months | | | 1 Year | | | Inception* | | | Gross | | | Net** | |
Grandeur Peak Global Opportunities
Fund – Investor (GPGOX) | | | 17.27% | | | | 22.34% | | | | 25.23% | | | | 1.76% | | | | 1.75% | |
| |
Grandeur Peak Global Opportunities
Fund – Institutional (GPGIX) | | | 17.78% | | | | 22.86% | | | | 25.93% | | | | 1.51% | | | | 1.50% | |
| |
Russell Global Small Cap Index | | | 15.64% | | | | 16.21% | | | | 18.72% | | | | | | | | | |
| |
Russell Global Index | | | 14.12% | | | | 15.87% | | | | 18.52% | | | | | | | | | |
| |
| * | Fund Inception date of October 17, 2011. |
| ** | Grandeur Peak Global Advisors, LLC (the “Adviser”), has agreed to waive and/or reimburse fees or expenses in order to limit Total Annual Fund Operating Expenses After Fee Waiver/Expense Reimbursement (excluding acquired fund fees and expenses, brokerage expenses, interest expenses, taxes and extraordinary expenses) to 1.75% of the Fund’s average daily net assets for the Investor Class and 1.50% of the Fund’s average daily net assets for the Institutional Class. This agreement is in effect through August 31, 2013. The Fund may have to repay some of these waivers and reimbursements to the Adviser in the following three years. This agreement may not be terminated or modified prior to this date except with the approval of the Fund’s Board of Trustees. |
Returns for periods greater than 1 year are annualized.
The returns shown above do not reflect the deduction of taxes a shareholder would pay on Fund distributions or redemption of Fund shares.
Performance data quoted represents past performance. Past performance does not guarantee future results. Investment return and principal value of an investment will fluctuate so that an investor’s shares, when sold or redeemed, may be worth more or less than the original cost. Current performance data may be higher or lower than actual data quoted. For the most current month-end performance data, please call 1-855-377-PEAK (7325).
Growth of $10,000 for the period ended April 30, 2013
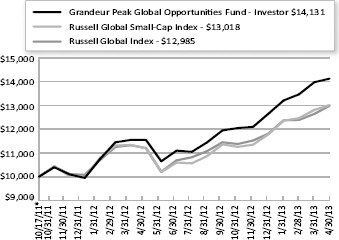
| | |
| Annual Report | April 30, 2013 | | 5 |
| | |
| Grandeur Peak Global Opportunities Fund | | Performance Update |
| | April 30, 2013 (Unaudited) |
The graphs shown above represent a hypothetical investment of $10,000 in the Fund’s Investor Class shares for the period from inception to 4/30/2013. All returns reflect reinvested dividends, but do not reflect the deduction of taxes that an investor would pay on distributions or redemptions.
The Russell Global Small Cap Index and Russell Global Index are not actively managed and do not reflect any deduction for fees, expenses or taxes. It is not possible to invest directly in an index.
The Fund also offers Institutional Class shares, performance for which is not reflected in the graphs above. The performance of Institutional Class shares may be higher or lower than the performance of the Investor Class shares shown in the graphs above based upon differences in fees paid by shareholders investing in the Investor Class shares and Institutional Class shares.
| | | | | | |
| Regional Allocation (as a % of Net Assets)* | | | |
North America | | | 34.9 | % | | |
Asia ex Japan | | | 21.4 | % | | |
Europe | | | 19.1 | % | | |
Australia/New Zealand | | | 5.3 | % | | |
Japan | | | 4.7 | % | | |
Latin America | | | 4.2 | % | | |
Africa/Middle East | | | 2.2 | % | | |
Cash, Cash Equivalents, & Other Net Assets | | | 8.2 | % | | |
Total | | | 100.0 | % | | |
| |
| Industry Sector Allocation (as a % of Net Assets)* | | | |
Technology | | | 21.8 | % | | |
Industrials | | | 19.7 | % | | |
Consumer | | | 18.8 | % | | |
Financials | | | 16.7 | % | | |
Health Care | | | 10.7 | % | | |
Energy & Materials | | | 3.4 | % | | |
Exchange Traded Funds | | | 0.7 | % | | |
Cash, Cash Equivalents, & Other Net Assets | | | 8.2 | % | | |
Total | | | 100.0 | % | | |
| |
| Top 10 Holdings (as a % of Net Assets)* | | | |
Magellan Financial Group, Ltd. | | | 3.1 | % | | |
Clinigen Group PLC | | | 2.5 | % | | |
Melexis NV | | | 2.0 | % | | |
Blinkx PLC | | | 1.5 | % | | |
Banco Daycoval SA | | | 1.5 | % | | |
Manning & Napier, Inc. | | | 1.4 | % | | |
RPS Group PLC | | | 1.4 | % | | |
Tilly’s, Inc., Class A | | | 1.4 | % | | |
Hy-Lok Corp. | | | 1.4 | % | | |
Roadrunner Transportation Systems, Inc. | | | 1.3 | % | | |
Total | | | 17.5 | % | | |
| * | Holdings are subject to change. Tables present indicative values only. |
| | |
| 6 | | 1.855.377.7325 | www.GrandeurPeakGlobal.com |
| | |
| Grandeur Peak International Opportunities Fund | | Performance Update |
| | April 30, 2013 (Unaudited) |
| | | | | | | | | | | | | | | | | | | | |
| Cumulative Total Return Performance for the periods ended April 30, 2013 | |
| | | | | | | | | Since Inception* | | | Expense Ratio | |
| | | 6 months | | | 1 Year | | | | Gross | | | Net** | |
Grandeur Peak Global��Opportunities
Fund – Investor (GPGOX) | | | 18.37% | | | | 24.57% | | | | 25.99% | | | | 1.88% | | | | 1.75% | |
| |
Grandeur Peak Global Opportunities
Fund – Institutional (GPGIX) | | | 18.39% | | | | 25.11% | | | | 26.35% | | | | 1.59% | | | | 1.50% | |
| |
Russell Global ex-U.S. Small Cap Index | | | 15.12% | | | | 15.38% | | | | 15.49% | | | | | | | | | |
| |
| * | Fund Inception date of October 17, 2011. |
| ** | Grandeur Peak Global Advisors, LLC (the “Adviser”), has agreed to waive and/or reimburse fees or expenses in order to limit Total Annual Fund Operating Expenses After Fee Waiver/Expense Reimbursement (excluding acquired fund fees and expenses, brokerage expenses, interest expenses, taxes and extraordinary expenses) to 1.75% of the Fund’s average daily net assets for the Investor Class and 1.50% of the Fund’s average daily net assets for the Institutional Class. This agreement is in effect through August 31, 2013. The Fund may have to repay some of these waivers and reimbursements to the Adviser in the following three years. This agreement may not be terminated or modified prior to this date except with the approval of the Fund’s Board of Trustees. |
Returns for periods greater than 1 year are annualized.
The returns shown above do not reflect the deduction of taxes a shareholder would pay on Fund distributions or redemption of Fund shares.
Performance data quoted represents past performance. Past performance does not guarantee future results. Investment return and principal value of an investment will fluctuate so that an investor’s shares, when sold or redeemed, may be worth more or less than the original cost. Current performance data may be higher or lower than actual data quoted. For the most current month-end performance data, please call 1-855-377-PEAK (7325).
Growth of $10,000 for the period ended April 30, 2013
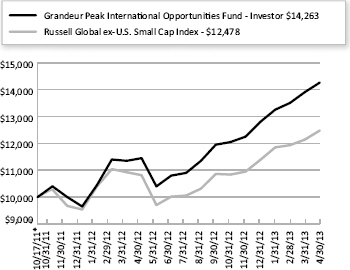
| | |
| Annual Report | April 30, 2013 | | 7 |
| | |
| Grandeur Peak International Opportunities Fund | | Performance Update |
| | April 30, 2013 (Unaudited) |
The graphs shown above represent a hypothetical investment of $10,000 in the Fund’s Investor Class shares for the period from inception to 4/30/2013. All returns reflect reinvested dividends, but do not reflect the deduction of taxes that an investor would pay on distributions or redemptions.
The Russell Global ex-U.S. Small Cap Index is not actively managed and does not reflect any deduction for fees, expenses or taxes. It is not possible to invest directly in an index.
The Fund also offers Institutional Class shares, performance for which is not reflected in the graphs above. The performance of Institutional Class shares may be higher or lower than the performance of the Investor Class shares shown in the graphs above based upon differences in fees paid by shareholders investing in the Investor Class shares and Institutional Class shares.
| | | | | | |
| Regional Allocation (as a % of Net Assets)* | | | |
Asia ex Japan | | | 37.4 | % | | |
Europe | | | 21.8 | % | | |
Japan | | | 7.5 | % | | |
North America | | | 6.9 | % | | |
Latin America | | | 5.5 | % | | |
Australia/New Zealand | | | 5.3 | % | | |
Africa/Middle East | | | 4.3 | % | | |
Cash, Cash Equivalents, & Other Net Assets | | | 11.3 | % | | |
Total | | | 100.0 | % | | |
| |
| Industry Sector Allocation (as a % of Net Assets)* | | | |
Consumer | | | 21.2 | % | | |
Technology | | | 19.1 | % | | |
Industrials | | | 17.1 | % | | |
Financials | | | 15.1 | % | | |
Health Care | | | 9.7 | % | | |
Energy & Materials | | | 3.8 | % | | |
Exchange Traded Funds | | | 2.7 | % | | |
Cash, Cash Equivalents, & Other Net Assets | | | 11.3 | % | | |
Total | | | 100.0 | % | | |
| |
| Top 10 Holdings (as a % of Net Assets)* | | | |
Magellan Financial Group, Ltd. | | | 3.0 | % | | |
WisdomTree India Earnings Fund | | | 2.5 | % | | |
Clinigen Group PLC | | | 2.3 | % | | |
Melexis NV | | | 1.9 | % | | |
Banco Daycoval SA | | | 1.7 | % | | |
Blinkx PLC | | | 1.7 | % | | |
RPS Group PLC | | | 1.7 | % | | |
Hy-Lok Corp. | | | 1.7 | % | | |
CETIP SA - Mercados Organizados | | | 1.5 | % | | |
Trancom Co., Ltd. | | | 1.3 | % | | |
Total | | | 19.3 | % | | |
| * | Holdings are subject to change. Tables present indicative values only. |
| | |
| 8 | | 1.855.377.7325 | www.GrandeurPeakGlobal.com |
| | |
| Grandeur Peak Funds® | | Disclosure of Fund Expenses |
| | April 30, 2013 (Unaudited) |
As a shareholder of a Fund, you incur two types of costs: direct costs, such as short-term redemption fees and wire fees, and indirect costs, including management fees, and other fund operating expenses. This example is intended to help you understand your indirect costs, also referred to as “ongoing costs” (in dollars), of investing in the Fund and to compare these costs with the ongoing costs of investing in other mutual funds.
This example is based on an investment of $1,000 invested at the beginning of the period and held for the entire six-month period of November 1, 2012 through April 30, 2013.
Actual Expenses The first line of the table below provides information about actual account values and actual expenses. You may use the information in this line, together with the amount you invested at the beginning of the period, to estimate the expenses that you paid over the period. Simply divide your account value by $1,000 (for example, an $8,600 account value divided by $1,000 = 8.6), then multiply the result by the number in the first line under the heading “Expenses Paid During Period” to estimate the expenses you paid on your account during this period.
Hypothetical Example for Comparison Purposes The second line of the table provides information about hypothetical account values and hypothetical expenses based on the Fund’s actual expense ratio and an assumed rate of return of 5% per year before expenses, which is not the Fund’s actual return. The hypothetical account values and expenses may not be used to estimate the actual ending account balance or expenses you paid for the period. You may use this information to compare ongoing costs of investing in the Fund and other funds. To do so, compare this 5% hypothetical example with the 5% hypothetical examples that appear in the shareholder reports of other funds.
Please note that the expenses shown in the table are meant to highlight your ongoing costs only and do not reflect any direct costs, such as wire fees or low balance fees. Therefore, the second line of the table is useful in comparing ongoing costs only and will not help you determine the relative total costs of owning different funds. In addition, if these direct costs were included, your costs would be higher.
| | | | | | | | |
| | | Beginning Account
Value
November 1, 2012 | | Ending Account
Value
April 30, 2013 | | Expense Ratio(a) | | Expenses Paid During period November 1, 2012 -
April 30, 2013(b) |
|
Grandeur Peak Global Opportunities | | | | |
| | | | |
Investor Class | | | | | | | | |
Actual | | $ 1,000.00 | | $ 1,172.70 | | 1.75% | | $ 9.43 |
Hypothetical
(5% return before expenses) | | $ 1,000.00 | | $ 1,016.12 | | 1.75% | | $ 8.75 |
| | | | |
Institutional Class | | | | | | | | |
Actual | | $ 1,000.00 | | $ 1,177.80 | | 1.50% | | $ 8.10 |
Hypothetical
(5% return before expenses) | | $ 1,000.00 | | $ 1,017.36 | | 1.50% | | $ 7.50 |
| (a) | The Fund’s expense ratios have been annualized based on the Fund’s most recent fiscal half-year expenses. |
| (b) | Expenses are equal to the Fund’s annualized expense ratio, multiplied by the average account value over the period, multiplied by the number of days in the most recent fiscal half-year 181/365. |
| | |
| Annual Report | April 30, 2013 | | 9 |
| | |
| Grandeur Peak Funds® | | Disclosure of Fund Expenses |
| | April 30, 2013 (Unaudited) |
| | | | | | | | |
| | | Beginning Account
Value November 1, 2012 | | Ending Account
Value April 30, 2013 | | Expense Ratio(a) | | Expenses Paid During period November 1, 2012 -
April 30, 2013(b) |
|
Grandeur Peak International Opportunities | | | | |
| | | | |
Investor Class | | | | | | | | |
Actual | | $ 1,000.00 | | $ 1,183.70 | | 1.75% | | $ 9.48 |
Hypothetical
(5% return before expenses) | | $ 1,000.00 | | $ 1,016.12 | | 1.75% | | $ 8.75 |
| | | | |
Institutional Class | | | | | | | | |
Actual | | $ 1,000.00 | | $ 1,183.90 | | 1.50% | | $ 8.12 |
Hypothetical
(5% return before expenses) | | $ 1,000.00 | | $ 1,017.36 | | 1.50% | | $ 7.50 |
| (a) | The Fund’s expense ratios have been annualized based on the Fund’s most recent fiscal half-year expenses. |
| (b) | Expenses are equal to the Fund’s annualized expense ratio, multiplied by the average account value over the period, multiplied by the number of days in the most recent fiscal half-year 181/365. |
| | |
| 10 | | 1.855.377.7325 | www.GrandeurPeakGlobal.com |
| | |
| Grandeur Peak Global Opportunities Fund | | Portfolio of Investments |
| | April 30, 2013 |
| | | | | | | | |
| | | Shares | | | Value (Note 2) | |
| |
COMMON STOCKS (91.09%) | | | | | | | | |
Australia (5.27%) | | | | | | | | |
ALS, Ltd. | | | 89,322 | | | $ | 906,555 | |
Countplus, Ltd. | | | 315,836 | | | | 622,111 | |
Lycopodium, Ltd. | | | 15,622 | | | | 82,920 | |
Magellan Financial Group, Ltd. | | | 1,444,045 | | | | 10,733,778 | |
Navitas, Ltd. | | | 90,505 | | | | 507,601 | |
The Reject Shop, Ltd. | | | 55,390 | | | | 1,020,977 | |
Sirtex Medical, Ltd. | | | 71,900 | | | | 723,025 | |
Super Retail Group, Ltd. | | | 191,257 | | | | 2,609,312 | |
Webjet, Ltd. | | | 279,300 | | | | 1,268,229 | |
| | | | | | | | |
| | | | | | | 18,474,508 | |
| | | | | | | | |
| | |
Belgium (2.03%) | | | | | | | | |
Melexis NV | | | 349,934 | | | | 7,110,850 | |
| | | | | | | | |
| | |
Brazil (4.20%) | | | | | | | | |
All America Latina Logistica SA | | | 358,300 | | | | 1,812,318 | |
Banco ABC Brasil SA | | | 216,042 | | | | 1,697,454 | |
Banco Daycoval SA | | | 1,017,600 | | | | 5,350,570 | |
CETIP SA - Mercados Organizados | | | 281,000 | | | | 3,317,366 | |
Tegma Gestao Logistica | | | 188,500 | | | | 2,532,490 | |
| | | | | | | | |
| | | | | | | 14,710,198 | |
| | | | | | | | |
| | |
Britain (9.40%) | | | | | | | | |
Abcam PLC | | | 135,565 | | | | 924,446 | |
Blinkx PLC(a) | | | 3,698,694 | | | | 5,371,917 | |
Brammer PLC | | | 434,900 | | | | 2,408,342 | |
Clinigen Group PLC | | | 2,083,800 | | | | 8,674,812 | |
CVS Group PLC | | | 87,680 | | | | 260,819 | |
Fidessa Group PLC | | | 12,120 | | | | 337,938 | |
Halma PLC | | | 76,296 | | | | 593,164 | |
Hunting PLC | | | 134,000 | | | | 1,679,761 | |
Michael Page International PLC | | | 62,375 | | | | 361,013 | |
N Brown Group PLC | | | 301,580 | | | | 2,089,328 | |
Premier Oil PLC(a) | | | 381,255 | | | | 2,208,397 | |
Robert Walters PLC | | | 203,500 | | | | 730,206 | |
RPS Group PLC | | | 1,277,584 | | | | 4,949,430 | |
Sthree PLC | | | 184,747 | | | | 962,807 | |
Ted Baker PLC | | | 43,070 | | | | 905,864 | |
| | |
| Annual Report | April 30, 2013 | | 11 |
| | |
| Grandeur Peak Global Opportunities Fund | | Portfolio of Investments |
| | April 30, 2013 |
| | | | | | | | |
| | | Shares | | | Value (Note 2) | |
| |
Britain (continued) | | | | | | | | |
Ultra Electronics Holdings PLC | | | 17,735 | | | $ | 454,553 | |
| | | | | | | | |
| | | | | | | 32,912,797 | |
| | | | | | | | |
| | |
Canada (3.86%) | | | | | | | | |
Atrium Innovations, Inc.(a) | | | 29,705 | | | | 365,323 | |
Gildan Activewear, Inc. | | | 19,770 | | | | 794,960 | |
Gran Tierra Energy, Inc.(a) | | | 535,275 | | | | 2,960,071 | |
Home Capital Group, Inc. | | | 57,664 | | | | 3,308,332 | |
Pan American Silver Corp. | | | 10,725 | | | | 141,055 | |
Richelieu Hardware, Ltd. | | | 59,555 | | | | 2,343,894 | |
SEMAFO, Inc. | | | 141,725 | | | | 268,693 | |
ShawCor, Ltd. | | | 43,645 | | | | 1,753,251 | |
Stantec, Inc. | | | 27,364 | | | | 1,170,124 | |
TransGlobe Energy Corp.(a) | | | 54,540 | | | | 432,011 | |
| | | | | | | | |
| | | | | | | 13,537,714 | |
| | | | | | | | |
| | |
China (3.46%) | | | | | | | | |
Airtac International Group | | | 185,000 | | | | 981,042 | |
China Medical System Holdings, Ltd. | | | 2,709,427 | | | | 2,657,003 | |
Golden Eagle Retail Group, Ltd. | | | 443,000 | | | | 779,802 | |
NQ Mobile, Inc., ADR(a) | | | 205,000 | | | | 1,769,150 | |
O2Micro International, Ltd., ADR(a) | | | 518,163 | | | | 1,772,117 | |
Pacific Online, Ltd. | | | 3,598,853 | | | | 1,437,658 | |
Parkson Retail Group, Ltd. | | | 950,000 | | | | 514,165 | |
Tao Heung Holdings, Ltd. | | | 1,800,000 | | | | 1,136,576 | |
WuXi PharmaTech Cayman, Inc., ADR(a) | | | 56,000 | | | | 1,067,920 | |
| | | | | | | | |
| | | | | | | 12,115,433 | |
| | | | | | | | |
| | |
France (0.83%) | | | | | | | | |
1000mercis SA | | | 9,998 | | | | 549,059 | |
Audika Groupe | | | 20,667 | | | | 210,391 | |
Neurones | | | 45,508 | | | | 539,985 | |
Sartorius Stedim Biotech | | | 5,513 | | | | 781,213 | |
Thermador Groupe | | | 11,192 | | | | 843,089 | |
| | | | | | | | |
| | | | | | | 2,923,737 | |
| | | | | | | | |
| | |
Germany (3.45%) | | | | | | | | |
Adler Modemaerkte AG(a) | | | 62,882 | | | | 530,828 | |
Bertrandt AG | | | 24,555 | | | | 2,824,376 | |
CompuGroup Medical AG | | | 83,265 | | | | 1,920,075 | |
Gerry Weber International AG | | | 15,800 | | | | 693,004 | |
| | |
| 12 | | 1.855.377.7325 | www.GrandeurPeakGlobal.com |
| | |
| Grandeur Peak Global Opportunities Fund | | Portfolio of Investments |
| | April 30, 2013 |
| | | | | | | | |
| | | Shares | | | Value (Note 2) | |
| |
Germany (continued) | | | | | | | | |
Nexus AG | | | 144,500 | | | $ | 1,722,209 | |
Softing AG | | | 30,424 | | | | 310,919 | |
Wirecard AG | | | 119,085 | | | | 3,194,608 | |
zooplus AG(a) | | | 16,120 | | | | 889,612 | |
| | | | | | | | |
| | | | | | | 12,085,631 | |
| | | | | | | | |
| | |
Hong Kong (1.86%) | | | | | | | | |
Far East Horizon, Ltd. | | | 1,890,000 | | | | 1,285,954 | |
Le Saunda Holdings, Ltd. | | | 3,038,600 | | | | 943,671 | |
Magic Holdings International, Ltd. | | | 5,750,000 | | | | 3,104,644 | |
Trinity, Ltd. | | | 1,285,000 | | | | 506,704 | |
Vitasoy International Holdings, Ltd. | | | 553,483 | | | | 670,443 | |
| | | | | | | | |
| | | | | | | 6,511,416 | |
| | | | | | | | |
| | |
India (0.29%) | | | | | | | | |
MakeMyTrip, Ltd.(a) | | | 79,300 | | | | 1,018,212 | |
| | | | | | | | |
| | |
Indonesia (1.38%) | | | | | | | | |
Arwana Citramulia Tbk PT | | | 4,193,000 | | | | 1,336,930 | |
Lippo Cikarang Tbk PT(a) | | | 2,783,000 | | | | 1,960,766 | |
Ultrajaya Milk Industry & Trading Co. Tbk PT | | | 4,428,000 | | | | 1,548,491 | |
| | | | | | | | |
| | | | | | | 4,846,187 | |
| | | | | | | | |
| | |
Ireland (0.65%) | | | | | | | | |
Beazley PLC | | | 654,400 | | | | 2,282,070 | |
| | | | | | | | |
| | |
Israel (0.74%) | | | | | | | | |
Caesar Stone Sdot Yam, Ltd.(a) | | | 31,700 | | | | 743,682 | |
Camtek, Ltd.(a) | | | 114,351 | | | | 162,378 | |
SodaStream International, Ltd.(a) | | | 31,150 | | | | 1,677,116 | |
| | | | | | | | |
| | | | | | | 2,583,176 | |
| | | | | | | | |
| | |
Japan (4.74%) | | | | | | | | |
Benefit One, Inc. | | | 600 | | | | 830,897 | |
CMIC Co., Ltd. | | | 65,220 | | | | 1,418,335 | |
Create SD Holdings Co., Ltd. | | | 27,900 | | | | 1,237,806 | |
CyberAgent, Inc. | | | 623 | | | | 1,218,712 | |
Daiken Medical Co., Ltd. | | | 22,900 | | | | 1,024,199 | |
Infomart Corp. | | | 15,000 | | | | 472,380 | |
Kakaku.com, Inc. | | | 40,000 | | | | 1,032,364 | |
MonotaRO Co., Ltd. | | | 100,290 | | | | 2,548,272 | |
| | |
| Annual Report | April 30, 2013 | | 13 |
| | |
| Grandeur Peak Global Opportunities Fund | | Portfolio of Investments |
| | April 30, 2013 |
| | | | | | | | |
| | | Shares | | | Value (Note 2) | |
| |
Japan (continued) | | | | | | | | |
Nihon M&A Center, Inc. | | | 13,900 | | | $ | 732,892 | |
Seria Co., Ltd. | | | 34,000 | | | | 830,076 | |
Simplex Holdings, Inc. | | | 786 | | | | 305,176 | |
Toridoll Corp. | | | 75,000 | | | | 1,008,617 | |
Trancom Co., Ltd. | | | 111,870 | | | | 3,224,647 | |
Watts Co., Ltd. | | | 56,600 | | | | 732,720 | |
| | | | | | | | |
| | | | | | | 16,617,093 | |
| | | | | | | | |
| | |
Luxembourg (0.89%) | | | | | | | | |
L’Occitane International SA | | | 1,075,153 | | | | 3,117,329 | |
| | | | | | | | |
| | |
Malaysia (2.01%) | | | | | | | | |
Aeon Credit Service M Bhd | | | 405,080 | | | | 1,917,223 | |
Berjaya Food Bhd | | | 1,793,000 | | | | 795,579 | |
JobStreet Corp. Bhd | | | 327,600 | | | | 355,326 | |
My EG Services Bhd | | | 4,621,500 | | | | 1,268,349 | |
Padini Holdings Bhd | | | 4,037,650 | | | | 2,375,479 | |
Uzma Bhd(a) | | | 437,500 | | | | 314,914 | |
| | | | | | | | |
| | | | | | | 7,026,870 | |
| | | | | | | | |
| | |
Mexico (0.51%) | | | | | | | | |
Genomma Lab Internacional SAB de CV(a) | | | 822,000 | | | | 1,775,021 | |
| | | | | | | | |
| | |
Philippines (0.73%) | | | | | | | | |
Security Bank Corp. | | | 531,700 | | | | 2,547,406 | |
| | | | | | | | |
| | |
Russia (0.26%) | | | | | | | | |
Highland Gold Mining, Ltd. | | | 144,690 | | | | 189,355 | |
MD Medical Group Investments PLC, GDR(a)(b) | | | 40,900 | | | | 715,750 | |
| | | | | | | | |
| | | | | | | 905,105 | |
| | | | | | | | |
| | |
Singapore (2.02%) | | | | | | | | |
ARA Asset Management, Ltd. | | | 622,888 | | | | 958,328 | |
Breadtalk Group, Ltd. | | | 1,488,625 | | | | 1,172,336 | |
CSE Global, Ltd. | | | 1,335,550 | | | | 916,245 | |
Goodpack, Ltd. | | | 387,000 | | | | 527,856 | |
Parkson Retail Asia, Ltd. | | | 1,155,000 | | | | 1,547,252 | |
Petra Foods, Ltd. | | | 590,000 | | | | 1,954,372 | |
| | | | | | | | |
| | | | | | | 7,076,389 | |
| | | | | | | | |
| | |
| 14 | | 1.855.377.7325 | www.GrandeurPeakGlobal.com |
| | |
| Grandeur Peak Global Opportunities Fund | | Portfolio of Investments |
| | April 30, 2013 |
| | | | | | | | |
| | | Shares | | | Value (Note 2) | |
| |
South Africa (1.32%) | | | | | | | | |
Clicks Group, Ltd. | | | 103,785 | | | $ | 661,559 | |
Ellies Holdings, Ltd. | | | 310,000 | | | | 307,461 | |
EOH Holdings, Ltd. | | | 153,300 | | | | 844,786 | |
Foschini Group, Ltd. | | | 59,035 | | | | 756,564 | |
Super Group, Ltd.(a) | | | 766,609 | | | | 2,059,725 | |
| | | | | | | | |
| | | | | | | 4,630,095 | |
| | | | | | | | |
| | |
South Korea (3.99%) | | | | | | | | |
Able C&C Co., Ltd. | | | 9,800 | | | | 534,804 | |
Daum Communications Corp. | | | 23,500 | | | | 1,920,458 | |
Duksan Hi-Metal Co., Ltd.(a) | | | 11,600 | | | | 287,551 | |
Handsome Co., Ltd. | | | 30,000 | | | | 897,576 | |
Hy-Lok Corp. | | | 237,000 | | | | 4,842,005 | |
Koh Young Technology, Inc. | | | 34,410 | | | | 1,070,137 | |
Kolao Holdings | | | 22,600 | | | | 615,636 | |
Kolon Life Science, Inc. | | | 3,000 | | | | 225,552 | |
KONA@I Co., Ltd. | | | 60,000 | | | | 1,539,090 | |
Korean Reinsurance Co. | | | 26,700 | | | | 261,836 | |
LG Fashion Corp. | | | 40,350 | | | | 1,155,945 | |
MKTrend Co., Ltd. | | | 39,340 | | | | 392,936 | |
Vieworks Co., Ltd. | | | 11,800 | | | | 241,079 | |
| | | | | | | | |
| | | | | | | 13,984,605 | |
| | | | | | | | |
| | |
Sweden (1.14%) | | | | | | | | |
AddTech AB, B Shares | | | 50,409 | | | | 1,722,806 | |
DIBS Payment Services AB | | | 6,499 | | | | 44,724 | |
HIQ International AB | | | 176,304 | | | | 987,469 | |
Indutrade AB | | | 35,564 | | | | 1,240,148 | |
| | | | | | | | |
| | | | | | | 3,995,147 | |
| | | | | | | | |
| | |
Taiwan (2.96%) | | | | | | | | |
Cub Elecparts, Inc. | | | 155,000 | | | | 439,601 | |
Global Mixed Mode Technology, Inc. | | | 218,000 | | | | 679,588 | |
Leadtrend Technology Corp. | | | 183,000 | | | | 288,340 | |
Pacific Hospital Supply Co. | | | 450,150 | | | | 1,494,805 | |
Polyronics Tech Corp. | | | 902,200 | | | | 1,773,096 | |
Power Mate Technology Co., Ltd. | | | 100,000 | | | | 131,472 | |
Richtek Technology Corp. | | | 59,200 | | | | 325,969 | |
Sporton International, Inc. | | | 896,086 | | | | 2,262,077 | |
Taiwan Hon Chuan Enterprise Co., Ltd. | | | 471,000 | | | | 1,308,688 | |
Test Research, Inc. | | | 547,234 | | | | 903,033 | |
| | |
| Annual Report | April 30, 2013 | | 15 |
| | |
| Grandeur Peak Global Opportunities Fund | | Portfolio of Investments |
| | April 30, 2013 |
| | | | | | | | |
| | | Shares | | | Value (Note 2) | |
| |
Taiwan (continued) | | | | | | | | |
TXC Corp. | | | 491,600 | | | $ | 766,251 | |
| | | | | | | | |
| | | | | | | 10,372,920 | |
| | | | | | | | |
| | |
Thailand (0.85%) | | | | | | | | |
Coastal Energy Co. (London Exchange)(a) | | | 11,888 | | | | 226,211 | |
Coastal Energy Co. (Toronto Exchange)(a) | | | 50,000 | | | | 958,360 | |
Premier Marketing PCL | | | 4,595,000 | | | | 1,800,426 | |
| | | | | | | | |
| | | | | | | 2,984,997 | |
| | | | | | | | |
| | |
Turkey (1.47%) | | | | | | | | |
Albaraka Turk Katilim Bankasi AS(a) | | | 1,449,083 | | | | 1,568,106 | |
Emlak Konut Gayrimenkul Yatirim Ortakligi AS | | | 778,000 | | | | 1,332,288 | |
Katmerciler Arac Ustu Ekipman Sanayi ve Ticaret AS(a) | | | 417,000 | | | | 1,307,232 | |
TAV Havalimanlari Holding AS(a) | | | 135,000 | | | | 952,587 | |
| | | | | | | | |
| | | | | | | 5,160,213 | |
| | | | | | | | |
| | |
United Arab Emirates (0.14%) | | | | | | | | |
Aramex PJSC | | | 755,100 | | | | 474,893 | |
| | | | | | | | |
| | |
United States (30.64%) | | | | | | | | |
3D Systems Corp.(a) | | | 26,000 | | | | 994,240 | |
Abaxis, Inc. | | | 55,130 | | | | 2,353,500 | |
ABIOMED, Inc.(a) | | | 102,500 | | | | 1,893,175 | |
Allegiant Travel Co. | | | 11,755 | | | | 1,056,774 | |
Amsurg Corp.(a) | | | 51,030 | | | | 1,712,567 | |
Ares Capital Corp. | | | 136,042 | | | | 2,470,523 | |
Astronics Corp.(a) | | | 32,200 | | | | 895,160 | |
Big 5 Sporting Goods Corp. | | | 46,550 | | | | 782,040 | |
Cardica, Inc.(a) | | | 600,000 | | | | 780,000 | |
Cardtronics, Inc.(a) | | | 45,450 | | | | 1,273,054 | |
Cempra, Inc.(a) | | | 185,300 | | | | 1,276,717 | |
Colony Financial, Inc. | | | 75,800 | | | | 1,690,340 | |
Covance, Inc.(a) | | | 20,132 | | | | 1,501,042 | |
CRA International, Inc.(a) | | | 87,473 | | | | 1,613,002 | |
Dice Holdings, Inc.(a) | | | 239,100 | | | | 2,018,004 | |
Ellie Mae, Inc.(a) | | | 101,200 | | | | 2,633,224 | |
EPAM Systems, Inc.(a) | | | 103,500 | | | | 2,225,250 | |
ExamWorks Group, Inc.(a) | | | 43,050 | | | | 779,205 | |
ExlService Holdings, Inc.(a) | | | 61,000 | | | | 1,989,820 | |
First Cash Financial Services, Inc.(a) | | | 40,800 | | | | 2,099,976 | |
| | |
| 16 | | 1.855.377.7325 | www.GrandeurPeakGlobal.com |
| | |
| Grandeur Peak Global Opportunities Fund | | Portfolio of Investments |
| | April 30, 2013 |
| | | | | | | | |
| | | Shares | | | Value (Note 2) | |
| |
United States (continued) | | | | | | | | |
First Republic Bank | | | 41,005 | | | $ | 1,557,370 | |
Grand Canyon Education, Inc.(a) | | | 41,300 | | | | 1,056,041 | |
ICU Medical, Inc.(a) | | | 12,600 | | | | 759,150 | |
Integrated Silicon Solution, Inc.(a) | | | 96,400 | | | | 883,988 | |
Keynote Systems, Inc. | | | 25,000 | | | | 280,250 | |
The KEYW Holding Corp.(a) | | | 73,600 | | | | 1,000,224 | |
Knight Transportation, Inc. | | | 118,595 | | | | 1,852,454 | |
Linear Technology Corp. | | | 28,870 | | | | 1,053,755 | |
Littelfuse, Inc. | | | 27,400 | | | | 1,913,068 | |
Manitex International, Inc.(a) | | | 122,500 | | | | 1,240,925 | |
Manning & Napier, Inc. | | | 289,850 | | | | 5,075,274 | |
Market Leader, Inc.(a) | | | 237,300 | | | | 2,377,746 | |
MarketAxess Holdings, Inc. | | | 59,900 | | | | 2,534,968 | |
Maxim Integrated Products, Inc. | | | 46,675 | | | | 1,443,658 | |
MaxLinear, Inc.(a) | | | 239,000 | | | | 1,488,970 | |
Meridian Bioscience, Inc. | | | 59,900 | | | | 1,215,371 | |
Mesa Laboratories, Inc. | | | 8,800 | | | | 434,368 | |
Micrel, Inc. | | | 153,975 | | | | 1,548,989 | |
Microchip Technology, Inc. | | | 66,245 | | | | 2,412,643 | |
Misonix, Inc.(a) | | | 86,000 | | | | 491,920 | |
Mitcham Industries, Inc.(a) | | | 69,000 | | | | 1,024,650 | |
Myriad Genetics, Inc.(a) | | | 30,095 | | | | 838,146 | |
Navigant Consulting, Inc.(a) | | | 159,910 | | | | 1,971,690 | |
Nu Skin Enterprises, Inc., Class A | | | 64,300 | | | | 3,261,939 | |
Pegasystems, Inc. | | | 54,250 | | | | 1,373,068 | |
Perficient, Inc.(a) | | | 123,896 | | | | 1,298,430 | |
Pericom Semiconductor Corp.(a) | | | 268,614 | | | | 1,735,246 | |
Polypore International, Inc.(a) | | | 26,650 | | | | 1,117,435 | |
Portfolio Recovery Associates, Inc.(a) | | | 8,455 | | | | 1,037,851 | |
Power Integrations, Inc. | | | 41,175 | | | | 1,705,057 | |
Procera Networks, Inc.(a) | | | 64,100 | | | | 710,869 | |
Rally Software Development Corp.(a) | | | 21,400 | | | | 387,982 | |
Redwood Trust, Inc. | | | 50,300 | | | | 1,147,846 | |
Resources Connection, Inc. | | | 126,675 | | | | 1,439,028 | |
RG Barry Corp. | | | 66,400 | | | | 915,656 | |
Roadrunner Transportation Systems, Inc.(a) | | | 205,500 | | | | 4,625,805 | |
Robert Half International, Inc. | | | 33,105 | | | | 1,086,506 | |
rue21, Inc.(a) | | | 36,900 | | | | 1,177,110 | |
SEI Investments Co. | | | 59,200 | | | | 1,696,672 | |
Silicon Laboratories, Inc.(a) | | | 22,640 | | | | 899,034 | |
Sonus Networks, Inc.(a) | | | 269,600 | | | | 566,160 | |
| | |
| Annual Report | April 30, 2013 | | 17 |
| | |
| Grandeur Peak Global Opportunities Fund | | Portfolio of Investments |
| | April 30, 2013 |
| | | | | | | | |
| | | Shares | | | Value (Note 2) | |
| |
United States (continued) | | | | | | | | |
Tetra Tech, Inc.(a) | | | 19,805 | | | $ | 520,673 | |
Tilly’s, Inc., Class A(a) | | | 341,846 | | | | 4,936,256 | |
Trimas Corp.(a) | | | 76,600 | | | | 2,336,300 | |
Universal Truckload Services, Inc.(a) | | | 141,143 | | | | 3,562,449 | |
Vera Bradley, Inc.(a) | | | 25,500 | | | | 581,910 | |
Volterra Semiconductor Corp.(a) | | | 65,435 | | | | 851,309 | |
WageWorks, Inc.(a) | | | 48,000 | | | | 1,229,280 | |
Zagg, Inc.(a) | | | 97,100 | | | | 657,367 | |
| | | | | | | | |
| | | | | | | 107,350,469 | |
| | | | | | | | |
| | |
TOTAL COMMON STOCKS (Cost $267,494,729) | | | | | | | 319,130,481 | |
| | | | | | | | |
| | |
EXCHANGE TRADED FUNDS (0.72%) | | | | | | | | |
Market Vectors® India Small-Cap Index ETF | | | 43,465 | | | | 412,918 | |
WisdomTree® India Earnings Fund | | | 112,000 | | | | 2,116,800 | |
| | | | | | | | |
| | |
TOTAL EXCHANGE TRADED FUNDS (Cost $2,628,855) | | | | | | | 2,529,718 | |
| | | | | | | | |
| | |
RIGHTS (0.02%) | | | | | | | | |
Sweden (0.02%) | | | | | | | | |
HIQ International AB, Rights, Strike Price 2.40 SEK
(expiring 05/25/13)(a) | | | 176,304 | | | | 65,015 | |
| | | | | | | | |
| | |
TOTAL RIGHTS (Cost $63,336) | | | | | | | 65,015 | |
| | | | | | | | |
| | |
SHORT TERM INVESTMENTS (7.63%) | | | | | | | | |
BlackRock Liquidity Funds Treasury Trust Fund Portfolio - Institutional Class (7 Day Yield 0.000%)(c) | | | 26,716,378 | | | | 26,716,378 | |
| | | | | | | | |
| | |
TOTAL SHORT TERM INVESTMENTS (Cost $26,716,378) | | | | | | | 26,716,378 | |
| | | | | | | | |
| | |
| 18 | | 1.855.377.7325 | www.GrandeurPeakGlobal.com |
| | |
| Grandeur Peak Global Opportunities Fund | | Portfolio of Investments |
| | April 30, 2013 |
| | | | |
TOTAL INVESTMENTS (99.46%) (Cost $296,903,298) | | $ | 348,441,592 | |
| |
Assets In Excess Of Other Liabilities (0.54%) | | | 1,896,075 | |
| | | | |
| |
NET ASSETS (100.00%) | | $ | 350,337,667 | |
| | | | |
| (a) | Non-Income Producing Security. |
| (b) | Security was purchased pursuant to Regulation S under the Securities Act of 1933, which exempts securities offered and sold outside of the United States from registration. Such security cannot be sold in the United States without either an effective registration statement filed pursuant to the Securities Act of 1933, or pursuant to an exemption from registration. The security has been deemed liquid under guidelines approved by the Fund’s Board of Trustees. As of April 30, 2013, the aggregate market value of those securities was $715,750, representing 0.20% of net assets. |
| (c) | Less than 0.0005% 7 Day Yield. |
Common Abbreviations:
AB - Aktiebolag is the Swedish equivalent of the term corporation.
ADR - American Depositary Receipt.
AG - Aktiengesellschaft is a German term that refers to a corporation that is limited by shares, i.e., owned by shareholders.
AS - Aktieselskab is the Danish term for a stock-based corporation.
Bhd - Berhad is the Malaysian term for public limited company.
ETF - Exchange Traded Fund.
GDR - Global Depositary Receipt.
Ltd. - Limited.
NV - Naamloze Vennootschap is the Dutch term for a public limited liability corporation.
PCL - Public Company Limited.
PLC - Public Limited Company.
PJSC - Public Joint Stock Company.
SA - Generally designates corporations in various countries, mostly those employing the civil law.
SAB de CV - A variable capital company.
SEK - Swedish Krona
Tbk PT - Terbuka Perseroan Terbatas is an Indonesian term for a limited liability company.
Holdings are subject to change.
For Fund compliance purposes, the Fund’s geographical classifications refer to any one or more of the sub-classifications used by one or more widely recognized market indexes or ratings group indexes, and/or as defined by Fund management. This definition may not apply for purposes of this report, which may combine sub-classifications for reporting ease. Geographical regions are shown as a percentage of net assets.
See Notes to Financial Statements.
| | |
| Annual Report | April 30, 2013 | | 19 |
| | |
| Grandeur Peak International Opportunities Fund | | Portfolio of Investments |
| | April 30, 2013 |
| | | | | | | | |
| | | Shares | | | Value (Note 2) | |
| |
COMMON STOCKS (86.16%) | | | | | | | | |
Australia (5.32%) | | | | | | | | |
ALS, Ltd. | | | 114,486 | | | $ | 1,161,951 | |
Countplus, Ltd. | | | 644,752 | | | | 1,269,986 | |
Lycopodium, Ltd. | | | 14,122 | | | | 74,958 | |
Magellan Financial Group, Ltd. | | | 1,411,057 | | | | 10,488,574 | |
Navitas, Ltd. | | | 47,280 | | | | 265,172 | |
The Reject Shop, Ltd. | | | 60,895 | | | | 1,122,448 | |
Sirtex Medical, Ltd. | | | 78,000 | | | | 784,366 | |
Super Retail Group, Ltd. | | | 155,348 | | | | 2,119,407 | |
Webjet, Ltd. | | | 265,318 | | | | 1,204,741 | |
| | | | | | | | |
| | | | | | | 18,491,603 | |
| | | | | | | | |
| | |
Belgium (1.92%) | | | | | | | | |
Melexis NV | | | 329,090 | | | | 6,687,288 | |
| | | | | | | | |
| | |
Brazil (5.54%) | | | | | | | | |
All America Latina Logistica SA | | | 498,600 | | | | 2,521,970 | |
Banco ABC Brasil SA | | | 200,273 | | | | 1,573,556 | |
Banco Daycoval SA | | | 1,133,200 | | | | 5,958,398 | |
CETIP SA - Mercados Organizados | | | 437,600 | | | | 5,166,119 | |
Even Construtora e Incorporadora SA | | | 367,000 | | | | 1,720,585 | |
Tegma Gestao Logistica | | | 171,800 | | | | 2,308,126 | |
| | | | | | | | |
| | | | | | | 19,248,754 | |
| | | | | | | | |
| | |
Britain (10.84%) | | | | | | | | |
Abcam PLC | | | 200,010 | | | | 1,363,909 | |
Advanced Medical Solutions Group PLC | | | 500,000 | | | | 617,457 | |
Blinkx PLC(a) | | | 4,059,600 | | | | 5,896,090 | |
Brammer PLC | | | 462,617 | | | | 2,561,830 | |
Clinigen Group PLC | | | 1,942,200 | | | | 8,085,335 | |
CVS Group PLC | | | 81,320 | | | | 241,900 | |
Fidessa Group PLC | | | 12,415 | | | | 346,163 | |
Globo PLC(a) | | | 1,500,000 | | | | 984,435 | |
Halma PLC | | | 174,999 | | | | 1,360,532 | |
Hunting PLC | | | 135,500 | | | | 1,698,565 | |
Michael Page International PLC | | | 140,425 | | | | 812,749 | |
N Brown Group PLC | | | 228,495 | | | | 1,583,000 | |
Premier Oil PLC(a) | | | 419,780 | | | | 2,431,551 | |
Robert Walters PLC | | | 141,400 | | | | 507,377 | |
RPS Group PLC | | | 1,512,790 | | | | 5,860,631 | |
Sthree PLC | | | 110,116 | | | | 573,868 | |
| | |
| 20 | | 1.855.377.7325 | www.GrandeurPeakGlobal.com |
| | |
| Grandeur Peak International Opportunities Fund | | Portfolio of Investments |
| | April 30, 2013 |
| | | | | | | | |
| | | Shares | | | Value (Note 2) | |
| |
Britain (continued) | | | | | | | | |
Ted Baker PLC | | | 61,378 | | | $ | 1,290,924 | |
Tracsis PLC | | | 170,100 | | | | 463,715 | |
Ultra Electronics Holdings PLC | | | 38,740 | | | | 992,917 | |
| | | | | | | | |
| | | | | | | 37,672,948 | |
| | | | | | | | |
| | |
Canada (4.76%) | | | | | | | | |
Atrium Innovations, Inc.(a) | | | 96,105 | | | | 1,181,936 | |
Gildan Activewear, Inc. | | | 16,500 | | | | 663,472 | |
Gran Tierra Energy, Inc.(a) | | | 530,950 | | | | 2,936,153 | |
Home Capital Group, Inc. | | | 72,230 | | | | 4,144,021 | |
Pan American Silver Corp. | | | 23,845 | | | | 313,610 | |
Richelieu Hardware, Ltd. | | | 80,550 | | | | 3,170,190 | |
SEMAFO, Inc. | | | 64,575 | | | | 122,426 | |
ShawCor, Ltd. | | | 46,545 | | | | 1,869,747 | |
Stantec, Inc. | | | 35,976 | | | | 1,538,385 | |
TransGlobe Energy Corp.(a) | | | 74,480 | | | | 589,955 | |
| | | | | | | | |
| | | | | | | 16,529,895 | |
| | | | | | | | |
| | |
China (4.66%) | | | | | | | | |
Airtac International Group | | | 207,000 | | | | 1,097,706 | |
China Medical System Holdings, Ltd. | | | 3,300,923 | | | | 3,237,054 | |
Cowealth Medical Holding Co., Ltd. | | | 397,000 | | | | 1,119,219 | |
Golden Eagle Retail Group, Ltd. | | | 496,000 | | | | 873,096 | |
NQ Mobile, Inc., ADR(a) | | | 310,600 | | | | 2,680,478 | |
O2Micro International, Ltd., ADR(a) | | | 302,714 | | | | 1,035,282 | |
Pacific Online, Ltd. | | | 5,359,152 | | | | 2,140,857 | |
Parkson Retail Group, Ltd. | | | 1,245,000 | | | | 673,827 | |
Tao Heung Holdings, Ltd. | | | 2,590,000 | | | | 1,635,407 | |
WuXi PharmaTech Cayman, Inc., ADR(a) | | | 89,900 | | | | 1,714,393 | |
| | | | | | | | |
| | | | | | | 16,207,319 | |
| | | | | | | | |
| | |
Finland (0.29%) | | | | | | | | |
BasWare OYJ | | | 39,743 | | | | 1,017,481 | |
| | | | | | | | |
| | |
France (1.15%) | | | | | | | | |
1000mercis SA | | | 6,585 | | | | 361,627 | |
Audika Groupe | | | 43,755 | | | | 445,427 | |
Neurones | | | 74,220 | | | | 880,674 | |
Sartorius Stedim Biotech | | | 10,112 | | | | 1,432,910 | |
| | |
| Annual Report | April 30, 2013 | | 21 |
| | |
| Grandeur Peak International Opportunities Fund | | Portfolio of Investments |
| | April 30, 2013 |
| | | | | | | | |
| | | Shares | | | Value (Note 2) | |
| |
France (continued) | | | | | | | | |
Thermador Groupe | | | 11,765 | | | $ | 886,252 | |
| | | | | | | | |
| | | | | | | 4,006,890 | |
| | | | | | | | |
| | |
Germany (3.92%) | | | | | | | | |
2G energy AG | | | 19,300 | | | | 1,009,823 | |
Adler Modemaerkte AG(a) | | | 39,200 | | | | 330,913 | |
Bertrandt AG | | | 22,100 | | | | 2,541,996 | |
CompuGroup Medical AG | | | 75,200 | | | | 1,734,097 | |
Gerry Weber International AG | | | 22,495 | | | | 986,654 | |
Nexus AG | | | 200,178 | | | | 2,385,802 | |
Softing AG | | | 80,786 | | | | 825,595 | |
Wirecard AG | | | 109,770 | | | | 2,944,721 | |
zooplus AG(a) | | | 15,350 | | | | 847,118 | |
| | | | | | | | |
| | | | | | | 13,606,719 | |
| | | | | | | | |
| | |
Hong Kong (2.91%) | | | | | | | | |
Far East Horizon, Ltd. | | | 3,781,000 | | | | 2,572,589 | |
Le Saunda Holdings, Ltd. | | | 3,192,400 | | | | 991,435 | |
Magic Holdings��International, Ltd. | | | 7,759,000 | | | | 4,189,379 | |
Trinity, Ltd. | | | 2,971,000 | | | | 1,171,531 | |
Vitasoy International Holdings, Ltd. | | | 982,338 | | | | 1,189,923 | |
| | | | | | | | |
| | | | | | | 10,114,857 | |
| | | | | | | | |
| | |
India (0.30%) | | | | | | | | |
MakeMyTrip, Ltd.(a) | | | 80,700 | | | | 1,036,188 | |
| | | | | | | | |
| | |
Indonesia (1.72%) | | | | | | | | |
Arwana Citramulia Tbk PT | | | 5,418,000 | | | | 1,727,519 | |
Lippo Cikarang Tbk PT(a) | | | 2,550,000 | | | | 1,796,606 | |
Ultrajaya Milk Industry & Trading Co. Tbk PT | | | 7,066,500 | | | | 2,471,185 | |
| | | | | | | | |
| | | | | | | 5,995,310 | |
| | | | | | | | |
| | |
Ireland (0.96%) | | | | | | | | |
Beazley PLC | | | 729,700 | | | | 2,544,661 | |
Kentz Corp., Ltd. | | | 131,000 | | | | 791,775 | |
| | | | | | | | |
| | | | | | | 3,336,436 | |
| | | | | | | | |
| | |
Israel (0.72%) | | | | | | | | |
Caesar Stone Sdot Yam, Ltd.(a) | | | 33,500 | | | | 785,910 | |
Camtek, Ltd.(a) | | | 56,296 | | | | 79,940 | |
| | |
| 22 | | 1.855.377.7325 | www.GrandeurPeakGlobal.com |
| | |
| Grandeur Peak International Opportunities Fund | | Portfolio of Investments |
| | April 30, 2013 |
| | | | | | | | |
| | | Shares | | | Value (Note 2) | |
| |
Israel (continued) | | | | | | | | |
SodaStream International, Ltd.(a) | | | 30,200 | | | $ | 1,625,968 | |
| | | | | | | | |
| | | | | | | 2,491,818 | |
| | | | | | | | |
| | |
Japan (7.48%) | | | | | | | | |
Benefit One, Inc. | | | 1,380 | | | | 1,911,063 | |
CMIC Co., Ltd. | | | 80,355 | | | | 1,747,475 | |
Create SD Holdings Co., Ltd. | | | 35,600 | | | | 1,579,422 | |
CyberAgent, Inc. | | | 566 | | | | 1,107,208 | |
Daiken Medical Co., Ltd. | | | 28,500 | | | | 1,274,658 | |
Gurunavi, Inc. | | | 97,000 | | | | 1,435,821 | |
Infomart Corp. | | | 20,200 | | | | 636,139 | |
Kakaku.com, Inc. | | | 60,000 | | | | 1,548,546 | |
MonotaRO Co., Ltd. | | | 72,090 | | | | 1,831,738 | |
Nakanishi, Inc. | | | 4,800 | | | | 614,495 | |
Next Co., Ltd. | | | 115,000 | | | | 1,193,825 | |
Nihon M&A Center, Inc. | | | 12,600 | | | | 664,348 | |
Seria Co., Ltd. | | | 76,000 | | | | 1,855,465 | |
Simplex Holdings, Inc. | | | 2,398 | | | | 931,059 | |
Toridoll Corp. | | | 145,000 | | | | 1,949,992 | |
Trancom Co., Ltd. | | | 156,290 | | | | 4,505,051 | |
Watts Co., Ltd. | | | 93,200 | | | | 1,206,528 | |
| | | | | | | | |
| | | | | | | 25,992,833 | |
| | | | | | | | |
| | |
Luxembourg (0.72%) | | | | | | | | |
L’Occitane International SA | | | 862,362 | | | | 2,500,357 | |
| | | | | | | | |
| | |
Malaysia (3.74%) | | | | | | | | |
Aeon Credit Service M Bhd | | | 710,040 | | | | 3,360,584 | |
Berjaya Food Bhd | | | 2,389,800 | | | | 1,060,388 | |
CB Industrial Product Holding Bhd | | | 922,000 | | | | 757,601 | |
JobStreet Corp. Bhd | | | 333,900 | | | | 362,159 | |
My EG Services Bhd | | | 8,808,700 | | | | 2,417,507 | |
Padini Holdings Bhd | | | 5,659,450 | | | | 3,329,635 | |
Uzma Bhd(a) | | | 2,394,200 | | | | 1,723,352 | |
| | | | | | | | |
| | | | | | | 13,011,226 | |
| | | | | | | | |
| | |
Mexico (0.75%) | | | | | | | | |
Genomma Lab Internacional SAB de CV(a) | | | 1,200,000 | | | | 2,591,272 | |
| | | | | | | | |
| | |
| Annual Report | April 30, 2013 | | 23 |
| | |
| Grandeur Peak International Opportunities Fund | | Portfolio of Investments |
| | April 30, 2013 |
| | | | | | | | |
| | | Shares | | | Value (Note 2) | |
| |
Netherlands (0.26%) | | | | | | | | |
Aalberts Industries NV | | | 40,000 | | | $ | 896,316 | |
| | | | | | | | |
| | |
Philippines (1.22%) | | | | | | | | |
COL Financial Group, Inc. | | | 1,800,000 | | | | 894,315 | |
Security Bank Corp. | | | 700,800 | | | | 3,357,574 | |
| | | | | | | | |
| | | | | | | 4,251,889 | |
| | | | | | | | |
| | |
Russia (0.50%) | | | | | | | | |
Exillon Energy PLC(a) | | | 66,740 | | | | 160,171 | |
Highland Gold Mining, Ltd. | | | 102,450 | | | | 134,076 | |
MD Medical Group Investments PLC, GDR(a)(b) | | | 82,000 | | | | 1,435,000 | |
| | | | | | | | |
| | | | | | | 1,729,247 | |
| | | | | | | | |
| | |
Singapore (3.66%) | | | | | | | | |
ARA Asset Management, Ltd. | | | 1,148,212 | | | | 1,766,552 | |
Breadtalk Group, Ltd. | | | 2,430,375 | | | | 1,913,992 | |
CSE Global, Ltd. | | | 2,180,055 | | | | 1,495,613 | |
Goodpack, Ltd. | | | 1,097,000 | | | | 1,496,273 | |
Parkson Retail Asia, Ltd. | | | 1,961,000 | | | | 2,626,979 | |
Petra Foods, Ltd. | | | 1,034,000 | | | | 3,425,120 | |
| | | | | | | | |
| | | | | | | 12,724,529 | |
| | | | | | | | |
| | |
South Africa (3.49%) | | | | | | | | |
Clicks Group, Ltd. | | | 128,485 | | | | 819,005 | |
Ellies Holdings, Ltd. | | | 2,599,240 | | | | 2,577,950 | |
EOH Holdings, Ltd. | | | 257,856 | | | | 1,420,960 | |
Foschini Group, Ltd. | | | 87,270 | | | | 1,118,410 | |
Italtile, Ltd. | | | 2,441,559 | | | | 1,632,513 | |
OneLogix Group, Ltd. | | | 2,250,000 | | | | 676,993 | |
Pinnacle Technology Holdings, Ltd. | | | 375,600 | | | | 920,845 | |
Super Group, Ltd.(a) | | | 924,600 | | | | 2,484,215 | |
Value Group, Ltd. | | | 817,368 | | | | 464,543 | |
| | | | | | | | |
| | | | | | | 12,115,434 | |
| | | | | | | | |
| | |
South Korea (6.99%) | | | | | | | | |
Able C&C Co., Ltd. | | | 18,360 | | | | 1,001,940 | |
Daum Communications Corp. | | | 40,700 | | | | 3,326,069 | |
Duksan Hi-Metal Co., Ltd.(a) | | | 64,900 | | | | 1,608,799 | |
ENF Technology Co., Ltd. | | | 61,500 | | | | 734,337 | |
Handsome Co., Ltd. | | | 53,600 | | | | 1,603,668 | |
Hy-Lok Corp. | | | 284,028 | | | | 5,802,806 | |
| | |
| 24 | | 1.855.377.7325 | www.GrandeurPeakGlobal.com |
| | |
| Grandeur Peak International Opportunities Fund | | Portfolio of Investments |
| | April 30, 2013 |
| | | | | | | | |
| | | Shares | | | Value (Note 2) | |
| |
South Korea (continued) | | | | | | | | |
Koh Young Technology, Inc. | | | 32,100 | | | $ | 998,297 | |
Kolao Holdings | | | 31,700 | | | | 863,525 | |
Kolon Life Science, Inc. | | | 8,650 | | | | 650,341 | |
KONA@I Co., Ltd. | | | 82,100 | | | | 2,105,988 | |
Korean Reinsurance Co. | | | 74,100 | | | | 726,668 | |
LEENO Industrial, Inc. | | | 36,800 | | | | 1,318,224 | |
LG Fashion Corp. | | | 58,470 | | | | 1,675,046 | |
MKTrend Co., Ltd. | | | 40,660 | | | | 406,120 | |
Silicon Works Co., Ltd. | | | 15,800 | | | | 326,387 | |
Vieworks Co., Ltd. | | | 39,500 | | | | 807,001 | |
Wins Technet Co., Ltd. | | | 16,800 | | | | 330,264 | |
| | | | | | | | |
| | | | | | | 24,285,480 | |
| | | | | | | | |
| | |
Sweden (1.71%) | | | | | | | | |
AddTech AB, B Shares | | | 56,130 | | | | 1,918,330 | |
DIBS Payment Services AB | | | 67,698 | | | | 465,871 | |
HIQ International AB | | | 237,000 | | | | 1,327,424 | |
Indutrade AB | | | 49,450 | | | | 1,724,366 | |
Seamless Distribution AB(a) | | | 140,000 | | | | 496,833 | |
| | | | | | | | |
| | | | | | | 5,932,824 | |
| | | | | | | | |
| | |
Taiwan (5.96%) | | | | | | | | |
Coland Holdings, Ltd. | | | 470,000 | | | | 1,089,320 | |
Cub Elecparts, Inc. | | | 355,000 | | | | 1,006,828 | |
Global Mixed Mode Technology, Inc. | | | 558,500 | | | | 1,741,054 | |
Leadtrend Technology Corp. | | | 655,000 | | | | 1,032,038 | |
Ledlink Optics, Inc. | | | 120,000 | | | | 357,821 | |
Pacific Hospital Supply Co. | | | 704,700 | | | | 2,340,085 | |
Polyronics Tech Corp. | | | 1,700,300 | | | | 3,341,603 | |
Power Mate Technology Co., Ltd. | | | 586,400 | | | | 770,951 | |
Richtek Technology Corp. | | | 218,000 | | | | 1,200,359 | |
Sporton International, Inc. | | | 1,300,208 | | | | 3,282,241 | |
Taiwan Hon Chuan Enterprise Co., Ltd. | | | 441,800 | | | | 1,227,555 | |
Test Research, Inc. | | | 449,880 | | | | 742,381 | |
TSC Auto ID Technology Co., Ltd. | | | 412,000 | | | | 1,842,776 | |
TXC Corp. | | | 471,900 | | | | 735,545 | |
| | | | | | | | |
| | | | | | | 20,710,557 | |
| | | | | | | | |
Thailand (0.89%) | | | | | | | | |
Coastal Energy Co. (London Exchange)(a) | | | 5,218 | | | | 99,291 | |
Coastal Energy Co. (Toronto Exchange)(a) | | | 44,000 | | | | 843,357 | |
| | |
| Annual Report | April 30, 2013 | | 25 |
| | |
| Grandeur Peak International Opportunities Fund | | Portfolio of Investments |
| | April 30, 2013 |
| | | | | | | | |
| | | Shares | | | Value (Note 2) | |
| |
Thailand (continued) | | | | | | | | |
Premier Marketing PCL | | | 5,470,000 | | | $ | 2,143,271 | |
| | | | | | | | |
| | | | | | | 3,085,919 | |
| | | | | | | | |
| | |
Turkey (2.29%) | | | | | | | | |
Albaraka Turk Katilim Bankasi AS(a) | | | 2,226,785 | | | | 2,409,685 | |
Emlak Konut Gayrimenkul Yatirim Ortakligi AS | | | 1,329,800 | | | | 2,277,220 | |
Katmerciler Arac Ustu Ekipman Sanayi ve Ticaret AS(a) | | | 512,338 | | | | 1,606,102 | |
TAV Havalimanlari Holding AS(a) | | | 236,100 | | | | 1,665,969 | |
| | | | | | | | |
| | | | | | | 7,958,976 | |
| | | | | | | | |
| | |
United Arab Emirates (0.13%) | | | | | | | | |
Aramex PJSC | | | 726,900 | | | | 457,157 | |
| | | | | | | | |
| | |
United States (1.36%) | | | | | | | | |
First Cash Financial Services, Inc.(a) | | | 43,100 | | | | 2,218,357 | |
Nu Skin Enterprises, Inc., Class A | | | 49,650 | | | | 2,518,745 | |
| | | | | | | | |
| | | | | | | 4,737,102 | |
| | | | | | | | |
| | |
TOTAL COMMON STOCKS (Cost $260,768,675) | | | | | | | 299,424,624 | |
| | | | | | | | |
| | |
EXCHANGE TRADED FUNDS (2.68%) | | | | | | | | |
Market Vectors® India Small-Cap Index ETF | | | 80,770 | | | | 767,315 | |
WisdomTree® India Earnings Fund | | | 453,000 | | | | 8,561,700 | |
| | | | | | | | |
| | |
TOTAL EXCHANGE TRADED FUNDS (Cost $9,294,028) | | | | | | | 9,329,015 | |
| | | | | | | | |
| | |
RIGHTS (0.03%) | | | | | | | | |
Sweden (0.03%) | | | | | | | | |
HIQ International AB, Rights, Strike Price 2.40 SEK (expiring 05/25/13)(a) | | | 237,000 | | | | 87,398 | |
| | | | | | | | |
| | |
TOTAL RIGHTS (Cost $85,864) | | | | | | | 87,398 | |
| | | | | | | | |
| | |
| 26 | | 1.855.377.7325 | www.GrandeurPeakGlobal.com |
| | |
| Grandeur Peak International Opportunities Fund | | Portfolio of Investments |
| | April 30, 2013 |
| | | | | | | | |
| | | Shares | | | Value (Note 2) | |
| |
SHORT TERM INVESTMENTS (13.17%) | | | | | | | | |
BlackRock Liquidity Funds Treasury Trust Fund Portfolio - Institutional Class (7 Day Yield 0.000%)(c) | | | 45,753,982 | | | $ | 45,753,982 | |
| | | | | | | | |
| | |
TOTAL SHORT TERM INVESTMENTS (Cost $ 45,753,982) | | | | | | | 45,753,982 | |
| | | | | | | | |
| | |
TOTAL INVESTMENTS (102.04%) (Cost $ 315,902,549) | | | | | | $ | 354,595,019 | |
| | |
Liabilities In Excess Of Other Assets (-2.04%) | | | | | | | (7,083,003) | |
| | | | | | | | |
| | |
NET ASSETS (100.00%) | | | | | | $ | 347,512,016 | |
| | | | | | | | |
| | | | | | | | |
| (a) | Non-Income Producing Security. |
| (b) | Security was purchased pursuant to Regulation S under the Securities Act of 1933, which exempts securities offered and sold outside of the United States from registration. Such security cannot be sold in the United States without either an effective registration statement filed pursuant to the Securities Act of 1933, or pursuant to an exemption from registration. The security has been deemed liquid under guidelines approved by the Fund’s Board of Trustees. As of April 30, 2013, the aggregate market value of those securities was $1,435,000, representing 0.41% of net assets. |
| (c) | Less than 0.0005% 7 Day Yield. |
Common Abbreviations:
AB - Aktiebolag is the Swedish equivalent of the term corporation.
ADR - American Depositary Receipt.
AG - Aktiengesellschaft is a German term that refers to a corporation that is limited by shares, i.e., owned by shareholders.
AS - Aktieselskab is the Danish term for a stock-based corporation.
Bhd - Berhad is the Malaysian term for public limited company.
ETF - Exchange Traded Fund.
GDR - Global Depositary Receipt.
Ltd. - Limited.
NV - Naamloze Vennootschap is the Dutch term for a public limited liability corporation.
OYJ - Julkinen Osakeyhtiö is the Finnish term for a public limited company.
PCL - Public Company Limited.
PLC - Public Limited Company.
PJSC - Public Joint Stock Company.
SA - Generally designates corporations in various countries, mostly those employing the civil law.
SAB de CV - A variable capital company.
SEK - Swedish Krona
Tbk PT - Terbuka Perseroan Terbatas is an Indonesian term for a limited liability company.
| | |
| Annual Report | April 30, 2013 | | 27 |
| | |
| Grandeur Peak International Opportunities Fund | | Portfolio of Investments |
| | April 30, 2013 |
Holdings are subject to change.
For Fund compliance purposes, the Fund’s geographical classifications refer to any one or more of the sub-classifications used by one or more widely recognized market indexes or ratings group indexes, and/or as defined by Fund management. This definition may not apply for purposes of this report, which may combine sub-classifications for reporting ease. Geographical regions are shown as a percentage of net assets.
See Notes to Financial Statements.
| | |
| 28 | | 1.855.377.7325 | www.GrandeurPeakGlobal.com |
| | |
| Grandeur Peak Funds® | | Statements of Assets and Liabilities |
| | April 30, 2013 |
| | | | | | | | |
| | | Grandeur Peak | | | Grandeur Peak | |
| | | Global | | | International | |
| | | Opportunities | | | Opportunities | |
| |
ASSETS | | | | | | | | |
Investments, at value (Cost - see below) | | $ | 348,441,592 | | | $ | 354,595,019 | |
Cash | | | – | | | | 97,666 | |
Foreign cash, at value
(Cost $5,477,911 and $4,115,660, respectively) | | | 5,524,837 | | | | 4,117,662 | |
Dividends and interest receivable | | | 471,775 | | | | 656,225 | |
Receivable for investments sold | | | 375,332 | | | | 60,969 | |
Receivable for fund shares subscribed | | | 1,295,618 | | | | 7,363,778 | |
Prepaid and other assets | | | 17,960 | | | | 38,830 | |
| |
Total assets | | | 356,127,114 | | | | 366,930,149 | |
| |
| | |
LIABILITIES | | | | | | | | |
Payable for investments purchased | | | 5,295,637 | | | | 19,048,924 | |
Payable for fund shares redeemed | | | 27,812 | | | | 13,191 | |
Advisory fees payable | | | 303,668 | | | | 188,830 | |
Administration fees payable | | | 18,393 | | | | 17,510 | |
Custodian fees payable | | | 35,462 | | | | 44,226 | |
Payable for trustee fees and expenses | | | 7,468 | | | | 6,436 | |
Payable for chief compliance officer fee | | | 3,750 | | | | 3,750 | |
Payable for principal financial officer fees | | | 1,250 | | | | 1,250 | |
Distribution and service fees payable | | | 25,465 | | | | 18,356 | |
Accrued expenses and other liabilities | | | 70,542 | | | | 75,660 | |
| |
Total liabilities | | | 5,789,447 | | | | 19,418,133 | |
| |
NET ASSETS | | $ | 350,337,667 | | | $ | 347,512,016 | |
| |
| |
| | |
NET ASSETS CONSISTS OF | | | | | | | | |
Paid-in capital (Note 5) | | $ | 296,682,176 | | | $ | 307,288,881 | |
Accumulated net investment loss | | | (865,742) | | | | (643,664) | |
Accumulated net realized gain on investments and foreign currency transactions | | | 2,948,603 | | | | 2,233,261 | |
Net unrealized appreciation on investments and translation of assets and liabilities in foreign currencies | | | 51,572,630 | | | | 38,633,538 | |
| |
NET ASSETS | | $ | 350,337,667 | | | $ | 347,512,016 | |
| |
| |
| | |
INVESTMENTS, AT COST | | $ | 296,903,298 | | | $ | 315,902,549 | |
| | |
| Annual Report | April 30, 2013 | | 29 |
| | |
| Grandeur Peak Funds® | | Statements of Assets and Liabilities (continued) |
| | April 30, 2013 |
| | | | | | | | |
| | | Grandeur Peak | | | Grandeur Peak | |
| | | Global | | | International | |
| | | Opportunities | | | Opportunities | |
| |
PRICING OF SHARES | | | | | | | | |
Investor Class | | | | | | | | |
Net Assets | | $ | 132,384,188 | | | $ | 96,550,019 | |
Net Asset Value, offering and redemption price per share | | $ | 2.77 | | | $ | 2.83 | |
Shares of beneficial interest outstanding | | | 47,777,008 | | | | 34,086,828 | |
Institutional Class | | | | | | | | |
Net Assets | | $ | 217,953,479 | | | $ | 250,961,997 | |
Net Asset Value, offering and redemption price per share | | $ | 2.79 | | | $ | 2.84 | |
Shares of beneficial interest outstanding | | | 78,234,962 | | | | 88,473,439 | |
See Notes to Financial Statements.
| | |
| 30 | | 1.855.377.7325 | www.GrandeurPeakGlobal.com |
| | |
| Grandeur Peak Funds® | | Statements of Operations |
| | For the Year Ended April 30, 2013 |
| | | | | | | | |
| | | Grandeur Peak
Global
Opportunities | | | Grandeur Peak
International
Opportunities | |
| |
INVESTMENT INCOME | | | | | | | | |
Dividends | | $ | 4,214,792 | | | $ | 2,979,329 | |
Interest | | | 2,150 | | | | 38 | |
Foreign taxes withheld | | | (272,258) | | | | (245,169) | |
| |
Total investment income | | | 3,944,684 | | | | 2,734,198 | |
| |
| | |
EXPENSES | | | | | | | | |
Investment advisor fees (Note 6) | | | 2,593,394 | | | | 1,698,009 | |
Administrative fees | | | 160,136 | | | | 103,321 | |
Distribution and service fees - Investor Class | | | 225,018 | | | | 67,649 | |
Transfer agent fees | | | 64,351 | | | | 42,434 | |
Legal fees | | | 9,785 | | | | 6,445 | |
Printing fees | | | 27,514 | | | | 15,281 | |
Registration fees | | | 49,848 | | | | 68,315 | |
Audit and tax preparation fees | | | 23,959 | | | | 23,654 | |
Custodian fees | | | 108,553 | | | | 136,643 | |
Trustee fees and expenses | | | 15,451 | | | | 10,622 | |
Chief compliance officer fees | | | 15,000 | | | | 15,000 | |
Principal financial officer fees | | | 5,000 | | | | 5,000 | |
Offering costs | | | 34,146 | | | | 31,823 | |
Other expenses | | | 24,670 | | | | 18,008 | |
| |
Total expenses | | | 3,356,825 | | | | 2,242,204 | |
Less fees waived/reimbursed by investment advisor | | | | | | | | |
Investor Class | | | (8,775) | | | | (33,942) | |
Institutional Class | | | (11,427) | | | | (103,002) | |
| |
Total net expenses | | | 3,336,623 | | | | 2,105,260 | |
| |
NET INVESTMENT INCOME | | | 608,061 | | | | 628,938 | |
| |
| | |
REALIZED AND UNREALIZED GAIN/(LOSS) ON INVESTMENTS | | | | | | | | |
Net realized gain on investments | | | 6,177,404 | | | | 3,207,753 | |
Net realized loss on foreign currency transactions | | | (667,152) | | | | (373,626) | |
Net change in unrealized appreciation on investments | | | 43,055,771 | | | | 35,338,869 | |
Net change in unrealized appreciation/(depreciation) on translation of assets and liabilities in foreign currencies | | | 33,160 | | | | (67,240) | |
| |
NET REALIZED AND UNREALIZED GAIN ON INVESTMENTS AND FOREIGN CURRENCY TRANSACTIONS | | | 48,599,183 | | | | 38,105,756 | |
| |
NET INCREASE IN NET ASSETS RESULTING FROM OPERATIONS | | $ | 49,207,244 | | | $ | 38,734,694 | |
| |
| |
See Notes to Financial Statements.
| | |
| Annual Report | April 30, 2013 | | 31 |
| | |
| Grandeur Peak Global Opportunities Fund | | Statements of Changes in Net Assets |
| | |
| | | | | | | | | | |
| | | For the Year Ended
April 30, 2013 | | | For the Period
October 17, 2011
(Inception) to
April 30, 2012 | | | |
|
OPERATIONS | | | | | | | | | | |
Net investment income | | $ | 608,061 | | | $ | 95,503 | | | |
Net realized gain on investments and foreign currency transactions | | | 5,510,252 | | | | 101,624 | | | |
Net change in unrealized appreciation on investments and foreign currency translations | | | 43,088,931 | | | | 9,712,622 | | | |
|
Net increase in net assets resulting from operations | | | 49,207,244 | | | | 9,909,749 | | | |
|
| | | |
DISTRIBUTIONS TO SHAREHOLDERS | | | | | | | | | | |
Net investment income | | | | | | | | | | |
Investor Class | | | (499,095) | | | | – | | | |
Institutional Class | | | (815,023) | | | | – | | | |
Net realized gains on investments | | | | | | | | | | |
Investor Class | | | (1,304,234) | | | | – | | | |
Institutional Class | | | (1,691,595) | | | | – | | | |
|
Net decrease in net assets from distributions | | | (4,309,947) | | | | – | | | |
|
| | | |
CAPITAL SHARE TRANSACTIONS (NOTE 5) | | | | | | | | | | |
Investor Class | | | | | | | | | | |
Proceeds from sales of shares | | | 54,013,215 | | | | 70,935,320 | | | |
Distributions reinvested | | | 1,777,862 | | | | – | | | |
Cost of shares redeemed | | | (15,078,229) | | | | (479,829) | | | |
Redemption fees | | | 6,976 | | | | 1,255 | | | |
|
Net increase from capital shares transactions | | | 40,719,824 | | | | 70,456,746 | | | |
|
| | | |
Institutional Class | | | | | | | | | | |
Proceeds from sales of shares | | | 119,663,878 | | | | 70,797,423 | | | |
Distributions reinvested | | | 2,431,109 | | | | – | | | |
Cost of shares redeemed | | | (8,266,338) | | | | (272,865) | | | |
Redemption fees | | | 682 | | | | 162 | | | |
|
Net increase from capital shares transactions | | | 113,829,331 | | | | 70,524,720 | | | |
|
| | | |
Net increase in net assets | | | 199,446,452 | | | | 150,891,215 | | | |
|
| | | |
NET ASSETS | | | | | | | | | | |
Beginning of year | | | 150,891,215 | | | | – | | | |
|
End of year* | | $ | 350,337,667 | | | $ | 150,891,215 | | | |
|
|
| | | |
*Including accumulated net investment loss of: | | $ | (865,742) | | | $ | (329,624) | | | |
| | |
| 32 | | 1.855.377.7325 | www.GrandeurPeakGlobal.com |
| | |
| Grandeur Peak Global Opportunities Fund | | Statements of Changes in Net Assets (continued) |
| | |
| | | | | | | | |
| | | For the
Year Ended
April 30, 2013 | | | For the Period
October 17, 2011
(Inception) to
April 30, 2012 | |
| |
OTHER INFORMATION | | | | | | | | |
Shares Transactions | | | | | | | | |
Investor Class | | | | | | | | |
Issued | | | 21,496,144 | | | | 31,896,998 | |
Issued in lieu of cash distributions | | | 725,658 | | | | – | |
Redeemed | | | (6,120,849) | | | | (220,943) | |
| |
Net increase in share transactions | | | 16,100,953 | | | | 31,676,055 | |
| |
| |
| | |
Institutional Class | | | | | | | | |
Issued | | | 47,178,631 | | | | 33,638,446 | |
Issued in lieu of cash distributions | | | 988,256 | | | | – | |
Redeemed | | | (3,450,605) | | | | (119,766) | |
| |
Net increase in share transactions | | | 44,716,282 | | | | 33,518,680 | |
| |
| |
See Notes to Financial Statements.
| | |
| Annual Report | April 30, 2013 | | 33 |
| | |
| Grandeur Peak International Opportunities Fund | | Statements of Changes in Net Assets |
| | |
| | | | | | | | |
| | | For the
Year Ended
April 30, 2013 | | | For the Period
October 17, 2011
(Inception) to
April 30, 2012 | |
| |
OPERATIONS | | | | | | | | |
Net investment income | | $ | 628,938 | | | $ | 68,526 | |
Net realized gain/(loss) on investments and foreign currency transactions | | | 2,834,127 | | | | (555,062) | |
Net change in unrealized appreciation on investments and foreign currency translations | | | 35,271,629 | | | | 4,261,024 | |
| |
Net increase in net assets resulting from operations | | | 38,734,694 | | | | 3,774,488 | |
| |
| | |
DISTRIBUTIONS TO SHAREHOLDERS | | | | | | | | |
Net investment income | | | | | | | | |
Investor Class | | | (130,100) | | | | – | |
Institutional Class | | | (937,970) | | | | – | |
Net realized gains on investments | | | | | | | | |
Investor Class | | | (53,171) | | | | – | |
Institutional Class | | | (333,531) | | | | – | |
| |
Net decrease in net assets from distributions | | | (1,454,772) | | | | – | |
| |
| | |
CAPITAL SHARE TRANSACTIONS (NOTE 5) | | | | | | | | |
Investor Class | | | | | | | | |
Proceeds from sales of shares | | | 85,888,034 | | | | 8,652,042 | |
Distributions reinvested | | | 161,260 | | | | – | |
Cost of shares redeemed | | | (6,392,115) | | | | (306,774) | |
Redemption fees | | | 16,442 | | | | 196 | |
| |
Net increase from capital shares transactions | | | 79,673,621 | | | | 8,345,464 | |
| |
| | |
Institutional Class | | | | | | | | |
Proceeds from sales of shares | | | 170,464,416 | | | | 52,679,495 | |
Distributions reinvested | | | 1,149,105 | | | | – | |
Cost of shares redeemed | | | (5,787,933) | | | | (69,011) | |
Redemption fees | | | 1,265 | | | | 1,184 | |
| |
Net increase from capital shares transactions | | | 165,826,853 | | | | 52,611,668 | |
| |
| | |
Net increase in net assets | | | 282,780,396 | | | | 64,731,620 | |
| |
| | |
NET ASSETS | | | | | | | | |
Beginning of year | | | 64,731,620 | | | | – | |
| |
End of year* | | $ | 347,512,016 | | | $ | 64,731,620 | |
| |
| |
| | |
*Including accumulated net investment loss of: | | $ | (643,664) | | | $ | (184,355) | |
| | |
| 34 | | 1.855.377.7325 | www.GrandeurPeakGlobal.com |
| | |
| Grandeur Peak International Opportunities Fund | | Statements of Changes |
| | in Net Assets (continued) |
| | | | | | | | |
| | | For the Year Ended April 30, 2013 | | | For the Period
October 17, 2011 (Inception) to April 30, 2012 | |
OTHER INFORMATION | | | | | | | | |
Shares Transactions | | | | | | | | |
Investor Class | | | | | | | | |
Issued | | | 32,421,152 | | | | 4,205,017 | |
Issued in lieu of cash distributions | | | 63,992 | | | | – | |
Redeemed | | | (2,456,449) | | | | (146,884) | |
| | | | | | | | | |
Net increase in share transactions | | | 30,028,695 | | | | 4,058,133 | |
| | | | | | | | | |
| | |
Institutional Class | | | | | | | | |
Issued | | | 66,055,460 | | | | 24,273,224 | |
Issued in lieu of cash distributions | | | 455,994 | | | | – | |
Redeemed | | | (2,280,523) | | | | (30,716) | |
| | | | | | | | | |
Net increase in share transactions | | | 64,230,931 | | | | 24,242,508 | |
| | | | | | | | | |
See Notes to Financial Statements
| | |
| Annual Report | April 30, 2013 | | 35 |
| | |
| Grandeur Peak Global Opportunities Fund | | Financial Highlights |
| | For a share outstanding throughout the periods presented. |
| | | | | | | | |
| Investor Class | | Year Ended April 30, 2013 | | | For the Period October 17, 2011 (Inception) to April 30, 2012 | |
NET ASSET VALUE, BEGINNING OF PERIOD | | $ | 2.31 | | | $ | 2.00 | |
| | |
INCOME FROM INVESTMENT OPERATIONS | | | | | | | | |
Net investment income/(loss)(a) | | | 0.00 | (b) | | | (0.00) | (b) |
Net realized and unrealized gain on investments | | | 0.51 | | | | 0.31 | |
| | | | | | | | | |
Total income from investment operations | | | 0.51 | | | | 0.31 | |
| | | | | | | | | |
| | |
DISTRIBUTIONS | | | | | | | | |
From net investment income | | | (0.01) | | | | – | |
From net realized gain on investments | | | (0.04) | | | | – | |
| | | | | | | | | |
Total distributions | | | (0.05) | | | | – | |
| | | | | | | | | |
| | |
REDEMPTION FEES ADDED TO PAID-IN CAPITAL | | | 0.00 | (b) | | | 0.00 | (b) |
| | | | | | | | | |
| | |
INCREASE IN NET ASSET VALUE | | | 0.46 | | | | 0.31 | |
| | | | | | | | | |
NET ASSET VALUE, END OF PERIOD | | $ | 2.77 | | | $ | 2.31 | |
| | | | | | | | | |
| | |
TOTAL RETURN | | | 22.34 | % | | | 15.50% | (c) |
| | |
RATIOS AND SUPPLEMENTAL DATA | | | | | | | | |
Net assets, end of period (in 000s) | | $ | 132,384 | | | $ | 73,154 | |
| | |
RATIOS TO AVERAGE NET ASSETS | | | | | | | | |
Expenses (excluding fees waived/reimbursed by investment advisor) | | | 1.76 | % | | | 2.30% | (d) |
Expenses (including fees waived/reimbursed by investment advisor) | | | 1.75 | % | | | 1.75% | (d) |
Net investment income/(loss) | | | 0.19 | % | | | (0.04)% | (d) |
| | |
PORTFOLIO TURNOVER RATE | | | 35 | % | | | 42% | (c) |
| (a) | Per share numbers have been calculated using the average shares method. |
| (b) | Less than $0.005 per share. |
See Notes to Financial Statements.
| | |
| 36 | | 1.855.377.7325 | www.GrandeurPeakGlobal.com |
| | |
| Grandeur Peak Global Opportunities Fund | | Financial Highlights |
| | For a share outstanding throughout the period presented. |
| | | | | | | | |
| Institutional Class | | Year Ended
April 30, 2013 | | | For the Period October 17, 2011 (Inception) to April 30, 2012 | |
NET ASSET VALUE, BEGINNING OF PERIOD | | $ | 2.32 | | | $ | 2.00 | |
| | |
INCOME FROM INVESTMENT OPERATIONS | | | | | | | | |
Net investment income(a) | | | 0.01 | | | | 0.00 | (b) |
Net realized and unrealized gain on investments | | | 0.52 | | | | 0.32 | |
Total income from investment operations | | | 0.53 | | | | 0.32 | |
| | |
DISTRIBUTIONS | | | | | | | | |
From net investment income | | | (0.02 | ) | | | – | |
From net realized gain on investments | | | (0.04 | ) | | | – | |
Total distributions | | | (0.06 | ) | | | – | |
| | |
REDEMPTION FEES ADDED TO PAID-IN CAPITAL | | | 0.00 | (b) | | | 0.00 | (b) |
| | |
INCREASE IN NET ASSET VALUE | | | 0.47 | | | | 0.32 | |
NET ASSET VALUE, END OF PERIOD | | $ | 2.79 | | | $ | 2.32 | |
| | | | | | | | | |
| | |
TOTAL RETURN | | | 22.86% | | | | 16.00% | (c) |
| | |
RATIOS AND SUPPLEMENTAL DATA | | | | | | | | |
Net assets, end of period (in 000s) | | $ | 217,953 | | | $ | 77,737 | |
| | |
RATIOS TO AVERAGE NET ASSETS | | | | | | | | |
Expenses (excluding fees waived/reimbursed by investment advisor) | | | 1.51% | | | | 2.03%(d) | |
Expenses (including fees waived/reimbursed by investment advisor) | | | 1.50% | | | | 1.50%(d) | |
Net investment income | | | 0.37% | | | | 0.40%(d) | |
| | |
PORTFOLIO TURNOVER RATE | | | 35% | | | | 42%(c) | |
| (a) | Per share numbers have been calculated using the average shares method. |
| (b) | Less than $0.005 per share. |
See Notes to Financial Statements.
| | |
| Annual Report | April 30, 2013 | | 37 |
| | |
| Grandeur Peak International Opportunities Fund | | Financial Highlights |
| | For a share outstanding throughout the periods presented. |
| | | | | | | | |
| Investor Class | | Year Ended
April 30, 2013 | | | For the Period October 17, 2011 (Inception) to April 30, 2012 | |
NET ASSET VALUE, BEGINNING OF PERIOD | | $ | 2.29 | | | $ | 2.00 | |
| | |
INCOME FROM INVESTMENT OPERATIONS | | | | | | | | |
Net investment income(a) | | | 0.01 | | | | 0.00 | (b) |
Net realized and unrealized gain on investments | | | 0.55 | | | | 0.29 | |
Total income from investment operations | | | 0.56 | | | | 0.29 | |
| | |
DISTRIBUTIONS | | | | | | | | |
From net investment income | | | (0.01) | | | | – | |
From net realized gain on investments | | | (0.01) | | | | – | |
Total distributions | | | (0.02) | | | | – | |
| | |
REDEMPTION FEES ADDED TO PAID-IN CAPITAL | | | 0.00 | (b) | | | 0.00 | (b) |
| | |
INCREASE IN NET ASSET VALUE | | | 0.54 | | | | 0.29 | |
NET ASSET VALUE, END OF PERIOD | | $ | 2.83 | | | $ | 2.29 | |
| | | | | | | | | |
| | |
TOTAL RETURN | | | 24.57 | % | | | 14.50% | (c) |
| | |
RATIOS AND SUPPLEMENTAL DATA | | | | | | | | |
Net assets, end of period (in 000s) | | $ | 96,550 | | | $ | 9,274 | |
| | |
RATIOS TO AVERAGE NET ASSETS | | | | | | | | |
Expenses (excluding fees waived/reimbursed by investment advisor) | | | 1.88 | % | | | 2.94% | (d) |
Expenses (including fees waived/reimbursed by investment advisor) | | | 1.75 | % | | | 1.75% | (d) |
Net investment income | | | 0.26 | % | | | 0.33% | (d) |
| | |
PORTFOLIO TURNOVER RATE | | | 52 | % | | | 24% | (c) |
| (a) | Per share numbers have been calculated using the average shares method. |
| (b) | Less than $0.005 per share. |
See Notes to Financial Statements.
| | |
| 38 | | 1.855.377.7325 | www.GrandeurPeakGlobal.com |
| | |
| Grandeur Peak International Opportunites Fund | | Financial Highlights |
| | For a share outstanding throughout the period presented. |
| | | | | | | | |
| Institutional Class | | Year Ended
April 30, 2013 | | | For the Period
October 17, 2011
(Inception) to April 30, 2012 | |
NET ASSET VALUE, BEGINNING OF PERIOD | | $ | 2.29 | | | $ | 2.00 | |
| | |
INCOME FROM INVESTMENT OPERATIONS | | | | | | | | |
Net investment income(a) | | | 0.01 | | | | 0.01 | |
Net realized and unrealized gain on investments | | | 0.57 | | | | 0.28 | |
Total income from investment operations | | | 0.58 | | | | 0.29 | |
| | |
DISTRIBUTIONS | | | | | | | | |
From net investment income | | | (0.02) | | | | – | |
From net realized gain on investments | | | (0.01) | | | | – | |
Total distributions | | | (0.03) | | | | – | |
| | |
REDEMPTION FEES ADDED TO PAID-IN CAPITAL | | | 0.00 | (b) | | | 0.00 | (b) |
| | |
INCREASE IN NET ASSET VALUE | | | 0.55 | | | | 0.29 | |
NET ASSET VALUE, END OF PERIOD | | $ | 2.84 | | | $ | 2.29 | |
| | | | | | | | | |
| | |
TOTAL RETURN | | | 25.11 | % | | | 14.50% | (c) |
| | |
RATIOS AND SUPPLEMENTAL DATA | | | | | | | | |
Net assets, end of period (in 000s) | | $ | 250,962 | | | $ | 55,458 | |
| | |
RATIOS TO AVERAGE NET ASSETS | | | | | | | | |
Expenses (excluding fees waived/reimbursed by investment advisor) | | | 1.59 | % | | | 2.50% | (d) |
Expenses (including fees waived/reimbursed by investment advisor) | | | 1.50 | % | | | 1.50% | (d) |
Net investment income | | | 0.51 | % | | | 0.56% | (d) |
| | |
PORTFOLIO TURNOVER RATE | | | 52 | % | | | 24% | (c) |
| (a) | Per share numbers have been calculated using the average shares method. |
| (b) | Less than $0.005 per share. |
See Notes to Financial Statements.
| | |
| Annual Report | April 30, 2013 | | 39 |
| | |
| Grandeur Peak Funds® | | Notes to Financial Statements |
| | April 30, 2013 |
1. ORGANIZATION
Financial Investors Trust (the “Trust”), a Delaware statutory trust, is an open-end management investment company registered under the Investment Company Act of 1940, as amended (“1940 Act”). As of April 30, 2013, the Trust had 26 registered funds. This annual report describes the Grandeur Peak Global Opportunities Fund and Grandeur Peak International Opportunities Fund (each a “Fund” and collectively, the “Funds”). The Grandeur Peak Global Opportunities Fund seeks long-term growth of capital and invests primarily in foreign and domestic small and micro cap companies. The Grandeur Peak International Opportunities Fund seeks long-term growth of capital and invests primarily in foreign small and micro cap companies. The Funds offer Investor Class and Institutional Class shares. All classes of shares have identical rights to earnings, assets and voting privileges, except for class specific expenses and exclusive rights to vote on matters affecting only individual classes.
2. SIGNIFICANT ACCOUNTING POLICIES
The accompanying financial statements were prepared in accordance with accounting principles generally accepted in the United States of America (“U.S. GAAP”). The preparation of financial statements in conformity with U.S. GAAP requires management to make certain estimates and assumptions that affect the reported amounts of assets and liabilities and disclosures of contingent assets and liabilities at the date of the financial statements and the reported amounts of revenue and expenses during the period. Actual results could differ from those estimates. The following is a summary of significant accounting policies consistently followed by the Funds in preparation of their financial statements.
Investment Valuation: The Funds generally value their securities based on market prices determined at the close of regular trading on the New York Stock Exchange (“NYSE”), normally 4:00 p.m. Eastern Time, on each day the NYSE is open for trading.
For equity securities and mutual funds that are traded on an exchange, the market price is usually the closing sale or official closing price on that exchange. In the case of equity securities not traded on an exchange, or if such closing prices are not otherwise available, the securities are valued at the mean of the most recent bid and ask prices on such day. Redeemable securities issued by open-end registered investment companies are valued at the investment company’s applicable net asset value.
Equity securities that are primarily traded on foreign securities exchanges are valued at the closing values of such securities on their respective foreign exchanges, except when an event occurs subsequent to the close of the foreign exchange and the close of the NYSE that was likely to have changed such value. In such an event, the fair value of those securities are determined in good faith through consideration of other factors in accordance with procedures established by and under the general supervision of the Board of Trustees (the “Board”). The Funds will use a fair valuation model provided by an independent pricing service, which is intended to reflect fair value when a security’s value or a meaningful portion of each Fund’s portfolio is believed to have been materially affected by a valuation event that has occurred between the close of the exchange or market on which the security is traded and the close of the regular trading day on the NYSE. The Funds’ valuation procedures set forth certain triggers which instruct when to use the fair valuation model.
Forward currency exchange contracts have a market value determined by the prevailing foreign currency exchange daily rates and current foreign currency exchange forward rates. The foreign currency exchange forward rates are calculated using an automated system that estimates rates
| | |
| 40 | | 1.855.377.7325 | www.GrandeurPeakGlobal.com |
| | |
| Grandeur Peak Funds® | | Notes to Financial Statements |
| | April 30, 2013 |
on the basis of the current day foreign currency exchange rates and forward foreign currency exchange rates supplied by a pricing service.
When such prices or quotations are not available, or when the Fair Value Committee appointed by the Board believes that they are unreliable, securities may be priced using fair value procedures approved by the Board.
Fair Value Measurements: The Funds disclose the classification of their fair value measurements following a three-tier hierarchy based on the inputs used to measure fair value. Inputs refer broadly to the assumptions that market participants would use in pricing the asset or liability, including assumptions about risk. Inputs may be observable or unobservable. Observable inputs reflect the assumptions market participants would use in pricing the asset or liability that are developed based on market data obtained from sources independent of the reporting entity. Unobservable inputs reflect the reporting entity’s own assumptions about the assumptions market participants would use in pricing the asset or liability that are developed based on the best information available.
Various inputs are used in determining the value of the Funds’ investments as of the end of the reporting period. When inputs used fall into different levels of the fair value hierarchy, the level in the hierarchy within which the fair value measurement falls is determined based on the lowest level input that is significant to the fair value measurement in its entirety. The designated input levels are not necessarily an indication of the risk or liquidity associated with these investments. These inputs are categorized in the following hierarchy under applicable financial accounting standards:
Level 1 – Unadjusted quoted prices in active markets for identical investments, unrestricted assets or liabilities that the Funds have the ability to access at the measurement date;
Level 2 – Quoted prices which are not active, quoted prices for similar assets or liabilities in active markets or inputs other than quoted prices that are observable (either directly or indirectly) for substantially the full term of the asset or liability; and
Level 3 – Significant unobservable prices or inputs (including the Funds’ own assumptions in determining the fair value of investments) where there is little or no market activity for the asset or liability at the measurement date.
The following is a summary of each Fund’s investments in the fair value hierarchy as of April 30, 2013:
| | | | | | | | | | | | | | | | |
Investments in Securities at Value(a) | | Level 1 - Quoted and Unadjusted Prices | | | Level 2 - Other Significant Observable Inputs | | | Level 3 - Significant Unobservable Inputs | | | Total | |
| | |
Grandeur Peak Global Opportunities | | | | | | | | | | | | | | | | |
Common Stocks | | $ | 319,130,481 | | | $ | – | | | $ | – | | | $ | 319,130,481 | |
Exchange Traded Funds | | | 2,529,718 | | | | – | | | | – | | | | 2,529,718 | |
Rights | | | 65,015 | | | | – | | | | – | | | | 65,015 | |
Short Term Investments | | | 26,716,378 | | | | – | | | | – | | | | 26,716,378 | |
| | |
Total | | $ | 348,441,592 | | | $ | – | | | $ | – | | | $ | 348,441,592 | |
| | |
| | |
| (a) | For detailed descriptions of countries, see the accompanying Portfolio of Investments. |
| | |
| Annual Report | April 30, 2013 | | 41 |
| | |
| Grandeur Peak Funds® | | Notes to Financial Statements |
| | April 30, 2013 |
| | | | | | | | | | | | | | | | |
Investments in Securities at Value(a) | | Level 1 - Quoted and Unadjusted Prices | | | Level 2 - Other Significant Observable Inputs | | | Level 3 - Significant Unobservable Inputs | | | Total | |
| | |
Grandeur Peak International Opportunities | | | | | | | | | | | | | | | | |
Common Stocks | | $ | 299,424,624 | | | $ | – | | | $ | – | | | $ | 299,424,624 | |
Exchange Traded Funds | | | 9,329,015 | | | | – | | | | – | | | | 9,329,015 | |
Rights | | | 87,398 | | | | – | | | | – | | | | 87,398 | |
Short Term Investments | | | 45,753,982 | | | | – | | | | – | | | | 45,753,982 | |
| | |
Total | | $ | 354,595,019 | | | $ | – | | | $ | – | | | $ | 354,595,019 | |
| | |
| | |
| (a) | For detailed descriptions of countries, see the accompanying Portfolio of Investments. |
The Funds recognize transfers between levels as of the end of the period. For the year ended April 30, 2013, the Funds did not have any transfers between Level 1 and Level 2 securities. The following is a reconciliation of assets in which significant unobservable inputs (Level 3) were used in determining fair value:
Grandeur Peak Global Opportunities Fund
| | | | | | | | | | | | | | | | | | | | | | | | |
Investments in Securities at Value | | Balance as of April 30, 2012 | | | Realized gain/(loss) | | | Change in unrealized appreciation/ (depreciation) | | | Sales proceeds | | | Balance as of April 30, 2013 | | | Net change in unrealized appreciation/ (depreciation) included in the statement of operations attributable to level 3 investments still held at April 30. 2013 | |
| | |
Common Stocks | | $ | 190,464 | | | $ | (127,800 | ) | | $ | 52,117 | | | $ | (114,781 | ) | | $ | – | | | $ | – | |
| | |
Total | | $ | 190,464 | | | $ | (127,800 | ) | | $ | 52,117 | | | $ | (114,781 | ) | | $ | – | | | $ | – | |
| | |
| | |
Grandeur Peak International Opportunities Fund
| | | | | | | | | | | | | | | | | | | | | | | | |
Investments in Securities at Value | | Balance as of April 30, 2012 | | | Realized gain/(loss) | | | Change in unrealized appreciation/ (depreciation) | | | Sales proceeds | | | Balance as of April 30, 2013 | | | Net change in unrealized appreciation/ (depreciation) included in the statement of operations attributable to level 3 investments still held at April 30, 2013 | |
| | |
Common Stocks | | $ | 110,632 | | | $ | (78,585 | ) | | $ | 34,624 | | | $ | (66,671 | ) | | $ | – | | | $ | – | |
| | |
Total | | $ | 110,632 | | | $ | (78,585 | ) | | $ | 34,624 | | | $ | (66,671 | ) | | $ | – | | | $ | – | |
| | |
| | |
Investment Transactions and Investment Income: Investment transactions are accounted for on the date the investments are purchased or sold (trade date). Realized gains and losses from investment transactions are reported on an identified cost basis. Interest income, which includes accretion of discounts and amortization of premiums, is accrued and recorded as earned. Dividend income is recognized on the ex-dividend date or for certain foreign securities, as soon as
| | |
| 42 | | 1.855.377.7325 | www.GrandeurPeakGlobal.com |
| | |
| Grandeur Peak Funds® | | Notes to Financial Statements |
| | April 30, 2013 |
information is available to the Funds. All of the realized and unrealized gains and losses and net investment income, are allocated daily to each class in proportion to its average daily net assets.
Foreign Securities: The Funds may directly purchase securities of foreign issuers. Investing in securities of foreign issuers involves special risks not typically associated with investing in securities of U.S. issuers. The risks include possible reevaluation of currencies, the inability to repatriate foreign currency, less complete financial information about companies and possible future adverse political and economic developments. Moreover, securities of many foreign issuers and their markets may be less liquid and their prices more volatile than those of securities of comparable U.S. issuers.
Foreign Currency Translation: The books and records of the Funds are maintained in U.S. dollars. Investment valuations and other assets and liabilities initially expressed in foreign currencies are converted each business day into U.S. dollars based upon current exchange rates. Prevailing foreign exchange rates may generally be obtained at the close of the NYSE (normally, 4:00 p.m. Eastern Time). The portion of realized and unrealized gains or losses on investments due to fluctuations in foreign currency exchange rates is not separately disclosed and is included in realized and unrealized gains or losses on investments, when applicable.
Foreign Currency Spot Contracts: The Funds may enter into foreign currency spot contracts to facilitate transactions in foreign securities or to convert foreign currency receipts into U.S. dollars. A foreign currency spot contract is an agreement between two parties to buy and sell currencies at the current market rate, for settlement generally within two business days. The U.S. dollar value of the contracts is determined using current currency exchange rates supplied by a pricing service. The contract is marked-to-market daily for settlements beyond one day and any change in market value is recorded as an unrealized gain or loss. When the contract is closed, a realized gain or loss is recorded equal to the difference between the value on the open and close date. Losses may arise from changes in the value of the foreign currency, or if the counterparties do not perform under the contract’s terms. The maximum potential loss from such contracts is the aggregate face value in U.S. dollars at the time the contract was opened.
Trust Expenses: Some expenses of the Trust can be directly attributed to the Funds. Expenses which cannot be directly attributed to the Funds are apportioned among all funds in the Trust based on average net assets of each fund.
Fund and Class Expenses: Expenses that are specific to a Fund or class of shares of a Fund are charged directly to that Fund or share class. Expenses that are common to all Funds generally are allocated among the Funds in proportion to their average daily net assets. Fees provided under the distribution (Rule 12b-1) and/or shareholder service plans for a particular class of the Funds are charged to the operations of such class.
Offering Costs: Offering costs, including costs of printing initial prospectuses, legal and registration fees, are being amortized over twelve months from the inception date of the Funds. As of April 30, 2013, all offering costs have been amortized by the Funds.
Federal Income Taxes: The Funds comply with the requirements under Subchapter M of the Internal Revenue Code of 1986, as amended, applicable to regulated investment companies and intend to distribute substantially all of their net taxable income and net capital gains, if any, each year so that it will not be subject to excise tax on undistributed income and gains. The Funds are not subject to income taxes to the extent such distributions are made.
| | |
| Annual Report | April 30, 2013 | | 43 |
| | |
| Grandeur Peak Funds® | | Notes to Financial Statements |
| | April 30, 2013 |
As of and during the year ended April 30, 2013, the Funds did not have a liability for any unrecognized tax benefits. The Funds file U.S. federal, state, and local tax returns as required. The Funds’ tax returns are subject to examination by the relevant tax authorities until expiration of the applicable statute of limitations, which is generally three years after the filing of the tax return for federal purposes and four years for most state returns. Tax returns for open years have incorporated no uncertain tax positions that require a provision for income taxes.
Distributions to Shareholders: Each Fund normally pays dividends and distributes capital gains, if any, on an annual basis. Income dividend distributions are derived from interest and other income each Fund receives from their investments, including short term capital gains. Long term capital gain distributions are derived from gains realized when each Fund sells a security it has owned for more than a year. Each Fund may make additional distributions and dividends at other times if the portfolio manager believes doing so may be necessary for each Fund to avoid or reduce taxes.
3. TAX BASIS INFORMATION
Reclassifications: As of April 30, 2013, permanent differences in book and tax accounting were reclassified. These differences had no effect on net assets and were primarily attributed to differing book/tax treatment of foreign currency, PFICs and certain other investments. The reclassifications were as follows:
| | | | | | | | | | | | |
| Fund | | Paid-in Capital | | | Accumulated Net Investment Income/(Loss) | | | Accumulated Net Realized Gain/(Loss) on Investments | |
| | |
Grandeur Peak Global Opportunities | | $ | (34,146 | ) | | $ | 169,939 | | | $ | 135,793 | |
Grandeur Peak International Opportunities | | | (31,823 | ) | | | (20,177 | ) | | | (52,000 | ) |
Tax Basis of Investments: As of April 30, 2013, the aggregate cost of investments, gross unrealized appreciation/ (depreciation) and net unrealized appreciation for Federal tax purposes was as follows:
| | | | | | | | | | | | | | | | | | | | |
| | | Gross Appreciation (excess of value over tax cost) | | | Gross Depreciation (excess of tax cost over value) | | | Net Appreciation/ (Depreciation) of Foreign Currency | | | Net Unrealized Appreciation | | | Cost of Investments for Income Tax Purposes | |
| | |
Grandeur Peak Global Opportunities | | $ | 60,298,409 | | | $ | (9,929,872 | ) | | $ | 34,336 | | | $ | 50,402,873 | | | $ | 298,073,055 | |
Grandeur Peak International Opportunities | | | 45,791,463 | | | | (7,839,663 | ) | | | (58,932 | ) | | | 37,892,868 | | | | 316,643,219 | |
| | |
| 44 | | 1.855.377.7325 | www.GrandeurPeakGlobal.com |
| | |
| Grandeur Peak Funds® | | Notes to Financial Statements |
| | April 30, 2013 |
Components of Earnings: As of April 30, 2013, components of distributable earnings on a tax basis were as follows:
| | | | | | | | |
| | | Grandeur Peak Global Opportunities | | | Grandeur Peak International Opportunities | |
| | |
Undistributed ordinary income | | $ | 1,939,706 | | | $ | 1,863,586 | |
Accumulated capital gains | | | 1,311,020 | | | | 480,158 | |
Net unrealized appreciation on investments | | | 50,402,873 | | | | 37,892,868 | |
Other cumulative effect of timing differences | | | 1,892 | | | | (13,477 | ) |
| | |
Total distributable earnings | | $ | 53,655,491 | | | $ | 40,223,135 | |
| | |
| | |
Capital Losses: As of April 30, 2013, the Funds have no accumulated capital loss carryforwards.
Tax Basis of Distributions to Shareholders: The character of distributions made during the year from net investment income or net realized gains may differ from its ultimate characterization for federal income tax purposes. Also, due to the timing of dividend distributions, the fiscal year in which amounts are distributed may differ from the fiscal year in which the income or realized gain were recorded by the Funds.
The tax character of distributions paid by the Funds for the fiscal year ended April 30, 2013 were as follows:
| | | | | | | | |
| | | Ordinary Income | | | Long-Term Capital Gain | |
| | |
Grandeur Peak Global Opportunities | | $ | 4,298,437 | | | $ | 11,510 | |
Grandeur Peak International Opportunities | | | 1,378,397 | | | | 76,375 | |
4. SECURITIES TRANSACTIONS
The cost of purchases and proceeds from sales of securities (excluding short term securities) during the year ended April 30, 2013 were as follows:
| | | | | | | | |
| Fund | | Purchases of Securities | | | Proceeds From Sales of Securities | |
| | |
Grandeur Peak Global Opportunities | | $ | 205,224,492 | | | $ | 69,688,297 | |
Grandeur Peak International Opportunities | | | 276,727,257 | | | | 67,342,087 | |
5. SHARES OF BENEFICIAL INTEREST
The capitalization of the Trust consists of an unlimited number of shares of beneficial interest with no par value per share. Holders of the shares of the Funds of the Trust have one vote for each share held and a proportionate fraction of a vote for each fractional share. All shares issued and outstanding are fully paid and are non-assessable, transferable and redeemable at the option of the shareholder. Shares have no pre-emptive rights.
Shares redeemed within 60 days of purchase may incur a 2% short-term redemption fee deducted from the redemption amount. For the year ended April 30, 2013 and the period October 17, 2011 (inception) to April 30, 2012, the redemption fees charged by the Funds are presented in the Statements of Changes in Net Assets.
| | |
| Annual Report | April 30, 2013 | | 45 |
| | |
| Grandeur Peak Funds® | | Notes to Financial Statements |
| | April 30, 2013 |
6. MANAGEMENT AND RELATED-PARTY TRANSACTIONS
Grandeur Peak Global Advisors, LLC (the “Adviser” or “Grandeur Peak Global Advisors”), subject to the authority of the Board, is responsible for the overall management and administration of the Funds’ business affairs. The Adviser manages the investments of the Funds in accordance with the Funds’ investment objective, policies and limitations and investment guidelines established jointly by the Adviser and the Trustees. Pursuant to the Advisory Agreement, (the “Advisory Agreement”), each Fund pays the Adviser an annual management fee of 1.25%, based on each Fund’s average daily net assets. The management fee is paid on a monthly basis.
The Adviser has contractually agreed to limit certain of each Fund’s expenses to 1.75% of the Fund’s average daily net assets in the Investor Class shares and 1.50% of the Fund’s average daily net assets in the Institutional Class shares until August 31, 2013. Pursuant to this agreement, each Fund will reimburse the Adviser for any fee waivers and expense reimbursements made by the Adviser, provided that any such reimbursements made by the Funds to the Adviser will not cause the Funds’ expense limitation to exceed expense limitations in existence at the time the expense was incurred, or at the time of the reimbursement, whichever is lower, and the reimbursement is made within three years after the expenses were incurred.
For the year ended April 30, 2013, the fee waivers and/or reimbursements were as follows:
| | | | | | | | | | | | |
| Fund | | Fees Waived/ Reimbursed By Advisor | | | Recoupment of Previously Waived Fees By Advisor | | | Total | |
| | |
Grandeur Peak Global Opportunities Fund | | | | | | | | | | | | |
| | |
Investor Class | | $ | 8,775 | | | $ | – | | | $ | 8,775 | |
| | |
Institutional Class | | | 11,427 | | | | – | | | | 11,427 | |
| | |
Grandeur Peak Global International Opportunities Fund | | | | | | | | | | | | |
| | |
Investor Class | | $ | 33,942 | | | $ | – | | | $ | 33,942 | |
| | |
Institutional Class | | | 103,002 | | | | – | | | | 103,002 | |
| | |
As of April 30, 2013, the balances of recoupable expenses for each Fund were as follows: | |
| Fund | | Expires 2015 | | | Expires 2016 | | | Total | |
| | |
Grandeur Peak Global Opportunities Fund | | | | | | | | | | | | |
| | |
Investor Class | | $ | 57,387 | | | $ | 8,775 | | | $ | 66,162 | |
| | |
Institutional Class | | | 130,976 | | | | 11,427 | | | | 142,402 | |
| | |
Grandeur Peak Global International Opportunities Fund | | | | | | | | | | | | |
| | |
Investor Class | | $ | 42,227 | | | $ | 33,942 | | | $ | 76,169 | |
| | |
Institutional Class | | | 102,671 | | | | 103,002 | | | | 205,673 | |
| | |
Fund Accounting Fees and Expenses
ALPS Fund Services, Inc. (“ALPS” and the “Administrator”) (an affiliate of ALPS Distributors, Inc.) serves as administrator to the Funds, and each Fund has agreed to pay expenses incurred in connection with its administrative activities. Pursuant to the Administration, Bookkeeping and Pricing Services Agreement (the “Agreement”), ALPS will provide operational services to the Funds
| | |
| 46 | | 1.855.377.7325 | www.GrandeurPeakGlobal.com |
| | |
| Grandeur Peak Funds® | | Notes to Financial Statements |
| | April 30, 2013 |
including, but not limited to fund accounting and fund administration and generally assist in each Fund’s operations.
The Annual Administrative Fee is billed monthly in total and allocated to each Fund in the amount of the greater of (a) the annual minimum for both Funds of $185,000 in year 1 of operations and $205,000 in year 2 and forward or (b) following basis point fee schedule:
| | | | | | | | | | |
| Average Total Net Assets | | Contractual Fee | | |
| |
Between $0-$500M | | | | 0.05 | % | | |
| |
$500M-$1B | | | | 0.03 | % | | | |
| |
Above $1B | | | | 0.02 | % | | |
| |
The Administrator is also reimbursed by the Funds for certain out-of-pocket expenses.
Transfer Agent
ALPS serves as transfer, dividend paying and shareholder servicing agent for the Funds (“Transfer Agent”). ALPS is compensated based upon a $25,000 annual base fee per Fund, and annually $9 per direct open account and $7 per open account through NSCC. The Transfer Agent is also reimbursed by the Funds for certain out-of-pocket expenses.
Compliance Services
ALPS provides services which assist the Trust’s Chief Compliance Officer in monitoring and testing the policies and procedures of the Trust in conjunction with requirements under Rule 38a-1 under the 1940 Act for an annual fee for both Funds of $30,000. ALPS is reimbursed for certain out-of-pocket expenses. The annual fee is billed monthly in total and allocated to each Fund.
Principal Financial Officer
ALPS receives an annual fee for both Funds of $10,000 for providing Principal Financial Officer (“PFO”) services to the Funds. The annual fee is billed monthly in total and allocated to each Fund.
Distributor: ALPS Distributors, Inc. (“ADI” or the “Distributor”) (an affiliate of ALPS) acts as the distributor of the Funds’ shares pursuant to a Distribution Agreement with the Trust. Shares are sold on a continuous basis by ADI as agent for the Funds, and ADI has agreed to use its best efforts to solicit orders for the sale of each Fund’s shares, although it is not obliged to sell any particular amount of shares. ADI is not entitled to any compensation for its services as Distributor. ADI is registered as a broker-dealer with the Securities and Exchange Commission.
Each Fund has adopted a Distribution and Services (12b-1) Plan pursuant to Rule 12b-1 of the 1940 Act (the “Plan”) for its Investor Class shares. The Plan allows the Funds to use Investor Class assets to pay fees in connection with the distribution and marketing of Investor Class shares and/or the provision of shareholder services to Investor Class shareholders. The Plan permits payment for services in connection with the administration of plans or programs that use Investor Class shares of each Fund as their funding medium and for related expenses. The Plan permits the Funds to make total payments at an annual rate of up to 0.25% of each Fund’s average daily net assets attributable to its Investor Class shares. The expenses of the Plan are reflected as distribution and service fees in the Statement of Operations.
7. INDEMNIFICATIONS
Under the Trust’s organizational documents, its officers and Trustees are indemnified against certain liability arising out of the performance of their duties to the Trust. Additionally, in the
| | |
| Annual Report | April 30, 2013 | | 47 |
| | |
| Grandeur Peak Funds® | | Notes to Financial Statements |
| | April 30, 2013 |
normal course of business, the Trust enters into contracts with service providers that may contain general indemnification clauses, which may permit indemnification to the extent permissible under applicable law. The Trust’s maximum exposure under these arrangements is unknown, as this would involve future claims that may be made against the Trust that have not yet occurred.
8. SUBSEQUENT EVENTS
Effective as of the close of business on May 1, 2013, the Funds closed to new investors, except as described below. This change affects new investors seeking to purchase shares of a Fund either directly or through third party intermediaries. Existing shareholders of the Funds may continue to purchase additional shares of that Fund.
| | • | | A financial advisor whose clients have established accounts in a Fund as of May 1, 2013 may continue to open new accounts in that Fund for any of its existing or new clients. |
| | • | | Existing or new participants in a qualified retirement plan, such as a 401(k) plan, profit sharing plan, 403(b) plan or 457 plan, which has an existing position in a Fund as of May 1, 2013, may continue to open new accounts in that Fund. In addition, if such qualified retirement plans have a related retirement plan formed in the future, this plan may also open new accounts in the Fund. |
As described in the Prospectus, the Adviser retains the right to make exceptions to any action taken to close a Fund or limit inflows into a Fund.
| | |
| 48 | | 1.855.377.7325 | www.GrandeurPeakGlobal.com |
| | |
| Grandeur Peak Funds® | | Report of Independent Registered Public Accounting Firm |
To the Shareholders and Board of Trustees of Financial Investors Trust:
We have audited the accompanying statements of assets and liabilities, including the portfolios of investments, of Grandeur Peak Global Opportunities Fund and Grandeur Peak International Opportunities Fund (the “Funds”), two of the funds constituting Financial Investors Trust, as of April 30, 2013, the related statements of operations for the year then ended, and the statements of changes in net assets and the financial highlights for the year then ended and for the period from October 17, 2011 (inception) to April 30, 2012. These financial statements and financial highlights are the responsibility of the Funds’ management. Our responsibility is to express an opinion on these financial statements and financial highlights based on our audits.
We conducted our audits in accordance with the standards of the Public Company Accounting Oversight Board (United States). Those standards require that we plan and perform the audit to obtain reasonable assurance about whether the financial statements and financial highlights are free of material misstatement. The Funds are not required to have, nor were we engaged to perform, an audit of their internal control over financial reporting. Our audits included consideration of internal control over financial reporting as a basis for designing audit procedures that are appropriate in the circumstances, but not for the purpose of expressing an opinion on the effectiveness of the Funds’ internal control over financial reporting. Accordingly, we express no such opinion. An audit also includes examining, on a test basis, evidence supporting the amounts and disclosures in the financial statements, assessing the accounting principles used and significant estimates made by management, as well as evaluating the overall financial statement presentation. Our procedures included confirmation of securities owned as of April 30, 2013, by correspondence with the custodian and brokers; where replies were not received from brokers, we performed other auditing procedures. We believe that our audits provide a reasonable basis for our opinion.
In our opinion, the financial statements and financial highlights referred to above present fairly, in all material respects, the financial position of Grandeur Peak Global Opportunities Fund and Grandeur Peak International Opportunities Fund of Financial Investors Trust as of April 30, 2013, the results of their operations for the year then ended, and the changes in their net assets and the financial highlights for the year then ended and for the period from October 17, 2011 (inception) to April 30, 2012, in conformity with accounting principles generally accepted in the United States of America.
DELOITTE & TOUCHE LLP
Denver, Colorado
June 27, 2013
| | |
| Annual Report | April 30, 2013 | | 49 |
| | |
| Grandeur Peak Funds® | | Additional Information |
| | April 30, 2013 (Unaudited) |
1. FUND HOLDINGS
The Funds file their complete schedule of portfolio holdings with the Securities and Exchange Commission (the “SEC”) for the first and third quarters of each fiscal year on Form N-Q within 60 days after the end of the period. Copies of the Funds’ Form N-Q are available without charge on the SEC website at http://www.sec.gov. You may also review and copy the Form N-Q at the SEC’s Public Reference Room in Washington, DC. For more information about the operation of the Public Reference Room, please call the SEC at 1-800-SEC-0330.
2. FUND PROXY VOTING POLICIES, PROCEDURES AND SUMMARIES
The Funds’ policies and procedures used in determining how to vote proxies and information regarding how the Funds voted proxies relating to portfolio securities during the most recent prior 12-month period ending June 30 are available without charge, (1) upon request, by calling (toll-free) 855-377-PEAK(7325) and (2) on the SEC’s website at http://www.sec.gov.
3. TAX DESIGNATIONS
The Funds designate the following for federal income tax purposes for distributions made during the calendar year ended December 31, 2012:
| | | | |
| | | Global Opportunities Fund | | International Opportunities Fund |
| |
Dividend Received Deduction | | 14.53% | | 0.40% |
Qualified Dividend Income | | 48.25% | | 65.70% |
In early 2013, if applicable, shareholders of record received this information for the distributions paid to them by the Funds during the calendar year 2012 via Form 1099. The Funds will notify shareholders in early 2014 of amounts paid to them by the Funds, if any, during the calendar year 2013.
The Grandeur Peak Global Opportunities Fund and the Grandeur Peak International Opportunities Fund designates $11,510 and $76,375, respectively, as long-term capital gain distribution.
��
| | |
| 50 | | 1.855.377.7325 | www.GrandeurPeakGlobal.com |
| | |
| Grandeur Peak Funds® | | Trustees and Officers |
| | April 30, 2013 (Unaudited) |
INDEPENDENT TRUSTEES
| | | | | | | | | | |
Name, Address* & Age | | Position(s) Held with Fund | | Term of Office and Length of Time Served** | | Principal Occupation(s) During Past 5 Years*** | | Number of Funds in Fund Complex Overseen by Trustee**** | | Other Directorships Held by Trustee During Past 5 Years |
Mary K. Anstine, age 72 | | Trustee | | Ms. Anstine was elected at a special meeting of shareholders held on March 21, 1997 and re-elected at a special meeting of shareholders held on August 7, 2009. | | Ms. Anstine was President/Chief Executive Officer of HealthONE Alliance, Denver, Colorado, and former Executive Vice President of First Interstate Bank of Denver. Ms. Anstine is also Trustee/Director of AV Hunter Trust and Colorado Uplift Board. Ms. Anstine was formerly a Director of the Trust Bank of Colorado (later purchased and now known as Northern Trust Bank), HealthONE and Denver Area Council of the Boy Scouts of America, and a member of the American Bankers Association Trust Executive Committee. | | 26 | | Ms. Anstine is a Trustee of ALPS ETF Trust (13 funds); ALPS Variable Investment Trust (7 funds); Reaves Utility Income Fund (1 fund); and Westcore Trust (12 funds). |
| * | All communications to Trustees and Officers may be directed to Financial Investors Trust c/o 1290 Broadway, Suite 1100, Denver, CO 80203. |
| ** | This is the period for which the Trustee/Officer began serving the Trust. Each Trustee/Officer serves an indefinite term, until his successor is elected |
| *** | Except as otherwise indicated, each individual has held the office shown or other offices in the same company for the last five years. |
| **** | The Fund Complex includes all series of the Trust (currently 26) and any other investment companies for which Grandeur Peak Global Advisors, LLC provides investment advisory services (currently none). |
| | |
| Annual Report | April 30, 2013 | | 51 |
| | |
| Grandeur Peak Funds® | | Trustees and Officers |
| | April 30, 2013 (Unaudited) |
INDEPENDENT TRUSTEES
| | | | | | | | | | |
Name, Address* & Age | | Position(s) Held with Fund | | Term of Office and Length of Time Served** | | Principal Occupation(s) During Past 5 Years*** | | Number of Funds in Fund Complex Overseen by Trustee**** | | Other Directorships Held by Trustee During Past 5 Years |
John R. Moran, Jr., age 82 | | Trustee | | Mr. Moran was elected at a special meeting of shareholders held on March 21, 1997 and re-elected at a special meeting of shareholders held on August 7, 2009. | | Mr. Moran is formerly President and CEO of The Colorado Trust, a private foundation serving the health and hospital community in the state of Colorado. An attorney, Mr. Moran was formerly a partner with the firm of Kutak Rock & Campbell in Denver, Colorado and a member of the Colorado House of Representatives. Currently, Mr. Moran is a member of the Treasurer’s Investment Advisory Committee for the University of Colorado. | | 26 | | None. |
| | |
| 52 | | 1.855.377.7325 | www.GrandeurPeakGlobal.com |
| | |
| Grandeur Peak Funds® | | Trustees and Officers |
| | April 30, 2013 (Unaudited) |
INDEPENDENT TRUSTEES
| | | | | | | | | | |
Name, Address* & Age | | Position(s)
Held with
Fund | | Term of Office and Length of Time Served** | | Principal Occupation(s) During Past 5 Years*** | | Number of
Funds in
Fund
Complex
Overseen
by
Trustee**** | | Other Directorships Held by Trustee During Past 5 Years |
Jeremy W. Deems, age 36 | | Trustee | | Mr. Deems was appointed as a Trustee at the March 11, 2008 meeting of the Board of Trustees and elected at a special meeting of shareholders held on August 7, 2009. | | Mr. Deems is the Co-Founder, Chief Operations Officer and Chief Financial Officer of Green Alpha Advisors, LLC. Prior to joining Green Alpha Advisors, Mr. Deems was CFO and Treasurer of Forward Management, LLC, an investment management company, ReFlow Management Co., LLC, a liquidity resourcing company, ReFlow Fund, LLC, a private investment fund, and Sutton Place Management, LLC, an administrative services company (from 2004 to June 2007). Prior to this, Mr. Deems served as Controller of Forward Management, LLC, ReFlow Management Co., LLC, ReFlow Fund, LLC and Sutton Place Management, LLC. | | 26 | | Mr. Deems is a Trustee of ALPS ETF Trust (13 funds); ALPS Variable Investment Trust (7 funds) and Reaves Utility Income Fund (1 fund). |
| * | All communications to Trustees and Officers may be directed to Financial Investors Trust c/o 1290 Broadway, Suite 1100, Denver, CO 80203. |
| ** | Except as otherwise indicated, each individual has held the office shown or other offices in the same company for the last five years. |
| *** | The Fund Complex includes all series of the Trust and any other investment companies for which Grandeur Peak provides investment advisory services. |
| **** | The Fund Complex includes all series of the Trust (currently 26) and any other investment companies for which Grandeur Peak Global Advisors, LLC provides investment advisory services (currently none). |
| | |
| Annual Report | April 30, 2013 | | 53 |
| | |
| Grandeur Peak Funds® | | Trustees and Officers |
| | April 30, 2013 (Unaudited) |
INDEPENDENT TRUSTEES
| | | | | | | | | | |
Name, Address* & Age | | Position(s)
Held with
Fund | | Term of Office and Length of Time Served** | | Principal Occupation(s) During Past 5 Years*** | | Number of
Funds in
Fund
Complex
Overseen
by
Trustee**** | | Other Directorships Held by Trustee During Past 5 Years |
Jerry G. Rutledge, age 68 | | Trustee | | Mr. Rutledge was elected at a special meeting of shareholders held on August 7, 2009. | | Mr. Rutledge is the President and owner of Rutledge’s Inc., a retail clothing business. Mr. Rutledge is currently Director of the American National Bank. He was from 1994 to 2007 a Regent of the University of Colorado. | | 26 | | Mr. Rutledge is a Trustee of Clough Global Allocation Fund (1 fund), Clough Global Equity Fund (1 fund) and Clough Global Opportunities Fund (1 fund). |
| | |
| 54 | | 1.855.377.7325 | www.GrandeurPeakGlobal.com |
| | |
| Grandeur Peak Funds® | | Trustees and Officers |
| | April 30, 2013 (Unaudited) |
INDEPENDENT TRUSTEES
| | | | | | | | | | |
Name, Address* & Age | | Position(s)
Held with
Fund | | Term of Office and Length of Time Served** | | Principal Occupation(s) During Past 5 Years*** | | Number of
Funds in
Fund
Complex
Overseen
by
Trustee**** | | Other Directorships Held by Trustee During Past 5 Years |
Michael “Ross” Shell, age 42 | | Trustee | | Mr. Shell was elected at a special meeting of shareholders held on August 7, 2009. | | Mr. Shell is Founder and CEO* of Red Idea, LLC, a strategic consulting/early stage venture firm (since June 2008). From 1999 to 2009, he was a part-owner and Director of Tesser, Inc., a brand agency. From December 2005 to May 2008, he was Director, Marketing and Investor Relations, of Woodbourne, a REIT/real estate hedge fund and private equity firm. Prior to this, from May 2004 to November 2005, he worked as a business strategy consultant; from June 2003 to April 2004, he was on the Global Client Services team of IDEO, a product design/innovation firm; and from 1999 to 2003, he was President of Tesser, Inc. Mr. Shell graduated with honors from Stanford University with a degree in Political Science. | | 26 | | None. |
| * | All communications to Trustees and Officers may be directed to Financial Investors Trust c/o 1290 Broadway, Suite 1100, Denver, CO 80203. |
| ** | This is the period for which the Trustee/Officer began serving the Trust. Each Trustee/Officer serves an indefinite term, until his successor is elected |
| *** | Except as otherwise indicated, each individual has held the office shown or other offices in the same company for the last five years. |
| **** | The Fund Complex includes all series of the Trust (currently 26) and any other investment companies for which Grandeur Peak Global Advisors, LLC provides investment advisory services (currently none). |
| | |
| Annual Report | April 30, 2013 | | 55 |
| | |
| Grandeur Peak Funds® | | Trustees and Officers |
| | April 30, 2013 (Unaudited) |
INTERESTED TRUSTEE
| | | | | | | | | | |
Name, Address* & Age | | Position(s)
Held with
Fund | | Term of Office and Length of Time Served** | | Principal Occupation(s) During Past 5 Years*** | | Number of
Funds in
Fund
Complex
Overseen
by
Trustee**** | | Other Directorships Held by Trustee During Past 5 Years |
Edmund J. Burke, age 52 | | Trustee,
Chairman
and
President | | Mr. Burke was elected as Chairman at the August 28, 2009 meeting of the Board of Trustees. Mr. Burke was elected as Trustee at a special meeting of shareholders held on August 7, 2009. Mr. Burke was elected President of the Trust at the December 17, 2002 meeting of the Board of Trustees. | | Mr. Burke is President and a Director of ALPS Holdings, Inc. (“AHI”) (since 2005) and Director of ALPS Advisors, Inc. (“AAI”), ALPS Distributors, Inc. (“ADI”), ALPS Fund Services, Inc. (“AFS”) and ALPS Portfolio Solutions Distributor, Inc. (“APSD”) and from 2001-2008, was President of AAI, ADI, AFS and APSD. Because of his positions with AHI, AAI, ADI, AFS and APSD, Mr. Burke is deemed an affiliate of the Trust as defined under the 1940 Act. Mr. Burke is Trustee and President of the Clough Global Allocation Fund (Trustee since 2006; President since 2004); Trustee and President of the Clough Global Equity Fund (Trustee since 2006; President since 2005); Trustee and President of the Clough Global Opportunities Fund (since 2006); Trustee of the Liberty All-Star Equity Fund; and Director of the Liberty All-Star Growth Fund, Inc. | | 26 | | Mr. Burke is a Trustee of Clough Global Allocation Fund (1 fund); Clough Global Equity Fund (1 fund); Clough Global Opportunities Fund (1 fund); Trustee of the Liberty All-Star Equity Fund (1 fund); and Director of the Liberty All-Star Growth Fund, Inc. (1 fund). |
| * | All communications to Trustees and Officers may be directed to Financial Investors Trust c/o 1290 Broadway, Suite 1100, Denver, CO 80203. |
| ** | This is the period for which the Trustee/Officer began serving the Trust. Each Trustee/Officer serves an indefinite term, until his successor is elected |
| *** | Except as otherwise indicated, each individual has held the office shown or other offices in the same company for the last five years. |
| **** | The Fund Complex includes all series of the Trust (currently 26) and any other investment companies for which Grandeur Peak Global Advisors, LLC provides investment advisory services (currently none). |
| | |
| 56 | | 1.855.377.7325 | www.GrandeurPeakGlobal.com |
| | |
| Grandeur Peak Funds® | | Trustees and Officers |
| | April 30, 2013 (Unaudited) |
OFFICERS
| | | | | | |
Name, Address* & Age | | Position(s) Held with Fund | | Term of Office and Length of Time Served** | | Principal Occupation(s) During Past 5 Years*** |
Kimberly R. Storms, age 41 | | Treasurer | | Ms. Storms was elected Treasurer of the Trust at the March 12, 2013 meeting of the Board of Trustees. | | Ms. Storms is Senior Vice President - Director of Fund Administration of ALPS. Ms. Storms joined ALPS in 1998 as Assistant Controller. Because of her position with ALPS, Ms. Storms is deemed an affiliate of the Trust as defined under the 1940 Act. Ms. Storms is also Treasurer of BPV Family of Funds and ALPS Series Trust; Assistant Treasurer of Liberty All-Star Equity Fund and Liberty All-Star Growth Fund, Inc.; Assistant Treasurer of Tilson Funds; and Chief Financial Officer of The Arbitrage Funds. |
David T. Buhler, age 41 | | Secretary | | Mr. Buhler was elected Secretary of the Trust at the September 11, 2012 meeting of the Board of Trustees. | | Mr. Buhler joined ALPS in June 2010, and is currently Vice President and Associate Counsel of ALPS, AAI, ADI and APSD. Prior to joining ALPS, Mr. Buhler served as Associate General Counsel and Assistant Secretary of Founders Asset Management LLC from 2006 to 2009. Because of his position with ALPS, Mr. Buhler is deemed an affiliate of the Trust as defined under the 1940 Act. Mr. Buhler is also the Secretary of ALPS Variable Investment Trust and Westcore Trust. |
| * | All communications to Trustees and Officers may be directed to Financial Investors Trust c/o 1290 Broadway, Suite 1100, Denver, CO 80203. |
| ** | This is the period for which the Trustee/Officer began serving the Trust. Each Trustee/Officer serves an indefinite term, until his successor is elected |
| *** | Except as otherwise indicated, each individual has held the office shown or other offices in the same company for the last five years. |
| | |
| Annual Report | April 30, 2013 | | 57 |
| | |
| Grandeur Peak Funds® | | Trustees and Officers |
| | April 30, 2013 (Unaudited) |
OFFICERS
| | | | | | |
Name, Address* & Age | | Position(s)
Held with Fund | | Term of Office and Length of Time Served** | | Principal Occupation(s) During Past 5 Years*** |
Ted Uhl, age 37 | | Chief Compliance Officer (“CCO”) | | Mr. Uhl was appointed CCO of the Trust at the June 8, 2010 meeting of the Board of Trustees. | | Mr. Uhl joined ALPS in October 2006, and is currently Deputy Compliance Officer of ALPS. Prior to his current role, Mr. Uhl served as Senior Risk Manager for ALPS from October 2006 until June 2010. Before joining ALPS, Mr. Uhl served a Sr. Analyst with Enenbach and Associates (RIA), and a Sr. Financial Analyst at Sprint. Because of his position with ALPS, Mr. Uhl is deemed an affiliate of the Trust as defined under the 1940 Act. Mr. Uhl is also CCO of the Clough Global Funds, Reaves Utility Income Fund, Drexel Hamilton Funds and Transparent Value Trust. |
| * | All communications to Trustees and Officers may be directed to Financial Investors Trust c/o 1290 Broadway, Suite 1100, Denver, CO 80203. |
| ** | This is the period for which the Trustee/Officer began serving the Trust. Each Trustee/Officer serves an indefinite term, until his successor is elected |
| *** | Except as otherwise indicated, each individual has held the office shown or other offices in the same company for the last five years. |
| | |
| 58 | | 1.855.377.7325 | www.GrandeurPeakGlobal.com |
Page Intentionally Left Blank
Page Intentionally Left Blank


TABLE OF CONTENTS
| | |
| Pathway Advisors Funds | | Shareholder Letter |
| | April 30, 2013 (Unaudited) |
May 1, 2013
Dear Shareholder:
Since we launched our funds in July of last year, we’ve been diligently working to promote the funds and expand awareness of our presence in the marketplace. The table below summarizes the total return since inception through the first quarter of 2013.
| | | | | | | | | | |
| | | Inception* Through 3/31/13 | | |
Pathway Advisors Conservative | | | | 5.07 | % | | |
Pathway Advisors Growth & Income | | | | 8.14 | % | | |
Pathway Advisors Aggressive Growth | | | | 12.81 | % | | |
*Since inception. The Funds’ inception date is July 30, 2012.
The performance data quoted represents past performance. Past performance does not guarantee future results. The investment return and principal value of an investment will fluctuate so that an Investor’s shares, when redeemed, may not be worth more or less than their original cost and current performance may be lower or higher than the performance quoted. To obtain the most recent month-end performance data, please call 1-888-288-1121 or visit www.pathwayadvisorsfunds.com.
Hanson McClain Strategic Advisors, Inc. (the “Adviser”) has agreed contractually to limit the amount of each Fund’s total annual expenses, exclusive of Acquired Fund Fees and Expenses, brokerage expenses, interest expenses, taxes and extraordinary expenses, to 1.98% of the Funds’ average daily net assets. This agreement is in effect through August 31, 2014. The Adviser will be permitted to recover expenses it has borne through the agreement described above to the extent that the Funds’ expenses in later periods fall below the annual rates set forth in the relevant agreement. The Funds will not be obligated to pay any such deferred fees and expenses more than three years after the end of the fiscal year in which the fees and expense were deferred. The Adviser may not discontinue this waiver without the approval by the Funds’ Board of Trustees.
A very strong first quarter of 2013 helped propel the funds overall returns since inception as noted above. As these funds are asset allocation funds that typically have 10% or more exposure to fixed income, we lagged behind broad equity indices as expected in periods of relatively low equity volatility, particularly from the beginning of the year until present. Conversely, our funds all exhibited less volatility as measured by beta (a measure of systematic risk with respect to a benchmark) and standard deviation (a statistical measurement of dispersion about an average which, for a mutual fund, depicts how widely the returns varied over a certain period of time). Despite the very strong run up in equity markets and multi-year records being set and all-time highs possible in the not too far distant future, we are somewhat cautious on both the degree to which equities have performed and the speed in which they’ve done so. While many prognosticators profess that the run up in equity prices is entirely justified by strong current earnings, high profit margins, healthy balance sheets, fair or slightly below normal valuations, and an ever accommodating Federal Reserve (Fed) – still purchasing $85 billion a month in mortgage-backed and other Treasury securities as of 3/31/13 – we have been focusing on fund managers and asset classes that we feel still are adding “quality” investments and diversification benefits to shareholders. On the fixed income side, we are also cautious in terms of valuations of both high duration government bonds as well as below investment grade credit (corporate or government debt that is rated at BBB or above by Moody’s or Standard & Poor’s rating agencies) as spreads (the difference between the yield on corporate/government debt
| | |
| | |
| Annual Report | April 30, 2013 | | 1 |
| | |
Pathway Advisors Funds | | Shareholder Letter |
| | April 30, 2013 (Unaudited) |
securities of the same average maturity) to Treasuries have tightened to multi-year lows and fund flows have increased by yield seeking investors. While we do not believe that either rates will increase dramatically in the next several months nor will default rates start picking up, we are more cognizant of both interest rate risk as well as spread risk, as both of these can adversely impact portfolio returns. For this reason, we continue to prefer mostly active managers in the fixed income space that can shorten duration (a time measure of a bond’s interest rate sensitivity, based on the weighted average of the time periods over which a bond’s cash flows accrue to the bondholder) or credit exposure or that can capitalize on alpha (a measure of the difference between a portfolio’s actual returns and its expected performance) generating opportunities overseas, rather than taking a more passive approach to domestic only fixed income.
Though the headwinds, or the amount of attention paid to the headwinds, has clearly decreased, we believe a high debt/gross domestic product (GDP) ratio and a Federal Reserve that is expanding its balance sheet to no seeming end may not provide a net benefit to the markets or the economic future in the long-run. There is also concern that earnings growth may be slowing and profit margins may start contracting. It is entirely possible that we have robbed returns and growth from the future, both at the micro level and the macro level. If this is the case, which we are of the opinion that it is, both fiscal and monetary policymakers will need to carefully balance an unwinding of massive balance sheets while keeping rates and inflation in check and all the while encouraging growth.
Notwithstanding our concerns domestically, the rest of the world also has its fair share of challenges – debt and growth crisis in Europe, reflation reattempt by Japan, and potentially slower growth in the Emerging Markets. There is also always the uncertainty of natural disasters, pandemics, or geopolitical stand-offs that could add to volatility and trepidation among investors. Perhaps of greatest concern, though, is that of unintended consequences of having too much accommodation by the Fed and having rates near zero for too long. Investors who are normally risk averse but need income are now taking more risk, either in credit products or via equity income. Will these same investors continue to hold risky assets through a market shock or will they revert back to being risk averse and contribute to panic selling? Will high frequency or algorithmic trading amplify volatility at precisely the wrong time and make matters even worse à la flash crash? We don’t know the answer to either of these questions, but we do feel that the void of bad news or uncertainty likely has put a premium on equities currently.
The equity markets have relentlessly pushed forward, climbing the “wall of worry” and bond yields have remained stubbornly low, courteous of the Federal Reserve’s (Fed) quantitative easing program whereby the Fed purchases debt securities as a means to induce economic activity via lower than normal interest rates. Perhaps emotions of fear are being replaced by emotions of greed, but, like the aforementioned prognosticators, we must acknowledge that there are some tailwinds or catalysts that, depending on how they play out, could be a boon for the economy. Increased energy production in natural gas and crude oil could create many jobs and, in the coming years, make us energy independent. Lower unemployment and higher business confidence could see much of the cash on corporate and individual balance sheets get reinvested. Systematic spending cuts from the government, though certainly not optimal, could have less of a drag on growth than anticipated and could help pave the way to further improve the federal balance sheet through more meaningful and better coordinated reductions to the debt level. The global economy could benefit from lower geopolitical risks and the emergence of the middle class consumer in developing markets. Technological improvement and networking gains could unlock more productivity, convenience, and wealth creation.
| | |
| | |
| 2 | | www.pathwayadvisorsfunds.com |
| | |
Pathway Advisors Funds | | Shareholder Letter |
| | April 30, 2013 (Unaudited) |
On balance, we continue to focus on diversification benefits of different asset types. Regardless of whether we get more headwinds or tailwinds, our portfolios are designed to move in the direction of the equity markets to varying degrees. We will tactically adjust our overlay to our strategic mix as we deem necessary to overweight attractive areas and underweight areas we believe to exhibit greater risks. We appreciate the confidence that you have placed in our management, and we take seriously our fiduciary responsibility to deliver competitive performance that can help you reach your investment objectives and financial goals.
Sincerely,
David Schauer
Chief Investment Officer
The views and information discussed in this commentary are as of the date of publication, are subject to change, and may not reflect the writer’s current views. The views expressed represent an assessment of market conditions at a specific point in time, are opinions only and should not be relied upon as investment advice regarding a particular investment or markets in general. Such information does not constitute a recommendation to buy or sell specific securities or investment vehicles. It should not be assumed that any investment will be profitable or will equal the performance of the Funds or any securities or any sectors mentioned herein. The subject matter contained herein has been derived from several sources believed to be reliable and accurate at the time of compilation. The Funds do not accept any liability for losses either direct or consequential caused by the use of this information.
The Pathway Aggressive Growth Fund invests in underlying funds that use investment techniques and financial instruments that may be considered aggressive, including the use of futures contracts, options on futures contracts, securities and indices, forward contracts, swap agreements and similar instruments, exposes an underlying fund to potentially dramatic changes (losses) in the value of certain of its portfolio holdings.
The Pathway Growth and Income Fund’s share price can move down in response to stock market conditions, changes in the economy or changes in a particular underlying fund’s share price. An underlying fund may decline in value even when the values of stocks or bonds in general are rising. An underlying fund’s investments in fixed-income securities may decline in value because of changes in interest rates. As nominal interest rates rise, the value of fixed income securities held by an underlying fund (and indirectly, by the Fund) are likely to decrease.
The Pathway Conservative Fund invests in underlying funds that invest long or short in fixed-income securities subjects the Fund to additional risks that include credit risk, interest risk, maturity risk, investment-grade securities risk, municipal securities risk and prepayment risk. These risks could affect the value of a particular investment by the Fund, possibly causing the Fund’s share price and total return to be reduced and fluctuate more than other types of investments.
The performance data quoted represents past performance. Past performance does not guarantee future results. The investment return and principal value of an investment will fluctuate so that an Investor’s shares, when redeemed, may not be worth more or less than their original cost and current performance may be lower or higher than the performance quoted. Diversification does not eliminate the risk of experiencing investment losses.
The Pathway Advisors Funds are distributed by ALPS Distributors, Inc.
| | |
| | |
| Annual Report | April 30, 2013 | | 3 |
| | |
| Pathway Advisors Conservative Fund | | Performance Update |
| | April 30, 2013 (Unaudited) |
Cumulative Total Return for the period ended April 30, 2013
| | | | | | |
| | | One Month | | Latest Quarter | | Since Inception* |
Pathway Advisors Conservative Fund | | 1.45% | | 2.64% | | 6.59% |
S&P 500 Total Return Index1 | | 1.93% | | 7.18% | | 17.30% |
Barclays Capital U.S. Aggregate Bond Index2 | | 1.01% | | 1.60% | | 1.38% |
Russell 2000® Index3 | | -0.37% | | 5.38% | | 21.02% |
* Fund inception date of July 30, 2012.
Indexes are not actively managed and do not reflect any deduction for fees or expenses. You cannot invest directly in an index.
The returns shown above do not reflect the deduction of taxes a shareholder would pay on Fund distributions or redemption of Fund shares.
The Fund is new and has a limited operating history.
Performance data quoted represents past performance. Past performance does not guarantee future results. Investment return and principal value of an investment will fluctuate so that an investor’s shares, when sold or redeemed, may be worth more or less than the original cost. Current performance data may be higher or lower than actual data quoted. For the most current month-end performance data, please call 1-888-288-1121 or visit www.pathwayadvisorsfunds.com.
| 1 | The S&P 500® Total Return Index is an unmanaged index of 500 common stocks chosen for the market size, liquidity and industry group representation. It is a market-value weighted index. The index is not actively managed and does not reflect any deduction for fees, expenses or taxes. An investor cannot invest directly into the index. |
| 2 | The Barclays Capital Aggregate Bond Index is a market capitalization-weighted index, meaning the securities in the index are weighted according to the market size of each bond type. Most U.S. traded investment grade bonds are represented. Municipal bonds, and Treasury Inflation-Protected Securities are excluded, due to tax treatment issues. The index includes Treasury securities, Government agency bonds, Mortgage-backed bonds, Corporate bonds, and a small amount of foreign bonds traded in U.S. The index is not actively managed and does not reflect any deduction for fees, expenses or taxes. An investor cannot invest directly into the index. |
| 3 | The Russell 2000® Index measures the performance of the small-cap segment of the U.S. equity universe. The Russell 2000® Index is a subset of the Russell 3000® Index representing approximately 10% of the total market capitalization of that index. It includes approximately 2000 of the smallest securities based on a combination of their market cap and current index membership. The index is not actively managed and does not reflect any deduction for fees, expenses or taxes. An investor cannot invest directly into the index. |
| | |
| | |
| 4 | | www.pathwayadvisorsfunds.com |
| | |
Pathway Advisors Conservative Fund | | Performance Update |
| | April 30, 2013 (Unaudited) |
Growth of $10,000 for the period ended April 30, 2013
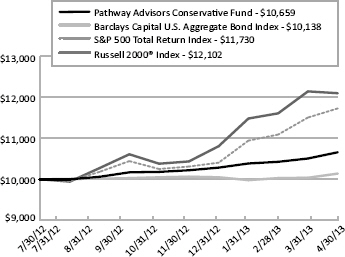
The graphs shown above represent a hypothetical investment of $10,000 in the Fund’s Investor Class shares for the period from inception to 4/30/13. All returns reflect reinvested dividends, but do not reflect the deduction of taxes that an investor would pay on distributions or redemptions.
| | |
| | |
| Annual Report | April 30, 2013 | | 5 |
| | |
| Pathway Advisors Conservative Fund | | Performance Update |
| | April 30, 2013 (Unaudited) |
| | | | | |
| Top Ten Long Holdings | | (as a % of Net Assets)* |
DoubleLine Total Return Bond Fund - Class I | | | | 14.32 | % |
PIMCO Total Return Fund - Institutional Class | | | | 10.38 | % |
Vanguard® Wellesley Income Fund - Class Admiral | | | | 9.67 | % |
Metropolitan West Total Return Bond Fund - Class I | | | | 8.79 | % |
Vanguard® Wellington Fund - Class Admiral | | | | 7.31 | % |
Vanguard® Total Stock Market ETF | | | | 5.72 | % |
Loomis Sayles Bond Fund - Institutional Class | | | | 4.84 | % |
PIMCO Real Return Fund - Institutional Class | | | | 4.80 | % |
Templeton Global Bond Fund - Class A | | | | 4.80 | % |
iShares® Dow Jones International Select Dividend Index Fund | | | | 2.51 | % |
Top Ten Holdings | | | | 73.14 | % |
Portfolio Allocation (as a % of Net Assets)*
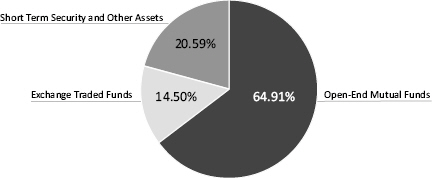
* Holdings are subject to change. Table and chart presents indicative values only.
| | |
| 6 | | www.pathwayadvisorsfunds.com |
| | |
| Pathway Advisors Growth and Income Fund | | Performance Update |
| | April 30, 2013 (Unaudited) |
Cumulative Total Return for the period ended April 30, 2013
| | | | | | |
| | | One Month | | Latest Quarter | | Since Inception* |
Pathway Advisors Growth and Income Fund - NAV | | 1.40% | | 3.14% | | 9.65% |
S&P 500 Total Return Index1 | | 1.93% | | 7.18% | | 17.30% |
Barclays Capital U.S. Aggregate Bond Index2 | | 1.01% | | 1.60% | | 1.38% |
Russell 2000® Index3 | | -0.37% | | 5.38% | | 21.02% |
* Fund inception date of July 30, 2012.
Indexes are not actively managed and do not reflect any deduction for fees or expenses. You cannot invest directly in an index.
The returns shown above do not reflect the deduction of taxes a shareholder would pay on Fund distributions or redemption of Fund shares.
The Fund is new and has a limited operating history.
Performance data quoted represents past performance. Past performance does not guarantee future results. Investment return and principal value of an investment will fluctuate so that an investor’s shares, when sold or redeemed, may be worth more or less than the original cost. Current performance data may be higher or lower than actual data quoted. For the most current month-end performance data, please call 1-888-288-1121 or visit www.pathwayadvisorsfunds.com.
| 1 | The S&P 500® Total Return Index is an unmanaged index of 500 common stocks chosen for the market size, liquidity and industry group representation. It is a market-value weighted index. The index is not actively managed and does not reflect any deduction for fees, expenses or taxes. An investor cannot invest directly into the index. |
| 2 | The Barclays Capital Aggregate Bond Index is a market capitalization-weighted index, meaning the securities in the index are weighted according to the market size of each bond type. Most U.S. traded investment grade bonds are represented. Municipal bonds, and Treasury Inflation-Protected Securities are excluded, due to tax treatment issues. The index includes Treasury securities, Government agency bonds, Mortgage-backed bonds, Corporate bonds, and a small amount of foreign bonds traded in U.S. The index is not actively managed and does not reflect any deduction for fees, expenses or taxes. An investor cannot invest directly into the index. |
| 3 | The Russell 2000® Index measures the performance of the small-cap segment of the U.S. equity universe. The Russell 2000® Index is a subset of the Russell 3000® Index representing approximately 10% of the total market capitalization of that index. It includes approximately 2000 of the smallest securities based on a combination of their market cap and current index membership. The index is not actively managed and does not reflect any deduction for fees, expenses or taxes. An investor cannot invest directly into the index. |
| | |
| Annual Report | April 30, 2013 | | 7 |
| | |
| Pathway Advisors Growth and Income Fund | | Performance Update |
| | April 30, 2013 (Unaudited) |
Growth of $10,000 for the period ended April 30, 2013
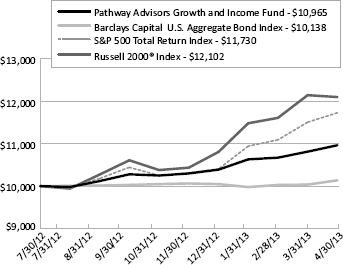
The graphs shown above represent a hypothetical investment of $10,000 in the Fund’s Investor Class shares for the period from inception to 4/30/13. All returns reflect reinvested dividends, but do not reflect the deduction of taxes that an investor would pay on distributions or redemptions.
| | |
| | |
| 8 | | www.pathwayadvisorsfunds.com |
| | |
| Pathway Advisors Growth and Income Fund | | Performance Update |
| | April 30, 2013 (Unaudited) |
| | |
| Top Ten Long Holdings | | (as a % of Net Assets)* |
SPDR® S&P 500® ETF Trust | | 14.85% |
Double Line Total Return Bond Fund - Class I | | 13.89% |
PIMCO Total Return Fund - Institutional Class | | 9.02% |
Vanguard® Wellington Fund - Class Admiral | | 8.24% |
T.Rowe Price Capital Appreciation Fund | | 7.42% |
iShares® Dow Jones International Select Dividend Index Fund | | 6.66% |
PIMCO Real Return Fund - Institutional Class | | 5.73% |
iShares® Dow Jones Select Dividend Index Fund | | 4.13% |
Vanguard® Large - Cap ETF | | 4.12% |
Metropolitan West Total Return Bond Fund - Class I | | 4.10% |
Top Ten Holdings | | 78.16% |
Portfolio Allocation (as a % of Net Assets)*
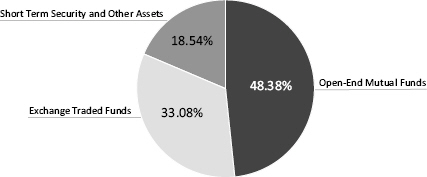
* Holdings are subject to change. Table and chart presents indicative values only.
| | |
| | |
| Annual Report | April 30, 2013 | | 9 |
| | |
| Pathway Advisors Aggressive Growth Fund | | Performance Update |
| | April 30, 2013 (Unaudited) |
Cumulative Total Return for the period ended April 30, 2013
| | | | | | | | | | | | | | | |
| | | One Month | | Latest Quarter | | Since Inception* |
Pathway Advisors Aggressive Growth Fund | | | | 2.06 | % | | | | 4.21 | % | | | | 15.14 | % |
MSCI EAFE NR1 | | | | 5.21 | % | | | | 5.07 | % | | | | 24.68 | % |
S&P 500 Total Return Index2 | | | | 1.93 | % | | | | 7.18 | % | | | | 17.30 | % |
Russell 2000® Index3 | | | | -0.37 | % | | | | 5.38 | % | | | | 21.02 | % |
* Fund inception date of July 30, 2012.
Indexes are not actively managed and do not reflect any deduction for fees or expenses. You cannot invest directly in an index.
The returns shown above do not reflect the deduction of taxes a shareholder would pay on Fund distributions or redemption of Fund shares.
The Fund is new and has a limited operating history.
Performance data quoted represents past performance. Past performance does not guarantee future results. Investment return and principal value of an investment will fluctuate so that an investor’s shares, when sold or redeemed, may be worth more or less than the original cost. Current performance data may be higher or lower than actual data quoted. For the most current month-end performance data, please call 1-888-288-1121 or visit www.pathwayadvisorsfunds.com.
| 1 | MSCI EAFE® (Europe, Australasia, Far East) Index is a free float-adjusted market capitalization weighted index designed to measure developed market equity performance. The MSCI EAFE® Index is composed of companies representative of the market structure of Developed Market countries. The index includes reinvestment of dividends, net of foreign withholding taxes. The index is not actively managed and does not reflect any deduction for fees, expenses or taxes. An investor cannot invest directly into the index. |
| 2 | The S&P 500® Total Return Index is an unmanaged index of 500 common stocks chosen for the market size, liquidity and industry group representation. It is a market-value weighted index. The index is not actively managed and does not reflect any deduction for fees, expenses or taxes. An investor cannot invest directly into the index. |
| 3 | The Russell 2000® Index measures the performance of the small-cap segment of the U.S. equity universe. The Russell 2000® Index is a subset of the Russell 3000® Index representing approximately 10% of the total market capitalization of that index. It includes approximately 2000 of the smallest securities based on a combination of their market cap and current index membership. The index is not actively managed and does not reflect any deduction for fees, expenses or taxes. An investor cannot invest directly into the index. |
Source: MSCI. MSCI makes no express or implied warranties or representations and shall have no liability whatsoever with respect to any MSCI data contained herein. The MSCI data may not be further redistributed or used to create indices or financial products. This report is not approved or produced by MSCI.
| | |
| | |
| 10 | | www.pathwayadvisorsfunds.com |
| | |
| Pathway Advisors Aggressive Growth Fund | | Performance Update |
| | April 30, 2013 (Unaudited) |
Growth of $10,000 for the period ended April 30, 2013
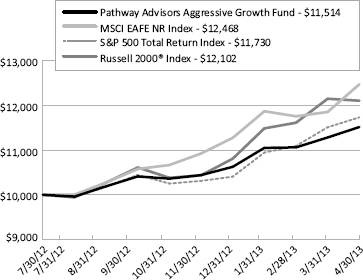
The graphs shown above represent a hypothetical investment of $10,000 in the Fund’s Investor Class shares for the period from inception to 4/30/13. All returns reflect reinvested dividends, but do not reflect the deduction of taxes that an investor would pay on distributions or redemptions.
| | |
| | |
| Annual Report | April 30, 2013 | | 11 |
| | |
| Pathway Advisors Aggressive Growth Fund | | Performance Update |
| | April 30, 2013 (Unaudited) |
| | | | | |
| Top Long Holdings | | (as a % of Net Assets)* |
iShares® Dow Jones International Select Dividend Index Fund | | | | 16.49 | % |
SPDR® S&P 500® ETF Trust | | | | 14.36 | % |
DoubleLine Total Return Bond Fund - Class I | | | | 14.17 | % |
Vanguard® Total Stock Market ETF | | | | 13.40 | % |
Akre Focus Fund - Institutional Class | | | | 12.69 | % |
T. Rowe Price Capital Appreciation Fund | | | | 8.60 | % |
Mairs & Power Growth Fund - Investor Class | | | | 7.62 | % |
Vanguard® FTSE Emerging Markets ETF | | | | 3.87 | % |
WisdomTree Emerging Markets SmallCap Dividend Fund | | | | 3.85 | % |
Top Long Holdings | | | | 95.05 | % |
Portfolio Allocation (as a % of Net Assets)*
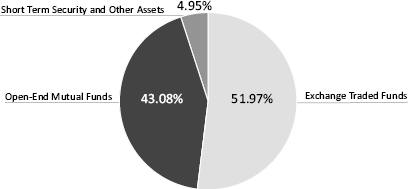
* Holdings are subject to change. Table and chart presents indicative values only.
| | |
| | |
| 12 | | www.pathwayadvisorsfunds.com |
| | |
| Pathway Advisors Funds | | Disclosure of Fund Expenses |
| | April 30, 2013 (Unaudited) |
As a shareholder of a Fund, you incur two types of costs: direct costs, such as short-term redemption fees and wire fees, and indirect costs, including management fees, and other fund operating expenses. This example is intended to help you understand your indirect costs, also referred to as “ongoing costs” (in dollars), of investing in the Fund and to compare these costs with the ongoing costs of investing in other mutual funds.
This example is based on an investment of $1,000 invested at the beginning of the period and held for the entire six-month period of November 1, 2012 through April 30, 2013.
Actual Expenses The first line of the table below provides information about actual account values and actual expenses. You may use the information in this line, together with the amount you invested at the beginning of the period, to estimate the expenses that you paid over the period. Simply divide your account value by $1,000 (for example, an $8,600 account value divided by $1,000 = 8.6), then multiply the result by the number in the first line under the heading “Expenses Paid During Period” to estimate the expenses you paid on your account during this period.
Hypothetical Example for Comparison Purposes The second line of the table provides information about hypothetical account values and hypothetical expenses based on the Fund’s actual expense ratio and an assumed rate of return of 5% per year before expenses, which is not the Fund’s actual return. The hypothetical account values and expenses may not be used to estimate the actual ending account balance or expenses you paid for the period. You may use this information to compare ongoing costs of investing in the Fund and other funds. To do so, compare this 5% hypothetical example with the 5% hypothetical examples that appear in the shareholder reports of other funds.
Please note that the expenses shown in the table are meant to highlight your ongoing costs only and do not reflect any direct costs, such as wire fees or low balance fees. Therefore, the second line of the table is useful in comparing ongoing costs only and will not help you determine the relative total costs of owning different funds. In addition, if these direct costs were included, your costs would be higher.
| | |
| | |
| Annual Report | April 30, 2013 | | 13 |
| | |
| Pathway Advisors Funds | | Disclosure of Fund Expenses |
| | April 30, 2013 (Unaudited) |
| | | | | | | | | | | | | | | | | | | | |
| | | BEGINNING ACCOUNT VALUE
11/01/12 | | ENDING ACCOUNT VALUE 04/30/13 | | EXPENSE RATIO(a) | | EXPENSES PAID
DURING PERIOD
11/01/12-
04/30/13(b) |
Pathway Advisors Conservative Fund | | | | | | | | | | | | | | | | | | | | |
Actual | | | | $ 1,000.00 | | | | | $ 1,047.10 | | | | | 1.98 | % | | | | $ 10.05 | |
Hypothetical
(5% return before expenses) | | | | $ 1,000.00 | | | | | $ 1,014.98 | | | | | 1.98 | % | | | | $ 9.89 | |
| | | | |
Pathway Advisors Growth and Income Fund | | | | | | | | | | | | | | | | | | | | |
Actual | | | | $ 1,000.00 | | | | | $ 1,069.80 | | | | | 1.98 | % | | | | $ 10.16 | |
Hypothetical
(5% return before expenses) | | | | $ 1,000.00 | | | | | $ 1,014.98 | | | | | 1.98 | % | | | | $ 9.89 | |
| | | | |
Pathway Advisors Aggressive Growth Fund | | | | | | | | | | | | | | | | | | | | |
Actual | | | | $ 1,000.00 | | | | | $ 1,111.30 | | | | | 1.98 | % | | | | $ 10.37 | |
Hypothetical
(5% return before expenses) | | | | $ 1,000.00 | | | | | $ 1,014.98 | | | | | 1.98 | % | | | | $ 9.89 | |
| (a) | Annualized, based on the Funds’ most recent fiscal half year expenses. |
| (b) | Expenses are equal to the Funds’ annualized expense ratio multiplied by the average account value over the period, multiplied by the number of days in the most recent fiscal half year (181), then divided by 365. |
| | |
| 14 | | www.pathwayadvisorsfunds.com |
| | |
Pathway Advisors Conservative Fund | | Portfolio of Investments |
| | April 30, 2013 |
| | | | | | | | | | |
| Description | | | | Shares | | | Value (Note 2) | |
EXCHANGE TRADED FUNDS (14.50%) | | | | | | | | |
iShares® Dow Jones International Select Dividend Index Fund | | | 949 | | | $ | 34,249 | |
SPDR® Barclays Capital High Yield Bond ETF | | | | | 791 | | | | 33,024 | |
Vanguard® FTSE Emerging Markets ETF | | | | | 480 | | | | 21,005 | |
Vanguard® REIT ETF | | | | | 417 | | | | 31,392 | |
Vanguard® Total Stock Market ETF | | | | | 949 | | | | 78,065 | |
| | | | | | | | | | |
TOTAL EXCHANGE TRADED FUNDS (Cost $187,070) | | | | | | | | | 197,735 | |
| | | |
OPEN-END MUTUAL FUNDS (64.91%) | | | | | | | | | | |
DoubleLine Total Return Bond Fund - Class I | | | | | 17,118 | | | | 195,323 | |
Loomis Sayles Bond Fund - Institutional Class | | | | | 4,224 | | | | 66,026 | |
Metropolitan West Total Return Bond Fund - Class I | | | | | 10,881 | | | | 119,910 | |
PIMCO Real Return Fund - Institutional Class | | | | | 5,306 | | | | 65,474 | |
PIMCO Total Return Fund - Institutional Class | | | | | 12,484 | | | | 141,564 | |
Templeton Global Bond Fund - Class A | | | | | 4,788 | | | | 65,399 | |
Vanguard® Wellesley Income Fund - Class Admiral | | | | | 2,144 | | | | 131,858 | |
Vanguard® Wellington Fund - Class Admiral | | | | | 1,567 | | | | 99,687 | |
| | | | | | | | | | |
TOTAL OPEN-END MUTUAL FUNDS (Cost $872,322) | | | | | | | | | 885,241 | |
| | | |
| | | 7-Day
Yield | | Shares | | | Value (Note 2) | |
SHORT TERM INVESTMENTS (13.88%) | | | | | | | | | | |
Dreyfus Cash Management, Institutional Shares | | 0.050% | | | 189,284 | | | | 189,284 | |
| | | | | | | | | | |
TOTAL SHORT TERM INVESTMENTS (Cost $189,284) | | | | | | | | | 189,284 | |
| | | |
TOTAL INVESTMENTS (93.29%) (Cost $1,248,676) | | | | | | | | $ | 1,272,260 | |
| | | |
Other Assets In Excess Of Liabilities (6.71%) | | | | | | | | | 91,460 | |
NET ASSETS (100.00%) | | | | | | | | $ | 1,363,720 | |
| | | | | | | | | | | |
Common Abbreviations:
ETF - Exchange Traded Fund.
FTSE - Financial Times and Stock Exchange.
PIMCO - Pacific Investment Management Company, LLC.
REIT - Real Estate Investment Trust.
SPDR - Standard & Poor’s Depository Receipts.
Holdings are subject to change.
| | |
See Notes to Financial Statements. | | |
| Annual Report | April 30, 2013 | | 15 |
| | |
| Pathway Advisors Growth and Income Fund | | Portfolio of Investments |
| | April 30, 2013 |
| | | | | | | | | | | | |
| Description | | | | | Shares | | | Value (Note 2) | |
EXCHANGE TRADED FUNDS (33.08%) | | | | | | | | | | | | |
iShares® Dow Jones International Select Dividend Index Fund | | | | | | | 9,429 | | | $ | 340,293 | |
iShares® Dow Jones Select Dividend Index Fund | | | | | | | 3,219 | | | | 210,748 | |
SPDR® S&P 500® ETF Trust | | | | | | | 4,748 | | | | 758,161 | |
Vanguard® FTSE Emerging Markets ETF | | | | | | | 1,938 | | | | 84,807 | |
Vanguard® Large-Cap ETF | | | | | | | 2,878 | | | | 210,583 | |
WisdomTree Emerging Markets SmallCap Dividend Fund | | | | | | | 1,608 | | | | 84,693 | |
| | | | | | | | | | | | |
TOTAL EXCHANGE TRADED FUNDS (Cost $1,630,817) | | | | | | | | | | | 1,689,285 | |
| | | |
OPEN-END MUTUAL FUNDS (48.38%) | | | | | | | | | | | | |
DoubleLine Total Return Bond Fund - Class I | | | | | | | 62,148 | | | | 709,113 | |
Metropolitan West Total Return Bond Fund - Class I | | | | | | | 18,991 | | | | 209,284 | |
PIMCO Real Return Fund - Institutional Class | | | | | | | 23,696 | | | | 292,409 | |
PIMCO Total Return Fund - Institutional Class | | | | | | | 40,600 | | | | 460,404 | |
T. Rowe Price Capital Appreciation Fund | | | | | | | 15,588 | | | | 378,792 | |
Vanguard® Wellington Fund - Class Admiral | | | | | | | 6,615 | | | | 420,809 | |
| | | | | | | | | | | | |
TOTAL OPEN-END MUTUAL FUNDS (Cost $2,445,762) | | | | | | | | | | | 2,470,811 | |
| | | |
| | | 7-Day
Yield | | | Shares | | | Value (Note 2) | |
SHORT TERM INVESTMENTS (11.82%) | | | | | | | | | | | | |
Dreyfus Cash Management, Institutional Shares | | | 0.050 | % | | | 603,517 | | | | 603,517 | |
| | | | | | | | | | | | |
TOTAL SHORT TERM INVESTMENTS (Cost $603,517) | | | | | | | | | | | 603,517 | |
| | | |
TOTAL INVESTMENTS (93.28%) (Cost $4,680,096) | | | | | | | | | | $ | 4,763,613 | |
| | | |
Other Assets In Excess Of Liabilities (6.72%) | | | | | | | | | | | 343,000 | |
NET ASSETS (100.00%) | | | | | | | | | | $ | 5,106,613 | |
| | | | | | | | | | | | | |
Common Abbreviations:
ETF - Exchange Traded Fund.
FTSE - Financial Times and Stock Exchange.
PIMCO - Pacific Investment Management Company, LLC.
SPDR - Standard & Poor’s Depository Receipts.
Holdings are subject to change.
| | |
See Notes to Financial Statements. | | |
| 16 | | www.pathwayadvisorsfunds.com |
| | |
| Pathway Advisors Aggressive Growth Fund | | Portfolio of Investments |
| | April 30, 2013 |
| | | | | | | | | | |
| Description | | | | Shares | | | Value (Note 2) | |
EXCHANGE TRADED FUNDS (51.97%) | | | | | | | | |
iShares® Dow Jones International Select Dividend Index Fund | | | 7,214 | | | $ | 260,352 | |
SPDR® S&P 500® ETF Trust | | | | | 1,420 | | | | 226,746 | |
Vanguard® FTSE Emerging Markets ETF | | | | | 1,396 | | | | 61,089 | |
Vanguard® Total Stock Market ETF | | | | | 2,573 | | | | 211,655 | |
WisdomTree Emerging Markets SmallCap Dividend Fund | | | 1,153 | | | | 60,729 | |
| | | | | | | | | | |
TOTAL EXCHANGE TRADED FUNDS (Cost $780,345) | | | | | | | | | 820,571 | |
| | | |
OPEN-END MUTUAL FUNDS (43.08%) | | | | | | | | | | |
Akre Focus Fund - Institutional Class | | | | | 11,272 | | | | 200,305 | |
DoubleLine Total Return Bond Fund - Class I | | | | | 19,616 | | | | 223,814 | |
Mairs & Power Growth Fund - Investor Class | | | | | 1,276 | | | | 120,346 | |
T. Rowe Price Capital Appreciation Fund | | | | | 5,588 | | | | 135,792 | |
| | | | | | | | | | |
TOTAL OPEN-END MUTUAL FUNDS (Cost $651,560) | | | | | | | | | 680,257 | |
| | | |
| | | 7-Day
Yield | | Shares | | | Value (Note 2) | |
SHORT TERM INVESTMENTS (6.21%) | | | | | | | | | | |
Dreyfus Cash Management, Institutional Shares | | 0.050% | | | 98,085 | | | | 98,085 | |
| | | | | | | | | | |
TOTAL SHORT TERM INVESTMENTS (Cost $98,085) | | | | | | | | | 98,085 | |
| | | |
TOTAL INVESTMENTS (101.26%) (Cost $1,529,990) | | | | | | | | $ | 1,598,913 | |
| | | |
Liabilities in Excess of Other Assets (-1.26%) | | | | | | | | | (19,958) | |
NET ASSETS (100.00%) | | | | | | | | $ | 1,578,955 | |
| | | | | | | | | | | |
Common Abbreviations:
ETF - Exchange Traded Fund.
FTSE - Financial Times and Stock Exchange.
SPDR - Standard & Poor’s Depository Receipts.
Holdings are subject to change.
| | |
See Notes to Financial Statements. | | |
| Annual Report | April 30, 2013 | | 17 |
| | |
| Pathway Advisors Funds | | Statements of Assets and Liabilities |
| | April 30, 2013 |
| | | | | | | | | | | | |
| | | PATHWAY
ADVISORS
CONSERVATIVE
FUND | | | PATHWAY
ADVISORS
GROWTH AND
INCOME FUND | | | PATHWAY
ADVISORS
AGGRESSIVE
GROWTH FUND | |
ASSETS | | | | | | | | | | | | |
Investments, at value | | $ | 1,272,260 | | | $ | 4,763,613 | | | $ | 1,598,913 | |
Cash | | | – | | | | 330,160 | | | | – | |
Receivable for shares sold | | | 110,711 | | | | 258,325 | | | | – | |
Receivable due from advisor | | | 4,032 | | | | 13,258 | | | | 5,075 | |
Dividends receivable | | | 814 | | | | 1,417 | | | | 4 | |
Deferred offering cost | | | 15,290 | | | | 15,174 | | | | 15,174 | |
Other assets | | | 1,593 | | | | 1,593 | | | | 1,594 | |
Total assets | | | 1,404,700 | | | | 5,383,540 | | | | 1,620,760 | |
LIABILITIES | | | | | | | | | | | | |
Distributions and service fees payable | | | 906 | | | | 1,770 | | | | 1,093 | |
Payable for investments purchased | | | – | | | | 224,372 | | | | – | |
Payable for trustee fees and expenses | | | 16 | | | | 26 | | | | 23 | |
Payable for chief compliance officer fees | | | 1,561 | | | | 3,152 | | | | 1,872 | |
Payable for principal financial officer fees | | | 391 | | | | 788 | | | | 468 | |
Payable for administration fees | | | 9,900 | | | | 20,115 | | | | 11,634 | |
Payable for transfer agency fees | | | 7,077 | | | | 8,358 | | | | 6,222 | |
Payable for professional fees | | | 12,915 | | | | 12,939 | | | | 12,921 | |
Payable for custody fees | | | 1,250 | | | | 1,250 | | | | 1,250 | |
Payable for reports to shareholders | | | 469 | | | | 792 | | | | 539 | |
Payable for offering costs | | | 5,730 | | | | 2,144 | | | | 4,928 | |
Accrued expenses and other liabilities | | | 765 | | | | 1,221 | | | | 855 | |
Total liabilities | | | 40,980 | | | | 276,927 | | | | 41,805 | |
NET ASSETS | | $ | 1,363,720 | | | $ | 5,106,613 | | | $ | 1,578,955 | |
| | | | | | | | | | | | | |
| | | |
NET ASSETS CONSIST OF | | | | | | | | | | | | |
Paid-in capital (Note 5) | | $ | 1,333,103 | | | $ | 5,017,279 | | | $ | 1,498,194 | |
Accumulated net investment income | | | 3,953 | | | | 2,793 | | | | 210 | |
Accumulated net realized gain on investments | | | 3,080 | | | | 3,024 | | | | 11,628 | |
Net unrealized appreciation on investments | | | 23,584 | | | | 83,517 | | | | 68,923 | |
NET ASSETS | | $ | 1,363,720 | | | $ | 5,106,613 | | | $ | 1,578,955 | |
| | | | | | | | | | | | | |
INVESTMENTS, AT COST | | $ | 1,248,676 | | | $ | 4,680,096 | | | $ | 1,529,990 | |
PRICING OF SHARES | | | | | | | | | | | | |
Net Asset Value, offering and redemption price per share | | $ | 10.51 | | | $ | 10.85 | | | $ | 11.40 | |
Net Assets | | $ | 1,363,720 | | | $ | 5,106,613 | | | $ | 1,578,955 | |
Shares of beneficial interest outstanding (unlimited number of shares, no par value common stock authorized) | | | 129,714 | | | | 470,791 | | | | 138,460 | |
| | |
See Notes to Financial Statements. | | |
| 18 | | www.pathwayadvisorsfunds.com |
| | |
Pathway Advisors Funds | | Statements of Operations |
| | For the Period July 31, 2012 (Commencement of Operations) to April 30, 2013 |
| | | | | | | | | | | | |
| | | PATHWAY
ADVISORS
CONSERVATIVE
FUND | | | PATHWAY
ADVISORS GROWTH AND
INCOME FUND | | | PATHWAY
ADVISORS
AGGRESSIVE GROWTH FUND | |
INVESTMENT INCOME | | | | | | | | | | | | |
Dividends | | $ | 12,300 | | | $ | 14,479 | | | $ | 9,288 | |
Total investment income | | | 12,300 | | | | 14,479 | | | | 9,288 | |
| | | |
EXPENSES | | | | | | | | | | | | |
Investment advisory fees | | | 3,231 | | | | 5,521 | | | | 3,911 | |
Administration fees | | | 52,381 | | | | 69,597 | | | | 63,295 | |
Transfer agency fees | | | 23,612 | | | | 24,949 | | | | 23,702 | |
Distribution and service fees | | | 1,615 | | | | 2,761 | | | | 1,956 | |
Legal fees | | | 775 | | | | 947 | | | | 788 | |
Audit and tax fees | | | 13,395 | | | | 13,395 | | | | 13,395 | |
Custody fees | | | 3,790 | | | | 3,780 | | | | 3,763 | |
Reports to shareholders | | | 664 | | | | 1,126 | | | | 733 | |
Trustee fees and expenses | | | 22 | | | | 30 | | | | 28 | |
Registration/filing fees | | | 513 | | | | 645 | | | | 530 | |
Chief compliance officer fees | | | 8,471 | | | | 11,289 | | | | 10,268 | |
Principal financial officer fees | | | 2,118 | | | | 2,823 | | | | 2,567 | |
Offering costs | | | 45,880 | | | | 45,862 | | | | 45,862 | |
Other | | | 3,854 | | | | 4,397 | | | | 4,194 | |
Total expenses before waivers | | | 160,321 | | | | 187,122 | | | | 174,992 | |
Less fees waived/reimbursed by investment advisor | | | (153,925) | | | | (176,190) | | | | (167,248) | |
Total net expenses | | | 6,396 | | | | 10,932 | | | | 7,744 | |
| | | |
NET INVESTMENT INCOME | | | 5,904 | | | | 3,547 | | | | 1,544 | |
Net realized gain on investments | | | 2,117 | | | | 2,331 | | | | 10,945 | |
Long-term capital gain distributions from other investment companies | | | 1,489 | | | | 1,553 | | | | 1,722 | |
Net change in unrealized appreciation on investments | | | 23,584 | | | | 83,517 | | | | 68,923 | |
NET REALIZED AND UNREALIZED GAIN ON INVESTMENTS | | | 27,190 | | | | 87,401 | | | | 81,590 | |
NET INCREASE IN NET ASSETS RESULTING FROM OPERATIONS | | $ | 33,094 | | | $ | 90,948 | | | $ | 83,134 | |
| | | | | | | | | | | | | |
| | |
See Notes to Financial Statements. | | |
Annual Report | April 30, 2013 | | 19 |
| | |
| Pathway Advisors Funds | | Statements of Changes in Net Assets |
For the Period July 31, 2012 (Commencement of Operations) to April 30, 2013 |
| | | | | | | | | | | | |
| | | PATHWAY
ADVISORS
CONSERVATIVE
FUND | | | PATHWAY
ADVISORS GROWTH
AND INCOME FUND | | | PATHWAY
ADVISORS
AGGRESSIVE GROWTH FUND | |
OPERATIONS | | | | | | | | | | | | |
Net investment income | | $ | 5,904 | | | $ | 3,547 | | | $ | 1,544 | |
Net realized gain on investments | | | 2,117 | | | | 2,331 | | | | 10,945 | |
Long-term capital gain distributions from other investment companies | | | 1,489 | | | | 1,553 | | | | 1,722 | |
Net change in unrealized appreciation on investments | | | 23,584 | | | | 83,517 | | | | 68,923 | |
Net increase in net assets resulting from operations | | | 33,094 | | | | 90,948 | | | | 83,134 | |
DISTRIBUTIONS | | | | | | | | | | | | |
Net investment income | | | (3,846) | | | | (3,542) | | | | (3,440) | |
Net realized gains on investments | | | (526) | | | | (860) | | | | (1,039) | |
Net decrease in net assets from distributions | | | (4,372) | | | | (4,402) | | | | (4,479) | |
BENEFICIAL INTEREST TRANSACTIONS (NOTE 5) | | | | | | | | | | | | |
Shares sold | | | 1,332,626 | | | | 5,015,665 | | | | 1,601,209 | |
Dividends reinvested | | | 4,372 | | | | 4,402 | | | | 4,479 | |
Shares redeemed | | | (2,000) | | | | – | | | | (105,388) | |
Net increase in net assets derived from beneficial interest transactions | | | 1,334,998 | | | | 5,020,067 | | | | 1,500,300 | |
Net increase in Net Assets | | | 1,363,720 | | | | 5,106,613 | | | | 1,578,955 | |
NET ASSETS: | | | | | | | | | | | | |
Beginning of period | | | – | | | | – | | | | – | |
End of period* | | $ | 1,363,720 | | | $ | 5,106,613 | | | $ | 1,578,955 | |
| | | | | | | | | | | | | |
* Includes accumulated net investment income of: | | $ | 3,953 | | | $ | 2,793 | | | $ | 210 | |
| | |
See Notes to Financial Statements. | | |
20 | | www.pathwayadvisorsfunds.com |
| | |
Pathway Advisors Conservative Fund | | Financial Highlights |
| | For a share outstanding throughout the period presented. |
| | | | |
| | | For the Period Ended
April 30, 2013(a) | |
| |
NET ASSET VALUE, BEGINNING OF PERIOD | | $ | 10.00 | |
INCOME/(LOSS) FROM OPERATIONS | | | | |
Net investment income(b) | | | 0.14 | |
Net realized and unrealized gain on investments | | | 0.52 | |
| | | | |
Total from Investment Operations | | | 0.66 | |
| | | | |
| |
LESS DISTRIBUTIONS | | | | |
Net investment income | | | (0.13) | |
Net realized gain on investments | | | (0.02) | |
| | | | |
Total Distributions | | | (0.15) | |
| | | | |
NET INCREASE IN NET ASSET VALUE | | | 0.51 | |
| | | | |
NET ASSET VALUE, END OF PERIOD | | $ | 10.51 | |
| | | | |
TOTAL RETURN(c) | | | 6.59% | |
| |
RATIOS/SUPPLEMENTAL DATA | | | | |
Net assets, End of Period (000s) | | $ | 1,364 | |
RATIOS TO AVERAGE NET ASSETS: | | | | |
Operating expenses excluding reimbursement/waiver(d) | | | 49.62% | (e)(f) |
Operating expenses including reimbursement/waiver(d) | | | 1.98% | (e)(f) |
Net investment income including reimbursement/waiver(d) | | | 1.83% | (e) |
PORTFOLIO TURNOVER RATE | | | 18% | (g) |
| (a) | The Fund commenced operations on July 31, 2012. |
| (b) | Calculated using the average shares method. |
| (c) | Total investment return is calculated assuming a purchase of a common share at the opening of the first day and a sale at closing on the last day of each period reported. Dividends and distributions, if any, are assumed for purposes of this calculation to be reinvested at prices obtained under the Fund’s dividend reinvestment plan. Total returns would have been lower had certain expenses not been waived during the period. Total investment returns do not reflect brokerage commissions, if any, and are not annualized. |
| (d) | The ratios exclude the impact of expenses of the underlying funds in which the Fund invests as represented in the Portfolio of Investments. |
| (f) | Expense ratios before reductions for startup periods may not be representative of longer term operating periods. |
See Notes to Financial Statements.
| | |
| | |
| Annual Report | April 30, 2013 | | 21 |
| | |
| Pathway Advisors Growth and Income Fund | | Financial Highlights |
| | For a share outstanding throughout the period presented. |
| | | | |
| | | For the Period Ended
April 30, 2013(a) | |
| |
NET ASSET VALUE, BEGINNING OF PERIOD | | $ | 10.00 | |
INCOME/(LOSS) FROM OPERATIONS | | | | |
Net investment income(b) | | | 0.05 | |
Net realized and unrealized gain on investments | | | 0.91 | |
| | | | |
Total from Investment Operations | | | 0.96 | |
| | | | |
| |
LESS DISTRIBUTIONS | | | | |
Net investment income | | | (0.09) | |
Net realized gain on investments | | | (0.02) | |
| | | | |
Total Distributions | | | (0.11) | |
| | | | |
NET INCREASE IN NET ASSET VALUE | | | 0.85 | |
| | | | |
NET ASSET VALUE, END OF PERIOD | | $ | 10.85 | |
| | | | |
TOTAL RETURN(c) | | | 9.65% | |
| |
RATIOS/SUPPLEMENTAL DATA | | | | |
Net assets, End of Period (000s) | | $ | 5,107 | |
RATIOS TO AVERAGE NET ASSETS: | | | | |
Operating expenses excluding reimbursement/waiver(d) | | | 33.89% | (e)(f) |
Operating expenses including reimbursement/waiver(d) | | | 1.98% | (e)(f) |
Net investment income including reimbursement/waiver(d) | | | 0.64% | (e) |
PORTFOLIO TURNOVER RATE | | | 5% | (g) |
| (a) | The Fund commenced operations on July 31, 2012. |
| (b) | Calculated using the average shares method. |
| (c) | Total investment return is calculated assuming a purchase of a common share at the opening of the first day and a sale at closing on the last day of each period reported. Dividends and distributions, if any, are assumed for purposes of this calculation to be reinvested at prices obtained under the Fund’s dividend reinvestment plan. Total returns would have been lower had certain expenses not been waived during the period. Total investment returns do not reflect brokerage commissions, if any, and are not annualized. |
| (d) | The ratios exclude the impact of expenses of the underlying funds in which the Fund invests as represented in the Portfolio of Investments. |
| (f) | Expense ratios before reductions for startup periods may not be representative of longer term operating periods. |
See Notes to Financial Statements.
| | |
| | |
| 22 | | www.pathwayadvisorsfunds.com |
| | |
| Pathway Advisors Aggressive Growth Fund | | Financial Highlights |
| | For a share outstanding throughout the period presented. |
| | | | |
| | | For the Period Ended
April 30, 2013(a) | |
| |
NET ASSET VALUE, BEGINNING OF PERIOD | | | $ 10.00 | |
INCOME/(LOSS) FROM OPERATIONS | | | | |
Net investment income(b) | | | 0.03 | |
Net realized and unrealized gain on investments | | | 1.47 | |
| | | | |
Total from Investment Operations | | | 1.50 | |
| | | | |
| |
LESS DISTRIBUTIONS | | | | |
Net investment income | | | (0.08) | |
Net realized gain on investments | | | (0.02) | |
| | | | |
Total Distributions | | | (0.10) | |
| | | | |
NET INCREASE IN NET ASSET VALUE | | | 1.40 | |
| | | | |
NET ASSET VALUE, END OF PERIOD | | | $ 11.40 | |
| | | | |
TOTAL RETURN(c) | | | 15.14% | |
| |
RATIOS/SUPPLEMENTAL DATA | | | | |
Net assets, End of Period (000s) | | | $ 1,579 | |
RATIOS TO AVERAGE NET ASSETS: | | | | |
Operating expenses excluding reimbursement/waiver(d) | | | 44.74%(e)(f) | |
Operating expenses including reimbursement/waiver(d) | | | 1.98%(e)(f) | |
Net investment income including reimbursement/waiver(d) | | | 0.39%(e) | |
PORTFOLIO TURNOVER RATE | | | 31%(g) | |
| (a) | The Fund commenced operations on July 31, 2012. |
| (b) | Calculated using the average shares method. |
| (c) | Total investment return is calculated assuming a purchase of a common share at the opening of the first day and a sale at closing on the last day of each period reported. Dividends and distributions, if any, are assumed for purposes of this calculation to be reinvested at prices obtained under the Fund’s dividend reinvestment plan. Total returns would have been lower had certain expenses not been waived during the period. Total investment returns do not reflect brokerage commissions, if any, and are not annualized. |
| (d) | The ratios exclude the impact of expenses of the underlying funds in which the Fund invests as represented in the Portfolio of Investments. |
| (f) | Expense ratios before reductions for startup periods may not be representative of longer term operating periods. |
See Notes to Financial Statements.
| | |
| | |
| Annual Report | April 30, 2013 | | 23 |
| | |
| Pathway Advisors Funds | | Notes to Financial Statements |
| | April 30, 2013 |
1. ORGANIZATION
Financial Investors Trust (the “Trust”), a Delaware statutory trust, is an open-end management investment company registered under the Investment Company Act of 1940, as amended (“1940 Act”). As of April 30, 2013, the Trust has 26 registered funds. This annual report describes Pathway Advisors Conservative Fund, Pathway Advisors Growth and Income Fund and Pathway Advisors Aggressive Growth Fund (individually a “Fund” and collectively, the “Funds”). The Funds’ inception date was July 30, 2012 and operations commenced on July 31, 2012. The Pathway Advisors Conservative Fund seeks total return through a primary emphasis on income with a secondary emphasis on growth of capital. The Pathway Advisors Growth and Income Fund seeks total return through growth of capital and income. The Pathway Advisors Aggressive Growth Fund seeks total return through a primary emphasis on growth with a secondary emphasis on income.
Principal Investment Strategies of each Fund: Each Fund is structured as a fund-of-funds and under normal circumstances, the Funds pursue their objectives by investing primarily in managed portfolios of other open-end investment companies registered under the 1940 Act, that represent a variety of asset classes and investment styles. The Funds may also invest in closed-end funds and exchange-traded funds, which provide exposure to hedging or alternative strategies. Collectively, the investment companies in which the Funds may invest are referred to as “underlying funds”.
2. SIGNIFICANT ACCOUNTING POLICIES
The accompanying financial statements were prepared in accordance with accounting principles generally accepted in the United States of America (“U.S. GAAP”). The preparation of financial statements in conformity with U.S. GAAP requires management to make certain estimates and assumptions that affect the reported amounts of assets and liabilities and disclosures of contingent assets and liabilities at the date of the financial statements and the reported amounts of revenue and expenses during the period. Actual results could differ from those estimates. The following is a summary of significant accounting policies consistently followed by the Funds in preparation of their financial statements.
Investment Valuation: The Funds generally value their securities based on market prices determined at the close of regular trading on the New York Stock Exchange (“NYSE”), normally 4:00 p.m. Eastern Time, on each day the NYSE is open for trading.
For equity securities and mutual funds that are traded on an exchange, the market price is usually the closing sale or official closing price on that exchange. In the case of equity securities not traded on an exchange, or if such closing prices are not otherwise available, the securities are valued at the mean of the most recent bid and ask prices on such day. Redeemable securities issued by open-end registered investment companies are valued at the investment company’s applicable net asset value, with the exception of exchange-traded open-end investment companies, which are priced as equity securities.
The market price for debt obligations is generally the price supplied by an independent third-party pricing service approved by the Board of Trustees (the “Board”), which may use a matrix, formula or other objective method that takes into consideration quotations from dealers, market transactions in comparable investments, market indices and yield curves. If vendors are unable to supply a price, or if the price supplied is deemed to be unreliable, the market price may be
| | |
| | |
| 24 | | www.pathwayadvisorsfunds.com �� |
| | |
| Pathway Advisors Funds | | Notes to Financial Statements |
| | April 30, 2013 |
determined using quotations received from one or more broker-dealers that make a market in the security. Short-term debt obligations that will mature in 60 days or less are valued at amortized cost, unless it is determined that using this method would not reflect an investment’s fair value.
When such prices or quotations are not available, or when the Fair Value Committee appointed by the Board believes that they are unreliable, securities may be priced using fair value procedures approved by the Board.
Fair Value Measurements: The Funds disclose the classification of their fair value measurements following a three-tier hierarchy based on the inputs used to measure fair value. Inputs refer broadly to the assumptions that market participants would use in pricing the asset or liability, including assumptions about risk. Inputs may be observable or unobservable. Observable inputs reflect the assumptions market participants would use in pricing the asset or liability that are developed based on market data obtained from sources independent of the reporting entity. Unobservable inputs reflect the reporting entity’s own assumptions about the assumptions market participants would use in pricing the asset or liability that are developed based on the best information available.
Various inputs are used in determining the value of the Funds’ investments as of the end of the reporting period. When inputs used fall into different levels of the fair value hierarchy, the level in the hierarchy within which the fair value measurement falls is determined based on the lowest level input that is significant to the fair value measurement in its entirety. The designated input levels are not necessarily an indication of the risk or liquidity associated with these investments. These inputs are categorized in the following hierarchy under applicable financial accounting standards:
| Level 1 – | Unadjusted quoted prices in active markets for identical investments, unrestricted assets or liabilities that the Funds have the ability to access at the measurement date; |
| Level 2 – | Quoted prices which are not active, quoted prices for similar assets or liabilities in active markets or inputs other than quoted prices that are observable (either directly or indirectly) for substantially the full term of the asset or liability; and |
| Level 3 – | Significant unobservable prices or inputs (including the Funds’ own assumptions in determining the fair value of investments) where there is little or no market activity for the asset or liability at the measurement date. |
| | |
| | |
| Annual Report | April 30, 2013 | | 25 |
| | |
| Pathway Advisors Funds | | Notes to Financial Statements |
| | April 30, 2013 |
The following is a summary of the inputs used to value the Funds’ investments as of April 30, 2013:
Pathway Advisors Conservative Fund
| | | | | | | | | | | | | | | | |
Investments in Securities at Value | | Level 1 -
Quoted Prices | | | Level 2 - Other Significant Observable Inputs | | | Level 3 - Significant Unobservable Inputs | | | Total | |
Exchange Traded Funds | | $ | 197,735 | | | $ | – | | | $ | – | | | $ | 197,735 | |
Open-End Mutual Funds | | | 885,241 | | | | – | | | | – | | | | 885,241 | |
Short Term Investments | | | 189,284 | | | | – | | | | – | | | | 189,284 | |
Total | | $ | 1,272,260 | | | $ | – | | | $ | – | | | $ | 1,272,260 | |
| | | | | | | | | | | | | | | | | |
Pathway Advisors Growth and Income Fund
| | | | | | | | | | | | | | | | |
Investments in Securities at Value | | Level 1 -
Quoted Prices | | | Level 2 -
Other
Significant
Observable
Inputs | | | Level 3 -
Significant
Unobservable
Inputs | | | Total | |
Exchange Traded Funds | | $ | 1,689,285 | | | $ | – | | | $ | – | | | $ | 1,689,285 | |
Open-End Mutual Funds | | | 2,470,811 | | | | – | | | | – | | | | 2,470,811 | |
Short Term Investments | | | 603,517 | | | | – | | | | – | | | | 603,517 | |
Total | | $ | 4,763,613 | | | $ | – | | | $ | – | | | $ | 4,763,613 | |
| | | | | | | | | | | | | | | | | |
Pathway Advisors Aggressive Growth Fund
| | | | | | | | | | | | | | | | |
Investments in Securities at Value | | Level 1 - Quoted Prices | | | Level 2 - Other Significant Observable Inputs | | | Level 3 - Significant Unobservable Inputs | | | Total | |
Exchange Traded Funds | | $ | 820,571 | | | $ | – | | | $ | – | | | $ | 820,571 | |
Open-End Mutual Funds | | | 680,257 | | | | – | | | | – | | | | 680,257 | |
Short Term Investments | | | 98,085 | | | | – | | | | – | | | | 98,085 | |
Total | | $ | 1,598,913 | | | $ | – | | | $ | – | | | $ | 1,598,913 | |
| | | | | | | | | | | | | | | | | |
The Funds recognize transfers between levels as of the end of the period. For the period ended April 30, 2013, the Funds did not have any transfers between Level 1 and Level 2 securities. For the period ended April 30, 2013, the Funds did not have any securities that used significant unobservable inputs (Level 3) in determining fair value.
Investment Transactions and Investment Income: Investment transactions are accounted for on the date the investments are purchased or sold (trade date basis). Net realized gains and losses from investment transactions are reported on an identified cost basis. Interest income, which includes accretion of discounts and amortization of premiums, is accrued and recorded as earned. Dividend income is recognized on the ex-dividend date or for certain foreign securities, as soon as information is available to the Funds.
| | |
| | |
| 26 | | www.pathwayadvisorsfunds.com |
| | |
Pathway Advisors Funds | | Notes to Financial Statements |
| | April 30, 2013 |
Trust Expenses: Some expenses of the Trust can be directly attributed to the Funds. Expenses which cannot be directly attributed to the Funds are apportioned among all funds in the Trust based on average net assets of each fund.
Fund Expenses: Expenses that are specific to a Fund are charged directly to that Fund. Expenses which cannot be directly attributed are apportioned among all funds in the Trust based on average net assets of each Fund.
Offering Costs: Offering costs, including costs of printing initial prospectuses, legal and registration fees, are being amortized over twelve months from the inception date of the Funds. As of April 30, 2013, $15,290, $15,174 and $15,174, of offering costs remain to be amortized for Pathway Advisors Conservative Fund, Pathway Advisors Growth and Income Fund and Pathway Advisors Aggressive Growth Fund, respectively.
Federal Income Taxes: The Funds comply with the requirements under Subchapter M of the Internal Revenue Code of 1986, as amended, applicable to regulated investment companies and intend to distribute substantially all of their net taxable income and net capital gains, if any, each year, so that it will not be subject to excise tax on undistributed income and gains. The Funds are not subject to income taxes to the extent such distributions are made.
As of and during the period ended April 30, 2013, the Funds did not have a liability for any unrecognized tax benefits. The Funds file U.S. federal, state, and local tax returns as required. The Funds’ tax returns are subject to examination by the relevant tax authorities until expiration of the applicable statute of limitations, which is generally three years after the filing of the tax return for federal purposes and four years for most state returns. Tax returns for open years have incorporated no uncertain tax positions that require a provision for income taxes.
Distributions to Shareholders: Each Fund normally pays dividends and distributes capital gains, if any, on an annual basis. Income dividend distributions are derived from interest and other income each Fund receives from its investments, including short-term capital gains. Long term capital gain distributions are derived from gains realized when each Fund sells a security it has owned for more than a year. Each Fund may make additional distributions and dividends at other times if the portfolio manager believes doing so may be necessary for each Fund to avoid or reduce taxes.
| | |
| | |
| Annual Report | April 30, 2013 | | 27 |
| | |
| Pathway Advisors Funds | | Notes to Financial Statements |
| | April 30, 2013 |
3. TAX BASIS INFORMATION
Reclassifications: As of April 30, 2013, permanent differences in book and tax accounting were reclassified. These differences had no effect on net assets and were primarily attributed to non-deductible expenses. The reclassifications were as follows:
| | | | | | | | | | | | |
| Fund | | Paid-in Capital | | | Accumulated Net
Investment Income | | | Accumulated Net Realized Gain on Investments | |
Pathway Advisors Conservative Fund | | $ | (1,895 | ) | | $ | 1,895 | | | $ | – | |
Pathway Advisors Growth and Income Fund | | | (2,788 | ) | | | 2,788 | | | | – | |
Pathway Advisors Aggressive Growth Fund | | | (2,106 | ) | | | 2,106 | | | | – | |
Tax Basis of Investments: As of April 30, 2013, the costs of investments for federal income tax purposes and accumulated net unrealized appreciation/(depreciation) on investments were as follows:
| | | | | | | | | | | | | | | | |
| | | Gross
Appreciation
(excess of value
over tax cost) | | | Gross
Depreciation
(excess of tax
cost over value) | | | Net Unrealized
Appreciation | | | Cost of
Investments for
Income Tax
Purposes | |
Pathway Advisors Conservative Fund | | $ | 24,219 | | | $ | (635) | | | $ | 23,584 | | | $ | 1,248,676 | |
Pathway Advisors Growth and Income Fund | | | 85,040 | | | | (1,523 | ) | | | 83,517 | | | | 4,680,096 | |
Pathway Advisors Aggressive Growth Fund | | | 69,068 | | | | (158 | ) | | | 68,910 | | | | 1,530,003 | |
Components of Earnings: As of April 30, 2013, components of distributable earnings were as follows:
| | | | | | | | | | | | |
| | | Pathway Advisors
Conservative Fund | | | Pathway Advisors
Growth and Income Fund | | | Pathway Advisors
Aggressive Growth
Fund | |
Undistributed ordinary income | | $ | 5,544 | | | $ | 4,264 | | | $ | 10,129 | |
Accumulated capital gain | | | 1,489 | | | | 1,553 | | | | 1,722 | |
Net unrealized appreciation on investments | | | 23,584 | | | | 83,517 | | | | 68,910 | |
Total distributable earnings | | $ | 30,617 | | | $ | 89,334 | | | $ | 80,761 | |
| | | | | | | | | | | | | |
Capital Losses: As of April 30, 2013, the Funds have no accumulated capital loss carryforwards.
Tax Basis of Distributions to Shareholders: The character of distributions made during the period from net investment income or net realized gains may differ from its ultimate characterization for federal income tax purposes. Also, due to the timing of dividend distributions,
| | |
| | |
| 28 | | www.pathwayadvisorsfunds.com |
| | |
| Pathway Advisors Funds | | Notes to Financial Statements |
| | April 30, 2013 |
the fiscal year in which amounts are distributed may differ from the fiscal year in which the income or realized gain were recorded by the Funds.
The tax character of distributions paid by the Funds for the period ended April 30, 2013, were as follows:
| | | | | | | | |
| | | | | | Long-Term Capital | |
| | | | Ordinary Income | | | | Gain | |
Pathway Advisors Conservative Fund | | $ | 4,372 | | | $ | – | |
Pathway Advisors Growth and Income Fund | | | 4,402 | | | | – | |
Pathway Advisors Aggressive Growth Fund | | | 4,479 | | | | – | |
4. SECURITIES TRANSACTIONS
Purchases and sales of securities (excluding short-term securities) during the period ended April 30, 2013, were as follows:
| | | | | | | | |
| Fund | | Purchases of | | | Proceeds From Sales | |
| | Securities | | | of Securities | |
Pathway Advisors Conservative Fund | | $ | 1,134,265 | | | $ | 76,880 | |
Pathway Advisors Growth and Income Fund | | | 4,115,476 | | | | 41,228 | |
Pathway Advisors Aggressive Growth Fund | | | 1,589,880 | | | | 168,920 | |
5. BENEFICIAL SHARE TRANSACTIONS
The capitalization of the Trust consists of an unlimited number of shares of beneficial interest with no par value per share. Holders of the shares of the Funds of the Trust have one vote for each share held and a proportionate fraction of a vote for each fractional share. All shares issued and outstanding are fully paid and are non-assessable, transferable and redeemable at the option of the shareholder. Shares have no pre-emptive rights.
Transactions in shares of capital stock:
Pathway Advisors Conservative Fund
| | | | |
| | | For the period July 31, 2012
(Commencement of Operations) to
April 30, 2013 | |
Common Shares Outstanding - Beginning of Period | | | – | |
Common Shares Sold | | | 129,476 | |
Common Shares Issued as Reinvestment of Dividends | | | 432 | |
Common Shares Redeemed | | | (194) | |
Common Shares Outstanding - End of Period | | | 129,714 | |
| | |
| | |
| | |
| Annual Report | April 30, 2013 | | 29 |
| | |
| Pathway Advisors Funds | | Notes to Financial Statements |
| | April 30, 2013 |
Pathway Advisors Growth and Income Fund
| | | | |
| | | For the period July 31, 2012
(Commencement of Operations) to
April 30, 2013 | |
Common Shares Outstanding - Beginning of Period | | | – | |
Common Shares Sold | | | 470,359 | |
Common Shares Issued as Reinvestment of Dividends | | | 432 | |
Common Shares Outstanding - End of Period | | | 470,791 | |
| | |
| | |
Pathway Advisors Aggressive Growth Fund
| | | | |
| | | For the period July 31, 2012
(Commencement of Operations) to
April 30, 2013 | |
Common Shares Outstanding - Beginning of Period | | | – | |
Common Shares Sold | | | 147,706 | |
Common Shares Issued as Reinvestment of Dividends | | | 432 | |
Common Shares Redeemed | | | (9,678) | |
Common Shares Outstanding - End of Period | | | 138,460 | |
| | |
| | |
6. MANAGEMENT AND RELATED PARTY TRANSACTIONS
Investment Advisory
Hanson McClain Strategic Advisors, Inc. (the “Adviser”), subject to the authority of the Board, is responsible for the overall management and administration of the Funds’ business affairs. The Adviser manages the investments of the Funds in accordance with the Funds’ investment objective, policies and limitations and investment guidelines established jointly by the Adviser and the Board. Pursuant to the Investment Advisory Agreement (“Advisory Agreement”), the Adviser is entitled to an investment advisory fee, computed daily and payable monthly of 1.00% of the average daily net assets for each Fund.
The Adviser has agreed contractually to limit the amount of each Fund’s total annual expenses, exclusive of acquired fund fees and expenses, brokerage expenses, interest expenses, taxes and extraordinary expenses, to 1.98% of the Funds’ average daily net assets. This agreement is in effect through August 31, 2014. The Adviser will be permitted to recover expenses it has borne through the agreement described above to the extent that the Funds’ expenses in later periods fall below the annual rates set forth in the relevant agreement. The Funds will not be obligated to pay any such deferred fees and expenses more than three years after the end of the fiscal year in which the fees and expense were deferred. The Adviser may not discontinue this waiver without the approval by the Funds’ Board of Trustees.
For the period ended April 30, 2013, the fee waivers and/ or reimbursements were as follows:
| | | | | | | | | | |
| Fund | | Fees Waived/
Reimbursed
By Adviser | | | Recoupment of
Past Waived
Fees By Adviser | | Total | |
Pathway Advisors Conservative Fund | | $ | 153,925 | | | $ 0 | | $ | 153,925 | |
Pathway Advisors Growth and Income Fund | | $ | 176,190 | | | 0 | | $ | 176,190 | |
Pathway Advisors Aggressive Growth Fund | | $ | 167,248 | | | 0 | | $ | 167,248 | |
| | |
| 30 | | www.pathwayadvisorsfunds.com |
| | |
| Pathway Advisors Funds | | Notes to Financial Statements |
| | April 30, 2013 |
As of April 30, 2013, the balances of recoupable expenses for each Fund were as follows:
| | | | | | |
| Fund | | 2012 | | | |
Pathway Advisors Conservative Fund | | $ | 153,925 | | | |
Pathway Advisors Growth and Income Fund | | $ | 176,190 | | | |
Pathway Advisors Aggressive Growth Fund | | $ | 167,248 | | | |
Fund Accounting Fees and Expenses
ALPS Fund Services, Inc. (“ALPS” and the “Administrator”) (an affiliate of ALPS Distributors, Inc.) serves as administrator to the Funds, and each Fund has agreed to pay expenses incurred in connection with its administrative activities. Pursuant to the Administration, Bookkeeping and Pricing Services Agreement (the “Agreement”), ALPS will provide operational services to the Funds including, but not limited to fund accounting and fund administration and generally assist in each Fund’s operations.
Annual Administrative Fee, billed monthly in total and allocated to each Fund, in the amount of the greater of (a) the annual minimum for all Funds of $245,000 in year 1 of operations and $260,000 in year 2 and forward or (b) following basis point fee schedule:
| | | | | | | |
| Average Total Net Assets | | Contractual Fee | | |
Between $0-$500 Million | | | | 0.05 | % | | |
$500M-$1 Billion | | | | 0.03 | % | | |
Above $1 Billion | | | | 0.02 | % | | |
The Administrator is also reimbursed by the Funds for certain out of pocket expenses.
Transfer Agent
ALPS serves as transfer, dividend paying and shareholder servicing agent for the Funds under a Transfer Agency and Services Agreement with the Trust. Under this Agreement, ALPS is paid an annual base fee of $25,000 per Fund plus fees for open accounts and is reimbursed for certain out-of-pocket expenses.
Compliance Services
ALPS provides services that assist the Trust’s Chief Compliance Officer in monitoring and testing the policies and procedures of the Trust in conjunction with requirements under Rule 38a-1 of the 1940 Act within the Chief Compliance Officer Services Agreement. Under this Agreement, ALPS is paid an annual base fee for all Funds of $40,000 and is reimbursed for certain out-of-pocket expenses.
Principal Financial Officer
ALPS receives an annual fee for all Funds of $10,000 for providing Principal Financial Officer (“PFO”) services to the Trust and is reimbursed for certain out-of-pocket expenses.
Distributor
ALPS Distributors, Inc. (“ADI” or the “Distributor”) (an affiliate of ALPS) acts as the distributor of the Funds’ shares pursuant to a Distribution Agreement with the Trust. Shares are sold on a continuous basis by ADI as agent for the Funds, and ADI has agreed to use its best efforts to solicit orders for the sale of Funds’ shares, although it is not obliged to sell any particular amount of
| | |
| | |
| Annual Report | April 30, 2013 | | 31 |
| | |
| Pathway Advisors Funds | | Notes to Financial Statements |
| | April 30, 2013 |
shares. ADI is not entitled to any compensation for its services as Distributor. ADI is registered as a broker-dealer with the Securities and Exchange Commission.
Each Fund has adopted a separate Distribution and Services Plan (each a “Plan” and collectively, the “Plans”) pursuant to Rule 12b-1 of the 1940 Act. The Plans allow each Fund, as applicable, to use each Fund’s assets to pay fees in connection with the distribution and marketing of the Funds’ shares and/or the provision of shareholder services to the Funds’ shareholders. The Plan permits payment for services in connection with the administration of plans or programs that use shares of each Fund as their funding medium and for related expenses. The Plans permit each Fund to make total payments at an annual rate of up to 0.35% of each Fund’s average daily net assets. Because these fees are paid out of the Funds’ assets on an ongoing basis, over time they will increase the cost of an investment in the Funds, and Plan fees may cost an investor more than other types of sales charges.
Each Fund has adopted a Shareholder Services Plan (a “Shareholder Services Plan”) with respect to its shares. Under the Shareholder Services Plan, each Fund is authorized to pay banks and their affiliates and other institutions, including broker-dealers and Fund affiliates (“Participating Organizations”), an aggregate fee in an amount not to exceed on an annual basis 0.15% of the average daily net asset value of shares of the Funds attributable to or held in the name of a Participating Organization for its clients as compensation for providing services pursuant to an agreement with a Participating Organization. Any amount of such payment not paid during the Funds’ fiscal year for such service activities shall be reimbursed to the Funds as soon as practicable after the end of the fiscal year. Shareholder Services Plan fees are included with distribution and service fees on the Statement of Operations.
7. INDEMNIFICATIONS
Under the Trust’s organizational documents, its officers and Trustees are indemnified against certain liability arising out of the performance of their duties to the Trust. Additionally, in the normal course of business, the Trust enters into contracts with service providers that may contain general indemnification clauses, which may permit indemnification to the extent permissible under applicable laws. The Trust’s maximum exposure under these arrangements is unknown, as this would involve future claims that may be made against the Trust that have not yet occurred.
| | |
| 32 | | www.pathwayadvisorsfunds.com |
| | |
Pathway Advisors Funds | | Report of Independent Registered Public Accounting Firm |
To the Shareholders and Board of Trustees of Financial Investors Trust:
We have audited the accompanying statements of assets and liabilities, including the portfolios of investments, of Pathway Advisors Conservative Fund, Pathway Advisors Growth and Income Fund, and Pathway Advisors Aggressive Growth Fund (the “Funds”), three of the funds constituting Financial Investors Trust, as of April 30, 2013, and the related statements of operations, changes in net assets, and the financial highlights for the period from July 31, 2012 (commencement of operations) to April 30, 2013. These financial statements and financial highlights are the responsibility of the Funds’ management. Our responsibility is to express an opinion on these financial statements and financial highlights based on our audits.
We conducted our audits in accordance with the standards of the Public Company Accounting Oversight Board (United States). Those standards require that we plan and perform the audit to obtain reasonable assurance about whether the financial statements and financial highlights are free of material misstatement. The Funds are not required to have, nor were we engaged to perform, an audit of their internal control over financial reporting. Our audits included consideration of internal control over financial reporting as a basis for designing audit procedures that are appropriate in the circumstances, but not for the purpose of expressing an opinion on the effectiveness of the Funds’ internal control over financial reporting. Accordingly, we express no such opinion. An audit also includes examining, on a test basis, evidence supporting the amounts and disclosures in the financial statements, assessing the accounting principles used and significant estimates made by management, as well as evaluating the overall financial statement presentation. Our procedures included confirmation of securities owned as of April 30, 2013, by correspondence with the custodian and brokers; where replies were not received from brokers, we performed other auditing procedures. We believe that our audits provide a reasonable basis for our opinion.
In our opinion, the financial statements and financial highlights referred to above present fairly, in all material respects, the financial position of Pathway Advisors Conservative Fund, Pathway Advisors Growth and Income Fund, and Pathway Advisors Aggressive Growth Fund as of April 30, 2013, the results of their operations, the changes in their net assets, and the financial highlights for the period from July 31, 2012 (commencement of operations) to April 30, 2013, in conformity with accounting principles generally accepted in the United States of America.
DELOITTE & TOUCHE LLP
Denver, Colorado
June 27, 2013
| | |
| | |
| Annual Report | April 30, 2013 | | 33 |
| | |
| Pathway Advisors Funds | | Additional Information |
| | April 30, 2013 (Unaudited) |
1. FUND HOLDINGS
The Funds file their complete schedule of portfolio holdings with the Securities and Exchange Commission (the “SEC”) for the first and third quarters of each fiscal year on Form N-Q within 60 days after the end of the period. Copies of the Funds’ Form N-Q are available without charge on the SEC website at http://www.sec.gov. You may also review and copy the Form N-Q at the SEC’s Public Reference Room in Washington, DC. For more information about the operation of the Public Reference Room, please call the SEC at 1-800-SEC-0330.
2. FUND PROXY VOTING POLICIES, PROCEDURES AND SUMMARIES
The Funds’ policies and procedures used in determining how to vote proxies and information regarding how the Fund voted proxies relating to portfolio securities during the most recent prior 12-month period ending June 30 are available without charge, (1) upon request, by calling (toll-free) 888-288-1121 and (2) on the SEC’s website at http://www.sec.gov.
3. TAX DESIGNATIONS
The Funds designate the following as a percentage of taxable ordinary income distributions, or up to the maximum amount allowable, for the calendar year ended December 31, 2012:
| | | | | | | | | | |
| | | Dividends Received
Deduction | | Qualified Dividend
Income |
Pathway Advisors Conservative Fund | | | | 0.39 | % | | | | 18.05 | % |
Pathway Advisors Growth and Income Fund | | | | 20.44 | % | | | | 38.02 | % |
Pathway Advisors Aggressive Growth Fund | | | | 24.17 | % | | | | 54.71 | % |
In early 2013, if applicable, shareholders of record received this information for the distributions paid to them by the Funds during the calendar year 2012 via Form 1099. The Funds will notify shareholders in early 2014 of amounts paid to them by the Funds, if any, during the calendar year 2013.
Please consult a tax advisor if you have questions about federal or state income tax laws, or how to prepare your tax returns.
| | |
| 34 | | www.pathwayadvisorsfunds.com |
| | |
| Pathway Advisors Funds | | Trustees & Officers |
| | April 30, 2013 (Unaudited) |
INDEPENDENT TRUSTEES
| | | | | | | | | | |
Name, Address* & Age | | Position(s) Held with Fund | | Term of Office and Length of Time
Served** | | Principal Occupation(s) During Past 5 Years*** | | Number of
Funds in
Fund
Complex
Overseen
by
Trustee**** | | Other Directorships Held by Trustee During Past 5 Years |
Mary K. Anstine, age 72 | | Trustee | | Ms. Anstine was elected at a special meeting of shareholders held on March 21, 1997 and re-elected at a special meeting of shareholders held on August 7, 2009. | | Ms. Anstine was President/Chief Executive Officer of HealthONE Alliance, Denver, Colorado, and former Executive Vice President of First Interstate Bank of Denver. Ms. Anstine is also Trustee/Director of AV Hunter Trust and Colorado Uplift Board. Ms. Anstine was formerly a Director of the Trust Bank of Colorado (later purchased and now known as Northern Trust Bank), HealthONE and Denver Area Council of the Boy Scouts of America, and a member of the American Bankers Association Trust Executive Committee. | | 26 | | Ms. Anstine is a Trustee of ALPS ETF Trust (13 funds); ALPS Variable Investment Trust (7 funds); Reaves Utility Income Fund (1 fund); and Westcore Trust (12 funds). |
John R. Moran, Jr., age 82 | | Trustee | | Mr. Moran was elected at a special meeting of shareholders held on March 21, 1997 and re- elected at a special meeting of shareholders held on August 7, 2009. | | Mr. Moran is formerly President and CEO of The Colorado Trust, a private foundation serving the health and hospital community in the state of Colorado. An attorney, Mr. Moran was formerly a partner with the firm of Kutak Rock & Campbell in Denver, Colorado and a member of the Colorado House of Representatives. Currently, Mr. Moran is a member of the Treasurer’s Investment Advisory Committee for the University of Colorado. | | 26 | | None. |
| * | All communications to Trustees and Officers may be directed to Financial Investors Trust c/o 1290 Broadway, Suite 1100, Denver, CO 80203. |
| ** | This is the period for which the Trustee/Officer began serving the Trust. Each Trustee/Officer serves an indefinite term, until his successor is elected |
| *** | Except as otherwise indicated, each individual has held the office shown or other offices in the same company for the last five years. |
| **** | The Fund Complex includes all series of the Trust (currently 26) and any other investment companies for which Hanson McClain Strategic Advisors, Inc. provides investment advisory services (currently none). |
| | |
| | |
| Annual Report | April 30, 2013 | | 35 |
| | |
| Pathway Advisors Funds | | Trustees & Officers |
| | April 30, 2013 (Unaudited) |
| | | | | | | | | | |
Name,
Address* & Age | | Position(s)
Held with
Fund | | Term of Office and Length of Time
Served** | | Principal Occupation(s) During Past 5 Years*** | | Number of
Funds in
Fund
Complex
Overseen
by
Trustee**** | | Other Directorships Held
by Trustee During
Past 5 Years |
Jeremy W. Deems, age 36 | | Trustee | | Mr. Deems was appointed as a Trustee at the March 11, 2008 meeting of the Board of Trustees and elected at a special meeting of shareholders held on August 7, 2009. | | Mr. Deems is the Co-Founder, Chief Operations Officer and Chief Financial Officer of Green Alpha Advisors, LLC. Prior to joining Green Alpha Advisors, Mr. Deems was CFO and Treasurer of Forward Management, LLC, an investment management company, ReFlow Management Co., LLC, a liquidity resourcing company, ReFlow Fund, LLC, a private investment fund, and Sutton Place Management, LLC, an administrative services company (from 2004 to June 2007). Prior to this, Mr. Deems served as Controller of Forward Management, LLC, ReFlow Management Co., LLC, ReFlow Fund, LLC and Sutton Place Management, LLC. | | 26 | | Mr. Deems is a Trustee of ALPS ETF Trust (13 funds); ALPS Variable Investment Trust (7 funds) and Reaves Utility Income Fund (1 fund). |
Jerry G. Rutledge, age 68 | | Trustee | | Mr. Rutledge was elected at a special meeting of shareholders held on August 7, 2009. | | Mr. Rutledge is the President and owner of Rutledge’s Inc., a retail clothing business. Mr. Rutledge is currently Director of the American National Bank. He was from 1994 to 2007 a Regent of the University of Colorado. | | 26 | | Mr. Rutledge is a Trustee of Clough Global Allocation Fund (1 fund), Clough Global Equity Fund (1 fund) and Clough Global Opportunities Fund (1 fund). |
| | |
| | |
| 36 | | www.pathwayadvisorsfunds.com |
| | |
Pathway Advisors Funds | | Trustees & Officers |
| | April 30, 2013 (Unaudited) |
| | | | | | | | | | |
Name,
Address* & Age | | Position(s)
Held with
Fund | | Term of Office and Length of Time
Served** | | Principal Occupation(s) During Past 5 Years*** | | Number of
Funds in
Fund
Complex
Overseen by
Trustee**** | | Other Directorships Held
by Trustee During
Past 5 Years |
Michael “Ross” Shell, age 42 | | Trustee | | Mr. Shell was elected at a special meeting of shareholders held on August 7, 2009. | | Mr. Shell is Founder and CEO* of Red Idea, LLC, a strategic consulting/early stage venture firm (since June 2008). From 1999 to 2009, he was a part-owner and Director of Tesser, Inc., a brand agency. From December 2005 to May 2008, he was Director, Marketing and Investor Relations, of Woodbourne, a REIT/real estate hedge fund and private equity firm. Prior to this, from May 2004 to November 2005, he worked as a business strategy consultant; from June 2003 to April 2004, he was on the Global Client Services team of IDEO, a product design/innovation firm; and from 1999 to 2003, he was President of Tesser, Inc. Mr. Shell graduated with honors from Stanford University with a degree in Political Science. | | 26 | | None. |
| * | All communications to Trustees and Officers may be directed to Financial Investors Trust c/o 1290 Broadway, Suite 1100, Denver, CO 80203. |
| ** | This is the period for which the Trustee/Officer began serving the Trust. Each Trustee/Officer serves an indefinite term, until his successor is elected |
| *** | Except as otherwise indicated, each individual has held the office shown or other offices in the same company for the last five years. |
| **** | The Fund Complex includes all series of the Trust (currently 26) and any other investment companies for which Hanson McClain Strategic Advisors, Inc. provides investment advisory services (currently none). |
| | |
| | |
| Annual Report | April 30, 2013 | | 37 |
| | |
| Pathway Advisors Funds | | Trustees & Officers |
| | April 30, 2013 (Unaudited) |
INTERESTED TRUSTEE
| | | | | | | | | | |
Name, Address* & Age | | Position(s) Held with Fund | | Term of Office and Length of Time Served** | | Principal Occupation(s) During Past 5 Years*** | | Number of Funds in
Fund
Complex
Overseen
by
Trustee**** | | Other Directorships
Held by Trustee
During Past 5 Years |
Edmund J. Burke, age 52 | | Trustee,
Chairman
and
President | | Mr. Burke was elected as Chairman at the August 28, 2009 meeting of the Board of Trustees. Mr. Burke was elected as Trustee at a special meeting of shareholders held on August 7, 2009. Mr. Burke was elected President of the Trust at the December 17, 2002 meeting of the Board of Trustees. | | Mr. Burke is President and a Director of ALPS Holdings, Inc. (“AHI”) (since 2005) and Director of ALPS Advisors, Inc. (“AAI”), ALPS Distributors, Inc. (“ADI”), ALPS Fund Services, Inc. (“AFS”) and ALPS Portfolio Solutions Distributor, Inc. (“APSD”) and from 2001-2008, was President of AAI, ADI, AFS and APSD. Because of his positions with AHI, AAI, ADI, AFS and APSD, Mr. Burke is deemed an affiliate of the Trust as defined under the 1940 Act. Mr. Burke is Trustee and President of the Clough Global Allocation Fund (Trustee since 2006; President since 2004); Trustee and President of the Clough Global Equity Fund (Trustee since 2006; President since 2005); Trustee and President of the Clough Global Opportunities Fund (since 2006); Trustee of the Liberty All-Star Equity Fund; and Director of the Liberty All-Star Growth Fund, Inc. | | 26 | | Mr. Burke is a Trustee of Clough Global Allocation Fund (1 fund); Clough Global Equity Fund (1 fund); Clough Global Opportunities Fund (1 fund); Trustee of the Liberty All-Star Equity Fund (1fund); and Director of the Liberty All-Star Growth Fund, Inc. (1 fund). |
| | |
| | |
| 38 | | www.pathwayadvisorsfunds.com |
| | |
| Pathway Advisors Funds | | Trustees & Officers |
| | April 30, 2013 (Unaudited) |
OFFICERS
| | | | | | |
Name,
Address* & Age | | Position(s)
Held with
Fund | | Term of Office and Length of Time Served** | | Principal Occupation(s) During Past 5 Years*** |
Kimberly R. Storms, age 40 | | Treasurer | | Ms. Storms was elected Treasurer of the Trust at the March 12, 2013 meeting of the Board of Trustees. | | Ms. Storms is Senior Vice President - Director of Fund Administration of ALPS. Ms. Storms joined ALPS in 1998 as Assistant Controller. Because of her position with ALPS, Ms. Storms is deemed an affiliate of the Trust as defined under the 1940 Act. Ms. Storms is also Treasurer of BPV Family of Funds and ALPS Series Trust; Assistant Treasurer of Liberty All-Star Equity Fund and Liberty All-Star Growth Fund, Inc.; Assistant Treasurer of Tilson Funds; and Chief Financial Officer of The Arbitrage Funds. |
David T. Buhler, age 41 | | Secretary | | Mr. Buhler was elected Secretary of the Trust at the September 11, 2012 meeting of the Board of Trustees. | | Mr. Buhler joined ALPS in June 2010, and is currently Vice President and Associate Counsel of ALPS, AAI, ADI and APSD. Prior to joining ALPS, Mr. Buhler served as Associate General Counsel and Assistant Secretary of Founders Asset Management LLC from 2006 to 2009. Because of his position with ALPS, Mr. Buhler is deemed an affiliate of the Trust as defined under the 1940 Act. Mr. Buhler is also the Secretary of ALPS Variable Investment Trust and Westcore Trust. |
Ted Uhl, age 37 | | Chief Compliance Officer (“CCO”) | | Mr. Uhl was appointed CCO of the Trust at the June 8, 2010 meeting of the Board of Trustees. | | Mr. Uhl joined ALPS in October 2006, and is currently Deputy Compliance Officer of ALPS. Prior to his current role, Mr. Uhl served as Senior Risk Manager for ALPS from October 2006 until June 2010. Before joining ALPS, Mr. Uhl served a Sr. Analyst with Enenbach and Associates (RIA), and a Sr. Financial Analyst at Sprint. Because of his position with ALPS, Mr. Uhl is deemed an affiliate of the Trust as defined under the 1940 Act. Mr. Uhl is also CCO of the Clough Global Funds, Reaves Utility Income Fund, Drexel Hamilton Funds and Transparent Value Trust. |
| * | All communications to Trustees and Officers may be directed to Financial Investors Trust c/o 1290 Broadway, Suite 1100, Denver, CO 80203. |
| ** | This is the period for which the Trustee/Officer began serving the Trust. Each Trustee/Officer serves an indefinite term, until his successor is elected |
| *** | Except as otherwise indicated, each individual has held the office shown or other offices in the same company for the last five years. |
| **** | The Fund Complex includes all series of the Trust (currently 26) and any other investment companies for which Hanson McClain Strategic Advisors, Inc. provides investment advisory services (currently none). |
| | |
| | |
| Annual Report | April 30, 2013 | | 39 |

| | |
 | | TABLEOF CONTENTS |
| | |
| | |
| Redmont Funds | | Shareholder Letter |
| | April 30, 2013 (Unaudited) |
Introduction:
Equity markets around the world continued their meteoric rise, led by the S&P 500 which gained nearly 17 percent during the previous twelve months. It is extremely difficult to reconcile the performance of the capital markets with a world which continues to struggle with a difficult macro-economic environment. It is not unusual for capital markets to perform well during difficult economic times. Strong markets can occur in a variety of economic environments. For instance, a rising market might result from investors’ anticipation of a robust economic recovery prior to the economy’s actual move into a new growth phase. On the other end of the spectrum, investors can fail to properly account for the difficult environment – leading to declining markets once the economic difficulties begin to be properly reflected in security prices. Highland’s position is that the latter is more probable than the former. Consequently, we believe that investors ought to begin to position their portfolios for more difficult and volatile markets. Given the wide range of potential outcomes, how one positions for this type of market is a difficult proposition. It is our opinion that volatility can often erode an investor’s ability to make sound investment decisions. We believe Ben Graham (Economist and Investor) and Warren Buffet (Chairman of Berkshire Hathaway) would describe this as “emotional corrosion” and believe that very few individuals have the ability to remain emotionally strong during volatile markets. Today’s global uncertainty and the resulting elevated expectation for volatility going forward places an increasing importance of hedged equity exposure in a portfolio. For more a more detailed view of our market outlook, please visit our advisor website (www.highlandassoc.com).
Performance Discussion:
REDMONT RESOLUTE FUND I
Table 1 notes the performance for Fund I as of quarter end under standard reporting (since inception) as well as of April 30th with the since inception being since initial funding on January 17, 2012.
Table 1 i .ii. iii. iv. v. vi.
Performance (amounts greater than one year are annualized)
| | | | | | | | | | | | |
| Redmont Resolute Fund I | | Standardized Performance Data As of March 31, 2013 | | Non-Standardized Performance Data As of April 30, 2013 |
| | | YTD | | 1-Year | | Since Inception
(12/30/11) | | Year-to-
Date | | 1-Year | | Since Funding
(1/17/2012) |
Resolute Fund I - I Class | | 3.05% | | 3.28% | | 4.17% | | 4.62% | | 4.96% | | 5.10% |
Resolute Fund I - A Class | | 2.96% | | 2.53% | | 3.81% | | 4.73% | | 4.81% | | 0.56% |
Load Adjusted | | -2.70% | | -2.61% | | -0.77% | | -1.02% | | -0.94% | | 4.96% |
HFRX Global Index | | 3.13% | | 3.50% | | 5.37% | | 3.60% | | 3.85% | | 20.59% |
S&P 500 Index | | 10.61% | | 13.96% | | 22.07% | | 12.74% | | 16.89% | | 0.56% |
Morningstar Multi-Alternative Universe | | 1.71% | | 2.62% | | 4.14% | | 2.45% | | 3.83% | | 3.87% |
| | | Gross Expense
Ratio | | Less Expense
Waivers | | Net Expense
Ratio | | Net Ratio ex Dividend & Short Expense* |
Resolute Fund I – I Class | | 3.58% | | -0.78% | | 2.80% | | | | 2.60% | | |
Resolute Fund I – A Class | | 3.98% | | -0.78% | | 3.20% | | | | 3.00% | | |
*Expense ratios per current prospectus dated March 31, 2013.
This performance analysis section shows the fund’s historical performance. Past performance is not indicative of future results. Investment return and value of shares will fluctuate. Upon redemption, shares may be worth more or less than their original cost. The current performance may be higher or lower than the quoted performance. Call 1-855-268-2242 or visit www.redmontfunds.com for the most recent month end performance results. The Fund has a redemption fee of 2.00% for shares redeemed within the first 90 days of purchase. Maximum Offering Price (MOP) for Class A includes the Fund’s maximum sales charge of 5.50%. Performance shown at NAV does not include these sales charges and would have been lower had it been taken into account.
Fund I outperformed the HFRX Global Index by approximately 100 basis pointsvii. (depending on the share class) over the twelve months ending April 30, 2013. Since inception, the Fund has outperformed the HFRX Global Index during strong equity markets and underperformed the Index during market declines. The main factor driving that performance profile is the Fund’s higher level of net equity exposure relative to the HFRX Global Index. As we have discussed in previous letters, the Fund seeks to perform in line with the equity markets over time with less volatility. In order to accomplish this objective, the Fund must maintain a minimum level of net equity exposure or it will not be able to keep up enough in strong markets. Though hedge fund exposure can vary greatly over time, we anticipate outperforming the Index in up markets and underperforming in down markets and to outperform the Index over a full market cycle.
| | |
| Annual Report | April 30, 2013 | | 1 |
| | |
| Redmont Funds | | Shareholder Letter |
| | April 30, 2013 (Unaudited) |
Relative to the S&P 500, the Fund has performed as we expected - participating but trailing in strong up markets while generally protecting capital (not experiencing as negative a return as the index) and outperforming in negative markets.
When compared to the peer group (Morningstar MultiAlternative Universe), the Fund has outperformed the Universe over all time periods – by over 200 basis points year-to-date and approximately 100 basis points over the longer term. As with the HFRX Global Index, the Universe is very diverse and contains a number of market-neutral and other low net equity strategies that cause the average net equity exposure for the Universe to be considerably less than our Fund. So we anticipate outperforming the Universe in up markets and underperforming in down markets - recent performance has been consistent with our expectations.
REDMONT RESOLUTE FUND II
Table 2 notes the performance for Fund II as of quarter end under standard reporting (since inception) as well as of April 30th with the since inception being since initial funding on January 6, 2012.
Table 2 i. ii. iii. iv. v. vi.
Performance (amounts greater than one year are annualized)
| | | | | | | | | | | | |
| Redmont Resolute Fund II | | Standardized Performance Data As of March 31, 2013 | | Non-Standardized Performance Data As of April 30, 2013 |
| | | YTD | | 1-Year | | Since Inception
(12/30/11) | | Year-to-
Date | | 1-Year | | Since Funding (1/6/12) |
Resolute Fund II - I Class | | 4.02% | | 3.28% | | 7.52% | | 5.74% | | 7.65% | | 8.37% |
HFRX Global Index | | 3.13% | | 2.53% | | 5.37% | | 3.60% | | 3.85% | | 4.96% |
S&P 500 Index | | 10.61% | | -2.61% | | 22.07% | | 12.74% | | 16.89% | | 20.59% |
Morningstar Multi-Alternative Universe | | 1.71% | | 3.50% | | 4.14% | | 2.45% | | 3.83% | | 3.88% |
| | | Gross Expense
Ratio | | Less Expense
Waivers | | Net Expense
Ratio | | Net Ratio ex Dividend & Short Expense* |
Resolute Fund II – I Class | | 2.96% | | -1.28% | | 1.68% | | | | 1.48% | | |
*Expense ratio per current prospectus dated March 31, 2013.
This performance analysis section shows the fund’s historical performance. Past performance is not indicative of future results. Investment return and value of shares will fluctuate. Upon redemption, shares may be worth more or less than their original cost. The current performance may be higher or lower than the quoted performance. Call 1-855-268-2242 or visit www.redmontfunds.com for the most recent month end performance results. The Fund has a redemption fee of 2.00% for shares redeemed within the first 90 days of purchase. Performance shown at NAV does not include these sales charges and would have been lower had it been taken into account.
Fund II outperformed the HFRX Global Index by nearly 400 basis points over the twelve months ending April 30, 2013. Since inception, the Fund has outperformed the HFRX Global Index during strong equity markets underperformed the Index during market declines. The main factor driving that performance profile is the Fund’s higher level of net equity exposure relative to the HFRX Global Index. As we have discussed in previous letters, the Fund seeks to perform in line with the equity markets over time with less volatility. In order to accomplish this objective, the Fund must maintain a minimum level of net equity exposure or it will not be able to keep up enough in strong markets. Though hedge fund exposure can vary greatly over time, we anticipate outperforming the Index in up markets and underperforming in down markets and to outperform the Index over a full market cycle.
Relative to the S&P 500, the Fund has performed as we expected - participating but trailing in strong up markets while protecting capital and outperforming in negative markets.
When compared to the peer group (Morningstar MultiAlternative Universe), the Fund has outperformed the Universe over all time periods – by over 300 basis points year-to-date, nearly 400 basis points over the trailing twelve months and approximately 450 basis points since funding. As with the HFRX Global Index, the Universe is very diverse and contains a number of market-neutral and other low net equity strategies that cause the average net equity exposure for the Universe to be considerably less than our Fund. So we anticipate outperforming the Universe in up markets and underperforming in down markets - recent performance has been consistent with our expectations.
| | |
| Redmont Funds | | Shareholder Letter |
| | April 30, 2013 (Unaudited) |
Underlying Allocation Weights & Performance:
The Fund consists of three main asset classes:
| | — | | Tactical Asset Allocation viii. - with three underlying funds; |
| | — | | Long/Short Equity ix.- with four underlying funds; and |
| | — | | Opportunistic/Other x.- with four underlying funds. |
The Fund began the fiscal year (May 1, 2012) with a target weight of 40% in Tactical with three underlying funds, 40% in Long/Short with four funds, and 20% in Opportunistic with two managers that each have two funds (for a total of four funds). During the middle of May 2012, we changed the allocation by reducing the Tactical exposure and increasing the Opportunistic/Other exposure. In general, the Tactical allocation will have the highest level of net equity exposure while the Opportunistic/Other allocation will have the lowest level of net equity exposure. These changes were intended to lower the overall net equity exposure of the Fund and were based on the following reasons:
| | — | | Valuations: equity market returns had been very strong for the preceding six months and, using our internal valuation models, valuations were roughly at their long-term average (the equity markets have continued to rise and our concerns over valuations remain); |
| | — | | Economic uncertainty: we believe the increasing uncertainty and economic challenges will pressure investor sentiment and the equity markets for the foreseeable future (uncertainty remains in the United States as well as around the globe despite the continued rise in equities); and |
| | — | | Government Policies: we believe the policies being pursued around the globe are producing a higher level of regulation, austerity, and a generally higher level of taxes – these shifts illustrate the very real challenges countries around the globe are dealing with coming out of the financial crisis in 2008 (this trend continues to be a concern). |
The combination of factors listed above caused us to reposition the portfolio more conservatively. If the valuation picture improves, we would expect to reallocate closer to our long-term target allocation of 40/40/20.
Figure 1 lists the long-term target asset allocation for the Funds as well as the allocation for Fund I and Fund II as of April 30th.
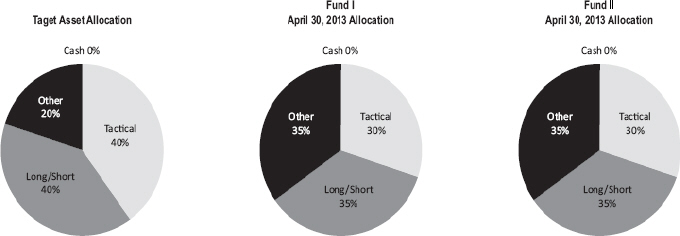
Holdings and allocations subject to change.
All three allocations performed well over the trailing twelve months. The underlying funds’ performance varied as expected with the funds with a higher net exposure outperforming the funds with a lower net exposure. Long/Short and Tactical were the leading contributors each providing about 35% of the Fund’s return during the trailing twelve months. Opportunistic funds did not perform quite as strongly (which is to be expected given their more defensive nature) and provided the remaining 30% of the Fund’s return during the trailing twelve months.
| | |
| Annual Report | April 30, 2013 | | 3 |
| | |
| Redmont Funds | | Shareholder Letter |
| | April 30, 2013 (Unaudited) |
Closing:
We appreciate your investment in the Redmont Resolute Fund. Please feel free to contact us with any questions.
Sincerely,

R. Scott Graham, CFA & Michael T. Lytle, CFA
Portfolio Managers xi.
IMPORTANT NOTES AND DISCLOSURES
The Funds’ investment objectives, risks, charges and expenses must be considered before investing. The prospectus contains this and other important information about the investment company, and may be obtained by calling 1-855-268-2242 or by visiting www.redmontfunds.com. Read it carefully before investing.
The views and information discussed in this commentary are as of the date of publication, are subject to change, and may not reflect the writer’s current views. The views expressed represent an assessment of market conditions at a specific point in time, are opinions only and should not be relied upon as investment advice regarding a particular investment or markets in general. Such information does not constitute a recommendation to buy or sell specific securities or investment vehicles. It should not be assumed that any investment will be profitable or will equal the performance of the Funds or any securities or any sectors mentioned herein. The subject matter contained herein has been derived from several sources believed to be reliable and accurate at the time of compilation. The Funds do not accept any liability for losses either direct or consequential caused by th use of this information.
RISKS:
The Funds currently pursue their objective by primarily allocating their assets among investment sub-advisers who manage alternative or hedging investment strategies, and other open-end investment companies that use alternative or hedging strategies. There are certain risks associated with the use of a fund-of-funds structure. These risks include, but are not limited to higher expenses, allocation risk, underlying fund risk, and transparency risk. Investments such as mutual funds which focus on alternative strategies are subject to increased risk and loss of principal and are not suitable for all investors.
The Funds’ investments may subject the Funds to significantly greater volatility than investments in traditional securities and involve substantial risks, including risk of a significant portion on their principal value. The commodities markets and the prices of various commodities may fluctuate widely based on a variety of factors. Because the Funds’ performance is linked to the performance of highly volatile commodities, investors should consider purchasing shares of the Funds only as part of an overall diversified portfolio and should be willing to assume the risks of potentially significant fluctuations in the value of the Funds. Additional risks of Commodity Futures-Linked Investments include liquidity risk and counterparty credit risk.
Another principal risk of investing in the Funds are equity risk, which is the risk that the value of the securities held by the Funds will fall due to general market and economic conditions, perceptions regarding the industries in which the issuers of securities held by the Funds participate or factors relating to specific companies in which the Funds invest.
The Funds’ investments in non-U.S. issuers may be even more volatile and may present more risks than investments in U.S. issuers. The Funds are new and has a limited operating history. Equity investments in commodity-related companies may not move in the same direction and to the same extent as the underlying commodities.
The Funds are not suitable for all investors. Subject to investment risks, including possible loss of the principal amount invested.
| ii. | The HFRX Global Index is designed to be representative of the overall composition of the hedge fund universe, and includes convertible arbitrage, distressed securities, equity hedge, equity market neutral, event driven, macro, merger arbitrage, and relative value strategies. Investors cannot invest directly in an index. |
| iii. | The S&P 500 Index is an unmanaged index of 500 common stocks chosen for market size, liquidity, and industry group representation. It is a market-value weighted index. The S&P 500 Index figures do not reflect any fees, expenses, or taxes. Investors cannot invest directly in this index. |
| iv. | The Morningstar Multi-Alternative Universe is designed to represent the exposure to alternative investment tactics. Funds in this category have the majority of their assets exposed to alternative strategies. An investor’s exposure to different tactics may change slightly over time in |
| | |
| Redmont Funds | | Shareholder Letter |
| | April 30, 2013 (Unaudited) |
response to market movements. Funds in this category include both funds with static allocations to alternative strategies and funds tactically allocating among alternative strategies and asset classes. The gross short exposure is greater than 20%.
| v. | Performance since funding is calculated at the Fund’s net asset value (NAV) and is from January 17, 2012. This is the date in which the Fund received sufficient cash flow to invest the Fund in the underlying investments. Performance is also shown as of the actual inception/launch of the Fund on December 30, 2011. However, the Fund was invested in money markets from December 30, 2011 through January 17, 2012 until the initial cash flows were received. The Fund’s NAV remained at $10.00 from inception date to funding date; therefore, the return of the Fund during this period was 0.00%. |
| vi. | The expense ratio includes fees and expenses associated with acquired funds, which are based on estimated amounts for the current fiscal year. Please see the prospectus for a full disclosure of fees and expenses. Highland Associates, Inc. (the “Adviser”) has agreed, with respect to the Redmont Resolute Fund I’s Class A and Class I shares, contractually to waive the portion of its 1.50% Management Fee in excess of the sum of 0.50% plus any sub-advisory fees paid by the Adviser to sub-advisors in connection with the Fund, and/or reimburse the Fund(or class, as applicable) by the amount of such excess. In addition, after giving effect to the foregoing fee waiver and/or expense reimbursement for the Fund’s Class A and Class I shares, to the extent the Fund’s total annual expenses (exclusive of Distribution and Service (12b-1) Fees, Shareholder Services Fees, Acquired Fund Fees and Expenses, Sub-Advisory Fees, brokerage expenses, interest expense, taxes and extraordinary expenses) exceed 1.90% of Fund I’s average daily net assets, the Adviser has contractually agreed to reduce the fee payable with respect to Fund I by the extent of such excess, and/or shall reimburse Fund I (or class, as applicable) by the amount of such excess. The Adviser will be permitted to recover, on a class-by-class basis, expenses it has borne through the agreement to the extent that the Funds’ expenses in later periods fall below the annual rates set forth in the relevant agreement. The Funds will not be obligated to pay any such deferred fees and expenses more than three years after the end of the fiscal year in which the fees and expense were deferred. With respect to Redmont Resolute Fund II, the Adviser has agreed to waive Fund II’s Class I share portion of its 1.50% Management Fee in excess of any sub-advisory fees paid by the Adviser to sub-advisors in connection with Fund II. The fee waivers and/or expense reimbursements for the Funds are in effect through August 31, 2017. The Adviser may not discontinue this agreement to waive fees and/or reimburse expenses without the approval by the Funds’ Board of Trustees. |
| vii. | Basis Point = 0.01%, 100 basis points would equal 1.0% |
| viii. | The tactical asset allocation strategy is designed to provide investors with fluid exposure to global markets including primarily cash, fixed income, and equities. |
| ix. | The long/short equity strategy is designed to provide investors with hedged equity exposure using both fundamental and quantitative analysis. |
| x. | The other strategies allocation is designed to provide investors with exposure that has a lower correlation with the other segments of the Fund. The classification consists of but is not limited to trading strategies, managed futures, arbitrage, distressed securities, etc. |
| xi. | ALPS Distributors, Inc. is the distributor for the Redmont Funds. R. Scott Graham and Michael T. Lytle are registered representatives of ALPS Distributors, Inc. CFA Institute Marks are trademarks owned by the CFA Institute. |
| | |
| Annual Report | April 30, 2013 | | 5 |
| | |
| Redmont Resolute Fund I | | Performance Update |
| | April 30, 2013 |
Performance (for the period ended April 30, 2013)
Redmont Resolute Fund I
| | | | | | |
Cumulative Total Return (for the period ended April 30, 2013) | | Year-to-Date | | 1 Year | | Since Inception* |
|
Class A (NAV)(a) | | 4.73% | | 4.81% | | 4.90% |
|
Class I (NAV) | | 4.62% | | 4.96% | | 5.09% |
|
S&P 500® Total Return Index(b) | | 12.74% | | 16.89% | | 22.28% |
|
Dow Jones U.S. Select Dividend Index(c) | | 15.41% | | 20.15% | | 20.27% |
|
HFRX Global Hedge Fund Index(d) | | 3.77% | | 4.02% | | 5.51% |
|
| (a) | Net Asset Value (NAV) is the share price without sales charges. |
| (b) | The S&P 500® Total Return Index is the Standard & Poor’s composite index of 500 stocks, a widely recognized, unmanaged index of common stock prices. The index is not actively managed and does not reflect any deduction of fees, expenses or taxes. An investor may not invest directly in an index. |
| (c) | The Dow Jones U.S. Select Dividend Index represents the country’s top stocks by dividend yield, selected annually and subject to screening and buffering criteria. The index is not actively managed and does not reflect any deductions of fees, expenses or taxes. An investor may not invest directly in an index. |
| (d) | The HFRX Global Index is designed to be representative of the overall composition of the hedge fund universe, and includes convertible arbitrage, distressed securities, equity hedge, equity market neutral, event driven, macro, merger arbitrage, and relative value strategies. The index is not actively managed and does not reflect any deduction of fees, expenses or taxes. An investor may not invest directly in an index. |
Performance data quoted represents past performance. Past performance does not guarantee future results. Investment return and principal value of an investment will fluctuate so that an investor’s shares, when sold or redeemed, may be worth more or less than the original cost. Current performance data may be higher or lower than actual data quoted. For the most current month-end performance data please call 1-855-268-2242.
The table does not reflect the deduction of taxes that a shareholder would pay on Fund distributions or the redemption of Fund shares.
* Fund inception date of 12/30/11.
Performance of $10,000 Initial Investment (for the period ended April 30, 2013) Comparison of change in value of a $10,000 investment (includes applicable sales loads)
| | | | |
| | | Top Ten Holdings* (for the period ended April 30, 2013) |
| | As a percentage of Net Assets |
| | AQR Risk Parity Fund, Class I | | 12.57% |
| | |
| | AQR Multi Strategy Alternative Fund, Class I | | 12.39% |
| | |
| | PIMCO Global Multi-Asset Fund, Institutional Class | | 12.04% |
| | |
| | BlackRock Global Allocation Fund, Inc., Class I | | 9.00% |
| | |
| | FPA Crescent Fund | | 8.98% |
| | |
| | Robeco Boston Partners Long/Short Research Fund, Institutional Class | | 8.73% |
| | |
| | Diamond Hill Long-Short Fund, Class Y | | 8.71% |
| | |
| | MainStay Marketfield Fund | | 8.70% |
| | |
| | Turner Spectrum Fund, Institutional Class | | 8.69% |
| | |
| | ASG Managed Futures Strategy Fund, Class A | | 5.17% |
| | |
| | Top Ten Holdings | | 94.98% |
| | * Holdings are subject to change. Table presents indicative values only. |
| | | |
| | | |
| | | |
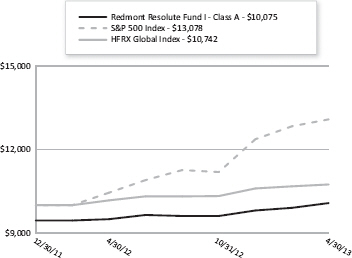
The chart represents historical performance of a hypothetical investment of $10,000 in the Fund since inception. Past performance does not guarantee future results. This chart does not reflect the deduction of taxes that a shareholder would pay on Fund distributions or the redemption of Fund shares.
| | |
| Redmont Resolute Fund II | | Performance Update |
| | April 30, 2013 |
Performance (for the period ended April 30, 2013)
Redmont Resolute Fund II
| | | | | | |
Cumulative Total Return (for the period ended April 30, 2013) | | | | | | |
| | Year-to-Date | | 1 Year | | Since Inception* |
|
Class I (NAV) | | 5.74% | | 7.65% | | 8.36% |
|
S&P 500® Total Return Index(a) | | 12.74% | | 16.89% | | 22.28% |
|
Dow Jones U.S. Select Dividend Index(b) | | 15.41% | | 20.15% | | 20.27% |
|
HFRX Global Hedge Fund Index(c) | | 3.77% | | 4.02% | | 5.51% |
|
| (a) | The S&P 500® Total Return Index is the Standard & Poor’s composite index of 500 stocks, a widely recognized, unmanaged index of common stock prices. The index is not actively managed and does not reflect any deduction of fees, expenses or taxes. An investor may not invest directly in an index |
| (b) | The Dow Jones U.S. Select Dividend Index represents the country’s top stocks by dividend yield, selected annually and subject to screening and buffering criteria. The index is not actively managed and does not reflect any deductions of fees, expenses or taxes. An investor may not invest directly in an index. |
| (c) | The HFRX Global Index is designed to be representative of the overall composition of the hedge fund universe and includes convertible arbitrage, distressed securities, equity hedge, equity market neutral, event driven, macro, merger arbitrage and relative value strategies. The index is not actively managed and does not reflect any deduction of fees, expenses or taxes. An investor may not invest directly in an index. |
Performance data quoted represents past performance. Past performance does not guarantee future results. Investment return and principal value of an investment will fluctuate so that an investor’s shares, when sold or redeemed, may be worth more or less than the original cost. Current performance data may be higher or lower than actual data quoted. For the most current month-end performance data please call 1-855-268-2242.
The table does not reflect the deduction of taxes that a shareholder would pay on Fund distributions or the redemption of Fund shares.
* Fund inception date of 12/30/11.
Performance of $10,000 Initial Investment (for the period ended April 30, 2013) Comparison of change in value of a $10,000 investment
| | | | |
| | | Top Ten Holdings* (for the period ended April 30, 2013) |
| | As a percentage of Net Assets |
| | AQR Risk Parity Fund, Class I | | 15.08% |
| | |
| | AQR Multi Strategy Alternative Fund, Class I | | 14.99% |
| | |
| | PIMCO Global Multi-Asset Fund, Institutional Class | | 11.95% |
| | |
| | BlackRock Global Allocation Fund, Inc., Class I | | 8.90% |
| | |
| | FPA Crescent Fund | | 8.86% |
| | |
| | MainStay Marketfield Fund | | 8.59% |
| | |
| | Robeco Boston Partners Long/Short Research Fund, Institutional Class | | 8.55% |
| | |
| | Diamond Hill Long-Short Fund, Class Y | | 8.54% |
| | |
| | Turner Spectrum Fund, Institutional Class | | 8.45% |
| | |
| | ASG Managed Futures Strategy Fund, Class Y | | 4.06% |
| | |
| | Top Ten Holdings | | 97.97% |
| | | * Holdings are subject to change.
Table presents indicative values
only. |
| | | |
| | | |
| | | |
| | | |
| | | |
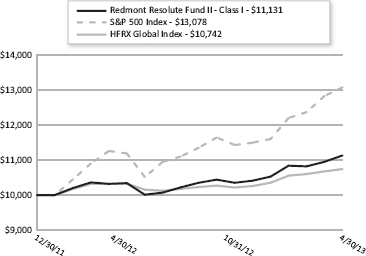
The chart represents historical performance of a hypothetical investment of $10,000 in the Fund since inception. Past performance does not guarantee future results. This chart does not reflect the deduction of taxes that a shareholder would pay on Fund distributions or the redemption of Fund shares.
| | |
| Annual Report | April 30, 2013 | | 7 |
| | |
| Redmont Funds | | Disclosure of Fund Expenses |
| | April 30, 2013 (Unaudited) |
As a shareholder of the Funds, you incur two types of costs: (1) transaction costs, including applicable sales charges (loads), redemption fees, wire fees and low balance fees; and (2) ongoing costs, including management fees, distribution and service (12b-1) fees, shareholder services fees and other Fund expenses. This example is intended to help you understand your indirect costs, also referred to as “ongoing costs” (in dollars), of investing in the Fund and to compare these costs with the ongoing costs of investing in other mutual funds.
This example is based on an investment of $1,000 invested at the beginning of the period and held for the six-month period of November 1, 2012 through April 30, 2013.
Actual Expenses The first line of the table below provides information about actual account values and actual expenses. You may use the information in this line, together with the amount you invested at the beginning of the period, to estimate the expenses that you paid over the period. Simply divide your account value by $1,000 (for example, an $8,600 account value divided by $1,000 = 8.6), then multiply the result by the number in the first line under the heading “Expenses Paid During Period” to estimate the expenses you paid on your account during this period.
Hypothetical Example for Comparison Purposes The second line of the table provides information about hypothetical account values and hypothetical expenses based on the Fund’s actual expense ratio and an assumed rate of return of 5% per year before expenses, which is not the Fund’s actual return. The hypothetical account values and expenses may not be used to estimate the actual ending account balance or expenses you paid for the period. You may use this information to compare ongoing costs of investing in the Fund and other funds. To do so, compare this 5% hypothetical example with the 5% hypothetical examples that appear in the shareholder reports of other funds.
Please note that the expenses shown in the table are meant to highlight your ongoing costs only and do not reflect any transactional costs, such as applicable sales charges (loads), redemption fees, wire fees and low balance fees. Therefore, the second line of the table is useful in comparing ongoing costs only and will not help you determine the relative total costs of owning different funds. In addition, if these transaction costs were included, your costs would be higher.
| | | | | | | | | | | | | | |
| | | BEGINNING | | | ENDING | | | | | EXPENSES PAID | |
| | | ACCOUNT VALUE | | | ACCOUNT VALUE | | | EXPENSE | | DURING PERIOD | |
| | | 11/01/12 | | | 04/30/13 | | | RATIO(a) | | 11/01/12-04/30/13(b) | |
Redmont Resolute Fund I | | | | | | | | | | | | | | |
| |
Class A | | | | | | | | | | | | | | |
Actual | | $ | 1,000.00 | | | $ | 1,061.70 | | | 2.30% | | $ | 11.76 | |
Hypothetical (5% return before expenses) | | $ | 1,000.00 | | | $ | 1,013.39 | | | 2.30% | | $ | 11.48 | |
| | | | | | | | | | | | | | |
| |
Class I | | | | | | | | | | | | | | |
Actual | | $ | 1,000.00 | | | $ | 1,061.10 | | | 1.90% | | $ | 9.71 | |
Hypothetical (5% return before expenses) | | $ | 1,000.00 | | | $ | 1,015.37 | | | 1.90% | | $ | 9.49 | |
| | | | |
Redmont Resolute Fund II | | | | | | | | | | | | | | |
| |
Class I | | | | | | | | | | | | | | |
Actual | | $ | 1,000.00 | | | $ | 1,075.50 | | | 0.19% | | $ | 0.98 | |
Hypothetical (5% return before expenses) | | $ | 1,000.00 | | | $ | 1,023.85 | | | 0.19% | | $ | 0.95 | |
| (a) | Annualized, based on the Fund’s most recent fiscal half year expenses. |
| (b) | Expenses are equal to the Fund’s annualized expense ratio multiplied by the number of days in the most recent fiscal half year (181), then divided by 365. |
| | |
| Redmont Resolute Fund I | | Schedule of Investments |
| | April 30, 2013 |
| | | | | | | | | | |
| | | | | | | | Value | |
| Description | | | | Shares | | | (Note 2) | |
| |
OPEN-END MUTUAL FUNDS (99.95%) | | | | | | | | | | |
AQR Multi Strategy Alternative Fund, Class I | | | | | 39,209 | | | $ | 398,362 | |
AQR Risk Parity Fund, Class I | | | | | 32,978 | | | | 404,310 | |
ASG Diversifying Strategies Fund, Class A(a) | | | | | 17,594 | | | | 160,102 | |
ASG Managed Futures Strategy Fund, Class A | | | | | 16,609 | | | | 166,427 | |
BlackRock Global Allocation Fund, Inc., Class I | | | | | 13,701 | | | | 289,630 | |
Diamond Hill Long-Short Fund, Class Y | | | | | 13,932 | | | | 280,033 | |
FPA Crescent Fund | | | | | 9,428 | | | | 288,861 | |
MainStay Marketfield Fund | | | | | 16,772 | | | | 279,757 | |
PIMCO Global Multi-Asset Fund, Institutional Class | | | | | 33,175 | | | | 387,158 | |
Robeco Boston Partners Long/Short Research Fund, Institutional Class | | | | | 21,777 | | | | 280,707 | |
Turner Spectrum Fund, Institutional Class(a) | | | | | 25,261 | | | | 279,383 | |
| | | | | | | | | | |
| | | | | | | | | 3,214,730 | |
| | | | | | | | | | |
| | | |
TOTAL OPEN-END MUTUAL FUNDS (Cost $3,040,037) | | | | | | | | | 3,214,730 | |
| |
| | | |
| | | | | | | | Value | |
| | | 7-Day Yield | | Shares | | | (Note 2) | |
| |
SHORT TERM INVESTMENTS (0.11%) | | | | | | | | | | |
Dreyfus Treasury Cash Management Fund, Institutional Class | | 0.010% | | | 3,507 | | | | 3,507 | |
| | | | | | | | | | |
| | | |
TOTAL SHORT TERM INVESTMENTS | | | | | | | | | | |
(Cost $3,507) | | | | | | | | | 3,507 | |
| |
| | | |
TOTAL INVESTMENTS (100.06%) | | | | | | | | | | |
(Cost $3,043,544) | | | | | | | | $ | 3,218,237 | |
| | | |
Liabilities in Excess of Other Assets (-0.06%) | | | | | | | | | (1,843) | |
| |
NET ASSETS (100.00%) | | | | | | | | $ | 3,216,394 | |
| |
| (a) | Non-income producing security. |
Common Abbreviations:
AQR - AQR Capital Management LLC.
ASG - AlphaSimplex Group LLC.
FPA - First Pacific Advisors LLC.
PIMCO - Pacific Investment Management Company.
Holdings are subject to change.
| | |
| Annual Report | April 30, 2013 | | 9 |
| | |
| Redmont Resolute Fund II | | Schedule of Investments |
| | April 30, 2013 |
| | | | | | | | | | |
| | | | | | | | Value | |
| Description | | | | Shares | | | (Note 2) | |
| |
OPEN-END MUTUAL FUNDS (98.44%) | | | | | | | | | | |
AQR Multi Strategy Alternative Fund, Class I | | | | | 6,582,781 | | | $ | 66,881,056 | |
AQR Risk Parity Fund, Class I | | | | | 5,491,425 | | | | 67,324,876 | |
ASG Diversifying Strategies Fund, Class Y(a) | | | | | 228,446 | | | | 2,090,278 | |
ASG Managed Futures Strategy Fund, Class Y | | | | | 1,807,474 | | | | 18,110,893 | |
BlackRock Global Allocation Fund, Inc., Class I | | | | | 1,879,003 | | | | 39,722,114 | |
Diamond Hill Long-Short Fund, Class Y | | | | | 1,896,678 | | | | 38,123,226 | |
FPA Crescent Fund | | | | | 1,290,196 | | | | 39,531,607 | |
MainStay Marketfield Fund | | | | | 2,298,290 | | | | 38,335,484 | |
PIMCO Global Multi-Asset Fund, Institutional Class | | | | | 4,571,745 | | | | 53,352,269 | |
Robeco Boston Partners Long/Short Research Fund, Institutional Class | | | | | 2,961,382 | | | | 38,172,220 | |
Turner Spectrum Fund, Institutional Class(a) | | | | | 3,408,883 | | | | 37,702,243 | |
| | | | | | | | | | |
| | | | | | | | | 439,346,266 | |
| | | | | | | | | | |
| | | |
TOTAL OPEN-END MUTUAL FUNDS (Cost $415,949,288) | | | | | | | | | 439,346,266 | |
| |
| | | |
| | | | | | | | Value | |
| | | 7-DayYield | | Shares | | | (Note 2) | |
| |
SHORT TERM INVESTMENTS (0.02%) | | | | | | | | | | |
Dreyfus Treasury Cash Management Fund, Institutional Class | | 0.010% | | | 99,527 | | | | 99,527 | |
| | | | | | | | | | |
| | | |
TOTAL SHORT TERM INVESTMENTS | | | | | | | | | | |
(Cost $99,527) | | | | | | | | | 99,527 | |
| |
| | | |
TOTAL INVESTMENTS (98.46%) | | | | | | | | | | |
(Cost $416,048,815) | | | | | | | | $ | 439,445,793 | |
| | | |
Other Assets In Excess Of Liabilities (1.54%) | | | | | | | | | 6,873,462 | |
| |
NET ASSETS (100.00%) | | | | | | | | $ | 446,319,255 | |
| |
| (a) | Non-income producing security. |
Common Abbreviations:
AQR - AQR Capital Management LLC.
ASG - AlphaSimplex Group LLC.
FPA - First Pacific Advisors LLC.
PIMCO - Pacific Investment Management Company.
Holdings are subject to change.
See Notes to Financial Statements.
| | |
| Redmont Funds | | Statements of Assets and Liabilities |
| | April 30, 2013 |
| | | | | | | | |
| | | REDMONT RESOLUTE
FUND I | | | REDMONT RESOLUTE
FUND II | |
| | | | |
ASSETS | | | | | | | | |
Investments, at value | | $ | 3,218,237 | | | $ | 439,445,793 | |
Receivable for shares sold | | | – | | | | 7,000,000 | |
Receivable due from adviser | | | 6,205 | | | | – | |
Receivable for dividends | | | – | | | | 2 | |
Other assets | | | 13,348 | | | | 4,225 | |
| |
Total assets | | | 3,237,790 | | | | 446,450,020 | |
| |
LIABILITIES | | | | | | | | |
Distributions and service fees payable | | | 21 | | | | – | |
Trustee fees and expenses payable | | | 82 | | | | 10,707 | |
Chief compliance officer fee payable | | | 35 | | | | 3,797 | |
Principal financial officer fees payable | | | 6 | | | | 828 | |
Administration fees payable | | | 253 | | | | 19,205 | |
Transfer agent fees payable | | | 6,450 | | | | 5,500 | |
Audit fees payable | | | 12,360 | | | | 18,743 | |
Custody fees payable | | | 1,281 | | | | 9,988 | |
Accrued expenses and other liabilities | | | 908 | | | | 61,997 | |
| |
Total liabilities | | | 21,396 | | | | 130,765 | |
| |
NET ASSETS | | $ | 3,216,394 | | | $ | 446,319,255 | |
| |
NET ASSETS CONSIST OF | | | | | | | | |
Paid-in capital (Note 5) | | $ | 3,053,206 | | | $ | 422,038,892 | |
Accumulated net investment income/(loss) | | | (12,111 | ) | | | 466,558 | |
Accumulated net realized gain on investments | | | 606 | | | | 416,827 | |
Net unrealized appreciation on investments | | | 174,693 | | | | 23,396,978 | |
| |
NET ASSETS | | $ | 3,216,394 | | | $ | 446,319,255 | |
| |
INVESTMENTS, AT COST | | $ | 3,043,544 | | | $ | 416,048,815 | |
| |
PRICING OF SHARES | | | | | | | | |
Class A: | | | | | | | | |
Net Asset Value, offering and redemption price per share(a) | | $ | 10.63 | | | | N/A | |
Net Assets | | $ | 21,426 | | | | N/A | |
Shares of beneficial interest outstanding (unlimited number of shares, no par value common stock authorized) | | | 2,016 | | | | N/A | |
Maximum offering price per share ((NAV/0.9450), based on maximum sales charge of 5.50% of the offering price) | | $ | 11.25 | | | | N/A | |
Class I: | | | | | | | | |
Net Asset Value, offering and redemption price per share | | $ | 10.65 | | | $ | 11.05 | |
Net Assets | | $ | 3,194,968 | | | $ | 446,319,255 | |
Shares of beneficial interest outstanding (unlimited number of shares, no par value common stock authorized) | | | 299,893 | | | | 40,383,121 | |
| (a) | Redemption price per share may be reduced for any applicable contingent deferred sales charge. For a description of a possible sales charge, please see the Fund’s Prospectus. |
See Notes to Financial Statements.
| | |
| Annual Report | April 30, 2013 | | 11 |
| | |
| Redmont Funds | | Statements of Operations |
| | For the Year Ended April 30, 2013 |
| | | | | | | | |
| | | REDMONT RESOLUTE FUND I | | | REDMONT RESOLUTE FUND II | |
| | | | |
INVESTMENT INCOME | | | | | | | | |
Dividends | | $ | 31,629 | | | $ | 3,420,273 | |
| |
Total investment income | | | 31,629 | | | | 3,420,273 | |
| |
| | |
EXPENSES | | | | | | | | |
Investment advisory fees | | | 20,822 | | | | 2,872,491 | |
Administration fees | | | 2,545 | | | | 203,710 | |
Transfer agency fees | | | 40,491 | | | | 37,684 | |
Distribution and service fees | | | | | | | | |
Class A | | | 267 | | | | – | |
Legal fees | | | 364 | | | | 58,589 | |
Audit fees | | | 12,379 | | | | 19,092 | |
Custody fees | | | 5,104 | | | | 28,861 | |
Reports to shareholders and printing fees | | | 4,654 | | | | 16,371 | |
Trustee fees and expenses | | | 134 | | | | 19,940 | |
Registration/filing fees | | | 18,292 | | | | 54,131 | |
Chief compliance officer fees | | | 335 | | | | 44,746 | |
Principal financial officer fees | | | 73 | | | | 9,927 | |
Offering costs | | | 1,818 | | | | 82,820 | |
Other | | | 3,848 | | | | 12,491 | |
| |
Total expenses before waivers | | | 111,126 | | | | 3,460,853 | |
Less fees waived/reimbursed by investment advisor | | | | | | | | |
Class A | | | (2,780) | | | | – | |
Class I | | | (72,257) | | | | (2,872,491) | |
| |
Total net expenses | | | 36,089 | | | | 588,362 | |
| |
NET INVESTMENT INCOME/(LOSS) | | | (4,460) | | | | 2,831,911 | |
| |
Net realized loss on investments | | | (10,443) | | | | (986,160) | |
Long-term capital gain distributions from other investment companies | | | 11,634 | | | | 1,545,786 | |
Net change in unrealized appreciation on investments | | | 163,454 | | | | 21,817,523 | |
| |
NET REALIZED AND UNREALIZED GAIN ON INVESTMENTS | | | 164,645 | | | | 22,377,149 | |
| |
NET INCREASE IN NET ASSETS RESULTING FROM OPERATIONS | | $ | 160,185 | | | $ | 25,209,060 | |
| |
See Notes to Financial Statements.
| | |
| Redmont Funds | | Statements of Changes in Net Assets |
| | |
| | | | | | | | |
| | | REDMONT RESOLUTE FUND I | |
| | | | |
| | | For the Year Ended
April 30, 2013 | | | For the Period Ended
April 30, 2012 (a) | |
OPERATIONS | | | | | | | | |
Net investment loss | | $ | (4,460 | ) | | $ | (3,080 | ) |
Net realized loss on investments | | | (10,443 | ) | | | (482 | ) |
Long-term capital gain distributions from other investment companies | | | 11,634 | | | | – | |
Net change in unrealized appreciation on investments | | | 163,454 | | | | 11,239 | |
| |
Net increase in net assets resulting from operations | | | 160,185 | | | | 7,677 | |
| |
DISTRIBUTIONS | | | | | | | | |
| | |
Net investment income | | | | | | | | |
Class A | | | (275 | ) | | | – | |
Class I | | | (7,274 | ) | | | – | |
Net realized gains on investments | | | | | | | | |
Class A | | | (5 | ) | | | – | |
Class I | | | (98 | ) | | | – | |
| |
Net decrease in net assets from distributions | | | (7,652 | ) | | | – | |
| |
BENEFICIAL INTEREST TRANSACTIONS (NOTE 5) | | | | | | | | |
Shares sold | | | | | | | | |
Class A | | | 142,500 | | | | 1,051 | |
Class I | | | 2,373,333 | | | | 943,710 | |
Dividends reinvested | | | | | | | | |
Class A | | | 280 | | | | – | |
Class I | | | 7,372 | | | | – | |
Shares redeemed, net of redemption fees | | | | | | | | |
Class A | | | (127,534 | ) | | | (44 | ) |
Class I | | | (284,445 | ) | | | (39 | ) |
| |
Net increase in net assets derived from beneficial interest transactions | | | 2,111,506 | | | | 944,678 | |
| |
Net increase in Net Assets | | | 2,264,039 | | | | 952,355 | |
NET ASSETS: | | | | | | | | |
Beginning of period | | | 952,355 | | | | – | |
| |
End of period* | | $ | 3,216,394 | | | $ | 952,355 | |
| |
* Includes accumulated net investment loss of: | | $ | (12,111 | ) | | $ | (2,939 | ) |
| (a) | The Fund’s inception was December 30, 2011. |
See Notes to Financial Statements.
| | |
| Annual Report | April 30, 2013 | | 13 |
| | |
| Redmont Funds | | Statements of Changes in Net Assets |
| | |
| | | | | | | | |
| | | REDMONT RESOLUTE FUND II | |
| | | | |
| | | For the Year Ended
April 30, 2013 | | | For the Period Ended
April 30, 2012 (a) | |
OPERATIONS | | | | | | | | |
Net investment income/(loss) | | $ | 2,831,911 | | | $ | (140,063 | ) |
Net realized loss on investments | | | (986,160 | ) | | | (142,799 | ) |
Long-term capital gain distributions from other investment companies | | | 1,545,786 | | | | – | |
Net change in unrealized appreciation on investments | | | 21,817,523 | | | | 1,579,455 | |
| |
Net increase in net assets resulting from operations | | | 25,209,060 | | | | 1,296,593 | |
| |
DISTRIBUTIONS | | | | | | | | |
| | |
Net investment income | | | | | | | | |
Class I | | | (2,358,905 | ) | | | – | |
| |
Net decrease in net assets from distributions | | | (2,358,905 | ) | | | – | |
| |
BENEFICIAL INTEREST TRANSACTIONS (NOTE 5) | | | | | | | | |
Shares sold | | | | | | | | |
Class I | | | 347,412,602 | | | | 77,201,010 | |
Dividends reinvested | | | | | | | | |
Class I | | | 2,358,905 | | | | – | |
Shares redeemed, net of redemption fees | | | | | | | | |
Class I | | | (4,800,000 | ) | | | (10 | ) |
| |
Net increase in net assets derived from beneficial interest transactions | | | 344,971,507 | | | | 77,201,000 | |
| |
Net increase in Net Assets | | | 367,821,662 | | | | 78,497,593 | |
NET ASSETS: | | | | | | | | |
Beginning of period | | | 78,497,593 | | | | – | |
| |
End of period* | | $ | 446,319,255 | | | $ | 78,497,593 | |
| |
* Includes accumulated net investment income/(loss) of: | | $ | 466,558 | | | $ | (103,442 | ) |
| (a) | The Fund’s inception was December 30, 2011. |
See Notes to Financial Statements.
| | |
| Redmont Resolute Fund I | | Financial Highlights |
| | For a share outstanding throughout the periods presented |
| | | | | | | | |
| | | CLASS A | |
| | | For the
Year Ended
April 30, 2013 | | | For the
Period Ended
April 30, 2012 (a) | |
| | |
NET ASSET VALUE, BEGINNING OF PERIOD | | $ | 10.17 | | | $ | 10.00 | |
INCOME/(LOSS) FROM OPERATIONS | | | | | | | | |
Net investment loss(b) | | | (0.04) | | | | (0.07) | |
Net realized and unrealized gain on investments | | | 0.52 | | | | 0.24 | |
| | | | | | | | |
Total from Investment Operations | | | 0.48 | | | | 0.17 | |
| | | | | | | | |
| | |
LESS DISTRIBUTIONS | | | | | | | | |
Net investment income | | | (0.03) | | | | – | |
Net realized gain on investments | | | (0.00)(c) | | | | – | |
| | | | | | | | |
Total Distributions | | | (0.03) | | | | – | |
| | | | | | | | |
REDEMPTION FEES ADDED TO PAID IN CAPITAL | | | 0.01 | | | | – | |
| | | | | | | | |
NET INCREASE IN NET ASSET VALUE | | | 0.46 | | | | 0.17 | |
| | | | | | | | |
NET ASSET VALUE, END OF PERIOD | | $ | 10.63 | | | $ | 10.17 | |
| | | | | | | | |
TOTAL RETURN(d) | | | 4.81 | % | | | 1.70 | % |
| | |
RATIOS/SUPPLEMENTAL DATA | | | | | | | | |
Net assets, End of Period (000s) | | $ | 21 | | | $ | 1 | |
RATIOS TO AVERAGE NET ASSETS: | | | | | | | | |
Operating expenses excluding reimbursement/waiver(e) | | | 6.47 | % | | | 689.76 | %(f) |
Operating expenses including reimbursement/waiver(e) | | | 2.30 | % | | | 2.30 | %(f) |
Net investment loss including reimbursement/waiver(e) | | | (0.38) | % | | | (2.21) | %(f) |
PORTFOLIO TURNOVER RATE | | | 25 | % | | | 13 | %(g) |
| | | | | | | | |
| (a) | The Fund’s inception was December 30, 2011. |
| (b) | Calculated using the average shares method. |
| (c) | Less than $0.005 per share. |
| (d) | Total investment return is calculated assuming a purchase of a common share at the opening of the first day and a sale at closing on the last day of each period reported. Dividends and distributions, if any, are assumed for purposes of this calculation to be reinvested at prices obtained under the Fund’s dividend reinvestment plan. Total returns would have been lower had certain expenses not been waived during the period. Total investment returns do not reflect brokerage commissions, if any, and are not annualized. |
| (e) | The ratios exclude the impact of expenses of the underlying funds in which the Fund invests as represented in the Schedule of Investments. |
See Notes to Financial Statements.
| | |
| Annual Report | April 30, 2013 | | 15 |
| | |
| Redmont Resolute Fund I | | Financial Highlights |
| | For a share outstanding throughout the periods presented |
| | | | | | | | |
| | | CLASS I | |
| | | For the
Year Ended
April 30, 2013 | | | For the
Period Ended
April 30, 2012 (a) | |
| | |
NET ASSET VALUE, BEGINNING OF PERIOD | | $ | 10.18 | | | $ | 10.00 | |
INCOME/(LOSS) FROM OPERATIONS | | | | | | | | |
Net investment loss(b) | | | (0.02 | ) | | | (0.06 | ) |
Net realized and unrealized gain on investments | | | 0.52 | | | | 0.24 | |
| | | | | | | | |
Total from Investment Operations | | | 0.50 | | | | 0.18 | |
| | | | | | | | |
| | |
LESS DISTRIBUTIONS | | | | | | | | |
Net investment income | | | (0.03) | | | | – | |
Net realized gain on investments | | | (0.00)(c) | | | | – | |
| | | | | | | | |
Total Distributions | | | (0.03) | | | | – | |
| | | | | | | | |
NET INCREASE IN NET ASSET VALUE | | | 0.47 | | | | 0.18 | |
| | | | | | | | |
NET ASSET VALUE, END OF PERIOD | | $ | 10.65 | | | $ | 10.18 | |
| | | | | | | | |
TOTAL RETURN(d) | | | 4.96 | % | | | 1.80 | % |
| | |
RATIOS/SUPPLEMENTAL DATA | | | | | | | | |
Net assets, End of Period (000s) | | $ | 3,195 | | | $ | 951 | |
RATIOS TO AVERAGE NET ASSETS: | | | | | | | | |
Operating expenses excluding reimbursement/waiver(e) | | | 5.87 | % | | | 19.86 | %(f) |
Operating expenses including reimbursement/waiver(e) | | | 1.90 | % | | | 1.90 | %(f) |
Net investment loss including reimbursement/waiver(e) | | | (0.23 | )% | | | (1.78 | )%(f) |
PORTFOLIO TURNOVER RATE | | | 25 | % | | | 13 | %(g) |
| | | | | | | | | |
| (a) | The Fund’s inception was December 30, 2011. |
| (b) | Calculated using the average shares method. |
| (c) | Less than $0.005 per share. |
| (d) | Total investment return is calculated assuming a purchase of a common share at the opening of the first day and a sale at closing on the last day of each period reported. Dividends and distributions, if any, are assumed for purposes of this calculation to be reinvested at prices obtained under the Fund’s dividend reinvestment plan. Total returns would have been lower had certain expenses not been waived during the period. Total investment returns do not reflect brokerage commissions, if any, and are not annualized. |
| (e) | The ratios exclude the impact of expenses of the underlying funds in which the Fund invests as represented in the Schedule of Investments. |
See Notes to Financial Statements.
| | |
| Redmont Resolute Fund II | | Financial Highlights |
| | For a share outstanding throughout the periods presented |
| | | | | | | | |
| | | CLASS I | |
| | | For the
Year Ended
April 30, 2013 | | | For the
Period Ended
April 30, 2012 (a) | |
| | |
NET ASSET VALUE, BEGINNING OF PERIOD | | $ | 10.34 | | | $ | 10.00 | |
INCOME/(LOSS) FROM OPERATIONS | | | | | | | | |
Net investment income/(loss)(b) | | | 0.11 | | | | (0.03) | |
Net realized and unrealized gain on investments | | | 0.68 | | | | 0.37 | |
| | | | | | | | |
Total from Investment Operations | | | 0.79 | | | | 0.34 | |
| | | | | | | | |
| | |
LESS DISTRIBUTIONS | | | | | | | | |
Net investment income | | | (0.08) | | | | – | |
| | | | | | | | |
Total Distributions | | | (0.08) | | | | – | |
| | | | | | | | |
NET INCREASE IN NET ASSET VALUE | | | 0.71 | | | | 0.34 | |
| | | | | | | | |
NET ASSET VALUE, END OF PERIOD | | $ | 11 .05 | | | $ | 10 .34 | |
| | | | | | | | |
TOTAL RETURN(c) | | | 7.65 | % | | | 3.40 | % |
| | |
RATIOS/SUPPLEMENTAL DATA | | | | | | | | |
Net assets, End of Period (000s) | | $ | 446,319 | | | $ | 78,498 | |
RATIOS TO AVERAGE NET ASSETS: | | | | | | | | |
Operating expenses excluding reimbursement/waiver(d) | | | 1.32 | % | | | 1.63% | (e) |
Operating expenses including reimbursement/waiver(d) | | | 0.22 | % | | | 1.13% | (e) |
Net investment income/(loss) including reimbursement/waiver(d) | | | 1.08 | % | | | (0.97)% | (e) |
PORTFOLIO TURNOVER RATE | | | 51 | % | | | 18% | (f) |
| | | | | | | | |
| (a) | The Fund’s inception was December 30, 2011. |
| (b) | Calculated using the average shares method. |
| (c) | Total investment return is calculated assuming a purchase of a common share at the opening of the first day and a sale at closing on the last day of each period reported. Dividends and distributions, if any, are assumed for purposes of this calculation to be reinvested at prices obtained under the Fund’s dividend reinvestment plan. Total returns would have been lower had certain expenses not been waived during the period. Total investment returns do not reflect brokerage commissions, if any, and are not annualized. |
| (d) | The ratios exclude the impact of expenses of the underlying funds in which the Fund invests as represented in the Schedule of Investments. |
| | |
See Notes to Financial Statements. | | |
| Annual Report | April 30, 2013 | | 17 |
| | |
| Redmont Funds | | Notes to Financial Statements |
| | April 30, 2013 |
1. ORGANIZATION
Financial Investors Trust (the “Trust”), a Delaware statutory trust, is an open-end management investment company registered under the Investment Company Act of 1940, as amended (“1940 Act”). As of April 30, 2013, the Trust has 26 registered funds. This annual report describes the Redmont Resolute Fund I and Redmont Resolute Fund II (each a “Fund” and collectively, the “Funds”). The Funds seek to provide long-term total return with reduced volatility and reduced correlation to the conventional stock and bond markets. The Funds pursue their objectives primarily by allocating their assets among (i) investment sub-advisers (the “Sub-Advisers”) who manage alternative or hedging investment strategies, and (ii) other open-end investment companies registered under the Investment Company Act of 1940, as amended (the “1940 Act”) that use alternative or hedging strategies. The Redmont Resolute Fund I offers Class A and Class I shares and the Redmont Resolute Fund II offers Class I shares. All classes of shares of a particular Fund have identical rights to earnings, assets and voting privileges, except for class specific expenses and exclusive rights to vote on matters affecting only individual classes.
2. SIGNIFICANT ACCOUNTING POLICIES
The accompanying financial statements were prepared in accordance with accounting principles generally accepted in the United States of America (“U.S. GAAP”). The preparation of financial statements in conformity with U.S. GAAP requires management to make certain estimates and assumptions that affect the reported amounts of assets and liabilities and disclosures of contingent assets and liabilities at the date of the financial statements and the reported amounts of revenue and expenses during the period. Actual results could differ from those estimates. The following is a summary of significant accounting policies consistently followed by the Funds in preparation of their financial statements.
Investment Valuation: The Funds generally value their securities based on market prices determined at the close of regular trading on the New York Stock Exchange (“NYSE”), normally 4:00 p.m. Eastern Time, on each day the NYSE is open for trading.
For equity securities and mutual funds that are traded on an exchange, the market price is usually the closing sale or official closing price on that exchange. In the case of equity securities not traded on an exchange, or if such closing prices are not otherwise available, the securities are valued at the mean of the most recent bid and ask prices on such day. Redeemable securities issued by open-end registered investment companies are valued at the investment company’s applicable net asset value, with the exception of exchange-traded open-end investment companies, which are priced as equity securities.
The market price for debt obligations is generally the price supplied by an independent third-party pricing service approved by the Board of Trustees (the “Board”), which may use a matrix, formula or other objective method that takes into consideration quotations from dealers, market transactions in comparable investments, market indices and yield curves. If vendors are unable to supply a price, or if the price supplied is deemed to be unreliable, the market price may be determined using quotations received from one or more brokers–dealers that make a market in the security. Short–term debt obligations that will mature in 60 days or less are valued at amortized cost, unless it is determined that using this method would not reflect an investment’s fair value.
When such prices or quotations are not available, or when the Fair Value Committee appointed by the Board believes that they are unreliable, securities may be priced using fair value procedures approved by the Board.
Fair Value Measurements: The Funds disclose the classification of their fair value measurements following a three-tier hierarchy based on the inputs used to measure fair value. Inputs refer broadly to the assumptions that market participants would use in pricing the asset or liability, including assumptions about risk. Inputs may be observable or unobservable. Observable inputs reflect the assumptions market participants would use in pricing the asset or liability that are developed based on market data obtained from sources independent of the reporting entity. Unobservable inputs reflect the reporting entity’s own assumptions about the assumptions market participants would use in pricing the asset or liability that are developed based on the best information available.
Various inputs are used in determining the value of the Funds’ investments as of the end of the reporting period. When inputs used fall into different levels of the fair value hierarchy, the level in the hierarchy within which the fair value measurement falls is determined based on the lowest level input that is significant to the fair value measurement in its entirety. The designated input levels are not necessarily an indication of the risk or liquidity associated with these investments. These inputs are categorized in the following hierarchy under applicable financial accounting standards:
| | | | |
Level 1 | | – | | Unadjusted quoted prices in active markets for identical investments, unrestricted assets or liabilities that the Funds have the ability to access at the measurement date; |
| | |
| Redmont Funds | | Notes to Financial Statements |
| | April 30, 2013 |
| | | | |
Level 2 | | – | | Quoted prices which are not active, quoted prices for similar assets or liabilities in active markets or inputs other than quoted prices that are observable (either directly or indirectly) for substantially the full term of the asset or liability; and |
| | |
Level 3 | | – | | Significant unobservable prices or inputs (including the Funds’ own assumptions in determining the fair value of investments) where there is little or no market activity for the asset or liability at the measurement date. |
The following is a summary of the inputs used to value the Funds’ investments as of April 30, 2013:
Redmont Resolute Fund I
| | | | | | | | | | | | | | | | |
| Investments in Securities at Value | | Level 1 - Quoted Prices | | | Level 2 - Other Significant
Observable Inputs | | | Level 3 - Significant Unobservable Inputs | | | Total | |
| |
Open-End Mutual Funds | | $ | 3,214,730 | | | $ | – | | | $ | – | | | $ | 3,214,730 | |
Short Term Investments | | | 3,507 | | | | – | | | | – | | | | 3,507 | |
| |
Total | | $ | 3,218,237 | | | $ | – | | | $ | – | | | $ | 3,218,237 | |
| |
Redmont Resolute Fund II
| | | | | | | | | | | | | | | | |
| Investments in Securities at Value | | Level 1 -
Quoted Prices | | | Level 2 - Other Significant
Observable Inputs | | | Level 3 - Significant
Unobservable Inputs | | | Total | |
| |
Open-End Mutual Funds | | $ | 439,346,266 | | | $ | – | | | $ | – | | | $ | 439,346,266 | |
Short Term Investments | | | 99,527 | | | | – | | | | – | | | | 99,527 | |
| |
Total | | $ | 439,445,793 | | | $ | – | | | $ | – | | | $ | 439,445,793 | |
| |
The Funds recognize transfers between levels as of the end of the period. For the year ended April 30, 2013, the Funds did not have any transfers between Level 1 and Level 2 securities. There were no Level 3 securities held during the period.
Trust Expenses: Some expenses of the Trust can be directly attributed to the Funds. Expenses which cannot be directly attributed to the Funds are apportioned among all funds in the Trust based on average net assets of each fund.
Fund and Class Expenses: Expenses that are specific to a Fund or class of shares of a Fund are charged directly to that Fund or share class. Expenses that are common to all Funds generally are allocated among the Funds in proportion to their average daily net assets. Fees provided under the distribution (Rule 12b-1) and/or shareholder service plans for a particular class of the Fund are charged to the operations of such class.
Offering Costs: Offering costs, including costs of printing initial prospectuses, legal and registration fees, are being amortized over twelve months from the inception date of the Funds. As of April 30, 2013, no offering costs remain to be amortized for the Funds.
Federal Income Taxes: The Funds comply with the requirements under Subchapter M of the Internal Revenue Code of 1986, as amended, applicable to regulated investment companies and intend to distribute substantially all of their net taxable income and net capital gains, if any, each year so that the Funds will not be subject to excise tax on undistributed income and gains. The Funds are not subject to income taxes to the extent such distributions are made.
As of and during the year ended April 30, 2013, the Funds did not have a liability for any unrecognized tax benefits. The Funds file U.S. federal, state, and local tax returns as required. The Funds’ tax returns are subject to examination by the relevant tax authorities until expiration of the applicable statute of limitations, which is generally three years after the filing of the tax return for federal purposes and four years for most state returns. Tax returns for open years have incorporated no uncertain tax positions that require a provision for income taxes.
Investment Transactions and Investment Income: Investment transactions are accounted for on the date the investments are purchased or sold (trade date basis). Net realized gains and losses from investment transactions are reported on an identified cost basis. Interest income, which includes accretion of discounts and amortization of premiums, is accrued and recorded as earned. Dividend income is recognized on the ex-dividend date or for certain foreign securities, as soon as information is available to the Funds. All of the realized and unrealized gains and losses and net investment income, are allocated daily to each class in proportion its average daily net assets.
| | |
| Annual Report | April 30, 2013 | | 19 |
| | |
| Redmont Funds | | Notes to Financial Statements |
| | April 30, 2013 |
Principal Investment Strategies of each Fund: The Funds pursue their objective primarily by allocating their assets among (i) investment sub-advisers (the “Sub-Advisers”) who manage alternative or hedging investment strategies, and (ii) other open-end investment companies registered under the Investment Company Act of 1940, as amended (the “1940 Act”) that use alternative or hedging strategies. The Funds may also invest in closed-end funds, exchange-traded funds and exchange-traded notes, which provide exposure to hedging or alternative strategies. Collectively, the open-end funds, closed-end funds and exchange-traded funds in which the Funds may invest are referred to as “Underlying Funds.”
Hedging strategies used by the Sub-Advisers and the Underlying Funds may include, among other techniques, the use of short selling, options, futures, derivatives or similar instruments. Alternative investment strategies may include, among others, long/short, market neutral and arbitrage strategies; commodities or commodity-linked investments; leverage; derivatives; distressed securities; and other investment techniques that are expected to achieve the Funds’ investment objective.
Distributions to Shareholders: Each Fund normally pays dividends and distributes capital gains, if any, on an annual basis. Income dividend distributions are derived from interest and other income each Fund receives from their investments, including distributions of short term capital gains. Capital gain distributions are derived from gains realized when each Fund sells a security it has owned for more than a year. Each Fund may make additional distributions and dividends at other times if its portfolio manager or managers believe doing so may be necessary for each Fund to avoid or reduce taxes.
3. TAX BASIS INFORMATION
Reclassifications: As of April 30, 2013, permanent differences in book and tax accounting were reclassified. These differences had no effect on net assets and were primarily attributed to minor differences between book and tax characterizations of distributions to shareholders and non deductible expenses. The reclassifications were as follows:
| | | | | | | | | | | | |
| | | Undistributed Net Investment Income | | | Accumulated Net Realized Gain/(Loss) on Investments | | | Paid-in Capital | |
Redmont Resolute Fund I | | $ | 2,837 | | | $ | – | | | $ | (2,837 | ) |
Redmont Resolute Fund II | | | 96,994 | | | | – | | | | (96,994 | ) |
Tax Basis of Investments: As of April 30, 2013, the aggregate cost of investments, gross unrealized appreciation/(depreciation) and net unrealized appreciation for Federal tax purposes were as follows:
| | | | | | | | | | | | | | | | |
| | | Gross Appreciation
(excess of value
over tax cost) | | | Gross Depreciation
(excess of tax cost
over value) | | | Net Unrealized Appreciation/(Depreciation) | | | Cost of Investments
for Income Tax
Purposes | |
Redmont Resolute Fund I | | $ | 173,601 | | | $ | (5,040 | ) | | $ | 168,561 | | | $ | 3,049,676 | |
Redmont Resolute Fund II | | | 23,027,569 | | | | (67,213 | ) | | | 22,960,356 | | | | 416,485,437 | |
Components of Earnings: As of April 30, 2013, components of distributable earnings were as follows:
| | | | | | | | | | | | | | | | |
| | | Accumulated Capital
Gain Undistributed | | | Ordinary Income
Undistributed | | | Net Unrealized
Appreciation | | | Other Cumulative
Effect of Timing
Differences | |
Redmont Resolute Fund I | | $ | 6,738 | | | $ | 958 | | | $ | 168,561 | | | $ | (13,069) | |
Redmont Resolute Fund II | | | 853,449 | | | | 466,558 | | | | 22,960,356 | | | | – | |
As of April 30, 2013, the Redmont Resolute Fund I elected to defer to the year ending April 30, 2014, late year ordinary losses in the amount of $13,069.
Capital Losses: As of April 30, 2013, the Funds have no accumulated capital loss carrryforwards.
Tax Basis of Distributions to Shareholders: The character of distributions made during the year from net investment income or net realized gains may differ from its ultimate characterization for federal income tax purposes. Also, due to the timing of dividend distributions, the fiscal year in which amounts are distributed may differ from the fiscal year in which the income or realized gain were recorded by the Funds.
| | |
| Redmont Funds | | Notes to Financial Statements |
| | April 30, 2013 |
The tax character of distributions paid by the Funds for the fiscal year ended April 30, 2013, were as follows:
| | | | |
| | | Ordinary Income | |
| |
Redmont Resolute Fund I | | $ | 7,652 | |
Redmont Resolute Fund II | | | 2,358,905 | |
There were no distributions paid by the Funds for the period ended April 30, 2012.
4. SECURITIES TRANSACTIONS
Purchases and sales of securities, excluding short-term securities during the year ended April 30, 2013 were as follows:
| | | | | | | | |
| Fund | | Purchases of Securities | | | Proceeds From Sales of Securities | |
| |
Redmont Resolute Fund I | | $ | 2,777,014 | | | $ | 464,200 | |
Redmont Resolute Fund II | | | 476,284,568 | | | | 133,375,000 | |
5. BENEFICIAL SHARE TRANSACTIONS
The capitalization of the Trust consists of an unlimited number of shares of beneficial interest with no par value per share. Holders of the shares of the Funds of the Trust have one vote for each share held and a proportionate fraction of a vote for each fractional share. All shares issued and outstanding are fully paid and are non-assessable, transferable and redeemable at the option of the shareholder. Shares have no pre-emptive rights.
Transactions in common shares were as follows:
Redmont Resolute Fund I
| | | | | | | | |
| | | For the | | | | |
| | | Year Ended | | | For the Period Ended | |
| Class A: | | April 30, 2013 | | | April 30, 2012(a) | |
| |
Common Shares Outstanding - Beginning of Period | | | 101 | | | | – | |
Common Shares Sold | | | 14,144 | | | | 105 | |
Common Shares Issued as Reinvestment of Dividends | | | 27 | | | | – | |
Common Shares Redeemed | | | (12,256) | | | | (4) | |
| |
Common Shares Outstanding - End of Period | | | 2,016 | | | | 101 | |
| |
| | |
| | | For the | | | | |
| | | Year Ended | | | For the Period Ended | |
| Class I: | | April 30, 2013 | | | April 30, 2012(a) | |
| |
Common Shares Outstanding - Beginning of Period | | | 93,449 | | | | – | |
Common Shares Sold | | | 233,443 | | | | 93,453 | |
Common Shares Issued as Reinvestment of Dividends | | | 724 | | | | – | |
Common Shares Redeemed | | | (27,723) | | | | (4) | |
| |
Common Shares Outstanding - End of Period | | | 299,893 | | | | 93,449 | |
| |
| | |
| Redmont Resolute Fund II | | | | | | | | |
| | | For the | | | | |
| | | Year Ended | | | For the Period Ended | |
| Class I: | | April 30, 2013 | | | April 30, 2012(a) | |
| |
Common Shares Outstanding - Beginning of Period | | | 7,591,661 | | | | – | |
Common Shares Sold | | | 33,012,452 | | | | 7,591,662 | |
Common Shares Issued as Reinvestment of Dividends | | | 225,485 | | | | – | |
Common Shares Redeemed | | | (446,477) | | | | (1) | |
| |
Common Shares Outstanding - End of Period | | | 40,383,121 | | | | 7,591,661 | |
| |
| (a) | The Fund’s inception was December 30, 2011. |
| | |
| Annual Report | April 30, 2013 | | 21 |
| | |
| Redmont Funds | | Notes to Financial Statements |
| | April 30, 2013 |
Shares redeemed within 30 days of purchase may incur a 2% short-term redemption fee deducted from the redemption amount. Redemption fees are reflected in the “Shares redeemed, net of redemption fees” in the Statements of Changes in Net Assets. For the year ended April 30, 2013 and the period ended April 30, 2012, the Funds retained fees as follows:
| | | | |
| Fund | | For the year ended April 30, 2013 | | For the period ended April 30, 2012 |
|
Redmont Resolute Fund I | | $51 | | — |
Redmont Resolute Fund II | | — | | — |
6. MANAGEMENT AND RELATED PARTY TRANSACTIONS
Investment Advisory
Highland Associates, Inc. (“Highland” or the Adviser”), subject to the authority of the Board, is responsible for the overall management and administration of the Funds’ business affairs. Pursuant to the Investment Advisory Agreement (the “Advisory Agreement”), the Adviser is entitled to an investment advisory fee, computed daily and payable monthly of 1.50% of the average daily net assets for each Fund. Prior to December 5, 2012, the Adviser was entitled to an investment advisory fee, computed daily and payable monthly of 0.50% of the average daily net assets for each Fund.
As of April 1, 2013 the Adviser adopted two Investment Sub-Advisory Agreements (the “Sub-Advisory Agreements”) with Robeco Investment Management, Inc. and Turner Investments, L.P. (each a “Sub-Adviser” and collectively the “Sub-Advisers”) in accordance with the Funds’ investment objective, policies and limitations and investment guidelines established jointly by the Adviser and the Board. The Adviser determines the allocation of each Fund’s assets among the various Sub-Advisers and Underlying Funds. The Funds are not required to invest with any minimum number of Sub-Advisers or Underlying Funds, and do not have minimum or maximum limitations with respect to allocations of assets to any Sub-Adviser, investment strategy or market sector. Highland may change the allocation of each of the Fund’s assets among the available investment options, and may add or remove Sub-Advisers, at any time. Each Sub-Adviser is responsible for the day-to-day management of its allocated portion of Fund assets. Highland has ultimate responsibility, subject to the oversight of the Board of the Funds, to oversee the Sub-Advisers, and to recommend their hiring, termination and replacement.
Pursuant to the Sub-Advisory Agreements, the Adviser pays each sub-adviser an annual sub-advisory management fee which is based on each Fund’s average quarterly market value of the assets managed by each Sub-Advisor. The Adviser is required to pay all fees due to each sub-adviser out of the management fee the Adviser receives from each Fund. The following table reflects the Funds’ contractual sub-advisory fee rates.
| | | | |
| | | Average Daily | | Contractual |
| Sub-Adviser | | Market Value of the Fund | | Sub-Advisory Fee |
|
| | First $50 Million | | 1.25% |
Robeco Investment Management, Inc. | | Over $50 Million | | 1.00% |
| | |
Turner Investments, L.P. | | All Asset Levels | | 1.20% |
Prior to December 5, 2012, the Adviser had contractually agreed to waive fees with respect to each class of the Redmont Resolute Fund I so that the Total Annual Operating Expenses (excluding interest, taxes, brokerage commissions, other expenditures that are capitalized in accordance with GAAP, other extraordinary expenses not incurred in the ordinary course of the Fund’s business, and amounts, if any, payable pursuant to a plan adopted in accordance with Rule 12b-1 under the 1940 Act) will not exceed 1.90% of average daily net assets. Pursuant to this agreement, the Fund will reimburse the Adviser for any fee waivers and expense reimbursements made by the Adviser, provided that any such reimbursements made by the Fund to the Adviser will not cause the Fund’s expense limitation to exceed expense limitations in existence at the time the expense was incurred, or at the time of the reimbursement, whichever is lower, and the reimbursement is made within three years after the expenses were incurred. Subsequently to December 5, 2012, the effective date of the amended agreement, the Adviser has agreed, with respect to Redmont Resolute Fund I’s Class A and Class I shares, contractually to waive the portion of its 1.50% Management Fee in excess of the sum of 0.50% plus any sub-advisory fees paid by the Adviser to Sub-Advisors, and/or reimburse the Fund (or class, as applicable) by the amount of such excess. In addition, after giving effect to the foregoing fee waiver and/or expense reimbursement for the Redmont Resolute Fund I’s Class A and Class I shares, to the extent the total annual expenses (exclusive of Distribution and Service (12b-1) Fees, Shareholder Services Fees, Acquired Fund Fees and Expenses, Sub-Advisory Fees, brokerage expenses, interest expense, taxes and extraordinary expenses) exceed 1.90% of the average daily net assets, the Adviser has contractually agreed to reduce the fee payable with respect to Redmont Resolute Fund I by the extent of such excess, and/or shall reimburse the Fund (or class, as applicable) by the amount of such excess. The fee waivers and/or expense reimbursements for the Fund are in effect through August 31, 2017. Pursuant to the December 5, 2012 agreement, the Fund will reimburse the Adviser for any fee waivers and expense reimbursements in relation to the expense limit of 1.90% of the average net assets, made by the Adviser, provided that any such reimbursements
| | |
| Redmont Funds | | Notes to Financial Statements |
| | April 30, 2013 |
made by the Fund to the Adviser will not cause the Fund’s expense limitation to exceed expense limitations in existence at the time the expense was incurred, or at the time of the reimbursement, whichever is lower, and the reimbursement is made within three years after the expenses were incurred.
For the year ended April 30, 2013, the fee waivers and/or reimbursements were as follows:
| | | | |
| Fund | | Fees Waived/Reimbursed By Advisor | | Recoupment of Previously Waived Fees by Advisor |
|
Redmont Resolute Fund I – Class A | | $ 2,780 | | — |
Redmont Resolute Fund I – Class I | | 72,257 | | — |
As of April 30, 2013, the balances of recoupable expenses for each Fund were as follows:
| | | | | | | | | | | | |
| Fund | | 4/30/13 | | | 4/30/12 | | | Total | |
| |
Redmont Resolute Fund I – Class A | | $ | 2,377 | | | $ | 2,270 | | | $ | 4,647 | |
Redmont Resolute Fund I – Class I | | | 61,265 | | | | 30,963 | | | | 92,228 | |
The Adviser has agreed, with respect to the Redmont Resolute Fund II Class I shares, to waive the portion of its 1.50% Management Fee in excess of any sub-advisory fees paid by the Adviser to Sub-Advisors. This agreement is in effect through August 31, 2017. Prior to December 5, 2012, the Adviser had agreed contractually to waive the total amount of Redmont Resolute Fund II’s 0.50% management fees.
Fund Accounting Fees and Expenses
ALPS Fund Services, Inc. (“ALPS” and the “Administrator”) (an affiliate of ALPS Distributors, Inc.) provides administrative, fund accounting and other services to the Funds under the Administration, Bookkeeping and Pricing Services Agreement with the Trust. Prior to the April 1, 2013 initiation of the Sub-Advisory Agreement, ALPS was paid fees, accrued on a daily basis and billed on a monthly basis in total and allocated to each Fund, based on the greater of (a) an annual total fee for both Funds of $200,000 from the first to the last, or projected last, day of the then current year of service under the Agreement; or (b) following basis point fee schedule:
| | | | |
| Average Total Net Assets | | Contractual Fee | | |
|
Between $0-$500M | | 0.05% | | |
$500M-$1B | | 0.03% | | |
Above $1B | | 0.02% | | |
The minimum annual total fee of $200,000 was increased to $234,000 with the initiation of the Sub-Advisory Agreements on April 1, 2013.
The Administrator is also reimbursed by the Funds for certain out-of-pocket expenses.
Transfer Agent
ALPS serves as transfer, dividend paying and shareholder servicing agent for the Funds under a Transfer Agency and Services Agreement with the Trust. Under this Agreement, ALPS is paid an annual base fee of $25,000 per Fund plus fees for open accounts and is reimbursed for certain out-of-pocket expenses.
Compliance Services
ALPS provides services that assist the Trust’s Chief Compliance Officer in monitoring and testing the policies and procedures of the Trust in conjunction with requirements under Rule 38a-1 under the 1940 Act under the Chief Compliance officer Services Agreement. Prior to the April 1, 2013 initiation of the Sub-Advisory Agreement, ALPS was paid an annual base fee for both Funds of $45,000 which was thereafter increased to $46,000. ALPS is reimbursed for certain out-of-pocket expenses. The annual fee is billed monthly in total and allocated to each Fund.
Principal Financial Officer
ALPS receives an annual fee for both Funds of $10,000 for providing Principal Financial Officer (“PFO”) services to the Trust. The annual fee is billed monthly in total and allocated to each Fund.
| | |
| Annual Report | April 30, 2013 | | 23 |
| | |
| Redmont Funds | | Notes to Financial Statements |
| | April 30, 2013 |
Distributor
ALPS Distributors, Inc. (“ADI” or the “Distributor”) (an affiliate of ALPS) acts as the distributor of the Funds’ shares pursuant to a Distribution Agreement with the Trust. Shares are sold on a continuous basis by ADI as agent for the Funds, and ADI has agreed to use its best efforts to solicit orders for the sale of Funds’ shares, although it is not obliged to sell any particular amount of shares. ADI is not entitled to any compensation for its services as Distributor. ADI is registered as a broker-dealer with the Securities and Exchange Commission.
The Redmont Resolute Fund I has adopted a Distribution and Services Plan (the “Plan”) pursuant to Rule 12b-1 of the 1940 Act for Class A shares. The Plan allows the Fund to use Class A assets to pay fees in connection with the distribution and marketing of Class A shares and/or the provision of shareholder services to Class A shareholders. The Plan permits payment for services in connection with the administration of plans or programs that use Class A shares of the Fund, if any, as their funding medium and for related expenses. The Plan permits the Fund to make total payments at an annual rate of up to 0.25% of the Fund’s average daily net assets attributable to its Class A shares. Because these fees are paid out of the Fund’s Class A assets, if any, on an ongoing basis, over time they will increase the cost of an investment in Class A shares, if any, and Plan fees may cost an investor more than other types of sales charges.
The Redmont Resolute Fund I has adopted a shareholder services plan (“Shareholder Services Plan”) for Class A shares. Under the Shareholder Services Plan the Fund is authorized to pay banks and their affiliates and other institutions, including broker-dealers and Fund affiliates (“Participating Organizations”), an aggregate fee in an amount not to exceed on an annual basis 0.15% for Class A shares of the average daily net asset value of the Class A shares, respectively, attributable to or held in the name of a Participating Organization for its clients as compensation for providing shareholder service activities, which do not include distribution services, pursuant to an agreement with a Participating Organization. Shareholder Services plan fees are included with distribution and service fees on the Statement of Operations.
7. INDEMNIFICATIONS
Under the Trust’s organizational documents, its officers and Trustees are indemnified against certain liability arising out of the performance of their duties to the Trust. Additionally, in the normal course of business, the Trust enters into contracts with service providers that may contain general indemnification clauses which may permit indemnification to the extent permissible under applicable law. The Trust’s maximum exposure under these arrangements is unknown, as this would involve future claims that may be made against the Trust that have not yet occurred.
| | |
| Redmont Funds | | Report of Independent Registered Public Accounting Firm |
| | April 30, 2013 |
To the Shareholders and Board of Trustees of Financial Investors Trust:
We have audited the accompanying statements of assets and liabilities, including the schedules of investments, of Redmont Resolute Fund I and Redmont Resolute Fund II (the “Funds”), two of the funds constituting Financial Investors Trust, as of April 30, 2013, and the related statements of operations for the year then ended, and the statements of changes in net assets and the financial highlights for the year then ended and for the period from December 30, 2011 (inception) to April 30, 2012. These financial statements and financial highlights are the responsibility of the Funds’ management. Our responsibility is to express an opinion on these financial statements and financial highlights based on our audits.
We conducted our audits in accordance with the standards of the Public Company Accounting Oversight Board (United States). Those standards require that we plan and perform the audit to obtain reasonable assurance about whether the financial statements and financial highlights are free of material misstatement. The Funds are not required to have, nor were we engaged to perform, an audit of their internal control over financial reporting. Our audits included consideration of internal control over financial reporting as a basis for designing audit procedures that are appropriate in the circumstances, but not for the purpose of expressing an opinion on the effectiveness of the Funds’ internal control over financial reporting. Accordingly, we express no such opinion. An audit also includes examining, on a test basis, evidence supporting the amounts and disclosures in the financial statements, assessing the accounting principles used and significant estimates made by management, as well as evaluating the overall financial statement presentation. Our procedures included confirmation of securities owned as of April 30, 2013, by correspondence with the custodian. We believe that our audits provide a reasonable basis for our opinion.
In our opinion, the financial statements and financial highlights referred to above present fairly, in all material respects, the financial position of Redmont Resolute Fund I and Redmont Resolute Fund II of Financial Investors Trust as of April 30, 2013, the results of their operations for the year then ended, and the changes in their net assets and the financial highlights for the year then ended and for the period from December 30, 2011 (inception) to April 30, 2012, in conformity with accounting principles generally accepted in the United States of America.
DELOITTE & TOUCHE LLP
Denver, Colorado
June 27, 2013
| | |
| Annual Report | April 30, 2013 | | 25 |
| | |
| Redmont Funds | | Additional Information |
| | April 30, 2013 (Unaudited) |
1. FUND HOLDINGS
The Funds file their complete schedule of portfolio holdings with the Securities and Exchange Commission (the “SEC”) for the first and third quarters of each fiscal year on Form N-Q within 60 days after the end of the period. Copies of the Funds’ Form N-Q are available without charge on the SEC website at http:// www.sec.gov. You may also review and copy the Form N-Q at the SEC’s Public Reference Room in Washington, D.C. For more information about the operation of the Public Reference Room, please call the SEC at 1-800-SEC-0330.
2. FUND PROXY VOTING POLICIES, PROCEDURES AND SUMMARIES
Fund policies and procedures used in determining how to vote proxies and information regarding how each of the Funds voted proxies relating to portfolio securities during the most recent prior 12-month period ending June 30 are available without charge, (1) upon request, by calling (toll-free) (866) 759-5679 and (2) on the SEC’s website at http://www.sec.gov.
3. TAX DESIGNATIONS
The Funds designate the following as a percentage of taxable ordinary income distributions, or up to the maximum amount allowable, for the calendar year ended December 31, 2012:
| | | | |
| | | Qualified Dividend Income | | Dividend Received Deduction |
|
Redmont Resolute Fund I | | 69.58% | | 2.61% |
Redmont Resolute Fund II | | 30.60% | | 1.68% |
4. DISCLOSURE REGARDING APPROVAL OF AMENDMENT TO FUND ADVISORY AGREEMENT
Redmont Resolute Fund I and Redmont Resolute Fund II (the “Redmont Funds”)
On November 2, 2012, a Special Meeting of Shareholders of the Redmont Funds was held at which an amended Investment Advisory Agreement (the “Redmont Advisory Agreement”) between the Trust and Highland Associates, Inc. (“Highland”) was approved. The Board of Trustees previously met in person to discuss, among other things, the approval of the amended Redmont Advisory Agreement, in accordance with Section 15(c) of the 1940 Act, and its recommendation that shareholders vote in favor of the amended Redmont Advisory Agreement. At that time, the Independent Trustees met with independent legal counsel during executive session and discussed the amended Redmont Advisory Agreement and other related materials.
In approving the amended Redmont Advisory Agreement with Highland to increase the advisory fees for the Redmont Funds and recommending that the shareholders of the Redmont Funds approve such amended Redmont Advisory Agreement, the Board, including the Independent Trustees, considered the following factors with respect to the Redmont Funds:
Investment Advisory Fee Rate: The Board reviewed and considered the contractual annual advisory fee to be paid by the Trust, on behalf of the Redmont Funds, to Highland of 1.50% of each of the Redmont Fund’s daily net assets, in light of the extent and quality of the advisory services provided by Highland to the Redmont Funds.
The Board considered information they received comparing the Redmont Funds’ contractual annual advisory fees and overall expenses with those of funds in both the relevant expense group and universe of funds provided by an independent provider of investment company data.
The Board also considered the initial application for exemptive relief from the SEC, pursuant to which the Highland would have the authority to engage, retain and terminate sub-advisers for the Redmont Funds, subject to approval of the Board, but without obtaining approval from the Redmont Funds’ shareholders. Under this arrangement, the total aggregate fees paid to all sub-advisers by each Redmont Fund would be equal to or less than 0.75% of each Redmont Fund’s average daily net assets.
In light of the SEC’s determination not to grant the initial application for exemptive relief, the Board also considered the revised application for exemptive relief and the rationales for the proposed increase in advisory fee rate. The Board noted Highland’s view that, if the amended advisory fee rate were to be approved and exemptive relief were to be obtained from the SEC, the amount potentially allocable to sub-advisers would provide Highland with the requisite flexibility to manage the Redmont Funds’ portfolios with minimal allocations to underlying funds if deemed in the interests of shareholders. The Board also noted Highland’s view that the potentially allocable amount would permit Highland to consider a wider spectrum of sub-advisers, including sub-advisers managing alternative products or strategies that may be more cost effectively accessed through a separate account rather than through a pooled investment vehicle.
| | |
| Redmont Funds | | Additional Information |
| | April 30, 2013 (Unaudited) |
Based on such information, the Board further determined that the contractual annual advisory fees of 1.50% of each of the Redmont Funds, the total expense ratio of 1.90% (after limitations and expense waivers/reimbursements) for each of Class A and Class I of the Redmont Fund I and Highland’s contractual agreement to waive the portion of the Redmond Fund II’s 1.50% advisory fee in excess of any sub-advisory fees paid to the Fund’s sub-adviser, are comparable to others within the Stonebridge Fund’s peer universe.
Nature, Extent and Quality of the Services Provided: The Board considered the nature, extent and quality of the services provided by Highland in light of the investment objective of each Redmont Fund. The Board reviewed the background and experience of the current Highland’s personnel responsible for the evaluation and monitoring for each Redmond Fund and Highland’s history as asset manager, its performance, the amount of assets currently under management, the research and decision-making processes utilized by investment professionals, and the methods adopted to seek to achieve compliance with the investment objectives, policies and restrictions.
The Board also reviewed Highland’s compliance-related materials and noted that it had received a report on these services and compliance issues from Highland at each regular Board meeting since the Redmont Funds’ inception on December 29, 2011 related to the services rendered by Highland to the Redmont Funds.
The Board concluded that the nature, extent and quality of the services to be provided by Highland to the Redmont Funds were appropriate and consistent with the terms of the amended Redmont Advisory Agreement and that each Redmont Fund was likely to benefit from services provided under the amended Redmont Advisory Agreement. The Board also concluded that the quality of the services provided by the senior advisory personnel employed by Highland had been consistent with or superior to quality norms in the industry and that Highland had sufficient personnel, with the appropriate education and experience, to serve each Redmont Fund effectively. The Board also concluded that the structure of Highland’s operations was sufficient to retain and properly motivate the Redmont Funds’ current senior advisory personnel. Finally, the Board concluded that the financial condition of Highland was sound.
Investment Performance: The Board reviewed the recent investment performance of each Redmont Fund. This review included a comparison of each Redmont Fund’s performance with the performance of a group of comparable funds selected by an independent provider of investment company data and the HFRX Global Index, the Redmont Funds’ benchmark. The Board observed that the Redmont Funds had limited performance history data available at the time of the meeting, due to the Redmont Funds’ inception date of December 29, 2011.
Costs of the Services to be Provided to the Redmont Funds and the Projected Profits to be Realized by Highland from its Relationship with the Redmont Funds. The Board reviewed the fees to be paid by each Redmont Fund to Highland under the current Redmont Advisory Agreement and the proposed new fees to be paid by each Redmont Fund to Highland under the amended Redmont Advisory Agreement. The Board reviewed comparative fee information of the Redmont Funds’ advisory contract, including information about (i) the rates of compensation paid to investment advisers, and overall expense ratios, for funds comparable in size, character and investment strategy to the Redmont Funds and (ii) the fees charged by Highland to its other client accounts. In its consideration of the Redmont Funds’ proposed new advisory fees under the amended Redmont Advisory Agreement and overall expenses compared with those of funds in both the relevant expense group and universe of funds, the Board reviewed information provided by an independent provider of investment company data.
The Board reviewed the proposed new advisory fees under the amended Redmont Advisory Agreement and expense ratios in light of the proposed contractual waivers by Highland. The Board, while acknowledging the challenges of comparing the Redmont Funds’ proposed hybrid fund-of-funds and manager-of-managers structure, also noted that the proposed new advisory fees for the Redmont Funds, after giving effect to waivers, were generally comparable to the fees charged to similar funds within the respective fund-of-funds or the manager-of-managers universes. Where a Redmont Fund’s fees or expenses were higher than the median of the funds compared, the Board noted that such fees or expenses were within an acceptable range. The Board also took note of the fact that any sub-advisers engaged by Highland Associates on behalf of the Redmont Funds would be paid by Highland from its advisory fees and not by the Redmont Funds. The Board also noted Highland’s view that the Redmont Funds were anticipated to, in the future, experience a reduction in acquired fund fees and expenses through the use of sub-advisers, but that Highland’s ability to realize those reductions were subject to, among other factors, the receipt of exemptive relief from the SEC and the ability to identify and engage appropriate sub-advisers within the expected timeframe. In renewing the amended Redmont Advisory Agreement, the Board concluded that the proposed new advisory fees payable by each Redmont Fund to Highland were reasonable in relation to the nature and quality of the services expected to be provided, taking into account the fees charged by other advisers for managing comparable funds with similar strategies, the particular performance considerations with respect to each Redmont Fund, the contractual waivers in place, and the fees Highland charges to other clients.
Projected Profitability and Costs of Services to Highland: The Board reviewed reports of the financial position of Highland. The Board considered the projected profitability of Highland’s overall relationship with the Redmont Funds, which included the proposed new advisory fees payable to Highland by the Redmont Funds, and concluded that the projected costs of providing services to each Redmont Fund pursuant to the amended
| | |
| Annual Report | April 30, 2013 | | 27 |
| | |
| Redmont Funds | | Additional Information |
| | April 30, 2013 (Unaudited) |
Redmont Advisory Agreement were not excessive. The Board reviewed the losses realized by Highland in connection with the operation of the Redmont Funds. The Board also considered Highland’s statements regarding its continuing commitment to the Redmont Funds despite these losses. The Board also considered the potential “fall-out” benefits (including the receipt of research products and services from unaffiliated brokers) that Highland might receive in connection with their association with the Redmont Funds.
The Board was provided with updated information regarding the projected profitability of Highland. The Board took note of the above factors previously considered during its initial approval of the current Redmont Advisory Agreement on December 13, 2011.
Extent of Economies of Scale as the Redmont Funds Grow and Whether Fee Levels Reflect Economies of Scale: The Board reviewed the Redmont Funds’ current financial information provided by Highland, and concluded that, to the extent any economies of scale could be realized as the assets of each Redmont Fund increase, such economies would likely be insignificant at the current time.
In connection with its review of the amended Redmont Advisory Agreement, the Board reviewed the information previously considered during the initial approval of the current Redmont Advisory Agreement on December 13, 2011.
In light of the considerations noted above, the Board, at its September 11, 2012 meeting, approved the amended Redmont Advisory Agreement for the maximum period permissible under the 1940 Act. Based on its evaluation, the Board unanimously concluded that the proposed new advisory fees payable to Highland by the Redmont Funds under the amended Redmont Advisory Agreement are reasonable, fair and in the best interests of the Redmont Funds and their shareholders. The Board believes that the amended Redmont Advisory Agreement will enable each Redmont Fund to continue to enjoy the high-quality investment management services it has received in the past from Highland, at higher management fee rates than the current rates but with total annual operating expenses on a pro-forma basis for each Redmont Fund anticipated to be lower than the corresponding current total annual operating expenses, which the Board deems appropriate, reasonable and in the best interests of each Redmont Fund and its shareholders. Based on its evaluation of the aforementioned considerations, the Board unanimously voted to approve and to recommend to the shareholders of each Redmont Fund that they approve the amended Redmont Advisory Agreement.
In approving the amended Redmont Advisory Agreement and in connection with the Board’s recommendation that shareholders of the Redmont Funds approve the amended Redmont Advisory Agreement, the Board considered the following factors discussed below, but without identifying any single factor as all-important or controlling:
| | — | | the assurances from Highland that the manner in which the Redmont Funds’ assets are managed will not change if the amended Redmont Advisory Agreement is approved, that the same people who currently manage the Redmont Funds’ assets will continue to do so after approval, and that there is not expected to be any diminution in the nature, quality and extent of services provided to the Redmont Funds; |
| | — | | the rationale for the proposed increase to each Redmont Fund’s annual advisory fee rate, in light of the SEC’s determination not to issue exemptive relief under the terms of the Trust’s and Highland’s initial application for exemptive relief dated February 12, 2012; |
| | — | | the material terms of the amended Redmont Advisory Agreement are the same as the terms of the Redmont Funds’ current Redmont Advisory Agreement but for the proposed new advisory fee rates payable to Highland by each of the Redmont Funds; |
| | — | | the assurances from Highland that it will enter into a new fee waiver agreement for both of the Redmont Funds on the terms presented to the Board; |
| | — | | the favorable history, reputation, qualification and background of Highland; |
| | — | | the qualifications of Highland’s personnel who provide advisory services to the Redmont Funds; |
| | — | | Highland’s financial condition; and |
| | — | | the potential adverse effects on Highland, and indirectly, on the Redmont Funds, in the event the amended Redmont Advisory Agreement with the new advisory fees is not approved. |
Based on the Board’s deliberations and their evaluation of the information described above, the Board, including all of the Independent Trustees, concluded that Highland’s proposed compensation for investment advisory services is consistent with the best interests of the Redmont Funds and their shareholders.
| | |
| Redmont Funds | | Additional Information |
| | April 30, 2013 (Unaudited) |
5. DISCLOSURE REGARDING APPROVAL OF FUND SUB-ADVISORY AGREEMENTS
Redmont Resolute Fund I and Redmont Resolute Fund II (the “Redmont Funds”)
On March 12, 2013, the Trustees met in person to discuss, among other things, the approval of the Sub-Advisory Agreement among the Trust, Highland Associates, Inc. (“Highland”) and Turner Investments, L.P. (“Turner”), and the Sub-Advisory Agreement among the Trust, Highland and Robeco Investment Management, Inc. (“Robeco”) (each, a “Sub-Advisory Agreement”) in accordance with Section15(c) of the 1940 Act. The Independent Trustees met with independent legal counsel during executive session and discussed each Sub-Advisory Agreement and other related materials.
In approving the Sub-Advisory Agreement with Turner and the Sub-Advisory Agreement with Robeco, the Trustees, including the Independent Trustees, considered the following factors with respect to the Redmont Funds:
Investment Advisory Fee Rate: The Trustees reviewed and considered the contractual annual advisory fee rate paid (a) by the Trust, on behalf of each Redmont Fund, to Highland of 1.50% of each Redmont Fund’s daily average net assets, and (b) the contractual annual sub-advisory fee to be paid by Highland to Turner of 1.20% of each Redmont Fund’s daily average net assets allocated to Turner and (c) the contractual annual sub-advisory fee to be paid by Highland to Robeco of 1.25% of the first $50 million of each Redmont Fund’s daily average net assets allocated to Robeco, and 1.00% of each Redmont Fund’s daily average net assets allocated to Robeco above $50 million, in light of the extent and quality of the advisory services to be provided by each to the Redmont Funds.
The Trustees considered the information they received comparing each Redmont Fund’s contractual annual advisory fee and overall expenses with those of funds in both the relevant expense group and universe of funds provided by an independent provider of investment company data.
Based on such information, the Trustees further determined that the contractual annual advisory fee of 1.50% and the estimated total expense ratio of 3.17% and 3.57% for the Class I and Class A Shares of the Redmont Resolute Fund I, respectively, taking into account the contractual fee waiver in place, and the estimate total expense ratio of 2.40% for the Class I Shares of the Redmont Resolute Fund II, taking into account the contractual fee waiver in place, are comparable to others within each Redmont Fund’s anticipated peer universe.
Nature, Extent and Quality of the Services under the Sub-Advisory Agreements: The Trustees received and considered information regarding the nature, extent and quality of services to be provided to the Redmont Funds under the Sub-Advisory Agreements with Turner and Robeco. The Trustees reviewed certain background materials supplied by Turner and Robeco in their presentations, including their Forms ADV.
The Trustees reviewed and considered Turner’s and Robeco’s investment advisory personnel, their history as asset managers and their performance and the amount of assets currently under management by each. The Trustees also reviewed the research and decision-making processes utilized by Turner and Robeco, including the methods adopted to seek to achieve compliance with the investment objectives, policies and restrictions of each Redmont Fund.
The Trustees considered the background and experience of Turner’s and Robeco’s management in connection with the Redmont Funds, including reviewing the qualifications, backgrounds and responsibilities of the management team primarily responsible for the day-to-day portfolio management of the Redmont Funds assets allocated to each and the extent of the resources devoted to research and analysis of actual and potential investments.
The Trustees also reviewed, among other things, Turner’s and Robeco’s insider trading policies and procedures and their Code of Ethics.
Performance: The Trustees noted that since Turner and Robeco had not yet begun to manage their respective portion of each Redmont Fund, there is no fund performance to be reviewed or analyzed at this time. The Trustees also considered the limitations on the comparability of performance information for certain related funds and accounts managed by each sub-adviser. The Trustees considered Turner’s and Robeco’s reputations generally and their investment techniques, risk management controls and decision-making processes.
The Adviser’s Profitability: The Trustees received and considered a projected profitability analysis prepared by Turner and Robeco based on the fees payable under each Sub-Advisory Agreement. The Trustees considered the profits, if any, anticipated to be realized by Turner and Robeco in connection with the operation of the Redmont Funds. The Board then reviewed and discussed Turner’s and Robeco’s financial statements in order to analyze the financial condition and stability and profitability of each adviser.
| | |
| Annual Report | April 30, 2013 | | 29 |
| | |
| Redmont Funds | | Additional Information |
| | April 30, 2013 (Unaudited) |
Economies of Scale: The Trustees considered whether economies of scale in the provision of services to the Redmont Funds will be passed along to the shareholders under the proposed agreements.
Other Benefits to the Sub-Advisers: The Trustees reviewed and considered any other incidental benefits derived or to be derived by Turner and Robeco from their relationship with the Redmont Funds, including soft dollar arrangements.
The Board summarized its deliberations with respect to the Sub-Advisory Agreements with Turner and Robeco. In selecting Turner and Robeco and the fees charged under the Sub-Advisory Agreements, the Trustees concluded that no single factor reviewed by the Trustees was identified by the Trustees to be determinative as the principal factor in whether to approve the Sub-Advisory Agreements. Further, the Independent Trustees were advised by separate independent legal counsel throughout the process. The Trustees, including all of the Independent Trustees, concluded that:
| | — | | the investment advisory fees received by Highland with respect to each Redmont Fund were unchanged as a result of entering into these sub-advisory agreements; |
| | — | | the nature, extent and quality of services to be rendered by Turner and Robeco under the respective Sub-Advisory Agreements were adequate; |
| | — | | there was no performance history for each of Turner and Robeco with respect to the Redmont Funds for the Board to consider; |
| | — | | the terms of the fee waiver and expense limitation agreement between the Trust, on behalf of the Redmont Funds, and Highland, were not unreasonable; |
| | — | | the profit, if any, anticipated to be realized by Turner or Robeco in connection with the operation of the Redmont Funds is not unreasonable to the Fund; and |
| | — | | there were no material economies of scale or other incidental benefits accruing to Turner or Robeco in connection with their relationship with the Redmont Funds. |
Based on the Trustees’ deliberations and their evaluation of the information described above, the Trustees, including all of the Independent Trustees, concluded that Turner’s and Robeco’s compensation for sub-investment advisory services is consistent with the best interests of each Redmont Fund and its shareholders.
| | |
| Redmont Funds | | Trustees and Officers |
| | April 30, 2013 (Unaudited) |
| | | | | | | | | | |
| INDEPENDENT TRUSTEES | | | | |
|
Name, Address* & Age | | Position(s) Held with Fund | | Term of Office and Length of Time Served** | | Principal Occupation(s) During Past 5 Years*** | | Number of
Funds in Fund Complex
Overseen by
Trustee**** | | Other
Directorships
Held by Trustee During Past 5 Years |
|
Mary K. Anstine, age 72 | | Trustee | | Ms. Anstine was elected at a special meeting of shareholders held on March 21, 1997 and re-elected at a special meeting of shareholders held on August 7, 2009. | | Ms. Anstine was President/Chief Executive Officer of HealthONE Alliance, Denver, Colorado, and former Executive Vice President of First Interstate Bank of Denver. Ms. Anstine is also Trustee/Director of AV Hunter Trust and Colorado Uplift Board. Ms. Anstine was formerly a Director of the Trust Bank of Colorado (later purchased and now known as Northern Trust Bank), HealthONE and Denver Area Council of the Boy Scouts of America, and a member of the American Bankers Association Trust Executive Committee. | | 26 | | Ms. Anstine is a Trustee of ALPS ETF Trust (4 funds); Financial Investors Variable Insurance Trust (5 funds); Reaves Utility Income Fund (1 fund); and Westcore Trust (12 funds). |
|
John R. Moran, Jr., age 82 | | Trustee | | Mr. Moran was elected at a special meeting of shareholders held on March 21, 1997 and re-elected at a special meeting of shareholders held on August 7, 2009. | | Mr. Moran is formerly President and CEO of The Colorado Trust, a private foundation serving the health and hospital community in the state of Colorado. An attorney, Mr. Moran was formerly a partner with the firm of Kutak Rock & Campbell in Denver, Colorado and a member of the Colorado House of Representatives. Currently, Mr. Moran is a member of the Treasurer’s Investment Advisory Committee for the University of Colorado. | | 26 | | None. |
|
Jeremy W. Deems, age 36 | | Trustee | | Mr. Deems was appointed as a Trustee at the March 11, 2008 meeting of the Board of Trustees and elected at a special meeting of shareholders held on August 7, 2009. | | Mr. Deems is the Co-Founder, Chief Operations Officer and Chief Financial Officer of Green Alpha Advisors, LLC. Prior to joining Green Alpha Advisors, Mr. Deems was CFO and Treasurer of Forward Management, LLC, an investment management company, ReFlow Management Co., LLC, a liquidity resourcing company, ReFlow Fund, LLC, a private investment fund, and Sutton Place Management, LLC, an administrative services company (from 2004 to June 2007). Prior to this, Mr. Deems served as Controller of Forward Management, LLC, ReFlow Management Co., LLC, ReFlow Fund, LLC and Sutton Place Management, LLC. | | 26 | | Mr. Deems is a Trustee of ALPS ETF Trust (13 funds); ALPS Variable Investment Trust (7 funds) and Reaves Utility Income Fund (1 fund). |
|
Jerry G. Rutledge, age 68 | | Trustee | | Mr. Rutledge was elected at a special meeting of shareholders held on August 7, 2009. | | Mr. Rutledge is the President and owner of Rutledge’s Inc., a retail clothing business. Mr. Rutledge is currently Director of the American National Bank. He was from 1994 to 2007 a Regent of the University of Colorado. | | 26 | | Mr. Rutledge is a Trustee of Clough Global Allocation Fund (1 fund), Clough Global Equity Fund (1 fund) and Clough Global Opportunities Fund (1 fund). |
|
Michael “Ross” Shell , age 42 | | Trustee | | Mr. Shell was elected at a special meeting of shareholders held on August 7, 2009. | | Mr. Shell is Founder and CEO* of Red Idea, LLC, a strategic consulting/early stage venture firm (since June 2008). From 1999 to 2009, he was a part-owner and Director of Tesser, Inc., a brand agency. From December 2005 to May 2008, he was Director, Marketing and Investor Relations, of Woodbourne, a REIT/real estate hedge fund and private equity firm. Prior to this, from May 2004 to November 2005, he worked as a business strategy consultant; from June 2003 to April 2004, he was on the Global Client Services team of IDEO, a product design/innovation firm; and from 1999 to 2003, he was President of Tesser, Inc. Mr. Shell graduated with honors from Stanford University with a degree in Political Science. | | 26 | | None. |
|
| * | All communications to Trustees and Officers may be directed to Financial Investors Trust c/o 1290 Broadway, Suite 1100, Denver, CO 80203. |
| ** | This is the period for which the Trustee/Officer began serving the Trust. Each Trustee/Officer serves an indefinite term, until his successor is elected |
| *** | Except as otherwise indicated, each individual has held the office shown or other offices in the same company for the last five years. |
| **** | The Fund Complex includes all series of the Trust (currently 26) and any other investment companies for which Highland Associates, Inc. provides investment advisory services (currently none). |
| | |
| Annual Report | April 30, 2013 | | 31 |
| | |
| Redmont Funds | | Trustees and Officers |
| | April 30, 2013 (Unaudited) |
| | | | | | | | | | |
| INTERESTED TRUSTEE | | | | |
|
Name, Address* & Age | | Position(s) Held with Fund | | Term of Office and Length of Time Served** | | Principal Occupation (s) During Past 5 Years*** | | Number of
Funds in Fund Complex
Overseen by
Trustee**** | | Other
Directorships
Held by Trustee |
|
Edmund J. Burke, age 52 | | Trustee,
Chairman and
President | | Mr. Burke was elected as Chairman at the August 28, 2009 meeting of the Board of Trustees. Mr. Burke was elected as Trustee at a special meeting of shareholders held on August 7, 2009. Mr. Burke was elected President of the Trust at the December 17, 2002 meeting of the Board of Trustees. | | Mr. Burke is Chief Executive Officer and a Director of ALPS Holdings, Inc. (“AHI”) (since 2005) and Director of ALPS Advisors, Inc. (“AAI”), ALPS Distributors, Inc. (“ADI”), ALPS Fund Services, Inc. (“AFS”) and FTAM Distributors, Inc. (“FDI”) and from 2001-2008, was President of AAI, ADI, AFS and FDI. Because of his positions with AHI, AAI, ADI, AFS and FDI, Mr. Burke is deemed an affiliate of the Trust as defined under the 1940 Act. Mr. Burke is Trustee and President of the Clough Global Allocation Fund (Trustee since 2006; President since 2004); Trustee and President of the Clough Global Equity Fund (Trustee since 2006; President since 2005); Trustee and President of the Clough Global Opportunities Fund (since 2006); Trustee of the Liberty All-Star Equity Fund; and Director of the Liberty All-Star Growth Fund, Inc. | | 26 | | Mr. Burke is a Trustee of Clough Global Allocation Fund (1 fund); Clough Global Equity Fund (1 fund); Clough Global Opportunities Fund (1 fund); Trustee of the Liberty All-Star Equity Fund (1 fund); and Director of the Liberty All-Star Growth Fund, Inc. (1 fund). |
|
OFFICERS | | | | |
|
| | | | |
Name,
Address* & Age | | Position(s)
Held with
Fund | | Term of Office And Length of
Time Served** | | Principal Occupation(s) During Past 5 Years*** | | |
|
Kimberly R. Storms, age 40 | | Treasurer | | Ms. Storms was elected Treasurer of the Trust at the March 12, 2013 meeting of the Board of Trustees. | | Ms. Storms is Senior Vice President - Director of Fund Administration of ALPS. Ms. Storms joined ALPS in 1998 as Assistant Controller. Because of her position with ALPS, Ms. Storms is deemed an affiliate of the Trust as defined under the 1940 Act. Ms. Storms is also Treasurer of BPV Family of Funds and ALPS Series Trust; Assistant Treasurer of Liberty All-Star Equity Fund and Liberty All-Star Growth Fund, Inc.; Assistant Treasurer of Tilson Funds; and Chief Financial Officer of The Arbitrage Funds. |
|
David T. Buhler, age 41 | | Secretary | | Mr. Buhler was elected Secretary of the Trust at the September 11, 2012 meeting of the Board of Trustees. | | Mr. Buhler joined ALPS in June 2010, and is currently Vice President and Associate Counsel of ALPS, AAI, ADI and APSD. Prior to joining ALPS, Mr. Buhler served as Associate General Counsel and Assistant Secretary of Founders Asset Management LLC from 2006 to 2009. Because of his position with ALPS, Mr. Buhler is deemed an affiliate of the Trust as defined under the 1940 Act. Mr. Buhler is also the Secretary of ALPS Variable Investment Trust and Westcore Trust. |
|
Ted Uhl, age 37 | | Chief
Compliance Officer
(“CCO”) | | Mr. Uhl was appointed CCO of the Trust at the June 8, 2010 meeting of the Board of Trustees. | | Mr. Uhl joined ALPS in October 2006, and is currently Deputy Compliance Officer of ALPS. Prior to his current role, Mr. Uhl served as Senior Risk Manager for ALPS from October 2006 until June 2010. Before joining ALPS, Mr. Uhl served a Sr. Analyst with Enenbach and Associates (RIA), and a Sr. Financial Analyst at Sprint. Because of his position with ALPS, Mr. Uhl is deemed an affiliate of the Trust as defined under the 1940 Act. Mr. Uhl is also CCO of the Clough Global Funds, Reaves Utility Income Fund, Drexel Hamilton Funds and the Transparent Value Trust. |
|
| * | All communications to Trustees and Officers may be directed to Financial Investors Trust c/o 1290 Broadway, Suite 1100, Denver, CO 80203. |
| ** | This is the period for which the Trustee/Officer began serving the Trust. Each Trustee/Officer serves an indefinite term, until his successor is elected |
| *** | Except as otherwise indicated, each individual has held the office shown or other offices in the same company for the last five years. |
| **** | The Fund Complex includes all series of the Trust (currently 26) and any other investment companies for which Highland Associates, Inc. provides investment advisory services (currently none). |

TABLE OF CONTENTS
| | |
Seafarer Overseas Growth and Income Fund | | Letter to Shareholders |
| | April 30, 2013 (Unaudited) |
LETTER TO SHAREHOLDERS
May 15, 2013
Dear Fellow Shareholders,
I am pleased to address you on behalf of the Seafarer Overseas Growth and Income Fund, which as of April 30 completed its first full fiscal year.1
During that year, the Fund’s Investor and Institutional share classes gained 18.24% and 18.33%, respectively. By comparison, the Fund’s benchmark, the MSCI Emerging Markets Total Return Index,2 rose 4.34%; and by way of broader comparison, the S&P 500 Index climbed 16.88%.
At the beginning of the fiscal year, the Fund had $2.8 million in assets under management; it finished with $37.8 million. The net asset value per share of the Investor class rose from $10.18 to $11.91, and during the year the class paid approximately $0.11 in distributions to shareholders.
At the Fund’s inception, Seafarer Capital Partners was pleased to provide a contractual obligation to the Fund that limited expenses on its Investor and Institutional share classes to 1.60% and 1.45%, respectively. The Fund’s subsequent growth allowed it to achieve some modest economies of scale; Seafarer was therefore pleased to offer in January an additional voluntary waiver that effectively capped expenses at 1.40% and 1.25% for the Investor and Institutional share classes, respectively. Seafarer’s intention is to convert the voluntary waiver into a new contractual obligation that will commence in September, concurrent with the annual release of the Fund’s prospectus.
The team at Seafarer is proud to report this progress to you. Nonetheless, we are acutely aware that our work has only just begun. If the Fund is to achieve anything of lasting worth for its shareholders, its success or failure will be measured in terms of decades, not individual years.
Something Different
Shareholder letters from fund companies typically discuss the state of affairs for financial markets, and they provide some sort of outlook for the future. My letters mostly follow convention – and this letter will conclude with the obligatory outlook. Yet I want to use most of the letter to do something different: I want to explain Seafarer’s investment approach, which is practiced “from the bottom up.”
If you finish this letter and you are still hungry for some practical details on the Fund, or you want insights on specific markets, please visit Seafarer’s website (seafarerfunds.com). You will find a large library of resources there.
Investing “From the Bottom Up”
Seafarer invests “from the bottom up.” I will explain what that phrase means, and why I believe it is essential to invest that way. Before I do so, a caveat: please note the following remarks apply only to the process of selecting individual securities for the purpose of portfolio construction. My comments do not pertain to “asset allocation,” which is a distinct and complex topic, and one that I will not address here.
Investing “from the bottom up” means selecting individual securities for your portfolio based on their unique merits. It is the opposite of investing “from the top down,” in which security selection is determined via macro-economic analysis or broad secular themes. In the former approach, you select securities because you have researched each one individually, and you have come to the conclusion they meet your risk and reward criteria. In the latter process, you usually perform some basic research on securities, but your primary emphasis is on getting the “big picture” themes and trends correct, and then translating those ideas to a basket of securities that are likely to benefit.
Each approach has its merits and drawbacks. However, I believe “top down” is ultimately more fallible, mainly because it is so difficult to implement a successful strategy of this sort consistently, over time.
| | | | |
Annual Report | April 30, 2013 | | | 1 | |
| | |
Seafarer Overseas Growth and Income Fund | | Letter to Shareholders |
| | April 30, 2013 (Unaudited) |
“Bottom up” is not inherently superior; instead, “top down” is terribly problematic, and thus “bottom up” is the only game in town.
The Trouble With the “Top Down”
Let me illustrate the difficulty with a “top down” approach. One year ago, the macro-economic outlook for the world was murky at best, and downright awful at worst. There were fears that the Eurozone would disintegrate violently, that China would face a “hard landing,” and that the U.S. would face a severe fiscal crisis, fall into recession,or both. If you adopted a “top down” approach, you most likely opted for cash, or went short.3
One year later, little has changed: the macro outlook is still murky, and most economies around the world remain in poor shape. The U.S. economy appears rehabilitated – few accurately predicted its rapid recovery! – but even so, there are plenty of critics who suggest its fiscal and monetary policies place it on thin ice. Thus a portfolio built on “top down” principles would be nearly unchanged; yet the interim twelve months offered an excellent opportunity to grow one’s financial capital. What accounts for this discrepancy?
The problem is not that returns from stocks were predictable (they were not), or that the U.S. recovery was obvious (it was not). The problem lies in the idea that anyone can make a consistent, accurate forecast about something as large and complex as an economy, even when holding to a short time horizon (e.g., six months). Even for a short-run forecast, the intricacy of a large economy is so great that it requires construction of a complex, multi-factor model (which means the model must incorporate many different variables – essentially moving pieces). Obviously, it is challenging to get such a model right – you have to specify all the variables correctly (tough!) and then you have to make the right assumptions about all the input values for each variable (even tougher).
Once that forecast exceeds anything beyond the shortest possible horizon – anything longer than a few months, really – I believe the complexity of the model rapidly approaches infinity. There are too many moving pieces; there are too many potential outcomes, some of which are known with varying probabilities, and some of which are unknowable until they unfold. This near-infinite complexity means the model’s predictive capacity rapidly falls to zero.
If you try to extend the model to incorporate other economies and their interactions with each other, I will believe you will transgress the boundaries of the near-infinite and slip into the realm of the impossible. How can your model possibly specify this complex, multi-economy environment accurately, with correct assumptions about all the underlying variables? And even if you miraculously do all of this, do you really think a model of this complexity will render practical, consistent, and timely investment advice? It seems to me that if the resulting “top down” portfolio performs well, it is by little more than random chance.
The trouble with such models and the forecasts they produce is that they are so darn appealing. They prey on our human frailties: they purport to explain everything, which alleviates our innate fear of the unknown; they are (superficially) logically consistent, and thus appeal to our sense of intellectual pride; and they often come with pithy slogans – witness the “New Normal“4 – which exploit our preference for simplicity over complexity. These models even tap into our tendency to favor action over stasis. They appear to provide the means to react to various macro-indicators and economic signals; they seem to give us tools that allow us to “do something” about the frustrating and confusing world around us. In my experience though, those tools are illusions that only amplify our natural exuberance and fear.
Ultimately, the “top down” approach appeals because it helps you convince yourself that you know something about the big picture, and what matters to your portfolio. This is a fallacy in my view; unfortunately, you have fooled yourself, albeit with the best intentions. In truth, the big picture is unknowable – or at least, it is beyond anyone’s ability to make timely, consistent and clear forecasts for the purpose of investment advice.
For proof of the fallacy, consider what happens when such models fail, publicly. If the forecasters are still in business – which is rare – they are usually engaged in convoluted efforts to re-purpose their
| | |
2 | | (855) 732-9220 | seafarerfunds.com |
| | |
| Seafarer Overseas Growth and Income Fund | | Letter to Shareholders |
| | April 30, 2013 (Unaudited) |
models, employing tons of jargon to disguise the inconvenient fact that their analysis failed to capture the breadth and complexity of reality. At such moments, the “top down” model is exposed for what it is: a concept with little substantive basis. At the same time, it is obvious that the forecaster’s contorted attempts to defend the model are only self-delusion.
A Little Bit Is Better Than Nothing At All
Investing “from the bottom up” is the opposite exercise, as the name suggests. A “bottom up” approach means you start and finish with the unique merits of individual investments. Importantly, if you truly inhabit this process, you must mostly abandon the idea that you know how the big picture will play out, or which themes will work. Essentially, you must embrace a perspective rooted in humility: you don’t pretend you know a lot about everything, but realize clearly that you know almost nothing at all.
Naturally, knowing almost nothing is frightening. However, as a bottom up investor, you enjoy two advantages that can alleviate this fear. First, you have the ability to arm yourself with tangible facts about the risks and rewards afforded by the individual investment under consideration. Second, because you are cognizant of your own ignorance, you are highly attuned to the potential for loss, and are thus more likely to undertake practical solutions to guard against such loss.
First, you have the advantage of basing your decisions on discrete, empirical facts rather than an abstract, untested hypothesis. Unlike a massive, complex macro-economy, a single company is just small enough that a human being can understand it, and wrap their mind around it. With effort, you can grasp a company’s financial position, its risks, its opportunities, its frailties. You can know a company’s assets; its revenues; its products; its operations; its competitors. These are tangible things you can measure, or see, or sometimes touch.
There are of course severe limitations to the knowledge you can accumulate. You are not an insider; and there is a constant risk of fraud and deception. Even if fraud is not part of the picture, shocks are frequent, and businesses fail for unexpected reasons. Yet even with all of these shortcomings, your bottom up research is a very valuable tool: at least you can discern and analyze real facts. If you do your homework, you will know a little bit about something with some certainty; you will no longer know nothing at all.
A quick clarification is in order. The bottom-up investor does not abandon the macro for the micro when researching an individual investment. Quite the contrary: it is healthy to develop a basic perspective about where the macro fault lines might lie. Just make sure that you constantly question that view, and never lean on it too much. Meanwhile, the key is to use the individual company as a tangible, real-world frame of reference to digest your macro thesis. Your beliefs will be sharpened in the process: you will abandon the grand but abstract framework in favor of facts drawn from the real world.
Thus the bottom up investor asks: how will this macro event affect my individual investment? What frailties (or opportunities) will it expose? What can I do within my portfolio to control the associated risks, and maximize the potential rewards? The beauty of this approach is that you remain grounded in a practical reality. Also, as your approach is necessarily empirical, you often collect data that force you to retool your macro hypothesis. Certainly, you run the risk that your data set is not representative, thereby falling prey to anecdotal evidence. Yet even with this risk, I think it is still more scientific to formulate my “macro” perspectives from the bottom up. Otherwise it is all too easy to twist the data to suit my macro theory, rather than the other way around.
Accepting (And Then Controlling) Risk
The second advantage of a bottom up approach lies in your awareness of how little you know. Armed with that knowledge, you are naturally vigilant against risk, and highly attuned to the potential for loss, as you assume nothing, and take nothing for granted. Managing risk within your portfolio thus takes on central importance.
| | | | |
Annual Report | April 30, 2013 | | | 3 | |
| | |
Seafarer Overseas Growth and Income Fund | | Letter to Shareholders |
| | April 30, 2013 (Unaudited) |
Before you manage risk within your portfolio, though, you must first accept it. Whether you are an equity investor trying to capture growth, or a fixed income investor harvesting illiquidity premia from creditors, you are necessarily exposed to risks. You must accept that the biggest risks are beyond prediction, and even mundane risks are difficult to predict in a consistent and timely manner.
However, once you have passed over this scary threshold, the knowledge is liberating: you quickly realize that just as you can’t control such risks, no one else can, either. Anyone who suggests they can radically reduce portfolio risk is engaged in fabrication (e.g., exaggerated risk management skills), or they are selling you something that is so expensive that it will do damage to your portfolio (e.g., products that offer a guaranteed return), or they are obscuring their own financial frailties (e.g., hidden counterparty risks). This awareness represents another small but vital piece of knowledge.
So, how does one take every reasonable precaution against the unknown, and the unknowable? In my view, there are only two time-tested, cost-effective means to do so. First, you must make efforts to control risk from the bottom up, by vetting your individual investments carefully. You must do your homework, and “look under the hood” to understand what you are getting for your money. In the process you will develop firsthand knowledge of the real frailties of the investment, as opposed to what the salesperson told you. Imagine relying on investment slogans and second-hand analysis during a time of financial crisis – now that is a scary thought!
Second, you must diversify. History has shown that diversification is cheap and effective. If you have done your homework from the bottom up, you will find it is surprisingly useful, as you will have direct knowledge about how to offset the important risks against each other. The approach is time-tested, and though it is not perfect, it works as well as any fancy risk management model, at lower cost.
Obviously, these two methods reduce risk, but they still leave your portfolio exposed to considerable hazards. Unfortunately, I do not have an answer to this; and no one else does – or if they do, the answer is not legal, or they have not shared it. This realization is again frightening. Yet in this fear, do not lose hope. Keep pushing yourself to find opportunity. Here’s why: there is only one constant in markets, and that is change. Where change exists, there is at least the opportunity to make progress; and progress is what begets growth (and financial profits). Change and the potential for progress always exist, even in the darkest and most confusing markets. Thus there is almost always an opportunity to invest, and grow your capital – if you are patient, disciplined, and invest “from the bottom up.”
A Brief Outlook, As Promised
For those of you who followed Seafarer’s various portfolio reviews and shareholder calls during the past year, you know I have expressed concern about whether the pace of earnings growth in the emerging markets would live up to investors’ elevated (and misplaced) expectations.
I noted last fall that the rapid gains in valuations seemed out of step with reality – a reality that would likely be characterized by a slower (but still reasonably good!) rate of growth. This has come to pass. Corporate profits have fallen below expectations in the first four months of this year. In my own opinion, the lackluster performance of emerging equities is largely attributable to the market’s belated recognition of this fact.
However, as of mid-May, the market landscape is once again different. A good deal of the valuation excesses that were apparent last year have been wrung out of the markets – with the caveat that some absurdly high valuations persist within the consumer sector. Meanwhile, corporate earnings continue to expand at a reasonably good (albeit slower) rate. As usual, I see plenty of specific issues to worry about in various countries throughout the emerging world, but nothing that appears immediate or fatal. Indeed, my research on individual companies leads me to be optimistic that growth might accelerate, just a bit.
Of course, a number of major “macro” issues cloud the picture. Will Japan collapse, or will Europe implode? Will quantitative easing beget hyperinflation?5 Will fixed income markets melt down? I can speculate about all of these things, but I will know none with any certainty. However, I do know there are plenty of prospective investments that satisfy the risk and return criteria the Fund seeks, and thus I am an enthusiastic investor.
| | |
4 | | (855) 732-9220 | seafarerfunds.com |
| | |
| Seafarer Overseas Growth and Income Fund | | Letter to Shareholders |
| | April 30, 2013 (Unaudited) |
Thank you for entrusting us with your capital. As usual, the future is murky, and I do not know whether the year ahead will bring success to the Fund. However, I do know one small thing, with certainty: we are very serious about our job.
We are honored to act as your investment adviser.
Andrew Foster
Chief Investment Officer
Seafarer Capital Partners, LLC
The views and information discussed in this commentary are as of the date of publication, are subject to change, and may not reflect the writer’s current views. The views expressed represent an assessment of market conditions at a specific point in time, are opinions only and should not be relied upon as investment advice regarding a particular investment or markets in general. Such information does not constitute a recommendation to buy or sell specific securities or investment vehicles. It should not be assumed that any investment will be profitable or will equal the performance of the Fund or any securities or any sectors mentioned herein. The subject matter contained herein has been derived from several sources believed to be reliable and accurate at the time of compilation. Seafarer does not accept any liability for losses either direct or consequential caused by the use of this information.
| 1 | Please note: the Fund’s inception was February 15, 2012. |
| 2 | The MSCI Emerging Markets Total Return Index, Standard (Large+Mid Cap) Core, Gross (dividends reinvested), USD is a free float-adjusted market capitalization index designed to measure equity market performance of emerging markets. The MSCI Emerging Markets Total Return Index consists of the following 21 emerging market country indices: Brazil, Chile, China, Colombia, Czech Republic, Egypt, Hungary, India, Indonesia, Korea, Malaysia, Mexico, Morocco, Peru, Philippines, Poland, Russia, South Africa, Taiwan, Thailand, and Turkey. Index code: GDUEEGF. It is not possible to invest directly in this or any index. |
| 3 | Short selling is the practice of borrowing securities in order to sell them shortly thereafter. The short seller’s intention is to speculate on a subsequent decline in the price of the security. The short seller might profit by repurchasing the same securities (“covering”) at a lower price, and then returning those securities to the original lender. Conversely, the short seller will incur a loss in the event that the price of a shorted instrument should rise prior to repurchase. |
| 4 | “New Normal” is a slogan for an investment theme propagated by PIMCO, a large fixed income investment manager. For more information on this topic, please see PIMCO’s latest discussion of the “New Normal,” titled “New Normal . . . Morphing” (May 2013): www.pimco.com/EN/Insights/Pages/Secular-Outlook-El-Erian-2013.aspx |
| 5 | Quantitative easing is the attempt by a central bank to inject more money into the economy and to keep long-term interest rates low through the purchase of large amounts of assets, often held by financial institutions. Hyperinflation occurs when a country experiences very high, accelerating, and possibly “unstoppable” rates of inflation. In such a condition, the general price level within an economy rapidly increases as the currency loses real value. |
| | | | |
Annual Report | April 30, 2013 | | | 5 | |
| | |
Seafarer Overseas Growth and Income Fund | | Portfolio Review |
| | April 30, 2013 (Unaudited) |
PORTFOLIO REVIEW
May 15, 2013
On April 30, the Seafarer Overseas Growth and Income Fund completed its first fiscal year of operations. 1
During the year, the Fund’s Investor and Institutional share classes gained 18.24% and 18.33%, respectively. By comparison, the Fund’s benchmark, the MSCI Emerging Markets Total Return Index, rose 4.34%; and by way of broader comparison, the S&P 500 Index climbed 16.88%.
Performance During the First Half of the Fiscal Year
During the first half of the Fund’s fiscal year (May 1, 2012 – October 31, 2012), the Fund gained 7.13% and 7.16% for the Investor and Institutional classes, respectively. The Fund’s benchmark, the MSCI Emerging Markets Total Return Index, fell -1.01% during the same period. By way of broader comparison, the S&P 500 Index gained 2.16%. During the period, the Fund distributed $0.04995 and $0.03484 per share for the Investor and Institutional classes, respectively.
During the period, stock markets in the developing world experienced substantial swings. They declined sharply between May and June, and then rose swiftly between July and September, before declining slightly once more in October. The net effect of all those gyrations is that markets finished the six-month period just shy of where they began (as measured by the benchmark index).
A number of factors drove the volatility in emerging equities. Markets stumbled in May due to renewed concerns over Greece’s ability to remain a member of the Eurozone, fears over Spain’s solvency, and worries that China’s economic growth would falter. However, by July stocks began to march upwards again; in my view, these gains occurred primarily because of three interrelated events. First, markets recognized that, as grave as the situation in Western Europe was (and is), the substantial decline priced into stocks was overdone. Second, markets anticipated extended stimulus on the part of the world’s major central banks. Indeed, both the U.S. Federal Reserve and the European Central Bank maintained relaxed monetary policies through the summer. Third, equities gained because valuations were quite depressed in June, and yet second quarter corporate profits generally exceeded the (low) expectations of investors.
As markets fell through June, the Fund also declined, but less so than the benchmark index; and as markets recovered lost ground between July and October, the Fund managed to slightly outpace the benchmark. During the six-month period, about two-thirds of the Fund’s positions contributed positively to the Fund’s performance. The Fund’s gains were relatively concentrated, though. The ten positions with the greatest contribution to performance were collectively responsible for over 80% of the Fund’s return.
The following holdings made substantial contributions to the Fund’s gains over the first half of the fiscal year:
| | • | | The top contributor to the Fund was a mid-capitalization company called Aselsan Elektronik. Aselsan is a Turkish firm that produces electronic systems and communication equipment for military and civilian markets. The company has existed for several decades, yet it has only recently undertaken efforts to operate on a truly commercial basis. In the past, the company operated essentially as a captive supplier to (and subsidiary of) the Turkish Army; consequently, Aselsan’s financial performance took a back seat. However, the company has recently begun to improve upon its commercial potential, expanding into new markets and accelerating its growth. Aselsan’s shares rose ostensibly in reflection of the company’s improved performance. |
| | • | | The Fund’s holdings in a small-capitalization company called Kingdee International also contributed to gains. Kingdee provides “enterprise management” software to small and mid-sized companies based in China. This software helps companies manage their |
| | |
6 | | (855) 732-9220 | seafarerfunds.com |
| | |
| Seafarer Overseas Growth and Income Fund | | Portfolio Review |
| | April 30, 2013 (Unaudited) |
accounts, track inventory and sales, and engage in online commerce. Kingdee has historically been a leader within its chosen niche. However, the company embarked upon an ill-fated expansion approximately two years ago, one which left the company’s finances stretched thin in light of slowing growth within the Chinese market. This caused the shares to drop nearly four-fifths between April 2011 and July 2012.2 Seafarer’s research confirmed that the company’s fundamental position has deteriorated, and that its near-term profitability is materially compromised. However, Seafarer also judged the extent of the correction overdone, and as such, the Fund began to acquire shares in the company in June 2012. The shares have since recovered a portion of their former value, to the Fund’s benefit.
| | • | | Another notable positive contribution to the Fund came from its holding in Cerebos Pacific, a Singapore-based purveyor of food and beverage products across Southeast Asia and Australia. The company was a closely-held subsidiary of the Japanese beverage company Suntory. In August, Suntory announced its intent to purchase the roughly 15% of Cerebos that it did not already own; Suntory agreed to pay a premium price in order to take the company private, and the transaction was consummated in late 2012. |
| | • | | The Fund’s two holdings in Mexico, Grupo Herdez and Kimberly-Clark de Mexico, also made prominent contributions to the Fund’s gains during the period. Their gains were likely attributable not only to strong financial performance, but also to the market’s belated recognition that the Mexican economy is much healthier than headlines convey. |
The following holding detracted the most from performance during the first half of the fiscal year:
| | • | | Market Vectors Vietnam ETF was responsible for the largest drag on performance. Vietnam saw its stock market lurch lower during the period as a series of scandals and reforms impacted its banking sector. Like China, its large neighbor to the north, Vietnam’s government has propagated a substantial number of uncompetitive, state-backed enterprises; and as in China, those entities have borrowed excessively from compliant local banks. Some of the debts have come due, and the state-backed debtors have been either unwilling or unable to repay. This outcome has led to criticism and scandal within the country’s banking sector and throughout its various political circles. Vietnam appears to be redoubling its efforts to reform the sector, yet the market stumbled amid the political and economic strife. |
Performance During the Second Half of the Fiscal Year
During the second half of the Fund’s fiscal year (October 31, 2012 – April 30, 2013), the Fund’s Investor and Institutional share classes gained 10.37% and 10.42%, respectively. By comparison, the Fund’s benchmark rose 5.40%, and the S&P 500 Index climbed 14.41%. In December, the Fund paid a second distribution to shareholders, $0.06080 and $0.08710 per share for the Investor and Institutional classes, respectively. This second distribution brought the fiscal year total to $0.11075 and $0.12194 per share for the Investor and Institutional classes, respectively.
The past six months proved to be a tumultuous period for stocks in the developing world. Emerging market equities surged from November 2012 through early January 2013; however, by late January the trend reversed and emerging markets underwent a moderate but broad-based decline. This reversal occurred despite impressive gains from U.S. equities during the same period. Investors in the emerging markets have long hoped their performance would “decouple” from the developed world; unfortunately, decoupling was all too evident, but not in a manner that was beneficial to short-run returns.
There are competing explanations as to why emerging markets saw their performance taper off. The list includes weak growth in China; a sharp, cyclical decline in commodity markets; major shifts in economic policy in Brazil; and elevated inflation in some of the largest markets, such as China, India and Brazil. However, in my view, the most important causal factor was identified in Seafarer’s semi-annual shareholder letter last fall,3 and again in our shareholder conference call in January4 : namely, that growth in corporate profits was likely to fall below the market’s elevated (and misplaced)
| | | | |
Annual Report | April 30, 2013 | | | 7 | |
| | |
Seafarer Overseas Growth and Income Fund | | Portfolio Review |
| | April 30, 2013 (Unaudited) |
expectations. As of late February, Bloomberg News reported that over 60% of the companies tracked within the MSCI Emerging Markets Index (the Fund’s benchmark) reported fourth quarter results that fell short of forecasts.5 I am convinced that the resulting disappointment was directly responsible for the volatility and poor performance that ensued. The same report stated that the equivalent ratio for the MSCI World Index – which includes most developed markets – was just over 30%, suggesting growth in the developed world was far more resilient.
Against this rocky backdrop, the Fund performed reasonably well; I am pleased the portfolio outpaced its benchmark. A number of the Fund’s mid-sized stocks performed well. The following holdings contributed the most to the Fund’s gains during the second half of the fiscal year, ranked in order of the greatest contribution:
| | • | | Aselsan, a Turkish company that specializes in electronics and communications systems, contributed the most to the Fund’s gains. The company’s shares rose as its order flow saw renewed activity from domestic and foreign customers, for both military and civilian applications. |
| | • | | Citic Telecom, a small telecommunication services company based in Hong Kong, saw its shares vault as it struck a deal to acquire Macau Telecom, the monopoly phone company in the former Portuguese colony. |
| | • | | Bangkok Bank, one of Thailand’s largest financial institutions, saw its shares steadily gain ground, as the economy in Thailand performed very well, despite ongoing political intrigues there. |
Of course, there were also notable losses during the second half of the fiscal year. The following holdings detracted the most from performance, ranked in order of the largest detraction:
| | • | | Digital China was one of the largest holdings of the Fund during the period. It is a technology company that provides software and services to corporate and government customers. Its shares plummeted on news that the company’s main shareholder was selling a large stake to cover a mysterious financial debt. The shares further retreated on news that a small subsidiary had failed to comply with strict parameters on a government project tender. I realized that, while I still hold some optimism for the company’s future, the position was a mistake, not least because of its extreme volatility, and the Fund has exited the shares. The losses incurred during the period consumed roughly half the gains generated by Aselsan. |
| | • | | Kingdee, another Hong Kong software company, saw its shares slump during the six-month period. The story here is a bit different, as Kingdee was one of the Fund’s biggest contributors during the first half of the fiscal year (as noted above). Kingdee is struggling with a tough business climate in which its profitability has been compromised, and this has led its shares to become exceedingly volatile. I remain positive about its prospects, though, and as of mid-May (after the end of the fiscal period), Kingdee had recovered a large portion of its losses. |
| | • | | Sociedad Quimica y Minera de Chile, or “SQM,” created the third largest drag on returns. SQM is a dominant and highly specialized producer of certain commodities such as lithium, iodine and potassium. Unfortunately, my short-run timing on adding this stock to the portfolio has proved to be poor: I initiated a position in the Fund at the stock’s near-term peak, last fall. It has been in steady decline ever since, largely in sympathy with the global retreat in commodity prices. However, I remain very enthusiastic about this position; there is more on this topic below. |
Allocation
As I survey global stock markets, it seems to me that a number of dramatic shifts are underway. This is an obvious truism: markets are never constant, and change is always at work. Yet at this moment, the shifts strike me as being of greater magnitude and consequence than is usually the case.
One notable shift is that within the emerging markets, the commodities / materials sector has grossly underperformed most other sectors since the fall of 2011. At that time, markets around the world were
| | |
8 | | (855) 732-9220 | seafarerfunds.com |
| | |
| Seafarer Overseas Growth and Income Fund | | Portfolio Review |
| | April 30, 2013 (Unaudited) |
under strain due to fears over the sustainability of the Eurozone, and shares in all sectors were depressed. However, by early 2012, most developed and emerging markets staged a partial recovery; but not so for emerging market commodity stocks, which remained depressed throughout the year. Early performance in 2013 has only sustained this trend: growth in China has decelerated, and commodity stocks everywhere have swooned in sympathy, even as other sectors have held up reasonably well.
I cannot yet explain this disconnect between commodities and the rest – Seafarer is currently researching the issue – but I find it intriguing, because for the better part of the past decade, investors bought commodity stocks aggressively as a means to “play” growth in the emerging world. The sector was previously considered to be “high beta”: if emerging markets were set to perform well, investors reflexively assumed commodities would perform all the better.6 That strategy is now on the rocks. In the past, I have shunned such businesses because I have not been able to make sense of the elevated valuations that investors have placed on their shares. I find it difficult to value businesses that are so deeply cyclical and volatile.
Yet now that valuations have receded so sharply, I believe that value is emerging. As a consequence, the Fund is adding to its exposure to commodities, albeit cautiously and in a very focused manner. To be sure, the Fund remains underweight the materials sector, with a 7% weighting versus 11% in the benchmark index. (Note: non-energy-related commodity businesses are classified as “materials” by the benchmark index.) Further still, I believe the stated 7% allocation for the Fund overstates its true exposure to commodities: the Fund holds only two stocks that are “pure” commodities companies (SQM and Vale, a new holding), both of which are focused on extraction of raw materials. Those two names together account for 5% of the Fund’s 7% allocation.7 The Fund’s modest allocation to extraction-based businesses is nevertheless the highest weighting I have ever placed on the sector in my career. To date, it has been the wrong bet: both SQM and Vale have detracted from performance, in line with the sector overall. Yet I am optimistic about the valuations of these two stocks, and despite their cyclicality, I believe both might deliver the sort of long-term sustainable growth that the Fund seeks.
Another major change in global markets is the drastic shift in monetary policy now underway in Japan. As I discussed in greater depth in my Tokyo Field Notes,8 I am deeply divided about what is occurring in Japan. On the one hand, I firmly believe that aggressive monetary policy is the correct prescription for what ails the country most: deflation. On the other hand, I think there is a material chance that Japan’s monetary policies will stoke intense speculation in a narrow group of financial assets. Indeed I believe a number of “mini-bubbles” are already forming, with distorted valuations evident for certain stocks and REITs (real estate investment trusts). If those mini-bubbles burst violently, I fear Japan’s new monetary policies will be discredited and withdrawn before they can induce needed change. If that happens, all the major policy options I can envision for the country will be exhausted. Thus there is a certain “go-for-broke” quality to the new policy construct that leaves little room for error. The Fund remains invested in Japan for the time being because of the individual merits of its holdings there; yet I am wary over what is likely to be a very wild ride.
Lastly, the deceleration in China’s growth rate has created yet another notable shift in global markets. I have commented at length about the causes and consequences of the deceleration, so I will not revisit the issue here.9 However, I note that within the span of the past few months, market sentiment has shifted sharply toward the negative. In the early weeks of 2013, emerging markets were ebullient; there was great hope that China’s growth would accelerate and cause an expansion in corporate profits. Now the pendulum has swung the other way – too far in my view – and valuations in some of the larger emerging markets have grown more attractive (especially in China). As a consequence, the Fund has established new positions within China whose depressed valuations seem at odds with their long-term growth prospects.
Andrew Foster
Chief Investment Officer
Seafarer Capital Partners, LLC
| | | | |
Annual Report | April 30, 2013 | | | 9 | |
| | |
Seafarer Overseas Growth and Income Fund | | Portfolio Review |
| | April 30, 2013 (Unaudited) |
The views and information discussed in this commentary are as of the date of publication, are subject to change, and may not reflect the writer’s current views. The views expressed represent an assessment of market conditions at a specific point in time, are opinions only and should not be relied upon as investment advice regarding a particular investment or markets in general. Such information does not constitute a recommendation to buy or sell specific securities or investment vehicles. It should not be assumed that any investment will be profitable or will equal the performance of the Fund or any securities or any sectors mentioned herein. The subject matter contained herein has been derived from several sources believed to be reliable and accurate at the time of compilation. Seafarer does not accept any liability for losses either direct or consequential caused by the use of this information.
| 1 | Please note: the Fund’s inception was February 15, 2012. |
| 2 | Kingdee International shares closed at HKD 5.07 on April 27, 2011; and closed at HKD 0.85 on July 30, 2012. Source: Factset. |
| 3 | Please see seafarerfunds.com/fund/shareholder-letter/2012/10/semi-annual |
| 4 | Please see seafarerfunds.com/shareholders/call/2013/01 |
| 5 | Bloomberg News, “Emerging Stocks Cheapen as Profits Disappoint,” 24 February 2013. |
| 6 | Beta is the covariance of a stock’s price movements in relation to the price movements of the market overall. It is effectively a measure of relative volatility, and a “high beta” security or sector is considered to be more volatile than the market. |
| 7 | The other 2% of the 7% in the materials sector is attributable to Taiwan Hon Chuan (THC), a producer of plastic bottles for the Asian beverage industry. THC produces plastics, and thus it is officially classified as a “materials” stock. However, I think that designation is debatable. Most companies in the materials sector produce highly commoditized products. By contrast, THC produces very specialized bottles and packaging, designed for consumer use. Its customers are bottlers, and THC is often highly integrated with its clientele, with production lines embedded within its clients’ premises. I think these features distinguish THC’s business from generic plastics companies, and as a consequence I personally believe the company is economically aligned with the consumer staples sector. |
| 8 | Please see seafarerfunds.com/field-notes/tokyo/2013/Q1 |
| 9 | For more information on this topic, please see the following commentaries and presentations available at seafarerfunds.com/archives: Letter to Shareholders (Annual Report for the period ended April 30, 2012), Inaugural Shareholder Conference Call (July 2012), Letter to Shareholders (Semi-Annual Report for the period ended October 31, 2012). |
Seafarer Overseas Growth and Income Fund Performance
| | | | | | |
Total Return (for the year ended April 30, 2013) | | 1 Year | | Since Inception* - Annualized | | Net Expense
Ratio** |
Investor Class (SFGIX) | | 18.24% | | 16.62% | | 1.49% |
Institutional Class (SIGIX) | | 18.33% | | 16.70% | | 1.35% |
MSCI Emerging Markets Total Return Index^ | | 4.34% | | 1.42% | | |
Gross expense ratio: 2.82% for Investor Class; 2.88% for Institutional Class**
Assumes reinvestment of all dividends and/or distributions before taxes. The performance data quoted represents past performance and does not guarantee future results. Future returns may be lower or higher. The investment return and principal value will fluctuate so that an investor’s shares, when redeemed, may be worth more or less than the original cost. Shares of the Fund redeemed or exchanged within 90 days of purchase are subject to a 2% redemption fee. Performance does not reflect this fee, which if deducted would reduce an individual’s return. To obtain the Fund’s most recent month-end performance, visit seafarerfunds.com or call (855) 732-9220.
| * | Inception Date: February 15, 2012. |
| ** | Seafarer Capital Partners, LLC (the “Adviser”) has agreed contractually to waive and/or reimburse fees or expenses in order to limit Total Annual Fund Operating Expenses After Fee Waiver / Expense Reimbursements (excluding acquired fund fees and expenses, brokerage expenses, interest expenses, taxes and extraordinary expenses) to 1.60% and 1.45% of the Fund’s average daily net assets for the Investor and Institutional share classes, respectively. This agreement is in effect through August 31, 2013. In addition to the |
| | |
10 | | (855) 732-9220 | seafarerfunds.com |
| | |
| Seafarer Overseas Growth and Income Fund | | Portfolio Review |
| | April 30, 2013 (Unaudited) |
| | Adviser’s agreement to contractually waive and/or reimburse fees or expenses, the Adviser has voluntarily agreed to waive a portion of its management fee payable by the Fund so that such fee is reduced to 0.75% of the Fund’s average daily net assets. Further, after giving effect to this voluntary agreement to waive a portion of its management fee, the Adviser has also agreed to voluntarily waive and/or reimburse fees or expenses of the Fund in order to limit total annual fund operating expenses (excluding acquired fund fees and expenses, brokerage expenses, interest expenses, taxes and extraordinary expenses) to 1.40% and 1.25% of the Fund’s average daily net assets for the Investor and Institutional share classes, respectively. The Adviser intends to continue these voluntary arrangements through at least August 31, 2013 (the date the existing contractual agreement expires), at which point they may be extended further. However, the Adviser may reduce or terminate these voluntary arrangements at any time without notice. |
| ^ | The MSCI Emerging Markets Total Return Index, Standard (Large+Mid Cap) Core, Gross (dividends reinvested), USD is a free float-adjusted market capitalization index designed to measure equity market performance of emerging markets. The MSCI Emerging Markets Total Return Index consists of the following 21 emerging market country indices: Brazil, Chile, China, Colombia, Czech Republic, Egypt, Hungary, India, Indonesia, Korea, Malaysia, Mexico, Morocco, Peru, Philippines, Poland, Russia, South Africa, Taiwan, Thailand, and Turkey. Index code: GDUEEGF. It is not possible to invest directly in this or any index. |
| | | | |
Annual Report | April 30, 2013 | | | 11 | |
| | |
Seafarer Overseas Growth and Income Fund | | Portfolio Review |
| | April 30, 2013 (Unaudited) |
Performance of a $10,000 Investment Since Inception
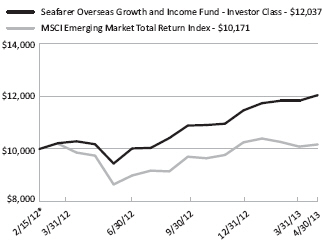
| * | Inception Date: February 15, 2012. |
The chart shown above represents historical performance of a hypothetical investment of $10,000 in the Fund’s Investor Class shares for the period from inception to April 30, 2013. All returns reflect reinvested dividends and/or distributions, but do not reflect the deduction of taxes that an investor would pay on distributions or redemptions.
The Fund also offers Institutional Class shares, performance for which is not reflected in the chart above. The performance of Institutional Class shares may be higher or lower than the performance of the Investor Class shares shown above based upon differences in fees paid by shareholders investing in the Investor Class shares and Institutional Class shares.
Investment Objective
The Fund seeks to provide long-term capital appreciation along with some current income. The Fund seeks to mitigate adverse volatility in returns as a secondary objective.
Strategy
The Fund invests primarily in the securities of companies located in developing countries. The Fund invests in several asset classes including dividend-paying common stocks, preferred stocks, convertible bonds, and fixed-income securities.
The Fund seeks to offer investors a relatively stable means of participating in a portion of developing countries’ growth prospects, while providing some downside protection compared to a portfolio that invests only in the common stocks of those countries.
| | |
12 | | (855) 732-9220 | seafarerfunds.com |
| | |
| Seafarer Overseas Growth and Income Fund | | Portfolio Review |
| | April 30, 2013 (Unaudited) |
Fund Characteristics
| | | | |
Inception Date | | | February 15, 2012 | |
Net Assets | | | $37.8M | |
Portfolio Turnover1 | | | 39% | |
| | | | |
| | | Investor Class | | Institutional Class |
Ticker | | SFGIX | | SIGIX |
NAV | | $11.91 | | $11.91 |
30-Day SEC Yield | | 1.78% | | 1.95% |
Fund Distribution Yield | | 0.93% | | 1.02% |
Net Expense Ratio | | 1.40% | | 1.25% |
Redemption Fee (within 90 calendar days) | | 2.00% | | 2.00% |
Minimum Initial Investment | | $2,500 | | $100,000 |
Minimum Initial Investment (Retirement Account) | | $1,000 | | $100,000 |
Underlying Portfolio Holdings
| | | | |
Number of Holdings | | | 48 | |
% of Net Assets in Top 10 Holdings | | | 35% | |
Weighted Average Market Cap | | | $13.0B | |
Market Cap of Portfolio Median | | | $4.6B | |
Gross Portfolio Yield2,3 | | | 3.2% | |
Price / Book Value2 | | | 1.8 | |
Price / Earnings2 | | | 13.5 | |
Forecast EPS Growth2 | | | 19% | |
Sources: ALPS Fund Services, Inc., FactSet Research Systems, Inc., Seafarer.
The “Underlying Portfolio Holdings” table presents indicative values only; Seafarer does not warrant the data’s accuracy, and disclaims any responsibility for its use for investment purposes.
Past performance does not guarantee future results.
| 1 | For the year ended April 30, 2013. |
| 2 | Calculated as a harmonic average of the underlying portfolio holdings. A harmonic average is the reciprocal of the arithmetic mean of the reciprocals. Harmonic averages are generally preferable to weighted averages or other techniques when measuring the fundamental characteristics (e.g., earnings per share, book value per share) of a portfolio of securities. For more information, see the presentation “Index Calculation Primer,” by Roger J. Bos, CFA, Senior Index Analyst at Standard & Poor’s, 17 July 2000. |
| 3 | Gross Portfolio Yield = gross yield for the underlying portfolio, estimated based on the dividend yield for common and preferred stocks and yield to maturity for bonds. This measure of yield does not account for offsetting Fund expenses and other costs, and consequently it should not be construed as the yield that an investor in the Fund would receive. |
Price / Book Value: the value of a company’s common shares, divided by the company’s book value.
Price / Earnings: the market price of a company’s common shares divided by the earnings per common share as forecast for this year.
Forecast EPS Growth: forecast growth rate of earnings per common share this year, expressed as a percentage.
| | | | |
Annual Report | April 30, 2013 | | | 13 | |
| | |
Seafarer Overseas Growth and Income Fund | | Portfolio Review |
| | April 30, 2013 (Unaudited) |
Top 10 Holdings
| | | | | | | | | | | | | | | | |
| Holding | | Sector | | Country | | % Net Assets | | Issuer Mkt
Cap ($B) | | Yield1 | | Price / Book | | Price / Earnings | | Forecast
EPS
Growth |
Sindoh Co. Ltd.2 | | Information Technology | | South Korea | | 4.8% | | $0.7 | | 3.2% | | 0.9 | | – | | – |
PGE Polska Grupa Energetyczna SA | | Utilities | | Poland | | 4.4% | | $9.8 | | 5.2% | | 0.8 | | 11 | | -6% |
SIA Engineering Co., Ltd. | | Industrials | | Singapore | | 4.3% | | $4.6 | | 4.3% | | 4.6 | | 20 | | 5% |
Ajinomoto Co. Inc | | Consumer Staples | | Japan | | 3.5% | | $8.6 | | 1.2% | | 1.4 | | 18 | | 2% |
Aselsan Elektronik Sanayi Ve Ticaret AS | | Industrials | | Turkey | | 3.1% | | $2.9 | | 1.5% | | 4.2 | | 17 | | 17% |
Bank Pekao SA | | Financials | | Poland | | 3.1% | | $12.6 | | 5.5% | | 1.7 | | 15 | | 9% |
NTT DOCOMO, Inc. | | Telecom Services | | Japan | | 3.1% | | $69.3 | | 3.7% | | 1.2 | | 13 | | 5% |
Sociedad Quimica y Minera de Chile ADR | | Materials | | Chile | | 3.0% | | $13.6 | | 2.0% | | 6.1 | | 19 | | 11% |
Odontoprev SA | | Health Care | | Brazil | | 3.0% | | $2.6 | | 3.3% | | 7.7 | | 28 | | 19% |
Bangkok Bank PCL NVDR | | Financials | | Thailand | | 2.9% | | $14.4 | | 2.9% | | 1.6 | | 11 | | 13% |
| | | | |
Cumulative Weight of Top 10 Holdings: | | | 35 | % |
Total Number of Holdings: | | | 48 | |
Portfolio holdings are subject to change.
Sources: ALPS Fund Services, Inc., FactSet Research Systems, Inc., Seafarer.
| 1 | Yield = dividend yield for common and preferred stocks and yield to maturity for bonds. |
| 2 | Sindoh Co. Ltd., a small capitalization company located in South Korea, is not followed by enough brokerage analysts so as to have public “consensus” forecasts for its earnings or EPS growth. |
The table above presents indicative values only; Seafarer does not warrant the data’s accuracy and disclaims any responsibility for its use for investment purposes.
| | |
14 | | (855) 732-9220 | seafarerfunds.com |
| | |
Seafarer Overseas Growth and Income Fund | | Portfolio Review |
| | April 30, 2013 (Unaudited) |
Portfolio Composition
| | | | |
| Region/Country | | % Net Assets | |
East & South Asia | | | 68 | |
China / Hong Kong | | | 15 | |
India | | | 2 | |
Indonesia | | | 3 | |
Japan | | | 7 | |
Malaysia | | | 5 | |
Singapore | | | 12 | |
South Korea | | | 9 | |
Taiwan | | | 5 | |
Thailand | | | 7 | |
Vietnam | | | 4 | |
Eastern Europe | | | 13 | |
Poland | | | 10 | |
Turkey | | | 3 | |
Latin America | | | 16 | |
Brazil | | | 7 | |
Chile | | | 5 | |
Mexico | | | 4 | |
Middle East & Africa | | | 2 | |
South Africa | | | 2 | |
Cash and Other Assets, Less Liabilities | | | 2 | |
Total | | | 100 | |
| |
| Asset Class | | % Net Assets | |
Common Stock | | | 84 | |
Preferred Stock | | | 6 | |
ADR | | | 6 | |
USD Convertible Bond | | | 1 | |
Foreign Currency Convertible Bond | | | 1 | |
Cash and Other Assets, Less Liabilities | | | 2 | |
Total | | | 100 | |
| |
Market Capitalization of Issuer | | | % Net Assets | |
Large Cap (over $10 billion) | | | 32 | |
Mid Cap ($1 - $10 billion) | | | 49 | |
Small Cap (under $1 billion) | | | 17 | |
Cash and Other Assets, Less Liabilities | | | 2 | |
Total | | | 100 | |
Percentage values may not sum to 100% due to rounding.
| | |
| Sector | | % Net Assets |
Consumer Discretionary | | 2 |
Consumer Staples | | 10 |
Energy | | 6 |
Financials* | | 23 |
Health Care | | 9 |
Industrials | | 16 |
Information Technology | | 13 |
Materials | | 7 |
Telecommunication Services | | 5 |
Utilities | | 7 |
Cash and Other Assets, Less Liabilities | | 2 |
Total | | 100 |
| * | The Fund’s concentration in the Financials sector includes holdings in property-related stocks, which are classified within the “Financials sector” according to the Global Industry Classification Standard (GICS) methodology utilized herein. Property-related holdings comprised 5% of the Fund’s net assets as of April 30, 2013. |
| | | | |
Annual Report | April 30, 2013 | | | 15 | |
| | |
Seafarer Overseas Growth and Income Fund | | Portfolio Review |
| | April 30, 2013 (Unaudited) |
Greatest Performance Contributors and Detractors
For the six months ended April 30, 2013
| | |
| Contributors | | % Net Assets1 |
Aselsan Elektronik Sanayi Ve Ticaret AS | | 3.1 |
Citic Telecom International Holdings, Ltd. | | 1.7 |
Bangkok Bank PCL NVDR | | 2.9 |
SIA Engineering Co., Ltd. | | 4.3 |
Sindoh Co. Ltd. | | 4.8 |
Kimberly-Clark de Mexico SAB de CV, Class A | | 1.8 |
| |
| Detractors | | % Net Assets1 |
Dongfang Electric Corp. Ltd. | | 2.6 |
Olam Intl 6.0% Cnv Bds 10/15/16 USD | | 1.3 |
Shandong Weigao Group Medical Polymer Co., Ltd., Class H | | 2.2 |
Sociedad Quimica y Minera de Chile SA ADR | | 3.0 |
Kingdee International Software Group Co. Ltd. | | 2.1 |
Digital China Holdings, Ltd.2 | | – |
| 2 | As of April 30, 2013, the Fund had no economic interest in Digital China Holdings, Ltd. |
Source: Bloomberg
The table above presents estimated values only; Seafarer does not warrant the data’s accuracy and disclaims any responsibility for its use for investment purposes.
| | |
16 | | (855) 732-9220 | seafarerfunds.com |
| | |
| Seafarer Overseas Growth and Income Fund | | Disclosure of Fund Expenses |
| | April 30, 2013 (Unaudited) |
As a shareholder of the Fund you will incur two types of costs: (1) transaction costs, including applicable redemption fees; and (2) ongoing costs, including management fees and other Fund expenses. The following examples are intended to help you understand your ongoing costs (in dollars) of investing in the Fund and to compare these costs with the ongoing costs of investing in other mutual funds. The examples are based on an investment of $1,000 invested on November 1, 2012 and held until April 30, 2013.
Actual Expenses. The first line of each table below provides information about actual account values and actual expenses. You may use the information in this line, together with the amount you invested, to estimate the expenses that you paid over the period. Simply divide your account value by $1,000 (for example, an $8,600 account value divided by $1,000 = 8.6), then multiply the result by the number in the first line under the heading “Expenses Paid During Period” to estimate the expenses you paid on your account during this period.
Hypothetical Example for Comparison Purposes. The second line of the table below provides information about hypothetical account values and hypothetical expenses based on the Fund’s actual expense ratio and an assumed rate of return of 5% per year before expenses, which is not the Fund’s actual return. The hypothetical account values and expenses may not be used to estimate the actual ending account balance or expenses you paid for the period. You may use this information to compare the ongoing costs of investing in the Fund and other mutual funds. To do so, compare this 5% hypothetical example with the 5% hypothetical examples that appear in the shareholder reports of the other funds. The expenses shown in the table are meant to highlight ongoing Fund costs only and do not reflect transaction fees, such as redemption fees or exchange fees. Therefore, the second line of each table below is useful in comparing ongoing costs only, and may not help you determine the relative total costs of owning different funds. In addition, if these transactional costs were included, your costs would have been higher.
| | | | | | | | |
| | | Beginning Account Value 11/01/12 | | Ending Account Value 04/30/13 | | Expense Ratio(a) | | Expenses Paid During Period 11/01/12 - 04/30/13(b) |
|
Investor Class | | | | | | | | |
Actual | | $ 1,000.00 | | $ 1,103.70 | | 1.47% | | $ 7.67 |
Hypothetical (5% return before expenses) | | $ 1,000.00 | | $ 1,017.50 | | 1.47% | | $ 7.35 |
|
|
Institutional Class | | | | | | | | |
Actual | | $ 1,000.00 | | $ 1,104.20 | | 1.31% | | $ 6.83 |
Hypothetical (5% return before expenses) | | $ 1,000.00 | | $ 1,018.30 | | 1.31% | | $ 6.56 |
| (a) | Annualized, based on the Fund’s most recent fiscal half year expenses. |
| (b) | Expenses are equal to the Fund’s annualized expense ratio multiplied by the average account value over the period, multiplied by the number of days in the most recent fiscal half year (181), then divided by 365. |
| | | | |
Annual Report | April 30, 2013 | | | 17 | |
| | |
| Seafarer Overseas Growth and Income Fund | | Portfolio of Investments |
| | April 30, 2013 |
| | | | | | | | | | | | | | | |
| | | Currency | | Shares | | Value |
COMMON STOCKS (90.3%) | | | | | | | | | | | | | | | |
Brazil (4.8%) | | | | | | | | | | | | | | | |
Odontoprev SA | | | | BRL | | | | | 225,700 | | | | $ | 1,125,821 | |
Aliansce Shopping Centers SA | | | | BRL | | | | | 62,000 | | | | | 700,027 | |
| | | | | | | | | | | | | | | |
| | | |
Total Brazil | | | | | | | | | | | | | | 1,825,848 | |
| | | | | | | | | | | | | | | |
| | | |
Chile (5.1%) | | | | | | | | | | | | | | | |
Sociedad Quimica y Minera de Chile SA ADR | | | | USD | | | | | 23,000 | | | | | 1,138,270 | |
Corpbanca SA | | | | CLP | | | | | 37,035,716 | | | | | 507,231 | |
Corpbanca SA/Chile ADR | | | | USD | | | | | 13,376 | | | | | 273,940 | |
| | | | | | | | | | | | | | | |
| | | |
Total Chile | | | | | | | | | | | | | | 1,919,441 | |
| | | | | | | | | | | | | | | |
| | | |
China / Hong Kong (15.5%) | | | | | | | | | | | | | | | |
Hang Lung Properties, Ltd. | | | | HKD | | | | | 275,000 | | | | | 1,070,764 | |
Dongfang Electric Corp. Ltd. | | | | HKD | | | | | 700,000 | | | | | 985,412 | |
Shandong Weigao Group Medical Polymer Co., Ltd., Class H | | | | HKD | | | | | 879,000 | | | | | 846,747 | |
Kingdee International Software Group Co., Ltd.(a) | | | | HKD | | | | | 4,806,000 | | | | | 794,637 | |
Citic Telecom International Holdings, Ltd. | | | | HKD | | | | | 1,744,000 | | | | | 634,299 | |
Beijing Enterprises Holdings, Ltd. | | | | HKD | | | | | 75,000 | | | | | 561,492 | |
Television Broadcasts, Ltd. | | | | HKD | | | | | 70,000 | | | | | 527,906 | |
Vitasoy International Holdings, Ltd. | | | | HKD | | | | | 356,000 | | | | | 431,482 | |
| | | | | | | | | | | | | | | |
| | | |
Total China / Hong Kong | | | | | | | | | | | | | | 5,852,739 | |
| | | | | | | | | | | | | | | |
| | | |
India (2.1%) | | | | | | | | | | | | | | | |
Infosys, Ltd. ADR | | | | USD | | | | | 18,600 | | | | | 776,364 | |
| | | | | | | | | | | | | | | |
| | | |
Total India | | | | | | | | | | | | | | 776,364 | |
| | | | | | | | | | | | | | | |
| | | |
Indonesia (2.7%) | | | | | | | | | | | | | | | |
Perusahaan Gas Negara Persero Tbk PT | | | | IDR | | | | | 1,610,000 | | | | | 1,035,595 | |
| | | | | | | | | | | | | | | |
| | | |
Total Indonesia | | | | | | | | | | | | | | 1,035,595 | |
| | | | | | | | | | | | | | | |
| | | |
Japan (6.5%) | | | | | | | | | | | | | | | |
Ajinomoto Co., Inc. | | | | JPY | | | | | 95,500 | | | | | 1,310,681 | |
NTT DOCOMO, Inc. | | | | JPY | | | | | 700 | | | | | 1,159,129 | |
| | | | | | | | | | | | | | | |
| | | |
Total Japan | | | | | | | | | | | | | | 2,469,810 | |
| | | | | | | | | | | | | | | |
| | | |
Malaysia (4.9%) | | | | | | | | | | | | | | | |
AMMB Holdings Bhd | | | | MYR | | | | | 420,000 | | | | | 924,897 | |
| | |
18 | | (855) 732-9220 | seafarerfunds.com |
| | |
| Seafarer Overseas Growth and Income Fund | | Portfolio of Investments |
| | April 30, 2013 |
| | | | | | | | | | | | | | | |
| | | Currency | | Shares | | Value |
Malaysia (continued) | | | | | | | | | | | | | | | |
Hartalega Holdings Bhd | | | | MYR | | | | | 530,000 | | | | $ | 912,802 | |
| | | | | | | | | | | | | | | |
| | | |
Total Malaysia | | | | | | | | | | | | | | 1,837,699 | |
| | | | | | | | | | | | | | | |
| | | |
Mexico (4.0%) | | | | | | | | | | | | | | | |
Grupo Herdez SAB de CV | | | | MXN | | | | | 230,347 | | | | | 838,501 | |
Kimberly-Clark de Mexico SAB de CV, Class A | | | | MXN | | | | | 191,300 | | | | | 669,896 | |
| | | | | | | | | | | | | | | |
| | | |
Total Mexico | | | | | | | | | | | | | | 1,508,397 | |
| | | | | | | | | | | | | | | |
| | | |
Poland (9.6%) | | | | | | | | | | | | | | | |
PGE SA | | | | PLN | | | | | 323,000 | | | | | 1,678,624 | |
Bank Pekao SA | | | | PLN | | | | | 24,500 | | | | | 1,175,388 | |
Asseco Poland SA | | | | PLN | | | | | 58,000 | | | | | 787,213 | |
| | | | | | | | | | | | | | | |
| | | |
Total Poland | | | | | | | | | | | | | | 3,641,225 | |
| | | | | | | | | | | | | | | |
| | | |
Singapore (10.3%) | | | | | | | | | | | | | | | |
SIA Engineering Co., Ltd. | | | | SGD | | | | | 400,000 | | | | | 1,644,133 | |
Hong Leong Finance, Ltd. | | | | SGD | | | | | 337,000 | | | | | 761,211 | |
Keppel Corp., Ltd. | | | | SGD | | | | | 85,000 | | | | | 741,433 | |
Singapore Technologies Engineering, Ltd. | | | | SGD | | | | | 200,000 | | | | | 715,810 | |
Keppel REIT | | | | SGD | | | | | 17,000 | | | | | 20,864 | |
| | | | | | | | | | | | | | | |
| | | |
Total Singapore | | | | | | | | | | | | | | 3,883,451 | |
| | | | | | | | | | | | | | | |
| | | |
South Africa (1.5%) | | | | | | | | | | | | | | | |
Life Healthcare Group Holdings, Ltd. | | | | ZAR | | | | | 130,000 | | | | | 549,206 | |
| | | | | | | | | | | | | | | |
| | | |
Total South Africa | | | | | | | | | | | | | | 549,206 | |
| | | | | | | | | | | | | | | |
| | | |
South Korea (4.8%) | | | | | | | | | | | | | | | |
Sindoh Co., Ltd. | | | | KRW | | | | | 26,000 | | | | | 1,817,852 | |
| | | | | | | | | | | | | | | |
| | | |
Total South Korea | | | | | | | | | | | | | | 1,817,852 | |
| | | | | | | | | | | | | | | |
| | | |
Taiwan (4.5%) | | | | | | | | | | | | | | | |
Taiwan Semiconductor Manufacturing Co., Ltd. | | | | TWD | | | | | 248,000 | | | | | 920,435 | |
Taiwan Hon Chuan Enterprise Co., Ltd. | | | | TWD | | | | | 282,000 | | | | | 784,079 | |
| | | | | | | | | | | | | | | |
| | | |
Total Taiwan | | | | | | | | | | | | | | 1,704,514 | |
| | | | | | | | | | | | | | | |
| | | |
Thailand (7.1%) | | | | | | | | | | | | | | | |
Bangkok Bank PCL NVDR | | | | THB | | | | | 140,000 | | | | | 1,080,344 | |
| | | | |
Annual Report | April 30, 2013 | | | 19 | |
| | |
Seafarer Overseas Growth and Income Fund | | Portfolio of Investments |
| | April 30, 2013 |
| | | | | | | | | | |
| | | Currency | | Shares | | | Value | |
Thailand (continued) | | | | | | | | | | |
PTT PCL | | THB | | | 88,500 | | | $ | 985,306 | |
Thai Reinsurance PCL(a) | | THB | | | 3,295,000 | | | | 624,399 | |
| | | | | | | | | | |
| | | |
Total Thailand | | | | | | | | | 2,690,049 | |
| | | | | | | | | | |
| | | |
Turkey (3.1%) | | | | | | | | | | |
Aselsan Elektronik Sanayi Ve Ticaret AS | | TRY | | | 200,000 | | | | 1,189,773 | |
| | | | | | | | | | |
| | | |
Total Turkey | | | | | | | | | 1,189,773 | |
| | | | | | | | | | |
| | | |
Vietnam (3.8%) | | | | | | | | | | |
PetroVietnam Drilling and Well Services JSC | | VND | | | 315,000 | | | | 599,558 | |
Bao Viet Holdings | | VND | | | 190,000 | | | | 424,073 | |
Nam Long Investment Corp.(a) | | VND | | | 406,300 | | | | 337,774 | |
Dry Cell & Storage Battery JSC | | VND | | | 80,990 | | | | 66,909 | |
Vietnam National Reinsurance Corp. | | VND | | | 28,800 | | | | 27,383 | |
| | | | | | | | | | |
| | | |
Total Vietnam | | | | | | | | | 1,455,697 | |
| | | | | | | | | | |
| | | |
TOTAL COMMON STOCKS (Cost $31,267,107) | | | | | | | | | 34,157,660 | |
| | | |
PREFERRED STOCKS (6.0%) | | | | | | | | | | |
Brazil (1.9%) | | | | | | | | | | |
Vale SA | | BRL | | | 45,000 | | | | 730,751 | |
| | | | | | | | | | |
| | | |
Total Brazil | | | | | | | | | 730,751 | |
| | | | | | | | | | |
| | | |
South Korea (4.1%) | | | | | | | | | | |
Samsung Fire & Marine Insurance Co., Ltd. | | KRW | | | 9,832 | | | | 791,048 | |
S-Oil Corp. | | KRW | | | 14,000 | | | | 754,661 | |
| | | | | | | | | | |
| | | |
Total South Korea | | | | | | | | | 1,545,709 | |
| | | | | | | | | | |
| | | |
TOTAL PREFERRED STOCKS | | | | | | | | | | |
(Cost $2,259,300) | | | | | | | | | 2,276,460 | |
| | |
20 | | (855) 732-9220 | seafarerfunds.com |
| | |
| Seafarer Overseas Growth and Income Fund | | Portfolio of Investments |
| | April 30, 2013 |
| | | | | | | | | | | | | | | | |
| | | Currency | | Rate | | Maturity
Date | | | Principal
Amount | | | Value | |
CONVERTIBLE CORPORATE BONDS (2.1%) | | | | | | | | | | | | | | | | |
Singapore (1.3%) | | | | | | | | | | | | | | | | |
Olam International, Ltd. | | USD | | 6.00% | | | 10/15/16 | | | $ | 500,000 | | | $ | 492,500 | |
| | | | | |
Total Singapore | | | | | | | | | | | | | | | 492,500 | |
| | | | | |
South Africa (0.8%) | | | | | | | | | | | | | | | | |
Steinhoff International Holdings, Ltd., Series SHF | | ZAR | | 9.63% | | | 07/20/15 | | | | 2,000,000 | | | | 284,950 | |
| | | | | |
Total South Africa | | | | | | | | | | | | | | | 284,950 | |
| | | | | |
TOTAL CONVERTIBLE CORPORATE BONDS (Cost $830,659) | | | | | | | | | | | | | | | 777,450 | |
| | | | | | | Currency | | | Shares | | | Value | |
WARRANTS (0.0%)(b) | | | | | | | | | | | | | | | | |
Malaysia (0.0%)(b) | | | | | | | | | | | | | | | | |
Hartalega Holdings, Strike Price 4.14 (expiration 05/29/15)(a) | | | | | | | MYR | | | | 6,860 | | | | 3,382 | |
| | | | | | | | | | | | | | | 3,382 | |
| | | | | |
TOTAL WARRANTS (Cost $–) | | | | | | | | | | | | | | | 3,382 | |
| | | | | |
TOTAL INVESTMENTS (Cost $34,357,066) (98.4%) | | | | | | | | | | | | | | $ | 37,214,952 | |
| | | | | |
Cash and Other Assets, Less Liabilities (1.6%) | | | | | | | | | | | | | | | 618,668 | |
NET ASSETS (100.0%) | | | | | | | | | | | | | | $ | 37,833,620 | |
| | | | | | | | | | | | | | | | | |
| (a) | Non-income producing security. |
Certain securities were fair valued in good faith through consideration of other factors in accordance with procedures established by and under the general supervision of the Board of Trustees (Note 2).
| | | | |
Annual Report | April 30, 2013 | | | 21 | |
| | |
Seafarer Overseas Growth and Income Fund | | Portfolio of Investments |
| | April 30, 2013 |
Currency Abbreviations
| | | | |
BRL | | - | | Brazil Real |
CLP | | - | | Chile Peso |
HKD | | - | | Hong Kong Dollar |
IDR | | - | | Indonesia Rupiah |
JPY | | - | | Japan Yen |
KRW | | - | | South Korea Won |
MXN | | - | | Mexico Peso |
MYR | | - | | Malaysia Ringgit |
PLN | | - | | Poland Zloty |
SGD | | - | | Singapore Dollar |
THB | | - | | Thailand Baht |
TRY | | - | | Turkey Lira |
TWD | | - | | Taiwan New Dollar |
USD | | - | | United States Dollar |
VND | | - | | Vietnam Dong |
ZAR | | - | | South Africa Rand |
| | | | |
|
| Common Abbreviations: |
ADR | | - | | American Depositary Receipt. |
AS | | - | | Andonim Sirketi, Joint Stock Company in Turkey. |
Bhd | | - | | Berhad, Public Limited Company in Malaysia. |
JSC | | - | | Joint Stock Company. |
Ltd. | | - | | Limited. |
NVDR | | - | | Non-Voting Depository Receipt. |
PCL | | - | | Public Company Limited. |
PT | | - | | Perseroan Terbata, Limited Liability Company in Indonesia. |
REIT | | - | | Real Estate Investment Trust. |
SA | | - | | Generally designates corporations in various countries, mostly those employing the civil law. This translates literally in all languages mentioned as anonymous company. |
SAB de CV | | - | | A variable capital company. |
Holdings are subject to change.
For Fund compliance purposes, the Fund’s geographical classifications refer to any one or more of the sub-classifications used by one or more widely recognized market indexes or ratings group indexes, and/or as defined by Fund management. This definition may not apply for purposes of this report, which may combine sub-classifications for reporting ease. Geographical regions are shown as a percentage of net assets.
See Accompanying Notes to Financial Statements.
| | |
22 | | (855) 732-9220 | seafarerfunds.com |
| | |
| Seafarer Overseas Growth and Income Fund | | Statement of Assets and Liabilities |
| | April 30, 2013 |
| | | | |
ASSETS: | | | | |
| |
Investments, at value | | $ | 37,214,952 | |
Cash | | | 493,164 | |
Foreign currency, at value (Cost $284,533) | | | 284,612 | |
Receivable for shares sold | | | 98,500 | |
Receivable due from advisor | | | 8,164 | |
Interest and dividends receivable | | | 176,323 | |
Prepaid expenses and other assets | | | 21,069 | |
| |
Total Assets | | | 38,296,784 | |
| |
LIABILITIES: | | | | |
Payable for investments purchased | | | 295,410 | |
Foreign capital gains tax | | | 60,082 | |
Administrative fees payable | | | 15,083 | |
Co-administrative & shareholder servicing fees payable | | | 2,564 | |
Payable for shares redeemed | | | 33,068 | |
Shareholder service plan fees payable | | | 7,077 | |
Trustee fees and expenses payable | | | 943 | |
Audit and tax fees payable | | | 16,419 | |
Accrued expenses and other liabilities | | | 32,518 | |
| |
Total Liabilities | | | 463,164 | |
| |
NET ASSETS | | $ | 37,833,620 | |
| |
NET ASSETS CONSIST OF: | | | | |
Paid-in capital (Note 5) | | $ | 34,269,784 | |
Accumulated net investment income | | | 60,497 | |
Accumulated net realized gain on investments and foreign currency transactions | | | 705,472 | |
Net unrealized appreciation on investments and translation of assets and liabilities in foreign currencies | | | 2,797,867 | |
| |
NET ASSETS | | $ | 37,833,620 | |
| |
INVESTMENTS, AT COST | | $ | 34,357,066 | |
PRICING OF SHARES | | | | |
Investor Class: | | | | |
Net Asset Value, offering and redemption price per share | | $ | 11.91 | |
Net Assets | | $ | 26,347,636 | |
Shares of beneficial interest outstanding | | | 2,212,911 | |
Institutional Class: | | | | |
Net Asset Value, offering and redemption price per share | | $ | 11.91 | |
Net Assets | | $ | 11,485,984 | |
Shares of beneficial interest outstanding | | | 964,185 | |
See Accompanying Notes to Financial Statements.
| | | | |
Annual Report | April 30, 2013 | | | 23 | |
| | |
Seafarer Overseas Growth and Income Fund | | Statement of Operations |
| | For the Year Ended April 30, 2013 |
| | | | |
INVESTMENT INCOME: | | | | |
Dividends | | $ | 486,099 | |
Foreign taxes withheld on dividends | | | (28,938) | |
Interest and other income | | | 16,807 | |
| |
Total investment income | | | 473,968 | |
| |
| |
EXPENSES: | | | | |
Investment advisory fees | | | 163,996 | |
Administrative and transfer agency fees | | | 184,977 | |
Co-administrative & shareholder servicing fees | | | | |
Investor Class | | | 13,999 | |
Institutional Class | | | 2,647 | |
Trustee fees and expenses | | | 1,418 | |
Registration/filing fees | | | 19,325 | |
Shareholder service plan fees | | | | |
Investor Class | | | 20,909 | |
Institutional Class | | | 2,519 | |
Legal fees | | | 8,569 | |
Audit fees | | | 16,012 | |
Reports to shareholders and printing fees | | | 9,265 | |
Custody fees | | | 39,254 | |
Offering costs | | | 52,868 | |
Miscellaneous | | | 10,817 | |
| |
Total expenses | | | 546,575 | |
Less fees waived/reimbursed by investment advisor | | | | |
Investor Class | | | (185,143) | |
Institutional Class | | | (81,165) | |
| |
Total net expenses | | | 280,267 | |
| |
NET INVESTMENT INCOME: | | | 193,701 | |
| |
Net realized gain on investments | | | 735,187 | |
Net realized loss on foreign currency transactions | | | (44,122) | |
Net change in unrealized appreciation on investments (net of foreign capital gains tax of $60,082) | | | 2,787,092 | |
Net change in unrealized appreciation on translation of assets and liabilities in foreign currency transactions | | | 576 | |
| |
NET REALIZED AND UNREALIZED GAIN ON INVESTMENTS AND FOREIGN CURRENCY TRANSLATIONS | | | 3,478,733 | |
| |
NET INCREASE IN NET ASSETS RESULTING FROM OPERATIONS | | $ | 3,672,434 | |
| |
See Accompanying Notes to Financial Statements.
| | |
24 | | (855) 732-9220 | seafarerfunds.com |
| | |
| Seafarer Overseas Growth and Income Fund | | Statements of Changes in Net Assets |
| | | | | | | | |
| | | Year Ended April 30, 2013 | | | For the Period February 15, 2012 (Inception) to April 30, 2012 | |
| | | | |
OPERATIONS: | | | | | | | | |
Net investment income | | $ | 193,701 | | | $ | 8,459 | |
Net realized gain/(loss) on investments and foreign currency transactions | | | 691,065 | | | | (4,995) | |
Net change in unrealized appreciation on investments and foreign currency translations | | | 2,787,668 | | | | 10,199 | |
| |
Net increase in net assets resulting from operations | | | 3,672,434 | | | | 13,663 | |
| |
DISTRIBUTIONS TO SHAREHOLDERS: | | | | | | | | |
From net investment income | | | | | | | | |
Investor Class | | | (112,900) | | | | – | |
Institutional Class | | | (49,868) | | | | – | |
From net realized gains on investments | | | | | | | | |
Investor Class | | | (867) | | | | – | |
Institutional Class | | | (254) | | | | – | |
| |
Net decrease in net assets from distributions | | | (163,889) | | | | – | |
| |
BENEFICIAL INTEREST TRANSACTIONS (NOTE 5): | | | | | | | | |
Shares sold | | | | | | | | |
Investor | | $ | 28,091,620 | | | $ | 1,449,187 | |
Institutional | | | 9,669,354 | | | | 1,327,000 | |
Dividends reinvested | | | | | | | | |
Investor | | | 110,846 | | | | – | |
Institutional | | | 46,662 | | | | – | |
Shares Redeemed, net of redemption fees | | | | | | | | |
Investor | | | (5,803,722) | | | | – | |
Institutional | | | (579,535) | | | | – | |
| |
Net increase in net assets derived from beneficial interest transactions | | | 31,535,225 | | | | 2,776,187 | |
| |
| | |
Net increase in net assets | | $ | 35,043,770 | | | $ | 2,789,850 | |
| | |
NET ASSETS: | | | | | | | | |
Beginning of period | | | 2,789,850 | | | | – | |
| |
End of period (including accumulated net investment income of $60,497 and $3,467, respectively) | | $ | 37,833,620 | | | $ | 2,789,850 | |
| |
| | | | |
Annual Report | April 30, 2013 | | | 25 | |
| | |
Seafarer Overseas Growth and Income Fund | | Statements of Changes in Net Assets |
| | | | | | | | |
| | | Year Ended April 30, 2013 | | | For the Period February 15, 2012 (Inception) to April 30, 2012 | |
| | | | |
Other Information: | | | | | | | | |
SHARE TRANSACTIONS: | | | | | | | | |
Investor Class | | | | | | | | |
Sold | | | 2,566,567 | | | | 141,869 | |
Distributions reinvested | | | 10,140 | | | | – | |
Redeemed | | | (505,665) | | | | – | |
| |
Net increase in shares outstanding | | | 2,071,042 | | | | 141,869 | |
| |
Institutional Class | | | | | | | | |
Sold | | | 878,414 | | | | 132,281 | |
Distributions reinvested | | | 4,298 | | | | – | |
Redeemed | | | (50,808) | | | | – | |
| |
Net increase in shares outstanding | | | 831,904 | | | | 132,281 | |
| |
See Accompanying Notes to Financial Statements.
| | |
26 | | (855) 732-9220 | seafarerfunds.com |
| | |
| Seafarer Overseas Growth and Income Fund | | Financial Highlights |
| | For a share outstanding through the periods presented |
| | | | | | | | |
| Investor Class | | Year Ended April 30, 2013 | | | For the Period February 15, 2012 (Inception) to April 30, 2012 | |
| |
NET ASSET VALUE, BEGINNING OF PERIOD | | $ | 10.18 | | | $ | 10.00 | |
INCOME FROM OPERATIONS: | | | | | | | | |
Net investment income(a) | | | 0.10 | | | | 0.05 | |
Net realized and unrealized gain on investments | | | 1.74 | | | | 0.13 | |
| |
Total from investment operations | | | 1.84 | | | | 0.18 | |
| |
| | |
LESS DISTRIBUTIONS: | | | | | | | | |
From net investment income | | | (0.11) | | | | – | |
From net realized gains on investments | | | (0.00 | ) (b) | | | – | |
| |
Total distributions | | | (0.11) | | | | – | |
| |
REDEMPTION FEES ADDED TO PAID IN CAPITAL | | | 0.00 | (c) | | | – | |
| |
NET INCREASE IN NET ASSET VALUE | | | 1.73 | | | | 0.18 | |
| |
NET ASSET VALUE, END OF PERIOD | | $ | 11.91 | | | $ | 10.18 | |
| |
| | |
TOTAL RETURN(d) | | | 18.24% | | | | 1.80% | |
RATIOS/SUPPLEMENTAL DATA: | | | | | | | | |
Net assets, end of period (in 000s) | | $ | 26,348 | | | $ | 1,443 | |
Operating expenses excluding reimbursement/waiver | | | 2.82% | | | | 18.96% | (e) |
Operating expenses including reimbursement/waiver | | | 1.49% | | | | 1.60% | (e) |
Net investment income including reimbursement/waiver | | | 0.90% | | | | 2.61% | (e) |
PORTFOLIO TURNOVER RATE(f) | | | 39% | | | | 5% | |
| (a) | Calculated using the average shares method. |
| (b) | Less than $(0.005) per share. |
| (c) | Less than $0.005 per share. |
| (d) | Total returns are for the period indicated and have not been annualized. Total returns would have been lower had certain expenses not been waived during the period. Returns shown do not reflect the deduction of taxes that a shareholder would pay on Fund distributions or the redemption of Fund shares. |
| (f) | Portfolio turnover rate for periods less than one full year have not been annualized. |
See Accompanying Notes to Financial Statements.
| | | | |
Annual Report | April 30, 2013 | | | 27 | |
| | |
Seafarer Overseas Growth and Income Fund | | Financial Highlights |
| | For a share outstanding through the periods presented |
| | | | | | | | |
| Institutional Class | | Year Ended April 30, 2013 | | | For the Period February 15, 2012 (Inception) to April 30, 2012 | |
| |
NET ASSET VALUE, BEGINNING OF PERIOD | | $ | 10.18 | | | $ | 10.00 | |
INCOME FROM OPERATIONS: | | | | | | | | |
Net investment income(a) | | | 0.14 | | | | 0.04 | |
Net realized and unrealized gain on investments | | | 1.71 | | | | 0.14 | |
| |
Total from investment operations | | | 1.85 | | | | 0.18 | |
| |
| | |
LESS DISTRIBUTIONS: | | | | | | | | |
From net investment income | | | (0.12) | | | | – | |
From net realized gains on investments | | | (0.00) (b) | | | | – | |
| |
Total distributions | | | (0.12) | | | | – | |
| |
REDEMPTION FEES ADDED TO PAID IN CAPITAL | | | 0.00 (c) | | | | – | |
| |
NET INCREASE IN NET ASSET VALUE | | | 1.73 | | | | 0.18 | |
| |
NET ASSET VALUE, END OF PERIOD | | $ | 11.91 | | | $ | 10.18 | |
| |
| | |
TOTAL RETURN(d) | | | 18.33% | | | | 1.80% | |
RATIOS/SUPPLEMENTAL DATA: | | | | | | | | |
Net assets, end of period (in 000s) | | $ | 11,486 | | | $ | 1,346 | |
Operating expenses excluding reimbursement/waiver | | | 2.88% | | | | 21.65% | (e) |
Operating expenses including reimbursement/waiver | | | 1.35% | | | | 1.45% | (e) |
Net investment income including reimbursement/waiver | | | 1.28% | | | | 2.00% | (e) |
PORTFOLIO TURNOVER RATE(f) | | | 39% | | | | 5% | |
| (a) | Calculated using the average shares method. |
| (b) | Less than $(0.005) per share. |
| (c) | Less than $0.005 per share. |
| (d) | Total returns are for the period indicated and have not been annualized. Total returns would have been lower had certain expenses not been waived during the period. Returns shown do not reflect the deduction of taxes that a shareholder would pay on Fund distributions or the redemption of Fund shares. |
| (f) | Portfolio turnover rate for periods less than one full year have not been annualized. |
See Accompanying Notes to Financial Statements.
| | |
28 | | (855) 732-9220 | seafarerfunds.com |
| | |
| Seafarer Overseas Growth and Income Fund | | Notes to Financial Statements |
| | April 30, 2013 |
1. ORGANIZATION
Financial Investors Trust (the “Trust”), a Delaware statutory trust, is an open-end management investment company registered under the Investment Company Act of 1940, as amended (“1940 Act”). As of April 30, 2013, the Trust had 26 registered funds. This annual report describes the Seafarer Overseas Growth and Income Fund (the “Fund”). The Fund seeks to provide long-term capital appreciation along with some current income; it also seeks to mitigate adverse volatility in returns. The Fund offers Investor Class and Institutional Class shares. All classes of shares have identical rights to earnings, assets and voting privileges, except for class specific expenses and exclusive rights to vote on matters affecting only individual classes.
2. SIGNIFICANT ACCOUNTING POLICIES
The accompanying financial statements were prepared in accordance with accounting principles generally accepted in the United States of America (“U.S. GAAP”). The preparation of financial statements in conformity with U.S. GAAP requires management to make certain estimates and assumptions that affect the reported amounts of assets and liabilities and disclosures of contingent assets and liabilities at the date of the financial statements and the reported amounts of revenue and expenses during the period. Actual results could differ from those estimates. The following is a summary of significant accounting policies consistently followed by the Fund in preparation of its financial statements.
Investment Valuation: The Fund generally values its securities based on market prices determined at the close of regular trading on the New York Stock Exchange (“NYSE”), normally 4:00 p.m. Eastern Time, on each day the NYSE is open for trading.
For equity securities and mutual funds that are traded on an exchange, the market price is usually the closing sale or official closing price on that exchange. In the case of equity securities not traded on an exchange, or if such closing prices are not otherwise available, the securities are valued at the mean of the most recent bid and ask prices on such day. Redeemable securities issued by open-end registered investment companies are valued at the investment company’s applicable net asset value, with the exception of exchange-traded open-end investment companies, which are priced as equity securities.
Equity securities that are primarily traded on foreign securities exchanges are valued at the closing values of such securities on their respective foreign exchanges, except when an event occurs subsequent to the close of the foreign exchange and the close of the NYSE that was likely to have changed such value. In such an event, the fair values of those securities are determined in good faith through consideration of other factors in accordance with procedures established by and under the general supervision of the Board of Trustees (the “Board”). The Fund will use a fair valuation model provided by an independent pricing service, which is intended to reflect fair value when a security’s value or a meaningful portion of the Fund’s portfolio is believed to have been materially affected by a valuation event that has occurred between the close of the exchange or market on which the security is traded and the close of the regular trading day on the NYSE. The Fund’s valuation procedures set forth certain triggers which instruct when to use the fair valuation model.
The market price for debt obligations is generally the price supplied by an independent third-party pricing service approved by the Board which may use a matrix, formula or other objective method that takes into consideration quotations from dealers, market transactions in comparable investments, market indices and yield curves. If vendors are unable to supply a price, or if the price supplied is deemed to be
| | | | |
Annual Report | April 30, 2013 | | | 29 | |
| | |
Seafarer Overseas Growth and Income Fund | | Notes to Financial Statements |
| | April 30, 2013 |
unreliable, the market price may be determined using quotations received from one or more broker–dealers that make a market in the security. Short–term debt obligations that will mature in 60 days or less are valued at amortized cost, unless it is determined that using this method would not reflect an investment’s fair value.
Forward currency exchange contracts have a market value determined by the prevailing foreign currency exchange daily rates and current foreign currency exchange forward rates. The foreign currency exchange forward rates are calculated using an automated system that estimates rates on the basis of the current day foreign currency exchange rates and forward foreign currency exchange rates supplied by a pricing service.
When such prices or quotations are not available, or when the Fair Value Committee appointed by the Board believes that they are unreliable, securities may be priced using fair value procedures approved by the Board.
Certain foreign countries impose a tax on capital gains which is accrued by the Fund based on unrealized appreciation, if any, on affected securities. The tax is paid when the gain is realized.
Fair Value Measurements: The Fund discloses the classification of its fair value measurements following a three-tier hierarchy based on the inputs used to measure fair value. Inputs refer broadly to the assumptions that market participants would use in pricing the asset or liability, including assumptions about risk. Inputs may be observable or unobservable. Observable inputs reflect the assumptions market participants would use in pricing the asset or liability that are developed based on market data obtained from sources independent of the reporting entity. Unobservable inputs reflect the reporting entity’s own assumptions about the assumptions market participants would use in pricing the asset or liability that are developed based on the best information available.
Various inputs are used in determining the value of the Fund’s investments as of the end of the reporting period. When inputs used fall into different levels of the fair value hierarchy, the level in the hierarchy within which the fair value measurement falls is determined based on the lowest level input that is significant to the fair value measurement in its entirety. The designated input levels are not necessarily an indication of the risk or liquidity associated with these investments. These inputs are categorized in the following hierarchy under applicable financial accounting standards:
| | | | |
Level 1 | | – | | Unadjusted quoted prices in active markets for identical investments, unrestricted assets or liabilities that a Fund has the ability to access at the measurement date; |
| | |
Level 2 | | – | | Quoted prices which are not active, quoted prices for similar assets or liabilities in active markets or inputs other than quoted prices that are observable (either directly or indirectly) for substantially the full term of the asset or liability; and |
| | |
Level 3 | | – | | Significant unobservable prices or inputs (including the Fund’s own assumptions in determining the fair value of investments) where there is little or no market activity for the asset or liability at the measurement date. |
| | |
30 | | (855) 732-9220 | seafarerfunds.com |
| | |
| Seafarer Overseas Growth and Income Fund | | Notes to Financial Statements |
| | April 30, 2013 |
The following is a summary of each input used to value the Fund as of April 30, 2013:
| | | | | | | | | | | | | | | | |
Investments in Securities at
Value | | Level 1 - Quoted Prices | | | Level 2 - Other Significant
Observable
Inputs | | | Level 3 - Significant Unobservable
Inputs | | | Total | |
| |
Common Stocks | | | | | | | | | | | | | | | | |
Brazil | | $ | 1,825,848 | | | $ | – | | | $ | – | | | $ | 1,825,848 | |
Chile | | | 1,919,441 | | | | – | | | | – | | | | 1,919,441 | |
China / Hong Kong | | | – | | | | 5,852,739 | | | | – | | | | 5,852,739 | |
India | | | 776,364 | | | | – | | | | – | | | | 776,364 | |
Indonesia | | | – | | | | 1,035,595 | | | | – | | | | 1,035,595 | |
Japan | | | – | | | | 2,469,810 | | | | – | | | | 2,469,810 | |
Malaysia | | | 1,837,699 | | | | – | | | | – | | | | 1,837,699 | |
Mexico | | | 1,508,397 | | | | – | | | | – | | | | 1,508,397 | |
Poland | | | – | | | | 3,641,225 | | | | – | | | | 3,641,225 | |
Singapore | | | – | | | | 3,883,451 | | | | – | | | | 3,883,451 | |
South Africa | | | 549,206 | | | | – | | | | – | | | | 549,206 | |
South Korea | | | 1,817,852 | | | | – | | | | – | | | | 1,817,852 | |
Taiwan | | | – | | | | 1,704,514 | | | | – | | | | 1,704,514 | |
Thailand | | | – | | | | 2,690,049 | | | | – | | | | 2,690,049 | |
Turkey | | | – | | | | 1,189,773 | | | | – | | | | 1,189,773 | |
Vietnam | | | 1,455,697 | | | | – | | | | – | | | | 1,455,697 | |
Preferred Stocks | | | | | | | | | | | | | | | | |
Brazil | | | 730,751 | | | | – | | | | – | | | | 730,751 | |
South Korea | | | – | | | | 1,545,709 | | | | – | | | | 1,545,709 | |
Convertible Corporate | | | | | | | | | | | | | | | | |
Bonds(a) | | | – | | | | 777,450 | | | | – | | | | 777,450 | |
Warrants(a) | | | 3,382 | | | | – | | | | – | | | | 3,382 | |
| |
Total | | $ | 12,424,637 | | | $ | 24,790,315 | | | $ | – | | | $ | 37,214,952 | |
| |
| (a) | For detailed descriptions of countries, see the accompanying Portfolio of Investments. |
The Fund recognizes transfers between levels as of the end of the period. For the year ended April 30, 2013, the Fund did not have any securities that used significant unobservable inputs (Level 3) in determining fair value.
| | | | |
Annual Report | April 30, 2013 | | | 31 | |
| | |
Seafarer Overseas Growth and Income Fund | | Notes to Financial Statements |
| | April 30, 2013 |
Security amounts the Fund transferred between Levels 1 and 2 at April 30, 2013 were as follows:
| | | | | | | | | | | | | | | | |
| | | Level 1 - Quoted Prices | | | Level 2 - Other Significant Observable Inputs | |
| | | Transfers In | | | Transfers (Out) | | | Transfers In | | | Transfers (Out) | |
| |
Common Stocks | | $ | 2,386,905 | | | $ | – | | | $ | – | | | $ | (2,386,905) | |
Preferred Stocks | | | – | | | | (791,048) | | | | 791,048 | | | | – | |
| |
Total | | $ | 2,386,905 | | | $ | (791,048) | | | $ | 791,048 | | | $ | (2,386,905) | |
| |
The above transfers were due to the Fund utilizing a fair value evaluation service with respect to international securities with an earlier market closing than the Fund’s net asset value computation cutoff. When events trigger the use of the fair value evaluation service on a reporting date, it results in certain securities transferring from a Level 1 to a Level 2.
Investment Transactions and Investment Income: Investment transactions are accounted for on the date the investments are purchased or sold (trade date). Realized gains and losses from investment transactions are reported on an identified cost basis. Interest income, which includes accretion of discounts and amortization of premiums, is accrued and recorded as earned. Dividend income is recognized on the ex-dividend date or for certain foreign securities, as soon as information is available to the Fund. All of the realized and unrealized gains and losses and net investment income are allocated daily to each class in proportion to its average daily net assets.
Foreign Securities: The Fund may directly purchase securities of foreign issuers. Investing in securities of foreign issuers involves special risks not typically associated with investing in securities of U.S. issuers. The risks include possible reevaluation of currencies, the inability to repatriate foreign currency, less complete financial information about companies and possible future adverse political and economic developments. Moreover, securities of many foreign issuers and their markets may be less liquid and their prices more volatile than those of securities of comparable U.S. issuers.
Foreign Currency Translation: The books and records of the Fund are maintained in U.S. dollars. Investment valuations and other assets and liabilities initially expressed in foreign currencies are converted each business day into U.S. dollars based upon current exchange rates. Prevailing foreign exchange rates may generally be obtained at the close of the NYSE (normally, 4:00 p.m. Eastern time). The portion of realized and unrealized gains or losses on investments due to fluctuations in foreign currency exchange rates is not separately disclosed and is included in realized and unrealized gains or losses on investments, when applicable.
Foreign Currency Spot Contracts: The Fund may enter into foreign currency spot contracts to facilitate transactions in foreign securities or to convert foreign currency receipts into U.S. dollars. A foreign currency spot contract is an agreement between two parties to buy and sell currencies at the current market rate, for settlement generally within two business days. The U.S. dollar value of the contracts is determined using current currency exchange rates supplied by a pricing service. The contract is marked-to-market daily for settlements beyond one day and any change in market value is recorded as an unrealized gain or loss. When the contract is closed, the Fund records a realized gain or loss equal to the difference between the value on the open and close date. Losses may arise from changes in the value of the foreign currency, or if the counterparties do not perform under the contract’s terms. The maximum potential loss from such contracts is the aggregate face value in U.S. dollars at the time the contract was opened.
| | |
32 | | (855) 732-9220 | seafarerfunds.com |
| | |
| Seafarer Overseas Growth and Income Fund | | Notes to Financial Statements |
| | April 30, 2013 |
Trust Expenses: Some expenses of the Trust can be directly attributed to the Fund. Expenses which cannot be directly attributed to the Fund are apportioned among all funds in the Trust based on average net assets of each fund.
Fund and Class Expenses: Expenses that are specific to the Fund or class of shares of the Fund are charged directly to the Fund or share class. All expenses of the Fund, other than class specific expenses, are allocated daily to each class in proportion to its average daily net assets. Fees provided under the shareholder service plans for a particular class of the Fund are charged to the operations of such class.
Offering Costs: Offering costs, including costs of printing initial prospectuses, legal and registration fees, are being amortized over twelve months from the inception date of the Fund. As of April 30, 2013, all offering costs have been amortized by the Fund.
Federal Income Taxes: The Fund complies with the requirements under Subchapter M of the Internal Revenue Code of 1986, as amended, applicable to regulated investment companies and intends to distribute substantially all of its net taxable income and net capital gains, if any, each year so that it will not be subject to excise tax on undistributed income and gains. The Fund is not subject to income taxes to the extent such distributions are made.
As of and during the year ended April 30, 2013, the Fund did not have a liability for any unrecognized tax benefits. The Fund files U.S. federal, state, and local tax returns as required. The Fund’s tax returns are subject to examination by the relevant tax authorities until expiration of the applicable statute of limitations, which is generally three years after the filing of the tax return for federal purposes and four years for most state returns. Tax returns for open years have incorporated no uncertain tax positions that require a provision for income taxes.
Distributions to Shareholders: The Fund normally pays dividends from net investment income, if any, on a semi-annual basis. The Fund normally distributes capital gains, if any, on an annual basis. Income dividend distributions are derived from interest and other income the Fund receives from its investments, including short term capital gains. Long term capital gain distributions are derived from gains realized when the Fund sells a security it has owned for more than one year. The Fund may make additional distributions and dividends at other times if the adviser believes doing so may be necessary for the Fund to avoid or reduce taxes.
3. TAX BASIS INFORMATION
Reclassifications: As of April 30, 2013, permanent differences in book and tax accounting were reclassified. These differences had no effect on net assets and were primarily attributed to non-deductible offering expenses, PFICs and foreign currency. The reclassifications were as follows:
| | | | | | | | | | | | |
| | | Paid-in Capital | | | Accumulated net Investment Income | | | Accumulated Net Realized Gain on Investments | |
| |
Seafarer Overseas Growth and Income Fund | | $ | (40,504 | ) | | $ | 26,097 | | | $ | 14,407 | |
| | | | |
Annual Report | April 30, 2013 | | | 33 | |
| | |
Seafarer Overseas Growth and Income Fund | | Notes to Financial Statements |
| | April 30, 2013 |
Tax Basis of Investments: As of April 30, 2013, the aggregate cost of investments, gross unrealized appreciation/ (depreciation) and net unrealized appreciation for Federal tax purposes were as follows:
| | | | | | | | | | |
| | | Cost of
Investments | | Gross
Unrealized
Appreciation | | Gross
Unrealized (Depreciation) | | Net
Depreciation
on Foreign
Currencies | | Net Unrealized
Appreciation |
Seafarer Overseas Growth and Income Fund | | $ 34,730,674 | | $ 3,506,436 | | $ (1,022,158) | | $ (60,019) | | $ 2,424,259 |
Components of Earnings: As of April 30, 2013, components of distributable earnings were as follows:
| | | | |
Undistributed ordinary income | | | $ 1,077,436 | |
Accumulated capital gains | | | 63,316 | |
Net unrealized appreciation on investments | | | 2,424,259 | |
Other cumulative effect of timing differences | | | (1,175 | ) |
| |
Total distributable earnings | | | $ 3,563,836 | |
| | |
Capital Losses: As of April 30, 2013, the Fund has no accumulative capital loss carryforwards.
Tax Basis of Distributions to Shareholders: The character of distributions made during the year from net investment income or net realized gains may differ from its ultimate characterization for federal income tax purposes. Also, due to the timing of dividend distributions, the fiscal year in which amounts are distributed may differ from the fiscal year in which the income or realized gain is recorded by the Fund.
The tax character of distributions paid by the Fund for the fiscal year ended April 30, 2013, were as follows:
| | | | | | | | |
| | | Ordinary Income | | | Long-Term Capital
Gain | |
Seafarer Overseas Growth and Income Fund | | | $ 163,889 | | | | $ – | |
During the period ended April 30, 2012, the Fund did not make any distributions.
4. SECURITIES TRANSACTIONS
The cost of purchases and proceeds from sales of securities excluding short term securities during the year ended April 30, 2013, were as follows:
| | | | | | | | |
| | | Purchases of
Securities | | | Proceeds From Sales
of Securities | |
Seafarer Overseas Growth and Income Fund | | | $ 38,421,861 | | | | $ 7,402,057 | |
| | |
34 | | (855) 732-9220 | seafarerfunds.com |
| | |
| Seafarer Overseas Growth and Income Fund | | Notes to Financial Statements |
| | April 30, 2013 |
5. SHARES OF BENEFICIAL INTEREST
The capitalization of the Trust consists of an unlimited number of shares of beneficial interest with no par value per share. Holders of the shares of the Fund of the Trust have one vote for each share held and a proportionate fraction of a vote for each fractional share. All shares issued and outstanding are fully paid and are non-assessable, transferable and redeemable at the option of the shareholder. Shares have no pre-emptive rights.
Shares redeemed within 90 days of purchase may incur a 2% short-term redemption fee deducted from the redemption amount. The redemption fee is reflected in the “Shares redeemed, net of redemption fees” in the Statements of Changes in Net Assets. During the year ended April 30, 2013 and the period ended April 30, 2012, the Fund retained the following redemption fees:
| | | | | | | | |
| Fund | | For the
year ended
April 30, 2013 | | | For the
period ended
April 30, 2012 | |
Seafarer Overseas Growth and Income Fund – Investor Class | | $ | 5,490 | | | | – | |
Seafarer Overseas Growth and Income Fund – Institutional Class | | $ | 928 | | | | – | |
6. MANAGEMENT AND RELATED-PARTY TRANSACTIONS
Seafarer Capital Partners, LLC (“Seafarer” or the “Adviser”), subject to the authority of the Board, is responsible for the overall management and administration of the Fund’s business affairs. The Adviser manages the investments of the Fund in accordance with the Fund’s investment objective, policies and limitations and investment guidelines established jointly by the Adviser and the Trustees. Pursuant to the Advisory Agreement, (the “Advisory Agreement”), the Fund pays the Adviser an annual management fee of 0.85%, based on the Fund’s average daily net assets. The management fee is paid on a monthly basis. Effective January 15, 2013, the Adviser voluntarily agreed to waive a portion of its management fee payable by the Fund so that such fee is reduced to 0.75% of the Fund’s average daily net assets. The Adviser intends to continue this voluntary arrangement through at least August 31, 2013 (the date the existing Advisory Agreement expires).
The Adviser has contractually agreed to limit certain Fund expenses to 1.60% of the Fund’s average daily net assets in the Investor Class shares and 1.45% of the Fund’s average daily net assets in the Institutional Class shares until August 31, 2013. Effective January 15, 2013, the Adviser has also agreed to voluntarily waive and/or reimburse fees or expenses of the Fund in order to limit total annual fund operating expenses (excluding acquired fund fees and expenses, brokerage expenses, interest expenses, taxes and extraordinary expenses) to 1.40% and 1.25% of the Fund’s average daily net assets for the Investor and Institutional share classes, respectively. The Adviser intends to continue this voluntary arrangement through at least August 31, 2013 (the date the existing Advisory Agreement expires), at which point it may be extended further. The Fund may have to repay some of these waivers and reimbursements to the Adviser in the following three years. Pursuant to this agreement, the Fund will reimburse the Adviser for any contractual fee waivers and expense reimbursements made by the Adviser, provided that any such reimbursements made by the Fund to the Adviser will not cause the Fund’s expense limitation to exceed expense limitations in existence at the time the expense was incurred, or at the time of the reimbursement, whichever is lower, and the reimbursement is made within three years after the end of the fiscal year in which fees or expenses were incurred.
| | | | |
Annual Report | April 30, 2013 | | | 35 | |
| | |
Seafarer Overseas Growth and Income Fund | | Notes to Financial Statements |
| | April 30, 2013 |
For the year ended April 30, 2013, the fee waivers and/or reimbursements were as follows:
| | | | | | | | | | | | | | |
| Fund | | Fees Waived/
Reimbursed
By Advisor | | | Recoupment
of Previously
Waived Fees
By Advisor | | | Total | | | |
Seafarer Overseas Growth and Income Fund | | | | | | | | | | | | | | |
Investor Class | | | $185,143 | | | $ | – | | | $ | 185,143 | | | |
Institutional Class | | | 81,165 | | | | – | | | | 81,165 | | | |
As of April 30, 2013, the balances of recoupable expenses for each class were as follows:
| | | | | | | | | | | | | | |
| Fund | | Expires 2015 | | | Expires 2016 | | | Total | | | |
Seafarer Overseas Growth and Income Fund | | | | | | | | | | | | | | |
Investor Class | | $ | 22,136 | | | | $177,710 | | | $ | 199,846 | | | |
Institutional Class | | | 51,869 | | | | 78,354 | | | | 130,223 | | | |
Fund Accounting Fees and Expenses
ALPS Fund Services, Inc. (“ALPS” and the “Administrator”) (an affiliate of ALPS Distributors, Inc.) provides administrative, fund accounting and other services to the Fund under the Administration, Bookkeeping and Pricing Services Agreement with the Trust. Under this Agreement, ALPS is paid fees by the Fund, accrued on a daily basis and paid on a monthly basis following the end of the month, based on the greater of (a) an annual total fee of $123,000 in year 1 of operations and $143,000 in year 2 and forward from the first to the last, or projected last, day of the then-current year of services; or (b) the following fee schedule:
| | | | | | |
| Average Total Net Assets | | Contractual Fee | | | |
Between $0-$500M | | | 0.05 | % | | |
$500M-$1B | | | 0.03 | % | | |
Above $1B | | | 0.02 | % | | |
The Administrator is also reimbursed by the Fund for certain out-of-pocket expenses.
Administrative and Shareholder Services
The Adviser provides administrative and shareholder services to the Fund under the Co-Administration and Shareholder Services Agreement with the Trust. Under this Agreement, the Adviser is paid fees, accrued on a daily basis and paid on a monthly basis following the end of the month, of 0.10% of the average daily net assets of the Investor Class and of 0.05% of the average daily net assets of the Institutional Class and is reimbursed for certain out-of-pocket expenses.
Transfer Agent
ALPS serves as transfer, dividend paying and shareholder servicing agent for the Fund (“Transfer Agent”). ALPS is compensated based upon a $25,000 annual base fee for the Fund, and annually $9 per direct open account and $7 per open account through NSCC. The Transfer Agent is also reimbursed by the Fund for certain out-of-pocket expenses.
Compliance Services
ALPS provides services that assist the Trust’s Chief Compliance Officer in monitoring and testing the policies and procedures of the Trust in conjunction with requirements under Rule 38a-1 under the 1940 Act under the
| | |
36 | | (855) 732-9220 | seafarerfunds.com |
| | |
Seafarer Overseas Growth and Income Fund | | Notes to Financial Statements |
| | April 30, 2013 |
Chief Compliance Officer Services Agreement with the Trust. Under this Agreement, the Adviser pays ALPS an annual base fee of $30,000 and reimburses ALPS for certain out-of-pocket expenses.
Principal Financial Officer
ALPS provides principal financial officer services to the Fund under the Principal Financial Officer Services Agreement with the Trust. Under this Agreement, the Adviser pays ALPS an annual base fee of $10,000 and reimburses ALPS for certain out-of-pocket expenses.
Distributor
ALPS Distributors, Inc. (“ADI” or the “Distributor”) (an affiliate of ALPS) acts as the distributor of the Fund’s shares pursuant to the Distribution Agreement with the Trust. Under this agreement, the Adviser pays ADI an annual base fee of $12,000 and reimburses ADI for certain out-of-pocket expenses. Shares are sold on a continuous basis by ADI as agent for the Fund, and ADI has agreed to use its best efforts to solicit orders for the sale of the Fund’s shares, although it is not obliged to sell any particular amount of shares. ADI is registered as a broker-dealer with the Securities and Exchange Commission.
Shareholder Services Plan for Investor Class and Institutional Class Shares
The Fund has adopted a shareholder service plan (a “Service Plan”) for each of its share classes. Under the Service Plan, the Fund is authorized to enter into shareholder service agreements with investment advisors, financial institutions and other service providers (“Participation Organizations”) to maintain and provide certain administrative and servicing functions in relation to the accounts of shareholders. The Service Plan will cause the Fund to pay an aggregate fee, not to exceed on an annual basis 0.15% and 0.05% of the average daily net asset value of the Investor and Institutional classes, respectively. Such payment will be made on assets attributable to or held in the name of a Participating Organization, on behalf of its clients as compensation for providing service activities pursuant to an agreement with a Participating Organization. Any amount of such payment not paid during the Fund’s fiscal year for such service activities shall be reimbursed to the Fund as soon as practicable after the end of the fiscal year.
7. INDEMNIFICATIONS
Under the Trust’s organizational documents, its officers and Trustees are indemnified against certain liability arising out of the performance of their duties to the Trust. Additionally, in the normal course of business, the Trust enters into contracts with service providers that may contain general indemnification clauses, which may permit indemnification to the extent permissible under the applicable law. The Trust’s maximum exposure under these arrangements is unknown, as this would involve future claims that may be made against the Trust that have not yet occurred.
| | | | |
Annual Report | April 30, 2013 | | | 37 | |
| | |
Seafarer Overseas Growth and Income Fund | | Report of Independent Registered Public Accounting Firm |
To the Shareholders and Board of Trustees of Financial Investors Trust:
We have audited the accompanying statement of assets and liabilities, including the portfolio of investments, of Seafarer Overseas Growth and Income Fund (the “Fund”), one of the funds constituting Financial Investors Trust, as of April 30, 2013, the related statement of operations for the year then ended, and the statements of changes in net assets and the financial highlights for the year then ended and for the period from February 15, 2012 (inception) to April 30, 2012. These financial statements and financial highlights are the responsibility of the Fund’s management. Our responsibility is to express an opinion on these financial statements and financial highlights based on our audits.
We conducted our audits in accordance with the standards of the Public Company Accounting Oversight Board (United States). Those standards require that we plan and perform the audit to obtain reasonable assurance about whether the financial statements and financial highlights are free of material misstatement. The Fund is not required to have, nor were we engaged to perform, an audit of its internal control over financial reporting. Our audits included consideration of internal control over financial reporting as a basis for designing audit procedures that are appropriate in the circumstances, but not for the purpose of expressing an opinion on the effectiveness of the Fund’s internal control over financial reporting. Accordingly, we express no such opinion. An audit also includes examining, on a test basis, evidence supporting the amounts and disclosures in the financial statements, assessing the accounting principles used and significant estimates made by management, as well as evaluating the overall financial statement presentation. Our procedures included confirmation of securities owned as of April 30, 2013, by correspondence with the custodian and brokers; where replies were not received from brokers, we performed other auditing procedures. We believe that our audits provide a reasonable basis for our opinion.
In our opinion, the financial statements and financial highlights referred to above present fairly, in all material respects, the financial position of Seafarer Overseas Growth and Income Fund of Financial Investors Trust as of April 30, 2013, the results of its operations for the year then ended, and the changes in its net assets and the financial highlights for the year then ended and for the period from February 15, 2012 (inception) to April 30, 2012, in conformity with accounting principles generally accepted in the United States of America.
DELOITTE & TOUCHE LLP
Denver, Colorado
June 27, 2013
| | |
38 | | (855) 732-9220 | seafarerfunds.com |
| | |
| Seafarer Overseas Growth and Income Fund | | Additional Information |
| | April 30, 2013 (Unaudited) |
1. FUND HOLDINGS
The Fund files its complete schedule of portfolio holdings with the Securities and Exchange Commission (the “SEC”) for the first and third quarters of each fiscal year on Form N-Q within 60 days after the end of the period. Copies of the Fund’s Form N-Q are available without charge on the SEC website at http://www.sec.gov. You may also review and copy the Form N-Q at the SEC’s Public Reference Room in Washington, D.C. For more information about the operation of the Public Reference Room, please call the SEC at 1-800-SEC-0330.
2. FUND PROXY VOTING POLICIES, PROCEDURES AND SUMMARIES
The Fund’s policies and procedures used in determining how to vote proxies and information regarding how the Fund voted proxies relating to portfolio securities during the most recent prior 12-month period ending June 30 are available without charge, (1) upon request, by calling toll-free at (855) 732-9220 and (2) on the SEC’s website at http://www.sec.gov.
3. TAX DESIGNATIONS
The Fund designates the following as a percentage of taxable ordinary income distributions, or up to the maximum amount allowable, for the calendar year ended December 31, 2012:
| | |
| Dividends Received Deduction | | Qualified Dividend Income |
0.00% | | 49.48% |
In early 2013, if applicable, shareholders of record received this information for the distributions paid to them by the Fund during the calendar year 2012 via Form 1099. The Fund will notify shareholders in early 2014 of amounts paid to them by the Fund, if any, during the calendar year 2013.
Please consult a tax advisor if you have questions about federal or state income tax laws, or how to prepare your tax returns.
The Fund designates foreign taxes paid in the amount of $32,362 and foreign source income in the amount of $373,041 for federal income tax purposes for the year ended April 30, 2013.
| | | | |
Annual Report | April 30, 2013 | | | 39 | |
| | |
Seafarer Overseas Growth and Income Fund | | Trustees and Officers |
| | April 30, 2013 (Unaudited) |
INDEPENDENT TRUSTEES
| | | | | | | | | | |
Name, Address* & Age | | Position(s) Held with Fund | | Term of Office and Length of Time Served** | | Principal Occupation(s) During Past 5 Years*** | | Number of Funds in Fund Complex Overseen by Trustee**** | | Other Directorships Held by Trustee During Past 5 Years |
Mary K. Anstine, age 72 | | Trustee | | Ms. Anstine was elected at a special meeting of shareholders held on March 21, 1997 and re-elected at a special meeting of shareholders held on August 7, 2009. | | Ms. Anstine was President/Chief Executive Officer of HealthONE Alliance, Denver, Colorado, and former Executive Vice President of First Interstate Bank of Denver. Ms. Anstine is also Trustee/Director of AV Hunter Trust and Colorado Uplift Board. Ms. Anstine was formerly a Director of the Trust Bank of Colorado (later purchased and now known as Northern Trust Bank), HealthONE and Denver Area Council of the Boy Scouts of America, and a member of the American Bankers Association Trust Executive Committee. | | 26 | | Ms. Anstine is a Trustee of ALPS ETF Trust (13 funds); ALPS Variable Investment Trust (7 funds); Reaves Utility Income Fund (1 fund); and Westcore Trust (12 funds). |
| | |
| * | | All communications to Trustees and Officers may be directed to Financial Investors Trust c/o 1290 Broadway, Suite 1100, Denver, CO 80203. |
| ** | | This is the period for which the Trustee/Officer began serving the Trust. Each Trustee/Officer serves an indefinite term, until his successor is elected. |
| *** | | Except as otherwise indicated, each individual has held the office shown or other offices in the same company for the last five years. |
| **** | | The Fund Complex includes all series of the Trust (currently 26) and any other investment companies for which Seafarer Capital Partners, LLC provides investment advisory services (currently none). |
| | |
40 | | (855) 732-9220 | seafarerfunds.com |
| | |
| Seafarer Overseas Growth and Income Fund | | Trustees and Officers |
| | April 30, 2013 (Unaudited) |
INDEPENDENT TRUSTEES
| | | | | | | | | | |
Name, Address* & Age | | Position(s) Held with Fund | | Term of Office and Length of Time Served** | | Principal Occupation(s) During Past 5 Years*** | | Number of Funds in Fund Complex Overseen by Trustee**** | | Other Directorships Held by Trustee During Past 5 Years |
| John R. Moran, Jr., age 81 | | Trustee | | Mr. Moran was elected at a special meeting of shareholders held on March 21, 1997 and re-elected at a special meeting of shareholders held on August 7, 2009. | | Mr. Moran is formerly President and CEO of The Colorado Trust, a private foundation serving the health and hospital community in the state of Colorado. An attorney, Mr. Moran was formerly a partner with the firm of Kutak Rock & Campbell in Denver, Colorado and a member of the Colorado House of Representatives. Currently, Mr. Moran is a member of the Treasurer’s Investment Advisory Committee for the University of Colorado. | | 26 | | None. |
| | | | |
Annual Report | April 30, 2013 | | | 41 | |
| | |
Seafarer Overseas Growth and Income Fund | | Trustees and Officers |
| | April 30, 2013 (Unaudited) |
INDEPENDENT TRUSTEES
| | | | | | | | | | |
Name, Address* & Age | | Position(s) Held with Fund | | Term of Office and Length of Time Served** | | Principal Occupation(s) During Past 5 Years*** | | Number of Funds in Fund Complex Overseen by Trustee**** | | Other Directorships Held by Trustee During Past 5 Years |
Jeremy W. Deems, age 36 | | Trustee | | Mr. Deems was appointed as a Trustee at the March 11, 2008 meeting of the Board of Trustees and elected at a special meeting of shareholders held on August 7, 2009. | | Mr. Deems is the Co- Founder, Chief Operations Officer and Chief Financial Officer of Green Alpha Advisors, LLC. Prior to joining Green Alpha Advisors, Mr. Deems was CFO and Treasurer of Forward Management, LLC, an investment management company, ReFlow Management Co., LLC, a liquidity resourcing company, ReFlow Fund, LLC, a private investment fund, and Sutton Place Management, LLC, an administrative services company (from 2004 to June 2007). Prior to this, Mr. Deems served as Controller of Forward Management, LLC, ReFlow Management Co., LLC, ReFlow Fund, LLC and Sutton Place Management, LLC. | | 26 | | Mr. Deems is a Trustee of ALPS ETF Trust (13 funds); ALPS Variable Investment Trust (7 funds) and Reaves Utility Income Fund (1 fund). |
| | |
| * | | All communications to Trustees and Officers may be directed to Financial Investors Trust c/o 1290 Broadway, Suite 1100, Denver, CO 80203. |
| ** | | This is the period for which the Trustee/Officer began serving the Trust. Each Trustee/Officer serves an indefinite term, until his successor is elected |
| *** | | Except as otherwise indicated, each individual has held the office shown or other offices in the same company for the last five years. |
| **** | | The Fund Complex includes all series of the Trust (currently 26) and any other investment companies for which Seafarer Capital Partners, LLC provides investment advisory services (currently none). |
| | |
42 | | (855) 732-9220 | seafarerfunds.com |
| | |
Seafarer Overseas Growth and Income Fund | | Trustees and Officers |
| | April 30, 2013 (Unaudited) |
INDEPENDENT TRUSTEES
| | | | | | | | | | |
Name, Address* & Age | | Position(s) Held with Fund | | Term of Office and Length of Time Served** | | Principal Occupation(s) During Past 5 Years*** | | Number of Funds in Fund
Complex Overseen by Trustee**** | | Other Directorships Held by Trustee During Past 5 Years |
Jerry G. Rutledge, age 68 | | Trustee | | Mr. Rutledge was elected at a special meeting of shareholders held on August 7, 2009. | | Mr. Rutledge is the President and owner of Rutledge’s Inc., a retail clothing business. Mr. Rutledge is currently Director of the American National Bank. He was from 1994 to 2007 a Regent of the University of Colorado. | | 26 | | Mr. Rutledge is a Trustee of Clough Global Allocation Fund (1 fund), Clough Global Equity Fund (1 fund) and Clough Global Opportunities Fund (1 fund). |
| | | | |
Annual Report | April 30, 2013 | | | 43 | |
| | |
Seafarer Overseas Growth and Income Fund | | Trustees and Officers |
| | April 30, 2013 (Unaudited) |
INDEPENDENT TRUSTEES
| | | | | | | | | | |
Name, Address* & Age | | Position(s) Held with Fund | | Term of Office and Length of Time Served** | | Principal Occupation(s) During Past 5 Years*** | | Number of Funds in Fund Complex Overseen by Trustee**** | | Other Directorships Held by Trustee During Past 5 Years |
Michael “Ross” Shell, age 42 | | Trustee | | Mr. Shell was elected at a special meeting of shareholders held on August 7, 2009. | | Mr. Shell is Founder and CEO* of Red Idea, LLC, a strategic consulting/early stage venture firm (since June 2008). From 1999 to 2009, he was a part-owner and Director of Tesser, Inc., a brand agency. From December 2005 to May 2008, he was Director, Marketing and Investor Relations, of Woodbourne, a REIT/real estate hedge fund and private equity firm. Prior to this, from May 2004 to November 2005, he worked as a business strategy consultant; from June 2003 to April 2004, he was on the Global Client Services team of IDEO, a product design/innovation firm; and from 1999 to 2003, he was President of Tesser, Inc. Mr. Shell graduated with honors from Stanford University with a degree in Political Science. | | 26 | | None. |
| | |
| * | | All communications to Trustees and Officers may be directed to Financial Investors Trust c/o 1290 Broadway, Suite 1100, Denver, CO 80203. |
| ** | | This is the period for which the Trustee/Officer began serving the Trust. Each Trustee/Officer serves an indefinite term, until his successor is elected |
| *** | | Except as otherwise indicated, each individual has held the office shown or other offices in the same company for the last five years. |
| **** | | The Fund Complex includes all series of the Trust (currently 26) and any other investment companies for which Seafarer Capital Partners, LLC provides investment advisory services (currently none). |
| | |
44 | | (855) 732-9220 | seafarerfunds.com |
| | |
| Seafarer Overseas Growth and Income Fund | | Trustees and Officers |
| | April 30, 2013 (Unaudited) |
INTERESTED TRUSTEES
| | | | | | | | | | |
Name, Address* & Age | | Position(s) Held with Fund | | Term of Office and Length of Time Served** | | Principal Occupation(s) During Past 5 Years*** | | Number of Funds in Fund Complex Overseen by Trustee**** | | Other Directorships Held by Trustee |
Edmund J. Burke, age 52 | | Trustee, Chairman and President | | Mr. Burke was elected as Chairman at the August 28, 2009 meeting of the Board of Trustees. Mr. Burke was elected as Trustee at a special meeting of shareholders held on August 7, 2009. Mr. Burke was elected President of the Trust at the December 17, 2002 meeting of the Board of Trustees. | | Mr. Burke is President and a Director of ALPS Holdings, Inc. (“AHI”) (since 2005) and Director of ALPS Advisors, Inc. (“AAI”), ALPS Distributors, Inc. (“ADI”), ALPS Fund Services, Inc. (“AFS”) and ALPS Portfolio Solutions Distributor, Inc. (“APSD”) and from 2001- 2008, was President of AAI, ADI, AFS and APSD. Because of his positions with AHI, AAI, ADI, AFS and APSD, Mr. Burke is deemed an affiliate of the Trust as defined under the 1940 Act. Mr. Burke is Trustee and President of the Clough Global Allocation Fund (Trustee since 2006; President since 2004); Trustee and President of the Clough Global Equity Fund (Trustee since 2006; President since 2005); Trustee and President of the Clough Global Opportunities Fund (since 2006); Trustee of the Liberty All-Star Equity Fund; and Director of the Liberty All-Star Growth Fund, Inc. | | 26 | | Mr. Burke is a Trustee of Clough Global Allocation Fund (1 fund); Clough Global Equity Fund (1 fund); Clough Global Opportunities Fund (1 fund); Trustee of the Liberty All-Star Equity Fund (1 fund); and Director of the Liberty All-Star Growth Fund, Inc. (1 fund). |
| | |
| * | | All communications to Trustees and Officers may be directed to Financial Investors Trust c/o 1290 Broadway, Suite 1100, Denver, CO 80203. |
| ** | | This is the period for which the Trustee/Officer began serving the Trust. Each Trustee/Officer serves an indefinite term, until his successor is elected |
| *** | | Except as otherwise indicated, each individual has held the office shown or other offices in the same company for the last five years. |
| **** | | The Fund Complex includes all series of the Trust (currently 26) and any other investment companies for which Seafarer Capital Partners, LLC provides investment advisory services (currently none). |
| | | | |
Annual Report | April 30, 2013 | | | 45 | |
| | |
Seafarer Overseas Growth and Income Fund | | Trustees and Officers |
| | April 30, 2013 (Unaudited) |
OFFICERS
| | | | | | |
Name, Address* & Age | | Position(s) Held with Fund | | Term of Office and Length of Time Served** | | Principal Occupation(s) During Past 5 Years*** |
Kimberly R. Storms, age 40 | | Treasurer | | Ms. Storms was elected Treasurer of the Trust at the March 12, 2013 meeting of the Board of Trustees. | | Ms. Storms is Senior Vice President - Director of Fund Administration of ALPS. Ms. Storms joined ALPS in 1998 as Assistant Controller. Because of her position with ALPS, Ms. Storms is deemed an affiliate of the Trust as defined under the 1940 Act. Ms. Storms is also Treasurer of BPV Family of Funds and ALPS Series Trust; Assistant Treasurer of Liberty All-Star Equity Fund and Liberty All-Star Growth Fund, Inc.; Assistant Treasurer of Tilson Funds; and Chief Financial Officer of The Arbitrage Funds. |
David T. Buhler, age 41 | | Secretary | | Mr. Buhler was elected Secretary of the Trust at the September 11, 2012 meeting of the Board of Trustees. | | Mr. Buhler joined ALPS in June 2010, and is currently Vice President and Associate Counsel of ALPS, AAI, ADI and APSD. Prior to joining ALPS, Mr. Buhler served as Associate General Counsel and Assistant Secretary of Founders Asset Management LLC from 2006 to 2009. Because of his position with ALPS, Mr. Buhler is deemed an affiliate of the Trust as defined under the 1940 Act. Mr. Buhler is also the Secretary of ALPS Variable Investment Trust and Westcore Trust. |
Ted Uhl, age 37 | | Chief Compliance Officer (“CCO”) | | Mr. Uhl was appointed CCO of the Trust at the June 8, 2010 meeting of the Board of Trustees. | | Mr. Uhl joined ALPS in October 2006, and is currently Deputy Compliance Officer of ALPS. Prior to his current role, Mr. Uhl served as Senior Risk Manager for ALPS from October 2006 until June 2010. Before joining ALPS, Mr. Uhl served a Sr. Analyst with Enenbach and Associates (RIA), and a Sr. Financial Analyst at Sprint. Because of his position with ALPS, Mr. Uhl is deemed an affiliate of the Trust as defined under the 1940 Act. Mr. Uhl is also CCO of the Clough Global Funds, Reaves Utility Income Fund, Drexel Hamilton Funds and Transparent Value Trust. |
| | |
| * | | All communications to Trustees and Officers may be directed to Financial Investors Trust c/o 1290 Broadway, Suite 1100, Denver, CO 80203. |
| ** | | This is the period for which the Trustee/Officer began serving the Trust. Each Trustee/Officer serves an indefinite term, until his successor is elected |
| *** | | Except as otherwise indicated, each individual has held the office shown or other offices in the same company for the last five years. |
| | |
46 | | (855) 732-9220 | seafarerfunds.com |
Page Intentionally Left Blank.
Page Intentionally Left Blank.

Seafarer Funds distributed by ALPS Distributors, Inc.
Must be accompanied or preceded by a prospectus.
Table of Contents
April 30, 2013
| | |
| | | Letter to Shareholders |
| | April 30, 2013 (Unaudited) |
May 15, 2013
OVERVIEW
Similar to the seasonal cycles of the last few years, the last six months of fiscal year 2013 saw strong performance in the equity markets. Identical to last year, most of the robust performance occurred in the first quarter of the calendar year. During this period, the Dow Jones Industrial Average returned 12%, the S&P 500® Index returned 11% and the Russell 2000® Index returned 12%. The Dow and S&P 500® again recorded one of their best quarterly returns over the last 15 years. Volatility continued to moderate as time elapsed as measures taken by the four horsemen (The Bank of England, The Bank of Japan, The European Central Bank and The U.S. Federal Reserve) further mitigates near-term financial risks.
The fiscal year started with some volatility in November amid concerns over a second Obama Administration and the associated risk of U.S Federal tax increases. In December, the equity markets rallied as the Federal Open Market Committee (FOMC) announced plans to replace Operation Twist with a substantial asset purchase plan. Then, as we neared year-end, heightened concerns over the fiscal cliff drove the markets lower. As we entered the new calendar year, investors reacted favorably to a bill passed in Congress extending some tax cuts though reinstating the full payroll tax and raising the top marginal tax rate. In late January, Congress also voted to suspend enforcement of the federal debt limit through May, which further reduced potential near-term uncertainty. February saw modest gains as the U.S. economy generated mixed economic results and the election results in Italy resulted in a divided government. In assessing corporate earnings during the quarter, profit growth remained at subdued levels relative to prior years. Investment returns accelerated in March as the employment data exceeded the most optimistic forecasts. Europe returned to the forefront as Cyprus agreed to terms for a rescue package for its troubled banking sector.
Since we are fundamentally-driven investors, we are somewhat perplexed by the strong rally of the equity markets over the last six months. When one analyzes the ratio of negative to positive guidance from S&P 500® companies, the number of companies issuing negative guidance continues to increase. After further investigation of this trend, one notices that revenue growth remains anemic while earnings growth remains somewhat better only as a result of financial engineering (significant share repurchase programs). The answer may be found in which sectors have led the market over the past six months – consumer staples, financials, utilities and telecom – high dividend paying sectors! As such, the strong equity rally we’ve seen in 2013 may really be a result of the movement of funds from the bond market into companies paying above-average dividends that are reliable and growing (bond-substitutes) as opposed to fundamental strength in the U.S. Economy or Worldwide Economy.
Similar to the overall equity markets, the best performing economic sectors for the Fund during the 2013 fiscal year were the Financial and Consumer Staples sectors. We did not have any exposure to the telecom and utility sectors. As mentioned in prior letters to shareholders, we believed that strong investment performance was likely to come from the Fund’s technology and health care investments due to strong anticipated revenue and earnings growth. Unfortunately, the Fund was positioned as such and so did not perform as well as the relative benchmark over the last six months.
| | |
| Annual Report | April 30, 2013 | | 1 |
| | |
| Letter to Shareholders | | |
| April 30, 2013 (Unaudited) | | |
STONEBRIDGE SMALL-CAP GROWTH FUND
For the fiscal year to date through April 30, 2013, the Stonebridge Small-Cap Growth Fund rose 3.80%, less than the 16.60% rise in the Russell 2000® Growth Index. Through the end of January 2013, the Fund participated with the overall rally in the equity markets, but lagged the comparative index thereafter. This underperformance was due partially to its overweight exposure to technology and health care names as well as the Fund’s underweight position in consumer staples, financials and utilities. Further, several positions in the Fund did not perform well in February and March for a common reason; the company’s respective need to increase spending (Selling, General & Administrative Expense, Research & Development, etc.) in order to take advantage of future potential growth. In the short-run, these company investments do diminish earnings growth. However, this short-term stock price underperformance gives the Fund the opportunity to add to its investment position and potentially prosper from the future growth potential.
Over the last five years or so, the Fund had been cautious of tenuous discretionary consumer spending; however, we believe that consumer spending has likely hit bottom and may improve in the second half of 2013. As such, the Fund has increased its exposure to consumer cyclicals and has identified a few interesting consumer businesses with strong growth profiles and market-leading positions. Further, we remain exposed to industrial companies that maintain a technological edge in niche markets and have taken advantage of the recent lag in performance of this sector relative to the overall market to increase our exposure in the Fund. Last, we anticipate continued Mergers & Acquisitions activity as interest rates remain historically low and corporations retain significant cash positions.
Stonebridge Small-Cap Growth Fund (SBSGX) Sector Allocation
as a Percent of Net Assets as of April 30, 2013*
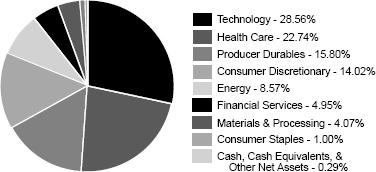
* These allocations may not reflect the current or future position of the portfolio.
| | |
| 2 | | Stonebridge Small-Cap Growth Fund |
| | |
| | | Letter to Shareholders |
| | April 30, 2013 (Unaudited) |
Change in value of a $10,000 investment in Stonebridge Small-Cap
Growth Fund (SBSGX) vs. the Russell 2000® Growth Index with Income
from April 30, 2003 to April 30, 2013
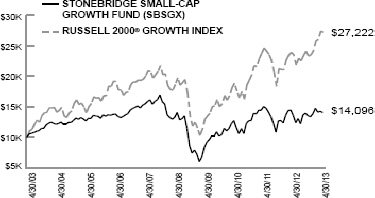
Average Annual Total Returns for the Years Ended April 30, 2013
| | | | | | |
| | | 1 Year | | 5 Years | | 10 Years |
Stonebridge Small-Cap Growth Fund (SBSGX) | | 3.43% | | 1.09% | | 3.49% |
Russell 2000® Growth Index | | 15.67% | | 7.81% | | 10.53% |
Average annual total returns reflect reinvestment of all dividends and capital gains distributions, any fee waivers in effect and any expense reimbursements. Without the fee waivers and expense reimbursements, the total return figures would be lower. Past performance is not indicative of future results and current performance may be lower or higher than the performance quoted. Investment return and principal value will fluctuate and shares, when redeemed, may be worth more or less than their original cost. The total returns shown do not reflect the deduction of taxes that a shareholder would pay on fund distributions or the redemption of fund shares. To obtain the most recent month-end performance, please call the Fund’s toll-free number at 1-800-639-3935.
Effective as of the close of business February 15, 2013, Stonebridge Small-Cap Growth Fund (SBAGX) (the “Acquired Fund”) and Stonebridge Institutional Small-Cap Growth Fund (SBSCX) (the “Acquiring Fund”), each a series of Stonebridge Funds Trust were reorganized into a newly created fund, which is named the Stonebridge Small-Cap Growth Fund (SBSGX) (the “Fund”), under the Financial Investors Trust. The Fund’s performance for periods prior to the close of business February 15, 2013 is that of the Acquired Fund.
As of the Prospectus dated February 28, 2012, the gross annual expense ratio for the Stonebridge Small-Cap Growth Fund was 4.34%. At October 31, 2012, the Fund’s gross annual expense ratio was 4.93%.
| | |
| Annual Report | April 30, 2013 | | 3 |
| | |
| Letter to Shareholders | | |
| April 30, 2013 (Unaudited) | | |
CONCLUSION
In managing the Fund in accordance with its strategy, we seek to identify strong businesses that we believe exhibit competitive advantages, growing market share, and healthy balance sheets, and that are poised to rapidly grow earnings in excess of market expectations. We are positioning the Fund toward those businesses and economic sectors that we believe contain the best opportunities for future growth and superior investment returns. Although we are most excited about the outlook for technology and health care companies, we believe that we will continue to find opportunities for the Funds across sectors that can deliver superior performance results for shareholders.
Sincerely,
Richard C. Barrett, CFA
Matthew W. Markatos, CFA
Portfolio Managers
Performance quoted above represents past performance. Past Performance does not guarantee future results.
The views and information discussed in this commentary are as of the date of publication, are subject to change, and may not reflect the writer’s current views. The views expressed represent an assessment of market conditions at a specific point in time, are opinions only and should not be relied upon as investment advice regarding a particular investment or markets in general. Such information does not constitute a recommendation to buy or sell specific securities or investment vehicles. It should not be assumed that any investment will be profitable or will equal the performance of the Fund or any securities or any sectors mentioned herein. The subject matter contained herein has been derived from several sources believed to be reliable and accurate at the time of compilation. The Fund does not accept any liability for losses either direct or consequential caused by the use of this information.
DEFINITIONS:
The Russell 2000® Growth Index is an unmanaged index that measures the performance of those Russell 2000® Index companies with higher price-to-book ratios and higher forecasted growth values. The Russell 2000® Index measures the performance of the 2,000 smallest companies in the Russell 3000® Index, which measures the performance of the 3,000 largest U.S. companies in terms of market capitalization. The Russell 2000® Growth Index is constructed to provide a comprehensive and unbiased barometer of the small-cap growth market. This is a total return index which reflects the reinvestment of income dividends and capital gain distributions, if any, but does not reflect fees, brokerage commissions, or other expenses of investing. An investor cannot invest directly in an index.
The S&P 500® Total Return Index is an unmanaged index of 500 common stocks chosen for market size, liquidity and industry group representation. It is a market-value weighted index. The S&P 500® Total Return Index is not actively managed and do not reflect any deduction for fees, expenses or taxes. An investor cannot invest directly in an index.
The Russell 2000® Index measures the performance of the small-cap segment of the U.S. equity universe. The Russell 2000® is a subset of the Russell 3000® Index representing approximately 10%
| | |
| 4 | | Stonebridge Small-Cap Growth Fund |
| | |
| | | Letter to Shareholders |
| | April 30, 2013 (Unaudited) |
of the total market capitalization of that index. It includes approximately 2000 of the smallest securities based on a combination of their market cap and current index membership. The index is not actively managed and does not reflect any deduction for fees, expenses or taxes. An investor cannot invest directly in an index.
The Dow Jones Industrial Average is a price-weighted average of 30 significant stocks traded on the New York Stock Exchange and the Nasdaq.
Fiscal Cliff
Combination of increased taxes and reduced government spending.
Operation Twist
A monetary process where the Federal Reserve buys and sells short-term and long-term bonds depending on their objective.
| | |
| Annual Report | April 30, 2013 | | 5 |
| | |
| Disclosure of Fund Expenses | | |
| April 30, 2013 (Unaudited) | | |
As a shareholder of a Fund, you incur two types of costs: (1) transaction costs (such as the 2% fee on redemption of Fund shares made within 30 days of purchase); and (2) ongoing costs, including management fees and other Fund expenses. The following examples are intended to help you understand your ongoing costs (in dollars) of investing in a Fund and to compare these costs with the ongoing costs of investing in other mutual funds. The examples are based on an investment of $1,000 invested on November 1, 2012 and held until April 30, 2013.
Actual Return — The first line of the following tables provides information about actual account values and actual expenses. You may use the information in this line, together with the amount you invested, to estimate the expenses that you paid over the period. Simply divide your account value by $1,000 (for example, an $8,600 account value divided by $1,000 = 8.6), then multiply the result by the number in the first line under the heading “Expense Paid During Period” to estimate the expenses you paid on your account during this period.
Hypothetical 5% Return — The second line of the following tables provides information about hypothetical account values and hypothetical expenses based on each Fund’s actual expense ratio and an assumed rate of return of 5% per year before expenses, which is not the Fund’s actual return. The hypothetical account values and expenses may not be used to estimate the actual ending account balance or expenses you paid for the period. You may use this information to compare the ongoing costs of investing in a Fund and other mutual funds. To do so, compare this 5% hypothetical example with the 5% hypothetical examples that appear in the shareholder reports of the other funds.
The expenses shown in the table are meant to highlight ongoing Fund costs only and do not reflect transaction fees, such as redemption fees. Therefore, the second line of the table is useful in comparing ongoing costs only, and may not help you determine the relative total costs of owning different funds. If the transaction fees were included, your costs would be higher.
Stonebridge Small-Cap Growth Fund
| | | | | | | | | | | | | | | |
| | | Beginning Account
Value at 11/01/12 | | Ending Account
Value at 4/30/13 | | Expense Paid
During Period*
11/01/12 to 4/30/13 |
Actual Fund Return | | | $ | 1,000.00 | | | | $ | 1,038.00 | | | | $ | 19.51 | |
Hypothetical Fund Return
(5% return before expenses) | | | $ | 1,000.00 | | | | $ | 1,005.65 | | | | $ | 19.20 | |
| * | Expenses are equal to the Fund’s annualized expense ratio of 3.86%, multiplied by the average account value over the period, multiplied by the number of days in the most recent fiscal half-year (181)/365 (to reflect the half-year period). |
| | |
| 6 | | Stonebridge Small-Cap Growth Fund |
| | |
Stonebridge Small-Cap Growth Fund (SBSGX) | | Statement of Investments |
| | April 30, 2013 |
| | | | | | | | |
| | | Shares | | | Market Value | |
COMMON STOCKS (99.71%) | | | | | | | | |
CONSUMER DISCRETIONARY - (14.02%) | | | | | | | | |
Consumer Electronics (3.76%) | | | | | | | | |
Harman International Industries, Inc. | | | 15,000 | | | $ | 670,650 | |
| | | | | | | | |
| | |
Consumer Services: Misc. (3.37%) | | | | | | | | |
Coinstar, Inc.** | | | 4,500 | | | | 237,645 | |
Steiner Leisure Ltd.** | | | 7,500 | | | | 363,225 | |
| | | | | | | | |
| | | | | | | 600,870 | |
| | | | | | | | |
| | |
Education Services (2.18%) | | | | | | | | |
Grand Canyon Education, Inc.** | | | 15,250 | | | | 389,942 | |
| | | | | | | | |
| | |
Household Furnishings (1.99%) | | | | | | | | |
Select Comfort Corp.** | | | 16,750 | | | | 355,435 | |
| | | | | | | | |
| | |
Recreational Vehicles & Boats (1.25%) | | | | | | | | |
Thor Industries, Inc. | | | 6,000 | | | | 222,540 | |
| | | | | | | | |
| | |
Specialty Retail (1.47%) | | | | | | | | |
Jos. A. Bank Clothiers, Inc.** | | | 6,000 | | | | 262,080 | |
| | | | | | | | |
| | |
TOTAL CONSUMER DISCRETIONARY | | | | | | | 2,501,517 | |
| | | | | | | | |
| | |
CONSUMER STAPLES - (1.00%) | | | | | | | | |
Foods (1.00%) | | | | | | | | |
Chefs’ Warehouse, Inc.** | | | 9,700 | | | | 178,383 | |
| | | | | | | | |
| | |
TOTAL CONSUMER STAPLES | | | | | | | 178,383 | |
| | | | | | | | |
| | |
ENERGY - (8.57%) | | | | | | | | |
Offshore Drilling & Other Services (2.04%) | | | | | | | | |
Atwood Oceanics, Inc.** | | | 7,400 | | | | 362,970 | |
| | | | | | | | |
| | |
Oil Well Equipment & Services (4.09%) | | | | | | | | |
McDermott International, Inc.** | | | 41,500 | | | | 443,220 | |
Superior Energy Services, Inc.** | | | 10,400 | | | | 286,936 | |
| | | | | | | | |
| | | | | | | 730,156 | |
| | | | | | | | |
Oil: Crude Producers (2.44%) | | | | | | | | |
Carrizo Oil & Gas, Inc.** | | | 3,250 | | | | 78,715 | |
Kodiak Oil & Gas Corp.** | | | 45,500 | | | | 356,265 | |
| | | | | | | | |
| | | | | | | 434,980 | |
| | | | | | | | |
TOTAL ENERGY | | | | | | | 1,528,106 | |
| | | | | | | | |
| | |
| See Notes to Financial Statements. | | |
| Annual Report | April 30, 2013 | | 7 |
| | |
| Stonebridge Small-Cap Growth Fund (SBSGX) | | Statement of Investments |
| April 30, 2013 | | |
| | | | | | | | |
| | | Shares | | | Market Value | |
FINANCIAL SERVICES - (4.95%) | | | | | | | | |
Asset Management & Custodial (0.52%) | | | | | | | | |
Waddell & Reed Financial, Inc., Class A | | | 2,150 | | | $ | 92,171 | |
| | | | | | | | |
| | |
Financial Data & Systems (3.38%) | | | | | | | | |
Higher One Holdings, Inc.** | | | 61,250 | | | | 603,925 | |
| | | | | | | | |
| | |
Securities Brokerage & Services (1.05%) | | | | | | | | |
FXCM, Inc., Class A | | | 13,850 | | | | 187,667 | |
| | | | | | | | |
| | |
TOTAL FINANCIAL SERVICES | | | | | | | 883,763 | |
| | | | | | | | |
| | |
HEALTH CARE - (22.74%) | | | | | | | | |
Biotechnology (3.74%) | | | | | | | | |
Genomic Health, Inc.** | | | 16,675 | | | | 506,253 | |
ImmunoGen, Inc.** | | | 10,000 | | | | 160,200 | |
| | | | | | | | |
| | | | | | | 666,453 | |
| | | | | | | | |
Health Care Facilities (2.03%) | | | | | | | | |
VCA Antech, Inc.** | | | 15,000 | | | | 361,500 | |
| | | | | | | | |
| | |
Health Care Services (5.12%) | | | | | | | | |
HMS Holdings Corp.** | | | 24,500 | | | | 617,645 | |
IPC The Hospitalist Co., Inc.** | | | 6,500 | | | | 296,530 | |
| | | | | | | | |
| | | | | | | 914,175 | |
| | | | | | | | |
Medical & Dental Instruments & Supplies (5.64%) | | | | | | | | |
Align Technology, Inc.** | | | 14,600 | | | | 483,552 | |
Merit Medical Systems, Inc.** | | | 54,000 | | | | 522,180 | |
| | | | | | | | |
| | | | | | | 1,005,732 | |
| | | | | | | | |
Medical Equipment (6.21%) | | | | | | | | |
Luminex Corp.** | | | 38,025 | | | | 632,356 | |
Masimo Corp. | | | 23,750 | | | | 476,425 | |
| | | | | | | | |
| | | | | | | 1,108,781 | |
| | | | | | | | |
TOTAL HEALTH CARE | | | | | | | 4,056,641 | |
| | | | | | | | |
| | |
MATERIALS & PROCESSING - (4.07%) | | | | | | | | |
Gold (3.63%) | | | | | | | | |
Allied Nevada Gold Corp.** | | | 60,500 | | | | 647,350 | |
| | | | | | | | |
| | |
Metal Fabricating (0.44%) | | | | | | | | |
Dynamic Materials Corp. | | | 5,000 | | | | 79,400 | |
| | | | | | | | |
| | |
TOTAL MATERIALS & PROCESSING | | | | | | | 726,750 | |
| | | | | | | | |
| | |
See Notes to Financial Statements. | | |
| 8 | | Stonebridge Small-Cap Growth Fund |
| | |
Stonebridge Small-Cap Growth Fund (SBSGX) | | Statement of Investments |
| | April 30, 2013 |
| | | | | | | | |
| | | Shares | | | Market Value | |
PRODUCER DURABLES - (15.80%) | | | | | | | | |
Back Office Support, HR, and Consulting (3.53%) | | | | | | | | |
Ritchie Bros Auctioneers, Inc. | | | 31,250 | | | $ | 630,313 | |
| | | | | | | | |
| | |
Construction (3.42%) | | | | | | | | |
Aegion Corp.** | | | 16,500 | | | | 347,490 | |
Great Lakes Dredge & Dock Co. | | | 38,000 | | | | 262,960 | |
| | | | | | | | |
| | | | | | | 610,450 | |
| | | | | | | | |
Engineering & Contracting Services (3.19%) | | | | | | | | |
Mistras Group, Inc.** | | | 30,000 | | | | 568,500 | |
| | | | | | | | |
| | |
Machinery: Agricultural (2.78%) | | | | | | | | |
Titan International, Inc. | | | 22,200 | | | | 495,282 | |
| | | | | | | | |
| | |
Machinery: Industrial (0.55%) | | | | | | | | |
Chart Industries, Inc.** | | | 1,150 | | | | 97,531 | |
| | | | | | | | |
| | |
Shipping (2.33%) | | | | | | | | |
GulfMark Offshore, Inc. | | | 10,000 | | | | 416,200 | |
| | | | | | | | |
| | |
TOTAL PRODUCER DURABLES | | | | | | | 2,818,276 | |
| | | | | | | | |
| | |
TECHNOLOGY - (28.56%) | | | | | | | | |
Communication Technology (3.96%) | | | | | | | | |
Riverbed Technology, Inc.** | | | 47,575 | | | | 706,965 | |
| | | | | | | | |
| | |
Computer Services Software & Systems (10.87%) | | | | | | | | |
BroadSoft, Inc.** | | | 7,000 | | | | 178,920 | |
Jive Software, Inc.** | | | 25,500 | | | | 346,545 | |
LogMeIn, Inc.** | | | 16,450 | | | | 371,441 | |
PTC, Inc.** | | | 11,650 | | | | 279,716 | |
Saba Software, Inc.** | | | 31,500 | | | | 286,650 | |
Tangoe, Inc.** | | | 30,000 | | | | 385,800 | |
Zix Corp.** | | | 23,800 | | | | 89,488 | |
| | | | | | | | |
| | | | | | | 1,938,560 | |
| | | | | | | | |
Computer Technology (2.39%) | | | | | | | | |
Fusion-io, Inc.** | | | 22,750 | | | | 427,245 | |
| | | | | | | | |
| | |
Electronic Components (3.14%) | | | | | | | | |
Tech Data Corp.** | | | 12,000 | | | | 560,760 | |
| | | | | | | | |
| | |
Electronic Entertainment (3.39%) | | | | | | | | |
Dolby Laboratories, Inc., Class A | | | 18,400 | | | | 604,440 | |
| | | | | | | | |
| | |
See Notes to Financial Statements. | | |
| Annual Report | April 30, 2013 | | 9 |
| | |
| Stonebridge Small-Cap Growth Fund (SBSGX) | | Statement of Investments |
| April 30, 2013 | | |
| | | | | | | | |
| | | Shares | | | Market Value | |
Electronics (1.07%) | | | | | | | | |
IPG Photonics Corp. | | | 3,000 | | | $ | 191,040 | |
| | | | | | | | |
| | |
Semiconductors & Components (3.74%) | | | | | | | | |
EZchip Semiconductor Ltd.** | | | 24,900 | | | | 567,969 | |
TriQuint Semiconductor, Inc.** | | | 17,000 | | | | 99,280 | |
| | | | | | | | |
| | | | | | | 667,249 | |
| | | | | | | | |
TOTAL TECHNOLOGY | | | | | | | 5,096,259 | |
| | | | | | | | |
| | |
TOTAL COMMON STOCKS | | | | | | | | |
(Cost $ 17,490,590) | | | | | | | 17,789,695 | |
| | | | | | | | |
| | |
MONEY MARKET MUTUAL FUNDS (0.53%) | | | | | | | | |
Fidelity® Institutional Money Market
Government Portfolio - Class I
(0.01% 7 Day Yield) | | | 95,589 | | | | 95,589 | |
| | | | | | | | |
| | |
TOTAL MONEY MARKET MUTUAL FUNDS | | | | | | | | |
(Cost $ 95,589) | | | | | | | 95,589 | |
| | | | | | | | |
| | |
TOTAL INVESTMENTS (100.24%) | | | | | | | | |
(Cost $ 17,586,179) | | | | | | $ | 17,885,284 | |
LIABILITIES IN EXCESS OF OTHER ASSETS (-0.24%) | | | | | | | (43,605 | ) |
| | | | | | | | |
NET ASSETS (100.00%) | | | | | | $ | 17,841,679 | |
| | | | | | | | |
| ** | Non-Income Producing Security. |
Common Abbreviations:
Ltd. - Limited.
Holdings are subject to change.
For Fund compliance purposes, the Fund’s industry classifications refer to any one or more of the industry sub-classifications used by one or more widely recognized market indexes or ratings group indexes, and/or as defined by Fund management. This definition may not apply for purposes of this report, which may combine industry sub-classifications for reporting ease. Industries are shown as a percent of net assets.
| | |
See Notes to Financial Statements. | | |
| 10 | | Stonebridge Small-Cap Growth Fund |
| | |
| | | Stonebridge Statement of Assets and Liabilities |
| | April 30, 2013 |
| | | | |
ASSETS: | | | | |
Investments, at value | | $ | 17,885,284 | |
Receivable for investments sold | | | 711,428 | |
Dividend receivable | | | 604 | |
Prepaid and other assets | | | 32,602 | |
| | | | |
Total assets | | | 18,629,918 | |
| | | | |
| |
LIABILITIES: | | | | |
Payable for investments purchased | | | 670,852 | |
Advisory fees payable | | | 10,767 | |
Administration and fund accounting fees payable | | | 6,995 | |
Payable for transfer agent fees | | | 17,529 | |
Payable for legal fees | | | 29,752 | |
Payable for audit fees | | | 16,445 | |
Payable for trustee fees and expenses | | | 236 | |
Payable for chief compliance officer fees | | | 4,046 | |
Accrued expenses and other liabilities | | | 31,617 | |
| | | | |
Total liabilities | | | 788,239 | |
| | | | |
Net Assets | | $ | 17,841,679 | |
| | | | |
| |
COMPOSITION OF NET ASSETS: | | | | |
Paid-in capital (Note 5) | | $ | 17,938,851 | |
Accumulated net investment loss | | | (151,799 | ) |
Accumulated net realized loss on investments | | | (244,478 | ) |
Net unrealized appreciation in value of investments | | | 299,105 | |
| | | | |
Net Assets | | $ | 17,841,679 | |
| | | | |
| |
NET ASSET VALUE PER SHARE: | | | | |
Net Assets | | $ | 17,841,679 | |
Shares outstanding | | | 2,040,934 | |
Net asset value and redemption price per share* | | $ | 8.74 | |
| | | | |
| |
Investments, at cost | | $ | 17,586,179 | |
| | | | |
| * | A charge of 2% is imposed on the redemption proceeds of shares held 30 days or less. |
| | |
See Notes to Financial Statements. | | |
| Annual Report | April 30, 2013 | | 11 |
| | |
| Stonebridge Statements of Operations | | |
| For the Year Ended April 30, 2013 | | |
| | | | | | | | |
| | | For the Six
Months Ended
April 30, 2013 | | | For the Year Ended
October 31, 2012 | |
INCOME: | | | | | | | | |
Dividends (Net Foreign Tax $(536) and $(162), respectively) | | $ | 25,518 | | | $ | 37,866 | |
| | | | |
Total Income | | | 25,518 | | | | 37,866 | |
| | | | |
| | |
EXPENSES: | | | | | | | | |
Investment advisory fees | | | 55,167 | | | | 93,864 | |
Administration fees | | | 37,304 | | | | 75,000 | |
Transfer agent fees | | | 40,697 | | | | 68,808 | |
Fund accounting fees and expenses | | | 10,656 | | | | 36,858 | |
Custodian fees | | | 4,111 | | | | 8,130 | |
Legal fees | | | 15,422 | | | | 72,094 | |
Printing fees | | | 4,977 | | | | 16,211 | |
Registration fees | | | 7,356 | | | | 8,928 | |
Audit fees | | | 16,445 | | | | 20,100 | |
Trustee fees and expenses | | | 4,030 | | | | 14,536 | |
Chief compliance officer fees | | | 4,045 | | | | – | |
Proxy voting fees | | | 54,099 | | | | 41,701 | |
Insurance | | | 26,912 | | | | 28,032 | |
Other | | | 2,984 | | | | 2,224 | |
| | | | |
Total Expenses | | | 284,205 | | | | 486,486 | |
| | | | |
Net Investment Loss | | | (258,687) | | | | (448,620) | |
| | | | |
| | |
REALIZED AND UNREALIZED GAIN/(LOSS) ON INVESTMENTS: | | | | | | | | |
Net realized gain on investments | | | 1,105,564 | | | | 1,426,818 | |
Change in net unrealized depreciation of investments | | | (599,341) | | | | (192,178) | |
| | | | |
Net Realized and Unrealized Gain on Investments | | | 506,223 | | | | 1,234,640 | |
| | | | |
Net Increase in Net Assets Resulting From Operations | | $ | 247,536 | | | $ | 786,020 | |
| | | | |
| | |
| See Notes to Financial Statements. | | |
| 12 | | Stonebridge Small-Cap Growth Fund |
| | |
| | | Statements of Changes in Net Assets |
| | Stonebridge Small-Cap Growth Fund (SBSGX) |
| | | | | | | | | | | | |
| | | For the Six
Months Ended
April 30, 2013 | | | For the Year Ended
October 31, 2012 | | | For the Year Ended
October 31, 2011 | |
OPERATIONS: | | | | | | | | | | | | |
Net investment loss | | $ | (258,687) | | | $ | (448,620) | | | $ | (405,480) | |
Net realized gain on investments | | | 1,105,564 | | | | 1,426,818 | | | | 1,294,239 | |
Change in net unrealized depreciation of investments | | | (599,341) | | | | (192,178) | | | | (816,450) | |
| | | | |
Increase in Net Assets Resulting from Operations | | | 247,536 | | | | 786,020 | | | | 72,309 | |
| | | | |
| | | |
CAPITAL SHARE TRANSACTIONS (NOTE 5): | | | | | | | | | | | | |
Net Increase/(Decrease) in Shareholder Activity Derived from Beneficial Interest Transactions, net of redemption fees | | | 4,921,322 | | | | (569,776) | | | | (1,108,202) | |
| | | | |
| | | |
NET INCREASE/(DECREASE) IN NET ASSETS | | | 5,168,858 | | | | 216,244 | | | | (1,035,893) | |
| | | |
NET ASSETS: | | | | | | | | | | | | |
Beginning of year | | | 12,672,821 | | | | 12,456,577 | | | | 13,492,470 | |
| | | | |
End of period* | | $ | 17,841,679 | | | $ | 12,672,821 | | | $ | 12,456,577 | |
| | | | |
| | | |
*Includes accumulated net investment loss of: | | $ | (151,799) | | | $ | (381,403) | | | $ | – | |
| | |
| See Notes to Financial Statements. |
| Annual Report | April 30, 2013 | | 13 |
| | |
| Stonebridge Small-Cap Growth Fund (SBSGX) | | |
| For a share outstanding through the periods presented | | |
| | |
| PER SHARE DATA | | |
Net asset value, beginning of period | | |
| |
| INCOME/(LOSS) FROM INVESTMENT OPERATIONS: | | |
Net investment income/(loss) | | |
Net realized and unrealized gain/(loss) on investments | | |
Total Income/(Loss) from Investment Operations | | |
| |
| DISTRIBUTIONS TO SHAREHOLDERS: | | |
From net realized gain on investments | | |
Total Distributions to Shareholders | | |
Net Increase/(Decrease) in Net Asset Value | | |
Net asset value, end of period | | |
| Total Return | | |
| |
| Ratios & Supplemental Data: | | |
Net assets, end of period (in 000s) | | |
Ratios to average net assets: | | |
Expenses (excluding fee waivers) | | |
Expenses (including fee waivers) | | |
Net investment loss (including fee waivers) | | |
Portfolio Turnover Rate
| (1) | Calculated using the average shares method. |
| (2) | Total return not annualized for periods less than one full year. |
| (4) | Expense ratios before reductions for startup periods may not be representative of longer term operating periods. |
| | |
See Notes to Financial Statements. | | |
| 14 | | Stonebridge Small-Cap Growth Fund |
| | | | | | | | | | | | | | | | | | | | | | | | | | | | |
Six Months
Ended April 30, 2013 | | Year Ended
October 31, 2012 | | Year Ended
October 31, 2011 | | Year Ended
October 31, 2010 | | Year Ended
October 31, 2009 | | Year Ended
October 31, 2008 |
| | | | | | | | | | | | | | | | | | | | | | | | | | | | | |
| | | $8.42 | | | | | $7.90 | | | | | $7.91 | | | | | $6.38 | | | | | $5.35 | | | | | $11.62 | |
| | | | | |
| | | (0.15)(1) | | | | | (0.30) | | | | | (0.26) | | | | | (0.24) | | | | | (0.18) | | | | | (0.21) | |
| | | 0.47 | | | | | 0.82 | | | | | 0.25 | | | | | 1.77 | | | | | 1.21 | | | | | (5.02) | |
| | | 0.32 | | | | | 0.52 | | | | | (0.01) | | | | | 1.53 | | | | | 1.03 | | | | | (5.23) | |
| | | | | | | | | | | | | | | | | | | | | | | | | | | | | |
| | | – | | | | | – | | | | | – | | | | | – | | | | | – | | | | | (1.04) | |
| | | – | | | | | – | | | | | – | | | | | – | | | | | – | | | | | (1.04) | |
| | | 0.32 | | | | | 0.52 | | | | | (0.01) | | | | | 1.53 | | | | | 1.03 | | | | | (6.27) | |
| | | $8.74 | | | | | $8.42 | | | | | $7.90 | | | | | $7.91 | | | | | $6.38 | | | | | $5.35 | |
| | | | | | | | | | | | | | | | | | | | | | | | | | | | | |
| | | 3.80%(2) | | | | | 6.58% | | | | | (0.13)% | | | | | 23.98% | | | | | 19.25% | | | | | (49.06)% | |
| | | | | | | | | | | | | | | | | | | | | | | | | | | | | |
| | | | | | | | | | | | | | | | | | | | | | | | | | | | | |
| | | $17,842 | | | | | $12,673 | | | | | $12,457 | | | | | $13,492 | | | | | $11,767 | | | | | $10,583 | |
| | | | | | | | | | | | | | | | | | | | | | | | | | | | | |
| | | | | | | | | | | | | | | | | | | | | | | | | | | | | |
| | | N/A | | | | | N/A | | | | | N/A | | | | | 3.48% | | | | | N/A | | | | | N/A | |
| | | | | | | | | | | | | | | | | | | | | | | | | | | | | |
| | | 3.86%(4) | | | | | 3.89% | | | | | 3.36% | | | | | 3.40% | | | | | 3.85% | | | | | 2.86% | |
| | | | | | | | | | | | | | | | | | | | | | | | | | | | | |
| | | (3.52)%(3) | | | | | (3.58)% | | | | | (2.96)% | | | | | (3.19)% | | | | | (3.34)% | | | | | (2.43)% | |
| | | | | | | | | | | | | | | | | | | | | | | | | | | | | |
| | | 89% | | | | | 222% | | | | | 195% | | | | | 115% | | | | | 137% | | | | | 145% | |
| | | | | | | | | | | | | | | | | | | | | | | | | | | | | |
| | |
| | |
| Annual Report | April 30, 2013 | | 15 |
| | |
| Stonebridge Notes to Financial Statements | | |
| April 30, 2013 | | |
1. ORGANIZATION
Financial Investors Trust (the “Trust”), a Delaware statutory trust, is an open-end management investment company registered under the Investment Company Act of 1940, as amended (“1940 Act”). As of April 30, 2013, the Trust had 26 registered funds. This annual report describes the Stonebridge Small-Cap Growth Fund (prior to the close of business on February 15, 2013 known as the Stonebridge Institutional Small-Cap Growth Fund) (the “Fund”). The Fund seeks long-term capital growth by investing primarily in common stocks of companies that Stonebridge Capital Management, Inc. (the “Adviser”), the investment adviser of the Fund, believes have good prospects for superior earnings growth.
The Fund is a successor to a previously operational fund which was a series of the Stonebridge Funds Trust, a Delaware statutory trust, and was organized into series of the Trust effective as of the close of business on February 15, 2013. As a result, the Fund’s fiscal year end changed from October 31st to April 30th.
2. SIGNIFICANT ACCOUNTING POLICIES
The accompanying financial statements were prepared in accordance with accounting principles generally accepted in the United States of America (“U.S. GAAP”). The preparation of financial statements in conformity with U.S. GAAP requires management to make certain estimates and assumptions that affect the reported amounts of assets and liabilities and disclosures of contingent assets and liabilities at the date of the financial statements and the reported amounts of revenue and expenses during the period. Actual results could differ from those estimates. The following is a summary of significant accounting policies consistently followed by the Fund in preparation of its financial statements.
Investment Valuation: The Fund generally values its securities based on market prices determined at the close of regular trading on the New York Stock Exchange (“NYSE”), normally 4:00 p.m. Eastern Time, on each day the NYSE is open for trading.
For equity securities and mutual funds that are traded on an exchange, the market price is usually the closing sale or official closing price on that exchange. In the case of equity securities not traded on an exchange, or if such closing prices are not otherwise available, the securities are valued at the mean of the most recent bid and ask prices on such day. Redeemable securities issued by open-end registered investment companies are valued at the investment company’s applicable net asset value, with the exception of exchange-traded open-end investment companies, which are priced as equity securities.
Short–term debt obligations that will mature in 60 days or less are valued at amortized cost, unless it is determined that using this method would not reflect an investment’s fair value. Investments in non-exchange traded funds are fair valued at their respective net asset values.
When such prices or quotations are not available, or when the Fair Value Committee appointed by the Board of Trustees (the “Board”) believes that they are unreliable, securities may be priced using fair value procedures approved by the Board.
Fair Value Measurements: The Fund discloses the classification of its fair value measurements following a three-tier hierarchy based on the inputs used to measure fair value. Inputs refer broadly to the assumptions that market participants would use in pricing the asset or liability, including assumptions about risk. Inputs may be observable or unobservable. Observable inputs
| | |
| | |
| 16 | | Stonebridge Small-Cap Growth Fund |
| | |
| | | Stonebridge Notes to Financial Statements |
| | April 30, 2013 |
reflect the assumptions market participants would use in pricing the asset or liability that are developed based on market data obtained from sources independent of the reporting entity.
Unobservable inputs reflect the reporting entity’s own assumptions about the assumptions market participants would use in pricing the asset or liability that are developed based on the best information available.
Various inputs are used in determining the value of the Fund’s investments as of the end of the reporting period. When inputs used fall into different levels of the fair value hierarchy, the level in the hierarchy within which the fair value measurement falls is determined based on the lowest level input that is significant to the fair value measurement in its entirety. The designated input levels are not necessarily an indication of the risk or liquidity associated with these investments. These inputs are categorized in the following hierarchy under applicable financial accounting standards:
| | | | |
Level 1 | | – | | Unadjusted quoted prices in active markets for identical investments, unrestricted assets or liabilities that the Fund has the ability to access at the measurement date; |
| | |
Level 2 | | – | | Quoted prices which are not active, quoted prices for similar assets or liabilities in active markets or inputs other than quoted prices that are observable (either directly or indirectly) for substantially the full term of the asset or liability; and |
| | |
Level 3 | | – | | Significant unobservable prices or inputs (including the Fund’s own assumptions in determining the fair value of investments) where there is little or no market activity for the asset or liability at the measurement date. |
The following is a summary of each input used to value the Fund as of April 30, 2013:
| | | | | | | | | | | | | | | | |
| | | Valuation Inputs | | | | |
| Investments in Securities at Value* | | Level 1 | | | Level 2 | | | Level 3 | | | Total | |
Common Stocks | | $ | 17,789,695 | | | $ | – | | | $ | – | | | $ | 17,789,695 | |
Money Market Mutual Funds | | | 95,589 | | | | – | | | | – | | | | 95,589 | |
Total | | $ | 17,885,284 | | | $ | – | | | $ | – | | | $ | 17,885,284 | |
| | | | | | | | | | | | | | | | | |
*For detailed Industry descriptions, see the accompanying Statement of Investments.
The Fund recognizes transfers between levels as of the end of the period. For the period ended April 30, 2013, the Fund did not have any transfers between Level 1 and Level 2 securities. For the period ended April 30, 2013, the Fund did not have any securities that used significant unobservable inputs (Level 3) in determining fair value.
Investment Transactions and Investment Income: Investment transactions are accounted for on the date the investments are purchased or sold (trade date). Realized gains and losses from investment transactions are reported on an identified cost basis. Interest income, which includes accretion of discounts, is accrued and recorded as earned. Dividend income is recognized on the ex-dividend date or for certain foreign securities, as soon as information is available to the Fund.
Trust Expenses: Some expenses of the Trust can be directly attributed to the Fund. Expenses which cannot be directly attributed to the Fund are apportioned among all funds in the Trust based on average net assets of each fund.
| | |
| | |
| Annual Report | April 30, 2013 | | 17 |
| | |
| Stonebridge Notes to Financial Statements | | |
| April 30, 2013 | | |
Fund Expenses: Expenses that are specific to the Fund are charged directly to the Fund.
Federal Income Taxes: The Fund complies with the requirements under Subchapter M of the Internal Revenue Code of 1986, as amended (the “Code”), applicable to regulated investment companies and intends to distribute substantially all of their net taxable income and net capital gains, if any, each year so that it will not be subject to excise tax on undistributed income and gains. The Fund is not subject to income taxes to the extent such distributions are made.
As of and during the period ended April 30, 2013, the Fund did not have a liability for any unrecognized tax benefits. The Fund files U.S. federal, state, and local tax returns as required. The Fund’s tax returns are subject to examination by the relevant tax authorities until expiration of the applicable statute of limitations, which is generally three years after the filing of the tax return for federal purposes and four years for most state returns. Tax returns for open years have incorporated no uncertain tax positions that require a provision for income taxes.
Distributions to Shareholders: The Fund normally pays dividends and distributes capital gains, if any, on an annual basis. Income dividend distributions are derived from interest and other income the Fund receives from its investments, including short term capital gains. Long term capital gain distributions are derived from gains realized when the Fund sells a security it has owned for more than a year. The Fund may make additional distributions and dividends at other times if the portfolio manager believes doing so may be necessary for the Fund to avoid or reduce taxes.
3. TAX BASIS INFORMATION
Reclassifications: Reclassifications are made to the Fund’s capital accounts for permanent tax differences to reflect income and gains available for distribution (or available capital loss carryforwards) under income tax regulations. If, for any calendar year, the total distributions made under the distribution policy exceed the Fund’s net investment income and net realized capital gains, the excess will generally be treated as a non-taxable return of capital, reducing the shareholder’s adjusted basis in his or her shares. These reclassifications were as follows:
| | | | |
Undistributed Net Investment Income | | $ | 488,291 | |
Accumulated Net Losses on Investments | | | (30,192 | ) |
Paid-in Capital | | | (458,099 | ) |
| | | | | |
Included in the amounts reclassified was a net operating loss offset to Paid-in Capital of $402,746.
Tax Basis of Investments: As of April 30, 2013, the aggregate cost of investments, gross unrealized appreciation/(depreciation) and net unrealized appreciation for Federal tax purposes was as follows:
| | | | |
Gross appreciation (excess of value over tax cost) | | $ | 1,486,973 | |
Gross depreciation (excess of tax cost over value) | | | (1,291,215 | ) |
Net unrealized appreciation | | $ | 195,758 | |
| | | | | |
Cost of investments for income tax purposes | | $ | 17,689,526 | |
| | | | | |
| | |
| | |
| 18 | | Stonebridge Small-Cap Growth Fund |
| | |
| | | Stonebridge Notes to Financial Statements |
| | April 30, 2013 |
Components of Earnings: As of April 30, 2013, components of distributable earnings were as follows:
| | | | |
Accumulated captial losses | | $ | (141,131 | ) |
Net unrealized appreciation on investments | | | 195,758 | |
Other cumulative effect of timing differences | | | (151,799 | ) |
| | | | | |
Total | | $ | (97,172 | ) |
| | | | | |
As of April 30, 2013, the Fund elected to defer to the fiscal year ending April 30, 2014, late year ordinary losses in the amount of $151,799.
Capital Losses: As of April 30, 2013 the Fund had capital loss carryforwards which may reduce its taxable income arising from future net realized gains on investments, if any, to the extent permitted by the Code and thus may reduce the amount of the distributions to shareholders which would otherwise be necessary to relieve the Fund of any liability for federal tax. Pursuant to the Code, such capital loss carryforwards will expire as follows:
Pre-Enactment Capital Losses:
| | | | |
| | | Amount | |
| | | | | |
Expiring 2016 | | $ | 141,131 | |
During the period ended April 30, 2013, $826,124 of capital loss carryforwards were utilized by the Fund.
Tax Basis of Distributions to Shareholders: The character of distributions made during the year from net investment income or net realized gains may differ from its ultimate characterization for federal income tax purposes. Also, due to the timing of dividend distributions, the fiscal year in which amounts are distributed may differ from the fiscal year in which the income or realized gain was recorded by the Fund.
No distributions were paid during the period ended April 30, 2013, nor in the years ended October 31, 2012 and October 31, 2011.
4. SECURITIES TRANSACTIONS
The cost of purchases and proceeds from sales of securities (excluding short-term securities) during the period ended April 30, 2013, was as follows:
| | | | | | | | |
| | | Purchases | | | Sales | |
| | | | | | | | | |
Stonebridge Small-Cap Growth Fund | | $ | 13,247,570 | | | $ | 14,061,687 | |
5. SHARES OF BENEFICIAL INTEREST
The capitalization of the Trust consists of an unlimited number of shares of beneficial interest with no par value per share. Holders of the shares of the Fund of the Trust have one vote for each share held and a proportionate fraction of a vote for each fractional share. All shares issued and outstanding are fully paid and are non-assessable, transferable and redeemable at the option of the shareholder. Shares have no pre-emptive rights.
| | |
| | |
| Annual Report | April 30, 2013 | | 19 |
| | |
| Stonebridge Notes to Financial Statements | | |
| April 30, 2013 | | |
Stonebridge Small-Cap Growth Fund
| | | | | | | | | | | | | | | | | | | | | | | | |
| | | Six Months
Ended
April 30,
2013
Shares | | | Six Months
Ended
April 30, 2013
Amount | | | Year Ended
October 31,
2012
Shares | | | Year Ended
October 31,
2012
Amount | | | Year Ended
October 31,
2011
Shares | | | Year Ended
October 31,
2011
Amount | |
| | | | | | | | | | | | | | | | | | | | | | | | | |
Shares Sold | | | 5,072 | | | $ | 42,935 | | | | 83,169 | | | $ | 720,844 | | | | 18,026 | | | $ | 139,492 | |
Acquisition (Note 8) | | | 625,439 | | | | 5,698,600 | | | | – | | | | – | | | | – | | | | – | |
| | | | | | | | | | | | | | | | | | | | | | | | | |
Total | | | 630,511 | | | | 5,741,535 | | | | 83,169 | | | | 720,844 | | | | 18,026 | | | | 139,492 | |
| | | | | | | | | | | | | | | | | | | | | | | | | |
Less Shares Redeemed, Net of Redemption Fees | | | (94,616 | ) | | | (820,213 | ) | | | (154,689 | ) | | | (1,290,620 | ) | | | (148,207 | ) | | | (1,247,694 | ) |
| | | | | | | | | | | | | | | | | | | | | | | | | |
Net Increase/(Decrease) | | | 535,895 | | | $ | 4,921,322 | | | | (71,520 | ) | | $ | (569,776 | ) | | | (130,181 | ) | | $ | (1,108,202 | ) |
| | | | | | | | | | | | | | | | | | | | | | | | | |
Shares redeemed within 30 days of purchase will incur a 2% short-term redemption fee deducted from the redemption amount. Redemption fees are reflected in the “Shares redeemed, net of redemption fees” in the Statements of Changes in Net Assets. For the period ended April 30, 2013 and October 31, 2012, the Funds retained fees as follows:
| | | | |
| Fund | | For the period
ended April 30, 2013 | | For the year ended
October 31, 2012 |
| | | | | |
Stonebridge Small-Cap Growth | | $ – | | $ 1 |
6. MANAGEMENT AND RELATED-PARTY TRANSACTIONS
The Trust has entered into an advisory agreement with Stonebridge Capital Management, Inc. (the “Adviser”) with respect to the Fund. The advisory agreement has been approved by the Board and shareholders. Pursuant to the advisory agreement with the Trust, the Adviser is entitled to investment advisory fees, computed daily and payable monthly at an annual rate of 0.75% of the average daily net assets of the Fund.
Fund Accounting Fees and Expenses
ALPS Fund Services, Inc. (“ALPS” and the “Administrator”) (an affiliate of ALPS Distributors, Inc.) serves as administrator to the Fund, and the Fund has agreed to pay expenses incurred in connection with its administrative activities. Pursuant to the Administration, Bookkeeping and Pricing Services Agreement (the “Agreement”), ALPS will provide operational services to the Fund including, but not limited to fund accounting and fund administration and generally assist in the Fund’s operations.
| | |
| | |
| 20 | | Stonebridge Small-Cap Growth Fund |
| | |
| | | Stonebridge Notes to Financial Statements |
| | April 30, 2013 |
Annual Administrative Fee, billed monthly, in the amount of the greater of (a) the annual minimum $75,000 or (b) following basis point fee schedule:
| | | | |
| Average Total Net Assets | | Contractual Fee | | |
Between $0-$500M | | 0.05% | | |
$500M-$1B | | 0.03% | | |
Above $1B | | 0.02% | | |
The Administrator is also reimbursed by the Fund for certain out-of-pocket expenses.
Prior to December 31, 2012, the effective date of the new agreement, the Fund had an administration agreement with ALPS. The administration agreement provided that ALPS received a monthly administration fee equal to the annual rate of 0.10% of the average daily net assets in the Fund up to $250,000,000 and 0.075% of the average daily net assets of the Fund in excess of $250,000,000, and that ALPS’ fee will be no less than $6,250 per month per Fund.
Transfer Agent
ALPS serves as transfer, dividend paying and shareholder servicing agent for the Fund. Effective December 31, 2012, ALPS is compensated based upon a $25,000 annual base fee for the Fund, and annually $9 per direct open account and $7 per open account through the National Securities Clearing Corporation. ALPS is also reimbursed by the Fund for certain out-of-pocket expenses.
Compliance Services
Effective December 31, 2012, ALPS provides services which assist the Trust’s Chief Compliance Officer in monitoring and testing the policies and procedures of the Trust in conjunction with requirements under Rule 38a-1 under the 1940 Act and receives an annual base fee of $20,000. ALPS is reimbursed for certain out-of-pocket expenses.
Principal Financial Officer
Effective December 31, 2012, ALPS provides Principal Financial Officer (“PFO”) services to the Fund at no annual fee.
Distributor
ALPS Distributors, Inc. (“ADI” or the “Distributor”) (an affiliate of ALPS) acts as the distributor of the Fund’s shares pursuant to a Distribution Agreement with the Trust. Shares are sold on a continuous basis by ADI as agent for the Fund, and ADI has agreed to use its best efforts to solicit orders for the sale of the Fund’s shares, although it is not obliged to sell any particular amount of shares. ADI is not entitled to any compensation for its services as Distributor. ADI is registered as a broker-dealer with the Securities and Exchange Commission.
7. INDEMNIFICATIONS
Under the Trust’s organizational documents, its officers and Trustees are indemnified against certain liability arising out of the performance of their duties to the Trust. Additionally, in the normal course of business, the Trust enters into contracts with service providers that may contain general indemnification clauses, which may permit indemnification to the extent permissible under applicable law. The Trust’s maximum exposure under these arrangements is unknown, as this would involve future claims that may be made against the Trust that have not yet occurred.
| | |
| | |
| Annual Report | April 30, 2013 | | 21 |
| | |
| Stonebridge Notes to Financial Statements | | |
| April 30, 2013 | | |
8. FUND REORGANIZATIONS
On February 15, 2013, Stonebridge Small-Cap Growth Fund (the “Acquired Fund”) and Stonebridge Institutional Small-Cap Growth Fund (the “Acquiring Fund”; together the “Predecessor Funds”), each a series of Stonebridge Funds Trust were reorganized into a newly created fund which is named the Stonebridge Small-Cap Growth Fund (the “Fund”), under the Financial Investors Trust (“FIT”). The purpose of the transaction was to combine two funds with similar investment objectives and principal investment strategies and substantially reduce the Predecessor Funds’ operating expenses. Immediately following the close of business on February 15, 2013, the assets of the Acquired Fund were acquired by the Acquiring Fund in exchange for shares of the Acquiring Fund and the assumption by the Acquiring Fund of the liabilities of the Acquired Fund. Upon the closing of the acquisition, the Acquiring Fund issued 625,439 shares in exchange for net assets of the Acquired Fund valued at $5,698,600. The investment portfolio of the Acquired Fund, with a fair value of $5,728,068 and identified cost of $5,356,242 at February 15, 2013, was the principal asset acquired by the Acquiring Fund. On February 19, 2013, the combined net asset value of the Acquired Fund (which included unrealized appreciation of $371,826) and the Acquiring Fund was $18,932,188. Immediately prior to the merger, the net assets of the Acquiring Fund were $13,233,588. The exchange of shares qualified as a tax-free reorganization for federal income tax purposes. The unused capital loss carryforward totaled $967,255 for potential utilization as of October 31, 2012. The Fund assumed all the operating history of the Acquiring Fund.
Assuming the acquisition had been completed on November 1, 2012, the beginning of the annual reporting period of the Acquiring Fund, the Acquiring Fund’s pro forma results of operations for the period ended April 30, 2013, are as follows:
| | | | |
Net Investment Loss | | $ | (210,247 | ) |
Net Realized and Unrealized Gain on Investments | | | 905,447 | |
Net Increase in Net Assets Resulting from Operations | | $ | 695,200 | |
| | |
Because the combined investment portfolios have been managed as a single integrated portfolio since the acquisition was completed, it is not practicable to separate the amounts of revenue and earnings of the Acquired Fund that have been included in the Acquiring Fund’s Statement of Operations since February 19, 2013, as presented in the Funds Annual Report dated April 30, 2013.
| | |
| | |
| 22 | | Stonebridge Small-Cap Growth Fund |
| | |
| | | Report of Independent Registered Public Accounting Firm |
| | |
To the Shareholders and Board of Trustees of Financial Investors Trust:
We have audited the accompanying statements of assets and liabilities, including the statement of investments, of Stonebridge Small-Cap Growth Fund (the “Fund”) (formerly known as “Stonebridge Institutional Small-Cap Growth Fund”), one of the funds of Financial Investors Trust, as of April 30, 2013, and the related statements of operations, changes in net assets, and the financial highlights for the period from November 1, 2012 to April 30, 2013. These financial statements and financial highlights are the responsibility of the Fund’s management. Our responsibility is to express an opinion on these financial statements and financial highlights based on our audit. The statement of operations for the year ended October 31, 2012, the statements of changes in net assets for each of the two years in the period ended October 31, 2012, and the financial highlights for each of the five years in the period ended October 31, 2012 were audited by other auditors whose report, dated December 11, 2012, expressed an unqualified opinion on such financial statements and financial highlights.
We conducted our audit in accordance with the standards of the Public Company Accounting Oversight Board (United States). Those standards require that we plan and perform the audit to obtain reasonable assurance about whether the financial statements and financial highlights are free of material misstatement. The Fund is not required to have, nor were we engaged to perform, an audit of its internal control over financial reporting. Our audit included consideration of internal control over financial reporting as a basis for designing audit procedures that are appropriate in the circumstances, but not for the purpose of expressing an opinion on the effectiveness of the Fund’s internal control over financial reporting. Accordingly, we express no such opinion. An audit also includes examining, on a test basis, evidence supporting the amounts and disclosures in the financial statements, assessing the accounting principles used and significant estimates made by management, as well as evaluating the overall financial statement presentation. Our procedures included confirmation of securities owned as of April 30, 2013, by correspondence with the custodian and brokers, where replies were not received from brokers, we performed other auditing procedures. We believe that our audit provides a reasonable basis for our opinion.
In our opinion, the financial statements and financial highlights referred to above present fairly, in all material respects, the financial position of Stonebridge Small-Cap Growth Fund of Financial Investors Trust as of April 30, 2013, the results of its operations, the changes in its net assets, and the financial highlights for the period from November 1, 2012 to April 30, 2013, in conformity with accounting principles generally accepted in the United States of America.
DELOITTE & TOUCHE LLP
Denver, Colorado
June 27, 2013
| | |
| | |
| Annual Report | April 30, 2013 | | 23 |
| | |
| Stonebridge Additional Information | | |
| April 30, 2013 (Unaudited) | | |
1. FUND HOLDINGS
The Fund files its complete schedule of portfolio holdings with the Securities and Exchange Commission (the “SEC”) for the first and third quarters of each fiscal year on Form N-Q within 60 days after the end of the period. Copies of the Fund’s Form N-Q are available without charge on the SEC website at http://www.sec.gov. You may also review and copy the Form N-Q at the SEC’s Public Reference Room in Washington, DC. For more information about the operation of the Public Reference Room, please call the SEC at 1-800-SEC-0330.
2. FUND PROXY VOTING POLICIES, PROCEDURES AND SUMMARIES
The Fund’s policies and procedures used in determining how to vote proxies and information regarding how the Fund voted proxies relating to portfolio securities during the most recent prior 12-month period ending June 30 are available without charge, (1) upon request, by calling (toll-free) 800-639-3935 and (2) on the SEC’s website at http://www.sec.gov.
3. DISCLOSURE REGARDING APPROVAL OF FUND ADVISORY AGREEMENT
Stonebridge Small-Cap Growth Fund (the “Stonebridge Fund”)
On September 11, 2012, the Trustees met in person to discuss, among other things, the approval of the Investment Advisory Agreement between the Trust and Stonebridge Capital Management, Incorporated (“Stonebridge Capital”) (the “Stonebridge Fund Advisory Agreement”) in accordance with Section 15(c) of the 1940 Act. The Independent Trustees met with independent legal counsel during executive session and discussed the Stonebridge Fund Advisory Agreement and other related materials.
In approving the Investment Advisory Agreement with Stonebridge Capital, the Trustees, including the Independent Trustees, considered the following factors with respect to the Stonebridge Fund:
Investment Advisory Fee Rate: The Trustees reviewed and considered the contractual annual advisory fee to be paid by the Trust, on behalf of the Stonebridge Fund, to Stonebridge Capital of 0.75% of the Stonebridge Fund’s daily net assets, in light of the extent and quality of the advisory services provided by Stonebridge Capital to the Stonebridge Fund.
The Board received and considered information comparing the Stonebridge Fund’s contractual advisory fees and overall expenses with those of funds in both the relevant expense group and universe of funds provided by an independent provider of investment company data.
Based on such information, the Trustees further determined that the contractual annual advisory fees set forth above and the total expense ratio of 1.84% is comparable to others within the Stonebridge Fund’s peer universe.
Nature, Extent and Quality of the Services under the Investment Advisory Agreement: The Trustees received and considered information regarding the nature, extent and quality of services provided to the Stonebridge Fund under the Stonebridge Fund Advisory Agreement. The Trustees reviewed certain background materials supplied by Stonebridge Capital in its presentation, including its Form ADV.
| | |
| | |
| 24 | | Stonebridge Small-Cap Growth Fund |
| | |
| | | Stonebridge Additional Information |
| | April 30, 2013 (Unaudited) |
The Trustees reviewed and considered Stonebridge Capital’s investment advisory personnel, its history as an asset manager, its performance and the amount of assets currently under management by Stonebridge Capital. The Trustees also reviewed the research and decision-making processes utilized by Stonebridge Capital, including the methods adopted to seek to achieve compliance with the investment objectives, policies and restrictions of the Stonebridge Fund.
The Trustees considered the background and experience of Stonebridge Capital’s management in connection with the Stonebridge Fund, including reviewing the qualifications, backgrounds and responsibilities of the management team primarily responsible for the day-to-day portfolio management of the Stonebridge Fund and the extent of the resources devoted to research and analysis of actual and potential investments.
The Trustees also reviewed, among other things, Stonebridge Capital’s description of their Codes of Ethics.
Performance: The Trustees reviewed performance information for the Predecessor Funds of the Stonebridge Fund for various periods ended March 31, 2012. The Trustees also considered Stonebridge Capital’s performance and reputation generally and its investment techniques, risk management controls and decision-making processes.
The Advisers’ Profitability: The Trustees received and considered a profitability analysis prepared by Stonebridge Capital based on the fees payable under the Stonebridge Fund Advisory Agreement. The Trustees considered the profits, if any, anticipated to be realized by Stonebridge Capital in connection with the operation of the Stonebridge Fund. The Board then reviewed Stonebridge Capital’s financial statements in order to analyze the financial condition and stability and profitability of the adviser.
Economies of Scale: The Trustees considered whether economies of scale in the provision of services to the Stonebridge Fund would be passed along to the shareholders.
Other Benefits to the Adviser: The Trustees reviewed and considered any other incidental benefits derived or to be derived by Stonebridge Capital from its relationship with the Stonebridge Fund, including soft dollar arrangements.
In selecting Stonebridge Capital as the Stonebridge Fund’s investment adviser and approving the Stonebridge Fund Advisory Agreement and the fees charged under such agreement, the Trustees concluded that no single factor reviewed by the Trustees was identified by the Trustees to be determinative as the principal factor in whether to approve the Stonebridge Fund Advisory Agreement. Further, the Independent Trustees were advised by independent legal counsel throughout the process. The Trustees, including all of the Independent Trustees, concluded that:
| | • | | the investment advisory fees to be received by Stonebridge Capital with respect to the Stonebridge Fund were comparable to others within the Stonebridge Fund’s peer universe; |
| | • | | the nature, extent and quality of services to be rendered by Stonebridge Capital under the Stonebridge Fund Advisory Agreement were adequate; |
| | • | | the profit, if any, anticipated to be realized by Stonebridge Capital in connection with the operation of the Stonebridge Fund is fair to the Trust; and |
| | |
| | |
| Annual Report | April 30, 2013 | | 25 |
| | |
| Stonebridge Additional Information | | |
| April 30, 2013 (Unaudited) | | |
| | • | | there were no material economies of scale or other incidental benefits accruing to Stonebridge Capital in connection with its relationship with the Stonebridge Fund. |
Based on the Trustees’ deliberations and their evaluation of the information described above, the Trustees, including all of the Independent Trustees, concluded that Stonebridge Capital’s compensation for investment advisory services is consistent with the best interests of the Stonebridge Fund and its shareholders.
| | |
| | |
| 26 | | Stonebridge Small-Cap Growth Fund |
| | |
| | | Trustees & Officers |
| | April 30, 2013 (Unaudited) |
INDEPENDENT TRUSTEES
| | | | | | | | | | |
Name, Address* & Age | | Position(s) Held with Fund | | Term of Office and Length of Time Served** | | Principal Occupation(s) During Past 5 Years*** | | Number of Funds in Fund Complex
Overseen by Trustee**** | | Other Directorships Held
by Trustee During Past 5 Years |
Mary K. Anstine, age 72 | | Trustee | | Ms. Anstine was elected at a special meeting of shareholders held on March 21, 1997 and re-elected at a special meeting of shareholders held on August 7, 2009. | | Ms. Anstine was President/Chief Executive Officer of HealthONE Alliance, Denver, Colorado, and former Executive Vice President of First Interstate Bank of Denver. Ms. Anstine is also Trustee/Director of AV Hunter Trust and Colorado Uplift Board. Ms. Anstine was formerly a Director of the Trust Bank of Colorado (later purchased and now known as Northern Trust Bank), HealthONE and Denver Area Council of the Boy Scouts of America, and a member of the American Bankers Association Trust Executive Committee. | | 26 | | Ms. Anstine is a Trustee of ALPS ETF Trust (13 funds); ALPS Variable Investment Trust (7 funds); Reaves Utility Income Fund (1 fund); and Westcore Trust (12 funds). |
John R. Moran, Jr., age 82 | | Trustee | | Mr. Moran was elected at a special meeting of shareholders held on March 21, 1997 and re- elected at a special meeting of shareholders held on August 7, 2009. | | Mr. Moran is formerly President and CEO of The Colorado Trust, a private foundation serving the health and hospital community in the state of Colorado. An attorney, Mr. Moran was formerly a partner with the firm of Kutak Rock & Campbell in Denver, Colorado and a member of the Colorado House of Representatives. Currently, Mr. Moran is a member of the Treasurer’s Investment Advisory Committee for the University of Colorado. | | 26 | | None. |
| | |
| | |
| Annual Report | April 30, 2013 | | 27 |
| | |
| Trustees & Officers | | |
| April 30, 2013 (Unaudited) | | |
| | | | | | | | | | |
Name,
Address*
& Age | | Position(s)
Held with
Fund | | Term of
Office and
Length of Time
Served** | | Principal Occupation(s)
During Past 5 Years*** | | Number of
Funds in
Fund
Complex
Overseen
by
Trustee**** | | Other
Directorships
Held by Trustee
During Past 5
Years |
Jeremy W. Deems, age 36 | | Trustee | | Mr. Deems was appointed as a Trustee at the March 11, 2008 meeting of the Board of Trustees and elected at a special meeting of shareholders held on August 7, 2009. | | Mr. Deems is the Co-Founder, Chief Operations Officer and Chief Financial Officer of Green Alpha Advisors, LLC. Prior to joining Green Alpha Advisors, Mr. Deems was CFO and Treasurer of Forward Management, LLC, an investment management company, ReFlow Management Co., LLC, a liquidity resourcing company, ReFlow Fund, LLC, a private investment fund, and Sutton Place Management, LLC, an administrative services company (from 2004 to June 2007). Prior to this, Mr. Deems served as Controller of Forward Management, LLC, ReFlow Management Co., LLC, ReFlow Fund, LLC and Sutton Place Management, LLC. | | 26 | | Mr. Deems is a Trustee of ALPS ETF Trust (13 funds); ALPS Variable Investment Trust (7 funds) and Reaves Utility Income Fund (1 fund). |
Jerry G. Rutledge, age 68 | | Trustee | | Mr. Rutledge was elected at a special meeting of shareholders held on August 7, 2009. | | Mr. Rutledge is the President and owner of Rutledge’s Inc., a retail clothing business. Mr. Rutledge is currently Director of the American National Bank. He was from 1994 to 2007 a Regent of the University of Colorado. | | 26 | | Mr. Rutledge is a Trustee of Clough Global Allocation Fund (1 fund), Clough Global Equity Fund (1 fund) and Clough Global Opportunities Fund (1 fund). |
| * | All communications to Trustees and Officers may be directed to Financial Investors Trust c/o 1290 Broadway, Suite 1100, Denver, CO 80203. |
| ** | This is the period for which the Trustee/Officer began serving the Trust. Each Trustee/Officer serves an indefinite term, until his successor is elected. |
| *** | Except as otherwise indicated, each individual has held the office shown or other offices in the same company for the last five years. |
| **** | The Fund Complex includes all series of the Trust (currently 26) and any other investment companies for which Stonebridge Capital Management, Inc. provides investment advisory services (currently none). |
| | |
| | |
| 28 | | Stonebridge Small-Cap Growth Fund |
| | |
| | | Trustees & Officers |
| | April 30, 2013 (Unaudited) |
| | | | | | | | | | |
Name,
Address*
& Age | | Position(s)
Held with
Fund | | Term of
Office and
Length of Time
Served** | | Principal Occupation(s) During
Past 5 Years*** | | Number of
Funds in
Fund
Complex
Overseen
by
Trustee**** | | Other
Directorships
Held by
Trustee During
Past 5 Years |
Michael “Ross” Shell, age 42 | | Trustee | | Mr. Shell was elected at a special meeting of shareholders held on August 7, 2009. | | Mr. Shell is Founder and CEO* of Red Idea, LLC, a strategic consulting/early stage venture firm (since June 2008). From 1999 to 2009, he was a part-owner and Director of Tesser, Inc., a brand agency. From December 2005 to May 2008, he was Director, Marketing and Investor Relations, of Woodbourne, a REIT/real estate hedge fund and private equity firm. Prior to this, from May 2004 to November 2005, he worked as a business strategy consultant; from June 2003 to April 2004, he was on the Global Client Services team of IDEO, a product design/innovation firm; and from 1999 to 2003, he was President of Tesser, Inc. Mr. Shell graduated with honors from Stanford University with a degree in Political Science. | | 26 | | None. |
| | |
| | |
| Annual Report | April 30, 2013 | | 29 |
| | |
| Trustees & Officers | | |
| April 30, 2013 (Unaudited) | | |
INTERESTED TRUSTEE
| | | | | | | | | | |
Name,
Address* & Age | | Position(s)
Held with
Fund | | Term of Office and Length of Time
Served** | | Principal Occupation(s) During Past 5 Years*** | | Number of
Funds in
Fund
Complex
Overseen
by
Trustee**** | | Other Directorships
Held by Trustee
During Past 5 Years |
Edmund J. Burke, age 52 | | Trustee, Chairman and President | | Mr. Burke was elected as Chairman at the August 28, 2009 meeting of the Board of Trustees. Mr. Burke was elected as Trustee at a special meeting of shareholders held on August 7, 2009. Mr. Burke was elected President of the Trust at the December 17, 2002 meeting of the Board of Trustees. | | Mr. Burke is President and a Director of ALPS Holdings, Inc. (“AHI”) (since 2005) and Director of ALPS Advisors, Inc. (“AAI”), ALPS Distributors, Inc. (“ADI”), ALPS Fund Services, Inc. (“AFS”) and ALPS Portfolio Solutions Distributor, Inc. (“APSD”) and from 2001-2008, was President of AAI, ADI, AFS and APSD. Because of his positions with AHI, AAI, ADI, AFS and APSD, Mr. Burke is deemed an affiliate of the Trust as defined under the 1940 Act. Mr. Burke is Trustee and President of the Clough Global Allocation Fund (Trustee since 2006; President since 2004); Trustee and President of the Clough Global Equity Fund (Trustee since 2006; President since 2005); Trustee and President of the Clough Global Opportunities Fund (since 2006); Trustee of the Liberty All-Star Equity Fund; and Director of the Liberty All-Star Growth Fund, Inc. | | 26 | | Mr. Burke is a Trustee of Clough Global Allocation Fund (1 fund); Clough Global Equity Fund (1 fund); Clough Global Opportunities Fund (1 fund); Trustee of the Liberty All-Star Equity Fund (1 fund); and Director of the Liberty All- Star Growth Fund, Inc. (1 fund). |
| * | All communications to Trustees and Officers may be directed to Financial Investors Trust c/o 1290 Broadway, Suite 1100, Denver, CO 80203. |
| ** | This is the period for which the Trustee/Officer began serving the Trust. Each Trustee/Officer serves an indefinite term, until his successor is elected. |
| *** | Except as otherwise indicated, each individual has held the office shown or other offices in the same company for the last five years. |
| **** | The Fund Complex includes all series of the Trust (currently 26) and any other investment companies for which Stonebridge Capital Management, Inc. provides investment advisory services (currently none). |
| | |
| | |
| 30 | | Stonebridge Small-Cap Growth Fund |
| | |
| | | Trustees & Officers |
| | April 30, 2013 (Unaudited) |
OFFICERS
| | | | | | |
Name,
Address* & Age | | Position(s)
Held with
Fund | | Term of Office and Length of Time Served** | | Principal Occupation(s) During Past 5 Years*** |
Kimberly R. Storms, age 40 | | Treasurer | | Ms. Storms was elected Treasurer of the Trust at the March 12, 2013 meeting of the Board of Trustees. | | Ms. Storms is Senior Vice President - Director of Fund Administration of ALPS. Ms. Storms joined ALPS in 1998 as Assistant Controller. Because of her position with ALPS, Ms. Storms is deemed an affiliate of the Trust as defined under the 1940 Act. Ms. Storms is also Treasurer of BPV Family of Funds and ALPS Series Trust; Assistant Treasurer of Liberty All-Star Equity Fund and Liberty All-Star Growth Fund, Inc.; Assistant Treasurer of Tilson Funds; and Chief Financial Officer of The Arbitrage Funds. |
David T. Buhler, age 41 | | Secretary | | Mr. Buhler was elected Secretary of the Trust at the September 11, 2012 meeting of the Board of Trustees. | | Mr. Buhler joined ALPS in June 2010, and is currently Vice President and Associate Counsel of ALPS, AAI, ADI and APSD. Prior to joining ALPS, Mr. Buhler served as Associate General Counsel and Assistant Secretary of Founders Asset Management LLC from 2006 to 2009. Because of his position with ALPS, Mr. Buhler is deemed an affiliate of the Trust as defined under the 1940 Act. Mr. Buhler is also the Secretary of ALPS Variable Investment Trust and Westcore Trust. |
Ted Uhl, age 37 | | Chief Compliance Officer (“CCO”) | | Mr. Uhl was appointed CCO of the Trust at the June 8, 2010 meeting of the Board of Trustees. | | Mr. Uhl joined ALPS in October 2006, and is currently Deputy Compliance Officer of ALPS. Prior to his current role, Mr. Uhl served as Senior Risk Manager for ALPS from October 2006 until June 2010. Before joining ALPS, Mr. Uhl served a Sr. Analyst with Enenbach and Associates (RIA), and a Sr. Financial Analyst at Sprint. Because of his position with ALPS, Mr. Uhl is deemed an affiliate of the Trust as defined under the 1940 Act. Mr. Uhl is also CCO of the Clough Global Funds, Reaves Utility Income Fund, Drexel Hamilton Funds and Transparent Value Trust. |
| * | All communications to Trustees and Officers may be directed to Financial Investors Trust c/o 1290 Broadway, Suite 1100, Denver, CO 80203. |
| ** | This is the period for which the Trustee/Officer began serving the Trust. Each Trustee/Officer serves an indefinite term, until his successor is elected. |
| *** | Except as otherwise indicated, each individual has held the office shown or other offices in the same company for the last five years. |
| | |
| | |
| Annual Report | April 30, 2013 | | 31 |
| | | | |
| | | | |
| | | | |
| | | | |
| | | | | |
| | |
| | | | |
| | This report and of its the financial Fund. The statements report is are not submitted authorized for for the distribution general information to prospective of the investors in the Fund unless preceded or accompanied by a prospectus. | | |
| | | | |
| | | | |
| | | | |
| | | | |
| | | | | |
| | | | |
| | | | |
| | | | |

| | |
| | | www.vulcanvaluepartners.com |
| | |
| | | Shareholder Letter |
| | April 30, 2013 (Unaudited) |
Dear Shareholders:
It is difficult not to be pleased with the strong results that we have enjoyed during the period ended April 30, 2013. Once again, Vulcan Value Partners Small Cap Fund was the standout. As we have often said we place no weight on short-term results, good or bad, and neither should you. In fact, we will and have willingly made decisions that negatively impact short-term performance when we think we can improve our long-term returns and lower risk. We encourage you to place more weight on our longer term historical results and a great deal of weight on our long-term prospects. Within this context we are gratified that both the Vulcan Value Partners Fund and Vulcan Value Partners Small Cap Fund received a 5-Star Overall Morningstar Rating™. (As of April 30, 2013 out of 1,485 Large Growth, and 606 Small Blend Funds, derived from a weighted average of the Fund’s three-, five– and ten– year (if applicable) Morningstar metrics, which are based on risk-adjusted return performance.)1
We are generally more concerned with risk than we are with return. We manage risk by limiting our investments to, what we believe are, extremely high quality companies with stable intrinsic values. Risk can be defined in many ways, but the margin of safety in terms of intrinsic value over price is our primary internal measure of risk. We further manage risk by demanding a discount to those stable values. Done correctly, our discipline allows us to take advantage of stock price volatility because our companies’ values are less volatile than their stock prices.
Unfortunately for us, stock price volatility has waned so far in 2013 as it did in 2012. We would characterize the environment we are in as “normal” where in the aggregate, prices are neither extraordinarily discounted as they were in 2008 nor extraordinarily elevated as they were in 2007. Our investment discipline requires that we increase the number of holdings in our strategies as the price to value ratio contracts. As a result, our portfolios have become slightly more diversified as prices have risen faster than our value estimates have compounded. We have reduced our weights or sold wonderful companies whose prices have risen closer to or reached our estimate of intrinsic value. At the same time, we have increased our positions in companies whose prices are more discounted in relation to our estimate of fair value. Consequently, our margin of safety is higher than it would be otherwise.
We will go into more detail in the individual portfolio reviews below, but the most extreme example of this process of managing risk through reallocating capital into companies with larger margins of safety from companies with lower margins of safety involves Apple and NASDAQ-OMX. NASDAQ-OMX rose nearly 30% during the first quarter of 2013. Its value did not change materially during this time so that its price to value ratio increased and its margin of safety decreased. At the same time, Apple, whose value was also stable, experienced steady price declines and was by far and away the largest negative contributor to our performance. As Apple’s stock declined roughly 16% during the first quarter of 2013 its price to value ratio became more and more attractive. Consequently, we reduced our position in NASDAQ-OMX from approximately 5% to 3.5% and steadily added to our position in Apple, taking its weight to approximately 6.5%, making Apple our largest position in Vulcan Value Partners Fund. This reallocation of capital and many other similar changes to our portfolios mitigates risk by improving our margin of safety and increasing our diversification as prices in general have risen faster than our values during the last 6 months.
The most important aspect to executing our portfolio management discipline is the mitigation of risk as illustrated above. NASDAQ-OMX announced a large acquisition and its stock price dropped
| | |
| Annual Report | April 30, 2013 | | 1 |
| | |
| Shareholder Letter | | |
| April 30, 2013 (Unaudited) | | |
significantly. We were not as impacted as we might have been because we reduced our allocation to NASDAQ-OMX after its price had risen during the first quarter of 2013. Apple, on the other hand, continued to decline until they announced their fiscal second quarter results, with which we were very pleased. In addition to better than expected operational results, Apple announced plans to return $100 billion of capital to shareholders over the next three years with an emphasis on share repurchases. We believe this intelligent capital allocation decision by them should materially increase our value per share for Apple.
As you know we spend 90% of our time on bottom-up analysis of our companies. This analysis helps us form an opinion about macro-economic impacts to our investments. We spend 10% of our time on purely macroeconomic analysis. The two tend to reinforce each other and give us better insights overall. So, what are we seeing? The global economy remains weak, but it is growing. It is growing less than it should, but it is expanding. This sustained weak but positive growth is enabling our companies to produce satisfactory results overall. Valuation levels remain attractive but are not extremely discounted as they were in 2008. However, valuation levels in relation to bonds are extreme. As we have written before, bond valuations appear excessive. It is sad and ironic that many investors, attempting to manage risk, have pushed bond yields to levels that virtually ensure negative real returns and increase the risk of capital destruction. There were early signs that capital flows might be reversing into equities during the first quarter of 2013. As long-term investors we greatly prefer to own high quality companies with large margins of safety and high free cash flow yields to bonds of any kind today.
If “the market” comes to the same conclusion, there will be a re-pricing of equities and bonds and those who thought they were taking less risk will be reminded, once again, how important valuation is to assessing risk. As we write our letters we always feel like we are “preaching to the choir.” We are extremely fortunate to be in partnership with intelligent, long-term investors. You make our jobs easier and much more enjoyable. We could not execute our investment philosophy as effectively if we worked for a different kind of client base. We are grateful for you and take our fiduciary duty to you very seriously. We look forward to working with you over the course of 2013 and in the years to come.
In the discussion that follows, we generally define material contributors and detractors as companies having a greater than 1% impact on the portfolio. We generally limit comment about top contributors and detractors to the top three.
Vulcan Value Partners Fund Review
There were three material contributors to performance; Walt Disney Company, Time Warner Inc. and Discovery Communications. There was one material detractor; Apple, to performance during the period ended April 30, 2013. Apple, Diageo and Fiserv were the three most significant detractors to performance, though Diageo and Fiserv had a less than 1% impact on the portfolio performance.
Disney’s core businesses are performing above our expectations and the company continues to produce ample amounts of free cash flow. Disney is growing its values steadily and we are pleased with the steps the management teams are taking to strengthen their business franchises and allocate capital intelligently.
| | |
| 2 | | www.vulcanvaluepartners.com |
| | |
| | | Shareholder Letter |
| | April 30, 2013 (Unaudited) |
We have long admired Time Warner’s media assets and since Mr. Bewkes took over as CEO, the company has positioned itself well to take advantage of digital distribution mediums and become much more shareholder friendly.
Discovery Communications generates strong free cash flow and is benefitting from strong ratings, steadily growing affiliate fees and an improving advertising climate.
We exited Diageo and Fiserv during the year. Fiserv provides financial services technology solutions worldwide. Diageo, based in the U.K., is a global company with very strong brands and excellent distribution. There was nothing wrong with these companies. Their stock prices compounded more rapidly than their values during the year so that our margin of safety was less attractive compared to the new positions we purchased with their proceeds. The timing of their purchases limited their total contribution to our portfolio.
One of the best examples of our process of managing risk through reallocating capital into companies with larger margins of safety involves Apple and NASDAQ-OMX. NASDAQ-OMX rose nearly 30% during the first quarter of 2013. Its value did not change materially during this time so that its price to value ratio increased and its margin of safety decreased. At the same time, Apple, whose value was also stable, experienced steady price declines and was by far and away the largest negative contributor to our performance. As Apple’s stock declined roughly 16% during the first quarter of 2013 its price to value ratio became more and more attractive. Consequently, we reduced our position in NASDAQ-OMX from approximately 5% to 3.5% and steadily added to our position in Apple, taking its weight to approximately 6.5%, making Apple our largest position in Vulcan Value Partners Fund. This reallocation of capital and many other similar changes to our portfolios mitigates risk by improving our margin of safety and increasing our diversification as prices in general have risen faster than our values during the last 6 months.
Subsequently, NASDAQ-OMX announced a large acquisition and its stock price dropped significantly. We were not as impacted as we might have been because we had reduced our allocation to NASDAQ-OMX after its price had risen during the first quarter of 2013. Apple, on the other hand, continued to decline until they announced their fiscal second quarter results, with which we were very pleased. In addition to better than expected operational results, Apple announced plans to return $100 billion of capital to shareholders over the next three years with an emphasis on share repurchases. We believe this intelligent capital allocation decision by them should materially increase our value per share for Apple.
Vulcan Value Partners Small Cap Review
We had a great deal of activity during the past twelve months. We sold several positions, one of which was taken away from us in a buyout and one of which rose to our estimate of fair value on buyout speculation. We also purchased several new positions with larger margins of safety to replace companies whose prices had risen closer to our estimate of fair value.
There were three material contributors to performance during the period ending April 30, 2013; Iconix Brand Group, Eaton Vance Corp. and Tupperware Brands. There were no material detractors. The three largest detractors were Boingo Wireless, Joseph A. Banks and Towers Watson.
| | |
| Annual Report | April 30, 2013 | | 3 |
| | |
| Shareholder Letter | | |
| April 30, 2013 (Unaudited) | | |
Iconix Brand Group owns brands and licenses them to retailers who pay royalties to Iconix. Iconix manages the brands but does no manufacturing. Retailers like working with Iconix because they can earn brand name margins on “private label” items. The company has stable margins, high return on capital and produces consistently high levels of free cash flow.
Eaton Vance is an extremely well managed investment company that has steadily grown its value through both bull and bear markets.
Tupperware derives over 70% of its sales from outside North America and approximately 60% of its sales from emerging markets.
Eaton Vance’s stock price increased nearly 47% but its value did not change materially during the past six months, so that its price to value ratio increased and its margin of safety decreased. Consequently, we reduced our position in Eaton Vance from approximately 5% to 2%. Iconix Brand Group was similar with a greater than 55% stock price gain and a stable value. As with Eaton Vance, we reduced our weight in Iconix Brand Group. This reallocation of capital and many other similar changes to our portfolios mitigates risk by improving our margin of safety and increasing our diversification as prices in general have risen faster than values during the past six months. It is of interest to note that this process resulted in 25% name turnover but actual turnover of 35%. These differing turnover statistics indicate that while we are long-term investors but that we also actively seek to manage risk in our portfolios.
Contrary to our expectations, our estimate for Boingo Wireless’ value declined. As long as our values are stable or rising we welcome stock price volatility and will buy more as price to value ratios improve. Boingo Wireless’ value declined because their competitive advantage in terms of controlled real estate in airports was not as strong as we had thought. Consistent with our investment discipline we reassessed our investment case and sold the position.
Towers Watson is a global consulting and manufacturing company. We sold Towers Watson to redeploy capital into more discounted companies.
Joseph A. Banks has built a great brand based on service, value, accessibility and quality. We believe its intrinsic value is still significantly discounted to its share price.
Closing
At the risk of being repetitive, while we are pleased with strong results for the period ended April 30, 2013, we do not place any emphasis on short-term results and neither should you. We will willingly take actions that hurt our short-term results if we believe that doing so will mitigate risk and improve our prospects over our five-year time horizon. We know that you understand our investment philosophy and share our long-term time horizon. We have fantastic client partners and we are grateful for you.
Thank you for the confidence you have placed in us.
Sincerely,
C.T. Fitzpatrick
Chief Investment Officer
| | |
| 4 | | www.vulcanvaluepartners.com |
| | |
| | | Shareholder Letter |
| | April 30, 2013 (Unaudited) |
| 1 | For each fund with at least a three-year history, Morningstar calculates a Morningstar Rating™ based on a Morningstar Risk-Adjusted Return measure that accounts for variation in a fund’s monthly performance (including the effects of sales charges, loads, and redemption fees), placing more emphasis on downward variations and rewarding consistent performance. The top 10% of funds in each category receive 5 stars, the next 22.5% receive 4 stars, the next 35% receive 3 stars, the next 22.5% receive 2 stars and the bottom 10% receive 1 star. (Each share class is counted as a fraction of one fund within this scale and rated separately, which may cause slight variations in the distribution percentages.) The Overall Morningstar Rating for a fund is derived from a weighted average of the performance figures associated with its three-, five- and ten-year (if applicable) Morningstar Rating metrics, as of April 30, 2013. Morningstar Rating is for the retail share class only; other classes may have different performance characteristics. © 2013 Morningstar, Inc. All Rights Reserved. The information contained herein: (1) is proprietary to Morningstar and/or its content providers; (2) may not be copied or distributed; and (3) is not warranted to be accurate, complete or timely. Neither Morningstar nor its content providers are responsible for any damages or losses arising from any use of this information. Vulcan Value Partners (VVPLX) was rated 5 Stars out of 1485 for the 3-year period against Large Growth Funds. Vulcan Value Partners (VVPSX) was rated 5 Stars out of 606 for the 3-year period against Small Blend Funds. All information in this report is as of the date shown in the upper right hand corner unless otherwise indicated. |
Intrinsic Value is our estimate of the price a willing buyer would pay and a willing seller would accept, assuming neither was compelled to enter into a transaction.
Margin of Safety is a favorable difference between the price of a company’s shares and the estimated intrinsic value of those shares.
Free Cash Flow is a measure of how much a business generates after accounting for capital expenditures. It is calculated as operating cash flow less capital expenditures.
The views and information discussed in this commentary are as of the date of publication, are subject to change, and may not reflect the writer’s current views. The views expressed represent an assessment of market conditions at a specific point in time, are opinions only and should not be relied upon as investment advice regarding a particular investment or markets in general. Such information does not constitute a recommendation to buy or sell specific securities or investment vehicles. It should not be assumed that any investment will be profitable or will equal the performance of the Funds or any securities or any sectors mentioned herein. The subject matter contained herein has been derived from several sources believed to be reliable and accurate at the time of compilation. The Funds do not accept any liability for losses either direct or consequential caused by the use of this information.
The index is not actively managed and does not reflect any deductions for fees, expenses or taxes. An investor may not invest directly in an index.
| | |
| Annual Report | April 30, 2013 | | 5 |
| | |
| Fund Overview | | |
| April 30, 2013 (Unaudited) | | |
VULCAN VALUE PARTNERS FUND
Average Annual Total Returns (as of 4/30/13)
| | | | | | | | | | | | | | | | |
| | | | | | Since | | | Expense Ratios | |
| | 1 Year | | | Inception* | | | Gross | | | Net** | |
Vulcan Value Partners Fund | | | 19.33% | | | | 14.62% | | | | 1.18% | | | | 1.18% | |
S&P 500® Total Return Index*** | | | 16.89% | | | | 13.42% | | | | | | | | | |
Russell 1000® Value Index*** | | | 21.80% | | | | 13.81% | | | | | | | | | |
Performance data quoted represents past performance. Past performance does not guarantee future results. Investment return and principal value of an investment will fluctuate so that an investor’s shares, when sold or redeemed, may be worth more or less than the original cost. The Fund imposes a 2.00% redemption fee on shares held for less that 90 days. Current performance data may be higher or lower than actual data quoted. For the most current month-end performance data, please call 1-877-421-5078.
The table does not reflect the deduction of taxes that a shareholder would pay on Fund distributions or the redemption of Fund shares.
Subject to investment risks, including possible loss of the principal amount invested.
| * | Fund inception date of 12/30/09. |
| ** | Vulcan Value Partners, LLC (“Vulcan” or the “Adviser”) has given a contractual agreement to the Fund that to the extent the Total Annual Fund Operating Expenses (as defined in Item 3 of Form N- 1A) with respect to the Fund (exclusive of Acquired Fund Fees and Expenses (if any), brokerage expenses, interest expense, taxes and extraordinary expenses) (“Designated Annual Fund Operating Expenses”) exceed 1.25% (1.50% prior to September 1, 2012) of the Fund’s average daily net assets for a particular fiscal year of the Fund, the Adviser will reduce the Management Fee and/or Other Expenses otherwise payable to the Adviser with respect to the Fund for the fiscal year by an amount equal to such excess, and/or the Adviser shall reimburse the Fund by the amount of such excess. This agreement is in effect through August 31, 2013. Without this agreement, expenses could be higher. If the Adviser foregoes any fees and/or reimburses the Fund pursuant to this letter agreement with respect to a particular fiscal year, then the Adviser shall be entitled to recover from the Fund the amount foregone or reimbursed to the extent Designated Annual Fund Operating Expenses are less than 1.25% (1.50% prior to September 1, 2012) of the Fund’s average daily net assets if within three years after the expenses were incurred. |
| *** | Indices are not actively managed and do not reflect any deduction for fees, expenses or taxes. An investor may not invest directly in an index. |
| | |
| 6 | | www.vulcanvaluepartners.com |
| | |
| | | Fund Overview |
| | April 30, 2013 (Unaudited) |
Performance of $10,000 Initial Investment (for the period ended April 30, 2013)
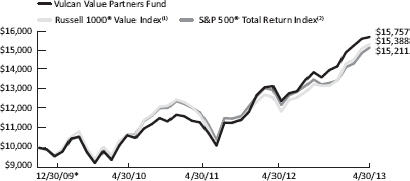
The chart above represents historical performance of a hypothetical investment of $10,000 in the Fund since inception. Past performance does not guarantee future results. This chart does not reflect the deduction of taxes that a shareholder would pay on Fund distributions or the redemption of Fund shares.
| * | Fund inception date of 12/30/09. |
| (1) | The Russell 1000® Value Index measures the performance of the large-cap value segment of the U.S. equity universe. It includes those Russell 1000® companies with lower price-to-book ratios and lower expected growth values. |
| (2) | The S&P 500® Total Return Index is an unmanaged index of 500 common stocks chosen for market size, liquidity and industry group representation. It is a market-value weighted index. |
Indices are not actively managed and do not reflect any deduction for fees, expenses or taxes. It is not possible to invest directly in an index.
Investing in the Fund is subject to investment risks, including possible loss of the principal amount invested.
Industry Allocation (as a % of Net Assets)†
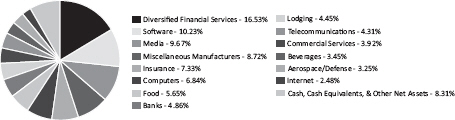
| † | Chart presents indicative values only. |
| | |
| Annual Report | April 30, 2013 | | 7 |
| | |
| Disclosure of Fund Expenses | | |
| April 30, 2013 (Unaudited) | | |
As a shareholder of the Vulcan Value Partners Fund (the “Fund”), you will incur two types of costs: (1) transaction costs, including applicable redemption fees; and (2) ongoing costs, including management fees and other Fund expenses. The following examples are intended to help you understand your ongoing costs (in dollars) of investing in the Fund and to compare these costs with the ongoing costs of investing in other mutual funds. The examples are based on an investment of $1,000 invested on November 1, 2012 and held until April 30, 2013.
Actual Expenses. The first line of each table below provides information about actual account values and actual expenses. You may use the information in this line, together with the amount you invested, to estimate the expenses that you paid over the period. Simply divide your account value by $1,000 (for example, an $8,600 account value divided by $1,000 = 8.6), then multiply the result by the number in the first line under the heading “Expenses Paid During Period” to estimate the expenses you paid on your account during this period.
Hypothetical Example for Comparison Purposes. The second line of the table below provides information about hypothetical account values and hypothetical expenses based on the Fund’s actual expense ratio and an assumed rate of return of 5% per year before expenses, which is not the Fund’s actual return. The hypothetical account values and expenses may not be used to estimate the actual ending account balance or expenses you paid for the period. You may use this information to compare the ongoing costs of investing in the Fund and other mutual funds. To do so, compare this 5% hypothetical example with the 5% hypothetical examples that appear in the shareholder reports of the other funds. The expenses shown in the table are meant to highlight ongoing Fund costs only and do not reflect transaction fees, such as redemption fees or exchange fees. Therefore, the second line of each table below is useful in comparing ongoing costs only, and may not help you determine the relative total costs of owning different funds. In addition, if these transactional costs were included, your costs would have been higher.
Vulcan Value Partners Fund
| | | | | | | | | | | | | | | | | | | | |
| | | Beginning Account
Value 11/1/12 | | Ending Account
Value 4/30/13 | | Expense
Ratio(a) | | Expenses Paid During period 11/1/12 - 4/30/13(b) |
| | | | |
Actual | | | $ | 1,000.00 | | | | $ | 1,153.50 | | | | | 1.14 | % | | | $ | 6.09 | |
Hypothetical
(5% return before expenses) | | | $ | 1,000.00 | | | | $ | 1,019.14 | | | | | 1.14 | % | | | $ | 5.71 | |
| (a) | The Fund’s expense ratios have been annualized based on the Fund’s most recent fiscal half-year expenses. |
| (b) | Expenses are equal to the Fund’s annualized expense ratio, multiplied by the average account value over the period, multiplied by the number of days in the most recent fiscal half-year (181)/365. |
| | |
| 8 | | www.vulcanvaluepartners.com |
| | |
| | | Fund Overview |
| | April 30, 2013 (Unaudited) |
VULCAN VALUE PARTNERS SMALL CAP FUND
Average Annual Total Returns (as of 4/30/2013)
| | | | | | | | | | | | | | | | | | | | |
| | | | | Since | | Expense Ratios |
| | 1 Year | | Inception* | | Gross | | Net** |
Vulcan Value Partners Small Cap Fund | | | | 30.07 | % | | | | 20.78 | % | | | | 1.38 | % | | | | 1.28 | % |
Russell 2000® Value Index*** | | | | 19.71 | % | | | | 13.55 | % | | | | | | | | | | |
Russell 2000® Index*** | | | | 17.69 | % | | | | 14.36 | % | | | | | | | | | | |
Performance data quoted represents past performance. Past performance does not guarantee future results. Investment return and principal value of an investment will fluctuate so that an investor’s shares, when sold or redeemed, may be worth more or less than the original cost. The Fund imposes a 2.00% redemption fee on shares held for less than 90 days. Current performance data may be higher or lower than actual data quoted. For the most current month-end performance data, please call 1-877-421-5078.
The table does not reflect the deduction of taxes that a shareholder would pay on Fund distributions or the redemption of Fund shares.
Subject to investment risks, including possible loss of the principal amount invested.
| * | Fund inception date of 12/30/09. |
| ** | Vulcan Value Partners, LLC (“Vulcan” or the “Adviser”) has given a contractual agreement to the Fund that to the extent the Total Annual Fund Operating Expenses (as defined in Item 3 of Form N-1A) with respect to the Fund (exclusive of Acquired Fund Fees and Expenses (if any), brokerage expenses, interest expense, taxes and extraordinary expenses) (“Designated Annual Fund Operating Expenses”) exceed 1.25% (1.50% prior to September 1, 2012) of such Fund’s average daily net assets for a particular fiscal year of the Fund, the Adviser will reduce the Management Fee and/or Other Expenses otherwise payable to the Adviser with respect to the Fund for such fiscal year by an amount equal to such excess, and/or the Adviser shall reimburse the Fund by the amount of such excess. This agreement is in effect through August 31, 2013. Without this agreement, expenses could be higher. If the Adviser foregoes any fees and/or reimburses the Fund pursuant to this letter agreement with respect to a particular fiscal year, then the Adviser shall be entitled to recover from the Fund the amount foregone or reimbursed to the extent Designated Annual Fund Operating Expenses are less than 1.25% (1.50% prior to September 1, 2012) of the Fund’s average daily net assets if within three years after the expenses were incurred. |
| *** | Indices are not actively managed and do not reflect any deduction for fees, expenses or taxes. An investor may not invest directly in an index. |
| | |
| Annual Report | April 30, 2013 | | 9 |
| | |
| Fund Overview | | |
| April 30, 2013 (Unaudited) | | |
Performance of $10,000 Initial Investment (for the period ended April 30, 2013)
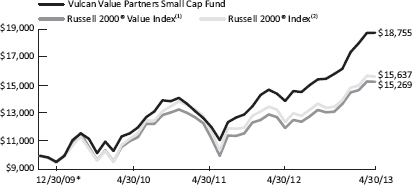
The chart above represents historical performance of a hypothetical investment of $10,000 in the Fund since inception. Past performance does not guarantee future results. This chart does not reflect the deduction of taxes that a shareholder would pay on Fund distributions or the redemption of Fund shares.
| * | Fund inception date of 12/30/09. |
| (1) | The Russell 2000® Value Index measures the performance of small-cap value segment of the U.S. equity universe. It includes those Russell 2000® companies with lower price-to-book ratios and lower forecasted growth values. |
| (2) | The Russell 2000® Index measures the performance of the small-cap segment of the U.S. equity universe. The Russell 2000® Index is a subset of the Russell 3000® Index representing approximately 8% of the total market capitalization of that index. It includes approximately 2,000 of the smallest securities based on a combination of their market cap and current index membership. |
Indices are not actively managed and do not reflect any deduction for fees, expenses or taxes. An investor may not invest directly in an index.
Investing in the Fund is subject to investment risks, including possible loss of the principal amount invested.
Industry Allocation (as a % of Net Assets)†
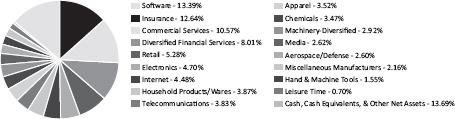
| † | Chart presents indicative values only. |
| | |
| 10 | | www.vulcanvaluepartners.com |
| | |
| | | Disclosure of Fund Expenses |
| | April 30, 2013 (Unaudited) |
As a shareholder of the Vulcan Value Partners Small Cap Fund (the “Fund”), you will incur two types of costs: (1) transaction costs, including applicable redemption fees; and (2) ongoing costs, including management fees and other Fund expenses. The following examples are intended to help you understand your ongoing costs (in dollars) of investing in the Fund and to compare these costs with the ongoing costs of investing in other mutual funds. The examples are based on an investment of $1,000 invested on November 1, 2012 and held until April 30, 2013.
Actual Expenses. The first line of each table below provides information about actual account values and actual expenses. You may use the information in this line, together with the amount you invested, to estimate the expenses that you paid over the period. Simply divide your account value by $1,000 (for example, an $8,600 account value divided by $1,000 = 8.6), then multiply the result by the number in the first line under the heading “Expenses Paid During Period” to estimate the expenses you paid on your account during this period.
Hypothetical Example for Comparison Purposes. The second line of the table below provides information about hypothetical account values and hypothetical expenses based on the Fund’s actual expense ratio and an assumed rate of return of 5% per year before expenses, which is not the Fund’s actual return. The hypothetical account values and expenses may not be used to estimate the actual ending account balance or expenses you paid for the period. You may use this information to compare the ongoing costs of investing in the Fund and other mutual funds. To do so, compare this 5% hypothetical example with the 5% hypothetical examples that appear in the shareholder reports of the other funds. The expenses shown in the table are meant to highlight ongoing Fund costs only and do not reflect transaction fees, such as redemption fees or exchange fees. Therefore, the second line of each table below is useful in comparing ongoing costs only, and may not help you determine the relative total costs of owning different funds. In addition, if these transactional costs were included, your costs would have been higher.
Vulcan Value Partners Small Cap Fund
| | | | | | | | | | | | | | | | | | | | |
| | | Beginning Account
Value 11/1/12 | | Ending Account
Value 4/30/13 | | Expense
Ratio(a) | | Expenses Paid During period 11/1/12 - 4/30/13(b) |
| | | | |
Actual | | | $ | 1,000.00 | | | | $ | 1,211.50 | | | | | 1.25 | % | | | $ | 6.85 | |
Hypothetical
(5% return before expenses) | | | $ | 1,000.00 | | | | $ | 1,018.60 | | | | | 1.25 | % | | | $ | 6.26 | |
| (a) | The Fund’s expense ratios have been annualized based on the Fund’s most recent fiscal half-year expenses. |
| (b) | Expenses are equal to the Fund’s annualized expense ratio, multiplied by the average account value over the period, multiplied by the number of days in the most recent fiscal half-year (181)/365. |
| | |
| Annual Report | April 30, 2013 | | 11 |
| | |
| Statement of Investments | | Vulcan Value Partners Fund |
| April 30, 2013 | | |
| | | | | | | | |
| | | Shares | | | Value (Note 2) | |
COMMON STOCKS (91.69%) | | | | | | | | |
Communications (16.46%) | | | | | | | | |
Internet (2.48%) | | | | | | | | |
Google, Inc., Class A(a) | | | 13,444 | | | $ | 11,085,519 | |
| | |
Media (9.67%) | | | | | | | | |
Discovery Communications, Inc., Class C(a) | | | 204,769 | | | | 14,516,074 | |
Time Warner, Inc. | | | 141,129 | | | | 8,436,692 | |
The Walt Disney Co. | | | 323,023 | | | | 20,298,765 | |
| | | | | | | 43,251,531 | |
Telecommunications (4.31%) | | | | | | | | |
Cisco Systems, Inc. | | | 921,103 | | | | 19,269,475 | |
| | |
TOTAL COMMUNICATIONS | | | | | | | 73,606,525 | |
| | |
Consumer, Cyclical (4.45%) | | | | | | | | |
Lodging (4.45%) | | | | | | | | |
Intercontinental Hotels Group PLC, ADR | | | 674,055 | | | | 19,918,337 | |
| | |
TOTAL CONSUMER, CYCLICAL | | | | | | | 19,918,337 | |
| | |
Consumer, Non-cyclical (13.02%) | | | | | | | | |
Beverages (3.45%) | | | | | | | | |
The Coca-Cola Co. | | | 364,989 | | | | 15,449,984 | |
| | |
Commercial Services (3.92%) | | | | | | | | |
Mastercard, Inc., Class A | | | 31,731 | | | | 17,545,022 | |
| | |
Food (5.65%) | | | | | | | | |
Tesco PLC | | | 3,290,683 | | | | 18,559,452 | |
Unilever NV, New York Registry Shares | | | 157,636 | | | | 6,696,378 | |
| | | | | | | 25,255,830 | |
| | |
TOTAL CONSUMER, NON-CYCLICAL | | | | | | | 58,250,836 | |
| | |
Financial (28.72%) | | | | | | | | |
Banks (4.86%) | | | | | | | | |
The Bank of New York Mellon Corp. | | | 770,226 | | | | 21,735,778 | |
| | |
Diversified Financial Services (16.53%) | | | | | | | | |
CME Group, Inc. | | | 344,975 | | | | 20,995,178 | |
Franklin Resources, Inc. | | | 140,973 | | | | 21,802,884 | |
The NASDAQ OMX Group, Inc. | | | 612,677 | | | | 18,061,718 | |
| | |
| 12 | | www.vulcanvaluepartners.com |
| | |
| Vulcan Value Partners Fund | | Statement of Investments |
| | April 30, 2013 |
| | | | | | | | |
| | | Shares | | | Value (Note 2) | |
Diversified Financial Services (continued) | | | | | | | | |
Visa, Inc., Class A | | | 77,708 | | | $ | 13,090,690 | |
| | | | | | | 73,950,470 | |
| | |
Insurance (7.33%) | | | | | | | | |
The Chubb Corp. | | | 143,583 | | | | 12,645,355 | |
Everest Re Group, Ltd. | | | 149,084 | | | | 20,124,849 | |
| | | | | | | 32,770,204 | |
| | |
TOTAL FINANCIAL | | | | | | | 128,456,452 | |
| | |
Industrial (11.97%) | | | | | | | | |
Aerospace/Defense (3.25%) | | | | | | | | |
United Technologies Corp. | | | 159,421 | | | | 14,553,543 | |
| | |
Miscellaneous Manufacturing (8.72%) | | | | | | | | |
Dover Corp. | | | 281,400 | | | | 19,410,972 | |
Parker Hannifin Corp. | | | 221,278 | | | | 19,598,592 | |
| | | | | | | 39,009,564 | |
| | |
TOTAL INDUSTRIAL | | | | | | | 53,563,107 | |
| | |
Technology (17.07%) | | | | | | | | |
Computers (6.84%) | | | | | | | | |
Apple, Inc. | | | 69,092 | | | | 30,590,483 | |
| | |
Software (10.23%) | | | | | | | | |
Check Point Software Technologies, Ltd.(a) | | | 316,900 | | | | 14,773,878 | |
Microsoft Corp | | | 294,153 | | | | 9,736,464 | |
Oracle Corp. | | | 648,439 | | | | 21,255,831 | |
| | | | | | | 45,766,173 | |
| | |
TOTAL TECHNOLOGY | | | | | | | 76,356,656 | |
| | |
TOTAL COMMON STOCKS (Cost $341,999,075) | | | | | | | 410,151,913 | |
| | |
| Annual Report | April 30, 2013 | | 13 |
| | |
| Statement of Investments | | Vulcan Value Partners Fund |
| April 30, 2013 | | |
| | | | | | | | | | |
| | | 7-Day
Yield | | Shares | | | Value (Note 2) | |
SHORT TERM INVESTMENTS (7.28%) | | | | | | | | | | |
Money Market Fund (7.28%) | | | | | | | | | | |
Dreyfus Treasury Prime Cash Management Fund, Institutional Shares | | 0.010% | | | 32,549,253 | | | $ | 32,549,253 | |
| | | |
TOTAL SHORT TERM INVESTMENTS (Cost $32,549,253) | | | | | | | | | 32,549,253 | |
| | | |
TOTAL INVESTMENTS (98.97%) (Cost $374,548,328) | | | | | | | | $ | 442,701,166 | |
| | | |
Other Assets In Excess Of Liabilities (1.03%) | | | | | | | | | 4,596,024 | |
| | | |
NET ASSETS (100.00%) | | | | | | | | $ | 447,297,190 | |
| | | | | | | | | | | |
| (a) | Non-Income Producing Security. |
Common Abbreviations:
ADR - American Depositary Receipt.
Ltd. - Limited.
NV - Naamloze Vennootschap is the Dutch term for a public limited liability corporation.
PLC - Public Limited Company.
Holdings are subject to change.
For Fund compliance purposes, the Fund’s industry classifications refer to any one or more of the industry sub-classifications used by one or more widely recognized market indexes or ratings group indexes, and/or as defined by Fund management. This definition may not apply for purposes of this report, which may combine industry sub-classifications for reporting ease. Industries are shown as a percent of net assets.
See Accompanying Notes to Financial Statements.
| | |
| 14 | | www.vulcanvaluepartners.com |
| | |
| Vulcan Value Partners Small Cap Fund | | Statement of Investments |
| | April 30, 2013 |
| | | | | | | | |
| | | Shares | | | Value (Note 2) | |
COMMON STOCKS (86.31%) | | | | | | | | |
Basic Materials (3.47%) | | | | | | | | |
Chemicals (3.47%) | | | | | | | | |
KMG Chemicals, Inc. | | | 803,867 | | | $ | 14,758,998 | |
| | |
TOTAL BASIC MATERIALS | | | | | | | 14,758,998 | |
| | |
Communications (10.93%) | | | | | | | | |
Internet (4.48%) | | | | | | | | |
ValueClick, Inc.(a) | | | 616,905 | | | | 19,037,688 | |
| | |
Media (2.62%) | | | | | | | | |
John Wiley & Sons, Inc., Class A | | | 292,245 | | | | 11,154,992 | |
| | |
Telecommunications (3.83%) | | | | | | | | |
NeuStar, Inc., Class A(a) | | | 371,473 | | | | 16,296,521 | |
| | |
TOTAL COMMUNICATIONS | | | | | | | 46,489,201 | |
| | |
Consumer, Cyclical (9.50%) | | | | | | | | |
Apparel (3.52%) | | | | | | | | |
Iconix Brand Group, Inc.(a) | | | 522,923 | | | | 14,981,744 | |
| | |
Leisure Time (0.70%) | | | | | | | | |
Interval Leisure Group, Inc. | | | 155,742 | | | | 2,968,442 | |
| | |
Retail (5.28%) | | | | | | | | |
Jos. A. Bank Clothiers, Inc.(a) | | | 352,377 | | | | 15,391,827 | |
Sonic Corp.(a) | | | 561,463 | | | | 7,035,132 | |
| | | | | | | 22,426,959 | |
| | |
TOTAL CONSUMER, CYCLICAL | | | | | | | 40,377,145 | |
| | |
Consumer, Non-cyclical (14.44%) | | | | | | | | |
Commercial Services (10.57%) | | | | | | | | |
Global Payments, Inc. | | | 156,918 | | | | 7,280,995 | |
Heartland Payment Systems, Inc. | | | 585,297 | | | | 19,250,418 | |
Universal Technical Institute, Inc. | | | 1,549,569 | | | | 18,393,384 | |
| | | | | | | 44,924,797 | |
| | |
Household Products/Wares (3.87%) | | | | | | | | |
Jarden Corp.(a) | | | 127,234 | | | | 5,726,803 | |
| | |
| Annual Report | April 30, 2013 | | 15 |
| | |
| Statement of Investments | | Vulcan Value Partners Small Cap Fund |
| April 30, 2013 | | |
| | | | | | | | |
| | | Shares | | | Value (Note 2) | |
Household Products/Wares (continued) | | | | | | | | |
Tupperware Brands Corp. | | | 133,511 | | | $ | 10,720,933 | |
| | | | | | | 16,447,736 | |
| | |
TOTAL CONSUMER, NON-CYCLICAL | | | | | | | 61,372,533 | |
| | |
Financial (20.65%) | | | | | | | | |
Diversified Financial Services (8.01%) | | | | | | | | |
Eaton Vance Corp. | | | 177,303 | | | | 7,070,844 | |
Janus Capital Group, Inc. | | | 1,342,387 | | | | 11,974,092 | |
The NASDAQ OMX Group, Inc. | | | 509,700 | | | | 15,025,956 | |
| | | | | | | 34,070,892 | |
| | |
Insurance (12.64%) | | | | | | | | |
Endurance Specialty Holdings, Ltd. | | | 330,602 | | | | 16,189,580 | |
Everest Re Group, Ltd. | | | 111,757 | | | | 15,086,077 | |
The Navigators Group, Inc.(a) | | | 276,478 | | | | 16,002,546 | |
ProAssurance Corp. | | | 131,934 | | | | 6,463,447 | |
| | | | | | | 53,741,650 | |
| | |
TOTAL FINANCIAL | | | | | | | 87,812,542 | |
| | |
Industrial (13.93%) | | | | | | | | |
Aerospace/Defense (2.60%) | | | | | | | | |
Curtiss-Wright Corp. | | | 337,228 | | | | 11,074,568 | |
| | |
Electronics (4.70%) | | | | | | | | |
Ituran Location and Control, Ltd. | | | 671,343 | | | | 10,714,634 | |
PerkinElmer, Inc. | | | 302,550 | | | | 9,273,158 | |
| | | | | | | 19,987,792 | |
| | |
Hand/Machine Tools (1.55%) | | | | | | | | |
Lincoln Electric Holdings, Inc. | | | 124,824 | | | | 6,585,714 | |
| | |
Machinery-Diversified (2.92%) | | | | | | | | |
Altra Holdings, Inc. | | | 188,826 | | | | 5,032,213 | |
Nordson Corp. | | | 106,470 | | | | 7,398,600 | |
| | | | | | | 12,430,813 | |
| | |
Miscellaneous Manufacturing (2.16%) | | | | | | | | |
Donaldson Co., Inc. | | | 251,878 | | | | 9,163,322 | |
| | |
TOTAL INDUSTRIAL | | | | | | | 59,242,209 | |
| | |
| 16 | | www.vulcanvaluepartners.com |
| | |
| Vulcan Value Partners Small Cap Fund | | Statement of Investments |
| | April 30, 2013 |
| | | | | | | | | | | | |
| | | | | | Shares | | | Value (Note 2) | |
Technology (13.39%) | | | | | | | | | | | | |
Software (13.39%) | | | | | | | | | | | | |
ACI Worldwide, Inc.(a) | | | | | | | 157,106 | | | $ | 7,385,553 | |
Dun & Bradstreet Corp. | | | | | | | 210,628 | | | | 18,630,047 | |
Fair Isaac Corp. | | | | | | | 296,292 | | | | 13,801,281 | |
MSCI, Inc.(a) | | | | | | | 202,315 | | | | 6,898,942 | |
Open Text Corp. | | | | | | | 155,867 | | | | 10,192,143 | |
| | | | | | | | | | | 56,907,966 | |
| | | |
TOTAL TECHNOLOGY | | | | | | | | | | | 56,907,966 | |
| | | |
TOTAL COMMON STOCKS (Cost $326,440,127) | | | | | | | | | | | 366,960,594 | |
| | | |
| | | 7-Day
Yield | | | Shares | | | Value (Note 2) | |
SHORT TERM INVESTMENTS (3.95%) | | | | | | | | | | | | |
Money Market Fund (3.95%) | | | | | | | | | | | | |
Dreyfus Treasury Prime Cash Management Fund, Institutional Shares | | | 0.010% | | | | 16,797,610 | | | | 16,797,610 | |
| | | |
TOTAL SHORT TERM INVESTMENTS (Cost $16,797,610) | | | | | | | | | | | 16,797,610 | |
| | | |
TOTAL INVESTMENTS (90.26%) (Cost $343,237,737) | | | | | | | | | | $ | 383,758,204 | |
| | | |
Other Assets In Excess Of Liabilities (9.74%) | | | | | | | | | | | 41,394,000 | |
| | | |
NET ASSETS (100.00%) | | | | | | | | | | $ | 425,152,204 | |
| | | | | | | | | | | | | |
| (a) | Non-Income Producing Security. |
Common Abbreviations:
Ltd. - Limited.
Holdings are subject to change.
For Fund compliance purposes, the Fund’s industry classifications refer to any one or more of the industry sub-classifications used by one or more widely recognized market indexes or ratings group indexes, and/or as defined by Fund management. This definition may not apply for purposes of this report, which may combine industry sub-classifications for reporting ease. Industries are shown as a percent of net assets.
| | |
| Annual Report | April 30, 2013 | | 17 |
| | |
| Statements of Assets and Liabilities | | |
| April 30, 2013 | | |
| | | | | | | | | | |
| | | Vulcan Value Partners
Fund | | Vulcan Value Partners
Small Cap Fund |
ASSETS: | | | | | | | | | | |
Investments, at value | | | $ | 442,701,166 | | | | $ | 383,758,204 | |
Receivable for investments sold | | | | – | | | | | 3,031,976 | |
Receivable for shares sold | | | | 7,345,862 | | | | | 50,128,184 | |
Dividends receivable | | | | 444,875 | | | | | 49,947 | |
Other assets | | | | 16,282 | | | | | 20,207 | |
Total assets | | | | 450,508,185 | | | | | 436,988,518 | |
| | |
LIABILITIES: | | | | | | | | | | |
Payable to custodian | | | | 4,722 | | | | | – | |
Payable for investments purchased | | | | 2,631,559 | | | | | 11,386,868 | |
Payable for shares redeemed | | | | 47,033 | | | | | 64,177 | |
Payable to adviser | | | | 398,626 | | | | | 271,413 | |
Payable for administration fees | | | | 16,983 | | | | | 12,530 | |
Payable for transfer agency fees | | | | 10,845 | | | | | 14,826 | |
Payable for audit and tax fees | | | | 17,827 | | | | | 17,544 | |
Payable for trustee fees and expenses | | | | 11,795 | | | | | 7,486 | |
Accrued expenses and other liabilities | | | | 71,605 | | | | | 61,470 | |
Total liabilities | | | | 3,210,995 | | | | | 11,836,314 | |
| | | | | | | | | | | |
NET ASSETS | | | $ | 447,297,190 | | | | $ | 425,152,204 | |
| | | | | | | | | | | |
| | |
NET ASSETS CONSIST OF: | | | | | | | | | | |
| | |
Paid-in capital (Note 5) | | | $ | 374,688,439 | | | | $ | 371,178,510 | |
Accumulated net investment income/(loss) | | | | 418,244 | | | | | (348,823) | |
Accumulated net realized gain on investments | | | | 4,037,669 | | | | | 13,802,050 | |
Net unrealized appreciation in value of investments | | | | 68,152,838 | | | | | 40,520,467 | |
NET ASSETS | | | $ | 447,297,190 | | | | $ | 425,152,204 | |
| | | | | | | | | | | |
| | |
INVESTMENTS, AT COST | | | $ | 374,548,328 | | | | $ | 343,237,737 | |
| | |
PRICING OF SHARES: | | | | | | | | | | |
Net Asset Value, offering and redemption price per share | | | $ | 15.28 | | | | $ | 16.97 | |
Shares of beneficial interest outstanding
(unlimited number of shares, no par value common stock authorized) | | | | 29,270,595 | | | | | 25,057,609 | |
| | |
| See Accompanying Notes to Financial Statements. | | |
| 18 | | www.vulcanvaluepartners.com |
| | |
| | | Statements of Operations |
| | For the Year Ended April 30, 2013 |
| | | | | | | | | | |
| | | Vulcan Value Partners
Fund | | Vulcan Value Partners
Small Cap Fund |
INVESTMENT INCOME: | | | | | | | | | | |
Dividends | | | $ | 7,000,847 | | | | $ | 2,501,213 | |
Foreign taxes withheld | | | | (58,553) | | | | | (77,793) | |
Total investment income | | | | 6,942,294 | | | | | 2,423,420 | |
| | |
EXPENSES: | | | | | | | | | | |
Investment advisory fees (Note 6) | | | | 3,106,747 | | | | | 1,936,846 | |
Administrative fees | | | | 179,457 | | | | | 86,643 | |
Transfer agency fees | | | | 58,131 | | | | | 66,758 | |
Legal and audit fees | | | | 27,948 | | | | | 21,814 | |
Custodian fees | | | | 33,036 | | | | | 19,156 | |
Trustee fees and expenses | | | | 23,268 | | | | | 11,082 | |
Recoupment of previously waived fees | | | | 101,609 | | | | | – | |
Other | | | | 121,636 | | | | | 94,281 | |
Total expenses before waiver | | | | 3,651,832 | | | | | 2,236,580 | |
Less fees waived/reimbursed by investment advisor | | | | – | | | | | (161,158) | |
Total net expenses | | | | 3,651,832 | | | | | 2,075,422 | |
NET INVESTMENT INCOME | | | | 3,290,462 | | | | | 347,998 | |
| | |
Net realized gain on investments | | | | 16,601,840 | | | | | 15,172,626 | |
Net change in unrealized appreciation of investments | | | | 46,424,045 | | | | | 35,892,359 | |
NET REALIZED AND UNREALIZED GAIN ON INVESTMENTS | | | | 63,025,885 | | | | | 51,064,985 | |
NET INCREASE IN NET ASSETS RESULTING FROM OPERATIONS | | | $ | 66,316,347 | | | | $ | 51,412,983 | |
| | | | | | | | | | | |
| | |
| See Accompanying Notes to Financial Statements. | | |
| Annual Report | April 30, 2013 | | 19 |
| | |
| Statements of Changes in Net Assets | | |
| | |
| | | | | | | | |
| | | Vulcan Value Partners Fund | |
| | |
| | | For the Year Ended April 30, 2013 | | | For the Year Ended April 30, 2012 | |
OPERATIONS: | | | | | | | | |
Net investment income | | $ | 3,290,462 | | | $ | 138,765 | |
Net realized gain on investments | | | 16,601,840 | | | | 50,407 | |
Net change in unrealized appreciation on investments | | | 46,424,045 | | | | 17,634,062 | |
Net increase in net assets resulting from operations | | | 66,316,347 | | | | 17,823,234 | |
| | |
DISTRIBUTIONS TO SHAREHOLDERS (Note 3): | | | | | | | | |
From net investment income | | | (2,967,613) | | | | (44,343) | |
From net realized gains on investments | | | (2,972,698) | | | | (815,977) | |
Net decrease in net assets from distributions | | | (5,940,311) | | | | (860,320) | |
| | |
SHARE TRANSACTIONS: (Note 5) | | | | | | | | |
Proceeds from sales of shares | | | 346,215,896 | | | | 61,081,687 | |
Issued to shareholders in reinvestment of distributions | | | 5,574,795 | | | | 847,260 | |
Cost of shares redeemed, net of redemption fees | | | (89,956,685) | | | | (2,561,935) | |
Net increase from share transactions | | | 261,834,006 | | | | 59,367,012 | |
| | |
Net increase in net assets | | | 322,210,042 | | | | 76,329,926 | |
| | |
NET ASSETS: | | | | | | | | |
Beginning of year | | | 125,087,148 | | | | 48,757,222 | |
End of year* | | $ | 447,297,190 | | | $ | 125,087,148 | |
| | | | | | | | | |
| | |
*Includes accumulated net investment income of: | | $ | 418,244 | | | $ | 95,395 | |
| | |
| See Accompanying Notes to Financial Statements. | | |
| 20 | | www.vulcanvaluepartners.com |
| | |
| | | Statements of Changes in Net Assets |
| | |
| | | | | | | | |
| | | Vulcan Value Partners Small Cap Fund | |
| | |
| | For the | | | For the | |
| | Year Ended | | | Year Ended | |
| | April 30,
2013 | | | April 30,
2012 | |
OPERATIONS: | | | | | | | | |
Net investment income | | $ | 347,998 | | | $ | 52,729 | |
Net realized gain/(loss) on investments | | | 15,172,626 | | | | (90,126) | |
Net change in unrealized appreciation on investments | | | 35,892,359 | | | | 548,570 | |
Net increase in net assets resulting from operations | | | 51,412,983 | | | | 511,173 | |
| | |
DISTRIBUTIONS TO SHAREHOLDERS (Note 3): | | | | | | | | |
From net investment income | | | (764,307) | | | | – | |
From net realized gains on investments | | | (1,181,796) | | | | (1,992,792) | |
Net decrease in net assets from distributions | | | (1,946,103) | | | | (1,992,792) | |
| | |
SHARE TRANSACTIONS: (Note 5) | | | | | | | | |
Proceeds from sales of shares | | | 355,116,824 | | | | 17,760,668 | |
Issued to shareholders in reinvestment of distributions | | | 1,713,133 | | | | 1,871,084 | |
Cost of shares redeemed, net of redemption fees | | | (21,247,646) | | | | (14,409,938) | |
Net increase from share transactions | | | 335,582,311 | | | | 5,221,814 | |
| | |
Net increase in net assets | | | 385,049,191 | | | | 3,740,195 | |
| | |
NET ASSETS: | | | | | | | | |
Beginning of year | | | 40,103,013 | | | | 36,362,818 | |
End of year* | | $ | 425,152,204 | | | $ | 40,103,013 | |
| | | | | | | | | |
| | |
*Includes accumulated net investment income/(loss) of: | | $ | (348,823 | ) | | $ | 52,729 | |
| | |
| See Accompanying Notes to Financial Statements. | | |
| Annual Report | April 30, 2013 | | 21 |
| | |
| Financial Highlights | | Vulcan Value Partners Fund |
| For a share outstanding throughout the periods presented. | | |
| | | | | | | | | | | | | | | | | | | | |
| | | For the Year
Ended April 30,
2013 | | For the Year
Ended April 30,
2012 | | For the Year
Ended April 30,
2011 | | For the Period
December 30,
2009
(Inception) to
April 30, 2010 |
NET ASSET VALUE, BEGINNING OF PERIOD | | | $ | 13.03 | | | | $ | 11.66 | | | | $ | 10.57 | | | | $ | 10.00 | |
INCOME/(LOSS) FROM OPERATIONS: | | | | | | | | | | | | | | | | | | | | |
Net investment income/(loss) | | | | 0.15 | (a) | | | | 0.02 | (a) | | | | 0.01 | (a) | | | | (0.00) | (b) |
Net realized and unrealized gain on investments | | | | 2.35 | | | | | 1.45 | | | | | 1.13 | | | | | 0.57 | |
Total from investment operations | | | | 2.50 | | | | | 1.47 | | | | | 1.14 | | | | | 0.57 | |
| | | | |
LESS DISTRIBUTIONS TO SHAREHOLDERS: | | | | | | | | | | | | | | | | | | | | |
From net investment income | | | | (0.12) | | | | | (0.01) | | | | | (0.01) | | | | | – | |
Distributions from net realized gain on investments | | | | (0.13) | | | | | (0.09) | | | | | (0.04) | | | | | – | |
Total distributions | | | | (0.25) | | | | | (0.10) | | | | | (0.05) | | | | | – | |
| | | | |
Redemption fees added to paid-in capital | | | | 0.00 | (c) | | | | 0.00 | (c) | | | | 0.00 | (c) | | | | 0.00 | (c) |
Increase in net asset value | | | | 2.25 | | | | | 1.37 | | | | | 1.09 | | | | | 0.57 | |
NET ASSET VALUE, END OF YEAR | | | $ | 15.28 | | | | $ | 13.03 | | | | $ | 11.66 | | | | $ | 10.57 | |
| | | | | | | | | | | | | | | | | | | | | |
| | | | |
Total return | | | | 19.33% | | | | | 12.73% | | | | | 10.82% | | | | | 5.70% | (d) |
| | | | |
RATIOS AND SUPPLEMENTAL DATA: | | | | | | | | | | | | | | | | | | | | |
Net assets, end of year (000’s) | | | $ | 447,297 | | | | $ | 125,087 | | | | $ | 48,757 | | | | $ | 12,807 | |
Ratio of expenses to average net assets without fee waivers/reimbursements | | | | 1.18% | | | | | 1.51% | | | | | 2.01% | | | | | 4.97% | (e) |
Ratio of expenses to average net assets including fee waivers/reimbursements | | | | 1.18% | | | | | 1.50% | | | | | 1.50% | | | | | 1.50% | (e) |
Net investment income/(loss) to average net assets including fee waivers/reimbursements | | | | 1.06% | | | | | 0.16% | | | | | 0.07% | | | | | (0.06%) | (e) |
Portfolio turnover rate | | | | 24% | | | | | 49% | | | | | 44% | | | | | 24% (d) | |
| (a) | Per share numbers have been calculated using the average shares method. |
| (b) | Less than $(0.005) per share. |
| (c) | Less than $0.005 per share. |
| | |
| See Accompanying Notes to Financial Statements. | | |
| 22 | | www.vulcanvaluepartners.com |
| | |
| Vulcan Value Partners Small Cap Fund | | Financial Highlights |
| | For a share outstanding throughout each period presented. |
| | | | | | | | | | | | | | | | | | | | |
| | | For the Year
Ended April 30,
2013 | | For the Year
Ended April 30,
2012 | | For the Year
Ended April 30,
2011 | | For the Period
December 30,
2009 (Inception) to
April 30, 2010 |
NET ASSET VALUE, BEGINNING OF PERIOD | | | $ | 13.18 | | | | $ | 13.72 | | | | $ | 11.60 | | | | $ | 10.00 | |
INCOME/(LOSS) FROM OPERATIONS: | | | | | | | | | | | | | | | | | | | | |
Net investment income/(loss) | | | | 0.03 | (a) | | | | 0.02 | (a) | | | | (0.09) | (a) | | | | (0.00) | (b) |
Net realized and unrealized gain on investments | | | | 3.91 | | | | | 0.17 | | | | | 2.55 | | | | | 1.60 | |
Total from investment operations | | | | 3.94 | | | | | 0.19 | | | | | 2.46 | | | | | 1.60 | |
| | | | |
LESS DISTRIBUTIONS TO SHAREHOLDERS: | | | | | | | | | | | | | | | | | | | | |
From net investment income | | | | (0.06) | | | | | – | | | | | – | | | | | – | |
Distributions from net realized gain on investments | | | | (0.09) | | | | | (0.73) | | | | | (0.34) | | | | | – | |
Total distributions | | | | (0.15) | | | | | (0.73) | | | | | (0.34) | | | | | – | |
| | | | |
Redemption fees added to paid-in capital | | | | 0.00 | (c) | | | | 0.00 | (c) | | | | 0.00 | (c) | | | | – | |
Increase/(decrease) in net asset value | | | | 3.79 | | | | | (0.54) | | | | | 2.12 | | | | | 1.60 | |
NET ASSET VALUE, END OF YEAR | | | $ | 16.97 | | | | $ | 13.18 | | | | $ | 13.72 | | | | $ | 11.60 | |
| | | | | | | | | | | | | | | | | | | | | |
| | | | |
Total return | | | | 30.07% | | | | | 2.10% | | | | | 21.75% | | | | | 16.00% | (d) |
| | | | |
RATIOS AND SUPPLEMENTAL DATA: | | | | | | | | | | | | | | | | | | | | |
Net assets, end of year (000’s) | | | $ | 425,152 | | | | $ | 40,103 | | | | $ | 36,363 | | | | $ | 7,225 | |
Ratio of expenses to average net assets without fee waivers/reimbursements | | | | 1.38% | | | | | 1.86% | | | | | 2.50% | | | | | 7.31% | (e) |
Ratio of expenses to average net assets including fee waivers/reimbursements | | | | 1.28% | | | | | 1.50% | | | | | 1.50% | | | | | 1.50% | (e) |
Net investment income/(loss) to average net assets including fee waivers/reimbursements | | | | 0.21% | | | | | 0.15% | | | | | (0.71%) | | | | | (0.57%) | (e) |
Portfolio turnover rate | | | | 57% | | | | | 57% | | | | | 60% | | | | | 33% (d) | |
| (a) | Per share numbers have been calculated using the average shares method. |
| (b) | Less than $(0.005) per share. |
| (c) | Less than $0.005 per share. |
| | |
| See Accompanying Notes to Financial Statements. | | |
| Annual Report | April 30, 2013 | | 23 |
| | |
| Notes to Financial Statements | | |
| April 30, 2013 | | |
1. ORGANIZATION
Financial Investors Trust (the “Trust”) is organized as a Delaware statutory trust and is registered as an open-end management investment company under the Investment Company Act of 1940, as amended (“1940 Act”). As of April 30, 2013, the Trust had 26 registered funds. This annual report describes the Vulcan Value Partners Fund and Vulcan Value Partners Small Cap Fund (each a “Fund” and collectively, the “Funds”). The Vulcan Value Partners Fund seeks to achieve long-term capital appreciation by investing primarily in publicly traded mid-and large-capitalization U.S. companies believed to be both undervalued and possessing a sustainable competitive advantage. The Vulcan Value Partners Small Cap Fund seeks to achieve long-term capital appreciation by investing primarily in publicly traded small-capitalization U.S. companies believed to be both undervalued and possessing a sustainable competitive advantage.
2. SIGNIFICANT ACCOUNTING POLICIES
The accompanying financial statements were prepared in accordance with accounting principles generally accepted in the United States of America (“U.S. GAAP”). The preparation of financial statements in conformity with U.S. GAAP requires management to make certain estimates and assumptions that affect the reported amounts of assets and liabilities and disclosures of contingent assets and liabilities at the date of the financial statements and the reported amounts of revenue and expenses during the period. Actual results could differ from those estimates. The following is a summary of significant accounting policies consistently followed by the Funds in preparation of their financial statements.
Investment Valuation: The Funds generally value their securities based on market prices determined at the close of regular trading on the New York Stock Exchange (“NYSE”), normally 4:00 p.m. Eastern Time, on each day the NYSE is open for trading.
For equity securities and mutual funds that are traded on an exchange, the market price is usually the closing sale or official closing price on that exchange. In the case of equity securities not traded on an exchange, or if such closing prices are not otherwise available, the securities are valued at the mean of the most recent bid and ask prices on such day. Redeemable securities issued by open-end registered investment companies are valued at the investment company’s applicable net asset value.
The market price for debt obligations is generally the price supplied by an independent third-party pricing service approved by the Board of Trustees (the “Board”), which may use a matrix, formula or other objective method that takes into consideration quotations from dealers, market transactions in comparable investments, market indices and yield curves. If vendors are unable to supply a price, or if the price supplied is deemed to be unreliable, the market price may be determined using quotations received from one or more broker–dealers that make a market in the security. Short-term debt obligations that will mature in 60 days or less are valued at amortized cost, unless it is determined that using this method would not reflect an investment’s fair value.
| | |
| 24 | | www.vulcanvaluepartners.com |
| | |
| | | Notes to Financial Statements |
| | April 30, 2013 |
When such prices or quotations are not available, or when the Fair Value Committee appointed by the Board believes that they are unreliable, securities may be priced using fair value procedures approved by the Board.
Fair Value Measurements: A three-tier hierarchy has been established to classify fair value measurements for disclosure purposes. Inputs refer broadly to the assumptions that market participants would use in pricing the asset or liability, including assumptions about risk. Inputs may be observable or unobservable. Observable inputs are inputs that reflect the assumptions market participants would use in pricing the asset or liability that are developed based on market data obtained from sources independent of the reporting entity. Unobservable inputs are inputs that reflect the reporting entity’s own assumptions about the assumptions market participants would use in pricing the asset or liability that are developed based on the best information available. Various inputs are used in determining the value of each Fund’s investments as of the reporting period end. The designated input levels are not necessarily an indication of the risk or liquidity associated with these investments. These inputs are categorized in the following hierarchy under applicable financial accounting standards:
| Level 1 – | Unadjusted quoted prices in active markets for identical investments, unrestricted assets or liabilities that the Funds have the ability to access at the measurement date; |
| Level 2 – | Quoted prices which are not active, quoted prices for similar assets or liabilities in active markets or inputs other than quoted prices that are observable (either directly or indirectly) for substantially the full term of the asset or liability; and |
| Level 3 – | Significant unobservable prices or inputs (including the Funds’ own assumptions in determining the fair value of investments) where there is little or no market activity for the asset or liability at the measurement date. |
The following is a summary of each input used to value each Fund’s investments as of April 30, 2013.
Vulcan Value Partners Fund:
| | | | | | | | | | | | | | | | |
| Investments in Securities at Value | | Level 1 - Unadjusted Quoted Prices | | | Level 2 -
Other Significant Observable Inputs | | | Level 3 - Significant Unobservable Inputs | | | Total | |
Common Stocks(a) | | $ | 410,151,913 | | | $ | – | | | $ | – | | | $ | 410,151,913 | |
Short Term Investments | | | 32,549,253 | | | | – | | | | – | | | | 32,549,253 | |
TOTAL | | $ | 442,701,166 | | | $ | – | | | $ | – | | | $ | 442,701,166 | |
| | | | | | | | | | | | | | | | | |
| | |
| Annual Report | April 30, 2013 | | 25 |
| | |
| Notes to Financial Statements | | |
| April 30, 2013 | | |
Vulcan Value Partners Small Cap Fund:
| | | | | | | | | | | | | | | | |
| Investments in Securities at Value | | Level 1 -
Unadjusted Quoted Prices | | | Level 2 - Other Significant Observable Inputs | | | Level 3 - Significant Unobservable Inputs | | | Total | |
Common Stocks(a) | | $ | 366,960,594 | | | $ | – | | | $ | – | | | $ | 366,960,594 | |
Short Term Investments | | | 16,797,610 | | | | – | | | | – | | | | 16,797,610 | |
TOTAL | | $ | 383,758,204 | | | $ | – | | | $ | – | | | $ | 383,758,204 | |
| | | | | | | | | | | | | | | | | |
| (a) | For detailed descriptions, see the accompanying Statements of Investments. |
The Funds recognize transfers between levels as of the end of period. For the year ended April 30, 2013, the Funds did not have any transfers between Level 1 and Level 2 securities. For the year ended April 30, 2013, the Funds did not have any securities that used significant unobservable inputs (Level 3) in determining fair value.
Investment Transactions and Investment Income: Investment transactions are accounted for on the date the investments are purchased or sold (trade date). Realized gains and losses from investment transactions are reported on an identified cost basis, which is the same basis the Funds use for federal income tax purposes. Interest income, which includes accretion of discounts and amortization of premiums, is accrued and recorded as earned. Dividend income is recognized on the ex-dividend date or for certain foreign securities, as soon as information is available to the Funds. All of the realized and unrealized gains and losses and net investment income, are allocated daily to each class in proportion to its average daily net assets.
Foreign Securities: The Funds may directly purchase securities of foreign issuers. Investing in securities of foreign issuers involves special risks not typically associated with investing in securities of U.S. issuers. The risks include possible reevaluation of currencies, the inability to repatriate foreign currency, less complete financial information about companies and possible future adverse political and economic developments. Moreover, securities of many foreign issuers and their markets may be less liquid and their prices more volatile than those of securities of comparable U.S. issuers.
Trust Expenses: Some expenses of the Trust can be directly attributed to the Funds. Expenses which cannot be directly attributed are apportioned among all funds in the Trust based on average net assets of each fund.
Fund Expenses: Expenses that are specific to a Fund are charged directly to that Fund. Expenses that are common to both Funds generally are allocated among the Funds in proportion to their average daily net assets.
Federal Income Taxes: Each Fund complies with the requirements under Subchapter M of the Internal Revenue Code of 1986, as amended, applicable to regulated investment companies and intends to distribute substantially all of its net taxable income and net capital gains, if any, each year so that it will not be subject to excise tax on undistributed income and gains. The Funds are not subject to income taxes to the extent such distributions are made.
| | |
| 26 | | www.vulcanvaluepartners.com |
| | |
| | | Notes to Financial Statements |
| | April 30, 2013 |
As of and during the year ended April 30, 2013, the Funds did not have a liability for any unrecognized tax benefits. The Funds file U.S. federal, state, and local tax returns as required. The Fund’s tax returns are subject to examination by the relevant tax authorities until expiration of the applicable statute of limitations, which is generally three years after the filing of the tax return for federal purposes and four years for most state returns. Tax returns for open years have incorporated no uncertain tax positions that require a provision for income taxes.
Distributions to Shareholders: Each Fund normally pays dividends and distributes capital gains, if any, on an annual basis. Income dividend distributions are derived from interest and other income each Fund receives from its investments, including short-term capital gains. Long term capital gain distributions are derived from gains realized when each Fund sells a security it has owned for more than a year. Each Fund may make additional distributions and dividends at other times if the portfolio manager believes doing so may be necessary for each Fund to avoid or reduce taxes.
3. TAX BASIS INFORMATION:
Reclassifications: As of April 30, 2013, permanent differences in book and tax accounting were reclassified. These differences had no effect on net assets and were primarily attributed to minor differences between book and tax characterizations of distributions to shareholders and redemptions-in-kind. The reclassifications were as follows:
| | | | | | | | | | | | |
| Fund | | Paid-in Capital | | | Accumulated Net
Investment
Income/(Loss) | | | Accumulated Net
Realized Gain on
Investments | |
Vulcan Value Partners Fund | | $ | 9,591,391 | | | $ | – | | | $ | (9,591,391 | ) |
Vulcan Value Partners Small Cap Fund | | | – | | | | 14,757 | | | | (14,757 | ) |
Tax Basis of Investments: As of April 30, 2013, the aggregate cost of investments, gross unrealized appreciation/ (depreciation) and net unrealized appreciation for federal tax purposes was as follows:
| | | | | | | | |
| | | Vulcan Value Partners
Fund | | | Vulcan Value Partners
Small Cap Fund | |
Gross appreciation (excess of value over tax cost) | | $ | 72,955,299 | | | $ | 44,412,166 | |
Gross depreciation (excess of tax cost over value) | | | (4,997,041) | | | | (4,006,571) | |
Net unrealized appreciation | | $ | 67,958,258 | | | $ | 40,405,595 | |
| | | | | | | | | |
Cost of investments for income tax purposes | | $ | 374,742,908 | | | $ | 343,352,609 | |
| | | | | | | | | |
| | |
| Annual Report | April 30, 2013 | | 27 |
| | |
| Notes to Financial Statements | | |
| April 30, 2013 | | |
Components of Earnings: As of April 30, 2013, components of distributable earnings were as follows:
| | | | | | | | |
| | | Vulcan Value
Partners Fund | | | Vulcan Value
Partners Small Cap
Fund | |
Undistributed ordinary income | | $ | 2,708,061 | | | $ | 10,501,969 | |
Accumulated capital gains | | | 1,942,432 | | | | 3,414,953 | |
Net unrealized appreciation on investments | | | 67,958,258 | | | | 40,405,595 | |
Other cumulative effect of timing differences | | | – | | | | (348,823) | |
Total | | $ | 72,608,751 | | | $ | 53,973,694 | |
| | | | | | | | | |
As of April 30, 2013, the Vulcan Value Partners Small Cap Fund elects to defer to the period April 30, 2014, late year ordinary losses in the amount of $348,823.
Capital Losses: As of April 30, 2013, the Funds have no accumulated capital loss carryforwards. Short-term capital loss carryover used by Vulcan Value Small Cap Fund during the period ended April 30, 2013 was $105, 658.
Tax Basis of Distributions to Shareholders: The character of distributions made during the year from net investment income or net realized gains may differ from its ultimate characterization for federal income tax purposes. Also, due to the timing of dividend distributions, the fiscal year in which amounts are distributed may differ from the fiscal year in which the income or realized gain were recorded by each Fund.
The tax character of distributions paid by the Funds for the fiscal year ended April 30, 2013 and April 30, 2012, were as follows:
| | | | | | | | |
| | | Ordinary Income | | | Long-Term Capital Gain | |
2013 | | | | | | | | |
Vulcan Value Partners Fund | | $ | 5,269,193 | | | $ | 671,118 | |
Vulcan Value Partners Small Cap Fund | | | 1,042,621 | | | | 903,482 | |
| | |
2012 | | | | | | | | |
Vulcan Value Partners Fund | | $ | 842,906 | | | $ | 17,414 | |
Vulcan Value Partners Small Cap Fund | | | 1,921,509 | | | | 71,283 | |
4. SECURITIES TRANSACTIONS
During the year ended April 30, 2013, common stock holdings were redeemed in-kind. The intent of the transfers was to save on equity transaction costs both for the redeeming shareholder at the institution they transferred to and for the Fund on the sale of assets. The assets of one separate account in Vulcan Value Partners Fund were redeemed-in-kind out of the Fund in the amount of $61,109,244 with a realized gain of $9,603,063.
| | |
| 28 | | www.vulcanvaluepartners.com |
| | |
| | | Notes to Financial Statements |
| | April 30, 2013 |
The cost of purchases and proceeds from sales of securities (excluding short-term securities and transfers-in-kind) during the year ended April 30, 2013 were as follows:
| | | | | | | | |
| Fund | | Purchase of Securities | | | Proceeds From Sales of Securities | |
Vulcan Value Partners Fund | | $ | 361,871,042 | | | $ | 70,504,295 | |
Vulcan Value Partners Small Cap Fund | | | 368,656,585 | | | | 90,925,285 | |
5. CAPITAL SHARE TRANSACTIONS
The capitalization of the Trust consists of an unlimited number of shares of beneficial interest with no par value per share. Holders of the shares of the Funds of the Trust have one vote for each share held and a proportionate fraction of a vote for each fractional share. All shares issued and outstanding are fully paid and are non-assessable, transferable and redeemable at the option of the shareholder. Shares have no pre-emptive rights.
Shares redeemed within 90 days of purchase may incur a 2% short-term redemption fee deducted from the redemption amount. The Vulcan Value Partners Fund and the Vulcan Value Partners Small Cap Fund retained $16,178 and $34,963, respectively, for the year ended April 30, 2013, and $179 and $894, respectively, for the year ended April 30, 2012, which is reflected in the “Cost of shares redeemed, net of redemption fees” in the Statements of Changes in Net Assets.
Transactions in shares of capital stock for the dates listed below were as follows:
Vulcan Value Partners Fund
| | | | | | | | |
| | | For the Year Ended April 30, 2013 | | | For the Year Ended April 30, 2012 | |
Shares Sold | | | 25,326,792 | | | | 5,573,082 | |
Shares Issued in Reinvestment of Dividends | | | 402,869 | | | | 75,929 | |
Less Shares Redeemed | | | (6,062,055) | | | | (227,861) | |
Net Increase | | | 19,667,606 | | | | 5,421,150 | |
| | | | | | | | | |
Vulcan Value Partners Small Cap Fund
| | | | | | | | |
| | | For the Year Ended April 30, 2013 | | | For the Year Ended April 30, 2012 | |
Shares Sold | | | 23,292,608 | | | | 1,389,727 | |
Shares Issued in Reinvestment of Dividends | | | 117,898 | | | | 160,884 | |
Less Shares Redeemed | | | (1,395,277) | | | | (1,158,259) | |
Net Increase | | | 22,015,229 | | | | 392,352 | |
| | | | | | | | | |
6. MANAGEMENT AND RELATED-PARTY TRANSACTIONS
Vulcan Value Partners, LLC (“Vulcan” or the “Adviser”), subject to the authority of the Board, is responsible for the overall management and administration of the Funds’ business affairs. Vulcan manages the investments of the Funds in accordance with each Fund’s investment objective, policies and limitations and investment guidelines established jointly by the Adviser and the Board.
| | |
| Annual Report | April 30, 2013 | | 29 |
| | |
| Notes to Financial Statements | | |
| April 30, 2013 | | |
Pursuant to the Investment Advisory Agreement (the “Advisory Agreement”), the Funds pay Vulcan an annual management fee of 1.00% and 1.15% for Vulcan Value Partners Fund and Vulcan Value Partners Small Cap Fund, respectively, based on each Fund’s average daily net assets. Prior to January 1, 2013, Vulcan Value Partners Small Cap Fund’s management fee was 1.25%, based on the Fund’s average daily net assets.
Prior to September 1, 2012, Vulcan contractually agreed with the Funds to limit the amount of each Fund’s total annual expenses to 1.50% of each Fund’s average daily net assets. Vulcan has contractually agreed with the Funds to limit the amount of each Fund’s total annual expenses (exclusive of distribution and service (12b-1) fees, acquired fund fees and expenses, brokerage expenses, interest expense, taxes and extraordinary expenses) to 1.25% of each Fund’s average daily net assets. This agreement is in effect through August 31, 2013 and is reevaluated on an annual basis. Without this agreement, expenses could be higher. The Adviser is permitted to recover expenses it has borne through the agreement described above to the extent that each Fund’s expenses in later periods fall below the annual rates set forth in the relevant agreement. If the Adviser foregoes any fees and/or reimburses the Funds pursuant to this agreement with respect to a particular fiscal year, then the Adviser shall be entitled to recover from the Funds the amount forgone or reimbursed to the extent annual fund operating expenses are less than 1.25% and, prior to September 1, 2012, 1.50%, of the Funds’ average daily net assets during any fiscal year following such fiscal year.
Pursuant to this agreement, each Fund will reimburse the Adviser for any fee waivers and expense reimbursements made by the Adviser, provided that any such reimbursements made by the Funds to the Adviser will not cause the Funds’ expense limitation to exceed expense limitations in existence at the time the expense was incurred, or at the time of the reimbursement, whichever is lower, and the reimbursement is made within three years after the expenses were incurred.
For the year ended April 30, 2013, the fee waivers and/or reimbursements were as follows:
| | | | | | | | |
| Fund | | Fees
Waived/Reimbursed By Advisor | | | Recoupment of
Previously Waived Fees by Advisor | |
Vulcan Value Partners Fund | | | $ – | | | | $ 101,609 | |
Vulcan Value Partners Small Cap Fund | | | 161,158 | | | | – | |
As of April 30, 2013, the balances of recoupable expenses for each Fund were as follows:
| | | | | | | | | | | | | | | | |
| Fund | | 2013 | | | 2012 | | | 2011 | | | Total | |
Vulcan Value Partners Fund | | $ | – | | | $ | – | | | $ | – | | | $ | – | |
Vulcan Value Partners Small Cap Fund | | | 161,158 | | | | 124,024 | | | | 199,532 | | | | 484,714 | |
Distributor: ALPS Distributors, Inc. (“ADI” or the “Distributor”) (an affiliate of ALPS Fund Services, Inc.) acts as the distributor of each Fund’s shares pursuant to a Distribution Agreement with the Trust. Shares are sold on a continuous basis by ADI as agent for the Funds, and ADI has agreed to use its best efforts to solicit orders for the sale of each Fund’s shares, although it is not obliged to sell any particular amount of shares. ADI is not entitled to any compensation for its services as Distributor. ADI is registered as a broker-dealer with the Securities and Exchange Commission.
| | |
| 30 | | www.vulcanvaluepartners.com |
| | |
| | | Notes to Financial Statements |
| | April 30, 2013 |
Principal Financial Officer: ALPS receives an annual fee of $10,000 for both Funds for providing Principal Financial Officer services to the Funds. The annual fee is billed monthly in total and allocated to each Fund. Vulcan pays this fee on behalf of the Funds.
Compliance Services: ALPS provides services that assist the Trust’s Chief Compliance Officer in monitoring and testing the policies and procedures of the Trust in conjunction with requirements under Rule 38a-1 under the 1940 Act under the Chief Compliance Officer Services Agreement with the Trust. Under this Agreement, ALPS is paid an annual base fee of $60,000 (subject to a 5% increase per annum) and is reimbursed for certain out-of-pocket expenses. Vulcan pays this fee on behalf of the Funds.
Transfer Agent: ALPS serves as transfer, dividend paying and shareholder servicing agent for the Fund (“Transfer Agent”). ALPS is compensated based upon a $25,000 annual base fee per Fund, and annually $9 per direct open account and $7 per open account through NSCC. The Transfer Agent is also reimbursed by the Fund for certain out-of-pocket expenses.
Administrator: ALPS Fund Services, Inc. (“ALPS” and the “Administrator”) (an affiliate of ADI) serves as administrator to the Funds, and each Fund has agreed to pay expenses incurred in connection with its administrative activities. Pursuant to the Administration, Bookkeeping and Pricing Services Agreement (the “Agreement”), ALPS will provide operational services to the Funds including, but not limited to fund accounting and fund administration and generally assist in each Fund’s operations.
Annual Administrative Fee, billed monthly in total and allocated to each Fund, in the amount of the greater of (a) $210,000 annual minimum for both Funds through May 2012, and $231,525 minimum thereafter (subject to a 5% increase per annum) or (b) following basis point fee schedule:
| | | | |
| Average Total Net Assets | | Contractual Fee | | |
Between $0-$500M | | 0.05% | | |
$500M-$1B | | 0.03% | | |
Above $1B | | 0.02% | | |
The Administrator is also reimbursed by the Funds for certain out-of-pocket expenses.
7. INDEMNIFICATIONS
Under the Trust’s organizational documents, its Officers and Trustees are indemnified against certain liability arising out of the performance of their duties to the Trust. Additionally, in the normal course of business, the Trust enters into contracts with service providers that may contain general indemnification clauses which may permit indemnification to the extent permissible under applicable law. The Trust’s maximum exposure under these arrangements is unknown, as this would involve future claims that may be made against the Trust that have not yet occurred.
| | |
| Annual Report | April 30, 2013 | | 31 |
| | |
| Report of Independent Registered Public Accounting Firm |
To the Shareholders and Board of Trustees of Financial Investors Trust:
We have audited the accompanying statements of assets and liabilities, including the statements of investments, of Vulcan Value Partners Fund and Vulcan Value Partners Small Cap Fund (the “Funds”), two of the funds constituting Financial Investors Trust, as of April 30, 2013, and the related statements of operations for the year then ended, the statements of changes in net assets for each of the two years in the period then ended, and the financial highlights for each of the three years in the period then ended and for the period from December 30, 2009 (inception) to April 30, 2010. These financial statements and financial highlights are the responsibility of the Funds’ management. Our responsibility is to express an opinion on these financial statements and financial highlights based on our audits.
We conducted our audits in accordance with the standards of the Public Company Accounting Oversight Board (United States). Those standards require that we plan and perform the audit to obtain reasonable assurance about whether the financial statements and financial highlights are free of material misstatement. The Funds are not required to have, nor were we engaged to perform, an audit of their internal control over financial reporting. Our audits included consideration of internal control over financial reporting as a basis for designing audit procedures that are appropriate in the circumstances, but not for the purpose of expressing an opinion on the effectiveness of the Funds’ internal control over financial reporting. Accordingly, we express no such opinion. An audit also includes examining, on a test basis, evidence supporting the amounts and disclosures in the financial statements, assessing the accounting principles used and significant estimates made by management, as well as evaluating the overall financial statement presentation. Our procedures included confirmation of securities owned as of April 30, 2013, by correspondence with the custodian and brokers; where replies were not received from brokers, we performed other auditing procedures. We believe that our audits provide a reasonable basis for our opinion.
In our opinion, the financial statements and financial highlights referred to above present fairly, in all material respects, the financial position of Vulcan Value Partners Fund and Vulcan Value Partners Small Cap Fund of Financial Investors Trust as of April 30, 2013, the results of their operations for the year then ended, the changes in their net assets for each of the two years in the period then ended, and the financial highlights for each of the three years in the period then ended and for the period from December 30, 2009 (inception) to April 30, 2010, in conformity with accounting principles generally accepted in the United States of America.
DELOITTE & TOUCHE LLP
Denver, Colorado
June 27, 2013
| | |
| 32 | | www.vulcanvaluepartners.com |
| | |
| | | Additional Information |
| | April 30, 2013 (Unaudited) |
1. FUND HOLDINGS
The Funds file their complete schedule of portfolio holdings with the Securities and Exchange Commission (the “SEC”) for the first and third quarters of each fiscal year on Form N-Q within 60 days after the end of the period. Copies of the Funds’ Form N-Q are available without charge on the SEC website at http://www.sec.gov. You may also review and copy the Form N-Q at the SEC’s Public Reference Room in Washington, DC. For more information about the operation of the Public Reference Room, please call the SEC at 1-800-SEC-0330.
2. FUND PROXY VOTING POLICIES, PROCEDURES AND SUMMARIES
Each Fund’s policies and procedures used in determining how to vote proxies and information regarding how the Funds voted proxies relating to portfolio securities during the most recent prior 12-month period ending June 30 are available without charge, (1) upon request, by calling (toll-free) (866) 759-5679 and (2) on the SEC’s website at http://www.sec.gov.
3. TAX DESIGNATIONS
The Funds designate the following for federal income tax purposes for the calendar year ended December 31, 2012:
| | | | | | | | | | |
| | | Qualified Dividend Income | | Dividend Received Deduction |
Vulcan Value Partners Fund | | | | 100.00 | % | | | | 71.36 | % |
Vulcan Value Partners Small Cap Fund | | | | 100.00 | % | | | | 100.00 | % |
Pursuant to Section 852(b)(3) of the Internal Revenue Code, the Vulcan Value Small Cap Fund designated $903,482 and the Vulcan Value Partners Fund designated $671,118 as long-term capital gain dividends.
4. DISCLOSURE REGARDING APPROVAL OF FUND ADVISORY AGREEMENTS
Vulcan Value Partners Fund and Vulcan Value Partners Small Cap Fund (the “Vulcan Funds”)
On December 11, 2012, the Trustees met in person to discuss, among other things, the approval of the Investment Advisory Agreement between the Trust and Vulcan Value Partners, LLC (“Vulcan”) (the “Vulcan Funds Advisory Agreement”) in accordance with Section 15(c) of the 1940 Act. The Independent Trustees met with independent legal counsel during executive session and discussed the Vulcan Funds Advisory Agreement and other related materials.
In renewing and approving the Investment Advisory Agreement with Vulcan, the Trustees, including the Independent Trustees, considered the following factors with respect to the Vulcan Funds:
Investment Advisory Fee Rate: The Trustees reviewed and considered the contractual annual advisory fee to be paid by the Trust, on behalf of the Vulcan Funds, to Vulcan of 1.00% and 1.15%
| | |
| Annual Report | April 30, 2013 | | 33 |
| | |
| Additional Information | | |
| April 30, 2013 (Unaudited) | | |
of the daily average net assets of Vulcan Value Partners Fund and the Vulcan Value Partners Small Cap Fund, respectively, in light of the extent and quality of the advisory services provided by the Vulcan to the Vulcan Funds.
The Board received and considered information comparing the Vulcan Funds’ contractual advisory fees and overall expenses with those of funds in both the relevant expense group and universe of funds provided by FUSE Research Network LLC, an independent provider of investment company data, as well as the Vulcan Funds’ direct competitors and similar products advised by Vulcan.
Based on such information, the Trustees further determined that the contractual annual advisory fees set forth above and the total expense ratio (after waivers) of 1.25% of each Vulcan Fund, taking into account the contractual fee waivers in place, is comparable to others within such Fund’s peer universe.
Nature, Extent and Quality of the Services under the Vulcan Funds Advisory Agreement: The Trustees received and considered information regarding the nature, extent and quality of services provided to the Vulcan Funds under the Vulcan Funds Advisory Agreement. The Trustees reviewed certain background materials supplied by Vulcan in its presentation, including its Form ADV.
The Trustees reviewed and considered Vulcan’s investment advisory personnel, its history as asset manager and its performance and the amount of assets currently under management by Vulcan. The Trustees also reviewed the research and decision-making processes utilized by Vulcan, including the methods adopted to seek to achieve compliance with the investment objectives, policies and restrictions of the Vulcan Funds.
The Trustees considered the background and experience of Vulcan’s management in connection with the Vulcan Funds, including reviewing the qualifications, backgrounds and responsibilities of the management team primarily responsible for the day-to-day portfolio management of the Vulcan Funds and the extent of the resources devoted to research and analysis of actual and potential investments.
The Trustees also reviewed the accompanying compliance-related materials and further noted that they have received reports on these services and compliance issues from Vulcan at each regular Board meeting throughout the year related to the services rendered by Vulcan with respect to the Vulcan Funds.
Performance: The Trustees reviewed performance information for the Vulcan Funds for the three-month and 1-year periods ended September 30, 2012. That review included a comparison of the Vulcan Funds’ performance to the performance of a group of comparable funds selected by FUSE Research Network LLC. The Trustees noted the favorable performance of the Vulcan Funds over the three-month and 1-year periods ended September 30, 2012 compared against funds identified by FUSE Research Network LLC. The Trustees also considered Vulcan’s discussion of the Vulcan Funds’ underlying portfolio diversification categories, its top contributors and top detractors, as well as Vulcan’s performance and reputation generally and its investment techniques, risk management controls and decision-making processes.
| | |
| 34 | | www.vulcanvaluepartners.com |
| | |
| | | Additional Information |
| | April 30, 2013 (Unaudited) |
The Adviser’s Profitability: The Trustees received and considered a projected profitability analysis prepared by Vulcan based on the fees payable under the Vulcan Funds Advisory Agreement. The Trustees noted that each of the Vulcan Fund’s total fees and expenses were within an acceptable range of the median expenses of comparable funds identified by FUSE Research Network LLC. The Board then reviewed and discussed Vulcan’s financial statements in order to analyze the financial condition and stability and profitability of the adviser.
Economies of Scale: The Trustees considered whether economies of scale in the provision of services to the Vulcan Funds were being passed along to the shareholders. The Trustees considered whether any economies of scale, fall-out benefits or any other direct or indirect benefits would accrue to Vulcan from its relationship with the Vulcan Funds.
Other Benefits to the Adviser: The Trustees reviewed and considered any other benefits derived or to be derived by Vulcan from its relationship with the Vulcan Funds, including soft-dollar arrangements.
The Board summarized its deliberations with respect to the Vulcan Funds Advisory Agreement with Vulcan. In selecting Vulcan and approving the investment advisory agreement and fees under such agreement, the Trustees concluded that no single factor reviewed by the Trustees was identified by the Trustees to be determinative as the principal factor in whether to approve the investment advisory agreement. Further, the Independent Trustees were advised by separate independent legal counsel throughout the process. The Trustees, including all of the Independent Trustees, concluded that:
| | • | | the investment advisory fees to be received by Vulcan with respect to the Vulcan Funds were comparable to others within such Fund’s peer universe, as well as similar products advised by Vulcan; |
| | • | | the nature, extent and quality of services rendered by Vulcan under the Vulcan Funds Advisory Agreement were adequate; |
| | • | | the performance of the Vulcan Funds was generally comparable to the performance of the funds in its FUSE Research Network LLC peer group; |
| | • | | the profit, if any, anticipated to be realized by Vulcan in connection with the operation of the Vulcan Funds is not unreasonable, especially in light of the fee waiver agreement between the Trust and Vulcan; and |
| | • | | there were no material or other benefits accruing to Vulcan in connection with its relationship with the Vulcan Funds. |
Based on the Trustees’ deliberations and their evaluation of the information described above, all of the Trustees, including all of the Independent Trustees in person at the Meeting, concluded that Vulcan’s compensation for investment advisory services is consistent with the best interests of the Vulcan Funds and their shareholders.
| | |
| Annual Report | April 30, 2013 | | 35 |
| | |
| Trustees and Officers | | |
| April 30, 2013 (Unaudited) | | |
INDEPENDENT TRUSTEES
| | | | | | | | | | |
Name, Address* & Age | | Position(s) Held with Fund | | Term of Office and Length of Time Served** | | Principal Occupation(s) During Past 5 Years*** | | Number of
Funds in
Fund
Complex
Overseen by
Trustee**** | | Other Directorships Held by Trustee During Past 5 Years |
Mary K. Anstine, age 72 | | Trustee | | Ms. Anstine was elected at a special meeting of shareholders held on March 21, 1997 and re-elected at a special meeting of shareholders held on August 7, 2009. | | Ms. Anstine was President/Chief Executive Officer of HealthONE Alliance, Denver, Colorado, and former Executive Vice President of First Interstate Bank of Denver. Ms. Anstine is also Trustee/Director of AV Hunter Trust and Colorado Uplift Board. Ms. Anstine was formerly a Director of the Trust Bank of Colorado (later purchased and now known as Northern Trust Bank), HealthONE and Denver Area Council of the Boy Scouts of America, and a member of the American Bankers Association Trust Executive Committee | | 26 | | Ms. Anstine is a Trustee of ALPS ETF Trust (13 funds); ALPS Variable Investment Trust (7 funds); Reaves Utility Income Fund (1 fund); and Westcore Trust (12 funds). |
John R. Moran, Jr., age 82 | | Trustee | | Mr. Moran was elected at a special meeting of shareholders held on March 21, 1997 and re-elected at a special meeting of shareholders held on August 7, 2009. | | Mr. Moran is formerly President and CEO of The Colorado Trust, a private foundation serving the health and hospital community in the state of Colorado. An attorney, Mr. Moran was formerly a partner with the firm of Kutak Rock & Campbell in Denver, Colorado and a member of the Colorado House of Representatives. Currently, Mr. Moran is a member of the Treasurer’s Investment Advisory Committee for the University of Colorado. | | 26 | | None. |
| * | All communications to Trustees and Officers may be directed to Financial Investors Trust c/o 1290 Broadway, Suite 1100, Denver, CO 80203. |
| ** | This is the period for which the Trustee/Officer began serving the Trust. Each Trustee/Officer serves an indefinite term, until his successor is elected |
| *** | Except as otherwise indicated, each individual has held the office shown or other offices in the same company for the last five years. |
| **** | The Fund Complex includes all series of the Trust (currently 26) and any other investment companies for which Vulcan Value Partners, LLC provides investment advisory services (currently none). |
| | |
| 36 | | www.vulcanvaluepartners.com |
| | |
| | | Trustees and Officers |
| | April 30, 2013 (Unaudited) |
INDEPENDENT TRUSTEES (continued)
| | | | | | | | | | |
Name, Address* & Age | | Position(s) Held with Fund | | Term of Office and Length of Time Served** | | Principal Occupation(s) During Past 5 Years*** | | Number of
Funds in
Fund
Complex
Overseen by
Trustee**** | | Other Directorships Held by Trustee During Past 5 Years |
Jeremy W. Deems, age 36 | | Trustee | | Mr. Deems was appointed as a Trustee at the March 11, 2008 meeting of the Board of Trustees and elected at a special meeting of shareholders held on August 7, 2009. | | Mr. Deems is the Co-Founder, Chief Operations Officer and Chief Financial Officer of Green Alpha Advisors, LLC. Prior to joining Green Alpha Advisors, Mr. Deems was CFO and Treasurer of Forward Management, LLC, an investment management company, ReFlow Management Co., LLC, a liquidity resourcing company, ReFlow Fund, LLC, a private investment fund, and Sutton Place Management, LLC, an administrative services company (from 2004 to June 2007). Prior to this, Mr. Deems served as Controller of Forward Management, LLC, ReFlow Management Co., LLC, ReFlow Fund, LLC and Sutton Place Management, LLC. | | 26 | | Mr. Deems is a Trustee of ALPS ETF Trust (13 funds); ALPS Variable Investment Trust (7 funds) and Reaves Utility Income Fund (1 fund). |
Jerry G. Rutledge, age 68 | | Trustee | | Mr. Rutledge was elected at a special meeting of shareholders held on August 7, 2009. | | Mr. Rutledge is the President and owner of Rutledge’s Inc., a retail clothing business. Mr. Rutledge is currently Director of the American National Bank. He was from 1994 to 2007 a Regent of the University of Colorado. | | 26 | | Mr. Rutledge is a Trustee of Clough Global Allocation Fund (1 fund), Clough Global Equity Fund (1 fund) and Clough Global Opportunities Fund (1 fund). |
| * | All communications to Trustees and Officers may be directed to Financial Investors Trust c/o 1290 Broadway, Suite 1100, Denver, CO 80203. |
| ** | This is the period for which the Trustee/Officer began serving the Trust. Each Trustee/Officer serves an indefinite term, until his successor is elected |
| *** | Except as otherwise indicated, each individual has held the office shown or other offices in the same company for the last five years. |
| **** | The Fund Complex includes all series of the Trust (currently 26) and any other investment companies for which Vulcan Value Partners, LLC provides investment advisory services (currently none). |
| | |
| Annual Report | April 30, 2013 | | 37 |
| | |
| Trustees and Officers | | |
| April 30, 2013 (Unaudited) | | |
INDEPENDENT TRUSTEES (continued)
| | | | | | | | | | |
Name, Address* & Age | | Position(s) Held with Fund | | Term of Office and Length of Time Served** | | Principal Occupation(s) During Past 5 Years*** | | Number of
Funds in
Fund
Complex
Overseen by
Trustee**** | | Other Directorships Held by Trustee During Past 5 Years |
Michael “Ross” Shell , age 42 | | Trustee | | Mr. Shell was elected at a special meeting of shareholders held on August 7, 2009. | | Mr. Shell is Founder and CEO* of Red Idea, LLC, a strategic consulting/early stage venture firm (since June 2008). From 1999 to 2009, he was a part-owner and Director of Tesser, Inc., a brand agency. From December 2005 to May 2008, he was Director, Marketing and Investor Relations, of Woodbourne, a REIT/real estate hedge fund and private equity firm. Prior to this, from May 2004 to November 2005, he worked as a business strategy consultant; from June 2003 to April 2004, he was on the Global Client Services team of IDEO, a product design/innovation firm; and from 1999 to 2003, he was President of Tesser, Inc. Mr. Shell graduated with honors from Stanford University with a degree in Political Science. | | 26 | | None. |
| * | All communications to Trustees and Officers may be directed to Financial Investors Trust c/o 1290 Broadway, Suite 1100, Denver, CO 80203. |
| ** | This is the period for which the Trustee/Officer began serving the Trust. Each Trustee/Officer serves an indefinite term, until his successor is elected |
| *** | Except as otherwise indicated, each individual has held the office shown or other offices in the same company for the last five years. |
| **** | The Fund Complex includes all series of the Trust (currently 26) and any other investment companies for which Vulcan Value Partners, LLC provides investment advisory services (currently none). |
| | |
| 38 | | www.vulcanvaluepartners.com |
| | |
| | | Trustees and Officers |
| | April 30, 2013 (Unaudited) |
INTERESTED TRUSTEE (continued)
| | | | | | | | | | |
| | | | | | | | | Number of | | |
| | | | | | | | | Funds in | | |
| | | | | | | | | Fund | | |
| Name, | | Position(s) | | Term of Office | | | | Complex | | Other |
| Address* | | Held with | | and Length of | | Principal Occupation(s) | | Overseen by | | Directorships |
| & Age | | Fund | | Time Served** | | During Past 5 Years*** | | Trustee**** | | Held by Trustee |
|
Edmund J. Burke, age 52 | | Trustee, Chairman and President | | Mr. Burke was elected as Chairman at the August 28, 2009 meeting of the Board of Trustees. Mr. Burke was elected as Trustee at a special meeting of shareholders held on August 7, 2009. Mr. Burke was elected President of the Trust at the December 17, 2002 meeting of the Board of Trustees. | | Mr. Burke is President and a Director of ALPS Holdings, Inc. (“AHI”) (since 2005) and Director of ALPS Advisors, Inc. (“AAI”), ALPS Distributors, Inc. (“ADI”), ALPS Fund Services, Inc. (“AFS”) and ALPS Portfolio Solutions Distributor, Inc. (“APSD”) and from 2001-2008, was President of AAI, ADI, AFS and APSD. Because of his positions with AHI, AAI, ADI, AFS and APSD, Mr. Burke is deemed an affiliate of the Trust as defined under the 1940 Act. Mr. Burke is Trustee and President of the Clough Global Allocation Fund (Trustee since 2006; President since 2004); Trustee and President of the Clough Global Equity Fund (Trustee since 2006; President since 2005); Trustee and President of the Clough Global Opportunities Fund (since 2006); Trustee of the Liberty All-Star Equity Fund; and Director of the Liberty All-Star Growth Fund, Inc. | | 26 | | Mr. Burke is a Trustee of Clough Global Allocation Fund (1 fund); Clough Global Equity Fund (1 fund); Clough Global Opportunities Fund (1 fund); Trustee of the Liberty All-Star Equity Fund (1 fund); and Director of the Liberty All-Star Growth Fund, Inc. (1 fund). |
|
| * | All communications to Trustees and Officers may be directed to Financial Investors Trust c/o 1290 Broadway, Suite 1100, Denver, CO 80203. |
| ** | This is the period for which the Trustee/Officer began serving the Trust. Each Trustee/Officer serves an indefinite term, until his successor is elected |
| *** | Except as otherwise indicated, each individual has held the office shown or other offices in the same company for the last five years. |
| **** | The Fund Complex includes all series of the Trust (currently 26) and any other investment companies for which Vulcan Value Partners, LLC provides investment advisory services (currently none). |
| | |
| Annual Report | April 30, 2013 | | 39 |
| | |
| Trustees and Officers | | |
| April 30, 2013 (Unaudited) | | |
OFFICERS
| | | | | | |
Name, Address* & Age | | Position(s) Held with Fund | | Term of Office and Length of Time Served** | | Principal Occupation(s) During Past 5 Years** |
|
Kimberly R. Storms, age 40 | | Treasurer | | Ms. Storms was elected Treasurer of the Trust at the March 12, 2013 meeting of the Board of Trustees. | | Ms. Storms is Senior Vice President - Director of Fund Administration of ALPS. Ms. Storms joined ALPS in 1998 as Assistant Controller. Because of her position with ALPS, Ms. Storms is deemed an affiliate of the Trust as defined under the 1940 Act. Ms. Storms is also Treasurer of BPV Family of Funds and ALPS Series Trust; Assistant Treasurer of Liberty All-Star Equity Fund and Liberty All-Star Growth Fund, Inc.; Assistant Treasurer of Tilson Funds; and Chief Financial Officer of The Arbitrage Funds. |
|
David T. Buhler, age 41 | | Secretary | | Mr. Buhler was elected Secretary of the Trust at the September 11, 2012 meeting of the Board of Trustees. | | Mr. Buhler joined ALPS in June 2010, and is currently Vice President and Associate Counsel of ALPS, AAI, ADI and APSD. Prior to joining ALPS, Mr. Buhler served as Associate General Counsel and Assistant Secretary of Founders Asset Management LLC from 2006 to 2009. Because of his position with ALPS, Mr. Buhler is deemed an affiliate of the Trust as defined under the 1940 Act. Mr. Buhler is also the Secretary of ALPS Variable Investment Trust and Westcore Trust. |
|
Ted Uhl, age 37 | | Chief Compliance Officer (“CCO”) | | Mr. Uhl was appointed CCO of the Trust at the June 8, 2010 meeting of the Board of Trustees. | | Mr. Uhl joined ALPS in October 2006, and is currently Deputy Compliance Officer of ALPS. Prior to his current role, Mr. Uhl served as Senior Risk Manager for ALPS from October 2006 until June 2010. Before joining ALPS, Mr. Uhl served a Sr. Analyst with Enenbach and Associates (RIA), and a Sr. Financial Analyst at Sprint. Because of his position with ALPS, Mr. Uhl is deemed an affiliate of the Trust as defined under the 1940 Act. Mr. Uhl is also CCO of the Clough Global Funds, Reaves Utility Income Fund, Drexel Hamilton Funds and Transparent Value Trust. |
|
| * | All communications to Trustees and Officers may be directed to Financial Investors Trust c/o 1290 Broadway, Suite 1100, Denver, CO 80203. |
| ** | This is the period for which the Trustee/Officer began serving the Trust. Each Trustee/Officer serves an indefinite term, until his successor is elected |
| *** | Except as otherwise indicated, each individual has held the office shown or other offices in the same company for the last five years. |
| **** | The Fund Complex includes all series of the Trust (currently 26) and any other investment companies for which Vulcan Value Partners, LLC provides investment advisory services (currently none). |
| | |
| 40 | | www.vulcanvaluepartners.com |

| | (a) | The Registrant, as of the end of the period covered by this report, has adopted a code of ethics that applies to the Registrant’s principal executive officer, principal financial officer, principal accounting officer or controller or any persons performing similar functions on behalf of the Registrant. |
| | (c) | During the period covered by this report, no amendments to the provisions of the code of ethics adopted in Item 2(a) above were made. |
| | (d) | During the period covered by this report, no implicit or explicit waivers to the provisions of the code of ethics adopted in Item 2(a) above were granted. |
| | (f) | The Registrant’s Code of Ethics is attached as an Exhibit to this report. |
| Item 3. | Audit Committee Financial Expert. |
The Board of Trustees of the Registrant has determined that the Registrant has at least one Audit Committee Financial Expert serving on its audit committee. The Board of Trustees of the Registrant has designated Jeremy W. Deems as the Registrant’s “Audit Committee Financial Expert.” Mr. Deems is “independent” as defined in paragraph (a)(2) of Item 3 to Form N-CSR.
| Item 4. | Principal Accountant Fees and Services. |
| | (a) | Audit Fees: For the Registrant’s fiscal years ended April 30, 2013 and April 30, 2012, the aggregate fees billed for professional services rendered by the principal accountant for the audit of the Registrant’s annual financial statements were $407,000 and $388,330, respectively. |
| | (b) | Audit-Related Fees: For the Registrant’s fiscal years ended April 30, 2013 and April 30, 2012, the aggregate fees billed for professional services rendered by the principal accountant for the verification of the Registrant’s securities and similar investments in accordance with Rule 17f-2 under the Investment Company Act of 1940 were $0 and $0, respectively. |
| | (c) | Tax Fees: For the Registrant’s fiscal years ended April 30, 2013 and April 30, 2012, the aggregate fees billed for professional services rendered by the principal accountant for tax compliance, tax advice and tax planning were $104,120 and $84,760, respectively. The fiscal year 2013 and 2012 tax fees were for services for dividend calculation, excise tax preparation and tax return preparation. |
| | (d) | All Other Fees: For the Registrant’s fiscal years ended April 30, 2013 and April 30, 2012, no fees were billed to Registrant by the principal accountant for services other than the services reported in paragraphs (a) through (c) of this Item. |
| | (e)(1) | Audit Committee Pre-Approval Policies and Procedures: All services to be performed by the Registrant’s principal accountant must be pre-approved by the Registrant’s audit committee. |
| | (e)(2) | No services described in paragraphs (b) through (d) of this Item were approved by the Registrant’s audit committee pursuant to paragraph (c)(7)(i)(C) of Rule 2-01 of Regulation S-X. |
| | (g) | The aggregate non-audit fees billed by the Registrant’s accountant in each of the last two fiscal years of the Registrant were $314,120 in 2013 and $247,760 in 2012. These fees consisted of non-audit fees billed to (i) the Registrant of $104,120 in 2013 and $84,760 in 2012 as described in response to paragraph (c) above and (ii) to ALPS Fund Services, Inc. (“AFS”), an entity under common control with ALPS Advisors, Inc., the Registrant’s investment adviser, of $210,000 in 2013 and $163,000 in 2012. The non-audit fees billed to AFS related to SSAE 16 services and other compliance-related matters. |
| | (h) | The Registrant’s audit committee has considered whether the provision of non-audit services that were rendered to the Registrant’s investment adviser (not including any sub-adviser whose role is primarily portfolio management and is subcontracted with or overseen by another investment adviser), and any entity controlling, controlled by, or under common control with the investment adviser that provides ongoing services to the Registrant that were not pre-approved pursuant to paragraph (c)(7)(ii) of Rule 2-01 of Regulation S-X, is compatible with maintaining the principal accountant’s independence. The Registrant’s audit committee determined that the provision of such non-audit services is compatible with maintaining the principal accountant’s independence. |
| Item 5. | Audit Committee of Listed Registrants. |
Not applicable.
| | (a) | Schedule of Investments is included as part of the Reports to Stockholders filed under Item 1 of this Form N-CSR. |
| Item 7. | Disclosure of Proxy Voting Policies and Procedures for Closed-End Management Investment Companies. |
Not applicable to Registrant.
| Item 8. | Portfolio Managers of Closed-End Management Investment Companies. |
Not applicable to Registrant.
| Item 9. | Purchases of Equity Securities by Closed-End Management Investment Company and Affiliated Purchasers. |
Not applicable to Registrant.
| Item 10. | Submission of Matters to a Vote of Security Holders. |
There have been no material changes to the procedures by which shareholders may recommend nominees to the Registrant’s Board of Trustees, where those changes were implemented after the Registrant last provided disclosure in response to the requirements of Item 407(c)(2)(iv) of Regulation S-K, or this Item.
| Item 11. | Controls and Procedures. |
| | (a) | The Registrant’s principal executive officer and principal financial officer have concluded that the Registrant’s disclosure controls and procedures (as defined in Rule 30a-3(c) under the Investment Company Act of 1940, as amended) are effective based on their evaluation of these controls and procedures as of a date within 90 days of the filing date of this report. |
| | (b) | There was no change in the Registrant’s internal control over financial reporting (as defined in Rule 30a-3(d) under the Investment Company Act of 1940, as amended) during the second fiscal quarter of the period covered by this report that has materially affected, or is reasonably likely to materially affect, the Registrant’s internal control over financial reporting. |
| | (a)(1) | Registrant’s Code of Ethics for Principal Executive Officer and Senior Financial Officers, which is the subject of the disclosure required by Item 2 of Form N- |
| | CSR, is incorporated by reference to Exhibit 12(a)(1) to the Registrant’s Certified Shareholder Report on Form N-CSR, File No. 811-8194, filed on July 7, 2008. |
| | (a)(2) | The certifications required by Rule 30a-2(a) of the Investment Company Act of 1940, as amended, and Section 302 of the Sarbanes-Oxley Act of 2002 are attached hereto as Exhibit 99.Cert. |
| | (b) | The certifications by the Registrant’s principal executive officer and principal financial officer, as required by Rule 30a-2(b) of the Investment Company Act of 1940, as amended, and Section 906 of the Sarbanes-Oxley Act of 2002 are attached hereto as Exhibit 99.906Cert. |
SIGNATURES
Pursuant to the requirements of the Securities Exchange Act of 1934 and the Investment Company Act of 1940, the Registrant has duly caused this report to be signed on its behalf by the undersigned, thereunto duly authorized.
FINANCIAL INVESTORS TRUST
| | |
| By: | | /s/ Edmund J. Burke |
| | Edmund J. Burke (Principal Executive Officer) |
| | President |
| |
| Date: | | July 8, 2013 |
Pursuant to the requirements of the Securities Exchange Act of 1934 and the Investment Company Act of 1940, this report has been signed below by the following persons on behalf of the Registrant and in the capacities and on the dates indicated.
FINANCIAL INVESTORS TRUST
| | |
| By: | | /s/ Edmund J. Burke |
| | Edmund J. Burke (Principal Executive Officer) |
| | President |
| |
| Date: | | July 8, 2013 |
| |
| By: | | /s/ Kimberly R. Storms |
| | Kimberly R. Storms (Principal Financial Officer) |
| | Treasurer |
| |
| Date: | | July 8, 2013 |