UNITED STATES
SECURITIES AND EXCHANGE COMMISSION
Washington, D.C. 20549
FORM N-CSR
CERTIFIED SHAREHOLDER REPORT OF REGISTERED
MANAGEMENT INVESTMENT COMPANIES
Investment Company Act file number: 811-8194
FINANCIAL INVESTORS TRUST
(Exact name of registrant as specified in charter)
1290 Broadway, Suite 1100, Denver, Colorado 80203
(Address of principal executive offices) (Zip code)
David T. Buhler, Secretary
Financial Investors Trust
1290 Broadway, Suite 1100
Denver, Colorado 80203
(Name and address of agent for service)
Registrant’s telephone number, including area code: 303-623-2577
Date of fiscal year end: April 30
Date of reporting period: May 1, 2013 - April 30, 2014
| Item 1. | Reports to Stockholders. |
TABLE OF CONTENTS
| | |
Seafarer Overseas Growth and Income Fund | | Letter to Shareholders |
April 30, 2014 |
LETTER TO SHAREHOLDERS
May 12, 2014
Dear Fellow Shareholders,
I am pleased to address you once again on behalf of the Seafarer Overseas Growth and Income Fund. This annual report encompasses the Fund’s most recent fiscal year, which ran from May 1, 2013 to April 30, 2014.
During the twelve month period, the Fund gained 2.12%1, while the Fund’s benchmark, the MSCI Emerging Markets Total Return Index, fell -1.49%. By way of broader comparison, the S&P 500 Index increased 20.44%.
The Fund began the fiscal year with a net asset value of $11.91 per share. During the ensuing twelve months, the Fund paid two distributions, worth $0.552 in aggregate. Those payments brought the cumulative distributions per share, as measured from the Fund’s inception, to $0.674.2 The Fund then finished the fiscal year with a value of $11.59 per share.3
We are proud of the Fund’s performance during this period, whether measured relative to peers, relative to the benchmark index, or in absolute. Emerging markets were highly volatile during the past twelve months, and we are pleased the Fund dampened a bit of that volatility, in line with the Fund’s investment objective.
Frankly, though, it was a tough time to be an investor in the Fund, or the emerging markets more broadly. Equity markets swung around a great deal, and the Fund did not go unscathed. Sometimes the emerging markets and the Fund moved higher together, but mostly they moved either sideways or lower. In the end, the Fund’s returns for the fiscal year were meager, and while positive, hardly seem worth the intervening drama. It was a frustrating time, and we are happy it is behind us.
However, while we are looking back: what a year it was! The emerging markets were beset by myriad troubles, with very few positive events to offset. The woes were numerous:
| | • | | “Tapering,” or the end to the U.S. Federal Reserve’s quantitative easing policy.4 |
| | • | | A mini-currency panic, led by the “fragile five” countries, which were deemed by some to be susceptible to funding gaps and therefore to financial crisis.5 |
| | • | | A rout in emerging market local currency bonds. |
| | • | | A material deceleration in China’s economic growth, accompanied by several bouts of distress within that country’s rickety financial system, including the country’s first recorded corporate bond default. |
| | • | | A collapse in commodity prices, which weighed heavily on Latin American and South African equities. |
| | • | | The implosion and final death throes of a Brazilian magnate’s empire, in which Seafarer estimates over $30 billion worth of Brazilian equity and bond capitalization evaporated during the preceding 24 months.6 |
| | • | | Episodic bouts of aggression and hostility on the part of North Korea. |
| | • | | Political instability in Brazil, Turkey, and Thailand, culminating in riots and protracted protests. |
| | • | | Cross-border conflict, instability and secession in Ukraine. |
When I review the list above, I am struck by the breadth and severity of the difficulties that have weighed on the emerging markets during the past twelve months. I am also struck by the performance of the benchmark index, when viewed in this context: a decline of only -1.49% is remarkable.
Last April, who would have imagined one year could deliver so many troubling events? And if you possessed such foreknowledge, would you have predicted the index would end the year roughly where it began? I, for one, would not have done so. If I somehow had advance notice of the list above, I would have cautioned clients to shelter from the market collapse that would inevitably follow. Yet the
| | |
Annual Report | April 30, 2014 | | 1 |
| | |
Seafarer Overseas Growth and Income Fund | | Letter to Shareholders |
April 30, 2014 |
market was nearly flat! With the benefit of hindsight, it is natural to view the index’s return as disappointing; yet I would assert that it was remarkably resilient in light of what could have happened.
The resilience of the emerging markets, in the face of so much bad news, likely conveys a basic but important message: stocks in the developing world are inexpensive. I cannot conclusively determine whether stocks are truly “cheap,” or “cheap enough” – those are loaded phrases that hold different meanings for different investors, and anyway, the markets are too broad to offer a simple, binary assessment as to their “cheapness.” However, I can state that in my experience, when stocks absorb a great deal of bad news, and yet their prices are materially unchanged, the simplest (and most likely) explanation is that prices were already low enough to compensate investors for additional risks – even big, unforeseen ones. Expensive stocks tend to exhibit the opposite behavior: a reduced tolerance for bad news, with prices swooning after a minor negative shock. The one-year return from the emerging markets was nearly flat, despite all that occurred – and I submit it was probably because stocks were inexpensive, with valuations that could accommodate bad news.
Performance Review
Amid this challenging year, the Fund’s performance was bolstered by its exposure to China, Vietnam, India and Poland. Chile, Turkey and Thailand weighed on returns. The Fund benefited from banks, health care, industrials, and utilities; it made absolute gains in technology shares, but on a relative basis it underperformed the index, which did much better in that sector; and the Fund was especially impaired by its exposure to commodity stocks.
Latin America was particularly challenging for the Fund throughout much of the fiscal year; the Fund’s holdings in Mexico, Chile and Brazil were all weak during the bulk of the period. However, we were pleased to see most of the Fund’s holdings in Brazil recover much of their lost ground near the close of the fiscal year, such that the Fund position in Brazil finished nearly flat. The Fund’s holdings in Mexico declined a bit during the period, but this was mainly because the positions had been so successful during the prior year – effectively, the valuations of the Fund’s holdings “cooled off” a bit, after substantial prior gains. We remain comfortable with the Fund’s holdings in that market.
Chile was a different story, though: at the outset of the year, the Fund’s holdings there were mostly centered on the commodity sector. A collapse in prices for raw materials undermined the Fund’s chief holding there, and for a variety of reasons – both related and unrelated to the price decline – we had the Fund exit the position.7 The Fund retains one position in Chile – Corpbanca, a mid-sized bank that is currently merging with Itau, one of Brazil’s largest financial institutions.
Regarding banks, and other financial institutions: the financial sector made the single largest contribution to the Fund’s outperformance versus the benchmark index. The Fund generated gains from the sector in several markets – Poland, Brazil, South Korea and Vietnam – while the benchmark produced sharply negative returns. Seafarer’s focus on bottom-up stock selection helped during the fiscal period, as there was no common theme or geography to otherwise unite these positions. The banks in Poland and Brazil are large capitalization stocks, acquired when their shares were depressed; the Fund benefited from the subsequent recovery in the valuation of those shares. In Korea, the Fund acquired the heavily discounted preferred shares of a commercial insurance company; happily for the Fund, the discount subsequently eased. In Vietnam, the Fund benefited from its exposure to a small capitalization stock associated with the country’s largest commercial re-insurer.
As mentioned above, the Fund’s performance was weak, on a relative basis, within the technology sector – the Fund produced gains, but it was outpaced by the benchmark index. The index’s gains were spurred mostly by its exposure to internet stocks, particularly those based in China and Korea. Since its inception, the Fund has lacked exposure to internet-focused companies (e.g. social media, search engines, entertainment). The Fund’s strategy does not prohibit exposure to the internet; however, such stocks typically fail to meet the Fund’s valuation and dividend criteria. We recognize there are some excellent internet-driven businesses, and if valuations ever become sufficiently attractive, the Fund will likely seek exposure.
| | |
| 2 | | (855) 732-9220 | seafarerfunds.com |
| | |
Seafarer Overseas Growth and Income Fund | | Letter to Shareholders |
April 30, 2014 |
The Fund performed well within India, generating gains and avoiding the worst of the volatility that impacted Indian shares and the local currency last autumn. The Fund’s exposure to Poland also proved successful: the Fund’s holdings were relatively steady amid the gyrations of the past year, and the holdings experienced growth that outpaced market expectations, which lifted share prices a bit.
The most surprising source of returns for the Fund was China. The country suffered from declining stock markets and widely publicized fears over slow growth and systemic risks within its financial sector. So perhaps it is surprising, but nonetheless true, that the Fund’s exposure to China was one of the largest sources of its absolute and relative gains, and the majority of the Fund’s Chinese holdings had positive returns during the fiscal year. The Fund’s success was due to its avoidance of large capitalization banks and energy companies – those sectors arguably are most affected by China’s current problems; and it was aided by its exposure to small and mid-sized industrial, technology and health care companies.
If you wish to review a more detailed discussion of the Fund’s performance and holdings, Seafarer publishes four portfolio reviews per year on its website. Each corresponds to a standard calendar quarter. Please visit www.seafarerfunds.com/archives for further information.
Peering Over China’s Great Wall of Worry
Returning to the topic of China: among investors focused on the emerging markets, the country is regarded with skepticism and trepidation. The global financial media is rife with reports of failings within the country’s financial system. Every release of economic data, no matter how trivial, receives a ridiculous degree of scrutiny, as if it were a tealeaf on which the Middle Kingdom’s future was written. I suppose there is a rational basis for this, as China is undergoing a major economic transition. The immediate outlook is not encouraging, and fraught with risk. There is plenty that can go wrong.
Yet if there is one surprising aspect to the current cloud that hangs over China, it is the near-total absence of discussion of all that could go right. The present debate around China’s investment merits is so unbalanced that it strikes me as absurd.
Please do not mistake me for a naive optimist about the country: for the past five years, I have written about the economy’s decelerating growth; its need for a revised economic model; troubles within its banking sector; potential imbalances that might undermine its currency, the renminbi; and the possibility that the country might instigate armed conflict with its neighbors. I am concerned about all of these issues, and more.
However, to dwell solely on the country’s well-known weaknesses is to ignore the important, broad-based reform efforts that are underway. China’s new leadership, installed in the fall of 2012, has launched a major overhaul of the country’s economic and political structure. Here is a partial list of what is taking place:
| | • | | A substantial (but unfortunately not exhaustive) anti-corruption drive. |
| | • | | Liberalization of the local currency and of interest rates within the banking system. Both are “backdoor” reforms of the domestic banking sector. |
| | • | | Recapitalization of the domestic banking system to address financial weaknesses. |
| | • | | Major stock market reforms, including: enhanced access for foreign investors via the “through train” policy,8 new mechanisms for companies to issue capital, and a liberalized market for initial public offerings (IPOs). |
| | • | | Major reforms to reduce excess capacities within state-owned enterprises. |
| | • | | Modernization of provincial governments’ finances, possibly culminating in the authority to levy local taxes (i.e. property and sales taxes), and the authority to issue municipal-style bonds. |
| | • | | Liberalization of most key input prices, especially energy and natural resources. |
| | • | | Environmental regulation, targeting sharp reduction in carbon emissions, with severe penalties for polluters. |
| | • | | Reformed property and land use rights. |
| | |
Annual Report | April 30, 2014 | | 3 |
| | |
Seafarer Overseas Growth and Income Fund | | Letter to Shareholders |
April 30, 2014 |
| | • | | Reform of the hukou (“household registration”) system. Hukou is a set of identification documents, somewhat like a domestic passport. Hukou defines a household’s civil, economic and legal rights within a given local municipality. It confers access (or lack thereof) to various government services, health care, education, housing and employment. If a family attempts to move from the countryside to the city, it will not be entitled to such services in the new urban residence because the family’s hukou remains tied to the original rural home. In my opinion, the system is broadly analogous to social entitlements in the U.S. – and its reform is just as politically contentious. |
| | • | | A major overhaul of the national healthcare delivery system. |
| | • | | Relaxation of the “one child” policy. |
Make no mistake: this is an impressive list. Apparently, China has listened to its external advisors, and to some of its detractors. The list makes it clear that China is not shying away from difficult change. No other developing nation has undertaken a reform program so comprehensive or bold. Imagine if the U.S. simultaneously tackled several sensitive issues. Envision a coordinated effort to reform healthcare, banking regulations, the tax code, and social entitlement programs. The project would be sweeping in its scale; it would meet with considerable resistance from vested interests; it would stand a significant risk of outright failure; and it would certainly rile every corner of our economy.
This is analogous to what is now taking place in China: the country is engaged in an extensive overhaul of the political and economic landscape. I cannot predict the extent to which it will be successful, but the country does not lack ambition. Nor does the leadership lack understanding about the urgency or nature of the challenges ahead. Admittedly, the most sensitive political reforms – those that might undermine the communist party’s authority – are absent. Nevertheless, any one of the initiatives above has the potential to impact the entire domestic economy for the better. If the reforms mostly meet with success, I believe China’s growth has the capacity to impress for many years to come. The team at Seafarer is eager to watch China’s progress unfold – and we will keep you informed regarding the results.
A Few Announcements
Please note: This section of the letter was written jointly by Andrew Foster and Michelle Foster, managing members of Seafarer Capital Partners, LLC.
The past fiscal year has been a good one for Seafarer Capital Partners, despite the difficulties that have weighed on the emerging markets. We have been privileged to welcome new shareholders to the Fund, and we have seen our relationships with clients grow. We made further investments in Seafarer’s resources – in personnel and technology – so as to ensure the firm’s steady growth and development. We recently expanded our investment team with the addition of Paul Espinosa, Senior Analyst, to our firm. Paul is a veteran investor in the emerging markets, and his arrival both broadens and deepens the team’s global research capabilities. We plan to further expand Seafarer’s team in the coming year.
Shortly after we founded Seafarer three years ago, we had the opportunity to write a brief essay on the firm’s goals.9 In that essay, we noted that our abiding goal as an investment adviser is to deliver superior long-term performance to our clients. However, we also noted three ancillary objectives: to increase the transparency associated with investment in developing countries; to mitigate a portion of the volatility that is inherent to the emerging markets; and to deliver lower costs to our clients, over time and with scale. We continue to work toward these three objectives, and we are happy to declare a bit of progress with respect to the third.
We are pleased to announce that effective September 1, 2014, the Fund will undertake an expense reduction on behalf of its shareholders. Seafarer Capital Partners, LLC (our firm) will contractually commit to lower the expenses of the Fund for the ensuing twelve months, with the intent to renew the same obligation for the foreseeable future.10 The Investor class net expenses will be reduced to 1.25% by way of this “expense cap,” and the Institutional class net expenses will be reduced to 1.05%.11 This new cap constitutes the second reduction in fees enacted by the Fund since its inception (the first reduction occurred in January 2013).
| | |
| 4 | | (855) 732-9220 | seafarerfunds.com |
| | |
Seafarer Overseas Growth and Income Fund | | Letter to Shareholders |
April 30, 2014 |
In addition, Seafarer Capital Partners will reduce its management fee for the Fund from 0.85% to 0.75%. Seafarer’s management fee constitutes a portion of the Fund’s overall expenses, and therefore such fees are subject to the aforementioned expense cap.
We are able to achieve these expense reductions because the Fund’s growth over the past year has afforded some basic economies of scale. Subscriptions from new and existing shareholders have increased the Fund’s operating efficiencies. The resulting economies, combined with the momentum we believe exists in our business, give us the confidence to drive expenses lower. We are pleased to achieve progress toward our goal of lower costs, though we are by no means finished. We will strive to further reduce expenses to shareholders, with additional time and with scale.
While we are pleased to be undertaking an expense reduction that benefits both share classes, it is our sincere wish that more shareholders could take advantage of the lower expenses afforded by the Institutional class. In truth, we would prefer to call it the “universal class,” because we hope that every shareholder could make use of it. We want to offer the lowest possible expenses to everyone. The problem is that certain distribution platforms (i.e., brokers, dealers, and other financial intermediaries) impose a minimum initial investment of $100,000 on the Institutional class. Those same platforms also restrict Seafarer’s ability to distribute the share class with a lower minimum on a direct basis – in other words, the $100,000 minimum applies everywhere, regardless of whether you purchase the Fund’s Institutional class directly from Seafarer, or from a platform or intermediary. This is not our preference. We are acutely aware that many shareholders cannot afford or would not choose to invest so much capital in the Fund. We are frustrated by the situation, as it drives a wedge between shareholders and the lower costs we would like to offer them.
Given that we would like to encourage broader usage of the Institutional class, we will describe three ways that certain shareholders might gain access to this share class, even if they are unable to immediately meet the investment minimum. First, financial advisers might discover that their platform will waive the minimum if the adviser invests with the intention to reach the minimum. Every platform evaluates waiver requests differently, and Seafarer has no influence over whether a particular platform will entertain such requests. Platforms that do grant waivers may require that Seafarer submit the request on behalf of the adviser. We are happy to help with such waiver requests. Advisers can contact us at (415) 578-9075 or contact@seafarerfunds.com.
Second, advisers can meet the investment minimum for the Institutional class by aggregating Fund holdings across multiple client accounts, if permitted by the platform.12 If you are an adviser and you encounter difficulty with aggregation at the platform, please let us know; we will try to resolve the issue with the platform.
Third, our firm has some influence over the application of the minimum as it pertains to shareholders who subscribe to the Fund on a direct basis via an automatic investment plan (“AIP”). We will do our utmost to waive the Institutional class minimum for accounts that satisfy all of the following criteria:
| | 1. | The account must be established directly with the Fund, not with a platform or intermediary. |
| | 2. | The account must activate an AIP. |
| | 3. | The account holder must request a waiver from the Fund’s transfer agent. The applicant must request the waiver in good faith, with the intent to eventually meet the Institutional class minimum via a program of sustained investment over time. The transfer agent can be reached at (855) 732-9220 or seafarerfunds@alpsinc.com. |
Also, we will do our best to ensure that existing AIP participants can convert from the Investor class to the Institutional class (known as a “share class transfer”), provided they satisfy all three criteria above. Ultimately, it is our hope that more shareholders make use of this “universal” share class, regardless of what its official name might convey. For our part, we will work to extend the benefit of lower expenses to those who undertake the extra effort required to invest directly with the Fund, on a sustained basis.
| | |
Annual Report | April 30, 2014 | | 5 |
| | |
Seafarer Overseas Growth and Income Fund | | Letter to Shareholders |
April 30, 2014 |
Thank you for entrusting us with your patience and your capital. It is an honor to serve as your investment adviser in the emerging markets.
Sincerely,
Andrew Foster, Chief Investment Officer
Michelle Foster, President
Seafarer Capital Partners, LLC
The MSCI Emerging Markets Total Return Index, Standard (Large+Mid Cap) Core, Gross (dividends reinvested), USD is a free float-adjusted market capitalization index designed to measure equity market performance of emerging markets. Index code: GDUEEGF.
The S&P 500 Total Return Index is a stock market index based on the market capitalizations of 500 large companies with common stock listed on the NYSE or NASDAQ. The index is not actively managed and does not reflect any deductions for fees, expense or taxes. An investor may not invest directly in an index.
The views and information discussed in this commentary are as of the date of publication, are subject to change, and may not reflect the writer’s current views. The views expressed represent an assessment of market conditions at a specific point in time, are opinions only and should not be relied upon as investment advice regarding a particular investment or markets in general. Such information does not constitute a recommendation to buy or sell specific securities or investment vehicles. It should not be assumed that any investment will be profitable or will equal the performance of the portfolios or any securities or any sectors mentioned herein. The subject matter contained herein has been derived from several sources believed to be reliable and accurate at the time of compilation. Seafarer does not accept any liability for losses either direct or consequential caused by the use of this information.
| 1 | References to the “Fund” pertain to the Fund’s Institutional share class (ticker: SIGIX). The Investor share class (ticker: SFGIX) returned 1.93% during the fiscal year. |
| 2 | The Fund’s inception date was February 15, 2012. |
| 3 | The Fund’s Investor share class began the fiscal year with a net asset value of $11.91 per share; it paid two distributions, worth $0.540 in aggregate; and it finished the fiscal year with a value of $11.58 per share. |
| 4 | Quantitative easing is the attempt by a central bank to inject more money into the economy and to keep long-term interest rates low through the purchase of large amounts of assets, often held by financial institutions. (Source: MITnews, “Explained: Quantitative Easing,” August 17, 2010) |
| 5 | The “fragile five” countries consist of Brazil, India, Indonesia, South Africa, and Turkey. |
| 6 | Bloomberg, “Batista’s Losers Shout and Sue as OGX Meltdown Casts Pall,” 31 December 2013 (www.bloomberg.com/news/2013-12-31/batista-s-losers-shout-and-sue-as-ogx-meltdown-casts-pall.html). |
| 7 | For more details regarding the Fund’s exposure to the commodity sector, please see the Fund’s portfolio review for the third quarter of 2013 (www.seafarerfunds.com/fund/portfolio-review/2013/09/Q3). |
| 8 | In April 2014 the China Securities Regulatory Commission (CSRC) and Hong Kong Securities and Futures Commission (SFC) announced the development of a pilot program called “Shanghai-Hong Kong Stock Connect” (informally known as the “through train”) that will establish mutual stock market access between mainland China and Hong Kong. The program will allow mainland Chinese and Hong Kong investors to access each other’s equity markets, and will enhance foreign investors’ access to mainland listed stocks as well. |
| 9 | The essay on the firm’s goals is available at www.seafarerfunds.com/ask-seafarer/#what-are-the-firms-goals. |
| 10 | Though it is Seafarer’s intent to renew this expense cap for the foreseeable future, Seafarer is under no obligation to renew the expense cap beyond the twelve month contractual term ending August 31, 2015. |
| 11 | Gross expense ratio as of the prospectus dated August 31, 2013: 2.79% for Investor class; 2.69% for Institutional class. |
| 12 | Similarly, individual investors can reach the investment minimum for the Institutional class by aggregating multiple accounts within the Fund, if permitted by the platform. |
| | |
| 6 | | (855) 732-9220 | seafarerfunds.com |
| | |
Seafarer Overseas Growth and Income Fund | | Portfolio Review |
April 30, 2014 |
Seafarer Overseas Growth and Income Fund Performance
| | | | | | |
Total Return (As of April 30, 2014) | | 1 Year | | Since
Inception* -
Annualized | | Net Expense
Ratio** |
Investor Class (SFGIX) | | 1.93% | | 9.72% | | 1.40% |
Institutional Class (SIGIX) | | 2.12% | | 9.85% | | 1.25% |
MSCI Emerging Markets Total Return Index^ | | -1.49% | | 0.09% | | |
Gross expense ratio: 2.79% for Investor Class; 2.69% for Institutional Class. Ratios as of the Prospectus dated August 31, 2013**
All performance is in U.S. dollars with gross (pre-tax) dividends and/or distributions reinvested. The performance data quoted represents past performance and does not guarantee future results. Future returns may be lower or higher. The investment return and principal value will fluctuate so that an investor’s shares, when redeemed, may be worth more or less than the original cost. Shares of the Fund redeemed or exchanged within 90 days of purchase are subject to a 2% redemption fee. Performance does not reflect this fee, which if deducted would reduce an individual’s return. To obtain the Fund’s most recent month-end performance, visit seafarerfunds.com or call (855) 732-9220.
| * | Inception Date: February 15, 2012. |
| ** | Seafarer Capital Partners, LLC has agreed contractually to waive and/or reimburse fees or expenses in order to limit Total Annual Fund Operating Expenses After Fee Waiver/Expense Reimbursements (excluding brokerage expenses, interest expenses, taxes and extraordinary expenses) to 1.40% and 1.25% of the Fund’s average daily net assets for the Investor and Institutional share classes, respectively. This agreement is in effect through August 31, 2014. |
| ^ | The MSCI Emerging Markets Total Return Index, Standard (Large+Mid Cap) Core, Gross (dividends reinvested), USD is a free float-adjusted market capitalization index designed to measure equity market performance of emerging markets. Index code: GDUEEGF. The index is not actively managed and does not reflect any deductions for fees, expense or taxes. An investor may not invest directly in an index. |
| | |
Annual Report | April 30, 2014 | | 7 |
| | |
Seafarer Overseas Growth and Income Fund | | Portfolio Review |
April 30, 2014 |
Performance of a $10,000 Investment Since Inception
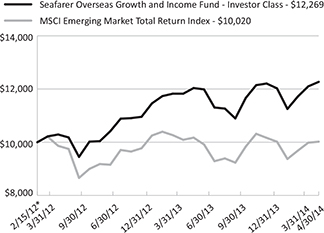
* Inception Date: February 15, 2012.
The chart shown above represents historical performance of a hypothetical investment of $10,000 in the Fund’s Investor Class shares for the period from inception to April 30, 2014. All returns reflect reinvested dividends and/or distributions, but do not reflect the deduction of taxes that an investor would pay on distributions or redemptions.
The Fund also offers Institutional Class shares, performance for which is not reflected in the chart above. The performance of Institutional Class shares may be higher or lower than the performance of the Investor Class shares shown above based upon differences in fees paid by shareholders investing in the Investor Class shares and Institutional Class shares.
Investment Objective
The Fund seeks to provide long-term capital appreciation along with some current income. The Fund seeks to mitigate adverse volatility in returns as a secondary objective.
Strategy
The Fund invests primarily in the securities of companies located in developing countries. The Fund invests in several asset classes including dividend-paying common stocks, preferred stocks, convertible bonds, and fixed-income securities.
The Fund seeks to offer investors a relatively stable means of participating in a portion of developing countries’ growth prospects, while providing some downside protection compared to a portfolio that invests only in the common stocks of those countries.
| | |
| 8 | | (855) 732-9220 | seafarerfunds.com |
| | |
Seafarer Overseas Growth and Income Fund | | Portfolio Review |
April 30, 2014 |
Fund Characteristics
| | | | |
Inception Date | | | February 15, 2012 | |
Net Assets | | | $73.8M | |
Portfolio Turnover1 | | | 51% | |
| | | | | | | | | | |
| | | Investor Class | | Institutional Class |
Ticker | | | | SFGIX | | | | | SIGIX | |
NAV | | | | $11.58 | | | | | $11.59 | |
30-Day SEC Yield | | | | 1.80% | | | | | 1.95% | |
Fund Distribution Yield | | | | 1.62% | | | | | 1.71% | |
Net Expense Ratio | | | | 1.40% | | | | | 1.25% | |
Redemption Fee (within 90 calendar days) | | | | 2.00% | | | | | 2.00% | |
Minimum Initial Investment | | | | $2,500 | | | | | $100,000 | |
Minimum Initial Investment (Retirement Account) | | | | $1,000 | | | | | $100,000 | |
Underlying Portfolio Holdings
| | | | |
Number of Holdings | | | 47 | |
% of Net Assets in Top 10 Holdings | | | 31% | |
Weighted Average Market Cap | | | $14.8B | |
Market Cap of Portfolio Median | | | $4.2B | |
Gross Portfolio Yield2,3 | | | 3.2% | |
Price / Book Value2 | | | 1.8 | |
Price / Earnings2,4 | | | 11.3 | |
Earnings Per Share Growth2,4 | | | 11% | |
| 1 | For the year ended April 30, 2014. |
| 2 | Calculated as a harmonic average of the underlying portfolio holdings. |
| 3 | Gross Portfolio Yield = gross yield for the underlying portfolio, estimated based on the dividend yield for common and preferred stocks and yield to maturity for bonds. This measure of yield does not account for offsetting Fund expenses and other costs, and consequently it should not be construed as the yield that an investor in the Fund would receive. |
| 4 | Based on consensus earnings estimates for next year. Excludes securities for which consensus earnings estimates are not available. |
Past performance does not guarantee future results.
Sources: ALPS Fund Services, Inc., Bloomberg, Seafarer.
Price / Book Value: the value of a company’s common shares, divided by the company’s book value.
Price / Earnings: the market price of a company’s common shares divided by the earnings per common share as forecast for next year.
Earnings Per Share (EPS) Growth: forecast growth rate of earnings per common share next year, expressed as a percentage.
The “Underlying Portfolio Holdings” table presents indicative values only; Seafarer does not warrant the data’s accuracy, and disclaims any responsibility for its use for investment purposes.
| | |
Annual Report | April 30, 2014 | | 9 |
| | |
Seafarer Overseas Growth and Income Fund | | Portfolio Review |
April 30, 2014 |
Top 10 Holdings
| | | | | | | | | | | | | | | | | | | | | | | | | | |
| Holding | | Sector | | Country | | % Net
Assets | | | Issuer Mkt
Cap ($B) | | Yield1 | | | Price /
Book | | | Price /
Earnings2 | | | EPS
Growth2 | |
Singapore Telecommunications Ltd. | | Telecom.
Services | | Singapore | | | 3.7% | | | $48.1 | | | 4.4% | | | | 2.7 | | | | 15 | | | | 7% | |
Hang Lung Properties, Ltd. | | Financials | | China /
Hong Kong | | | 3.5% | | | $13.5 | | | 3.2% | | | | 0.8 | | | | 16 | | | | 12% | |
Valid Solucoes | | Industrials | | Brazil | | | 3.3% | | | $0.9 | | | 2.6% | | | | 3.5 | | | | 12 | | | | 15% | |
Sindoh Co. Ltd.3 | | Information
Technology | | South
Korea | | | 3.1% | | | $0.7 | | | 3.4% | | | | 0.8 | | | | – | | | | – | |
Keppel Corp. Ltd. | | Industrials | | Singapore | | | 3.1% | | | $15.3 | | | 3.8% | | | | 1.9 | | | | 11 | | | | 7% | |
NTT DOCOMO, Inc. | | Telecom.
Services | | Japan | | | 3.0% | | | $69.7 | | | 3.7% | | | | 1.2 | | | | 13 | | | | 4% | |
Cia Vale do Rio Doce, Pfd. | | Materials | | Brazil | | | 3.0% | | | $68.7 | | | 6.4% | | | | 0.9 | | | | 6 | | | | 2% | |
Sun Pharma Advanced Research Co., Ltd.3,4 | | Health Care | | India | | | 3.0% | | | $0.7 | | | – | | | | 38.3 | | | | – | | | | – | |
Dongsuh Co. Inc.3 | | Consumer
Staples | | South
Korea | | | 2.7% | | | $1.5 | | | 3.5% | | | | 1.8 | | | | – | | | | – | |
Dongfang Electric Corp. Ltd. | | Industrials | | China /
Hong Kong | | | 2.7% | | | $3.7 | | | 1.0% | | | | 1.1 | | | | 9 | | | | 4% | |
| | | | | | |
Cumulative Weight of Top 10 Holdings: | | | 31% | | | | | | | | | | | | | | | | | | | |
Total Number of Holdings: | | | 47 | | | | | | | | | | | | | | | | | | | |
| 1 | Yield = dividend yield for common and preferred stocks and yield to maturity for bonds. |
| 2 | Based on consensus earnings estimates for next year. |
| 3 | Consensus estimates for earnings and EPS growth are not available for this security. |
| 4 | Non-income producing security. |
Portfolio holdings are subject to change.
Sources: ALPS Fund Services, Inc., Bloomberg, Seafarer.
The table above presents indicative values only; Seafarer does not warrant the data’s accuracy and disclaims any responsibility for its use for investment purposes.
| | |
| 10 | | (855) 732-9220 | seafarerfunds.com |
| | |
Seafarer Overseas Growth and Income Fund | | Portfolio Review |
April 30, 2014 |
Portfolio Composition
| | | | | |
| Region/Country | | % Net Assets |
East & South Asia | | | | 61 | |
China / Hong Kong | | | | 13 | |
India | | | | 7 | |
Indonesia | | | | 4 | |
Japan | | | | 5 | |
Malaysia | | | | 4 | |
Singapore | | | | 11 | |
South Korea | | | | 8 | |
Taiwan | | | | 4 | |
Vietnam | | | | 6 | |
Eastern Europe | | | | 14 | |
Poland | | | | 6 | |
Turkey | | | | 8 | |
Latin America | | | | 21 | |
Brazil | | | | 14 | |
Chile | | | | 2 | |
Mexico | | | | 5 | |
Middle East & Africa | | | | 2 | |
South Africa | | | | 2 | |
Cash and Other Assets,
Less Liabilities | | | | 2 | |
Total | | | | 100 | |
| |
| Asset Class | | % Net Assets |
Common Stock | | | | 81 | |
ADR | | | | 6 | |
Preferred Stock | | | | 5 | |
Foreign Currency Government Bond | | | | 4 | |
USD Convertible Bond | | | | 1 | |
Cash and Other Assets, Less Liabilities | | | | 2 | |
Total | | | | 100 | |
| |
| Market Capitalization of Issuer | | % Net Assets |
Large Cap (over $10 billion) | | | | 37 | |
Mid Cap ($1 - $10 billion) | | | | 38 | |
Small Cap (under $1 billion) | | | | 19 | |
Not Applicable | | | | 4 | |
Cash and Other Assets,
Less Liabilities | | | | 2 | |
Total | | | | 100 | |
| | | | | |
| Sector | | % Net Assets |
Consumer Discretionary | | | | 9 | |
Consumer Staples | | | | 11 | |
Energy | | | | 1 | |
Financials* | | | | 19 | |
Government | | | | 4 | |
Health Care | | | | 9 | |
Industrials | | | | 16 | |
Information Technology | | | | 15 | |
Materials | | | | 5 | |
Telecommunication Services | | | | 7 | |
Utilities | | | | 2 | |
Cash and Other Assets,
Less Liabilities | | | | 2 | |
Total | | | | 100 | |
| * | The Fund’s concentration in the Financials sector includes holdings in property-related stocks, which are classified within the “Financials sector” according to the Global Industry Classification Standard (GICS) methodology utilized herein. Property-related holdings comprised 7% of the Fund’s net assets as of April 30, 2014. |
Percentage values may not sum to 100% due to rounding.
| | |
Annual Report | April 30, 2014 | | 11 |
| | |
Seafarer Overseas Growth and Income Fund | | Portfolio Review |
April 30, 2014 |
Greatest Performance Contributors and Detractors
For the twelve months ended April 30, 2014
| | | | | |
| Contributors | | % Net Assets1 |
Samsung Fire & Marine Insurance Co., Ltd., Pfd. 2 | | | | – | |
Kingdee International Software Group Co. Ltd. 2 | | | | – | |
Bank Pekao SA | | | | 2.2 | |
PGE Polska Grupa Energetyczna SA | | | | 2.1 | |
Valid Solucoes | | | | 3.3 | |
| |
| Detractors | | % Net Assets1 |
Sociedad Quimica y Minera de Chile SA ADR2 | | | | – | |
Netas Telekomunikasyon AS2 | | | | – | |
Digital China Holdings, Ltd. | | | | 1.8 | |
Thai Reinsurance PCL2 | | | | – | |
Aliansce Shopping Centers SA | | | | 1.5 | |
| 2 | As of April 30, 2014, the Fund had no economic interest in this security. |
Source: Bloomberg.
The table above presents estimated values only; Seafarer does not warrant the data’s accuracy and disclaims any responsibility for its use for investment purposes.
| | |
| 12 | | (855) 732-9220 | seafarerfunds.com |
| | |
Seafarer Overseas Growth and Income Fund | | Disclosure of Fund Expenses |
April 30, 2014 (Unaudited) |
As a shareholder of the Fund you will incur two types of costs: (1) transaction costs, including applicable redemption fees; and (2) ongoing costs, including management fees and other Fund expenses. The following examples are intended to help you understand your ongoing costs (in dollars) of investing in the Fund and to compare these costs with the ongoing costs of investing in other mutual funds. The examples are based on an investment of $1,000 invested on November 1, 2013 and held until April 30, 2014.
Actual Expenses. The first line of each table below provides information about actual account values and actual expenses. You may use the information in this line, together with the amount you invested, to estimate the expenses that you paid over the period. Simply divide your account value by $1,000 (for example, an $8,600 account value divided by $1,000 = 8.6), then multiply the result by the number in the first line under the heading “Expenses Paid During Period” to estimate the expenses you paid on your account during this period.
Hypothetical Example for Comparison Purposes. The second line of the table below provides information about hypothetical account values and hypothetical expenses based on the Fund’s actual expense ratio and an assumed rate of return of 5% per year before expenses, which is not the Fund’s actual return. The hypothetical account values and expenses may not be used to estimate the actual ending account balance or expenses you paid for the period. You may use this information to compare the ongoing costs of investing in the Fund and other mutual funds. To do so, compare this 5% hypothetical example with the 5% hypothetical examples that appear in the shareholder reports of the other funds. The expenses shown in the table are meant to highlight ongoing Fund costs only and do not reflect transaction fees, such as redemption fees or exchange fees. Therefore, the second line of each table below is useful in comparing ongoing costs only, and may not help you determine the relative total costs of owning different funds. In addition, if these transactional costs were included, your costs would have been higher.
| | | | | | | | | | | | | | | | | | | | | | | | | |
| | | Beginning
Account Value
11/01/13 | | Ending
Account Value
04/30/14 | | Expense
Ratio(a) | | Expenses Paid
During Period
11/01/13 - 04/30/14(b) | | |
Investor Class | | | | | | | | | | | | | | | | | | | | | | |
Actual | | | $ | 1,000.00 | | | | $ | 1,010.20 | | | | | 1.40 | % | | | $ | 6.98 | | | |
Hypothetical | | | | | | | | | | | | | | | | | | | | | | |
(5% return before expenses) | | | $ | 1,000.00 | | | | $ | 1,017.85 | | | | | 1.40 | % | | | $ | 7.00 | | | |
| | | | | | | | | | | | | | | | | | | | | | | | |
Institutional Class | | | | | | | | | | | | | | | | | | | | | | |
Actual | | | $ | 1,000.00 | | | | $ | 1,011.10 | | | | | 1.25 | % | | | $ | 6.23 | | | |
Hypothetical | | | | | | | | | | | | | | | | | | | | | | |
(5% return before expenses) | | | $ | 1,000.00 | | | | $ | 1,018.60 | | | | | 1.25 | % | | | $ | 6.26 | | | |
| (a) | Annualized, based on the Fund’s most recent fiscal half year expenses. |
| (b) | Expenses are equal to the Fund’s annualized expense ratio multiplied by the average account value over the period, multiplied by the number of days in the most recent fiscal half-year (181)/365 (to reflect the half-year period). |
| | |
Annual Report | April 30, 2014 | | 13 |
| | |
Seafarer Overseas Growth and Income Fund | | Portfolio of Investments |
April 30, 2014 |
| | | | | | | | | | |
| | | Currency | | Shares | | | Value | |
COMMON STOCKS (84.9%) | | | | | | | | | | |
Brazil (7.5%) | | | | | | | | | | |
Valid Solucoes e Servicos de Seguranca em Meios de Pagamento e Identificacao SA | | BRL | | | 160,000 | | | $ | 2,466,286 | |
Odontoprev SA | | BRL | | | 475,000 | | | | 1,917,255 | |
Aliansce Shopping Centers SA | | BRL | | | 136,000 | | | | 1,107,030 | |
| | | | | | | | | | |
| | | |
Total Brazil | | | | | | | | | 5,490,571 | |
| | | | | | | | | | |
| | | |
Chile (2.1%) | | | | | | | | | | |
Corpbanca SA | | CLP | | | 136,535,716 | | | | 1,572,839 | |
| | | | | | | | | | |
| | | |
Total Chile | | | | | | | | | 1,572,839 | |
| | | | | | | | | | |
| | | |
China / Hong Kong (13.3%) | | | | | | | | | | |
Hang Lung Properties, Ltd. | | HKD | | | 860,000 | | | | 2,565,079 | |
Dongfang Electric Corp., Ltd. | | HKD | | | 1,260,000 | | | | 1,970,642 | |
Beijing Enterprises Holdings, Ltd. | | HKD | | | 175,000 | | | | 1,523,995 | |
SinoMedia Holding, Ltd. | | HKD | | | 1,729,000 | | | | 1,520,439 | |
Digital China Holdings, Ltd. | | HKD | | | 1,470,000 | | | | 1,361,522 | |
Shandong Weigao Group Medical Polymer Co., Ltd., Class H | | HKD | | | 877,222 | | | | 888,792 | |
| | | | | | | | | | |
| | | |
Total China / Hong Kong | | | | | | | | | 9,830,469 | |
| | | | | | | | | | |
| | | |
India (6.8%) | | | | | | | | | | |
Sun Pharma Advanced Research Co., Ltd.(a) | | INR | | | 770,000 | | | | 2,185,110 | |
Infosys, Ltd. ADR | | USD | | | 35,000 | | | | 1,879,850 | |
Navneet Education, Ltd. | | INR | | | 968,880 | | | | 964,623 | |
| | | | | | | | | | |
| | | |
Total India | | | | | | | | | 5,029,583 | |
| | | | | | | | | | |
| | | |
Indonesia (2.6%) | | | | | | | | | | |
Astra International Tbk PT | | IDR | | | 3,000,000 | | | | 1,932,877 | |
| | | | | | | | | | |
| | | |
Total Indonesia | | | | | | | | | 1,932,877 | |
| | | | | | | | | | |
| | | |
Japan (4.8%) | | | | | | | | | | |
NTT DOCOMO, Inc. | | JPY | | | 140,000 | | | | 2,233,076 | |
Ajinomoto Co., Inc. | | JPY | | | 90,000 | | | | 1,324,607 | |
| | | | | | | | | | |
| | | |
Total Japan | | | | | | | | | 3,557,683 | |
| | | | | | | | | | |
| | |
| 14 | | (855) 732-9220 | seafarerfunds.com |
| | |
Seafarer Overseas Growth and Income Fund | | Portfolio of Investments |
April 30, 2014 |
| | | | | | | | | | |
| | | Currency | | Shares | | | Value | |
Malaysia (3.7%) | | | | | | | | | | |
Hartalega Holdings Bhd | | MYR | | | 759,960 | | | $ | 1,475,470 | |
AMMB Holdings Bhd | | MYR | | | 550,000 | | | | 1,210,513 | |
| | | | | | | | | | |
| | | |
Total Malaysia | | | | | | | | | 2,685,983 | |
| | | | | | | | | | |
| | | |
Mexico (4.8%) | | | | | | | | | | |
Grupo Herdez SAB de CV | | MXN | | | 630,470 | | | | 1,884,748 | |
Grupo Financiero Banorte SAB de CV | | MXN | | | 250,000 | | | | 1,660,392 | |
| | | | | | | | | | |
| | | |
Total Mexico | | | | | | | | | 3,545,140 | |
| | | | | | | | | | |
| | | |
Poland (5.8%) | | | | | | | | | | |
Bank Pekao SA | | PLN | | | 25,000 | | | | 1,604,511 | |
PGE SA | | PLN | | | 225,000 | | | | 1,563,481 | |
Asseco Poland SA | | PLN | | | 75,000 | | | | 1,116,774 | |
| | | | | | | | | | |
| | | |
Total Poland | | | | | | | | | 4,284,766 | |
| | | | | | | | | | |
| | | |
Singapore (9.3%) | | | | | | | | | | |
Singapore Telecommunications, Ltd. | | SGD | | | 900,000 | | | | 2,756,807 | |
Keppel Corp., Ltd. | | SGD | | | 270,000 | | | | 2,271,789 | |
SIA Engineering Co., Ltd. | | SGD | | | 477,000 | | | | 1,824,073 | |
| | | | | | | | | | |
| | | |
Total Singapore | | | | | | | | | 6,852,669 | |
| | | | | | | | | | |
| | | |
South Africa (1.5%) | | | | | | | | | | |
EOH Holdings, Ltd. | | ZAR | | | 140,000 | | | | 1,117,818 | |
| | | | | | | | | | |
| | | |
Total South Africa | | | | | | | | | 1,117,818 | |
| | | | | | | | | | |
| | | |
South Korea (5.8%) | | | | | | | | | | |
Sindoh Co., Ltd. | | KRW | | | 35,000 | | | | 2,297,343 | |
Dongsuh Co., Inc. | | KRW | | | 130,000 | | | | 1,992,953 | |
| | | | | | | | | | |
| | | |
Total South Korea | | | | | | | | | 4,290,296 | |
| | | | | | | | | | |
| | | |
Taiwan (4.4%) | | | | | | | | | | |
Taiwan Hon Chuan Enterprise Co., Ltd. | | TWD | | | 650,000 | | | | 1,340,833 | |
Taiwan Semiconductor Manufacturing Co., Ltd. | | TWD | | | 325,000 | | | | 1,277,041 | |
| | |
Annual Report | April 30, 2014 | | 15 |
| | |
Seafarer Overseas Growth and Income Fund | | Portfolio of Investments |
April 30, 2014 |
| | | | | | | | | | |
| | | Currency | | Shares | | | Value | |
Taiwan (continued) | | | | | | | | | | |
Taiwan Semiconductor Manufacturing Co., Ltd. ADR | | USD | | | 30,000 | | | $ | 603,000 | |
| | | | | | | | | | |
| | | |
Total Taiwan | | | | | | | | | 3,220,874 | |
| | | | | | | | | | |
| | | |
Turkey (7.0%) | | | | | | | | | | |
Ulker Biskuvi Sanayi AS | | TRY | | | 250,000 | | | | 1,915,832 | |
Arcelik AS | | TRY | | | 300,000 | | | | 1,854,362 | |
Aselsan Elektronik Sanayi Ve Ticaret AS | | TRY | | | 305,000 | | | | 1,358,068 | |
| | | | | | | | | | |
| | | |
Total Turkey | | | | | | | | | 5,128,262 | |
| | | | | | | | | | |
| | | |
Vietnam (5.5%) | | | | | | | | | | |
Nam Long Investment Corp. | | VND | | | 1,508,990 | | | | 1,402,879 | |
Bao Viet Holdings | | VND | | | 550,000 | | | | 957,429 | |
PetroVietnam Drilling and Well Services JSC | | VND | | | 205,739 | | | | 829,917 | |
Vietnam National Reinsurance Corp. | | VND | | | 325,800 | | | | 455,881 | |
Dry Cell & Storage Battery JSC | | VND | | | 400,000 | | | | 438,278 | |
| | | | | | | | | | |
| | | |
Total Vietnam | | | | | | | | | 4,084,384 | |
| | | | | | | | | | |
| | | |
TOTAL COMMON STOCKS (Cost $59,651,728) | | | | | | | | | 62,624,214 | |
| | | |
PREFERRED STOCKS (7.7%) | | | | | | | | | | |
Brazil (5.4%) | | | | | | | | | | |
Vale SA | | BRL | | | 185,000 | | | | 2,197,018 | |
Banco Bradesco SA, ADR | | USD | | | 120,000 | | | | 1,784,400 | |
| | | | | | | | | | |
| | | |
Total Brazil | | | | | | | | | 3,981,418 | |
| | | | | | | | | | |
| | | |
South Korea (2.3%) | | | | | | | | | | |
Samsung Electronics Co., Ltd. | | KRW | | | 1,700 | | | | 1,709,485 | |
| | | | | | | | | | |
| | | |
Total South Korea | | | | | | | | | 1,709,485 | |
| | | | | | | | | | |
| | | |
TOTAL PREFERRED STOCKS (Cost $5,645,586) | | | | | | | | | 5,690,903 | |
| | |
| 16 | | (855) 732-9220 | seafarerfunds.com |
| | |
Seafarer Overseas Growth and Income Fund | | Portfolio of Investments |
April 30, 2014 |
| | | | | | | | | | | | | | | | |
| | | Currency | | Rate | | | Maturity Date | | Principal Amount | | | Value | |
FOREIGN CURRENCY GOVERNMENT BONDS (3.6%) | | | | | | | | | | | | | | | | |
Brazil (1.3%) | | | | | | | | | | | | | | | | |
Brazilian Government International Bond | | BRL | | | 10.25% | | | 01/10/28 | | | 2,000,000 | | | $ | 959,749 | |
| | | | | | | | | | | | | | | | |
| | | | | |
Total Brazil | | | | | | | | | | | | | | | 959,749 | |
| | | | | | | | | | | | | | | | |
| | | | | |
Indonesia (1.1%) | | | | | | | | | | | | | | | | |
Indonesia Treasury Bond, Series FR70 | | IDR | | | 8.38% | | | 03/15/24 | | | 9,000,000,000 | | | | 798,101 | |
| | | | | | | | | | | | | | | | |
| | | | | |
Total Indonesia | | | | | | | | | | | | | | | 798,101 | |
| | | | | | | | | | | | | | | | |
| | | | | |
Turkey (1.2%) | | | | | | | | | | | | | | | | |
Turkey Government Bond | | TRY | | | 8.80% | | | 09/27/23 | | | 2,000,000 | | | | 924,818 | |
| | | | | | | | | | | | | | | | |
| | | | | |
Total Turkey | | | | | | | | | | | | | | | 924,818 | |
| | | | | | | | | | | | | | | | |
| | | |
TOTAL FOREIGN CURRENCY GOVERNMENT BONDS (Cost $2,391,632) | | | | | | | | | | 2,682,668 | |
| | | | | |
USD CONVERTIBLE BONDS (1.5%) | | | | | | | | | | | | | | | | |
Singapore (1.5%) | | | | | | | | | | | | | | | | |
Olam International, Ltd. | | USD | | | 6.00% | | | 10/15/16 | | $ | 1,000,000 | | | | 1,076,250 | |
| | | | | | | | | | | | | | | | |
| | | | | |
Total Singapore | | | | | | | | | | | | | | | 1,076,250 | |
| | | | | | | | | | | | | | | | |
| | | | | |
TOTAL USD CONVERTIBLE BONDS (Cost $1,042,555) | | | | | | | | | | | | | | | 1,076,250 | |
| | | | | |
TOTAL INVESTMENTS (Cost $68,731,501) (97.7%) | | | | | | | | | | | | | | $ | 72,074,035 | |
| | | | | |
Cash and Other Assets, Less Liabilities (2.3%) | | | | | | | | | | | | | | | 1,730,636 | |
NET ASSETS (100.0%) | | | | | | | | | | | | | | $ | 73,804,671 | |
| | |
| (a) | Non-income producing security. |
Certain securities were fair valued in good faith through consideration of other factors in accordance with procedures established by and under the general supervision of the Board of Trustees (Note 2).
| | |
Annual Report | April 30, 2014 | | 17 |
| | |
Seafarer Overseas Growth and Income Fund | | Portfolio of Investments |
April 30, 2014 |
| | | | |
Currency Abbreviations |
BRL | | - | | Brazil Real |
CLP | | - | | Chile Peso |
HKD | | - | | Hong Kong Dollar |
IDR | | - | | Indonesia Rupiah |
INR | | - | | India Rupee |
JPY | | - | | Japan Yen |
KRW | | - | | South Korea Won |
MXN | | - | | Mexico Peso |
MYR | | - | | Malaysia Ringgit |
PLN | | - | | Poland Zloty |
SGD | | - | | Singapore Dollar |
TRY | | - | | Turkey Lira |
TWD | | - | | Taiwan New Dollar |
USD | | - | | United States Dollar |
VND | | - | | Vietnam Dong |
ZAR | | - | | South Africa Rand |
| | | | |
Common Abbreviations: |
ADR | | - | | American Depositary Receipt. |
AS | | - | | Andonim Sirketi, Joint Stock Company in Turkey. |
Bhd | | - | | Berhad, Public Limited Company in Malaysia. |
JSC | | - | | Joint Stock Company. |
Ltd. | | - | | Limited. |
SA | | - | | Generally designates corporations in various countries, mostly those employing the civil law. This translates literally in all languages mentioned as anonymous company. |
SAB de CV | | - | | A variable capital company. |
Tbk PT | | - | | Terbuka is the Indonesian term for limited liability company. |
Holdings are subject to change.
For Fund compliance purposes, the Fund’s geographical classifications refer to any one or more of the sub-classifications used by one or more widely recognized market indexes or ratings group indexes, and/or as defined by Fund management. This definition may not apply for purposes of this report, which may combine sub-classifications for reporting ease. Geographical regions are shown as a percentage of net assets.
See Accompanying Notes to Financial Statements.
| | |
| 18 | | (855) 732-9220 | seafarerfunds.com |
| | |
Seafarer Overseas Growth and Income Fund | | Statement of Assets and Liabilities |
April 30, 2014 |
| | | | |
ASSETS: | | | | |
| |
Investments, at value | | $ | 72,074,035 | |
Cash | | | 948,828 | |
Foreign currency, at value (Cost $186,991) | | | 188,982 | |
Receivable for investments sold | | | 971,531 | |
Receivable for shares sold | | | 394,373 | |
Interest and dividends receivable | | | 324,043 | |
Prepaid expenses and other assets | | | 15,000 | |
Total Assets | | | 74,916,792 | |
LIABILITIES: | | | | |
Payable for investments purchased | | | 918,866 | |
Foreign capital gains tax | | | 73,114 | |
Administrative fees payable | | | 14,456 | |
Shareholder service plan fees payable | | | 16,449 | |
Payable for shares redeemed | | | 4,602 | |
Investment advisory fees payable | | | 35,660 | |
Trustee fees and expenses payable | | | 492 | |
Audit and tax fees payable | | | 16,489 | |
Accrued expenses and other liabilities | | | 31,993 | |
Total Liabilities | | | 1,112,121 | |
NET ASSETS | | $ | 73,804,671 | |
| | |
NET ASSETS CONSIST OF: | | | | |
Paid-in capital (Note 5) | | $ | 70,566,085 | |
Accumulated net investment loss | | | (233,636) | |
Accumulated net realized gain on investments and foreign currency transactions | | | 200,019 | |
Net unrealized appreciation on investments and translation of assets and liabilities in foreign currencies | | | 3,272,203 | |
NET ASSETS | | $ | 73,804,671 | |
| | |
INVESTMENTS, AT COST | | $ | 68,731,501 | |
PRICING OF SHARES | | | | |
Investor Class: | | | | |
Net Asset Value, offering and redemption price per share | | $ | 11.58 | |
Net Assets | | $ | 27,180,720 | |
Shares of beneficial interest outstanding | | | 2,347,204 | |
Institutional Class: | | | | |
Net Asset Value, offering and redemption price per share | | $ | 11.59 | |
Net Assets | | $ | 46,623,951 | |
Shares of beneficial interest outstanding | | | 4,022,993 | |
See Accompanying Notes to Financial Statements.
| | |
Annual Report | April 30, 2014 | | 19 |
| | |
Seafarer Overseas Growth and Income Fund | | Statement of Operations |
For the Year Ended April 30, 2014 |
| | | | |
INVESTMENT INCOME: | | | | |
Dividends | | $ | 1,446,249 | |
Foreign taxes withheld on dividends | | | (123,162) | |
Interest and other income | | | 70,570 | |
Foreign taxes withheld on interest | | | (5,121) | |
Total investment income | | | 1,388,536 | |
| |
EXPENSES: | | | | |
Investment advisory fees (Note 6) | | | 380,980 | |
Administrative and transfer agency fees | | | 201,230 | |
Co-administrative and shareholder servicing fees | | | | |
Investor Class | | | 8,054 | |
Institutional Class | | | 2,043 | |
Trustee fees and expenses | | | 1,730 | |
Registration/filing fees | | | 36,531 | |
Shareholder service plan fees | | | | |
Investor Class | | | 34,654 | |
Institutional Class | | | 8,779 | |
Legal fees | | | 2,902 | |
Audit fees | | | 17,493 | |
Reports to shareholders and printing fees | | | 6,977 | |
Custody fees | | | 49,860 | |
Miscellaneous | | | 14,453 | |
Total expenses | | | 765,686 | |
Less fees waived/reimbursed by investment advisor (Note 6) | | | | |
Investor Class | | | (95,961) | |
Institutional Class | | | (71,701) | |
Total net expenses | | | 598,024 | |
NET INVESTMENT INCOME: | | | 790,512 | |
Net realized gain on investments | | | 583,856 | |
Net realized loss on foreign currency transactions | | | (111,089) | |
Net change in unrealized appreciation on investments (net of foreign capital gains tax of $13,032) | | | 471,616 | |
Net change in unrealized appreciation on translation of assets and liabilities in foreign currency transactions | | | 2,720 | |
NET REALIZED AND UNREALIZED GAIN ON INVESTMENTS AND FOREIGN CURRENCY TRANSLATIONS | | | 947,103 | |
NET INCREASE IN NET ASSETS RESULTING FROM OPERATIONS | | $ | 1,737,615 | |
| | |
See Accompanying Notes to Financial Statements.
| | |
| 20 | | (855) 732-9220 | seafarerfunds.com |
| | |
Seafarer Overseas Growth and Income Fund | | Statements of Changes in Net Assets |
|
| | | | | | | | |
| | | Year Ended | | | Year Ended | |
| | | April 30, 2014 | | | April 30, 2013 | |
OPERATIONS: | | | | | | | | |
Net investment income | | $ | 790,512 | | | $ | 193,701 | |
Net realized gain on investments and foreign currency transactions | | | 472,767 | | | | 691,065 | |
Net change in unrealized appreciation on investments and foreign currency translations | | | 474,336 | | | | 2,787,668 | |
Net increase in net assets resulting from operations | | | 1,737,615 | | | | 3,672,434 | |
DISTRIBUTIONS TO SHAREHOLDERS (NOTE 3): | | | | | | | | |
From net investment income | | | | | | | | |
Investor Class | | $ | (585,611) | | | $ | (112,900) | |
Institutional Class | | | (308,771) | | | | (49,868) | |
From net realized gains on investments | | | | | | | | |
Investor Class | | | (654,807) | | | | (867) | |
Institutional Class | | | (316,013) | | | | (254) | |
Net decrease in net assets from distributions | | | (1,865,202) | | | | (163,889) | |
BENEFICIAL INTEREST TRANSACTIONS (NOTE 5): | | | | | | | | |
Shares sold | | | | | | | | |
Investor | | $ | 18,789,915 | | | $ | 28,091,620 | |
Institutional | | | 41,977,026 | | | | 9,669,354 | |
Dividends reinvested | | | | | | | | |
Investor | | | 1,190,349 | | | | 110,846 | |
Institutional | | | 611,803 | | | | 46,662 | |
Shares Redeemed, net of redemption fees | | | | | | | | |
Investor | | | (18,143,918) | | | | (5,803,722) | |
Institutional | | | (8,326,537) | | | | (579,535) | |
Net increase in net assets derived from beneficial interest transactions | | | 36,098,638 | | | | 31,535,225 | |
| | |
Net increase in net assets | | $ | 35,971,051 | | | $ | 35,043,770 | |
| | |
NET ASSETS: | | | | | | | | |
Beginning of period | | $ | 37,833,620 | | | $ | 2,789,850 | |
End of period (including accumulated net investment income/(loss) of $(233,636) and $60,497, respectively) | | $ | 73,804,671 | | | $ | 37,833,620 | |
| | |
| | |
Annual Report | April 30, 2014 | | 21 |
| | |
Seafarer Overseas Growth and Income Fund | | Statements of Changes in Net Assets |
|
| | | | | | | | |
| | | Year Ended | | | Year Ended | |
| | | April 30, 2014 | | | April 30, 2013 | |
Other Information: | | | | | | | | |
SHARE TRANSACTIONS: | | | | | | | | |
Investor Class | | | | | | | | |
Sold | | | 1,651,517 | | | | 2,566,567 | |
Distributions reinvested | | | 105,435 | | | | 10,140 | |
Redeemed | | | (1,622,659) | | | | (505,665) | |
Net increase in shares outstanding | | | 134,293 | | | | 2,071,042 | |
| | |
Institutional Class | | | | | | | | |
Sold | | | 3,748,511 | | | | 878,414 | |
Distributions reinvested | | | 54,211 | | | | 4,298 | |
Redeemed | | | (743,914) | | | | (50,808) | |
Net increase in shares outstanding | | | 3,058,808 | | | | 831,904 | |
| | |
See Accompanying Notes to Financial Statements.
| | |
| 22 | | (855) 732-9220 | seafarerfunds.com |
| | |
| Seafarer Overseas Growth and Income Fund | | Financial Highlights |
| For a share outstanding through the periods presented |
| | | | | | | | | | | | |
| Investor Class | | Year Ended
April 30, 2014 | | | Year Ended
April 30, 2013 | | | For the Period
February 15, 2012
(Inception) to
April 30, 2012 | |
NET ASSET VALUE, BEGINNING OF PERIOD | | $ | 11.91 | | | $ | 10.18 | | | $ | 10.00 | |
INCOME FROM OPERATIONS: | | | | | | | | | | | | |
Net investment income(a) | | | 0.19 | | | | 0.10 | | | | 0.05 | |
Net realized and unrealized gain on investments | | | 0.02 | | | | 1.74 | | | | 0.13 | |
Total from investment operations | | | 0.21 | | | | 1.84 | | | | 0.18 | |
| | | |
LESS DISTRIBUTIONS: | | | | | | | | | | | | |
From net investment income | | | (0.26) | | | | (0.11) | | | | – | |
From net realized gains on investments | | | (0.28) | | | | (0.00) | (b) | | | – | |
Total distributions | | | (0.54) | | | | (0.11) | | | | – | |
REDEMPTION FEES ADDED TO PAID IN CAPITAL | | | 0.00 | (c) | | | 0.00 | (c) | | | – | |
NET INCREASE/(DECREASE) IN NET ASSET VALUE | | | (0.33) | | | | 1.73 | | | | 0.18 | |
NET ASSET VALUE, END OF PERIOD | | $ | 11.58 | | | $ | 11.91 | | | $ | 10.18 | |
| | |
| | | |
TOTAL RETURN(d) | | | 1.93% | | | | 18.24% | | | | 1.80% | |
SUPPLEMENTAL DATA: | | | | | | | | | | | | |
Net assets, end of period (in 000s) | | $ | 27,181 | | | $ | 26,348 | | | $ | 1,443 | |
RATIOS TO AVERAGE NET ASSETS: | | | | | | | | | | | | |
Operating expenses excluding reimbursement/waiver | | | 1.78% | | | | 2.82% | | | | 18.96% ( | e) |
Operating expenses including reimbursement/waiver | | | 1.40% | | | | 1.49% | | | | 1.60% ( | e) |
Net investment income including reimbursement/waiver | | | 1.66% | | | | 0.90% | | | | 2.61% ( | e) |
PORTFOLIO TURNOVER RATE(f) | | | 51% | | | | 39% | | | | 5% | |
| (a) | Calculated using the average shares method. |
| (b) | Less than $(0.005) per share. |
| (c) | Less than $0.005 per share. |
| (d) | Total returns are for the period indicated and have not been annualized. Total returns would have been lower had certain expenses not been waived during the period. Returns shown do not reflect the deduction of taxes that a shareholder would pay on Fund distributions or the redemption of Fund shares. |
| (f) | Portfolio turnover rate for periods less than one full year have not been annualized. |
See Accompanying Notes to Financial Statements.
| | |
Annual Report | April 30, 2014 | | 23 |
| | |
Seafarer Overseas Growth and Income Fund | | Financial Highlights |
For a share outstanding through the periods presented |
| | | | | | | | | | | | |
| Institutional Class | | Year Ended
April 30, 2014 | | | Year Ended
April 30, 2013 | | | For the Period
February 15, 2012
(Inception) to
April 30, 2012 | |
NET ASSET VALUE, BEGINNING OF PERIOD | | $ | 11.91 | | | $ | 10.18 | | | $ | 10.00 | |
INCOME FROM OPERATIONS: | | | | | | | | | | | | |
Net investment income(a) | | | 0.21 | | | | 0.14 | | | | 0.04 | |
Net realized and unrealized gain on investments | | | 0.02 | | | | 1.71 | | | | 0.14 | |
Total from investment operations | | | 0.23 | | | | 1.85 | | | | 0.18 | |
| | | |
LESS DISTRIBUTIONS: | | | | | | | | | | | | |
From net investment income | | | (0.27) | | | | (0.12) | | | | – | |
From net realized gains on investments | | | (0.28) | | | | (0.00) | (b) | | | – | |
Total distributions | | | (0.55) | | | | (0.12) | | | | – | |
REDEMPTION FEES ADDED TO PAID IN CAPITAL | | | 0.00 | (c) | | | 0.00 | (c) | | | – | |
NET INCREASE/(DECREASE) IN NET ASSET VALUE | | | (0.32) | | | | 1.73 | | | | 0.18 | |
NET ASSET VALUE, END OF PERIOD | | $ | 11.59 | | | $ | 11.91 | | | $ | 10.18 | |
| | |
| | | |
TOTAL RETURN(d) | | | 2.12% | | | | 18.33% | | | | 1.80% | |
SUPPLEMENTAL DATA: | | | | | | | | | | | | |
Net assets, end of period (in 000s) | | $ | 46,624 | | | $ | 11,486 | | | $ | 1,346 | |
RATIOS TO AVERAGE NET ASSETS: | | | | | | | | | | | | |
Operating expenses excluding reimbursement/waiver | | | 1.61% | | | | 2.88% | | | | 21.65% | (e) |
Operating expenses including reimbursement/waiver | | | 1.25% | | | | 1.35% | | | | 1.45%( | e) |
Net investment income including reimbursement/waiver | | | 1.89% | | | | 1.28% | | | | 2.00%( | e) |
PORTFOLIO TURNOVER RATE(f) | | | 51% | | | | 39% | | | | 5% | |
| (a) | Calculated using the average shares method. |
| (b) | Less than $(0.005) per share. |
| (c) | Less than $0.005 per share. |
| (d) | Total returns are for the period indicated and have not been annualized. Total returns would have been lower had certain expenses not been waived during the period. Returns shown do not reflect the deduction of taxes that a shareholder would pay on Fund distributions or the redemption of Fund shares. |
| (f) | Portfolio turnover rate for periods less than one full year have not been annualized. |
See Accompanying Notes to Financial Statements.
| | |
| 24 | | (855) 732-9220 | seafarerfunds.com |
| | |
Seafarer Overseas Growth and Income Fund | | Notes to Financial Statements |
| | April 30, 2014 |
1. ORGANIZATION
Financial Investors Trust (the “Trust”), a Delaware statutory trust, is an open-end management investment company registered under the Investment Company Act of 1940, as amended (“1940 Act”). As of April 30, 2014, the Trust had 30 registered funds. This annual report describes the Seafarer Overseas Growth and Income Fund (the “Fund”). The Fund seeks to provide long-term capital appreciation along with some current income; it also seeks to mitigate adverse volatility in returns. The Fund offers Investor Class and Institutional Class shares. All classes of shares have identical rights to earnings, assets and voting privileges, except for class specific expenses and exclusive rights to vote on matters affecting only individual classes.
2. SIGNIFICANT ACCOUNTING POLICIES
The accompanying financial statements were prepared in accordance with accounting principles generally accepted in the United States of America (“U.S. GAAP”). The preparation of financial statements in conformity with U.S. GAAP requires management to make certain estimates and assumptions that affect the reported amounts of assets and liabilities and disclosures of contingent assets and liabilities at the date of the financial statements and the reported amounts of revenue and expenses during the period. Actual results could differ from those estimates. The following is a summary of significant accounting policies consistently followed by the Fund in preparation of its financial statements.
Investment Valuation: The Fund generally values its securities based on market prices determined at the close of regular trading on the New York Stock Exchange (“NYSE”), normally 4:00 p.m. Eastern Time, on each day the NYSE is open for trading.
For equity securities and mutual funds that are traded on an exchange, the market price is usually the closing sale or official closing price on that exchange. In the case of equity securities not traded on an exchange, or if such closing prices are not otherwise available, the securities are valued at the mean of the most recent bid and ask prices on such day. Redeemable securities issued by open-end registered investment companies are valued at the investment company’s applicable net asset value, with the exception of exchange-traded open-end investment companies, which are priced as equity securities.
Equity securities that are primarily traded on foreign securities exchanges are valued at the closing values of such securities on their respective foreign exchanges, except when an event occurs subsequent to the close of the foreign exchange but before the close of the NYSE, such that the securities’ value would likely change. In such an event, the fair values of those securities are determined in good faith through consideration of other factors in accordance with procedures established by and under the general supervision of the Board of Trustees (the “Board”). The Fund will use a fair valuation model provided by an independent pricing service, which is intended to reflect fair value when a security’s value or a meaningful portion of the Fund’s portfolio is believed to have been materially affected by a valuation event that has occurred between the close of the exchange or market on which the security is traded and the close of the regular trading day on the NYSE. The Fund’s valuation procedures set forth certain triggers that inform the Fund when to use the fair valuation model.
The market price for debt obligations is generally the price supplied by an independent third-party pricing service approved by the Board which may use a matrix, formula or other objective method that takes into consideration quotations from dealers, market transactions in comparable investments, market indices and yield curves. If vendors are unable to supply a price, or if the price supplied is deemed to be
| | |
Annual Report | April 30, 2014 | | 25 |
| | |
Seafarer Overseas Growth and Income Fund | | Notes to Financial Statements |
April 30, 2014 |
unreliable, the market price may be determined using quotations received from one or more broker–dealers that make a market in the security. Short–term debt obligations that will mature in 60 days or less are valued at amortized cost, unless it is determined that using this method would not reflect an investment’s fair value.
Forward currency exchange contracts have a market value determined by the prevailing foreign currency exchange daily rates and current foreign currency exchange forward rates. The foreign currency exchange forward rates are calculated using an automated system that estimates rates on the basis of the current day foreign currency exchange rates and forward foreign currency exchange rates supplied by a pricing service.
When such prices or quotations are not available, or when the Fair Value Committee appointed by the Board believes that they are unreliable, securities may be priced using fair value procedures approved by the Board.
Certain foreign countries impose a tax on capital gains which is accrued by the Fund based on unrealized appreciation, if any, on affected securities. The tax is paid when the gain is realized.
Fair Value Measurements: The Fund discloses the classification of its fair value measurements following a three-tier hierarchy based on the inputs used to measure fair value. Inputs refer broadly to the assumptions that market participants would use in pricing the asset or liability, including assumptions about risk. Inputs may be observable or unobservable. Observable inputs reflect the assumptions market participants would use in pricing the asset or liability. Such inputs are developed based on market data obtained from sources independent of the reporting entity. Unobservable inputs reflect the reporting entity’s own assumptions about the assumptions market participants would use in pricing the asset or liability, which are developed based on the information available and the reporting entity’s best efforts to interpret such information.
Various inputs are used in determining the value of the Fund’s investments as of the end of the reporting period. When inputs used fall into different levels of the fair value hierarchy, the level in the hierarchy within which the fair value measurement falls is determined based on the lowest level input that is significant to the fair value measurement in its entirety. The designated input levels are not necessarily an indication of the risk or liquidity associated with these investments. These inputs are categorized in the following hierarchy under applicable financial accounting standards:
| Level 1 – | Unadjusted quoted prices in active markets for identical investments, unrestricted assets or liabilities that a Fund has the ability to access at the measurement date; |
| Level 2 – | Quoted prices which are not active, quoted prices for similar assets or liabilities in active markets or inputs other than quoted prices that are observable (either directly or indirectly) for substantially the full term of the asset or liability; and |
| Level 3 – | Significant unobservable prices or inputs (including the Fund’s own assumptions in determining the fair value of investments) where there is little or no market activity for the asset or liability at the measurement date. |
| | |
| 26 | | (855) 732-9220 | seafarerfunds.com |
| | |
Seafarer Overseas Growth and Income Fund | | Notes to Financial Statements |
April 30, 2014 |
The following is a summary of each input used to value the Fund as of April 30, 2014:
| | | | | | | | | | | | | | | | |
| | | | | | Level 2 - | | | Level 3 - | | | | |
| | | | | | Other Significant | | | Significant | | | | |
| Investments in Securities at | | Level 1 - | | | Observable | | | Unobservable | | | | |
| Value(a) | | Quoted Prices | | | Inputs | | | Inputs | | | Total | |
Common Stocks | | | | | | | | | | | | | | | | |
Brazil | | $ | 5,490,571 | | | $ | – | | | $ | – | | | $ | 5,490,571 | |
Chile | | | 1,572,839 | | | | – | | | | – | | | | 1,572,839 | |
China / Hong Kong | | | – | | | | 9,830,469 | | | | – | | | | 9,830,469 | |
India | | | 2,844,473 | | | | 2,185,110 | | | | – | | | | 5,029,583 | |
Indonesia | | | – | | | | 1,932,877 | | | | – | | | | 1,932,877 | |
Japan | | | – | | | | 3,557,683 | | | | – | | | | 3,557,683 | |
Malaysia | | | 1,475,470 | | | | 1,210,513 | | | | – | | | | 2,685,983 | |
Mexico | | | 3,545,140 | | | | – | | | | – | | | | 3,545,140 | |
Poland | | | – | | | | 4,284,766 | | | | – | | | | 4,284,766 | |
Singapore | | | – | | | | 6,852,669 | | | | – | | | | 6,852,669 | |
South Africa | | | 1,117,818 | | | | – | | | | – | | | | 1,117,818 | |
South Korea | | | – | | | | 4,290,296 | | | | – | | | | 4,290,296 | |
Taiwan | | | 603,000 | | | | 2,617,874 | | | | – | | | | 3,220,874 | |
Turkey | | | – | | | | 5,128,262 | | | | – | | | | 5,128,262 | |
Vietnam | | | 4,084,384 | | | | – | | | | – | | | | 4,084,384 | |
Preferred Stocks | | | 3,981,418 | | | | 1,709,485 | | | | – | | | | 5,690,903 | |
Foreign Currency | | | | | | | | | | | | | | | | |
Government Bonds | | | – | | | | 2,682,668 | | | | – | | | | 2,682,668 | |
USD Convertible Bonds | | | – | | | | 1,076,250 | | | | – | | | | 1,076,250 | |
Total | | $ | 24,715,113 | | | $ | 47,358,922 | | | $ | – | | | $ | 72,074,035 | |
| | |
| (a) | For detailed descriptions of countries, see the accompanying Portfolio of Investments. |
The Fund recognizes transfers between levels as of the end of the period. For the year ended April 30, 2014, the Fund did not have any securities that used significant unobservable inputs (Level 3) in determining fair value.
Security amounts the Fund transferred between Levels 1 and 2 at April 30, 2014 were as follows:
| | | | | | | | | | | | | | | | |
| | | Level 1 - | | | Level 2 - | |
| | | Quoted Prices | | | Other Significant Observable Inputs | |
| | | Transfers In | | | Transfers (Out) | | | Transfers In | | | Transfers (Out) | |
Common Stocks | | $ | – | | | $ | (3,507,856 | ) | | | $ 3,507,856 | | | $ | – | |
Total | | $ | – | | | $ | (3,507,856 | ) | | | $ 3,507,856 | | | $ | – | |
| | |
The above transfers were due to the Fund utilizing a fair value evaluation service with respect to international securities with an earlier market closing than the Fund’s net asset value computation cutoff. When events trigger the use of the fair value evaluation service on a reporting date, it results in certain securities transferring from a Level 1 to a Level 2.
| | |
Annual Report | April 30, 2014 | | 27 |
| | |
Seafarer Overseas Growth and Income Fund | | Notes to Financial Statements |
April 30, 2014 |
Investment Transactions and Investment Income: Investment transactions are accounted for on the date the investments are purchased or sold (trade date). Realized gains and losses from investment transactions are reported on an identified cost basis. Interest income, which includes accretion of discounts and amortization of premiums, is accrued and recorded as earned. Dividend income is recognized on the ex-dividend date or for certain foreign securities, as soon as information is available to the Fund. All of the realized and unrealized gains and losses and net investment income are allocated daily to each class in proportion to its average daily net assets.
Foreign Securities: The Fund may directly purchase securities of foreign issuers. Investing in securities of foreign issuers involves special risks not typically associated with investing in securities of U.S. issuers. The risks include possible reevaluation of currencies, the inability to repatriate foreign currency, less complete financial information about companies and possible future adverse political and economic developments. Moreover, securities of many foreign issuers and their markets may be less liquid and their prices more volatile than those of securities of comparable U.S. issuers.
Foreign Currency Translation: The books and records of the Fund are maintained in U.S. dollars. Investment valuations and other assets and liabilities initially expressed in foreign currencies are converted each business day into U.S. dollars based upon current exchange rates. Prevailing foreign exchange rates may generally be obtained at the close of the NYSE (normally, 4:00 p.m. Eastern time). The portion of realized and unrealized gains or losses on investments due to fluctuations in foreign currency exchange rates is not separately disclosed and is included in realized and unrealized gains or losses on investments, when applicable.
Foreign Currency Spot Contracts: The Fund may enter into foreign currency spot contracts to facilitate transactions in foreign securities or to convert foreign currency receipts into U.S. dollars. A foreign currency spot contract is an agreement between two parties to buy and sell currencies at the current market rate, for settlement generally within two business days. The U.S. dollar value of the contracts is determined using current currency exchange rates supplied by a pricing service. The contract is marked-to-market daily for settlements beyond one day and any change in market value is recorded as an unrealized gain or loss. When the contract is closed, the Fund records a realized gain or loss equal to the difference between the value on the open and close date. Losses may arise from changes in the value of the foreign currency, or if the counterparties do not perform under the contract’s terms. The maximum potential loss from such contracts is the aggregate face value in U.S. dollars at the time the contract was opened.
Trust Expenses: Some expenses of the Trust can be directly attributed to the Fund. Expenses which cannot be directly attributed to the Fund are apportioned among all funds in the Trust based on average net assets of each fund.
Fund and Class Expenses: Expenses that are specific to the Fund or class of shares of the Fund are charged directly to the Fund or share class. All expenses of the Fund, other than class specific expenses, are allocated daily to each class in proportion to its average daily net assets. Fees provided under the shareholder service plans for a particular class of the Fund are charged to the operations of such class.
Federal Income Taxes: The Fund complies with the requirements under Subchapter M of the Internal Revenue Code of 1986, as amended, applicable to regulated investment companies and intends to distribute substantially all of its net taxable income and net capital gains, if any, each year so that it will not be subject to excise tax on undistributed income and gains. The Fund is not subject to income taxes to the extent such distributions are made.
| | |
| 28 | | (855) 732-9220 | seafarerfunds.com |
| | |
Seafarer Overseas Growth and Income Fund | | Notes to Financial Statements |
April 30, 2014 |
As of and during the year ended April 30, 2014, the Fund did not have a liability for any unrecognized tax benefits. The Fund files U.S. federal, state, and local tax returns as required. The Fund’s tax returns are subject to examination by the relevant tax authorities until expiration of the applicable statute of limitations, which is generally three years after the filing of the tax return for federal purposes and four years for most state returns. Tax returns for open years have incorporated no uncertain tax positions that require a provision for income taxes.
Distributions to Shareholders: The Fund normally pays dividends from net investment income, if any, on a semi-annual basis. The Fund normally distributes capital gains, if any, on an annual basis. Income dividend distributions are derived from interest and other income the Fund receives from its investments, including short term capital gains. Long term capital gain distributions are derived from gains realized when the Fund sells a security it has owned for more than one year. The Fund may make additional distributions and dividends at other times if the adviser believes doing so may be necessary for the Fund to avoid or reduce taxes.
3. TAX BASIS INFORMATION
Reclassifications: As of April 30, 2014, permanent differences in book and tax accounting were reclassified. These differences had no effect on net assets and were primarily attributed to redemption distributions, PFICs and foreign currency. The reclassifications were as follows:
| | | | | | | | | | | | |
| | | | | | | | | Accumulated Net | |
| | | | | | Accumulated Net | | | Realized Gain on | |
| | | Paid-in Capital | | | Investment Loss | | | Investments | |
Seafarer Overseas Growth and Income Fund | | $ | 197,663 | | | $ | (190,263 | ) | | $ | (7,400 | ) |
Tax Basis of Investments: As of April 30, 2014, the aggregate cost of investments, gross unrealized appreciation/ (depreciation) and net unrealized appreciation for Federal tax purposes were as follows:
| | | | | | | | | | | | | | | | | | | | |
| | | | | | | | | | | | Net | | | | |
| | | | | | Gross | | | Gross | | | Depreciation | | | | |
| | | Cost of | | | Unrealized | | | Unrealized | | | on Foreign | | | Net Unrealized | |
| | | Investments | | | Appreciation | | | Depreciation | | | Currencies | | | Appreciation | |
Seafarer Overseas Growth and Income Fund | | $ | 69,280,319 | | | $ | 5,134,674 | | | $ | (2,340,958 | ) | | $ | (70,331 | ) | | $ | 2,723,385 | |
Components of Earnings: As of April 30, 2014, components of distributable earnings were as follows:
| | | | |
Undistributed ordinary income | | $ | 144,172 | |
Accumulated capital gains | | | 371,029 | |
Net unrealized appreciation on investments | | | 2,723,385 | |
Total distributable earnings | | $ | 3,238,586 | |
| | |
| | |
Annual Report | April 30, 2014 | | 29 |
| | |
Seafarer Overseas Growth and Income Fund | | Notes to Financial Statements |
April 30, 2014 |
Capital Losses: As of April 30, 2014, the Fund has no accumulative capital loss carryforwards.
Tax Basis of Distributions to Shareholders: The character of distributions made during the year from net investment income or net realized gains may differ from its ultimate characterization for federal income tax purposes. Also, due to the timing of dividend distributions, the fiscal year in which amounts are distributed may differ from the fiscal year in which the income or realized gain is recorded by the Fund.
The tax character of distributions paid by the Fund for the fiscal year ended April 30, 2014, were as follows:
| | | | | | | | |
| | | | | | Long-Term Capital | |
| | | Ordinary Income | | | Gain | |
Seafarer Overseas Growth and Income Fund | | $ | 1,543,197 | | | $ | 322,005 | |
|
The tax character of distributions paid by the Fund for the fiscal year ended April 30, 2013, were as follows: | |
| | |
| | | | | | Long-Term Capital | |
| | | Ordinary Income | | | Gain | |
Seafarer Overseas Growth and Income Fund | | $ | 163,889 | | | $ | – | |
4. SECURITIES TRANSACTIONS
The cost of purchases and proceeds from sales of securities excluding short term securities during the year ended April 30, 2014, were as follows:
| | | | | | |
| | | Purchases of | | | Proceeds From Sales |
| | | Securities | | | of Securities |
Seafarer Overseas Growth and Income Fund | | | $ 56,471,972 | | | $ 22,689,192 |
5. SHARES OF BENEFICIAL INTEREST
The capitalization of the Trust consists of an unlimited number of shares of beneficial interest with no par value per share. Holders of the shares of the Fund of the Trust have one vote for each share held and a proportionate fraction of a vote for each fractional share. All shares issued and outstanding are fully paid and are non-assessable, transferable and redeemable at the option of the shareholder. Shares have no pre-emptive rights.
| | |
| 30 | | (855) 732-9220 | seafarerfunds.com |
| | |
Seafarer Overseas Growth and Income Fund | | Notes to Financial Statements |
April 30, 2014 |
Shares redeemed within 90 days of purchase may incur a 2% short-term redemption fee deducted from the redemption amount. The redemption fee is reflected in the “Shares redeemed, net of redemption fees” in the Statements of Changes in Net Assets. During the year ended April 30, 2014 and the year ended April 30, 2013, the Fund retained the following redemption fees:
| | | | |
| | | For the Year Ended | | For the Year Ended |
| Fund | | April 30, 2014 | | April 30, 2013 |
Seafarer Overseas Growth and Income Fund - Investor | | $ 9,035 | | $ 5,490 |
Seafarer Overseas Growth and Income Fund - Institutional | | $ 3,790 | | $ 928 |
6. MANAGEMENT AND RELATED-PARTY TRANSACTIONS
Seafarer Capital Partners, LLC (the “Adviser”), subject to the authority of the Board, is responsible for the overall management and administration of the Fund’s business affairs. The Adviser manages the investments of the Fund in accordance with the Fund’s investment objective, policies, limitations and investment guidelines established jointly by the Adviser and the Trustees. Pursuant to the Advisory Agreement, (the “Advisory Agreement”), the Fund pays the Adviser an annual management fee of 0.85%, based on the Fund’s average daily net assets. The management fee is paid on a monthly basis. Effective January 15, 2013, the Adviser voluntarily agreed to waive a portion of its management fee payable by the Fund so that such fee was reduced to 0.75% of the Fund’s average daily net assets. This voluntary arrangement expired on August 31, 2013. Effective September 1, 2014, the Adviser has agreed to reduce its management fee to 0.75% annually, based on the Fund’s average daily net assets.
From the inception of the Fund through August 31, 2013, the Adviser contractually agreed to limit certain Fund expenses (exclusive of acquired fund fees and expenses, brokerage expenses, interest expenses, taxes and extraordinary expenses) to 1.60% and 1.45% of the Fund’s average daily net assets in the Investor and Institutional share classes, respectively. Effective January 15, 2013, the Adviser voluntarily agreed to further limit such Fund expenses to 1.40% and 1.25% of the Fund’s average daily net assets in the Investor and Institutional share classes, respectively. Effective September 1, 2013, the Adviser contractually agreed to limit certain Fund expenses (exclusive of brokerage expenses, interest expenses, taxes and extraordinary expenses) to 1.40% and 1.25% of the Fund’s average daily net assets in the Investor and Institutional share classes, respectively, through August 31, 2014. Effective September 1, 2014, the Adviser has contractually agreed to limit such Fund expenses to 1.25% and 1.05% of the Fund’s average daily net assets in the Investor and Institutional share classes, respectively, through August 31, 2015, at which point this agreement may be extended further. The Fund may have to repay some of these waivers and reimbursements to the Adviser in the following three years. Pursuant to the expense limitation agreement between the Adviser and the Trust, the Fund will reimburse the Adviser for any contractual fee waivers and expense reimbursements made by the Adviser, provided that any such reimbursements made by the Fund to the Adviser will not cause the Fund’s expense limitation to exceed expense limitations in existence at the time the expense was incurred, or at the time of the reimbursement, whichever is lower, and the reimbursement is made within three years after the end of the fiscal year in which fees or expenses were incurred.
| | |
Annual Report | April 30, 2014 | | 31 |
| | |
Seafarer Overseas Growth and Income Fund | | Notes to Financial Statements |
April 30, 2014 |
For the year ended April 30, 2014, the fee waivers and/or reimbursements were as follows:
| | | | | | | | |
| | | Fees Waived/ | | | | |
| | | Reimbursed By | | | | |
| Fund | | Adviser | | | Total | |
Seafarer Overseas Growth and Income Fund | | | | | | | | |
Investor Class | | $ | 95,961 | | | $ | 95,961 | |
Institutional Class | | | 71,701 | | | | 71,701 | |
As of April 30, 2014, the balances of recoupable expenses for each class were as follows:
| | | | | | | | | | | | | | | | |
| | | Expires | | | Expires | | | Expires | | | | |
| Fund | | 2015 | | | 2016 | | | 2017 | | | Total | |
Seafarer Overseas Growth and Income Fund | | | | | | | | | | | | | | | | |
Investor Class | | $ | 22,136 | | | $ | 177,710 | | | $ | 89,143 | | | $ | 288,989 | |
Institutional Class | | | 51,869 | | | | 78,354 | | | | 66,379 | | | | 196,602 | |
Fund Administrator Fees and Expenses
ALPS Fund Services, Inc. (“ALPS” and the “Administrator”) (an affiliate of ALPS Distributors, Inc.) provides administrative, fund accounting and other services to the Fund under the Administration, Bookkeeping and Pricing Services Agreement with the Trust. Under this Agreement, ALPS is paid fees by the Fund, accrued on a daily basis and paid on a monthly basis following the end of the month, based on the greater of (a) an annual total fee of $143,000 (subject to an annual cost of living increase), or (b) the following fee schedule:
| | |
| Average Total Net Assets | | Contractual Fee |
Between $0-$500M | | 0.05% |
$500M-$1B | | 0.03% |
Above $1B | | 0.02% |
The Administrator is also reimbursed by the Fund for certain out-of-pocket expenses.
Administrative and Shareholder Services
From the inception of the Fund through August 31, 2013, the Adviser provided administrative and shareholder services to the Fund under the Co-Administration and Shareholder Services Agreement with the Trust. Under this Agreement, the Adviser was entitled to fees, accrued on a daily basis and paid on a monthly basis following the end of the month, of 0.10% of the average daily net assets of the Investor Class and 0.05% of the average daily net assets of the Institutional Class, and was reimbursed for certain out-of-pocket expenses. Effective September 1, 2013, the Co-Administration and Shareholder Services Agreement with the Trust was terminated with the approval of the Board of Trustees. The Adviser continues to provide the administrative and shareholder services to the Fund that were described under the Agreement, but the Adviser does not receive an Administrative and Shareholder Servicing Fee for doing so.
| | |
| 32 | | (855) 732-9220 | seafarerfunds.com |
| | |
Seafarer Overseas Growth and Income Fund | | Notes to Financial Statements |
April 30, 2014 |
Transfer Agent
ALPS serves as transfer, dividend paying and shareholder servicing agent for the Fund (“Transfer Agent”). ALPS is compensated based upon a $25,000 annual base fee for the Fund, and annually $9 per direct open account and $7 per open account through NSCC. The Transfer Agent is also reimbursed by the Fund for certain out-of-pocket expenses.
Compliance Services
ALPS provides services that assist the Trust’s Chief Compliance Officer in monitoring and testing the policies and procedures of the Trust in conjunction with requirements under Rule 38a-1 under the 1940 Act under the Chief Compliance Officer Services Agreement with the Trust. Under this Agreement, the Adviser pays ALPS an annual base fee of $30,000 and reimburses ALPS for certain out-of-pocket expenses.
Principal Financial Officer
ALPS provides principal financial officer services to the Fund under the Principal Financial Officer Services Agreement with the Trust. Under this Agreement, the Adviser pays ALPS an annual base fee of $10,000 and reimburses ALPS for certain out-of-pocket expenses.
Distributor
ALPS Distributors, Inc. (“ADI” or the “Distributor”) (an affiliate of ALPS) acts as the distributor of the Fund’s shares pursuant to the Distribution Agreement with the Trust. Under this agreement, the Adviser pays ADI an annual base fee of $12,000 and reimburses ADI for certain out-of-pocket expenses. Shares are sold on a continuous basis by ADI as agent for the Fund, and ADI has agreed to use its best efforts to solicit orders for the sale of the Fund’s shares, although it is not obliged to sell any particular amount of shares. ADI is registered as a broker-dealer with the Securities and Exchange Commission.
Shareholder Service Plan for Investor Class and Institutional Class Shares
The Fund has adopted a shareholder service plan (a “Service Plan”) for each of its share classes. Under the Service Plan, the Fund is authorized to enter into shareholder service agreements with investment advisors, financial institutions and other service providers (“Participating Organizations”) to maintain and provide certain administrative and servicing functions in relation to the accounts of shareholders. The Service Plan will cause the Fund to pay an aggregate fee, not to exceed on an annual basis 0.15% and 0.05% of the average daily net asset value of the Investor and Institutional share classes, respectively. Such payment will be made on assets attributable to or held in the name of a Participating Organization, on behalf of its clients as compensation for providing service activities pursuant to an agreement with a Participating Organization. Any amount of such payment not paid during the Fund’s fiscal year for such service activities shall be reimbursed to the Fund as soon as practicable after the end of the fiscal year.
7. INDEMNIFICATIONS
Under the Trust’s organizational documents, its officers and Trustees are indemnified against certain liability arising out of the performance of their duties to the Trust. Additionally, in the normal course of business, the Trust enters into contracts with service providers that may contain general indemnification clauses, which may permit indemnification to the extent permissible under the applicable law. The Trust’s maximum exposure under these arrangements is unknown, as this would involve future claims that may be made against the Trust that have not yet occurred.
| | |
Annual Report | April 30, 2014 | | 33 |
| | |
Seafarer Overseas Growth and Income Fund | | Notes to Financial Statements |
April 30, 2014 |
8. NEW ACCOUNTING PRONOUNCEMENTS
In June 2013, the Financial Accounting Standards Board (the “FASB”) issued Accounting Standards Update (“ASU”) No. 2013-08, Financial Services-Investment Companies (Topic 946): Amendments to the Scope, Measurement, and Disclosure Requirements. The FASB standard identifies characteristics a company must assess to determine whether it is considered an investment company for financial reporting purposes. This ASU is effective for fiscal years beginning after December 15, 2013. The Fund believes the adoption of this ASU will not have a material impact on its financial statements.
| | |
| 34 | | (855) 732-9220 | seafarerfunds.com |
| | |
| | Report of Independent Registered |
| Seafarer Overseas Growth and Income Fund | | Public Accounting Firm |
To the Shareholders and Board of Trustees of Financial Investors Trust:
We have audited the accompanying statement of assets and liabilities, including the portfolio of investments, of Seafarer Overseas Growth and Income Fund (the “Fund”), one of the portfolios constituting Financial Investors Trust, as of April 30, 2014, the related statement of operations for the year then ended, the statements of changes in net assets for each of the two years in the period then ended, and the financial highlights for each of the two years in the period then ended and for the period from February 15, 2012 (inception) to April 30, 2012. These financial statements and financial highlights are the responsibility of the Fund’s management. Our responsibility is to express an opinion on these financial statements and financial highlights based on our audits.
We conducted our audits in accordance with the standards of the Public Company Accounting Oversight Board (United States). Those standards require that we plan and perform the audit to obtain reasonable assurance about whether the financial statements and financial highlights are free of material misstatement. The Fund is not required to have, nor were we engaged to perform, an audit of its internal control over financial reporting. Our audits included consideration of internal control over financial reporting as a basis for designing audit procedures that are appropriate in the circumstances, but not for the purpose of expressing an opinion on the effectiveness of the Fund’s internal control over financial reporting. Accordingly, we express no such opinion. An audit also includes examining, on a test basis, evidence supporting the amounts and disclosures in the financial statements, assessing the accounting principles used and significant estimates made by management, as well as evaluating the overall financial statement presentation. Our procedures included confirmation of securities owned as of April 30, 2014, by correspondence with the custodian and brokers; where replies were not received from brokers, we performed other auditing procedures. We believe that our audits provide a reasonable basis for our opinion.
In our opinion, the financial statements and financial highlights referred to above present fairly, in all material respects, the financial position of Seafarer Overseas Growth and Income Fund of Financial Investors Trust as of April 30, 2014, the results of its operations for the year then ended, and the changes in its net assets for each of the two years in the period then ended, and the financial highlights for each of the two years in the period then ended and for the period from February 15, 2012 (inception) to April 30, 2012, in conformity with accounting principles generally accepted in the United States of America.
DELOITTE & TOUCHE LLP
Denver, Colorado
June 26, 2014
| | |
Annual Report | April 30, 2014 | | 35 |
| | |
| | Disclosure Regarding Approval |
| Seafarer Overseas Growth and Income Fund | | of Fund Advisory Agreement |
| | April 30, 2014 (Unaudited) |
On December 10, 2013, the Trustees met in person to discuss, among other things, the approval of the investment advisory agreement between the Trust and Seafarer Capital Partners, LLC (“Seafarer”) (the “Investment Advisory Agreement”), in accordance with Section 15(c) of the 1940 Act. The Independent Trustees met with independent legal counsel during executive session and discussed the Investment Advisory Agreement and other related materials.
In renewing and approving the Investment Advisory Agreement with Seafarer, the Trustees, including the Independent Trustees, considered the following factors with respect to the Seafarer Overseas Growth and Income Fund (the “Seafarer Fund” or the “Fund”):
Investment Advisory Fee Rate: The Trustees reviewed and considered the contractual annual advisory fee to be paid by the Trust, on behalf of the Seafarer Fund, to Seafarer of 0.85% of the Seafarer Fund’s daily average net assets, in light of the extent and quality of the advisory services to be provided by Seafarer to the Seafarer Fund. The Trustees noted that Seafarer had voluntarily lowered the total net expense ratio for each share class of the Seafarer Fund by revising its agreement to waive fees and/or reimburse expenses, and had also cancelled its Co-Administration and Shareholder Services Agreement in light of the growth of the Fund.
The Trustees considered the information they received comparing the Seafarer Fund’s contractual annual advisory fee and overall net expenses with those of funds in the relevant expense peer group provided by an independent provider of investment company data.
Based on such information, the Trustees determined that the contractual annual advisory fee of 0.85% of the daily average net assets of the Seafarer Fund and the total net expense ratio, after fee waivers and/or expense reimbursements, of 1.40% and 1.25% for the Investor Class and Institutional Class, respectively, of the Seafarer Fund, compared favorably to the respective peer group median, and were reasonable in light of the generally favorable performance of the Fund compared to its peer universe.
Nature, Extent and Quality of the Services under the Advisory Agreement: The Trustees received and considered information regarding the nature, extent and quality of services provided to the Seafarer Fund under the Investment Advisory Agreement. The Trustees reviewed certain background materials supplied by Seafarer in its presentation, including its Form ADV, financial statements and Compliance Policies.
The Trustees reviewed and considered Seafarer’s investment advisory personnel, its history as an asset manager, its performance and the amount of assets currently under management by Seafarer. The Trustees also reviewed the research and decision-making processes utilized by Seafarer, including the methods adopted to seek to achieve compliance with the investment objectives, policies and restrictions of the Seafarer Fund.
The Trustees considered the background and experience of Seafarer’s management in connection with the Seafarer Fund including reviewing the qualifications, backgrounds and responsibilities of the management team primarily responsible for the day-to-day portfolio management of the Seafarer Fund and the extent of the resources devoted to research and analysis of actual and potential investments.
The Trustees also reviewed the accompanying Compliance-related materials and further noted that they have received reports on these services and Compliance issues at each regular Board meeting throughout the year related to the services rendered by Seafarer with respect to the Seafarer Fund.
| | |
| 36 | | (855) 732-9220 | seafarerfunds.com |
| | |
Seafarer Overseas Growth and Income Fund | | Disclosure Regarding Approval of Fund Advisory Agreement |
April 30, 2014 (Unaudited) |
Performance: The Trustees reviewed performance information for the Seafarer Fund for the three-month, 1-year and since inception periods ended September 30, 2013. That review included a comparison of the Seafarer Fund’s performance to the performance of a universe of comparable funds selected by an independent provider of investment company data. The Trustees noted the generally favorable performance of the Seafarer Fund compared to funds identified by an independent provider of investment company data.
The Adviser’s Profitability: The Trustees received a profitability analysis prepared by Seafarer based on the fees payable under the Advisory Agreement. Although the Fund is not yet profitable to Seafarer, the Trustees considered the statements made by Seafarer regarding its ongoing commitment to the Fund. The Board then reviewed Seafarer’s financial statements in order to analyze the financial condition and stability and profitability of Seafarer.
Economies of Scale: The Trustees considered whether economies of scale in the provision of services to the Seafarer Fund will be passed along to the shareholders under the Investment Advisory Agreement. The Board noted that Seafarer had reduced the net total expenses applicable to the Seafarer Fund through its agreement to waive fees and/or reimburse expenses, and cancelled its Co-Administration and Shareholder Services Agreement pursuant to which it received a separate fee from the Fund.
Other Benefits to the Adviser: The Trustees reviewed and considered any other benefits derived or to be derived by Seafarer from its relationship with the Seafarer Fund, including soft dollar arrangements.
The Board summarized its deliberations with respect to the Investment Advisory Agreement with Seafarer. In selecting Seafarer and approving the Investment Advisory Agreement and fees under such agreement, the Trustees concluded that no single factor reviewed by the Trustees was identified by the Trustees to be determinative as the principal factor in whether to approve the investment advisory agreement. Further, the Independent Trustees were advised by separate independent legal counsel throughout the process. The Trustees, including all of the Independent Trustees, concluded that:
| | • | | the investment advisory fees received by Seafarer with respect to the Seafarer Fund, and the net total expenses after Seafarer’s agreement to waive fees and/or reimburse expenses, were generally below that of the median of its peer group; |
| | • | | the nature, extent and quality of services rendered by Seafarer under the Investment Advisory Agreement were adequate; |
| | • | | the performance of the Seafarer Fund was generally favorable compared with the performance of the funds in the applicable peer universe provided by an independent provider of investment company data; |
| | • | | the profit, if any, anticipated to be realized by Seafarer in connection with the operation of the Seafarer Fund is fair to the Trust, bearing in mind Seafarer’s commitment to the Seafarer Fund despite any losses; and |
| | • | | the benefits of any material economies of scale or other benefits accruing to Seafarer in connection with its relationship with the Seafarer Fund had been substantially passed through to shareholders. |
Based on the Trustees’ deliberations and their evaluation of the information described above, the Trustees, including all of the Independent Trustees, concluded that Seafarer’s compensation for investment advisory services is consistent with the best interests of the Seafarer Fund and its shareholders.
| | |
Annual Report | April 30, 2014 | | 37 |
| | |
| Seafarer Overseas Growth and Income Fund | | Additional Information |
| | April 30, 2014 (Unaudited) |
1. FUND HOLDINGS
The Fund files its complete schedule of portfolio holdings with the Securities and Exchange Commission (the “SEC”) for the first and third quarters of each fiscal year on Form N-Q within 60 days after the end of the period. Copies of the Fund’s Form N-Q are available without charge on the SEC website at http://www.sec.gov. You may also review and copy the Form N-Q at the SEC’s Public Reference Room in Washington, D.C. For more information about the operation of the Public Reference Room, please call the SEC at 1-800-SEC-0330.
2. FUND PROXY VOTING POLICIES, PROCEDURES AND SUMMARIES
The Fund’s policies and procedures used in determining how to vote proxies and information regarding how the Fund voted proxies relating to portfolio securities during the most recent prior 12-month period ending June 30 are available without charge, (1) upon request, by calling toll-free (855) 732-9220 and (2) on the SEC’s website at http://www.sec.gov.
3. TAX DESIGNATIONS
The Fund designates the following as a percentage of taxable ordinary income distributions, or up to the maximum amount allowable, for the calendar year ended December 31, 2013:
| | |
| Dividends Received Deduction | | Qualified Dividend Income |
| 0.00% | | 33.83% |
The Fund designates foreign taxes paid in the amount of $121,921 and foreign source income in the amount of $1,333,489 for federal income tax purposes for the year ended April 30, 2014.
Pursuant to section 852(b)(3), the Fund designates $438,351 as a long-term capital gain distribution. This amount includes $116,346 of earnings and profits distributed to shareholders on redemptions.
In early 2014, if applicable, shareholders of record received this information for the distributions paid to them by the Fund during the calendar year 2013 via Form 1099. The Fund will notify shareholders in early 2015 of amounts paid to them by the Fund, if any, during the calendar year 2014.
Please consult a tax advisor if you have questions about federal or state income tax laws, or how to prepare your tax returns.
| | |
| 38 | | (855) 732-9220 | seafarerfunds.com |
| | |
| Seafarer Overseas Growth and Income Fund | | Trustees and Officers |
| | April 30, 2014 (Unaudited) |
Additional information regarding the Fund’s trustees is included in the Statement of Additional Information, which can be obtained without charge by calling 855-732-9220.
INDEPENDENT TRUSTEES
| | | | | | | | | | |
Name, Address* & Year of Birth | | Position(s) Held with Fund | | Term of Office and Length of Time Served** | | Principal Occupation(s) During Past 5 Years*** | | Number of Funds in Fund Complex Overseen by Trustee**** | | Other Directorships Held by Trustee |
Mary K. Anstine, 1940 | | Trustee | | Ms. Anstine was elected at a special meeting of shareholders held on March 21, 1997 and re-elected at a special meeting of shareholders held on August 7, 2009. | | Ms. Anstine was President/Chief Executive Officer of HealthONE Alliance, Denver, Colorado, and former Executive Vice President of First Interstate Bank of Denver. Ms. Anstine is also Trustee/Director of AV Hunter Trust and Colorado Uplift Board. Ms. Anstine was formerly a Director of the Trust Bank of Colorado (later purchased and now known as Northern Trust Bank), HealthONE and Denver Area Council of the Boy Scouts of America, and a member of the American Bankers Association Trust Executive Committee. | | 30 | | Ms. Anstine is a Trustee of ALPS ETF Trust (21 funds); ALPS Variable Investment Trust (8 funds); Reaves Utility Income Fund (1 fund); and Westcore Trust (12 funds). |
| * | All communications to Trustees and Officers may be directed to Financial Investors Trust c/o 1290 Broadway, Suite 1100, Denver, CO 80203. |
| ** | This is the period for which the Trustee or Officer began serving the Trust. Each Trustee and/or Officer serves an indefinite term, until his successor is elected. |
| *** | Except as otherwise indicated, each individual has held the office shown or other offices in the same company for the last five years. |
| **** | The Fund Complex includes all series of the Trust (currently 30) and any other investment companies for which any Trustee serves as Trustee for and which Seafarer Capital Partners, LLC provides investment advisory services (currently none). |
| | |
Annual Report | April 30, 2014 | | 39 |
| | |
Seafarer Overseas Growth and Income Fund | | Trustees and Officers |
April 30, 2014 (Unaudited) |
INDEPENDENT TRUSTEES
| | | | | | | | | | |
Name, Address* & Year of Birth | | Position(s) Held with Fund | | Term of Office and Length of Time Served** | | Principal Occupation(s) During Past 5 Years*** | | Number of Funds in Fund Complex Overseen by Trustee**** | | Other Directorships Held by Trustee |
John R. Moran, Jr., 1930 | | Trustee | | Mr. Moran was elected at a special meeting of shareholders held on March 21, 1997 and re-elected at a special meeting of shareholders held on August 7, 2009. | | Mr. Moran is formerly President and CEO of The Colorado Trust, a private foundation serving the health and hospital community in the state of Colorado. Currently, Mr. Moran is a member of the Treasurer’s Investment Advisory Committee for the University of Colorado. | | 30 | | None. |
Jeremy W. Deems, 1976 | | Trustee | | Mr. Deems was appointed as a Trustee at the March 11, 2008 meeting of the Board of Trustees and elected at a special meeting of shareholders held on August 7, 2009. | | Mr. Deems is the Co-Founder, Chief Operations Officer and Chief Financial Officer of Green Alpha Advisors, LLC. Mr. Deems is Co-Portfolio Manager of the Shelton Green Alpha Fund. Prior to joining Green Alpha Advisors, Mr. Deems was CFO and Treasurer of Forward Management, LLC, ReFlow Management Co., LLC, ReFlow Fund, LLC, a private investment fund, and Sutton Place Management, LLC, an administrative services company, from 2004 to June 2007. | | 30 | | Mr. Deems is a Trustee of ALPS ETF Trust (21 funds); ALPS Variable Investment Trust (8 funds) and Reaves Utility Income Fund (1 fund). |
| | |
| 40 | | (855) 732-9220 | seafarerfunds.com |
| | |
Seafarer Overseas Growth and Income Fund | | Trustees and Officers |
April 30, 2014 (Unaudited) |
INDEPENDENT TRUSTEES
| | | | | | | | | | |
Name,
Address* & Year of Birth | | Position(s) Held with Fund | | Term of Office and Length of Time Served** | | Principal Occupation(s) During Past 5 Years*** | | Number of Funds in Fund Complex Overseen by Trustee**** | | Other Directorships Held by Trustee |
Jerry G. Rutledge, 1944 | | Trustee | | Mr. Rutledge was elected at a special meeting of shareholders held on August 7, 2009. | | Mr. Rutledge is the President and owner of Rutledge’s Inc., a retail clothing business. He was from 1994 to 2007 a Regent of the University of Colorado. | | 30 | | Mr. Rutledge is a Trustee of Principal Real Estate Income Fund (1 fund), Clough Global Allocation Fund (1 fund), Clough Global Equity Fund (1 fund) and Clough Global Opportunities Fund (1 fund). |
Michael “Ross” Shell, 1970 | | Trustee | | Mr. Shell was elected at a special meeting of shareholders held on August 7, 2009. | | Mr. Shell is Founder and CEO of Red Idea, LLC, a strategic consulting/early stage venture firm (since June 2008). From 1999 to 2009, he was a part-owner and Director of Tesser, Inc., a brand agency. From December 2005 to May 2008, he was Director, Marketing and Investor Relations, of Woodbourne, a REIT/real estate hedge fund and private equity firm. Prior to this, from May 2004 to November 2005, he worked as a business strategy consultant; from June 2003 to April 2004, he was on the Global Client Services team of IDEO, a product design/innovation firm; and from 1999 to 2003, he was President of Tesser, Inc. Mr. Shell graduated with honors from Stanford University with a degree in Political Science. | | 30 | | None. |
| * | All communications to Trustees and Officers may be directed to Financial Investors Trust c/o 1290 Broadway, Suite 1100, Denver, CO 80203. |
| ** | This is the period for which the Trustee or Officer began serving the Trust. Each Trustee and/or Officer serves an indefinite term, until his successor is elected. |
| *** | Except as otherwise indicated, each individual has held the office shown or other offices in the same company for the last five years. |
| **** | The Fund Complex includes all series of the Trust (currently 30) and any other investment companies for which any Trustee serves as Trustee for and which Seafarer Capital Partners, LLC provides investment advisory services (currently none). |
| | |
Annual Report | April 30, 2014 | | 41 |
| | |
Seafarer Overseas Growth and Income Fund | | Trustees and Officers |
April 30, 2014 (Unaudited) |
INTERESTED TRUSTEE
| | | | | | | | | | |
Name, Address* & Year of Birth | | Position(s) Held with Fund | | Term of Office and Length of Time Served** | | Principal Occupation(s) During Past 5 Years*** | | Number of Funds in Fund Complex Overseen by Trustee**** | | Other Directorships Held by Trustee |
Edmund J. Burke, 1961 | | Trustee, Chairman and President | | Mr. Burke was elected as Chairman at the August 28, 2009 meeting of the Board of Trustees. Mr. Burke was elected as Trustee at a special meeting of shareholders held on August 7, 2009. Mr. Burke was elected President of the Trust at the December 17, 2002 meeting of the Board of Trustees. | | Mr. Burke is President and a Director of ALPS Holdings, Inc. (“AHI”) (since 2005) and Director of Boston Financial Data Services, Inc. (“BFDS”), ALPS Advisors, Inc. (“AAI”), ALPS Distributors, Inc. (“ADI”), ALPS Fund Services, Inc. (“AFS”) and ALPS Portfolio Solutions Distributor, Inc. (“APSD”) and from 2001-2008, was President of AAI, ADI, AFS and APSD. Because of his positions with AHI, BFDS, AAI, ADI, AFS and APSD, Mr. Burke is deemed an affiliate of the Trust as defined under the 1940 Act. Mr. Burke is Trustee and President of the Clough Global Allocation Fund (Trustee since 2006; President since 2004); Trustee and President of the Clough Global Equity Fund (Trustee since 2006; President since 2005); Trustee and President of the Clough Global Opportunities Fund (since 2006); Trustee of the Liberty All-Star Equity Fund; and Director of the Liberty All-Star Growth Fund, Inc. | | 30 | | Mr. Burke is a Trustee of Clough Global Allocation Fund (1 fund); Clough Global Equity Fund (1 fund); Clough Global Opportunities Fund (1 fund); Trustee of the Liberty All-Star Equity Fund (1 fund); and Director of the Liberty All-Star Growth Fund, Inc. (1 fund). |
| * | All communications to Trustees and Officers may be directed to Financial Investors Trust c/o 1290 Broadway, Suite 1100, Denver, CO 80203. |
| ** | This is the period for which the Trustee or Officer began serving the Trust. Each Trustee and/or Officer serves an indefinite term, until his successor is elected. |
| *** | Except as otherwise indicated, each individual has held the office shown or other offices in the same company for the last five years. |
| **** | The Fund Complex includes all series of the Trust (currently 30) and any other investment companies for which any Trustee serves as Trustee for and which Seafarer Capital Partners, LLC provides investment advisory services (currently none). |
| | |
| 42 | | (855) 732-9220 | seafarerfunds.com |
| | |
Seafarer Overseas Growth and Income Fund | | Trustees and Officers |
April 30, 2014 (Unaudited) |
OFFICERS
| | | | | | |
Name, Address* & Year of Birth | | Position(s) Held with Fund | | Term of Office and Length of Time Served** | | Principal Occupation(s) During Past 5 Years*** |
Kimberly R. Storms, 1972 | | Treasurer | | Ms. Storms was elected Treasurer of the Trust at the March 12, 2013 meeting of the Board of Trustees. | | Ms. Storms is Senior Vice President - Director of Fund Administration of ALPS. Ms. Storms joined ALPS in 1998 as Assistant Controller. Because of her position with ALPS, Ms. Storms is deemed an affiliate of the Trust as defined under the 1940 Act. Ms. Storms is also Treasurer of BPV Family of Funds and ALPS Series Trust; Assistant Treasurer of Liberty All-Star Equity Fund and Liberty All-Star Growth Fund, Inc.; Assistant Treasurer of Tilson Funds; and Chief Financial Officer of The Arbitrage Funds. |
David T. Buhler, 1971 | | Secretary | | Mr. Buhler was elected Secretary of the Trust at the September 11, 2012 meeting of the Board of Trustees. | | Mr. Buhler joined ALPS in June 2010. He is currently Vice President and Senior Associate Counsel of ALPS, AAI, ADI and APSD. Prior to joining ALPS, Mr. Buhler served as Associate General Counsel and Assistant Secretary of Founders Asset Management LLC from 2006 to 2009. Because of his position with ALPS, Mr. Buhler is deemed an affiliate of the Trust as defined under the 1940 Act. Mr. Buhler is also the Secretary ALPS Variable Investment Trust and Westcore Trust. |
Ted Uhl, 1974 | | Chief Compliance Officer (“CCO”) | | Mr. Uhl was appointed CCO of the Trust at the June 8, 2010 meeting of the Board of Trustees. | | Mr. Uhl joined ALPS in October 2006, and is currently Deputy Compliance Officer of ALPS. Prior to his current role, Mr. Uhl served as Senior Risk Manager for ALPS from October 2006 until June 2010. Before joining ALPS, Mr. Uhl served a Sr. Analyst with Enenbach and Associates (RIA), and a Sr. Financial Analyst at Sprint. Because of his position with ALPS, Mr. Uhl is deemed an affiliate of the Trust as defined under the 1940 Act. Mr. Uhl is also CCO of the Clough Global Funds, Reaves Utility Income Fund, Drexel Hamilton Funds and Transparent Value Trust. |
| * | All communications to Trustees and Officers may be directed to Financial Investors Trust c/o 1290 Broadway, Suite 1100, Denver, CO 80203. |
| ** | This is the period for which the Trustee or Officer began serving the Trust. Each Trustee and/or Officer serves an indefinite term, until his successor is elected. |
| *** | Except as otherwise indicated, each individual has held the office shown or other offices in the same company for the last five years. |
| | |
Annual Report | April 30, 2014 | | 43 |

Seafarer Funds distributed by ALPS Distributors, Inc.
Must be accompanied or preceded by a prospectus.
TABLE OF CONTENTS
| | |
| Aspen Managed Futures Strategy Fund | | Manager Commentary |
April 30, 2014 (Unaudited)
Market Conditions
Equity returns masked this year’s tumultuous news environment. The annexation of Crimea by Russia was no doubt the most important event in the period. U.S. weather patterns were also problematic, and severe enough to disrupt normal economic activity. Janet Yellen’s ascension to the Federal Reserve FED chairmanship was also an important driver of markets. Among all this uncertainty, the S&P 500® Total Return Index(1) managed a fifth consecutive quarterly gain – the first time this has happened since 2007.
Emerging markets fell in the first quarter, but we may finally be at an inflection point. After seeing outflows for years, the asset class has finally started seeing some interest from investors. EM equity funds saw the first inflows this year in the week ending April 2, according to fund tracker EPFR Global. Although reduced tension in the Ukraine and rallies in emerging market currencies are likely reasons for the renewed interest, valuations are probably the biggest driver. Owing to the long period of underperformance, it will likely take a month or so of positive flows to confirm a sentiment change in the EM sector.
After a tough 2013 for the asset class, fixed income markets had a surprisingly good first quarter. Bond holders mostly have increased market volatility to thank, as Russians tensions and equity pullbacks in Asia encouraged investors to buy government and corporate debt.
Performance Results
For the twelve-month period ending April 30, 2014, the Class I shares of the Aspen Managed Futures Strategy Fund posted a loss of -1.81%. Per its mandate, the Fund maintained very tight correlation to the Aspen Managed Futures Beta Index. The index uses a combination of trend and counter-trend algorithms to determine exposures to 23 futures markets. In following the index, the Fund can take long or short exposures to each of the eligible markets. A long position in a futures market will profit if the price of the futures contract rises, and a short position will profit if the price of the futures contract falls.
The Newedge CTA Index, a managed futures benchmark, returned -5.2% in the same timeframe. Another benchmark, the Barclay BTOP50 Index(2), returned -4.0%. It is important to note that there are substantive differences between the Fund and these indices in terms of construction. There were no significant changes to the Fund strategy during this period.
Explanation of Fund Performance
May (+0.7%) and June (+0.4%) were both positive performance months for the fund. The fund provided helpful diversification against losses in bonds (in both May and June) and stocks (in June). The fund’s broad diversification was a benefit. If outsized concentrations in previously successful trends had been allowed, they would likely have caused greater losses in these months than other portions of the portfolio could have overcome.
July (-1.1%), August (-1.5%), and September (+0.4%) were all heavily whipsawed months. In each case, the fund had substantial runups that were subsequently given back as the month continued. For example, the fund experienced a 2.0% gain on the low-market-volume “zombie day”(3) of July 5 only to see those gains given back over the next four trading days. Similar patterns occurred repeatedly in the third quarter, resulting in the fund giving back a portion of its gains for the year. Only in September was the end-of-month drawdown insufficient to claw back all of the month’s earlier gains.
October was a quieter month for the fund. Markets handled the government shutdown in a relatively non-volatile fashion, providing little opportunity for trend-followers. Following the end of the shutdown, a relief rally provided strong returns for managed futures managers with heavy concentrations in “risk-on”(4) positions, such as long equity trends. In this case, the fund’s enforced diversification proved unhelpful, as gains in equity trends were insufficient to offset losses elsewhere in the portfolio. Losses for the month (-0.4%) exactly offset the gains from September.
November (+2.1%) and December (+1.8%) were both positive months for the fund, driven in large part by ongoing gains in long equity positions. In November, the fund also benefited from the underlying model’s dynamic integration of trend and counter-trend. The stand-alone counter-trend model was down for the month, but its contribution to fund returns was positive thanks to dynamic integration.
Long-standing, profitable long equity trends suffered drawdowns when risk appetite turned negative in January. This was a major contributor to the fund’s -4.0% return for the month. Reduced exposures contained ongoing losses in February. The majority of that month’s -0.8% return was attributable to whipsawing weak commodity trends, although all asset classes were unprofitable.
The counter-trend model was beneficial in March, driving the fund to a +0.9% return despite small losses overall from trend-following. However, some of the counter-trend gains were given back in April, contributing to a -0.3% loss.
Outlook
After a significant rally in risk assets in 2013, the macroeconomic environment appears more problematic. Our view is primarily based on the way markets respond to new information. It has been shown that good news is more rapidly disseminated than bad news. Most of the good news in the current reporting period has been earnings-related. Through the end of the first quarter 64% of companies in the S&P 500® Total Return Index
| | |
| Annual Report | April 30, 2014 | | 1 |
| | |
| Aspen Managed Futures Strategy Fund | | Manager Commentary |
April 30, 2014 (Unaudited) |
reported earnings above analyst expectations, according to Thomson Reuters. Growing consumer confidence and the Fed’s apparent willingness to extend stimulus added to the positive tone. Broad improvement in the labor market added to the market’s friendly tone.
Our concerns lie in the available inventory of bad news. If there is enough good news to offset the bad, markets will likely rise. But what will happen in a dearth of positive reinforcement?
This is a more likely scenario than during last year. One of the key reasons is earnings revisions, which have lately been overwhelmingly negative. According to Morgan Stanley, the ratio of negative-to-positive guidance was at 4.5:1 during the first quarter. Companies adjust downward in order to clear this lower “hurdle” when actual earnings are released. This parlor trick works because the reaction to the lower expected results is more dramatic (and sudden) than the reaction to the reduced guidance. Recent macro events may shift this equilibrium.
Let’s take the political situation in the Ukraine as an example. Russia’s takeover of Crimea is old news, and the Ukraine only has about 1% of the Gross Domestic Product GDP of the U.S. But the situation could become a catalyst for a series of events that could impact global markets. As the fifth largest grain exporter, any supply disruption in the region could have an impact on prices. Tensions between the U.S. and Russia could lead to flight to quality dollar buying. Troop movements in the area could impact Asian trade, and might tilt Australia into a recession.
China could also become a catalyst. Their economic slowdown has not affected much of the developed world. But if their imports continue dropping (March witnessed an 11% decline), luxury retailers are certain to be pinched. Price declines in raw materials like copper and aluminum, which are mainly due to reduced construction in China, might also impact producers.
As a result of this view, we believe that portfolio diversification should take center stage in client portfolios. Considering the robust valuation of stocks, the introduction of non-equity linked investments seems quite prudent.
Sincerely,
Bryan R. Fisher,
Managing Partner
William Ware Bush,
Partner
Performance data quoted represents past performance. Past performance does not guarantee future results. Investment return and principal value of an investment will fluctuate so that an investor’s shares, when sold or redeemed, may be worth more or less than the original cost. Current performance data may be higher or lower than actual data quoted. For the most current month-end performance data please call 1-855-845-9444.
The views and information discussed in this commentary are as of the date of publication, are subject to change, and may not reflect the writer’s current views. The views expressed represent an assessment of market conditions at a specific point in time, are opinions only and should not be relied upon as investment advice regarding a particular investment or markets in general. Such information does not constitute a recommendation to buy or sell specific securities or investment vehicles. It should not be assumed that any investment will be profitable or will equal the performance of the portfolios or any securities or any sectors mentioned herein. The subject matter contained herein has been derived from several sources believed to be reliable and accurate at the time of compilation. Aspen Partners Ltd. does not accept any liability for losses either direct or consequential caused by the use of this information.
| (1) | The S&P 500® Total Return Index is an unmanaged index of 500 common stocks chosen for market size, liquidity and industry group representation. It is a market size, liquidity and industry group representation. It is a market-value weighted index. The index is not actively managed and does not reflect any deductions for fees, expense or taxes. An investor may not invest directly in an index. |
| (2) | Barclay BTOP50 Index is an index of the largest investable CTA programs as measured by assets under management. The index is not actively managed and does not reflect any deduction for fees, expense or taxes. An investor may not invest directly in an index. |
| (3) | Zombie Day denotes the workday after a Thursday holiday, when companies like to release negative news on the populace. |
| (4) | During a market sentiment of ‘Risk on,’ the market is optimistic and more willing to take risk in exchange for possibly better returns. At this time there will be a greater interest in shares or stocks and commodities. When the market sentiment is ‘Risk off,’ there is pessimism in the market and it will favor perceived lower risk investments such as U.S. Treasuries or U.S. dollars. http://en.wikipedia.org. |
| | |
| 2 | | www.aspenfuturesfund.com |
| | |
| Aspen Managed Futures Strategy Fund | | Manager Commentary |
April 30, 2014 (Unaudited) |
| | | | | | | | | | | | | | | |
| Cumulative Total Return Performance as of April 30, 2014 |
| | | |
| | | Calendar | | | | Since |
| Aspen Managed Futures Strategy Fund | | Year-to-Date | | 1 Year | | Inception* |
Aspen Managed Futures Strategy Fund - Class A (NAV)(1) | | -4.17% | | -2.15% | | | | -3.41% | |
Aspen Managed Futures Strategy Fund - Class A (MOP)(2) | | -9.39% | | -7.52% | | | | -5.38% | |
Aspen Managed Futures Strategy Fund - Class I | | -4.12% | | -1.81% | | | | -3.03% | |
Newedge CTA Index(3) | | -1.81% | | -5.22% | | | | -3.16% | |
Aspen Managed Futures Beta Index(4) | | -3.88% | | -2.22% | | | | -8.47% | |
Barclays US Managed Futures Industry Index(5) | | -1.24% | | -3.85% | | | | -1.84% | |
Performance data quoted represents past performance. Past performance does not guarantee future results. Investment return and principal value of an investment will fluctuate so that an investor’s shares, when sold or redeemed, may be worth more or less than the original cost. Current performance data may be higher or lower than actual data quoted. For the most current month-end performance data please call 1-855-845-9444.
The table does not reflect the deduction of taxes that a shareholder would pay on Fund distributions or the redemption of Fund shares.
| * | Fund Inception date of August 2, 2011. |
| (1) | Net Asset Value (NAV) is the share price without sales charges. |
| (2) | Maximum Offering Price (MOP) includes sales charges. Class A returns include effects of the Fund’s maximum sales charge of 5.50%. |
| (3) | The Newedge CTA Index provides the market with a reliable daily performance benchmark of major commodity trading advisors (CTAs). The Newedge CTA Index calculates the daily rate of return for a pool of CTAs selected from the larger managers that are open to new investment. Selection of the pool of qualified CTAs used in construction of the Index will be conducted annually, with re-balancing on January 1st of each year. A committee of industry professionals has been established to monitor the methodology of the index on a regular basis. The index is not actively managed and does not reflect any deductions for fees, expense or taxes. An investor may not invest directly in an index. |
| (4) | Aspen Managed Futures Beta Index – The Managed Futures Beta Index is constructed using a quantitative, rules-based model designed to replicate the trend-following and counter-trend exposure of futures markets by allocating assets to liquid futures contracts of certain financial and commodities futures markets. The Index therefore seeks to reflect the performance of strategies and exposures common to a broad universe of futures markets, i.e., managed futures beta. The index is not actively managed and does not reflect any deductions for fees, expense or taxes. An investor may not invest directly in an index. |
| (5) | The Barclays US Managed Futures Industry Index seeks to replicate the overall composition of the managed futures industry with regard to trading style and overall market exposure. The Barclays US Managed Futures Industry Index employs a top-down approach in selecting its constituents. The largest investable trading advisor programs, as measured by assets under management, are selected for inclusion in the Barclays US Managed Futures Industry Index. The index is not actively managed and does not reflect any deductions for fees, expense or taxes. An investor may not invest directly in an index. |
Performance of $10,000 Initial Investment (as of April 30, 2014)
Comparison of change in value of a $10,000 investment (includes applicable sales loads)
| | |
Portfolio Composition as of April 30, 2014 As a percentage of Net Assets |
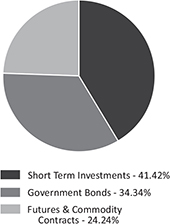
|
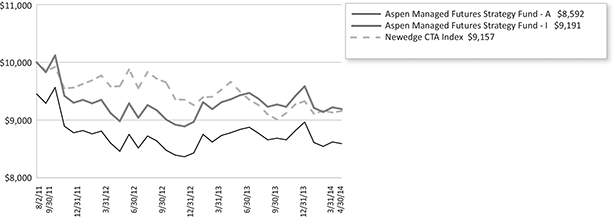
The chart represents historical performance of a hypothetical investment of $10,000 in the Fund since inception. Past performance does not guarantee future results. This chart does not reflect the deduction of taxes that a shareholder would pay on Fund distributions or the redemption of Fund shares.
| | |
| Annual Report | April 30, 2014 | | 3 |
| | |
| Aspen Managed Futures Strategy Fund | | Consolidated Disclosure of Fund Expenses |
April 30, 2014 (Unaudited)
As a shareholder of a Fund, you incur two types of costs: (1) transaction costs, including applicable sales charges (loads), redemption fees, wire fees and low balance fees; and (2) ongoing costs, including management fees, distribution and service (12b-1) fees, shareholder services fees and other Fund expenses. This example is intended to help you understand your indirect costs, also referred to as “ongoing costs” (in dollars), of investing in the Fund and to compare these costs with the ongoing costs of investing in other mutual funds.
This example is based on an investment of $1,000 invested at the beginning of the period and held for the entire six-month period of November 1, 2013 through April 30, 2014.
Actual Expenses The first line of the table below provides information about actual account values and actual expenses. You may use the information in this line, together with the amount you invested at the beginning of the period, to estimate the expenses that you paid over the period. Simply divide your account value by $1,000 (for example, an $8,600 account value divided by $1,000 = 8.6), then multiply the result by the number in the first line under the heading “Expenses Paid During Period” to estimate the expenses you paid on your account during this period.
Hypothetical Example for Comparison Purposes The second line of the table provides information about hypothetical account values and hypothetical expenses based on the Fund’s actual expense ratio and an assumed rate of return of 5% per year before expenses, which is not the Fund’s actual return. The hypothetical account values and expenses may not be used to estimate the actual ending account balance or expenses you paid for the period. You may use this information to compare ongoing costs of investing in the Fund and other funds. To do so, compare this 5% hypothetical example with the 5% hypothetical examples that appear in the shareholder reports of other funds.
Please note that the expenses shown in the table are meant to highlight your ongoing costs only and do not reflect any transactional costs, such as applicable sales charges (loads), redemption fees, wire fees and low balance fees. Therefore, the second line of the table is useful in comparing ongoing costs only and will not help you determine the relative total costs of owning different funds. In addition, if these transaction costs were included, your costs would be higher.
| | | | | | | | | | |
| | | Beginning | | Ending | | | | Expenses Paid | |
| | | Account Value | | Account Value | | | | During period | |
| | | 11/1/13 | | 4/30/14 | | Expense Ratio(a) | | 11/1/13 - 4/30/14(b) | |
| | | | |
Class A | | | | | | | | | | |
Actual | | $ 1,000.00 | | $ 993.50 | | 1.84% | | | $ 9.09 | |
Hypothetical (5% return before expenses) | | $ 1,000.00 | | $ 1,015.67 | | 1.84% | | | $ 9.20 | |
Class I | | | | | | | | | | |
Actual | | $ 1,000.00 | | $ 994.60 | | 1.32% | | | $ 6.53 | |
Hypothetical (5% return before expenses) | | $ 1,000.00 | | $ 1,018.25 | | 1.32% | | | $ 6.61 | |
| (a) | The Fund’s expense ratios have been based on the Fund’s most recent fiscal half-year expenses. |
| (b) | Expenses are equal to the Fund’s annualized expense ratio multiplied by the average account value over the period, multiplied by the number of days in the most recent fiscal half-year (181)/365 (to reflect the half-year period). |
| | |
| 4 | | www.aspenfuturesfund.com |
| | |
| Aspen Managed Futures Strategy Fund | | Consolidated Schedule of Investments |
April 30, 2014
| | | | | | | | |
| | | Principal Amount/ | | | Value | |
| | | Shares | | | (Note 2) | |
GOVERNMENT BONDS (34.34%) | | | | | | | | |
U.S. TREASURY NOTES (34.34%) | | | | | | | | |
0.250%, 08/31/2014 | | $ | 6,745,000 | | | $ | 6,749,613 | |
0.125%, 04/30/2015 | | | 5,005,000 | | | | 5,006,662 | |
0.250%, 08/15/2015 | | | 7,000,000 | | | | 7,007,931 | |
0.250%, 09/30/2015 | | | 5,000,000 | | | | 5,004,295 | |
0.250%, 10/31/2015 | | | 5,000,000 | | | | 5,002,735 | |
0.250%, 11/30/2015 | | | 7,013,000 | | | | 7,013,820 | |
0.250%, 12/31/2015 | | | 9,029,000 | | | | 9,025,822 | |
0.375%, 01/31/2016 | | | 6,006,000 | | | | 6,013,507 | |
0.250%, 02/29/2016 | | | 6,019,000 | | | | 6,010,068 | |
0.375%, 03/31/2016 | | | 5,042,000 | | | | 5,042,197 | |
| | |
| | | | | | | | |
TOTAL GOVERNMENT BONDS (Cost $61,808,271) | | | | | | | 61,876,650 | |
| | | | | | | | |
| | |
SHORT TERM INVESTMENTS (41.42%) | | | | | | | | |
MONEY MARKET FUND (6.32%) | | | | | | | | |
Dreyfus Treasury & Agency Cash Management Fund - Institutional Shares, 7-day yield, 0.010% | | | 11,382,477 | | | | 11,382,477 | |
| | | | | | | | |
| | |
U.S. TREASURY BILLS (35.10%) | | | | | | | | |
0.085%, 05/15/2014(a) | | | 4,250,000 | | | | 4,249,860 | |
0.039%, 06/19/2014(a) | | | 5,000,000 | | | | 4,999,736 | |
0.082%, 07/24/2014(a) | | | 5,500,000 | | | | 5,499,857 | |
0.093%, 08/21/2014(a) | | | 5,500,000 | | | | 5,499,549 | |
0.119%, 09/18/2014(a) | | | 5,750,000 | | | | 5,749,385 | |
0.059%, 10/16/2014(a) | | | 4,000,000 | | | | 3,999,276 | |
0.083%, 11/13/2014(a) | | | 7,500,000 | | | | 7,498,312 | |
0.096%, 12/11/2014(a) | | | 5,000,000 | | | | 4,998,485 | |
0.087%, 01/08/2015(a) | | | 4,250,000 | | | | 4,248,512 | |
0.099%, 02/05/2015(a) | | | 10,000,000 | | | | 9,994,750 | |
0.073%, 04/02/2015(a) | | | 6,500,000 | | | | 6,495,145 | |
| | | | | | | | |
| | | | | | | 63,232,867 | |
| | | | | | | | |
| | |
TOTAL SHORT TERM INVESTMENTS (Cost $74,604,449) | | | | | | | 74,615,344 | |
| | | | | | | | |
| | |
TOTAL INVESTMENTS (75.76%) (Cost $136,412,720) | | | | | | $ | 136,491,994 | |
| | | | | | | | |
| | |
Other Assets In Excess Of Liabilities (24.24%) | | | | | | | 43,678,873(b) | |
| | | | | | | | |
| | |
NET ASSETS (100.00%) | | | | | | $ | 180,170,867 | |
| | | | | | | | |
(a) Rate shown represents the bond equivalent yield to maturity at date of purchase.
(b) Includes cash which is being held as collateral for futures contracts.
| | |
| Annual Report | April 30, 2014 | | 5 |
| | |
| Aspen Managed Futures Strategy Fund | | Consolidated Schedule of Investments |
April 30, 2014 |
FUTURES CONTRACTS
At April 30, 2014, the Fund had outstanding futures contracts:
| | | | | | | | | | | | | | | | |
| | | | | | | Expiration | | | Underlying Face | | | Unrealized | |
| Description | | Position | | Contracts | | Date | | | Amount at Value | | | Appreciation | |
Commodity Contracts | | | | | | | | | | | | | | | | |
Copper Future | | Short | | 75 | | | 07/30/2014 | | | $ | (5,676,563) | | | $ | 20,765 | |
Corn Future | | Long | | 221 | | | 07/15/2014 | | | | 5,734,950 | | | | 183,698 | |
Silver Future | | Short | | 89 | | | 07/30/2014 | | | | (8,532,430) | | | | 125,321 | |
Soybean Future | | Long | | 113 | | | 07/15/2014 | | | | 8,547,038 | | | | 207,814 | |
Sugar No. 11 (World) Future | | Short | | 439 | | | 07/01/2014 | | | | (8,712,570) | | | | 118,299 | |
Equity Contracts | | | | | | | | | | | | | | | | |
Euro STOXX 50® Index Future | | Long | | 334 | | | 06/23/2014 | | | | 14,573,113 | | | | 197,796 | |
FTSE® 100 Index Future | | Long | | 86 | | | 06/23/2014 | | | | 9,793,121 | | | | 170,286 | |
Nikkei 225 Index Future | | Short | | 135 | | | 06/13/2014 | | | | (9,655,875) | | | | 62,294 | |
S&P 500® E-Mini Future | | Long | | 154 | | | 06/23/2014 | | | | 14,459,830 | | | | 90,202 | |
Fixed Income Contracts | | | | | | | | | | | | | | | | |
Canadian 10 Year Bond Future | | Long | | 75 | | | 06/20/2014 | | | | 8,961,270 | | | | 7,163 | |
Euro-Bund Future | | Long | | 92 | | | 06/09/2014 | | | | 18,448,502 | | | | 188,999 | |
Foreign Currency Contracts | | | | | | | | | | | | | | | | |
Australian Dollar Currency Future | | Long | | 550 | | | 06/17/2014 | | | | 50,968,500 | | | | 780,489 | |
Euro FX Currency Future | | Long | | 183 | | | 06/17/2014 | | | | 31,727,625 | | | | 26,864 | |
New Zealand Dollar Currency Future | | Long | | 474 | | | 06/17/2014 | | | | 40,740,300 | | | | 591,804 | |
| | | | | | | | | | | | |
| | | | | | | | | | $ | 171,376,811 | | | $ | 2,771,794 | |
| | | | | | | | | | | | |
| | | | | |
| | | | | | | Expiration | | | Underlying Face | | | Unrealized | |
| Description | | Position | | Contracts | | Date | | | Amount at Value | | | Depreciation | |
Commodity Contracts | | | | | | | | | | | | | | | | |
Gold 100 Oz Future | | Short | | 22 | | | 06/27/2014 | | | $ | (2,850,980) | | | $ | (24,936) | |
New York Harbor ULSD Future | | Short | | 46 | | | 06/02/2014 | | | | (5,657,089) | | | | (160) | |
WTI Crude Oil Future | | Short | | 30 | | | 05/21/2014 | | | | (2,992,200) | | | | (104) | |
Fixed Income Contracts | | | | | | | | | | | | | | | | |
Long Gilt Future | | Long | | 100 | | | 06/27/2014 | | | | 18,628,014 | | | | (1,866) | |
U.S. 10 Year Treasury Note Future | | Short | | 73 | | | 06/20/2014 | | | | (9,082,797) | | | | (1,328) | |
Foreign Currency Contracts | | | | | | | | | | | | | | | | |
Canadian Dollar Currency Future | | Short | | 116 | | | 06/18/2014 | | | | (10,586,160) | | | | (225,260) | |
Japanese Yen Currency Future | | Short | | 418 | | | 06/17/2014 | | | | (51,178,875) | | | | (278,326) | |
Swiss Franc Currency Future | | Short | | 286 | | | 06/17/2014 | | | | (40,644,175) | | | | (21,773) | |
| | | | | | | | | | | | |
| | | | | | | | | | $ | (104,364,262) | | | $ | (553,753) | |
| | | | | | | | | | | | |
Common Abbreviations:
FTSE - Financial Times and the London Stock Exchange
FX - Foreign
No. - Number
Oz - Ounce
S&P - Standard and Poor’s
ULSD - Ultra Low Sulfur Diesel
Holdings are subject to change.
For Fund compliance purposes, the Fund’s industry classifications refer to any one or more of the industry sub-classifications used by one or more widely recognized market indexes or ratings group indexes, and/or as defined by Fund management. This definition may not apply for purposes of this report, which may combine industry sub-classifications for reporting ease. Industries are shown as a percentage of net assets.
See Notes to Consolidated Financial Statements.
| | |
| 6 | | www.aspenfuturesfund.com |
| | |
| Aspen Managed Futures Strategy Fund | | Consolidated Statement of Assets & Liabilities |
April 30, 2014
| | | | |
ASSETS: | | | | |
Investments, at value | | $ | 136,491,994 | |
Foreign currency, at value (Cost $393,573) | | | 392,668 | |
Deposit with broker for futures contracts (Note 3) | | | 41,262,845 | |
Receivable for shares sold | | | 73,579 | |
Variation margin receivable | | | 2,771,794 | |
Interest receivable | | | 33,658 | |
Prepaid and other assets | | | 11,756 | |
Total assets | | | 181,038,294 | |
| |
LIABILITIES: | | | | |
Payable to advisor | | | 110,831 | |
Variation margin payable | | | 553,753 | |
Payable for shares redeemed | | | 61,306 | |
Payable for administration fees | | | 19,516 | |
Payable for distribution and service fees Class A | | | 8,186 | |
Payable for transfer agency fees | | | 16,028 | |
Payable for trustee fees and expenses | | | 1,291 | |
Payable for professional fees | | | 36,117 | |
Payable for chief compliance officer fees | | | 2,756 | |
Payable for principal financial officer fees | | | 416 | |
Payable for licensing fees | | | 36,944 | |
Accrued expenses and other liabilities | | | 20,283 | |
Total liabilities | | | 867,427 | |
NET ASSETS | | $ | 180,170,867 | |
| | |
| |
NET ASSETS CONSIST OF: | | | | |
| |
Paid-in capital (Note 5) | | $ | 180,208,123 | |
Accumulated net investment loss | | | (710,695) | |
Accumulated net realized loss on investments, futures contracts and foreign currency transactions | | | (1,622,971) | |
Net unrealized appreciation on investments, futures contracts and foreign currency translations | | | 2,296,410 | |
NET ASSETS | | $ | 180,170,867 | |
| | |
| |
INVESTMENTS, AT COST | | $ | 136,412,720 | |
| |
PRICING OF SHARES: | | | | |
Class A: | | | | |
Net Asset Value, offering and redemption price per share | | $ | 8.97 | |
Net Assets | | $ | 12,913,517 | |
Shares of beneficial interest outstanding | | | 1,439,686 | |
Maximum offering price per share (NAV/0.9450), based on maximum sales charge of 5.50% of the offering price | | $ | 9.49 | |
| |
Class I: | | | | |
Net Asset Value, offering and redemption price per share | | $ | 9.07 | |
Net Assets | | $ | 167,258,098 | |
Shares of beneficial interest outstanding | | | 18,434,938 | |
See Notes to Consolidated Financial Statements.
| | |
| Annual Report | April 30, 2014 | | 7 |
| | |
| Aspen Managed Futures Strategy Fund | | Consolidated Statement of Operations |
For the Year Ended April 30, 2014
| | | | |
INVESTMENT INCOME: | | | | |
Interest | | $ | 153,680 | |
Dividends | | | 1,118 | |
Total Investment Income | | | 154,798 | |
| |
EXPENSES: | | | | |
Investment advisory fees (Note 6) | | | 1,173,209 | |
Recoupment of previously waived fees (Note 6) Class A | | | 13,338 | |
Administrative fees | | | 224,716 | |
Distribution and service fees Class A | | | 32,962 | |
Transfer agency fees | | | 107,563 | |
Professional fees | | | 48,035 | |
Custodian fees | | | 10,731 | |
Trustee fees and expenses | | | 18,229 | |
Principal financial officer fees | | | 5,000 | |
Chief compliance officer fees | | | 31,763 | |
Licensing fees | | | 338,012 | |
Other | | | 81,081 | |
Total Net Expenses | | | 2,084,639 | |
NET INVESTMENT LOSS | | | (1,929,841) | |
| |
Net realized gain on investments | | | 15,799 | |
Net realized loss on futures contracts | | | (2,967,877) | |
Net realized gain on foreign currency transactions | | | 26,984 | |
Net change in unrealized appreciation of investments | | | 79,072 | |
Net change in unrealized appreciation on futures contracts | | | 1,479,174 | |
Net change in unrealized depreciation on translation of assets and liabilities denominated in foreign currency transactions | | | (842) | |
NET REALIZED AND UNREALIZED LOSS ON INVESTMENTS | | | (1,367,690) | |
NET DECREASE IN NET ASSETS RESULTING FROM OPERATIONS | | $ | (3,297,531) | |
| | |
See Notes to Consolidated Financial Statements.
| | |
| 8 | | www.aspenfuturesfund.com |
| | |
| Aspen Managed Futures Strategy Fund | | Consolidated Statements
of Changes in Net Assets |
| | | | | | | | |
| | | For the Year Ended
April 30, 2014 | | | For the Year Ended
April 30, 2013 | |
OPERATIONS: | | | | | | | | |
Net investment loss | | $ | (1,929,841) | | | $ | (1,324,600) | |
Net realized gain/(loss) on investments, futures contracts and foreign currency transactions | | | (2,925,094) | | | | 5,093,850 | |
Net change in unrealized appreciation on investments, futures contracts and foreign currency translations | | | 1,557,404 | | | | 1,008,325 | |
Net increase/(decrease) in net assets resulting from operations | | | (3,297,531) | | | | 4,777,575 | |
| | |
DISTRIBUTIONS TO SHAREHOLDERS (Note 4): | | | | | | | | |
From net realized gains on investments | | | | | | | | |
Class A | | | (162,261) | | | | – | |
Class I | | | (2,158,924) | | | | – | |
Net decrease in net assets from distributions | | | (2,321,185) | | | | – | |
| | |
SHARE TRANSACTIONS (Note 5): | | | | | | | | |
Class A | | | | | | | | |
Proceeds from sales of shares | | | 13,615,924 | | | | 2,819,184 | |
Distributions reinvested | | | 160,468 | | | | – | |
Cost of shares redeemed | | | (3,784,081) | | | | (830,242) | |
Redemption fees | | | 7,725 | | | | 455 | |
Class I | | | | | | | | |
Proceeds from sales of shares | | | 67,455,247 | | | | 55,964,668 | |
Distributions reinvested | | | 2,022,776 | | | | – | |
Cost of shares redeemed | | | (17,814,123) | | | | (30,316,921) | |
Redemption fees | | | 5,843 | | | | 1,069 | |
Net increase from share transactions | | | 61,669,779 | | | | 27,638,213 | |
| | |
Net increase in net assets | | | 56,051,063 | | | | 32,415,788 | |
| | |
NET ASSETS: | | | | | | | | |
Beginning of period | | | 124,119,804 | | | | 91,704,016 | |
End of period* | | $ | 180,170,867 | | | $ | 124,119,804 | |
| | | | | | | | | |
*Includes accumulated net investment loss of: | | $ | (710,695) | | | $ | (1,112,263) | |
| | |
Other Information: | | | | | | | | |
SHARE TRANSACTIONS: | | | | | | | | |
Class A | | | | | | | | |
Sold | | | 1,473,235 | | | | 311,862 | |
Distributions reinvested | | | 17,310 | | | | – | |
Redeemed | | | (411,560) | | | | (91,293) | |
Net increase in shares outstanding | | | 1,078,985 | | | | 220,569 | |
| | | | | | | | | |
| | |
Class I | | | | | | | | |
Sold | | | 7,251,376 | | | | 6,129,373 | |
Distributions reinvested | | | 216,109 | | | | – | |
Redeemed | | | (1,932,582) | | | | (3,306,806) | |
| |
Net increase in shares outstanding | | | 5,534,903 | | | | 2,822,567 | |
| | | | | | | | | |
See Notes to Consolidated Financial Statements.
| | |
| Annual Report | April 30, 2014 | | 9 |
| | |
| Aspen Managed Futures Strategy Fund – Class A | | Consolidated Financial Highlights |
For a share outstanding throughout the periods presented.
| | | | | | | | | | | | |
| | | For the
Year Ended
April 30, 2014 (a) | | | For the
Year Ended
April 30, 2013 (a) | | | For the Period
August 2, 2011
(Inception) to
April 30, 2012 (a) | |
NET ASSET VALUE, BEGINNING OF PERIOD | | $ | 9.29 | | | $ | 8.95 | | | $ | 10.00 | |
INCOME/(LOSS) FROM OPERATIONS: | | | | | | | | | | | | |
Net investment loss(b) | | | (0.16) | | | | (0.16) | | | | (0.13) | |
Net realized and unrealized gain/(loss) on investments | | | (0.05) | | | | 0.50 | | | | (0.92) | |
Total from investment operations | | | (0.21) | | | | 0.34 | | | | (1.05) | |
LESS DISTRIBUTIONS: | | | | | | | | | | | | |
Distributions from net realized gain on investments | | | (0.12) | | | | – | | | | – | |
Total distributions | | | (0.12) | | | | – | | | | – | |
REDEMPTION FEES ADDED TO PAID IN CAPITAL | | | 0.01 | | | | 0.00 | (c) | | | – | |
INCREASE/(DECREASE) IN NET ASSET VALUE | | | (0.32) | | | | 0.34 | | | | (1.05) | |
NET ASSET VALUE, END OF PERIOD | | $ | 8.97 | | | $ | 9.29 | | | $ | 8.95 | |
| | | | | | | | | | | | | |
| | | |
TOTAL RETURN(d) | | | (2.15%) | | | | 3.80% | | | | (10.50%) | (e) |
| | | |
RATIOS AND SUPPLEMENTAL DATA: | | | | | | | | | | | | |
Net assets, end of period (000’s) | | $ | 12,914 | | | $ | 3,350 | | | $ | 1,254 | |
| | | |
RATIOS TO AVERAGE NET ASSETS: | | | | | | | | | | | | |
Operating expenses excluding fee waivers/reimbursements | | | 1.83% | | | | 1.80% | | | | 2.53% | (f) |
Operating expenses including fee waivers/reimbursements | | | 1.83% | | | | 1.80% | | | | 1.80% | (f) |
Net investment loss including fee waivers/reimbursements | | | (1.72%) | | | | (1.75%) | | | | (1.79%) | (f) |
| | | |
PORTFOLIO TURNOVER RATE | | | 90% | | | | 0% | | | | 0% | (e) |
| (a) | Per share amounts and ratios to average net assets include income and expenses of the Aspen Futures Fund Ltd. (subsidiary), exclusive of the subsidiary’s management fee. |
| (b) | Per share numbers have been calculated using the average shares method. |
| (c) | Less than $0.005 per share. |
| (d) | Total return does not reflect the effect of sales charges. |
See Notes to Consolidated Financial Statements.
| | |
| 10 | | www.aspenfuturesfund.com |
| | |
| Aspen Managed Futures Strategy Fund – Class I | | Consolidated Financial Highlights |
For a share outstanding throughout the periods presented.
| | | | | | | | | | | | | | | |
| | | For the
Year Ended
April 30, 2014 (a) | | For the
Year Ended
April 30, 2013 (a) | | For the Period
August 2, 2011
(Inception) to
April 30, 2012 (a) |
NET ASSET VALUE, BEGINNING OF PERIOD | | | $ | 9.36 | | | | $ | 8.98 | | | | $ | 10.00 | |
INCOME/(LOSS) FROM OPERATIONS: | | | | | | | | | | | | | | | |
Net investment loss(b) | | | | (0.11 | ) | | | | (0.11 | ) | | | | (0.11 | ) |
Net realized and unrealized gain/(loss) on investments | | | | (0.06 | ) | | | | 0.49 | | | | | (0.91 | ) |
Total from investment operations | | | | (0.17 | ) | | | | 0.38 | | | | | (1.02 | ) |
LESS DISTRIBUTIONS: | | | | | | | | | | | | | | | |
Distributions from net realized gain on investments | | | | (0.12 | ) | | | | – | | | | | – | |
Total distributions | | | | (0.12 | ) | | | | – | | | | | – | |
REDEMPTION FEES ADDED TO PAID IN CAPITAL | | | | 0.00 | (c) | | | | 0.00 | (c) | | | | 0.00 | (c) |
INCREASE/(DECREASE) IN NET ASSET VALUE | | | | (0.29 | ) | | | | 0.38 | | | | | (1.02 | ) |
NET ASSET VALUE, END OF PERIOD | | | $ | 9.07 | | | | $ | 9.36 | | | | $ | 8.98 | |
| | | | | | | | | | | | | | | | |
| | | |
TOTAL RETURN | | | | (1.81%) | | | | | 4.23% | | | | | (10.20% | )(d) |
| | | |
RATIOS AND SUPPLEMENTAL DATA: | | | | | | | | | | | | | | | |
Net assets, end of period (000’s) | | | $ | 167,258 | | | | $ | 120,769 | | | | $ | 90,450 | |
| | | |
RATIOS TO AVERAGE NET ASSETS: | | | | | | | | | | | | | | | |
Operating expenses excluding fee waivers/reimbursements | | | | 1.30% | | | | | 1.25% | | | | | 1.75% | (e) |
Operating expenses including fee waivers/reimbursements | | | | 1.30% | | | | | 1.25% | | | | | 1.55% | (e) |
Net investment loss including fee waivers/reimbursements | | | | (1.20%) | | | | | (1.20%) | | | | | (1.54% | )(e) |
| | | |
PORTFOLIO TURNOVER RATE | | | | 90% | | | | | 0% | | | | | 0% | (d) |
| (a) | Per share amounts and ratios to average net assets include income and expenses of the Aspen Futures Fund Ltd. (subsidiary), exclusive of the subsidiary’s management fee. |
| (b) | Per share numbers have been calculated using the average shares method. |
| (c) | Less than $0.005 per share. |
See Notes to Consolidated Financial Statements.
| | |
| Annual Report | April 30, 2014 | | 11 |
| | |
| Aspen Managed Futures Strategy Fund | | Notes to Consolidated Financial Statements |
April 30, 2014
1. ORGANIZATION
Financial Investors Trust (the “Trust”), a Delaware statutory trust, is an open-end management investment company registered under the Investment Company Act of 1940, as amended (“1940 Act”). As of April 30, 2014, the Trust had 30 registered funds. This annual report describes the Aspen Managed Futures Strategy Fund (the “Fund”). The Fund seeks investment results that replicate as closely as possible, before fees and expenses, the price and yield performance of the Aspen Managed Futures Beta Index (the “MFBI” or “Index”). The Aspen Managed Futures Strategy Fund offers Class A and Class I shares. All classes of shares have identical rights to earnings, assets and voting privileges, except for class specific expenses and exclusive rights to vote on matters affecting only individual classes.
Basis of Consolidation for the Aspen Futures Fund, Ltd.
Aspen Futures Fund, Ltd. (the “Subsidiary”), a Cayman Islands exempted company, is a wholly owned subsidiary of the Fund. The Subsidiary’s investment objective is designed to enhance the ability of the Fund to obtain exposure to equities, financial, currency and commodities markets consistent with the limits of the U.S. federal tax law requirements applicable to registered investment companies. The Subsidiary is subject to substantially the same investment policies and investment restrictions as the Fund. The Subsidiary acts as an investment vehicle for the Fund in order to effect certain commodity-related investments on behalf of the Fund. Investments in the Subsidiary are expected to provide the Fund with exposure to the commodity markets within the limitations of Subchapter M of the Internal Revenue Code of 1986, as amended (the “Code”), and recent IRS revenue rulings, as discussed below under “Federal Income Taxes”. The Fund is the sole shareholder of the Subsidiary pursuant to a subscription agreement dated as of August 2, 2011, and it is intended that the Fund will remain the sole shareholder and will continue to control the Subsidiary. Under the Articles of Association of the Subsidiary, shares issued by the Subsidiary confer upon a shareholder the right to wholly own and vote at general meetings of the Subsidiary and certain rights in connection with any winding-up or repayment of capital, as well as the right to participate in the profits or assets of the Subsidiary. The Fund may invest up to 25% of its total assets in shares of the Subsidiary. As a wholly owned subsidiary of the Fund, all assets and liabilities, income and expenses of the Subsidiary are consolidated in the financial statements and financial highlights of the Fund. All investments held by the Subsidiary are disclosed in the accounts of the Fund. As of April 30, 2014, net assets of the Fund were $180,170,867, of which $28,672,134 or 15.91%, represented the Fund’s ownership of all issued shares and voting rights of the Subsidiary.
2. SIGNIFICANT ACCOUNTING POLICIES
The accompanying financial statements were prepared in accordance with accounting principles generally accepted in the United States of America (“U.S. GAAP”). The preparation of financial statements in conformity with U.S. GAAP requires management to make certain estimates and assumptions that affect the reported amounts of assets and liabilities and disclosures of contingent assets and liabilities at the date of the financial statements and the reported amounts of revenue and expenses during the period. Actual results could differ from those estimates. The following is a summary of significant accounting policies consistently followed by the Fund and subsidiary in preparation of the financial statements.
Investment Valuation: The Fund generally values its securities based on market prices determined at the close of regular trading on the New York Stock Exchange (“NYSE”), normally 4:00 p.m. Eastern Time, on each day the NYSE is open for trading.
For equity securities and mutual funds that are traded on an exchange, the market price is usually the closing sale or official closing price on that exchange. In the case of equity securities not traded on an exchange, or if such closing prices are not otherwise available, the securities are valued at the mean of the most recent bid and ask prices on such day. Redeemable securities issued by open-end registered investment companies are valued at the investment company’s applicable net asset value, with the exception of exchange-traded open-end investment companies, which are priced as equity securities.
The market price for debt obligations is generally the price supplied by an independent third-party pricing service approved by the Board of Trustees (the “Board”), which may use a matrix, formula or other objective method that takes into consideration quotations from dealers, market transactions in comparable investments, market indices and yield curves. If vendors are unable to supply a price, or if the price supplied is deemed to be unreliable, the market price may be determined using quotations received from one or more brokers–dealers that make a market in the security. Short–term debt obligations that will mature in 60 days or less are valued at amortized cost, unless it is determined that using this method would not reflect an investment’s fair value.
Futures contracts that are listed or traded on a national securities exchange, commodities exchange, contract market or comparable over-the-counter market, and that are freely transferable, are valued at their closing settlement price on the exchange on which they are primarily traded or based upon the current settlement price for a like instrument acquired on the day on which the instrument is being valued. A settlement price may not be used if the market makes a limit move with respect to a particular commodity.
Forward currency exchange contracts have a market value determined by the prevailing foreign currency exchange daily rates and current foreign currency exchange forward rates. The foreign currency exchange forward rates are calculated using an automated system that estimates rates on the basis of the current day foreign currency exchange rates and forward foreign currency exchange rates supplied by a pricing service.
| | |
| 12 | | www.aspenfuturesfund.com |
| | |
| Aspen Managed Futures Strategy Fund | | Notes to Consolidated Financial Statements |
April 30, 2014 |
Investment securities that are primarily traded on foreign securities exchanges are valued at the preceding closing values of such securities on their respective exchanges, except when an occurrence subsequent to the time a value was so established is likely to have changed such value. In such an event, the fair value of those securities are determined in good faith through consideration of other factors in accordance with procedures established by and under the general supervision of the Board.
When such prices or quotations are not available, or when the Fair Value Committee appointed by the Board believes that they are unreliable, securities may be priced using fair value procedures approved by the Board.
Fair Value Measurements: The Fund discloses the classification of its fair value measurements following a three-tier hierarchy based on the inputs used to measure fair value. Inputs refer broadly to the assumptions that market participants would use in pricing the asset or liability, including assumptions about risk. Inputs may be observable or unobservable. Observable inputs reflect the assumptions market participants would use in pricing the asset or liability that are developed based on market data obtained from sources independent of the reporting entity. Unobservable inputs reflect the reporting entity’s own assumptions about the assumptions market participants would use in pricing the asset or liability that are developed based on the best information available.
Various inputs are used in determining the value of the Fund’s investments as of the end of the reporting period. When inputs used fall into different levels of the fair value hierarchy, the level in the hierarchy within which the fair value measurement falls is determined based on the lowest level input that is significant to the fair value measurement in its entirety. The designated input levels are not necessarily an indication of the risk or liquidity associated with these investments. These inputs are categorized in the following hierarchy under applicable financial accounting standards:
| Level 1 – | Unadjusted quoted prices in active markets for identical investments, unrestricted assets or liabilities that the Fund has the ability to access at the measurement date; |
| Level 2 – | Quoted prices which are not active, quoted prices for similar assets or liabilities in active markets or inputs other than quoted prices that are observable (either directly or indirectly) for substantially the full term of the asset or liability; and |
| Level 3 – | Significant unobservable prices or inputs (including the Fund’s own assumptions in determining the fair value of investments) where there is little or no market activity for the asset or liability at the measurement date. |
The following is a summary of each input used to value the Fund as of April 30, 2014:
| | | | | | | | | | | | | | | | |
| Investments in Securities at Value | | Level 1 -
Quoted Prices | | | Level 2 -
Other Significant
Observable Inputs | | | Level 3 -
Significant Unobservable
Inputs | | | Total | |
Government Bonds | | $ | – | | | $ | 61,876,650 | | | $ | – | | | $ | 61,876,650 | |
Short Term Investments | | | 11,382,477 | | | | 63,232,867 | | | | – | | | | 74,615,344 | |
TOTAL | | $ | 11,382,477 | | | $ | 125,109,517 | | | $ | – | | | $ | 136,491,994 | |
| | | | | | | | | | | | | | | | | |
Other Financial Instruments | | | | | | | | | | | | | | | | |
Assets: | | | | | | | | | | | | | | | | |
Futures Contracts | | | | | | | | | | | | | | | | |
Commodity Contracts | | $ | 655,897 | | | $ | – | | | $ | – | | | $ | 655,897 | |
Equity Contracts | | | 520,578 | | | | – | | | | – | | | | 520,578 | |
Fixed Income Contracts | | | 196,162 | | | | – | | | | – | | | | 196,162 | |
Foreign Currency Contracts | | | 1,399,157 | | | | – | | | | – | | | | 1,399,157 | |
Liabilities: | | | | | | | | | | | | | | | | |
Futures Contracts | | | | | | | | | | | | | | | | |
Commodity Contracts | | | (25,200 | ) | | | – | | | | – | | | | (25,200 | ) |
Fixed Income Contracts | | | (3,194 | ) | | | – | | | | – | | | | (3,194 | ) |
Foreign Currency Contracts | | | (525,359 | ) | | | – | | | | – | | | | (525,359 | ) |
TOTAL | | $ | 2,218,041 | | | $ | – | | | $ | – | | | $ | 2,218,041 | |
| | | | | | | | | | | | | | | | | |
The Fund recognizes transfers between levels as of the end of the period. For the year ended April 30, 2014, the Fund did not have any transfers between Level 1 and Level 2 securities. For the year ended April 30, 2014, the Fund did not have any securities that used significant unobservable inputs (Level 3) in determining fair value.
| | |
| Annual Report | April 30, 2014 | | 13 |
| | |
| Aspen Managed Futures Strategy Fund | | Notes to Consolidated Financial Statements |
April 30, 2014 |
Investment Transactions and Investment Income: Investment transactions are accounted for on the date the investments are purchased or sold (trade date). Realized gains and losses from investment transactions are reported on an identified cost basis. Interest income, which includes accretion of discounts, is accrued and recorded as earned. Dividend income is recognized on the ex-dividend date or for certain foreign securities, as soon as information is available to the Fund. All of the realized and unrealized gains and losses and net investment income, are allocated daily to each class in proportion to its average daily net assets.
Foreign Securities: The Fund may directly purchase securities of foreign issuers. Investing in securities of foreign issuers involves special risks not typically associated with investing in securities of U.S. issuers. The risks include possible reevaluation of currencies, the inability to repatriate foreign currency, less complete financial information about companies and possible future adverse political and economic developments. Moreover, securities of many foreign issuers and their markets may be less liquid and their prices more volatile than those of securities of comparable U.S. issuers.
Foreign Currency Translation: The books and records of the Fund are maintained in U.S. dollars. Investment valuations and other assets and liabilities initially expressed in foreign currencies are converted each business day into U.S. dollars based upon current exchange rates. Prevailing foreign exchange rates may generally be obtained at the close of the NYSE (normally, 4:00 p.m. Eastern Time). The portion of realized and unrealized gains or losses on investments due to fluctuations in foreign currency exchange rates is not separately disclosed and is included in realized and unrealized gains or losses on investments, when applicable.
Foreign Currency Spot Contracts: The Fund may enter into foreign currency spot contracts to facilitate transactions in foreign securities or to convert foreign currency receipts into U.S. dollars. A foreign currency spot contract is an agreement between two parties to buy and sell currencies at the current market rate, for settlement generally within two business days. The U.S. dollar value of the contracts is determined using current currency exchange rates supplied by a pricing service. The contract is marked-to-market daily for settlements beyond one day and any change in market value is recorded as an unrealized gain or loss. When the contract is closed, the Fund records a realized gain or loss equal to the difference between the value on the open and close date. Losses may arise from changes in the value of the foreign currency, or if the counterparties do not perform under the contract’s terms. The maximum potential loss from such contracts is the aggregate face value in U.S. dollars at the time the contract was opened.
Trust Expenses: Some expenses of the Trust can be directly attributed to the Fund. Expenses which cannot be directly attributed to the Fund are apportioned among all funds in the Trust based on average net assets of each fund.
Fund and Class Expenses: Expenses that are specific to a class of shares of the Fund are charged directly to that share class. All expenses of the Fund, other than class specific expenses, are allocated daily to each class in proportion to its average daily net assets. Fees provided under the distribution (Rule 12b-1) for a particular class of the Fund are charged to the operations of such class.
Federal Income Taxes: The Fund complies with the requirements under Subchapter M of the Internal Revenue Code of 1986, as amended, applicable to regulated investment companies and intends to distribute substantially all of their net taxable income and net capital gains, if any, each year so that it will not be subject to excise tax on distributed income and gains. The Fund is not subject to income taxes to the extent such distributions are made.
As of and during the year ended April 30, 2014, the Fund did not have a liability for any unrecognized tax benefits. The Fund files U.S. federal, state, and local tax returns as required. The Fund’s tax returns are subject to examination by the relevant tax authorities until expiration of the applicable statute of limitations, which is generally three years after the filing of the tax return for federal purposes and four years for most state returns. Tax returns for open years have incorporated no uncertain tax positions that require a provision for income taxes.
Distributions to Shareholders: The Fund normally pays dividends and distributes capital gains, if any, on an annual basis. Income dividend distributions are derived from interest and other income the Fund receives from its investments, including short term capital gains. Long term capital gains distributions are derived from gains realized when the Fund sells a security it has owned for more than a year. The Fund may make additional distributions and dividends at other times if the portfolio manager believes doing so may be necessary for the Fund to avoid or reduce taxes.
3. DERIVATIVE INSTRUMENTS
The Fund uses derivatives (including futures) to pursue its investment objective. The Fund’s use of derivative instruments involves risks different from, or possibly greater than, the risks associated with investing directly in securities and other traditional investments. These risks may include (i) the risk that the counterparty to a derivative transaction may not fulfill its contractual obligations, (ii) risk of mispricing or improper valuation, and (iii) the risk that changes in the value of the derivative may not correlate perfectly with the underlying asset, rate or index. These risks could cause the Fund to lose more than the principal amount invested. In addition, investments in derivatives involve leverage, which means a small percentage of assets invested in derivatives can have a disproportionately large impact on the Fund.
| | |
| 14 | | www.aspenfuturesfund.com |
| | |
| Aspen Managed Futures Strategy Fund | | Notes to Consolidated Financial Statements |
April 30, 2014 |
The Fund’s use of derivatives can result in losses due to unanticipated changes in the market risk factors and the overall market. In instances where the Fund is using derivatives to decrease, or hedge, exposures to market risk factors for securities held by the Fund, there are also risks that those derivatives may not perform as expected resulting in losses for the combined or hedged positions. Derivatives may have little or no initial cash investment relative to their market value exposure and therefore can produce significant gains or losses in excess of their cost. This use of embedded leverage allows the Fund to increase its market value exposure relative to its net assets and can substantially increase the volatility of the Fund’s performance.
In addition, use of derivatives may increase or decrease exposure to the following risk factors:
| | • | | Equity Risk: Equity risk relates to the change in value of equity securities as they relate to increases or decreases in the general market. |
| | • | | Fixed Income Risk: When the Fund invests in fixed-income securities or derivatives, the value of an investment in the Fund will fluctuate with changes in interest rates. Typically, a rise in interest rates causes a decline in the value of fixed-income securities or derivatives owned by the Fund. In general, the market price of debt securities with longer maturities will increase or decrease more in response to changes in interest rates than shorter-term securities. Other risk factors include credit risk (the debtor may default) and prepayment risk (the debtor may pay its obligation early, reducing the amount of interest payments). |
| | • | | Foreign Currency Risk: Currency trading involves significant risks, including market risk, interest rate risk, country risk, counterparty credit risk and short sale risk. Market risk results from the price movement of foreign currency values in response to shifting market supply and demand. Interest rate risk arises whenever a country changes its stated interest rate target associated with its currency. Country risk arises because virtually every country has interfered with international transactions in its currency. Counterparty credit risk arises when the counterparty will not fulfill its obligations to the Fund. Short sale risk arises from the sale of a security that is not owned, or any sale that is completed by the delivery of a security borrowed. |
| | • | | Commodity Risk: Exposure to the commodities markets may subject the Fund to greater volatility than investments in traditional securities. Commodity prices are influenced by unfavorable weather, animal and plant disease, geologic and environmental factors, as well as changes in government regulation such as tariffs, embargoes or burdensome production rules and restrictions. |
Futures: The Fund and the Subsidiary may enter into futures contracts. Futures contracts are agreements between two parties to buy and sell a particular commodity, instrument or index for a specified price on a specified future date. When the Fund or the Subsidiary enters into a futures contract, it is required to deposit with (or for the benefit of) its broker an amount of cash or short-term high-quality securities as “initial margin”. The margin requirements are set by the exchange on which the contract is traded and may be modified during the term of the contract. The initial margin is in the nature of a performance bond or good faith deposit on the futures contract that is returned to the Fund upon termination of the contract, assuming all contractual obligations have been satisfied. As the value of the contract changes, the value of the futures contract position increases or declines. Subsequent payments, known as “variation margin”, are made or received by the Fund or the Subsidiary, depending on the price fluctuations in the fair value of the contract and the value of cash or securities on deposit with the broker. The aggregate principal amounts of the contracts are not recorded in the financial statements. Fluctuations in the value of the contracts are recorded in the Consolidated Statements of Assets and Liabilities as an asset (liability) and in the Consolidated Statements of Operations as unrealized appreciation (depreciation) until the contracts are closed, when they are recorded as realized gains (losses). Realized gain or loss on a futures position is equal to the difference between the value of the contract at the time it was opened and the value at the time it was closed, minus brokerage commissions. When the Fund or the Subsidiary enters into a futures contract certain risks may arise, such as illiquidity in the futures market, which may limit the Fund’s or the Subsidiary’s ability to close out a futures contract prior to settlement date, and unanticipated movements in the value of securities, commodities or interest rates. Futures contracts are exchange-traded. Exchange-traded futures are standardized contracts and are settled through a clearing house with fulfillment supported by the credit of the exchange. Therefore, counterparty credit risk to the Fund and the Subsidiary is reduced. In addition, the Fund could be exposed to risk if the counterparties to the contracts are unable to meet the terms of their contracts. With exchange traded futures, there is minimal counterparty credit risk to the Funds since futures are exchange traded and the exchange’s clearinghouse, as a counterparty to all exchange traded futures, guarantees the futures against default.
| | |
| Annual Report | April 30, 2014 | | 15 |
| | |
| Aspen Managed Futures Strategy Fund | | Notes to Consolidated Financial Statements |
April 30, 2014 |
Consolidated Balance Sheet – Fair Value of Derivative Instruments as of April 30, 2014(a):
| | | | | | | | | | | | |
| Derivatives Instruments | | Asset Derivatives Balance Sheet Location | | Fair Value | | | Liabilities Derivatives
Balance Sheet Location | | Fair Value | |
Futures Contracts | | Variation margin receivable | | $ | 2,771,794 | | | Variation margin payable | | $ | 553,753 | |
| | | | | | | | | | | | |
| | | | $ | 2,771,794 | | | | | $ | 553,753 | |
| | | | | | | | | | | | |
| | | | |
| | Risk Exposure to Fund | | | | | | | | | | |
| | Commodity Contracts | | $ | 655,897 | | | | | $ | 25,200 | |
| | Equity Contracts | | | 520,578 | | | | | | – | |
| | Fixed Income Contracts | | | 196,162 | | | | | | 3,194 | |
| | Foreign Currency Contracts | | | 1,399,157 | | | | | | 525,359 | |
| | | | | | | | | | | | |
| | | | $ | 2,771,794 | | | | | $ | 553,753 | |
| | | | | | | | | | | | |
| (a) | For open derivative instruments as of April 30, 2014, see the Consolidated Schedule of Investments, which is also indicative of the activity for the year ended April 30, 2014. |
Consolidated Statement of Operations – The effect of Derivative Instruments for the year ended April 30, 2014:
| | | | | | | | | | |
| Derivatives Instruments | | Location of Gain/(Loss) on Derivatives Recognized in Income | | Realized Gain/(Loss) on Derivatives Recognized in Income | | | Change in Unrealized Gain/(Loss) on
Derivatives Recognized in Income | |
Futures Contracts | | Net realized loss on futures contracts/Net change in unrealized depreciation on futures contracts | | $ | (2,967,877) | | | $ | 1,479,174 | |
| | | | | | |
| | | | $ | (2,967,877) | | | $ | 1,479,174 | |
| | | | | | |
| | | |
| | Risk Exposure to Fund | | | | | | | | |
| | Commodity Contracts | | $ | (2,618,694) | | | $ | 1,274,019 | |
| | Equity Contracts | | | (2,584,717) | | | | (667,689) | |
| | Fixed Income Contracts | | | 2,363,028 | | | | (588,239) | |
| | Foreign Currency Contracts | | | (127,494) | | | | 1,461,083 | |
| | | | | | |
| | | | $ | (2,967,877) | | | $ | 1,479,174 | |
| | | | | | |
4. TAX BASIS INFORMATION
Reclassifications: Reclassifications to paid-in capital relate primarily to differing book/tax treatment of net investment losses and income from a controlled foreign corporation. For the year ended April 30, 2014, the following reclassifications, which had no impact on results of operations or net assets, were recorded to reflect tax character:
| | | | | | | | | | | | |
| Fund | | Paid-in Capital | | | Accumulated Net
Investment Loss | | | Accumulated Net
Realized Loss on
Futures Contracts | |
Aspen Managed Futures Strategy Fund | | $ | (4,775,637 | ) | | $ | 2,331,409 | | | $ | 2,444,228 | |
Included in the amounts reclassified was a net operating loss offset to Paid-in-capital of $2,233,662.
Tax Basis of Investments: As of April 30, 2014, the aggregate cost of investments, gross unrealized appreciation/(depreciation) and net unrealized appreciation for Federal tax purposes was as follows:
| | | | | | | | | | | | | | | | | | | | | | | | | | | | |
| | | Cost of Investments | | | | | Gross Appreciation
(excess of value
over tax cost) | | | | | Gross Depreciation
(excess of tax cost
over value) | | | | | Net Appreciation on
Futures Contracts and
Foreign Currencies | | | | | Net Appreciation
on Investments | |
Aspen Managed Futures Strategy Fund | | $ | 136,412,720 | | | | | $ | 80,630 | | | | | $ | (1,356 | ) | | | | $ | 2,217,136 | | | | | $ | 2,296,410 | |
| | |
| 16 | | www.aspenfuturesfund.com |
| | |
| Aspen Managed Futures Strategy Fund | | Notes to Consolidated Financial Statements |
April 30, 2014 |
Components of Distributable Earnings: At April 30, 2014, components of distributable earnings were on a tax basis as follows:
| | | | |
| | | Aspen Managed Futures Strategy Fund | |
Accumulated net capital losses | | $ | (35,626) | |
Net unrealized appreciation on futures contracts | | | 2,296,410 | |
Other cumulative effect of timing differences | | | (2,298,040) | |
Total distributable earnings | | $ | (37,256) | |
| | |
As of April 30, 2014, the Fund elects to defer to the period ending April 30, 2015 late year ordinary losses in the amount of $710,695.
Capital Losses: During the year ended April 30, 2014, the Fund deferred capital losses in the amounts of $33,639 for short-term and $1,987 for long-term.
Tax Basis of Distributions to Shareholders: Distributions are determined in accordance with federal income tax regulations, which differ from GAAP, and, therefore, may differ significantly in amount or character from net investment income and realized gains for financial reporting purposes. Financial reporting records are adjusted for permanent book/tax differences to reflect tax character but are not adjusted for temporary differences.
The tax character of distributions paid during the year ending April 30, 2014 were as follows:
| | | | | | | | |
| | | Ordinary Income | | | Long-Term Capital Gain | |
Aspen Managed Futures Strategy Fund | | $ | – | | | $ | 2,321,185 | |
During the year ended April 30, 2013, the Fund did not make any distributions.
5. SHARES OF BENEFICIAL INTEREST
The capitalization of the Trust consists of an unlimited number of shares of beneficial interest with no par value per share. Holders of the shares of the Fund of the Trust have one vote for each share held and a proportionate fraction of a vote for each fractional share. All shares issued and outstanding are fully paid and are non-assessable, transferable and redeemable at the option of the shareholder. Shares have no pre-emptive rights.
Fund shares redeemed within 30 days of purchase may incur a 2% short-term redemption fee deducted from the redemption amount. The amount of redemption fees received during the period are presented in the Consolidated Statement of Changes in Net Assets.
6. MANAGEMENT AND RELATED-PARTY TRANSACTIONS
Aspen Partners Ltd. (the “Adviser” or “Aspen”), subject to the authority of the Board, is responsible for the overall management and administration of the Fund’s business affairs. The Adviser manages the investments of the Fund in accordance with the Fund’s investment objective, policies and limitations and investment guidelines established jointly by the Adviser and the Board. Pursuant to the Investment Advisory Agreement, (the “Advisory Agreement”), the Fund will pay the Adviser an annual management fee of 0.75%, based on the Fund’s average daily net assets. The management fee is paid on a monthly basis.
The Subsidiary has entered into a separate advisory agreement (the “Subsidiary Advisory Agreement”) with Aspen, the Subsidiary’s investment adviser and the Fund’s investment adviser, for the management of the Subsidiary’s portfolio pursuant to which the Subsidiary is obligated to pay the Adviser a management fee at the same rate that the Fund pays the Adviser for investment advisory services provided to the Fund. The Adviser has agreed to waive the advisory fee it receives from the Fund in an amount equal to the management fee paid by the Subsidiary. This waiver may not be terminated or modified without the consent of the Board.
The Adviser has contractually agreed to waive and/or reimburse fees or expenses in order to limit total annual fund operating expenses after fee waiver/expense reimbursements (excluding distribution and service (12b-1) fees, shareholder services fees, acquired fund fees and expenses, brokerage expenses, interest expenses, taxes and extraordinary expenses) to 1.55% of the Fund’s average daily net assets. This agreement is in effect through August 31, 2016. This agreement may not be terminated or modified prior to this date except with the approval of the Board.
Pursuant to this agreement, the Fund will reimburse the Adviser for any fee waivers and expense reimbursements made by the Adviser, provided that any such reimbursements made by the Fund to the Adviser will not cause the Fund’s expense limitation to exceed expense limitations in existence at the time the expense was incurred, or at the time of the reimbursement, whichever is lower, and the reimbursement is made within three years after the expenses were incurred.
| | |
| Annual Report | April 30, 2014 | | 17 |
| | |
| Aspen Managed Futures Strategy Fund | | Notes to Consolidated Financial Statements |
April 30, 2014 |
For the year ended April 30, 2014, the fee waivers and/or reimbursements were as follows:
| | | | | | | | | | |
| Fund | | Fees Waived/Reimbursed
By Adviser | | Recoupment of Previously
Waived Fees By Adviser |
Aspen Managed Futures Strategy Fund - Class A | | | $ | – | | | | $ | 13,338 | |
Aspen Managed Futures Strategy Fund - Class I | | | $ | – | | | | $ | – | |
As of April 30, 2014, the balances of recoupable expenses for the Fund were as follows:
| | | | | | | | | | | | | | | | | | | | | | | | | | | | | | | | | | | | | | |
| Fund | | Expires 2015 | | | | | Expires 2016 | | Expires 2017 | | | | | Total | |
Aspen Managed Futures Strategy Fund - Class A | | $ | | | | | – | | | | | $ | | | | | – | | | | | $ | | | | | – | | | | | $ | | | | | – | |
Aspen Managed Futures Strategy Fund - Class I | | | | | | | – | | | | | | | | | | – | | | | | | | | | | – | | | | | | | | | | – | |
Fund Accounting Fees and Expenses
ALPS Fund Services, Inc. (“ALPS” and the “Administrator”) (an affiliate of ALPS Distributors, Inc.) serves as administrator to the Fund and Subsidiary. The Fund has agreed to pay expenses incurred in connection with its administrative activities. Pursuant to the Administration, Bookkeeping and Pricing Services Agreement (the “Agreement”), ALPS will provide operational services to the Fund including, but not limited to fund accounting and fund administration and generally assist in the Fund’s operations.
The Fund’s administration fee is accrued on a daily basis, and paid on a monthly basis following the end of the month, based on the greater of (a) an annual total fee of $165,000, subject to a 5% increase per annum, from the first to the last, or projected last, day of the then current year of service under the Administration Agreement; or (b) the following basis point fee schedule:
| | |
| Average Total Net Assets | | Contractual Fee |
Between $0-$500M | | 0.05% |
$500M-$1B | | 0.03% |
Above $1B | | 0.02% |
The Subsidiary’s administration fee is based on an annual rate of $45,000.
The Administrator is also reimbursed by the Fund for certain out-of-pocket expenses.
Transfer Agent
ALPS serves as transfer, dividend paying and shareholder servicing agent for the Fund. ALPS receives an annual minimum fee, a fee based upon the number of shareholder accounts, and is also reimbursed by the Fund for certain out-of-pocket expenses.
Compliance Services
ALPS provides services that assist the Trust’s Chief Compliance Officer in monitoring and testing the policies and procedures of the Trust in conjunction with requirements under Rule 38a-1 under the 1940 Act and receives an annual base fee. ALPS is reimbursed for certain out-of-pocket expenses by the Fund.
Principal Financial Officer
ALPS receives an annual fee for providing Principal Financial Officer services to the Fund.
Distributor
ALPS Distributors, Inc. (“ADI” or the “Distributor”) (an affiliate of ALPS) acts as the distributor of the Fund’s shares pursuant to a Distribution Agreement with the Trust. Shares are sold on a continuous basis by ADI as agent for the Fund, and ADI has agreed to use its best efforts to solicit orders for the sale of the Fund’s shares, although it is not obliged to sell any particular amount of shares. ADI is not entitled to any compensation for its services as Distributor. ADI is registered as a broker-dealer with the Securities and Exchange Commission.
The Fund has adopted a plan of distribution for Class A shares pursuant to Rule 12b-1 under the 1940 Act (the “Plan”). The Plan allows the Fund to use Class A assets to pay fees in connection with the distribution and marketing of Class A shares and/or the provision of shareholder services to Class A shareholders. The Plan permits payment for services in connection with the administration of plans or programs that use Class A shares as their funding medium and for related expenses. The Plan permits the Fund to use its Class A assets to make total payments at an annual rate of up to 0.25% of the Fund’s average daily net assets attributable to its Class A shares. The expenses of the plan are reflected as distribution and service fees in the Consolidated Statement of Operations.
| | |
| 18 | | www.aspenfuturesfund.com |
| | |
| Aspen Managed Futures Strategy Fund | | Notes to Consolidated Financial Statements |
April 30, 2014 |
Effective October 11, 2013, the Fund has adopted a shareholder service plan (a “Shareholder Services Plan”) for Class A shares. Under the Shareholder Services Plan the Fund is authorized to pay banks and their affiliates and other institutions, including broker-dealers and Fund affiliates (“Participating Organizations”), an aggregate fee in an amount not to exceed on an annual basis 0.15% for Class A shares of the average daily net asset value of the Class A shares, respectively, attributable to or held in the name of a Participating Organization for its clients as compensation for providing shareholder service activities, which do not include distribution services, pursuant to an agreement with a Participating Organization. Any amount of such payment not paid during the Fund’s fiscal year for such service activities shall be reimbursed to the Fund. Shareholder Services Plan fees are included with distribution and service fees on the Consolidated Statement of Operations.
Index Licensing Services
As of July 1, 2013, the Fund has adopted an Index Licensing Agreement with Quantitative Equity Strategies, LLC (“QES”) and the Adviser, joint owners of the Index, pursuant to which the Fund pays QES a monthly annualized licensing fee of 0.25%, based on the Fund’s average daily net assets for the right to use the Index in connection with the Fund.
7. SECURITIES TRANSACTIONS
The cost of purchases and proceeds from sales of U.S. Government securities (excluding short-term securities) during the year ended April 30, 2014 were as follows:
| | | | |
| Aspen Managed Futures Strategy Fund | | | |
Cost of Investments Purchased | | $ | 90,811,484 | |
Proceeds from Investments Sold | | $ | 35,521,801 | |
8. INDEMNIFICATIONS
Under the Trust’s organizational documents, its officers and Trustees are indemnified against certain liability arising out of the performance of their duties to the Trust. Additionally, in the normal course of business, the Trust enters into contracts with service providers that may contain general indemnification clauses, which may permit indemnification to the extent permissible under applicable law. The Trust’s maximum exposure under these arrangements is unknown, as this would involve future claims that may be made against the Trust that have not yet occurred.
9. NEW ACCOUNTING PRONOUNCEMENTS
In June 2013, the Financial Accounting Standards Board (the “FASB”) issued Accounting Standards Update (”ASU”) No. 2013-08, Financial Services-Investment Companies (Topic 946): Amendments to the Scope, Measurement, and Disclosure Requirements. The FASB standard identifies characteristics a company must assess to determine whether it is considered an investment company for financial reporting purposes. This ASU is effective for fiscal years beginning after December 15, 2013. The Funds believe the adoption of this ASU will not have a material impact on their financial statements.
| | |
| Annual Report | April 30, 2014 | | 19 |
| | |
| Aspen Managed Futures Strategy Fund | | Report of Independent Registered Public Accounting Firm |
|
To the Shareholders and Board of Trustees of Financial Investors Trust:
We have audited the accompanying consolidated statement of assets and liabilities, including the consolidated schedule of investments, of Aspen Managed Futures Strategy Fund and subsidiary (the “Fund”), one of the portfolios constituting Financial Investors Trust, as of April 30, 2014, the related consolidated statement of operations for the year then ended, the consolidated statements of changes in net assets for each of the two years in the period then ended, and the consolidated financial highlights for each of the two years in the period then ended and the period from August 2, 2011 (inception) to April 30, 2012. These financial statements and financial highlights are the responsibility of the Fund’s management. Our responsibility is to express an opinion on these financial statements and financial highlights based on our audits.
We conducted our audits in accordance with the standards of the Public Company Accounting Oversight Board (United States). Those standards require that we plan and perform the audit to obtain reasonable assurance about whether the financial statements and financial highlights are free of material misstatement. The Fund is not required to have, nor were we engaged to perform, an audit of its internal control over financial reporting. Our audits included consideration of internal control over financial reporting as a basis for designing audit procedures that are appropriate in the circumstances, but not for the purpose of expressing an opinion on the effectiveness of the Fund’s internal control over financial reporting. Accordingly, we express no such opinion. An audit also includes examining, on a test basis, evidence supporting the amounts and disclosures in the financial statements, assessing the accounting principles used and significant estimates made by management, as well as evaluating the overall financial statement presentation. Our procedures included confirmation of securities owned as of April 30, 2014, by correspondence with the custodian and broker. We believe that our audits provide a reasonable basis for our opinion.
In our opinion, the consolidated financial statements and financial highlights referred to above present fairly, in all material respects, the financial position of Aspen Managed Futures Strategy Fund and subsidiary of the Financial Investors Trust, as of April 30, 2014, the results of their operations for the year then ended, the changes in their net assets for each of the two years in the period then ended, and the financial highlights for each of the two years in the period then ended and the period from August 2, 2011 (inception) to April 30, 2012, in conformity with accounting principles generally accepted in the United States of America.
DELOITTE & TOUCHE LLP
Denver, Colorado
June 26, 2014
| | |
| 20 | | www.aspenfuturesfund.com |
| | |
| Aspen Managed Futures Strategy Fund | | Disclosure Regarding Approval of Fund Advisory Agreement |
|
On March 11, 2014, the Trustees met in person to discuss, among other things, the approval of the investment advisory agreement between the Trust and Aspen Partners, Ltd. (“Aspen”) (the “Investment Advisory Agreement”), in accordance with Section 15(c) of the 1940 Act. The Independent Trustees met with independent legal counsel during executive session and discussed the Investment Advisory Agreement and other related materials.
In renewing and approving the Investment Advisory Agreement with Aspen, the Trustees, including the Independent Trustees, considered the following factors with respect to the Aspen Managed Futures Strategy Fund (the “Aspen Fund”):
Investment Advisory Fee Rate: The Trustees reviewed and considered the contractual annual advisory fee to be paid by the Trust, on behalf of the Aspen Fund to Aspen of 0.75% of the Aspen Fund’s daily average net assets in light of the extent and quality of the advisory services provided by Aspen to the Aspen Fund.
The Trustees considered the information they received comparing the Aspen Fund’s contractual annual advisory fee and overall net expenses with those of funds in the relevant expense peer group provided by an independent provider of investment company data.
Based on such information, the Trustees determined that the contractual annual advisory fee of 0.75% of the daily average net assets of the Aspen Fund, and the total net expense ratio of 1.95% for Class A shares and 1.48% for Class I shares, were generally lower than the respective peer group median.
Nature, Extent and Quality of the Services under the Advisory Agreement: The Trustees received and considered information regarding the nature, extent and quality of services provided to the Aspen Fund under the Investment Advisory Agreement. The Trustees reviewed certain background materials supplied by Aspen in its presentation, including its Form ADV, financial statements and Compliance Policies and Procedures.
The Trustees reviewed and considered Aspen’s investment advisory personnel, its history as an asset manager, its performance and the amount of assets currently under management by Aspen. The Trustees also reviewed the research and decision-making processes utilized by Aspen, including the methods adopted to seek to achieve compliance with the investment objectives, policies and restrictions of the Aspen Fund.
The Trustees considered the background and experience of Aspen’s management in connection with the Aspen Fund, including reviewing the qualifications, backgrounds and responsibilities of the management team primarily responsible for the day-to-day portfolio management of the Aspen Fund and the extent of the resources devoted to research and analysis of actual and potential investments.
The Trustees also reviewed the accompanying Compliance-related materials and further noted that they have received reports on these services and Compliance issues at each regular Board meeting throughout the year related to the services rendered by Aspen with respect to the Aspen Fund.
Performance: The Trustees reviewed performance information for the Aspen Fund for the three-month and 1-year periods ended December 31, 2013. That review included a comparison of the Aspen Fund’s performance to the performance of a universe of comparable funds selected by an independent provider of fund company data. The Trustees noted the generally favorable performance of the Aspen Fund compared against funds in its peer universe for the 1-year period ended December 31, 2013.
The Adviser’s Profitability: The Trustees received a profitability analysis prepared by Aspen based on the fees payable under the Investment Advisory Agreement. The Board then reviewed Aspen’s financial statements in order to analyze the financial condition and stability and profitability of Aspen.
Economies of Scale: The Trustees considered whether the economies of scale, as described by Aspen, in the provision of services to the Aspen Fund will be passed along to the shareholders under the Investment Advisory Agreement.
Other Benefits to the Adviser: The Trustees reviewed and considered any other benefits derived or to be derived by Aspen from its relationship with the Aspen Fund, including the fact that Aspen does not use soft dollars.
The Board summarized its deliberations with respect to the Investment Advisory Agreement with Aspen. In selecting Aspen and approving the Investment Advisory Agreement and fees under such agreement, the Trustees concluded that no single factor reviewed by the Trustees was identified by the Trustees to be determinative as the principal factor in whether to approve the Investment Advisory Agreement. Further, the Independent Trustees were advised by separate independent legal counsel throughout the process. The Trustees, including all of the Independent Trustees, concluded that:
| | |
| Annual Report | April 30, 2014 | | 21 |
| | |
| Aspen Managed Futures Strategy Fund | | Disclosure Regarding Approval of Fund Advisory Agreement |
|
| | • | | the investment advisory fee to be received by Aspen with respect to the Aspen Fund was the lowest of the applicable peer group, and the net total expenses paid by each of the Aspen Fund’s share classes, after Aspen’s agreement to waive fees and/or reimburse expenses, were below the applicable peer group median; |
| | • | | the nature, extent and quality of services rendered by Aspen under the Investment Advisory Agreement were adequate; |
| | • | | the performance of the Aspen Fund was generally favorable compared with the performance of the funds in the applicable peer universe over the most recent 1-year period; |
| | • | | the profit, if any, anticipated to be realized by Aspen in connection with the operation of the Aspen Fund is fair to the Trust; and |
| | • | | any material economies of scale or other benefits accruing to Aspen in connection with its relationship with the Aspen Fund were being passed through to Aspen Fund shareholders. |
Based on the Trustees’ deliberations and their evaluation of the information described above, the Trustees, including all of the Independent Trustees, concluded that Aspen’s compensation for investment advisory services is consistent with the best interests of the Aspen Fund and its shareholders.
| | |
| 22 | | www.aspenfuturesfund.com |
| | |
| Aspen Managed Futures Strategy Fund | | Additional Information |
April 30, 2014 (Unaudited) |
1. FUND HOLDINGS
The Fund files its complete schedule of portfolio holdings with the Securities and Exchange Commission (the “SEC”) for the first and third quarters of each fiscal year on Form N-Q within 60 days after the end of the period. Copies of the Fund’s Form N-Q are available without charge on the SEC website at http://www.sec.gov. You may also review and copy the Form N-Q at the SEC’s Public Reference Room in Washington, DC. For more information about the operation of the Public Reference Room, please call the SEC at
1-800-SEC-0330.
2. FUND PROXY VOTING POLICIES, PROCEDURES AND SUMMARIES
The Fund’s policies and procedures used in determining how to vote proxies and information regarding how the Fund voted proxies relating to portfolio securities during the most recent prior 12-month period ending June 30 are available without charge, (1) upon request, by calling (toll-free) 855-845-9444 and (2) on the SEC’s website at http://www.sec.gov.
3. TAX DESIGNATIONS
The Fund designates the following for federal income tax purposes for distributions made during the calendar year ended December 31, 2013:
| | | | |
| | | QDI | | DRD |
Aspen Managed Futures Strategy Fund | | 0.00% | | 0.00% |
In early 2014, if applicable, shareholders of record received this information for the distribution paid to them by the Fund during the calendar year 2013 via Form 1099. The Fund will notify shareholders in early 2015 of amounts paid to them by the Funds, if any, during the calendar year 2014.
Pursuant to Section 852(b)(3) of the Internal Revenue Code, Aspen Managed Futures Strategy Fund designated $2,321,185 as long-term capital gain distribution.
| | |
| Annual Report | April 30, 2014 | | 23 |
| | |
| Aspen Managed Futures Strategy Fund | | Trustees and Officers |
April 30, 2014 (Unaudited) |
Additional information regarding the Fund’s trustees is included in the Statement of Additional Information, which can be obtained without charge by calling 855-845-9444.
INDEPENDENT TRUSTEES
| | | | | | | | | | |
Name, Address* & Year of
Birth | | Position(s) Held with Fund | | Term of Office and Length
of Time Served** | | Principal Occupation(s)
During Past 5 Years*** | | Number of Funds in
Fund Complex
Overseen by
Trustee**** | | Other Directorships Held by Trustee |
Mary K.
Anstine,
1940 | | Trustee | | Ms. Anstine was elected at a special meeting of shareholders held on March 21, 1997 and re-elected at a special meeting of shareholders held on August 7, 2009. | | Ms. Anstine was President/Chief Executive Officer of HealthONE Alliance, Denver, Colorado, and former Executive Vice President of First Interstate Bank of Denver. Ms. Anstine is also Trustee/Director of AV Hunter Trust and Colorado Uplift Board. Ms. Anstine was formerly a Director of the Trust Bank of Colorado (later purchased and now known as Northern Trust Bank), HealthONE and Denver Area Council of the Boy Scouts of America, and a member of the American Bankers Association Trust Executive Committee. | | 30 | | Ms. Anstine is a Trustee of ALPS ETF Trust (21 funds); ALPS Variable Investment Trust (8 funds); Reaves Utility Income Fund (1 fund); and Westcore Trust (12 funds). |
John R.
Moran, Jr.,
1930 | | Trustee | | Mr. Moran was elected at a special meeting of shareholders held on March 21, 1997 and re-elected at a special meeting of shareholders held on August 7, 2009. | | Mr. Moran is formerly President and CEO of The Colorado Trust, a private foundation serving the health and hospital community in the state of Colorado Currently, Mr. Moran is a member of the Treasurer’s Investment Advisory Committee for the University of Colorado. | | 30 | | None. |
Jeremy W.
Deems,
1976 | | Trustee | | Mr. Deems was appointed as a Trustee at the March 11, 2008 meeting of the Board of Trustees and elected at a special meeting of shareholders held on August 7, 2009. | | Mr. Deems is the Co-Founder, Chief Operations Officer and Chief Financial Officer of Green Alpha Advisors, LLC. Mr. Deems is Co-Portfolio Manager of the Shelton Green Alpha Fund. Prior to joining Green Alpha Advisors, Mr. Deems was CFO and Treasurer of Forward Management, LLC, ReFlow Management Co., LLC, ReFlow Fund, LLC, a private investment fund, and Sutton Place Management, LLC, an administrative services company, from 2004 to June 2007. | | 30 | | Mr. Deems is a Trustee of ALPS ETF Trust (21 funds); ALPS Variable Investment Trust (8 funds) and Reaves Utility Income Fund (1 fund). |
Jerry G.
Rutledge,
1944 | | Trustee | | Mr. Rutledge was elected at a special meeting of shareholders held on August 7, 2009. | | Mr. Rutledge is the President and owner of Rutledge’s Inc., a retail clothing business. He was from 1994 to 2007 a Regent of the University of Colorado. | | 30 | | Mr. Rutledge is a Trustee of Principal Real Estate Income Fund (1 fund), Clough Global Allocation Fund (1 fund), Clough Global Equity Fund (1 fund) and Clough Global Opportunities Fund (1 fund). |
Michael
“Ross”
Shell,
1970 | | Trustee | | Mr. Shell was elected at a special meeting of shareholders held on August 7, 2009. | | Mr. Shell is Founder and CEO of Red Idea, LLC, a strategic consulting/early stage venture firm (since June 2008). From 1999 to 2009, he was a part-owner and Director of Tesser, Inc., a brand agency. From December 2005 to May 2008, he was Director, Marketing and Investor Relations, of Woodbourne, a REIT/real estate hedge fund and private equity firm. Prior to this, from May 2004 to November 2005, he worked as a business strategy consultant; from June 2003 to April 2004, he was on the Global Client Services team of IDEO, a product design/innovation firm; and from 1999 to 2003, he was President of Tesser, Inc. Mr. Shell graduated with honors from Stanford University with a degree in Political Science. | | 30 | | None. |
| | |
| 24 | | www.aspenfuturesfund.com |
| | |
| Aspen Managed Futures Strategy Fund | | Trustees and Officers |
April 30, 2014 (Unaudited) |
INTERESTED TRUSTEE
| | | | | | | | | | |
Name, Address* & Year of Birth | | Position(s) Held with Fund | | Term of Office and
Length of Time Served** | | Principal Occupation(s)
During Past 5 Years*** | | Number of
Funds in
Fund
Complex
Overseen
by
Trustee**** | | Other Directorships Held
by Trustee |
Edmund
J. Burke,
1961 | | Trustee,
Chairman
and
President | | Mr. Burke was elected as Chairman at the August 28, 2009 meeting of the Board of Trustees. Mr. Burke was elected as Trustee at a special meeting of shareholders held on August 7, 2009. Mr. Burke was elected President of the Trust at the December 17, 2002 meeting of the Board of Trustees. | | Mr. Burke is President and a Director of ALPS Holdings, Inc. (“AHI”) (since 2005) and Director of Boston Financial Data Services, Inc. (“BFDS”), ALPS Advisors, Inc. (“AAI”), ALPS Distributors, Inc. (“ADI”), ALPS Fund Services, Inc. (“AFS”) and ALPS Portfolio Solutions Distributor, Inc. (“APSD”) and from 2001-2008, was President of AAI, ADI, AFS and APSD. Because of his positions with AHI, BFDS, AAI, ADI, AFS and APSD, Mr. Burke is deemed an affiliate of the Trust as defined under the 1940 Act. Mr. Burke is Trustee and President of the Clough Global Allocation Fund (Trustee since 2006; President since 2004); Trustee and President of the Clough Global Equity Fund (Trustee since 2006; President since 2005); Trustee and President of the Clough Global Opportunities Fund (since 2006); Trustee of the Liberty All-Star Equity Fund; and Director of the Liberty All-Star Growth Fund, Inc. | | 30 | | Mr. Burke is a Trustee of Clough Global Allocation Fund (1 fund); Clough Global Equity Fund (1 fund); Clough Global Opportunities Fund (1 fund); Trustee of the Liberty All-Star Equity Fund (1 fund); and Director of the Liberty All-Star Growth Fund, Inc. (1 fund). |
OFFICERS
| | | | | | |
Name, Address* & Year of Birth | | Position(s) Held with Fund | | Term of Office and
Length of Time Served** | | Principal Occupation(s) During Past 5 Years*** |
Kimberly R.
Storms,
1972 | | Treasurer | | Ms. Storms was elected Treasurer of the Trust at the March 12, 2013 meeting of the Board of Trustees. | | Ms. Storms is Senior Vice President - Director of Fund Administration of ALPS. Ms. Storms joined ALPS in 1998 as Assistant Controller. Because of her position with ALPS, Ms. Storms is deemed an affiliate of the Trust as defined under the 1940 Act. Ms. Storms is also Treasurer of BPV Family of Funds and ALPS Series Trust; Assistant Treasurer of Liberty All-Star Equity Fund and Liberty All-Star Growth Fund, Inc.; Assistant Treasurer of Tilson Funds; and Chief Financial Officer of The Arbitrage Funds. |
David T.
Buhler,
1971 | | Secretary | | Mr. Buhler was elected Secretary of the Trust at the September 11, 2012 meeting of the Board of Trustees. | | Mr. Buhler joined ALPS in June 2010. He is currently Vice President and Senior Associate Counsel of ALPS, AAI, ADI and APSD. Prior to joining ALPS, Mr. Buhler served as Associate General Counsel and Assistant Secretary of Founders Asset Management LLC from 2006 to 2009. Because of his position with ALPS, Mr. Buhler is deemed an affiliate of the Trust as defined under the 1940 Act. Mr. Buhler is also the Secretary ALPS Variable Investment Trust and Westcore Trust. |
Ted Uhl,
1974 | | Chief
Compliance
Officer
(CCO”) | | Mr. Uhl was appointed CCO of the Trust at the June 8, 2010 meeting of the Board of Trustees. | | Mr. Uhl joined ALPS in October 2006, and is currently Deputy Compliance Officer of ALPS. Prior to his current role, Mr. Uhl served as Senior Risk Manager for ALPS from October 2006 until June 2010. Before joining ALPS, Mr. Uhl served a Sr. Analyst with Enenbach and Associates (RIA), and a Sr. Financial Analyst at Sprint. Because of his position with ALPS, Mr. Uhl is deemed an affiliate of the Trust as defined under the 1940 Act. Mr. Uhl is also CCO of the Clough Global Funds, Reaves Utility Income Fund, Drexel Hamilton Funds and Transparent Value Trust. |
| * | All communications to Trustees and Officers may be directed to Financial Investors Trust c/o 1290 Broadway, Suite 1100, Denver, CO 80203. |
| ** | This is the period for which the Trustee or Officer began serving the Trust. Each Trustee and/or Officer serves an indefinite term, until his successor is elected. |
| *** | Except as otherwise indicated, each individual has held the office shown or other offices in the same company for the last five years. |
| **** | The Fund Complex includes all series of the Trust (currently 30) and any other investment companies for which any Trustee serves as Trustee for and which Aspen Partners, Ltd. provides investment advisory services (currently none). |
| | |
| Annual Report | April 30, 2014 | | 25 |

This material must be accompanied or preceded by the prospectus.
WWW.ASPENFUTURESFUND.COM
Table of Contents
April 30, 2014
| | |
Stonebridge Small-Cap Growth Fund | | Letter to Shareholders |
April 30, 2014 (Unaudited) |
May 12, 2014
OVERVIEW
An unusually cold and snowy winter caused major disruptions to economic activity in the first quarter of 2014. Three consecutive months of severe weather impacted consumer demand, job creation, and housing starts and, as a result, a pervasive reduction in overall economic activity ensued. The initial estimate of Gross Domestic Product (GDP) growth for the first quarter arrived at 0.1% - well below any economist’s estimate at the end of December 2013. And, it is likely to be revised down further, most likely into negative territory. This slow domestic economic growth and the political instability in Eastern Europe (Ukraine) have kept returns from the equity markets muted. Now that spring is upon us and strong March retail numbers have been announced, it appears a catch-up to the first quarter’s anemic activity has developed. Hence, GDP in the second quarter of 2014 will likely be very strong.
From a capital markets perspective, the first four months of 2014 have surprised many pundits. As we ended 2013, the vast majority of Wall Street strategists called for much higher interest rates at the long end of the curve. Instead, 10 year and 30 year treasuries have rallied. In Europe, we have seen similar rallies in various government bonds. A continued lack of inflation, globally, and concerns of possible future deflation in Europe have attracted investors back to government bonds. Likewise, some of the best performing equity markets so far this year have been emerging market countries like Turkey and Brazil. Interestingly, it is very unlikely that either country was on any strategist’s top 10 list in December 2013.
Concurrently, the U.S. equity markets may have witnessed an inflection point. There appears to be a shift in the investment trend from momentum-growth companies to high-quality, stable, blue chip companies. For example, the NASDAQ Biotech Index had risen over 20% during the first quarter of 2014, yet was down slightly as of May 9, 2014. Yet, the NYSE Arca Pharmaceutical Index has risen over 9% over the same time period. Further, a few social media stocks have struggled in 2014 (LNKD & TWTR) while some large cap technology companies (AAPL, CSCO, MSFT & ORCL) have achieved strong, positive returns so far in 2014. A shift in focus by investors towards profitable growth and cash generation could be very healthy for the equity markets.
As we mentioned in our last letter to shareholders, we thought the Federal Reserve would begin tapering its third round of quantitative easing. Based upon current trends and recent speeches by Federal Reserve Chair Yellen, it appears that Quantitative Easing 3 (QE3) will indeed terminate by the end of 2014. However, the Federal Reserve has also indicated that they plan to keep the Federal Funds rate low. Given the recent slowdown in homebuilding and mortgage applications, maintaining the current Federal Funds policy seems appropriate for now. Analyzing economic trends outside of the U.S., the European economic recovery has gathered strength and recent Eurozone Purchasing Managers Index (PMI) data shows that the recovery there is broad-based, geographically. While China continues to grow at a respectable pace, in excess of 7%, its economic growth is reaching a mature phase, albeit still pretty fast! China’s government is committed to support continued growth and has already introduced economic stimulus plans to ensure its success. As such, we remain constructive on the equity markets and believe that we may be at the early stages of synchronous movement in global growth.
| | |
Annual Report | April 30, 2014 | | 1 |
| | |
| Stonebridge Small-Cap Growth Fund | | Letter to Shareholders |
April 30, 2014 (Unaudited) |
The Fund’s investments performed well from an absolute return perspective during the 2014 fiscal year. Our best performing stocks came out of the consumer discretionary sector which on average rose over 44% during the last year. Our financial investments also did well, rising over 26% during the fiscal year despite our hesitancy towards the economic sector. Our third best sector was health care where the stocks on average rose over 18%. On the other hand, our materials stocks performed the worst as result of company specific issues and declining gold prices.
STONEBRIDGE SMALL-CAP GROWTH FUND
For the six months ending April 30, 2014, the Stonebridge Small-Cap Growth Fund rose 2.79% while the Russell 2000® Growth Index returned 1.27% over the same period. During this period, the Fund kept its sector allocations relatively constant with the exception of the increased weighting towards the energy sector. The technology and health care sectors remain key areas of focus for the Fund’s investment strategy, as the investment team continues to identify businesses that have strong growth profiles due to industry-leading innovation. As mentioned in our semi-annual letter to shareholders last November, the Fund increased its exposure to energy stocks and we continue to have a significant overweight position relative to our benchmark, the Russell 2000® Growth Index. So far, this tactical position has performed well since both natural gas prices and crude oil prices have increased since October 31, 2013. The Fund continues to favor industrial companies with advanced technology in niche markets that benefit from long-term secular growth drivers. And while the Fund’s strategy remains cautious on the overall state of consumer spending, it does have investment positions in consumer companies with what we believe are strong growth opportunities and market-leading positions.
Stonebridge Small-Cap Growth Fund (SBSGX) Sector Allocation
as a Percent of Net Assets as of April 30, 2014*
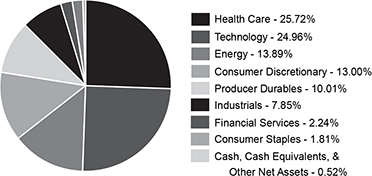
| | * | These allocations may not reflect the current or future position of the portfolio. |
| | |
| 2 | | Stonebridge Small-Cap Growth Fund |
| | |
| Stonebridge Small-Cap Growth Fund | | Letter to Shareholders |
April 30, 2014 (Unaudited) |
Change in value of a $10,000 investment in Stonebridge Small-Cap
Growth Fund (SBSGX) vs. the Russell 2000® Growth Index with Income
from April 30, 2004 to April 30, 2014
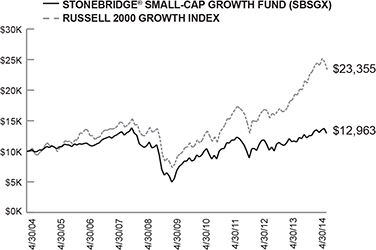
Average Annual Total Returns for the Years Ended April 30, 2014
| | | | | | |
| | | 1 Year | | 5 Years | | 10 Years |
Stonebridge Small-Cap Growth Fund (SBSGX) | | 12.20% | | 13.53% | | 2.63% |
Russell 2000® Growth Index | | 21.46% | | 20.50% | | 8.85% |
Average annual total returns reflect reinvestment of all dividends and capital gains distributions, any fee waivers in effect and any expense reimbursements. Without the fee waivers and expense reimbursements, the total return figures would be lower. Past performance is not indicative of future results and current performance may be lower or higher than the performance quoted. Investment return and principal value will fluctuate and shares, when redeemed, may be worth more or less than their original cost. The total returns shown do not reflect the deduction of taxes that a shareholder would pay on fund distributions or the redemption of fund shares. To obtain the most recent month-end performance, please call the Fund’s toll-free number at 1-800-639-3935.
Effective as of the close of business February 15, 2013, Stonebridge Small-Cap Growth Fund (SBAGX) (the “Acquired Fund”) and Stonebridge Institutional Small-Cap Growth Fund (SBSCX) (the “Acquiring Fund”), each a series of Stonebridge Funds Trust were reorganized into a newly created fund, which is named the Stonebridge Small-Cap Growth Fund (SBSGX) (the “Fund”), under the Financial Investors Trust. The Fund’s performance for periods prior to the close of business February 15, 2013 is that of the Acquiring Fund.
As of the Prospectus dated August 31, 2013, the gross annual expense ratio for the Stonebridge Small-Cap Growth Fund was 3.86%. At April 30, 2014, the Fund’s gross annual expense ratio was 2.25%.
| | |
| Annual Report | April 30, 2014 | | 3 |
| | |
Stonebridge Small-Cap Growth Fund | | Letter to Shareholders |
April 30, 2014 (Unaudited) |
CONCLUSION
In managing the Fund in accordance with its strategy, we seek to identify strong businesses that we believe exhibit competitive advantages, growing market share, and healthy balance sheets, and that are poised to rapidly grow earnings in excess of market expectations. We are positioning the Fund toward those businesses and economic sectors that we believe contain the best opportunities for future growth and investment returns. Although we are most excited about the outlook for technology, health care and energy companies, we believe that we will continue to find opportunities for the Fund across sectors that can deliver solid performance results for shareholders.
Sincerely,
Richard C. Barrett, CFA
Matthew W. Markatos, CFA
Portfolio Managers
Performance quoted above represents past performance. Past Performance does not guarantee future results.
The views and information discussed in this commentary are as of the date of publication, are subject to change, and may not reflect the writer’s current views. The views expressed represent an assessment of market conditions at a specific point in time, are opinions only and should not be relied upon as investment advice regarding a particular investment or markets in general. Such information does not constitute a recommendation to buy or sell specific securities or investment vehicles. It should not be assumed that any investment will be profitable or will equal the performance of the portfolios or any securities or any sectors mentioned herein. The subject matter contained herein has been derived from several sources believed to be reliable and accurate at the time of compilation. Stonebridge Capital Management, Inc. does not accept any liability for losses either direct or consequential caused by the use of this information.
DEFINITIONS:
The Russell 2000® Growth Index is an unmanaged index that measures the performance of those Russell 2000® Index companies with higher price-to-book ratios and higher forecasted growth values. The Russell 2000® Index measures the performance of the 2,000 smallest companies in the Russell 3000® Index, which measures the performance of the 3,000 largest U.S. companies in terms of market capitalization. The Russell 2000® Growth Index is constructed to provide a comprehensive and unbiased barometer of the small-cap growth market. This is a total return index which reflects the reinvestment of income dividends and capital gain distributions, if any, but does not reflect fees, brokerage commissions, or other expenses of investing. The index is not actively managed and does not reflect any deductions for fees, expenses or taxes. An investor may not invest directly in an index.
The NASDAQ Biotechnology Index is a modified market capitalization weighted index designed to measure the performance of all NASDAQ stocks in the biotechnology sector. The index was developed with a base value of 200 as of November 1, 1993. The index is not actively managed and does not reflect any deductions for fees, expenses or taxes. An investor may not invest directly into an index.
| | |
| 4 | | Stonebridge Small-Cap Growth Fund |
| | |
| Stonebridge Small-Cap Growth Fund | | Letter to Shareholders |
April 30, 2014 (Unaudited) |
DEFINITIONS (CONTINUED):
The NYSE Arca Pharmaceutical Index is a capitalization weighted index designed to represent a cross section of widely held, highly capitalized companies involved in various phases of the pharmaceutical industry. The index was developed with a base value of 200 as of July 31, 1991. The index is not actively managed and does not reflect any deductions for fees, expenses or taxes. An investor may not invest directly into an index.
Quantitative easing is an unconventional monetary policy in which a central bank purchases government securities or other securities from the market in order to lower interest rates and increase the money supply.
| | |
| Annual Report | April 30, 2014 | | 5 |
| | |
| Stonebridge Small-Cap Growth Fund | | Disclosure of Fund Expenses |
April 30, 2014 (Unaudited) |
As a shareholder of a Fund, you incur two types of costs: (1) transaction costs (such as the 2% fee on redemption of Fund shares made within 30 days of purchase); and (2) ongoing costs, including management fees and other Fund expenses. The following examples are intended to help you understand your ongoing costs (in dollars) of investing in a Fund and to compare these costs with the ongoing costs of investing in other mutual funds. The examples are based on an investment of $1,000 invested on November 1, 2013 and held until April 30, 2014.
Actual Return — The first line of the following tables provides information about actual account values and actual expenses. You may use the information in this line, together with the amount you invested, to estimate the expenses that you paid over the period. Simply divide your account value by $1,000 (for example, an $8,600 account value divided by $1,000 = 8.6), then multiply the result by the number in the first line under the heading “Expense Paid During Period” to estimate the expenses you paid on your account during this period.
Hypothetical 5% Return — The second line of the following tables provides information about hypothetical account values and hypothetical expenses based on each Fund’s actual expense ratio and an assumed rate of return of 5% per year before expenses, which is not the Fund’s actual return. The hypothetical account values and expenses may not be used to estimate the actual ending account balance or expenses you paid for the period. You may use this information to compare the ongoing costs of investing in a Fund and other mutual funds. To do so, compare this 5% hypothetical example with the 5% hypothetical examples that appear in the shareholder reports of the other funds.
The expenses shown in the table are meant to highlight ongoing Fund costs only and do not reflect transaction fees, such as redemption fees. Therefore, the second line of the table is useful in comparing ongoing costs only, and may not help you determine the relative total costs of owning different funds. If the transaction fees were included, your costs would be higher.
Stonebridge Small-Cap Growth Fund
| | | | | | | | | | | | | | | |
| | | Beginning Account
Value at 11/01/13 | | Ending Account
Value at
4/30/14(1) | | Expense Paid During Period 11/01/13 to 4/30/14(2) |
Actual Fund Return | | | $ | 1,000.00 | | | | $ | 1,027.90 | | | | $ | 11.01 | |
Hypothetical Fund Return
(5% return before expenses) | | | $ | 1,000.00 | | | | $ | 1,013.93 | | | | $ | 10.94 | |
| (1) | The Fund’s expense ratios have been annualized based on the Fund’s most recent fiscal half-year expenses. |
| (2) | Expenses are equal to the Fund’s annualized expense ratio multiplied by the average account value over the period, multiplied by the number of days in the most recent fiscal half-year (181)/365 (to reflect the half-year period). |
| | |
| 6 | | Stonebridge Small-Cap Growth Fund |
| | |
| Stonebridge Small-Cap Growth Fund | | Statement of Investments |
April 30, 2014 |
| | | | | | | | |
| | | Shares | | | Market Value | |
COMMON STOCKS (99.48%) | | | | | | | | |
CONSUMER DISCRETIONARY - (13.00%) | | | | | | | | |
Advertising Agencies (1.10%) | | | | | | | | |
Constant Contact, Inc.** | | | 8,000 | | | $ | 206,880 | |
| | | | | | | | |
| | |
Automotive Retail (0.97%) | | | | | | | | |
America’s Car-Mart, Inc.** | | | 5,000 | | | | 180,700 | |
| | | | | | | | |
| | |
Consumer Services (2.54%) | | | | | | | | |
Steiner Leisure, Ltd.** | | | 11,000 | | | | 474,870 | |
| | | | | | | | |
| | |
Education Services (2.91%) | | | | | | | | |
K12, Inc.** | | | 23,000 | | | | 544,640 | |
| | | | | | | | |
| | |
Homebuilding (1.27%) | | | | | | | | |
TRI Pointe Homes, Inc.** | | | 14,750 | | | | 237,033 | |
| | | | | | | | |
| | |
Hotel Leisure (2.07%) | | | | | | | | |
Interval Leisure Group, Inc. | | | 15,000 | | | | 386,550 | |
| | | | | | | | |
| | |
Household Furnishings (2.14%) | | | | | | | | |
Select Comfort Corp.** | | | 21,750 | | | | 400,200 | |
| | | | | | | | |
| | |
TOTAL CONSUMER DISCRETIONARY | | | | | | | 2,430,873 | |
| | | | | | | | |
| | |
CONSUMER STAPLES - (1.81%) | | | | | | | | |
Foods (1.81%) | | | | | | | | |
Chefs’ Warehouse, Inc.** | | | 16,850 | | | | 338,517 | |
| | | | | | | | |
| | |
TOTAL CONSUMER STAPLES | | | | | | | 338,517 | |
| | | | | | | | |
| | |
ENERGY - (13.89%) | | | | | | | | |
Exploration & Production (3.78%) | | | | | | | | |
Halcon Resources Corp.** | | | 53,000 | | | | 292,560 | |
Kodiak Oil & Gas Corp.** | | | 15,000 | | | | 190,650 | |
Resolute Energy Corp.** | | | 30,000 | | | | 225,000 | |
| | | | | | | | |
| | | | | | | 708,210 | |
| | | | | | | | |
Offshore Drilling & Other Services (3.84%) | | | | | | | | |
Atwood Oceanics, Inc.** | | | 14,500 | | | | 718,620 | |
| | | | | | | | |
| | |
Oil Well Equipment & Services (2.36%) | | | | | | | | |
McDermott International, Inc.** | | | 61,000 | | | | 441,030 | |
| | | | | | | | |
See Notes to Financial Statements.
| | |
Annual Report | April 30, 2014 | | 7 |
| | |
| Stonebridge Small-Cap Growth Fund | | Statement of Investments |
April 30, 2014 |
| | | | | | | | |
| | | Shares | | | Market Value | |
ENERGY (continued) | | | | | | | | |
Oilfield Services (1.44%) | | | | | | | | |
Acorn Energy, Inc.** | | | 116,000 | | | $ | 269,120 | |
| | | | | | | | |
| | |
Shipping (2.47%) | | | | | | | | |
Gulfmark Offshore, Inc. Class A | | | 10,250 | | | | 461,352 | |
| | | | | | | | |
| | |
TOTAL ENERGY | | | | | | | 2,598,332 | |
| | | | | | | | |
| | |
FINANCIAL SERVICES - (2.24%) | | | | | | | | |
Financial Data & Systems (2.24%) | | | | | | | | |
Higher One Holdings, Inc.** | | | 70,000 | | | | 419,300 | |
| | | | | | | | |
| | |
TOTAL FINANCIAL SERVICES | | | | | | | 419,300 | |
| | | | | | | | |
| | |
HEALTH CARE - (25.72%) | | | | | | | | |
Biotechnology (4.33%) | | | | | | | | |
Endocyte, Inc.** | | | 21,000 | | | | 380,310 | |
Exact Sciences Corp.** | | | 14,250 | | | | 171,000 | |
ImmunoGen, Inc.** | | | 20,000 | | | | 258,800 | |
| | | | | | | | |
| | | | | | | 810,110 | |
| | | | | | | | |
| | |
Health Care - Technology (2.88%) | | | | | | | | |
Quality Systems, Inc. | | | 36,500 | | | | 539,105 | |
| | | | | | | | |
| | |
Health Care Facilities (1.60%) | | | | | | | | |
VCA Antech, Inc.** | | | 9,750 | | | | 298,643 | |
| | | | | | | | |
| | |
Health Care Services (6.59%) | | | | | | | | |
Accretive Health, Inc.** | | | 18,000 | | | | 144,900 | |
HMS Holdings Corp.** | | | 46,750 | | | | 755,947 | |
IPC The Hospitalist Co., Inc.** | | | 8,200 | | | | 332,100 | |
| | | | | | | | |
| | | | | | | 1,232,947 | |
| | | | | | | | |
| | |
Medical & Dental Instruments & Supplies (0.88%) | | | | | | | | |
Merit Medical Systems, Inc.** | | | 12,700 | | | | 163,449 | |
| | | | | | | | |
| | |
Medical Equipment (9.44%) | | | | | | | | |
Genomic Health, Inc.** | | | 21,500 | | | | 564,160 | |
Luminex Corp.** | | | 37,500 | | | | 720,375 | |
Masimo Corp.** | | | 18,000 | | | | 481,680 | |
| | | | | | | | |
| | | | | | | 1,766,215 | |
| | | | | | | | |
TOTAL HEALTH CARE | | | | | | | 4,810,469 | |
| | | | | | | | |
See Notes to Financial Statements.
| | |
| 8 | | Stonebridge Small-Cap Growth Fund |
| | |
| Stonebridge Small-Cap Growth Fund | | Statement of Investments |
April 30, 2014 |
| | | | | | | | |
| | | Shares | | | Market Value | |
INDUSTRIALS - (7.85%) | | | | | | | | |
Business Services (1.81%) | | | | | | | | |
Performant Financial Corp.** | | | 39,000 | | | $ | 339,690 | |
| | | | | | | | |
| | |
Electronic Components (2.41%) | | | | | | | | |
Polypore International, Inc.** | | | 13,000 | | | | 450,840 | |
| | | | | | | | |
| | |
Machinery (2.37%) | | | | | | | | |
Chart Industries, Inc.** | | | 6,500 | | | | 443,430 | |
| | | | | | | | |
| | |
Scientific Instruments: Control & Filter (1.26%) | | | | | | | | |
Energy Recovery, Inc.** | | | 46,000 | | | | 235,060 | |
| | | | | | | | |
| | |
TOTAL INDUSTRIALS | | | | | | | 1,469,020 | |
| | | | | | | | |
| | |
PRODUCER DURABLES - (10.01%) | | | | | | | | |
Auction Services (0.80%) | | | | | | | | |
Ritchie Bros Auctioneers, Inc. | | | 6,000 | | | | 150,000 | |
| | | | | | | | |
| | |
Construction (2.42%) | | | | | | | | |
Aegion Corp.** | | | 7,250 | | | | 184,802 | |
Great Lakes Dredge & Dock Corp.** | | | 31,000 | | | | 267,530 | |
| | | | | | | | |
| | | | | | | 452,332 | |
| | | | | | | | |
| | |
Engineering & Contracting Services (1.00%) | | | | | | | | |
Mistras Group, Inc.** | | | 8,250 | | | | 187,358 | |
| | | | | | | | |
| | |
Machinery: Agricultural (2.06%) | | | | | | | | |
Titan International, Inc. | | | 22,000 | | | | 385,220 | |
| | | | | | | | |
| | |
Machinery: Industrial (2.76%) | | | | | | | | |
Woodward, Inc. | | | 11,500 | | | | 515,545 | |
| | | | | | | | |
| | |
Truckers (0.97%) | | | | | | | | |
Quality Distribution, Inc.** | | | 14,500 | | | | 182,265 | |
| | | | | | | | |
| | |
TOTAL PRODUCER DURABLES | | | | | | | 1,872,720 | |
| | | | | | | | |
| | |
TECHNOLOGY - (24.96%) | | | | | | | | |
Communications Technology (2.05%) | | | | | | | | |
Riverbed Technology, Inc.** | | | 19,750 | | | | 384,138 | |
| | | | | | | | |
See Notes to Financial Statements.
| | |
| Annual Report | April 30, 2014 | | 9 |
| | |
| Stonebridge Small-Cap Growth Fund | | Statement of Investments |
April 30, 2014 |
| | | | | | | | |
| | | Shares | | | Market Value | |
TECHNOLOGY (continued) | | | | | | | | |
Computer Services Software & Systems (12.97%) | | | | | | | | |
BroadSoft, Inc.** | | | 22,750 | | | $ | 577,395 | |
Jive Software, Inc.** | | | 77,250 | | | | 577,830 | |
Marin Software, Inc.** | | | 37,500 | | | | 351,750 | |
PTC, Inc.** | | | 5,000 | | | | 176,850 | |
ServiceSource International, Inc.** | | | 63,500 | | | | 396,240 | |
Tangoe, Inc.** | | | 23,000 | | | | 345,920 | |
| | | | | | | | |
| | | | | | | 2,425,985 | |
| | | | | | | | |
| | |
Computer Technology (3.09%) | | | | | | | | |
Fusion-io, Inc.** | | | 67,000 | | | | 578,210 | |
| | | | | | | | |
| | |
Electronics (1.82%) | | | | | | | | |
IPG Photonics Corp.** | | | 5,250 | | | | 339,307 | |
| | | | | | | | |
| | |
Semiconductors & Components (3.07%) | | | | | | | | |
EZchip Semiconductor, Ltd.** | | | 24,000 | | | | 574,800 | |
| | | | | | | | |
| | |
Telecom Equipment (1.96%) | | | | | | | | |
8x8, Inc.** | | | 37,750 | | | | 366,175 | |
| | | | | | | | |
| | |
TOTAL TECHNOLOGY | | | | | | | 4,668,615 | |
| | | | | | | | |
| | |
TOTAL COMMON STOCKS (Cost $18,391,701) | | | | | | | 18,607,846 | |
| | | | | | | | |
| | |
MONEY MARKET MUTUAL FUNDS (0.78%) | | | | | | | | |
Fidelity® Institutional Money Market | | | | | | | | |
Government Portfolio - Class I (0.01% 7 Day Yield) | | | 144,806 | | | | 144,806 | |
| | | | | | | | |
| | |
TOTAL MONEY MARKET MUTUAL FUNDS (Cost $144,806) | | | | | | | 144,806 | |
| | | | | | | | |
| | |
TOTAL INVESTMENTS (100.26%) (Cost $18,536,507) | | | | | | $ | 18,752,652 | |
LIABILITIES IN EXCESS OF OTHER ASSETS (-0.26%) | | | | | | | (48,167) | |
| | | | | | | | |
NET ASSETS (100.00%) | | | | | | $ | 18,704,485 | |
| | | | | | | | |
| ** | Non-Income Producing Security. |
Common Abbreviations:
Ltd. - Limited.
See Notes to Financial Statements.
| | |
| 10 | | Stonebridge Small-Cap Growth Fund |
| | |
| Stonebridge Small-Cap Growth Fund | | Statement of Investments |
April 30, 2014 |
Holdings are subject to change.
For Fund compliance purposes, the Fund’s industry classifications refer to any one or more of the industry sub-classifications used by one or more widely recognized market indexes or ratings group indexes, and/or as defined by Fund management. This definition may not apply for purposes of this report, which may combine industry sub-classifications for reporting ease. Industries are shown as a percentage of net assets.
See Notes to Financial Statements.
| | |
| Annual Report | April 30, 2014 | | 11 |
| | |
| Stonebridge Small-Cap Growth Fund | | Statement of Assets and Liabilities |
April 30, 2014 |
| | | | |
ASSETS: | | | | |
Investments, at value | | $ | 18,752,652 | |
Receivable for investments sold | | | 118,516 | |
Prepaid and other assets | | | 7,536 | |
| | | | |
Total assets | | | 18,878,704 | |
| | | | |
| |
LIABILITIES: | | | | |
Payable for investments purchased | | | 122,383 | |
Advisory fees payable | | | 11,751 | |
Administration and fund accounting fees payable | | | 6,784 | |
Payable for transfer agent fees | | | 8,800 | |
Payable for professional fees | | | 16,826 | |
Payable for trustee fees and expenses | | | 160 | |
Payable for chief compliance officer fees | | | 1,713 | |
Accrued expenses and other liabilities | | | 5,802 | |
| | | | |
Total liabilities | | | 174,219 | |
| | | | |
Net Assets | | $ | 18,704,485 | |
| | | | |
| |
COMPOSITION OF NET ASSETS: | | | | |
Paid-in capital (Note 5) | | $ | 17,393,481 | |
Accumulated net realized gain on investments | | | 1,094,859 | |
Net unrealized appreciation in value of investments | | | 216,145 | |
| | | | |
Net Assets | | $ | 18,704,485 | |
| | | | |
| |
NET ASSET VALUE PER SHARE: | | | | |
Net Assets | | $ | 18,704,485 | |
Shares outstanding | | | 1,986,117 | |
Net asset value and redemption price per share* | | $ | 9.42 | |
| | | | |
| |
Investments, at cost | | $ | 18,536,507 | |
| | | | |
| * | A charge of 2% is imposed on the redemption proceeds of shares held 30 days or less. |
See Notes to Financial Statements.
| | |
| 12 | | Stonebridge Small-Cap Growth Fund |
| | |
| Stonebridge Small-Cap Growth Fund | | Statement of Operations |
For the Year Ended April 30, 2014 |
| | | | |
INCOME: | |
Dividends | | $ | 31,723 | |
Foreign taxes withheld on dividends | | | (1,722) | |
| | | | |
Total Income | | | 30,001 | |
| | | | |
|
EXPENSES: | |
Investment advisory fees (Note 6) | | | 143,453 | |
Administration fees | | | 75,173 | |
Transfer agent fees | | | 83,499 | |
Fund accounting fees and expenses | | | 3,280 | |
Custodian fees | | | 4,961 | |
Professional fees | | | 27,776 | |
Printing fees | | | 21,554 | |
Registration fees | | | 13,741 | |
Trustee fees and expenses | | | 734 | |
Chief compliance officer fees | | | 20,047 | |
Proxy voting fees | | | 4,836 | |
Insurance | | | 24,683 | |
Other | | | 6,110 | |
| | | | |
Total Expenses | | | 429,847 | |
| | | | |
Net Investment Loss | | | (399,846) | |
| | | | |
|
REALIZED AND UNREALIZED GAIN/(LOSS) ON INVESTMENTS: | |
Net realized gain on investments | | | 2,637,902 | |
Change in net unrealized depreciation of investments | | | (82,960) | |
| | | | |
Net Realized and Unrealized Gain on Investments | | | 2,554,942 | |
| | | | |
Net Increase in Net Assets Resulting From Operations | | $ | 2,155,096 | |
| | | | |
See Notes to Financial Statements.
| | |
Annual Report | April 30, 2014 | | 13 |
| | |
| Stonebridge Small-Cap Growth Fund | | Statements of Changes in Net Assets |
| | | | | | | | | | | | |
| | | For the Year Ended April 30, 2014 | | | For the Six
Months Ended
April 30, 2013 | | | For the Year Ended October 31, 2012 | |
| |
OPERATIONS: | | | | | | | | | | | | |
Net investment loss | | $ | (399,846) | | | $ | (258,687) | | | $ | (448,620) | |
Net realized gain on investments | | | 2,637,902 | | | | 1,105,564 | | | | 1,426,818 | |
Change in net unrealized depreciation of investments | | | (82,960) | | | | (599,341) | | | | (192,178) | |
| | | | |
Increase in Net Assets Resulting from Operations | | | 2,155,096 | | | | 247,536 | | | | 786,020 | |
| | | | |
| | | |
DISTRIBUTIONS (Note 3): | | | | | | | | | | | | |
From net realized gains | | | (746,920) | | | | - | | | | - | |
| | | | |
Total distributions | | | (746,920) | | | | - | | | | - | |
| | | | |
| | | |
CAPITAL SHARE TRANSACTIONS (NOTE 5): | | | | | | | | | | | | |
Net increase/(decrease) in shareholder activity derived from beneficial interest transactions, net of redemption fees | | | (545,370) | | | | 4,921,322 | | | | (569,776) | |
| | | | |
| | | |
NET INCREASE IN NET ASSETS | | | 862,806 | | | | 5,168,858 | | | | 216,244 | |
| | | |
NET ASSETS: | | | | | | | | | | | | |
Beginning of period | | | 17,841,679 | | | | 12,672,821 | | | | 12,456,577 | |
| | | | |
End of period* | | $ | 18,704,485 | | | $ | 17,841,679 | | | $ | 12,672,821 | |
| | | | |
| | | |
* Includes accumulated net investment loss of: | | $ | – | | | $ | (151,799) | | | $ | (381,403) | |
See Notes to Financial Statements.
| | |
| 14 | | Stonebridge Small-Cap Growth Fund |
Page Intentionally Left Blank.
Stonebridge Small-Cap Growth Fund
For a share outstanding through the periods presented
|
| PER SHARE DATA |
Net asset value, beginning of period |
|
| INCOME/(LOSS) FROM INVESTMENT OPERATIONS: |
Net investment loss |
Net realized and unrealized gain on investments |
Total Income/(Loss) from Investment Operations |
|
| DISTRIBUTIONS TO SHAREHOLDERS: |
From net realized gain on investments |
Total Distributions to Shareholders |
Net Increase/(Decrease) in Net Asset Value |
Net asset value, end of period |
Total Return |
|
| Ratios & Supplemental Data: |
Net assets, end of period (in 000s) |
Ratios to average net assets: |
Expenses (excluding fee waivers) |
Expenses (including fee waivers) |
Net investment loss (including fee waivers) |
Portfolio Turnover Rate(5)
| (1) | The Fund’s fiscal year end changed from October 31st to April 30th. See Note 1. |
| (2) | Calculated using the average shares method. |
| (3) | Total return not annualized for periods less than one full year. |
| (5) | Portfolio turnover rate for periods less than one full year have not been annualized. |
See Notes to Financial Statements.
| | |
| 16 | | Stonebridge Small-Cap Growth Fund |
Financial Highlights
| | | | | | | | | | | | | | | | | | | | | | | | | | | | |
Year Ended
April 30, 2014 | | Six Months Ended April 30, 2013(1) | | Year Ended
October 31, 2012 | | Year Ended
October 31,
2011 | | Year Ended
October 31,
2010 | | Year Ended
October 31,
2009 |
| | | | | | | | | | | | | | | | | | | | | | | | | | | | | |
| | | $8.74 | | | | | $8.42 | | | | | $7.90 | | | | | $7.91 | | | | | $6.38 | | | | | $5.35 | |
| | | | | |
| | | | | | | | | | | | | | | | | | | | | | | | | | | | | |
| | | (0.20)(2) | | | | | (0.15)(2) | | | | | (0.30) | | | | | (0.26) | | | | | (0.24) | | | | | (0.18) | |
| | | 1.26 | | | | | 0.47 | | | | | 0.82 | | | | | 0.25 | | | | | 1.77 | | | | | 1.21 | |
| | | 1.06 | | | | | 0.32 | | | | | 0.52 | | | | | (0.01) | | | | | 1.53 | | | | | 1.03 | |
| | | | | |
| | | | | | | | | | | | | | | | | | | | | | | | | | | | | |
| | | (0.38) | | | | | – | | | | | – | | | | | – | | | | | – | | | | | – | |
| | | (0.38) | | | | | – | | | | | – | | | | | – | | | | | – | | | | | – | |
| | | 0.68 | | | | | 0.32 | | | | | 0.52 | | | | | (0.01) | | | | | 1.53 | | | | | 1.03 | |
| | | | | | | | | | | | | | | | | | | | | | | | | | | | | |
| | | $9.42 | | | | | $8.74 | | | | | $8.42 | | | | | $7.90 | | | | | $7.91 | | | | | $6.38 | |
| | | | | | | | | | | | | | | | | | | | | | | | | | | | | |
| | | 12.20% | | | | | 3.80%(3) | | | | | 6.58% | | | | | (0.13)% | | | | | 23.98% | | | | | 19.25% | |
| | | | | | | | | | | | | | | | | | | | | | | | | | | | | |
| | | | | |
| | | | | | | | | | | | | | | | | | | | | | | | | | | | | |
| | | $18,704 | | | | | $17,842 | | | | | $12,673 | | | | | $12,457 | | | | | $13,492 | | | | | $11,767 | |
| | | | | | | | | | | | | | | | | | | | | | | | | | | | | |
| | | N/A | | | | | N/A | | | | | N/A | | | | | N/A | | | | | 3.48% | | | | | N/A | |
| | | | | | | | | | | | | | | | | | | | | | | | | | | | | |
| | | 2.25% | | | | | 3.86%(4) | | | | | 3.89% | | | | | 3.36% | | | | | 3.40% | | | | | 3.85% | |
| | | | | | | | | | | | | | | | | | | | | | | | | | | | | |
| | | (2.09)% | | | | | (3.52)%(4) | | | | | (3.58)% | | | | | (2.96)% | | | | | (3.19)% | | | | | (3.34)% | |
| | | | | | | | | | | | | | | | | | | | | | | | | | | | | |
| | | 152% | | | | | 89% | | | | | 222% | | | | | 195% | | | | | 115% | | | | | 137% | |
| | | | | | | | | | | | | | | | | | | | | | | | | | | | | |
| | |
Annual Report | April 30, 2014 | | 17 |
| | |
| Stonebridge Small-Cap Growth Fund | | Notes to Financial Statements |
April 30, 2014 |
1. ORGANIZATION
Financial Investors Trust (the “Trust”), a Delaware statutory trust, is an open-end management investment company registered under the Investment Company Act of 1940, as amended (“1940 Act”). As of April 30, 2014, the Trust had 30 registered funds. This annual report describes the Stonebridge Small-Cap Growth Fund (prior to the close of business on February 15, 2013 known as the Stonebridge Institutional Small-Cap Growth Fund) (the “Fund”). The Fund seeks long-term capital growth by investing primarily in common stocks of companies that Stonebridge Capital Management, Inc. (the “Adviser”), the investment adviser of the Fund, believes have good prospects for above average earnings growth.
The Fund is a successor to a previously operational fund which was a series of the Stonebridge Funds Trust, a Delaware statutory trust, and was organized into a series of the Trust effective as of the close of business on February 15, 2013. As a result, the Fund’s fiscal year end changed from October 31st to April 30th.
2. SIGNIFICANT ACCOUNTING POLICIES
The accompanying financial statements were prepared in accordance with accounting principles generally accepted in the United States of America (“U.S. GAAP”). The preparation of financial statements in conformity with U.S. GAAP requires management to make certain estimates and assumptions that affect the reported amounts of assets and liabilities and disclosures of contingent assets and liabilities at the date of the financial statements and the reported amounts of revenue and expenses during the period. Actual results could differ from those estimates. The following is a summary of significant accounting policies consistently followed by the Fund in preparation of its financial statements.
Investment Valuation: The Fund generally values its securities based on market prices determined at the close of regular trading on the New York Stock Exchange (“NYSE”), normally 4:00 p.m. Eastern Time, on each day the NYSE is open for trading.
For equity securities and mutual funds that are traded on an exchange, the market price is usually the closing sale or official closing price on that exchange. In the case of equity securities not traded on an exchange, or if such closing prices are not otherwise available, the securities are valued at the mean of the most recent bid and ask prices on such day. Redeemable securities issued by open-end registered investment companies are valued at the investment company’s applicable net asset value, with the exception of exchange-traded open-end investment companies, which are priced as equity securities.
Short-term debt obligations that will mature in 60 days or less are valued at amortized cost, unless it is determined that using this method would not reflect an investment’s fair value. Investments in non-exchange traded funds are fair valued at their respective net asset values.
When such prices or quotations are not available, or when the Fair Value Committee appointed by the Board of Trustees (the “Board”) believes that they are unreliable, securities may be priced using fair value procedures approved by the Board.
Fair Value Measurements: The Fund discloses the classification of its fair value measurements following a three-tier hierarchy based on the inputs used to measure fair value. Inputs refer broadly to the assumptions that market participants would use in pricing the asset or liability,
| | |
| 18 | | Stonebridge Small-Cap Growth Fund |
| | |
| Stonebridge Small-Cap Growth Fund | | Notes to Financial Statements |
April 30, 2014 |
including assumptions about risk. Inputs may be observable or unobservable. Observable inputs reflect the assumptions market participants would use in pricing the asset or liability that are developed based on market data obtained from sources independent of the reporting entity.
Unobservable inputs reflect the reporting entity’s own assumptions about the assumptions market participants would use in pricing the asset or liability that are developed based on the best information available.
Various inputs are used in determining the value of the Fund’s investments as of the end of the reporting period. When inputs used fall into different levels of the fair value hierarchy, the level in the hierarchy within which the fair value measurement falls is determined based on the lowest level input that is significant to the fair value measurement in its entirety. The designated input levels are not necessarily an indication of the risk or liquidity associated with these investments. These inputs are categorized in the following hierarchy under applicable financial accounting standards:
| | |
Level 1 – | | Unadjusted quoted prices in active markets for identical investments, unrestricted assets or liabilities that the Fund has the ability to access at the measurement date; |
| |
Level 2 – | | Quoted prices which are not active, quoted prices for similar assets or liabilities in active markets or inputs other than quoted prices that are observable (either directly or indirectly) for substantially the full term of the asset or liability; and |
| |
Level 3 – | | Significant unobservable prices or inputs (including the Fund’s own assumptions in determining the fair value of investments) where there is little or no market activity for the asset or liability at the measurement date. |
The following is a summary of each input used to value the Fund as of April 30, 2014:
| | | | | | | | | | | | | | | | |
| | | Valuation Inputs | | | | |
| Investments in Securities at Value* | | Level 1 | | | Level 2 | | | Level 3 | | | Total | |
Common Stocks | | $ | 18,607,846 | | | $ | – | | | | $ – | | | $ | 18,607,846 | |
Money Market Mutual Funds | | | 144,806 | | | | – | | | | – | | | | 144,806 | |
Total | | $ | 18,752,652 | | | $ | – | | | | $ – | | | $ | 18,752,652 | |
| | | | | | | | | | | | | | | | | |
*For detailed Industry descriptions, see the accompanying Statement of Investments.
The Fund recognizes transfers between levels as of the end of the period. For the year ended April 30, 2014, the Fund did not have any transfers between Level 1 and Level 2 securities. For the year ended April 30, 2014, the Fund did not have any securities that used significant unobservable inputs (Level 3) in determining fair value.
Investment Transactions and Investment Income: Investment transactions are accounted for on the date the investments are purchased or sold (trade date). Realized gains and losses from investment transactions are reported on an identified cost basis. Interest income, which includes accretion of discounts, is accrued and recorded as earned. Dividend income is recognized on the ex-dividend date or for certain foreign securities, as soon as information is available to the Fund.
Trust Expenses: Some expenses of the Trust can be directly attributed to the Fund. Expenses which cannot be directly attributed to the Fund are apportioned among all funds in the Trust based on average net assets of each fund.
| | |
| Annual Report | April 30, 2014 | | 19 |
| | |
| Stonebridge Small-Cap Growth Fund | | Notes to Financial Statements |
April 30, 2014 |
Fund Expenses: Expenses that are specific to the Fund are charged directly to the Fund.
Federal Income Taxes: The Fund complies with the requirements under Subchapter M of the Internal Revenue Code of 1986, as amended (the “Code”), applicable to regulated investment companies and intends to distribute substantially all of their net taxable income and net capital gains, if any, each year so that it will not be subject to excise tax on undistributed income and gains. The Fund is not subject to income taxes to the extent such distributions are made.
As of and during the year ended April 30, 2014, the Fund did not have a liability for any unrecognized tax benefits. The Fund files U.S. federal, state, and local tax returns as required. The Fund’s tax returns are subject to examination by the relevant tax authorities until expiration of the applicable statute of limitations, which is generally three years after the filing of the tax return for federal purposes and four years for most state returns. Tax returns for open years have incorporated no uncertain tax positions that require a provision for income taxes.
Distributions to Shareholders: The Fund normally pays dividends and distributes capital gains, if any, on an annual basis. Income dividend distributions are derived from interest and other income the Fund receives from its investments, including short term capital gains. Long term capital gain distributions are derived from gains realized when the Fund sells a security it has owned for more than a year. The Fund may make additional distributions and dividends at other times if the portfolio manager believes doing so may be necessary for the Fund to avoid or reduce taxes.
3. TAX BASIS INFORMATION
Reclassifications: As of April 30, 2014, permanent differences on book and tax accounting were reclassified. These differences had no effect on net assets and were primarily attributed to the netting of a net investment loss. These reclassifications were as follows:
| | | | |
Undistributed Net Investment Income | | $ | 551,645 | |
Accumulated Net Gain on Investments | | | (551,645) | |
Paid-in Capital Gain | | | 0 | |
Tax Basis of Investments: As of April 30, 2014, the aggregate cost of investments, gross unrealized appreciation/(depreciation) and net unrealized appreciation for Federal tax purposes was as follows:
| | | | |
Gross appreciation (excess of value over tax cost) | | $ | 1,590,187 | |
Gross depreciation (excess of tax cost over value) | | | (1,481,578) | |
Net unrealized appreciation | | $ | 108,609 | |
| | | | | |
Cost of investments for income tax purposes | | $ | 18,644,043 | |
| | | | | |
| | |
| 20 | | Stonebridge Small-Cap Growth Fund |
| | |
| Stonebridge Small-Cap Growth Fund | | Notes to Financial Statements |
April 30, 2014 |
Components of Earnings: As of April 30, 2014, components of distributable earnings were as follows:
| | | | |
Undistributed ordinary income | | $ | 962,869 | |
Accumulated captial gains | | | 239,526 | |
Net unrealized appreciation on investments | | | 108,609 | |
Total | | $ | 1,311,004 | |
| | | | | |
During the year ended April 30, 2014, $141,131 of capital loss carryforwards were utilized by the Fund. As of April 30, 2014, the Fund had no capital loss carryfowards remaining.
Tax Basis of Distributions to Shareholders: The character of distributions made during the year from net investment income or net realized gains may differ from its ultimate characterization for federal income tax purposes. Also, due to the timing of dividend distributions, the fiscal year in which amounts are distributed may differ from the fiscal year in which the income or realized gain was recorded by the Fund.
The tax character of distributions paid during the year ended April 30, 2014, were as follows:
| | | | | | | | |
| | | Ordinary Income | | | Long-Term Capital
Gain | |
The Stonebridge Small-Cap Growth Fund | | $ | 218,314 | | | $ | 528,606 | |
No distributions were paid during the period ended April 30, 2013 and year ended October 31, 2012.
4. SECURITIES TRANSACTIONS
The cost of purchases and proceeds from sales of securities (excluding short-term securities) during the year ended April 30, 2014, was as follows:
| | | | | | | | |
| | | Purchases | | | Sales | |
Stonebridge Small-Cap Growth Fund | | $ | 28,582,843 | | | $ | 30,319,461 | |
5. SHARES OF BENEFICIAL INTEREST
The capitalization of the Trust consists of an unlimited number of shares of beneficial interest with no par value per share. Holders of the shares of the Fund of the Trust have one vote for each share held and a proportionate fraction of a vote for each fractional share. All shares issued and outstanding are fully paid and are non-assessable, transferable and redeemable at the option of the shareholder. Shares have no pre-emptive rights.
| | |
| Annual Report | April 30, 2014 | | 21 |
| | |
| Stonebridge Small-Cap Growth Fund | | Notes to Financial Statements |
April 30, 2014 |
Stonebridge Small-Cap Growth Fund
| | | | | | | | | | | | | | | | | | | | | | | | |
| | | Year Ended
April 30,
2014
Shares | | | Year Ended
April 30, 2014
Amount | | | Six Months
Ended
April 30, 2013
Shares | | | Six Months
Ended
April 30, 2013
Amount | | | Year Ended
October 31,
2012
Shares | | | Year Ended
October 31,
2012 Amount | |
Shares sold | | | 11,430 | | | $ | 108,589 | | | | 5,072 | | | $ | 42,935 | | | | 83,169 | | | $ | 720,844 | |
Acquisition | | | – | | | | – | | | | 625,439 | | | | 5,698,600 | | | | – | | | | – | |
Shares issued in reinvestment of dividends | | | 78,468 | | | | 734,465 | | | | – | | | | – | | | | – | | | | – | |
Total | | | 89,898 | | | | 843,054 | | | | 630,511 | | | | 5,741,535 | | | | 83,169 | | | | 720,844 | |
Less shares redeemed, net of redemption fees | | | (144,715) | | | | (1,388,424) | | | | (94,616) | | | | (820,213) | | | | (154,689) | | | | (1,290,620) | |
Net Increase/ (Decrease) | | | (54,817) | | | $ | (545,370) | | | | 535,895 | | | $ | 4,921,322 | | | | (71,520) | | | $ | (569,776) | |
| | | | | | | | | | | | | | | | | | | | | | | | | |
Shares redeemed within 30 days of purchase will incur a 2% short-term redemption fee deducted from the redemption amount. Redemption fees are reflected in the “Net increase/(decrease) in shareholder activity derived from beneficial interest transactions, net of redemption fees” in the Statements of Changes in Net Assets.
For the year ended April 30, 2014, the six months ended April 30, 2013 and the year ended October 31, 2012, the Fund retained redemption fees in the amounts of $0, $0 and $1, respectively.
6. MANAGEMENT AND RELATED-PARTY TRANSACTIONS
The Trust has entered into an advisory agreement with Stonebridge Capital Management, Inc. (the “Adviser”) with respect to the Fund. The advisory agreement has been approved by the Board and shareholders. Pursuant to the advisory agreement with the Trust, the Adviser is entitled to investment advisory fees, computed daily and payable monthly at an annual rate of 0.75% of the average daily net assets of the Fund.
Fund Adminstrator Fees and Expenses
ALPS Fund Services, Inc. (“ALPS” and the “Administrator”) (an affiliate of ALPS Distributors, Inc.) serves as administrator to the Fund, and the Fund has agreed to pay expenses incurred in connection with its administrative activities. Pursuant to the Administration, Bookkeeping and Pricing Services Agreement (the “Agreement”), ALPS will provide operational services to the Fund including, but not limited to fund accounting and fund administration and generally assist in the Fund’s operations.
| | |
| 22 | | Stonebridge Small-Cap Growth Fund |
| | |
| Stonebridge Small-Cap Growth Fund | | Notes to Financial Statements |
April 30, 2014 |
Annual Administrative Fee, billed monthly, in the amount of the greater of (a) the annual minimum $75,000 (subject to an annual cost of living increase) or (b) following basis point fee schedule:
| | |
| Average Total Net Assets | | Contractual Fee |
Between $0-$500M | | 0.05% |
$500M-$1B | | 0.03% |
Above $1B | | 0.02% |
The Administrator is also reimbursed by the Fund for certain out-of-pocket expenses.
Transfer Agent
ALPS serves as transfer, dividend paying and shareholder servicing agent for the Fund. ALPS receives an annual minimum fee, a fee based upon the number of shareholder accounts, and is also reimbursed by the Fund for certain out-of-pocket expenses.
Compliance Services
ALPS provides services that assist the Trust’s Chief Compliance Officer in monitoring and testing the policies and procedures of the Trust in conjunction with requirements under Rule 38a-1 under the 1940 Act and receives an annual base fee. ALPS is reimbursed for certain out-of-pocket expenses by the Fund.
Principal Financial Officer
ALPS receives an annual fee for providing principal financial officer services to the Fund.
Distributor
ALPS Distributors, Inc. (“ADI” or the “Distributor”) (an affiliate of ALPS) acts as the distributor of the Fund’s shares pursuant to a Distribution Agreement with the Trust. Shares are sold on a continuous basis by ADI as agent for the Fund, and ADI has agreed to use its best efforts to solicit orders for the sale of the Fund’s shares, although it is not obliged to sell any particular amount of shares. ADI is not entitled to any compensation for its services as Distributor. ADI is registered as a broker-dealer with the Securities and Exchange Commission.
7. INDEMNIFICATIONS
Under the Trust’s organizational documents, its officers and Trustees are indemnified against certain liability arising out of the performance of their duties to the Trust. Additionally, in the normal course of business, the Trust enters into contracts with service providers that may contain general indemnification clauses, which may permit indemnification to the extent permissible under applicable law. The Trust’s maximum exposure under these arrangements is unknown, as this would involve future claims that may be made against the Trust that have not yet occurred.
8. NEW ACCOUNTING PRONOUNCEMENTS
In June 2013, the Financial Accounting Standards Board (the “FASB”) issued Accounting Standards Update (“ASU”) No. 2013-08, Financial Services-Investment Companies (Topic 946): Amendments to the Scope, Measurement, and Disclosure Requirements. The FASB standard identifies characteristics a company must assess to determine whether it is considered an investment company for financial reporting purposes. This ASU is effective for fiscal years beginning after December 15, 2013. The Funds believe the adoption of this ASU will not have a material impact on their financial statements.
| | |
| Annual Report | April 30, 2014 | | 23 |
Report of Independent Registered Public Accounting Firm
To the Shareholders and Board of Trustees of Financial Investors Trust:
We have audited the accompanying statement of assets and liabilities, including the statement of investments, of Stonebridge Small-Cap Growth Fund (the “Fund”), one of the portfolios constituting Financial Investors Trust, as of April 30, 2014, the related statement of operations for the year then ended, and the statements of changes in net assets, and the financial highlights for the year then ended and the period from November 1, 2012 to April 30, 2013. These financial statements and financial highlights are the responsibility of the Fund’s management. Our responsibility is to express an opinion on these financial statements and financial highlights based on our audits. The statement of changes in net assets for the year ended October 31, 2012, and the financial highlights for each of the four years in the period ended October 31, 2012 were audited by other auditors whose report, dated December 11, 2012, expressed an unqualified opinion on such financial statement and financial highlights.
We conducted our audits in accordance with the standards of the Public Company Accounting Oversight Board (United States). Those standards require that we plan and perform the audit to obtain reasonable assurance about whether the financial statements and financial highlights are free of material misstatement. The Fund is not required to have, nor were we engaged to perform, an audit of its internal control over financial reporting. Our audits included consideration of internal control over financial reporting as a basis for designing audit procedures that are appropriate in the circumstances, but not for the purpose of expressing an opinion on the effectiveness of the Fund’s internal control over financial reporting. Accordingly, we express no such opinion. An audit also includes examining, on a test basis, evidence supporting the amounts and disclosures in the financial statements, assessing the accounting principles used and significant estimates made by management, as well as evaluating the overall financial statement presentation. Our procedures included confirmation of securities owned as of April 30, 2014, by correspondence with the custodian and brokers, where replies were not received from brokers, we performed other auditing procedures. We believe that our audits provide a reasonable basis for our opinion.
In our opinion, the financial statements and financial highlights referred to above present fairly, in all material respects, the financial position of Stonebridge Small-Cap Growth Fund of Financial Investors Trust as of April 30, 2014, the results of its operations for the year then ended, and the changes in its net assets and the financial highlights for the year then ended and the period from November 1, 2012 to April 30, 2013, in conformity with accounting principles generally accepted in the United States of America.
DELOITTE & TOUCHE LLP
Denver, Colorado
June 26, 2014
| | |
| 24 | | Stonebridge Small-Cap Growth Fund |
| | |
| Stonebridge Small-Cap Growth Fund | | Additional Information |
April 30, 2014 (Unaudited) |
1. FUND HOLDINGS
The Fund files its complete schedule of portfolio holdings with the Securities and Exchange Commission (the “SEC”) for the first and third quarters of each fiscal year on Form N-Q within 60 days after the end of the period. Copies of the Fund’s Form N-Q are available without charge on the SEC website at http://www.sec.gov. You may also review and copy the Form N-Q at the SEC’s Public Reference Room in Washington, DC. For more information about the operation of the Public Reference Room, please call the SEC at 1-800-SEC-0330.
2. FUND PROXY VOTING POLICIES, PROCEDURES AND SUMMARIES
The Fund’s policies and procedures used in determining how to vote proxies and information regarding how the Fund voted proxies relating to portfolio securities during the most recent prior 12-month period ending June 30 are available without charge, (1) upon request, by calling (toll-free) 800-639-3935 and (2) on the SEC’s website at http://www.sec.gov.
3. TAX DESIGNATIONS
The Funds designate the following for federal income tax purposes for the calendar year ended December 31, 2013:
| | | | |
| | | Qualified Dividend
Income | | Dividend Received
Deduction |
Stonebridge Small-Cap Growth Fund | | 0.00% | | 0.00% |
Pursuant to Section 852(b)(3) of the Internal Revenue Code, the Stonebridge Small-Cap Growth Fund designated $528,606 as long-term capital gain dividends.
Please consult a tax advisor if you have questions about federal or state income tax laws, or how to prepare your tax returns.
| | |
Annual Report | April 30, 2014 | | 25 |
| | |
| Stonebridge Small-Cap Growth Fund | | Trustees & Officers |
April 30, 2014 (Unaudited) |
Additional information regarding the Fund’s trustees is included in the Statement of Additional Information, which can be obtained without charge by calling 800-639-3935.
INDEPENDENT TRUSTEES
| | | | | | | | | | |
Name,
Address*
& Year of
Birth | | Position(s)
Held with
Fund | | Term of Office and Length of Time Served** | | Principal Occupation(s) During Past 5 Years*** | | Number of
Funds in
Fund
Complex
Overseen by Trustee**** | | Other Directorships Held by Trustee |
Mary K. Anstine, 1940 | | Trustee | | Ms. Anstine was elected at a special meeting of shareholders held on March 21, 1997 and re-elected at a special meeting of shareholders held on August 7, 2009. | | Ms. Anstine was President/Chief Executive Officer of HealthONE Alliance, Denver, Colorado, and former Executive Vice President of First Interstate Bank of Denver. Ms. Anstine is also Trustee/Director of AV Hunter Trust and Colorado Uplift Board. Ms. Anstine was formerly a Director of the Trust Bank of Colorado (later purchased and now known as Northern Trust Bank), HealthONE and Denver Area Council of the Boy Scouts of America, and a member of the American Bankers Association Trust Executive Committee. | | 30 | | Ms. Anstine is a Trustee of ALPS ETF Trust (21 funds); ALPS Variable Investment Trust (8 funds); Reaves Utility Income Fund (1 fund); and Westcore Trust (12 funds). |
John R. Moran, Jr., 1930 | | Trustee | | Mr. Moran was elected at a special meeting of shareholders held on March 21, 1997 and re-elected at a special meeting of shareholders held on August 7, 2009. | | Mr. Moran is formerly President and CEO of The Colorado Trust, a private foundation serving the health and hospital community in the state of Colorado Currently, Mr. Moran is a member of the Treasurer’s Investment Advisory Committee for the University of Colorado. | | 30 | | None. |
| | |
| 26 | | Stonebridge Small-Cap Growth Fund |
| | |
| Stonebridge Small-Cap Growth Fund | | Trustees & Officers |
April 30, 2014 (Unaudited) |
| | | | | | | | | | |
Name,
Address*
& Year of
Birth | | Position(s)
Held with
Fund | | Term of Office and Length of Time Served** | | Principal Occupation(s) During Past 5 Years*** | | Number of
Funds in
Fund
Complex
Overseen by Trustee**** | | Other Directorships Held by Trustee |
Jeremy W. Deems, 1976 | | Trustee | | Mr. Deems was appointed as a Trustee at the March 11, 2008 meeting of the Board of Trustees and elected at a special meeting of shareholders held on August 7, 2009. | | Mr. Deems is the Co-Founder, Chief Operations Officer and Chief Financial Officer of Green Alpha Advisors, LLC. Mr. Deems is Co-Portfolio Manager of the Shelton Green Alpha Fund. Prior to joining Green Alpha Advisors, Mr. Deems was CFO and Treasurer of Forward Management, LLC, ReFlow Management Co., LLC, ReFlow Fund, LLC, a private investment fund, and Sutton Place Management, LLC, an administrative services company, from 2004 to June 2007. | | 30 | | Mr. Deems is a Trustee of ALPS ETF Trust (21 funds); ALPS Variable Investment Trust (8 funds) and Reaves Utility Income Fund (1 fund). |
Jerry G. Rutledge, 1944 | | Trustee | | Mr. Rutledge was elected at a special meeting of shareholders held on August 7, 2009. | | Mr. Rutledge is the President and owner of Rutledge’s Inc., a retail clothing business. He was from 1994 to 2007 a Regent of the University of Colorado. | | 30 | | Mr. Rutledge is a Trustee of Principal Real Estate Income Fund (1 fund), Clough Global Allocation Fund (1 fund), Clough Global Equity Fund (1 fund) and Clough Global Opportunities Fund (1 fund). |
| * | All communications to Trustees and Officers may be directed to Financial Investors Trust c/o 1290 Broadway, Suite 1100, Denver, CO 80203. |
| ** | This is the period for which the Trustee or Officer began serving the Trust. Each Trustee and/or Officer serves an indefinite term, until his successor is elected. |
| *** | Except as otherwise indicated, each individual has held the office shown or other offices in the same company for the last five years. |
| **** | The Fund Complex includes all series of the Trust (currently 30) and any other investment companies for which any Trustee serves as Trustee for and which Stonebridge Capital Management, Inc. provides investment advisory services (currently none). |
| | |
| Annual Report | April 30, 2014 | | 27 |
| | |
| Stonebridge Small-Cap Growth Fund | | Trustees & Officers |
April 30, 2014 (Unaudited) |
| | | | | | | | | | |
Name,
Address*
& Year of
Birth | | Position(s)
Held with
Fund | | Term of Office and Length of Time Served** | | Principal Occupation(s) During Past 5 Years*** | | Number of Funds in Fund Complex Overseen by
Trustee**** | | Other Directorships Held by Trustee |
Michael “Ross” Shell , 1970 | | Trustee | | Mr. Shell was elected at a special meeting of shareholders held on August 7, 2009. | | Mr. Shell is Founder and CEO of Red Idea, LLC, a strategic consulting/early stage venture firm (since June 2008). From 1999 to 2009, he was a part-owner and Director of Tesser, Inc., a brand agency. From December 2005 to May 2008, he was Director, Marketing and Investor Relations, of Woodbourne, a REIT/real estate hedge fund and private equity firm. Prior to this, from May 2004 to November 2005, he worked as a business strategy consultant; from June 2003 to April 2004, he was on the Global Client Services team of IDEO, a product design/innovation firm; and from 1999 to 2003, he was President of Tesser, Inc. Mr. Shell graduated with honors from Stanford University with a degree in Political Science. | | 30 | | None. |
| | |
| 28 | | Stonebridge Small-Cap Growth Fund |
| | |
| Stonebridge Small-Cap Growth Fund | | Trustees & Officers |
April 30, 2014 (Unaudited) |
INTERESTED TRUSTEE
| | | | | | | | | | |
Name,
Address*
& Year of
Birth | | Position(s) Held with Fund | | Term of Office and Length of Time
Served** | | Principal Occupation(s) During Past 5 Years*** | | Number of
Funds in
Fund
Complex
Overseen by
Trustee**** | | Other Directorships Held by Trustee |
| Edmund J. Burke, 1961 | | Trustee, Chairman and President | | Mr. Burke was elected as Chairman at the August 28, 2009 meeting of the Board of Trustees. Mr. Burke was elected as Trustee at a special meeting of shareholders held on August 7, 2009. Mr. Burke was elected President of the Trust at the December 17, 2002 meeting of the Board of Trustees. | | Mr. Burke is President and a Director of ALPS Holdings, Inc. (“AHI”) (since 2005) and Director of Boston Financial Data Services, Inc. (“BFDS”), ALPS Advisors, Inc. (“AAI”), ALPS Distributors, Inc. (“ADI”), ALPS Fund Services, Inc. (“AFS”) and ALPS Portfolio Solutions Distributor, Inc. (“APSD”) and from 2001-2008, was President of AAI, ADI, AFS and APSD. Because of his positions with AHI, BFDS, AAI, ADI, AFS and APSD, Mr. Burke is deemed an affiliate of the Trust as defined under the 1940 Act. Mr. Burke is Trustee and President of the Clough Global Allocation Fund (Trustee since 2006; President since 2004); Trustee and President of the Clough Global Equity Fund (Trustee since 2006; President since 2005); Trustee and President of the Clough Global Opportunities Fund (since 2006); Trustee of the Liberty All-Star Equity Fund; and Director of the Liberty All-Star Growth Fund, Inc. | | 30 | | Mr. Burke is a Trustee of Clough Global Allocation Fund (1 fund); Clough Global Equity Fund (1 fund); Clough Global Opportunities Fund (1 fund); Trustee of the Liberty All-Star Equity Fund (1 fund); and Director of the Liberty All-Star Growth Fund, Inc. (1 fund). |
| * | All communications to Trustees and Officers may be directed to Financial Investors Trust c/o 1290 Broadway, Suite 1100, Denver, CO 80203. |
| ** | This is the period for which the Trustee or Officer began serving the Trust. Each Trustee and/or Officer serves an indefinite term, until his successor is elected. |
| *** | Except as otherwise indicated, each individual has held the office shown or other offices in the same company for the last five years. |
| **** | The Fund Complex includes all series of the Trust (currently 30) and any other investment companies for which any Trustee serves as Trustee for and which Stonebridge Capital Management, Inc. provides investment advisory services (currently none). |
| | |
| Annual Report | April 30, 2014 | | 29 |
| | |
| Stonebridge Small-Cap Growth Fund | | Trustees & Officers |
April 30, 2014 (Unaudited) |
OFFICERS
| | | | | | |
Name,
Address*
& Year of
Birth | | Position(s)
Held with
Fund | | Term of Office and Length of Time Served** | | Principal Occupation(s) During Past 5 Years*** |
Kimberly R. Storms, 1972 | | Treasurer | | Ms. Storms was elected Treasurer of the Trust at the March 12, 2013 meeting of the Board of Trustees. | | Ms. Storms is Senior Vice President - Director of Fund Administration of ALPS. Ms. Storms joined ALPS in 1998 as Assistant Controller. Because of her position with ALPS, Ms. Storms is deemed an affiliate of the Trust as defined under the 1940 Act. Ms. Storms is also Treasurer of BPV Family of Funds and ALPS Series Trust; Assistant Treasurer of Liberty All-Star Equity Fund and Liberty All-Star Growth Fund, Inc.; Assistant Treasurer of Tilson Funds; and Chief Financial Officer of The Arbitrage Funds. |
David T. Buhler, 1971 | | Secretary | | Mr. Buhler was elected Secretary of the Trust at the September 11, 2012 meeting of the Board of Trustees. | | Mr. Buhler joined ALPS in June 2010. He is currently Vice President and Senior Associate Counsel of ALPS, AAI, ADI and APSD. Prior to joining ALPS, Mr. Buhler served as Associate General Counsel and Assistant Secretary of Founders Asset Management LLC from 2006 to 2009. Because of his position with ALPS, Mr. Buhler is deemed an affiliate of the Trust as defined under the 1940 Act. Mr. Buhler is also the Secretary ALPS Variable Investment Trust and Westcore Trust. |
Ted Uhl, 1974 | | Chief Compliance Officer (“CCO”) | | Mr. Uhl was appointed CCO of the Trust at the June 8, 2010 meeting of the Board of Trustees. | | Mr. Uhl joined ALPS in October 2006, and is currently Deputy Compliance Officer of ALPS. Prior to his current role, Mr. Uhl served as Senior Risk Manager for ALPS from October 2006 until June 2010. Before joining ALPS, Mr. Uhl served a Sr. Analyst with Enenbach and Associates (RIA), and a Sr. Financial Analyst at Sprint. Because of his position with ALPS, Mr. Uhl is deemed an affiliate of the Trust as defined under the 1940 Act. Mr. Uhl is also CCO of the Clough Global Funds, Reaves Utility Income Fund, Drexel Hamilton Funds and Transparent Value Trust. |
| * | All communications to Trustees and Officers may be directed to Financial Investors Trust c/o 1290 Broadway, Suite 1100, Denver, CO 80203. |
| ** | This is the period for which the Trustee or Officer began serving the Trust. Each Trustee and/or Officer serves an indefinite term, until his successor is elected. |
| *** | Except as otherwise indicated, each individual has held the office shown or other offices in the same company for the last five years. |
| | |
| 30 | | Stonebridge Small-Cap Growth Fund |
Page Intentionally Left Blank
This report and its financial statements are submitted for the general information of the shareholders of the Fund. The report is not
authorized for distribution to prospective investors in the Fund unless preceded or accompanied by a prospectus.
TABLE OF CONTENTS
| | |
| Pathway Advisors Funds | | Shareholder Letter |
April 30, 2014 (Unaudited) |
May 15, 2014
Dear Shareholder:
With just a few months short of our two year mark in the Funds, we are continuing to see interest in the Pathway opportunity for investors wanting an alternative to their 401k options. Below is a table of the performance for the year ended April 30, 2014, as well as our annualized performance since the Fund's inception on 7/30/12.
| | | | | | | | | | |
| | | Year Ended | | |
| | | | | April 30, 2014 | | | | | Since Inception* | |
Pathway Advisors Conservative Fund | | | | 2.53% | | | | | 5.21% | |
Pathway Advisors Growth & Income Fund | | | | 7.17% | | | | | 9.66% | |
Pathway Advisors Aggressive Growth Fund | | | | 12.05% | | | | | 15.67% | |
| * | The Funds’ inception date is July 30, 2012. |
The performance data quoted represents past performance. Past performance does not guarantee future results. The investment return and principal value of an investment will fluctuate so that an Investor’s shares, when redeemed, may not be worth more or less than their original cost and current performance may be lower or higher than the performance quoted. To obtain the most recent month-end performance data, please call 1-888-288-1121 or visit www.pathwayadvisorsfunds. com.
Following a very robust equity market in 2013, as measured by the S&P 500, and a falling bond market, as measured by the yield of the 10-year US Treasury bond, 2014 has seen some volatility early in the year as 10-year Treasury yields dropped roughly 40 basis points and as equities dropped nearly 6% in early February. Since then, however, the price of the S&P 500 is now closing in on 1900, while Treasury yields are still near the early February lows at roughly 2.62%. Why the rise in equity prices when the yields have stayed low? Normally, when equities move higher, long-term interest rates also move higher. With the Federal Reserve currently tapering their quantitative easing (QE) of Treasury bonds and mortgage-backed securities, there would naturally be more pressure for yields to move higher. As the economy improves, this would also give rise to the notion that yields should improve. So why have yields declined from the beginning of the year, especially as nearly everyone is saying that yields will and should move higher? We believe the equity and bond markets may be acting this way for a few reasons:
| • | | We are still in a funk where “bad news = good news.” For example, a poor economic report may put pressure on yields to move down (bond prices up) and equity prices to move higher due to the expectation that the Federal Reserve will wait longer to raise interest rates (due to weaker economic data), thereby prolonging quantitative easing, low interest rates and the removal of the “punch bowl” for some investors in risky assets. We don’t believe that this can persist for too long. |
| • | | Yields are low due to macro-economic concerns (e.g. crisis in Ukraine, Russia) and equity investors have viewed this as a less significant risk than bond investors. Either bond yields will move up or equity prices will move down, depending on how serious things turn out to be from an economic standpoint as well as from an investor sentiment standpoint. |
| | |
| Annual Report | April 30, 2014 | | 1 |
| | |
| Pathway Advisors Funds | | Shareholder Letter |
April 30, 2014 (Unaudited) |
| • | | Foreign central banks are increasingly purchasing Treasury bonds for the purposes of increasing their US dollar denominated currency reserves. This, too, will not likely persist for very long. |
We likewise acknowledge that, definitively, no one knows exactly why bond yields and equity prices have moved how they have. What concerns us, however, is if the bond markets are pricing in low inflation and low expected economic growth while the equity markets are looking for higher earnings and revenue growth and sustained high profit margins to justify the current expansion of the price/earnings multiple. In other words, the bond markets may be looking more at the near term and the equity markets may be looking further into the future, especially for growth to justify the current returns. Have we just been borrowing against future equity returns?? The most bullish investors may claim that current price multiples based on forward earnings are about average and since QE is still in effect, there is little reason to be concerned about valuations. Large investors in Netflix, Yelp, and Tesla Motors (each down more than 20% since March) might sheepishly tell us that current or trailing earnings are also important and that valuations do, in fact, matter. When we look at earnings over the last 10 years that provide some normalizing of the business cycles and compare that with current prices (Shiller P/E or Cyclically Adjusted P/E), we are concerned that equity returns over the next 10 years quite possibly could be in the low single digits, based on current price levels. This price/multiple is currently at 25.2x, comfortably above the long-term average (17.6 going back to 1926).
Because of these and other equity valuation concerns, as well as concerns with regard to the macro-economic growth and margin expansion backdrop, we continue to remain underweight in equities in each of our funds relative to our blended benchmarks. Within fixed income, we continue to weigh the benefits and risks of duration and credit exposures. For duration, we are cognizant that, over the long-term, rates will likely move higher. We also know that we currently have a steep yield curve and that any hikes in interest rates will likely affect short-term rates more than long-term rates. We believe the yield curve is likely to flatten than to shift upwards across all maturities. We also know of the advantages of holding duration in portfolios that contains equities as high quality bonds may act as partial imperfect hedge against equity risk. For credit, we know that yields on high yield bonds are near all-time lows and that spreads between high yield bonds and Treasury bonds are very narrow right now (3.42%). We are cautious about having too much exposure in high yield because of this, but we understand that as long as good fundamentals (low default rates, improving cash flows) and “technicals” (demand, issuance) are in place, spreads can stay low for a long period of time. We are doubtful, however, that spreads can compress much beyond what they already have done and this translates into more “coupon clipping” returns than returns that include capital appreciation from spread compression. With spreads so low, we will continue to be vigilant in monitoring the credit-related asset classes.
In the first quarter, we introduced the Osterweis Strategic Income fund into each fund. This fund, while highly correlated to high yield bond returns, has a lower beta (0.43) to high yield and has a much lower duration (2.0) than the duration of the Barclays US Aggregate Bond index (5.2). The managers of this fund have also been able to keep total risk or standard deviation low (3.21%) and very close to that of the Barclays US Aggregate (2.83%), which is significantly lower than the Credit Suisse HY index (7.18%). The introduction of this position replaced our indexed high yield bond exposure and also reduced some of our intermediate-term bond exposure. We also added Putnam Capital Spectrum to the Aggressive Growth fund and reduced T. Rowe Price Capital Appreciation during the first quarter. This was largely due to the potential diversification benefit that may be
| | |
| 2 | | www.pathwayadvisorsfunds.com |
| | |
| Pathway Advisors Funds | | Shareholder Letter |
April 30, 2014 (Unaudited) |
acheived by adding this fund, as well as due to the success that the manager has been able to achieve as it relates to downside risk. We continue to own Putnam Capital Spectrum in the Growth & Income and Conservative funds.
We continue to emphasize the importance for investors to be invested in the strategy that fits with their objectives and risk tolerance, regardless of the ebbs and flows and overall noise of the markets. We also categorically defend the principles and long-term benefit that can be had through proper diversification and asset allocation. While 2013 may have been a year to do well by not diversifying, we believe this would be the exception and not the rule. We are grateful for the trust that you have placed with us and we take our fiduciary responsibility to the funds very seriously. We sincerely wish each of you much success with your financial goals, hopes, and dreams.
Sincerely,
David Schauer
Chief Investment Officer
The views and information discussed in this commentary are as of the date of publication, are subject to change, and may not reflect the writer’s current views. The views expressed represent an assessment of market conditions at a specific point in time, are opinions only and should not be relied upon as investment advice regarding a particular investment or markets in general. Such information does not constitute a recommendation to buy or sell specific securities or investment vehicles. It should not be assumed that any investment will be profitable or will equal the performance of the portfolios or any securities or any sectors mentioned herein. The subject matter contained herein has been derived from several sources believed to be reliable and accurate at the time of compilation. Hanson McClain Strategic Advisors, Inc. does not accept any liability for losses either direct or consequential caused by the use of this information.
The Pathway Aggressive Growth Fund invests in underlying funds that use investment techniques and financial instruments that may be considered aggressive, including the use of futures contracts, options on futures contracts, securities and indices, forward contracts, swap agreements and similar instruments, exposes an underlying fund to potentially dramatic changes (losses) in the value of certain of its portfolio holdings.
The Pathway Growth and Income Fund’s share price can move down in response to stock market conditions, changes in the economy or changes in a particular underlying fund’s share price. An underlying fund may decline in value even when the values of stocks or bonds in general are rising. An underlying fund’s investments in fixed-income securities may decline in value because of changes in interest rates. As nominal interest rates rise, the value of fixed income securities held by an underlying fund (and indirectly, by the Fund) are likely to decrease.
The Pathway Conservative Fund invests in underlying funds that invest long or short in fixed-income securities subjects the Fund to additional risks that include credit risk, interest risk, maturity risk, investment-grade securities risk, municipal securities risk and prepayment risk. These risks could affect the value of a particular investment by the Fund, possibly causing the Fund’s share price and total return to be reduced and fluctuate more than other types of investments.
The performance data quoted represents past performance. Past performance does not guarantee future results. The investment return and principal value of an investment will fluctuate so that an Investor’s shares, when redeemed, may not be worth more or less than their original cost and current performance may be lower or higher than the performance quoted.
The Pathway Advisors Funds are distributed by ALPS Distributors, Inc.
| | |
| Annual Report | April 30, 2014 | | 3 |
| | |
| Pathway Advisors Funds | | Shareholder Letter |
April 30, 2014 (Unaudited) |
Hanson McClain, Inc. (the “Adviser”) has agreed contractually to limit the amount of the Fund’s total annual expenses, exclusive of Acquired Fund Fees and Expenses, brokerage expenses, interest expenses, taxes and extraordinary expenses, to 1.88% (1.98% prior to October 1, 2013) of the Fund’s average daily net assets. This agreement is in effect through August 31, 2014. The Adviser will be permitted to recover expenses it has borne through the agreement described above to the extent that the Fund’s expenses in later periods fall below the annual rates set forth in the relevant agreement. The Fund will not be obligated to pay any such deferred fees and expenses more than three years after the end of the fiscal year in which the fees and expense were deferred. The Adviser may not discontinue this waiver without the approval by the Fund’s Board of Trustees.
Diversification does not assure a profit or protect against a loss.
Definitions:
Basis point is a unit of measure used in finance to describe the percentage change in the value or rate of a financial instrument. One basis point is equivalent to 0.01% (1/100th of a percent) or 0.0001 in decimal form.
Cyclically adjusted P/E, commonly known as CAPE or Shiller P/E, is a valuation measure usually applied to broad equity markets. It is defined as price divided by the average of ten years of earnings (Moving average), adjusted for inflation.
Beta is a measure of a stock’s volatility in relation to the market.
Downside risk is the probability that an asset will fall in price. It is also the measure of the possible loss from that decline.
| | |
| 4 | | www.pathwayadvisorsfunds.com |
| | |
| Pathway Advisors Conservative Fund | | Performance Update |
April 30, 2014 (Unaudited) |
Cumulative Total Return for the period ended April 30, 2014
| | | | | | | | | | | | | | | |
| | | Calendar YTD | | One Year | | Since Inception* |
Pathway Advisors Conservative Fund | | | | 2.51% | | | | | 2.53% | | | | | 5.21% | |
S&P 500® Total Return Index1 | | | | 2.56% | | | | | 20.44% | | | | | 21.82% | |
Barclays Capital U.S. Aggregate Bond Index2 | | | | 2.70% | | | | | -0.26% | | | | | 0.63% | |
Russell 2000® Index3 | | | | -2.80% | | | | | 20.50% | | | | | 24.04% | |
* Fund inception date of July 30, 2012.
The returns shown above do not reflect the deduction of taxes a shareholder would pay on Fund distributions or redemption of Fund shares.
Performance data quoted represents past performance. Past performance does not guarantee future results. Investment return and principal value of an investment will fluctuate so that an investor’s shares, when sold or redeemed, may be worth more or less than the original cost. Current performance data may be higher or lower than actual data quoted. For the most current month-end performance data, please call 1-888-288-1121 or visit www.pathwayadvisorsfunds. com.
| 1 | The S&P 500® Total Return Index is an unmanaged index of 500 common stocks chosen for the market size, liquidity and industry group representation. It is a market-value weighted index. The index is not actively managed and does not reflect any deduction for fees, expenses or taxes. An investor may not invest directly into the index. |
| 2 | The Barclays Capital U.S. Aggregate Bond Index is a market capitalization-weighted index, meaning the securities in the index are weighted according to the market size of each bond type. Most U.S. traded investment grade bonds are represented. Municipal bonds, and Treasury Inflation- Protected Securities are excluded, due to tax treatment issues. The index includes Treasury securities, Government agency bonds, Mortgage-backed bonds, Corporate bonds, and a small amount of foreign bonds traded in U.S. The index is not actively managed and does not reflect any deduction for fees, expenses or taxes. An investor may not invest directly into the index. |
| 3 | The Russell 2000® Index measures the performance of the small-cap segment of the U.S. equity universe. The Russell 2000® Index is a subset of the Russell 3000® Index representing approximately 10% of the total market capitalization of that index. It includes approximately 2000 of the smallest securities based on a combination of their market cap and current index membership. The index is not actively managed and does not reflect any deduction for fees, expenses or taxes. An investor may not invest directly into the index. |
| | |
| Annual Report | April 30, 2014 | | 5 |
| | |
| Pathway Advisors Conservative Fund | | Performance Update |
April 30, 2014 (Unaudited) |
Growth of $10,000 for the period ended April 30, 2014
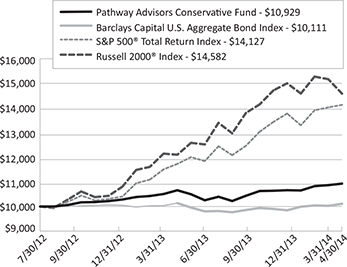
The graphs shown above represent a hypothetical investment of $10,000 in the Fund’s Investor Class shares for the period from inception to 4/30/14. All returns reflect reinvested dividends, but do not reflect the deduction of taxes that an investor would pay on distributions or redemptions.
| | |
| 6 | | www.pathwayadvisorsfunds.com |
| | |
| Pathway Advisors Conservative Fund | | Performance Update |
April 30, 2014 (Unaudited) |
| | | | | |
| Top Ten Long Holdings | | (as a % of Net Assets)* |
DoubleLine Total Return Bond Fund - Class I | | | | 17.58% | |
Vanguard® Wellesley Income Fund - Class Admiral | | | | 11.90% | |
PIMCO Total Return Fund - Institutional Class | | | | 9.81% | |
Vanguard® Wellington Fund - Class Admiral | | | | 8.94% | |
Metropolitan West Total Return Bond Fund - Class I | | | | 8.84% | |
Osterweis Strategic Income Fund - Class I | | | | 7.83% | |
Vanguard® Total Stock Market ETF | | | | 6.91% | |
Templeton Global Bond Fund - Advisor Class | | | | 5.93% | |
Loomis Sayles Bond Fund - Institutional Class | | | | 5.93% | |
Vanguard® REIT ETF | | | | 3.08% | |
Top Ten Holdings | | | | 86.75% | |
Portfolio Allocation (as a % of Net Assets)*
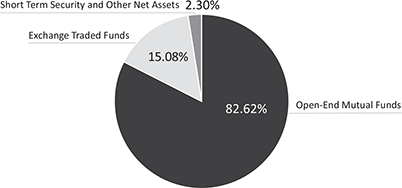
* Holdings are subject to change. Table and chart presents indicative values only.
| | |
| Annual Report | April 30, 2014 | | 7 |
| | |
| Pathway Advisors Growth and Income Fund | | Performance Update |
April 30, 2014 (Unaudited) |
Cumulative Total Return for the period ended April 30, 2014
| | | | | | | | | | | | | | | |
| | | Calendar YTD | | One Year | | Since Inception* |
Pathway Advisors Growth and Income Fund | | | | 2.58% | | | | | 7.17% | | | | | 9.65% | |
S&P 500 Total Return Index1 | | | | 2.56% | | | | | 20.44% | | | | | 21.82% | |
Barclays Capital U.S. Aggregate Bond Index2 | | | | 2.70% | | | | | -0.26% | | | | | 0.63% | |
Russell 2000® Index3 | | | | -2.80% | | | | | 20.50% | | | | | 24.04% | |
* Fund inception date of July 30, 2012.
The returns shown above do not reflect the deduction of taxes a shareholder would pay on Fund distributions or redemption of Fund shares.
Performance data quoted represents past performance. Past performance does not guarantee future results. Investment return and principal value of an investment will fluctuate so that an investor’s shares, when sold or redeemed, may be worth more or less than the original cost. Current performance data may be higher or lower than actual data quoted. For the most current month-end performance data, please call 1-888-288-1121 or visit www.pathwayadvisorsfunds. com.
| 1 | The S&P 500® Total Return Index is an unmanaged index of 500 common stocks chosen for the market size, liquidity and industry group representation. It is a market-value weighted index. The index is not actively managed and does not reflect any deduction for fees, expenses or taxes. An investor may not invest directly into the index. |
| 2 | The Barclays Capital U.S. Aggregate Bond Index is a market capitalization-weighted index, meaning the securities in the index are weighted according to the market size of each bond type. Most U.S. traded investment grade bonds are represented. Municipal bonds, and Treasury Inflation- Protected Securities are excluded, due to tax treatment issues. The index includes Treasury securities, Government agency bonds, Mortgage-backed bonds, Corporate bonds, and a small amount of foreign bonds traded in U.S. The index is not actively managed and does not reflect any deduction for fees, expenses or taxes. An investor may not invest directly into the index. |
| 3 | The Russell 2000® Index measures the performance of the small-cap segment of the U.S. equity universe. The Russell 2000® Index is a subset of the Russell 3000® Index representing approximately 10% of the total market capitalization of that index. It includes approximately 2000 of the smallest securities based on a combination of their market cap and current index membership. The index is not actively managed and does not reflect any deduction for fees, expenses or taxes. An investor may not invest directly into the index. |
| | |
| 8 | | www.pathwayadvisorsfunds.com |
| | |
| Pathway Advisors Growth and Income Fund | | Performance Update |
April 30, 2014 (Unaudited) |
Growth of $10,000 for the period ended April 30, 2014
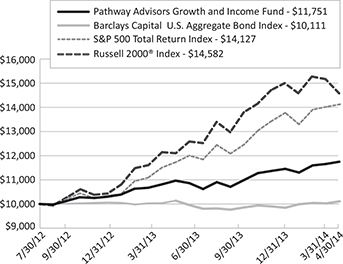
The graphs shown above represent a hypothetical investment of $10,000 in the Fund’s Investor Class shares for the period from inception to 4/30/14. All returns reflect reinvested dividends, but do not reflect the deduction of taxes that an investor would pay on distributions or redemptions.
| | |
| Annual Report | April 30, 2014 | | 9 |
| | |
| Pathway Advisors Growth and Income Fund | | Performance Update |
April 30, 2014 (Unaudited) |
| | | | | |
| Top Ten Long Holdings | | (as a % of Net Assets)* |
SPDR® S&P 500® ETF Trust | | | | 17.07% | |
DoubleLine Total Return Bond Fund - Class I | | | | 16.83% | |
Vanguard® Wellington Fund - Class Admiral | | | | 10.01% | |
T. Rowe Price Capital Appreciation Fund | | | | 8.98% | |
iShares® Dow Jones International Select Dividend Index Fund | | | | 8.09% | |
PIMCO Total Return Fund - Institutional Class | | | | 7.96% | |
Vanguard® Large-Cap ETF | | | | 5.02% | |
iShares® Dow Jones Select Dividend Index Fund | | | | 5.01% | |
Osterweis Strategic Income Fund - Class I | | | | 4.97% | |
Putnam Capital Spectrum Fund - Class Y | | | | 3.99% | |
Top Ten Holdings | | | | 87.93% | |
Portfolio Allocation (as a % of Net Assets)*
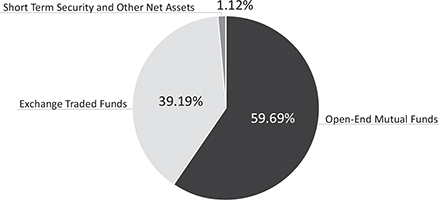
* Holdings are subject to change. Table and chart presents indicative values only.
| | |
| 10 | | www.pathwayadvisorsfunds.com |
| | |
| Pathway Advisors Aggressive Growth Fund | | Performance Update |
April 30, 2014 (Unaudited) |
Cumulative Total Return for the period ended April 30, 2014
| | | | | | | | | | | | | | | |
| | | Calendar YTD | | One Year | | Since Inception* |
Pathway Advisors Aggressive Growth Fund | | | | 2.02% | | | | | 12.05% | | | | | 15.66% | |
MSCI EAFE® Index1 | | | | 2.12% | | | | | 13.35% | | | | | 21.84% | |
S&P 500 Total Return Index2 | | | | 2.56% | | | | | 20.44% | | | | | 21.82% | |
Russell 2000® Index3 | | | | -2.80% | | | | | 20.50% | | | | | 24.04% | |
* Fund inception date of July 30, 2012.
The returns shown above do not reflect the deduction of taxes a shareholder would pay on Fund distributions or redemption of Fund shares.
Performance data quoted represents past performance. Past performance does not guarantee future results. Investment return and principal value of an investment will fluctuate so that an investor’s shares, when sold or redeemed, may be worth more or less than the original cost. Current performance data may be higher or lower than actual data quoted. For the most current month-end performance data, please call 1-888-288-1121 or visit www.pathwayadvisorsfunds. com.
| 1 | MSCI EAFE® Index (Europe, Australasia, Far East) is a free float-adjusted market capitalization weighted index designed to measure developed market equity performance. The MSCI EAFE® Index is composed of companies representative of the market structure of Developed Market countries. The index includes reinvestment of dividends, net of foreign withholding taxes. The index is not actively managed and does not reflect any deduction for fees, expenses or taxes. An investor may not invest directly into the index. |
| 2 | The S&P 500® Total Return Index is an unmanaged index of 500 common stocks chosen for the market size, liquidity and industry group representation. It is a market-value weighted index. The index is not actively managed and does not reflect any deduction for fees, expenses or taxes. An investor may not invest directly into the index. |
| 3 | The Russell 2000® Index measures the performance of the small-cap segment of the U.S. equity universe. The Russell 2000® Index is a subset of the Russell 3000® Index representing approximately 10% of the total market capitalization of that index. It includes approximately 2000 of the smallest securities based on a combination of their market cap and current index membership. The index is not actively managed and does not reflect any deduction for fees, expenses or taxes. An investor may not invest directly into the index. |
Source: MSCI. MSCI makes no express or implied warranties or representations and shall have no liability whatsoever with respect to any MSCI data contained herein. The MSCI data may not be further redistributed or used to create indices or financial products. This report is not approved or produced by MSCI.
| | |
| Annual Report | April 30, 2014 | | 11 |
| | |
| Pathway Advisors Aggressive Growth Fund | | Performance Update |
April 30, 2014 (Unaudited) |
Growth of $10,000 for the period ended April 30, 2014
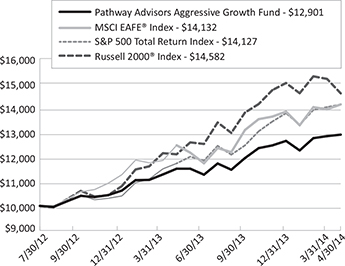
The graphs shown above represent a hypothetical investment of $10,000 in the Fund’s Investor Class shares for the period from inception to 4/30/14. All returns reflect reinvested dividends, but do not reflect the deduction of taxes that an investor would pay on distributions or redemptions.
| | |
| 12 | | www.pathwayadvisorsfunds.com |
| | |
| Pathway Advisors Aggressive Growth Fund | | Performance Update |
April 30, 2014 (Unaudited) |
| | | | | |
| Top Ten Long Holdings | | (as a % of Net Assets)* |
iShares® Dow Jones International Select Dividend Index Fund | | | | 17.30% | |
SPDR® S&P 500® ETF Trust | | | | 15.03% | |
Vanguard® Total Stock Market ETF | | | | 13.98% | |
DoubleLine Total Return Bond Fund - Class I | | | | 9.95% | |
Mairs & Power Growth Fund - Investor Class | | | | 7.96% | |
Akre Focus Fund - Institutional Class | | | | 7.93% | |
Osterweis Strategic Income Fund - Class I | | | | 4.99% | |
Principal MidCap Fund - Institutional Class | | | | 4.98% | |
Putnam Capital Spectrum Fund - Class Y | | | | 4.91% | |
Vanguard® FTSE Emerging Markets ETF | | | | 4.09% | |
Top Ten Holdings | | | | 91.12% | |
Portfolio Allocation (as a % of Net Assets)*
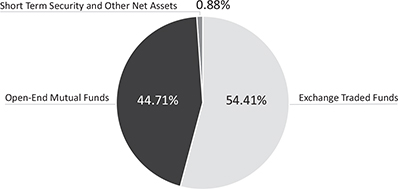
* Holdings are subject to change. Table and chart presents indicative values only.
| | |
| Annual Report | April 30, 2014 | | 13 |
| | |
| Pathway Advisors Funds | | Disclosure of Fund Expenses |
April 30, 2014 (Unaudited) |
As a shareholder of a Fund, you incur two types of costs: direct costs, such as short-term redemption fees and wire fees, and indirect costs, including management fees, and other fund operating expenses. This example is intended to help you understand your indirect costs, also referred to as “ongoing costs” (in dollars), of investing in the Fund and to compare these costs with the ongoing costs of investing in other mutual funds.
This example is based on an investment of $1,000 invested at the beginning of the period and held for the entire six-month period of November 1, 2013 through April 30, 2014.
Actual Expenses The first line of the table below provides information about actual account values and actual expenses. You may use the information in this line, together with the amount you invested at the beginning of the period, to estimate the expenses that you paid over the period. Simply divide your account value by $1,000 (for example, an $8,600 account value divided by $1,000 = 8.6), then multiply the result by the number in the first line under the heading “Expenses Paid During Period” to estimate the expenses you paid on your account during this period.
Hypothetical Example for Comparison Purposes The second line of the table provides information about hypothetical account values and hypothetical expenses based on the Fund’s actual expense ratio and an assumed rate of return of 5% per year before expenses, which is not the Fund’s actual return. The hypothetical account values and expenses may not be used to estimate the actual ending account balance or expenses you paid for the period. You may use this information to compare ongoing costs of investing in the Fund and other funds. To do so, compare this 5% hypothetical example with the 5% hypothetical examples that appear in the shareholder reports of other funds.
Please note that the expenses shown in the table are meant to highlight your ongoing costs only and do not reflect any direct costs, such as wire fees or low balance fees. Therefore, the second line of the table is useful in comparing ongoing costs only and will not help you determine the relative total costs of owning different funds. In addition, if these direct costs were included, your costs would be higher.
| | |
| 14 | | www.pathwayadvisorsfunds.com |
| | |
| Pathway Advisors Funds | | Disclosure of Fund Expenses |
April 30, 2014 (Unaudited) |
| | | | | | | | | | | | | | | | | | | | |
| | | | | | | | | EXPENSES PAID |
| | | BEGINNING | | ENDING | | | | DURING PERIOD |
| | | ACCOUNT VALUE | | ACCOUNT VALUE | | EXPENSE | | 11/01/13- |
| | | 11/01/13 | | 04/30/14 | | RATIO(a) | | 04/30/14(b) |
Pathway Advisors Conservative Fund | | | | | | | | | | | | | | | | | | | | |
Actual | | | | $ 1,000.00 | | | | | $ 1,028.30 | | | | | 1.88 | % | | | | $ 9.45 | |
Hypothetical | | | | | | | | | | | | | | | | | | | | |
(5% return before expenses) | | | | $ 1,000.00 | | | | | $ 1,015.47 | | | | | 1.88 | % | | | | $ 9.39 | |
| | | | |
Pathway Advisors Growth and Income Fund | | | | | | | | | | | | | | | | | | | | |
Actual | | | | $ 1,000.00 | | | | | $ 1,041.90 | | | | | 1.88 | % | | | | $ 9.52 | |
Hypothetical | | | | | | | | | | | | | | | | | | | | |
(5% return before expenses) | | | | $ 1,000.00 | | | | | $ 1,015.47 | | | | | 1.88 | % | | | | $ 9.39 | |
| | | | |
Pathway Advisors Aggressive Growth Fund | | | | | | | | | | | | | | | | | | | | |
Actual | | | | $ 1,000.00 | | | | | $ 1,044.50 | | | | | 1.88 | % | | | | $ 9.53 | |
Hypothetical | | | | | | | | | | | | | | | | | | | | |
(5% return before expenses) | | | | $ 1,000.00 | | | | | $ 1,015.47 | | | | | 1.88 | % | | | | $ 9.39 | |
| (a) | Annualized, based on the Funds’ most recent fiscal half year expenses. |
| (b) | Expenses are equal to the Fund’s annualized expense ratio multiplied by the average account value over the period, multiplied by the number of days in the most recent fiscal half-year (181)/365 (to reflect the half-year period). |
| | |
| Annual Report | April 30, 2014 | | 15 |
| | |
Pathway Advisors Conservative Fund | | Portfolio of Investments |
April 30, 2014 |
| | | | | | | | |
| | | | | | | | Value |
| Description | | | | | Shares | | (Note 2) |
EXCHANGE TRADED FUNDS (15.08%) | | | | | | | | |
iShares® Dow Jones International Select Dividend Index Fund | | | | | | 4,173 | | $ 166,711 |
Vanguard® FTSE Emerging Markets ETF | | | | | | 2,662 | | 108,982 |
Vanguard® REIT ETF | | | | | | 2,293 | | 167,251 |
Vanguard® Total Stock Market ETF | | | | | | 3,843 | | 374,809 |
| | | | | | | | |
TOTAL EXCHANGE TRADED FUNDS (Cost $747,270) | | | | | | | | 817,753 |
| | | |
OPEN-END MUTUAL FUNDS (82.62%) | | | | | | | | |
DoubleLine Total Return Bond Fund - Class I | | | | | | 87,247 | | 953,607 |
Loomis Sayles Bond Fund - Institutional Class | | | | | | 20,655 | | 321,805 |
Metropolitan West Total Return Bond Fund - Class I | | | | | | 44,633 | | 479,359 |
Osterweis Strategic Income Fund - Class I | | | | | | 35,328 | | 424,646 |
PIMCO Real Return Fund - Institutional Class | | | | | | 14,170 | | 160,547 |
PIMCO Total Return Fund - Institutional Class | | | | | | 49,071 | | 531,930 |
Putnam Capital Spectrum Fund - Class Y | | | | | | 4,302 | | 156,242 |
Templeton Global Bond Fund - Advisor Class | | | | | | 24,661 | | 321,822 |
Vanguard® Wellesley Income Fund - Class Admiral | | | | | | 10,415 | | 645,388 |
Vanguard® Wellington Fund - Class Admiral | | | | | | 7,195 | | 484,827 |
| | | | | | | | |
TOTAL OPEN-END MUTUAL FUNDS (Cost $4,413,082) | | | | | | | | 4,480,173 |
| | | |
| | | 7-Day | | | | | Value |
| | | Yield | | | Shares | | (Note 2) |
SHORT TERM INVESTMENTS (2.51%) | | | | | | | | |
Dreyfus Cash Management, Institutional Shares | | | 0.030 | % | | 136,289 | | 136,289 |
| | | | | | | | |
TOTAL SHORT TERM INVESTMENTS (Cost $136,289) | | | | | | | | 136,289 |
| | | |
TOTAL INVESTMENTS (100.21%) (Cost $5,296,641) | | | | | | | | $ 5,434,215 |
| | | |
Liabilities in Excess of Other Assets (-0.21%) | | | | | | | | (11,192) |
NET ASSETS (100.00%) | | | | | | | | $ 5,423,023 |
|
Common Abbreviations:
ETF - Exchange Traded Fund.
FTSE - Financial Times and Stock Exchange.
PIMCO - Pacific Investment Management Company, LLC.
REIT - Real Estate Investment Trust.
Holdings are subject to change.
See Notes to Financial Statements.
| | |
| 16 | | www.pathwayadvisorsfunds.com |
| | |
| Pathway Advisors Growth and Income Fund | | Portfolio of Investments |
April 30, 2014 |
| | | | | | | | |
| Description | | | | | Shares | | Value (Note 2) |
EXCHANGE TRADED FUNDS (39.19%) | | | | | | | | |
iShares® Dow Jones International Select Dividend Index Fund | | | | | | 82,201 | | $ 3,283,930 |
iShares® Dow Jones Select Dividend Index Fund | | | | | | 27,159 | | 2,032,580 |
SPDR® S&P 500® ETF Trust | | | | | | 36,775 | | 6,929,513 |
Vanguard® FTSE Emerging Markets ETF | | | | | | 19,767 | | 809,261 |
Vanguard® Large-Cap ETF | | | | | | 23,553 | | 2,036,863 |
WisdomTree® Emerging Markets SmallCap Dividend Fund | | | | | | 17,273 | | 813,040 |
| | | | | | | | |
TOTAL EXCHANGE TRADED FUNDS (Cost $14,481,871) | | | | | | | | 15,905,187 |
| | | |
OPEN-END MUTUAL FUNDS (59.69%) | | | | | | | | |
DoubleLine Total Return Bond Fund - Class I | | | | | | 625,075 | | 6,832,065 |
Metropolitan West Total Return Bond Fund - Class I | | | | | | 112,672 | | 1,210,094 |
Osterweis Strategic Income Fund - Class I | | | | | | 167,772 | | 2,016,624 |
PIMCO Real Return Fund - Institutional Class | | | | | | 142,281 | | 1,612,047 |
PIMCO Total Return Fund - Institutional Class | | | | | | 297,959 | | 3,229,873 |
Putnam Capital Spectrum Fund - Class Y | | | | | | 44,571 | | 1,618,806 |
T. Rowe Price Capital Appreciation Fund | | | | | | 137,174 | | 3,644,701 |
Vanguard® Wellington Fund - Class Admiral | | | | | | 60,322 | | 4,064,515 |
| | | | | | | | |
TOTAL OPEN-END MUTUAL FUNDS (Cost $23,789,104) | | | | | | | | 24,228,725 |
| | | |
| | | 7-Day | | | | | Value |
| | | Yield | | | Shares | | (Note 2) |
SHORT TERM INVESTMENTS (1.77%) | | | | | | | | |
Dreyfus Cash Management, Institutional Shares | | | 0.030 | % | | 719,520 | | 719,520 |
| | | | | | | | |
TOTAL SHORT TERM INVESTMENTS (Cost $719,520) | | | | | | | | 719,520 |
| | | |
TOTAL INVESTMENTS (100.65%) (Cost $38,990,495) | | | | | | | | $ 40,853,432 |
| | | |
Liabilities in Excess of Other Assets (-0.65%) | | | | | | | | (265,165) |
NET ASSETS (100.00%) | | | | | | | | $ 40,588,267 |
|
Common Abbreviations:
ETF - Exchange Traded Fund.
FTSE - Financial Times and Stock Exchange.
PIMCO - Pacific Investment Management Company, LLC.
S&P - Standard & Poor's.
SPDR - Standard & Poor's Depository Receipts.
Holdings are subject to change.
See Notes to Financial Statements.
| | |
| Annual Report | April 30, 2014 | | 17 |
| | |
| Pathway Advisors Aggressive Growth Fund | | Portfolio of Investments |
April 30, 2014 |
| | | | | | | | |
| Description | | | | | Shares | | Value (Note 2) |
EXCHANGE TRADED FUNDS (54.41%) | | | | | | | | |
iShares® Dow Jones International Select Dividend Index Fund | | | | | | 71,991 | | $ 2,876,040 |
SPDR® S&P 500® ETF Trust | | | | | | 13,258 | | 2,498,205 |
Vanguard® FTSE Emerging Markets ETF | | | | | | 16,602 | | 679,686 |
Vanguard® Total Stock Market ETF | | | | | | 23,822 | | 2,323,360 |
WisdomTree® Emerging Markets SmallCap Dividend Fund | | | | | | 14,182 | | 667,547 |
| | | | | | | | |
TOTAL EXCHANGE TRADED FUNDS (Cost $8,300,729) | | | | | | | | 9,044,838 |
| | | |
OPEN-END MUTUAL FUNDS (44.71%) | | | | | | | | |
Akre Focus Fund - Institutional Class | | | | | | 62,847 | | 1,318,536 |
DoubleLine Total Return Bond Fund - Class I | | | | | | 151,306 | | 1,653,776 |
Mairs & Power Growth Fund - Investor Class | | | | | | 11,822 | | 1,322,858 |
Osterweis Strategic Income Fund - Class I | | | | | | 68,974 | | 829,069 |
Principal MidCap Fund - Institutional Class | | | | | | 40,430 | | 828,009 |
Putnam Capital Spectrum Fund - Class Y | | | | | | 22,490 | | 816,822 |
T. Rowe Price Capital Appreciation Fund | | | | | | 24,970 | | 663,452 |
| | | | | | | | |
TOTAL OPEN-END MUTUAL FUNDS (Cost $7,163,658) | | | | | | | | 7,432,522 |
| | | |
| | | 7-Day
Yield | | | Shares | | Value (Note 2) |
SHORT TERM INVESTMENTS (0.91%) | | | | | | | | |
Dreyfus Cash Management, Institutional Shares | | | 0.030 | % | | 151,137 | | 151,137 |
| | | | | | | | |
TOTAL SHORT TERM INVESTMENTS (Cost $151,137) | | | | | | | | 151,137 |
| | | |
TOTAL INVESTMENTS (100.03%) (Cost $15,615,524) | | | | | | | | $ 16,628,497 |
| | | |
Liabilities in Excess of Other Assets (-0.03%) | | | | | | | | (4,690) |
NET ASSETS (100.00%) | | | | | | | | $ 16,623,807 |
|
Common Abbreviations:
ETF - Exchange Traded Fund.
FTSE - Financial Times and Stock Exchange.
S&P - Standard & Poor's.
SPDR - Standard & Poor's Depository Receipts.
Holdings are subject to change.
See Notes to Financial Statements.
| | |
| 18 | | www.pathwayadvisorsfunds.com |
| | |
| Pathway Advisors Funds | | Statements of Assets and Liabilities |
April 30, 2014 |
| | | | | | |
| | | PATHWAY | | PATHWAY | | PATHWAY |
| | | ADVISORS | | ADVISORS | | ADVISORS |
| | | CONSERVATIVE | | GROWTH AND | | AGGRESSIVE |
| | | FUND | | INCOME FUND | | GROWTH FUND |
ASSETS | | | | | | |
Investments, at value | | $ 5,434,215 | | $ 40,853,432 | | $ 16,628,497 |
Receivable for shares sold | | – | | 44,511 | | 29,601 |
Receivable due from advisor | | 2,194 | | – | | – |
Dividends receivable | | 6,076 | | 37,673 | | 6,871 |
Other assets | | 4,170 | �� | 4,597 | | 4,296 |
Total assets | | 5,446,655 | | 40,940,213 | | 16,669,265 |
LIABILITIES | | | | | | |
Investment advisory fees payable | | – | | 15,473 | | 4,799 |
Distributions and service fees payable | | 4,423 | | 33,867 | | 13,575 |
Payable for investments purchased | | – | | 260,221 | | – |
Payable for trustee fees and expenses | | 40 | | 300 | | 127 |
Payable for chief compliance officer fees | | 345 | | 2,125 | | 957 |
Payable for principal financial officer fees | | 92 | | 569 | | 255 |
Payable for administration fees | | 2,128 | | 14,954 | | 6,370 |
Payable for transfer agency fees | | 2,825 | | 4,904 | | 3,815 |
Payable for professional fees | | 12,195 | | 12,481 | | 12,239 |
Payable for custody fees | | 885 | | 1,314 | | 885 |
Payable for reports to shareholders | | 87 | | 618 | | 249 |
Accrued expenses and other liabilities | | 612 | | 5,120 | | 2,187 |
Total liabilities | | 23,632 | | 351,946 | | 45,458 |
NET ASSETS | | $ 5,423,023 | | $ 40,588,267 | | $ 16,623,807 |
|
| | | |
NET ASSETS CONSIST OF | | | | | | |
Paid-in capital (Note 5) | | $ 5,258,708 | | $ 38,524,218 | | $ 15,526,670 |
Accumulated net investment income | | 16,518 | | 31,911 | | – |
Accumulated net realized gain on investments | | 10,223 | | 169,201 | | 84,164 |
Net unrealized appreciation on investments | | 137,574 | | 1,862,937 | | 1,012,973 |
NET ASSETS | | $ 5,423,023 | | $ 40,588,267 | | $ 16,623,807 |
|
INVESTMENTS, AT COST | | $ 5,296,641 | | $ 38,990,495 | | $ 15,615,524 |
|
PRICING OF SHARES | | | | | | |
Net Asset Value, offering and redemption price per share | | $ 10.61 | | $11.52 | | $ 12.65 |
Net Assets | | $ 5,423,023 | | $ 40,588,267 | | $ 16,623,807 |
Shares of beneficial interest outstanding | | | | | | |
(unlimited number of shares, no par value common stock authorized) | | 510,894 | | 3,524,222 | | 1,314,394 |
See Notes to Financial Statements.
| | |
| Annual Report | April 30, 2014 | | 19 |
| | |
| Pathway Advisors Funds | | Statements of Operations |
For the Year Ended April 30, 2014 |
| | | | | | |
| | | PATHWAY | | PATHWAY | | PATHWAY |
| | | ADVISORS | | ADVISORS | | ADVISORS |
| | | CONSERVATIVE | | GROWTH AND | | AGGRESSIVE |
| | | FUND | | INCOME FUND | | GROWTH FUND |
INVESTMENT INCOME | | | | | | |
Dividends from other investment companies | | $ 115,866 | | $ 763,634 | | $ 262,825 |
Total investment income | | 115,866 | | 763,634 | | 262,825 |
| | | |
EXPENSES | | | | | | |
Investment advisory fees (Note 6) | | 33,315 | | 241,670 | | 95,718 |
Administration fees | | 26,635 | | 169,025 | | 65,051 |
Transfer agency fees | | 30,137 | | 42,489 | | 34,558 |
Distribution and service fees | | 14,010 | | 101,769 | | 39,821 |
Professional fees | | 13,705 | | 16,783 | | 14,490 |
Custody fees | | 5,130 | | 7,788 | | 5,156 |
Reports to shareholders | | 616 | | 5,182 | | 1,825 |
Trustee fees and expenses | | 143 | | 1,001 | | 397 |
Registration/filing fees | | 15,302 | | 19,615 | | 16,807 |
Chief compliance officer fees | | 4,029 | | 26,167 | | 9,979 |
Principal financial officer fees | | 1,013 | | 6,579 | | 2,510 |
Offering costs | | 13,790 | | 13,674 | | 13,674 |
Other | | 3,283 | | 7,961 | | 2,690 |
Total expenses before waivers | | 161,108 | | 659,703 | | 302,676 |
Less fees waived/reimbursed by investment advisor (Note 6) | | (97,471) | | (199,873) | | (120,826) |
Total net expenses | | 63,637 | | 459,830 | | 181,850 |
NET INVESTMENT INCOME | | 52,229 | | 303,804 | | 80,975 |
|
Net realized gain/(loss) on investments | | (9,884) | | (56,031) | | 40,254 |
Net realized capital gain distributions from other investment companies | | 26,283 | | 230,232 | | 73,997 |
Net change in unrealized appreciation on investments | | 113,990 | | 1,779,420 | | 944,050 |
NET REALIZED AND UNREALIZED GAIN ON INVESTMENTS | | 130,389 | | 1,953,621 | | 1,058,301 |
|
NET INCREASE IN NET ASSETS RESULTING FROM OPERATIONS | | $ 182,618 | | $ 2,257,425 | | $ 1,139,276 |
|
See Notes to Financial Statements.
| | |
| 20 | | www.pathwayadvisorsfunds.com |
| | |
Pathway Advisors Conservative Fund | | Statements of Changes in Net Assets |
|
| | | | | | | | |
| | | For the
Year Ended
April 30, 2014 | | | For the Period
Ended
April 30, 2013(a) | |
OPERATIONS | | | | | | | | |
Net investment income | | $ | 52,229 | | | $ | 5,904 | |
Net realized gain/(loss) on investments | | | (9,884) | | | | 2,117 | |
Net realized capital gain distributions from other investment companies | | | 26,283 | | | | 1,489 | |
Net change in unrealized appreciation on investments | | | 113,990 | | | | 23,584 | |
Net increase in net assets resulting from operations | | | 182,618 | | | | 33,094 | |
DISTRIBUTIONS (NOTE 3) | | | | | | | | |
Net investment income | | | (43,119) | | | | (3,846) | |
Net realized gains on investments | | | (9,256) | | | | (526) | |
Net decrease in net assets from distributions | | | (52,375) | | | | (4,372) | |
BENEFICIAL INTEREST TRANSACTIONS (NOTE 5) | | | | | | | | |
Shares sold | | | 4,685,131 | | | | 1,332,626 | |
Dividends reinvested | | | 52,374 | | | | 4,372 | |
Shares redeemed | | | (808,445) | | | | (2,000) | |
Net increase in net assets derived from beneficial interest transactions | | | 3,929,060 | | | | 1,334,998 | |
Net increase in Net Assets | | | 4,059,303 | | | | 1,363,720 | |
NET ASSETS: | | | | | | | | |
Beginning of period | | | 1,363,720 | | | | – | |
End of period* | | $ | 5,423,023 | | | $ | 1,363,720 | |
| | |
* Includes accumulated net investment income of: | | $ | 16,518 | | | $ | 3,953 | |
| (a) | The Fund commenced operations on July 31, 2012. |
See Notes to Financial Statements.
| | |
| Annual Report | April 30, 2014 | | 21 |
| | |
Pathway Advisors Growth and Income Fund | | Statements of Changes in Net Assets |
|
| | | | | | | | |
| | | For the Year Ended
April 30, 2014 | | | For the Period
Ended
April 30, 2013(a) | |
OPERATIONS | | | | | | | | |
Net investment income | | $ | 303,804 | | | $ | 3,547 | |
Net realized gain/(loss) on investments | | | (56,031) | | | | 2,331 | |
Net realized capital gain distributions from other investment companies | | | 230,232 | | | | 1,553 | |
Net change in unrealized appreciation on investments | | | 1,779,420 | | | | 83,517 | |
Net increase in net assets resulting from operations | | | 2,257,425 | | | | 90,948 | |
DISTRIBUTIONS (NOTE 3) | | | | | | | | |
Net investment income | | | (262,518) | | | | (3,542) | |
Net realized gains on investments | | | (27,907) | | | | (860) | |
Net decrease in net assets from distributions | | | (290,425) | | | | (4,402) | |
BENEFICIAL INTEREST TRANSACTIONS (NOTE 5) | | | | | | | | |
Shares sold | | | 36,950,034 | | | | 5,015,665 | |
Dividends reinvested | | | 290,424 | | | | 4,402 | |
Shares redeemed | | | (3,725,804) | | | | – | |
Net increase in net assets derived from beneficial interest transactions | | | 33,514,654 | | | | 5,020,067 | |
Net increase in Net Assets | | | 35,481,654 | | | | 5,106,613 | |
NET ASSETS: | | | | | | | | |
Beginning of period | | | 5,106,613 | | | | – | |
End of period* | | $ | 40,588,267 | | | $ | 5,106,613 | |
| | |
* Includes accumulated net investment income of: | | $ | 31,911 | | | $ | 2,793 | |
| (a) | The Fund commenced operations on July 31, 2012. |
See Notes to Financial Statements.
| | |
| 22 | | www.pathwayadvisorsfunds.com |
| | |
Pathway Advisors Aggressive Growth Fund | | Statements of Changes in Net Assets |
|
| | | | | | | | |
| | | For the Year Ended
April 30, 2014 | | | For the Period
Ended
April 30, 2013(a) | |
OPERATIONS | | | | | | | | |
Net investment income | | $ | 80,975 | | | $ | 1,544 | |
Net realized gain on investments | | | 40,254 | | | | 10,945 | |
Net realized capital gain distributions from other investment companies | | | 73,997 | | | | 1,722 | |
Net change in unrealized appreciation on investments | | | 944,050 | | | | 68,923 | |
Net increase in net assets resulting from operations | | | 1,139,276 | | | | 83,134 | |
DISTRIBUTIONS (NOTE 3) | | | | | | | | |
Net investment income | | | (92,205) | | | | (3,440) | |
Net realized gains on investments | | | (35,419) | | | | (1,039) | |
Net decrease in net assets from distributions | | | (127,624) | | | | (4,479) | |
BENEFICIAL INTEREST TRANSACTIONS (NOTE 5) | | | | | | | | |
Shares sold | | | 15,021,195 | | | | 1,601,209 | |
Dividends reinvested | | | 127,625 | | | | 4,479 | |
Shares redeemed | | | (1,115,620) | | | | (105,388) | |
Net increase in net assets derived from beneficial interest transactions | | | 14,033,200 | | | | 1,500,300 | |
Net increase in Net Assets | | | 15,044,852 | | | | 1,578,955 | |
NET ASSETS: | | | | | | | | |
Beginning of period | | | 1,578,955 | | | | – | |
End of period* | | $ | 16,623,807 | | | $ | 1,578,955 | |
| | |
* Includes accumulated net investment income of: | | $ | 0 | | | $ | 210 | |
| (a) | The Fund commenced operations on July 31, 2012. |
See Notes to Financial Statements.
| | |
| Annual Report | April 30, 2014 | | 23 |
| | |
| Pathway Advisors Conservative Fund | | Financial Highlights |
For a share outstanding throughout the periods presented. |
| | | | | | | | |
| | | For the Year
Ended
April 30, 2014 | | | For the Period Ended
April 30, 2013(a) | |
| | |
NET ASSET VALUE, BEGINNING OF PERIOD | | $ | 10.51 | | | $ | 10.00 | |
INCOME FROM OPERATIONS | | | | | | | | |
Net investment income(b) | | | 0.16 | | | | 0.14 | |
Net realized and unrealized gain on investments | | | 0.10 | | | | 0.52 | |
| | | | | | | | |
Total from Investment Operations | | | 0.26 | | | | 0.66 | |
| | | | | | | | |
| | |
LESS DISTRIBUTIONS | | | | | | | | |
Net investment income | | | (0.13) | | | | (0.13) | |
Net realized gain on investments | | | (0.03) | | | | (0.02) | |
| | | | | | | | |
Total Distributions | | | (0.16) | | | | (0.15) | |
| | | | | | | | |
NET INCREASE IN NET ASSET VALUE | | | 0.10 | | | | 0.51 | |
| | | | | | | | |
NET ASSET VALUE, END OF PERIOD | | $ | 10.61 | | | $ | 10.51 | |
| | | | | | | | |
TOTAL RETURN(c) | | | 2.53% | | | | 6.59% | |
| | |
RATIOS/SUPPLEMENTAL DATA | | | | | | | | |
Net assets, End of Period (000s) | | $ | 5,423 | | | $ | 1,364 | |
RATIOS TO AVERAGE NET ASSETS: | | | | | | | | |
Operating expenses excluding reimbursement/waiver(d) | | | 4.84% | | | | 49.62%(e)(f) | |
Operating expenses including reimbursement/waiver(d) | | | 1.91%(g) | | | | 1.98%(e)(f) | |
Net investment income including reimbursement/waiver(d) | | | 1.57% | | | | 1.83%(e) | |
PORTFOLIO TURNOVER RATE | | | 38% | | | | 18%(h) | |
| (a) | The Fund commenced operations on July 31, 2012. |
| (b) | Calculated using the average shares method. |
| (c) | Total investment return is calculated assuming a purchase of a common share at the opening of the first day and a sale at closing on the last day of each period reported. Dividends and distributions, if any, are assumed for purposes of this calculation to be reinvested at prices obtained under the Fund’s dividend reinvestment plan. Total returns would have been lower had certain expenses not been waived during the period. Total investment returns do not reflect brokerage commissions, if any, and are not annualized. |
| (d) | The ratios exclude the impact of expenses of the underlying funds in which the Fund invests as represented in the Portfolio of Investments. |
| (f) | Expense ratios before reductions for startup periods may not be representative of longer term operating periods. |
| (g) | Contractual expense limitation changed from 1.98% to 1.88% effective October 1, 2013. |
See Notes to Financial Statements.
| | |
| 24 | | www.pathwayadvisorsfunds.com |
| | |
| Pathway Advisors Growth and Income Fund | | Financial Highlights |
For a share outstanding throughout the periods presented. |
| | | | | | | | |
| | | For the Year
Ended April 30, 2014 | | | For the Period Ended
April 30, 2013(a) | |
| | |
NET ASSET VALUE, BEGINNING OF PERIOD | | $ | 10.85 | | | $ | 10.00 | |
INCOME FROM OPERATIONS | | | | | | | | |
Net investment income(b) | | | 0.14 | | | | 0.05 | |
Net realized and unrealized gain on investments | | | 0.63 | | | | 0.91 | |
| | | | | | | | |
Total from Investment Operations | | | 0.77 | | | | 0.96 | |
| | | | | | | | |
| | |
LESS DISTRIBUTIONS | | | | | | | | |
Net investment income | | | (0.09) | | | | (0.09) | |
Net realized gain on investments | | | (0.01) | | | | (0.02) | |
| | | | | | | | |
Total Distributions | | | (0.10) | | | | (0.11) | |
| | | | | | | | |
NET INCREASE IN NET ASSET VALUE | | | 0.67 | | | | 0.85 | |
| | | | | | | | |
NET ASSET VALUE, END OF PERIOD | | $ | 11.52 | | | $ | 10.85 | |
| | | | | | | | |
TOTAL RETURN(c) | | | 7.17% | | | | 9.65% | |
| | |
RATIOS/SUPPLEMENTAL DATA | | | | | | | | |
Net assets, End of Period (000s) | | $ | 40,588 | | | $ | 5,107 | |
RATIOS TO AVERAGE NET ASSETS: | | | | | | | | |
Operating expenses excluding reimbursement/waiver(d) | | | 2.73% | | | | 33.89%(e)(f) | |
Operating expenses including reimbursement/waiver(d) | | | 1.90%(g) | | | | 1.98%(e)(f) | |
Net investment income including reimbursement/waiver(d) | | | 1.26% | | | | 0.64%(e) | |
PORTFOLIO TURNOVER RATE | | | 11% | | | | 5%(h) | |
| (a) | The Fund commenced operations on July 31, 2012. |
| (b) | Calculated using the average shares method. |
| (c) | Total investment return is calculated assuming a purchase of a common share at the opening of the first day and a sale at closing on the last day of each period reported. Dividends and distributions, if any, are assumed for purposes of this calculation to be reinvested at prices obtained under the Fund’s dividend reinvestment plan. Total returns would have been lower had certain expenses not been waived during the period. Total investment returns do not reflect brokerage commissions, if any, and are not annualized. |
| (d) | The ratios exclude the impact of expenses of the underlying funds in which the Fund invests as represented in the Portfolio of Investments. |
| (f) | Expense ratios before reductions for startup periods may not be representative of longer term operating periods. |
| (g) | Contractual expense limitation changed from 1.98% to 1.88% effective October 1, 2013. |
See Notes to Financial Statements.
| | |
| Annual Report | April 30, 2014 | | 25 |
| | |
| Pathway Advisors Aggressive Growth Fund | | Financial Highlights |
For a share outstanding throughout the periods presented. |
| | | | | | | | |
| | | For the Year
Ended
April 30, 2014 | | | For the Period Ended
April 30, 2013(a) | |
| | |
NET ASSET VALUE, BEGINNING OF PERIOD | | $ | 11.40 | | | $ | 10.00 | |
INCOME FROM OPERATIONS | | | | | | | | |
Net investment income(b) | | | 0.10 | | | | 0.03 | |
Net realized and unrealized gain on investments | | | 1.27 | | | | 1.47 | |
| | | | | | | | |
Total from Investment Operations | | | 1.37 | | | | 1.50 | |
| | | | | | | | |
| | |
LESS DISTRIBUTIONS | | | | | | | | |
Net investment income | | | (0.09) | | | | (0.08) | |
Net realized gain on investments | | | (0.03) | | | | (0.02) | |
| | | | | | | | |
Total Distributions | | | (0.12) | | | | (0.10) | |
| | | | | | | | |
NET INCREASE IN NET ASSET VALUE | | | 1.25 | | | | 1.40 | |
| | | | | | | | |
NET ASSET VALUE, END OF PERIOD | | $ | 12.65 | | | $ | 11.40 | |
| | | | | | | | |
TOTAL RETURN(c) | | | 12.05% | | | | 15.14% | |
| | |
RATIOS/SUPPLEMENTAL DATA | | | | | | | | |
Net assets, End of Period (000s) | | $ | 16,624 | | | $ | 1,579 | |
RATIOS TO AVERAGE NET ASSETS: | | | | | | | | |
Operating expenses excluding reimbursement/waiver(d) | | | 3.16% | | | | 44.74%(e)(f) | |
Operating expenses including reimbursement/waiver(d) | | | 1.90%(g) | | | | 1.98%(e)(f) | |
Net investment income including reimbursement/waiver(d) | | | 0.85% | | | | 0.39%(e) | |
PORTFOLIO TURNOVER RATE | | | 18% | | | | 31%(h) | |
| (a) | The Fund commenced operations on July 31, 2012. |
| (b) | Calculated using the average shares method. |
| (c) | Total investment return is calculated assuming a purchase of a common share at the opening of the first day and a sale at closing on the last day of each period reported. Dividends and distributions, if any, are assumed for purposes of this calculation to be reinvested at prices obtained under the Fund’s dividend reinvestment plan. Total returns would have been lower had certain expenses not been waived during the period. Total investment returns do not reflect brokerage commissions, if any, and are not annualized. |
| (d) | The ratios exclude the impact of expenses of the underlying funds in which the Fund invests as represented in the Portfolio of Investments. |
| (f) | Expense ratios before reductions for startup periods may not be representative of longer term operating periods. |
| (g) | Contractual expense limitation changed from 1.98% to 1.88% effective October 1, 2013. |
See Notes to Financial Statements.
| | |
| 26 | | www.pathwayadvisorsfunds.com |
| | |
| Pathway Advisors Funds | | Notes to Financial Statements |
April 30, 2014 |
1. ORGANIZATION
Financial Investors Trust (the “Trust”), a Delaware statutory trust, is an open-end management investment company registered under the Investment Company Act of 1940, as amended (“1940 Act”). As of April 30, 2014, the Trust has 30 registered funds. This annual report describes Pathway Advisors Conservative Fund, Pathway Advisors Growth and Income Fund and Pathway Advisors Aggressive Growth Fund (individually a “Fund” and collectively, the “Funds”). The Funds’ inception date was July 30, 2012 and operations commenced on July 31, 2012. The Pathway Advisors Conservative Fund seeks total return through a primary emphasis on income with a secondary emphasis on growth of capital. The Pathway Advisors Growth and Income Fund seeks total return through growth of capital and income. The Pathway Advisors Aggressive Growth Fund seeks total return through a primary emphasis on growth with a secondary emphasis on income.
Principal Investment Strategies of each Fund: Each Fund is structured as a fund-of-funds and under normal circumstances, the Funds pursue their objectives by investing primarily in managed portfolios of other open-end investment companies registered under the 1940 Act, that represent a variety of asset classes and investment styles. The Funds may also invest in closed-end funds and exchange-traded funds, which provide exposure to hedging or alternative strategies. Collectively, the investment companies in which the Funds may invest are referred to as “underlying funds”.
2. SIGNIFICANT ACCOUNTING POLICIES
The accompanying financial statements were prepared in accordance with accounting principles generally accepted in the United States of America (“U.S. GAAP”). The preparation of financial statements in conformity with U.S. GAAP requires management to make certain estimates and assumptions that affect the reported amounts of assets and liabilities and disclosures of contingent assets and liabilities at the date of the financial statements and the reported amounts of revenue and expenses during the period. Actual results could differ from those estimates. The following is a summary of significant accounting policies consistently followed by the Funds in preparation of their financial statements.
Investment Valuation: The Funds generally value their securities based on market prices determined at the close of regular trading on the New York Stock Exchange (“NYSE”), normally 4:00 p.m. Eastern Time, on each day the NYSE is open for trading.
For equity securities and mutual funds that are traded on an exchange, the market price is usually the closing sale or official closing price on that exchange. In the case of equity securities not traded on an exchange, or if such closing prices are not otherwise available, the securities are valued at the mean of the most recent bid and ask prices on such day. Redeemable securities issued by open-end registered investment companies are valued at the investment company’s applicable net asset value, with the exception of exchange-traded open-end investment companies, which are priced as equity securities.
The market price for debt obligations is generally the price supplied by an independent third-party pricing service approved by the Board of Trustees (the “Board”), which may use a matrix, formula or other objective method that takes into consideration quotations from dealers, market transactions in comparable investments, market indices and yield curves. If vendors are unable to supply a price, or if the price supplied is deemed to be unreliable, the market price may be
| | |
| Annual Report | April 30, 2014 | | 27 |
| | |
| Pathway Advisors Funds | | Notes to Financial Statement |
April 30, 2014 |
determined using quotations received from one or more broker-dealers that make a market in the security. Short-term debt obligations that will mature in 60 days or less are valued at amortized cost, unless it is determined that using this method would not reflect an investment’s fair value.
When such prices or quotations are not available, or when the Fair Value Committee appointed by the Board believes that they are unreliable, securities may be priced using fair value procedures approved by the Board.
Fair Value Measurements: The Funds disclose the classification of their fair value measurements following a three-tier hierarchy based on the inputs used to measure fair value. Inputs refer broadly to the assumptions that market participants would use in pricing the asset or liability, including assumptions about risk. Inputs may be observable or unobservable. Observable inputs reflect the assumptions market participants would use in pricing the asset or liability that are developed based on market data obtained from sources independent of the reporting entity. Unobservable inputs reflect the reporting entity’s own assumptions about the assumptions market participants would use in pricing the asset or liability that are developed based on the best information available.
Various inputs are used in determining the value of the Funds’ investments as of the end of the reporting period. When inputs used fall into different levels of the fair value hierarchy, the level in the hierarchy within which the fair value measurement falls is determined based on the lowest level input that is significant to the fair value measurement in its entirety. The designated input levels are not necessarily an indication of the risk or liquidity associated with these investments. These inputs are categorized in the following hierarchy under applicable financial accounting standards:
| | |
Level 1 – | | Unadjusted quoted prices in active markets for identical investments, unrestricted assets or liabilities that the Funds have the ability to access at the measurement date; |
| |
Level 2 – | | Quoted prices which are not active, quoted prices for similar assets or liabilities in active markets or inputs other than quoted prices that are observable (either directly or indirectly) for substantially the full term of the asset or liability; and |
| |
Level 3 – | | Significant unobservable prices or inputs (including the Funds’ own assumptions in determining the fair value of investments) where there is little or no market activity for the asset or liability at the measurement date. |
The following is a summary of the inputs used to value the Funds’ investments as of April 30, 2014:
Pathway Advisors Conservative Fund
| | | | | | | | | | | | | | | | |
Investments in Securities at Value | | Level 1 -
Quoted Prices | | | Level 2 -
Other
Significant
Observable
Inputs | | | Level 3 -
Significant
Unobservable
Inputs | | | Total | |
Exchange Traded Funds | | $ | 817,753 | | | $ | – | | | $ | – | | | $ | 817,753 | |
Open-End Mutual Funds | | | 4,480,173 | | | | – | | | | – | | | | 4,480,173 | |
Short Term Investments | | | 136,289 | | | | – | | | | – | | | | 136,289 | |
Total | | $ | 5,434,215 | | | $ | – | | | $ | – | | | $ | 5,434,215 | |
| | |
| | |
| 28 | | www.pathwayadvisorsfunds.com |
| | |
| Pathway Advisors Funds | | Notes to Financial Statements |
April 30, 2014 |
Pathway Advisors Growth and Income Fund
| | | | | | | | | | | | | | | | |
Investments in Securities at Value | | Level 1 -
Quoted Prices | | | Level 2 -
Other
Significant
Observable
Inputs | | | Level 3 -
Significant
Unobservable
Inputs | | | Total | |
Exchange Traded Funds | | $ | 15,905,187 | | | $ | – | | | $ | – | | | $ | 15,905,187 | |
Open-End Mutual Funds | | | 24,228,725 | | | | – | | | | – | | | | 24,228,725 | |
Short Term Investments | | | 719,520 | | | | – | | | | – | | | | 719,520 | |
Total | | $ | 40,853,432 | | | $ | – | | | $ | – | | | $ | 40,853,432 | |
| | |
|
Pathway Advisors Aggressive Growth Fund | |
| | | | |
Investments in Securities at Value | | Level 1 -
Quoted Prices | | | Level 2 -
Other
Significant
Observable
Inputs | | | Level 3 -
Significant
Unobservable
Inputs | | | Total | |
Exchange Traded Funds | | $ | 9,044,838 | | | $ | – | | | $ | – | | | $ | 9,044,838 | |
Open-End Mutual Funds | | | 7,432,522 | | | | – | | | | – | | | | 7,432,522 | |
Short Term Investments | | | 151,137 | | | | – | | | | – | | | | 151,137 | |
Total | | $ | 16,628,497 | | | $ | – | | | $ | – | | | $ | 16,628,497 | |
| | |
The Funds recognize transfers between levels as of the end of the period. For the year ended April 30, 2014, the Funds did not have any transfers between Level 1 and Level 2 securities. For the year ended April 30, 2014, the Funds did not have any securities that used significant unobservable inputs (Level 3) in determining fair value.
Investment Transactions and Investment Income: Investment transactions are accounted for on the date the investments are purchased or sold (trade date basis). Net realized gains and losses from investment transactions are reported on an identified cost basis. Interest income, which includes accretion of discounts and amortization of premiums, is accrued and recorded as earned. Dividend income is recognized on the ex-dividend date or for certain foreign securities, as soon as information is available to the Funds.
Trust Expenses: Some expenses of the Trust can be directly attributed to the Funds. Expenses which cannot be directly attributed to the Funds are apportioned among all funds in the Trust based on average net assets of each fund.
Fund Expenses: Expenses that are specific to a Fund are charged directly to that Fund. Expenses which cannot be directly attributed are apportioned among all funds in the Trust based on average net assets of each Fund.
Offering Costs: Offering costs, including costs of printing initial prospectuses, legal and registration fees, are being amortized over twelve months from the inception date of the Funds. As of April 30, 2014, all offering costs have been fully amortized by the Funds.
| | |
| Annual Report | April 30, 2014 | | 29 |
| | |
| Pathway Advisors Funds | | Notes to Financial Statements |
April 30, 2014 |
Federal Income Taxes: The Funds comply with the requirements under Subchapter M of the Internal Revenue Code of 1986, as amended, applicable to regulated investment companies and intend to distribute substantially all of their net taxable income and net capital gains, if any, each year, so that it will not be subject to excise tax on undistributed income and gains. The Funds are not subject to income taxes to the extent such distributions are made.
As of and during the year ended April 30, 2014, the Funds did not have a liability for any unrecognized tax benefits. The Funds file U.S. federal, state, and local tax returns as required. The Funds’ tax returns are subject to examination by the relevant tax authorities until expiration of the applicable statute of limitations, which is generally three years after the filing of the tax return for federal purposes and four years for most state returns. Tax returns for open years have incorporated no uncertain tax positions that require a provision for income taxes.
Distributions to Shareholders: Each Fund normally pays dividends and distributes capital gains, if any, on an annual basis. Income dividend distributions are derived from interest and other income each Fund receives from its investments, including short-term capital gains. Long term capital gain distributions are derived from gains realized when each Fund sells a security it has owned for more than a year. Each Fund may make additional distributions and dividends at other times if the portfolio manager believes doing so may be necessary for each Fund to avoid or reduce taxes.
3. TAX BASIS INFORMATION
Reclassifications: As of April 30, 2014, permanent differences in book and tax accounting were reclassified. These differences had no effect on net assets and were primarily attributed to non-deductible expenses and book-tax distribution differences. The reclassifications were as follows:
| | | | | | | | | | | | |
| Fund | | Paid-in Capital | | | Accumulated Net
Investment
Income/(Loss) | | | Accumulated Net Realized Gain/(Loss) on
Investments | |
Pathway Advisors Conservative Fund | | $ | (3,455) | | | $ | 3,455 | | | $ | – | |
Pathway Advisors Growth and Income Fund | | | (7,715) | | | | (12,168) | | | | 19,883 | |
Pathway Advisors Aggressive Growth Fund | | | (4,724) | | | | 11,020 | | | | (6,296) | |
Tax Basis of Investments: As of April 30, 2014, the costs of investments for federal income tax purposes and accumulated net unrealized appreciation/(depreciation) on investments were as follows:
| | | | | | | | | | | | | | | | |
| | | Gross
Appreciation
(excess of value
over tax cost) | | | Gross
Depreciation
(excess of tax
cost over value) | | | Net Unrealized
Appreciation | | | Cost of
Investments for
Income Tax
Purposes | |
Pathway Advisors Conservative Fund | | $ | 131,035 | | | $ | (19,784) | | | $ | 111,251 | | | $ | 5,322,964 | |
| | |
| 30 | | www.pathwayadvisorsfunds.com |
| | |
| Pathway Advisors Funds | | Notes to Financial Statements |
April 30, 2014 |
| | | | | | | | | | | | | | | | |
| | | Gross
Appreciation
(excess of value
over tax cost) | | | Gross
Depreciation
(excess of tax
cost over value) | | | Net Unrealized
Appreciation | | | Cost of
Investments for
Income Tax
Purposes | |
Pathway Advisors Growth and Income Fund | | | 1,931,212 | | | | (127,976) | | | | 1,803,236 | | | | 39,050,196 | |
Pathway Advisors Aggressive Growth Fund | | | 1,033,775 | | | | (34,003) | | | | 999,772 | | | | 15,628,725 | |
Components of Earnings: As of April 30, 2014, components of distributable earnings were as follows:
| | | | | | | | | | | | |
| | | Pathway Advisors
Conservative Fund | | | Pathway Advisors
Growth and
Income Fund | | | Pathway Advisors
Aggressive Growth
Fund | |
Undistributed ordinary income | | $ | 26,745 | | | $ | 31,911 | | | $ | 12,629 | |
Accumulated capital gain | | | 26,319 | | | | 228,902 | | | | 84,736 | |
Net unrealized appreciation on investments | | | 111,251 | | | | 1,803,236 | | | | 999,772 | |
Total distributable earnings | | $ | 164,315 | | | $ | 2,064,049 | | | $ | 1,097,137 | |
| | |
Capital Losses: As of April 30, 2014, the Funds have no accumulated capital loss carryforwards.
Tax Basis of Distributions to Shareholders: The character of distributions made during the period from net investment income or net realized gains may differ from its ultimate characterization for federal income tax purposes. Also, due to the timing of dividend distributions, the fiscal year in which amounts are distributed may differ from the fiscal year in which the income or realized gain were recorded by the Funds.
The tax character of distributions paid by the Funds for the year ended April 30, 2014, were as follows:
| | | | | | | | |
| | | Ordinary Income | | | Long-Term Capital
Gain | |
Pathway Advisors Conservative Fund | | $ | 44,742 | | | $ | 7,633 | |
Pathway Advisors Growth and Income Fund | | | 283,872 | | | | 6,553 | |
Pathway Advisors Aggressive Growth Fund | | | 125,902 | | | | 1,722 | |
The tax character of distributions paid by the Funds for the period ended April 30, 2013, were as follows:
| | | | | | | | |
| | | Ordinary Income | | | Long-Term Capital
Gain | |
Pathway Advisors Conservative Fund | | $ | 4,372 | | | $ | – | |
Pathway Advisors Growth and Income Fund | | | 4,402 | | | | – | |
Pathway Advisors Aggressive Growth Fund | | | 4,479 | | | | – | |
| | |
| Annual Report | April 30, 2014 | | 31 |
| | |
| Pathway Advisors Funds | | Notes to Financial Statements |
April 30, 2014 |
4. SECURITIES TRANSACTIONS
Purchases and sales of securities (excluding short-term securities) during the year ended April 30, 2014, were as follows:
| | | | | | | | |
| Fund | | Purchases of
Securities | | | Proceeds From Sales
of Securities | |
Pathway Advisors Conservative Fund | | $ | 5,343,954 | | | $ | 1,231,943 | |
Pathway Advisors Growth and Income Fund | | | 36,898,203 | | | | 2,647,776 | |
Pathway Advisors Aggressive Growth Fund | | | 15,677,835 | | | | 1,685,607 | |
5. BENEFICIAL SHARE TRANSACTIONS
The capitalization of the Trust consists of an unlimited number of shares of beneficial interest with no par value per share. Holders of the shares of the Funds of the Trust have one vote for each share held and a proportionate fraction of a vote for each fractional share. All shares issued and outstanding are fully paid and are non-assessable, transferable and redeemable at the option of the shareholder. Shares have no pre-emptive rights.
Transactions in shares of capital stock:
Pathway Advisors Conservative Fund
| | | | | | | | |
| | | For the Year Ended
April 30, 2014 | | | For the period July 31, 2012
(Commencement of
Operations) to April 30, 2013 | |
Common Shares Outstanding - Beginning of Period | | | 129,714 | | | | – | |
Common Shares Sold | | | 453,941 | | | | 129,476 | |
Common Shares Issued as Reinvestment of Dividends | | | 5,060 | | | | 432 | |
Common Shares Redeemed | | | (77,821) | | | | (194) | |
Common Shares Outstanding - End of Period | | | 510,894 | | | | 129,714 | |
| | |
Pathway Advisors Growth and Income Fund
| | | | | | | | |
| | | For the Year Ended
April 30, 2014 | | | For the period July 31, 2012
(Commencement of
Operations) to April 30, 2013 | |
Common Shares Outstanding - Beginning of Period | | | 470,791 | | | | – | |
Common Shares Sold | | | 3,359,753 | | | | 470,359 | |
Common Shares Issued as Reinvestment of Dividends | | | 25,908 | | | | 432 | |
Common Shares Redeemed | | | (332,230) | | | | – | |
Common Shares Outstanding - End of Period | | | 3,524,222 | | | | 470,791 | |
| | |
| | |
| 32 | | www.pathwayadvisorsfunds.com |
| | |
| Pathway Advisors Funds | | Notes to Financial Statements |
April 30, 2014 |
Pathway Advisors Aggressive Growth Fund
| | | | | | | | |
| | | For the Year Ended
April 30, 2014 | | | For the period July 31, 2012
(Commencement of
Operations) to April 30, 2013 | |
Common Shares Outstanding - Beginning of Period | | | 138,460 | | | | – | |
Common Shares Sold | | | 1,256,587 | | | | 147,706 | |
Common Shares Issued as Reinvestment of Dividends | | | 10,317 | | | | 432 | |
Common Shares Redeemed | | | (90,970) | | | | (9,678) | |
Common Shares Outstanding - End of Period | | | 1,314,394 | | | | 138,460 | |
| | |
6. MANAGEMENT AND RELATED PARTY TRANSACTIONS
Investment Advisory
Hanson McClain, Inc. (the “Adviser”), subject to the authority of the Board, is responsible for the overall management and administration of the Funds’ business affairs. The Adviser manages the investments of the Funds in accordance with the Funds’ investment objective, policies and limitations and investment guidelines established jointly by the Adviser and the Board. Pursuant to the Investment Advisory Agreement (“Advisory Agreement”), the Adviser is entitled to an investment advisory fee, computed daily and payable monthly of 1.00% of the average daily net assets for each Fund.
Prior to October 1, 2013, the Adviser had agreed contractually to limit the amount of each Fund’s total annual expenses to 1.98% of each Fund’s average daily net assets. Effective October 1, 2013, the Adviser has agreed contractually to limit the amount of each Fund’s total annual expenses, exclusive of acquired fund fees and expenses, brokerage expenses, interest expenses, taxes and extraordinary expenses, to 1.88% of each Fund’s average daily net assets. This amended agreement is in effect through August 31, 2015. The Adviser will be permitted to recover expenses it has borne through the agreement described above to the extent that the Funds’ expenses in later periods fall below the annual rates set forth in the relevant agreement. The Funds will not be obligated to pay any such deferred fees and expenses more than three years after the end of the fiscal year in which the fees and expense were deferred. The Adviser may not discontinue this waiver without the approval by the Funds’ Board.
For the year ended April 30, 2014, the fee waivers and/or reimbursements were as follows:
| | | | | | | | | | | | |
| | | Fees Waived/
Reimbursed By
Adviser | | | Recoupment of
Past Waived Fees
By Adviser | | | Total | |
Pathway Advisors Conservative Fund | | $ | 97,471 | | | $ | – | | | $ | 97,471 | |
Pathway Advisors Growth and Income Fund | | | 199,873 | | | | – | | | | 199,873 | |
Pathway Advisors Aggressive Growth Fund | | | 120,826 | | | | – | | | | 120,826 | |
| | |
| Annual Report | April 30, 2014 | | 33 |
| | |
| Pathway Advisors Funds | | Notes to Financial Statements |
April 30, 2014 |
As of April 30, 2014, the balances of recoupable expenses for each Fund were as follows:
| | | | | | | | | | | | |
| Fund | | Expires 2016 | | | Expires 2017 | | | Total | |
Pathway Advisors Conservative Fund | | $ | 153,925 | | | $ | 97,471 | | | $ | 251,396 | |
Pathway Advisors Growth and Income Fund | | | 176,190 | | | | 199,873 | | | | 376,063 | |
Pathway Advisors Aggressive Growth Fund | | | 167,248 | | | | 120,826 | | | | 288,074 | |
Fund Administratore Fees and Expenses
ALPS Fund Services, Inc. (“ALPS” and the “Administrator”) (an affiliate of ALPS Distributors, Inc.) serves as administrator to the Funds, and each Fund has agreed to pay expenses incurred in connection with its administrative activities. Pursuant to the Administration, Bookkeeping and Pricing Services Agreement (the “Agreement”), ALPS will provide operational services to the Funds including, but not limited to fund accounting and fund administration and generally assist in each Fund’s operations.
Annual Administrative Fee, billed monthly in total and allocated to each Fund, in the amount of the greater of (a) the annual minimum for all Funds of $245,000 in year 1 of operations and $260,000 in year 2 and forward (subject to an annual cost of living increase) or (b) following basis point fee schedule:
| | | | |
| Average Total Net Assets | | Contractual Fee | | |
Between $0-$500 Million | | 0.05% | | |
$500M-$1 Billion | | 0.03% | | |
Above $1 Billion | | 0.02% | | |
The Administrator is also reimbursed by the Funds for certain out of pocket expenses.
Transfer Agent
ALPS serves as transfer, dividend paying and shareholder servicing agent for the Fund. ALPS receives an annual minimum fee, a fee based upon the number of shareholder accounts, and is also reimbursed by the Fund for certain out-of-pocket expenses.
Compliance Services
ALPS provides services that assist the Trust’s Chief Compliance Officer in monitoring and testing the policies and procedures of the Trust in conjunction with requirements under Rule 38a-1 under the 1940 Act and receives an annual base fee. ALPS is reimbursed for certain out-of-pocket expenses by the Fund.
Principal Financial Officer
ALPS receives an annual fee for providing principal financial officer services to the Fund.
Distributor
ALPS Distributors, Inc. (“ADI” or the “Distributor”) (an affiliate of ALPS) acts as the distributor of the Funds’ shares pursuant to a Distribution Agreement with the Trust. Shares are sold on a continuous basis by ADI as agent for the Funds, and ADI has agreed to use its best efforts to solicit orders for the sale of Funds’ shares, although it is not obliged to sell any particular amount of
| | |
| 34 | | www.pathwayadvisorsfunds.com |
| | |
| Pathway Advisors Funds | | Notes to Financial Statements |
April 30, 2014 |
shares. ADI is not entitled to any compensation for its services as Distributor. ADI is registered as a broker-dealer with the Securities and Exchange Commission.
Each Fund has adopted a separate Distribution and Services Plan (each a “Plan” and collectively, the “Plans”) pursuant to Rule 12b-1 of the 1940 Act. The Plans allow each Fund, as applicable, to use each Fund’s assets to pay fees in connection with the distribution and marketing of the Funds’ shares and/or the provision of shareholder services to the Funds’ shareholders. The Plan permits payment for services in connection with the administration of plans or programs that use shares of each Fund as their funding medium and for related expenses. Prior to October 1, 2013, the Plans permitted each Fund to make total payments at an annual rate of up to 0.35% of each Fund’s average daily net assets. Subsequently to October 1, 2013, the Plans permit each Fund to make total payments at an annual rate of up to 0.25% of each Funds’ average daily net assets. Because these fees are paid out of the Funds’ assets on an ongoing basis, over time they will increase the cost of an investment in the Funds, and Plan fees may cost an investor more than other types of sales charges.
Each Fund has adopted a Shareholder Services Plan (a “Shareholder Services Plan”) with respect to its shares. Under the Shareholder Services Plan, each Fund is authorized to pay banks and their affiliates and other institutions, including broker-dealers and Fund affiliates (“Participating Organizations”), an aggregate fee in an amount not to exceed on an annual basis 0.15% of the average daily net asset value of shares of the Funds attributable to or held in the name of a Participating Organization for its clients as compensation for providing services pursuant to an agreement with a Participating Organization. Any amount of such payment not paid during the Funds’ fiscal year for such service activities shall be reimbursed to the Funds as soon as practicable after the end of the fiscal year. Shareholder Services Plan fees are included within “Distribution and service fees” on the Statement of Operations.
7. INDEMNIFICATIONS
Under the Trust’s organizational documents, its officers and Trustees are indemnified against certain liability arising out of the performance of their duties to the Trust. Additionally, in the normal course of business, the Trust enters into contracts with service providers that may contain general indemnification clauses, which may permit indemnification to the extent permissible under applicable laws. The Trust's maximum exposure under these arrangements is unknown, as this would involve future claims that may be made against the Trust that have not yet occurred.
8. NEW ACCOUNTING PRONOUNCEMENTS
In June 2013, the Financial Accounting Standards Board (the "FASB") issued Accounting Standards Update (“ASU”) No. 2013-08, Financial Services-Investment Companies (Topic 946): Amendments to the Scope, Measurement, and Disclosure Requirements. The FASB standard identifies characteristics a company must assess to determine whether it is considered an investment company for financial reporting purposes. This ASU is effective for fiscal years beginning after December 15, 2013. The Funds believe the adoption of this ASU will not have a material impact on their financial statements.
| | |
| Annual Report | April 30, 2014 | | 35 |
| | |
| Pathway Advisors Funds | | Report of Independent Registered Public Accounting Firm |
|
To the Shareholders and Board of Trustees of Financial Investors Trust:
We have audited the accompanying statements of assets and liabilities, including the portfolios of investments, of Pathway Advisors Conservative Fund, Pathway Advisors Growth and Income Fund, and Pathway Advisors Aggressive Growth Fund, three of the portfolios constituting Financial Investors Trust (the “Funds”), as of April 30, 2014, and the related statements of operations for the year then ended, and the statements of changes in net assets and the financial highlights for the year then ended and the period from July 31, 2012 (commencement of operations) to April 30, 2013. These financial statements and financial highlights are the responsibility of the Funds’ management. Our responsibility is to express an opinion on these financial statements and financial highlights based on our audits.
We conducted our audits in accordance with the standards of the Public Company Accounting Oversight Board (United States). Those standards require that we plan and perform the audit to obtain reasonable assurance about whether the financial statements and financial highlights are free of material misstatement. The Funds are not required to have, nor were we engaged to perform, an audit of their internal control over financial reporting. Our audits included consideration of internal control over financial reporting as a basis for designing audit procedures that are appropriate in the circumstances, but not for the purpose of expressing an opinion on the effectiveness of the Funds’ internal control over financial reporting. Accordingly, we express no such opinion. An audit also includes examining, on a test basis, evidence supporting the amounts and disclosures in the financial statements, assessing the accounting principles used and significant estimates made by management, as well as evaluating the overall financial statement presentation. Our procedures included confirmation of securities owned as of April 30, 2014, by correspondence with the custodian and brokers; where replies were not received from brokers, we performed other auditing procedures. We believe that our audits provide a reasonable basis for our opinion.
In our opinion, the financial statements and financial highlights referred to above present fairly, in all material respects, the financial position of Pathway Advisors Conservative Fund, Pathway Advisors Growth and Income Fund, and Pathway Advisors Aggressive Growth Fund as of April 30, 2014, the results of their operations for the year then ended, and the changes in their net assets and the financial highlights for the year then ended and the period from July 31, 2012 (commencement of operations) to April 30, 2013, in conformity with accounting principles generally accepted in the United States of America.
DELOITTE & TOUCHE LLP
Denver, Colorado
June 26, 2014
| | |
| 36 | | www.pathwayadvisorsfunds.com |
| | |
| Pathway Advisors Funds | | Additional Information |
April 30, 2014 (Unaudited) |
1. FUND HOLDINGS
The Funds file their complete schedule of portfolio holdings with the Securities and Exchange Commission (the “SEC”) for the first and third quarters of each fiscal year on Form N-Q within 60 days after the end of the period. Copies of the Funds’ Form N-Q are available without charge on the SEC website at http://www.sec.gov. You may also review and copy the Form N-Q at the SEC’s Public Reference Room in Washington, DC. For more information about the operation of the Public Reference Room, please call the SEC at 1-800-SEC-0330.
2. FUND PROXY VOTING POLICIES, PROCEDURES AND SUMMARIES
The Funds’ policies and procedures used in determining how to vote proxies and information regarding how the Fund voted proxies relating to portfolio securities during the most recent prior 12-month period ending June 30 are available without charge, (1) upon request, by calling (toll- free) 888-288-1121 and (2) on the SEC’s website at http://www.sec.gov.
3. TAX DESIGNATIONS
The Funds designate the following as a percentage of taxable ordinary income distributions, or up to the maximum amount allowable, for the calendar year ended December 31, 2013:
| | | | | | | | |
| | | Dividends Received
Deduction | | | Qualified Dividend
Income | |
Pathway Advisors Conservative Fund | | | – | | | | 31.94% | |
Pathway Advisors Growth and Income Fund | | | 35.34% | | | | 69.15% | |
Pathway Advisors Aggressive Growth Fund | | | 22.96% | | | | 80.53% | |
In early 2014, if applicable, shareholders of record received this information for the distributions paid to them by the Funds during the calendar year 2013 via Form 1099. The Funds will notify shareholders in early 2015 of amounts paid to them by the Funds, if any, during the calendar year 2014.
Pursuant to Section 852(b)(3) of the Internal Revenue Code, Pathway Advisors Conservative Fund, Pathway Advisors Growth and Income Fund, and Pathway Advisors Aggressive Fund designated $7,633, $6,553, and $1,722, respectively, as long-term capital gain dividends.
Please consult a tax advisor if you have questions about federal or state income tax laws, or how to prepare your tax returns.
| | |
| Annual Report | April 30, 2014 | | 37 |
| | |
| Pathway Advisors Fund | | Trustees & Officers |
April 30, 2014 (Unaudited) |
Additional information regarding the Fund’s trustees is included in the Statement of Additional Information, which can be obtained without charge by calling 888-288-1121.
INDEPENDENT TRUSTEES
| | | | | | | | | | |
Name, Address* & Year of Birth | | Position(s) Held with Fund | | Term of Office and
Length of Time
Served** | | Principal Occupation(s) During Past 5 Years*** | | Number of Funds in Fund Complex Overseen by Trustee**** | | Other
Directorships
Held by Trustee |
Mary K. Anstine, 1940 | | Trustee | | Ms. Anstine was elected at a special meeting of shareholders held on March 21, 1997 and re-elected at a special meeting of shareholders held on August 7, 2009. | | Ms. Anstine was President/Chief Executive Officer of HealthONE Alliance, Denver, Colorado, and former Executive Vice President of First Interstate Bank of Denver. Ms. Anstine is also Trustee/Director of AV Hunter Trust and Colorado Uplift Board. Ms. Anstine was formerly a Director of the Trust Bank of Colorado (later purchased and now known as Northern Trust Bank), HealthONE and Denver Area Council of the Boy Scouts of America, and a member of the American Bankers Association Trust Executive Committee. | | 30 | | Ms. Anstine is a Trustee of ALPS ETF Trust (21 funds); ALPS Variable Investment Trust (8 funds); Reaves Utility Income Fund (1 fund); and Westcore Trust (12 funds). |
John R. Moran, Jr., 1930 | | Trustee | | Mr. Moran was elected at a special meeting of shareholders held on March 21, 1997 and re-elected at a special meeting of shareholders held on August 7, 2009. | | Mr. Moran is formerly President and CEO of The Colorado Trust, a private foundation serving the health and hospital community in the state of Colorado Currently, Mr. Moran is a member of the Treasurer’s Investment Advisory Committee for the University of Colorado. | | 30 | | None. |
| * | All communications to Trustees and Officers may be directed to Financial Investors Trust c/o 1290 Broadway, Suite 1100, Denver, CO 80203. |
| ** | This is the period for which the Trustee or Officer began serving the Trust. Each Trustee and/or Officer serves an indefinite term, until his successor is elected. |
| *** | Except as otherwise indicated, each individual has held the office shown or other offices in the same company for the last five years. |
| **** | The Fund Complex includes all series of the Trust (currently 30) and any other investment companies for which any Trustee serves as Trustee for and which Hanson McClain, Inc. provides investment advisory services (currently none). |
| | |
| 38 | | www.pathwayadvisorsfunds.com |
| | |
| Pathway Advisors Funds | | Trustees & Officers |
April 30, 2014 (Unaudited) |
| | | | | | | | | | |
Name, Address* & Age | | Position(s) Held with Fund | | Term of Office and Length of Time
Served** | | Principal Occupation(s) During Past 5 Years*** | | Number of Funds in Fund Complex
Overseen by
Trustee**** | | Other
Directorships
Held by Trustee |
Jeremy W. Deems, 1976 | | Trustee | | Mr. Deems
was appointed
as a Trustee at
the March 11,
2008 meeting
of the Board of
Trustees and
elected at a
special
meeting of
shareholders
held on August
7, 2009. | | Mr. Deems is the Co-Founder, Chief Operations Officer and Chief Financial Officer of Green Alpha Advisors, LLC. Mr. Deems is Co-Portfolio Manager of the Shelton Green Alpha Fund. Prior to joining Green Alpha Advisors, Mr. Deems was CFO and Treasurer of Forward Management, LLC, ReFlow Management Co., LLC, ReFlow Fund, LLC, a private investment fund, and Sutton Place Management, LLC, an administrative services company, from 2004 to June 2007. | | 30 | | Mr. Deems is a Trustee of ALPS ETF Trust (21 funds); ALPS Variable Investment Trust (8 funds) and Reaves Utility Income Fund (1 fund). |
Jerry G. Rutledge, 1944 | | Trustee | | Mr. Rutledge
was elected at
a special
meeting of
shareholders
held on August
7, 2009. | | Mr. Rutledge is the President and owner of Rutledge’s Inc., a retail clothing business. He was from 1994 to 2007 a Regent of the University of Colorado. | | 30 | | Mr. Rutledge is a Trustee of Principal Real Estate Income Fund (1 fund), Clough Global Allocation Fund (1 fund), Clough Global Equity Fund (1 fund) and Clough Global Opportunities Fund (1 fund). |
| | |
| Annual Report | April 30, 2014 | | 39 |
| | |
| Pathway Advisors Fund | | Trustees & Officers |
April 30, 2014 (Unaudited) |
| | | | | | | | | | |
Name, Address* & Age | | Position(s)
Held with
Fund | | Term of Office and
Length of Time
Served** | | Principal Occupation(s) During Past 5 Years*** | | Number of
Funds in
Fund
Complex
Overseen by
Trustee**** | | Other
Directorships
Held by Trustee |
Michael “Ross” Shell , 1970 | | Trustee | | Mr. Shell was elected at a special meeting of shareholders held on August 7, 2009. | | Mr. Shell is Founder and CEO of Red Idea, LLC, a strategic consulting/early stage venture firm (since June 2008). From 1999 to 2009, he was a part-owner and Director of Tesser, Inc., a brand agency. From December 2005 to May 2008, he was Director, Marketing and Investor Relations, of Woodbourne, a REIT/real estate hedge fund and private equity firm. Prior to this, from May 2004 to November 2005, he worked as a business strategy consultant; from June 2003 to April 2004, he was on the Global Client Services team of IDEO, a product design/innovation firm; and from 1999 to 2003, he was President of Tesser, Inc. Mr. Shell graduated with honors from Stanford University with a degree in Political Science. | | 30 | | None. |
| * | All communications to Trustees and Officers may be directed to Financial Investors Trust c/o 1290 Broadway, Suite 1100, Denver, CO 80203. |
| ** | This is the period for which the Trustee or Officer began serving the Trust. Each Trustee and/or Officer serves an indefinite term, until his successor is elected. |
| *** | Except as otherwise indicated, each individual has held the office shown or other offices in the same company for the last five years. |
| **** | The Fund Complex includes all series of the Trust (currently 30) and any other investment companies for which any Trustee serves as Trustee for and which Hanson McClain, Inc. provides investment advisory services (currently none). |
| | |
| 40 | | www.pathwayadvisorsfunds.com |
| | |
| Pathway Advisors Fund | | Trustees & Officers |
April 30, 2014 (Unaudited) |
INTERESTED TRUSTEE
| | | | | | | | | | |
Name, Address*
& Year
Born | | Position(s)
Held with
Fund | | Term of Office and
Length of Time
Served** | | Principal Occupation(s) During Past 5 Years*** | | Number of
Funds in
Fund
Complex
Overseen
by Trustee**** | | Other Directorships
Held by Trustee |
| Edmund J. Burke, 1961 | | Trustee, Chairman and President | | Mr. Burke was elected as Chairman at the August 28, 2009 meeting of the Board of Trustees. Mr. Burke was elected as Trustee at a special meeting of shareholders held on August 7, 2009. Mr. Burke was elected President of the Trust at the December 17, 2002 meeting of the Board of Trustees. | | Mr. Burke is President and a Director of ALPS Holdings, Inc. (“AHI”) (since 2005) and Director of Boston Financial Data Services, Inc. (“BFDS”), ALPS Advisors, Inc. (“AAI”), ALPS Distributors, Inc. (“ADI”), ALPS Fund Services, Inc. (“AFS”) and ALPS Portfolio Solutions Distributor, Inc. (“APSD”) and from 2001-2008, was President of AAI, ADI, AFS and APSD. Because of his positions with AHI, BFDS, AAI, ADI, AFS and APSD, Mr. Burke is deemed an affiliate of the Trust as defined under the 1940 Act. Mr. Burke is Trustee and President of the Clough Global Allocation Fund (Trustee since 2006; President since 2004); Trustee and President of the Clough Global Equity Fund (Trustee since 2006; President since 2005); Trustee and President of the Clough Global Opportunities Fund (since 2006); Trustee of the Liberty All-Star Equity Fund; and Director of the Liberty All-Star Growth Fund, Inc. | | 30 | | Mr. Burke is a Trustee of Clough Global Allocation Fund (1 fund); Clough Global Equity Fund (1 fund); Clough Global Opportunities Fund (1 fund); Trustee of the Liberty All-Star Equity Fund (1 fund); and Director of the Liberty All-Star Growth Fund, Inc. (1 fund). |
| | |
| Annual Report | April 30, 2014 | | 41 |
| | |
| Pathway Advisors Fund | | Trustees & Officers |
April 30, 2014 (Unaudited) |
OFFICERS
| | | | | | |
Name, Address* & Year of Birth | | Position(s) Held with Fund | | Term of Office and
Length of Time
Served** | | Principal Occupation(s) During Past 5 Years*** |
Kimberly R. Storms, 1972 | | Treasurer | | Ms. Storms was elected Treasurer of the Trust at the March 12, 2013 meeting of the Board of Trustees. | | Ms. Storms is Senior Vice President - Director of Fund Administration of ALPS. Ms. Storms joined ALPS in 1998 as Assistant Controller. Because of her position with ALPS, Ms. Storms is deemed an affiliate of the Trust as defined under the 1940 Act. Ms. Storms is also Treasurer of BPV Family of Funds and ALPS Series Trust; Assistant Treasurer of Liberty All-Star Equity Fund and Liberty All-Star Growth Fund, Inc.; Assistant Treasurer of Tilson Funds; and Chief Financial Officer of The Arbitrage Funds. |
David T. Buhler, 1971 | | Secretary | | Mr. Buhler was elected Secretary of the Trust at the September 11, 2012 meeting of the Board of Trustees. | | Mr. Buhler joined ALPS in June 2010. He is currently Vice President and Senior Associate Counsel of ALPS, AAI, ADI and APSD. Prior to joining ALPS, Mr. Buhler served as Associate General Counsel and Assistant Secretary of Founders Asset Management LLC from 2006 to 2009. Because of his position with ALPS, Mr. Buhler is deemed an affiliate of the Trust as defined under the 1940 Act. Mr. Buhler is also the Secretary ALPS Variable Investment Trust and Westcore Trust. |
Ted Uhl, 1974 | | Chief Compliance Officer (“CCO”) | | Mr. Uhl was appointed CCO of the Trust at the June 8, 2010 meeting of the Board of Trustees. | | Mr. Uhl joined ALPS in October 2006, and is currently Deputy Compliance Officer of ALPS. Prior to his current role, Mr. Uhl served as Senior Risk Manager for ALPS from October 2006 until June 2010. Before joining ALPS, Mr. Uhl served a Sr. Analyst with Enenbach and Associates (RIA), and a Sr. Financial Analyst at Sprint. Because of his position with ALPS, Mr. Uhl is deemed an affiliate of the Trust as defined under the 1940 Act. Mr. Uhl is also CCO of the Clough Global Funds, Reaves Utility Income Fund, Drexel Hamilton Funds and Transparent Value Trust. |
| * | All communications to Trustees and Officers may be directed to Financial Investors Trust c/o 1290 Broadway, Suite 1100, Denver, CO 80203. |
| ** | This is the period for which the Trustee or Officer began serving the Trust. Each Trustee and/or Officer serves an indefinite term, until his successor is elected. |
| *** | Except as otherwise indicated, each individual has held the office shown or other offices in the same company for the last five years. |
| | |
| 42 | | www.pathwayadvisorsfunds.com |
Page Intentionally Left Blank


Table of Contents
www.vulcanvaluepartners.com
Shareholder Letter
April 30, 2014 (Unaudited)
PORTFOLIO REVIEW
April 30, 2014
General
We are pleased with the results we enjoyed during the period ended April 30, 2014. We are gratified that the Vulcan Value Partners Fund and the Vulcan Value Partners Small Cap Fund received a 5-Star Overall Morningstar Rating™. (As of April 30, 2014 out of 1,482 Large Growth, and 606 Small Blend Funds, derived from a weighted average of the Fund’s three-, five– and ten– year (if applicable) Morningstar metrics, which are based on risk-adjusted return performance.)1
However, the summary of the first four months of 2014 is that the market rewarded businesses that we had no desire owning and punished the outstanding businesses that we were happy to own as long-term investors. Our businesses continued to compound their intrinsic values and their prices fell. As a result, we improved our margin of safety and mitigated risk in the portfolios. The cost was poor short-term performance. It is a cost we have paid in the past (2007) and will happily pay again in order to improve the opportunity for attractive long-term risk adjusted returns.
As we have often said we place no weight on short-term results, good or bad, and neither should you. In fact, we have made and will continue to make decisions that negatively impact short-term performance when we think we can improve our long-term returns and lower risk. We encourage you to place more weight on our longer-term historical results and a great deal of weight on our long-term prospects.
We are more concerned with risk than we are with returns. We seek to mitigate risk by limiting our investments to what we believe are extremely high quality companies whose estimated values are inherently stable. We further aim to mitigate risk by demanding a discount to those stable values. When prices fall and estimated values rise, as occurred during the first four months of 2014, our margin of safety improves and risk is mitigated.
Our preference is to mitigate risk by lowering our weighted average price to value ratios and thereby improving our portfolios’ margin of safety. When larger discounts are not available, we hold smaller positions in the deepest discounts we can find. That is, we will acknowledge reality and hold smaller stakes in admittedly less discounted companies. As a result we will lower risk through increased diversification. In either case, we are managing risk.
Recently, we became more diversified as we sold more fully valued companies and redeployed capital into companies with larger discounts than those we sold. The deepest discounts available to us today are not as great as they have been in recent years as markets have recovered from the financial crisis. Consequently, we took smaller position sizes, which also mitigated risk through greater diversification. This process was more pronounced in Small Cap than in Large Cap.
So, what has been working recently that we are glad we did not own? Utilities were one of the best performing groups among both large caps and small caps. We are not aware of a single utility that would qualify for investment at Vulcan Value Partners. In our opinion, the outlook for the industry going forward is relatively poor with stagnant demand, high leverage, and record high
| | |
Annual Report | April 30, 2014 | | 1 |
Shareholder Letter
April 30, 2014 (Unaudited)
valuations. Financials, driven by commercial banks and investment banks, did well while our financials declined. We do not like commercial banks or investment banks because their values are inherently unstable. Instead, we bought what we believe are three new outstanding financials (one in Large Cap and two in Small Cap) as they were declining in price, which hurt our short term returns. Energy did well. We are not aware of any energy companies we would like to own at today’s prices and there are very few we would like to own at any price! Lastly, many of the top performing names were biotechs with negative free cash flow and “new technology” companies with what we regard as absurd valuations, negative free cash flow, and largely unproven business models. Obviously, we have no interest in either. We prefer to own deeply discounted, dominant businesses with strong balance sheets that produce ample amounts of free cash flow. If their prices continue to decline and their estimated values continue to grow as we expect they will, we will keep buying more, even if it continues to hurt our short-term performance.
As we write our letters, we always feel like we are “preaching to the choir.” We are extremely fortunate to be in partnership with intelligent, long term investors. You make our jobs easier and much more enjoyable. We could not execute our investment philosophy as effectively if we worked for a different kind of client base. We are grateful for you and take our fiduciary duty to you very seriously. We are pleased that we were able to mitigate risk and improve our prospective long-term returns during the first quarter.
In the discussion that follows, we generally define material contributors and detractors as companies having a greater than 1% impact on the portfolio.
Vulcan Value Partners Large Cap Review2
There were five material contributors to performance during the period; Apple, Oracle, Dover, Mastercard and Bank of New York Mellon. There were no material detractors to performance during the period. We have increased our weight in Apple as it stock price declined and it became one of our largest positions. Since that time, Apple large amounts of free cash flow, allocated capital brilliantly, introduced a number of well received products, and expanded its already formidable global distribution reach. Oracle and Mastercard have continued to produce solid results in line with or above our expectations and have continued to use their large free cash flow streams to repurchase stock at attractive prices.
We bought nine new positions and sold five positions during the period.
Recent purchases included UK based Aberdeen Asset Management, Verizon Communications, Wellpoint, eBay and Marriott International. Aberdeen Asset Management became attractive to us due to fears that declines in emerging markets would adversely impact its short-term results since it invests a portion of its clients’ assets in emerging markets. Verizon Communications’ estimated value has compounded steadily while its stock price has declined. We believe Verizon has the best cellular network in the U.S. and recently gained full control of Verizon Wireless from Vodaphone. Wellpoint’s stock price stagnated over the last twelve months due to concerns about the Affordable Care Act impacting its short-term results. Meanwhile, its estimated value has grown steadily. We owned eBay several years ago and hoped that we would have a chance to own it again. EBay’s estimated value has grown steadily since we sold it. During 2013, its stock price was relatively flat as its estimated value continued to compound at high double-digit rates. We sold companies at our estimate of fair value and reallocated capital into eBay at an estimated discount.
| | |
2 | | www.vulcanvaluepartners.com |
Shareholder Letter
April 30, 2014 (Unaudited)
Since we owned it last, the company has become more competitively entrenched and broadened its revenue stream in its original Marketplaces business. Paypal, owned by eBay, has grown very rapidly and has become the dominant on-line payments provider. We are big fans of CEO John Donohoe, who took over from the very capable Meg Whitman. We also purchased Marriott International. Marriott has long pursued the asset-light hotel franchise and management model that other hotel companies (two of whom we own) have more recently emulated. The company has leading hotel brands and global reach. Its management team, led by Bill Marriott, has tremendous depth. Similar to eBay, Marriott’s value has compounded steadily and its stock price has not kept pace.
Recent sales include United Technologies, Google and CME. We sold United Technologies at a price very close to our estimate of fair value. United Technologies was an outstanding investment for us with both its price and estimated value compounding at double digit rates while we held it. We like the company, but at our estimate of fair value there is no margin of safety and our investment discipline requires us to sell. We redeployed capital into what we believe are businesses with larger margins of safety and mitigated risk in the portfolio as a result. We sold our last share of Google north of $1,000. In 2010, when the stock was trading at $531.64 (4/26/10 Closing Price) BusinessWeek wrote an article about Vulcan Value Partners entitled, “Google, a Value Play? Really? Vulcan Value Partners’ new funds scout for quality companies trading at double-digit discounts.” Value investors can own companies that grow. We just demand that they be cheap as well. We held Google for more than five years. During that time its value grew steadily and its stock price doubled. Although Google was a great investment for us and we think its value will continue to compound nicely, its price has risen to our estimate of fair value so that there is no longer a margin of safety available to us. No matter how much we like a company, we will not hold anything that does not have a margin of safety. We have used the proceeds from selling Google to buy more companies with greater estimated discounts and larger margins of safety. The larger the margin of safety, the greater the weight in our portfolios. We sold CME Group for the exact same reason. CME Group was an excellent investment for us, but it rose to our estimate of fair value so we reallocated capital into more companies with greater estimated discounts to mitigate risk by improving our margin of safety.
Vulcan Value Partners Small Cap Review2
We had a great deal of activity during the period as we mitigated risk by lowering our weighted average price to value ratio and through greater diversification. There were four material contributors to performance and two material detractors to performance during the period. Neustar was our largest detractor with a loss of 41.3%. We have owned Neustar for over two years and it has been a good investment for us until 2014. In fact, we sold some of our position and reduced its weight in 2013 as its price rose faster than its estimated value last year. Neustar has three main businesses. Its largest business segment manages all phone number portability in the U.S. and has done so successfully since the mid-1990’s. Its contract with the Federal Communications Commission (FCC) is up for renewal and the timing of announcing the winner has been delayed, fueling speculation that Neustar has lost the contract. We have always valued the contract at a discount to their other businesses, but thought that the risk of losing the contract was extremely low. Without the contract, Neustar is trading at our estimate of the value of its remaining businesses. We will follow our investment discipline with regard to Neustar and with all of our investments.
| | |
Annual Report | April 30, 2014 | | 3 |
Shareholder Letter
April 30, 2014 (Unaudited)
We bought 24 new positions and sold 16 positions during the period
Recent new purchases include Knowles Corp., GenPact, U.S. Ecology and SAI Global. Knowles was spun out of Dover Corp., which we own in our Large Cap program. Several years ago GenPact was spun out of GE, which we do not own but follow in our Large Cap program. These purchases are examples of how both programs support and reinforce each other. U.S. Ecology manages and disposes hazardous waste and SAI Global helps companies manage compliance systems.
Recent sales include John Wiley, Newmarket Corp., Perkin-Elmer, Omnicell, Global Payments, Nordson, and OpenText . All were sold at or near our estimate of fair value and no longer had a sufficient margin of safety.
We closed the Small Cap Fund to new investors during the period. You, as an existing Small Cap Fund client, can continue to invest in the Small Cap Fund, but it is closed to new investors. We closed Small Cap because we wanted to remain small enough to be able to buy and sell stakes in our companies without liquidity constraints. We are long-term investors, but we like the liquidity that public markets provide us because we can reallocate capital rapidly when opportunities present themselves. Growing too large relative to the size of the companies in which we invest in Small Cap would reduce the effectiveness of this tool to us and ultimately impede our ability to continue to execute our strategy. We would make more money if we remained open. However as fiduciaries, we have a duty to put our clients first, even if it is not in our best interests. We take fiduciary duty seriously. In fact, the first Vulcan Value Partners value is “serve others before self.” Moreover, as investors in our strategies who are required to invest exclusively in our strategies, we want to be able to compound capital at above-average rates over our very long-term time horizon. We will close any strategy when we believe further growth would reduce our ability to perform.
Closing
With prices down and estimated values up, we are feeling better about our long-term prospects today than we were at the end of our last letter. We added to the building blocks, but we paid for it with poor short-term performance. We will continue to execute our investment philosophy regardless of short-term impacts to our portfolios. We would not be able to do so without outstanding clients who provide stable capital and allow us to make intelligent investment decisions based upon our five year time horizon. We are grateful for you and are working hard to continue to earn your confidence in us.
Thank you for the confidence you have placed in us.
C.T. Fitzpatrick
Chief Executive Officer
| | |
4 | | www.vulcanvaluepartners.com |
Shareholder Letter
April 30, 2014 (Unaudited)
| 1 | For each fund with at least a three-year history, Morningstar calculates a Morningstar Rating™ based on a Morningstar Risk-Adjusted Return measure that accounts for variation in a fund’s monthly performance (including the effects of sales charges, loads, and redemption fees), placing more emphasis on downward variations and rewarding consistent performance. The top 10% of funds in each category receive 5 stars, the next 22.5% receive 4 stars, the next 35% receive 3 stars, the next 22.5% receive 2 stars and the bottom 10% receive 1 star. (Each share class is counted as a fraction of one fund within this scale and rated separately, which may cause slight variations in the distribution percentages.) The Overall Morningstar Rating for a fund is derived from a weighted average of the performance figures associated with its three-, five- and ten-year (if applicable) Morningstar Rating metrics, as of April 30, 2014. Morningstar Rating is for the retail share class only; other classes may have different performance characteristics. © 2014 Morningstar, Inc. All Rights Reserved. The information contained herein: (1) is proprietary to Morningstar and/or its content providers; (2) may not be copied or distributed; and (3) is not warranted to be accurate, complete or timely. Neither Morningstar nor its content providers are responsible for any damages or losses arising from any use of this information. Vulcan Value Partners (VVPLX) was rated 5 Stars out of 1482 for the 3-year period against Large Growth Funds. Vulcan Value Partners (VVPSX) was rated 5 Stars out of 606 for the 3-year period against Small Blend Funds. All information in this report is as of the date shown in the upper right hand corner unless otherwise indicated. |
| ² | Please see page 6 and 9 for 1 year and inception to date returns for the Vulcan Value Partners Fund and Vulcan Value Small Cap Fund, respectively. |
Margin of Safety is a favorable difference between the price of a company’s shares and the estimated intrinsic value of those shares.
Free Cash Flow is a measure of how much a business generates after accounting for capital expenditures. It is calculated as operating cash flow less capital expenditures.
Price to value ratio is a calculation that compares the price of a company’s stock to our appraisal of the company’s intrinsic value. Fair or intrinsic value is our estimate of the price a willing buyer would pay and a willing seller would accept, assuming neither was compelled to enter into a transaction.
The views and information discussed in this commentary are as of the date of publication, are subject to change, and may not reflect the writer’s current views. The views expressed represent an assessment of market conditions at a specific point in time, are opinions only and should not be relied upon as investment advice regarding a particular investment or markets in general. Such information does not constitute a recommendation to buy or sell specific securities or investment vehicles. It should not be assumed that any investment will be profitable or will equal the performance of the Funds or any securities or any sectors mentioned herein. The subject matter contained herein has been derived from several sources believed to be reliable and accurate at the time of compilation. Vulcan Value Partners, LLC does not accept any liability for losses either direct or consequential caused by the use of this information.
Diversification does not assure a profit or protect against loss.
The primary and secondary benchmark indexes are not actively managed and do not reflect any deductions for fees, expenses or taxes. An investor may not invest directly in an index.
| | |
Annual Report | April 30, 2014 | | 5 |
Fund Overview
April 30, 2014 (Unaudited)
VULCAN VALUE PARTNERS FUND
Average Annual Total Returns (as of 4/30/14)
| | | | | | | | | | |
| | | | | | | Since | | Expense Ratios |
| | | 1 Year | | 3 Year | | Inception* | | Total | | Net** |
Vulcan Value Partners Fund | | 22.84% | | 18.22% | | 16.47% | | 1.18% | | 1.18% |
S&P 500® Total Return Index*** | | 20.44% | | 13.83% | | 15.00% | | | | |
Russell 1000® Value Index*** | | 20.90% | | 14.16% | | 15.41% | | | | |
Performance data quoted represents past performance. Past performance does not guarantee future results. Investment return and principal value of an investment will fluctuate so that an investor’s shares, when sold or redeemed, may be worth more or less than the original cost. The Fund imposes a 2.00% redemption fee on shares held for less that 90 days. Current performance data may be higher or lower than actual data quoted. For the most current month-end performance data, please call 1-877-421-5078.
The table does not reflect the deduction of taxes that a shareholder would pay on Fund distributions or the redemption of Fund shares.
Subject to investment risks, including possible loss of the principal amount invested.
| * | Fund inception date of 12/30/09. |
| ** | Vulcan Value Partners, LLC (“Vulcan” or the “Adviser”) has given a contractual agreement to the Fund that to the extent the Total Annual Fund Operating Expenses (as defined in Item 3 of Form N-1A) with respect to the Fund (exclusive of Acquired Fund Fees and Expenses (if any), brokerage expenses, interest expense, taxes and extraordinary expenses) (“Designated Annual Fund Operating Expenses”) exceed 1.25% of the Fund’s average daily net assets for a particular fiscal year of the Fund, the Adviser will reduce the Management Fee and/or Other Expenses otherwise payable to the Adviser with respect to the Fund for the fiscal year by an amount equal to such excess, and/or the Adviser shall reimburse the Fund by the amount of such excess. This agreement is in effect through August 31, 2014. Without this agreement, expenses could be higher. If the Adviser foregoes any fees and/or reimburses the Fund pursuant to this letter agreement with respect to a particular fiscal year, then the Adviser shall be entitled to recover from the Fund the amount foregone or reimbursed to the extent Designated Annual Fund Operating Expenses are less than 1.25% of the Fund’s average daily net assets if within three years after the expenses were incurred. |
| *** | Indices are not actively managed and do not reflect any deduction for fees, expenses or taxes. An investor may not invest directly in an index. |
| | |
6 | | www.vulcanvaluepartners.com |
Fund Overview
April 30, 2014 (Unaudited)
Performance of $10,000 Initial Investment (for the period ended April 30, 2014)
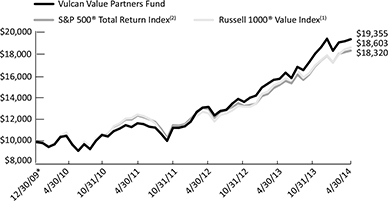
The chart above represents historical performance of a hypothetical investment of $10,000 in the Fund since inception. Past performance does not guarantee future results. This chart does not reflect the deduction of taxes that a shareholder would pay on Fund distributions or the redemption of Fund shares.
| * | Fund inception date of 12/30/09. |
| (1) | The Russell 1000® Value Index measures the performance of the large-cap value segment of the U.S. equity universe. It includes those Russell 1000® companies with lower price-to-book ratios and lower expected growth values. The index is not actively managed and does not reflect any deductions for fees, expense or taxes. An investor may not invest directly in an index. |
| (2) | The S&P 500® Total Return Index is an unmanaged index of 500 common stocks chosen for market size, liquidity and industry group representation. It is a market-value weighted index. The index is not actively managed and does not reflect any deductions for fees, expense or taxes. An investor may not invest directly in an index. |
Investing in the Fund is subject to investment risks, including possible loss of the principal amount invested.
Industry Allocation (as a % of Net Assets)†
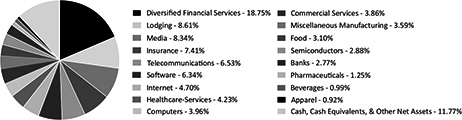
| † | Chart presents indicative values only. |
| | |
Annual Report | April 30, 2014 | | 7 |
Disclosure of Fund Expenses
April 30, 2014 (Unaudited)
As a shareholder of the Vulcan Value Partners Fund (the “Fund”), you will incur two types of costs: (1) transaction costs, including applicable redemption fees; and (2) ongoing costs, including management fees and other Fund expenses. The following examples are intended to help you understand your ongoing costs (in dollars) of investing in the Fund and to compare these costs with the ongoing costs of investing in other mutual funds. The examples are based on an investment of $1,000 invested on November 1, 2013 and held until April 30, 2014.
Actual Expenses. The first line of each table below provides information about actual account values and actual expenses. You may use the information in this line, together with the amount you invested, to estimate the expenses that you paid over the period. Simply divide your account value by $1,000 (for example, an $8,600 account value divided by $1,000 = 8.6), then multiply the result by the number in the first line under the heading “Expenses Paid During Period” to estimate the expenses you paid on your account during this period.
Hypothetical Example for Comparison Purposes. The second line of the table below provides information about hypothetical account values and hypothetical expenses based on the Fund’s actual expense ratio and an assumed rate of return of 5% per year before expenses, which is not the Fund’s actual return. The hypothetical account values and expenses may not be used to estimate the actual ending account balance or expenses you paid for the period. You may use this information to compare the ongoing costs of investing in the Fund and other mutual funds. To do so, compare this 5% hypothetical example with the 5% hypothetical examples that appear in the shareholder reports of the other funds. The expenses shown in the table are meant to highlight ongoing Fund costs only and do not reflect transaction fees, such as redemption fees or exchange fees. Therefore, the second line of each table below is useful in comparing ongoing costs only, and may not help you determine the relative total costs of owning different funds. In addition, if these transactional costs were included, your costs would have been higher.
Vulcan Value Partners Fund
| | | | | | | | |
| | | Beginning Account Value 11/1/13 | | Ending Account Value 4/30/14 | | Expense Ratio(a) | | Expenses Paid During period 11/1/13 - 4/30/14(b) |
| | | | |
Actual | | $1,000.00 | | $1,072.50 | | 1.09% | | $5.60 |
Hypothetical (5% return before expenses) | | $1,000.00 | | $1,019.39 | | 1.09% | | $5.46 |
| (a) | The Fund’s expense ratios have been annualized based on the Fund’s most recent fiscal half-year expenses. |
| (b) | Expenses are equal to the Fund’s annualized expense ratio multiplied by the average account value over the period, multiplied by the number of days in the most recent fiscal half-year (181)/365 (to reflect the half-year period). |
| | |
8 | | www.vulcanvaluepartners.com |
Fund Overview
April 30, 2014 (Unaudited)
VULCAN VALUE PARTNERS SMALL CAP FUND
Average Annual Total Returns (as of 4/30/14)
| | | | | | | | | | |
| | | | | | | Since | | Expense Ratios |
| | | 1 Year | | 3 Year | | Inception* | | Total | | Net** |
Vulcan Value Partners Small Cap Fund | | 16.11% | | 15.53% | | 19.68% | | 1.35% | | 1.26% |
Russell 2000® Value Index*** | | 19.61% | | 11.16% | | 14.92% | | | | |
Russell 2000® Index*** | | 20.50% | | 10.74% | | 15.75% | | | | |
Performance data quoted represents past performance. Past performance does not guarantee future results. Investment return and principal value of an investment will fluctuate so that an investor’s shares, when sold or redeemed, may be worth more or less than the original cost. The Fund imposes a 2.00% redemption fee on shares held for less than 90 days. Current performance data may be higher or lower than actual data quoted. For the most current month-end performance data, please call 1-877-421-5078.
The table does not reflect the deduction of taxes that a shareholder would pay on Fund distributions or the redemption of Fund shares.
Subject to investment risks, including possible loss of the principal amount invested.
| * | Fund inception date of 12/30/09. |
| ** | Vulcan Value Partners, LLC (“Vulcan” or the “Adviser”) has given a contractual agreement to the Fund that to the extent the Total Annual Fund Operating Expenses (as defined in Item 3 of Form N-1A) with respect to the Fund (exclusive of Acquired Fund Fees and Expenses (if any), brokerage expenses, interest expense, taxes and extraordinary expenses) (“Designated Annual Fund Operating Expenses”) exceed 1.25% of such Fund’s average daily net assets for a particular fiscal year of the Fund, the Adviser will reduce the Management Fee and/or Other Expenses otherwise payable to the Adviser with respect to the Fund for such fiscal year by an amount equal to such excess, and/or the Adviser shall reimburse the Fund by the amount of such excess. This agreement is in effect through August 31, 2014. Without this agreement, expenses could be higher. If the Adviser foregoes any fees and/or reimburses the Fund pursuant to this letter agreement with respect to a particular fiscal year, then the Adviser shall be entitled to recover from the Fund the amount foregone or reimbursed to the extent Designated Annual Fund Operating Expenses are less than 1.25% of the Fund’s average daily net assets if within three years after the expenses were incurred. |
| *** | Indices are not actively managed and do not reflect any deduction for fees, expenses or taxes. An investor may not invest directly in an index. |
| | |
Annual Report | April 30, 2014 | | 9 |
Fund Overview
April 30, 2014 (Unaudited)
Performance of $10,000 Initial Investment (for the period ended April 30, 2014)
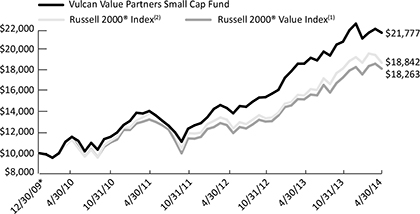
The chart above represents historical performance of a hypothetical investment of $10,000 in the Fund since inception. Past performance does not guarantee future results. This chart does not reflect the deduction of taxes that a shareholder would pay on Fund distributions or the redemption of Fund shares.
| * | Fund inception date of 12/30/09. |
| (1) | The Russell 2000® Value Index measures the performance of small-cap value segment of the U.S. equity universe. It includes those Russell 2000® companies with lower price-to-book ratios and lower forecasted growth values. The index is not actively managed and does not reflect any deductions for fees, expense or taxes. An investor may not invest directly in an index. |
| (2) | The Russell 2000® Index measures the performance of the small-cap segment of the U.S. equity universe. The Russell 2000® Index is a subset of the Russell 3000® Index representing approximately 8% of the total market capitalization of that index. It includes approximately 2,000 of the smallest securities based on a combination of their market cap and current index membership. The index is not actively managed and does not reflect any deductions for fees, expense or taxes. An investor may not invest directly in an index. |
Investing in the Fund is subject to investment risks, including possible loss of the principal amount invested.
Industry Allocation (as a % of Net Assets)†
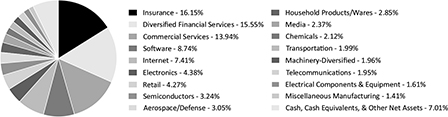
| † | Chart presents indicative values only. |
| | |
10 | | www.vulcanvaluepartners.com |
Disclosure of Fund Expenses
April 30, 2014 (Unaudited)
As a shareholder of the Vulcan Value Partners Small Cap Fund (the “Fund”), you will incur two types of costs: (1) transaction costs, including applicable redemption fees; and (2) ongoing costs, including management fees and other Fund expenses. The following examples are intended to help you understand your ongoing costs (in dollars) of investing in the Fund and to compare these costs with the ongoing costs of investing in other mutual funds. The examples are based on an investment of $1,000 invested on November 1, 2013 and held until April 30, 2014.
Actual Expenses. The first line of each table below provides information about actual account values and actual expenses. You may use the information in this line, together with the amount you invested, to estimate the expenses that you paid over the period. Simply divide your account value by $1,000 (for example, an $8,600 account value divided by $1,000 = 8.6), then multiply the result by the number in the first line under the heading “Expenses Paid During Period” to estimate the expenses you paid on your account during this period.
Hypothetical Example for Comparison Purposes. The second line of the table below provides information about hypothetical account values and hypothetical expenses based on the Fund’s actual expense ratio and an assumed rate of return of 5% per year before expenses, which is not the Fund’s actual return. The hypothetical account values and expenses may not be used to estimate the actual ending account balance or expenses you paid for the period. You may use this information to compare the ongoing costs of investing in the Fund and other mutual funds. To do so, compare this 5% hypothetical example with the 5% hypothetical examples that appear in the shareholder reports of the other funds. The expenses shown in the table are meant to highlight ongoing Fund costs only and do not reflect transaction fees, such as redemption fees or exchange fees. Therefore, the second line of each table below is useful in comparing ongoing costs only, and may not help you determine the relative total costs of owning different funds. In addition, if these transactional costs were included, your costs would have been higher.
Vulcan Value Partners Small Cap Fund
| | | | | | | | |
| | | Beginning Account Value 11/1/13 | | Ending Account Value 4/30/14 | | Expense Ratio(a) | | Expenses Paid During period 11/1/13 - 4/30/14(b) |
| | | | |
Actual | | $ 1,000.00 | | $ 1,042.00 | | 1.25% | | $ 6.33 |
Hypothetical (5% return before expenses) | | $ 1,000.00 | | $ 1,018.60 | | 1.25% | | $ 6.26 |
| (a) | The Fund’s expense ratios have been annualized based on the Fund’s most recent fiscal half-year expenses. |
| (b) | Expenses are equal to the Fund’s annualized expense ratio multiplied by the average account value over the period, multiplied by the number of days in the most recent fiscal half-year (181)/365 (to reflect the half-year period). |
| | |
Annual Report | April 30, 2014 | | 11 |
| | |
| Statement of Investments | | Vulcan Value Partners Fund |
| April 30, 2014 | | |
| | | | | | | | |
| | | Shares | | | Value (Note 2) | |
COMMON STOCKS (88.23%) | | | | | | | | |
Communications (19.57%) | | | | | | | | |
Internet (4.70%) | | | 842,981 | | | $ | 43,691,705 | |
| | | | | | | | |
eBay, Inc.(a) | | | | | | | | |
| | |
Media (8.34%) | | | | | | | | |
Discovery Communications, Inc., Class C(a) | | | 414,245 | | | | 29,051,002 | |
Time Warner, Inc. | | | 403,600 | | | | 26,823,256 | |
Walt Disney Co. | | | 273,494 | | | | 21,699,014 | |
| | | | | | | | |
| | | | | | | 77,573,272 | |
| | | | | | | | |
| | |
Telecommunications (6.53%) | | | | | | | | |
Cisco Systems, Inc. | | | 1,423,615 | | | | 32,899,743 | |
Verizon Communications, Inc. | | | 595,936 | | | | 27,848,089 | |
| | | | | | | | |
| | | | | | | 60,747,832 | |
| | | | | | | | |
| | |
TOTAL COMMUNICATIONS | | | | | | | 182,012,809 | |
| | | | | | | | |
| | |
Consumer, Cyclical (9.53%) | | | | | | | | |
Apparel (0.92%) | | | | | | | | |
LVMH Moet Hennessy Louis Vuitton, SA | | | 43,522 | | | | 8,567,741 | |
| | | | | | | | |
| | |
Lodging (8.61%) | | | | | | | | |
Intercontinental Hotels Group PLC, ADR | | | 680,370 | | | | 23,418,349 | |
Marriott International, Inc., Class A | | | 328,261 | | | | 19,016,160 | |
Starwood Hotels & Resorts Worldwide, Inc. | | | 491,234 | | | | 37,653,086 | |
| | | | | | | | |
| | | | | | | 80,087,595 | |
| | | | | | | | |
| | |
TOTAL CONSUMER, CYCLICAL | | | | | | | 88,655,336 | |
| | | | | | | | |
| | |
Consumer, Non-cyclical (13.43%) | | | | | | | | |
Beverages (0.99%) | | | | | | | | |
Coca-Cola Co. | | | 226,202 | | | | 9,226,779 | |
| | | | | | | | |
| | |
Commercial Services (3.86%) | | | | | | | | |
Mastercard, Inc., Class A | | | 487,768 | | | | 35,875,336 | |
| | | | | | | | |
| | |
Food (3.10%) | | | | | | | | |
Unilever NV, New York Registry Shares | | | 672,291 | | | | 28,787,501 | |
| | | | | | | | |
| | |
Healthcare-Services (4.23%) | | | | | | | | |
WellPoint, Inc. | | | 390,394 | | | | 39,304,868 | |
| | | | | | | | |
| | |
12 | | www.vulcanvaluepartners.com |
| | |
| Vulcan Value Partners Fund | | Statement of Investments |
| | April 30, 2014 |
| | | | | | | | |
| | | Shares | | | Value (Note 2) | |
Consumer, Non-cyclical (continued) | | | | | | | | |
Pharmaceuticals (1.25%) | | | | | | | | |
Express Scripts Holding Co.(a) | | | 174,865 | | | $ | 11,642,512 | |
| | | | | | | | |
| | |
TOTAL CONSUMER, NON-CYCLICAL | | | | | | | 124,836,996 | |
| | | | | | | | |
| | |
Financial (28.93%) | | | | | | | | |
Banks (2.77%) | | | | | | | | |
Bank of New York Mellon Corp. | | | 760,559 | | | | 25,760,134 | |
| | | | | | | | |
| | |
Diversified Financial Services (18.75%) | | | | | | | | |
Aberdeen Asset Management PLC | | | 7,270,863 | | | | 54,022,512 | |
Franklin Resources, Inc. | | | 835,746 | | | | 43,751,303 | |
NASDAQ OMX Group, Inc. | | | 938,489 | | | | 34,630,244 | |
Visa, Inc., Class A | | | 206,772 | | | | 41,894,075 | |
| | | | | | | | |
| | | | | | | 174,298,134 | |
| | | | | | | | |
| | |
Insurance (7.41%) | | | | | | | | |
Chubb Corp. | | | 298,574 | | | | 27,492,694 | |
Everest Re Group, Ltd. | | | 262,211 | | | | 41,437,204 | |
| | | | | | | | |
| | | | | | | 68,929,898 | |
| | | | | | | | |
| | |
TOTAL FINANCIAL | | | | | | | 268,988,166 | |
| | | | | | | | |
| | |
Industrial (3.59%) | | | | | | | | |
Miscellaneous Manufacturing (3.59%) | | | | | | | | |
Dover Corp. | | | 281,394 | | | | 24,312,442 | |
Parker Hannifin Corp. | | | 71,102 | | | | 9,021,422 | |
| | | | | | | | |
| | | | | | | 33,333,864 | |
| | | | | | | | |
| | |
TOTAL INDUSTRIAL | | | | | | | 33,333,864 | |
| | | | | | | | |
| | |
Technology (13.18%) | | | | | | | | |
Computers (3.96%) | | | | | | | | |
Apple, Inc. | | | 62,464 | | | | 36,859,382 | |
| | | | | | | | |
| | |
Semiconductors (2.88%) | | | | | | | | |
QUALCOMM, Inc. | | | 339,926 | | | | 26,755,575 | |
| | | | | | | | |
| | |
Software (6.34%) | | | | | | | | |
Check Point Software Technologies, Ltd.(a) | | | 190,531 | | | | 12,205,416 | |
| | |
Annual Report | April 30, 2014 | | 13 |
| | |
| Statement of Investments | | Vulcan Value Partners Fund |
April 30, 2014 | | |
| | | | | | | | | | | | |
| | | | | | Shares | | | Value (Note 2) | |
Technology (continued) | | | | | | | | | | | | |
Software (continued) | | | | | | | | | | | | |
Oracle Corp. | | | | | | | 1,142,775 | | | $ | 46,716,642 | |
| | | | | | | | | | | 58,922,058 | |
| | | |
TOTAL TECHNOLOGY | | | | | | | | | | | 122,537,015 | |
| | | |
TOTAL COMMON STOCKS (Cost $667,487,882) | | | | | | | | | | | 820,364,186 | |
| | | |
| | | 7-Day Yield | | | Shares | | | Value (Note 2) | |
SHORT TERM INVESTMENTS (4.45%) | | | | | | | | | | | | |
Money Market Fund (4.45%) | | | | | | | | | | | | |
Dreyfus Treasury Prime Cash Management Fund, Institutional Shares | | | 0.010 | % | | | 41,401,158 | | | | 41,401,158 | |
TOTAL SHORT TERM INVESTMENTS (Cost $41,401,158) | | | | | | | | | | | 41,401,158 | |
| | | |
TOTAL INVESTMENTS (92.68%) (Cost $708,889,040) | | | | | | | | | | $ | 861,765,344 | |
| | | |
Other Assets In Excess Of Liabilities (7.32%) | | | | | | | | | | | 68,063,710 | |
| | | |
NET ASSETS (100.00%) | | | | | | | | | | $ | 929,829,054 | |
| | |
| (a) | Non-Income Producing Security. |
Common Abbreviations:
ADR - American Depositary Receipt.
Ltd. - Limited.
NV - Naamloze Vennootschap is the Dutch term for a public limited liability corporation.
PLC - Public Limited Company.
SA - Generally designates corporations in various countries, mostly those employing the civil law.
Holdings are subject to change.
For Fund compliance purposes, the Fund’s industry classifications refer to any one or more of the industry sub-classifications used by one or more widely recognized market indexes or ratings group indexes, and/or as defined by Fund management. This definition may not apply for purposes of this report, which may combine industry sub-classifications for reporting ease. Industries are shown as a percentage of net assets.
See Accompanying Notes to Financial Statements.
| | |
14 | | www.vulcanvaluepartners.com |
| | |
| Vulcan Value Partners Small Cap Fund | | Statement of Investments |
| | April 30, 2014 |
| | | | | | | | |
| | | Shares | | | Value (Note 2) | |
COMMON STOCKS (92.99%) | | | | | | | | |
Basic Materials (2.12%) | | | | | | | | |
Chemicals (2.12%) | | | | | | | | |
Albemarle Corp. | | | 104,160 | | | $ | 6,982,886 | |
KMG Chemicals, Inc. | | | 998,503 | | | | 15,586,632 | |
| | | | | | | 22,569,518 | |
| | |
TOTAL BASIC MATERIALS | | | | | | | 22,569,518 | |
| | |
Communications (11.73%) | | | | | | | | |
Internet (7.41%) | | | | | | | | |
Conversant, Inc.(a) | | | 3,231,513 | | | | 78,978,178 | |
| | |
Media (2.37%) | | | | | | | | |
SAI Global Ltd. | | | 6,403,263 | | | | 25,333,728 | |
| | |
Telecommunications (1.95%) | | | | | | | | |
Knowles Corp.(a) | | | 338,338 | | | | 9,449,780 | |
NeuStar, Inc., Class A(a) | | | 441,540 | | | | 11,356,409 | |
| | | | | | | 20,806,189 | |
| | |
TOTAL COMMUNICATIONS | | | | | | | 125,118,095 | |
| | |
Consumer, Cyclical (4.27%) | | | | | | | | |
Retail (4.27%) | | | | | | | | |
Nu Skin Enterprises, Inc., Class A | | | 523,011 | | | | 45,501,957 | |
| | |
TOTAL CONSUMER, CYCLICAL | | | | | | | 45,501,957 | |
| | |
Consumer, Non-cyclical (16.79%) | | | | | | | | |
Commercial Services (13.94%) | | | | | | | | |
Chemed Corp. | | | 296,368 | | | | 24,678,563 | |
Genpact Ltd.(a) | | | 963,757 | | | | 16,248,943 | |
Heartland Payment Systems, Inc. | | | 531,322 | | | | 21,752,322 | |
Insperity, Inc. | | | 1,449,264 | | | | 46,463,404 | |
Live Nation Entertainment, Inc.(a) | | | 498,944 | | | | 10,417,951 | |
Navigant Consulting, Inc.(a) | | | 468,665 | | | | 7,873,572 | |
Universal Technical Institute, Inc. | | | 1,762,705 | | | | 21,170,087 | |
| | | | | | | 148,604,842 | |
| | |
Annual Report | April 30, 2014 | | 15 |
| | |
| Statement of Investments | | Vulcan Value Partners Small Cap Fund |
April 30, 2014 | | |
| | | | | | | | |
| | | Shares | | | Value (Note 2) | |
Consumer, Non-cyclical (continued) | | | | | | | | |
Household Products/Wares (2.85%) | | | | | | | | |
Tupperware Brands Corp. | | | 358,281 | | | $ | 30,421,640 | |
| | |
TOTAL CONSUMER, NON-CYCLICAL | | | | | | | 179,026,482 | |
| | |
Financial (31.70%) | | | | | | | | |
Diversified Financial Services (15.55%) | | | | | | | | |
Ashmore Group PLC | | | 9,724,097 | | | | 57,534,760 | |
Eaton Vance Corp. | | | 1,123,237 | | | | 40,515,159 | |
NASDAQ OMX Group, Inc. | | | 1,086,395 | | | | 40,087,975 | |
Virtus Investment Partners, Inc.(a) | | | 149,543 | | | | 27,663,960 | |
| | | | | | | 165,801,854 | |
| | |
Insurance (16.15%) | | | | | | | | |
Everest Re Group, Ltd. | | | 320,650 | | | | 50,672,320 | |
Montpelier Re Holdings, Ltd. | | | 1,007,456 | | | | 30,808,004 | |
Navigators Group, Inc.(a) | | | 760,221 | | | | 43,309,790 | |
ProAssurance Corp. | | | 684,706 | | | | 31,099,347 | |
Safety Insurance Group, Inc. | | | 304,387 | | | | 16,348,626 | |
| | | | | | | 172,238,087 | |
| | |
TOTAL FINANCIAL | | | | | | | 338,039,941 | |
| | |
Industrial (14.40%) | | | | | | | | |
Aerospace/Defense (3.05%) | | | | | | | | |
Curtiss-Wright Corp. | | | 508,160 | | | | 32,491,750 | |
| | |
Electrical Components & Equipment (1.61%) | | | | | | | | |
EnerSys, Inc. | | | 253,633 | | | | 17,140,518 | |
| | |
Electronics (4.38%) | | | | | | | | |
Ituran Location and Control, Ltd. | | | 1,126,128 | | | | 27,049,594 | |
Woodward, Inc. | | | 438,600 | | | | 19,662,438 | |
| | | | | | | 46,712,032 | |
| | |
Machinery-Diversified (1.96%) | | | | | | | | |
Lindsay Corp. | | | 236,874 | | | | 20,875,706 | |
| | |
Miscellaneous Manufacturing (1.41%) | | | | | | | | |
Donaldson Co., Inc. | | | 358,266 | | | | 15,079,416 | |
| | |
16 | | www.vulcanvaluepartners.com |
| | |
| Vulcan Value Partners Small Cap Fund | | Statement of Investments |
| | April 30, 2014 |
| | | | | | | | | | | | |
| | | | | | Shares | | | Value (Note 2) | |
Industrial (continued) | | | | | | | | | | | | |
Transportation (1.99%) | | | | | | | | | | | | |
Forward Air Corp. | | | | | | | 481,203 | | | $ | 21,283,609 | |
| | | |
TOTAL INDUSTRIAL | | | | | | | | | | | 153,583,031 | |
| | | |
Technology (11.98%) | | | | | | | | | | | | |
Semiconductors (3.24%) | | | | | | | | | | | | |
Rovi Corp.(a) | | | | | | | 1,549,257 | | | | 34,532,939 | |
| | | |
Software (8.74%) | | | | | | | | | | | | |
ACI Worldwide, Inc.(a) | | | | | | | 800,561 | | | | 45,752,061 | |
Fair Isaac Corp. | | | | | | | 492,206 | | | | 28,154,183 | |
MSCI, Inc.(a) | | | | | | | 475,315 | | | | 19,269,270 | |
| | | | | | | | | | | 93,175,514 | |
| | | |
TOTAL TECHNOLOGY | | | | | | | | | | | 127,708,453 | |
| | | |
TOTAL COMMON STOCKS (Cost $921,209,779) | | | | | | | | | | | 991,547,477 | |
| | | |
| | | 7-Day
Yield | | | Shares | | | Value (Note 2) | |
SHORT TERM INVESTMENTS (8.16%) | | | | | | | | | | | | |
Money Market Fund (8.16%) | | | | | | | | | | | | |
Dreyfus Treasury Prime Cash Management Fund, Institutional Shares | | | 0.010 | % | | | 86,991,683 | | | | 86,991,683 | |
| | | |
TOTAL SHORT TERM INVESTMENTS (Cost $86,991,683) | | | | | | | | | | | 86,991,683 | |
| | | |
TOTAL INVESTMENTS (101.15%) (Cost $1,008,201,462) | | | | | | | | | | $ | 1,078,539,160 | |
| | | |
Liabilities In Excess Of Other Assets (-1.15%) | | | | | | | | | | | (12,292,897) | |
| | | |
NET ASSETS (100.00%) | | | | | | | | | | $ | 1,066,246,263 | |
| | |
| (a) | Non-Income Producing Security. |
| | |
Annual Report | April 30, 2014 | | 17 |
| | |
| Statement of Investments | | Vulcan Value Partners Small Cap Fund |
April 30, 2014 | | |
Common Abbreviations:
Ltd. - Limited.
PLC - Public Limited Company.
Holdings are subject to change.
For Fund compliance purposes, the Fund’s industry classifications refer to any one or more of the industry sub-classifications used by one or more widely recognized market indexes or ratings group indexes, and/or as defined by Fund management. This definition may not apply for purposes of this report, which may combine industry sub-classifications for reporting ease. Industries are shown as a percentage of net assets.
See Accompanying Notes to Financial Statements.
| | |
18 | | www.vulcanvaluepartners.com |
Statements of Assets and Liabilities
April 30, 2014
| | | | | | | | |
| | | Vulcan Value Partners Fund | | | Vulcan Value Partners Small Cap Fund | |
ASSETS: | | | | | | | | |
Investments, at value | | $ | 861,765,344 | | | $ | 1,078,539,160 | |
Receivable for investments sold | | | 78,822,280 | | | | 3,549,501 | |
Receivable for shares sold | | | 274,541 | | | | 533,735 | |
Dividends receivable | | | 750,192 | | | | 257,660 | |
Other assets | | | 18,824 | | | | 19,182 | |
Total assets | | | 941,631,181 | | | | 1,082,899,238 | |
| | |
LIABILITIES: | | | | | | | | |
Payable for investments purchased | | | 10,696,849 | | | | 13,771,231 | |
Payable for shares redeemed | | | 191,877 | | | | 1,704,040 | |
Payable to adviser | | | 748,496 | | | | 902,899 | |
Payable for administration fees | | | 22,708 | | | | 26,605 | |
Payable for transfer agency fees | | | 18,198 | | | | 93,270 | |
Payable for professional fees | | | 18,512 | | | | 18,487 | |
Payable for trustee fees and expenses | | | 6,982 | | | | 8,611 | |
Accrued expenses and other liabilities | | | 98,505 | | | | 127,832 | |
Total liabilities | | | 11,802,127 | | | | 16,652,975 | |
| | |
NET ASSETS | | $ | 929,829,054 | | | $ | 1,066,246,263 | |
| | |
| | |
NET ASSETS CONSIST OF: | | | | | | | | |
Paid-in capital (Note 5) | | $ | 745,031,465 | | | $ | 960,388,403 | |
Accumulated net investment income | | | 1,352,320 | | | | 0 | |
Accumulated net realized gain on investments | | | 30,568,965 | | | | 35,520,162 | |
Net unrealized appreciation in value of investments | | | 152,876,304 | | | | 70,337,698 | |
NET ASSETS | | $ | 929,829,054 | | | $ | 1,066,246,263 | |
| | |
| | |
INVESTMENTS, AT COST | | $ | 708,889,040 | | | $ | 1,008,201,462 | |
| | |
PRICING OF SHARES: | | | | | | | | |
Net Asset Value, offering and redemption price per share | | $ | 18.20 | | | $ | 18.74 | |
Shares of beneficial interest outstanding (unlimited number of shares, no par value common stock authorized) | | | 51,095,142 | | | | 56,885,580 | |
| | |
| See Accompanying Notes to Financial Statements. | | |
Annual Report | April 30, 2014 | | 19 |
Statements of Operations
For the Year Ended April 30, 2014
| | | | | | | | |
| | | Vulcan Value Partners Fund | | | Vulcan Value Partners Small Cap Fund | |
INVESTMENT INCOME: | | | | | | | | |
Dividends | | $ | 13,264,814 | | | $ | 9,163,782 | |
Foreign taxes withheld | | | (223,117) | | | | (328,890) | |
Total investment income | | | 13,041,697 | | | | 8,834,892 | |
| | |
EXPENSES: | | | | | | | | |
Investment advisory fees (Note 6) | | | 6,915,036 | | | | 8,469,912 | |
Administrative fees | | | 237,221 | | | | 250,811 | |
Transfer agency fees | | | 112,250 | | | | 563,658 | |
Professional fees | | | 33,199 | | | | 33,947 | |
Custodian fees | | | 81,136 | | | | 72,008 | |
Trustee fees and expenses | | | 26,743 | | | | 30,126 | |
Other | | | 128,374 | | | | 186,188 | |
Total expenses before waiver | | | 7,533,959 | | | | 9,606,650 | |
Less fees waived/reimbursed by investment adviser (Note 6) | | | – | | | | (400,224) | |
Total net expenses | | | 7,533,959 | | | | 9,206,426 | |
NET INVESTMENT INCOME/(LOSS) | | | 5,507,738 | | | | (371,534) | |
| | |
Net realized gain on investments | | | 45,055,933 | | | | 59,572,270 | |
Net realized gain on foreign currency transactions | | | 1,721 | | | | 11,313 | |
Net change in unrealized appreciation of investments | | | 84,723,466 | | | | 29,817,231 | |
NET REALIZED AND UNREALIZED GAIN ON INVESTMENTS | | | 129,781,120 | | | | 89,400,814 | |
NET INCREASE IN NET ASSETS RESULTING FROM OPERATIONS | | $ | 135,288,858 | | | $ | 89,029,280 | |
| | |
| | |
| See Accompanying Notes to Financial Statements. | | |
20 | | www.vulcanvaluepartners.com |
Statements of Changes in Net Assets
| | | | | | | | |
| | | Vulcan Value Partners Fund | |
| | |
| | | For the Year Ended April 30, 2014 | | | For the Year Ended April 30, 2013 | |
OPERATIONS: | | | | | | | | |
Net investment income | | $ | 5,507,738 | | | $ | 3,290,462 | |
Net realized gain on investments and foreign currency transactions | | | 45,057,654 | | | | 16,601,840 | |
Net change in unrealized appreciation on investments | | | 84,723,466 | | | | 46,424,045 | |
Net increase in net assets resulting from operations | | | 135,288,858 | | | | 66,316,347 | |
| | |
DISTRIBUTIONS TO SHAREHOLDERS (Note 3): | | | | | | | | |
From net investment income | | | (4,575,383) | | | | (2,967,613) | |
From net realized gains on investments | | | (18,524,637) | | | | (2,972,698) | |
Net decrease in net assets from distributions | | | (23,100,020) | | | | (5,940,311) | |
| | |
SHARE TRANSACTIONS (Note 5): | | | | | | | | |
Proceeds from sales of shares | | | 410,644,045 | | | | 346,215,896 | |
Issued to shareholders in reinvestment of distributions | | | 19,326,050 | | | | 5,574,795 | |
Cost of shares redeemed, net of redemption fees | | | (59,627,069) | | | | (89,956,685) | |
Net increase from share transactions | | | 370,343,026 | | | | 261,834,006 | |
| | |
Net increase in net assets | | | 482,531,864 | | | | 322,210,042 | |
| | |
NET ASSETS: | | | | | | | | |
Beginning of year | | | 447,297,190 | | | | 125,087,148 | |
End of year* | | $ | 929,829,054 | | | $ | 447,297,190 | |
| | |
| | |
*Includes accumulated net investment income of: | | $ | 1,352,320 | | | $ | 418,244 | |
| | |
| See Accompanying Notes to Financial Statements. | | |
Annual Report | April 30, 2014 | | 21 |
Statements of Changes in Net Assets
| | | | | | | | |
| | | Vulcan Value Partners Small Cap Fund | |
| | |
| | | For the Year Ended April 30, 2014 | | | For the Year Ended April 30, 2013 | |
OPERATIONS: | | | | | | | | |
Net investment income/(loss) | | $ | (371,534) | | | $ | 347,998 | |
Net realized gain on investments | | | 59,583,583 | | | | 15,172,626 | |
Net change in unrealized appreciation on investments | | | 29,817,231 | | | | 35,892,359 | |
Net increase in net assets resulting from operations | | | 89,029,280 | | | | 51,412,983 | |
| | |
DISTRIBUTIONS TO SHAREHOLDERS (Note 3): | | | | | | | | |
From net investment income | | | – | | | | (764,307) | |
From net realized gains on investments | | | (37,145,114) | | | | (1,181,796) | |
Net decrease in net assets from distributions | | | (37,145,114) | | | | (1,946,103) | |
| | |
SHARE TRANSACTIONS (Note 5): | | | | | | | | |
Proceeds from sales of shares | | | 753,029,272 | | | | 355,116,824 | |
Issued to shareholders in reinvestment of distributions | | | 28,982,662 | | | | 1,713,133 | |
Cost of shares redeemed, net of redemption fees | | | (192,802,041) | | | | (21,247,646) | |
Net increase from share transactions | | | 589,209,893 | | | | 335,582,311 | |
| | |
Net increase in net assets | | | 641,094,059 | | | | 385,049,191 | |
| | |
NET ASSETS: | | | | | | | | |
Beginning of year | | | 425,152,204 | | | | 40,103,013 | |
End of year* | | $ | 1,066,246,263 | | | $ | 425,152,204 | |
| | |
| | |
*Includes accumulated net investment income/(loss) of: | | $ | 0 | | | $ | (348,823) | |
| | |
| See Accompanying Notes to Financial Statements. | | |
22 | | www.vulcanvaluepartners.com |
Intentionally Left Blank
Financial Highlights
For a share outstanding throughout the periods presented.
|
NET ASSET VALUE, BEGINNING OF PERIOD |
INCOME/(LOSS) FROM OPERATIONS: |
|
Net investment income/(loss) |
Net realized and unrealized gain on investments |
Total from investment operations |
|
LESS DISTRIBUTIONS TO SHAREHOLDERS: |
From net investment income |
From net realized gains on investments |
Total distributions |
|
Redemption fees added to paid-in capital |
Increase in net asset value |
NET ASSET VALUE, END OF YEAR |
| |
|
Total return |
|
RATIOS AND SUPPLEMENTAL DATA: |
Net assets, end of year (000’s) |
|
Ratio of expenses to average net assets without fee waivers/reimbursements |
Ratio of expenses to average net assets including fee waivers/reimbursements |
|
Net investment income/(loss) to average net assets including fee waivers/reimbursements |
|
Portfolio turnover rate |
| (a) | Per share numbers have been calculated using the average shares method. |
| (b) | Less than $(0.005) per share. |
| (c) | Less than $0.005 per share. |
| | |
See Accompanying Notes to Financial Statements. | | |
24 | | www.vulcanvaluepartners.com |
Vulcan Value Partners Small Cap Fund
| | | | | | | | | | | | | | | | | | | | | | | |
For the Year Ended April 30, 2014 | | For the Year Ended April 30, 2013 | | For the Year Ended April 30, 2012 | | For the Year Ended April 30, 2011 | | For the Period December 30, 2009 (Inception) to April 30, 2010 |
| | $ | 15.28 | | | | $ | 13.03 | | | | $ | 11.66 | | | | $ | 10.57 | | | | $ | 10.00 | |
| | | | | | | | | | | | | | | | | | | | | | | | |
| | | | |
| | | 0.14 | (a) | | | | 0.15 | (a) | | | | 0.02 | (a) | | | | 0.01 | (a) | | | | (0.00) | (b) |
| | | 3.33 | | | | | 2.35 | | | | | 1.45 | | | | | 1.13 | | | | | 0.57 | |
| | | 3.47 | | | | | 2.50 | | | | | 1.47 | | | | | 1.14 | | | | | 0.57 | |
| | | | |
| | | | | | | | | | | | | | | | | | | | | | | | |
| | | (0.11) | | | | | (0.12) | | | | | (0.01) | | | | | (0.01) | | | | | – | |
| | | (0.44) | | | | | (0.13) | | | | | (0.09) | | | | | (0.04) | | | | | – | |
| | | (0.55) | | | | | (0.25) | | | | | (0.10) | | | | | (0.05) | | | | | – | |
| | | | |
| | | 0.00 | (c) | | | | 0.00 | (c) | | | | 0.00 | (c) | | | | 0.00 | (c) | | | | 0.00 | (c) |
| | | 2.92 | | | | | 2.25 | | | | | 1.37 | | | | | 1.09 | | | | | 0.57 | |
| | $ | 18.20 | | | | $ | 15.28 | | | | $ | 13.03 | | | | $ | 11.66 | | | | $ | 10.57 | |
| | | | |
| | | | |
| | | 22.84% | | | | | 19.33% | | | | | 12.73% | | | | | 10.82% | | | | | 5.70% | (d) |
| | | | |
| | | | | | | | | | | | | | | | | | | | | | | | |
| | $ | 929,829 | | | | $ | 447,297 | | | | $ | 125,087 | | | | $ | 48,757 | | | | $ | 12,807 | |
| | | | |
| | | 1.09% | | | | | 1.18% | | | | | 1.51% | | | | | 2.01% | | | | | 4.97% | (e) |
| | | 1.09% | | | | | 1.18% | | | | | 1.50% | | | | | 1.50% | | | | | 1.50% | (e) |
| | | | |
| | | 0.80% | | | | | 1.06% | | | | | 0.16% | | | | | 0.07% | | | | | (0.06%) | (e) |
| | | | |
| | | 56% | | | | | 24% | | | | | 49% | | | | | 44% | | | | | 24% | (d) |
| | |
Annual Report | April 30, 2014 | | 25 |
Financial Highlights
For a share outstanding throughout the periods presented.
|
NET ASSET VALUE, BEGINNING OF PERIOD |
INCOME/(LOSS) FROM OPERATIONS: |
|
Net investment income/(loss) |
Net realized and unrealized gain on investments |
Total from investment operations |
|
LESS DISTRIBUTIONS TO SHAREHOLDERS: |
From net investment income |
From net realized gains on investments |
Total distributions |
|
Redemption fees added to paid-in capital |
Increase/(decrease) in net asset value |
NET ASSET VALUE, END OF YEAR |
| |
|
Total return |
|
RATIOS AND SUPPLEMENTAL DATA: |
Net assets, end of year (000’s) |
|
Ratio of expenses to average net assets without fee waivers/reimbursements |
Ratio of expenses to average net assets including fee waivers/reimbursements |
|
Net investment income/(loss) to average net assets including fee waivers/reimbursements |
|
Portfolio turnover rate |
| (a) | Per share numbers have been calculated using the average shares method. |
| (b) | Less than $(0.005) per share. |
| (c) | Less than $0.005 per share. |
| | |
See Accompanying Notes to Financial Statements. | | |
26 | | www.vulcanvaluepartners.com |
Vulcan Value Partners Small Cap Fund
| | | | | | | | | | | | | | | | | | | | | | | |
For the Year Ended April 30, 2014 | | For the Year Ended
April 30, 2013 | | For the Year Ended
April 30, 2012 | | For the Year Ended
April 30, 2011 | | For the Period
December 30, 2009
(Inception) to April 30, 2010 |
| | $ | 16.97 | | | | $ | 13.18 | | | | $ | 13.72 | | | | $ | 11.60 | | | | $ | 10.00 | |
| | | | | | | | | | | | | | | | | | | | | | | | |
| | | | |
| | | (0.01) | (a) | | | | 0.03 | (a) | | | | 0.02 | (a) | | | | (0.09) | (a) | | | | (0.00) | (b) |
| | | 2.76 | | | | | 3.91 | | | | | 0.17 | | | | | 2.55 | | | | | 1.60 | |
| | | 2.75 | | | | | 3.94 | | | | | 0.19 | | | | | 2.46 | | | | | 1.60 | |
| | | | |
| | | | | | | | | | | | | | | | | | | | | | | | |
| | | – | | | | | (0.06) | | | | | – | | | | | – | | | | | – | |
| | | (0.98) | | | | | (0.09) | | | | | (0.73) | | | | | (0.34) | | | | | – | |
| | | (0.98) | | | | | (0.15) | | | | | (0.73) | | | | | (0.34) | | | | | – | |
| | | | |
| | | 0.00 | (c) | | | | 0.00 | (c) | | | | 0.00 | (c) | | | | 0.00 | (c) | | | | – | |
| | | 1.77 | | | | | 3.79 | | | | | (0.54) | | | | | 2.12 | | | | | 1.60 | |
| | $ | 18.74 | | | | $ | 16.97 | | | | $ | 13.18 | | | | $ | 13.72 | | | | $ | 11.60 | |
| | | | |
| | | | |
| | | 16.11% | | | | | 30.07% | | | | | 2.10% | | | | | 21.75% | | | | | 16.00% | (d) |
| | | | |
| | | | | | | | | | | | | | | | | | | | | | | | |
| | $ | 1,066,246 | | | | $ | 425,152 | | | | $ | 40,103 | | | | $ | 36,363 | | | | $ | 7,225 | |
| | | | |
| | | 1.30% | | | | | 1.38% | | | | | 1.86% | | | | | 2.50% | | | | | 7.31% | (e) |
| | | 1.25% | | | | | 1.28% | | | | | 1.50% | | | | | 1.50% | | | | | 1.50% | (e) |
| | | | |
| | | (0.05%) | | | | | 0.21% | | | | | 0.15% | | | | | (0.71%) | | | | | (0.57%) | (e) |
| | | | |
| | | 70% | | | | | 57% | | | | | 57% | | | | | 60% | | | | | 33% | (d) |
| | |
Annual Report | April 30, 2014 | | 27 |
Notes to Financial Statements
April 30, 2014
1. ORGANIZATION
Financial Investors Trust (the “Trust”) is organized as a Delaware statutory trust and is registered as an open-end management investment company under the Investment Company Act of 1940, as amended (“1940 Act”). As of April 30, 2014, the Trust had 30 registered funds. This annual report describes the Vulcan Value Partners Fund and Vulcan Value Partners Small Cap Fund (each a “Fund” and collectively, the “Funds”). The Vulcan Value Partners Fund seeks to achieve long-term capital appreciation by investing primarily in publicly traded mid-and large-capitalization U.S. companies believed to be both undervalued and possessing a sustainable competitive advantage. The Vulcan Value Partners Small Cap Fund seeks to achieve long-term capital appreciation by investing primarily in publicly traded small-capitalization U.S. companies believed to be both undervalued and possessing a sustainable competitive advantage. The Vulcan Value Partners Small-Cap Fund is registered as a non-diversified investment company for purpose of the 1940 Act. As a result of ongoing operations, it is possible the Fund may become a diversified investment company, which would occur at the earliest on or about April, 2015 for Vulcan Value Partners Fund and on or about January, 2015 for Vulcan Value Small Cap Fund. In such case, the Fund may not resume operating in a non-diversified manner without first obtaining shareholder approval.
2. SIGNIFICANT ACCOUNTING POLICIES
The accompanying financial statements were prepared in accordance with accounting principles generally accepted in the United States of America (“U.S. GAAP”). The preparation of financial statements in conformity with U.S. GAAP requires management to make certain estimates and assumptions that affect the reported amounts of assets and liabilities and disclosures of contingent assets and liabilities at the date of the financial statements and the reported amounts of revenue and expenses during the period. Actual results could differ from those estimates. The following is a summary of significant accounting policies consistently followed by the Funds in preparation of their financial statements.
Investment Valuation: The Funds generally value their securities based on market prices determined at the close of regular trading on the New York Stock Exchange (“NYSE”), normally 4:00 p.m. Eastern Time, on each day the NYSE is open for trading.
For equity securities and mutual funds that are traded on an exchange, the market price is usually the closing sale or official closing price on that exchange. In the case of equity securities not traded on an exchange, or if such closing prices are not otherwise available, the securities are valued at the mean of the most recent bid and ask prices on such day. Redeemable securities issued by open-end registered investment companies are valued at the investment company’s applicable net asset value.
The market price for debt obligations is generally the price supplied by an independent third-party pricing service approved by the Board of Trustees (the “Board”), which may use a matrix, formula or other objective method that takes into consideration quotations from dealers, market transactions in comparable investments, market indices and yield curves. If vendors are unable to supply a price, or if the price supplied is deemed to be unreliable, the market price may be determined using quotations received from one or more broker–dealers that make a market in the security. Short-term debt obligations that will mature in 60 days or less are valued at amortized cost, unless it is determined that using this method would not reflect an investment’s fair value.
| | |
28 | | www.vulcanvaluepartners.com |
Notes to Financial Statements
April 30, 2014
When such prices or quotations are not available, or when the Fair Value Committee appointed by the Board believes that they are unreliable, securities may be priced using fair value procedures approved by the Board.
Fair Value Measurements: A three-tier hierarchy has been established to classify fair value measurements for disclosure purposes. Inputs refer broadly to the assumptions that market participants would use in pricing the asset or liability, including assumptions about risk. Inputs may be observable or unobservable. Observable inputs are inputs that reflect the assumptions market participants would use in pricing the asset or liability that are developed based on market data obtained from sources independent of the reporting entity. Unobservable inputs are inputs that reflect the reporting entity’s own assumptions about the assumptions market participants would use in pricing the asset or liability that are developed based on the best information available. Various inputs are used in determining the value of each Fund’s investments as of the reporting period end. The designated input levels are not necessarily an indication of the risk or liquidity associated with these investments. These inputs are categorized in the following hierarchy under applicable financial accounting standards:
| | |
Level 1 – | | Unadjusted quoted prices in active markets for identical investments, unrestricted assets or liabilities that the Funds have the ability to access at the measurement date; |
Level 2 – | | Quoted prices which are not active, quoted prices for similar assets or liabilities in active markets or inputs other than quoted prices that are observable (either directly or indirectly) for substantially the full term of the asset or liability; and |
Level 3 – | | Significant unobservable prices or inputs (including the Funds’ own assumptions in determining the fair value of investments) where there is little or no market activity for the asset or liability at the measurement date. |
The following is a summary of each input used to value each Fund’s investments as of April 30, 2014.
Vulcan Value Partners Fund:
| | | | | | | | | | | | | | | | |
| Investments in Securities at Value | | Level 1 - Unadjusted Quoted Prices | | | Level 2 - Other Significant Observable Inputs | | | Level 3 - Significant Unobservable Inputs | | | Total | |
Common Stocks(a) | | $ | 820,364,186 | | | $ | – | | | $ | – | | | $ | 820,364,186 | |
Short Term Investments | | | 41,401,158 | | | | – | | | | – | | | | 41,401,158 | |
TOTAL | | $ | 861,765,344 | | | $ | – | | | $ | – | | | $ | 861,765,344 | |
| | |
| | |
Annual Report | April 30, 2014 | | 29 |
Notes to Financial Statements
April 30, 2014
Vulcan Value Partners Small Cap Fund:
| | | | | | | | | | | | | | | | |
| Investments in Securities at Value | | Level 1 - Unadjusted Quoted Prices | | | Level 2 - Other Significant Observable Inputs | | | Level 3 - Significant Unobservable Inputs | | | Total | |
Common Stocks | | | | | | | | | | | | | | | | |
Diversified Financial Services | | $ | 108,267,094 | | | $ | 57,534,760 | | | $ | – | | | $ | 165,801,854 | |
Media | | | – | | | | 25,333,728 | | | | – | | | | 25,333,728 | |
Other(a) | | | 800,411,895 | | | | – | | | | – | | | | 800,411,895 | |
Short Term Investments | | | 86,991,683 | | | | – | | | | – | | | | 86,991,683 | |
TOTAL | | $ | 995,670,672 | | | $ | 82,868,488 | | | $ | – | | | $ | 1,078,539,160 | |
| | |
| (a) | For detailed descriptions, see the accompanying Statements of Investments. |
The Funds recognize transfers between levels as of the end of period. For the year ended April 30, 2014, the Funds did not have any transfers between Level 1 and Level 2 securities. For the year ended April 30, 2014, the Funds did not have any securities that used significant unobservable inputs (Level 3) in determining fair value.
Investment Transactions and Investment Income: Investment transactions are accounted for on the date the investments are purchased or sold (trade date). Realized gains and losses from investment transactions are reported on an identified cost basis, which is the same basis the Funds use for federal income tax purposes. Interest income, which includes accretion of discounts and amortization of premiums, is accrued and recorded as earned. Dividend income is recognized on the ex-dividend date or for certain foreign securities, as soon as information is available to the Funds. All of the realized and unrealized gains and losses and net investment income, are allocated daily to each class in proportion to its average daily net assets.
Foreign Securities: The Funds may directly purchase securities of foreign issuers. Investing in securities of foreign issuers involves special risks not typically associated with investing in securities of U.S. issuers. The risks include possible reevaluation of currencies, the inability to repatriate foreign currency, less complete financial information about companies and possible future adverse political and economic developments. Moreover, securities of many foreign issuers and their markets may be less liquid and their prices more volatile than those of securities of comparable U.S. issuers.
Trust Expenses: Some expenses of the Trust can be directly attributed to the Funds. Expenses which cannot be directly attributed are apportioned among all funds in the Trust based on average net assets of each fund.
Fund Expenses: Expenses that are specific to a Fund are charged directly to that Fund. Expenses that are common to both Funds generally are allocated among the Funds in proportion to their average daily net assets.
Federal Income Taxes: Each Fund complies with the requirements under Subchapter M of the Internal Revenue Code of 1986, as amended, applicable to regulated investment companies and intends to distribute substantially all of its net taxable income and net capital gains, if any, each
| | |
30 | | www.vulcanvaluepartners.com |
Notes to Financial Statements
April 30, 2014
year so that it will not be subject to excise tax on undistributed income and gains. The Funds are not subject to income taxes to the extent such distributions are made.
As of and during the year ended April 30, 2014, the Funds did not have a liability for any unrecognized tax benefits. The Funds file U.S. federal, state, and local tax returns as required. The Fund’s tax returns are subject to examination by the relevant tax authorities until expiration of the applicable statute of limitations, which is generally three years after the filing of the tax return for federal purposes and four years for most state returns. Tax returns for open years have incorporated no uncertain tax positions that require a provision for income taxes.
Distributions to Shareholders: Each Fund normally pays dividends and distributes capital gains, if any, on an annual basis. Income dividend distributions are derived from interest and other income each Fund receives from its investments, including short-term capital gains. Long term capital gain distributions are derived from gains realized when each Fund sells a security it has owned for more than a year. Each Fund may make additional distributions and dividends at other times if the portfolio manager believes doing so may be necessary for each Fund to avoid or reduce taxes.
3. TAX BASIS INFORMATION:
Reclassifications: As of April 30, 2014, permanent differences in book and tax accounting were reclassified. These differences had no effect on net assets and were primarily attributed to foreign currency transactions and net operating losses. The reclassifications were as follows:
| | | | | | | | | | | | |
| Fund | | Paid-in Capital | | | Accumulated Net Investment Income | | | Accumulated Net Realized Gain on Investments | |
Vulcan Value Partners Fund | | $ | – | | | $ | 1,721 | | | $ | (1,721) | |
Vulcan Value Partners Small Cap Fund | | | – | | | | 720,357 | | | | (720,357) | |
Tax Basis of Investments: As of April 30, 2014, the aggregate cost of investments, gross unrealized appreciation/ (depreciation) and net unrealized appreciation for federal tax purposes was as follows:
| | | | | | | | |
| | | Vulcan Value Partners Fund | | | Vulcan Value Partners Small Cap Fund | |
Gross appreciation
(excess of value over tax cost) | | $ | 156,705,258 | | | $ | 97,825,096 | |
Gross depreciation
(excess of tax cost over value) | | | (4,084,451) | | | | (29,884,747) | |
Net unrealized appreciation | | $ | 152,620,807 | | | $ | 67,940,349 | |
| | |
Cost of investments for income tax purposes | | $ | 709,144,537 | | | $ | 1,010,598,811 | |
| | |
| | |
Annual Report | April 30, 2014 | | 31 |
Notes to Financial Statements
April 30, 2014
Components of Earnings: As of April 30, 2014, components of distributable earnings were as follows:
| | | | | | | | |
| | | Vulcan Value Partners Fund | | | Vulcan Value Partners Small Cap Fund | |
Undistributed ordinary income | | $ | 14,598,778 | | | $ | 30,131,362 | |
Accumulated capital gains | | | 17,578,004 | | | | 7,786,149 | |
Net unrealized appreciation on investments | | | 152,620,807 | | | | 67,940,349 | |
Total | | $ | 184,797,589 | | | $ | 105,857,860 | |
| | |
Capital Losses: As of April 30, 2014, the Funds have no accumulated capital loss carryforwards.
Tax Basis of Distributions to Shareholders: The character of distributions made during the year from net investment income or net realized gains may differ from its ultimate characterization for federal income tax purposes. Also, due to the timing of dividend distributions, the fiscal year in which amounts are distributed may differ from the fiscal year in which the income or realized gain were recorded by each Fund.
The tax character of distributions paid by the Funds for the fiscal year ended April 30, 2014 and April 30, 2013 were as follows:
| | | | | | | | |
| | | Ordinary Income | | | Long-Term Capital Gain | |
2014 | | | | | | | | |
Vulcan Value Partners Fund | | $ | 17,739,758 | | | $ | 5,360,262 | |
Vulcan Value Partners Small Cap Fund | | | 26,859,770 | | | | 10,285,344 | |
| | |
2013 | | | | | | | | |
Vulcan Value Partners Fund | | $ | 5,269,193 | | | $ | 671,118 | |
Vulcan Value Partners Small Cap Fund | | | 1,042,621 | | | | 903,482 | |
4. SECURITIES TRANSACTIONS
During the year ended April 30, 2014, equity holdings, asset/mortgage backed securities and fixed income securities were transferred in-kind. The intent of the transfers was to save on equity transaction costs both for the new shareholders at the institution they transferred from and for the Vulcan Value Partners Fund on the addition of assets. The assets of two separate accounts were transferred-in-kind into the Fund in the amount of $33,441,398.
The cost of purchases and proceeds from sales of securities (excluding short-term securities and transfers-in-kind) during the year ended April 30, 2014 were as follows:
| | | | | | | | |
| Fund | | Purchase of Securities | | | Proceeds From Sales of Securities | |
Vulcan Value Partners Fund | | $ | 623,274,575 | | | $ | 376,283,101 | |
Vulcan Value Partners Small Cap Fund | | | 1,021,637,076 | | | | 486,439,670 | |
| | |
32 | | www.vulcanvaluepartners.com |
Notes to Financial Statements
April 30, 2014
5. CAPITAL SHARE TRANSACTIONS
The capitalization of the Trust consists of an unlimited number of shares of beneficial interest with no par value per share. Holders of the shares of the Funds of the Trust have one vote for each share held and a proportionate fraction of a vote for each fractional share. All shares issued and outstanding are fully paid and are non-assessable, transferable and redeemable at the option of the shareholder. Shares have no pre-emptive rights.
Shares redeemed within 90 days of purchase may incur a 2% short-term redemption fee deducted from the redemption amount. The Vulcan Value Partners Fund and the Vulcan Value Partners Small Cap Fund retained $78,880 and $76,658, respectively, for the year ended April 30, 2014, and $16,178 and $34,963, respectively, for the year ended April 30, 2013, which is reflected in the “Cost of shares redeemed, net of redemption fees” in the Statements of Changes in Net Assets.
Transactions in shares of capital stock for the dates listed below were as follows:
Vulcan Value Partners Fund
| | | | | | | | |
| | | For the Year Ended April 30, 2014 | | | For the Year Ended April 30, 2013 | |
Shares Sold | | | 24,274,979 | | | | 25,326,792 | |
Shares Issued in Reinvestment of Dividends | | | 1,094,860 | | | | 402,869 | |
Less Shares Redeemed | | | (3,545,292) | | | | (6,062,055) | |
Net Increase | | | 21,824,547 | | | | 19,667,606 | |
| | |
Vulcan Value Partners Small Cap Fund
| | | | | | | | |
| | | For the Year Ended April 30, 2014 | | | For the Year Ended April 30, 2013 | |
Shares Sold | | | 40,732,583 | | | | 23,292,608 | |
Shares Issued in Reinvestment of Dividends | | | 1,529,428 | | | | 117,898 | |
Less Shares Redeemed | | | (10,434,040) | | | | (1,395,277) | |
Net Increase | | | 31,827,971 | | | | 22,015,229 | |
| | |
6. MANAGEMENT AND RELATED-PARTY TRANSACTIONS
Vulcan Value Partners, LLC (“Vulcan” or the “Adviser”), subject to the authority of the Board, is responsible for the overall management and administration of the Funds’ business affairs. Vulcan manages the investments of the Funds in accordance with each Fund’s investment objective, policies and limitations and investment guidelines established jointly by the Adviser and the Board. Pursuant to the Investment Advisory Agreement (the “Advisory Agreement”), the Funds pay Vulcan an annual management fee of 1.00% and 1.15% for Vulcan Value Partners Fund and Vulcan Value Partners Small Cap Fund, respectively, based on each Fund’s average daily net assets.
Vulcan has contractually agreed with the Funds to limit the amount of each Fund’s total annual expenses (exclusive of brokerage expenses, interest expense, taxes and extraordinary expenses) to 1.25% of each Fund’s average daily net assets. This agreement is in effect through August 31, 2014
| | |
Annual Report | April 30, 2014 | | 33 |
Notes to Financial Statements
April 30, 2014
and is reevaluated on an annual basis. Without this agreement, expenses could be higher. The Adviser is permitted to recover expenses it has borne through the agreement described above to the extent that each Fund’s expenses in later periods fall below the annual rates set forth in the relevant agreement. If the Adviser foregoes any fees and/or reimburses the Funds pursuant to this agreement with respect to a particular fiscal year, then the Adviser shall be entitled to recover from the Funds the amount forgone or reimbursed to the extent annual fund operating expenses are less than 1.25% of the Funds’ average daily net assets during any fiscal year following such fiscal year.
Pursuant to this agreement, each Fund will reimburse the Adviser for any fee waivers and expense reimbursements made by the Adviser, provided that any such reimbursements made by the Funds to the Adviser will not cause the Funds’ expense limitation to exceed expense limitations in existence at the time the expense was incurred, or at the time of the reimbursement, whichever is lower, and the reimbursement is made within three years after the expenses were incurred.
For the year ended April 30, 2014, the fee waivers and/or reimbursements were as follows:
| | | | | | | | |
| Fund | | Fees Waived/Reimbursed By Adviser | | | Recoupment of Previously Waived Fees by Adviser | |
Vulcan Value Partners Fund | | $ | – | | | $ | – | |
Vulcan Value Partners Small Cap Fund | | | 400,224 | | | | – | |
As of April 30, 2014, the balances of recoupable expenses for each Fund were as follows:
| | | | | | | | | | | | | | | | |
| Fund | | Expires 2017 | | | Expires 2016 | | | Expires 2015 | | | Total | |
Vulcan Value Partners Fund | | $ | – | | | $ | – | | | $ | – | | | $ | – | |
Vulcan Value Partners Small Cap Fund | | | 400,224 | | | | 161,158 | | | | 124,024 | | | | 685,406 | |
Distributor: ALPS Distributors, Inc. (“ADI” or the “Distributor”) (an affiliate of ALPS Fund Services, Inc.) acts as the distributor of each Fund’s shares pursuant to a Distribution Agreement with the Trust. Shares are sold on a continuous basis by ADI as agent for the Funds, and ADI has agreed to use its best efforts to solicit orders for the sale of each Fund’s shares, although it is not obliged to sell any particular amount of shares. ADI is not entitled to any compensation for its services as Distributor. ADI is registered as a broker-dealer with the Securities and Exchange Commission.
Principal Financial Officer: ALPS Fund Services, Inc. (“ALPS” and the “Administrator”) (an affiliate of ADI) receives an annual fee for providing principal financial officer services to the Funds. Vulcan pays this fee on behalf of the Funds.
Compliance Services: ALPS provides services that assist the Trust’s Chief Compliance Officer in monitoring and testing the policies and procedures of the Trust in conjunction with requirements under Rule 38a-1 under the 1940 Act and receives an annual base fee. ALPS is reimbursed for certain out-of-pocket expenses by the Funds. Vulcan pays this fee on behalf of the Funds.
Transfer Agent: ALPS serves as transfer, dividend paying and shareholder servicing agent for the Funds. ALPS receives an annual minimum fee, a fee based upon the number of
| | |
34 | | www.vulcanvaluepartners.com |
Notes to Financial Statements
April 30, 2014
shareholder accounts, and is also reimbursed by the Funds for certain out-of-pocket expenses.
Fund Administrator Fees and Expenses: ALPS serves as administrator to the Funds, and each Fund has agreed to pay expenses incurred in connection with its administrative activities. Pursuant to the Administration, Bookkeeping and Pricing Services Agreement (the “Agreement”), ALPS will provide operational services to the Funds including, but not limited to fund accounting and fund administration and generally assist in each Fund’s operations.
Annual Administrative Fee, billed monthly in total and allocated to each Fund, in the amount of the greater of (a) $210,000 annual minimum for both Funds (subject to an annual cost of living adjustment increase) or (b) following basis point fee schedule:
| | |
| Average Total Net Assets | | Contractual Fee |
Between $0-$500M | | 0.05% |
$500M-$1B | | 0.03% |
Above $1B | | 0.02% |
The Administrator is also reimbursed by the Funds for certain out-of-pocket expenses.
7. INDEMNIFICATIONS
Under the Trust’s organizational documents, its Officers and Trustees are indemnified against certain liability arising out of the performance of their duties to the Trust. Additionally, in the normal course of business, the Trust enters into contracts with service providers that may contain general indemnification clauses which may permit indemnification to the extent permissible under applicable law. The Trust’s maximum exposure under these arrangements is unknown, as this would involve future claims that may be made against the Trust that have not yet occurred.
8. NEW ACCOUNTING PRONOUNCEMENTS
In June 2013, the Financial Accounting Standards Board (the “FASB”) issued Accounting Standards Update (“ASU”) No. 2013-08, Financial Services-Investment Companies (Topic 946): Amendments to the Scope, Measurement, and Disclosure Requirements. The FASB standard identifies characteristics a company must assess to determine whether it is considered an investment company for financial reporting purposes. This ASU is effective for fiscal years beginning after December 15, 2013. The Funds believe the adoption of this ASU will not have a material impact on their financial statements.
| | |
Annual Report | April 30, 2014 | | 35 |
Report of Independent Registered Public Accounting Firm
To the Shareholders and Board of Trustees of Financial Investors Trust:
We have audited the accompanying statements of assets and liabilities, including the statements of investments, of Vulcan Value Partners Fund and Vulcan Value Partners Small Cap Fund (the “Funds”), two of the portfolios constituting Financial Investors Trust, as of April 30, 2014, and the related statements of operations for the year then ended, the statements of changes in net assets for each of the two years in the period then ended, and the financial highlights for each of the four years in the period then ended and for the period from December 30, 2009 (inception) to April 30, 2010. These financial statements and financial highlights are the responsibility of the Funds’ management. Our responsibility is to express an opinion on these financial statements and financial highlights based on our audits.
We conducted our audits in accordance with the standards of the Public Company Accounting Oversight Board (United States). Those standards require that we plan and perform the audit to obtain reasonable assurance about whether the financial statements and financial highlights are free of material misstatement. The Funds are not required to have, nor were we engaged to perform, an audit of their internal control over financial reporting. Our audits included consideration of internal control over financial reporting as a basis for designing audit procedures that are appropriate in the circumstances, but not for the purpose of expressing an opinion on the effectiveness of the Funds’ internal control over financial reporting. Accordingly, we express no such opinion. An audit also includes examining, on a test basis, evidence supporting the amounts and disclosures in the financial statements, assessing the accounting principles used and significant estimates made by management, as well as evaluating the overall financial statement presentation. Our procedures included confirmation of securities owned as of April 30, 2014, by correspondence with the custodian and brokers; where replies were not received from brokers, we performed other auditing procedures. We believe that our audits provide a reasonable basis for our opinion.
In our opinion, the financial statements and financial highlights referred to above present fairly, in all material respects, the financial position of Vulcan Value Partners Fund and Vulcan Value Partners Small Cap Fund of Financial Investors Trust as of April 30, 2014, the results of their operations for the year then ended, the changes in their net assets for each of the two years in the period then ended, and the financial highlights for each of the four years in the period then ended and for the period from December 30, 2009 (inception) to April 30, 2010, in conformity with accounting principles generally accepted in the United States of America.
DELOITTE & TOUCHE LLP
Denver, Colorado
June 26, 2014
| | |
36 | | www.vulcanvaluepartners.com |
Disclosure Regarding Approval of Fund Advisory Agreements
April 30, 2014 (Unaudited)
VULCAN VALUE PARTNERS FUND AND VULCAN VALUE PARTNERS SMALL CAP FUND
On December 10, 2013, the Trustees met in person to discuss, among other things, the approval of the investment advisory agreement between the Trust and Vulcan Value Partners, LLC (“Vulcan”) (the “Investment Advisory Agreement”), in accordance with Section 15(c) of the 1940 Act. The Independent Trustees met with independent legal counsel during executive session and discussed the Investment Advisory Agreement and other related materials.
In renewing and approving the Investment Advisory Agreement with Vulcan, the Trustees, including the Independent Trustees, considered the following factors with respect to the Vulcan Value Partners and Vulcan Value Partners Small Cap Fund (the “Vulcan Funds”):
Investment Advisory Fee Rate: The Trustees reviewed and considered the contractual annual advisory fee to be paid by the Trust, on behalf of the Vulcan Funds, to Vulcan of 1.15% and 1.00% of the Vulcan Value Partners Small Cap Value Fund’s and Vulcan Value Partners Fund’s daily average net assets, respectively, in light of the extent and quality of the advisory services to be provided by Vulcan to the Vulcan Funds. The Trustees noted that Vulcan had voluntarily agreed to reduce its advisory fee with respect to the Vulcan Value Partners Small Cap Value Fund by 10 basis points effective January 1, 2013.
The Trustees considered the information they received comparing the Vulcan Funds’ contractual annual advisory fee and overall net expenses with those of funds in both the relevant expense peer group provided by an independent provider of investment company data, as well as similar value and small-cap value products advised by Vulcan.
Based on such information, the Trustees determined that the contractual annual advisory fee of 1.15% of the daily average net assets of Vulcan Value Partners Small Cap Value Fund and 1.00% of the daily average net assets of Vulcan Value Partners Fund, and the total net expense ratio of 1.25% for each of the Vulcan Funds, although generally greater than each respective peer group median, were reasonable in light of the generally favorable performance of each Vulcan Fund compared to their peer groups.
Nature, Extent and Quality of the Services under the Advisory Agreement: The Trustees received and considered information regarding the nature, extent and quality of services provided to the Vulcan Funds under the Investment Advisory Agreement. The Trustees reviewed certain background materials supplied by Vulcan in its presentation, including its Form ADV, financial statements and Compliance Policies and Procedures.
The Trustees reviewed and considered Vulcan’s investment advisory personnel, its history as an asset manager, its performance and the amount of assets currently under management by Vulcan. The Trustees also reviewed the research and decision-making processes utilized by Vulcan, including the methods adopted to seek to achieve compliance with the investment objectives, policies and restrictions of the Vulcan Funds.
The Trustees considered the background and experience of Vulcan’s management in connection with the Vulcan Funds, including reviewing the qualifications, backgrounds and responsibilities of the management team primarily responsible for the day-to-day portfolio management of the
| | |
Annual Report | April 30, 2014 | | 37 |
Disclosure Regarding Approval of Fund Advisory Agreements
April 30, 2014 (Unaudited)
Vulcan Funds and the extent of the resources devoted to research and analysis of actual and potential investments.
The Trustees also reviewed the accompanying Compliance-related materials and further noted that they have received reports on these services and Compliance issues at each regular Board meeting throughout the year related to the services rendered by Vulcan with respect to the Vulcan Funds.
Performance: The Trustees reviewed performance information for each Vulcan Fund for the three-month, 1-year and 3-year periods ended September 30, 2013. That review included a comparison of each Vulcan Fund’s performance to the performance of a universe of comparable funds selected by an independent provider of investment company data. The Trustees noted the generally favorable performance of the each Vulcan Fund compared against funds identified by an independent provider of investment company data.
The Adviser’s Profitability: The Trustees received a profitability analysis prepared by Vulcan based on the fees payable under the Advisory Agreement. The Trustees considered the recent profits realized by Vulcan in connection with the operation of the Vulcan Funds. The Board then reviewed Vulcan’s financial statements in order to analyze the financial condition and stability and profitability of Vulcan.
Economies of Scale: The Trustees considered whether economies of scale in the provision of services to the Vulcan Funds will be passed along to the shareholders under the proposed agreement. The Trustees noted that, while there were currently no material economies of scale applicable, certain economies of scale were expected with respect to the Vulcan Value Partners Fund in future years.
Other Benefits to the Adviser: The Trustees reviewed and considered any other benefits derived or to be derived by Vulcan from its relationship with the Vulcan Funds, including the fact that Vulcan does not use soft dollars.
The Board summarized its deliberations with respect to the Investment Advisory Agreement with Vulcan. In selecting Vulcan and approving the investment advisory agreement and fees under such agreement, the Trustees concluded that no single factor reviewed by the Trustees was identified by the Trustees to be determinative as the principal factor in whether to approve the Investment Advisory Agreement. Further, the Independent Trustees were advised by separate independent legal counsel throughout the process. The Trustees, including all of the Independent Trustees, concluded that:
| | • | | the investment advisory fees to be received by Vulcan with respect to the Vulcan Funds were, although higher than applicable peer group medians, within an acceptable range of the median when considered in light of each Vulcan Fund’s performance relative to its peer group, and comparable to those charged for other Vulcan value and small-cap value products (such as separately managed accounts), taking into account the differences between the funds and such products, including investment restrictions and time commitment of the adviser; |
| | |
38 | | www.vulcanvaluepartners.com |
Disclosure Regarding Approval of Fund Advisory Agreements
April 30, 2014 (Unaudited)
| | • | | the nature, extent and quality of services rendered by Vulcan under the Investment Advisory Agreement were adequate; |
| | • | | the performance of the Vulcan Funds was generally favorable compared with the performance of the funds in the applicable peer universe provided by an independent provider of investment company data; |
| | • | | the profit, if any, anticipated to be realized by Vulcan in connection with the operation of the Vulcan Funds is fair to the Trust; and |
| | • | | there were no material economies of scale or other benefits accruing to Vulcan in connection with its relationship with the Vulcan Funds at this time. |
Based on the Trustees’ deliberations and their evaluation of the information described above, the Trustees, including all of the Independent Trustees, concluded that Vulcan’s compensation for investment advisory services is consistent with the best interests of the Vulcan Funds and their shareholders.
| | |
Annual Report | April 30, 2014 | | 39 |
Additional Information
April 30, 2014 (Unaudited)
1. FUND HOLDINGS
The Fund files its complete schedule of portfolio holdings with the Securities and Exchange Commission (the “SEC”) for the first and third quarters of each fiscal year on Form N-Q within 60 days after the end of the period. Copies of the Fund’s Form N-Q are available without charge on the SEC website at http://www.sec.gov. You may also review and copy the Form N-Q at the SEC’s Public Reference Room in Washington, DC. For more information about the operation of the Public Reference Room, please call the SEC at 1-800-SEC-0330.
2. FUND PROXY VOTING POLICIES, PROCEDURES AND SUMMARIES
The Fund’s policies and procedures used in determining how to vote proxies and information regarding how the Fund voted proxies relating to portfolio securities during the most recent prior 12-month period ending June 30 are available without charge, (1) upon request, by calling (toll-free) (866)-759-5679 and (2) on the SEC’s website at http://www.sec.gov.
3. TAX DESIGNATIONS
The Funds designate the following for federal income tax purposes for the calendar year ended December 31, 2013:
| | | | |
| | | Qualified Dividend Income | | Dividend Received Deduction |
Vulcan Value Partners Fund | | 58.13% | | 41.17% |
Vulcan Value Partners Small Cap Fund | | 20.55% | | 14.74% |
Pursuant to Section 852(b)(3) of the Internal Revenue Code, the Vulcan Value Partners Fund designated $5,360,262, and the Vulcan Value Small Cap Fund designated $10,285,344 as long-term capital gain dividends.
In early 2014, if applicable, shareholders of record received this information for the distributions paid to them by the Funds during the calendar year 2013 via Form 1099. The Funds will notify shareholders in early 2015 of amounts paid to them by the Fund, if any, during the calendar year 2014.
Please consult a tax advisor if you have questions about federal or state income tax laws, or how to prepare your tax returns.
| | |
40 | | www.vulcanvaluepartners.com |
Trustees and Officers
April 30, 2014 (Unaudited)
Additional information regarding the Fund’s trustees is included in the Statement of Additional Information, which can be obtained without charge by calling 866-759-5679.
INDEPENDENT TRUSTEES
| | | | | | | | | | |
Name, Address* & Year of Birth | | Position(s) Held with Fund | | Term of Office and Length of Time Served** | | Principal Occupation(s) During Past 5 Years*** | | Number of Funds in Fund Complex Overseen by Trustee**** | | Other Directorships Held by Trustee |
Mary K. Anstine, 1940 | | Trustee | | Ms. Anstine was elected at a special meeting of shareholders held on March 21, 1997 and re-elected at a special meeting of shareholders held on August 7, 2009. | | Ms. Anstine was President/Chief Executive Officer of HealthONE Alliance, Denver, Colorado, and former Executive Vice President of First Interstate Bank of Denver. Ms. Anstine is also Trustee/Director of AV Hunter Trust and Colorado Uplift Board. Ms. Anstine was formerly a Director of the Trust Bank of Colorado (later purchased and now known as Northern Trust Bank), HealthONE and Denver Area Council of the Boy Scouts of America, and a member of the American Bankers Association Trust Executive Committee. | | 30 | | Ms. Anstine is a Trustee of ALPS ETF Trust (21 funds); ALPS Variable Investment Trust (8 funds); Reaves Utility Income Fund (1 fund); and Westcore Trust (12 funds). |
John R. Moran, Jr., 1930 | | Trustee | | Mr. Moran was elected at a special meeting of shareholders held on March 21, 1997 and re-elected at a special meeting of shareholders held on August 7, 2009. | | Mr. Moran is formerly President and CEO of The Colorado Trust, a private foundation serving the health and hospital community in the state of Colorado. Currently, Mr. Moran is a member of the Treasurer’s Investment Advisory Committee for the University of Colorado. | | 30 | | None. |
| * | All communications to Trustees and Officers may be directed to Financial Investors Trust c/o 1290 Broadway, Suite 1100, Denver, CO 80203. |
| ** | This is the period for which the Trustee or Officer began serving the Trust. Each Trustee and/or Officer serves an indefinite term, until his successor is elected. |
| *** | Except as otherwise indicated, each individual has held the office shown or other offices in the same company for the last five years. |
| **** | The Fund Complex includes all series of the Trust (currently 30) and any other investment companies for which any Trustee serves as Trustee for and which Vulcan Value Partners, LLC provides investment advisory services (currently none). |
| | |
Annual Report | April 30, 2014 | | 41 |
Trustees and Officers
April 30, 2014 (Unaudited)
INDEPENDENT TRUSTEES (continued)
| | | | | | | | | | |
Name, Address* & Year of Birth | | Position(s) Held with Fund | | Term of Office and Length of Time Served** | | Principal Occupation(s) During Past 5 Years*** | | Number of Funds in Fund Complex Overseen by Trustee**** | | Other Directorships Held by Trustee |
Jeremy W. Deems, 1976 | | Trustee | | Mr. Deems was appointed as a Trustee at the March 11, 2008 meeting of the Board of Trustees and elected at a special meeting of shareholders held on August 7, 2009. | | Mr. Deems is the Co-Founder, Chief Operations Officer and Chief Financial Officer of Green Alpha Advisors, LLC. Mr. Deems is Co-Portfolio Manager of the Shelton Green Alpha Fund. Prior to joining Green Alpha Advisors, Mr. Deems was CFO and Treasurer of Forward Management, LLC, ReFlow Management Co., LLC, ReFlow Fund, LLC, a private investment fund, and Sutton Place Management, LLC, an administrative services company, from 2004 to June 2007. | | 30 | | Mr. Deems is a Trustee of ALPS ETF Trust (21 funds); ALPS Variable Investment Trust (8 funds) and Reaves Utility Income Fund (1 fund). |
| Jerry G. Rutledge, 1944 | | Trustee | | Mr. Rutledge was elected at a special meeting of shareholders held on August 7, 2009. | | Mr. Rutledge is the President and owner of Rutledge’s Inc., a retail clothing business. He was from 1994 to 2007 a Regent of the University of Colorado. | | 30 | | Mr. Rutledge is a Trustee of Principal Real Estate Income Fund (1 fund), Clough Global Allocation Fund (1 fund), Clough Global Equity Fund (1 fund) and Clough Global Opportunities Fund (1 fund). |
| * | All communications to Trustees and Officers may be directed to Financial Investors Trust c/o 1290 Broadway, Suite 1100, Denver, CO 80203. |
| ** | This is the period for which the Trustee or Officer began serving the Trust. Each Trustee and/or Officer serves an indefinite term, until his successor is elected. |
| *** | Except as otherwise indicated, each individual has held the office shown or other offices in the same company for the last five years. |
| **** | The Fund Complex includes all series of the Trust (currently 30) and any other investment companies for which any Trustee serves as Trustee for and which Vulcan Value Partners, LLC provides investment advisory services (currently none). |
| | |
42 | | www.vulcanvaluepartners.com |
Trustees and Officers
April 30, 2014 (Unaudited)
INDEPENDENT TRUSTEES (continued)
| | | | | | | | | | |
Name, Address* & Year of Birth | | Position(s) Held with Fund | | Term of Office and Length of Time Served** | | Principal Occupation(s) During Past 5 Years*** | | Number of Funds in Fund Complex Overseen by Trustee**** | | Other Directorships Held by Trustee |
Michael “Ross” Shell , 1970 | | Trustee | | Mr. Shell was elected at a special meeting of shareholders held on August 7, 2009. | | Mr. Shell is Founder and CEO of Red Idea, LLC, a strategic consulting/early stage venture firm (since June 2008). From 1999 to 2009, he was a part-owner and Director of Tesser, Inc., a brand agency. From December 2005 to May 2008, he was Director, Marketing and Investor Relations, of Woodbourne, a REIT/real estate hedge fund and private equity firm. Prior to this, from May 2004 to November 2005, he worked as a business strategy consultant; from June 2003 to April 2004, he was on the Global Client Services team of IDEO, a product design/innovation firm; and from 1999 to 2003, he was President of Tesser, Inc. Mr. Shell graduated with honors from Stanford University with a degree in Political Science. | | 30 | | None. |
| | |
Annual Report | April 30, 2014 | | 43 |
Trustees and Officers
April 30, 2014 (Unaudited)
INTERESTED TRUSTEE
| | | | | | | | | | |
Name,
Address*
& Year of
Birth | | Position(s) Held with
Fund | | Term of Office
and Length of
Time Served** | | Principal Occupation(s) During Past 5 Years*** | | Number of
Funds in
Fund
Complex
Overseen by
Trustee**** | | Other
Directorships
Held by Trustee |
Edmund J. Burke, 1961 | | Trustee, Chairman and President | | Mr. Burke was elected as Chairman at the August 28, 2009 meeting of the Board of Trustees. Mr. Burke was elected as Trustee at a special meeting of shareholders held on August 7, 2009. Mr. Burke was elected President of the Trust at the December 17, 2002 meeting of the Board of Trustees. | | Mr. Burke is President and a Director of ALPS Holdings, Inc. (“AHI”) (since 2005) and Director of Boston Financial Data Services, Inc. (“BFDS”), ALPS Advisors, Inc. (“AAI”), ALPS Distributors, Inc. (“ADI”), ALPS Fund Services, Inc. (“AFS”) and ALPS Portfolio Solutions Distributor, Inc. (“APSD”) and from 2001-2008, was President of AAI, ADI, AFS and APSD. Because of his positions with AHI, BFDS, AAI, ADI, AFS and APSD, Mr. Burke is deemed an affiliate of the Trust as defined under the 1940 Act. Mr. Burke is Trustee and President of the Clough Global Allocation Fund (Trustee since 2006; President since 2004); Trustee and President of the Clough Global Equity Fund (Trustee since 2006; President since 2005); Trustee and President of the Clough Global Opportunities Fund (since 2006); Trustee of the Liberty All-Star Equity Fund; and Director of the Liberty All-Star Growth Fund, Inc. | | 30 | | Mr. Burke is a Trustee of Clough Global Allocation Fund (1 fund); Clough Global Equity Fund (1 fund); Clough Global Opportunities Fund (1 fund); Trustee of the Liberty All-Star Equity Fund (1 fund); and Director of the Liberty All-Star Growth Fund, Inc. (1 fund). |
| * | All communications to Trustees and Officers may be directed to Financial Investors Trust c/o 1290 Broadway, Suite 1100, Denver, CO 80203. |
| ** | This is the period for which the Trustee or Officer began serving the Trust. Each Trustee and/or Officer serves an indefinite term, until his successor is elected. |
| *** | Except as otherwise indicated, each individual has held the office shown or other offices in the same company for the last five years. |
| **** | The Fund Complex includes all series of the Trust (currently 30) and any other investment companies for which any Trustee serves as Trustee for and which Vulcan Value Partners, LLC provides investment advisory services (currently none). |
| | |
44 | | www.vulcanvaluepartners.com |
Trustees and Officers
April 30, 2014 (Unaudited)
OFFICERS
| | | | | | |
Name, Address* & Year of Birth | | Position(s) Held with Fund | | Term of Office and Length of Time Served** | | Principal Occupation(s) During Past 5 Years*** |
Kimberly R. Storms, 1972 | | Treasurer | | Ms. Storms was elected Treasurer of the Trust at the March 12, 2013 meeting of the Board of Trustees. | | Ms. Storms is Senior Vice President - Director of Fund Administration of ALPS. Ms. Storms joined ALPS in 1998 as Assistant Controller. Because of her position with ALPS, Ms. Storms is deemed an affiliate of the Trust as defined under the 1940 Act. Ms. Storms is also Treasurer of BPV Family of Funds and ALPS Series Trust; Assistant Treasurer of Liberty All-Star Equity Fund and Liberty All-Star Growth Fund, Inc.; Assistant Treasurer of Tilson Funds; and Chief Financial Officer of The Arbitrage Funds. |
David T. Buhler, 1971 | | Secretary | | Mr. Buhler was elected Secretary of the Trust at the September 11, 2012 meeting of the Board of Trustees. | | Mr. Buhler joined ALPS in June 2010. He is currently Vice President and Senior Associate Counsel of ALPS, AAI, ADI and APSD. Prior to joining ALPS, Mr. Buhler served as Associate General Counsel and Assistant Secretary of Founders Asset Management LLC from 2006 to 2009. Because of his position with ALPS, Mr. Buhler is deemed an affiliate of the Trust as defined under the 1940 Act. Mr. Buhler is also the Secretary ALPS Variable Investment Trust and Westcore Trust. |
Ted Uhl, 1974 | | Chief Compliance Officer (“CCO”) | | Mr. Uhl was appointed CCO of the Trust at the June 8, 2010 meeting of the Board of Trustees. | | Mr. Uhl joined ALPS in October 2006, and is currently Deputy Compliance Officer of ALPS. Prior to his current role, Mr. Uhl served as Senior Risk Manager for ALPS from October 2006 until June 2010. Before joining ALPS, Mr. Uhl served a Sr. Analyst with Enenbach and Associates (RIA), and a Sr. Financial Analyst at Sprint. Because of his position with ALPS, Mr. Uhl is deemed an affiliate of the Trust as defined under the 1940 Act. Mr. Uhl is also CCO of the Clough Global Funds, Reaves Utility Income Fund, Drexel Hamilton Funds and Transparent Value Trust. |
| | |
Annual Report | April 30, 2014 | | 45 |

| | |
| |
| | Table of Contents April 30, 2014 |
Disclosure of Fund Expenses
April 30, 2014 (Unaudited)
Examples. As a shareholder of the Funds, you will incur two types of costs: (1) transaction costs, including applicable sales charges (loads) and redemption fees; and (2) ongoing costs, including management fees, distribution and service (12b-1) fees, shareholder service fees and other Fund expenses. The following examples are intended to help you understand your ongoing costs (in dollars) of investing in the Funds and to compare these costs with the ongoing costs of investing in other mutual funds. The examples are based on an investment of $1,000 invested on November 1, 2013 and held until April 30, 2014.
Actual Expenses. The first line under each class in the table on the next page provides information about actual account values and actual expenses. You may use the information in this line, together with the amount you invested, to estimate the expenses that you paid over the period. Simply divide your account value by $1,000 (for example, an $8,600 account value divided by $1,000 = 8.6), then multiply the result by the number in the first line under the heading “Expenses Paid During Period November 1, 2013 –April 30, 2014” to estimate the expenses you paid on your account during this period.
Hypothetical Example for Comparison Purposes. The second line under each class in the table on the next page provides information about hypothetical account values and hypothetical expenses based on the Fund’s actual expense ratio and an assumed rate of return of 5% per year before expenses, which is not the Fund’s actual return. The hypothetical account values and expenses may not be used to estimate the actual ending account balance or expenses you paid for the period. You may use this information to compare the ongoing costs of investing in the Funds and other mutual funds. To do so, compare these 5% hypothetical examples with the 5% hypothetical examples that appear in the shareholder reports of the other funds.
Please note that the expenses shown in the table are meant to highlight your ongoing costs only and do not reflect any transactional costs, such as sales charges or redemption fees. Therefore, the second line under each class in the table on the next page is useful in comparing ongoing costs only, and will not help you determine the relative total costs of owning different funds. In addition, if these transactional costs were included, your costs would have been higher.
1 | April 30, 2014
Disclosure of Fund Expenses
April 30, 2014 (Unaudited)
| | | | | | | | | | | | | | |
| | | Beginning Account Value
November 1, 2013 | | | Ending Account Value
April 30, 2014 | | | Expense
Ratio(a) | | Expenses Paid
During Period
November 1, 2013 -
April 30, 2014(b) | |
ALPS | Alerian MLP Infrastructure Index Fund | | | | | | | |
Class A | | | | | | | | | | | | | | |
Actual | | $ | 1,000.00 | | | $ | 1,042.10 | | | 1.25% | | $ | 6.33 | |
Hypothetical (5% return before expenses) | | $ | 1,000.00 | | | $ | 1,018.60 | | | 1.25% | | $ | 6.26 | |
Class C | | | | | | | | | | | | | | |
Actual | | $ | 1,000.00 | | | $ | 1,040.40 | | | 1.85% | | $ | 9.36 | |
Hypothetical (5% return before expenses) | | $ | 1,000.00 | | | $ | 1,015.62 | | | 1.85% | | $ | 9.25 | |
Class I | | | | | | | | | | | | | | |
Actual | | $ | 1,000.00 | | | $ | 1,042.00 | | | 0.85% | | $ | 4.30 | |
Hypothetical (5% return before expenses) | | $ | 1,000.00 | | | $ | 1,020.58 | | | 0.85% | | $ | 4.26 | |
ALPS | CoreCommodity Management CompleteCommodities® Strategy Fund(c) | | | | |
Class A | | | | | | | | | | | | | | |
Actual | | $ | 1,000.00 | | | $ | 1,073.10 | | | 1.45% | | $ | 7.45 | |
Hypothetical (5% return before expenses) | | $ | 1,000.00 | | | $ | 1,017.60 | | | 1.45% | | $ | 7.25 | |
Class C | | | | | | | | | | | | | | |
Actual | | $ | 1,000.00 | | | $ | 1,069.90 | | | 2.05% | | $ | 10.52 | |
Hypothetical (5% return before expenses) | | $ | 1,000.00 | | | $ | 1,014.63 | | | 2.05% | | $ | 10.24 | |
Class I | | | | | | | | | | | | | | |
Actual | | $ | 1,000.00 | | | $ | 1,075.20 | | | 1.15% | | $ | 5.92 | |
Hypothetical (5% return before expenses) | | $ | 1,000.00 | | | $ | 1,019.09 | | | 1.15% | | $ | 5.76 | |
ALPS | Kotak India Growth Fund(d) | | | | | | | |
Class A | | | | | | | | | | | | | | |
Actual | | $ | 1,000.00 | | | $ | 1,131.40 | | | 1.77% | | $ | 9.35 | |
Hypothetical (5% return before expenses) | | $ | 1,000.00 | | | $ | 1,016.02 | | | 1.77% | | $ | 8.85 | |
Class C | | | | | | | | | | | | | | |
Actual | | $ | 1,000.00 | | | $ | 1,125.60 | | | 2.60% | | $ | 13.70 | |
Hypothetical (5% return before expenses) | | $ | 1,000.00 | | | $ | 1,011.90 | | | 2.60% | | $ | 12.97 | |
Class I | | | | | | | | | | | | | | |
Actual | | $ | 1,000.00 | | | $ | 1,132.90 | | | 1.60% | | $ | 8.46 | |
Hypothetical (5% return before expenses) | | $ | 1,000.00 | | | $ | 1,016.86 | | | 1.60% | | $ | 8.00 | |
ALPS | Red Rocks Listed Private Equity Fund | | | | |
Class A | | | | | | | | | | | | | | |
Actual | | $ | 1,000.00 | | | $ | 1,086.40 | | | 1.63% | | $ | 8.43 | |
Hypothetical (5% return before expenses) | | $ | 1,000.00 | | | $ | 1,016.71 | | | 1.63% | | $ | 8.15 | |
Class C | | | | | | | | | | | | | | |
Actual | | $ | 1,000.00 | | | $ | 1,084.90 | | | 2.17% | | $ | 11.22 | |
Hypothetical (5% return before expenses) | | $ | 1,000.00 | | | $ | 1,014.03 | | | 2.17% | | $ | 10.84 | |
Class I | | | | | | | | | | | | | | |
Actual | | $ | 1,000.00 | | | $ | 1,088.10 | | | 1.25% | | $ | 6.47 | |
Hypothetical (5% return before expenses) | | $ | 1,000.00 | | | $ | 1,018.60 | | | 1.25% | | $ | 6.26 | |
Class R | | | | | | | | | | | | | | |
Actual | | $ | 1,000.00 | | | $ | 1,086.40 | | | 1.71% | | $ | 8.85 | |
Hypothetical (5% return before expenses) | | $ | 1,000.00 | | | $ | 1,016.31 | | | 1.71% | | $ | 8.55 | |
2 | April 30, 2014
Disclosure of Fund Expenses
April 30, 2014 (Unaudited)
| | | | | | | | | | | | | | |
| | | Beginning Account Value
November 1, 2013 | | | Ending Account Value
April 30, 2014 | | | Expense
Ratio(a) | | Expenses Paid
During Period
November 1, 2013 -
April 30, 2014(b) | |
ALPS | WMC Disciplined Value Fund | | | | | | | | | | | |
Class A | | | | | | | | | | | | | | |
Actual | | $ | 1,000.00 | | | $ | 1,091.60 | | | 1.40% | | $ | 7.26 | |
Hypothetical (5% return before expenses) | | $ | 1,000.00 | | | $ | 1,017.85 | | | 1.40% | | $ | 7.00 | |
Class C | | | | | | | | | | | | | | |
Actual | | $ | 1,000.00 | | | $ | 1,088.10 | | | 2.15% | | $ | 11.13 | |
Hypothetical (5% return before expenses) | | $ | 1,000.00 | | | $ | 1,014.13 | | | 2.15% | | $ | 10.74 | |
Class I | | | | | | | | | | | | | | |
Actual | | $ | 1,000.00 | | | $ | 1,093.40 | | | 1.15% | | $ | 5.97 | |
Hypothetical (5% return before expenses) | | $ | 1,000.00 | | | $ | 1,019.09 | | | 1.15% | | $ | 5.76 | |
Clough China Fund | | | | | | | | | | | | | | |
Class A | | | | | | | | | | | | | | |
Actual | | $ | 1,000.00 | | | $ | 932.20 | | | 1.95% | | $ | 9.34 | |
Hypothetical (5% return before expenses) | | $ | 1,000.00 | | | $ | 1,015.12 | | | 1.95% | | $ | 9.74 | |
Class C | | | | | | | | | | | | | | |
Actual | | $ | 1,000.00 | | | $ | 928.50 | | | 2.70% | | $ | 12.91 | |
Hypothetical (5% return before expenses) | | $ | 1,000.00 | | | $ | 1,011.41 | | | 2.70% | | $ | 13.47 | |
Class I | | | | | | | | | | | | | | |
Actual | | $ | 1,000.00 | | | $ | 933.10 | | | 1.70% | | $ | 8.15 | |
Hypothetical (5% return before expenses) | | $ | 1,000.00 | | | $ | 1,016.36 | | | 1.70% | | $ | 8.50 | |
RiverFront Conservative Income Builder Fund | | | | | | | |
Class A | | | | | | | | | | | | | | |
Actual | | $ | 1,000.00 | | | $ | 1,030.90 | | | 1.15% | | $ | 5.79 | |
Hypothetical (5% return before expenses) | | $ | 1,000.00 | | | $ | 1,019.09 | | | 1.15% | | $ | 5.76 | |
Class C | | | | | | | | | | | | | | |
Actual | | $ | 1,000.00 | | | $ | 1,027.20 | | | 1.90% | | $ | 9.55 | |
Hypothetical (5% return before expenses) | | $ | 1,000.00 | | | $ | 1,015.37 | | | 1.90% | | $ | 9.49 | |
Class I | | | | | | | | | | | | | | |
Actual | | $ | 1,000.00 | | | $ | 1,032.40 | | | 0.90% | | $ | 4.54 | |
Hypothetical (5% return before expenses) | | $ | 1,000.00 | | | $ | 1,020.33 | | | 0.90% | | $ | 4.51 | |
RiverFront Dynamic Equity Income Fund | | | | | | | |
Class A | | | | | | | | | | | | | | |
Actual | | $ | 1,000.00 | | | $ | 1,044.10 | | | 1.15% | | $ | 5.83 | |
Hypothetical (5% return before expenses) | | $ | 1,000.00 | | | $ | 1,019.09 | | | 1.15% | | $ | 5.76 | |
Class C | | | | | | | | | | | | | | |
Actual | | $ | 1,000.00 | | | $ | 1,040.50 | | | 1.90% | | $ | 9.61 | |
Hypothetical (5% return before expenses) | | $ | 1,000.00 | | | $ | 1,015.37 | | | 1.90% | | $ | 9.49 | |
Class I | | | | | | | | | | | | | | |
Actual | | $ | 1,000.00 | | | $ | 1,045.10 | | | 0.90% | | $ | 4.56 | |
Hypothetical (5% return before expenses) | | $ | 1,000.00 | | | $ | 1,020.33 | | | 0.90% | | $ | 4.51 | |
RiverFront Global Allocation Fund | | | | | | | |
Class A | | | | | | | | | | | | | | |
Actual | | $ | 1,000.00 | | | $ | 1,038.70 | | | 1.15% | | $ | 5.81 | |
Hypothetical (5% return before expenses) | | $ | 1,000.00 | | | $ | 1,019.09 | | | 1.15% | | $ | 5.76 | |
Class C | | | | | | | | | | | | | | |
Actual | | $ | 1,000.00 | | | $ | 1,034.50 | | | 1.90% | | $ | 9.58 | |
Hypothetical (5% return before expenses) | | $ | 1,000.00 | | | $ | 1,015.37 | | | 1.90% | | $ | 9.49 | |
Class I | | | | | | | | | | | | | | |
Actual | | $ | 1,000.00 | | | $ | 1,040.00 | | | 0.90% | | $ | 4.55 | |
Hypothetical (5% return before expenses) | | $ | 1,000.00 | | | $ | 1,020.33 | | | 0.90% | | $ | 4.51 | |
3 | April 30, 2014
Disclosure of Fund Expenses
April 30, 2014 (Unaudited)
| | | | | | | | | | | | | | |
| | | Beginning Account Value
November 1, 2013 | | | Ending Account Value
April 30, 2014 | | | Expense
Ratio(a) | | Expenses Paid
During Period
November 1, 2013 -
April 30, 2014(b) | |
RiverFront Global Growth Fund | | | | | | | | | | | |
Class A | | | | | | | | | | | | | | |
Actual | | $ | 1,000.00 | | | $ | 1,041.50 | | | 1.15% | | $ | 5.82 | |
Hypothetical (5% return before expenses) | | $ | 1,000.00 | | | $ | 1,019.09 | | | 1.15% | | $ | 5.76 | |
Class C | | | | | | | | | | | | | | |
Actual | | $ | 1,000.00 | | | $ | 1,037.10 | | | 1.90% | | $ | 9.60 | |
Hypothetical (5% return before expenses) | | $ | 1,000.00 | | | $ | 1,015.37 | | | 1.90% | | $ | 9.49 | |
Class I | | | | | | | | | | | | | | |
Actual | | $ | 1,000.00 | | | $ | 1,042.90 | | | 0.90% | | $ | 4.56 | |
Hypothetical (5% return before expenses) | | $ | 1,000.00 | | | $ | 1,020.33 | | | 0.90% | | $ | 4.51 | |
Class L | | | | | | | | | | | | | | |
Actual | | $ | 1,000.00 | | | $ | 1,042.50 | | | 0.90% | | $ | 4.56 | |
Hypothetical (5% return before expenses) | | $ | 1,000.00 | | | $ | 1,020.33 | | | 0.90% | | $ | 4.51 | |
Investor Class | | | | | | | | | | | | | | |
Actual | | $ | 1,000.00 | | | $ | 1,011.70 | | | 1.15% | | $ | 5.74 | |
Hypothetical (5% return before expenses) | | $ | 1,000.00 | | | $ | 1,019.09 | | | 1.15% | | $ | 5.76 | |
RiverFront Moderate Growth & Income Fund | | | | | | | | | | | |
Class A | | | | | | | | | | | | | | |
Actual | | $ | 1,000.00 | | | $ | 1,043.40 | | | 1.15% | | $ | 5.83 | |
Hypothetical (5% return before expenses) | | $ | 1,000.00 | | | $ | 1,019.09 | | | 1.15% | | $ | 5.76 | |
Class C | | | | | | | | | | | | | | |
Actual | | $ | 1,000.00 | | | $ | 1,039.30 | | | 1.90% | | $ | 9.61 | |
Hypothetical (5% return before expenses) | | $ | 1,000.00 | | | $ | 1,015.37 | | | 1.90% | | $ | 9.49 | |
Class I | | | | | | | | | | | | | | |
Actual | | $ | 1,000.00 | | | $ | 1,045.00 | | | 0.90% | | $ | 4.56 | |
Hypothetical (5% return before expenses) | | $ | 1,000.00 | | | $ | 1,020.33 | | | 0.90% | | $ | 4.51 | |
| (a) | Annualized, based on the Fund’s most recent fiscal half year expenses. |
| (b) | Expenses are equal to the Fund’s annualized expense ratio multiplied by the average account value over the period, multiplied by the number of days in the most recent fiscal half year (181), divided by 365. |
| (c) | Includes expenses of the CoreCommodity Management Cayman Commodity Fund Ltd. (wholly-owned subsidiary), exclusive of the subsidiary’s management fee. |
| (d) | Includes expenses of the Kotak Mauritius Portfolio (wholly-owned subsidiary), exclusive of subsidiary’s management fee. |
4 | April 30, 2014
| | |
| ALPS | Alerian MLP Infrastructure Index Fund |
| Management Commentary | | April 30, 2014 (Unaudited) |
During the twelve month period of May 1, 2013 to April 30, 2014, the Alerian MLP Infrastructure Index Fund’s Class A shares delivered a net return of 7.59% at Net Asset Value. Class A delivered a net return of 1.64% at MOP, Class C was 6.13% with CDSC, and Class I was 7.68%. This compares to the Fund’s index, the Alerian MLP Infrastructure Index (“Index”), which gained 9.2% on a price-return and 15.5% on a total return basis. The difference in the performance between the Index and various classes of Fund shares is primarily attributable to the Fund’s class specific fees, operating expenses and the tax impact of the Fund’s C-corporation structure.
During the period, the Fund paid four distributions: $0.1650 per share on May 14, $0.1680 on August 14, $0.1715 on November 15, and $0.1740 on February 13, representing 1.4%, 1.8%, 2.1%, and 1.5% increases quarter over quarter. On an annual basis, the Fund has increased its distribution by 6.9% when comparing the February 13, 2014 distribution versus the February 14, 2013 distribution of $0.1627.
Top contributors to the Index during the period include Sunoco Logistics Partners (SXL), Spectra Energy Partners (SEP), Magellan Midstream Partners (MMP), and Access Midstream Partners (ACMP), all gaining more than 40% on a price-return basis. Only four MLPs in the Index generated negative returns during the period: Plains All American Pipeline Partners (PAA), Atlas Pipeline Partners (APL), Kinder Morgan Energy Partners (KMP), and El Paso Pipeline Partners (EPB). During the period, Boardwalk Pipeline Partners (BWP) was removed from the Index. Copano Energy Partners and PVR Partners were also removed from the Index, as they were acquired by KMP and Regency Energy Partners (RGP).
Energy infrastructure Master Limited Partnerships (“MLPs”) continue to benefit from the dramatic increase in natural gas, crude oil, and natural gas liquids (LNG) production known as the energy renaissance. The MLP-owned energy infrastructure assets, including pipelines, storage facilities, and processing plants, are the bridge by which the reserves and production in supply basins make their way to demand centers. As production grows, the need to construct additional infrastructure increases as well.
In March 2014, the Interstate Natural Gas Association of America updated its North American midstream infrastructure study, noting that $640 billion of midstream infrastructure investment will be needed over the next 20 years through 2035. This represents a sharp increase from the $250 billion estimate released just three years prior. Updated numbers reflect new production forecast estimates and include infrastructure related to natural gas, natural gas liquids, crude oil, as well as other assets previously not accounted for such as compression for gathering, fractionation, crude oil, leasing equipment, and LNG export facilities.
For perspective, the total market capitalization of the 25 MLPs in the Index at April 30, 2014 was $318 billion. The additional $640 billion of needed investment represents a vast opportunity for MLPs to participate in the energy infrastructure build-out of North America. With toll-road business models anchored by inflation-indexed tariff increases and billions of dollars of infrastructure opportunities over the next few decades, we believe that MLPs continue to represent a compelling potential investment opportunity for investors seeking after-tax yield.
The views and information discussed in this commentary are as of the date of publication, are subject to change, and may not reflect the writer’s current views. The views expressed represent an assessment of market conditions at a specific point in time, are opinions only and should not be relied upon as investment advice regarding a particular investment or markets in general. Such information does not constitute a recommendation to buy or sell specific securities or investment vehicles. It should not be assumed that any investment will be profitable or will equal the performance of the fund(s) or any securities or any sectors mentioned herein. The subject matter contained herein has been derived from several sources believed to be reliable and accurate at the time of compilation. ALPS Advisors, Inc. and Alerian do not accept any liability for losses either direct or consequential caused by the use of this information.
5 | April 30, 2014
| | |
| ALPS | Alerian MLP Infrastructure Index Fund |
| Performance Update | | April 30, 2014 (Unaudited) |
Performance of $10,000 Initial Investment (as of April 30, 2014)
Comparison of change in value of a $10,000 investment (includes maximum sales charges of 5.50%)

The chart above represents historical performance of a hypothetical investment of $10,000 in the Fund since inception. Past performance does not guarantee future results. This chart does not reflect the deduction of taxes that a shareholder would pay on Fund distributions or the redemption of Fund shares.
Average Annual Total Returns (as of April 30, 2014)
| | | | | | | | |
| | | 1 Year | | Since Inception^ | | Total Expense Ratio* | | What You Pay** |
Class A (NAV) | | 7.59% | | 15.59% | | 1.49% | | 1.25% |
Class A (MOP) | | 1.64% | | 10.79% | | |
Class C (NAV) | | 7.13% | | 15.14% | | 2.09% | | 1.85% |
Class C (CDSC) | | 6.13% | | 15.14% | | |
Class I | | 7.68% | | 15.74% | | 1.09% | | 0.85% |
Alerian MLP Infrastructure Index1 | | 13.31% | | 26.53% | | | | |
Performance data quoted represents past performance. Past performance does not guarantee future results. Investment return and principal value of an investment will fluctuate so that an investor’s shares, when sold or redeemed, may be worth more or less than the original cost. Current performance data may be higher or lower than actual data quoted. For the most current month-end performance data please call 1-866-759-5679.
Maximum Offering Price (MOP) for Class A shares includes the Fund’s maximum sales charge of 5.50%. Performance shown at NAV does not include these sales charges and would have been lower had it been taken into account. If you invest $1 million or more, either as a lump sum or through the Fund’s accumulation or letter of intent programs, you can purchase Class A shares without an initial sales charge (load). A Contingent Deferred Sales Charge (“CDSC”) of 1.00% may apply to Class C shares redeemed within the first 12 months after a purchase, and on Class A shares redeemed within the first 18 months after a purchase in excess of $1 million.
Investments in securities of MLPs involve risks that differ from an investment in common stock. MLPs are controlled by their general partners, which generally have conflicts of interest and limited fiduciary duties to the MLP, which may permit the general partner to favor its own interests over the MLPs. The benefit you are expected to derive from the Fund’s investment in MLPs depends largely on the MLPs being treated as partnerships for federal income tax purposes. As a partnership, an MLP has no federal income tax liability at the entity level. Therefore, treatment of one or more MLPs as a corporation for federal income tax purposes could affect the Fund’s ability to meet its investment objective and would reduce the amount of cash available to pay or distribute to you. Legislative, judicial, or administrative changes and differing interpretations, possibly on a retroactive basis, could negatively impact the value of an investment in MLPs and therefore the value of your investment in the Fund.
6 | April 30, 2014
| | |
| ALPS | Alerian MLP Infrastructure Index Fund |
| Performance Update | | April 30, 2014 (Unaudited) |
| 1 | Alerian MLP Infrastructure Index is comprised of 25 midstream energy Master Limited Partnerships. The index is not actively managed and does not reflect any deductions for fees, expenses or taxes. An investor may not invest directly in an index. |
| ^ | Fund inception date of December 31, 2012. The Fund commenced operations on January 2, 2013. |
| * | Excludes current and deferred income tax expense. |
| ** | What You Pay reflects the Advisor’s and Sub-Advisor’s decision to contractually limit expenses through August 31, 2014. Please see the prospectus for additional information. |
The table does not reflect the deduction of taxes that a shareholder would pay on Fund distributions or the redemption of Fund shares.
This Fund is not suitable for all investors and is subject to investment risks, including possible loss of the principal amount invested.
There is no guarantee that the Fund will continue to hold any one particular security or stay invested in any one particular company. The composition of the Fund’s top holdings is subject to change. Performance figures are historical and reflect the change in share price, reinvested distributions, changes in net asset value, sales charges and capital gains distributions, if any.
Not FDIC Insured – No Bank Guarantee – May Lose Value
Top Ten Holdings (as a % of Net Assets) †
| | | | |
Enterprise Products Partners LP | | | 10.33% | |
Kinder Morgan Energy Partners LP | | | 9.52% | |
Magellan Midstream Partners LP | | | 7.51% | |
Plains All American Pipeline LP | | | 7.29% | |
Energy Transfer Partners LP | | | 7.01% | |
MarkWest Energy Partners LP | | | 6.06% | |
Buckeye Partners LP | | | 4.96% | |
Williams Partners LP | | | 4.92% | |
ONEOK Partners LP | | | 4.91% | |
Regency Energy Partners LP | | | 4.72% | |
Top Ten Holdings | | | 67.23% | |
| † | Holdings are subject to change. Table presents indicative values only. |
Industry Sector Allocation (as a % of Total Investments)
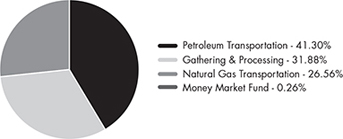
7 | April 30, 2014
| | |
| ALPS | Alerian MLP Infrastructure Index Fund |
| Statement of Investments | | April 30, 2014 |
| | | | | | | | |
| | | Shares | | | Value (Note 2) | |
| |
| MASTER LIMITED PARTNERSHIPS (104.70%) | |
| Gathering & Processing (33.46%) | |
Pipelines (33.46%) | | | | | | | | |
Access Midstream Partners LP | | | 7,416 | | | $ | 440,140 | |
Atlas Pipeline Partners LP | | | 6,067 | | | | 196,449 | |
Crestwood Midstream Partners LP | | | 11,507 | | | | 267,423 | |
DCP Midstream Partners LP | | | 6,815 | | | | 364,602 | |
EnLink Midstream Partners LP | | | 7,452 | | | | 219,759 | |
MarkWest Energy Partners LP | | | 12,581 | | | | 796,881 | |
Regency Energy Partners LP | | | 22,803 | | | | 621,154 | |
Targa Resources Partners LP | | | 8,077 | | | | 478,239 | |
Western Gas Partners LP | | | 5,454 | | | | 370,872 | |
Williams Partners LP | | | 12,560 | | | | 647,845 | |
| | | | | | | | |
| | | | | | | 4,403,364 | |
| | | | | | | | |
| |
| TOTAL GATHERING & PROCESSING | | | | 4,403,364 | |
| | | | | | | | |
| |
| Natural Gas Transportation (27.88%) | | | | | |
Pipelines (27.88%) | | | | | | | | |
El Paso Pipeline Partners LP | | | 10,377 | | | | 337,771 | |
Energy Transfer Partners LP | | | 16,704 | | | | 921,894 | |
Enterprise Products Partners LP | | | 18,596 | | | | 1,359,925 | |
ONEOK Partners LP | | | 11,344 | | | | 646,495 | |
Spectra Energy Partners LP | | | 3,809 | | | | 207,400 | |
TC PipeLines LP | | | 3,687 | | | | 195,558 | |
| | | | | | | | |
| | | | | | | 3,669,043 | |
| | | | | | | | |
| |
| TOTAL NATURAL GAS TRANSPORTATION | | | | 3,669,043 | |
| | | | | | | | |
|
| Petroleum Transportation (43.36%) | |
Pipelines (43.36%) | | | | | | | | |
Buckeye Partners LP | | | 8,571 | | | | 653,196 | |
Enbridge Energy Partners LP | | | 16,930 | | | | 507,223 | |
Genesis Energy LP | | | 5,967 | | | | 330,691 | |
Kinder Morgan Energy Partners LP | | | 16,614 | | | | 1,252,363 | |
Magellan Midstream Partners LP | | | 13,317 | | | | 988,255 | |
NuStar Energy LP | | | 5,310 | | | | 309,892 | |
Plains All American Pipeline LP | | | 17,200 | | | | 959,760 | |
Sunoco Logistics Partners LP | | | 5,726 | | | | 520,837 | |
Tesoro Logistics LP | | | 2,875 | | | | 183,712 | |
| | | | | | | | |
| | | | | | | 5,705,929 | |
| | | | | | | | |
| |
| TOTAL PETROLEUM TRANSPORTATION | | | | 5,705,929 | |
| | | | | | | | |
| |
TOTAL MASTER LIMITED PARTNERSHIPS (Cost $11,707,794) | | | | 13,778,336 | |
| | | | | | | | |
| | | | | | | | | | | | |
| | | 7-Day Yield | | | Shares | | | Value (Note 2) | |
| |
| SHORT TERM INVESTMENTS (0.27%) | |
| Money Market Fund (0.27%) | | | | | |
Morgan Stanley | | | | | | | | | | | | |
Institutional Liquidity Funds - Prime Portfolio | | | 0.055 | % | | | 35,655 | | | $ | 35,655 | |
| | | | | | | | | | | | |
| |
TOTAL SHORT TERM INVESTMENTS (Cost $35,655) | | | | 35,655 | |
| | | | | | | | | | | | |
| |
TOTAL INVESTMENTS (104.97%) (Cost $11,743,449) | | | $ | 13,813,991 | |
| |
Liabilities In Excess Of Other Assets (-4.97%) | | | | (654,385) | |
| | | | | | | | | | | | |
| |
| NET ASSETS (100.00%) | | | $ | 13,159,606 | |
| | | | | | | | | | | | |
Common Abbreviations:
LP - Limited Partnerships.
For Fund compliance purposes, the Fund’s industry classifications refer to any one or more of the industry sub-classifications used by one or more widely recognized market indexes or ratings group indexes, and/or as defined by Fund management. This definition may not apply for purposes of this report, which may combine industry sub-classifications for reporting ease. Industries are shown as a percent of net assets.
See Notes to Financial Statements.
| | |
| ALPS | Alerian MLP Infrastructure Index Fund |
| Statement of Assets and Liabilities | | April 30, 2014 |
| | | | |
ASSETS | | | | |
Investments, at value | | $ | 13,813,991 | |
Receivable for shares sold | | | 47,569 | |
Dividends receivable | | | 86,349 | |
Receivable due from advisor | | | 3,196 | |
Income tax receivable | | | 6,797 | |
Prepaid expenses and other assets | | | 16,058 | |
Total Assets | | | 13,973,960 | |
LIABILITIES | | | | |
Deferred tax liability | | | 678,230 | |
Franchise tax payable | | | 1,869 | |
Payable for shares redeemed | | | 97,901 | |
Administration and transfer agency fees payable | | | 1,375 | |
Distribution and services fees payable | | | 6,110 | |
Trustees’ fees and expenses payable | | | 92 | |
Professional fees payable | | | 21,795 | |
Accrued expenses and other liabilities | | | 6,982 | |
Total Liabilities | | | 814,354 | |
| NET ASSETS | | $ | 13,159,606 | |
| | | | | |
NET ASSETS CONSIST OF | | | | |
Paid-in capital | | $ | 12,185,386 | |
Accumulated net investment loss, net of deferred income taxes | | | (78,191) | |
Accumulated net realized loss on investments, net of deferred income taxes | | | (268,997) | |
Net unrealized appreciation on investments, net of deferred income taxes | | | 1,321,408 | |
| NET ASSETS | | $ | 13,159,606 | |
| | | | | |
| INVESTMENTS, AT COST | | $ | 11,743,449 | |
| |
| PRICING OF SHARES | | | | |
Class A: | | | | |
Net Asset Value, offering and redemption price per share(a) | | $ | 11.23 | |
Net Assets | | $ | 8,223,371 | |
Shares of beneficial interest outstanding (unlimited number of shares, no par value common stock authorized) | | | 732,357 | |
Maximum offering price per share ((NAV/0.9450), based on maximum sales charge of 5.50% of the offering price) | | $ | 11.88 | |
Class C: | | | | |
Net Asset Value, offering and redemption price per share(a) | | $ | 11.17 | |
Net Assets | | $ | 3,428,798 | |
Shares of beneficial interest outstanding (unlimited number of shares, no par value common stock authorized) | | | 306,952 | |
Class I: | | | | |
Net Asset Value, offering and redemption price per share | | $ | 11.25 | |
Net Assets | | $ | 1,507,437 | |
Shares of beneficial interest outstanding (unlimited number of shares, no par value common stock authorized) | | | 133,956 | |
| (a) | Redemption price per share may be reduced for any applicable contingent deferred sales charge. For a description of a possible sales charge, please see the Fund’s Prospectus. |
See Notes to Financial Statements.
9 | April 30, 2014
| | |
| ALPS | Alerian MLP Infrastructure Index Fund |
| Statement of Operations | | For the Year Ended April 30, 2014 |
| | | | |
INVESTMENT INCOME | | | | |
Dividends | | $ | 33 | |
Distributions from master limited partnerships | | | 487,557 | |
Less return of capital distributions | | | (487,557) | |
Total Investment Income | | | 33 | |
| |
| EXPENSES | | | | |
Investment advisory fees | | | 59,609 | |
Administrative and transfer agency fees | | | 10,014 | |
Distribution and service fees | | | | |
Class A | | | 20,539 | |
Class C | | | 15,441 | |
Professional fees | | | 63,165 | |
Reports to shareholders and printing fees | | | 2,145 | |
State registration fees | | | 27,509 | |
SEC registration fees | | | 1,322 | |
Insurance fees | | | 96 | |
Franchise tax expenses | | | 1,869 | |
Custody fees | | | 12,881 | |
Trustees’ fees and expenses | | | 330 | |
Offering costs | | | 46,017 | |
Miscellaneous expenses | | | 12,614 | |
Total Expenses | | | 273,551 | |
Less fees waived/reimbursed by investment advisor (Note 8) | | | | |
Class A | | | (95,994) | |
Class C | | | (28,674) | |
Class I | | | (38,321) | |
Net Expenses | | | 110,562 | |
Net Investment Loss, Before Deferred Income Taxes | | | (110,529) | |
Deferred income tax benefit | | | 26,867 | |
Deferred income tax benefit - Class A | | | 7,476 | |
Deferred income tax benefit - Class C | | | 5,621 | |
Net Investment Loss, Net of Deferred Income Taxes | | | (70,565) | |
| |
| REALIZED AND UNREALIZED GAIN/(LOSS) | | | | |
Net realized loss on investments, before deferred income taxes | | | (63,121) | |
Current income tax expense | | | (3,303) | |
Deferred income tax benefit | | | 26,138 | |
Net Realized Loss on investments, Net of Deferred Income Taxes | | | (40,286) | |
| |
Net change in unrealized appreciation on investment, before deferred income taxes | | | 1,436,619 | |
Deferred income tax expense | | | (518,386) | |
Net Change in Unrealized Appreciation on Investments | | | 918,233 | |
NET REALIZED AND UNREALIZED GAIN ON INVESTMENTS, NET OF DEFERRED INCOME TAXES | | | 877,947 | |
| NET INCREASE IN NET ASSETS RESULTING FROM OPERATIONS | | $ | 807,382 | |
| | | | | |
See Notes to Financial Statements.
10 | April 30, 2014
|
| ALPS | Alerian MLP Infrastructure Index Fund |
| Statements of Changes in Net Assets |
| | | | | | | | |
| | | For the Year Ended
April 30, 2014 | | | For the Period
January 2, 2013
(Commencement)
to April 30, 2013 | |
OPERATIONS | | | | | | | | |
Net investment loss, net of deferred income taxes | | $ | (70,565) | | | $ | (7,626) | |
Net realized loss on investments, net of deferred income taxes | | | (40,286) | | | | (764) | |
Net change in unrealized appreciation on investments, net of deferred income taxes | | | 918,233 | | | | 403,175 | |
Net Increase in Net Assets Resulting from Operations | | | 807,382 | | | | 394,785 | |
| | |
| DISTRIBUTIONS | | | | | | | | |
Dividends to shareholders from net investment income | | | | | | | | |
Class A | | | (137,326) | | | | – | |
Class C | | | (42,694) | | | | – | |
Class I | | | (47,927) | | | | – | |
Dividends to shareholders from tax return of capital | | | | | | | | |
Class A | | | (120,029) | | | | (8,653) | |
Class C | | | (41,147) | | | | (8,137) | |
Class I | | | (74,680) | | | | (32,548) | |
Net Decrease in Net Assets from Distributions | | | (463,803) | | | | (49,338) | |
| | |
| BENEFICIAL INTEREST TRANSACTIONS (NOTE 6) | | | | | | | | |
Shares sold | | | | | | | | |
Class A | | | 9,171,152 | | | | 851,295 | |
Class C | | | 3,336,491 | | | | 500,010 | |
Class I | | | 1,646,324 | | | | 2,000,010 | |
Dividends reinvested | | | | | | | | |
Class A | | | 240,424 | | | | 8,653 | |
Class C | | | 58,350 | | | | 8,137 | |
Class I | | | 118,124 | | | | 32,548 | |
Shares redeemed | | | | | | | | |
Class A | | | (2,345,899) | | | | (10) | |
Class C | | | (621,954) | | | | (10) | |
Class I | | | (2,533,055) | | | | (10) | |
Net Increase in Net Assets Derived from Beneficial Interest Transactions | | | 9,069,957 | | | | 3,400,623 | |
| | |
Net increase in net assets | | | 9,413,536 | | | | 3,746,070 | |
| | |
| NET ASSETS | | | | | | | | |
Beginning of year | | | 3,746,070 | | | | – | |
End of year * | | $ | 13,159,606 | | | $ | 3,746,070 | |
| | | | | | | | | |
*Including accumulated net investment loss, net of Deferred Income Taxes, of: | | $ | (78,191) | | | $ | (7,626) | |
See Notes to Financial Statements.
11 | April 30, 2014
| | |
| ALPS | Alerian MLP Infrastructure Index Fund – Class A |
| Financial Highlights | | |
Selected data for a share of beneficial interest outstanding throughout the periods indicated:
| | | | |
| | | For the Year Ended
April 30, 2014 | | For the Period
January 2, 2013
(Commencement) to
April 30, 2013 |
Net asset value, beginning of period | | $11.10 | | $10.00 |
| | |
| INCOME/(LOSS) FROM INVESTMENT OPERATIONS: | | | | |
Net investment loss(a) | | (0.09) | | (0.03) |
Net realized and unrealized gain | | 0.90 | | 1.29 |
Total from investment operations | | 0.81 | | 1.26 |
| | |
| DISTRIBUTIONS: | | | | |
From net investment income | | (0.36) | | – |
From tax return of capital | | (0.32) | | (0.16) |
Total distributions | | (0.68) | | (0.16) |
| | |
Net increase in net asset value | | 0.13 | | 1.10 |
Net asset value, end of year | | $11.23 | | $11.10 |
| | | | | |
| TOTAL RETURN(b) | | 7.59% | | 12.68% |
| | |
| RATIOS/SUPPLEMENTAL DATA: | | | | |
Net assets, end of year (000s) | | $8,223 | | $928 |
| | |
Ratio of expenses to average net assets before waivers, franchise tax expense and income tax expense | | 3.09% | | 5.51%(c)(d) |
Ratio of expense waivers to average net assets | | (1.84%) | | (4.26%)(c)(d) |
Ratio of expenses to average net assets net of waivers before franchise tax expense and income tax expense | | 1.25% | | 1.25%(c)(d) |
Ratio of franchise tax expense and deferred income tax expense to average net assets(e) | | 5.38% | | 20.55%(c) |
Ratio of total expenses to average net assets | | 6.63% | | 21.80%(c) |
| | | | | |
| | |
Ratio of investment loss to average net assets before waivers, franchise tax expense and income tax expense | | (3.09%) | | (5.51%)(c)(d) |
Ratio of expense waivers to average net assets | | (1.84%) | | (4.26%)(c)(d) |
Ratio of investment loss to average net assets net of waivers before franchise tax expense and income tax expense | | (1.25%) | | (1.25%)(c)(d) |
Ratio of franchise tax expense and deferred income tax benefit to average net assets(f) | | 0.43% | | 0.40%(c) |
Ratio of net investment loss to average net assets | | (0.82%) | | (0.85%)(c) |
| | | | | |
| | |
Portfolio turnover rate(g) | | 63% | | 3% |
| (a) | Calculated using the average shares method. |
| (b) | Total returns are for the period indicated and have not been annualized. Total returns would have been lower had certain expenses not been waived during the period. Returns shown do not reflect the deduction of taxes that a shareholder would pay on Fund distributions or the redemption of Fund shares. Returns shown exclude any applicable sales charges. |
| (d) | Expense ratios before reductions for startup periods may not be representative of longer term operating periods. |
| (e) | Deferred income tax expense estimate for the ratio calculation is derived from the net investment loss, and realized and unrealized gains/losses. |
| (f) | Deferred income tax benefit for the ratio calculation is derived from net investment loss only. |
| (g) | Portfolio turnover rate for periods less than one full year have not been annualized. |
See Notes to Financial Statements.
12 | April 30, 2014
| | |
| ALPS | Alerian MLP Infrastructure Index Fund – Class C |
| Financial Highlights | | |
Selected data for a share of beneficial interest outstanding throughout the periods indicated:
| | | | |
| | | For the Year Ended
April 30, 2014 | | For the Period
January 2, 2013
(Commencement) to
April 30, 2013 |
Net asset value, beginning of period | | $11.09 | | $10.00 |
| | |
| INCOME/(LOSS) FROM INVESTMENT OPERATIONS: | | | | |
Net investment loss(a) | | (0.13) | | (0.05) |
Net realized and unrealized gain | | 0.89 | | 1.30 |
Total from investment operations | | 0.76 | | 1.25 |
| | |
| DISTRIBUTIONS: | | | | |
From net investment income | | (0.35) | | – |
From tax return of capital | | (0.33) | | (0.16) |
Total distributions | | (0.68) | | (0.16) |
| | |
Net increase in net asset value | | 0.08 | | 1.09 |
Net asset value, end of year | | $11.17 | | $11.09 |
| | | | | |
| TOTAL RETURN(b) | | 7.13% | | 12.58% |
| | |
| RATIOS/SUPPLEMENTAL DATA: | | | | |
Net assets, end of year (000s) | | $3,429 | | $563 |
| | |
Ratio of expenses to average net assets before waivers, franchise tax expense and income tax expense | | 3.71% | | 7.01%(c)(d) |
Ratio of expense waivers to average net assets | | (1.86%) | | (5.16%)(c)(d) |
Ratio of expenses to average net assets net of waivers before franchise tax expense and income tax expense | | 1.85% | | 1.85%(c)(d) |
Ratio of franchise tax expense and deferred income tax expense to average net
assets(e) | | 5.16% | | 20.55%(c) |
Ratio of total expenses to average net assets | | 7.01% | | 22.40%(c) |
| | | | | |
| | |
Ratio of investment loss to average net assets before waivers, franchise tax expense and income tax expense | | (3.71%) | | (7.01%)(c)(d) |
Ratio of expense waivers to average net assets | | (1.86%) | | (5.16%)(c)(d) |
Ratio of investment loss to average net assets net of waivers before franchise tax expense and income tax expense | | (1.85%) | | (1.85%)(c)(d) |
Ratio of franchise tax expense and deferred income tax benefit to average net assets(f) | | 0.65% | | 0.40%(c) |
Ratio of net investment loss to average net assets | | (1.20%) | | (1.45%)(c) |
| | | | | |
| | |
Portfolio turnover rate(g) | | 63% | | 3% |
| (a) | Calculated using the average shares method. |
| (b) | Total returns are for the period indicated and have not been annualized. Total returns would have been lower had certain expenses not been waived during the period. Returns shown do not reflect the deduction of taxes that a shareholder would pay on Fund distributions or the redemption of Fund shares. Returns shown exclude any applicable sales charges. |
| (d) | Expense ratios before reductions for startup periods may not be representative of longer term operating periods. |
| (e) | Deferred income tax expense estimate for the ratio calculation is derived from the net investment loss, and realized and unrealized gains/losses. |
| (f) | Deferred income tax benefit for the ratio calculation is derived from net investment loss only. |
| (g) | Portfolio turnover rate for periods less than one full year have not been annualized. |
See Notes to Financial Statements.
13 | April 30, 2014
|
| ALPS | Alerian MLP Infrastructure Index Fund – Class I |
| Financial Highlights |
Selected data for a share of beneficial interest outstanding throughout the periods indicated:
| | | | |
| | | For the Year Ended
April 30, 2014 | | For the Period
January 2, 2013
(Commencement) to
April 30, 2013 |
Net asset value, beginning of period | | $11.11 | | $10.00 |
| | |
| INCOME/(LOSS) FROM INVESTMENT OPERATIONS: | | | | |
Net investment loss(a) | | (0.06) | | (0.02) |
Net realized and unrealized gain | | 0.88 | | 1.29 |
Total from investment operations | | 0.82 | | 1.27 |
| | |
| DISTRIBUTIONS: | | | | |
From net investment income | | (0.27) | | – |
From tax return of capital | | (0.41) | | (0.16) |
Total distributions | | (0.68) | | (0.16) |
| | |
Net increase in net asset value | | 0.14 | | 1.11 |
Net asset value, end of year | | $11.25 | | $11.11 |
| | | | | |
| TOTAL RETURN(b) | | 7.68% | | 12.78% |
| | |
| RATIOS/SUPPLEMENTAL DATA: | | | | |
Net assets, end of year (000s) | | $1,507 | | $2,256 |
| | |
Ratio of expenses to average net assets before waivers, franchise tax expense and income tax expense | | 3.03% | | 6.01%(c)(d) |
Ratio of expense waivers to average net assets | | (2.18%) | | (5.16%)(c)(d) |
Ratio of expenses to average net assets net of waivers before franchise tax expense and income tax expense | | 0.85% | | 0.85%(c)(d) |
Ratio of franchise tax expense and deferred income tax expense to average net
assets(e) | | 5.53% | | 20.55%(c) |
Ratio of total expenses to average net assets | | 6.38% | | 21.40%(c) |
| | | | | |
| | |
Ratio of investment loss to average net assets before waivers, franchise tax expense and income tax expense | | (3.03%) | | (6.01%)(c)(d) |
Ratio of expense waivers to average net assets | | (2.18%) | | (5.16%)(c)(d) |
Ratio of investment loss to average net assets net of waivers before franchise tax expense and income tax expense | | (0.85%) | | (0.85%)(c)(d) |
Ratio of franchise tax expense and deferred income tax benefit to average net assets(f) | | 0.29% | | 0.40%(c) |
Ratio of net investment loss to average net assets | | (0.56%) | | (0.45%)(c) |
| | | | | |
| | |
Portfolio turnover rate(g) | | 63% | | 3% |
| (a) | Calculated using the average shares method. |
| (b) | Total returns are for the period indicated and have not been annualized. Total returns would have been lower had certain expenses not been waived during the period. Returns shown do not reflect the deduction of taxes that a shareholder would pay on Fund distributions or the redemption of Fund shares. |
| (d) | Expense ratios before reductions for startup periods may not be representative of longer term operating periods. |
| (e) | Deferred income tax expense estimate for the ratio calculation is derived from the net investment loss, and realized and unrealized gains/losses. |
| (f) | Deferred income tax benefit for the ratio calculation is derived from net investment loss only. |
| (g) | Portfolio turnover rate for periods less than one full year have not been annualized. |
See Notes to Financial Statements.
14 | April 30, 2014
| | |
ALPS | CoreCommodity Management CompleteCommodities® Strategy Fund |
| Management Commentary | | April 30, 2014 (Unaudited) |
Commodity prices rose modestly over the past year. For the one year period ending April 30, 2014, the ALPS | CoreCommodity Management CompleteCommodities® Strategy Fund (the “Fund”) Class I shares (JCRIX) were up 4.82% (Class A, JCRAX, was up 4.52% at NAV and Class C, JCRCX, was up 3.88%). Since inception, June 29, 2010, the Fund’s Class I Shares, JCRIX, has delivered an annual return of 6.22% (5.93% for Class A, JCRAX, at NAV and 5.33% for Class C, JCRCX, with CDSC). As of April 30, 2014, the Fund’s “I” share outperformed its primary benchmark, the Thomson Reuters/Core Commodity CRB Total Return Index (the “TR/CC CRB Total Return Index”) (+20.09%) by 495 basis points since inception (cumulative returns). Additionally, the Fund surpassed the cumulative performance of the Dow Jones UBS Commodity Total Return Index (DJUBSTR) (+11.25%) by 1480 basis points.
This quarter the Fund effectively employed the sub-adviser’s strategy to attempt to reduce the corrosive effects of commodity contango (or costs associated with replacing expiring futures contacts when new contacts are more expensive) by combining commodity futures related investments (collateralized by Treasury Inflation-Protected Securities (“TIPS”)), commodity equities, and where appropriate, physical commodity exchange-traded funds (ETFs). This asset combination contributed to the Fund’s outperformance relative to its benchmark. During most of the year, the Fund invested approximately 67% of its assets in commodity futures related instruments (backed by collateral held in TIPS) with the remainder (approximately 33%) in commodity equities. The Fund successfully reduced some of the costs of contango in many of the components of the CRB Index, which contributed to the comparative performance of the Fund relative to its benchmark.
Commodity prices were largely subdued throughout most of 2013. Lower than expected gross domestic product (GDP) growth rates globally and specific economic challenges in China, India, Brazil, Argentina, and other developing countries reduced marginal demand for many commodities. As 2014 unfolded, commodity prices have begun to rebound. The gains in just the first four months of 2014 have largely been responsible for the Fund’s positive year-over-year performance.
Highly accommodative monetary policies have been the primary tools employed by numerous central banks around the world, including the US Federal Reserve. Despite the announcement to taper quantitative easing during 2014, the Federal Open Market Committee (the “Fed”) continues to buy US treasury securities and mortgage backed securities. The Fed maintains a zero interest rate policy as well. Chairman Janet Yellen has suggested repeatedly that the Fed is likely to remain accommodative for a very long time. We believe the policies already in place and the large accumulated balance sheet may contribute to a surge in commodity prices going forward. Additional stimulus contemplated from other parts of the globe may only heighten the positive price impact on commodities.
The Fund invests its excess cash held as collateral held for commodity futures related positions in U.S. Treasury Inflation Protected Bonds or TIPS. We believe that we may be nearing the end
of what has been a significant rally in US treasury prices, both nominal and TIPS, and as a result, we continue to limit our duration exposure. At the end of April, our weighted average maturity was approximately 1.15 years.
Commodity prices appear to be returning to their historic norms in terms of correlation relative to broad equity and bond returns. The general appreciation and outperformance by commodities in the first half of 2014 is notable and consistent with this observation. We expect both commodity and equity markets to be volatile, with the possibility of further pullbacks. However, we believe our long-term thesis continues to be strong for investing in commodities as a source for capturing growth in the emerging markets, as a hedge against the possible weakness of the US Dollar, and as a possible diversifying element within a well balanced portfolio. Commodities did not participate as robustly as the equity, bond, or real estate markets in the rally from the depths of the financial crisis in 2008-2009. Perhaps they have more upside potential as central banks pursue higher levels of inflation.
The views and information discussed in this commentary are as of the date of publication, are subject to change, and may not reflect the writer’s current views. The views expressed represent an assessment of market conditions at a specific point in time, are opinions only and should not be relied upon as investment advice regarding a particular investment or markets in general. Such information does not constitute a recommendation to buy or sell specific securities or investment vehicles. It should not be assumed that any investment will be profitable or will equal the performance of the fund(s) or any securities or any sectors mentioned herein. The subject matter contained herein has been derived from several sources believed to be reliable and accurate at the time of compilation. CoreCommodity Management, LLC does not accept any liability for losses either direct or consequential caused by the use of this information.
15 | April 30, 2014
| | |
ALPS | CoreCommodity Management CompleteCommodities® Strategy Fund |
| Performance Update | | April 30, 2014 (Unaudited) |
Performance of $10,000 Initial Investment (as of April 30, 2014)
Comparison of change in value of a $10,000 investment (includes maximum sales charges of 5.50%)
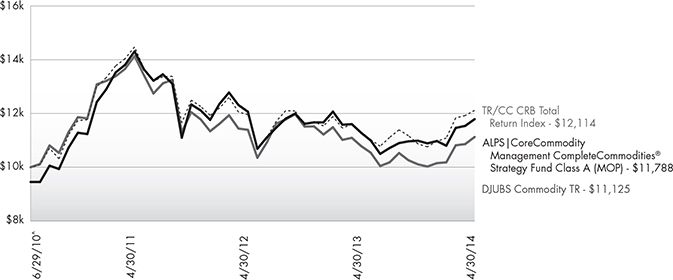
The chart above represents historical performance of a hypothetical investment of $10,000 in the Fund since inception. Past performance does not guarantee future results. This chart does not reflect the deduction of taxes that a shareholder would pay on Fund distributions or the redemption of Fund shares.
Average Annual Total Returns (as of April 30, 2014)
| | | | | | | | | | |
| | | 1 Year | | 3 Year | | Since Inception^ | | Total Expense Ratio | | What You Pay* |
Class A (NAV) | | 4.52% | | -6.26% | | 5.93% | | 1.55% | | 1.46% |
Class A (MOP) | | -1.27% | | -8.01% | | 4.38% | | |
Class C (NAV) | | 3.88% | | -6.83% | | 5.33% | | 2.15% | | 2.06% |
Class C (CDSC) | | 2.88% | | -6.83% | | 5.33% | | |
Class I | | 4.82% | | -6.00% | | 6.22% | | 1.17% | | 1.16% |
TR/CC CRB Total Return Index1 | | 7.48% | | -5.76% | | 5.13% | | | | |
DJUBS Commodity TR1 | | 3.17% | | -7.68% | | 2.82% | | | | |
Performance data quoted represents past performance. Past performance does not guarantee future results. Investment return and principal value of an investment will fluctuate so that an investor’s shares, when sold or redeemed, may be worth more or less than the original cost. Current performance data may be higher or lower than actual data quoted. For the most current month-end performance data, please call 1-866-759-5679.
Maximum Offering Price (MOP) for Class A shares includes the Fund’s maximum sales charge of 5.50%. Performance shown at NAV does not include these sales charges and would have been lower had it been taken into account. If you invest $1 million or more, either as a lump sum or through the Fund’s accumulation or letter of intent programs, you can purchase Class A shares without an initial sales charge (load). A Contingent Deferred Sales Charge (“CDSC”) of 1.00% may apply to Class C shares redeemed within the first 12 months after a purchase, and on Class A shares redeemed within the first 18 months after a purchase in excess of $1 million. The Fund imposes a 2.00% redemption fee on shares held for less than 30 days.
16 | April 30, 2014
| | |
ALPS | CoreCommodity Management CompleteCommodities® Strategy Fund |
| Performance Update | | April 30, 2014 (Unaudited) |
| 1 | Thomson Reuters/CC CRB Index and the Dow Jones-UBS Commodity Index are unmanaged indices used as a measurement of change in commodity market conditions based on the performance of a basket of different commodities. The indices are not actively managed and do not reflect any deduction for fees, expenses or taxes. An investor may not invest directly in an index. |
| ^ | Fund Inception date of June 29, 2010. |
| * | What You Pay reflects the Advisor’s decision to contractually limit expenses through August 31, 2014. Please see the prospectus for additional information. |
The table does not reflect the deduction of taxes that a shareholder would pay on Fund distributions or the redemption of Fund shares.
There is no guarantee that the Fund will continue to hold any one particular security or stay invested in any one particular company. The composition of the Fund’s top holdings is subject to change. Performance figures are historical and reflect the change in share price, reinvested distributions, changes in net asset value, sales charges and capital gains distributions, if any.
Not FDIC Insured – No Bank Guarantee – May Lose Value
This Fund is not suitable for all investors, and is subject to investment risks, including possible loss of the principal amount invested.
Investing in commodity-related securities involves risk and considerations not present when investing in more conventional securities. The Fund may be more susceptible to high volatility of commodity markets.
Derivatives generally are more sensitive to changes in economic or market conditions than other types of investments; this could result in losses that significantly exceed the Fund’s original investment.
Asset Type Allocation (as a % of Net Assets)†
| | | | |
Common Stocks | | | 35.09% | |
Government Bonds | | | 34.77% | |
Commodity-Linked Notes | | | 1.66% | |
Purchased Options | | | 1.21% | |
Master Limited Partnerships | | | 0.41% | |
Warrants | | | 0.00% | |
Short Term Investments and Other Assets | | | 26.86% | |
Total | | | 100.00% | |
| † | Holdings are subject to change. Table presents indicative values only. |
17 | April 30, 2014
| | |
ALPS | CoreCommodity Management CompleteCommodities® Strategy Fund |
| Consolidated Statement of Investments | | April 30, 2014 |
| | | | | | | | |
| | | | | | Value | |
| | | Shares | | | (Note 2) | |
| |
COMMON STOCKS (35.09%) | | | | | | | | |
Australia (0.54%) | | | | | | | | |
Caltex Australia, Ltd. | | | 4,871 | | | $ | 100,775 | |
Fortescue Metals Group, Ltd. | | | 31,313 | | | | 146,903 | |
GrainCorp, Ltd. | | | 29,298 | | | | 241,149 | |
Iluka Resources, Ltd. | | | 30,151 | | | | 249,011 | |
Incitec Pivot, Ltd. | | | 188,051 | | | | 503,132 | |
Newcrest Mining, Ltd.(a) | | | 11,624 | | | | 112,954 | |
Orica, Ltd. | | | 8,299 | | | | 168,612 | |
Regis Resources, Ltd. | | | 104,820 | | | | 236,627 | |
Woodside Petroleum, Ltd. | | | 9,366 | | | | 355,000 | |
| | | | | | | | |
| | | | | | | 2,114,163 | |
| | | | | | | | |
| | |
Austria (0.11%) | | | | | | | | |
OMV AG | | | 1,948 | | | | 91,117 | |
Voestalpine AG | | | 7,476 | | | | 341,232 | |
| | | | | | | | |
| | | | | | | 432,349 | |
| | | | | | | | |
| | |
Bermuda (0.11%) | | | | | | | | |
Nabors Industries, Ltd. | | | 11,916 | | | | 304,097 | |
Seadrill, Ltd. | | | 4,179 | | | | 147,184 | |
| | | | | | | | |
| | | | | | | 451,281 | |
| | | | | | | | |
| | |
Brazil (0.55%) | | | | | | | | |
Cia de Saneamento Basico do Estado de Sao Paulo, ADR | | | 87,603 | | | | 830,476 | |
Cia Siderurgica Nacional SA, ADR | | | 1,580 | | | | 6,115 | |
Gerdau SA, ADR | | | 27,835 | | | | 167,288 | |
Petroleo Brasileiro SA, ADR | | | 25,208 | | | | 349,887 | |
Vale SA, ADR | | | 62,030 | | | | 820,037 | |
| | | | | | | | |
| | | | | | | 2,173,803 | |
| | | | | | | | |
| | |
Canada (4.54%) | | | | | | | | |
Agnico-Eagle Mines, Ltd. | | | 9,541 | | | | 282,032 | |
Agrium, Inc. | | | 10,868 | | | | 1,044,089 | |
ARC Resources, Ltd. | | | 6,787 | | | | 201,372 | |
Argonaut Gold, Inc.(a) | | | 48,675 | | | | 179,858 | |
AuRico Gold, Inc. | | | 120,230 | | | | 500,157 | |
Barrick Gold Corp. | | | 38,755 | | | | 677,050 | |
Cameco Corp. | | | 5,892 | | | | 125,441 | |
Canadian Natural Resources, Ltd. | | | 5,741 | | | | 234,061 | |
Canadian Oil Sands, Ltd. | | | 38,708 | | | | 839,106 | |
Crescent Point Energy Corp. | | | 8,378 | | | | 340,838 | |
Eldorado Gold Corp. | | | 28,088 | | | | 171,337 | |
Encana Corp. | | | 30,254 | | | | 702,195 | |
First Quantum Minerals, Ltd. | | | 16,847 | | | | 335,541 | |
Goldcorp, Inc. | | | 38,241 | | | | 945,318 | |
IAMGOLD Corp. | | | 228,430 | | | | 797,221 | |
Kinross Gold Corp.(a) | | | 156,515 | | | | 635,451 | |
New Gold, Inc.(a) | | | 81,391 | | | | 412,652 | |
Osisko Mining Corp.(a) | | | 85,692 | | | | 613,733 | |
Pan American Silver Corp. | | | 72,423 | | | | 938,602 | |
Potash Corp. of Saskatchewan, Inc. | | | 101,128 | | | | 3,656,788 | |
Silver Standard Resources, Inc.(a) | | | 68,096 | | | | 674,831 | |
Silver Wheaton Corp. | | | 26,173 | | | | 581,041 | |
Suncor Energy, Inc. | | | 36,444 | | | | 1,406,738 | |
| | | | | | | | |
| | | | | | Value | |
| | | Shares | | | (Note 2) | |
| |
Canada (continued) | | | | | | | | |
Teck Resources, Ltd., Class B | | | 14,026 | | | $ | 319,372 | |
TransCanada Corp. | | | 9,742 | | | | 454,013 | |
Turquoise Hill Resources, Ltd.(a) | | | 109,666 | | | | 427,697 | |
Yamana Gold, Inc. | | | 45,719 | | | | 341,978 | |
| | | | | | | | |
| | | | | | | 17,838,512 | |
| | | | | | | | |
| | |
Chile (0.49%) | | | | | | | | |
Sociedad Quimica y Minera de Chile SA, ADR | | | 60,163 | | | | 1,919,200 | |
| | | | | | | | |
| | |
China (0.45%) | | | | | | | | |
China Petroleum & Chemical Corp., Class H | | | 550,358 | | | | 486,260 | |
China Shenhua Energy Co., Ltd., Class H | | | 95,369 | | | | 258,321 | |
CNOOC, Ltd. | | | 250,001 | | | | 413,393 | |
Jiangxi Copper Co., Ltd., Class H | | | 50,082 | | | | 82,685 | |
PetroChina Co., Ltd., Class H | | | 330,045 | | | | 382,281 | |
Zijin Mining Group Co., Ltd., Class H | | | 560,331 | | | | 136,596 | |
| | | | | | | | |
| | | | | | | 1,759,536 | |
| | | | | | | | |
| | |
Colombia (0.29%) | | | | | | | | |
Ecopetrol SA, ADR | | | 30,070 | | | | 1,127,324 | |
| | | | | | | | |
| | |
Denmark (0.08%) | | | | | | | | |
FLSmidth & Co. A/S | | | 6,011 | | | | 321,220 | |
| | | | | | | | |
| | |
Finland (0.13%) | | | | | | | | |
Neste Oil OYJ | | | 9,009 | | | | 184,979 | |
Outotec OYJ | | | 30,692 | | | | 342,986 | |
| | | | | | | | |
| | | | | | | 527,965 | |
| | | | | | | | |
| | |
France (0.59%) | | | | | | | | |
Total SA | | | 32,454 | | | | 2,317,886 | |
| | | | | | | | |
| | |
Germany (1.37%) | | | | | | | | |
Aurubis AG | | | 6,206 | | | | 330,791 | |
K+S AG | | | 124,713 | | | | 4,360,976 | |
Salzgitter AG | | | 7,919 | | | | 335,470 | |
ThyssenKrupp AG(a) | | | 11,855 | | | | 337,492 | |
| | | | | | | | |
| | | | | | | 5,364,729 | |
| | | | | | | | |
| | |
India (0.20%) | | | | | | | | |
Reliance Industries, Ltd., GDR(b) | | | 18,211 | | | | 564,541 | |
Sesa Sterlite, Ltd., ADR | | | 16,933 | | | | 206,752 | |
| | | | | | | | |
| | | | | | | 771,293 | |
| | | | | | | | |
| | |
Israel (0.24%) | | | | | | | | |
Israel Chemicals, Ltd. | | | 55,718 | | | | 493,661 | |
The Israel Corp., Ltd.(a) | | | 785 | | | | 442,576 | |
| | | | | | | | |
| | | | | | | 936,237 | |
| | | | | | | | |
| | |
Italy (0.32%) | | | | | | | | |
Eni SpA, ADR | | | 24,166 | | | | 1,247,932 | |
| | | | | | | | |
18 | April 30, 2014
| | |
ALPS | CoreCommodity Management CompleteCommodities® Strategy Fund |
| Consolidated Statement of Investments | | April 30, 2014 |
| | | | | | | | |
| | | | | | Value | |
| | | Shares | | | (Note 2) | |
| |
Japan (0.70%) | | | | | | | | |
Hitachi Metals, Ltd. | | | 14,000 | | | $ | 189,798 | |
Inpex Corp. | | | 81,500 | | | | 1,186,208 | |
Iseki & Co., Ltd. | | | 20,907 | | | | 53,988 | |
JFE Holdings, Inc. | | | 11,500 | | | | 212,599 | |
Kubota Corp. | | | 18,000 | | | | 231,349 | |
Kurita Water Industries, Ltd. | | | 4,816 | | | | 101,280 | |
Maruichi Steel Tube, Ltd. | | | 6,900 | | | | 174,871 | |
Nihon Trim Co., Ltd. | | | 1,101 | | | | 38,016 | |
Nippon Steel & Sumitomo Metal Corp. | | | 20,342 | | | | 53,325 | |
Sumitomo Forestry Co., Ltd. | | | 15,159 | | | | 154,207 | |
TonenGeneral Sekiyu KK | | | 36,000 | | | | 339,805 | |
| | | | | | | | |
| | | | | | | 2,735,446 | |
| | | | | | | | |
| | |
Jersey (0.06%) | | | | | | | | |
Randgold Resources, Ltd., ADR | | | 2,744 | | | | 219,712 | |
| | | | | | | | |
| | |
Luxembourg (0.26%) | | | | | | | | |
APERAM(a) | | | 13,273 | | | | 345,083 | |
ArcelorMittal | | | 20,626 | | | | 335,173 | |
Subsea 7 SA | | | 7,765 | | | | 155,318 | |
Tenaris SA, ADR | | | 4,150 | | | | 182,808 | |
| | | | | | | | |
| | | | | | | 1,018,382 | |
| | | | | | | | |
| | |
Mexico (0.20%) | | | | | | | | |
Grupo Mexico SAB de CV, Series B | | | 253,034 | | | | 762,037 | |
Industrias Penoles SAB de CV | | | 437 | | | | 10,174 | |
| | | | | | | | |
| | | | | | | 772,211 | |
| | | | | | | | |
| | |
Netherlands (0.75%) | | | | | | | | |
CNH Industrial N.V. | | | 36,636 | | | | 424,612 | |
Nutreco N.V. | | | 12,688 | | | | 588,985 | |
Royal Dutch Shell PLC, ADR | | | 24,453 | | | | 1,925,429 | |
| | | | | | | | |
| | | | | | | 2,939,026 | |
| | | | | | | | |
| | |
Norway (0.49%) | | | | | | | | |
Marine Harvest ASA | | | 4,429 | | | | 54,242 | |
Norsk Hydro ASA | | | 26,688 | | | | 142,817 | |
Yara International ASA | | | 36,441 | | | | 1,720,193 | |
| | | | | | | | |
| | | | | | | 1,917,252 | |
| | | | | | | | |
| | |
Peru (0.06%) | | | | | | | | |
Cia de Minas Buenaventura SAA, ADR | | | 18,729 | | | | 243,477 | |
| | | | | | | | |
| | |
Singapore (0.44%) | | | | | | | | |
Golden Agri-Resources, Ltd. | | | 893,758 | | | | 434,867 | |
Olam International, Ltd. | | | 331,254 | | | | 589,213 | |
Wilmar International, Ltd. | | | 257,061 | | | | 697,142 | |
| | | | | | | | |
| | | | | | | 1,721,222 | |
| | | | | | | | |
| | |
South Africa (0.74%) | | | | | | | | |
Anglo Platinum, Ltd. | | | 2,554 | | | | 121,382 | |
AngloGold Ashanti, Ltd., ADR(a) | | | 39,786 | | | | 720,126 | |
Gold Fields, Ltd., ADR | | | 187,690 | | | | 793,929 | |
| | | | | | | | |
| | | | | | Value | |
| | | Shares | | | (Note 2) | |
| |
South Africa (continued) | | | | | | | | |
Harmony Gold Mining Co., Ltd., ADR(a) | | | 36,130 | | | $ | 118,868 | |
Impala Platinum Holdings, Ltd. | | | 39,295 | | | | 442,234 | |
Kumba Iron Ore, Ltd. | | | 1,186 | | | | 42,178 | |
Sasol, Ltd. | | | 10,287 | | | | 577,189 | |
Sibanye Gold, Ltd., ADR | | | 8,280 | | | | 85,532 | |
| | | | | | | | |
| | | | | | | 2,901,438 | |
| | | | | | | | |
| | |
South Korea (0.13%) | | | | | | | | |
POSCO, ADR | | | 6,977 | | | | 513,507 | |
| | | | | | | | |
| | |
Spain (0.08%) | | | | | | | | |
Acerinox SA | | | 19,169 | | | | 335,085 | |
| | | | | | | | |
| | |
Sweden (0.48%) | | | | | | | | |
Holmen AB, B Shares | | | 11,000 | | | | 387,746 | |
Lundin Petroleum AB(a) | | | 16,470 | | | | 351,832 | |
SSAB AB, A Shares(a) | | | 41,117 | | | | 356,964 | |
Svenska Cellulosa AB SCA, B Shares | | | 28,903 | | | | 809,455 | |
| | | | | | | | |
| | | | | | | 1,905,997 | |
| | | | | | | | |
| | |
Switzerland (1.16%) | | | | | | | | |
Glencore Xstrata PLC | | | 123,495 | | | | 664,098 | |
Noble Corp. PLC | | | 9,174 | | | | 282,651 | |
Syngenta AG | | | 7,096 | | | | 2,810,664 | |
Transocean, Ltd. | | | 8,890 | | | | 382,892 | |
Weatherford International, Ltd.(a) | | | 20,498 | | | | 430,458 | |
| | | | | | | | |
| | | | | | | 4,570,763 | |
| | | | | | | | |
| | |
United Kingdom (1.40%) | | | | | | | | |
Anglo American PLC(a) | | | 27,213 | | | | 726,869 | |
Antofagasta PLC | | | 13,306 | | | | 176,805 | |
BG Group PLC | | | 31,674 | | | | 640,667 | |
BHP Billiton PLC, ADR | | | 10,378 | | | | 671,457 | |
BP PLC, ADR | | | 34,972 | | | | 1,770,283 | |
Kazakhmys PLC(a) | | | 11,431 | | | | 45,953 | |
Lonmin PLC(a) | | | 32,588 | | | | 155,985 | |
Petropavlovsk PLC | | | 10,690 | | | | 12,273 | |
Rio Tinto PLC, ADR | | | 18,883 | | | | 1,025,158 | |
Severn Trent PLC | | | 6,177 | | | | 192,419 | |
United Utilities Group PLC | | | 7,682 | | | | 103,243 | |
| | | | | | | | |
| | | | | | | 5,521,112 | |
| | | | | | | | |
| | |
United States (18.13%) | | | | | | | | |
AGCO Corp. | | | 64,801 | | | | 3,609,416 | |
Alcoa, Inc. | | | 15,849 | | | | 213,486 | |
Allegheny Technologies, Inc. | | | 19,804 | | | | 815,925 | |
Allied Nevada Gold Corp.(a) | | | 95,099 | | | | 322,386 | |
American States Water Co. | | | 1,651 | | | | 50,124 | |
American Vanguard Corp. | | | 4,915 | | | | 87,536 | |
Anadarko Petroleum Corp. | | | 8,727 | | | | 864,148 | |
Apache Corp. | | | 7,118 | | | | 617,842 | |
Aqua America, Inc. | | | 15,151 | | | | 380,139 | |
Archer-Daniels-Midland Co. | | | 56,815 | | | | 2,484,520 | |
Baker Hughes, Inc. | | | 10,613 | | | | 741,849 | |
19 | April 30, 2014
| | |
ALPS | CoreCommodity Management CompleteCommodities® Strategy Fund |
| Consolidated Statement of Investments | | April 30, 2014 |
| | | | | | | | |
| | | | | | Value | |
| | | Shares | | | (Note 2) | |
| |
United States (continued) | | | | | | | | |
Bunge, Ltd. | | | 9,138 | | | $ | 727,842 | |
Calgon Carbon Corp.(a) | | | 2,116 | | | | 42,383 | |
California Water Service Group | | | 7,154 | | | | 160,965 | |
Cameron International Corp.(a) | | | 11,146 | | | | 724,044 | |
Carpenter Technology Corp. | | | 5,307 | | | | 333,280 | |
Century Aluminum Co.(a) | | | 20,809 | | | | 286,124 | |
CF Industries Holdings, Inc. | | | 22,416 | | | | 5,495,731 | |
Chesapeake Energy Corp. | | | 8,295 | | | | 238,481 | |
Chevron Corp. | | | 26,731 | | | | 3,355,275 | |
Chiquita Brands International, Inc.(a) | | | 13,695 | | | | 157,219 | |
Cliffs Natural Resources, Inc. | | | 7,741 | | | | 137,170 | |
Coeur Mining, Inc.(a) | | | 9,712 | | | | 84,106 | |
Commercial Metals Co. | | | 16,778 | | | | 322,138 | |
ConocoPhillips | | | 21,492 | | | | 1,597,071 | |
Continental Resources, Inc.(a) | | | 2,001 | | | | 277,179 | |
CST Brands, Inc. | | | 2,472 | | | | 80,661 | |
Darling International, Inc.(a) | | | 11,542 | | | | 230,955 | |
Deere & Co. | | | 16,693 | | | | 1,558,125 | |
Detour Gold Corp.(a) | | | 2,430 | | | | 24,188 | |
Devon Energy Corp. | | | 15,807 | | | | 1,106,490 | |
Diamond Offshore Drilling, Inc. | | | 3,190 | | | | 174,206 | |
Ensco PLC, Class A | | | 6,012 | | | | 303,305 | |
EOG Resources, Inc. | | | 6,956 | | | | 681,688 | |
Exxon Mobil Corp. | | | 41,397 | | | | 4,239,467 | |
First Majestic Silver Corp.(a) | | | 40,390 | | | | 383,705 | |
FMC Technologies, Inc.(a) | | | 6,853 | | | | 388,565 | |
Freeport-McMoRan Copper & Gold, Inc. | | | 13,813 | | | | 474,753 | |
Halliburton Co. | | | 14,488 | | | | 913,758 | |
Harsco Corp. | | | 13,921 | | | | 333,130 | |
Hecla Mining Co. | | | 32,888 | | | | 100,966 | |
Helmerich & Payne, Inc. | | | 5,481 | | | | 595,511 | |
Hess Corp. | | | 7,488 | | | | 667,630 | |
HollyFrontier Corp. | | | 19,490 | | | | 1,024,979 | |
Hormel Foods Corp. | | | 30,016 | | | | 1,431,463 | |
Ingredion, Inc. | | | 9,619 | | | | 677,659 | |
Intrepid Potash, Inc.(a) | | | 35,134 | | | | 572,684 | |
Joy Global, Inc. | | | 7,301 | | | | 440,834 | |
Kinder Morgan, Inc. | | | 15,180 | | | | 495,779 | |
Lindsay Corp. | | | 2,779 | | | | 244,913 | |
Marathon Oil Corp. | | | 48,949 | | | | 1,769,506 | |
Marathon Petroleum Corp. | | | 16,702 | | | | 1,552,451 | |
Monsanto Co. | | | 44,516 | | | | 4,927,921 | |
The Mosaic Co. | | | 78,846 | | | | 3,945,454 | |
Murphy Oil Corp. | | | 19,277 | | | | 1,222,740 | |
National Oilwell Varco, Inc. | | | 6,572 | | | | 516,099 | |
Newmont Mining Corp. | | | 22,497 | | | | 558,600 | |
Noble Energy, Inc. | | | 9,360 | | | | 671,861 | |
Nucor Corp. | | | 4,675 | | | | 241,931 | |
Occidental Petroleum Corp. | | | 13,899 | | | | 1,330,829 | |
Oceaneering International, Inc. | | | 15,676 | | | | 1,148,737 | |
Oil States International, Inc.(a) | | | 12,909 | | | | 1,253,980 | |
Peabody Energy Corp. | | | 7,370 | | | | 140,104 | |
Phillips 66 | | | 19,781 | | | | 1,646,175 | |
Pilgrim’s Pride Corp.(a) | | | 10,383 | | | | 226,972 | |
Pioneer Natural Resources Co. | | | 2,762 | | | | 533,812 | |
| | | | | | | | |
| | | | | | Value | |
| | | Shares | | | (Note 2) | |
| |
United States (continued) | | | | | | | | |
Plum Creek Timber Co., Inc | | | 6,200 | | | $ | 270,320 | |
Potlatch Corp. | | | 7,200 | | | | 275,256 | |
Rayonier, Inc. | | | 5,350 | | | | 241,285 | |
Reliance Steel & Aluminum Co. | | | 3,658 | | | | 259,060 | |
Royal Gold, Inc. | | | 9,863 | | | | 652,931 | |
Sanderson Farms, Inc. | | | 2,665 | | | | 219,250 | |
Schlumberger, Ltd. | | | 10,293 | | | | 1,045,254 | |
Southern Copper Corp. | | | 15,605 | | | | 470,335 | |
Southwestern Energy Co.(a) | | | 7,599 | | | | 363,840 | |
Spectra Energy Corp. | | | 5,869 | | | | 233,058 | |
Stillwater Mining Co.(a) | | | 20,812 | | | | 328,413 | |
Tesoro Corp. | | | 8,749 | | | | 492,481 | |
Tyson Foods, Inc., Class A | | | 8,524 | | | | 357,752 | |
Valero Energy Corp. | | | 29,018 | | | | 1,658,959 | |
Weyerhaeuser Co. | | | 10,200 | | | | 304,470 | |
Whiting Petroleum Corp.(a) | | | 2,199 | | | | 162,110 | |
The Williams Co., Inc. | | | 15,553 | | | | 655,870 | |
Worthington Industries, Inc. | | | 7,978 | | | | 293,590 | |
| | | | | | | | |
| | | | | | | 71,243,199 | |
| | | | | | | | |
| | |
TOTAL COMMON STOCKS
(Cost $130,732,777) | | | | | | | 137,861,259 | |
| | | | | | | | |
|
MASTER LIMITED PARTNERSHIPS (0.41%) | |
Marshall Islands (0.01%) | | | | | | | | |
Golar LNG Partners LP | | | 183 | | | | 5,664 | |
Navios Maritime Partners LP | | | 314 | | | | 5,944 | |
Teekay LNG Partners LP | | | 240 | | | | 10,274 | |
| | | | | | | | |
| | | | | | | 21,882 | |
| | | | | | | | |
| | |
United States (0.40%) | | | | | | | | |
Access Midstream Partners LP | | | 451 | | | | 26,767 | |
Alliance Resource Partners LP | | | 104 | | | | 9,686 | |
AmeriGas Partners LP | | | 278 | | | | 12,894 | |
Atlas Pipeline Partners LP | | | 365 | | | | 11,819 | |
Atlas Resource Partners LP | | | 217 | | | | 4,607 | |
BreitBurn Energy Partners LP | | | 578 | | | | 11,716 | |
Buckeye Partners LP | | | 566 | | | | 43,135 | |
Calumet Specialty Products Partners LP | | | 263 | | | | 7,709 | |
Crestwood Midstream Partners LP | | | 701 | | | | 16,291 | |
CVR Partners LP | | | 7,942 | | | | 169,482 | |
DCP Midstream Partners LP | | | 407 | | | | 21,774 | |
El Paso Pipeline Partners LP | | | 630 | | | | 20,506 | |
Enbridge Energy Partners LP | | | 1,025 | | | | 30,709 | |
Energy Transfer Partners LP | | | 1,425 | | | | 78,646 | |
EnLink Midstream Partners LP | | | 445 | | | | 13,123 | |
Enterprise Products Partners LP | | | 2,914 | | | | 213,101 | |
EQT Midstream Partners LP | | | 133 | | | | 10,245 | |
EV Energy Partners LP | | | 218 | | | | 7,863 | |
Exterran Partners LP | | | 147 | | | | 4,304 | |
Ferrellgas Partners LP | | | 258 | | | | 6,411 | |
Genesis Energy LP | | | 358 | | | | 19,840 | |
Holly Energy Partners LP | | | 177 | | | | 5,719 | |
Kinder Morgan Energy Partners LP | | | 1,433 | | | | 108,020 | |
20 | April 30, 2014
| | |
ALPS | CoreCommodity Management CompleteCommodities® Strategy Fund |
| Consolidated Statement of Investments | | April 30, 2014 |
| | | | | | | | |
| | | Shares | | | Value (Note 2) | |
| |
United States (continued) | | | | | | | | |
Legacy Reserves LP | | | 235 | | | $ | 5,819 | |
Linn Energy LLC | | | 986 | | | | 28,121 | |
Magellan Midstream Partners LP | | | 1,124 | | | | 83,412 | |
MarkWest Energy Partners LP | | | 852 | | | | 53,966 | |
Martin Midstream Partners LP | | | 106 | | | | 4,491 | |
Memorial Production Partners LP | | | 272 | | | | 6,376 | |
MPLX LP | | | 96 | | | | 5,196 | |
Natural Resource Partners LP | | | 357 | | | | 5,733 | |
NGL Energy Partners LP | | | 255 | | | | 9,861 | |
NuStar Energy LP | | | 321 | | | | 18,734 | |
ONEOK Partners LP | | | 685 | | | | 39,038 | |
Phillips 66 Partners LP | | | 92 | | | | 4,933 | |
Plains All American Pipeline LP | | | 1,678 | | | | 93,632 | |
QR Energy LP | | | 249 | | | | 4,597 | |
Regency Energy Partners LP | | | 1,428 | | | | 38,899 | |
Rentech Nitrogen Partners LP | | | 7,631 | | | | 137,968 | |
Spectra Energy Partners LP | | | 232 | | | | 12,632 | |
Suburban Propane Partners LP | | | 295 | | | | 13,160 | |
Sunoco Logistics Partners LP | | | 346 | | | | 31,472 | |
Targa Resources Partners LP | | | 485 | | | | 28,717 | |
TC PipeLines LP | | | 223 | | | | 11,828 | |
Teekay Offshore Partners LP | | | 301 | | | | 10,297 | |
Tesoro Logistics LP | | | 174 | | | | 11,119 | |
Vanguard Natural Resources LLC | | | 389 | | | | 11,740 | |
Western Gas Partners LP | | | 330 | | | | 22,440 | |
Williams Partners LP | | | 787 | | | | 40,593 | |
| | | | | | | | |
| | | | | | | 1,589,141 | |
| | | | | | | | |
| | |
TOTAL MASTER LIMITED PARTNERSHIPS
(Cost $1,561,770) | | | | | | | 1,611,023 | |
| | | | | | | | |
| | |
WARRANTS (0.00%) | | | | | | | | |
Canada (0.00%) | | | | | | | | |
Kinross Gold Corp., Strike Price $21.30, Expires 9/17/14(a) | | | 19 | | | | 0 | |
| | | | | | | | |
| | |
TOTAL WARRANTS
(Cost $69) | | | | | | | 0 | |
| | | | | | | | |
| | |
| | | Principal Amount | | | Value (Note 2) | |
| |
COMMODITY-LINKED NOTES (1.66%) | |
Bank of America Corp., | | | | | | | | |
Commodity-Linked | | | | | | | | |
Note Linked to the | | | | | | | | |
Merrill Lynch | | | | | | | | |
Commodity Index | | | | | | | | |
eXtra J-Series F3 Total | | | | | | | | |
Return Index, 0.000%, 1/9/15 | | $ | 4,900,000 | | | $ | 6,511,796 | |
| | | | | | | | |
| |
TOTAL COMMODITY-LINKED NOTES
(Cost $4,900,000) | | | | 6,511,796 | |
| | | | | | | | |
| | | | | | | | |
| | | Principal Amount | | | Value (Note 2) | |
| |
GOVERNMENT BONDS (34.77%) | |
U.S. Treasury Bonds (34.77%) | |
United States Treasury Inflation Indexed Bonds | | | | | | | | |
2.000%, 7/15/14 | | $ | 11,519,858 | | | $ | 11,684,557 | |
1.625%, 1/15/15(c) | | | 13,800,240 | | | | 14,138,773 | |
0.500%, 4/15/15(c) | | | 11,834,397 | | | | 12,060,919 | |
1.875%, 7/15/15 | | | 8,749,953 | | | | 9,162,845 | |
2.000%, 1/15/16 | | | 9,166,468 | | | | 9,724,687 | |
0.125%, 4/15/16(c) | | | 21,802,365 | | | | 22,437,708 | |
2.500%, 7/15/16 | | | 2,150,477 | | | | 2,346,792 | |
2.375%, 1/15/17(c) | | | 10,185,613 | | | | 11,169,563 | |
0.125%, 4/15/17(c) | | | 14,986,620 | | | | 15,464,903 | |
2.625%, 7/15/17(c) | | | 14,441,543 | | | | 16,201,606 | |
1.625%, 1/15/18 | | | 11,205,500 | | | | 12,201,736 | |
| | | | | | | | |
| | | | | | | 136,594,089 | |
| | | | | | | | |
| |
TOTAL GOVERNMENT BONDS
(Cost $137,068,782) | | | | 136,594,089 | |
| | | | | | | | |
| | | | | | | | | | | | | | | | |
| | | | |
| | | Expiration Date | | | Exercise Price | | | Number of
Contracts | | | Value | |
| |
PURCHASED OPTIONS (1.21%) | |
Purchased Call Options (1.03%) | |
S&P 500® Index Future: | | | | | | | | | |
| | | 6/20/14 | | | $ | 1,750.00 | | | | 120 | | | $ | 4,059,000 | |
| | | | | | | | | | | | | | | | |
| |
Total Purchased Call Options
(Cost $1,980,000) | | | | 4,059,000 | |
| | | | | | | | | | | | | | | | |
|
Purchased Put Options (0.18%) | |
SPDR® S&P 500® ETF Trust: | | | | | | | | | |
| | | 9/20/14 | | | | 170.00 | | | | 600 | | | | 126,600 | |
| | | 9/30/14 | | | | 170.00 | | | | 500 | | | | 116,000 | |
| | | | | | | | | | | | | | | | |
| | | | | | | | | | | | | | | 242,600 | |
| | | | | | | | | | | | | | | | |
E-mini S&P 500® Future: | | | | | | | | | |
| | | 9/19/14 | | | | 1,700.00 | | | | 450 | | | | 470,250 | |
| | | | | | | | | | | | | | | | |
| |
Total Purchased Put Options
(Cost $1,693,294) | | | | 712,850 | |
| | | | | | | | | | | | | | | | |
| |
TOTAL PURCHASED OPTIONS
(Cost $3,673,294) | | | | 4,771,850 | |
| | | | | | | | | | | | | | | | |
| | | | | | | | | | | | |
| | | 7-Day Yield | | | Shares | | | Value (Note 2) | |
| |
SHORT TERM INVESTMENTS (23.30%) | |
Money Market Fund (23.30%) | |
Dreyfus Treasury Prime | | | | | |
Cash Management | | | | | | | | | | | | |
Fund, Institutional Shares | | | 0.00004 | % | | | 91,520,155 | | | $ | 91,520,155 | |
| | | | | | | | | | | | |
| |
TOTAL SHORT TERM INVESTMENTS
(Cost $91,520,155) | | | | 91,520,155 | |
| | | | | | | | | | | | |
21 | April 30, 2014
| | |
ALPS | CoreCommodity Management CompleteCommodities® Strategy Fund |
| Consolidated Statement of Investments | | April 30, 2014 |
| | | | | | | | |
| | | | | | | Value (Note 2) | |
| |
TOTAL INVESTMENTS (96.44%)
(Cost $369,456,847) | | $ | 378,870,172 | |
| |
Other Assets In Excess Of Liabilities
(3.56%)(d) | | | 13,980,334 | |
NET ASSETS - 100.00% | | $ | 392,850,506 | |
| | | | | | | | | |
| | | | | | | | | |
| (a) | Non-Income Producing Security. |
| (b) | Security exempt from registration under rule 144A of the securities act of 1933. This security may be resold in transactions exempt from registration, normally to qualified institutional buyers. At period end, the market value of those securities was $564,541, representing 0.14% of the Fund’s net assets. |
| (c) | Security, or portion of security, is being held as collateral for total return swap contracts, futures contracts and written options aggregating a total market value of $72,821,787. |
| (d) | Includes cash which is being held as collateral for total return swap contracts, future contracts and written options in the amount of $6,943,066. |
Common Abbreviations:
| A/S | - Aktieselskab is the Danish equivalent for the term Stock Company. |
| AB | - Aktiebolag is the Swedish equivalent of the term corporation. |
| ADR | - American Depositary Receipt. |
| AG | - Aktiengesellschaft is a German term that refers to a corporation that is limited by shares, i.e., owned by shareholders. |
| ASA | - Allmennaksjeselskap is the Norwegian term for public limited company. |
| ETF | - Exchange Traded Fund. |
| GDR | - Global Depositary Receipt. |
| KK | - Kabushiki Kaisha is the Japanese equivalent for the term Stock Company. |
| LLC- | Limited Liability Company. |
| N.V. | - Naamloze vennootschap is the Dutch term for a public limited liability corporation. |
| OYJ | - Osakeyhtio is the Finnish equivalent of a public limited company. |
| SA | - Generally designated corporations in various countries, mostly those employing the civil law. |
| SAA | - Sociedad Anonima Abierta is the Peruvian term used for companies with 20 or more shareholders. |
| SAB | de CV - A variable capital company. |
| SCA | - Societe en commandite pe actiuni is the Romanian term for limited liability partnership. |
| SPDR | - Standard & Poor’s Depository Receipt. |
For Fund compliance purposes, the Fund’s industry and geographical classifications refer to any one or more of the industry sub-classifications used by one or more widely recognized market indexes or ratings group indexes, and/or as defined by Fund management. This definition may not apply for purposes of this report, which may combine sub-classifications for reporting ease. Industries and regions are shown as a percent of net assets.
See Notes to Financial Statements.
22 | April 30, 2014
| | |
ALPS | CoreCommodity Management CompleteCommodities® Strategy Fund |
| Consolidated Statement of Investments | | April 30, 2014 |
| | | | | | | | | | | | | | | | |
SCHEDULE OF WRITTEN OPTIONS | | Expiration Date | | | Exercise Price | | | Contracts | | | Value | |
| |
Written Call Options | | | | | | | | | | | | | | | | |
Natural Gas Option | | | 5/27/14 | | | $ | 4.60 | | | | (50) | | | $ | (139,000) | |
| | | | | | | | | | | | | | | | |
| | | | |
TOTAL WRITTEN CALL OPTIONS | | | | | | | | | | | | | | | | |
(Premiums received $77,364) | | | | | | | | | | | | | | | (139,000) | |
| | | | | | | | | | | | | | | | |
| | | | |
Written Put Options | | | | | | | | | | | | | | | | |
E-mini S&P 500® Future
| | | 9/19/14 | | | | 1,800.00 | | | | (150) | | | | (298,500) | |
| | | | | | | | | | | | | | | | |
| | | | |
TOTAL WRITTEN PUT OPTIONS | | | | | | | | | | | | | | | | |
(Premiums received $425,264) | | | | | | | | | | | | | | | (298,500) | |
| | | | | | | | | | | | | | | | |
| | | | |
TOTAL WRITTEN OPTIONS | | | | | | | | | | | | | | | | |
(Premiums received $502,628) | | | | | | | | | | | | | | $ | (437,500) | |
| | | | | | | | | | | | | | | | |
| | | | |
FUTURES CONTRACTS | | | | | | | | | | | | | | | | |
| | | | | | | | | | | | | | |
| Description | | Position | | Contracts | | Expiration Date | | Value (Note 2) | | | Unrealized Appreciation | |
| |
Brent Crude Future | | Long | | 120 | | 5/16/14 | | $ | 12,968,400 | | | $ | 230,614 | |
Gold 100 Oz. Future | | Long | | 2 | | 6/27/14 | | | 259,180 | | | | 86 | |
Gold 100 Oz. Future | | Long | | 70 | | 8/28/14 | | | 9,072,000 | | | | 52,752 | |
Live Cattle Future | | Long | | 20 | | 7/01/14 | | | 1,097,600 | | | | 18,296 | |
WTI Crude Future | | Short | | (134) | | 5/20/14 | | | (13,365,160) | | | | 369,490 | |
| | | | | | | | | | |
| | | | | | | | $ | 10,032,020 | | | $ | 671,238 | |
| | | | | | | | | | |
| | | | | |
| Description | | Position | | Contracts | | Expiration Date | | Value (Note 2) | | | Unrealized Depreciation | |
| |
E-mini S&P 500® Future | | Short | | (668) | | 6/23/14 | | $ | (62,721,860) | | | $ | (698,658) | |
| | | | | | | | | | |
| | | | | | | | $ | (62,721,860) | | | $ | (698,658) | |
| | | | | | | | | | |
See Notes to Financial Statements.
23 | April 30, 2014
| | |
ALPS | CoreCommodity Management CompleteCommodities® Strategy Fund |
| Consolidated Statement of Investments | | April 30, 2014 |
TOTAL RETURN SWAP CONTRACTS(a)
| | | | | | | | | | | | | | | | |
| Swap Counterparty | | Reference Obligation | | Notional Dollars | | | Rate Paid by the
Fund | | Termination Date | | | Unrealized
Appreciation | |
| |
Bank of America - Merrill Lynch | | CRB 3 Month Forward Total Return Index | | $ | 50,267,632 | | | 0.48% | | | 6/30/14 | | | $ | 983,998 | |
Bank of America - Merrill Lynch | | LME Aluminum Future | | | (466,000) | | | 0.00% | | | 7/14/14 | | | | 17,438 | |
Bank of America - Merrill Lynch | | LME Copper Future | | | (1,680,875) | | | 0.00% | | | 6/25/14 | | | | 18,533 | |
Bank of America - Merrill Lynch | | LME Zinc Future | | | 988,375 | | | 0.00% | | | 6/25/14 | | | | 33,205 | |
Bank of America - Merrill Lynch | | LME Zinc Future | | | (1,021,875) | | | 0.00% | | | 6/25/14 | | | | 295 | |
Bank of America - Merrill Lynch | | ML eXtra Coffee GA6 Index | | | 4,480,811 | | | 0.10% | | | 6/30/14 | | | | 616,346 | |
Bank of America - Merrill Lynch | | MLCS Copper J-F3 Index | | | (5,047,818) | | | 0.10% | | | 6/30/14 | | | | 4,861 | |
Bank of America - Merrill Lynch | | MLCS Silver J-F3 Index | | | (639,102) | | | 0.10% | | | 6/30/14 | | | | 19,687 | |
Bank of America - Merrill Lynch | | Natural Gas Future | | | 2,616,250 | | | 0.00% | | | 5/31/15 | | | | 105,950 | |
Societe Generale | | CRB 3 Month Forward Total Return Index | | | 102,753,424 | | | 0.35% | | | 11/28/14 | | | | 2,011,386 | |
UBS | | CRB 3 Month Forward Total Return Index | | | 69,408,030 | | | 0.40% | | | 11/28/14 | | | | 1,211,083 | |
| | | | | | | | | | | | | | | | |
| | | | | | | | | | | | | | $ | 5,022,782 | |
| | | | | | | | | | | | | | | | |
| | | | | |
| Swap Counterparty | | Reference Obligation | | Notional Dollars | | | Rate Paid
by the
Fund | | Termination
Date | | | Unrealized
Depreciation | |
| |
Bank of America - Merrill Lynch | | LME Aluminum Future | | $ | 449,375 | | | 0.00% | | | 7/14/14 | | | $ | (813) | |
Bank of America - Merrill Lynch | | LME Copper Future | | | 1,667,563 | | | 0.00% | | | 6/25/14 | | | | (5,220) | |
Bank of America - Merrill Lynch | | ML Aluminum GA6 Index | | | 4,672,408 | | | 0.10% | | | 6/30/14 | | | | (4,286) | |
Bank of America - Merrill Lynch | | ML eXtra Copper GA6 Index | | | 5,068,018 | | | 0.10% | | | 6/30/14 | | | | (18,246) | |
Bank of America - Merrill Lynch | | ML eXtra Silver GA6 Index | | | 641,317 | | | 0.10% | | | 6/30/14 | | | | (19,621) | |
Bank of America - Merrill Lynch | | MLCS Coffee J-F3 Index | | | (4,477,411) | | | 0.10% | | | 6/30/14 | | | | (632,219) | |
Bank of America - Merrill Lynch | | MLCX Aluminum J-F3 Index | | | (4,602,536) | | | 0.10% | | | 6/30/14 | | | | (2,534) | |
Bank of America - Merrill Lynch | | Natural Gas Future | | | (2,977,000) | | | 0.00% | | | 7/31/14 | | | | (170,949) | |
| | | | | | | | | | | | | | | | |
| | | | | | | | | | | | | | $ | (853,888) | |
| | | | | | | | | | | | | | | | |
| (a) | The Fund receives payments based on any positive return of the Reference Obligation less the rate paid by the Fund. The Fund makes payments on any negative return of such Reference Obligation plus the rate paid by the Fund. |
See Notes to Financial Statements.
24 | April 30, 2014
| | |
ALPS | CoreCommodity Management CompleteCommodities® Strategy Fund |
| Consolidated Statement of Assets and Liabilities | | April 30, 2014 |
| | | | |
ASSETS | | | | |
Investments, at value | | $ | 378,870,172 | |
Foreign currency, at value (Cost $139,620) | | | 140,928 | |
Unrealized appreciation on total return swap contracts | | | 5,022,782 | |
Receivable for investments sold | | | 6,951,257 | |
Receivable for shares sold | | | 8,048,400 | |
Receivable for variation margin | | | 671,238 | |
Deposit with broker for written options | | | 535,421 | |
Deposit with broker for futures contracts | | | 3,226,720 | |
Deposit with broker for total return swap contracts | | | 3,180,925 | |
Dividends and interest receivable | | | 839,448 | |
Prepaid expenses and other assets | | | 16,467 | |
Total Assets | | | 407,503,758 | |
LIABILITIES | | | | |
Written options, at value (premiums received $502,628) | | | 437,500 | |
Payable for investments purchased | | | 11,943,285 | |
Payable for variation margin | | | 698,658 | |
Payable due to broker for total return swap contracts | | | 74,411 | |
Payable for shares redeemed | | | 182,624 | |
Unrealized depreciation on total return swap contracts | | | 853,888 | |
Investment advisory fees payable | | | 256,503 | |
Administration and transfer agency fees payable | | | 61,428 | |
Distribution and services fees payable | | | 50,101 | |
Trustees’ fees and expenses payable | | | 4,944 | |
Professional fees payable | | | 43,309 | |
Accrued expenses and other liabilities | | | 46,601 | |
Total Liabilities | | | 14,653,252 | |
| NET ASSETS | | $ | 392,850,506 | |
| | | | | |
NET ASSETS CONSIST OF | | | | |
Paid-in capital | | $ | 387,039,972 | |
Accumulated net investment income | | | 1,681,334 | |
Accumulated net realized loss on investments, written options, futures contracts, total return swap contracts, securities sold short and foreign currency transactions | | | (9,488,560) | |
Net unrealized appreciation on investments, written options, futures contracts, total return swap contracts and translation of assets and liabilities denominated in foreign currencies | | | 13,617,760 | |
| NET ASSETS | | $ | 392,850,506 | |
| | | | | |
| INVESTMENTS, AT COST | | $ | 369,456,847 | |
See Notes to Financial Statements.
25 | April 30, 2014
| | |
ALPS | CoreCommodity Management CompleteCommodities® Strategy Fund |
| Consolidated Statement of Assets and Liabilities (continued) | | April 30, 2014 |
| | | | |
PRICING OF SHARES | | | | |
Class A: | | | | |
Net Asset Value, offering and redemption price per share(a) | | $ | 10.87 | |
Net Assets | | $ | 112,562,040 | |
Shares of beneficial interest outstanding (unlimited number of shares, no par value common stock authorized) | | | 10,356,905 | |
Maximum offering price per share ((NAV/0.9450), based on maximum sales charge of 5.50% of the offering price) | | $ | 11.50 | |
Class C: | | | | |
Net Asset Value, offering and redemption price per share(a) | | $ | 10.71 | |
Net Assets | | $ | 13,995,577 | |
Shares of beneficial interest outstanding (unlimited number of shares, no par value common stock authorized) | | | 1,307,151 | |
Class I: | | | | |
Net Asset Value, offering and redemption price per share | | $ | 10.87 | |
Net Assets | | $ | 266,292,889 | |
Shares of beneficial interest outstanding (unlimited number of shares, no par value common stock authorized) | | | 24,509,117 | |
| (a) | Redemption price per share may be reduced for any applicable contingent deferred sales charge. For a description of a possible sales charge, please see the Fund’s Prospectus. |
See Notes to Financial Statements.
26 | April 30, 2014
| | |
ALPS | CoreCommodity Management CompleteCommodities® Strategy Fund |
| Consolidated Statement of Operations | | For the Year Ended April 30, 2014 |
| | | | |
INVESTMENT INCOME | | | | |
Dividends | | $ | 3,455,474 | |
Foreign taxes withheld on dividends | | | (243,705) | |
Interest and other income, net of premium amortization | | | (377,513) | |
Total Investment Income | | | 2,834,256 | |
| |
| EXPENSES | | | | |
Investment advisory fees | | | 2,743,197 | |
Administrative and transfer agency fees | | | 530,922 | |
Distribution and service fees | | | | |
Class A | | | 402,049 | |
Class C | | | 171,101 | |
Professional fees | | | 66,217 | |
Networking fees | | | | |
Class I | | | 125,535 | |
Reports to shareholders and printing fees | | | 54,238 | |
State registration fees | | | 61,840 | |
SEC registration fees | | | 6,306 | |
Insurance fees | | | 6,464 | |
Custody fees | | | 56,388 | |
Trustees’ fees and expenses | | | 14,590 | |
Miscellaneous expenses | | | 22,599 | |
Total Expenses | | | 4,261,446 | |
Less fees waived/reimbursed by investment advisor (Note 8) | | | | |
Class A | | | (55,147) | |
Class C | | | (9,066) | |
Class I | | | (30,311) | |
Net Expenses | | | 4,166,922 | |
Net Investment Loss | | | (1,332,666) | |
Net realized loss on investments | | | (4,033,609) | |
Net realized gain on written options | | | 240,680 | |
Net realized loss on futures contracts | | | (7,044,112) | |
Net realized gain on total return swap contracts | | | 6,067,345 | |
Net realized loss on securities sold short | | | (8,487) | |
Net realized gain on foreign currency transactions | | | 55,809 | |
Net change in unrealized appreciation on investments | | | 9,783,086 | |
Net change in unrealized appreciation on written options | | | 65,128 | |
Net change in unrealized appreciation on futures contracts | | | 1,887,507 | |
Net change in unrealized appreciation on total return swap contracts | | | 9,186,316 | |
Net change in unrealized depreciation on translation of assets and liabilities denominated in foreign currencies | | | (3,210) | |
| NET REALIZED AND UNREALIZED GAIN ON INVESTMENTS | | | 16,196,453 | |
| NET INCREASE IN NET ASSETS RESULTING FROM OPERATIONS | | $ | 14,863,787 | |
| | | | | |
See Notes to Financial Statements.
27 | April 30, 2014
| | |
| ALPS | CoreCommodity Management CompleteCommodities® Strategy Fund |
| Consolidated Statements of Changes in Net Assets |
| | | | | | | | |
| | | For the Year Ended April 30, 2014 | | | For the Year Ended April 30, 2013 | |
OPERATIONS | | | | | | | | |
Net investment loss | | $ | (1,332,666) | | | $ | (498,594) | |
Net realized loss on investments, written options, futures contracts, total return swap contracts, securities sold short and foreign currency transactions | | | (4,722,374) | | | | (9,335,982) | |
Net change in unrealized appreciation/(depreciation) on investments, written options, futures contracts, total return swap contracts and translation of assets and liabilities denominated in foreign currencies | | | 20,918,827 | | | | (4,642,501) | |
Net Increase/(Decrease) in Net Assets Resulting from Operations | | | 14,863,787 | | | | (14,477,077) | |
| | |
| DISTRIBUTIONS | | | | | | | | |
Dividends to shareholders from tax return of capital | | | | | | | | |
Class A | | | – | | | | (532,988) | |
Class C | | | – | | | | (84,918) | |
Class I | | | – | | | | (699,604) | |
Net Decrease in Net Assets from Distributions | | | – | | | | (1,317,510) | |
| | |
| BENEFICIAL INTEREST TRANSACTIONS (NOTE 6) | | | | | | | | |
Shares sold | | | | | | | | |
Class A | | | 78,069,155 | | | | 90,054,418 | |
Class C | | | 5,689,512 | | | | 8,548,230 | |
Class I | | | 234,370,555 | | | | 157,098,320 | |
Dividends reinvested | | | | | | | | |
Class A | | | – | | | | 395,824 | |
Class C | | | – | | | | 51,810 | |
Class I | | | – | | | | 542,393 | |
Shares redeemed, net of redemption fees | | | | | | | | |
Class A | | | (73,729,663) | | | | (66,182,451) | |
Class C | | | (11,437,221) | | | | (5,831,034) | |
Class I | | | (165,799,406) | | | | (45,457,181) | |
Net Increase in Net Assets Derived from Beneficial Interest Transactions | | | 67,162,932 | | | | 139,220,329 | |
| | |
Net increase in net assets | | | 82,026,719 | | | | 123,425,742 | |
| | |
| NET ASSETS | | | | | | | | |
Beginning of year | | | 310,823,787 | | | | 187,398,045 | |
End of year * | | $ | 392,850,506 | | | $ | 310,823,787 | |
| | | | | | | | | |
*Including accumulated net investment income of: | | $ | 1,681,334 | | | $ | 1,091 | |
See Notes to Financial Statements.
28 | April 30, 2014
| | |
ALPS | CoreCommodity Management CompleteCommodities® Strategy Fund – Class A |
| Consolidated Financial Highlights |
Selected data for a share of beneficial interest outstanding throughout the periods indicated:
| | | | | | | | |
| | | For the Year Ended April 30, 2014 (a) | | For the Year Ended April 30, 2013 (a)(b) | | For the Year Ended April 30, 2012 (a) | | For the Period June 29, 2010
(Inception) to
April 30, 2011 (a) |
Net asset value, beginning of period | | $10.40 | | $11.18 | | $14.28 | | $10.00 |
|
| INCOME/(LOSS) FROM INVESTMENT OPERATIONS: |
Net investment income/(loss)(c) | | (0.06) | | (0.03) | | 0.04 | | 0.12 |
Net realized and unrealized
gain/(loss) | | 0.53 | | (0.69) | | (2.29) | | 4.87 |
Total from investment operations | | 0.47 | | (0.72) | | (2.25) | | 4.99 |
| | | | |
| DISTRIBUTIONS: | | | | | | | | |
From net investment income | | – | | – | | (0.83) | | (0.71) |
From net realized gains | | – | | – | | (0.02) | | – |
Tax return of capital | | – | | (0.06) | | – | | – |
Total distributions | | – | | (0.06) | | (0.85) | | (0.71) |
| | | | |
REDEMPTION FEES ADDED TO PAID-IN CAPITAL (NOTE 6) | | 0.00(d) | | 0.00(d) | | 0.00(d) | | 0.00(d) |
Net increase/(decrease) in net asset value | | 0.47 | | (0.78) | | (3.10) | | 4.28 |
Net asset value, end of year | | $10.87 | | $10.40 | | $11.18 | | $14.28 |
| |
TOTAL RETURN(e) | | 4.52% | | (6.44)% | | (15.77)% | | 51.41% |
|
| RATIOS/SUPPLEMENTAL DATA: |
Net assets, end of year (000s) | | $112,562 | | $104,234 | | $85,805 | | $37,060 |
Ratio of expenses to average net assets excluding fee waivers and reimbursements | | 1.50% | | 1.50% | | 1.64% | | 2.59%(f) |
Ratio of expenses to average net assets including fee waivers and reimbursements | | 1.45% | | 1.40%(g) | | 1.45% | | 1.45%(f) |
Ratio of net investment income/(loss) to average net assets | | (0.60)% | | (0.30)% | | 0.36% | | 1.08%(f) |
Portfolio turnover rate(h) | | 28% | | 117% | | 264% | | 59% |
| (a) | Per share amounts and ratios to average net assets include income and expenses of the CoreCommodity Management Cayman Commodity Fund Ltd. (wholly-owned subsidiary). |
| (b) | Prior to April 30, 2013 the ALPS | CoreCommodity Management CompleteCommodities® Strategy Fund was known as the Jefferies Asset Management Commodity Strategy Allocation Fund. |
| (c) | Calculated using the average shares method. |
| (d) | Less than $0.005 per share. |
| (e) | Total returns are for the period indicated and have not been annualized. Total returns would have been lower had certain expenses not been waived during the period. Returns shown do not reflect the deduction of taxes that a shareholder would pay on Fund distributions or the redemption of Fund shares. Returns shown exclude any applicable sales charges. |
| (g) | According to the Fund’s shareholder services plan with respect to the Fund’s Class A shares, any amount of such payment not paid during the Fund’s fiscal year for such service activities shall be reimbursed to the Fund as soon as practical after the end of the fiscal year. Fees were reimbursed to the Fund during the year ended April 30, 2013, for the prior fiscal year in the amount of 0.05% of average net assets of Class A shares. |
| (h) | Portfolio turnover rate for periods less than one full year have not been annualized. |
See Notes to Financial Statements.
29 | April 30, 2014
| | |
ALPS | CoreCommodity Management CompleteCommodities® Strategy Fund – Class C |
| Consolidated Financial Highlights | | |
Selected data for a share of beneficial interest outstanding throughout the periods indicated:
| | | | | | | | |
| | | For the Year Ended
April 30, 2014 (a) | | For the Year Ended
April 30, 2013 (a)(b) | | For the Year Ended
April 30, 2012 (a) | | For the Period
June 29, 2010
(Inception) to
April 30, 2011 (a) |
Net asset value, beginning of period | | $10.31 | | $11.15 | | $14.19 | | $10.00 |
|
INCOME/(LOSS) FROM INVESTMENT OPERATIONS: |
Net investment income/(loss)(c) | | (0.12) | | (0.10) | | (0.05) | | 0.08 |
Net realized and unrealized gain/(loss) | | 0.52 | | (0.69) | | (2.26) | | 4.87 |
Total from investment operations | | 0.40 | | (0.79) | | (2.31) | | 4.95 |
| | | | |
| DISTRIBUTIONS: | | | | | | | | |
From net investment income | | – | | – | | (0.71) | | (0.76) |
From net realized gains | | – | | – | | (0.02) | | – |
Tax return of capital | | – | | (0.05) | | – | | – |
Total distributions | | – | | (0.05) | | (0.73) | | (0.76) |
| | | | |
REDEMPTION FEES ADDED TO PAID-IN CAPITAL (NOTE 6) | | 0.00(d) | | 0.00(d) | | 0.00(d) | | 0.00(d) |
Net increase/(decrease) in net asset value | | 0.40 | | (0.84) | | (3.04) | | 4.19 |
Net asset value, end of year | | $10.71 | | $10.31 | | $11.15 | | $14.19 |
| |
| TOTAL RETURN(e) | | 3.88% | | (7.10)% | | (16.26)% | | 50.90% |
|
| RATIOS/SUPPLEMENTAL DATA: |
Net assets, end of year (000s) | | $13,996 | | $19,444 | | $18,095 | | $7,352 |
Ratio of expenses to average net assets excluding fee waivers and reimbursements | | 2.10% | | 2.14% | | 2.24% | | 4.00%(f) |
Ratio of expenses to average net assets including fee waivers and reimbursements | | 2.05% | | 2.05% | | 2.05% | | 2.05%(f) |
Ratio of net investment income/(loss) to average net assets | | (1.16)% | | (0.92)% | | (0.42)% | | 0.72%(f) |
Portfolio turnover rate(g) | | 28% | | 117% | | 264% | | 59% |
| (a) | Per share amounts and ratios to average net assets include income and expenses of the CoreCommodity Management Cayman Commodity Fund Ltd. (wholly-owned subsidiary). |
| (b) | Prior to April 30, 2013 the ALPS | CoreCommodity Management CompleteCommodities® Strategy Fund was known as the Jefferies Asset Management Commodity Strategy Allocation Fund. |
| (c) | Calculated using the average shares method. |
| (d) | Less than $0.005 per share. |
| (e) | Total returns are for the period indicated and have not been annualized. Total returns would have been lower had certain expenses not been waived during the period. Returns shown do not reflect the deduction of taxes that a shareholder would pay on Fund distributions or the redemption of Fund shares. Returns shown exclude any applicable sales charges. |
| (g) | Portfolio turnover rate for periods less than one full year have not been annualized. |
See Notes to Financial Statements.
30 | April 30, 2014
| | |
ALPS | CoreCommodity Management CompleteCommodities® Strategy Fund – Class I |
| Consolidated Financial Highlights | | |
Selected data for a share of beneficial interest outstanding throughout the periods indicated:
| | | | | | | | |
| | | For the Year Ended
April 30, 2014 (a) | | For the Year Ended
April 30, 2013 (a)(b) | | For the Year Ended
April 30, 2012 (a) | | For the Period
June 29, 2010
(Inception) to
April 30, 2011 (a) |
Net asset value, beginning of period | | $10.37 | | $11.12 | | $14.25 | | $10.00 |
|
INCOME/(LOSS) FROM INVESTMENT OPERATIONS: |
Net investment income/(loss)(c) | | (0.03) | | (0.00)(d) | | 0.10 | | 0.13 |
Net realized and unrealized
gain/(loss) | | 0.53 | | (0.69) | | (2.32) | | 4.89 |
Total from investment operations | | 0.50 | | (0.69) | | (2.22) | | 5.02 |
| | | | |
| DISTRIBUTIONS: | | | | | | | | |
From net investment income | | – | | – | | (0.89) | | (0.77) |
From net realized gains | | – | | – | | (0.02) | | – |
Tax return of capital | | – | | (0.06) | | – | | – |
Total distributions | | – | | (0.06) | | (0.91) | | (0.77) |
| | | | |
REDEMPTION FEES ADDED TO PAID-IN CAPITAL (NOTE 6) | | 0.00(d) | | 0.00(d) | | 0.00(d) | | 0.00(d) |
Net increase/(decrease) in net asset value | | 0.50 | | (0.75) | | (3.13) | | 4.25 |
Net asset value, end of year | | $10.87 | | $10.37 | | $11.12 | | $14.25 |
| |
| TOTAL RETURN(e) | | 4.82% | | (6.16)% | | (15.53)% | | 51.74% |
|
| RATIOS/SUPPLEMENTAL DATA: |
Net assets, end of year (000s) | | $266,293 | | $187,146 | | $83,497 | | $73,630 |
Ratio of expenses to average net assets excluding fee waivers and reimbursements | | 1.16% | | 1.17% | | 1.33% | | 2.04%(f) |
Ratio of expenses to average net assets including fee waivers and reimbursements | | 1.15% | | 1.15% | | 1.15% | | 1.15%(f) |
Ratio of net investment income/(loss) to average net assets | | (0.26)% | | (0.02)% | | 0.82% | | 1.19%(f) |
Portfolio turnover rate(g) | | 28% | | 117% | | 264% | | 59% |
| (a) | Per share amounts and ratios to average net assets include income and expenses of the CoreCommodity Management Cayman Commodity Fund Ltd. (wholly-owned subsidiary). |
| (b) | Prior to April 30, 2013 the ALPS | CoreCommodity Management CompleteCommodities® Strategy Fund was known as the Jefferies Asset Management Commodity Strategy Allocation Fund. |
| (c) | Calculated using the average shares method. |
| (d) | Less than $0.005 per share. |
| (e) | Total returns are for the period indicated and have not been annualized. Total returns would have been lower had certain expenses not been waived during the period. Returns shown do not reflect the deduction of taxes that a shareholder would pay on Fund distributions or the redemption of Fund shares. |
| (g) | Portfolio turnover rate for periods less than one full year have not been annualized. |
See Notes to Financial Statements.
31 | April 30, 2014
| | |
| ALPS | Kotak India Growth Fund |
| Management Commentary | | April 30, 2014 (Unaudited) |
Performance
ALPS | Kotak India Growth Fund (the “Fund”) was launched on February 14, 2011. During the 12-month period ended April 30, 2014 (hereinafter referred to as “the period”), the Fund’s Class A Shares, INDAX, delivered a net return of 5.49% at Net Asset Value (Class A delivered a net return of (0.30%) at MOP, Class C, INFCX, was 3.60% with CDSC, Class I, INDIX, was 5.70%). The Fund’s performance was above that of the CNX 500 Index’s (“CNX 500”) 2.54%, without taking into account sales charges for Class A and C Shares.
The period saw the Indian equity market bottoming at the end of August 2013 post the worries of tapering in US which saw dismal performance across EM (Emerging Market) equity markets. Post that, the Indian equity market rallied to record high on account of optimism around the general election, improving macroeconomic data, resilient earning result, and strong FII (Foreign Institutional Investors) flow into the equity market. Thus, in Indian Rupee (INR) terms, NIFTY1, CNXMCAP2, and CNX500 Index returned 12.92%, 12.34%, and 13.23% respectively in the period. On the currency side, the rupee depreciated by 11.28% to INR60.34/USD (U.S. Dollar) in the period, having recovered from as high as INR68/USD at the end of August 2013. The improvement in the rupee is due to strong FII inflow along with some measures announced by the new Reserve Bank of India (RBI) governor, Mr. Raghuram Rajan, who assumed his office in early September 2013. The investment environment during the period was impacted by the following, with August 2013 and September 2013 marking the worst and best monthly change respectively (CNX 500 returned -12.47% in August 2013 and 11.54% September 2013).
| | » | The global equity market turned volatile in the period with the first half dominated by the fear of tapering of Quantitative Easing (QE) in US which started at the end of May 2013. Global asset classes experienced big volatility as the market weighed on the potential impact of lower liquidity and higher interest rate in US. EM asset classes bore most of the brunt with global investors, fearing that the era of continued inflow to EM may be over or reversed, scrambling to withdraw their capital from EM. In the period, EM underperformed DM (Developed Markets) with the MSCI EM Index3 returning -4.25% as against 14.33% gain in MSCI World Index4 (all in USD term). In its December 2013 Federal Open Market Committee (FOMC) meeting, the Fed started its tapering program by reducing its asset purchase program by USD10 billion (bn)/month each in its December, January, March, and April FOMC meeting. The period also saw a change in the helm of the Fed with Janet Yellen replacing Ben Bernanke whose term expired in January 2014. There was also renewed concern in China post its first onshore bond default in early 2014 and as its macroeconomic data deteriorated sharply. The period also saw escalation of conflict in Syria and Ukraine/Russia which impacted energy prices globally. |
| | » | During the period, to curb currency volatility and combat high inflation, the Reserve Bank of India (RBI) changed its course from an easing mode to a tightening mode by |
| | raising the policy rate by 25bps (basis points) each in its September 2013, October 2013, and January 2014 policy meeting, bringing the repo and reverse repo rate to 8% and 7% respectively. The hike in the policy rate at the beginning of the year was on the back of sticky core inflation which has since come down. As a result, RBI has refrained from raising the policy rate in its subsequent policy meeting. We think RBI will likely maintain the status quo for now until they get a clearer picture on the impact of El-Nino on monsoon season and its impact on inflation. |
| | » | For the third quarter of the fiscal year (ending January 31, 2014), real Gross Domestic Product (GDP) number came in at 4.7% (vs 4.8% in the second quarter), lower than consensus expectation of 4.9%. Agriculture and service growth remained weak while industry sector growth turned negative. Within the industry, mining and manufacturing experienced de-growth while electricity continued to be the bright spot. We expect GDP growth to remain muted in the fiscal year ending April 30, 2015 as lower expenditure growth (especially plan expenditure) will impact overall GDP growth in the next six months along with further moderation in services growth. From here on, it is therefore necessary for the real sector to lead growth. |
| | » | India’s CAD (Current Account Deficit) has improved significantly with the past year’s CAD being estimated to be around 1.9% of GDP as compared to 4.8% in the year ended April 30, 2013. We expect CAD to be around 2.1% of GDP in the fiscal year ending April 30, 2015. The improvement in the current account has been on the back of lower trade deficit (primarily lower gold imports and export growth) and improvement in invisible led by software services and remittances. |
| | » | The latest April inflation data continued to show a downward trend in inflation numbers after peaking out in November 2013. Thus, WPI (Wholesale Price Index) inflation fell to 5.2% from 7.5% in November 2013 (and average of 6% in the 12-month period ending April 2014) while CPI (Consumer Price Index) inflation also fell to 8.6% from 11.2% in November 2013 (and average of 9.4% in the 12-month period ending April 2014). The decline in the inflation number is mainly on account of lower food inflation post a good monsoon season in 2013. Nonetheless, there is a growing concern on El Nino weather patterns emerging which can potentially lead to a weaker monsoon and this remains a key risk to agricultural product prices. Thus, the India Meteorological Department (IMD) released its 2014 monsoon forecast where it expected rainfall at 95% (slightly below normal) of long period average with 56% probability of less than normal rainfall and 60% probability of El-Nino occurring. However, with increasing water storage level in various reservoirs, the impact can be somewhat mitigated. |
| | » | The period saw a strong FII flow to the equity market while FII flow to the debt market turned negative. FIIs were buyers in the equity market at around USD14bn while they were sellers in the debt market to the tune of USD7.1bn in the 12-month period ending April 2014. |
32 | April 30, 2014
| | |
| ALPS | Kotak India Growth Fund |
| Management Commentary | | April 30, 2014 (Unaudited) |
| | » | During the period, the government proposed the Land Acquisition Bill and National Foods Security Bill. Both of the bills have been passed by the parliament and this has been met with skepticism by both investors and industry. We believe that these bills, while well-intended, will increase the subsidy burden on the already strained economy. Land acquisition will potentially lead to slower investment cycle when a revival of the same is deeply desired. In addition, India parliament has also passed the Lokpal bill after more than 40 years after it was first initiated. The Lokpal bill would require each state to set up an anti-graft body within a year of its approval. The body will have powers to initiate inquiry and prosecute public servants in cases involving corruption. |
| | » | On the fiscal side, the government concluded its spectrum (Telecom space – 1,800 MHz and 900MHz) auction in February 2014 after 10 days and 68 rounds of bidding and managed to collect INR612bn successfully. Meanwhile, in March 2014, the government also successfully completed its divestment program in Axis Bank before the March 31, 2014 deadline and successfully raised INR56bn, much higher than previously expected. |
| | » | The trade balance number continued to show sharp improvement with latest April 2014 trade deficit narrowed to USD10.1bn from the past fiscal year’s average of USD12bn. For the full year ended April 30, export rose 4% YoY (year on year) while import were down 8.1% YoY. Average monthly trade deficit also declined to around USD12bn (vs USD16bn in the prior year). |
Portfolio Composition
The portfolio is constructed to potentially benefit from the strong macro-economic growth in the Indian economy across four broad themes in India – consumption lead by favourable demographics, financial services, infrastructure and outsourcing. The Fund has the flexibility to invest across market capitalizations – depending on market conditions, valuation differential, earnings growth, liquidity, etc.
For the 12-month period ending April 30, 2014, sectorally the key changes have been in Information Technology (added 430 bps), Cement & Cement Products (added 290 bps), Telecom (added 90 bps), Banking & Finance (reduced 160 bps), Utilities (reduced 130 bps), and Construction (reduced 110 bps). Thematically, Consumption (at about 33%) and Financials (at about 27%) are the largest themes in the portfolio while infrastructure exposure is only around 8% due to poor policy initiatives by the government. Over the last 12 months, exposure to midcap and small-cap companies in the fund remained in the range of 22%-26%.
Sectorally, the portfolio is overweight Cement & Cement Products, Infrastructure, and Banking & Finance while underweight Utilities, Oil & Gas, and Metal & Metal Products as of April 30, 2014.
Outlook
In recent months, Indian equity markets have moved up on the back of optimism on formation of stable government post the ongoing general elections. Election related news flow will continue to dominate the market behavior in the near term and the outcome will dominate the trend meaningfully thenceforth. The market is gearing up for a change of guard at the center. Macro economic factors like inflation, current account and fiscal deficit have shown meaningful improvement. A positive outcome on elections would have an impact on overall sentiment as well as could hasten the process of policy reforms and execution of stalled projects thus potentially kick-starting the stalled investment cycle and possibly ushering in a new economic up-cycle.
The key question in everyone’s mind is whether the “change rally” has already played out, or, are there further upsides in the market. On corporate earnings in the near term we don’t expect any major positive or negative surprise. Markets may though be volatile on the back of election result. However, we remain optimistic on the outcome. Equity Markets are trading around their long term one year forward PE5 (Price Earnings) average multiple of around 14-14.5X. However, the forward multiple tends to move to higher teens in a cycle of improving economic growth and most likely Indian economy and corporate earnings have bottomed out and will exhibit improving trends. Earnings are expected to move into mid teen over the next two years. We believe it is likely that in a scenario of a stable government formation and economic recovery kicking in, on the back of potential further re-rating and earnings growth, there is reasonable upside in the market. Please note that this assumes a formation of a stable government post the upcoming elections. An uncertain election verdict contrary to the recent opinion polls is the key risk for Indian equities in the near-term.
Important Notice
Investments in India are subject to a number of risks including, but not limited to, risk of losing some or all of the capital invested, high market volatility, variable market liquidity, geopolitical risks (including political instability), exchange rate fluctuations (between the currency of the fund’s share class and the Indian Rupee), changes in tax regime and restrictions on investment activities of foreign investors.
| 1 | NIFTY – NIFTY is an index computed from performance of top stocks from different sectors listed on the NSE (National Stock Exchange) of India. NIFTY consists of 50 companies from 24 different sectors. NIFTY stands for National Stock Exchange’s Fifty. The companies included in the NIFTY may vary from time to time based on many factors considered by the NSE. |
| 2 | CNXMCAP – The CNX Midcap Index comprises 100 tradable stocks listed on the National Stock Exchange (NSE) of India. The primary objective of the CNX Midcap Index is to capture the movement of the midcap segment of the market. CNX Midcap Index is computed using free float market capitalization method, wherein the level of the index reflects the total free float market value of all the stocks in the index relative to particular base market capitalization value. |
33 | April 30, 2014
| | |
| ALPS | Kotak India Growth Fund |
| Management Commentary | | April 30, 2014 (Unaudited) |
| 3 | MSCI Emerging Markets Index – The MSCI (Morgan Stanley Capital International) Emerging Markets Index is a free float-adjusted market capitalization index that is designed to measure equity market performance of emerging markets. The MSCI Emerging Markets Index consists of the following 23 emerging market country indexes: Brazil, Chile, China, Colombia, Czech Republic, Egypt, Greece, Hungary, India, Indonesia, Korea, Malaysia, Mexico, Peru, Philippines, Poland, Qatar, Russia, South Africa, Taiwan, Thailand, Turkey and United Arab Emirates. |
| 4 | MSCI World Index – The MSCI World Index is a free float-adjusted market capitalization weighted index that is designed to measure the equity market performance of developed markets. The MSCI World Index consists of the following 23 developed market country indexes: Australia, Austria, Belgium, Canada, Denmark, Finland, France, Germany, Hong Kong, Ireland, Israel, Italy, Japan, Netherlands, New Zealand, Norway, Portugal, Singapore, Spain, Sweden, Switzerland, the United Kingdom, and the United States. |
| 5 | PE – A valuation ratio of a company’s current share price compared to its per-share earnings. |
The views and information discussed in this commentary are as of the date of publication, are subject to change, and may not reflect the writer’s current views. The views expressed represent an assessment of market conditions at a specific point in time, are opinions only and should not be relied upon as investment advice regarding a particular investment or markets in general. Such information does not constitute a recommendation to buy or sell specific securities or investment vehicles. It should not be assumed that any investment will be profitable or will equal the performance of the fund(s) or any securities or any sectors mentioned herein. The subject matter contained herein has been derived from several sources believed to be reliable and accurate at the time of compilation. Kotak Mahindra (UK) Limited does not accept any liability for losses either direct or consequential caused by the use of this information.
34 | April 30, 2014
| | |
| ALPS | Kotak India Growth Fund |
| Performance Update | | April 30, 2014 (Unaudited) |
Performance of $10,000 Initial Investment (as of April 30, 2014)
Comparison of change in value of a $10,000 investment (includes maximum sales charges of 5.50%)
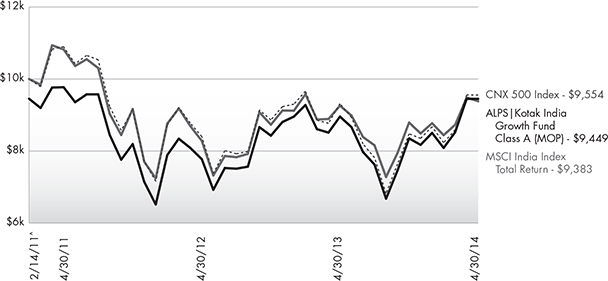
The chart above represents historical performance of a hypothetical investment of $10,000 in the Fund since inception. Past performance does not guarantee future results. This chart does not reflect the deduction of taxes that a shareholder would pay on Fund distributions or the redemption of Fund shares.
Average Annual Total Returns (as of April 30, 2014)
| | | | | | | | | | |
| | | 1 Year | | 3 Year | | Since Inception^ | | Total Expense Ratio | | What You Pay* |
Class A (NAV) | | 5.49% | | -1.12% | | -0.01% | | 8.01% | | 2.00% |
Class A (MOP) | | -0.30% | | -2.96% | | -1.75% | | |
Class C (NAV) | | 4.60% | | -1.78% | | -0.70% | | 8.61% | | 2.60% |
Class C (CDSC) | | 3.60% | | -1.78% | | -0.70% | | |
Class I | | 5.70% | | -0.80% | | 0.32% | | 7.61% | | 1.60% |
CNX 500 Index1 | | 2.54% | | -12.33% | | -1.41% | | | | |
MSCI India Index Total Return2 | | 1.34% | | -4.64% | | -1.97% | | | | |
Performance data quoted represents past performance. Past performance does not guarantee future results. Investment return and principal value of an investment will fluctuate so that an investor’s shares, when sold or redeemed, may be worth more or less than the original cost. Current performance data may be higher or lower than actual data quoted. For the most current month-end performance data, please call 1-877-256-8445.
Maximum Offering Price (MOP) for Class A shares includes the Fund’s maximum sales charge of 5.50%. Performance shown at NAV does not include these sales charges and would have been lower had it been taken into account. If you invest $1 million or more, either as a lump sum or through the Fund’s accumulation or letter of intent programs, you can purchase Class A shares without an initial sales charge (load). A Contingent Deferred Sales Charge (“CDSC”) of 1.00% may apply to Class C shares redeemed within the first 12 months after a purchase, and on Class A shares redeemed within the first 18 months after a purchase in excess of $1 million. The Fund imposes a 2.00% redemption fee on shares held for less than 30 days.
Investing in the Fund is subject to investment risks, including possible loss of the principal amount invested. Derivatives generally are more sensitive to changes in economic or market conditions than other types of investments; this could result in losses that significantly exceed the funds original investment.
35 | April 30, 2014
| | |
| ALPS | Kotak India Growth Fund |
| Performance Update | | April 30, 2014 (Unaudited) |
| 1 | CNX 500 - India’s first broad based benchmark of the Indian capital market. The CNX 500 companies are disaggregated into 72 industry indices. Industry weightages in the market. The index is not actively managed and does not reflect any deduction for fees, expenses or taxes. An investor may not invest directly in an index. |
| 2 | MSCI India Index - a free float weighted equity index. It was developed with a base value of 100 as-of December 31, 1992. The index is not actively managed and does not reflect any deduction for fees, expenses or taxes. An investor may not invest directly in an index. |
| ^ | Fund inception date of February 14, 2011. |
| * | What You Pay reflects the Advisor’s and Sub-Advisor’s decision to contractually limit expenses through August 31, 2014. Please see the prospectus for additional information. |
The table does not reflect the deduction of taxes that a shareholder would pay on Fund distributions or the redemption of Fund shares.
This Fund is not suitable for all investors and is subject to investment risks, including possible loss of the principal amount invested.
There is no guarantee that the Fund will continue to hold any one particular security or stay invested in any one particular company. The composition of the Fund’s top holdings is subject to change. Performance figures are historical and reflect the change in share price, reinvested distributions, changes in net asset value, sales charges and capital gains distributions, if any.
Not FDIC Insured – No Bank Guarantee – May Lose Value
Investing in India involves risk and considerations not present when investing in more established securities markets. The Fund may be more susceptible to economic, market, political and local risks of the region than a fund that is more geographically diversified. Investments in India are subject to a number of risks including, but not limited to, risk of losing some or all of the capital invested, high market volatility, variable market liquidity, geopolitical risks (including political instability), exchange rate fluctuations (between the currency of the fund’s share class and the Indian Rupee), changes in tax regime and restrictions on investment activities of foreign investors.
Top Ten Holdings (as a % of Net Assets)†
| | | | |
ICICI Bank, Ltd. | | | 6.09% | |
HDFC Bank, Ltd. | | | 5.60% | |
ITC, Ltd. | | | 5.54% | |
Infosys, Ltd. | | | 5.14% | |
Tata Consultancy Services, Ltd. | | | 5.02% | |
Housing Development Finance Corp. | | | 3.49% | |
Reliance Industries, Ltd. | | | 3.39% | |
Axis Bank, Ltd. | | | 3.36% | |
Larsen & Toubro, Ltd. | | | 3.27% | |
Tata Motors, Ltd. | | | 2.83% | |
Top Ten Holdings | | | 43.73% | |
| † | Holdings are subject to change. Table presents indicative values only. |
Industry Sector Allocation (as a % of Net Assets)
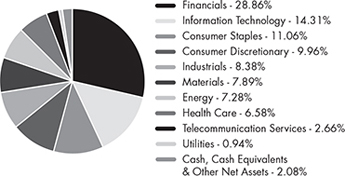
36 | April 30, 2014
| | |
| ALPS | Kotak India Growth Fund | | |
| Consolidated Statement of Investments | | April 30, 2014 |
| | | | | | | | |
| | | | | | Value | |
| | | Shares | | | (Note 2) | |
| |
| COMMON STOCKS (97.92%) | |
| Consumer Discretionary (9.96%) | |
Auto Components (1.29%) | | | | | | | | |
Motherson Sumi Systems, Ltd. | | | 24,630 | | | $ | 103,903 | |
| | | | | | | | |
| | |
Automobiles (6.67%) | | | | | | | | |
Bajaj Auto, Ltd. | | | 3,486 | | | | 110,710 | |
Mahindra & Mahindra, Ltd. | | | 8,005 | | | | 142,968 | |
Maruti Suzuki India, Ltd. | | | 1,705 | | | | 54,465 | |
Tata Motors, Ltd. | | | 32,850 | | | | 227,232 | |
| | | | | | | | |
| | | | | | | 535,375 | |
| | |
Media (0.90%) | | | | | | | | |
Zee Entertainment Enterprises, Ltd. | | | 16,500 | | | | 71,935 | |
| | | | | | | | |
|
Textiles, Apparel & Luxury Goods (1.10%) | |
Bata India, Ltd. | | | 5,000 | | | | 88,665 | |
| | | | | | | | |
| |
| TOTAL CONSUMER DISCRETIONARY | | | | 799,878 | |
|
| Consumer Staples (11.06%) | |
Beverages (1.78%) | | | | | | | | |
United Spirits, Ltd. | | | 3,120 | | | | 143,280 | |
| | | | | | | | |
| | |
Food Products (1.58%) | | | | | | | | |
Britannia Industries, Ltd. | | | 8,825 | | | | 126,626 | |
| | | | | | | | |
|
Household Products (1.00%) | |
Jyothy Laboratories, Ltd. | | | 25,389 | | | | 80,033 | |
| | | | | | | | |
| | |
Personal Products (1.16%) | | | | | | | | |
Emami, Ltd. | | | 11,802 | | | | 93,220 | |
| | | | | | | | |
| | |
Tobacco (5.54%) | | | | | | | | |
ITC, Ltd. | | | 78,750 | | | | 445,235 | |
| | | | | | | | |
| |
TOTAL CONSUMER STAPLES | | | | 888,394 | |
| | | | | | | | |
| | |
| Energy (7.28%) | | | | | | | | |
Oil, Gas & Consumable Fuels (7.28%) | |
Cairn India, Ltd. | | | 7,300 | | | | 40,602 | |
Hindustan Petroleum Corp., Ltd. | | | 25,731 | | | | 137,365 | |
Oil India, Ltd. | | | 16,960 | | | | 134,281 | |
Reliance Industries, Ltd. | | | 17,498 | | | | 271,991 | |
| | | | | | | | |
| | | | | | | 584,239 | |
| | |
TOTAL ENERGY | | | | | | | 584,239 | |
| | | | | | | | |
| | |
| Financials (28.86%) | | | | | | | | |
Commercial Banks (22.64%) | |
Axis Bank, Ltd. | | | 10,679 | | | | 269,441 | |
| | | | | | | | |
| | | | | | Value | |
| | | Shares | | | (Note 2) | |
| |
| Commercial Banks (continued) | |
Bank of Baroda | | | 12,035 | | | $ | 163,453 | |
Federal Bank, Ltd. | | | 79,300 | | | | 119,102 | |
HDFC Bank, Ltd. | | | 37,547 | | | | 449,403 | |
ICICI Bank, Ltd. | | | 23,704 | | | | 488,729 | |
IndusInd Bank, Ltd. | | | 12,800 | | | | 101,780 | |
State Bank of India | | | 3,025 | | | | 104,457 | |
Yes Bank, Ltd. | | | 16,583 | | | | 121,659 | |
| | | | | | | | |
| | | | | | | 1,818,024 | |
|
Consumer Finance (1.25%) | |
Sundaram Finance, Ltd. | | | 8,398 | | | | 100,418 | |
| | | | | | | | |
|
Real Estate Management & Development (1.48%) | |
Phoenix Mills, Ltd. | | | 18,188 | | | | 74,935 | |
Prestige Estates Projects, Ltd. | | | 15,628 | | | | 44,147 | |
| | | | | | | | |
| | | | | | | 119,082 | |
|
Thrifts & Mortgage Finance (3.49%) | |
Housing Development Finance Corp. | | | 18,803 | | | | 280,345 | |
| | | | | | | | |
| |
| TOTAL FINANCIALS | | | | 2,317,869 | |
| |
| Health Care (6.58%) | | | | | |
Pharmaceuticals (6.58%) | | | | | | | | |
Cadila Healthcare, Ltd. | | | 2,828 | | | | 45,871 | |
Dr. Reddy’s Laboratories, Ltd. | | | 1,995 | | | | 89,533 | |
Glenmark Pharmaceuticals, Ltd. | | | 3,094 | | | | 31,028 | |
Lupin, Ltd. | | | 7,400 | | | | 121,432 | |
Sun Pharmaceutical Industries, Ltd. | | | 16,550 | | | | 173,861 | |
Torrent Pharmaceuticals, Ltd. | | | 6,917 | | | | 66,350 | |
| | | | | | | | |
| | | | | | | 528,075 | |
| | |
| TOTAL HEALTH CARE | | | | | | | 528,075 | |
| |
| Industrials (8.38%) | | | | | |
Construction & Engineering (4.36%) | |
GMR Infrastructure, Ltd. | | | 210,650 | | | | 86,882 | |
Larsen & Toubro, Ltd. | | | 12,226 | | | | 262,944 | |
| | | | | | | | |
| | | | | | | 349,826 | |
|
Electrical Equipment (1.77%) | |
Amara Raja Batteries, Ltd. | | | 10,213 | | | | 69,342 | |
Crompton Greaves, Ltd. | | | 26,607 | | | | 72,687 | |
| | | | | | | | |
| | | | | | | 142,029 | |
|
Machinery (1.09%) | |
Thermax, Ltd. | | | 7,200 | | | | 87,650 | |
| | | | | | | | |
|
Transportation Infrastructure (1.16%) | |
Gujarat Pipavav Port, Ltd.(a) | | | 17,078 | | | | 23,384 | |
37 | April 30, 2014
| | |
| ALPS | Kotak India Growth Fund |
| Consolidated Statement of Investments | | April 30, 2014 |
| | | | | | | | |
| | | | | | Value | |
| | | Shares | | | (Note 2) | |
| |
Transportation Infrastructure (continued) | |
IL&FS Transportation Networks, Ltd. | | | 31,985 | | | $ | 70,132 | |
| | | | | | | | |
| | | | | | | 93,516 | |
| | |
| TOTAL INDUSTRIALS | | | | | | | 673,021 | |
| |
| Information Technology (14.31%) | | | | | |
Electronic Equipment, Instruments & Components
(0.43%) | |
Redington India, Ltd. | | | 23,905 | | | | 34,937 | |
| | | | | | | | |
|
Internet Software & Services (0.83%) | |
Info Edge India, Ltd. | | | 6,822 | | | | 66,410 | |
| | | | | | | | |
|
IT Services (13.05%) | |
HCL Technologies, Ltd. | | | 3,735 | | | | 86,915 | |
Infosys, Ltd. | | | 7,758 | | | | 412,755 | |
Tata Consultancy Services, Ltd. | | | 11,099 | | | | 402,898 | |
Tech Mahindra, Ltd. | | | 4,785 | | | | 145,496 | |
| | | | | | | | |
| | | | | | | 1,048,064 | |
| |
| TOTAL INFORMATION TECHNOLOGY | | | | 1,149,411 | |
| | |
| Materials (7.89%) | | | | | | | | |
Chemicals (1.08%) | |
Berger Paints India, Ltd. | | | 9,101 | | | | 36,780 | |
Coromandel International, Ltd. | | | 13,836 | | | | 50,352 | |
| | | | | | | | |
| | | | | | | 87,132 | |
|
Construction Materials (5.27%) | |
Century Textiles & Industries, Ltd. | | | 15,550 | | | | 86,550 | |
The Ramco Cements, Ltd. | | | 31,675 | | | | 113,750 | |
Shree Cement, Ltd. | | | 1,443 | | | | 136,284 | |
Ultratech Cement, Ltd. | | | 2,572 | | | | 86,553 | |
| | | | | | | | |
| | | | | | | 423,137 | |
|
Metals & Mining (1.54%) | |
Hindustan Zinc, Ltd. | | | 57,800 | | | | 123,653 | |
| | | | | | | | |
| | |
| TOTAL MATERIALS | | | | | | | 633,922 | |
| |
| Telecommunication Services (2.66%) | | | | | |
Diversified Telecommunication (0.69%) | |
Tata Communications, Ltd. | | | 11,830 | | | | 55,617 | |
| | | | | | | | |
|
Wireless Telecommunication Services (1.97%) | |
Bharti Airtel, Ltd. | | | 29,000 | | | | 157,923 | |
| | | | | | | | |
| |
| TOTAL TELECOMMUNICATION SERVICES | | | | 213,540 | |
| | | | | | | | | | | | |
| | | | | | | | | Value | |
| | | | | | Shares | | | (Note 2) | |
| |
| Utilities (0.94%) | | | | | |
Independent Power Producers & Energy Traders
(0.94%) | |
PTC India, Ltd. | | | | 68,000 | | | $ | 75,395 | |
| | | | | | | | | | | | |
| |
| TOTAL UTILITIES | | | | 75,395 | |
| |
TOTAL COMMON STOCKS (Cost $6,919,328) | | | | 7,863,744 | |
| |
RIGHTS (0.04%) | | | | | |
IL&FS Transportation Networks, Ltd., Strike Price: 100 INR, Expires: 05/12/2014(a) | | | | 8,636 | | | | 2,935 | |
| |
TOTAL RIGHTS
(Cost $–) | | | | 2,935 | |
| | | |
| | | 7-Day | | | | | | Value | |
| | | Yield | | | Shares | | | (Note 2) | |
| |
SHORT TERM INVESTMENTS (0.05%) | |
| Money Market Fund (0.05%) | |
Dreyfus Cash Advantage Fund, Institutional Class | | | 0.060% | | | | 4,425 | | | | 4,425 | |
| |
TOTAL SHORT TERM INVESTMENTS (Cost $4,425) | | | | 4,425 | |
| |
TOTAL INVESTMENTS (98.01%) (Cost $6,923,753) | | | $ | 7,871,104 | |
| |
| Other Assets In Excess Of Liabilities (1.99%) | | | | 159,586 | |
| |
NET ASSETS (100.00%) | | | $ | 8,030,690 | |
| | | | | | | | | | | | |
| | | | | | | | | | | | |
| (a) | Non-Income Producing Security. |
Common Abbreviations:
Ltd. - Limited.
Currency Abbreviations:
INR - Indian Rupee
For Fund compliance purposes, the Fund’s industry classifications refer to any one or more of the industry sub-classifications used by one or more widely recognized market indexes or ratings group indexes, and/or as defined by Fund management. This definition may not apply for purposes of this report, which may combine industry sub-classifications for reporting ease. Industries are shown as a percent of net assets.
See Notes to Financial Statements.
38 | April 30, 2014
| | |
| ALPS | Kotak India Growth Fund | | |
| Consolidated Statement of Assets and Liabilities | | April 30, 2014 |
| | | | |
ASSETS | | | | |
Investments, at value | | $ | 7,871,104 | |
Cash | | | 4,293 | |
Foreign currency, at value (Cost $194,054) | | | 194,720 | |
Foreign currency held at broker (Cost $14,300) | | | 14,584 | |
Receivable for investments sold | | | 21,252 | |
Receivable for shares sold | | | 28,068 | |
Receivable due from advisor | | | 3,876 | |
Prepaid expenses and other assets | | | 20,022 | |
Total Assets | | | 8,157,919 | |
LIABILITIES | | | | |
Payable for investments purchased | | | 3,615 | |
Payable for shares redeemed | | | 478 | |
Administration and transfer agency fees payable | | | 13,437 | |
Distribution and services fees payable | | | 4,688 | |
Trustees’ fees and expenses payable | | | 60 | |
Professional fees payable | | | 39,722 | |
Accrued expenses and other liabilities | | | 65,229 | |
Total Liabilities | | | 127,229 | |
NET ASSETS | | $ | 8,030,690 | |
| | | | | |
| | | | | |
NET ASSETS CONSIST OF | | | | |
Paid-in capital | | $ | 7,611,385 | |
Accumulated net investment loss | | | (37,846) | |
Accumulated net realized loss on investments, futures contracts and foreign currency transactions | | | (491,217) | |
Net unrealized appreciation on investments and translation of assets and liabilities denominated in foreign currencies | | | 948,368 | |
NET ASSETS | | $ | 8,030,690 | |
| | | | | |
| | | | | |
| INVESTMENTS, AT COST | | $ | 6,923,753 | |
| |
| PRICING OF SHARES | | | | |
Class A: | | | | |
Net Asset Value, offering and redemption price per share(a) | | $ | 9.99 | |
Net Assets | | $ | 5,211,023 | |
Shares of beneficial interest outstanding (unlimited number of shares, no par value common stock authorized) | | | 521,641 | |
Maximum offering price per share ((NAV/0.9450), based on maximum sales charge of 5.50% of the offering price) | | $ | 10.57 | |
Class C: | | | | |
Net Asset Value, offering and redemption price per share(a) | | $ | 9.77 | |
Net Assets | | $ | 874,768 | |
Shares of beneficial interest outstanding (unlimited number of shares, no par value common stock authorized) | | | 89,504 | |
Class I: | | | | |
Net Asset Value, offering and redemption price per share | | $ | 10.04 | |
Net Assets | | $ | 1,944,899 | |
Shares of beneficial interest outstanding (unlimited number of shares, no par value common stock authorized) | | | 193,804 | |
| (a) | Redemption price per share may be reduced for any applicable contingent deferred sales charge. For a description of a possible sales charge, please see the Fund’s Prospectus. |
See Notes to Financial Statements.
39 | April 30, 2014
| | |
| ALPS | Kotak India Growth Fund | | |
| Consolidated Statement of Operations | | For the Year Ended April 30, 2014 |
| | | | |
INVESTMENT INCOME | | | | |
Dividends | | $ | 112,349 | |
Total Investment Income | | | 112,349 | |
| |
| EXPENSES | | | | |
Investment advisory fees | | | 87,269 | |
Administrative and transfer agency fees | | | 141,000 | |
Distribution and service fees | | | | |
Class A | | | 12,136 | |
Class C | | | 8,186 | |
Professional fees | | | 46,195 | |
Reports to shareholders and printing fees | | | 2,436 | |
State registration fees | | | 43,440 | |
Insurance fees | | | 3,084 | |
Custody fees | | | 78,021 | |
Trustees’ fees and expenses | | | 4,260 | |
Miscellaneous expenses | | | 30,436 | |
Total Expenses | | | 456,463 | |
Less fees waived/reimbursed by investment advisor (Note 8) | | | | |
Class A | | | (198,350) | |
Class C | | | (38,130) | |
Class I | | | (87,957) | |
Net Expenses | | | 132,026 | |
Net Investment Loss | | | (19,677) | |
Net realized loss on investments | | | (80,511) | |
Net realized gain on futures contracts | | | 10,181 | |
Net realized loss on foreign currency transactions | | | (28,692) | |
Net change in unrealized appreciation on investments | | | 449,545 | |
Net change in unrealized depreciation on translation of assets and liabilities denominated in foreign currencies | | | (43) | |
NET REALIZED AND UNREALIZED GAIN ON INVESTMENTS | | | 350,480 | |
NET INCREASE IN NET ASSETS RESULTING FROM OPERATIONS | | $ | 330,803 | |
| | | | | |
| | | | | |
See Notes to Financial Statements.
40 | April 30, 2014
| | |
| ALPS | Kotak India Growth Fund | | |
| Consolidated Statements of Changes in Net Assets |
| | | | | | | | |
| | | For the Year Ended
April 30, 2014 | | | For the Year Ended
April 30, 2013 | |
OPERATIONS | | | | | | | | |
Net investment loss | | $ | (19,677) | | | $ | (43,203) | |
Net realized gain/(loss) on investments, futures contracts and foreign currency transactions | | | (99,022) | | | | 181,647 | |
Net change in unrealized appreciation on investments and translation of assets and liabilities denominated in foreign currencies | | | 449,502 | | | | 627,189 | |
Net Increase in Net Assets Resulting from Operations | | | 330,803 | | | | 765,633 | |
| | |
| DISTRIBUTIONS | | | | | | | | |
Dividends to shareholders from net investment income | | | | | | | | |
Class I | | | (9,601) | | | | – | |
Net Decrease in Net Assets from Distributions | | | (9,601) | | | | – | |
| | |
| BENEFICIAL INTEREST TRANSACTIONS (NOTE 6) | | | | | | | | |
Shares sold | | | | | | | | |
Class A | | | 2,368,871 | | | | 3,239,533 | |
Class C | | | 348,482 | | | | 532,616 | |
Class I | | | 325,772 | | | | 744,593 | |
Dividends reinvested | | | | | | | | |
Class I | | | 8,639 | | | | – | |
Shares redeemed, net of redemption fees | | | | | | | | |
Class A | | | (2,090,462) | | | | (1,327,483) | |
Class C | | | (419,549) | | | | (118,894) | |
Class I | | | (586,477) | | | | (530,127) | |
Net Increase/(Decrease) in Net Assets Derived from Beneficial Interest Transactions | | | (44,724) | | | | 2,540,238 | |
| | |
Net increase in net assets | | | 276,478 | | | | 3,305,871 | |
| | |
| NET ASSETS | | | | | | | | |
Beginning of year | | | 7,754,212 | | | | 4,448,341 | |
End of year * | | $ | 8,030,690 | | | $ | 7,754,212 | |
| | | | | | | | | |
| | | | | | | | | |
*Including accumulated net investment loss of: | | $ | (37,846) | | | $ | (45,369) | |
See Notes to Financial Statements.
41 | April 30, 2014
| | |
| ALPS | Kotak India Growth Fund – Class A |
| Consolidated Financial Highlights |
Selected data for a share of beneficial interest outstanding throughout the periods indicated:
| | | | | | | | | | | | | | | | | | | | |
| | | For the Year Ended
April 30, 2014 (a) | | For the Year Ended
April 30, 2013 (a) | | For the Year Ended
April 30, 2012 (a) | | For the Period
February 14, 2011
(Inception) to
April 30, 2011 (a) |
Net asset value, beginning of period | | $9.47 | | $8.22 | | $10.35 | | $10.00 |
|
| INCOME/(LOSS) FROM INVESTMENT OPERATIONS: |
Net investment loss(b) | | (0.02) | | (0.07) | | (0.08) | | (0.04) |
Net realized and unrealized gain/(loss) | | 0.54 | | 1.32 | | (2.04) | | 0.39 |
Total from investment operations | | 0.52 | | 1.25 | | (2.12) | | 0.35 |
| | | | |
| DISTRIBUTIONS: | | | | | | | | |
From net realized gains | | – | | – | | (0.01) | | – |
Total distributions | | – | | – | | (0.01) | | – |
| | | | |
REDEMPTION FEES ADDED TO PAID-IN CAPITAL (NOTE 6) | | 0.00(c) | | 0.00(c) | | 0.00(c) | | 0.00(c) |
Net increase/(decrease) in net asset value | | 0.52 | | 1.25 | | (2.13) | | 0.35 |
Net asset value, end of year | | $9.99 | | $9.47 | | $8.22 | | $10.35 |
| | | | | | | | | | | | | |
| | | | | | | | | | | | | |
| TOTAL RETURN(d) | | 5.49% | | 15.21% | | (20.44)% | | 3.40% |
| | | | |
| RATIOS/SUPPLEMENTAL DATA: | | | | | | | | |
Net assets, end of year (000s) | | $5,211 | | $4,681 | | $2,404 | | $935 |
Ratio of expenses to average net assets excluding fee waivers and reimbursements | | 6.51% | | 7.99% | | 12.42% | | 69.96%(e) |
Ratio of expenses to average net assets including fee waivers and reimbursements(f) | | 1.88%(f) | | 2.00% | | 2.00% | | 2.00%(e) |
Ratio of net investment loss to average net assets | | (0.27)% | | (0.82)% | | (0.89)% | | (1.82)%(e) |
Portfolio turnover rate(g) | | 65% | | 93% | | 114% | | 9% |
| (a) | Per share amounts and ratios to average net assets include income and expenses of the Kotak Mauritius Portfolio (wholly-owned subsidiary). |
| (b) | Calculated using the average shares method. |
| (c) | Less than $0.005 per share. |
| (d) | Total returns are for the period indicated and have not been annualized. Total returns would have been lower had certain expenses not been waived during the period. Returns shown do not reflect the deduction of taxes that a shareholder would pay on Fund distributions or the redemption of Fund shares. Returns shown exclude any applicable sales charges. |
| (f) | According to the Fund’s shareholder services plan with respect to the Fund’s Class A shares, any amount of such payment not paid during the Fund’s fiscal year for such service activities shall be reimbursed to the Fund as soon as practical after the end of the fiscal year. Fees were reimbursed to the Fund during the year ended April 30, 2014, for the prior fiscal year in the amount of 0.12% of average net assets of Class A shares. |
| (g) | Portfolio turnover rate for periods less than one full year have not been annualized. |
See Notes to Financial Statements.
42 | April 30, 2014
| | |
| ALPS | Kotak India Growth Fund – Class C |
| Consolidated Financial Highlights |
Selected data for a share of beneficial interest outstanding throughout the periods indicated:
| | | | | | | | | | | | | | | | | | | | |
| | | For the Year Ended
April 30, 2014 (a) | | For the Year Ended
April 30, 2013 (a) | | For the Year Ended
April 30, 2012 (a) | | For the Period
February 14, 2011
(Inception) to
April 30, 2011 (a) |
Net asset value, beginning of period | | $9.34 | | $8.15 | | $10.32 | | $10.00 |
| | |
| INCOME/(LOSS) FROM INVESTMENT OPERATIONS: | | | | |
Net investment loss(b) | | (0.09) | | (0.12) | | (0.13) | | (0.05) |
Net realized and unrealized gain/(loss) | | 0.52 | | 1.31 | | (2.03) | | 0.37 |
Total from investment operations | | 0.43 | | 1.19 | | (2.16) | | 0.32 |
| | | | |
| DISTRIBUTIONS: | | | | | | | | |
From net realized gains | | – | | – | | (0.01) | | – |
Total distributions | | – | | – | | (0.01) | | – |
| | | | |
REDEMPTION FEES ADDED TO PAID-IN CAPITAL (NOTE 6) | | – | | – | | 0.00(c) | | – |
Net increase/(decrease) in net asset value | | 0.43 | | 1.19 | | (2.17) | | 0.32 |
Net asset value, end of year | | $9.77 | | $9.34 | | $8.15 | | $10.32 |
| | | | | | | | | | | | | |
| | | | | | | | | | | | | |
| TOTAL RETURN(d) | | 4.60% | | 14.60% | | (20.97)% | | 3.20% |
| | | | |
| RATIOS/SUPPLEMENTAL DATA: | | | | | | | | |
Net assets, end of year (000s) | | $875 | | $924 | | $435 | | $466 |
Ratio of expenses to average net assets excluding fee waivers and reimbursements | | 7.26% | | 8.54% | | 13.39% | | 69.64%(e) |
Ratio of expenses to average net assets including fee waivers and reimbursements | | 2.60% | | 2.60% | | 2.60% | | 2.60%(e) |
Ratio of net investment loss to average net assets | | (1.00)% | | (1.42)% | | (1.49)% | | (2.42)%(e) |
Portfolio turnover rate(f) | | 65% | | 93% | | 114% | | 9% |
| (a) | Per share amounts and ratios to average net assets include income and expenses of the Kotak Mauritius Portfolio (wholly-owned subsidiary). |
| (b) | Calculated using the average shares method. |
| (c) | Less than $0.005 per share. |
| (d) | Total returns are for the period indicated and have not been annualized. Total returns would have been lower had certain expenses not been waived during the period. Returns shown do not reflect the deduction of taxes that a shareholder would pay on Fund distributions or the redemption of Fund shares. Returns shown exclude any applicable sales charges. |
| (f) | Portfolio turnover rate for periods less than one full year have not been annualized. |
See Notes to Financial Statements.
43 | April 30, 2014
| | |
| ALPS | Kotak India Growth Fund – Class I |
| Consolidated Financial Highlights |
Selected data for a share of beneficial interest outstanding throughout the periods indicated:
| | | | | | | | | | | | | | | | | | | | |
| | | For the Year Ended
April 30, 2014 (a) | | For the Year Ended
April 30, 2013 (a) | | For the Year Ended
April 30, 2012 (a) | | For the Period
February 14, 2011
(Inception) to
April 30, 2011 (a) |
Net asset value, beginning of period | | $9.55 | | $8.25 | | $10.34 | | $10.00 |
|
INCOME/(LOSS) FROM INVESTMENT OPERATIONS: |
Net investment income/(loss)(b) | | 0.00(c) | | (0.04) | | (0.04) | | (0.03) |
Net realized and unrealized gain/(loss) | | 0.54 | | 1.34 | | (2.04) | | 0.37 |
Total from investment operations | | 0.54 | | 1.30 | | (2.08) | | 0.34 |
| | | | |
| DISTRIBUTIONS: | | | | | | | | |
From net investment income | | (0.05) | | – | | – | | – |
From net realized gains | | – | | – | | (0.01) | | – |
Total distributions | | (0.05) | | – | | (0.01) | | – |
| | | | |
REDEMPTION FEES ADDED TO PAID-IN CAPITAL (NOTE 6) | | – | | 0.00(c) | | 0.00(c) | | – |
Net increase/(decrease) in net asset value | | 0.49 | | 1.30 | | (2.09) | | 0.34 |
Net asset value, end of year | | $10.04 | | $9.55 | | $8.25 | | $10.34 |
| | | | | | | | | | | | | |
| | | | | | | | | | | | | |
| TOTAL RETURN(d) | | 5.70% | | 15.76% | | (20.23)% | | 3.50% |
| | | | |
| RATIOS/SUPPLEMENTAL DATA: | | | | | | | | |
Net assets, end of year (000s) | | $1,945 | | $2,149 | | $1,609 | | $568 |
Ratio of expenses to average net assets excluding fee waivers and reimbursements | | 6.28% | | 7.65% | | 12.05% | | 96.67%(e) |
Ratio of expenses to average net assets including fee waivers and reimbursements | | 1.60% | | 1.60% | | 1.60% | | 1.60%(e) |
Ratio of net investment income/(loss) to average net assets | | 0.00%(f) | | (0.42)% | | (0.49)% | | (1.36)%(e) |
Portfolio turnover rate(g) | | 65% | | 93% | | 114% | | 9% |
| (a) | Per share amounts and ratios to average net assets include income and expenses of the Kotak Mauritius Portfolio (wholly-owned subsidiary). |
| (b) | Calculated using the average shares method. |
| (c) | Less than $0.005 per share. |
| (d) | Total returns are for the period indicated and have not been annualized. Total returns would have been lower had certain expenses not been waived during the period. Returns shown do not reflect the deduction of taxes that a shareholder would pay on Fund distributions or the redemption of Fund shares. |
| (g) | Portfolio turnover rate for periods less than one full year have not been annualized. |
See Notes to Financial Statements.
44 | April 30, 2014
| | |
| ALPS | Red Rocks Listed Private Equity Fund |
| Management Commentary | | April 30, 2014 (Unaudited) |
Overview
During the last year we opined that “No Major Drama=Steadily Raising Values”. We could have just as easily equated that to Stability; for that is what we got. Stability has been and continues to be a very good thing for the capital markets and private equity alike.
That stability is born out of several things; low interest rates, easy access to both debt and equity, low to moderate GDP (Gross Domestic Product) growth in the developed world, continuing improvement in corporate profitability and decent M&A (Mergers & Acquisitions) activity. Yes, the market is no longer cheap - price multiples on deals continue to rise, along with debt to equity ratios, but, in our opinion, not to levels that are alarming. The emerging markets appear to be slowing, albeit from high-single digit to mid-single digit growth rates; growth that most developed countries would give their eye teeth to be experiencing. And finally, what seems to be a constant these days - geopolitical unrest, unevenness in economic prosperity, real wage stagnation, stubborn unemployment/underemployment in almost every labor market and concern surrounding expanding government/central bank balance sheets. All things considered, we think the situation is by no means perfect, but certainly good enough, especially when compared to where we were 5 - 6 years ago.
With the macro view out of the way, you might ask how private equity as an asset class is doing? Rather well. In fact, very well! Most private equity firms ended 2013 on a strong note and have continued the theme into 2014. The vast majority of their portfolio companies are growing revenue and/or experiencing growth in EBITDA (Earnings Before Interest, Taxes, Depreciation and Amortization). They are able to raise additional equity capital in these businesses at uplifts to most recent valuations. They are selectively putting investment capital to work in new businesses. And they are exiting older businesses/investments and returning capital to LPs (Limited Partners) and shareholders (shareholders of listed private equity vehicles) at a very strong pace; which means that those private equity firms that are accomplishing the above are well positioned to raise new funds from investors, have fresh capital to put to work in new businesses and have a new source of fee income for the private equity firm. This is the definition of the virtuous cycle in the private equity business.
I think the editor of Bloomberg’s Private Equity Brief, Jennifer Rossa, said it best in the March 5, 2014 edition: “Exits, Exits, Exits.” Exits are important in the private equity world. Exits at strong uplifts to invested capital (what’s commonly referred to as the multiple on investment) are VERY important. Firms that do this will thrive. Firms that do not, well they tend to wither.
Portfolio Review
The Fund’s I Shares Class returned 24.02% (Class A delivered a net return of 16.79% at MOP), compared with 14.23%, 17.56% and 16.62% for the MSCI World Index, the Red Rocks Global Listed Private Equity Index and the S&P® Listed Private Equity Index, respectively, during the period.
During the year, we exited thirteen securities, including: Aker Asa, American Capital Ltd., Bure Equity AB, Candover Investments PLC, Compass Diversified Holdings, Conversus Capital LP, Deutsche Beteiligungs AG, Graphite Enterprise Trust PLC, ICG Group Inc, Leucadia National Corp Com, NB Private Equity Partners, Princess Private Equity, and Safeguard Scientifics Inc. We added ten securities, including: 3I Group PLC, Better Capital PCC LTD, Capital Southwest Corp, CIR SPA, Compass Diversified Holdings, Danaher Corporation, Grande Parade Investments LTD, Melrose Industries PLC, Mutares AG and Riverstone Energy to the Fund.
Diversification of the Fund has not changed: investors are benefiting from a broadly diversified set of holdings from a geographical, industry, stage, vintage and underlying private equity manager perspective. At the end of the year, the Fund had 38 holdings in some of the top performing private equity funds/firms. Finding, researching and analyzing these investments continues to be the most challenging, yet the most rewarding part of what we do at Red Rocks Capital. Our objective is to assemble a global portfolio of the best listed private equity securities for the benefit of our shareholders.
Net contributors to performance for the year included:
Net detractors to performance for the year included:
Outlook
I am hard pressed to suggest that things can get better for private equity, but they can. That does not mean that they will. It just means that they can. Consistent 3.5% - 5.0% GDP growth would be a good place to start, coupled with a slow rise on the 10 year US Treasury Note to 3.5% - 4.0%. Will that happen? As I said before, I am not a prognosticator, although in this case, I wish I was.
A potential issue that I have previously highlighted continues to hold true in a rising valuation environment: private equity may be challenged to invest capital in new businesses at reasonable valuations (always in the eye of the beholder). Why is that a potential issue? Because new capital continues to flow into the top private equity firms and private equity firms and their investors want to see that capital put to work. We think chances are it will be put to work. Where, when and at what valuation is anyone’s guess. Stay tuned.
As always, we appreciate your continued support and interest in Red Rocks and the Listed Private Equity strategy.
Adam Goldman
Co-Portfolio Manager
45 | April 30, 2014
| | |
| ALPS | Red Rocks Listed Private Equity Fund |
Management Commentary | | April 30, 2014 (Unaudited) |
The views and information discussed in this commentary are as of the date of publication, are subject to change, and may not reflect the writer’s current views. The views expressed represent an assessment of market conditions at a specific point in time, are opinions only and should not be relied upon as investment advice regarding a particular investment or markets in general. Such information does not constitute a recommendation to buy or sell specific securities or investment vehicles. It should not be assumed that any investment will be profitable or will equal the performance of the fund(s) or any securities or any sectors mentioned herein. The subject matter contained herein has been derived from several sources believed to be reliable and accurate at the time of compilation. Red Rocks Capital LLC does not accept any liability for losses either direct or consequential caused by the use of this information.
Diversification cannot guarantee gain or prevent losses.
46 | April 30, 2014
| | |
| ALPS | Red Rocks Listed Private Equity Fund |
| Performance Update | | April 30, 2014 (Unaudited) |
Performance of $10,000 Initial Investment (as of April 30, 2014)
Comparison of change in value of a $10,000 investment (includes maximum sales charges of 5.50%)
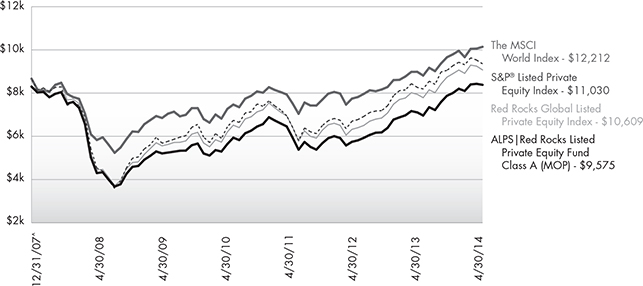
The chart above represents historical performance of a hypothetical investment of $10,000 in the Fund since inception. Past performance does not guarantee future results. This chart does not reflect the deduction of taxes that a shareholder would pay on Fund distributions or the redemption of Fund shares.
Average Annual Total Returns (as of April 30, 2014)
| | | | | | | | | | | | |
| | | 1 Year | | 3 Year | | 5 Year | | Since Inception^ | | Total
Expense Ratio | | What You Pay* |
Class A (NAV) | | 23.54% | | 9.35% | | 23.01% | | 0.20% | | 2.58% | | 2.58% |
Class A (MOP) | | 16.79% | | 7.33% | | 21.60% | | -0.68% | | |
Class C (NAV) | | 22.97% | | 8.55% | | 22.01% | | -0.60% | | 3.21% | | 3.21% |
Class C (CDSC) | | 21.97% | | 8.55% | | 22.01% | | -0.60% | | |
Class I (NAV) | | 24.02% | | 9.62% | | 23.30% | | 0.49% | | 2.23% | | 2.21% |
Class R | | 23.50% | | 9.30% | | 22.72% | | -0.08% | | 2.81% | | 2.71% |
Red Rocks Global Listed Private Equity Index1 | | 17.56% | | 8.45% | | 23.12% | | 0.94% | | | | |
S&P® LPE Total Return Index2 | | 16.62% | | 9.08% | | 16.03% | | 3.21% | | | | |
MSCI World Index3 | | 14.23% | | 9.26% | | 23.65% | | 1.56% | | | | |
Performance data quoted represents past performance. Past performance does not guarantee future results. Investment return and principal value of an investment will fluctuate so that an investor’s shares, when sold or redeemed, may be worth more or less than the original cost. Current performance data may be higher or lower than actual data quoted. For the most current month-end performance data, please call 1-866-759-5679.
Maximum Offering Price (MOP) for Class A shares includes the Fund’s maximum sales charge of 5.50%. Performance shown at NAV does not include these sales charges and would have been lower had it been taken into account. If you invest $1 million or more, either as a lump sum or through the Fund’s accumulation or letter of intent programs, you can purchase Class A shares without an initial sales charge (load). A Contingent Deferred Sales Charge (“CDSC”) of 1.00% may apply to Class C shares redeemed within the first 12 months after a purchase, and on Class A shares redeemed within the first 18 months after a purchase in excess of $1 million. The Fund imposes a 2.00% redemption fee on shares held for less than 90 days.
47 | April 30, 2014
| | |
| ALPS | Red Rocks Listed Private Equity Fund |
| Performance Update | | April 30, 2014 (Unaudited) |
Performance shown for Class C shares prior to June 30, 2010 reflects the historical performance of the Fund’s Class A shares, calculated using the fees and expenses of Class C shares.
| 1 | The Red Rocks Global Listed Private Equity Index is replacing the S&P Listed Private Equity Index as the Fund’s secondary index. The Red Rocks Global Listed Private Equity Index includes securities, ADRs and GDRs of 40 to 75 private equity companies, including business development companies, master limited partnerships and other vehicles whose principal business is to invest in, lend capital to or provide services to privately held companies. The Red Rocks Global Listed Private Equity Index is managed by the Fund’s Sub-Advisor. The Adviser and Sub-Advisor made this recommendation to the Board because the new index more closely aligns to the Fund’s investment strategies and investment restrictions. Information on both indices will be shown for a one-year transition period. |
| 2 | S&P® Listed Private Equity Index: The S&P® Listed Private Equity Index is comprised of 30 leading listed private equity companies that meet size, liquidity, exposure, and activity requirements. The index is designed to provide tradable exposure to the leading publicly listed companies in the private equity space. The index is not actively managed and does not reflect any deduction for fees, expenses or taxes. An investor may not invest directly in an index. |
| 3 | MSCI World Index: Morgan Stanley Capital International’s market capitalization weighted index is composed of companies representative of the market structure of 22 developed market countries in North America, Europe and the Asia/Pacific Region. The index is not actively managed and does not reflect any deduction for fees, expenses or taxes. An investor may not invest directly in an index. |
| ^ | Fund inception date of December 31, 2007. |
| * | What You Pay reflects the Advisor’s and Sub-Advisor’s decision to contractually limit expenses through August 31, 2013. Please see the prospectus for additional information. |
The table does not reflect the deduction of taxes that a shareholder would pay on Fund distributions or the redemption of Fund shares.
Listed Private Equity Companies are subject to various risks depending on their underlying investments, which could include, but are not limited to, additional liquidity risk, industry risk, non-U.S. security risk, currency risk, credit risk, managed portfolio risk and derivatives risk (derivatives risk is the risk that the value of the Listed Private Equity Companies’ derivative investments will fall because of pricing difficulties or lack of correlation with the underlying investment).
There are inherent risks in investing in private equity companies, which encompass financial institutions or vehicles whose principal business is to invest in and lend capital to privately held companies. Generally, little public information exists for private and thinly traded companies, and there is a risk that investors may not be able to make a fully informed investment decision.
Listed Private Equity Companies may have relatively concentrated investment portfolios, consisting of a relatively small number of holdings. A consequence of this limited number of investments is that the aggregate returns realized may be adversely impacted by the poor performance of a small number of investments, or even a single investment, particularly if a company experiences the need to write down the value of an investment.
Certain of the Fund’s investments may be exposed to liquidity risk due to low trading volume, lack of a market maker or legal restrictions limiting the ability of the Fund to sell particular securities at an advantageous price and/or time. As a result, these securities may be more difficult to value. Foreign investing involves special risks, such as currency fluctuations and political uncertainty. The Fund invests in derivatives and is subject to the risk that the value of those derivative investments will fall because of pricing difficulties or lack of correlation with the underlying investment.
There is no guarantee that the Fund will continue to hold any one particular security or stay invested in any one particular company. The composition of the Fund’s top holdings is subject to change. Performance figures are historical and reflect the change in share price, reinvested distributions, changes in net asset value, sales charges and capital gains distributions, if any.
Not FDIC Insured – No Bank Guarantee – May Lose Value
48 | April 30, 2014
| | |
| ALPS | Red Rocks Listed Private Equity Fund |
| Performance Update | | April 30, 2014 (Unaudited) |
Top Ten Holdings (as a % of Net Assets) †
| | | | |
Eurazeo SA | | | 5.38% | |
Onex Corp. | | | 5.33% | |
SVG Capital PLC | | | 4.78% | |
HarbourVest Global Private Equity, Ltd. | | | 4.75% | |
Blackstone Group LP | | | 4.73% | |
KKR & Co. LP | | | 4.64% | |
The Carlyle Group LP | | | 4.32% | |
Apollo Global Management LLC, Class A | | | 4.23% | |
Investor AB, B Shares | | | 4.12% | |
Wendel SA | | | 4.04% | |
Top Ten Holdings | | | 46.32% | |
| † | Holdings are subject to change. Table presents indicative values only. |
Industry Sector Allocation (as a % of Net Assets)
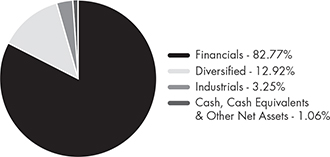
49 | April 30, 2014
| | |
| ALPS | Red Rocks Listed Private Equity Fund |
| Statement of Investments | | April 30, 2014 |
| | | | | | | | |
| | | Shares | | | Value (Note 2) | |
| |
COMMON STOCKS (98.94%) | | | | | |
| Diversified (12.92%) | | | | | | | | |
Holding Companies-Diversified Operations (12.92%) | |
Ackermans & van Haaren N.V. | | | 106,874 | | | $ | 13,818,891 | |
CIR-Compagnie Industriali Riunite
SpA(a) | | | 132,571 | | | | 204,154 | |
Remgro, Ltd. | | | 340,940 | | | | 6,858,985 | |
Schouw & Co. | | | 295,487 | | | | 16,476,970 | |
Wendel SA | | | 112,774 | | | | 16,983,376 | |
| | | | | | | | |
| | | | | | | 54,342,376 | |
| | | | | | | | |
| | |
| TOTAL DIVERSIFIED | | | | | | | 54,342,376 | |
| | | | | | | | |
| | |
| Financials (82.77%) | | | | | | | | |
Closed-End Funds (26.67%) | |
AP Alternative Assets
LP(a) | | | 153,002 | | | | 5,163,817 | |
Better Capital PCC,
Ltd.(a) | | | 1,887,775 | | | | 3,537,905 | |
Castle Private Equity, Ltd.(a) | | | 330,495 | | | | 4,806,654 | |
Electra Private Equity PLC(a) | | | 320,117 | | | | 14,430,884 | |
HarbourVest Global Private Equity, Ltd. | | | 1,762,432 | | | | 19,959,542 | |
HBM Healthcare Investments AG, Class A | | | 82,780 | | | | 6,819,168 | |
HgCapital Trust PLC | | | 912,360 | | | | 15,958,752 | |
Pantheon International Participations PLC, Ordinary Shares(a) | | | 271,059 | | | | 5,052,494 | |
Pantheon International Participations PLC, Redeemable Shares(a) | | | 213,200 | | | | 3,797,629 | |
Riverstone Energy,
Ltd.(a) | | | 218,854 | | | | 3,307,124 | |
Standard Life European Private | | | | | | | | |
Equity Trust PLC, Ordinary Shares | | | 2,635,944 | | | | 9,212,542 | |
SVG Capital PLC(a) | | | 2,801,294 | | | | 20,101,134 | |
| | | | | | | | |
| | | | | | | 112,147,645 | |
| | | | | | | | |
|
Diversified Financial Services (16.68%) | |
Blackstone Group LP | | | 673,778 | | | | 19,896,664 | |
Intermediate Capital Group PLC | | | 1,111,091 | | | | 8,321,739 | |
KKR & Co. LP | | | 859,407 | | | | 19,517,133 | |
Onex Corp. | | | 392,394 | | | | 22,411,263 | |
| | | | | | | | |
| | | | | | | 70,146,799 | |
| | | | | | | | |
|
Investment Companies (9.49%) | |
Capital Southwest Corp. | | | 106,308 | | | | 3,731,411 | |
Grand Parade Investments, Ltd. | | | 5,468,282 | | | | 2,806,779 | |
Hosken Consolidated Investments, Ltd. | | | 623,643 | | | | 8,891,826 | |
Investor AB, B Shares | | | 448,080 | | | | 17,331,383 | |
| | | | | | | | |
| | | Shares | | | Value (Note 2) | |
| |
Investment Companies (continued) | |
Oaktree Capital Group LLC | | | 134,832 | | | $ | 7,146,096 | |
| | | | | | | | |
| | | | | | | 39,907,495 | |
| | | | | | | | |
| | |
Private Equity (27.34%) | | | | | | | | |
3i Group PLC | | | 1,800,176 | | | | 11,543,642 | |
Altamir Amboise | | | 942,150 | | | | 14,273,416 | |
Apollo Global Management LLC, Class A | | | 655,464 | | | | 17,782,738 | |
Aurelius AG | | | 440,899 | | | | 16,368,559 | |
The Carlyle Group LP | | | 566,919 | | | | 18,186,762 | |
Eurazeo SA | | | 268,554 | | | | 22,622,917 | |
IP Group PLC(a) | | | 1,530,270 | | | | 4,443,953 | |
mutares AG | | | 7,959 | | | | 1,092,044 | |
Ratos AB, B Shares | | | 852,433 | | | | 8,659,100 | |
| | | | | | | | |
| | | | | | | 114,973,131 | |
| | | | | | | | |
| | |
Real Estate (2.59%) | | | | | | | | |
Brookfield Asset Management, Inc., Class A | | | 259,478 | | | | 10,913,645 | |
| | | | | | | | |
| | |
| TOTAL FINANCIALS | | | | | | | 348,088,715 | |
| | | | | | | | |
| | |
| Industrials (3.25%) | | | | | | | | |
Miscellaneous Manufacturers (3.25%) | | | | | | | | |
Danaher Corp. | | | 112,696 | | | | 8,269,632 | |
Melrose Industries PLC | | | 1,119,383 | | | | 5,395,824 | |
| | | | | | | | |
| | | | | | | 13,665,456 | |
| | | | | | | | |
| | |
| TOTAL INDUSTRIALS | | | | | | | 13,665,456 | |
| | | | | | | | |
| |
TOTAL COMMON STOCKS (Cost $322,801,884) | | | | 416,096,547 | |
| | | | | | | | |
| | | | | | | | | | | | |
| | | 7-Day
Yield | | | Shares | | | Value
(Note 2) | |
| |
SHORT TERM INVESTMENTS (1.07%) | | | | | |
Money Market Fund (1.07%) | | | | | |
Morgan Stanley Institutional Liquidity Funds - Prime Portfolio | | | 0.055 | % | | | 4,482,636 | | | | 4,482,636 | |
| | | | | | | | | | | | |
| |
TOTAL SHORT TERM INVESTMENTS (Cost $4,482,636) | | | | 4,482,636 | |
| | | | | | | | | | | | |
50 | April 30, 2014
| | |
| ALPS | Red Rocks Listed Private Equity Fund |
| Statement of Investments | | April 30, 2014 |
| | | | |
| | | Value (Note 2) | |
| |
TOTAL INVESTMENTS (100.01%) (Cost $327,284,520) | | $ | 420,579,183 | |
| |
Liabilities In Excess Of Other Assets (-0.01%) | | | (36,769) | |
| | | | |
| |
NET ASSETS (100.00%) | | $ | 420,542,414 | |
| | | | |
| (a) | Non-Income Producing Security. |
Common Abbreviations:
| AB - | Aktiebolag is the Swedish equivalent of the term corporation. |
| AG - | Aktiengesellschaft is a German term that refers to a corporation that is limited by shares, i.e., owned by shareholders. |
| LLC - | Limited Liability Company. |
| N.V. - | Naamloze Vennootschap is the Dutch term for a public limited liability corporation. |
| PCC | - Protected Cell Company. |
| PLC | - Public Limited Company. |
| SA - | Generally designates corporations in various countries, mostly those employing the civil law. |
| SpA - | Societa’ Per Azioni is an Italian shared company. |
For Fund compliance purposes, the Fund’s industry classifications refer to any one or more of the industry sub-classifications used by one or more widely recognized market indexes or ratings group indexes, and/or as defined by Fund management. This definition may not apply for purposes of this report, which may combine industry sub-classifications for reporting ease. Industries are shown as a percent of net assets.
See Notes to Financial Statements.
51 | April 30, 2014
| | |
| ALPS | Red Rocks Listed Private Equity Fund |
| Statement of Assets and Liabilities | | April 30, 2014 |
| | | | |
ASSETS | | | | |
Investments, at value | | $ | 420,579,183 | |
Foreign currency, at value (Cost $720,332) | | | 724,357 | |
Receivable for investments sold | | | 1,349,914 | |
Receivable for shares sold | | | 1,218,472 | |
Dividends and interest receivable | | | 1,070,735 | |
Prepaid expenses and other assets | | | 30,106 | |
Total Assets | | | 424,972,767 | |
LIABILITIES | | | | |
Payable for investments purchased | | | 3,597,409 | |
Payable for shares redeemed | | | 211,564 | |
Investment advisory fees payable | | | 315,100 | |
Administration and transfer agency fees payable | | | 54,727 | |
Distribution and services fees payable | | | 133,168 | |
Trustees’ fees and expenses payable | | | 3,262 | |
Professional fees payable | | | 31,030 | |
Custody fees payable | | | 17,063 | |
Accrued expenses and other liabilities | | | 67,030 | |
Total Liabilities | | | 4,430,353 | |
NET ASSETS | | $ | 420,542,414 | |
| | | | | |
NET ASSETS CONSIST OF | | | | |
Paid-in capital | | $ | 347,572,252 | |
Accumulated net investment loss | | | (21,142,940) | |
Accumulated net realized gain on investments and foreign currency transactions | | | 791,898 | |
Net unrealized appreciation on investments and translation of assets and liabilities denominated in foreign currencies | | | 93,321,204 | |
NET ASSETS | | $ | 420,542,414 | |
| | | | | |
INVESTMENTS, AT COST | | $ | 327,284,520 | |
| |
| PRICING OF SHARES | | | | |
Class A: | | | | |
Net Asset Value, offering and redemption price per share(a) | | $ | 7.00 | |
Net Assets | | $ | 205,726,512 | |
Shares of beneficial interest outstanding (unlimited number of shares, no par value common stock authorized) | | | 29,389,161 | |
Maximum offering price per share ((NAV/0.9450), based on maximum sales charge of 5.50% of the offering price) | | $ | 7.41 | |
Class C: | | | | |
Net Asset Value, offering and redemption price per share(a) | | $ | 6.83 | |
Net Assets | | $ | 12,200,123 | |
Shares of beneficial interest outstanding (unlimited number of shares, no par value common stock authorized) | | | 1,786,871 | |
Class I: | | | | |
Net Asset Value, offering and redemption price per share | | $ | 7.05 | |
Net Assets | | $ | 202,076,097 | |
Shares of beneficial interest outstanding (unlimited number of shares, no par value common stock authorized) | | | 28,648,425 | |
Class R: | | | | |
Net Asset Value, offering and redemption price per share | | $ | 6.21 | |
Net Assets | | $ | 539,682 | |
Shares of beneficial interest outstanding (unlimited number of shares, no par value common stock authorized) | | | 86,909 | |
| (a) | Redemption price per share may be reduced for any applicable contingent deferred sales charge. For a description of a possible sales charge, please see the Fund’s Prospectus. |
See Notes to Financial Statements.
52 | April 30, 2014
| | |
| ALPS | Red Rocks Listed Private Equity Fund |
| Statement of Operations | | For the Year Ended April 30, 2014 |
| | | | |
INVESTMENT INCOME | | | | |
Dividends | | $ | 7,542,694 | |
Foreign taxes withheld on dividends | | | (591,613) | |
Interest and other income | | | 12,916 | |
Total Investment Income | | | 6,963,997 | |
| |
EXPENSES | | | | |
Investment advisory fees | | | 2,774,129 | |
Administrative and transfer agency fees | | | 499,363 | |
Distribution and service fees | | | | |
Class A | | | 611,346 | |
Class C | | | 70,686 | |
Class R | | | 1,822 | |
Professional fees | | | 43,852 | |
Networking fees | | | | |
Class A | | | 57,600 | |
Class C | | | 3,734 | |
Class I | | | 158,952 | |
Class R | | | 159 | |
Reports to shareholders and printing fees | | | 58,974 | |
State registration fees | | | 69,183 | |
SEC registration fees | | | 15,927 | |
Insurance fees | | | 4,791 | |
Custody fees | | | 111,588 | |
Trustees’ fees and expenses | | | 12,833 | |
Repayment of previously waived fees | | | | |
Class A | | | 168,480 | |
Class C | | | 3,091 | |
Class I | | | 73,922 | |
Class R | | | 263 | |
Miscellaneous expenses | | | 19,431 | |
Total Expenses | | | 4,760,126 | |
Net Investment Income | | | 2,203,871 | |
Net realized gain on investments | | | 31,042,197 | |
Net realized loss on foreign currency transactions | | | (79,801) | |
Net change in unrealized appreciation on investments | | | 36,500,824 | |
Net change in unrealized appreciation on translation of assets and liabilities denominated in foreign currencies | | | 17,156 | |
| NET REALIZED AND UNREALIZED GAIN ON INVESTMENTS | | | 67,480,376 | |
| NET INCREASE IN NET ASSETS RESULTING FROM OPERATIONS | | $ | 69,684,247 | |
| | | | | |
See Notes to Financial Statements.
53 | April 30, 2014
| | |
| ALPS | Red Rocks Listed Private Equity Fund |
| Statements of Changes in Net Assets | | |
| | | | | | | | |
| | | For the
Year Ended
April 30, 2014 | | | For the
Year Ended
April 30, 2013 | |
| |
OPERATIONS | | | | | | | | |
Net investment income | | $ | 2,203,871 | | | $ | 3,533,375 | |
Net realized gain on investments and foreign currency transactions | | | 30,962,396 | | | | 4,919,331 | |
Net change in unrealized appreciation on investments and translation of assets and liabilities denominated in foreign currencies | | | 36,517,980 | | | | 46,645,985 | |
Net Increase in Net Assets Resulting from Operations | | | 69,684,247 | | | | 55,098,691 | |
| | |
DISTRIBUTIONS | | | | | | | | |
Dividends to shareholders from net investment income | | | | | | | | |
Class A | | | (11,258,970) | | | | (1,393,693) | |
Class C | | | (444,823) | | | | (36,855) | |
Class I | | | (11,570,862) | | | | (1,868,287) | |
Class R | | | (25,293) | | | | (1,190) | |
Net Decrease in Net Assets from Distributions | | | (23,299,948) | | | | (3,300,025) | |
| | |
BENEFICIAL INTEREST TRANSACTIONS (NOTE 6) | | | | | | | | |
Shares sold | | | | | | | | |
Class A | | | 104,537,580 | | | | 29,478,167 | |
Class C | | | 7,052,467 | | | | 1,238,806 | |
Class I | | | 93,622,391 | | | | 60,979,444 | |
Class R | | | 330,734 | | | | 148,586 | |
Dividends reinvested | | | | | | | | |
Class A | | | 10,565,914 | | | | 1,275,595 | |
Class C | | | 357,600 | | | | 30,465 | |
Class I | | | 4,362,094 | | | | 656,092 | |
Class R | | | 23,238 | | | | 813 | |
Shares redeemed, net of redemption fees | | | | | | | | |
Class A | | | (36,821,447) | | | | (33,853,264) | |
Class C | | | (554,548) | | | | (541,528) | |
Class I | | | (57,218,383) | | | | (29,674,718) | |
Class R | | | (52,283) | | | | (25,800) | |
Net Increase in Net Assets Derived from Beneficial Interest Transactions | | | 126,205,357 | | | | 29,712,658 | |
| | |
Net increase in net assets | | | 172,589,656 | | | | 81,511,324 | |
| | |
NET ASSETS | | | | | | | | |
Beginning of year | | | 247,952,758 | | | | 166,441,434 | |
End of year * | | $ | 420,542,414 | | | $ | 247,952,758 | |
| | | | | | | | | |
*Including accumulated net investment loss of: | | $ | (21,142,940) | | | $ | (8,376,470) | |
See Notes to Financial Statements.
54 | April 30, 2014
| | |
| ALPS | Red Rocks Listed Private Equity Fund – Class A |
| Financial Highlights | | |
Selected data for a share of beneficial interest outstanding throughout the periods indicated:
| | | | | | | | | | |
| | | For the Year
Ended
April 30, 2014 | | For the Year
Ended
April 30, 2013 | | For the Year
Ended
April 30, 2012 | | For the Year
Ended
April 30, 2011 | | For the Year
Ended
April 30, 2010 |
Net asset value, beginning of period | | $6.05 | | $4.67 | | $6.44 | | $5.17 | | $3.56 |
| |
| INCOME/(LOSS) FROM INVESTMENT OPERATIONS: | | |
Net investment income | | 0.03(a) | | 0.08(a) | | 0.07(a) | | 0.04(a) | | 0.14 |
Net realized and unrealized gain/(loss) | | 1.37 | | 1.39 | | (1.41) | | 1.61 | | 1.99 |
Total from investment operations | | 1.40 | | 1.47 | | (1.34) | | 1.65 | | 2.13 |
| | | | | |
| DISTRIBUTIONS: | | | | | | | | | | |
From net investment income | | (0.45) | | (0.09) | | (0.43) | | (0.38) | | (0.52) |
Total distributions | | (0.45) | | (0.09) | | (0.43) | | (0.38) | | (0.52) |
| | | | | |
REDEMPTION FEES ADDED TO
PAID-IN CAPITAL (NOTE 6) | | 0.00(b) | | 0.00(b) | | 0.00(b) | | 0.00(b) | | 0.00(b) |
Net increase/(decrease) in net asset value | | 0.95 | | 1.38 | | (1.77) | | 1.27 | | 1.61 |
Net asset value, end of year | | $7.00 | | $6.05 | | $4.67 | | $6.44 | | $5.17 |
| | | | | | | | | | | |
TOTAL RETURN(c) | | 23.54% | | 31.75% | | (19.68)% | | 33.22% | | 61.68% |
| |
| RATIOS/SUPPLEMENTAL DATA: | | |
Net assets, end of year (000s) | | $205,727 | | $105,488 | | $85,807 | | $124,874 | | $67,192 |
Ratio of expenses to average net assets excluding fee waivers and reimbursements(d) | | 1.64% | | 1.53% | | 1.71% | | 1.70% | | 1.71% |
Ratio of expenses to average net assets including fee waivers and reimbursements(d) | | 1.64%(e) | | 1.51%(f) | | 1.50% | | 1.50% | | 1.44%(g) |
Ratio of net investment income to average net assets(d) | | 0.46% | | 1.54% | | 1.34% | | 0.67% | | 0.42% |
Portfolio turnover rate(h) | | 40% | | 32% | | 72% | | 43% | | 54% |
| (a) | Calculated using the average shares method. |
| (b) | Less than $0.005 per share. |
| (c) | Total returns are for the period indicated and have not been annualized. Total returns would have been lower had certain expenses not been waived during the period. Returns shown do not reflect the deduction of taxes that a shareholder would pay on Fund distributions or the redemption of Fund shares. Returns shown exclude any applicable sales charges. |
| (d) | The ratios exclude the impact of expenses of the underlying funds in which the Fund invests as represented in the Statement of Investments. |
| (e) | According to the Fund’s shareholder services plan with respect to the Fund’s Class A shares, any amount of such payment not paid during the Fund’s fiscal year for such service activities shall be reimbursed to the Fund as soon as practical after the end of the fiscal year. Fees were reimbursed to the Fund during the year ended April 30, 2014, for the prior fiscal year in the amount of 0.01% of average net assets of Class A shares. |
| (f) | Contractual expense limitation changed from 1.50% to 1.65% effective September 1, 2012. |
| (g) | Contractual expense limitation changed from 1.25% to 1.50% effective September 1, 2009. |
| (h) | Portfolio turnover rate for periods less than one full year have not been annualized. |
See Notes to Financial Statements.
55 | April 30, 2014
| | |
| ALPS | Red Rocks Listed Private Equity Fund – Class C |
| Financial Highlights | | |
Selected data for a share of beneficial interest outstanding throughout the periods indicated:
| | | | | | | | |
| | | For the Year Ended
April 30, 2014 | | For the Year Ended
April 30, 2013 | | For the Year Ended
April 30, 2012 | | For the Period
July 2, 2010
(Inception) to
April 30, 2011 |
Net asset value, beginning of period | | $5.92 | | $4.59 | | $6.37 | | $4.39 |
|
| INCOME/(LOSS) FROM INVESTMENT OPERATIONS: |
Net investment income/(loss)(a) | | (0.00)(b) | | 0.04 | | 0.03 | | (0.01) |
Net realized and unrealized gain/(loss) | | 1.33 | | 1.35 | | (1.39) | | 2.36 |
Total from investment operations | | 1.33 | | 1.39 | | (1.36) | | 2.35 |
| | | | |
| DISTRIBUTIONS: | | | | | | | | |
From net investment income | | (0.42) | | (0.06) | | (0.42) | | (0.37) |
Total distributions | | (0.42) | | (0.06) | | (0.42) | | (0.37) |
| | | | |
REDEMPTION FEES ADDED TO PAID-IN CAPITAL (NOTE 6) | | 0.00(b) | | 0.00(b) | | 0.00(b) | | 0.00(b) |
Net increase/(decrease) in net asset value | | 0.91 | | 1.33 | | (1.78) | | 1.98 |
Net asset value, end of year | | $6.83 | | $5.92 | | $4.59 | | $6.37 |
| | | | | | | | | |
| | | | |
TOTAL RETURN(c) | | 22.97% | | 30.55% | | (20.33)% | | 55.32% |
| | | |
| RATIOS/SUPPLEMENTAL DATA: | | | | | | |
Net assets, end of year (000s) | | $12,200 | | $4,417 | | $2,838 | | $2,566 |
Ratio of expenses to average net assets excluding fee waivers and reimbursements(d) | | 2.20% | | 2.25% | | 2.37% | | 2.31%(e) |
Ratio of expenses to average net assets including fee waivers and reimbursements(d) | | 2.20% | | 2.25% | | 2.25% | | 2.25%(e) |
Ratio of net investment income/(loss) to average net assets(d) | | (0.04)% | | 0.79% | | 0.59% | | (0.19)%(e) |
Portfolio turnover rate(f) | | 40% | | 32% | | 72% | | 43%(g) |
| (a) | Calculated using the average shares method. |
| (b) | Less than $0.005 per share. |
| (c) | Total returns are for the period indicated and have not been annualized. Total returns would have been lower had certain expenses not been waived during the period. Returns shown do not reflect the deduction of taxes that a shareholder would pay on Fund distributions or the redemption of Fund shares. Returns shown exclude any applicable sales charges. |
| (d) | The ratios exclude the impact of expenses of the underlying funds in which the Fund invests as represented in the Statement of Investments. |
| (f) | Portfolio turnover rate for periods less than one full year have not been annualized. |
| (g) | Portfolio turnover rate is calculated at the Fund Level and represents the year ended April 30, 2011. |
See Notes to Financial Statements.
56 | April 30, 2014
| | |
| ALPS | Red Rocks Listed Private Equity Fund – Class I |
| Financial Highlights | | |
Selected data for a share of beneficial interest outstanding throughout the periods indicated:
| | | | | | | | | | |
| | | For the Year
Ended
April 30, 2014 | | For the Year
Ended
April 30, 2013 | | For the Year
Ended
April 30, 2012 | | For the Year
Ended
April 30, 2011 | | For the Year
Ended
April 30, 2010 |
Net asset value, beginning of period | | $6.08 | | $4.69 | | $6.47 | | $5.19 | | $3.57 |
| |
| INCOME/(LOSS) FROM INVESTMENT OPERATIONS: | | |
Net investment income | | 0.06(a) | | 0.12(a) | | 0.08(a) | | 0.05(a) | | 0.28 |
Net realized and unrealized gain/(loss) | | 1.37 | | 1.36 | | (1.42) | | 1.62 | | 1.87 |
Total from investment operations | | 1.43 | | 1.48 | | (1.34) | | 1.67 | | 2.15 |
| | | | | |
| DISTRIBUTIONS: | | | | | | | | | | |
From net investment income | | (0.46) | | (0.09) | | (0.44) | | (0.39) | | (0.53) |
Total distributions | | (0.46) | | (0.09) | | (0.44) | | (0.39) | | (0.53) |
| | | | | |
REDEMPTION FEES ADDED TO PAID-IN CAPITAL (NOTE 6) | | 0.00(b) | | 0.00(b) | | 0.00(b) | | 0.00(b) | | 0.00(b) |
Net increase/(decrease) in net asset value | | 0.97 | | 1.39 | | (1.78) | | 1.28 | | 1.62 |
Net asset value, end of year | | $7.05 | | $6.08 | | $4.69 | | $6.47 | | $5.19 |
| | | | | | | | | | | |
TOTAL RETURN(c) | | 24.02% | | 31.99% | | (19.52)% | | 33.47% | | 62.09% |
| |
| RATIOS/SUPPLEMENTAL DATA: | | |
Net assets, end of year (000s) | | $202,076 | | $137,856 | | $77,750 | | $66,854 | | $45,144 |
Ratio of expenses to average net assets excluding fee waivers and reimbursements(d) | | 1.25% | | 1.27% | | 1.41% | | 1.36% | | 1.47% |
Ratio of expenses to average net assets including fee waivers and reimbursements(d) | | 1.25% | | 1.25% | | 1.25% | | 1.25% | | 1.19%(e) |
Ratio of net investment income to average net assets(d) | | 0.91% | | 2.27% | | 1.60% | | 0.91% | | 0.78% |
Portfolio turnover rate(f) | | 40% | | 32% | | 72% | | 43% | | 54% |
| (a) | Calculated using the average shares method. |
| (b) | Less than $0.005 per share. |
| (c) | Total returns are for the period indicated and have not been annualized. Total returns would have been lower had certain expenses not been waived during the period. Returns shown do not reflect the deduction of taxes that a shareholder would pay on Fund distributions or the redemption of Fund shares. |
| (d) | The ratios exclude the impact of expenses of the underlying funds in which the Fund invests as represented in the Statement of Investments. |
| (e) | Contractual expense limitation changed from 1.00% to 1.25% effective September 1, 2009. |
| (f) | Portfolio turnover rate for periods less than one full year have not been annualized. |
See Notes to Financial Statements.
57 | April 30, 2014
| | |
| ALPS | Red Rocks Listed Private Equity Fund – Class R |
| Financial Highlights | | |
Selected data for a share of beneficial interest outstanding throughout the periods indicated:
| | | | | | | | | | |
| | | For the Year
Ended
April 30, 2014 | | For the Year
Ended
April 30, 2013 | | For the Year
Ended
April 30, 2012 | | For the Year
Ended
April 30, 2011 | | For the Year
Ended
April 30, 2010 |
Net asset value, beginning of period | | $5.41 | | $4.17 | | $5.82 | | $4.73 | | $3.31 |
| |
| INCOME/(LOSS) FROM INVESTMENT OPERATIONS: | | |
Net investment income/(loss) | | 0.02(a) | | 0.08(a) | | 0.05(a) | | 0.03(a) | | (0.09) |
Net realized and unrealized gain/(loss) | | 1.22 | | 1.24 | | (1.27) | | 1.43 | | 2.02 |
Total from investment operations | | 1.24 | | 1.32 | | (1.22) | | 1.46 | | 1.93 |
| | | | | |
| DISTRIBUTIONS: | | | | | | | | | | |
From net investment income | | (0.44) | | (0.08) | | (0.43) | | (0.37) | | (0.51) |
Total distributions | | (0.44) | | (0.08) | | (0.43) | | (0.37) | | (0.51) |
| | | | | |
Net increase/(decrease) in net asset value | | 0.80 | | 1.24 | | (1.65) | | 1.09 | | 1.42 |
Net asset value, end of year | | $6.21 | | $5.41 | | $4.17 | | $5.82 | | $4.73 |
| | | | | | | | | | | |
TOTAL RETURN(b) | | 23.50% | | 32.05% | | (19.93)% | | 32.47% | | 60.92% |
| |
| RATIOS/SUPPLEMENTAL DATA: | | |
Net assets, end of year (000s) | | $540 | | $191 | | $46 | | $125 | | $18 |
Ratio of expenses to average net assets excluding fee waivers and reimbursements(c) | | 1.72% | | 1.85% | | 1.89% | | 1.87% | | 2.27% |
Ratio of expenses to average net assets including fee waivers and reimbursements(c) | | 1.72% | | 1.75% | | 1.75% | | 1.75% | | 1.75%(d) |
Ratio of net investment income/(loss) to average net assets(c) | | 0.36% | | 1.80% | | 1.10% | | 0.66% | | (0.24)% |
Portfolio turnover rate(e) | | 40% | | 32% | | 72% | | 43% | | 54% |
| (a) | Calculated using the average shares method. |
| (b) | Total returns are for the period indicated and have not been annualized. Total returns would have been lower had certain expenses not been waived during the period. Returns shown do not reflect the deduction of taxes that a shareholder would pay on Fund distributions or the redemption of Fund shares. |
| (c) | The ratios exclude the impact of expenses of the underlying funds in which the Fund invests as represented in the Statement of Investments. |
| (d) | Contractual expense limitation changed from 1.50% to 1.75% effective September 1, 2009. |
| (e) | Portfolio turnover rate for periods less than one full year have not been annualized. |
See Notes to Financial Statements.
58 | April 30, 2014
| | |
| ALPS | WMC Disciplined Value Fund |
| Management Commentary | | April 30, 2014 (Unaudited) |
Market Commentary
US equities moved higher during the period, in part due to improving economic indicators and continued central bank interventions around the globe. Markets rose in July after US Federal Reserve Chairman Ben Bernanke emphasized the need for continued “highly accommodative monetary policy,” which helped to quash the tapering fears that dominated the markets earlier in the period. However, US equities suffered their worst month of 2013 in August after heightened geopolitical risks took center stage; investors focused on the widening conflict in Syria and the potential for an imminent US military strike against the regime of Syrian President Bashar al-Assad. In September, the Federal Open Market Committee’s decision to leave the pace of its monthly asset purchases unchanged at $85 billion surprised many investors and US equities rose as a result. Unfortunately, the liquidity-fueled euphoria was short-lived as the ideological gridlock in Congress stifled the rally; the centerpiece of the fiscal battle was defunding or delaying the Affordable Care Act (Obamacare). US equities rose into the end of 2013 as a result of a last-minute deal by the US Congress to reopen the US government and extend the debt ceiling, solid corporate earnings, and accommodative rhetoric from Fed chairman nominee Janet Yellen. After finishing their best year since 1997, US stocks began 2014 with their worst month in nearly two years. Worries about a slowdown in China and general angst surrounding emerging markets overshadowed a fairly benign domestic environment. Despite a myriad of adverse weather-influenced economic data, US equities rebounded from January’s pullback and finished February at an all-time high. Robust merger and acquisition activity and an uncontested increase in the debt ceiling from Congress helped stoke investors’ risk appetites. In March, momentum stocks came under heightened scrutiny late in the month causing some market participants to question the staying power of the five-year-old bull market. This rotation out of the momentum and high-beta* areas of the market continued in April, but the trend appeared to be abating toward the end of the month.
Within the Russell 1000 Value Index, all ten sectors posted positive returns, with the information technology, industrials, and materials sectors gaining the most. Telecommunication services and utilities lagged the most during the period.
Fund Review
The Fund outperformed its benchmark for the period, on a gross of fee basis, posting positive relative results in seven out of ten broad market sectors. Overall, stock selection was additive relative to the Russell 1000 Value Index1, as decisions in health care, financials, and energy more than offset negative relative performance from stock selection in information technology and consumer staples.
Top contributors to relative performance included Forest Labs (health care), Ameriprise Financial (financials), and Gilead Sciences (health care). Forest Labs, a US-based pharmaceutical company, saw its shares soar on news that Actavis, the world’s second-largest generic-drug maker by market value, agreed to buy Forest for about $25 billion. Shares of Ameriprise Financial, a global provider of a range of financial products and services, outperformed after the firm
posted strong quarterly earnings that exceeded consensus expectations. The company’s advice and wealth management segment drove results as stronger advisor productivity and well contained expenses, combined with upward trending equity markets, led to solid earnings growth. Shares of Gilead Sciences, a biopharmaceutical company, moved higher as quarterly results were driven by growing sales of the firm’s antiviral franchise and pipeline momentum continued to build. After reaching a record high toward the end of February, the stock gave back some its gains in March as the market rotated sharply from higher growth stocks (including biotechnology) to more defensive names with more modest valuations. The pullback proved short-lived as Gilead rebounded in April following a strong earnings report due to robust sales of Sovaldi (hepatitis C treatment).
Detractors from relative performance for the period included Philip Morris International (consumer staples), Genpact (information technology), and Xcel Energy (utilities). Shares of Philip Morris, a US-based manufacturer and distributor of tobacco products in markets outside the US, including a presence in emerging markets, declined after the firm reported earnings that fell short of consensus expectations due to weak cigarette shipments, a tax-related price increase in the Philippines, and weakness in Europe and Latin America. We eliminated our position in Philip Morris during the period. Shares of Genpact, a business process outsourcing (BPO) services provider, declined after the company lowered revenue guidance due to slower completion of larger deals and lower volumes. Xcel Energy, a major U.S. electric and gas company operating in eight states, underperformed as some investors feared that the company could face slow growth and higher capital deployment in the near term; ongoing regulatory risk in Minnesota also contributed to investors’ anxieties. We eliminated our position in Xcel Energy during the period.
Outlook
We believe the US economy remains poised for continued moderate growth. As the impact of frigid weather fades, we believe the economy should regain some momentum. While we are seeing turnover activity in housing take a breather as a result of higher mortgage rates and house prices, our expectation remains that the second half of this year should see renewed upward momentum. Home prices are still up double digits year over year, inventories remain tight, and we are starting to see some evidence of easing lending standards. Employment data had been on a positive trend but this has become more mixed lately; however, the tepid jobs reports in January and February was also impacted by poor weather. We think job creation and wage gains will gradually improve over the course of the year. In addition, we are seeing positive indicators for non-residential construction and positive sentiment in the trucking industry. While the Fed is on track to end quantitative easing this year and further normalize policy in 2015, we believe overall monetary policy should remain fairly accommodative for some time.
59 | April 30, 2014
| | |
| ALPS | WMC Disciplined Value Fund |
| Management Commentary | | April 30, 2014 (Unaudited) |
As of the end of the period, the Fund was most overweight the health care, consumer discretionary, and energy sectors and most underweight the information technology, utilities, and financials sectors.
Mammen Chally, CFA
Vice President and Equity Portfolio Manager
| * | Beta is a measure of the volatility, or systematic risk, of a security or a portfolio in comparison to the market as a whole. |
The views and information discussed in this commentary are as of the date of publication, are subject to change, and may not reflect the writer’s current views. The views expressed represent an assessment of market conditions at a specific point in time, are opinions only and should not be relied upon as investment advice regarding a particular investment or markets in general. Such information does not constitute a recommendation to buy or sell specific securities or investment vehicles. It should not be assumed that any investment will be profitable or will equal the performance of the fund(s) or any securities or any sectors mentioned herein. The subject matter contained herein has been derived from several sources believed to be reliable and accurate at the time of compilation. Wellington Management Company, LLP does not accept any liability for losses either direct or consequential caused by the use of this information.
60 | April 30, 2014
| | |
| ALPS | WMC Disciplined Value Fund |
| Performance Update | | April 30, 2014 (Unaudited) |
Performance of $10,000 Initial Investment (as of April 30, 2014)
Comparison of change in value of a $10,000 investment (includes maximum sales charges of 5.50%)
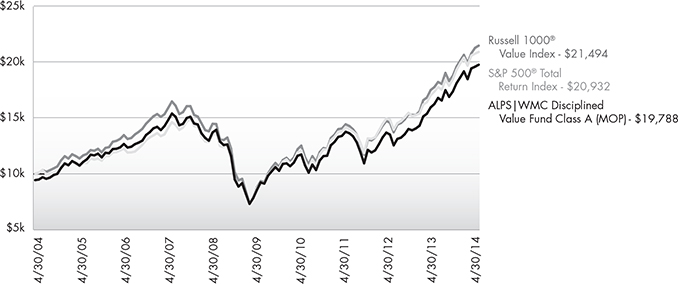
The chart above represents historical performance of a hypothetical investment of $10,000 in the Fund since inception. Past performance does not guarantee future results. This chart does not reflect the deduction of taxes that a shareholder would pay on Fund distributions or the redemption of Fund shares.
Average Annual Total Returns (as of April 30, 2014)
| | | | | | | | | | |
| | | | | | | | | Total | | |
| | | 1 Year | | 5 Year | | 10 Year | | Expense Ratio | | What You Pay* |
Class A (NAV) | | 21.70% | | 18.20% | | 7.67% | | 1.51% | | 1.40% |
Class A (MOP) | | 15.04% | | 16.86% | | 7.06% | | |
Class C (NAV) | | 20.97% | | 17.34% | | 6.88% | | 2.26% | | 2.15% |
Class C (CDSC) | | 19.97% | | 17.34% | | 6.88% | | |
Class I | | 22.11% | | 18.52% | | 7.88% | | 1.26% | | 1.15% |
Russell 1000® Value Index1 | | 20.90% | | 19.52% | | 7.95% | | | | |
S&P 500® Total Return Index2 | | 20.44% | | 19.14% | | 7.67% | | | | |
Performance data quoted represents past performance. Past performance does not guarantee future results. Investment return and principal value of an investment will fluctuate so that an investor’s shares, when sold or redeemed, may be worth more or less than the original cost. Current performance data may be higher or lower than actual data quoted. For the most current month-end performance data, please call 1-866-759-5679.
Maximum Offering Price (MOP) for Class A shares includes the Fund’s maximum sales charge of 5.50%. Performance shown at NAV does not include these sales charges and would have been lower had it been taken into account. If you invest $1 million or more, either as a lump sum or through the Fund’s accumulation or letter of intent programs, you can purchase Class A shares without an initial sales charge (load). A Contingent Deferred Sales Charge (“CDSC”) of 1.00% may apply to Class C shares redeemed within the first 12 months after a purchase, and on Class A shares redeemed within the first 18 months after a purchase in excess of $1 million.
Performance shown for Class C shares prior to June 30, 2010 reflects the historical performance of the Fund’s Class A shares, calculated using the fees and expenses of Class C shares.
The performance shown for the ALPS | WMC Disciplined Value Fund (the “Fund”) for periods prior to August 29, 2009, reflects the performance of the Activa Mutual Funds Trust – Activa Value Fund (as result of a prior reorganization of Activa Mutual Funds Trust – Activa Value Fund into the Fund).
61 | April 30, 2014
| | |
| ALPS | WMC Disciplined Value Fund |
| Performance Update | | April 30, 2014 (Unaudited) |
| 1 | The Russell 1000® Value Index measures the performance of those Russell 1000® companies with lower price-to-book ratios and lower forecasted growth values. The index is not actively managed and does not reflect any deduction for fees, expenses or taxes. An investor may not invest directly in an index. |
| 2 | The S&P 500® Index is the Standard & Poor’s composite index of 500 stocks, a widely recognized, unmanaged index of common stock prices. The index is not actively managed and does not reflect any deduction for fees, expenses or taxes. An investor may not invest directly in an index. |
| * | What You Pay reflects the Advisor’s decision to contractually limit expenses through August 31, 2014. Please see the prospectus for additional information. |
The table does not reflect the deduction of taxes that a shareholder would pay on Fund distributions or the redemption of Fund shares.
There is no guarantee that the Fund will continue to hold any one particular security or stay invested in any one particular company. The composition of the Fund’s top holdings is subject to change. Performance figures are historical and reflect the change in share price, reinvested distributions, changes in net asset value, sales charges and capital gains distributions, if any.
Not FDIC Insured – No Bank Guarantee – May Lose Value
Top Ten Holdings (as a % of Net Assets) †
| | | | |
Wells Fargo & Co. | | | 3.47 | % |
Chevron Corp. | | | 3.44 | % |
JPMorgan Chase & Co. | | | 3.24 | % |
iShares® Russell 1000® Value Index Fund | | | 2.90 | % |
Merck & Co., Inc. | | | 2.68 | % |
Exxon Mobil Corp. | | | 2.57 | % |
Citigroup, Inc. | | | 2.13 | % |
Ameriprise Financial, Inc. | | | 2.08 | % |
CVS Caremark Corp. | | | 2.05 | % |
ACE, Ltd. | | | 1.89 | % |
Top Ten Holdings | | | 26.45 | % |
Industry Sector Allocation (as a % of Net Assets)
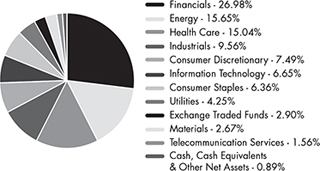
| † | Holdings are subject to change. Table presents indicative values only. |
62 | April 30, 2014
| | |
| ALPS | WMC Disciplined Value Fund |
Statement of Investments | | April 30, 2014 |
| | | | | | | | |
| | | Shares | | | Value (Note 2) | |
| |
COMMON STOCKS (96.21%) | |
| Consumer Discretionary (7.49%) | |
Automobiles & Components (1.07%) | |
TRW Automotive Holdings Corp.(a) | | | 13,880 | | | $ | 1,115,258 | |
| | | | | | | | |
Consumer Durables & Apparel (1.07%) | |
PVH Corp. | | | 8,865 | | | | 1,113,178 | |
| | | | | | | | |
| | |
Media (2.26%) DIRECTV(a) | | | 5,530 | | | | 429,128 | |
Twenty-First
Century Fox,
Inc., Class A | | | 34,945 | | | | 1,118,939 | |
Viacom, Inc.,
Class B | | | 9,410 | | | | 799,662 | |
| | | | | | | | |
| | | | | | | 2,347,729 | |
| | | | | | | | |
Retailing (3.09%) | | | | | | | | |
Dollar Tree, Inc.(a) | | | 18,850 | | | | 981,520 | |
Lowe’s Cos., Inc. | | | 24,585 | | | | 1,128,697 | |
TJX Cos., Inc. | | | 18,930 | | | | 1,101,347 | |
| | | | | | | | |
| | | | | | | 3,211,564 | |
| | | | | | | | |
| |
TOTAL CONSUMER
DISCRETIONARY | | | | 7,787,729 | |
| | | | | | | | |
| |
| Consumer Staples (6.36%) | | | | | |
Food & Staples Retailing (2.89%) | |
CVS Caremark Corp. | | | 29,245 | | | | 2,126,696 | |
Walgreen Co. | | | 12,930 | | | | 877,947 | |
| | | | | | | | |
| | | | | | | 3,004,643 | |
| | | | | | | | |
|
Food Beverage & Tobacco (2.72%) | |
Altria Group, Inc. | | | 32,180 | | | | 1,290,740 | |
The Hillshire
Brands Co. | | | 24,520 | | | | 874,138 | |
The JM Smucker Co. | | | 6,885 | | | | 665,642 | |
| | | | | | | | |
| | | | | | | 2,830,520 | |
| | | | | | | | |
Household & Personal Products (0.75%) | |
Coty, Inc., Class A | | | 48,150 | | | | 772,808 | |
| | | | | | | | |
| |
TOTAL CONSUMER
STAPLES | | | | 6,607,971 | |
| | | | | | | | |
| | |
| Energy (15.65%) | | | | | | | | |
Energy (15.65%) | | | | | | | | |
Anadarko
Petroleum Corp. | | | 16,900 | | | | 1,673,438 | |
Chesapeake
Energy Corp. | | | 26,640 | | | | 765,900 | |
Chevron Corp. | | | 28,469 | | | | 3,573,429 | |
ConocoPhillips | | | 8,560 | | | | 636,094 | |
EOG Resources,
Inc. | | | 10,820 | | | | 1,060,360 | |
Exxon Mobil Corp. | | | 26,054 | | | | 2,668,190 | |
Halliburton Co. | | | 21,405 | | | | 1,350,013 | |
Marathon Oil Corp. | | | 26,430 | | | | 955,444 | |
Marathon
Petroleum Corp. | | | 8,800 | | | | 817,960 | |
Patterson-UTI
Energy, Inc. | | | 26,500 | | | | 862,045 | |
| | | | | | | | |
| | | Shares | | | Value (Note 2) | |
| |
Energy (continued) | | | | | | | | |
PBF Energy, Inc.,
Class A | | | 15,870 | | | $ | 488,479 | |
Phillips 66 | | | 16,940 | | | | 1,409,747 | |
| | | | | | | | |
| | |
| TOTAL ENERGY | | | | | | | 16,261,099 | |
| | | | | | | | |
| | |
| Financials (26.98%) | | | | | | | | |
Banks (11.02%) | | | | | | | | |
Citigroup, Inc. | | | 46,105 | | | | 2,208,891 | |
JPMorgan Chase & Co. | | | 60,073 | | | | 3,362,886 | |
Ocwen Financial Corp.(a) | | | 10,330 | | | | 391,507 | |
The PNC Financial
Services Group, Inc. | | | 15,130 | | | | 1,271,525 | |
Wells Fargo & Co. | | | 72,740 | | | | 3,610,814 | |
Zions Bancorporation | | | 20,890 | | | | 604,139 | |
| | | | | | | | |
| | | | | | | 11,449,762 | |
| | | | | | | | |
Diversified Financials (5.87%) | |
Ameriprise Financial, Inc. | | | 19,370 | | | | 2,162,273 | |
BlackRock, Inc. | | | 4,140 | | | | 1,246,140 | |
Invesco, Ltd. | | | 35,520 | | | | 1,250,659 | |
Morgan Stanley | | | 35,960 | | | | 1,112,243 | |
Santander Consumer
USA Holdings, Inc. | | | 14,740 | | | | 335,188 | |
| | | | | | | | |
| | | | | | | 6,106,503 | |
| | | | | | | | |
Insurance (6.66%) | | | | | | | | |
ACE, Ltd. | | | 19,160 | | | | 1,960,451 | |
American International
Group, Inc. | | | 29,200 | | | | 1,551,396 | |
Aon PLC | | | 16,770 | | | | 1,423,438 | |
Lincoln National Corp. | | | 17,150 | | | | 831,946 | |
Prudential Financial, Inc. | | | 14,310 | | | | 1,154,531 | |
| | | | | | | | |
| | | | | | | 6,921,762 | |
| | | | | | | | |
Real Estate (3.43%) | | | | | | | | |
American Capital
Agency Corp. | | | 42,510 | | | | 965,402 | |
Camden Property Trust | | | 11,435 | | | | 783,183 | |
Equity Lifestyle
Properties, Inc. | | | 17,100 | | | | 715,977 | |
Forest City Enterprises,
Inc., Class A(a) | | | 58,020 | | | | 1,097,158 | |
| | | | | | | | |
| | | | | | | 3,561,720 | |
| | | | | | | | |
| | |
| TOTAL FINANCIALS | | | | | | | 28,039,747 | |
| | | | | | | | |
| | |
| Health Care (15.04%) | | | | | | | | |
Health Care Equipment & Services (5.64%) | |
Aetna, Inc. | | | 13,250 | | | | 946,712 | |
Covidien PLC | | | 12,080 | | | | 860,700 | |
Envision Healthcare
Holdings, Inc.(a) | | | 20,720 | | | | 700,129 | |
McKesson Corp. | | | 6,680 | | | | 1,130,189 | |
63 | April 30, 2014
| | |
| ALPS | WMC Disciplined Value Fund |
Statement of Investments | | April 30, 2014 |
| | | | | | | | |
| | | Shares | | | Value (Note 2) | |
Health Care Equipment & Services (continued) | |
UnitedHealth Group, Inc. | | | 18,640 | | | $ | 1,398,746 | |
Zimmer Holdings, Inc. | | | 8,470 | | | | 819,896 | |
| | | | | | | | |
| | | | | | | 5,856,372 | |
| | | | | | | | |
|
Pharmaceuticals, Biotechnology & Life Sciences (9.40%) | |
Actavis plc(a) | | | 7,090 | | | | 1,448,700 | |
Bristol-Myers Squibb Co. | | | 27,465 | | | | 1,375,722 | |
Forest Laboratories,
Inc.(a) | | | 20,543 | | | | 1,888,107 | |
Gilead Sciences,
Inc.(a) | | | 16,700 | | | | 1,310,783 | |
Merck & Co., Inc. | | | 47,620 | | | | 2,788,627 | |
Thermo Fisher Scientific, Inc. | | | 8,430 | | | | 961,020 | |
| | | | | | | | |
| | | | | | | 9,772,959 | |
| | | | | | | | |
| |
| TOTAL HEALTH CARE | | | | 15,629,331 | |
| | | | | | | | |
| | |
| Industrials (9.56%) | | | | | | | | |
Capital Goods (5.39%) | |
The Boeing Co. | | | 6,560 | | | | 846,371 | |
Dover Corp. | | | 11,420 | | | | 986,688 | |
General Electric Co. | | | 45,865 | | | | 1,233,310 | |
Parker Hannifin Corp. | | | 9,220 | | | | 1,169,834 | |
United Technologies Corp. | | | 11,580 | | | | 1,370,261 | |
| | | | | | | | |
| | | | | | | 5,606,464 | |
| | | | | | | | |
|
Commercial & Professional Services (2.35%) | |
Equifax, Inc. | | | 14,110 | | | | 999,129 | |
Towers Watson &
Co., Class A | | | 8,720 | | | | 978,558 | |
Verisk Analytics, Inc.,
Class A(a) | | | 7,750 | | | | 465,698 | |
| | | | | | | | |
| | | | | | | 2,443,385 | |
| | | | | | | | |
Transportation (1.82%) | | | | | |
Hertz Global
Holdings, Inc.(a) | | | 45,455 | | | | 1,294,104 | |
United Continental
Holdings, Inc.(a) | | | 14,600 | | | | 596,702 | |
| | | | | | | | |
| | | | | | | 1,890,806 | |
| | | | | | | | |
| | |
| TOTAL INDUSTRIALS | | | | | | | 9,940,655 | |
| | | | | | | | |
| |
| Information Technology (6.65%) | | | | | |
Semiconductors & Semiconductor Equipment (0.58%) | |
Altera Corp. | | | 18,455 | | | | 600,157 | |
| | | | | | | | |
|
Software & Services (4.42%) | |
Accenture PLC, Class A | | | 9,495 | | | | 761,689 | |
Activision Blizzard, Inc. | | | 31,520 | | | | 630,715 | |
Genpact, Ltd.(a) | | | 49,385 | | | | 832,631 | |
VeriSign, Inc.(a) | | | 15,030 | | | | 709,115 | |
Visa, Inc., A Shares | | | 4,100 | | | | 830,701 | |
Yahoo! Inc(a) | | | 22,940 | | | | 824,693 | |
| | | | | | | | |
| | | | | | | 4,589,544 | |
| | | | | | | | |
| | | | | | | | |
| | | Shares | | | Value (Note 2) | |
Technology Hardware & Equipment (1.65%) | |
Apple, Inc. | | | 2,910 | | | $ | 1,717,162 | |
| | | | | | | | |
| |
TOTAL INFORMATION TECHNOLOGY | | | | 6,906,863 | |
| | | | | | | | |
| | |
| Materials (2.67%) | | | | | | | | |
Materials (2.67%) | | | | | | | | |
Crown Holdings, Inc.(a) | | | 20,295 | | | | 957,315 | |
The Dow Chemical Co. | | | 36,458 | | | | 1,819,254 | |
| | | | | | | | |
| | |
| TOTAL MATERIALS | | | | | | | 2,776,569 | |
| | | | | | | | |
|
| Telecommunication Services (1.56%) | |
|
Telecommunication Services (1.56%) | |
AT&T, Inc. | | | 45,295 | | | | 1,617,032 | |
| | | | | | | | |
| |
TOTAL TELECOMMUNICATION SERVICES | | | | 1,617,032 | |
| | | | | | | | |
| | |
| Utilities (4.25%) | | | | | | | | |
Utilities (4.25%) | | | | | | | | |
American Electric Power Co., Inc | | | 21,940 | | | | 1,180,591 | |
NextEra Energy, Inc. | | | 17,710 | | | | 1,768,344 | |
NRG Energy, Inc. | | | 10,620 | | | | 347,486 | |
PG&E Corp. | | | 24,700 | | | | 1,125,826 | |
| | | | | | | | |
| | |
| TOTAL UTILITIES | | | | | | | 4,422,247 | |
| | | | | | | | |
| |
TOTAL COMMON STOCKS
(Cost $65,524,222) | | | | 99,989,243 | |
| | | | | | | | |
|
| EXCHANGE TRADED FUNDS (2.90%) | |
iShares® Russell 1000®
Value Index Fund | | | 30,990 | | | | 3,017,806 | |
| | | | | | | | |
| |
TOTAL EXCHANGE TRADED FUNDS
(Cost $2,835,450) | | | | 3,017,806 | |
| | | | | | | | |
| | | | | | | | | | | | |
| | | 7-Day Yield | | | Shares | | | Value (Note 2) | |
| SHORT TERM INVESTMENTS (0.89%) | |
| Money Market Fund (0.89%) | |
Morgan Stanley Institutional Liquidity Funds - Prime Portfolio | | | 0.055 | % | | | 920,059 | | | | 920,059 | |
| | | | | | | | | | | | |
| |
TOTAL SHORT TERM
INVESTMENTS
(Cost $920,059) | | | | 920,059 | |
| | | | | | | | | | | | |
64 | April 30, 2014
| | |
| ALPS | WMC Disciplined Value Fund |
Statement of Investments | | April 30, 2014 |
| | | | |
| | | Value (Note 2) | |
TOTAL INVESTMENTS (100.00%) | | | | |
(Cost $69,279,731) | | $ | 103,927,108 | |
| |
Other Assets In Excess Of Liabilities (0.00%)(b) | | | 3,462 | |
| | | | |
| | | | |
| |
| NET ASSETS (100.00%) | | $ | 103,930,570 | |
| | | | |
| (a) | Non-Income Producing Security. |
Common Abbreviations:
Ltd. - Limited.
PLC - Public Limited Company.
For Fund compliance purposes, the Fund’s industry classifications refer to any one or more of the industry sub-classifications used by one or more widely recognized market indexes or ratings group indexes, and/or as defined by Fund management. This definition may not apply for purposes of this report, which may combine industry sub-classifications for reporting ease. Industries are shown as a percent of net assets.
See Notes to Financial Statements.
65 | April 30, 2014
| | |
| ALPS | WMC Disciplined Value Fund |
Statement of Assets and Liabilities | | April 30, 2014 |
| | | | |
ASSETS | | | | |
Investments, at value | | $ | 103,927,108 | |
Receivable for shares sold | | | 35,021 | |
Dividends receivable | | | 81,516 | |
Prepaid expenses and other assets | | | 15,894 | |
Total Assets | | | 104,059,539 | |
LIABILITIES | | | | |
Payable for shares redeemed | | | 1,000 | |
Investment advisory fees payable | | | 73,165 | |
Administration and transfer agency fees payable | | | 17,660 | |
Distribution and services fees payable | | | 12,086 | |
Trustees’ fees and expenses payable | | | 832 | |
Professional fees payable | | | 16,572 | |
Accrued expenses and other liabilities | | | 7,654 | |
Total Liabilities | | | 128,969 | |
| NET ASSETS | | $ | 103,930,570 | |
| | | | | |
NET ASSETS CONSIST OF | | | | |
Paid-in capital | | $ | 69,427,919 | |
Accumulated net investment loss | | | (138,735) | |
Accumulated net realized loss on investments | | | (5,991) | |
Net unrealized appreciation on investments | | | 34,647,377 | |
| NET ASSETS | | $ | 103,930,570 | |
| | | | | |
| INVESTMENTS, AT COST | | $ | 69,279,731 | |
| |
| PRICING OF SHARES | | | | |
Class A: | | | | |
Net Asset Value, offering and redemption price per share(a) | | $ | 11.92 | |
Net Assets | | $ | 59,068,890 | |
Shares of beneficial interest outstanding (unlimited number of shares, no par value common stock authorized) | | | 4,954,046 | |
Maximum offering price per share ((NAV/0.9450), based on maximum sales charge of 5.50% of the offering price) | | $ | 12.61 | |
Class C: | | | | |
Net Asset Value, offering and redemption price per share(a) | | $ | 11.80 | |
Net Assets | | $ | 132,503 | |
Shares of beneficial interest outstanding (unlimited number of shares, no par value common stock authorized) | | | 11,231 | |
Class I: | | | | |
Net Asset Value, offering and redemption price per share | | $ | 12.05 | |
Net Assets | | $ | 44,729,177 | |
Shares of beneficial interest outstanding (unlimited number of shares, no par value common stock authorized) | | | 3,713,131 | |
| (a) | Redemption price per share may be reduced for any applicable contingent deferred sales charge. For a description of a possible sales charge, please see the Fund’s Prospectus. |
See Notes to Financial Statements.
66 | April 30, 2014
| | |
| ALPS | WMC Disciplined Value Fund |
| Statement of Operations | | For the Year Ended April 30, 2014 |
| | | | |
INVESTMENT INCOME | | | | |
Dividends | | $ | 1,872,494 | |
Total Investment Income | | | 1,872,494 | |
| |
| EXPENSES | | | | |
Investment advisory fees | | | 927,411 | |
Administrative and transfer agency fees | | | 167,183 | |
Distribution and service fees | | | | |
Class A | | | 135,923 | |
Class C | | | 1,091 | |
Professional fees | | | 21,914 | |
Reports to shareholders and printing fees | | | 16,577 | |
State registration fees | | | 33,461 | |
Insurance fees | | | 1,843 | |
Custody fees | | | 10,629 | |
Trustees’ fees and expenses | | | 3,745 | |
Miscellaneous expenses | | | 11,720 | |
Total Expenses | | | 1,331,497 | |
Less fees waived/reimbursed by investment advisor (Note 8) | | | | |
Class A | | | (39,957) | |
Class C | | | (81) | |
Class I | | | (31,790) | |
Net Expenses | | | 1,259,669 | |
Net Investment Income | | | 612,825 | |
Net realized gain on investments | | | 6,559,877 | |
Net realized gain distributions from other investment companies | | | 13,515 | |
Net change in unrealized appreciation on investments | | | 12,117,145 | |
| NET REALIZED AND UNREALIZED GAIN ON INVESTMENTS | | | 18,690,537 | |
| NET INCREASE IN NET ASSETS RESULTING FROM OPERATIONS | | $ | 19,303,362 | |
| | | | | |
See Notes to Financial Statements.
67 | April 30, 2014
| | |
| ALPS | WMC Disciplined Value Fund |
| Statements of Changes in Net Assets | | |
| | | | | | | | |
| | | For the
Year Ended
April 30, 2014 | | | For the
Year Ended
April 30, 2013 | |
OPERATIONS | | | | | | | | |
Net investment income | | $ | 612,825 | | | $ | 832,964 | |
Net realized gain on investments | | | 6,559,877 | | | | 3,959,551 | |
Net realized gain distributions from other investment companies | | | 13,515 | | | | – | |
Net change in unrealized appreciation on investments | | | 12,117,145 | | | | 10,023,480 | |
Net Increase in Net Assets Resulting from Operations | | | 19,303,362 | | | | 14,815,995 | |
| | |
| DISTRIBUTIONS | | | | | | | | |
Dividends to shareholders from net investment income | | | | | | | | |
Class A | | | (528,474) | | | | (495,861) | |
Class C | | | (670) | | | | (501) | |
Class I | | | (470,800) | | | | (393,650) | |
Dividends to shareholders from net realized gains | | | | | | | | |
Class A | | | (642,398) | | | | – | |
Class C | | | (1,397) | | | | – | |
Class I | | | (488,619) | | | | – | |
Net Decrease in Net Assets from Distributions | | | (2,132,358) | | | | (890,012) | |
| | |
| BENEFICIAL INTEREST TRANSACTIONS (NOTE 6) | | | | | | | | |
Shares sold | | | | | | | | |
Class A | | | 2,472,682 | | | | 2,079,629 | |
Class C | | | 28,068 | | | | 6,300 | |
Class I | | | 5,245,365 | | | | 5,541,680 | |
Dividends reinvested | | | | | | | | |
Class A | | | 1,120,556 | | | | 472,006 | |
Class C | | | 2,067 | | | | 501 | |
Class I | | | 958,847 | | | | 393,650 | |
Shares redeemed | | | | | | | | |
Class A | | | (4,195,516) | | | | (5,504,904) | |
Class C | | | (16,613) | | | | – | |
Class I | | | (8,515,750) | | | | (6,958,371) | |
Net Decrease in Net Assets Derived from Beneficial Interest Transactions | | | (2,900,294) | | | | (3,969,509) | |
| | |
Net increase in net assets | | | 14,270,710 | | | | 9,956,474 | |
| | |
| NET ASSETS | | | | | | | | |
Beginning of year | | | 89,659,860 | | | | 79,703,386 | |
End of year * | | $ | 103,930,570 | | | $ | 89,659,860 | |
| | | | | | | | | |
*Including accumulated net investment income/(loss) of: | | $ | (138,735) | | | $ | 240,154 | |
See Notes to Financial Statements.
68 | April 30, 2014
| | |
| ALPS | WMC Disciplined Value Fund – Class A |
| Financial Highlights | | |
Selected data for a share of beneficial interest outstanding throughout the periods indicated:
| | | | | | | | | | | | |
| | | For the Year
Ended
April 30, 2014 | | For the Year
Ended
April 30, 2013 (a) | | For the Year
Ended
April 30, 2012 | | For the Year
Ended
April 30, 2011 (b) | | For the Period
January 1, 2010 to
April 30, 2010 (c) | | For the Year
Ended
December 31, 2009 |
Net asset value, beginning of period | | $10.01 | | $8.42 | | $8.64 | | $7.43 | | $6.92 | | $5.86 |
| | |
| INCOME/(LOSS) FROM INVESTMENT OPERATIONS: | | | | |
Net investment income | | 0.06(d) | | 0.08(d) | | 0.06(d) | | 0.06(d) | | 0.03 | | 0.07 |
Net realized and unrealized gain/(loss) | | 2.09 | | 1.61 | | (0.23) | | 1.22 | | 0.48 | | 1.06 |
Total from investment operations | | 2.15 | | 1.69 | | (0.17) | | 1.28 | | 0.51 | | 1.13 |
| | | | | | |
| DISTRIBUTIONS: | | | | | | | | | | | | |
From net investment income | | (0.11) | | (0.10) | | (0.05) | | (0.07) | | – | | (0.07) |
From net realized gains | | (0.13) | | – | | – | | – | | – | | – |
Total distributions | | (0.24) | | (0.10) | | (0.05) | | (0.07) | | – | | (0.07) |
| | | | | | |
Net increase/(decrease) in net asset value | | 1.91 | | 1.59 | | (0.22) | | 1.21 | | 0.51 | | 1.06 |
Net asset value, end of year | | $11.92 | | $10.01 | | $8.42 | | $8.64 | | $7.43 | | $6.92 |
| | | | | | | | | | | | | |
TOTAL RETURN(e) | | 21.70% | | 20.17% | | (1.81)% | | 17.34% | | 7.22% | | 19.24% |
| | |
| RATIOS/SUPPLEMENTAL DATA: | | | | |
Net assets, end of year (000s) | | $59,069 | | $50,142 | | $44,989 | | $48,899 | | $45,300 | | $62,264 |
Ratio of expenses to average net assets excluding fee waivers and reimbursements | | 1.47% | | 1.51% | | 1.58% | | 1.71% | | 1.70%(f) | | N/A |
Ratio of expenses to average net assets including fee waivers and reimbursements | | 1.40% | | 1.40% | | 1.40% | | 1.40% | | 1.40%(f) | | 1.62% |
Ratio of net investment income to average net assets | | 0.52% | | 0.95% | | 0.83% | | 0.77% | | 0.60%(f) | | 1.12% |
Portfolio turnover rate(g) | | 19% | | 34% | | 46% | | 44% | | 11% | | 56% |
| (a) | Prior to August 31, 2012, the ALPS | WMC Value Disciplined Fund was known as the ALPS | WMC Value Intersection Fund. |
| (b) | Prior to August 31, 2010, the ALPS | WMC Value Intersection Fund was known as the Activa Value Fund (as a result of the reorganization of Activa Mutual Funds Trust - Activa Value Fund into the fund). |
| (c) | Effective March 9, 2010, the Board approved changing the fiscal year-end of the Fund from December 31 to April 30. |
| (d) | Calculated using the average shares method. |
| (e) | Total returns are for the period indicated and have not been annualized. Total returns would have been lower had certain expenses not been waived during the period. Returns shown do not reflect the deduction of taxes that a shareholder would pay on Fund distributions or the redemption of Fund shares. Returns shown exclude any applicable sales charges. |
| (g) | Portfolio turnover rate for periods less than one full year have not been annualized. |
See Notes to Financial Statements.
69 | April 30, 2014
| | |
| ALPS | WMC Disciplined Value Fund – Class C |
| Financial Highlights | | |
Selected data for a share of beneficial interest outstanding throughout the periods indicated:
| | | | | | | | |
| | | For the Year Ended
April 30, 2014 | | For the Year Ended
April 30, 2013 (a) | | For the Year Ended
April 30, 2012 | | For the Period July 2, 2010 (Inception) to
April 30, 2011 (b) |
Net asset value, beginning of period | | $9.93 | | $8.39 | | $8.62 | | $6.40 |
|
INCOME/(LOSS) FROM INVESTMENT OPERATIONS: |
Net investment
income/(loss)(c) | | (0.02) | | 0.02 | | (0.01) | | (0.01) |
Net realized and
unrealized gain/(loss) | | 2.08 | | 1.57 | | (0.20) | | 2.27 |
Total from
investment
operations | | 2.06 | | 1.59 | | (0.21) | | 2.26 |
| | | | |
| DISTRIBUTIONS: | | | | | | | | |
From net investment income | | (0.06) | | (0.05) | | (0.02) | | (0.04) |
From net
realized gains | | (0.13) | | – | | – | | – |
Total
distributions | | (0.19) | | (0.05) | | (0.02) | | (0.04) |
| | | | |
Net increase/(decrease) in net asset value | | 1.87 | | 1.54 | | (0.23) | | 2.22 |
Net asset value, end of year | | $11.80 | | $9.93 | | $8.39 | | $8.62 |
| | | | | | | | | |
TOTAL RETURN(d) | | 20.97% | | 19.07% | | (2.45)% | | 35.44% |
|
RATIOS/SUPPLEMENTAL DATA: |
Net assets, end of year (000s) | | $133 | | $100 | | $79 | | $14 |
Ratio of expenses to average net assets excluding fee waivers and reimbursements | | 2.22% | | 2.26% | | 2.38% | | 2.49% (e) |
Ratio of expenses to average net assets including fee waivers and reimbursements | | 2.15% | | 2.15% | | 2.15% | | 2.15%(e) |
Ratio of net investment income/(loss) to average net assets | | (0.23)% | | 0.19% | | (0.16)% | | (0.09)%(e) |
Portfolio turnover rate(f) | | 19% | | 34% | | 46% | | 44%(g) |
| (a) | Prior to August 31, 2012, the ALPS | WMC Value Disciplined Fund was known as the ALPS | WMC Value Intersection Fund. |
| (b) | Prior to August 31, 2010, the ALPS | WMC Value Intersection Fund was known as the Activa Value Fund (as a result of the reorganization
of Activa Mutual Funds Trust - Activa Value Fund into the fund). |
| (c) | Calculated using the average shares method. |
| (d) | Total returns are for the period indicated and have not been annualized. Total returns would have been lower had certain expenses not been waived during the period. Returns shown do not reflect the deduction of taxes that a shareholder would pay on Fund distributions or the redemption of Fund shares. Returns shown exclude any applicable sales charges. |
| (f) | Portfolio turnover rate for periods less than one full year have not been annualized. |
| (g) | Portfolio turnover rate is calculated at the Fund Level and represents the year ended April 30, 2011. |
See Notes to Financial Statements.
70 | April 30, 2014
| | |
| ALPS | WMC Disciplined Value Fund – Class I |
| Financial Highlights | | |
Selected data for a share of beneficial interest outstanding throughout the periods indicated:
| | | | | | | | | | | | |
| | | For the Year
Ended April 30, 2014 | | For the Year
Ended April 30, 2013 (a) | | For the Year
Ended April 30, 2012 | | For the Year
Ended April 30, 2011 (b) | | For the Period
January 1, 2010 to
April 30, 2010 (c) | | For the Year
Ended
December 31,
2009 |
Net asset value, beginning of period | | $10.10 | | $8.49 | | $8.71 | | $7.48 | | $6.96 | | $5.89 |
| | |
| INCOME/(LOSS) FROM INVESTMENT OPERATIONS: | | | | |
Net investment income | | 0.09(d) | | 0.11(d) | | 0.09(d) | | 0.07(d) | | 0.02 | | 0.07 |
Net realized and unrealized gain/(loss) | | 2.12 | | 1.61 | | (0.24) | | 1.24 | | 0.50 | | 1.08 |
Total from investment operations | | 2.21 | | 1.72 | | (0.15) | | 1.31 | | 0.52 | | 1.15 |
| | | | | | |
| DISTRIBUTIONS: | | | | | | | | | | | | |
From net investment income | | (0.13) | | (0.11) | | (0.07) | | (0.08) | | – | | (0.08) |
From net realized
gains | | (0.13) | | – | | – | | – | | – | | – |
Total distributions | | (0.26) | | (0.11) | | (0.07) | | (0.08) | | – | | (0.08) |
| | | | | | |
Net increase/(decrease) in net asset value | | 1.95 | | 1.61 | | (0.22) | | 1.23 | | 0.52 | | 1.07 |
Net asset value,
end of year | | $12.05 | | $10.10 | | $8.49 | | $8.71 | | $7.48 | | $6.96 |
| | | | | | | | | | | | | |
TOTAL RETURN(e) | | 22.11% | | 20.43% | | (1.62)% | | 17.67% | | 7.47% | | 19.59% |
| | |
| RATIOS/SUPPLEMENTAL DATA: | | | | |
Net assets, end of year (000s) | | $44,729 | | $39,417 | | $34,636 | | $29,251 | | $16,814 | | $16,465 |
Ratio of expenses to average net assets excluding fee waivers and reimbursements | | 1.22% | | 1.26% | | 1.33% | | 1.46% | | 1.49%(f) | | N/A |
Ratio of expenses to average net assets including fee waivers and reimbursements | | 1.15% | | 1.15% | | 1.15% | | 1.15% | | 1.15%(f) | | 1.46% |
Ratio of net investment income to average net assets | | 0.77% | | 1.20% | | 1.08% | | 0.95% | | 0.77%(f) | | 1.17% |
Portfolio turnover rate(g) | | 19% | | 34% | | 46% | | 44% | | 11% | | 56% |
| (a) | Prior to August 31, 2012, the ALPS | WMC Value Disciplined Fund was known as the ALPS | WMC Value Intersection Fund. |
| (b) | Prior to August 31, 2010, the ALPS | WMC Value Intersection Fund was known as the Activa Value Fund (as a result of the reorganization
of Activa Mutual Funds Trust - Activa Value Fund into the fund). |
| (c) | Effective March 9, 2010, the Board approved changing the fiscal year-end of the Fund from December 31 to April 30. |
| (d) | Calculated using the average shares method. |
| (e) | Total returns are for the period indicated and have not been annualized. Total returns would have been lower had certain expenses not
been waived during the period. Returns shown do not reflect the deduction of taxes that a shareholder would pay on Fund distributions or
the redemption of Fund shares. |
| (g) | Portfolio turnover rate for periods less than one full year have not been annualized. |
See Notes to Financial Statements.
71 | April 30, 2014
| | |
| Clough China Fund |
| Management Commentary | | April 30, 2014 (Unaudited) |
During the fiscal year ending April 30, 2014, the Clough China Fund Class A NAV was down approximately 2.7% and the MSCI China Index declined 1.25%. The market was turbulent during these twelve months with major Chinese stock indices subject to brutal swings in investors’ sentiment. The fiscal year started quite badly with a liquidity squeeze at the end of June as the authorities tried to manage a slowdown in credit growth and so-called “shadow banking” activities. Later, Chinese equities recovered thanks to a gradual improvement in macro economic data and reassuring policy developments introduced by Beijing. However, the market weakened once again as we began 2014. The most significant and common concern about China is related to the slowdown in economic growth from 9 – 10% per year in the prior decade until 2011, to 7.8% in 2012, 7.7% in 2013 and 7.4% in the first quarter 2014, which is an eighteen month low and slightly below the official 7.5% growth target1.
The slowdown has been largely engineered by the new Xi Jinping-led government in a shift of policy from an economic growth model based on quantity, volume and production to a new model focused more on quality, services and consumption. Indeed, given the massive scale the Chinese economy has already achieved after growing from $2.2 trillion in 2005 to $9.2 trillion last year it is only natural that the potential economic growth rate is lower2. Other concerns emerged in the last four months as well. Let’s mention three of them. The first default in China’s bond market occurred in March when a small solar company failed to pay its coupon. Since then at least two other firms (a real estate developer and a steel maker) have also shown signs of serious financial stress and difficulty in refinancing debts. Although the amounts of money involved in each of these cases are tiny compared to the size of China’s financial system, the news had quite a negative impact on markets. The second factor is more significant and perhaps more disturbing for investors; it is the change in the Central Bank policy on the foreign exchange rate after the PBOC (People’s Bank of China) widened the currency trading band from 1 to 2% in March and then allowed the currency to depreciate by some 2% against the US Dollar without giving any indication of a target or a time frame for the future evolution of the Yuan. This change and the lack of visibility seriously undermined confidence. And finally, the property sector entered a correction phase with new residential unit starts falling 24.5%, sales volume down 8.6% and sales value down 8.6% in the first four months of 2014. Home prices have started to retreat in a number of small to mid-size cities3.
As these factors put the market under more pressure, the MSCI China Index dropped 8% in the first four months of 2014. Navigating and avoiding pitfalls became a challenge. Major market themes changed abruptly: cheap, “old economy stocks” (e.g., banks and telecoms), almost all State-owned Enterprises (SOEs), engineered a nice rally while expensive “new economy” stocks (e.g., Internet, e-commerce and traditional retailers and consumer products companies) suddenly plunged. Long term attractive sectors benefiting from policy support such as renewable energy and environment protection were sold out as well. In general, large capitalization stocks outperformed small capitalization stocks, which was a similar rotation witnessed in US stock markets as well in recent months.
Portfolio Composition
The Fund’s overweight in Consumer Discretionary and Information Technology sectors generated positive returns and the stock selection in the utilities sector, focused on water business – both treatment and distribution – strongly outperformed the benchmark.
In terms of individual stocks, the largest contributor to performance was Tencent Holdings Limited, the leading provider of Internet, mobile and telecommunication value-added services who also has the largest mobile game distribution platform. This highly innovative group, whose online games still account for the majority of revenue and results, enjoys a high growth rate coming both from robust organic growth and a very active acquisition strategy to diversify and expand its platform. It entered new areas such as online outlets, logistics services, search and wealth management products and bought a stake in a Korean game developer. The shares more than doubled between the beginning of May 2013 and March 2014 before retreating by 25% in the following two months after valuation stretched higher to more than 40x earnings and as the Chinese government started discussing the regulation of online payments and Internet finance in an effort to protect the banks against the rising competition in this booming area. First quarter results recently released were strong and beat analyst expectations with core net earnings gaining 29% year-over-year. Revenue rose 36%, driven by mobile gaming, which tripled from a year ago and on-line ads revenue up 39%. The group financial position is very healthy with more than $5.0 billion of net cash on the balance sheet and a 32% Return on Equity (ROE).
Man Wah Holdings was our second best performer, followed by China Everbright International.
Man Wah is a home furnishing group, engaged in the design and manufacturing of high-end reclining sofas under the brand Cheers, sold in Mainland China and Hong Kong and exported to international markets such as North America and Europe where it has been gaining market shares steadily in the last several years through acquiring new retail customers and expanding its distribution network. It now has the dominant position in terms of market share in China and is the fourth largest in the United States. In our view, Man Wah is well managed, generating strong financial performance with both high sales growth and profitability enhancement – net profit margin rose from 12% to 16% in its last fiscal year for instance. As such, earnings growth has accelerated over the last few years which was due not only to its consistent marketing efforts but also to a very serious cost control process and efficiency gains. Net profit for the recently announced fiscal year to end March 2014 rose 72% and the balance sheet has a net cash position.
China Everbright International (CEI), our long-held favorite holding in the water and environmental services sector, builds and operates waste-to-energy projects, water treatment plants and alternative energy projects in several Provinces after it entered the business in
72 | April 30, 2014
| | |
| Clough China Fund |
| Management Commentary | | April 30, 2014 (Unaudited) |
Jiangsu ten years ago. CEI is gaining market share across the country thanks to its solid reputation of high quality execution skills. Profit margins in new developments such as hazardous waste treatment are higher than average and the group is winning new contracts almost every week. New initiatives include the group attempt to inject all its water treatment business into a Singapore listed company (Hankore), which would represent a new financing platform to support its fast expansion pace. Last year core earnings jumped 50% and its net gearing improved from 50 to 32%.
Major detractors to the Fund’s performance were Skyworth Digital – a maker of color TV sets and other audio digital products, whose earnings were disappointing; CNOOC, China’s leading offshore oil producer; and Anton Oilfield Group, a company which specializes in providing unconventional oil exploration techniques such as fracking and coiled tubing for shale oil and gas fields. None of these three stocks is still held by the Fund.
Outlook
As we mentioned above, the Chinese economy is slowing down and the trend is accentuated by the government policy to continue to implement a “prudent” monetary policy, i.e. to keep bank lending and monetary growth under control. Money supply, as measured by M2, is targeted to grow only 13% this year, down slightly from its 13.6% increase last year. Fixed Asset Investment (FAI) is expected to grow 17.5% down from 19.6% growth in 2013 and retail sales are forecast to rise 14.5%, up from 13.1%3. However, the first several months of 2014 show a somewhat different profile from government targets. While M2 is increasing in line, by around 13% and FAI is up 17.3% year-to-date, consumer spending looks relatively weak – retail sales were up only 12.2% in March and 11.9% in April3. Meanwhile, exports are flattish. Domestic consumption as well as corporate profit performances is suffering from a consistent deflationary trend seen in production prices (PPI) falling for more than a year. Consumer prices have also softened, with Consumer Price Index (CPI) measuring just 1.8% in April 2014 vs. 2.5% last January3. The Politburo recently4 maintained that it will not loosen monetary policy and that there will be no material stimulus package to support the economy. This doesn’t surprise us as we fully expect policy to give priority to ongoing economic reforms over short-term growth. The tight liquidity environment, coupled with home purchase restrictions and altered price expectations of home buyers have translated into a contraction of demand for residential property at a time when inventories are considered as rather high in certain areas.
Investors have been concerned and disappointed by this data and by the policy orientations, even if, actually, relaxing the monetary policy may well fuel more financial risks and make the economy reliant on artificial support measures. In any case, the stock market has adjusted downwards to reflect these factors, which now look to be discounted in prices. But the government is not ignoring the difficulties. A few steps have been taken recently to help specific sectors, such as an increased budget for railway investment for the second time this year, from 630 to 800 billion Chinese Yuan. In addition several cities have announced property policy relaxations
by removing some purchase constraints, the reserve requirement ratio of rural banks has been cut, and the PBOC has asked large commercial banks to accelerate granting mortgage loans to first time buyers1. Meanwhile, the reform of SOEs – to be more market driven – has been gathering momentum in recent months5, with the announcements of partial asset divestitures (by the Sinopec Group), asset injections and group stock market listings (by the Citic Group), managerial incentives (by Baosteel and SAIC Motor) and even the buying of shares by management (by Bank of Communication).
As far as the banking sector is concerned, a set of new regulations to control wealth management products and limit the rise in off balance sheet items has been issued, although their impact will be felt only gradually6. In addition, the Ministry of Finance approved 10 Provinces to issue local municipal government bonds, which reduces the risk from a build-up of local government debts and will introduce more transparency. The risk of large scale trust defaults, feared by some though China does have experience in managing through large defaults in the past, such as in the case in late 1990’s when GITIC (Guangdong International Trust and Investment Corp), Hainan Development Bank and China Agribusiness Development Trust and Investment Corp all experienced balance sheet problems7. We are tempted to consider that the Chinese government should do well by letting some defaults take place this year since they would introduce more discipline and more caution in the risk management of the financial system. On the other hand, it is clear that the boom in China’s “shadow banking” has raised much concern but, as HSBC reported8 recently, the size of this sector is still small relative to the size of the Chinese economy. Shadow banking in China is just 25.8% of gross domestic product (GDP) as compared to 165.9% in the United States, 183.7% in the Euro area and even 354.4% in the UK. Therefore, we see no reason to panic and believe that the current challenges need to be put into perspective. China’s economic conditions are certainly not ideal but they look less fragile than in the past and the risks were much higher in previous crisis than now8. China is now much more able to respond to shocks: the fiscal policy could be flexible if needed, since public finances look healthy. The average budget deficit has been just 1.2% of GDP since 1980 and government revenues grew 18.6% per year between 1994 and 2013 – faster than the 15.1% nominal GDP growth3. Foreign reserves have now reached almost $4.0 trillion, and even monetary policy could be loosened if necessary as the large commercial banks reserve requirement ratio stands at a 20% high level.
The government’s bottom line is employment, which for now remains strong. We know that according to current calculation9, each percentage point of real GDP growth creates 1.6 million jobs. A 7% GDP growth rate remains the minimum growth rate to absorb the 7 million new graduates arriving to the labor market every year plus other new job seekers and maintain stable unemployment. Urban unemployment remains very low at around 4.3%. So this looks to be the floor under which we can expect that the growth rate of the economy for now. This also explains why the government intends to give a more decisive role to the private sector since it is estimated to generate 90% of new jobs created in the country and
73 | April 30, 2014
| | |
| Clough China Fund |
| Management Commentary | | April 30, 2014 (Unaudited) |
account for 80% of urban employment. We expect more measures in favor of the expansion of the private sector to be announced in coming months.
Francoise Vappereau, Co-Portfolio Manager
Eric Brock, Co-Portfolio Manager
| 2 | Source: CLSA The Chinese Dream, Challenges along the road to reforms, May 2014, p. 30, |
| 3 | Source: NBS and Bloomberg |
| 4 | Source: BoFa Merrill Lynch Global Research, China An Equity Strategist Diary. April 29, 2014. |
| 5 | Source: UBS Research Alert China H share Strategy “Reformation – SOE bad it’s good” April 29, 2014. |
| 6 | Source: BoFaML Global Research China Economic Watch: Impacts of potential trust defaults on Chinese Economy, January 20, 2014. |
| 7 | Source: NSBO China – Financials – Trust Default Worries Overdone May 19, 2014. |
| 8 | Source: HSBC Global Research Macro Economic Challenges, daunting but not unprecedented, 16 May 2014, p. 3 & 12. |
| 9 | Source: CLSA The Chinese Dream – Challenges along the road to reform May 2014, p. 6. |
Consumer Price Index (CPI) – measures changes in the price level of a market basket of consumer goods and services purchased by households.
Fixed Asset Investment (FAI) – is a measure of capital spending. It refers to any investment within the measurement period in physical assets, such as real estate infrastructure, machinery, etc. that are held for more than one year.
Production Price Index (PPI) – a family of indexes that measures the average change in selling prices received by domestic producers of goods and services over time. PPIs measure price change from the perspective of the seller.
Money Supply (M2) – A measure of money supply that includes cash and checking deposits (M1) as well as near money. “Near money” in M2 includes savings deposits, money market mutual funds and other time deposits, which are less liquid and not as suitable as exchange mediums but can be quickly converted into cash or checking deposits.
ROE – The amount of net income returned as a percentage of shareholders equity. Return on equity measures a corporation’s profitability by revealing how much profit a company generates with the money shareholders have invested.
Price to Earnings (P/E) ratio – A valuation ratio of a company’s current share price compared to its per-share earnings.
Investments in international and emerging markets securities include exposure to risks such as currency fluctuations, foreign taxes and regulations, and the potential for illiquid markets and political instability.
The views and information discussed in this commentary are as of the date of publication, are subject to change, and may not reflect the writer’s current views. The views expressed represent an assessment of market conditions at a specific point in time, are opinions only and should not be relied upon as investment advice regarding a particular investment or markets in general. Such information does not constitute a recommendation to buy or sell specific securities or investment vehicles. It should not be assumed that any investment will be profitable or will equal the performance of the fund(s) or any securities or any sectors mentioned herein. The subject matter contained herein has been derived from several sources believed to be reliable and accurate at the time of compilation. Clough Capital Partners, LP does not accept any liability for losses either direct or consequential caused by the use of this information.
74 | April 30, 2014
| | |
| Clough China Fund |
| Performance Update | | April 30, 2014 (Unaudited) |
Performance of $10,000 Initial Investment (as of April 30, 2014)
Comparison of change in value of a $10,000 investment (includes maximum sales charges of 5.50%)
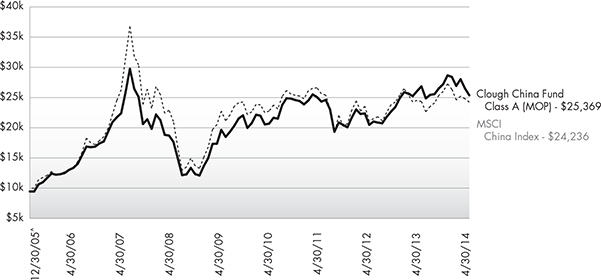
The chart above represents historical performance of a hypothetical investment of $10,000 in the Fund since inception. Past performance does not guarantee future results. This chart does not reflect the deduction of taxes that a shareholder would pay on Fund distributions or the redemption of Fund shares.
Average Annual Total Returns (as of April 30, 2014)
| | | | | | | | | | | | |
| | | | | | | | | | | Total | | |
| | | 1 Year | | 3 Year | | 5 Year | | Since Inception^ | | Expense Ratio | | What You Pay* |
Class A (NAV) | | -2.69% | | -0.19% | | 11.12% | | 12.58% | | 2.15% | | 1.96% |
Class A (MOP) | | -8.05% | | -2.05% | | 9.87% | | 11.82% | | |
Class C (NAV) | | -3.43% | | -0.95% | | 10.25% | | 11.75% | | 2.95% | | 2.71% |
Class C (CDSC) | | -4.39% | | -0.95% | | 10.25% | | 11.75% | | |
Class I 1 | | -2.41% | | 0.08% | | 11.49% | | 13.07% | | 1.95% | | 1.71% |
MSCI China Index2 | | -1.25% | | -2.97% | | 7.57% | | 11.21% | | | | |
Performance data quoted represents past performance. Past performance does not guarantee future results. Investment return and principal value of an investment will fluctuate so that an investor’s shares, when sold or redeemed, may be worth more or less than the original cost. Current performance data may be higher or lower than actual data quoted. For the most current month-end performance data, please call 1-877-256-8445.
Maximum Offering Price (MOP) for Class A shares includes the Fund’s maximum sales charge of 5.50%. Performance shown at NAV does not include these sales charges and would have been lower had it been taken into account. If you invest $1 million or more, either as a lump sum or through the Fund’s accumulation or letter of intent programs, you can purchase Class A shares without an initial sales charge (load). A Contingent Deferred Sales Charge (“CDSC”) of 1.00% may apply to Class C shares redeemed within the first 12 months after a purchase, and on Class A shares redeemed within the first 18 months after a purchase in excess of $1 million. The Fund imposes a 2.00% redemption fee on shares held for less than 30 days.
The performance shown for the Clough China Fund for periods prior to January 15, 2010, reflects the performance of the Old Mutual China Fund, a series of Old Mutual Funds I (as a result of a prior reorganization of the Old Mutual China Fund into the Clough China Fund).
75 | April 30, 2014
| | |
| Clough China Fund |
| Performance Update | | April 30, 2014 (Unaudited) |
| 1 | Prior to close of business on January 15, 2010, Class I was known as Institutional Class of the Old Mutual China Fund. |
| 2 | The Morgan Stanley Capital International (“MSCI”) China Index is constructed according to the MSCI Global Investable Market Index (GIMI) family. The MSCI China Index is part of the MSCI Emerging Markets Index. The index is not actively managed and does not reflect any deduction for fees, expenses or taxes. An investor may not invest directly in an index. |
| ^ | Fund Inception date of December 30, 2005. |
| * | What You Pay reflects the Advisor’s decision to contractually limit expenses through August 31, 2014. Please see the prospectus for additional information. |
The table does not reflect the deduction of taxes that a shareholder would pay on Fund distributions or the redemption of Fund shares.
There is no guarantee that the Fund will continue to hold any one particular security or stay invested in any one particular company. The composition of the Fund’s top holdings is subject to change. Performance figures are historical and reflect the change in share price, reinvested distributions, changes in net asset value, sales charges and capital gains distributions, if any.
Not FDIC Insured – No Bank Guarantee – May Lose Value
Investing in the Fund is subject to investment risks, including possible loss of the principal amount invested.
Investing in China, Hong Kong and Taiwan involves risk and considerations not present when investing in more established securities markets. The Fund may be more susceptible to the economic, market, political and local risks of these regions than a fund that is more geographically diversified. This Fund is not suitable for all investors.
Top Ten Holdings (as a % of Net Assets) †
| | | | |
Tencent Holdings, Ltd. | | | 7.29% | |
China Construction Bank Corp., Class H | | | 7.22% | |
Industrial & Commercial Bank of China, Ltd., Class H | | | 6.34% | |
China Petroleum & Chemical Corp., Class H | | | 5.71% | |
Bank of China, Ltd., Class H | | | 4.81% | |
China Mobile, Ltd. | | | 3.06% | |
China Everbright International, Ltd. | | | 2.82% | |
China State Construction International Holdings, Ltd. | | | 2.51% | |
Sands China, Ltd. | | | 2.50% | |
Man Wah Holdings, Ltd. | | | 2.46% | |
Top Ten Holdings | | | 44.72% | |
| † | Holdings are subject to change. Table presents indicative values only. |
Industry Sector Allocation (as a % of Net Assets)
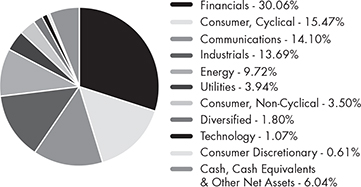
76 | April 30, 2014
| | |
| Clough China Fund |
| Statement of Investments | | April 30, 2014 |
| | | | | | |
| | | Shares | | | Value (Note 2) |
|
COMMON STOCKS (93.96%) |
| Communications (14.10%) |
Internet (7.29%) | | | | | | |
Tencent Holdings, Ltd. | | | 87,400 | | | $ 5,502,699 |
| | | | | | |
|
Telecommunications (6.81%) |
China Fiber Optic Network System Group, Ltd. | | | 4,114,000 | | | 969,005 |
China Mobile, Ltd. | | | 243,000 | | | 2,309,973 |
China Telecom Corp., Ltd., Class H | | | 1,820,000 | | | 931,092 |
China Unicom Hong Kong, Ltd. | | | 606,000 | | | 929,020 |
| | | | | | |
| | | | | | 5,139,090 |
| | | | | | |
| |
TOTAL COMMUNICATIONS | | | 10,641,789 |
| | | | | | |
|
| Consumer Discretionary (0.61%) |
Specialty Retail (0.61%) |
China ZhengTong Auto Services Holdings, Ltd.(a) | | | 845,500 | | | 461,982 |
| | | | | | |
| |
TOTAL CONSUMER DISCRETIONARY | | | 461,982 |
| | | | | | |
|
| Consumer, Cyclical (15.47%) |
Apparel (2.77%) |
Shenzhou International Group Holdings, Ltd. | | | 258,000 | | | 890,138 |
Sitoy Group Holdings, Ltd. | | | 1,997,000 | | | 1,197,123 |
| | | | | | |
| | | | | | 2,087,261 |
| | | | | | |
|
Auto Manufacturers (2.48%) |
Chongqing Changan Automobile Co., Ltd. | | | 717,970 | | | 1,296,485 |
Dongfeng Motor Group Co., Ltd., Class H | | | 432,000 | | | 577,532 |
| | | | | | |
| | | | | | 1,874,017 |
| | | | | | |
|
Home Furnishings (0.47%) |
Haier Electronics Group Co., Ltd. | | | 143,000 | | | 351,761 |
| | | | | | |
| | |
Lodging (4.71%) | | | | | | |
Galaxy Entertainment Group,
Ltd.(a) | | | 120,000 | | | 947,301 |
Sands China, Ltd. | | | 256,800 | | | 1,885,365 |
SJM Holdings, Ltd. | | | 261,000 | | | 726,084 |
| | | | | | |
| | | | | | 3,558,750 |
| | | | | | |
|
Retail (3.19%) |
China Dongxiang Group Co., Ltd. | | | 3,116,000 | | | 552,475 |
Man Wah Holdings, Ltd. | | | 1,129,356 | | | 1,854,753 |
| | | | | | |
| | | | | | 2,407,228 |
| | | | | | |
| | | | | | |
| | | Shares | | | Value (Note 2) |
|
Textiles (1.85%) |
Pacific Textile Holdings, Ltd. | | | 1,098,000 | | | $ 1,393,575 |
| | | | | | |
| |
TOTAL CONSUMER, CYCLICAL | | | 11,672,592 |
| | | | | | |
|
| Consumer, Non-Cyclical (3.50%) |
Cosmetics/Personal Care (0.23%) |
Vinda International Holdings, Ltd. | | | 118,000 | | | 172,804 |
| | | | | | |
| | |
Food (3.27%) | | | | | | |
China Mengniu Dairy Co., Ltd. | | | 127,000 | | | 653,559 |
China Modern Dairy Holdings, Ltd.(a) | | | 1,914,000 | | | 821,567 |
Want Want China Holdings, Ltd. | | | 630,000 | | | 990,313 |
| | | | | | |
| | | | | | 2,465,439 |
| | | | | | |
| |
TOTAL CONSUMER, NON-CYCLICAL | | | 2,638,243 |
| | | | | | |
|
| Diversified (1.80%) |
Holding Companies-Diversified (1.80%) |
Hutchison Whampoa, Ltd. | | | 99,000 | | | 1,358,231 |
| | | | | | |
| |
TOTAL DIVERSIFIED | | | 1,358,231 |
| | | | | | |
|
| Energy (9.72%) |
Energy-Alternate Sources (1.02%) |
China Longyuan Power Group Corp., Class H | | | 750,000 | | | 772,499 |
| | | | | | |
|
Oil & Gas (5.71%) |
China Petroleum & Chemical Corp., Class H | | | 4,858,000 | | | 4,312,719 |
| | | | | | |
| |
Oil & Gas Services (0.88%) | | | |
CIMC Enric Holdings, Ltd. | | | 458,000 | | | 664,421 |
| | | | | | |
|
Pipelines (2.11%) |
China Gas Holdings, Ltd. | | | 976,000 | | | 1,588,732 |
| | | | | | |
| |
TOTAL ENERGY | | | 7,338,371 |
| | | | | | |
|
| Financials (30.06%) |
Banks (21.29%) |
Agricultural Bank of China, Ltd., Class H | | | 3,145,000 | | | 1,323,355 |
Bank of China, Ltd., Class H | | | 8,246,000 | | | 3,633,175 |
China Construction Bank Corp., Class H | | | 7,870,080 | | | 5,449,036 |
China Merchants Bank Co., Ltd., Class H | | | 491,500 | | | 880,660 |
77 | April 30, 2014
| | |
| Clough China Fund |
| Statement of Investments | | April 30, 2014 |
| | | | | | |
| | | | | | Value |
| | | Shares | | | (Note 2) |
|
Banks (continued) | | | | | | |
Industrial & Commercial Bank of China, Ltd., Class H | | | 8,004,967 | | | $ 4,783,114 |
| | | | | | |
| | | | | | 16,069,340 |
| | | | | | |
|
Diversified Financial Services (1.85%) |
China Galaxy Securities Co., Ltd., Class H(a) | | | 1,137,000 | | | 666,934 |
Haitong Securities Co., Ltd., Class H | | | 521,200 | | | 731,006 |
| | | | | | |
| | | | | | 1,397,940 |
| | | | | | |
|
Insurance (1.96%) |
Ping An Insurance Group Co. of China, Ltd., Class H | | | 199,500 | | | 1,480,714 |
| | | | | | |
| |
Real Estate (4.96%) | | | |
China Overseas Land & Investment, Ltd. | | | 428,000 | | | 1,053,600 |
China South City Holdings, Ltd. | | | 2,174,000 | | | 910,267 |
Country Garden Holdings Co., Ltd. | | | 1,035,000 | | | 414,991 |
Franshion Properties China, Ltd. | | | 1,434,000 | | | 452,216 |
Shimao Property Holdings, Ltd. | | | 458,000 | | | 908,173 |
| | | | | | |
| | | | | | 3,739,247 |
| | | | | | |
| | |
TOTAL FINANCIALS | | | | | | 22,687,241 |
| | | | | | |
| | |
| Industrials (13.69%) | | | | | | |
Building Materials (2.26%) |
Anhui Conch Cement Co., Ltd., Class H | | | 456,000 | | | 1,702,591 |
| | | | | | |
|
Electrical Equipment (0.55%) |
China High Speed Transmission Equipment Group Co., Ltd.(a) | | | 592,000 | | | 413,845 |
| | | | | | |
|
Engineering & Construction (3.88%) |
China Railway Construction Corp., Ltd., Class H | | | 1,250,500 | | | 1,037,724 |
China State Construction International Holdings, Ltd. | | | 1,132,000 | | | 1,893,541 |
| | | | | | |
| | | | | | 2,931,265 |
| | | | | | |
|
Environmental Control (3.55%) |
China Everbright International, Ltd. | | | 1,698,000 | | | 2,130,245 |
CT Environmental Group, Ltd.(a) | | | 946,000 | | | 545,926 |
| | | | | | |
| | | | | | 2,676,171 |
| | | | | | |
| | | | | | |
| | | | | | Value |
| | | Shares | | | (Note 2) |
|
Hand/Machine Tools (0.78%) |
Techtronic Industries Co., Ltd. | | | 185,364 | | | $ 592,261 |
| | | | | | |
| |
Machinery-Diversified (1.54%) | | | |
CSR Corp., Ltd., Class H | | | 1,588,000 | | | 1,162,237 |
| | | | | | |
|
Transportation (1.13%) |
Sinotrans, Ltd., Class H | | | 1,544,000 | | | 854,178 |
| | | | | | |
| | |
TOTAL INDUSTRIALS | | | | | | 10,332,548 |
| | | | | | |
|
| Technology (1.07%) |
Electrical Equipment & Instruments (1.07%) |
Byd Co., Ltd.,
Class H(a) | | | 149,500 | | | 808,975 |
| | | | | | |
| |
TOTAL TECHNOLOGY | | | 808,975 |
| | | | | | |
| | |
| Utilities (3.94%) | | | | | | |
Electrical Equipment (1.48%) |
Huadian Fuxin Energy Corp., Ltd., Class H | | | 2,386,000 | | | 1,115,703 |
| | | | | | |
|
Gas (1.48%) |
Beijing Enterprises Holdings, Ltd. | | | 128,000 | | | 1,114,694 |
| | | | | | |
|
Water (0.98%) |
Beijing Enterprises Water Group, Ltd. | | | 1,164,000 | | | 739,780 |
| | | | | | |
| | |
TOTAL UTILITIES | | | | | | 2,970,177 |
| | | | | | |
| |
TOTAL COMMON STOCKS (Cost $62,449,758) | | | 70,910,149 |
| | | | | | |
| | | | | | | | | | | | |
| | | 7-Day | | | | | | Value | |
| | | Yield | | | Shares | | | (Note 2) | |
| |
SHORT TERM INVESTMENTS (0.34%) | | | | | |
| Money Market Fund (0.34%) | | | | | | | | | |
Morgan Stanley Institutional Liquidity Funds - Prime Portfolio | | | 0.055 | % | | | 253,936 | | | | 253,936 | |
| | | | | | | | | | | | |
| |
TOTAL SHORT TERM INVESTMENTS (Cost $253,936) | | | | 253,936 | |
| | | | | | | | | | | | |
| | |
| Clough China Fund |
| Statement of Investments | | April 30, 2014 |
| | | | |
| | | Value | |
| | | (Note 2) | |
| |
TOTAL INVESTMENTS (94.30%) (Cost $62,703,694) | | $ | 71,164,085 | |
Other Assets In Excess Of Liabilities (5.70%) | | | 4,300,369 | |
| | | | |
| |
NET ASSETS (100.00%) | | $ | 75,464,454 | |
| | | | |
| (a) | Non-Income Producing Security. |
Common Abbreviations:
Ltd. - Limited.
For Fund compliance purposes, the Fund’s industry classifications refer to any one or more of the industry sub-classifications used by one or more widely recognized market indexes or ratings group indexes, and/or as defined by Fund management. This definition may not apply for purposes of this report, which may combine industry sub-classifications for reporting ease. Industries are shown as a percent of net assets.
See Notes to Financial Statements.
79 | April 30, 2014
| | |
| Clough China Fund |
| Statement of Assets and Liabilities | | April 30, 2014 |
| | | | |
ASSETS | | | | |
Investments, at value | | $ | 71,164,085 | |
Foreign currency, at value (Cost $5,362,803) | | | 5,367,350 | |
Receivable for investments sold | | | 1,474,858 | |
Receivable for shares sold | | | 831 | |
Dividends receivable | | | 14,021 | |
Prepaid expenses and other assets | | | 17,702 | |
Total Assets | | | 78,038,847 | |
LIABILITIES | | | | |
Payable for investments purchased | | | 2,307,335 | |
Payable for shares redeemed | | | 77,819 | |
Investment advisory fees payable | | | 100,603 | |
Administration and transfer agency fees payable | | | 16,323 | |
Distribution and services fees payable | | | 16,096 | |
Trustees’ fees and expenses payable | | | 701 | |
Professional fees payable | | | 28,591 | |
Accrued expenses and other liabilities | | | 26,925 | |
Total Liabilities | | | 2,574,393 | |
NET ASSETS | | $ | 75,464,454 | |
| | |
NET ASSETS CONSIST OF | | | | |
Paid-in capital | | $ | 68,915,771 | |
Accumulated net investment income | | | 173,708 | |
Accumulated net realized loss on investments and foreign currency transactions | | | (2,089,999) | |
Net unrealized appreciation on investments and translation of assets and liabilities denominated in foreign currencies | | | 8,464,974 | |
NET ASSETS | | $ | 75,464,454 | |
| | |
INVESTMENTS, AT COST | | $ | 62,703,694 | |
| |
| PRICING OF SHARES | | | | |
Class A: | | | | |
Net Asset Value, offering and redemption price per share(a) | | $ | 20.72 | |
Net Assets | | $ | 31,164,142 | |
Shares of beneficial interest outstanding (unlimited number of shares, no par value common stock authorized) | | | 1,504,036 | |
Maximum offering price per share ((NAV/0.9450), based on maximum sales charge of 5.50% of the offering price) | | $ | 21.93 | |
Class C: | | | | |
Net Asset Value, offering and redemption price per share(a) | | $ | 19.94 | |
Net Assets | | $ | 10,865,502 | |
Shares of beneficial interest outstanding (unlimited number of shares, no par value common stock authorized) | | | 544,949 | |
Class I: | | | | |
Net Asset Value, offering and redemption price per share | | $ | 21.11 | |
Net Assets | | $ | 33,434,810 | |
Shares of beneficial interest outstanding (unlimited number of shares, no par value common stock authorized) | | | 1,583,959 | |
| (a) | Redemption price per share may be reduced for any applicable contingent deferred sales charge. For a description of a possible sales charge, please see the Fund’s Prospectus. |
See Notes to Financial Statements.
80 | April 30, 2014
| | |
| Clough China Fund |
| Statement of Operations | | For the Year Ended April 30, 2014 |
| | | | |
INVESTMENT INCOME | | | | |
Dividends | | $ | 2,286,061 | |
Foreign taxes withheld on dividends | | | (119,466) | |
Total Investment Income | | | 2,166,595 | |
| |
EXPENSES | | | | |
Investment advisory fees | | | 1,155,579 | |
Administrative and transfer agency fees | | | 150,311 | |
Distribution and service fees | | | | |
Class A | | | 90,072 | |
Class C | | | 121,069 | |
Professional fees | | | 30,156 | |
Networking fees | | | | |
Class A | | | 15,272 | |
Class C | | | 10,431 | |
Class I | | | 12,632 | |
Reports to shareholders and printing fees | | | 13,963 | |
State registration fees | | | 43,532 | |
SEC registration fees | | | 1,450 | |
Insurance fees | | | 1,326 | |
Custody fees | | | 99,353 | |
Trustees’ fees and expenses | | | 3,197 | |
Miscellaneous expenses | | | 18,150 | |
Total Expenses | | | 1,766,493 | |
Less fees waived/reimbursed by investment advisor (Note 8) | | | | |
Class A | | | (40,594) | |
Class C | | | (18,643) | |
Class I | | | (40,939) | |
Net Expenses | | | 1,666,317 | |
Net Investment Income | | | 500,278 | |
Net realized gain on investments | | | 2,054,689 | |
Net realized gain on foreign currency transactions | | | 6,743 | |
Net change in unrealized depreciation on investments | | | (5,386,635) | |
Net change in unrealized appreciation on translation of assets and liabilities denominated in foreign currencies | | | 3,955 | |
NET REALIZED AND UNREALIZED LOSS ON INVESTMENTS | | | (3,321,248) | |
NET DECREASE IN NET ASSETS RESULTING FROM OPERATIONS | | $ | (2,820,970) | |
| | |
See Notes to Financial Statements.
81 | April 30, 2014
| | |
| Clough China Fund |
| Statements of Changes in Net Assets | | |
| | | | | | | | |
| | | For the Year Ended
April 30, 2014 | | | For the Year Ended
April 30, 2013 | |
OPERATIONS | | | | | | | | |
Net investment income | | $ | 500,278 | | | $ | 401,561 | |
Net realized gain on investments and foreign currency transactions | | | 2,061,432 | | | | 1,151,438 | |
Net change in unrealized appreciation/(depreciation) on investments and translation of assets and liabilities denominated in foreign currencies | | | (5,382,680) | | | | 5,521,514 | |
Net Increase/(Decrease) in Net Assets Resulting from Operations | | | (2,820,970) | | | | 7,074,513 | |
| | |
| DISTRIBUTIONS | | | | | | | | |
Dividends to shareholders from net investment income | | | | | | | | |
Class A | | | (300,642) | | | | (38,487) | |
Class C | | | (39,515) | | | | – | |
Class I | | | (359,841) | | | | (61,529) | |
Net Decrease in Net Assets from Distributions | | | (699,998) | | | | (100,016) | |
| | |
| BENEFICIAL INTEREST TRANSACTIONS (NOTE 6) | | | | | | | | |
Shares sold | | | | | | | | |
Class A | | | 13,818,283 | | | | 8,119,247 | |
Class C | | | 4,109,696 | | | | 2,575,377 | |
Class I | | | 17,778,504 | | | | 41,213,968 | |
Dividends reinvested | | | | | | | | |
Class A | | | 401,410 | | | | 25,075 | |
Class C | | | 21,934 | | | | – | |
Class I | | | 167,997 | | | | 18,451 | |
Shares redeemed, net of redemption fees | | | | | | | | |
Class A | | | (14,337,423) | | | | (10,136,711) | |
Class C | | | (4,986,624) | | | | (3,351,866) | |
Class I | | | (8,919,474) | | | | (45,590,967) | |
Net Increase/(Decrease) in Net Assets Derived from Beneficial Interest Transactions | | | 8,054,303 | | | | (7,127,426) | |
| | |
Net increase/(decrease) in net assets | | | 4,533,335 | | | | (152,929) | |
| | |
| NET ASSETS | | | | | | | | |
Beginning of year | | | 70,931,119 | | | | 71,084,048 | |
End of year * | | $ | 75,464,454 | | | $ | 70,931,119 | |
| | |
* Including accumulated net investment income of: | | $ | 173,708 | | | $ | 336,688 | |
See Notes to Financial Statements.
82 | April 30, 2014
| | |
| Clough China Fund – Class A | | |
| Financial Highlights | | |
Selected data for a share of beneficial interest outstanding throughout the periods indicated:
| | | | | | | | | | | | |
| | | For the Year | | For the Year | | For the Year | | For the Year | | For the Period | | For the Year |
| | | Ended | | Ended | | Ended | | Ended | | August 1, 2009 to | | Ended |
| | | April 30, 2014 | | April 30, 2013 | | April 30, 2012 | | April 30, 2011 | | April 30, 2010 (a)(b) | | July 31, 2009 |
Net asset value, beginning of period | | $21.45 | | $18.43 | | $21.02 | | $18.21 | | $16.32 | | $15.81 |
| | |
| INCOME/(LOSS) FROM INVESTMENT OPERATIONS: | | | | |
Net investment income/(loss) | | 0.12(c) | | 0.15(c) | | 0.02(c) | | (0.04)(c) | | 0.10 | | 0.09(c) |
Net realized and unrealized gain/(loss) | | (0.69) | | 2.90 | | (2.61) | | 2.94 | | 1.85 | | 0.62(d) |
Total from investment operations | | (0.57) | | 3.05 | | (2.59) | | 2.90 | | 1.95 | | 0.71 |
| | | | | | |
DISTRIBUTIONS: | | | | | | | | | | | | |
From net investment income | | (0.17) | | (0.03) | | – | | (0.09) | | (0.07) | | (0.20) |
Total distributions | | (0.17) | | (0.03) | | – | | (0.09) | | (0.07) | | (0.20) |
| | | | | | |
REDEMPTION FEES ADDED TO PAID-IN CAPITAL (NOTE 6) | | 0.01 | | 0.00(e) | | 0.00(e) | | 0.00(c)(e) | | 0.01 | | 0.00(c)(e) |
Net increase/(decrease) in net asset value | | (0.73) | | 3.02 | | (2.59) | | 2.81 | | 1.89 | | 0.51 |
Net asset value, end of year | | $20.72 | | $21.45 | | $18.43 | | $21.02 | | $18.21 | | $16.32 |
| | | | | |
TOTAL RETURN(f) | | (2.69)% | | 16.54% | | (12.32)% | | 16.00% | | 12.07% | | 5.00%(d) |
| | | | |
| RATIOS/SUPPLEMENTAL DATA: | | | | | | | | |
Net assets, end of year (000s) | | $31,164 | | $32,709 | | $30,542 | | $44,616 | | $28,695 | | $15,069 |
Ratio of expenses to average net assets excluding fee waivers and reimbursements | | 2.06% | | 2.14% | | 2.08% | | 2.07% | | 2.24%(g) | | 2.62% |
Ratio of expenses to average net assets including fee waivers and reimbursements | | 1.95% | | 1.95% | | 1.95% | | 1.89%(h) | | 1.87%(g)(i) | | 1.95% |
Ratio of net investment income/ (loss) to average net assets | | 0.55% | | 0.78% | | 0.13% | | (0.22)% | | (0.53)%(g) | | 0.70% |
Portfolio turnover rate(j) | | 232% | | 221% | | 174% | | 170% | | 110% | | 120% |
| (a) | Effective March 9, 2010, the Board approved changing the fiscal year-end of the Fund from July 31 to April 30. |
| (b) | Prior to its reorganization on January 15, 2010, the Clough China Fund was known as the Old Mutual China Fund. |
| (c) | Calculated using the average shares method. |
| (d) | Impact of payment by affiliate was less than $0.01 per share and 0.01%, respectively. |
| (e) | Less than $0.005 per share. |
| (f) | Total returns are for the period indicated and have not been annualized. Total returns would have been lower had certain expenses not been waived during the period. Returns shown do not reflect the deduction of taxes that a shareholder would pay on Fund distributions or the redemption of Fund shares. Returns shown exclude any applicable sales charges. |
| (h) | Contractual expense limitation changed from 1.85% to 1.95% effective January 1, 2011. |
| (i) | Contractual expense limitation changed from 1.95% to 1.85% effective January 1, 2010. |
| (j) | Portfolio turnover rate for periods less than one full year have not been annualized. |
See Notes to Financial Statements.
83 | April 30, 2014
| | |
| Clough China Fund – Class C | | |
| Financial Highlights | | |
Selected data for a share of beneficial interest outstanding throughout the periods indicated:
| | | | | | | | | | | | |
| | | For the Year | | For the Year | | For the Year | | For the Year | | For the Period | | For the Year |
| | | Ended | | Ended | | Ended | | Ended | | August 1, 2009 to | | Ended |
| | | April 30, 2014 | | April 30, 2013 | | April 30, 2012 | | April 30, 2011 | | April 30, 2010 (a)(b) | | July 31, 2009 |
Net asset value, beginning of period | | $20.71 | | $17.90 | | $20.58 | | $17.89 | | $16.08 | | $15.48 |
| | |
| INCOME/(LOSS) FROM INVESTMENT OPERATIONS: | | | | |
Net investment income/(loss) | | (0.02)(c) | | 0.01(c) | | (0.11)(c) | | (0.21)(c) | | (0.17) | | (0.01)(c) |
Net realized and unrealized gain/(loss) | | (0.68) | | 2.80 | | (2.57) | | 2.90 | | 1.98 | | 0.65(d) |
Total from investment operations | | (0.70) | | 2.81 | | (2.68) | | 2.69 | | 1.81 | | 0.64 |
| | | | | | |
DISTRIBUTIONS: | | | | | | | | | | | | |
From net investment income | | (0.07) | | – | | – | | (0.00)(e) | | – | | (0.04) |
Total distributions | | (0.07) | | – | | – | | (0.00)(e) | | – | | (0.04) |
| | | | | | |
REDEMPTION FEES ADDED TO
PAID-IN CAPITAL (NOTE 6) | | 0.00(e) | | 0.00(e) | | 0.00(e) | | 0.00(e) | | – | | – |
Net increase/(decrease) in net asset value | | (0.77) | | 2.81 | | (2.68) | | 2.69 | | 1.81 | | 0.60 |
Net asset value, end of year | | $19.94 | | $20.71 | | $17.90 | | $20.58 | | $17.89 | | $16.08 |
| | | | | |
TOTAL RETURN(f) | | (3.43)% | | 15.70% | | (13.02)% | | 15.13% | | 11.26% | | 4.21%(d) |
| | | |
| RATIOS/SUPPLEMENTAL DATA: | | | | | | |
Net assets, end of year (000s) | | $10,866 | | $12,251 | | $11,674 | | $16,848 | | $7,594 | | $8,267 |
Ratio of expenses to average net assets excluding fee waivers and reimbursements | | 2.86% | | 2.94% | | 2.88% | | 2.86% | | 3.18%(g) | | 3.43% |
Ratio of expenses to average net assets including fee waivers and reimbursements | | 2.70% | | 2.70% | | 2.70% | | 2.70% | | 2.70%(g) | | 2.70% |
Ratio of net investment income/ (loss) to average net assets | | (0.09)% | | 0.07% | | (0.62)% | | (1.10)% | | (1.26)%(g) | | (0.05)% |
Portfolio turnover rate(h) | | 232% | | 221% | | 174% | | 170% | | 110% | | 120% |
| (a) | Effective March 9, 2010, the Board approved changing the fiscal year-end of the Fund from July 31 to April 30. |
| (b) | Prior to its reorganization on January 15, 2010, the Clough China Fund was known as the Old Mutual China Fund. |
| (c) | Calculated using the average shares method. |
| (d) | Impact of payment by affiliate was less than $0.01 per share and 0.01%, respectively. |
| (e) | Less than $0.005 and ($0.005) per share. |
| (f) | Total returns are for the period indicated and have not been annualized. Total returns would have been lower had certain expenses not been waived during the period. Returns shown do not reflect the deduction of taxes that a shareholder would pay on Fund distributions or the redemption of Fund shares. Returns shown exclude any applicable sales charges. |
| (h) | Portfolio turnover rate for periods less than one full year have not been annualized. |
See Notes to Financial Statements.
84 | April 30, 2014
| | |
| Clough China Fund – Class I | | |
| Financial Highlights | | |
Selected data for a share of beneficial interest outstanding throughout the periods indicated:
| | | | | | | | | | | | |
| | | For the Year | | For the Year | | For the Year | | For the Year | | For the Period | | For the Year |
| | | Ended | | Ended | | Ended | | Ended | | August 1, 2009 to | | Ended |
| | | April 30, 2014 | | April 30, 2013 | | April 30, 2012 | | April 30, 2011 | | April 30, 2010 (a)(b) | | July 31, 2009 |
Net asset value, beginning of period | | $21.82 | | $18.71 | | $21.30 | | $18.41 | | $16.52 | | $16.10 |
| | |
| INCOME/(LOSS) FROM INVESTMENT OPERATIONS: | | | | |
Net investment income/(loss) | | 0.19(c) | | 0.13(c) | | 0.06(c) | | (0.01)(c) | �� | 0.01 | | 0.15(c) |
Net realized and unrealized gain/(loss) | | (0.69) | | 3.02 | | (2.65) | | 3.03 | | 2.03 | | 0.60(d) |
Total from investment operations | | (0.50) | | 3.15 | | (2.59) | | 3.02 | | 2.04 | | 0.75 |
| | | | | | |
DISTRIBUTIONS: | | | | | | | | | | | | |
From net investment income | | (0.21) | | (0.06) | | – | | (0.13) | | (0.15) | | (0.33) |
Total distributions | | (0.21) | | (0.06) | | – | | (0.13) | | (0.15) | | (0.33) |
| | | | | | |
REDEMPTION FEES ADDED TO PAID-IN CAPITAL (NOTE 6) | | 0.00(e) | | 0.02 | | 0.00(e) | | 0.00(e) | | – | | – |
Net increase/(decrease) in net asset value | | (0.71) | | 3.11 | | (2.59) | | 2.89 | | 1.89 | | 0.42 |
Net asset value, end of year | | $21.11 | | $21.82 | | $18.71 | | $21.30 | | $18.41 | | $16.52 |
| | | | | |
TOTAL RETURN(f) | | (2.41)% | | 16.95% | | (12.16)% | | 16.45% | | 12.36% | | 5.51%(d) |
| | | | | |
| RATIOS/SUPPLEMENTAL DATA: | | | | | | | | | | |
Net assets, end of year (000s) | | $33,435 | | $25,972 | | $28,868 | | $41,054 | | $15,071 | | $9,744 |
Ratio of expenses to average net assets excluding fee waivers and reimbursements | | 1.81% | | 1.94% | | 1.85% | | 1.85% | | 1.86%(g) | | 1.97% |
Ratio of expenses to average net assets including fee waivers and reimbursements | | 1.70% | | 1.70% | | 1.70% | | 1.53%(h) | | 1.40%(g) | | 1.40% |
Ratio of net investment income/ (loss) to average net assets | | 0.83% | | 0.69% | | 0.33% | | (0.03)% | | 0.08%(g) | | 1.20% |
Portfolio turnover rate(i) | | 232% | | 221% | | 174% | | 170% | | 110% | | 120% |
| (a) | Effective March 9, 2010, the Board approved changing the fiscal year-end of the Fund from July 31 to April 30. |
| (b) | Prior to its reorganization on January 15, 2010, the Clough China Fund was known as the Old Mutual China Fund and Class I was known as the Institutional Class. |
| (c) | Calculated using the average shares method. |
| (d) | Impact of payment by affiliate was less than $0.01 per share and 0.01%, respectively. |
| (e) | Less than $0.005 per share. |
| (f) | Total returns are for the period indicated and have not been annualized. Total returns would have been lower had certain expenses not been waived during the period. Returns shown do not reflect the deduction of taxes that a shareholder would pay on Fund distributions or the redemption of Fund shares. |
| (h) | Contractual expense limitation changed from 1.40% to 1.70% effective January 1, 2011. |
| (i) | Portfolio turnover rate for periods less than one full year have not been annualized. |
See Notes to Financial Statements.
85 | April 30, 2014
| | |
| RiverFront Global Allocation Series |
| Management Commentary | | April 30, 2014 (Unaudited) |
Year in Review
Looking over the past twelve months, there have been moments in the market where investors, concerned about debt, Obamacare, the economy, geopolitical tensions, etc., have feared that stocks have become unhinged from fundamentals. At RiverFront, we disagree. While we acknowledge that US equities are close to fair value, we believe there is a true recovery ongoing for Main Street. Our baseline scenario assumes broader and more stable economic growth, which should finally be felt in the form of stronger job growth and increased investment spending. Wall Street will continue to have to deal with the reduction or “tapering” of bond purchases by the Federal Reserve which likely will ultimately lead to higher interest rates.
Remaining true to our discipline and our annual capital market assumption process, we have responded to last year’s large gains in global equities by adjusting the asset allocation mix for each of our funds, especially in those with three-to five-year investment horizons. Based on our latest optimization, we made the following broad asset allocation decisions as we moved into 2014:
| | » | We maintained high stock weightings relative to bonds, but replaced some of last year’s biggest gainers (US Small Caps, Higher-Volatility US Large Caps) by raising exposure to less volatile Dividend Payers and Real Estate Investment Trusts (REITs). Both underperformed in 2013 but had higher long-term trend returns than US Large Caps. |
| | » | Added to US Micro Caps, which were near their 88-year trend (US Small Caps were about 20% above trend). |
| | » | Maintained exposure to short duration bonds (our average is now about two years) and increased the relative exposure to short-duration high yield in longer-term strategies. |
| | » | Eliminated Emerging Market (EM) stocks from shorter-term strategies and reduced EM in longer-term strategies to lower risk. Added Developed International (further below trend and less volatile than EM) and some core US in growth-oriented strategies. |
Through the beginning of the year, we have seen rotation in the global markets and are trying to decide if it is temporary and counter trend, or reflecting the beginning of new trends. Asset classes such as emerging markets (especially Latin America), longer duration bonds, utilities, Master Limited Partnerships (MLPs) and REITS have been strong performers thus far in 2014. Developed world stocks (especially Japan), mid and small caps, and higher momentum US equity sectors such as technology and biotechnology have underperformed on a relative basis.
The weakness in smaller cap stocks and technology, combined with the strength in bonds would typically indicate economic weakness; yet the data has been stable to stronger. Meanwhile emerging markets have firmed as commodity prices have stabilized, also arguing for improved global growth prospects. Furthermore another reliable indicator of economic weakness, the yield difference between corporate and Treasury bonds, has been stable. Thus, we believe the decline in bond yields is temporary.
An argument has been made that investors are reacting to better economic news by worrying that better data brings the Fed closer to raising interest rates and fearing that it will mistakenly raise rates too soon. We think this makes some sense as an explanation, but while we do see rates rising in 2015, we believe the Fed, under Janet Yellen’s new leadership, will want to see clear signs of persistent economic strength. Japan’s weakness is also policy related. The consumption tax was raised on April 1st and investors are clearly worried about the sustainability of the economic and earnings recovery. We have recently neutralized our weight in Japan.
We have hedged some of our euro exposure. The European Central Bank (ECB) is slowly, but surely, becoming more proactive in preventing deflation and sustaining recovery in the Eurozone. In contrast, the US Federal Reserve is likely to be the first among major developed market central banks to raise interest rates as the US economy exhibits relative strength.
Unlike quantitative easing (QE) in the US, where the Fed is purchasing Treasuries and government agency mortgage-backed securities, ‘private QE’ in Europe is being designed to get credit to small businesses flowing again. While sovereign credit spreads have come down significantly since Mario Draghi pledged to do “whatever it takes” to prevent the Eurozone from breaking apart, borrowing costs for small businesses, which are the engine of the European economy, remain restrictive. With the sovereign debt crisis mostly behind it, in our view, we think the ECB’s attention will increasingly be towards jump-starting growth through small business lending. As a result, we recently lowered our euro-currency exposure and raised weightings in European small caps, given the increased likelihood of euro weakness and targeted stimulus from the ECB.
Performance Discussion
RiverFront’s investment process combines dynamic strategic asset allocation with tactical adjustment tools. We believe that over longer time frames, valuation, or the price you pay for an asset, is the single most important determinant of your odds of being successful. However, in our view, investors rarely give themselves or their investment manager sufficient time to be proven right. Thus Riverfront incorporates tactical adjustments to our dynamic strategic allocations in an attempt to manage risk and lower short term volatility for our shorter time horizon portfolios (3-7 years) and to enhance returns in our longer term portfolios (7-10 yrs).
Tactical moves in our more conservative offerings tend to be more oriented to “risk management” than opportunistic adjustments. In our two most conservative strategies (Conservative Income Builder and Moderate Growth & Income), we seek to navigate short-term cycles with less volatility, and provide our clients the reassurance that portfolio risks will be actively managed; thereby giving them the confidence to remain invested across a market cycle. Conversely, tactical tilts in our longer time frame funds tend to be more opportunistic. Given the longer time horizon (7-10) years for these funds, investors in these strategies should be able to withstand higher levels of volatility in times of market uncertainly in order to achieve their longer term goals.
86 | April 30, 2014
| | |
| RiverFront Global Allocation Series |
| Management Commentary | | April 30, 2014 (Unaudited) |
With this process as the backdrop, the RiverFront Investment Team typically constructs a core portfolio of securities and then makes variations in position sizes to conform to the risk profile of each individual model. For example, our most aggressive offering, the Global Growth Fund is comprised of all equities. Those same equities are utilized in Global Allocation, but a measure of fixed income is added to provide a potential offset to downside volatility. To that end, the drivers of performance for the two funds will be the same, generally, just in different degrees. The same holds true for the balanced funds (those that contain a higher proportion of fixed income) Dynamic Equity Income, Moderate Growth & Income and Conservative Income Builder.
Any discussion of the performance of the RiverFront funds over the past year must include a snapshot of the variance in performance of the various asset classes that constitute the investable universe for each. All of the funds, regardless of investment time horizon, are globally allocated. Our Price Matters® framework prescribes the parameters for the various asset classes – domestic equity, developed international and emerging markets, fixed income – as we work through the RiverFront Capital Market Assumptions annually. In addition to being globally allocated, four of the funds have a fixed income component. There have been wide discrepancies amongst the performance of these asset classes as the table below illustrates. As of April 30, 2014, the performance results for the indices representing RiverFront’s investable asset classes were as follows:
| | | | | |
| Benchmark Indexes* | | 1-YR Return** |
S&P 500 Total Return | | | | 20.44 | % |
S&P 1000 Total Return | | | | 20.40 | % |
MSCI EAFE (Net) | | | | 13.35 | % |
MSCI Emerging Markets (Net) | | | | -1.84 | % |
MSCI All Country World Index (Net) | | | | 14.40 | % |
Barclays US Aggregate | | | | -0.26 | % |
Barclays US Treasury Index | | | | -1.59 | % |
Barclays US Short Treasury Index (1-3M) | | | | 0.04 | % |
Data as of 4/30/2013
| * | For index definitions see footnotes at the end of the management commentary and below the performance data on the following pages. |
| ** | For a complete presentation of RiverFront mutual fund and relevant benchmark performance, please refer to the Performance Discussion on the following pages. |
While mutual funds are benchmarked against a single index benchmark, the RiverFront investment managers are charged with constructing the strategies based on the following mandates which included blended components of some of the indices listed in the table above:
RiverFront Growth Funds – investment time horizons range from 7-10 years.
These funds are optimized to a longer time horizon and assume that investors are willing to accept more volatility.
The RiverFront Global Growth strategy is invested based on a 100% allocation to the MSCI All Country World Index Net.
The RiverFront Global Allocation strategy is invested according to a blend of 80% MSCI All Country World Index Net/20% Barclays US Aggregate Bond Index.
The RiverFront Dynamic Equity Income strategy is invested according to a blend of 70% MSCI All Country World Index Net/30% Barclays US Aggregate Bond Index.
RiverFront Balanced Funds – investment time horizons range from 3-7 years.
The RiverFront Moderate Growth & Income strategy is invested according to a blend of 50% S&P 500/50% Barclays US Aggregate Bond Index.
The RiverFront Conservative Income Builder strategy is invested according to a blend of 30% S&P 500/70% Barclays US Aggregate Bond Index.
Performance Contributors:
| | » | The allocation to Master Limited Partnerships (MLPs) and Real Estate Investment Trusts (REITs) contributed positively to performance. We like MLPs due to the attractive distribution yields and potential growth of distributions. We have increased our allocation to REITs given their lower relative valuation and relative underperformance over the period. We believe REITs have the potential to outperform in an environment where real estate fundamentals are improving. |
| | » | The allocation to microcap was positive. We had an allocation here given our belief that an easier credit environment and an improving US economy could boost valuation levels higher. |
| | » | Domestic equity sectors that contributed positively included consumer staples, consumer discretionary and financials. |
| | » | In the balanced funds, we remain underweight relative to the strategic allocations. We continue to prefer stocks to bonds given our belief that fixed income investors will suffer continued erosion of purchasing power and considerable opportunity cost. |
Negative Factors:
| | » | Exposure to emerging markets had a negative impact during the twelve month period as it was the worst performing equity asset class as illustrated by the table above. We have shifted to an underweight here as a risk management decision and only have exposure in those funds optimized for the longest time horizons. |
| | » | While small cap US equities were positive contributor for part of the year, the asset class started to show some of the fatigue associated with stretched valuations. Our allocation here ultimately impacted the funds negatively. |
| | » | U.S equity sectors that had negative impact included healthcare and industrials. Specifically, underweights in biotech and aerospace/defense hurt performance. |
87 | April 30, 2014
| | |
| RiverFront Global Allocation Series |
| Management Commentary | | April 30, 2014 (Unaudited) |
Past performance is no guarantee of future results. Dividends are not guaranteed and are subject to change or elimination. Investments in international and emerging markets securities include exposure to risks such as currency fluctuations, foreign taxes and regulations, and the potential for illiquid markets and political instability.
The views and information discussed in this commentary are as of the date of publication, are subject to change, and may not reflect the writer’s current views. The views expressed represent an assessment of market conditions at a specific point in time, are opinions only and should not be relied upon as investment advice regarding a particular investment or markets in general. Such information does not constitute a recommendation to buy or sell specific securities or investment vehicles. It should not be assumed that any investment will be profitable or will equal the performance of the fund(s) or any securities or any sectors mentioned herein. The subject matter contained herein has been derived from several sources believed to be reliable and accurate at the time of compilation. RiverFront Investment Group, LLC does not accept any liability for losses either direct or consequential caused by the use of this information.
The S&P 1000® Index combines the S&P MidCap 400® and the S&P SmallCap 600® to form an investable benchmark for the mid- to small-cap segment of the U.S. equity market.
The MSCI EAFE Index is recognized as the pre-eminent benchmark in the United States to measure international equity performance. It comprises the MSCI country indices that represent developed markets outside of North America: Europe, Australasia and the Far East.
The MSCI Emerging Markets Index is a free float-adjusted market capitalization index that is designed to measure equity market performance in the global emerging markets.
The Barclays Capital U.S. Treasury Index includes public obligations of the U.S. Treasury, excluding Treasury bills and certain special issues, such as state and local government series bonds (SLGs) and U.S. Treasury TIPS.
The Barclays Capital U.S. Short Treasury Index is composed of bonds of investment grade with a maturity between one and three years.
88 | April 30, 2014
| | |
| RiverFront Conservative Income Builder Fund |
| Performance Update | | April 30, 2014 (Unaudited) |
Performance of $10,000 Initial Investment (as of April 30, 2014)
Comparison of change in value of a $10,000 investment (includes maximum sales charges of 5.50%)
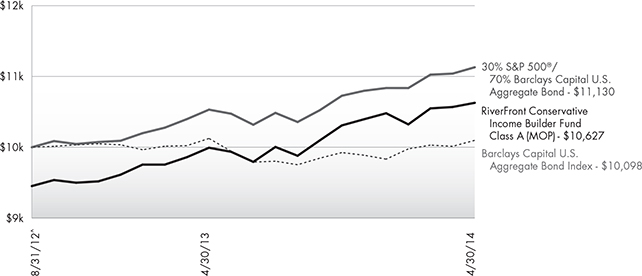
The chart above represents historical performance of a hypothetical investment of $10,000 in the Fund since inception. Past performance does not guarantee future results. This chart does not reflect the deduction of taxes that a shareholder would pay on Fund distributions or the redemption of Fund shares.
Average Annual Total Returns (as of April 30, 2014)
| | | | | | | | |
| | | 1 Year | | Since Inception^ | | Total Expense Ratio | | What You Pay* |
Class A (NAV) | | 6.35% | | 7.30% | | 5.50% | | 1.45% |
Class A (MOP) | | 0.50% | | 3.73% | | |
Class C (NAV) | | 5.49% | | 6.51% | | 6.25% | | 2.20% |
Class C (CDSC) | | 4.49% | | 6.51% | | |
Class I | | 6.53% | | 7.55% | | 5.25% | | 1.20% |
Barclays Capital U.S. Aggregate Bond Index1 | | -0.26% | | 0.59% | | | | |
30% S&P 500® and 70% Barclays Capital U.S. Aggregate Bond1,2 | | 5.68% | | 6.65% | | | | |
Performance data quoted represents past performance. Past performance does not guarantee future results. Investment return and principal value of an investment will fluctuate so that an investor’s shares, when sold or redeemed, may be worth more or less than the original cost. Current performance data may be higher or lower than actual data quoted. For the most current month-end performance data, please call 1-866-759-5679.
Maximum Offering Price (MOP) for Class A shares includes the Fund’s maximum sales charge of 5.50%. Performance shown at NAV does not include these sales charges and would have been lower had it been taken into account. If you invest $1 million or more, either as a lump sum or through the Fund’s accumulation or letter of intent programs, you can purchase Class A shares without an initial sales charge (load). A Contingent Deferred Sales Charge (“CDSC”) of 1.00% may apply to Class C shares redeemed within the first 12 months after a purchase, and on Class A shares redeemed within the first 18 months after a purchase in excess of $1 million.
89 | April 30, 2014
| | |
| RiverFront Conservative Income Builder Fund |
| Performance Update | | April 30, 2014 (Unaudited) |
| 1 | The Barclays Capital U.S. Aggregate Bond Index is a broad-based benchmark that measures the investment grade, U.S. dollar-denominated, fixed-rate taxable bond market, including Treasuries, government-related and corporate securities, MBS (agency fixed-rate and hybrid ARM passthroughs), ABS, and CMBS. The index is not actively managed and does not reflect any deductions for fees, expenses or taxes. An investor may not invest directly in an index. |
| 2 | The S&P 500® Index is the Standard & Poor’s composite index of 500 stocks, a widely recognized, unmanaged index of common stock prices. |
| ^ | Fund inception date of August 31, 2012. The Fund commenced operations September 4, 2012. |
| * | What You Pay reflects the Advisor’s and Sub-Advisor’s decision to contractually limit expenses through August 31, 2014. Please see the prospectus for additional information. |
The table does not reflect the deduction of taxes that a shareholder would pay on Fund distributions or the redemption of Fund shares.
This Fund is not suitable for all investors. Subject to investment risks, including possible loss of the principal amount invested.
There is no guarantee that the Fund will continue to hold any one particular security or stay invested in any one particular company. The composition of the Fund’s top holdings is subject to change. Performance figures are historical and reflect the change in share price, reinvested distributions, changes in net asset value, sales charges and capital gains distributions, if any.
Not FDIC Insured – No Bank Guarantee – May Lose Value
Top Ten Holdings (as a % of Net Assets) †
| | | | |
SPDR® Barclays Short Term Corporate Bond ETF | | | 15.63% | |
iShares® Barclays 1-3 Year Credit Bond Fund | | | 15.62% | |
PIMCO 0-5 Year High Yield Corporate Bond Index ETF | | | 9.09% | |
SPDR® Barclays Short Term High Yield Bond ETF | | | 9.02% | |
Riverfront Strategic Income Fund | | | 7.35% | |
WisdomTree® LargeCap Dividend Fund | | | 4.06% | |
Powershares® Dynamic Food & Beverage Portfolio | | | 3.71% | |
First Trust NASDAQ Technology Dividend Index Fund | | | 3.01% | |
FlexShares Quality Dividend Index Fund | | | 2.82% | |
Vanguard® FTSE® Europe ETF | | | 2.70% | |
Top Ten Holdings | | | 73.01% | |
| † | Holdings are subject to change. Table presents indicative values only. |
Portfolio Composition (as a % of Net Assets)
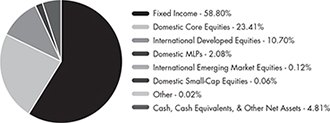
90 | April 30, 2014
| | |
| RiverFront Dynamic Equity Income Fund |
| Performance Update | | April 30, 2014 (Unaudited) |
Performance of $10,000 Initial Investment (as of April 30, 2014)
Comparison of change in value of a $10,000 investment (includes maximum sales charges of 5.50%)
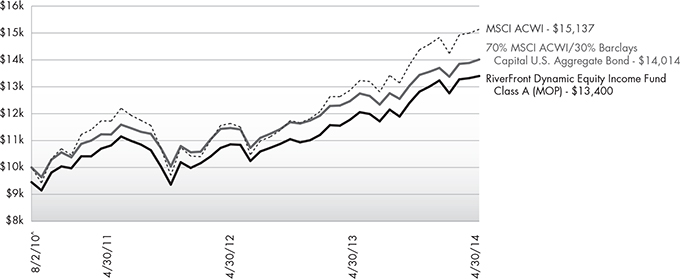
The chart above represents historical performance of a hypothetical investment of $10,000 in the Fund since inception. Past performance does not guarantee future results. This chart does not reflect the deduction of taxes that a shareholder would pay on Fund distributions or the redemption of Fund shares.
Average Annual Total Returns (as of April 30, 2014)
| | | | | | | | | | |
| | | 1 Year | | 3 Years | | Since Inception^ | | Total Expense Ratio | | What You Pay* |
Class A (NAV) | | 11.15% | | 6.31% | | 9.78% | | 1.84% | | 1.43% |
Class A (MOP) | | 5.06% | | 4.34% | | 8.13% | | |
Class C (NAV) | | 10.34% | | 5.51% | | 8.94% | | 2.59% | | 2.18% |
Class C (CDSC) | | 9.34% | | 5.51% | | 8.94% | | |
Class I | | 11.40% | | 6.55% | | 10.03% | | 1.59% | | 1.18% |
MSCI All Country World Index1 | | 14.40% | | 7.45% | | 11.71% | | | | |
70% MSCI ACWI and 30% Barclays Capital U.S. Aggregate Bond1,2 | | 9.91% | | 6.53% | | 9.44% | | | | |
Performance data quoted represents past performance. Past performance does not guarantee future results. Investment return and principal value of an investment will fluctuate so that an investor’s shares, when sold or redeemed, may be worth more or less than the original cost. Current performance data may be higher or lower than actual data quoted. For the most current month-end performance data, please call 1-866-759-5679.
Maximum Offering Price (MOP) for Class A shares includes the Fund’s maximum sales charge of 5.50%. Performance shown at NAV does not include these sales charges and would have been lower had it been taken into account. If you invest $1 million or more, either as a lump sum or through the Fund’s accumulation or letter of intent programs, you can purchase Class A shares without an initial sales charge (load). A Contingent Deferred Sales Charge (“CDSC”) of 1.00% may apply to Class C shares redeemed within the first 12 months after a purchase, and on Class A shares redeemed within the first 18 months after a purchase in excess of $1 million.
91 | April 30, 2014
| | |
| RiverFront Dynamic Equity Income Fund |
| Performance Update | | April 30, 2014 (Unaudited) |
| 1 | The MSCI ACWI (All Country World Index) is a free float-adjusted market capitalization weighted index that is designed to measure the equity market performance of developed and emerging markets. The MSCI ACWI consists of 45 country indices comprising 24 developed and 21 emerging market country indices. The index includes reinvestment of dividends, net of foreign withholding taxes. The index is not actively managed and does not reflect any deductions for fees, expenses or taxes. An investor may not invest directly in an index. |
| 2 | The Barclays Capital U.S. Aggregate Bond Index is a broad-based benchmark that measures the investment grade, U.S. dollar-denominated, fixed-rate taxable bond market, including Treasuries, government-related and corporate securities, MBS (agency fixed-rate and hybrid ARM passthroughs), ABS, and CMBS. The index is not actively managed and does not reflect any deductions for fees, expenses or taxes. An investor may not invest directly in an index. |
| ^ | Fund inception date of August 2, 2010. |
| * | What You Pay reflects the Advisor’s and Sub-Advisor’s decision to contractually limit expenses through August 31, 2014. Please see the prospectus for additional information. |
The table does not reflect the deduction of taxes that a shareholder would pay on Fund distributions or the redemption of Fund shares.
This Fund is not suitable for all investors. Subject to investment risks, including possible loss of the principal amount invested.
There is no guarantee that the Fund will continue to hold any one particular security or stay invested in any one particular company. The composition of the Fund’s top holdings is subject to change. Performance figures are historical and reflect the change in share price, reinvested distributions, changes in net asset value, sales charges and capital gains distributions, if any.
Not FDIC Insured – No Bank Guarantee – May Lose Value
Top Ten Holdings (as a % of Net Assets) †
| | | | |
WisdomTree® LargeCap Dividend Fund | | | 16.77% | |
Vanguard® FTSE® Europe ETF | | | 8.97% | |
SPDR® Barclays Short Term High Yield Bond ETF | | | 6.12% | |
Riverfront Strategic Income Fund | | | 5.48% | |
PIMCO 0-5 Year High Yield Corporate Bond Index ETF | | | 5.11% | |
iShares® Russell Microcap Index Fund | | | 4.48% | |
iShares® MSCI All Country Asia ex Japan Index Fund | | | 3.92% | |
WisdomTree® Japan Hedged Equity Fund | | | 3.61% | |
Schwab U.S. REIT ETF | | | 3.45% | |
DB X-trackers MSCI EAFE Hedged Equity Fund | | | 3.09% | |
Top Ten Holdings | | | 61.00% | |
| † | Holdings are subject to change. Table presents indicative values only. |
Portfolio Composition (as a % of Net Assets)
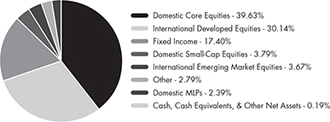
92 | April 30, 2014
| | |
| RiverFront Global Allocation Fund |
| Performance Update | | April 30, 2014 (Unaudited) |
Performance of $10,000 Initial Investment (as of April 30, 2014)
Comparison of change in value of a $10,000 investment (includes maximum sales charges of 5.50%)
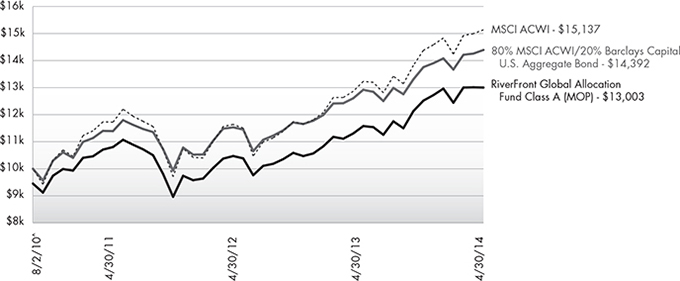
The chart above represents historical performance of a hypothetical investment of $10,000 in the Fund since inception. Past performance does not guarantee future results. This chart does not reflect the deduction of taxes that a shareholder would pay on Fund distributions or the redemption of Fund shares.
Average Annual Total Returns (as of April 30, 2014)
| | | | | | | | | | |
| | | 1 Year | | 3 Years | | Since Inception^ | | Total Expense Ratio | | What You Pay* |
Class A (NAV) | | 12.32% | | 5.51% | | 8.90% | | 1.95% | | 1.43% |
Class A (MOP) | | 6.18% | | 3.54% | | 7.27% | | |
Class C (NAV) | | 11.48% | | 4.72% | | 8.09% | | 2.70% | | 2.18% |
Class C (CDSC) | | 10.48% | | 4.72% | | 8.09% | | |
Class I | | 12.61% | | 5.80% | | 9.16% | | 1.70% | | 1.18% |
MSCI All Country World Index1 | | 14.40% | | 7.45% | | 11.71% | | | | |
80% MSCI ACWI and 20% Barclays Capital U.S. Aggregate Bond1,2 | | 11.40% | | 6.86% | | 10.22% | | | | |
Performance data quoted represents past performance. Past performance does not guarantee future results. Investment return and principal value of an investment will fluctuate so that an investor’s shares, when sold or redeemed, may be worth more or less than the original cost. Current performance data may be higher or lower than actual data quoted. For the most current month-end performance data, please call 1-866-759-5679.
Maximum Offering Price (MOP) for Class A shares includes the Fund’s maximum sales charge of 5.50%. Performance shown at NAV does not include these sales charges and would have been lower had it been taken into account. If you invest $1 million or more, either as a lump sum or through the Fund’s accumulation or letter of intent programs, you can purchase Class A shares without an initial sales charge (load). A Contingent Deferred Sales Charge (“CDSC”) of 1.00% may apply to Class C shares redeemed within the first 12 months after a purchase, and on Class A shares redeemed within the first 18 months after a purchase in excess of $1 million.
93 | April 30, 2014
| | |
| RiverFront Global Allocation Fund |
| Performance Update | | April 30, 2014 (Unaudited) |
| 1 | The MSCI ACWI (All Country World Index) is a free float-adjusted market capitalization weighted index that is designed to measure the equity market performance of developed and emerging markets. The MSCI ACWI consists of 45 country indices comprising 24 developed and 21 emerging market country indices. The index includes reinvestment of dividends, net of foreign withholding taxes. The index is not actively managed and does not reflect any deductions for fees, expenses or taxes. An investor may not invest directly in an index. |
| 2 | The Barclays Capital U.S. Aggregate Bond Index is a broad-based benchmark that measures the investment grade, U.S. dollar-denominated, fixed-rate taxable bond market, including Treasuries, government-related and corporate securities, MBS (agency fixed-rate and hybrid ARM passthroughs), ABS, and CMBS. The index is not actively managed and does not reflect any deductions for fees, expenses or taxes. An investor may not invest directly in an index. |
| ^ | Fund inception date of August 2, 2010. |
| * | What You Pay reflects the Advisor’s and Sub-Advisor’s decision to contractually limit expenses through August 31, 2014. Please see the prospectus for additional information. |
The table does not reflect the deduction of taxes that a shareholder would pay on Fund distributions or the redemption of Fund shares.
This Fund is not suitable for all investors. Subject to investment risks, including possible loss of the principal amount invested.
There is no guarantee that the Fund will continue to hold any one particular security or stay invested in any one particular company. The composition of the Fund’s top holdings is subject to change. Performance figures are historical and reflect the change in share price, reinvested distributions, changes in net asset value, sales charges and capital gains distributions, if any.
Not FDIC Insured – No Bank Guarantee – May Lose Value
Top Ten Holdings (as a % of Net Assets) †
| | | | |
Vanguard® FTSE® Europe ETF | | | 7.37% | |
iShares® MSCI All Country Asia ex Japan Index Fund | | | 5.46% | |
Riverfront Strategic Income Fund | | | 5.45% | |
Vanguard® Large-Cap ETF | | | 5.19% | |
WisdomTree® Japan Hedged Equity Fund | | | 4.38% | |
Vanguard® MSCI EAFE ETF | | | 4.03% | |
iShares® MSCI EMU Index Fund | | | 3.98% | |
Powershares® Dynamic Food & Beverage Portfolio | | | 3.58% | |
PowerShares® S&P 500® High Beta Port ETF | | | 3.47% | |
iShares® Russell Microcap Index Fund | | | 3.19% | |
Top Ten Holdings | | | 46.10% | |
| † | Holdings are subject to change. Table presents indicative values only. |
Portfolio Composition (as a % of Net Assets)
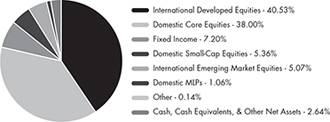
94 | April 30, 2014
| | |
| RiverFront Global Growth Fund |
| Performance Update | | April 30, 2014 (Unaudited) |
Performance of $10,000 Initial Investment (as of April 30, 2014)
Comparison of change in value of a $10,000 investment (includes maximum sales charges of 5.50%)
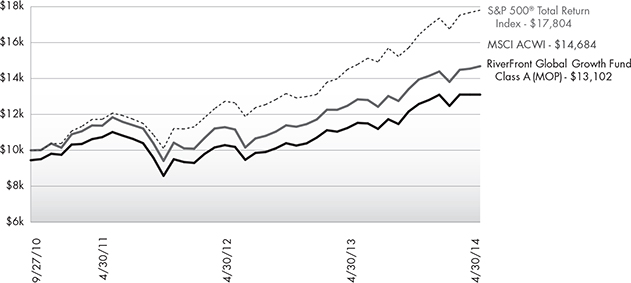
The chart above represents historical performance of a hypothetical investment of $10,000 in the Fund since inception. Past performance does not guarantee future results. This chart does not reflect the deduction of taxes that a shareholder would pay on Fund distributions or the redemption of Fund shares.
Average Annual Total Returns (as of April 30, 2014)
| | | | | | | | | | |
| | | 1 Year | | 3 Years | | Since Inception^ | | Total Expense Ratio | | What You Pay* |
Class A (NAV) | | 13.66% | | 5.95% | | 12.55% | | 1.75% | | 1.42% |
Class A (MOP) | | 7.38% | | 3.97% | | 11.40% | | |
Class C (NAV) | | 12.84% | | 5.17% | | 11.72% | | 2.50% | | 2.17% |
Class C (CDSC) | | 11.84% | | 5.17% | | 11.72% | | |
Class I | | 14.01% | | 6.21% | | 12.83% | | 1.50% | | 1.17% |
Class L 1 | | 13.98% | | 6.22% | | 12.82% | | 1.50% | | 1.17% |
Investor | | 13.73% | | 5.99% | | 12.53% | | 1.75% | | 1.42% |
S&P 500® Total Return Index2 | | 20.44% | | 13.83% | | 15.99% | | | | |
MSCI All Country World Index3 | | 14.40% | | 7.45% | | 14.85% | | | | |
Performance data quoted represents past performance. Past performance does not guarantee future results. Investment return and principal value of an investment will fluctuate so that an investor’s shares, when sold or redeemed, may be worth more or less than the original cost. Current performance data may be higher or lower than actual data quoted. For the most current month-end performance data, please call 1-866-759-5679.
Maximum Offering Price (MOP) for Class A shares includes the Fund’s maximum sales charge of 5.50%. Performance shown at NAV does not include these sales charges and would have been lower had it been taken into account. If you invest $1 million or more, either as a lump sum or through the Fund’s accumulation or letter of intent programs, you can purchase Class A shares without an initial sales charge (load). A Contingent Deferred Sales Charge (“CDSC”) of 1.00% may apply to Class C shares redeemed within the first 12 months after a purchase, and on Class A shares redeemed within the first 18 months after a purchase in excess of $1 million.
95 | April 30, 2014
| | |
| RiverFront Global Growth Fund |
| Performance Update | | April 30, 2014 (Unaudited) |
| 1 | Prior to close of business on September 24, 2010, Class L was known as Institutional Class of the Baird Funds, Inc. - RiverFront Long-Term Growth Fund. |
| 2 | S&P 500® Total Return Index is the Standard & Poor’s composite index of 500 stocks, a widely recognized, unmanaged index of common stock prices. The index is not actively managed and does not reflect any deduction for fees, expenses or taxes. An investor may not invest directly in an index. |
| 3 | The MSCI ACWI (All Country World Index) is a free float-adjusted market capitalization weighted index that is designed to measure the equity market performance of developed and emerging markets. The MSCI ACWI consists of 45 country indices comprising 24 developed and 21 emerging market country indices. The index includes reinvestment of dividends, net of foreign withholding taxes. The index is not actively managed and does not reflect any deductions for fees, expenses or taxes. An investor may not invest directly in an index. |
| ^ | Fund inception date of October 28, 2008. |
| * | What You Pay reflects the Advisor’s and Sub-Advisor’s decision to contractually limit expenses through August 31, 2014. Please see the prospectus for additional information. |
The Class A, C, I and L shares performance shown for periods prior to September 27, 2010 reflects the performance of the Baird Funds, Inc. – RiverFront Long-Term Growth Fund’s Institutional Class shares (as result of the reorganization of the Baird Funds, Inc. – RiverFront Long-Term Growth Fund into the Fund).
The Investor Class performance shown for periods prior to September 27, 2010 reflects the performance of the Baird Funds, Inc. – RiverFront Long-Term Growth Fund’s Investor Class shares (as result of the reorganization of the Baird Funds, Inc. – RiverFront Long-Term Growth Fund into the Fund).
The table does not reflect the deduction of taxes that a shareholder would pay on Fund distributions or the redemption of Fund shares.
This Fund is not suitable for all investors. Subject to investment risks, including possible loss of the principal amount invested.
There is no guarantee that the Fund will continue to hold any one particular security or stay invested in any one particular company. The composition of the Fund’s top holdings is subject to change. Performance figures are historical and reflect the change in share price, reinvested distributions, changes in net asset value, sales charges and capital gains distributions, if any.
Not FDIC Insured – No Bank Guarantee – May Lose Value
Top Ten Holdings (as a % of Net Assets) †
| | | | |
Vanguard® FTSE® Europe ETF | | | 9.64% | |
PowerShares® S&P 500® High Beta Port ETF | | | 7.19% | |
iShares® MSCI All Country Asia ex Japan Index Fund | | | 6.84% | |
WisdomTree® Japan Hedged Equity Fund | | | 4.99% | |
iShares® MSCI EMU Index Fund | | | 4.72% | |
Vanguard® MSCI EAFE ETF | | | 4.25% | |
DB X-trackers MSCI EAFE Hedged Equity Fund | | | 3.01% | |
iShares® Russell Microcap Index Fund | | | 2.97% | |
Vanguard® Large-Cap ETF | | | 2.84% | |
Wilshire Micro-Cap ETF | | | 2.79% | |
Top Ten Holdings | | | 49.24% | |
| † | Holdings are subject to change. Table presents indicative values only. |
Portfolio Composition (as a % of Net Assets)
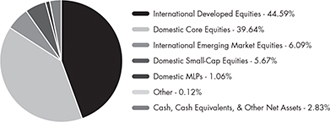
96 | April 30, 2014
| | |
| RiverFront Moderate Growth & Income Fund |
| Performance Update | | April 30, 2014 (Unaudited) |
Performance of $10,000 Initial Investment (as of April 30, 2014)
Comparison of change in value of a $10,000 investment (includes maximum sales charges of 5.50%)
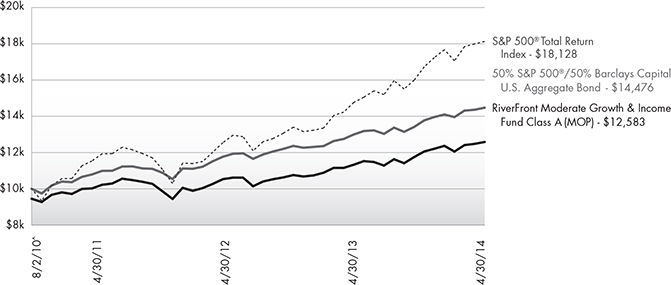
The chart above represents historical performance of a hypothetical investment of $10,000 in the Fund since inception. Past performance does not guarantee future results. This chart does not reflect the deduction of taxes that a shareholder would pay on Fund distributions or the redemption of Fund shares.
Average Annual Total Returns (as of April 30, 2014)
| | | | | | | | | | |
| | | 1 Year | | 3 Years | | Since Inception^ | | Total Expense Ratio | | What You Pay* |
Class A (NAV) | | 9.16% | | 6.02% | | 7.95% | | 1.65% | | 1.41% |
Class A (MOP) | | 3.14% | | 4.06% | | 6.33% | | |
Class C (NAV) | | 8.33% | | 5.19% | | 7.15% | | 2.40% | | 2.16% |
Class C (CDSC) | | 7.33% | | 5.19% | | 7.15% | | |
Class I | | 9.43% | | 6.29% | | 8.22% | | 1.40% | | 1.16% |
S&P 500® Total Return Index1 | | 20.44% | | 13.83% | | 17.23% | | | | |
50% S&P 500® and 50% Barclays Capital U.S. Aggregate Bond1,2 | | 9.77% | | 8.84% | | 10.69% | | | | |
Performance data quoted represents past performance. Past performance does not guarantee future results. Investment return and principal value of an investment will fluctuate so that an investor’s shares, when sold or redeemed, may be worth more or less than the original cost. Current performance data may be higher or lower than actual data quoted. For the most current month-end performance data, please call 1-866-759-5679.
Maximum Offering Price (MOP) for Class A shares includes the Fund’s maximum sales charge of 5.50%. Performance shown at NAV does not include these sales charges and would have been lower had it been taken into account. If you invest $1 million or more, either as a lump sum or through the Fund’s accumulation or letter of intent programs, you can purchase Class A shares without an initial sales charge (load). A Contingent Deferred Sales Charge (“CDSC”) of 1.00% may apply to Class C shares redeemed within the first 12 months after a purchase, and on Class A shares redeemed within the first 18 months after a purchase in excess of $1 million.
97 | April 30, 2014
| | |
| RiverFront Moderate Growth & Income Fund |
| Performance Update | | April 30, 2014 (Unaudited) |
| 1 | S&P 500® Total Return Index is the Standard & Poor’s composite index of 500 stocks, a widely recognized, unmanaged index of common stock prices. The index is not actively managed and does not reflect any deduction for fees, expenses or taxes. An investor may not invest directly in an index. |
| 2 | The Barclays Capital U.S. Aggregate Bond Index is a broad-based benchmark that measures the investment grade, U.S. dollar-denominated, fixed-rate taxable bond market, including Treasuries, government-related and corporate securities, MBS (agency fixed-rate and hybrid ARM passthroughs), ABS, and CMBS. The index is not actively managed and does not reflect any deductions for fees, expenses or taxes. An investor may not invest directly in an index. |
| ^ | Fund inception date of August 2, 2010. |
| * | What You Pay reflects the Advisor’s and Sub-Advisor’s decision to contractually limit expenses through August 31, 2014. Please see the prospectus for additional information. |
The table does not reflect the deduction of taxes that a shareholder would pay on Fund distributions or the redemption of Fund shares.
This Fund is not suitable for all investors. Subject to investment risks, including possible loss of the principal amount invested.
There is no guarantee that the Fund will continue to hold any one particular security or stay invested in any one particular company. The composition of the Fund’s top holdings is subject to change. Performance figures are historical and reflect the change in share price, reinvested distributions, changes in net asset value, sales charges and capital gains distributions, if any.
Not FDIC Insured – No Bank Guarantee – May Lose Value
Top Ten Holdings (as a % of Net Assets) †
| | | | |
WisdomTree® LargeCap Dividend Fund | | | 11.11% | |
Riverfront Strategic Income Fund | | | 7.39% | |
iShares® Barclays 1-3 Year Credit Bond Fund | | | 7.39% | |
PIMCO 0-5 Year High Yield Corporate Bond Index ETF | | | 6.81% | |
SPDR® Barclays Short Term High Yield Bond ETF | | | 6.78% | |
Powershares® Dynamic Food & Beverage Portfolio | | | 5.94% | |
Vanguard® FTSE® Europe ETF | | | 4.26% | |
Schwab U.S. REIT ETF | | | 4.07% | |
SPDR® Barclays Short Term Corporate Bond ETF | | | 3.94% | |
FlexShares Quality Dividend Index Fund | | | 3.73% | |
Top Ten Holdings | | | 61.42% | |
| † | Holdings are subject to change. Table presents indicative values only. |
Portfolio Composition (as a % of Net Assets)
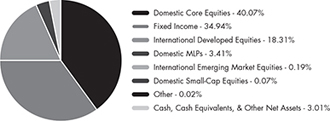
98 | April 30, 2014
| | |
| RiverFront Conservative Income Builder Fund |
Statement of Investments | | April 30, 2014 |
| | | | | | | | |
| | | Shares | | | Value (Note 2) | |
| |
COMMON STOCKS (3.41%) | |
| Communications (0.55%) | | | | | | | | |
Media (0.55%) | | | | | | | | |
The Walt Disney Co. | | | 460 | | | $ | 36,497 | |
| | | | | | | | |
| | |
| TOTAL COMMUNICATIONS | | | | | | | 36,497 | |
| | | | | | | | |
| | |
| Consumer, Cyclical (0.56%) | | | | | | | | |
Retail (0.56%) | | | | | | | | |
CVS Caremark Corp. | | | 507 | | | | 36,869 | |
| | | | | | | | |
| |
| TOTAL CONSUMER, CYCLICAL | | | | 36,869 | |
| | | | | | | | |
|
| Consumer, Non-Cyclical (1.77%) | |
Cosmetics/Personal Care (0.48%) | | | | | | | | |
Colgate-Palmolive Co. | | | 470 | | | | 31,631 | |
| | | | | | | | |
| | |
Food (0.57%) | | | | | | | | |
General Mills, Inc. | | | 706 | | | | 37,432 | |
| | | | | | | | |
| | |
Pharmaceuticals (0.72%) | | | | | | | | |
Abbott Laboratories | | | 1,228 | | | | 47,573 | |
| | | | | | | | |
| | |
| TOTAL CONSUMER, NON-CYCLICAL | | | | | | | 116,636 | |
| | | | | | | | |
| | |
| Financials (0.53%) | | | | | | | | |
Diversified Financial Services (0.53%) | | | | | | | | |
Discover Financial Services | | | 618 | | | | 34,546 | |
| | | | | | | | |
| | |
| TOTAL FINANCIALS | | | | | | | 34,546 | |
| | | | | | | | |
| |
TOTAL COMMON STOCKS (Cost $204,554) | | | | 224,548 | |
| | | | | | | | |
|
| EXCHANGE TRADED FUNDS (89.62%) | |
Debt (58.60%) | | | | | | | | |
iShares® Barclays 1-3 Year Credit Bond Fund | | | 9,754 | | | | 1,029,145 | |
iShares® iBoxx $ High Yield Corporate Bond Fund | | | 658 | | | | 62,076 | |
PIMCO 0-5 Year High Yield Corporate Bond Index ETF | | | 5,615 | | | | 599,120 | |
Riverfront Strategic Income Fund(a) | | | 19,045 | | | | 484,124 | |
SPDR® Barclays Capital High Yield Bond ETF | | | 1,507 | | | | 62,314 | |
SPDR® Barclays Short Term Corporate Bond ETF | | | 33,444 | | | | 1,029,741 | |
| | | | | | | | |
| | | Shares | | | Value (Note 2) | |
| |
Debt (continued) | | | | | | | | |
SPDR® Barclays Short Term High Yield Bond ETF | | | 19,198 | | | | $594,370 | |
| | | | | | | | |
| | | | | | | 3,860,890 | |
| | | | | | | | |
Equity (31.02%) | | | | | | | | |
DB X-trackers MSCI EAFE Hedged Equity Fund | | | 4,766 | | | | 130,112 | |
First Trust NASDAQ Technology Dividend Index Fund | | | 7,830 | | | | 198,099 | |
FlexShares Quality Dividend Index Fund | �� | | 5,436 | | | | 185,694 | |
Global X MLP & Energy Infrastructure ETF | | | 2,017 | | | | 35,701 | |
Guggenheim Insider Sentiment ETF | | | 697 | | | | 32,738 | |
Guggenheim S&P 500® Equal Weight Energy ETF | | | 518 | | | | 45,004 | |
iShares® MSCI Australia Index Fund | | | 1,218 | | | | 32,216 | |
iShares® MSCI EAFE Value ETF | | | 1,149 | | | | 67,802 | |
iShares® MSCI EMU Index Fund | | | 2,828 | | | | 121,745 | |
iShares® MSCI United Kingdom Index Fund | | | 1,263 | | | | 27,180 | |
iShares® Transportation Average ETF | | | 305 | | | | 41,840 | |
Powershares® Dynamic Food & Beverage Portfolio | | | 9,038 | | | | 244,116 | |
Schwab U.S. REIT ETF | | | 2,714 | | | | 93,199 | |
Utilities Select Sector SPDR® Fund | | | 3,515 | | | | 152,129 | |
Vanguard® FTSE® Europe ETF | | | 2,944 | | | | 178,141 | |
Vanguard® Information Technology ETF | | | 598 | | | | 54,257 | |
WisdomTree® Japan Hedged Equity Fund | | | 1,979 | | | | 91,212 | |
WisdomTree® Japan SmallCap Dividend Fund | | | 908 | | | | 44,901 | |
WisdomTree® LargeCap Dividend Fund | | | 3,890 | | | | 267,204 | |
| | | | | | | | |
| | | | | | | 2,043,290 | |
| | | | | | | | |
|
| TOTAL EXCHANGE TRADED FUNDS | |
(Cost $5,724,365) | | | | | | | 5,904,180 | |
| | | | | | | | |
|
| EXCHANGE TRADED NOTES (2.08%) | |
Equity (2.08%) | | | | | | | | |
Barclays ETN+ Select MLP ETNs | | | 2,251 | | | | 65,054 | |
Credit Suisse Cushing® 30 MLP Index ETN | | | 2,169 | | | | 72,097 | |
| | | | | | | | |
| | | | | | | 137,151 | |
| | | | | | | | |
|
| TOTAL EXCHANGE TRADED NOTES | |
(Cost $120,101) | | | | | | | 137,151 | |
| | | | | | | | |
99 | April 30, 2014
| | |
| RiverFront Conservative Income Builder Fund |
Statement of Investments | | April 30, 2014 |
| | | | | | | | | | | | |
| | | 7-Day Yield | | | Shares | | | Value (Note 2) | |
| |
SHORT TERM INVESTMENTS (4.35%) | |
| Money Market Fund (4.35%) | |
Morgan Stanley Institutional Liquidity Fund, Prime Portfolio | | | 0.055% | | | | 286,915 | | | $ | 286,915 | |
| | | | | | | | | | | | |
| |
| TOTAL SHORT TERM INVESTMENTS | | | | | |
(Cost $286,915) | | | | | | | | | | | 286,915 | |
| | | | | | | | | | | | |
| |
| TOTAL INVESTMENTS (99.46%) | | | | | |
(Cost $6,335,935) | | | | | | | | | | $ | 6,552,794 | |
| |
Other Assets In Excess Of
Liabilities (0.54%) | | | | 35,573 | |
| | | | | | | | | | | | |
| | | |
| NET ASSETS (100.00%) | | | | | | | | | | $ | 6,588,367 | |
| | | | | | | | | | | | |
| (a) | Affiliated Company. See Note 7 to Financial Statements. |
Common Abbreviations:
EAFE - Europe, Australia, and Far East.
EMU - European Monetary Union.
ETF - Exchange Traded Fund.
ETN - Exchange Traded Note.
FTSE - Financial Times and the London Stock Exchange.
MLP - Master Limited Partnership.
MSCI - Morgan Stanley Capital International.
REIT - Real Estate Investment Trust.
S&P - Standard and Poor’s.
SPDR - Standard and Poor’s Depositary Receipt.
For Fund compliance purposes, the Fund’s industry classifications refer to any one or more of the industry sub-classifications used by one or more widely recognized market indexes or ratings group indexes, and/or as defined by Fund management. This definition may not apply for purposes of this report, which may combine industry sub-classifications for reporting ease. Industries are shown as a percent of net assets.
See Notes to Financial Statements.
100 | April 30, 2014
| | |
| RiverFront Dynamic Equity Income Fund |
| Statement of Investments | | April 30, 2014 |
| | | | | | | | |
| | | | | | Value | |
| | | Shares | | | (Note 2) | |
| |
COMMON STOCKS (4.21%) | |
| Communications (0.76%) | |
Media (0.76%) | | | | | | | | |
The Walt Disney Co. | | | 5,703 | | | $ | 452,476 | |
| | | | | | | | |
TOTAL COMMUNICATIONS | | | | 452,476 | |
| | | | | | | | |
|
| Consumer, Cyclical (0.76%) | |
Retail (0.76%) | | | | | | | | |
CVS Caremark Corp. | | | 6,195 | | | | 450,500 | |
| | | | | | | | |
| |
| TOTAL CONSUMER, CYCLICAL | | | | 450,500 | |
| | | | | | | | |
|
| Consumer, Non-Cyclical (2.09%) | |
| Cosmetics/Personal Care (0.67%) | |
Colgate-Palmolive Co. | | | 5,928 | | | | 398,954 | |
| | | | | | | | |
| | |
Food (0.71%) | | | | | | | | |
General Mills, Inc. | | | 8,012 | | | | 424,796 | |
| | | | | | | | |
|
| Pharmaceuticals (0.71%) | |
Abbott Laboratories | | | 10,821 | | | | 419,206 | |
| | | | | | | | |
| TOTAL CONSUMER, NON-CYCLICAL | | | | 1,242,956 | |
| | | | | | | | |
|
| Financials (0.60%) | |
| Diversified Financial Services (0.60%) | |
Discover Financial Services | | | 6,332 | | | | 353,959 | |
| | | | | | | | |
| | |
| TOTAL FINANCIALS | | | | | | | 353,959 | |
| | | | | | | | |
| |
TOTAL COMMON STOCKS (Cost $2,264,857) | | | | 2,499,891 | |
| | | | | | | | |
|
| EXCHANGE TRADED FUNDS (88.80%) | |
Debt (17.05%) | | | | | | | | |
PIMCO 0-5 Year High Yield Corporate Bond Index ETF | | | 27,904 | | | | 2,977,357 | |
Riverfront Strategic Income Fund(a) | | | 125,419 | | | | 3,188,151 | |
SPDR® Barclays Capital High Yield Bond ETF | | | 9,732 | | | | 402,418 | |
SPDR® Barclays Short Term High Yield Bond ETF | | | 115,038 | | | | 3,561,577 | |
| | | | | | | | |
| | | | | | | 10,129,503 | |
| | | | | | | | |
Equity (71.75%) | | | | | | | | |
DB X-trackers MSCI EAFE Hedged Equity Fund | | | 65,940 | | | | 1,800,162 | |
First Trust NASDAQ Technology Dividend Index Fund | | | 31,205 | | | | 789,486 | |
| | | | | | | | |
| | | | | | Value | |
| | | Shares | | | (Note 2) | |
| |
Equity (continued) | | | | | | | | |
FlexShares Quality Dividend Index Fund | | | 25,815 | | | $ | 881,840 | |
Global X FTSE Nordic Region ETF | | | 11,410 | | | | 295,633 | |
Global X MLP & Energy Infrastructure ETF | | | 51,128 | | | | 904,966 | |
Global X Norway 30 ETF | | | 26,150 | | | | 453,441 | |
Guggenheim Insider Sentiment ETF | | | 7,411 | | | | 348,095 | |
Guggenheim S&P 500® Equal Weight Energy ETF | | | 11,762 | | | | 1,021,883 | |
iShares® MSCI All Country Asia ex Japan Index Fund | | | 38,295 | | | | 2,283,148 | |
iShares® MSCI Australia Index Fund | | | 49,049 | | | | 1,297,346 | |
iShares® MSCI EMU Index Fund | | | 38,408 | | | | 1,653,464 | |
iShares® MSCI Poland Capped ETF | | | 14,358 | | | | 435,335 | |
iShares® MSCI Spain Capped ETF | | | 14,351 | | | | 602,311 | |
iShares® North American Tech-Multimedia Networking ETF | | | 32,810 | | | | 1,092,245 | |
iShares® Russell Microcap Index Fund | | | 35,917 | | | | 2,610,088 | |
iShares® Transportation Average ETF | | | 3,028 | | | | 415,381 | |
Powershares® Dynamic Food & Beverage Portfolio | | | 55,851 | | | | 1,508,536 | |
PowerShares® S&P 500® High Beta Port ETF | | | 18,355 | | | | 572,125 | |
Schwab U.S. REIT ETF | | | 58,490 | | | | 2,008,547 | |
Vanguard® FTSE® Europe ETF | | | 86,277 | | | | 5,220,621 | |
Vanguard® Information Technology ETF | | | 7,208 | | | | 653,982 | |
Wilshire Micro-Cap ETF | | | 19,439 | | | | 517,272 | |
WisdomTree® Europe Hedged Equity Fund | | | 25,233 | | | | 1,451,402 | |
WisdomTree® Europe SmallCap Dividend Fund | | | 22,998 | | | | 1,435,995 | |
WisdomTree® Japan Hedged Equity Fund | | | 45,554 | | | | 2,099,584 | |
WisdomTree® Japan SmallCap Dividend Fund | | | 10,407 | | | | 514,626 | |
WisdomTree® LargeCap Dividend Fund | | | 142,177 | | | | 9,766,138 | |
| | | | | | | | |
| | | | | | | 42,633,652 | |
| | | | | | | | |
| |
TOTAL EXCHANGE TRADED FUNDS (Cost $49,209,789) | | | | 52,763,155 | |
| | | | | | | | |
101 | April 30, 2014
| | |
| RiverFront Dynamic Equity Income Fund |
| Statement of Investments | | April 30, 2014 |
| | | | | | | | |
| | | | | | Value | |
| | | Shares | | | (Note 2) | |
| |
EXCHANGE TRADED NOTES (2.34%) | |
Equity (2.34%) | | | | | | | | |
Barclays ETN+ Select MLP ETNs | | | 26,164 | | | $ | 756,140 | |
Credit Suisse Cushing® 30 MLP Index ETN | | | 19,105 | | | | 635,050 | |
| | | | | | | | |
| | | | | | | 1,391,190 | |
| | | | | | | | |
| |
TOTAL EXCHANGE TRADED NOTES (Cost $1,204,261) | | | | 1,391,190 | |
| | | | | | | | |
| | | | | | | | | | | | |
| | | |
| | | 7-Day | | | | | | Value | |
| | | Yield | | | Shares | | | (Note 2) | |
| |
SHORT TERM INVESTMENTS (2.59%) | |
| Money Market Fund (2.59%) | | | | | |
Morgan Stanley Institutional Liquidity Fund, Prime Portfolio | | | 0.055% | | | | 1,538,531 | | | | 1,538,531 | |
| | | | | | | | | | | | |
| |
TOTAL SHORT TERM INVESTMENTS (Cost $1,538,531) | | | | 1,538,531 | |
| | | | | | | | | | | | |
| |
TOTAL INVESTMENTS (97.94%) (Cost $54,217,438) | | | $ | 58,192,767 | |
| |
Other Assets In Excess Of Liabilities (2.06%) | | | | 1,221,536 | |
| | | | | | | | | | | | |
| |
| NET ASSETS (100.00%) | | | $ | 59,414,303 | |
| | | | | | | | | | | | |
| (a) | Affiliated Company. See Note 7 to Financial Statements. |
Common Abbreviations:
EAFE - Europe, Australia, and Far East.
EMU - European Monetary Union.
ETF - Exchange Traded Fund.
ETN - Exchange Traded Note.
FTSE - Financial Times and the London Stock Exchange.
MLP - Master Limited Partnership.
MSCI - Morgan Stanley Capital International.
REIT - Real Estate Investment Trust.
S&P - Standard and Poor’s.
SPDR - Standard and Poor’s Depositary Receipt.
For Fund compliance purposes, the Fund’s industry classifications refer to any one or more of the industry sub-classifications used by one or more widely recognized market indexes or ratings group indexes, and/or as defined by Fund management. This definition may not apply for purposes of this report, which may combine industry sub-classifications for reporting ease. Industries are shown as a percent of net assets.
See Notes to Financial Statements.
102 | April 30, 2014
| | |
| RiverFront Global Allocation Fund | | |
| Statement of Investments | | April 30, 2014 |
| | | | | | | | |
| | | | | | Value | |
| | | Shares | | | (Note 2) | |
| |
COMMON STOCKS (4.58%) | |
Communications (1.33%) | | | | | | | | |
Internet (0.54%) | | | | | | | | |
eBay, Inc.(a) | | | 3,533 | | | $ | 183,116 | |
| | | | | | | | |
| |
Media (0.79%) | | | | | |
The Walt Disney Co. | | | 3,409 | | | | 270,470 | |
| | | | | | | | |
| | |
| TOTAL COMMUNICATIONS | | | | | | | 453,586 | |
| | | | | | | | |
|
| Consumer, Cyclical (0.67%) | |
Retail (0.67%) | | | | | | | | |
CVS Caremark Corp. | | | 3,160 | | | | 229,795 | |
| | | | | | | | |
| | |
| TOTAL CONSUMER, CYCLICAL | | | | | | | 229,795 | |
| | | | | | | | |
|
| Consumer, Non-Cyclical (2.07%) | |
Food (0.73%) | | | | | | | | |
General Mills, Inc. | | | 4,719 | | | | 250,201 | |
| | | | | | | | |
| | |
Pharmaceuticals (1.34%) | | | | | | | | |
Abbott Laboratories | | | 5,386 | | | | 208,654 | |
Omnicare, Inc. | | | 4,241 | | | | 251,364 | |
| | | | | | | | |
| | | | | | | 460,018 | |
| | | | | | | | |
| |
TOTAL CONSUMER, NON-CYCLICAL | | | | 710,219 | |
| | | | | | | | |
| | |
| Financials (0.51%) | | | | | | | | |
Diversified Financial Services (0.51%) | |
Discover Financial Services | | | 3,100 | | | | 173,290 | |
| | | | | | | | |
| | |
| TOTAL FINANCIALS | | | | | | | 173,290 | |
| | | | | | | | |
| | |
TOTAL COMMON STOCKS (Cost $1,393,232) | | | | | | | 1,566,890 | |
| | | | | | | | |
| | |
| EXCHANGE TRADED FUNDS (91.90%) | | | | | | | | |
Debt (7.21%) | | | | | | | | |
iShares® iBoxx $ High Yield Corporate Bond Fund | | | 3,180 | | | | 300,001 | |
Riverfront Strategic Income Fund(b) | | | 73,453 | | | | 1,867,175 | |
SPDR® Barclays Capital High Yield Bond ETF | | | 7,294 | | | | 301,607 | |
| | | | | | | | |
| | | | | | | 2,468,783 | |
| | | | | | | | |
Equity (84.69%) | | | | | | | | |
DB X-trackers MSCI EAFE Hedged Equity Fund | | | 37,890 | | | | 1,034,397 | |
Financial Select Sector SPDR® Fund | | | 34,134 | | | | 749,583 | |
| | | | | | | | |
| | | | | | Value | |
| | | Shares | | | (Note 2) | |
| |
Equity (continued) | | | | | | | | |
First Trust Dow Jones® Select Micro-Cap Index Fund | | | 22,652 | | | $ | 702,892 | |
First Trust NASDAQ Technology Dividend Index Fund | | | 32,624 | | | | 825,387 | |
FlexShares Quality Dividend Index Fund | | | 24,460 | | | | 835,554 | |
Global X FTSE Nordic Region ETF | | | 6,812 | | | | 176,499 | |
Global X MLP & Energy Infrastructure ETF | | | 16,335 | | | | 289,129 | |
Global X Norway 30 ETF | | | 17,756 | | | | 307,889 | |
Guggenheim Insider Sentiment ETF | | | 3,710 | | | | 174,259 | |
Guggenheim S&P 500® Equal Weight Energy ETF | | | 6,363 | | | | 552,817 | |
iShares® MSCI All Country Asia ex Japan Index Fund | | | 31,375 | | | | 1,870,577 | |
iShares® MSCI Australia Index Fund | | | 29,028 | | | | 767,791 | |
iShares® MSCI EAFE Index Fund | | | 7,354 | | | | 502,425 | |
iShares® MSCI EMU Index Fund | | | 31,648 | | | | 1,362,446 | |
iShares® MSCI Japan Index Fund | | | 24,700 | | | | 273,676 | |
iShares® MSCI Poland Capped ETF | | | 8,402 | | | | 254,749 | |
iShares® MSCI Spain Capped ETF | | | 9,771 | | | | 410,089 | |
iShares® MSCI Switzerland Index Fund | | | 10,700 | | | | 374,821 | |
iShares® MSCI United Kingdom Index Fund | | | 13,464 | | | | 289,745 | |
iShares® North American Tech-Multimedia Networking ETF | | | 19,187 | | | | 638,735 | |
iShares® Russell Microcap Index Fund | | | 15,035 | | | | 1,092,593 | |
iShares® Transportation Average ETF | | | 2,845 | | | | 390,277 | |
iShares® US Consumer Goods ETF | | | 10,397 | | | | 1,006,638 | |
Powershares® Dynamic Food & Beverage Portfolio | | | 45,336 | | | | 1,224,525 | |
PowerShares® FTSE® RAFI Developed Markets ex-U.S. Portfolio | | | 11,532 | | | | 516,980 | |
PowerShares® S&P 500® High Beta Port ETF | | | 38,100 | | | | 1,187,577 | |
Schwab U.S. REIT ETF | | | 22,840 | | | | 784,326 | |
Vanguard® FTSE® Developed Markets ETF | | | 32,897 | | | | 1,379,042 | |
Vanguard® FTSE® Europe ETF | | | 41,704 | | | | 2,523,509 | |
Vanguard® Information Technology ETF | | | 3,683 | | | | 334,159 | |
Vanguard® Large-Cap ETF | | | 20,562 | | | | 1,778,202 | |
Wilshire Micro-Cap ETF | | | 32,778 | | | | 872,223 | |
WisdomTree® Europe Hedged Equity Fund | | | 14,951 | | | | 859,981 | |
103 | April 30, 2014
| | |
| RiverFront Global Allocation Fund |
| Statement of Investments | | April 30, 2014 |
| | | | | | | | |
| | | | | | Value | |
| | | Shares | | | (Note 2) | |
| |
Equity (continued) | |
WisdomTree® Europe SmallCap Dividend Fund | | | 13,688 | | | $ | 854,679 | |
WisdomTree® Japan Hedged Equity Fund | | | 32,506 | | | | 1,498,201 | |
WisdomTree® Japan SmallCap Dividend Fund | | | 6,166 | | | | 304,909 | |
| | | | | | | | |
| | | | | | | 29,001,281 | |
| | | | | | | | |
| |
TOTAL EXCHANGE TRADED FUNDS (Cost $28,645,141) | | | | 31,470,064 | |
| | | | | | | | |
|
| EXCHANGE TRADED NOTES (1.06%) | |
Equity (1.06%) | |
Barclays ETN+ Select MLP ETNs | | | 12,570 | | | | 363,273 | |
| | | | | | | | |
| |
TOTAL EXCHANGE TRADED NOTES (Cost $341,901) | | | | 363,273 | |
| | | | | | | | |
| | | | | | | | | | | | |
| | | |
| | | 7-Day | | | | | | Value | |
| | | Yield | | | Shares | | | (Note 2) | |
| |
SHORT TERM INVESTMENTS (2.38%) | |
| Money Market Fund (2.38%) | | | | | |
Morgan Stanley Institutional Liquidity Fund, Prime Portfolio | | | 0.055% | | | | 815,885 | | | | 815,885 | |
| | | | | | | | | | | | |
| |
TOTAL SHORT TERM INVESTMENTS (Cost $815,885) | | | | 815,885 | |
| | | | | | | | | | | | |
| |
TOTAL INVESTMENTS (99.92%) (Cost $31,196,159) | | | $ | 34,216,112 | |
| |
| Other Assets In Excess Of Liabilities (0.08%) | | | | 27,392 | |
| | | | | | | | | | | | |
| |
| NET ASSETS (100.00%) | | | $ | 34,243,504 | |
| | | | | | | | | | | | |
| (a) | Non-Income Producing Security. |
| (b) | Affiliated Company. See Note 7 to Financial Statements. |
Common Abbreviations:
EAFE - Europe, Australia, and Far East.
EMU - European Monetary Union.
ETN - Exchange Traded Note.
ETF - Exchange Traded Fund.
FTSE - Financial Times and the London Stock Exchange.
MLP - Master Limited Partnership.
MSCI - Morgan Stanley Capital International.
RAFI - Research Affiliates Fundamental Index.
REIT - Real Estate Investment Trust.
S&P - Standard and Poor’s.
SPDR - Standard and Poor’s Depositary Receipt.
For Fund compliance purposes, the Fund’s industry classifications refer to any one or more of the industry sub-classifications used by one or more widely recognized market indexes or ratings group indexes, and/or as defined by Fund management. This definition may not apply for purposes of this report, which may combine industry sub-classifications for reporting ease. Industries are shown as a percent of net assets.
See Notes to Financial Statements.
104 | April 30, 2014
| | |
| RiverFront Global Growth Fund | | |
| Statement of Investments | | April 30, 2014 |
| | | | | | | | |
| | | | | | Value | |
| | | Shares | | | (Note 2) | |
| |
COMMON STOCKS (5.31%) | |
| Communications (1.41%) | |
Internet (0.63%) | | | | | | | | |
eBay, Inc.(a) | | | 8,831 | | | $ | 457,711 | |
| | | | | | | | |
| | |
Media (0.78%) | | | | | | | | |
The Walt Disney Co. | | | 7,203 | | | | 571,486 | |
| | | | | | | | |
| |
| TOTAL COMMUNICATIONS | | | | 1,029,197 | |
| | | | | | | | |
|
| Consumer, Cyclical (0.79%) | |
Retail (0.79%) | | | | | | | | |
CVS Caremark Corp. | | | 7,976 | | | | 580,015 | |
| | | | | | | | |
| |
| TOTAL CONSUMER, CYCLICAL | | | | 580,015 | |
| | | | | | | | |
|
| Consumer, Non-Cyclical (2.52%) | |
Food (0.95%) | | | | | | | | |
General Mills, Inc. | | | 13,114 | | | | 695,304 | |
| | | | | | | | |
|
| Pharmaceuticals (1.57%) | |
Abbott Laboratories | | | 13,680 | | | | 529,963 | |
Omnicare, Inc. | | | 10,496 | | | | 622,098 | |
| | | | | | | | |
| | | | | | | 1,152,061 | |
| | | | | | | | |
| |
| TOTAL CONSUMER, NON-CYCLICAL | | | | 1,847,365 | |
| | | | | | | | |
| | |
| Financials (0.59%) | | | | | | | | |
| Diversified Financial Services (0.59%) | |
Discover Financial Services | | | 7,760 | | | | 433,784 | |
| | | | | | | | |
| |
| TOTAL FINANCIALS | | | | 433,784 | |
| | | | | | | | |
| |
TOTAL COMMON STOCKS (Cost $3,456,251) | | | | 3,890,361 | |
| | | | | | | | |
|
| EXCHANGE TRADED FUNDS (91.13%) | |
Equity (91.13%) | | | | | | | | |
DB X-trackers MSCI EAFE Hedged Equity Fund | | | 80,809 | | | | 2,206,086 | |
Financial Select Sector SPDR® Fund | | | 68,047 | | | | 1,494,312 | |
First Trust Dow Jones® Select Micro-Cap Index Fund | | | 59,897 | | | | 1,858,604 | |
First Trust NASDAQ Technology Dividend Index Fund | | | 68,112 | | | | 1,723,234 | |
FlexShares Quality Dividend Index Fund | | | 32,575 | | | | 1,112,762 | |
Global X FTSE Nordic Region ETF | | | 14,460 | | | | 374,659 | |
Global X MLP & Energy Infrastructure ETF | | | 43,474 | | | | 769,490 | |
Global X Norway 30 ETF | | | 37,587 | | | | 651,759 | |
| | | | | | | | |
| | | | | | Value | |
| | | Shares | | | (Note 2) | |
| |
Equity (continued) | | | | | | | | |
Guggenheim Insider Sentiment ETF | | | 10,954 | | | $ | 514,509 | |
Guggenheim S&P 500® Equal Weight Energy ETF | | | 18,131 | | | | 1,575,221 | |
iShares® MSCI All Country Asia ex Japan Index Fund | | | 84,088 | | | | 5,013,327 | |
iShares® MSCI Australia Index Fund | | | 62,114 | | | | 1,642,915 | |
iShares® MSCI EMU Index Fund | | | 80,245 | | | | 3,454,547 | |
iShares® MSCI Japan Index Fund | | | 66,065 | | | | 732,000 | |
iShares® MSCI Pacific ex-Japan Index Fund | | | 15,225 | | | | 751,963 | |
iShares® MSCI Poland Capped ETF | | | 17,917 | | | | 543,243 | |
iShares® MSCI Spain Capped ETF | | | 18,302 | | | | 768,135 | |
iShares® MSCI Switzerland Index Fund | | | 22,450 | | | | 786,423 | |
iShares® MSCI United Kingdom Index Fund | | | 26,914 | | | | 579,189 | |
iShares® North American Tech- Multimedia Networking ETF | | | 20,017 | | | | 666,366 | |
iShares® Russell Microcap Index Fund | | | 29,954 | | | | 2,176,757 | |
iShares® Transportation Average ETF | | | 6,351 | | | | 871,230 | |
iShares® US Consumer Goods ETF | | | 20,627 | | | | 1,997,106 | |
Powershares® Dynamic Food & Beverage Portfolio | | | 61,178 | | | | 1,652,418 | |
PowerShares® FTSE® RAFI Developed Markets ex-U.S. Portfolio | | | 32,277 | | | | 1,446,978 | |
PowerShares® S&P 500® High Beta Port ETF | | | 169,003 | | | | 5,267,824 | |
Schwab U.S. REIT ETF | | | 54,662 | | | | 1,877,093 | |
Vanguard® FTSE® Developed Markets ETF | | | 74,349 | | | | 3,116,710 | |
Vanguard® FTSE® Europe ETF | | | 116,687 | | | | 7,060,730 | |
Vanguard® Information Technology ETF | | | 21,943 | | | | 1,990,888 | |
Vanguard® Large-Cap ETF | | | 24,025 | | | | 2,077,682 | |
Wilshire Micro-Cap ETF | | | 76,849 | | | | 2,044,952 | |
WisdomTree® Europe Hedged Equity Fund | | | 31,880 | | | | 1,833,738 | |
WisdomTree® Europe SmallCap Dividend Fund | | | 29,188 | | | | 1,822,499 | |
WisdomTree® Japan Hedged Equity Fund | | | 79,359 | | | | 3,657,656 | |
105 | April 30, 2014
| | |
| RiverFront Global Growth Fund |
| Statement of Investments | | April 30, 2014 |
| | | | | | | | |
| | | | | | Value | |
| | | Shares | | | (Note 2) | |
| |
Equity (continued) | | | | | | | | |
WisdomTree® Japan SmallCap Dividend Fund | | | 12,895 | | | $ | 637,658 | |
| | | | | | | | |
| | | | | | | 66,750,663 | |
| | | | | | | | |
| |
TOTAL EXCHANGE TRADED FUNDS (Cost $58,394,361) | | | | 66,750,663 | |
| | | | | | | | |
|
| EXCHANGE TRADED NOTES (1.07%) | |
Equity (1.07%) | | | | | |
Barclays ETN+ Select MLP ETNs | | | 26,954 | | | | 778,971 | |
| | | | | | | | |
| |
TOTAL EXCHANGE TRADED NOTES (Cost $733,894) | | | | 778,971 | |
| | | | | | | | |
| | | | | | | | | | | | |
| | | |
| | | 7-Day | | | | | | Value | |
| | | Yield | | | Shares | | | (Note 2) | |
| |
SHORT TERM INVESTMENTS (2.55%) | |
| Money Market Fund (2.55%) | | | | | |
Morgan Stanley Institutional Liquidity Fund, Prime Portfolio | | | 0.055% | | | | 1,869,138 | | | | 1,869,138 | |
| | | | | | | | | | | | |
| |
TOTAL SHORT TERM INVESTMENTS (Cost $1,869,138) | | | | 1,869,138 | |
| | | | | | | | | | | | |
| |
TOTAL INVESTMENTS (100.06%) (Cost $64,453,644) | | | $ | 73,289,133 | |
| |
Liabilities In Excess Of Other Assets (-0.06%) | | | | (40,512) | |
| | | | | | | | | | | | |
| |
| NET ASSETS (100.00%) | | | $ | 73,248,621 | |
| | | | | | | | | | | | |
| (a) | Non-Income Producing Security. |
Common Abbreviations:
EAFE - Europe, Australia, and Far East.
EMU - European Monetary Union.
ETN - Exchange Traded Note.
ETF - Exchange Traded Fund.
FTSE - Financial Times and the London Stock Exchange.
MLP - Master Limited Partnership.
MSCI - Morgan Stanley Capital International.
RAFI - Research Affiliates Fundamental Index.
REIT - Real Estate Investment Trust.
S&P - Standard and Poor’s.
SPDR - Standard and Poor’s Depositary Receipt.
For Fund compliance purposes, the Fund’s industry classifications refer to any one or more of the industry sub-classifications used by one or more widely recognized market indexes or ratings group indexes, and/or as defined by Fund management. This definition may not apply for purposes of this report, which may combine industry sub-classifications for reporting ease. Industries are shown as a percent of net assets.
See Notes to Financial Statements.
106 | April 30, 2014
| | |
| RiverFront Moderate Growth & Income Fund |
| Statement of Investments | | April 30, 2014 |
| | | | | | | | |
| | | | | | Value | |
| | | Shares | | | (Note 2) | |
| |
COMMON STOCKS (4.39%) | |
| Communications (0.80%) | |
Media (0.80%) | | | | | | | | |
The Walt Disney Co. | | | 13,291 | | | $ | 1,054,508 | |
| | | | | | | | |
| |
| TOTAL COMMUNICATIONS | | | | 1,054,508 | |
| | | | | | | | |
|
| Consumer, Cyclical (0.78%) | |
Retail (0.78%) | | | | | | | | |
CVS Caremark Corp. | | | 14,231 | | | | 1,034,878 | |
| | | | | | | | |
| |
| TOTAL CONSUMER, CYCLICAL | | | | 1,034,878 | |
| | | | | | | | |
|
| Consumer, Non-Cyclical (2.17%) | |
| Cosmetics/Personal Care (0.70%) | |
Colgate-Palmolive Co. | | | 13,700 | | | | 922,010 | |
| | | | | | | | |
| | |
Food (0.74%) | | | | | | | | |
General Mills, Inc. | | | 18,406 | | | | 975,886 | |
| | | | | | | | |
|
| Pharmaceuticals (0.73%) | |
Abbott Laboratories | | | 24,928 | | | | 965,711 | |
| | | | | | | | |
| |
| TOTAL CONSUMER, NON-CYCLICAL | | | | 2,863,607 | |
| | | | | | | | |
|
| Financials (0.64%) | |
| Diversified Financial Services (0.64%) | |
Discover Financial Services | | | 15,005 | | | | 838,780 | |
| | | | | | | | |
| |
| TOTAL FINANCIALS | | | | 838,780 | |
| | | | | | | | |
| |
TOTAL COMMON STOCKS (Cost $5,175,160) | | | | 5,791,773 | |
| | | | | | | | |
|
| EXCHANGE TRADED FUNDS (88.61%) | |
Debt (34.18%) | | | | | | | | |
iShares® Barclays 1-3 Year Credit Bond Fund | | | 92,336 | | | | 9,742,371 | |
iShares® iBoxx $ High Yield Corporate Bond Fund | | | 13,061 | | | | 1,232,175 | |
PIMCO 0-5 Year High Yield Corporate Bond Index ETF | | | 84,143 | | | | 8,978,058 | |
Riverfront Strategic Income Fund(a) | | | 383,662 | | | | 9,752,688 | |
SPDR® Barclays Capital High Yield Bond ETF | | | 29,976 | | | | 1,239,508 | |
SPDR® Barclays Short Term Corporate Bond ETF | | | 168,958 | | | | 5,202,217 | |
| | | | | | | | |
| | | | | | Value | |
| | | Shares | | | (Note 2) | |
| |
Debt (continued) | | | | | | | | |
SPDR® Barclays Short Term High Yield Bond ETF | | | 288,821 | | | $ | 8,941,898 | |
| | | | | | | | |
| | | | | | | 45,088,915 | |
| | | | | | | | |
Equity (54.43%) | | | | | | | | |
DB X-trackers MSCI EAFE Hedged Equity Fund | | | 96,171 | | | | 2,625,468 | |
First Trust NASDAQ Technology Dividend Index Fund | | | 164,578 | | | | 4,163,823 | |
FlexShares Quality Dividend Index Fund | | | 144,058 | | | | 4,921,021 | |
Global X MLP & Energy Infrastructure ETF | | | 77,660 | | | | 1,374,582 | |
Guggenheim Insider Sentiment ETF | | | 14,238 | | | | 668,759 | |
Guggenheim S&P 500® Equal Weight Energy ETF | | | 13,861 | | | | 1,204,244 | |
iShares® MSCI Australia Index Fund | | | 66,960 | | | | 1,771,092 | |
iShares® MSCI EAFE Index Fund | | | 44,222 | | | | 3,021,247 | |
iShares® MSCI EAFE Value ETF | | | 28,140 | | | | 1,660,541 | |
iShares® MSCI EMU Index Fund | | | 57,941 | | | | 2,494,360 | |
iShares® MSCI United Kingdom Index Fund | | | 51,428 | | | | 1,106,731 | |
iShares® North American Tech-Multimedia Networking ETF | | | 48,302 | | | | 1,607,974 | |
iShares® Transportation Average ETF | | | 7,415 | | | | 1,017,190 | |
Powershares® Dynamic Food & Beverage Portfolio | | | 290,115 | | | | 7,836,006 | |
PowerShares® FTSE® RAFI Developed Markets ex-U.S. Portfolio | | | 46,908 | | | | 2,102,886 | |
Schwab U.S. REIT ETF | | | 156,498 | | | | 5,374,141 | |
Utilities Select Sector SPDR® Fund | | | 82,194 | | | | 3,557,356 | |
Vanguard® FTSE® Europe ETF | | | 92,946 | | | | 5,624,162 | |
Vanguard® Information Technology ETF | | | 16,924 | | | | 1,535,515 | |
WisdomTree® Japan Hedged Equity Fund | | | 55,296 | | | | 2,548,593 | |
WisdomTree® Japan SmallCap Dividend Fund | | | 18,567 | | | | 918,138 | |
WisdomTree® LargeCap Dividend Fund | | | 213,293 | | | | 14,651,096 | |
| | | | | | | | |
| | | | | | | 71,784,925 | |
| | | | | | | | |
| |
TOTAL EXCHANGE TRADED FUNDS (Cost $109,097,709) | | | | 116,873,840 | |
| | | | | | | | |
107 | April 30, 2014
| | |
| RiverFront Moderate Growth & Income Fund |
| Statement of Investments | | April 30, 2014 |
| | | | | | | | |
| | | | | | Value | |
| | | Shares | | | (Note 2) | |
| |
EXCHANGE TRADED NOTES (3.41%) | |
Equity (3.41%) | | | | | |
Barclays ETN+ Select MLP ETNs | | | 105,098 | | | $ | 3,037,332 | |
Credit Suisse Cushing® 30 MLP Index ETN | | | 43,717 | | | | 1,453,153 | |
| | | | | | | | |
| | | | | | | 4,490,485 | |
| | | | | | | | |
| |
TOTAL EXCHANGE TRADED NOTES (Cost $3,941,049) | | | | 4,490,485 | |
| | | | | | | | |
| | | | | | | | | | | | |
| | | |
| | | 7-Day | | | | | | Value | |
| | | Yield | | | Shares | | | (Note 2) | |
| |
SHORT TERM INVESTMENTS (2.64%) | |
| Money Market Fund (2.64%) | | | | | |
Morgan Stanley Institutional Liquidity Fund, Prime Portfolio | | | 0.055% | | | | 3,486,309 | | | | 3,486,309 | |
| | | | | | | | | | | | |
| |
TOTAL SHORT TERM INVESTMENTS (Cost $3,486,309) | | | | 3,486,309 | |
| | | | | | | | | | | | |
| |
TOTAL INVESTMENTS (99.05%) (Cost $121,700,227) | | | $ | 130,642,407 | |
| |
Other Assets In Excess Of Liabilities (0.95%) | | | | 1,253,769 | |
| | | | | | | | | | | | |
| |
| NET ASSETS (100.00%) | | | $ | 131,896,176 | |
| | | | | | | | | | | | |
| (a) | Affiliated Company. See Note 7 to Financial Statements. |
Common Abbreviations:
EAFE - Europe, Australia, and Far East.
EMU - European Monetary Union.
ETF - Exchange Traded Fund.
ETN - Exchange Traded Note.
FTSE - Financial Times and the London Stock Exchange.
MLP - Master Limited Partnership.
MSCI - Morgan Stanley Capital International.
RAFI - Research Affiliates Fundamental Index.
REIT - Real Estate Investment Trust.
S&P - Standard and Poor’s.
SPDR - Standard and Poor’s Depositary Receipt.
For Fund compliance purposes, the Fund’s industry classifications refer to any one or more of the industry sub-classifications used by one or more widely recognized market indexes or ratings group indexes, and/or as defined by Fund management. This definition may not apply for purposes of this report, which may combine industry sub-classifications for reporting ease. Industries are shown as a percent of net assets.
See Notes to Financial Statements.
108 | April 30, 2014
| | |
| RiverFront Global Allocation Series |
| Statements of Assets and Liabilities | | April 30, 2014 |
| | | | | | | | | | | | | | | | | | | | |
| | | RiverFront
Conservative
Income Builder Fund | | | RiverFront
Dynamic Equity
Income Fund | | | RiverFront
Global Allocation
Fund | | | RiverFront
Global Growth Fund | | | RiverFront
Moderate Growth & Income Fund | |
ASSETS | | | | | | | | | | | | | | | | | | | | |
Investments, at value | | $ | 6,068,670 | | | $ | 55,004,616 | | | $ | 32,348,937 | | | $ | 73,289,133 | | | $ | 120,889,719 | |
Investments in affiliates, at value | | | 484,124 | | | | 3,188,151 | | | | 1,867,175 | | | | – | | | | 9,752,688 | |
Receivable for investments sold | | | 42,207 | | | | – | | | | – | | | | – | | | | 1,225,020 | |
Receivable for shares sold | | | – | | | | 1,284,398 | | | | 72,334 | | | | 54,290 | | | | 192,404 | |
Dividends and interest receivable | | | 3,039 | | | | 20,230 | | | | 4,033 | | | | 10,684 | | | | 54,621 | |
Receivable due from adviser | | | 1,571 | | | | – | | | | – | | | | – | | | | – | |
Prepaid expenses and other assets | | | 10,277 | | | | 11,904 | | | | 11,526 | | | | 58,978 | | | | 12,347 | |
Total Assets | | | 6,609,888 | | | | 59,509,299 | | | | 34,304,005 | | | | 73,413,085 | | | | 132,126,799 | |
LIABILITIES | | | | | | | | | | | | | | | | | | | | |
Payable for shares redeemed | | | – | | | | 10,540 | | | | 5,202 | | | | 78,200 | | | | 49,338 | |
Investment advisory fees payable | | | – | | | | 31,359 | | | | 17,644 | | | | 41,261 | | | | 80,760 | |
Administration and transfer agency fees payable | | | 198 | | | | 5,448 | | | | 3,342 | | | | 6,882 | | | | 12,422 | |
Distribution and services fees payable | | | 3,552 | | | | 23,593 | | | | 13,771 | | | | 14,267 | | | | 57,487 | |
Trustees’ fees and expenses payable | | | 49 | | | | 450 | | | | 274 | | | | 570 | | | | 1,049 | |
Professional fees payable | | | 15,510 | | | | 15,678 | | | | 15,611 | | | | 15,756 | | | | 16,503 | |
Custody fees payable | | | 1,537 | | | | 1,887 | | | | 1,552 | | | | 1,130 | | | | 1,717 | |
Printing fees payable | | | 235 | | | | 2,526 | | | | 1,609 | | | | 3,420 | | | | 6,556 | |
Accrued expenses and other liabilities | | | 440 | | | | 3,515 | | | | 1,496 | | | | 2,978 | | | | 4,791 | |
Total Liabilities | | | 21,521 | | | | 94,996 | | | | 60,501 | | | | 164,464 | | | | 230,623 | |
| NET ASSETS | | $ | 6,588,367 | | | $ | 59,414,303 | | | $ | 34,243,504 | | | $ | 73,248,621 | | | $ | 131,896,176 | |
| | | | | | | | | | | | | | | | | | | | | |
NET ASSETS CONSIST OF | | | | | | | | | | | | | | | | | | | | |
Paid-in capital | | $ | 6,263,444 | | | $ | 53,491,603 | | | $ | 29,778,775 | | | $ | 61,248,737 | | | $ | 119,211,021 | |
Accumulated net investment income/(loss) | | | 7,353 | | | | 15,178 | | | | – | | | | 2,262 | | | | 60,631 | |
Accumulated net realized gain on investments | | | 100,711 | | | | 1,932,193 | | | | 1,444,776 | | | | 3,162,133 | | | | 3,682,344 | |
Net unrealized appreciation in value on investments | | | 216,859 | | | | 3,975,329 | | | | 3,019,953 | | | | 8,835,489 | | | | 8,942,180 | |
| NET ASSETS | | $ | 6,588,367 | | | $ | 59,414,303 | | | $ | 34,243,504 | | | $ | 73,248,621 | | | $ | 131,896,176 | |
| | | | | | | | | | | | | | | | | | | | | |
INVESTMENTS, AT COST | | $ | 5,856,946 | | | $ | 51,077,080 | | | $ | 29,359,458 | | | $ | 64,453,644 | | | $ | 112,069,546 | |
INVESTMENTS IN AFFILIATES, AT COST | | $ | 478,989 | | | $ | 3,140,358 | | | $ | 1,836,701 | | | $ | – | | | $ | 9,630,681 | |
See Notes to Financial Statements.
109 | April 30, 2014
| | |
| RiverFront Global Allocation Series |
| Statements of Assets and Liabilities (continued) | | April 30, 2014 |
| | | | | | | | | | | | | | | | | | | | |
| | | RiverFront
Conservative
Income Builder Fund | | | RiverFront
Dynamic Equity
Income Fund | | | RiverFront
Global Allocation
Fund | | | RiverFront
Global Growth Fund | | | RiverFront
Moderate Growth
& Income Fund | |
| | | | | |
| PRICING OF SHARES | | | | | | | | | | | | | | | | | | | | |
Class A: | | | | | | | | | | | | | | | | | | | | |
Net Asset Value, offering and redemption price per share(a) | | $ | 10.83 | | | $ | 12.97 | | | $ | 12.97 | | | $ | 15.26 | | | $ | 11.99 | |
Net Assets | | $ | 1,100,870 | | | $ | 15,373,878 | | | $ | 9,098,215 | | | $ | 16,439,878 | | | $ | 31,033,184 | |
Shares of beneficial interest outstanding | | | | | | | | | | | | | | | | | | | | |
(unlimited number of shares, no par value common stock authorized) | | | 101,688 | | | | 1,185,650 | | | | 701,390 | | | | 1,077,439 | | | | 2,588,680 | |
Maximum offering price per share | | | | | | | | | | | | | | | | | | | | |
((NAV/0.9450), based on maximum sales charge of 5.50% of the offering price) | | $ | 11.46 | | | $ | 13.72 | | | $ | 13.72 | | | $ | 16.15 | | | $ | 12.69 | |
Class C: | | | | | | | | | | | | | | | | | | | | |
Net Asset Value, offering and redemption price per share(a) | | $ | 10.77 | | | $ | 12.84 | | | $ | 12.83 | | | $ | 15.07 | | | $ | 11.94 | |
Net Assets | | $ | 4,106,393 | | | $ | 25,786,795 | | | $ | 14,624,058 | | | $ | 11,510,613 | | | $ | 63,030,708 | |
Shares of beneficial interest outstanding | | | | | | | | | | | | | | | | | | | | |
(unlimited number of shares, no par value common stock authorized) | | | 381,410 | | | | 2,008,794 | | | | 1,139,464 | | | | 763,997 | | | | 5,278,585 | |
Class I: | | | | | | | | | | | | | | | | | | | | |
Net Asset Value, offering and redemption price per share | | $ | 10.66 | | | $ | 12.88 | | | $ | 12.75 | | | $ | 15.32 | | | $ | 11.98 | |
Net Assets | | $ | 1,381,104 | | | $ | 18,253,630 | | | $ | 10,521,231 | | | $ | 11,844,635 | | | $ | 37,832,284 | |
Shares of beneficial interest outstanding | | | | | | | | | | | | | | | | | | | | |
(unlimited number of shares, no par value common stock authorized) | | | 129,593 | | | | 1,417,270 | | | | 825,441 | | | | 773,290 | | | | 3,158,748 | |
Class L: | | | | | | | | | | | | | | | | | | | | |
Net Asset Value, offering and redemption price per share | | | N/A | | | | N/A | | | | N/A | | | $ | 15.29 | | | | N/A | |
Net Assets | | | N/A | | | | N/A | | | | N/A | | | $ | 25,092,414 | | | | N/A | |
Shares of beneficial interest outstanding | | | | | | | | | | | | | | | | | | | | |
(unlimited number of shares, no par value common stock authorized) | | | N/A | | | | N/A | | | | N/A | | | | 1,641,169 | | | | N/A | |
Investor Class: | | | | | | | | | | | | | | | | | | | | |
Net Asset Value, offering and redemption price per share | | | N/A | | | | N/A | | | | N/A | | | $ | 15.19 | | | | N/A | |
Net Assets | | | N/A | | | | N/A | | | | N/A | | | $ | 8,361,081 | | | | N/A | |
Shares of beneficial interest outstanding | | | | | | | | | | | | | | | | | | | | |
(unlimited number of shares, no par value common stock authorized) | | | N/A | | | | N/A | | | | N/A | | | | 550,551 | | | | N/A | |
| (a) | Redemption price per share may be reduced for any applicable contingent deferred sales charge. For a description of a possible sales charge, please see the Fund’s Prospectus. |
See Notes to Financial Statements.
110 | April 30, 2014
| | |
| RiverFront Global Allocation Series |
| Statements of Operations | | For the Year Ended April 30, 2014 |
| | | | | | | | | | | | | | | | | | | | |
| | | RiverFront
Conservative Income Builder Fund | | | RiverFront
Dynamic Equity
Income Fund | | | RiverFront
Global Allocation
Fund | | | RiverFront
Global Growth Fund | | | RiverFront
Moderate Growth
& Income Fund | |
INVESTMENT INCOME | | | | | | | | | | | | | | | | | | | | |
Dividends | | $ | 113,718 | | | $ | 1,094,541 | | | $ | 546,861 | | | $ | 1,261,108 | | | $ | 2,941,388 | |
Dividends from affiliated securities | | | 4,863 | | | | 40,524 | | | | 24,674 | | | | – | | | | 106,997 | |
Other income | | | – | | | | 90 | | | | 31 | | | | 131 | | | | 222 | |
Total Investment Income | | | 118,581 | | | | 1,135,155 | | | | 571,566 | | | | 1,261,239 | | | | 3,048,607 | |
| | | | | |
| EXPENSES | | | | | | | | | | | | | | | | | | | | |
Investment advisory fees | | | 41,738 | | | | 383,400 | | | | 247,136 | | | | 539,339 | | | | 1,039,286 | |
Administrative and transfer agency fees | | | 7,108 | | | | 52,970 | | | | 34,995 | | | | 73,797 | | | | 140,563 | |
Distribution and service fees | | | | | | | | | | | | | | | | | | | | |
Class A | | | 2,038 | | | | 25,783 | | | | 21,599 | | | | 28,226 | | | | 77,669 | |
Class C | | | 27,598 | | | | 202,348 | | | | 117,660 | | | | 90,588 | | | | 576,494 | |
Investor Class | | | – | | | | – | | | | – | | | | 21,787 | | | | – | |
Professional fees | | | 16,263 | | | | 18,266 | | | | 17,654 | | | | 19,073 | | | | 22,209 | |
Reports to shareholders and printing fees | | | 741 | | | | 6,796 | | | | 4,334 | | | | 8,756 | | | | 17,655 | |
State registration fees | | | 33,646 | | | | 40,684 | | | | 38,316 | | | | 61,742 | | | | 42,681 | |
Insurance fees | | | 52 | | | | 722 | | | | 472 | | | | 1,104 | | | | 2,125 | |
Custody fees | | | 9,102 | | | | 10,391 | | | | 9,499 | | | | 8,928 | | | | 12,232 | |
Trustees’ fees and expenses | | | 197 | | | | 1,772 | | | | 1,133 | | | | 2,432 | | | | 4,703 | |
Offering costs | | | 19,356 | | | | – | | | | – | | | | – | | | | – | |
Miscellaneous expenses | | | 4,647 | | | | 14,934 | | | | 11,931 | | | | 17,128 | | | | 23,015 | |
Total Expenses | | | 162,486 | | | | 758,066 | | | | 504,729 | | | | 872,900 | | | | 1,958,632 | |
Less fees waived/reimbursed by investment advisor (Note 8) | | | | | | | | | | | | | | | | | | | | |
Class A | | | (14,608) | | | | (28,302) | | | | (31,141) | | | | (28,381) | | | | (52,042) | |
Class C | | | (50,536) | | | | (55,724) | | | | (41,816) | | | | (22,962) | | | | (96,176) | |
Class I | | | (23,541) | | | | (39,925) | | | | (30,843) | | | | (27,339) | | | | (55,830) | |
Class L | | | – | | | | – | | | | – | | | | (60,282) | | | | – | |
Investor Class | | | – | | | | – | | | | – | | | | (22,272) | | | | – | |
Net Expenses | | | 73,801 | | | | 634,115 | | | | 400,929 | | | | 711,664 | | | | 1,754,584 | |
Net Investment Income | | | 44,780 | | | | 501,040 | | | | 170,637 | | | | 549,575 | | | | 1,294,023 | |
Net realized gain on investments | | | 173,828 | | | | 2,992,680 | | | | 2,148,570 | | | | 6,157,817 | | | | 7,624,458 | |
Net realized loss on investments - affiliated securities | | | (270) | | | | – | | | | – | | | | – | | | | – | |
Net realized gain distributions from other investment companies | | | 1,636 | | | | 14,904 | | | | 9,169 | | | | 24,369 | | | | 33,187 | |
Net change in unrealized appreciation on investments | | | 107,775 | | | | 1,272,714 | | | | 958,395 | | | | 1,314,672 | | | | 1,671,672 | |
NET REALIZED AND UNREALIZED GAIN ON INVESTMENTS | | | 282,969 | | | | 4,280,298 | | | | 3,116,134 | | | | 7,496,858 | | | | 9,329,317 | |
NET INCREASE IN NET ASSETS RESULTING FROM OPERATIONS | | $ | 327,749 | | | $ | 4,781,338 | | | $ | 3,286,771 | | | $ | 8,046,433 | | | $ | 10,623,340 | |
| | | | | | | | | | | | | | | | | | | | | |
See Notes to Financial Statements.
111 | April 30, 2014
| | |
| RiverFront Conservative Income Builder Fund |
| Statements of Changes in Net Assets | | |
| | | | | | | | |
| | | For the Year Ended April 30, 2014 | | | For the Period
September 4, 2012
(Commencement) to
April 30, 2013 | |
OPERATIONS | | | | | | | | |
Net investment income | | $ | 44,780 | | | $ | 15,227 | |
Net realized gain on investments | | | 173,828 | | | | 16,667 | |
Net realized loss on investments - affiliated securities | | | (270) | | | | – | |
Net realized gain distributions from other investment companies | | | 1,636 | | | | – | |
Net change in unrealized appreciation on investments | | | 107,775 | | | | 109,084 | |
Net Increase in Net Assets Resulting from Operations | | | 327,749 | | | | 140,978 | |
DISTRIBUTIONS | | | | | | | | |
Dividends to shareholders from net investment income | | | | | | | | |
Class A | | | (7,713) | | | | (895) | |
Class C | | | (26,587) | | | | (3,477) | |
Class I | | | (11,868) | | | | (12,108) | |
Dividends to shareholders from net realized gains | | | | | | | | |
Class A | | | (16,067) | | | | – | |
Class C | | | (47,172) | | | | – | |
Class I | | | (27,911) | | | | – | |
Net Decrease in Net Assets from Distributions | | | (137,318) | | | | (16,480) | |
BENEFICIAL INTEREST TRANSACTIONS (NOTE 6) | | | | | | | | |
Shares sold | | | | | | | | |
Class A | | | 546,840 | | | | 590,998 | |
Class C | | | 2,524,709 | | | | 2,176,853 | |
Class I | | | 1,927,846 | | | | 745,479 | |
Dividends reinvested | | | | | | | | |
Class A | | | 8,715 | | | | 475 | |
Class C | | | 68,221 | | | | 2,582 | |
Class I | | | 39,779 | | | | 12,108 | |
Shares redeemed | | | | | | | | |
Class A | | | (92,120) | | | | – | |
Class C | | | (825,324) | | | | (6,853) | |
Class I | | | (1,387,092) | | | | (59,778) | |
Net Increase in Net Assets Derived from Beneficial Interest Transactions | | | 2,811,574 | | | | 3,461,864 | |
Net increase in net assets | | | 3,002,005 | | | | 3,586,362 | |
NET ASSETS | | | | | | | | |
Beginning of year | | | 3,586,362 | | | | – | |
End of year * | | $ | 6,588,367 | | | $ | 3,586,362 | |
| | | | | | | | | |
*Including accumulated net investment income of: | | $ | 7,353 | | | $ | 8,505 | |
See Notes to Financial Statements.
112 | April 30, 2014
|
| RiverFront Dynamic Equity Income Fund |
| Statements of Changes in Net Assets |
| | | | | | | | |
| | | For the Year Ended
April 30, 2014 | | | For the Year Ended
April 30, 2013 | |
OPERATIONS | | | | | | | | |
Net investment income | | $ | 501,040 | | | $ | 531,046 | |
Net realized gain on investments | | | 2,992,680 | | | | 1,802,700 | |
Net realized gain distributions from other investment companies | | | 14,904 | | | | – | |
Net change in unrealized appreciation on investments | | | 1,272,714 | | | | 764,280 | |
Net Increase in Net Assets Resulting from Operations | | | 4,781,338 | | | | 3,098,026 | |
DISTRIBUTIONS | | | | | | | | |
Dividends to shareholders from net investment income | | | | | | | | |
Class A | | | (135,855) | | | | (140,732) | |
Class C | | | (134,304) | | | | (192,727) | |
Class I | | | (236,905) | | | | (177,578) | |
Dividends to shareholders from net realized gains | | | | | | | | |
Class A | | | (365,030) | | | | – | |
Class C | | | (742,929) | | | | – | |
Class I | | | (549,797) | | | | – | |
Net Decrease in Net Assets from Distributions | | | (2,164,820) | | | | (511,037) | |
BENEFICIAL INTEREST TRANSACTIONS (NOTE 6) | | | | | | | | |
Shares sold | | | | | | | | |
Class A | | | 7,646,945 | | | | 3,202,766 | |
Class C | | | 10,756,383 | | | | 4,609,418 | |
Class I | | | 9,923,982 | | | | 5,250,086 | |
Dividends reinvested | | | | | | | | |
Class A | | | 464,335 | | | | 129,832 | |
Class C | | | 824,340 | | | | 180,549 | |
Class I | | | 679,588 | | | | 159,280 | |
Shares redeemed | | | | | | | | |
Class A | | | (1,433,618) | | | | (2,936,263) | |
Class C | | | (3,025,374) | | | | (3,724,460) | |
Class I | | | (3,656,006) | | | | (2,581,492) | |
Net Increase in Net Assets Derived from Beneficial Interest Transactions | | | 22,180,575 | | | | 4,289,716 | |
Net increase in net assets | | | 24,797,093 | | | | 6,876,705 | |
NET ASSETS | | | | | | | | |
Beginning of year | | | 34,617,210 | | | | 27,740,505 | |
End of year * | | $ | 59,414,303 | | | $ | 34,617,210 | |
| | | | | | | | | |
*Including accumulated net investment income of: | | $ | 15,178 | | | $ | 21,202 | |
See Notes to Financial Statements.
113 | April 30, 2014
| | |
| RiverFront Global Allocation Fund |
| Statements of Changes in Net Assets |
| | | | | | | | |
| | | For the Year Ended
April 30, 2014 | | | For the Year Ended
April 30, 2013 | |
OPERATIONS | | | | | | | | |
Net investment income | | $ | 170,637 | | | $ | 213,148 | |
Net realized gain on investments | | | 2,148,570 | | | | 1,215,328 | |
Net realized gain distributions from other investment companies | | | 9,169 | | | | – | |
Net change in unrealized appreciation on investments | | | 958,395 | | | | 803,271 | |
Net Increase in Net Assets Resulting from Operations | | | 3,286,771 | | | | 2,231,747 | |
DISTRIBUTIONS | | | | | | | | |
Dividends to shareholders from net investment income | | | | | | | | |
Class A | | | (60,721) | | | | (97,608) | |
Class C | | | (29,814) | | | | (82,166) | |
Class I | | | (77,225) | | | | (70,616) | |
Dividends to shareholders from net realized gains | | | | | | | | |
Class A | | | (225,948) | | | | – | |
Class C | | | (315,722) | | | | – | |
Class I | | | (241,798) | | | | – | |
Net Decrease in Net Assets from Distributions | | | (951,228) | | | | (250,390) | |
BENEFICIAL INTEREST TRANSACTIONS (NOTE 6) | | | | | | | | |
Shares sold | | | | | | | | |
Class A | | | 1,828,903 | | | | 3,042,104 | |
Class C | | | 5,733,154 | | | | 2,492,791 | |
Class I | | | 4,414,127 | | | | 4,368,510 | |
Dividends reinvested | | | | | | | | |
Class A | | | 278,213 | | | | 89,657 | |
Class C | | | 333,197 | | | | 76,038 | |
Class I | | | 312,410 | | | | 68,350 | |
Shares redeemed | | | | | | | | |
Class A | | | (1,969,635) | | | | (1,396,094) | |
Class C | | | (2,060,625) | | | | (3,584,254) | |
Class I | | | (1,566,346) | | | | (1,712,016) | |
Net Increase in Net Assets Derived from Beneficial Interest Transactions | | | 7,303,398 | | | | 3,445,086 | |
Net increase in net assets | | | 9,638,941 | | | | 5,426,443 | |
NET ASSETS | | | | | | | | |
Beginning of year | | | 24,604,563 | | | | 19,178,120 | |
End of year * | | $ | 34,243,504 | | | $ | 24,604,563 | |
| | | | | | | | | |
*Including accumulated net investment loss of: | | $ | – | | | $ | (19,166) | |
See Notes to Financial Statements.
114 | April 30, 2014
|
| RiverFront Global Growth Fund |
| Statements of Changes in Net Assets |
| | | | | | | | |
| | | For the Year Ended
April 30, 2014 | | | For the Year Ended
April 30, 2013 | |
OPERATIONS | | | | | | | | |
Net investment income | | $ | 549,575 | | | $ | 679,592 | |
Net realized gain on investments | | | 6,157,817 | | | | 4,550,863 | |
Net realized gain distributions from other investment companies | | | 24,369 | | | | – | |
Net change in unrealized appreciation on investments | | | 1,314,672 | | | | 1,032,501 | |
Net Increase in Net Assets Resulting from Operations | | | 8,046,433 | | | | 6,262,956 | |
DISTRIBUTIONS | | | | | | | | |
Dividends to shareholders from net investment income | | | | | | | | |
Class A | | | (87,390) | | | | (116,274) | |
Class C | | | (28,977) | | | | (75,361) | |
Class I | | | (101,824) | | | | (79,598) | |
Class L | | | (216,395) | | | | (390,061) | |
Investor Class | | | (65,366) | | | | (141,444) | |
Dividends to shareholders from net realized gains | | | | | | | | |
Class A | | | (1,086,883) | | | | – | |
Class C | | | (878,168) | | | | – | |
Class I | | | (1,050,842) | | | | – | |
Class L | | | (2,201,623) | | | | – | |
Investor Class | | | (797,894) | | | | – | |
Net Decrease in Net Assets from Distributions | | | (6,515,362) | | | | (802,738) | |
BENEFICIAL INTEREST TRANSACTIONS (NOTE 6) | | | | | | | | |
Shares sold | | | | | | | | |
Class A | | | 10,986,353 | | | | 6,220,932 | |
Class C | | | 5,045,220 | | | | 2,331,909 | |
Class I | | | 4,759,222 | | | | 3,837,874 | |
Class L | | | 3,180,517 | | | | 2,863,936 | |
Investor Class | | | 270,199 | | | | 228,451 | |
Dividends reinvested | | | | | | | | |
Class A | | | 1,095,779 | | | | 110,123 | |
Class C | | | 892,977 | | | | 73,619 | |
Class I | | | 1,130,451 | | | | 76,336 | |
Class L | | | 2,347,791 | | | | 375,201 | |
Investor Class | | | 782,525 | | | | 120,142 | |
Shares redeemed | | | | | | | | |
Class A | | | (4,352,368) | | | | (3,873,219) | |
Class C | | | (1,765,523) | | | | (2,747,755) | |
Class I | | | (2,075,170) | | | | (2,778,845) | |
Class L | | | (4,553,986) | | | | (6,924,206) | |
Investor Class | | | (2,130,007) | | | | (2,240,520) | |
Net Increase/(Decrease) in Net Assets Derived from Beneficial Interest Transactions | | | 15,613,980 | | | | (2,326,022) | |
Net increase in net assets | | | 17,145,051 | | | | 3,134,196 | |
NET ASSETS | | | | | | | | |
Beginning of year | | | 56,103,570 | | | | 52,969,374 | |
End of year * | | $ | 73,248,621 | | | $ | 56,103,570 | |
| | | | | | | | | |
*Including accumulated net investment income/(loss) of: | | $ | 2,262 | | | $ | (47,361) | |
See Notes to Financial Statements.
115 | April 30, 2014
|
| RiverFront Moderate Growth & Income Fund |
| Statements of Changes in Net Assets |
| | | | | | | | |
| | | For the Year Ended
April 30, 2014 | | | For the Year Ended
April 30, 2013 | |
OPERATIONS | | | | | | | | |
Net investment income | | $ | 1,294,023 | | | $ | 1,590,843 | |
Net realized gain on investments | | | 7,624,458 | | | | 3,679,508 | |
Net realized gain distributions from other investment companies | | | 33,187 | | | | – | |
Net change in unrealized appreciation on investments | | | 1,671,672 | | | | 2,504,601 | |
Net Increase in Net Assets Resulting from Operations | | | 10,623,340 | | | | 7,774,952 | |
DISTRIBUTIONS | | | | | | | | |
Dividends to shareholders from net investment income | | | | | | | | |
Class A | | | (416,464) | | | | (490,109) | |
Class C | | | (361,379) | | | | (586,750) | |
Class I | | | (539,349) | | | | (434,898) | |
Dividends to shareholders from net realized gains | | | | | | | | |
Class A | | | (1,461,687) | | | | – | |
Class C | | | (2,693,789) | | | | – | |
Class I | | | (1,636,155) | | | | – | |
Net Decrease in Net Assets from Distributions | | | (7,108,823) | | | | (1,511,757) | |
BENEFICIAL INTEREST TRANSACTIONS (NOTE 6) | | | | | | | | |
Shares sold | | | | | | | | |
Class A | | | 11,020,034 | | | | 11,313,240 | |
Class C | | | 18,772,301 | | | | 18,703,383 | |
Class I | | | 16,516,197 | | | | 20,012,679 | |
Dividends reinvested | | | | | | | | |
Class A | | | 1,531,756 | | | | 440,510 | |
Class C | | | 2,692,375 | | | | 482,949 | |
Class I | | | 2,004,990 | | | | 392,082 | |
Shares redeemed | | | | | | | | |
Class A | | | (11,453,882) | | | | (5,157,175) | |
Class C | | | (12,685,999) | | | | (8,693,372) | |
Class I | | | (7,559,841) | | | | (8,863,522) | |
Net Increase in Net Assets Derived from Beneficial Interest Transactions | | | 20,837,931 | | | | 28,630,774 | |
Net increase in net assets | | | 24,352,448 | | | | 34,893,969 | |
NET ASSETS | | | | | | | | |
Beginning of year | | | 107,543,728 | | | | 72,649,759 | |
End of year * | | $ | 131,896,176 | | | $ | 107,543,728 | |
| | | | | | | | | |
*Including accumulated net investment income of: | | $ | 60,631 | | | $ | 83,800 | |
See Notes to Financial Statements.
116 | April 30, 2014
|
| RiverFront Conservative Income Builder Fund – Class A |
| Financial Highlights |
Selected data for a share of beneficial interest outstanding throughout the periods indicated:
| | | | | | |
| | | For the Year Ended
April 30, 2014 | | | | For the Period
September 4, 2012
(Commencement) to
April 30, 2013 |
Net asset value, beginning of period | | $10.48 | | | | $10.00 |
| | | |
| INCOME FROM INVESTMENT OPERATIONS: | | | | | | |
Net investment income(a) | | 0.13 | | | | 0.09 |
Net realized and unrealized gain | | 0.53 | | | | 0.48 |
Total from investment operations | | 0.66 | | | | 0.57 |
| | | |
| DISTRIBUTIONS: | | | | | | |
From net investment income | | (0.12) | | | | (0.09) |
From net realized gains | | (0.19) | | | | – |
Total distributions | | (0.31) | | | | (0.09) |
| | | |
Net increase in net asset value | | 0.35 | | | | 0.48 |
Net asset value, end of year | | $10.83 | | | | $10.48 |
| | | | | | | |
| TOTAL RETURN(b) | | 6.35% | | | | 5.72% |
| | | |
| RATIOS/SUPPLEMENTAL DATA: | | | | | | |
Net assets, end of year (000s) | | $1,101 | | | | $607 |
Ratio of expenses to average net assets excluding fee waivers and reimbursements | | 2.94% | | | | 5.65% (c)(d) |
Ratio of expenses to average net assets including fee waivers and reimbursements | | 1.15% | | | | 1.15% (c)(d) |
Ratio of net investment income to average net assets | | 1.27% | | | | 1.37% (c)(d) |
Portfolio turnover rate(e) | | 125% | | | | 73% |
| (a) | Calculated using the average shares method. |
| (b) | Total returns are for the period indicated and have not been annualized. Total returns would have been lower had certain expenses not been waived during the period. Returns shown do not reflect the deduction of taxes that a shareholder would pay on Fund distributions or the redemption of Fund shares. Returns shown exclude any applicable sales charges. |
| (d) | Expense ratios before reductions for startup periods may not be representative of longer term operating periods. |
| (e) | Portfolio turnover rate for periods less than one full year have not been annualized. |
See Notes to Financial Statements.
117 | April 30, 2014
|
| RiverFront Conservative Income Builder Fund – Class C |
| Financial Highlights |
Selected data for a share of beneficial interest outstanding throughout the periods indicated:
| | | | | | |
| | | For the Year Ended
April 30, 2014 | | | | For the Period
September 4, 2012
(Commencement) to
April 30, 2013 |
Net asset value, beginning of period | | $10.51 | | | | $10.00 |
| | | |
| INCOME FROM INVESTMENT OPERATIONS: | | | | | | |
Net investment income(a) | | 0.06 | | | | 0.06 |
Net realized and unrealized gain | | 0.51 | | | | 0.47 |
Total from investment operations | | 0.57 | | | | 0.53 |
| | | |
| DISTRIBUTIONS: | | | | | | |
From net investment income | | (0.12) | | | | (0.02) |
From net realized gains | | (0.19) | | | | – |
Total distributions | | (0.31) | | | | (0.02) |
| | | |
Net increase in net asset value | | 0.26 | | | | 0.51 |
Net asset value, end of year | | $10.77 | | | | $10.51 |
| | | | | | | |
| TOTAL RETURN(b) | | 5.49% | | | | 5.29% |
| | | |
| RATIOS/SUPPLEMENTAL DATA: | | | | | | |
Net assets, end of year (000s) | | $4,106 | | | | $2,264 |
Ratio of expenses to average net assets excluding fee waivers and reimbursements | | 3.73% | | | | 6.53%(c)(d) |
Ratio of expenses to average net assets including fee waivers and reimbursements | | 1.90% | | | | 1.90%(c)(d) |
Ratio of net investment income to average net assets | | 0.53% | | | | 0.90%(c)(d) |
Portfolio turnover rate(e) | | 125% | | | | 73% |
| (a) | Calculated using the average shares method. |
| (b) | Total returns are for the period indicated and have not been annualized. Total returns would have been lower had certain expenses not been waived during the period. Returns shown do not reflect the deduction of taxes that a shareholder would pay on Fund distributions or the redemption of Fund shares. Returns shown exclude any applicable sales charges. |
| (d) | Expense ratios before reductions for startup periods may not be representative of longer term operating periods. |
| (e) | Portfolio turnover rate for periods less than one full year have not been annualized. |
See Notes to Financial Statements.
118 | April 30, 2014
|
| RiverFront Conservative Income Builder Fund – Class I |
| Financial Highlights |
Selected data for a share of beneficial interest outstanding throughout the periods indicated:
| | | | | | |
| | | For the Year Ended
April 30, 2014 | | | | For the Period
September 4, 2012
(Commencement) to
April 30, 2013 |
Net asset value, beginning of period | | $10.29 | | | | $10.00 |
| | | |
| INCOME FROM INVESTMENT OPERATIONS: | | | | | | |
Net investment income(a) | | 0.15 | | | | 0.12 |
Net realized and unrealized gain | | 0.51 | | | | 0.46 |
Total from investment operations | | 0.66 | | | | 0.58 |
| | | |
| DISTRIBUTIONS: | | | | | | |
From net investment income | | (0.10) | | | | (0.29) |
From net realized gains | | (0.19) | | | | – |
Total distributions | | (0.29) | | | | (0.29) |
| | | |
Net increase in net asset value | | 0.37 | | | | 0.29 |
Net asset value, end of year | | $10.66 | | | | $10.29 |
| | | | | | | |
| TOTAL RETURN(b) | | 6.53% | | | | 5.95% |
| | | |
| RATIOS/SUPPLEMENTAL DATA: | | | | | | |
Net assets, end of year (000s) | | $1,381 | | | | $715 |
Ratio of expenses to average net assets excluding fee waivers and reimbursements | | 2.66% | | | | 7.74%(c)(d) |
Ratio of expenses to average net assets including fee waivers and reimbursements | | 0.90% | | | | 0.90%(c)(d) |
Ratio of net investment income to average net assets | | 1.49% | | | | 1.84%(c)(d) |
Portfolio turnover rate(e) | | 125% | | | | 73% |
| (a) | Calculated using the average shares method. |
| (b) | Total returns are for the period indicated and have not been annualized. Total returns would have been lower had certain expenses not been waived during the period. Returns shown do not reflect the deduction of taxes that a shareholder would pay on Fund distributions or the redemption of Fund shares. |
| (d) | Expense ratios before reductions for startup periods may not be representative of longer term operating periods. |
| (e) | Portfolio turnover rate for periods less than one full year have not been annualized. |
See Notes to Financial Statements.
119 | April 30, 2014
| | |
| RiverFront Dynamic Equity Income Fund – Class A |
| Financial Highlights | | |
Selected data for a share of beneficial interest outstanding throughout the periods indicated:
| | | | | | | | |
| | | For the Year Ended
April 30, 2014 | | For the Year Ended
April 30, 2013 | | For the Year Ended April 30, 2012 (a) | | For the Period
August 2, 2010 (Inception) to
April 30, 2011 |
Net asset value, beginning of period | | $12.24 | | $11.24 | | $11.73 | | $10.00 |
|
| INCOME/(LOSS) FROM INVESTMENT OPERATIONS: |
Net investment income(b) | | 0.17 | | 0.25 | | 0.16 | | 0.12 |
Net realized and unrealized gain/(loss) | | 1.17 | | 0.99 | | (0.49) | | 1.67 |
Total from investment operations | | 1.34 | | 1.24 | | (0.33) | | 1.79 |
|
| DISTRIBUTIONS: |
From net investment income | | (0.17) | | (0.24) | | (0.15) | | (0.06) |
From net realized gains | | (0.44) | | – | | – | | (0.00)(c) |
Tax return of capital | | – | | – | | (0.01) | | (0.00)(c) |
Total distributions | | (0.61) | | (0.24) | | (0.16) | | (0.06) |
| | | | |
Net increase/(decrease) in net asset value | | 0.73 | | 1.00 | | (0.49) | | 1.73 |
Net asset value, end of year | | $12.97 | | $12.24 | | $11.24 | | $11.73 |
| | | | | | | | | |
| TOTAL RETURN(d) | | 11.15% | | 11.22% | | (2.80)% | | 17.99% |
|
| RATIOS/SUPPLEMENTAL DATA: |
Net assets, end of year (000s) | | $15,374 | | $8,087 | | $7,114 | | $5,723 |
Ratio of expenses to average net assets excluding fee waivers and reimbursements | | 1.42% | | 1.58% | | 1.73% | | 2.17%(e) |
Ratio of expenses to average net assets including fee waivers and reimbursements | | 1.15% | | 1.20%(f) | | 1.30% | | 1.30%(e) |
Ratio of net investment income to average net assets | | 1.38% | | 2.17% | | 1.50% | | 1.48%(e) |
Portfolio turnover rate(g) | | 99% | | 136% | | 133% | | 66% |
| (a) | Prior to January 1, 2012, the RiverFront Dynamic Equity Income Fund was known as the RiverFront Long-Term Growth & Income Fund. |
| (b) | Calculated using the average shares method. |
| (c) | Less than ($0.005) per share. |
| (d) | Total returns are for the period indicated and have not been annualized. Total returns would have been lower had certain expenses not been waived during the period. Returns shown do not reflect the deduction of taxes that a shareholder would pay on Fund distributions or the redemption of Fund shares. Returns shown exclude any applicable sales charges. |
| (f) | Contractual expense limitation change from 1.30% to 1.15% effective September 1, 2012. |
| (g) | Portfolio turnover rate for periods less than one full year have not been annualized. |
See Notes to Financial Statements.
120 | April 30, 2014
| | |
| RiverFront Dynamic Equity Income Fund – Class C |
| Financial Highlights | | |
Selected data for a share of beneficial interest outstanding throughout the periods indicated:
| | | | | | | | |
| | | For the Year Ended
April 30, 2014 | | For the Year Ended
April 30, 2013 | | For the Year Ended
April 30, 2012 (a) | | For the Period
August 2, 2010
(Inception) to
April 30, 2011 |
Net asset value, beginning of period | | $12.13 | | $11.14 | | $11.67 | | $10.00 |
|
| INCOME/(LOSS) FROM INVESTMENT OPERATIONS: |
Net investment income(b) | | 0.08 | | 0.16 | | 0.09 | | 0.05 |
Net realized and unrealized gain/(loss) | | 1.15 | | 0.98 | | (0.51) | | 1.67 |
Total from investment operations | | 1.23 | | 1.14 | | (0.42) | | 1.72 |
|
| DISTRIBUTIONS: |
From net investment income | | (0.08) | | (0.15) | | (0.10) | | (0.05) |
From net realized gains | | (0.44) | | – | | – | | (0.00)(c) |
Tax return of capital | | – | | – | | (0.01) | | (0.00)(c) |
Total distributions | | (0.52) | | (0.15) | | (0.11) | | (0.05) |
| | | | |
Net increase/(decrease) in net asset value | | 0.71 | | 0.99 | | (0.53) | | 1.67 |
Net asset value, end of year | | $12.84 | | $12.13 | | $11.14 | | $11.67 |
| | | | | | | | | |
| TOTAL RETURN(d) | | 10.34% | | 10.41% | | (3.60)% | | 17.32% |
|
| RATIOS/SUPPLEMENTAL DATA: |
Net assets, end of year (000s) | | $25,787 | | $16,070 | | $13,729 | | $9,223 |
Ratio of expenses to average net assets excluding fee waivers and reimbursements | | 2.18% | | 2.33% | | 2.49% | | 3.10%(e) |
Ratio of expenses to average net assets including fee waivers and reimbursements | | 1.90% | | 1.95%(f) | | 2.05% | | 2.05%(e) |
Ratio of net investment income to average net assets | | 0.61% | | 1.44% | | 0.84% | | 0.65%(e) |
Portfolio turnover rate(g) | | 99% | | 136% | | 133% | | 66% |
| (a) | Prior to January 1, 2012, the RiverFront Dynamic Equity Income Fund was known as the RiverFront Long-Term Growth & Income Fund. |
| (b) | Calculated using the average shares method. |
| (c) | Less than ($0.005) per share. |
| (d) | Total returns are for the period indicated and have not been annualized. Total returns would have been lower had certain expenses not been waived during the period. Returns shown do not reflect the deduction of taxes that a shareholder would pay on Fund distributions or the redemption of Fund shares. Returns shown exclude any applicable sales charges. |
| (f) | Contractual expense limitation change from 2.05% to 1.90% effective September 1, 2012. |
| (g) | Portfolio turnover rate for periods less than one full year have not been annualized. |
See Notes to Financial Statements.
121 | April 30, 2014
| | |
| RiverFront Dynamic Equity Income Fund – Class I |
| Financial Highlights | | |
Selected data for a share of beneficial interest outstanding throughout the periods indicated:
| | | | | | | | |
| | | For the Year Ended
April 30, 2014 | | For the Year Ended
April 30, 2013 | | For the Year Ended
April 30, 2012 (a) | | For the Period
August 2, 2010
(Inception) to
April 30, 2011 |
Net asset value, beginning of period | | $12.16 | | $11.17 | | $11.64 | | $10.00 |
|
| INCOME/(LOSS) FROM INVESTMENT OPERATIONS: |
Net investment income(b) | | 0.20 | | 0.27 | | 0.20 | | 0.12 |
Net realized and unrealized gain/(loss) | | 1.16 | | 0.99 | | (0.50) | | 1.68 |
Total from investment operations | | 1.36 | | 1.26 | | (0.30) | | 1.80 |
|
| DISTRIBUTIONS: |
From net investment income | | (0.20) | | (0.27) | | (0.16) | | (0.15) |
From net realized gains | | (0.44) | | – | | – | | (0.00)(c) |
Tax return of capital | | – | | – | | (0.01) | | (0.01) |
Total distributions | | (0.64) | | (0.27) | | (0.17) | | (0.16) |
| | | | |
Net increase/(decrease) in net asset value | | 0.72 | | 0.99 | | (0.47) | | 1.64 |
Net asset value, end of year | | $12.88 | | $12.16 | | $11.17 | | $11.64 |
| | | | | | | | | |
| TOTAL RETURN(d) | | 11.40% | | 11.47% | | (2.58)% | | 18.21% |
|
| RATIOS/SUPPLEMENTAL DATA: |
Net assets, end of year (000s) | | $18,254 | | $10,460 | | $6,897 | | $3,301 |
Ratio of expenses to average net assets excluding fee waivers and reimbursements | | 1.17% | | 1.33% | | 1.49% | | 2.44%(e) |
Ratio of expenses to average net assets including fee waivers and reimbursements | | 0.90% | | 0.95%(f) | | 1.05% | | 1.05%(e) |
Ratio of net investment income to average net assets | | 1.61% | | 2.36% | | 1.88% | | 1.49%(e) |
Portfolio turnover rate(g) | | 99% | | 136% | | 133% | | 66% |
| (a) | Prior to January 1, 2012, the RiverFront Dynamic Equity Income Fund was known as the RiverFront Long-Term Growth & Income Fund. |
| (b) | Calculated using the average shares method. |
| (c) | Less than ($0.005) per share. |
| (d) | Total returns are for the period indicated and have not been annualized. Total returns would have been lower had certain expenses not been waived during the period. Returns shown do not reflect the deduction of taxes that a shareholder would pay on Fund distributions or the redemption of Fund shares. |
| (f) | Contractual expense limitation change from 1.05% to 0.90% effective September 1, 2012. |
| (g) | Portfolio turnover rate for periods less than one full year have not been annualized. |
See Notes to Financial Statements.
122 | April 30, 2014
| | |
| RiverFront Global Allocation Fund – Class A |
| Financial Highlights | | |
Selected data for a share of beneficial interest outstanding throughout the periods indicated:
| | | | | | | | |
| | | For the Year Ended
April 30, 2014 | | For the Year Ended
April 30, 2013 | | For the Year Ended
April 30, 2012 (a) | | For the Period
August 2, 2010
(Inception) to
April 30, 2011 |
Net asset value, beginning of period | | $11.93 | | $10.86 | | $11.66 | | $10.00 |
|
| INCOME/(LOSS) FROM INVESTMENT OPERATIONS: |
Net investment income(b) | | 0.10 | | 0.15 | | 0.12 | | 0.10 |
Net realized and unrealized gain/(loss) | | 1.36 | | 1.08 | | (0.84) | | 1.61 |
Total from investment operations | | 1.46 | | 1.23 | | (0.72) | | 1.71 |
|
| DISTRIBUTIONS: |
From net investment income | | (0.09) | | (0.16) | | (0.07) | | (0.05) |
From net realized gains | | (0.33) | | – | | (0.01) | | – |
Total distributions | | (0.42) | | (0.16) | | (0.08) | | (0.05) |
| | | | |
Net increase/(decrease) in net asset value | | 1.04 | | 1.07 | | (0.80) | | 1.66 |
Net asset value, end of year | | $12.97 | | $11.93 | | $10.86 | | $11.66 |
| | | | | | | | | |
| TOTAL RETURN(c) | | 12.32% | | 11.47% | | (6.18)% | | 17.12% |
|
| RATIOS/SUPPLEMENTAL DATA: |
Net assets, end of year (000s) | | $9,098 | | $8,244 | | $5,791 | | $4,686 |
Ratio of expenses to average net assets excluding fee waivers and reimbursements | | 1.51% | | 1.68% | | 1.80% | | 3.00%(d) |
Ratio of expenses to average net assets including fee waivers and reimbursements | | 1.15% | | 1.19%(e) | | 1.30% | | 1.30%(d) |
Ratio of net investment income to average net assets | | 0.83% | | 1.32% | | 1.10% | | 1.16%(d) |
Portfolio turnover rate(f) | | 95% | | 113% | | 163% | | 77% |
| (a) | Prior to January 1, 2012, the RiverFront Global Allocation Fund was known as the RiverFront Moderate Growth Fund. |
| (b) | Calculated using the average shares method. |
| (c) | Total returns are for the period indicated and have not been annualized. Total returns would have been lower had certain expenses not been waived during the period. Returns shown do not reflect the deduction of taxes that a shareholder would pay on Fund distributions or the redemption of Fund shares. Returns shown exclude any applicable sales charges. |
| (e) | Contractual expense limitation change from 1.30% to 1.15% effective September 1, 2012. |
| (f) | Portfolio turnover rate for periods less than one full year have not been annualized. |
See Notes to Financial Statements.
123 | April 30, 2014
| | |
| RiverFront Global Allocation Fund – Class C |
| Financial Highlights | | |
Selected data for a share of beneficial interest outstanding throughout the periods indicated:
| | | | | | | | |
| | | For the Year Ended
April 30, 2014 | | For the Year Ended
April 30, 2013 | | For the Year Ended
April 30, 2012 (a) | | For the Period
August 2, 2010
(Inception) to
April 30, 2011 |
Net asset value, beginning of period | | $11.84 | | $10.81 | | $11.64 | | $10.00 |
|
| INCOME/(LOSS) FROM INVESTMENT OPERATIONS: |
Net investment income(b) | | 0.01 | | 0.07 | | 0.02 | | 0.00(c) |
Net realized and unrealized gain/(loss) | | 1.34 | | 1.07 | | (0.82) | | 1.65 |
Total from investment operations | | 1.35 | | 1.14 | | (0.80) | | 1.65 |
|
| DISTRIBUTIONS: |
From net investment income | | (0.03) | | (0.11) | | (0.02) | | (0.01) |
From net realized gains | | (0.33) | | – | | (0.01) | | – |
Total distributions | | (0.36) | | (0.11) | | (0.03) | | (0.01) |
| | | | |
Net increase/(decrease) in net asset value | | 0.99 | | 1.03 | | (0.83) | | 1.64 |
Net asset value, end of year | | $12.83 | | $11.84 | | $10.81 | | $11.64 |
| | | | | | | | | |
| TOTAL RETURN(d) | | 11.48% | | 10.59% | | (6.86)% | | 16.52% |
|
| RATIOS/SUPPLEMENTAL DATA: |
Net assets, end of year (000s) | | $14,624 | | $9,686 | | $9,891 | | $8,926 |
Ratio of expenses to average net assets excluding fee waivers and reimbursements | | 2.26% | | 2.44% | | 2.58% | | 3.21%(e) |
Ratio of expenses to average net assets including fee waivers and reimbursements | | 1.90% | | 1.95%(f) | | 2.05% | | 2.05%(e) |
Ratio of net investment income to average net assets | | 0.05% | | 0.66% | | 0.17% | | 0.04%(e) |
Portfolio turnover rate(g) | | 95% | | 113% | | 163% | | 77% |
| (a) | Prior to January 1, 2012, the RiverFront Global Allocation Fund was known as the RiverFront Moderate Growth Fund. |
| (b) | Calculated using the average shares method. |
| (c) | Less than $0.005 per share. |
| (d) | Total returns are for the period indicated and have not been annualized. Total returns would have been lower had certain expenses not been waived during the period. Returns shown do not reflect the deduction of taxes that a shareholder would pay on Fund distributions or the redemption of Fund shares. Returns shown exclude any applicable sales charges. |
| (f) | Contractual expense limitation change from 2.05% to 1.90% effective September 1, 2012. |
| (g) | Portfolio turnover rate for periods less than one full year have not been annualized. |
See Notes to Financial Statements.
124 | April 30, 2014
| | |
| RiverFront Global Allocation Fund – Class I |
| Financial Highlights | | |
Selected data for a share of beneficial interest outstanding throughout the periods indicated:
| | | | | | | | |
| | | For the Year Ended
April 30, 2014 | | For the Year Ended
April 30, 2013 | | For the Year Ended
April 30, 2012 (a) | | For the Period
August 2, 2010
(Inception) to
April 30, 2011 |
Net asset value, beginning of period | | $11.72 | | $10.66 | | $11.42 | | $10.00 |
|
| INCOME/(LOSS) FROM INVESTMENT OPERATIONS: |
Net investment income(b) | | 0.13 | | 0.17 | | 0.13 | | 0.08 |
Net realized and unrealized gain/(loss) | | 1.34 | | 1.07 | | (0.80) | | 1.62 |
Total from investment operations | | 1.47 | | 1.24 | | (0.67) | | 1.70 |
|
| DISTRIBUTIONS: |
From net investment income | | (0.11) | | (0.18) | | (0.08) | | (0.28) |
From net realized gains | | (0.33) | | – | | (0.01) | | – |
Total distributions | | (0.44) | | (0.18) | | (0.09) | | (0.28) |
| | | | |
Net increase/(decrease) in net asset value | | 1.03 | | 1.06 | | (0.76) | | 1.42 |
Net asset value, end of year | | $12.75 | | $11.72 | | $10.66 | | $11.42 |
| | | | | | | | | |
| TOTAL RETURN(c) | | 12.61% | | 11.73% | | (5.86)% | | 17.20% |
|
| RATIOS/SUPPLEMENTAL DATA: |
Net assets, end of year (000s) | | $10,521 | | $6,675 | | $3,496 | | $1,905 |
Ratio of expenses to average net assets excluding fee waivers and reimbursements | | 1.26% | | 1.43% | | 1.55% | | 4.68%(d) |
Ratio of expenses to average net assets including fee waivers and reimbursements | | 0.90% | | 0.94%(e) | | 1.05% | | 1.05%(d) |
Ratio of net investment income to average net assets | | 1.07% | | 1.52% | | 1.28% | | 0.98%(d) |
Portfolio turnover rate(f) | | 95% | | 113% | | 163% | | 77% |
| (a) | Prior to January 1, 2012, the RiverFront Global Allocation Fund was known as the RiverFront Moderate Growth Fund. |
| (b) | Calculated using the average shares method. |
| (c) | Total returns are for the period indicated and have not been annualized. Total returns would have been lower had certain expenses not been waived during the period. Returns shown do not reflect the deduction of taxes that a shareholder would pay on Fund distributions or the redemption of Fund shares. |
| (e) | Contractual expense limitation change from 1.05% to 0.90% effective September 1, 2012. |
| (f) | Portfolio turnover rate for periods less than one full year have not been annualized. |
See Notes to Financial Statements.
125 | April 30, 2014
| | |
| RiverFront Global Growth Fund – Class A |
| Financial Highlights | | |
Selected data for a share of beneficial interest outstanding throughout the periods indicated:
| | | | | | | | | | |
| | | For the Year
Ended
April 30, 2014 | | For the Year
Ended
April 30, 2013 | | For the Year
Ended
April 30, 2012 (a) | | For the Period
January 1, 2011
to
April 30, 2011 (b) | | For the Period
September 27,
2010
(Inception) to
December 31,
2010 |
Net asset value, beginning of period | | $14.89 | | $13.37 | | $15.65 | | $14.66 | | $13.68 |
| |
| INCOME/(LOSS) FROM INVESTMENT OPERATIONS: | | |
Net investment income(c) | | 0.12 | | 0.17 | | 0.14 | | 0.00(d) | | 0.23 |
Net realized and unrealized gain/(loss) | | 1.88 | | 1.57 | | (1.41) | | 0.99 | | 1.03 |
Total from investment operations | | 2.00 | | 1.74 | | (1.27) | | 0.99 | | 1.26 |
| | | | | |
| DISTRIBUTIONS: | | | | | | | | | | |
From net investment income | | (0.12) | | (0.22) | | (0.14) | | – | | (0.14) |
From net realized gains | | (1.51) | | – | | (0.87) | | – | | (0.14) |
Total distributions | | (1.63) | | (0.22) | | (1.01) | | – | | (0.28) |
| | | | | |
Net increase/(decrease) in net asset value | | 0.37 | | 1.52 | | (2.28) | | 0.99 | | 0.98 |
Net asset value, end of year | | $15.26 | | $14.89 | | $13.37 | | $15.65 | | $14.66 |
| | | | | | | | | | | |
| TOTAL RETURN(e) | | 13.66% | | 13.14% | | (7.51)% | | 6.75% | | 9.22% |
| |
| RATIOS/SUPPLEMENTAL DATA: | | |
Net assets, end of year (000s) | | $16,440 | | $8,525 | | $5,241 | | $12,307 | | $1,934 |
Ratio of expenses to average net assets excluding fee waivers and reimbursements | | 1.40% | | 1.49% | | 1.52% | | 1.58%(f) | | 2.15%(f) |
Ratio of expenses to average net assets including fee waivers and reimbursements (includes acquired fund fee reimbursements)(g) | | 1.15% | | 0.98% | | 0.92% | | 0.81%(f) | | 0.91%(f) |
Ratio of expenses to average net assets including fee waivers and reimbursements (excludes acquired fund fee reimbursements) | | 1.15% | | 1.15% | | 1.15% | | 1.15%(f) | | 1.15%(f) |
Ratio of net investment income to average net assets | | 0.76% | | 1.23% | | 0.99% | | 0.06%(f) | | 6.20%(f) |
Portfolio turnover rate(h) | | 85% | | 113% | | 119% | | 34% | | 99% |
| (a) | Prior to January 1, 2012, the RiverFront Global Growth Fund was known as the RiverFront Long-Term Growth Fund. |
| (b) | Effective March 8, 2011, the Board approved changing the fiscal year-end of the Fund from December 31 to April 30. |
| (c) | Calculated using the average shares method. |
| (d) | Less than $0.005 per share. |
| (e) | Total returns are for the period indicated and have not been annualized. Total returns would have been lower had certain expenses not been waived during the period. Returns shown do not reflect the deduction of taxes that a shareholder would pay on Fund distributions or the redemption of Fund shares. Returns shown exclude any applicable sales charges. |
| (g) | Prior to January 1, 2013, all acquired fund fees were reimbursed. |
| (h) | Portfolio turnover rate for periods less than one full year have not been annualized. |
See Notes to Financial Statements.
126 | April 30, 2014
| | |
| RiverFront Global Growth Fund – Class C |
| Financial Highlights | | |
Selected data for a share of beneficial interest outstanding throughout the periods indicated:
| | | | | | | | | | |
| | | For the Year
Ended
April 30, 2014 | | For the Year
Ended
April 30, 2013 | | For the Year
Ended
April 30, 2012 (a) | | For the Period
January 1, 2011
to
April 30, 2011 (b) | | For the Period
September 27,
2010
(Inception) to
December 31,
2010 |
Net asset value, beginning of period | | $14.76 | | $13.29 | | $15.60 | | $14.63 | | $13.68 |
| |
| INCOME/(LOSS) FROM INVESTMENT OPERATIONS: | | |
Net investment income/(loss)(c) | | 0.01 | | 0.08 | | 0.05 | | (0.04) | | 0.20 |
Net realized and unrealized gain/(loss) | | 1.86 | | 1.54 | | (1.42) | | 1.01 | | 1.02 |
Total from investment operations | | 1.87 | | 1.62 | | (1.37) | | 0.97 | | 1.22 |
| | | | | |
| DISTRIBUTIONS: | | | | | | | | | | |
From net investment income | | (0.05) | | (0.15) | | (0.07) | | – | | (0.13) |
From net realized gains | | (1.51) | | – | | (0.87) | | – | | (0.14) |
Total distributions | | (1.56) | | (0.15) | | (0.94) | | – | | (0.27) |
| | | | | |
Net increase/(decrease) in net asset value | | 0.31 | | 1.47 | | (2.31) | | 0.97 | | 0.95 |
Net asset value, end of year | | $15.07 | | $14.76 | | $13.29 | | $15.60 | | $14.63 |
| | | | | | | | | | | |
| TOTAL RETURN(d) | | 12.84% | | 12.31% | | (8.22)% | | 6.63% | | 8.91% |
| |
| RATIOS/SUPPLEMENTAL DATA: | | |
Net assets, end of year (000s) | | $11,511 | | $7,182 | | $6,808 | | $6,156 | | $2,050 |
Ratio of expenses to average net assets excluding fee waivers and reimbursements | | 2.15% | | 2.25% | | 2.29% | | 2.33%(e) | | 2.89%(e) |
Ratio of expenses to average net assets including fee waivers and reimbursements (includes acquired fund fee reimbursements)(f) | | 1.90% | | 1.73% | | 1.67% | | 1.55%(e) | | 1.66%(e) |
Ratio of expenses to average net assets including fee waivers and reimbursements (excludes acquired fund fee reimbursements) | | 1.90% | | 1.90% | | 1.90% | | 1.90%(e) | | 1.90%(e) |
Ratio of net investment income/(loss) to average net assets | | 0.07% | | 0.57% | | 0.34% | | (0.72)%(e) | | 5.36%(e) |
Portfolio turnover rate(g) | | 85% | | 113% | | 119% | | 34% | | 99% |
| (a) | Prior to January 1, 2012, the RiverFront Global Growth Fund was known as the RiverFront Long-Term Growth Fund. |
| (b) | Effective March 8, 2011, the Board approved changing the fiscal year-end of the Fund from December 31 to April 30. |
| (c) | Calculated using the average shares method. |
| (d) | Total returns are for the period indicated and have not been annualized. Total returns would have been lower had certain expenses not been waived during the period. Returns shown do not reflect the deduction of taxes that a shareholder would pay on Fund distributions or the redemption of Fund shares. Returns shown exclude any applicable sales charges. |
| (f) | Prior to January 1, 2013, all acquired fund fees were reimbursed. |
| (g) | Portfolio turnover rate for periods less than one full year have not been annualized. |
See Notes to Financial Statements.
127 | April 30, 2014
| | |
| RiverFront Global Growth Fund – Class I |
| Financial Highlights | | |
Selected data for a share of beneficial interest outstanding throughout the periods indicated:
| | | | | | | | | | |
| | | For the Year
Ended
April 30, 2014 | | For the Year
Ended
April 30, 2013 | | For the Year
Ended
April 30, 2012 (a) | | For the Period
January 1, 2011
to
April 30, 2011 (b) | | For the Period
September 27,
2010
(Inception) to
December 31,
2010 |
Net asset value, beginning of period | | $14.92 | | $13.40 | | $15.67 | | $14.65 | | $13.68 |
| |
| INCOME/(LOSS) FROM INVESTMENT OPERATIONS: | | |
Net investment income(c) | | 0.17 | | 0.20 | | 0.19 | | 0.01 | | 0.17 |
Net realized and unrealized gain/(loss) | | 1.89 | | 1.57 | | (1.43) | | 1.01 | | 1.09 |
Total from investment operations | | 2.06 | | 1.77 | | (1.24) | | 1.02 | | 1.26 |
| | | | | |
| DISTRIBUTIONS: | | | | | | | | | | |
From net investment income | | (0.15) | | (0.25) | | (0.16) | | – | | (0.15) |
From net realized gains | | (1.51) | | – | | (0.87) | | – | | (0.14) |
Total distributions | | (1.66) | | (0.25) | | (1.03) | | – | | (0.29) |
| | | | | |
Net increase/(decrease) in net asset value | | 0.40 | | 1.52 | | (2.27) | | 1.02 | | 0.97 |
Net asset value, end of year | | $15.32 | | $14.92 | | $13.40 | | $15.67 | | $14.65 |
| | | | | | | | | | | |
| TOTAL RETURN(d) | | 14.01% | | 13.36% | | (7.31)% | | 7.04% | | 9.12% |
| |
| RATIOS/SUPPLEMENTAL DATA: | | |
Net assets, end of year (000s) | | $11,845 | | $7,769 | | $6,022 | | $4,508 | | $2,280 |
Ratio of expenses to average net assets excluding fee waivers and reimbursements | | 1.16% | | 1.25% | | 1.30% | | 1.30%(e) | | 1.74%(e) |
Ratio of expenses to average net assets including fee waivers and reimbursements (includes acquired fund fee reimbursements)(f) | | 0.90% | | 0.73% | | 0.67% | | 0.61%(e) | | 0.66%(e) |
Ratio of expenses to average net assets including fee waivers and reimbursements (excludes acquired fund fee reimbursements) | | 0.90% | | 0.90% | | 0.90% | | 0.90%(e) | | 0.90%(e) |
Ratio of net investment income to average net assets | | 1.13% | | 1.45% | | 1.40% | | 0.23%(e) | | 4.70%(e) |
Portfolio turnover rate(g) | | 85% | | 113% | | 119% | | 34% | | 99% |
| (a) | Prior to January 1, 2012, the RiverFront Global Growth Fund was known as the RiverFront Long-Term Growth Fund. |
| (b) | Effective March 8, 2011, the Board approved changing the fiscal year-end of the Fund from December 31 to April 30. |
| (c) | Calculated using the average shares method. |
| (d) | Total returns are for the period indicated and have not been annualized. Total returns would have been lower had certain expenses not been waived during the period. Returns shown do not reflect the deduction of taxes that a shareholder would pay on Fund distributions or the redemption of Fund shares. |
| (f) | Prior to January 1, 2013, all acquired fund fees were reimbursed. |
| (g) | Portfolio turnover rate for periods less than one full year have not been annualized. |
See Notes to Financial Statements.
128 | April 30, 2014
| | |
| RiverFront Global Growth Fund – Class L |
| Financial Highlights | | |
Selected data for a share of beneficial interest outstanding throughout the periods indicated:
| | | | | | | | | | | | |
| | | For the Year
Ended
April 30, 2014 | | For the Year
Ended
April 30, 2013 | | For the Year
Ended
April 30, 2012 (a) | | For the Period
January 1, 2011 to
April 30, 2011 (b) | | For the Year
Ended
December 31,
2010 | | For the Year
Ended
December 31,
2009 |
Net asset value, beginning of period | | $14.90 | | $13.37 | | $15.65 | | $14.63 | | $13.22 | | $10.49 |
| | |
| INCOME/(LOSS) FROM INVESTMENT OPERATIONS: | | | | |
Net investment income(c) | | 0.17 | | 0.22 | | 0.17 | | 0.01 | | 0.18 | | 0.16 |
Net realized and unrealized
gain/(loss) | | 1.88 | | 1.56 | | (1.41) | | 1.01 | | 1.52 | | 2.66 |
Total from investment operations | | 2.05 | | 1.78 | | (1.24) | | 1.02 | | 1.70 | | 2.82 |
| | | | | | |
| DISTRIBUTIONS: | | | | | | | | | | | | |
From net investment income | | (0.15) | | (0.25) | | (0.17) | | – | | (0.15) | | (0.09) |
From net realized gains | | (1.51) | | – | | (0.87) | | – | | (0.14) | | – |
Total distributions | | (1.66) | | (0.25) | | (1.04) | | – | | (0.29) | | (0.09) |
| | | | | | |
Net increase/(decrease) in net asset value | | 0.39 | | 1.53 | | (2.28) | | 1.02 | | 1.41 | | 2.73 |
Net asset value, end of year | | $15.29 | | $14.90 | | $13.37 | | $15.65 | | $14.63 | | $13.22 |
| | | | | | | | | | | | | |
| TOTAL RETURN(d) | | 13.98% | | 13.43% | | (7.31)% | | 6.97% | | 12.87% | | 26.86% |
| | |
| RATIOS/SUPPLEMENTAL DATA: | | | | |
Net assets, end of year (000s) | | $25,092 | | $23,454 | | $24,765 | | $42,977 | | $43,240 | | $27,763 |
Ratio of expenses to average net assets excluding fee waivers and reimbursements | | 1.15% | | 1.25% | | 1.08% | | 1.28%(e) | | 1.22% | | 1.53% |
Ratio of expenses to average net assets including fee waivers and reimbursements (includes acquired fund fee reimbursements)(f) | | 0.90% | | 0.73% | | 0.67% | | 0.64%(e) | | 0.66% | | N/A |
Ratio of expenses to average net assets including fee waivers and reimbursements (excludes acquired fund fee reimbursements) | | 0.90% | | 0.90% | | 0.90% | | 0.90%(e) | | 0.90% | | 0.90% |
Ratio of net investment income to average net assets | | 1.11% | | 1.59% | | 1.26% | | 0.19%(e) | | 1.33% | | 1.34% |
Portfolio turnover rate(g) | | 85% | | 113% | | 119% | | 34% | | 99% | | 67% |
| (a) | Prior to January 1, 2012, the RiverFront Global Growth Fund was known as the RiverFront Long-Term Growth Fund. |
| (b) | Effective March 8, 2011, the Board approved changing the fiscal year-end of the Fund from December 31 to April 30. |
| (c) | Calculated using the average shares method. |
| (d) | Total returns are for the period indicated and have not been annualized. Total returns would have been lower had certain expenses not been waived during the period. Returns shown do not reflect the deduction of taxes that a shareholder would pay on Fund distributions or the redemption of Fund shares. |
| (f) | Prior to January 1, 2013, all acquired fund fees were reimbursed. |
| (g) | Portfolio turnover rate for periods less than one full year have not been annualized. |
See Notes to Financial Statements.
129 | April 30, 2014
| | |
| RiverFront Global Growth Fund – Investor Class |
| Financial Highlights | | |
Selected data for a share of beneficial interest outstanding throughout the periods indicated:
| | | | | | | | | | | | |
| | | For the Year
Ended
April 30, 2014 | | For the Year
Ended
April 30, 2013 | | For the Year
Ended
April 30, 2012 (a) | | For the Period
January 1, 2011 to
April 30, 2011 (b) | | For the Year
Ended
December 31,
2010 | | For the Year
Ended
December 31,
2009 |
Net asset value, beginning of period | | $14.82 | | $13.32 | | $15.59 | | $14.59 | | $13.19 | | $10.49 |
| | |
| INCOME/(LOSS) FROM INVESTMENT OPERATIONS: | | | | |
Net investment income(c) | | 0.13 | | 0.18 | | 0.13 | | 0.00(d) | | 0.12 | | 0.13 |
Net realized and unrealized gain/(loss) | | 1.87 | | 1.54 | | (1.39) | | 1.00 | | 1.54 | | 2.65 |
Total from investment operations | | 2.00 | | 1.72 | | (1.26) | | 1.00 | | 1.66 | | 2.78 |
| | | | | | |
| DISTRIBUTIONS: | | | | | | | | | | | | |
From net investment income | | (0.12) | | (0.22) | | (0.14) | | – | | (0.12) | | (0.08) |
From net realized gains | | (1.51) | | – | | (0.87) | | – | | (0.14) | | – |
Total distributions | | (1.63) | | (0.22) | | (1.01) | | – | | (0.26) | | (0.08) |
| | | | | | |
Net increase/(decrease) in net asset value | | 0.37 | | 1.50 | | (2.27) | | 1.00 | | 1.40 | | 2.70 |
Net asset value, end of year | | $15.19 | | $14.82 | | $13.32 | | $15.59 | | $14.59 | | $13.19 |
| | | | | | | | | | | | | |
| TOTAL RETURN(e) | | 13.73% | | 13.07% | | (7.47)% | | 6.79% | | 12.58% | | 26.58% |
| | |
| RATIOS/SUPPLEMENTAL DATA: | | | | |
Net assets, end of year (000s) | | $8,361 | | $9,174 | | $10,133 | | $21,270 | | $23,556 | | $13,882 |
Ratio of expenses to average net assets excluding fee waivers and reimbursements | | 1.41% | | 1.50% | | 1.93% | | 1.53%(f) | | 1.47% | | 1.78% |
Ratio of expenses to average net assets including fee waivers and reimbursements (includes acquired fund fee reimbursements)(g) | | 1.15% | | 0.98% | | 0.92% | | 0.89%(f) | | 0.91% | | N/A |
Ratio of expenses to average net assets including fee waivers and reimbursements (excludes acquired fund fee reimbursements) | | 1.15% | | 1.15% | | 1.15% | | 1.15%(f) | | 1.15% | | 1.15% |
Ratio of net investment income/ (loss) to average net assets | | 0.85% | | 1.36% | | 0.97% | | (0.08)%(f) | | 0.93% | | 1.09% |
Portfolio turnover rate(h) | | 85% | | 113% | | 119% | | 34% | | 99% | | 67% |
| (a) | Prior to January 1, 2012, the RiverFront Global Growth Fund was known as the RiverFront Long-Term Growth Fund. |
| (b) | Effective March 8, 2011, the Board approved changing the fiscal year-end of the Fund from December 31 to April 30. |
| (c) | Calculated using the average shares method. |
| (d) | Less than $0.005 per share. |
| (e) | Total returns are for the period indicated and have not been annualized. Total returns would have been lower had certain expenses not been waived during the period. Returns shown do not reflect the deduction of taxes that a shareholder would pay on Fund distributions or the redemption of Fund shares. |
| (g) | Prior to January 1, 2013, all acquired fund fees were reimbursed. |
| (h) | Portfolio turnover rate for periods less than one full year have not been annualized. |
See Notes to Financial Statements.
130 | April 30, 2014
| | |
| RiverFront Moderate Growth & Income Fund – Class A |
| Financial Highlights | | |
Selected data for a share of beneficial interest outstanding throughout the periods indicated:
| | | | | | | | |
| | | For the Year Ended
April 30, 2014 | | For the Year Ended
April 30, 2013 | | For the Year Ended
April 30, 2012 | | For the Period
August 2, 2010
(Inception) to
April 30, 2011 |
Net asset value, beginning of period | | $11.66 | | $10.96 | | $11.08 | | $10.00 |
| |
| INCOME/(LOSS) FROM INVESTMENT OPERATIONS: | | |
Net investment income(a) | | 0.16 | | 0.24 | | 0.17 | | 0.15 |
Net realized and unrealized gain/(loss) | | 0.89 | | 0.69 | | (0.12) | | 1.01 |
Total from investment operations | | 1.05 | | 0.93 | | 0.05 | | 1.16 |
| | | | |
| DISTRIBUTIONS: | | | | | | | | |
From net investment income | | (0.16) | | (0.23) | | (0.17) | | (0.08) |
From net realized gains | | (0.56) | | – | | – | | (0.00)(b) |
Tax return of capital | | – | | – | | (0.00)(b) | | – |
Total distributions | | (0.72) | | (0.23) | | (0.17) | | (0.08) |
| | | | |
Net increase/(decrease) in net asset value | | 0.33 | | 0.70 | | (0.12) | | 1.08 |
Net asset value, end of year | | $11.99 | | $11.66 | | $10.96 | | $11.08 |
| | | | | | | | | |
| | | | | | | | | |
| TOTAL RETURN(c) | | 9.16% | | 8.59% | | 0.55% | | 11.70% |
| | |
| RATIOS/SUPPLEMENTAL DATA: | | | | |
Net assets, end of year (000s) | | $31,033 | | $29,066 | | $20,754 | | $12,148 |
Ratio of expenses to average net assets excluding fee waivers and reimbursements | | 1.32% | | 1.40% | | 1.50% | | 1.64%(d) |
Ratio of expenses to average net assets including fee waivers and reimbursements | | 1.15% | | 1.19%(e) | | 1.30% | | 1.30%(d) |
Ratio of net investment income to average net assets | | 1.35% | | 2.17% | | 1.65% | | 1.89%(d) |
Portfolio turnover rate(f) | | 98% | | 108% | | 128% | | 69% |
| | | | | | | | | |
| (a) | Calculated using the average shares method. |
| (b) | Less than ($0.005) per share. |
| (c) | Total returns are for the period indicated and have not been annualized. Total returns would have been lower had certain expenses not been waived during the period. Returns shown do not reflect the deduction of taxes that a shareholder would pay on Fund distributions or the redemption of Fund shares. Returns shown exclude any applicable sales charges. |
| (e) | Contractual expense limitation change from 1.30% to 1.15% effective September 1, 2012. |
| (f) | Portfolio turnover rate for periods less than one full year have not been annualized. |
See Notes to Financial Statements.
131 | April 30, 2014
| | |
| RiverFront Moderate Growth & Income Fund – Class C |
| Financial Highlights | | |
Selected data for a share of beneficial interest outstanding throughout the periods indicated:
| | | | | | | | |
| | | For the Year Ended
April 30, 2014 | | For the Year Ended
April 30, 2013 | | For the Year Ended
April 30, 2012 | | For the Period
August 2, 2010
(Inception) to
April 30, 2011 |
Net asset value, beginning of period | | $11.62 | | $10.92 | | $11.06 | | $10.00 |
| |
| INCOME/(LOSS) FROM INVESTMENT OPERATIONS: | | |
Net investment income(a) | | 0.07 | | 0.16 | | 0.09 | | 0.10 |
Net realized and unrealized gain/(loss) | | 0.89 | | 0.68 | | (0.13) | | 1.02 |
Total from investment operations | | 0.96 | | 0.84 | | (0.04) | | 1.12 |
| | | | |
| DISTRIBUTIONS: | | | | | | | | |
From net investment income | | (0.08) | | (0.14) | | (0.10) | | (0.06) |
From net realized gains | | (0.56) | | – | | – | | (0.00)(b) |
Tax return of capital | | – | | – | | (0.00)(b) | | – |
Total distributions | | (0.64) | | (0.14) | | (0.10) | | (0.06) |
| | | | |
Net increase/(decrease) in net asset value | | 0.32 | | 0.70 | | (0.14) | | 1.06 |
Net asset value, end of year | | $11.94 | | $11.62 | | $10.92 | | $11.06 |
| | | | | | | | | |
| | | | | | | | | |
| TOTAL RETURN(c) | | 8.33% | | 7.83% | | (0.37)% | | 11.24% |
| | |
| RATIOS/SUPPLEMENTAL DATA: | | | | |
Net assets, end of year (000s) | | $63,031 | | $52,579 | | $39,015 | | $24,061 |
Ratio of expenses to average net assets excluding fee waivers and reimbursements | | 2.07% | | 2.15% | | 2.25% | | 2.54%(d) |
Ratio of expenses to average net assets including fee waivers and reimbursements | | 1.90% | | 1.95%(e) | | 2.05% | | 2.05%(d) |
Ratio of net investment income to average net assets | | 0.59% | | 1.43% | | 0.88% | | 1.22%(d) |
Portfolio turnover rate(f) | | 98% | | 108% | | 128% | | 69% |
| | | | | | | | | |
| (a) | Calculated using the average shares method. |
| (b) | Less than ($0.005) per share. |
| (c) | Total returns are for the period indicated and have not been annualized. Total returns would have been lower had certain expenses not been waived during the period. Returns shown do not reflect the deduction of taxes that a shareholder would pay on Fund distributions or the redemption of Fund shares. Returns shown exclude any applicable sales charges. |
| (e) | Contractual expense limitation change from 2.05% to 1.90% effective September 1, 2012. |
| (f) | Portfolio turnover rate for periods less than one full year have not been annualized. |
See Notes to Financial Statements.
132 | April 30, 2014
| | |
| RiverFront Moderate Growth & Income Fund – Class I |
| Financial Highlights | | |
Selected data for a share of beneficial interest outstanding throughout the periods indicated:
| | | | | | | | |
| | | For the Year Ended
April 30, 2014 | | For the Year Ended
April 30, 2013 | | For the Year Ended
April 30, 2012 | | For the Period
August 2, 2010
(Inception) to
April 30, 2011 |
Net asset value, beginning of period | | $11.65 | | $10.94 | | $11.07 | | $10.00 |
| |
| INCOME/(LOSS) FROM INVESTMENT OPERATIONS: | | |
Net investment income(a) | | 0.19 | | 0.26 | | 0.20 | | 0.17 |
Net realized and unrealized gain/(loss) | | 0.89 | | 0.70 | | (0.13) | | 1.01 |
Total from investment operations | | 1.08 | | 0.96 | | 0.07 | | 1.18 |
| | | | |
| DISTRIBUTIONS: | | | | | | | | |
From net investment income | | (0.19) | | (0.25) | | (0.19) | | (0.11) |
From net realized gains | | (0.56) | | – | | – | | (0.00)(b) |
Tax return of capital | | – | | – | | (0.01) | | – |
Total distributions | | (0.75) | | (0.25) | | (0.20) | | (0.11) |
| | | | |
Net increase/(decrease) in net asset value | | 0.33 | | 0.71 | | (0.13) | | 1.07 |
Net asset value, end of year | | $11.98 | | $11.65 | | $10.94 | | $11.07 |
| | | | | | | | | |
| | | | | | | | | |
| TOTAL RETURN(c) | | 9.43% | | 8.94% | | 0.71% | | 11.92% |
| | |
| RATIOS/SUPPLEMENTAL DATA: | | | | |
Net assets, end of year (000s) | | $37,832 | | $25,898 | | $12,880 | | $7,535 |
Ratio of expenses to average net assets excluding fee waivers and reimbursements | | 1.07% | | 1.15% | | 1.26% | | 1.55%(d) |
Ratio of expenses to average net assets including fee waivers and reimbursements | | 0.90% | | 0.94%(e) | | 1.05% | | 1.05%(d) |
Ratio of net investment income to average net assets | | 1.59% | | 2.39% | | 1.91% | | 2.16%(d) |
Portfolio turnover rate(f) | | 98% | | 108% | | 128% | | 69% |
| | | | | | | | | |
| (a) | Calculated using the average shares method. |
| (b) | Less than ($0.005) per share. |
| (c) | Total returns are for the period indicated and have not been annualized. Total returns would have been lower had certain expenses not been waived during the period. Returns shown do not reflect the deduction of taxes that a shareholder would pay on Fund distributions or the redemption of Fund shares. |
| (e) | Contractual expense limitation change from 1.05% to 0.90% effective September 1, 2012. |
| (f) | Portfolio turnover rate for periods less than one full year have not been annualized. |
See Notes to Financial Statements.
133 | April 30, 2014
Notes to Financial Statements
April 30, 2014
1. ORGANIZATION
Financial Investors Trust (the “Trust”), a Delaware statutory trust, is an open-end management investment company registered under the Investment Company Act of 1940, as amended (“1940 Act”). As of April 30, 2014, the Trust had 30 registered funds. This annual report describes the following funds: ALPS | Alerian MLP Infrastructure Index Fund, ALPS | CoreCommodity Management CompleteCommodities® Strategy Fund, ALPS | Kotak India Growth Fund, ALPS | Red Rocks Listed Private Equity Fund, ALPS | WMC Disciplined Value Fund, Clough China Fund, RiverFront Conservative Income Builder Fund, RiverFront Dynamic Equity Income Fund, RiverFront Global Allocation Fund, RiverFront Global Growth Fund and RiverFront Moderate Growth & Income Fund (each, a “Fund” and collectively, the “Funds”).
ALPS | Alerian MLP Infrastructure Index Fund seeks investment results that correspond (before fees and expenses) generally to the price and yield performance of its underlying index, the Alerian MLP Infrastructure Index. The ALPS | CoreCommodity Management CompleteCommodities® Strategy Fund seeks to maximize real returns, consistent with prudent investment management. The Fund was previously registered as a non-diversified investment company for purpose of the 1940 Act. As a result of ongoing operations, the Fund became a diversified company. The Fund may not resume operating in a non-diversified manner without first obtaining shareholder approval. ALPS | Kotak India Growth Fund seeks to achieve long-term capital appreciation. ALPS | Red Rocks Listed Private Equity Fund seeks to maximize total return, which consists of appreciation on its investments and a variable income stream. ALPS | WMC Disciplined Value Fund seeks long-term capital appreciation: dividend income may be a factor in portfolio selection but is secondary to the Fund’s principal objective. The Clough China Fund seeks to provide investors with long-term capital appreciation. The RiverFront Conservative Income Builder Fund seeks to provide current income and potential for that income to grow over time, primarily through investments in fixed-income securities, including high- and low-grade corporate debt, with the balance of the Fund (typically 20%-50%) invested in a diversified basket of dividend-paying stocks, including small-and mid-cap domestic and foreign securities. The RiverFront Dynamic Equity Income Fund seeks to achieve long-term growth and income through a combination of capital appreciation and rising dividend payments that exceed the average yield on global stocks generally. The RiverFront Global Allocation Fund seeks to provide high total investment return through a fully managed investment policy utilizing United States and foreign equity securities, debt and money market securities, the combination of which will be varied from time to time both with respect to types of securities and markets in response to changing market and economic trends. Total investment return means the combination of capital appreciation and investment income. The RiverFront Global Growth Fund seeks to achieve long-term capital appreciation through a fully managed investment policy utilizing United States and foreign equity securities, debt and money market securities, the combination of which will be varied from time to time both with respect to types of securities and markets in response to changing market and economic trends. The RiverFront Moderate Growth & Income Fund has two primary investment objectives: (1) seeks to provide a level of current income that exceeds the average yield on U.S. stocks in general and (2) to provide a growing stream of income over the years.
The classes of each fund differ principally in the applicable distribution and shareholder service fees. Shareholders of each class also bear certain expenses that pertain to that particular class. All shareholders bear the common expenses of the Fund and earn income and realized gains/losses from the Fund pro rata based on the average daily net assets of each class, without distinction between share classes. Dividends to shareholders are determined separately for each class based on income and expenses allocable to each class. Realized gain distributions to shareholders are allocated to each class pro rata based on the shares outstanding of each class on the date of distribution. Differences in per share dividend rates generally result from differences in separate class expenses, including distribution and shareholder service fees, if applicable.
Basis of Consolidation for the ALPS | CoreCommodity Management CompleteCommodities® Strategy Fund
CoreCommodity Management Cayman Commodity Fund Ltd. (the “Subsidiary”), a Cayman Islands exempted company, was incorporated on April 23, 2010 and is a wholly owned subsidiary of the ALPS | CoreCommodity Management CompleteCommodities® Strategy Fund (the “CoreCommodity Fund”). The Subsidiary acts as an investment vehicle for the CoreCommodity Fund in order to effect certain commodity-related investments on behalf of the CoreCommodity Fund. CoreCommodity Fund is the sole shareholder of the Subsidiary pursuant to a subscription agreement dated as of June 14, 2010, and it is intended that the CoreCommodity Fund will remain the sole shareholder and will continue to wholly own and control the Subsidiary. Under the Articles of Association of the Subsidiary, shares issued by the Subsidiary confer upon a shareholder the right to vote at general meetings of the Subsidiary and certain rights in connection with any winding-up or repayment of capital, as well as the right to participate in the profits or assets of the Subsidiary. The CoreCommodity Fund may invest up to 25% of its total assets in shares of the Subsidiary. As a wholly owned subsidiary of the CoreCommodity Fund, the financial statements of the Subsidiary are included in the consolidated financial statements and financial highlights of the CoreCommodity Fund. All investments held by the Subsidiary are disclosed in the accounts of the CoreCommodity Fund. As of April 30, 2014, net assets of the CoreCommodity Fund were $392,850,506, of which $70,687,598 or 17.99%, represented the CoreCommodity Fund’s ownership of all issued shares and voting rights of the Subsidiary.
Basis of Consolidation for the ALPS | Kotak India Growth Fund
ALPS | Kotak India Growth Fund, (the “Kotak Fund”) invests in the equity securities of Indian companies through its wholly owned, collective investment vehicle, the India Premier Equity Portfolio (the “Portfolio”). The Portfolio is registered with and regulated by the Mauritius Financial Services Commission. The Portfolio was formed for the purpose of facilitating the Kotak Fund’s purchase of securities of a wide selection of Indian companies, consistent with the Kotak Fund’s investment strategies. The Portfolio is a private company limited by shares incorporated under the
134 | April 30, 2014
Notes to Financial Statements
April 30, 2014
Mauritius Companies Act 2001. As a wholly owned subsidiary of the Kotak Fund, financial statements of the Portfolio are included in the consolidated financial statements and financial highlights of the Kotak Fund. All investments held by the Portfolio are disclosed in the accounts of the Kotak Fund.
The Portfolio established residency in Mauritius allowing the Kotak Fund to receive the beneficial tax treatment under the Treaty between India and Mauritius. If the benefits of the Treaty are denied or if the Portfolio is held to have a permanent establishment in India, gains derived by the Portfolio due to the sale of securities, may be subject to taxation in India. India’s Finance Act of 2012 had introduced legislation on General Anti-Avoidance Rules (“GAAR”) into the Act which contains treaty override provisions. The GAAR may be used by the Indian tax authorities to declare any arrangement whose main purpose or one of the main purposes is to obtain a tax benefit, as an “impermissible avoidance arrangement”. Originally, GAAR was to be effective from April 1, 2012; however, subsequent to the 2013 amendments introduced to the Finance Act, GAAR has been deferred until April 1, 2015.
2. SIGNIFICANT ACCOUNTING POLICIES
The accompanying financial statements were prepared in accordance with accounting principles generally accepted in the United States of America (“U.S. GAAP”). The preparation of financial statements in conformity with U.S. GAAP requires management to make certain estimates and assumptions that affect the reported amounts of assets and liabilities and disclosures of contingent assets and liabilities at the date of the financial statements and the reported amounts of revenue and expenses during the period. Actual results could differ from those estimates. The following is a summary of significant accounting policies consistently followed by the Funds and subsidiaries, as applicable, in preparation of their financial statements.
Investment Valuation: The Funds generally value their securities based on market prices determined at the close of regular trading on the New York Stock Exchange (“NYSE”), normally 4:00 p.m. Eastern Time, on each day the NYSE is open for trading.
For equity securities and mutual funds that are traded on an exchange, the market price is usually the closing sale or official closing price on that exchange. In the case of equity securities not traded on an exchange, or if such closing prices are not otherwise available, the securities are valued at the mean of the most recent bid and ask prices on such day.
The market price for debt obligations is generally the price supplied by an independent third-party pricing service approved by the Board of Trustees (the “Board”), which may use a matrix, formula or other objective method that takes into consideration quotations from dealers, market transactions in comparable investments, market indices and yield curves. If vendors are unable to supply a price, or if the price supplied is deemed to be unreliable, the market price may be determined using quotations received from one or more brokers-dealers that make a market in the security. Short-term debt obligations that will mature in 60 days or less are valued at amortized cost; unless it is determined that using this method would not reflect an investment’s fair value. Investments in non-exchange traded funds are fair valued at their respective net asset values.
Futures contracts that are listed or traded on a national securities exchange, commodities exchange, contract market or comparable over the counter market, and that are freely transferable, are valued at their closing settlement price on the exchange on which they are primarily traded or based upon the current settlement price for a like instrument acquired on the day on which the instrument is being valued. A settlement price may not be used if the market makes a limit move with respect to a particular commodity. Over-the-counter swap contracts for which market quotations are readily available are valued based on quotes received from independent pricing services or one or more dealers that make markets in such securities.
Equity securities that are primarily traded on foreign securities exchanges are valued at the closing values of such securities on their respective foreign exchanges, except when an event occurs subsequent to the close of the foreign exchange and the close of the NYSE that was likely to have changed such value. In such an event, the fair value of those securities are determined in good faith through consideration of other factors in accordance with procedures established by and under the general supervision of the Board. The Funds will use a fair valuation model provided by an independent pricing service, which is intended to reflect fair value when a security’s value or a meaningful portion of the Fund’s portfolio is believed to have been materially affected by an valuation event that has occurred between the close of the exchange or market on which the security is traded and the close of the regular trading day on the NYSE. The Funds’ valuation procedures set forth certain triggers which instruct when to use the fair valuation model.
Forward currency exchange contracts have a market value determined by the prevailing foreign currency exchange daily rates and current foreign currency exchange forward rates. The foreign currency exchange forward rates are calculated using an automated system that estimates rates on the basis of the current day foreign currency exchange rates and forward foreign currency exchange rates supplied by a pricing service. Foreign exchange rates and forward foreign currency exchange rates may generally be obtained at the close of the NYSE, normally 4:00 p.m. Eastern Time.
135 | April 30, 2014
Notes to Financial Statements
April 30, 2014
When such prices or quotations are not available, or when the Fair Value Committee appointed by the Board believes that they are unreliable, securities may be priced using fair value procedures approved by the Board.
Fair Value Measurements: The Funds disclose the classification of their fair value measurements following a three-tier hierarchy based on the inputs used to measure fair value. Inputs refer broadly to the assumptions that market participants would use in pricing the asset or liability, including assumptions about risk. Inputs may be observable or unobservable. Observable inputs reflect the assumptions market participants would use in pricing the asset or liability that are developed based on market data obtained from sources independent of the reporting entity. Unobservable inputs reflect the reporting entity’s own assumptions about the assumptions market participants would use in pricing the asset or liability that are developed based on the best information available.
Various inputs are used in determining the value of each Fund’s investments as of the end of the reporting period. When inputs used fall into different levels of the fair value hierarchy, the level in the hierarchy within which the fair value measurement falls is determined based on the lowest level input that is significant to the fair value measurement in its entirety. The designated input levels are not necessarily an indication of the risk or liquidity associated with these investments. These inputs are categorized in the following hierarchy under applicable financial accounting standards:
| | |
Level 1 – | | Unadjusted quoted prices in active markets for identical investments, unrestricted assets or liabilities that a Fund has the ability to access at the measurement date; |
| |
Level 2 – | | Quoted prices which are not active, quoted prices for similar assets or liabilities in active markets or inputs other than quoted prices that are observable (either directly or indirectly) for substantially the full term of the asset or liability; and |
| |
Level 3 – | | Significant unobservable prices or inputs (including the Fund’s own assumptions in determining the fair value of investments) where there is little or no market activity for the asset or liability at the measurement date. |
The following is a summary of each Fund’s investments/financial instruments in the fair value hierarchy as of April 30, 2014:
| | | | | | | | | | | | | | | | |
Investments in Securities at
Value | | Level 1 - Unadjusted
Quoted Prices | | | Level 2 - Other Significant
Observable Inputs | | | Level 3 - Significant
Unobservable Inputs | | | Total | |
ALPS | Alerian MLP Infrastructure Index Fund | | | | | | | | | |
Master Limited Partnerships(a) | | $ | 13,778,336 | | | $ | – | | | $ | – | | | $ | 13,778,336 | |
Short Term Investments | | | 35,655 | | | | – | | | | – | | | | 35,655 | |
Total | | $ | 13,813,991 | | | $ | – | | | $ | – | | | $ | 13,813,991 | |
| | | | | | | | | | | | | | | | | |
| | | | |
Investments in Securities at
Value | | Level 1 - Unadjusted
Quoted Prices | | | Level 2 - Other Significant
Observable Inputs | | | Level 3 - Significant
Unobservable Inputs | | | Total | |
ALPS | CoreCommodity Management CompleteCommodities® Strategy Fund | | | | | |
Common Stocks(a) | | $ | 137,861,259 | | | $ | – | | | $ | – | | | $ | 137,861,259 | |
Master Limited Partnerships(a) | | | 1,611,023 | | | | – | | | | – | | | | 1,611,023 | |
Warrants | | | 0 | | | | – | | | | – | | | | 0 | |
Commodity-Linked Notes | | | – | | | | 6,511,796 | | | | – | | | | 6,511,796 | |
Government Bonds | | | – | | | | 136,594,089 | | | | – | | | | 136,594,089 | |
Purchased Options | | | 4,771,850 | | | | – | | | | – | | | | 4,771,850 | |
Short Term Investments | | | 91,520,155 | | | | – | | | | – | | | | 91,520,155 | |
Total | | $ | 235,764,287 | | | $ | 143,105,885 | | | $ | – | | | $ | 378,870,172 | |
| | | | | | | | | | | | | | | | | |
Other Financial Instruments | | | | | | | | | | | | | | | | |
| | | | | | | | | | | | | | | | | |
Assets | | | | | | | | | | | | | | | | |
Futures Contracts | | $ | 671,238 | | | $ | – | | | $ | – | | | $ | 671,238 | |
Total Return Swap Contracts | | | – | | | | 5,022,782 | | | | – | | | | 5,022,782 | |
Liabilities | | | | | | | | | | | | | | | | |
Written Options | | | (437,500) | | | | – | | | | – | | | | (437,500) | |
Futures Contracts | | | (698,658) | | | | – | | | | – | | | | (698,658) | |
Total Return Swap Contracts | | | – | | | | (853,888) | | | | – | | | | (853,888) | |
Total | | $ | (464,920) | | | $ | 4,168,894 | | | $ | – | | | $ | 3,703,974 | |
| | | | | | | | | | | | | | | | | |
136 | April 30, 2014
Notes to Financial Statements
April 30, 2014
| | | | | | | | | | | | | | | | |
| Investments in Securities at Value | | Level 1 - Unadjusted Quoted Prices | | | Level 2 - Other Significant Observable Inputs | | | Level 3 - Significant
Unobservable Inputs | | | Total | |
ALPS | Kotak India Growth Fund | | | | | | | | | |
Common Stocks | | | | | | | | | | | | | | | | |
Consumer Discretionary | | $ | – | | | $ | 799,878 | | | $ | – | | | $ | 799,878 | |
Consumer Staples | | | – | | | | 888,394 | | | | – | | | | 888,394 | |
Energy | | | – | | | | 584,239 | | | | – | | | | 584,239 | |
Financials | | | – | | | | 2,317,869 | | | | – | | | | 2,317,869 | |
Health Care | | | – | | | | 528,075 | | | | – | | | | 528,075 | |
Industrials | | | 157,782 | | | | 515,239 | | | | – | | | | 673,021 | |
Information Technology | | | – | | | | 1,149,411 | | | | – | | | | 1,149,411 | |
Materials | | | 164,102 | | | | 469,820 | | | | – | | | | 633,922 | |
Telecommunication Services | | | – | | | | 213,540 | | | | – | | | | 213,540 | |
Utilities | | | – | | | | 75,395 | | | | – | | | | 75,395 | |
Rights(a) | | | – | | | | 2,935 | | | | – | | | | 2,935 | |
Short Term Investments | | | 4,425 | | | | – | | | | – | | | | 4,425 | |
Total | | $ | 326,309 | | | $ | 7,544,795 | | | $ | – | | | $ | 7,871,104 | |
| | | | | | | | | | | | | | | | | |
| | | | |
| Investments in Securities at Value | | Level 1 - Unadjusted
Quoted Prices | | | Level 2 - Other Significant
Observable Inputs | | | Level 3 - Significant
Unobservable Inputs | | | Total | |
ALPS | Red Rocks Listed Private Equity Fund | | | | | | | | | |
Common Stocks(a) | | $ | 416,096,547 | | | $ | – | | | $ | – | | | $ | 416,096,547 | |
Short Term Investments | | | 4,482,636 | | | | – | | | | – | | | | 4,482,636 | |
Total | | $ | 420,579,183 | | | $ | – | | | $ | – | | | $ | 420,579,183 | |
| | | | | | | | | | | | | | | | | |
| | | | |
| Investments in Securities at Value | | Level 1 - Unadjusted
Quoted Prices | | | Level 2 - Other Significant
Observable Inputs | | | Level 3 - Significant
Unobservable Inputs | | | Total | |
ALPS | WMC Disciplined Value Fund | | | | | | | | | |
Common Stocks(a) | | $ | 99,989,243 | | | $ | – | | | $ | – | | | $ | 99,989,243 | |
Exchange Traded Funds | | | 3,017,806 | | | | – | | | | – | | | | 3,017,806 | |
Short Term Investments | | | 920,059 | | | | – | | | | – | | | | 920,059 | |
Total | | $ | 103,927,108 | | | $ | – | | | $ | – | | | $ | �� 103,927,108 | |
| | | | | | | | | | | | | | | | | |
137 | April 30, 2014
Notes to Financial Statements
April 30, 2014
| | | | | | | | | | | | | | | | |
| Investments in Securities at Value | | Level 1 - Unadjusted
Quoted Prices | | | Level 2 - Other Significant
Observable Inputs | | | Level 3 - Significant
Unobservable Inputs | | | Total | |
Clough China Fund | | | | | | | | | | | | | | | | |
Common Stocks | | | | | | | | | | | | | | | | |
Communications | | $ | 2,309,973 | | | $ | 8,331,816 | | | $ | – | | | $ | 10,641,789 | |
Consumer Discretionary | | | – | | | | 461,982 | | | | – | | | | 461,982 | |
Consumer, Cyclical | | | 2,690,060 | | | | 8,982,532 | | | | – | | | | 11,672,592 | |
Consumer, Non-Cyclical | | | – | | | | 2,638,243 | | | | – | | | | 2,638,243 | |
Diversified | | | – | | | | 1,358,231 | | | | – | | | | 1,358,231 | |
Energy | | | – | | | | 7,338,371 | | | | – | | | | 7,338,371 | |
Financials | | | – | | | | 22,687,241 | | | | – | | | | 22,687,241 | |
Industrials | | | – | | | | 10,332,548 | | | | – | | | | 10,332,548 | |
Technology | | | – | | | | 808,975 | | | | – | | | | 808,975 | |
Utilities | | | – | | | | 2,970,177 | | | | – | | | | 2,970,177 | |
Short Term Investments | | | 253,936 | | | | – | | | | – | | | | 253,936 | |
Total | | $ | 5,253,969 | | | $ | 65,910,116 | | | $ | – | | | $ | 71,164,085 | |
| | | | | | | | | | | | | | | | | |
| | | | |
| Investments in Securities at Value | | Level 1 - Unadjusted Quoted Prices | | | Level 2 - Other Significant
Observable Inputs | | | Level 3 - Significant
Unobservable Inputs | | | Total | |
RiverFront Conservative Income Builder Fund | | | | | | | | | |
Common Stocks(a) | | $ | 224,548 | | | $ | – | | | $ | – | | | $ | 224,548 | |
Exchange Traded Funds(a) | | | 5,904,180 | | | | – | | | | – | | | | 5,904,180 | |
Exchange Traded Notes(a) | | | 137,151 | | | | – | | | | – | | | | 137,151 | |
Short Term Investments | | | 286,915 | | | | – | | | | – | | | | 286,915 | |
Total | | $ | 6,552,794 | | | $ | – | | | $ | – | | | $ | 6,552,794 | |
| | | | | | | | | | | | | | | | | |
| | | | |
| Investments in Securities at Value | | Level 1 - Unadjusted Quoted Prices | | | Level 2 - Other Significant
Observable Inputs | | | Level 3 - Significant
Unobservable Inputs | | | Total | |
RiverFront Dynamic Equity Income Fund | | | | | | | | | |
Common Stocks(a) | | $ | 2,499,891 | | | $ | – | | | $ | – | | | $ | 2,499,891 | |
Exchange Traded Funds(a) | | | 52,763,155 | | | | – | | | | – | | | | 52,763,155 | |
Exchange Traded Notes(a) | | | 1,391,190 | | | | – | | | | – | | | | 1,391,190 | |
Short Term Investments | | | 1,538,531 | | | | – | | | | – | | | | 1,538,531 | |
Total | | $ | 58,192,767 | | | $ | – | | | $ | – | | | $ | 58,192,767 | |
| | | | | | | | | | | | | | | | | |
138 | April 30, 2014
Notes to Financial Statements
April 30, 2014
| | | | | | | | | | | | | | | | |
| Investments in Securities at Value | | Level 1 - Unadjusted
Quoted Prices | | | Level 2 - Other Significant
Observable Inputs | | | Level 3 - Significant
Unobservable Inputs | | | Total | |
RiverFront Global Allocation Fund | | | | | | | | | |
Common Stocks(a) | | $ | 1,566,890 | | | $ | – | | | $ | – | | | $ | 1,566,890 | |
Exchange Traded Funds(a) | | | 31,470,064 | | | | – | | | | – | | | | 31,470,064 | |
Exchange Traded Notes(a) | | | 363,273 | | | | – | | | | – | | | | 363,273 | |
Short Term Investments | | | 815,885 | | | | – | | | | – | | | | 815,885 | |
Total | | $ | 34,216,112 | | | $ | – | | | $ | – | | | $ | 34,216,112 | |
| | | | | | | | | | | | | | | | | |
| | | | |
| Investments in Securities at Value | | Level 1 - Unadjusted
Quoted Prices | | | Level 2 - Other Significant
Observable Inputs | | | Level 3 - Significant
Unobservable Inputs | | | Total | |
RiverFront Global Growth Fund | | | | | | | | | | | | | | | | |
Common Stocks(a) | | $ | 3,890,361 | | | $ | – | | | $ | – | | | $ | 3,890,361 | |
Exchange Traded Funds(a) | | | 66,750,663 | | | | – | | | | – | | | | 66,750,663 | |
Exchange Traded Notes(a) | | | 778,971 | | | | – | | | | – | | | | 778,971 | |
Short Term Investments | | | 1,869,138 | | | | – | | | | – | | | | 1,869,138 | |
Total | | $ | 73,289,133 | | | $ | – | | | $ | – | | | $ | 73,289,133 | |
| | | | | | | | | | | | | | | | | |
| | | | |
| Investments in Securities at Value | | Level 1 - Unadjusted
Quoted Prices | | | Level 2 - Other Significant
Observable Inputs | | | Level 3 - Significant
Unobservable Inputs | | | Total | |
RiverFront Moderate Growth & Income Fund | | | | | | | | | |
Common Stocks(a) | | $ | 5,791,773 | | | $ | – | | | $ | – | | | $ | 5,791,773 | |
Exchange Traded Funds(a) | | | 116,873,840 | | | | – | | | | – | | | | 116,873,840 | |
Exchange Traded Notes(a) | | | 4,490,485 | | | | – | | | | – | | | | 4,490,485 | |
Short Term Investments | | | 3,486,309 | | | | – | | | | – | | | | 3,486,309 | |
Total | | $ | 130,642,407 | | | $ | – | | | $ | – | | | $ | 130,642,407 | |
| | | | | | | | | | | | | | | | | |
| (a) | For detailed descriptions of country, sector and/or industry, see the accompanying Statement of Investments. |
The Funds recognize transfers between levels as of the end of the period. For the fiscal year ended April 30, 2014, the Funds did not have any transfers between Level 1 and Level 2 securities, except the Clough China Fund and ALPS | Kotak India Growth Fund. The Clough China Fund and ALPS | Kotak India Growth Fund utilize a fair value evaluation service with respect to international securities with an earlier market closing than the Funds’ net asset value computation cutoff. When events trigger the use of the fair value evaluation service on a reporting period date, it results in certain securities transferring from a Level 1 to a Level 2 classification. The transfer amount disclosed in the table below represents the value of the securities as of April 30, 2014 transferred in/(out) of Level 1 and Level 2 during the reporting period that were also held as of April 30, 2014.
The Clough China Fund had the following transfers out of Levels 1 and 2 at April 30, 2014:
| | | | | | | | | | | | | | | | |
| | | Level 1 - Quoted and Unadjusted Prices | | | Level 2 - Other Significant Observable Inputs | |
| | | Transfers In | | | Transfers (Out) | | | Transfers In | | | Transfers (Out) | |
Common Stocks | | $ | 1,393,575 | | | $ | — | | | $ | — | | | $ | (1,393,575) | |
Total | | $ | 1,393,575 | | | $ | — | | | $ | — | | | $ | (1,393,575) | |
| | | | | | | | | | | | | | | | | |
The ALPS | Kotak India Growth Fund had the following transfers out of Levels 1 and 2 at April 30, 2014:
| | | | | | | | | | | | | | | | |
| | | Level 1 - Quoted and Unadjusted Prices | | | Level 2 - Other Significant Observable Inputs | |
| | | Transfers In | | | Transfers (Out) | | | Transfers In | | | Transfers (Out) | |
Common Stocks | | $ | 157,782 | | | $ | (66,410) | | | $ | 66,410 | | | $ | (157,782) | |
Total | | $ | 157,782 | | | $ | (66,410) | | | $ | 66,410 | | | $ | (157,782) | |
| | | | | | | | | | | | | | | | | |
Offering Costs: The ALPS | Alerian MLP Infrastructure Index Fund and RiverFront Conservative Income Builder Fund incurred offering costs during the twelve months ended April 30, 2014. These offering costs, including fees for printing initial prospectuses, legal, and registration fees, are being amortized over the first twelve months from the inception date of each Fund. Amounts amortized through April 30, 2014 are shown on each Fund’s Statement of Operations.
139 | April 30, 2014
Notes to Financial Statements
April 30, 2014
Fund and Class Expenses: Some expenses of the Trust can be directly attributed to a Fund or a specific share class of a Fund. Expenses which cannot be directly attributed are apportioned among all Funds in the Trust based on average net assets of each share class within a Fund.
Federal Income Taxes: The Funds, except for ALPS | Alerian MLP Infrastructure Index Fund, comply with the requirements under Subchapter M of the Internal Revenue Code of 1986, as amended (the “Code”) applicable to regulated investment companies and intend to distribute substantially all of their net taxable income and net capital gains, if any, each year. Those Funds are not subject to income taxes to the extent such distributions are made.
The ALPS | Alerian MLP Infrastructure Index Fund is taxed as a regular corporation (or so-called subchapter “C” corporation) for federal income tax purposes, and will be subject to tax on its taxable income at rates applicable to corporations. Currently, the maximum marginal regular federal income tax rate for a corporation is 34 percent. The ALPS | Alerian MLP Infrastructure Index Fund may be subject to a 20 percent federal alternative minimum tax on its federal alternative taxable income to the extent that its alternative minimum tax exceeds its regular federal income tax. This differs from most investment companies, which elect to be treated as “regulated investment companies” under the Code in order to avoid paying entity level income taxes. Under current law, the ALPS | Alerian MLP Infrastructure Index Fund is not eligible to elect treatment as a regulated investment company due to its investments, primarily in Master Limited Partnerships (“MLPs”) invested in energy assets. As a result, the ALPS | Alerian MLP Infrastructure Index Fund will be obligated to pay applicable federal and state corporate income taxes on its taxable income as opposed to most other investment companies which are not so obligated. As discussed below, the ALPS | Alerian MLP Infrastructure Index Fund expects that a portion of the distributions it receives from MLPs may be treated as a tax-deferred return of capital, thus reducing the Fund’s current tax liability. However, the amount of taxes currently paid by the ALPS | Alerian MLP Infrastructure Index Fund will vary depending on the amount of income and gains derived from investments and/or sales of MLP interests and such taxes will reduce the return from an investment in the Fund. See further disclosure regarding MLPs below.
As of and during the fiscal year ended April 30, 2014, the Funds did not have a liability for any unrecognized tax benefits. The Funds file U.S. federal, state, and local tax returns as required. The Funds’ tax returns are subject to examination by the relevant tax authorities until expiration of the applicable statute of limitations which is generally three years after the filing of the tax return, but may extend to four years in certain jurisdictions. Tax returns for open years have incorporated no uncertain tax positions that require a provision for income taxes.
Distributions to Shareholders: Each Fund, except the ALPS | CoreCommodity Management CompleteCommodities® Strategy Fund, RiverFront Conservative Income Builder Fund, RiverFront Dynamic Equity Income Fund, and RiverFront Moderate Growth & Income Fund normally pays dividends and distributes capital gains, if any, on an annual basis. The ALPS | CoreCommodity Management CompleteCommodities® Strategy Fund, RiverFront Conservative Income Builder Fund, RiverFront Dynamic Equity Income Fund, and RiverFront Moderate Growth & Income Fund pay dividends, if any, on a quarterly basis and distribute capital gains annually. Income dividend distributions are derived from interest and other income the Fund receives from its investments, including distributions of short-term capital gains. Capital gain distributions are derived from gains realized when the Fund sells a security it has owned for more than a year. Each Fund may make additional distributions and dividends at other times if its portfolio manager or managers believe doing so may be necessary for the Fund to avoid or reduce taxes.
Distributions received from the ALPS | Alerian MLP Infrastructure Index Fund’s investments in MLPs generally are comprised of income and return of capital. The Fund records investment income and return of capital based on estimates made at the time such distributions are received. Such estimates are based on historical information available from each MLP and other industry sources. These estimates may subsequently be revised based on information received from MLPs after their tax reporting periods are concluded. Return of capital distributions are not taxable income to the shareholder, but reduce the investor’s tax basis in the investor’s Fund shares. Such a reduction in tax basis will result in larger taxable gains and/or lower tax losses on a subsequent sale of Fund shares. Shareholders who periodically receive the payment of dividends or other distributions consisting of a return of capital may be under the impression that they are receiving net profits from the Fund when, in fact, they are not. Shareholders should not assume that the source of the distributions is from the net profits of the Fund.
Cash distributions from MLPs to the ALPS | Alerian MLP Infrastructure Index Fund that exceed such Fund’s allocable share of such MLP’s net taxable income are considered a tax-deferred return of capital that will reduce the Fund’s adjusted tax basis in the equity securities of the MLP. These reductions in such Fund’s adjusted tax basis in the MLP equity securities will increase the amount of gain (or decrease the amount of loss) recognized by the Fund on a subsequent sale of the securities. The Fund will accrue deferred income taxes for any future tax liability associated with (i) that portion of MLP distributions considered to be a tax-deferred return of capital as well as (ii) capital appreciation of its investments. Upon the sale of an MLP security, the Fund may be liable for previously deferred taxes. The Fund will rely to some extent on information provided by the MLPs, which is not necessarily timely, to estimate deferred tax liability for purposes of financial statement reporting and determining the NAV. From time to time, ALPS Advisors, Inc. will modify the estimates or assumptions related to the Fund’s deferred tax liability as new information becomes available. The Fund will generally compute deferred income taxes based on the marginal regular federal income tax rate applicable to corporations and an assumed rate attributable to state taxes.
140 | April 30, 2014
Notes to Financial Statements
April 30, 2014
Investment Transactions and Investment Income: Investment transactions are accounted for on the date the investments are purchased or sold (trade date basis). Net realized gains and losses from investment transactions are reported on an identified cost basis. Interest income, which includes accretion of discounts and amortization of premiums, is accrued and recorded as earned. Dividend income is recognized on the ex-dividend date or for certain foreign securities, as soon as information is available to each Fund.
Foreign Securities: Each Fund may directly purchase securities of foreign issuers. Investing in securities of foreign issuers involves special risks not typically associated with investing in securities of U.S. issuers. The risks include possible reevaluation of currencies, the inability to repatriate foreign currency, less complete financial information about companies and possible future adverse political and economic developments.
Moreover, securities of many foreign issuers and their markets may be less liquid and their prices more volatile than those of securities of comparable U.S. issuers.
Foreign Currency Translation: The books and records of the Funds are maintained in U.S. dollars. Investment valuations and other assets and liabilities initially expressed in foreign currencies are converted each business day into U.S. dollars based upon current exchange rates. The portion of realized and unrealized gains or losses on investments due to fluctuations in foreign currency exchange rates is not separately disclosed and is included in realized and unrealized gains or losses on investments, when applicable.
Foreign Currency Spot Contracts: The Funds may enter into foreign currency spot contracts to facilitate transactions in foreign securities or to convert foreign currency receipts into U.S. dollars. A foreign currency spot contract is an agreement between two parties to buy and sell currencies at the current market rate, for settlement generally within two business days. The U.S. dollar value of the contracts is determined using current currency exchange rates supplied by a pricing service. The contract is marked-to-market daily for settlements beyond one day and any change in market value is recorded as an unrealized gain or loss. When the contract is closed, the Fund records a realized gain or loss equal to the difference between the value on the open and close date. Losses may arise from changes in the value of the foreign currency, or if the counterparties do not perform under the contract’s terms. The maximum potential loss from such contracts is the aggregate face value in U.S. dollars at the time the contract was opened.
Real Estate Investment Trusts (“REITs”): The Funds may invest a portion of their assets in REITs and are subject to certain risks associated with direct investment in REITs. REITs may be affected by changes in the value of their underlying properties and by defaults by borrowers or tenants. REITs depend generally on their ability to generate cash flow to make distributions to shareowners, and certain REITs have self-liquidation provisions by which mortgages held may be paid in full and distributions of capital returns may be made at any time. In addition, the performance of a REIT may be affected by its failure to qualify for tax-free pass-through of income under the Internal Revenue Code of 1986, as amended (the “Code”), or its failure to maintain exemption from registration under the 1940 Act.
Treasury Inflation Protected-Securities: The Funds may invest in treasury inflation protected securities (“TIPS”), including structured bonds in which the principal amount is adjusted daily to keep pace with inflation, as measured by the U.S. Consumer Pricing Index for Urban Consumers. The adjustments to principal due to inflation/deflation are reflected as increases/decreases to interest income with a corresponding adjustment to cost. Such adjustments may have a significant impact on a Fund’s distributions and may result in a return of capital to shareholders. The repayment of the original bond principal upon maturity is guaranteed by the full faith and credit of the U.S. Government.
Master Limited Partnerships: MLPs are publicly traded partnerships engaged in the transportation, storage and processing of minerals and natural resources. By confining their operations to these specific activities, their interests, or units, are able to trade on public securities exchanges exactly like the shares of a corporation, without entity level taxation. Of the seventy MLPs eligible for inclusion in the Index, approximately two-thirds trade on the NYSE and the rest trade on the NASDAQ. To qualify as a MLP and to not be taxed as a corporation, a partnership must receive at least 90% of its income from qualifying sources as set forth in Section 7704(d) of the Code. These qualifying sources include natural resource based activities such as the processing, transportation and storage of mineral or natural resources. MLPs generally have two classes of owners, the general partner and limited partners. The general partner of an MLP is typically owned by a major energy company, an investment fund, the direct management of the MLP, or is an entity owned by one or more of such parties. The general partner may be structured as a private or publicly traded corporation or other entity. The general partner typically controls the operations and management of the MLP through an up to 2% equity interest in the MLP plus, in many cases, ownership of common units and subordinated units. Limited partners typically own the remainder of the partnership, through ownership of common units, and have a limited role in the partnership’s operations and management. MLPs are typically structured such that common units and general partner interests have first priority to receive quarterly cash distributions up to an established minimum amount (“minimum quarterly distributions” or “MQD”). Common and general partner interests also accrue arrearages in distributions to the extent the MQD is not paid. Once common and general partner interests have been paid, subordinated units receive distributions of up to the MQD; however, subordinated units do not accrue arrearages. Distributable cash in excess of the MQD is paid to both common and subordinated units and is distributed to both common and subordinated units generally on a pro rata basis. The general partner is
141 | April 30, 2014
Notes to Financial Statements
April 30, 2014
also eligible to receive incentive distributions if the general partner operates the business in a manner which results in distributions paid per common unit surpassing specified target levels. As the general partner increases cash distributions to the limited partners, the general partner receives an increasingly higher percentage of the incremental cash distributions.
Short Sales: Each Fund may make short sales of securities consistent with its strategies. A short sale is a transaction in which a Fund sells a security it does not own in anticipation that the market price of that security will decline. During the fiscal year ended April 30, 2014, the Funds did not engage in short sales activity; therefore, there were no outstanding short sale positions at the period end.
When a Fund makes a short sale, it must borrow the security sold short and deliver it to the broker dealer through which it made the short sale as collateral for its obligation to deliver the security upon conclusion of the sale. The Fund may have to pay a fee to borrow particular securities and is often obligated to pay over any accrued interest and dividends on such borrowed securities.
If the price of the security sold short increases between the time of the short sale and the time that a Fund replaces the borrowed security, the Fund will incur a loss; conversely, if the price declines, the Fund will realize a capital gain. Any gain will be decreased, and any loss increased, by the transaction costs described above. The successful use of short selling may be adversely affected by imperfect correlation between movements in the price of the security sold short and the securities being hedged.
To the extent that a Fund engages in short sales, it will provide collateral to the broker-dealer and (except in the case of short sales “against the box”) will maintain additional asset coverage in the form of segregated or “earmarked” assets determined to be liquid in accordance with procedures established by the Board and that is equal to the current market value of the securities sold short, or will ensure that such positions are covered by “offsetting” positions, until the Fund replaces the borrowed security. A short sale is “against the box” to the extent that the Fund contemporaneously owns, or has the right to obtain at no added cost, securities identical to those sold short. Each Fund may engage in short selling to the extent permitted by the federal securities laws and rules and interpretations thereunder. To the extent a Fund engages in short selling in foreign (non-U.S.) jurisdictions, the Fund will do so to the extent permitted by the laws and regulations of such jurisdiction.
3. DERIVATIVE INSTRUMENTS
As a part of their investment strategy, ALPS | Kotak India Growth Fund and ALPS | CoreCommodity Management CompleteCommodities® Strategy Fund are permitted to enter in various types of derivatives contracts. The other funds including ALPS | Alerian MLP Infrastructure Index Fund, ALPS | Red Rocks Listed Private Equity Fund, ALPS | WMC Disciplined Value Fund, Clough China Fund, RiverFront Conservative Income Builder Fund, RiverFront Dynamic Equity Income Fund, RiverFront Global Allocation Fund, RiverFront Global Growth Fund and RiverFront Moderate Growth & Income Fund may invest to a lesser extent in derivatives contracts. In doing so, the Funds will employ strategies in differing combinations to permit them to increase, decrease, or change the level or types of exposure to market factors. Central to those strategies are features inherent in derivatives that make them more attractive for this purpose than equity or debt securities; they require little or no initial cash investment, they can focus exposure on only certain selected risk factors, and they may not require the ultimate receipt or delivery of the underlying security (or securities) to the contract. This may allow the Funds to pursue their objectives more quickly and efficiently than if they were to make direct purchases or sales of securities capable of affecting a similar response to market factors.
Risk of Investing in Derivatives: The Funds’ use of derivatives can result in losses due to unanticipated changes in the market risk factors and the overall market. In instances where the Funds are using derivatives to decrease, or hedge, exposures to market risk factors for securities held by the Funds, there are also risks that those derivatives may not perform as expected resulting in losses for the combined or hedged positions.
Derivatives may have little or no initial cash investment relative to their market value exposure and therefore can produce significant gains or losses in excess of their cost. This use of embedded leverage allows the Fund to increase its market value exposure relative to it net assets and can substantially increase the volatility of the Funds’ performance.
Additional associated risks from investing in derivatives also exist and potentially could have significant effects on the valuation of the derivative and the Funds. Typically, the associated risks are not the risks that the Funds are attempting to increase or decrease exposure to, per their investment objectives, but are the additional risks from investing in derivatives.
Examples of these associated risks are liquidity risk, which is the risk that the Funds will not be able to sell or close out the derivative in a timely manner, and counterparty credit risk, which is the risk that the counterparty will not fulfill its obligation to the Funds. In addition, use of derivatives may increase or decrease exposure to the following risk factors:
Equity Risk: Equity risk relates to the change in value of equity securities as they relate to increases or decreases in the general market. Associated risks can be different for each type of derivative and are discussed by each derivative type in the notes that follow.
142 | April 30, 2014
Notes to Financial Statements
April 30, 2014
Commodity Risk: Exposure to the commodities markets may subject the Fund to greater volatility than investments in traditional securities. Prices of various commodities may also be affected by factors, such as drought, floods, weather, livestock disease, embargoes, tariffs and other regulatory developments, which are unpredictable. The prices of commodities can also fluctuate widely due to supply and demand disruptions in major producing or consuming regions.
Foreign Currency Risk: Currency trading involves significant risks, including market risk, interest rate risk, country risk, counterparty credit risk and short sale risk. Market risk results from the price movement of foreign currency values in response to shifting market supply and demand.
Interest rate risk arises whenever a country changes its stated interest rate target associated with its currency. Country risk arises because virtually every country has interfered with international transactions in its currency.
Interest Rate Risk: Interest rate risk is the risk that fixed income securities will decline in value because of changes in interest rates. As nominal interest rates rise, the value of fixed income securities held by the Fund are likely to decrease. Securities with longer durations tend to be more sensitive to changes in interest rates, and are usually more volatile than securities.
Swap Contracts: The CoreCommodity Fund may enter into swap transactions for hedging purposes or to seek to increase total return. At the present time, the CoreCommodity Fund primarily enters into swap transactions for the purpose of increasing total return. Risks may arise as a result of the failure of the counterparty to the swap contract to comply with the terms of the swap contract. The loss incurred by the failure of a counterparty is generally limited to the net payment to be received by the CoreCommodity Fund and/or the termination value at the end of the contract.
Therefore, the CoreCommodity Fund considers the creditworthiness of each counterparty to a contract in evaluating potential credit risk. Additionally, risks may arise from unanticipated movements in interest rates or in the value of the underlying reference asset or index. Entering into these agreements involves, to varying degrees, market risk, liquidity risk and elements of credit, legal and documentation risk that are not directly reflected in the amounts recognized in the Statements of Assets and Liabilities.
The CoreCommodity Fund may pay or receive cash as collateral on these contracts which may be recorded as an asset and/or liability. The CoreCommodity Fund must set aside liquid assets, or engage in other appropriate measures, to cover its obligations under these contracts. Swaps are marked to market daily using either pricing vendor quotations, counterparty prices or model prices and the change in value, if any, is recorded as an unrealized gain or loss. Upfront payments made and/or received by the CoreCommodity Fund are recorded as an asset and/or liability and realized gains or losses are recognized ratably over the contract’s term/event, with the exception of forward starting interest rate swaps, whose realized gains or losses are recognized ratably from the effective start date. Periodic payments received or made on swap contracts are recorded as realized gains or losses. Gains or losses are realized upon termination of a swap contract and are recorded on the Statement of Operations.
The CoreCommodity Fund invests in total return swaps to obtain exposure to a security or market without owning such security or investing directly in that market or to transfer the risk/return of one market (e.g., fixed income) to another market (e.g., equity) (equity risk and/or interest rate risk). Total return swaps are agreements in which there is an exchange of cash flows whereby one party commits to make payments based on the total return (coupons plus capital gains/losses) of an underlying instrument in exchange for fixed or floating rate interest payments. To the extent the total return of the instrument or index underlying the transaction exceeds or falls short of the offsetting interest rate obligation, the Fund will receive a payment from or make a payment to the counterparty. Swap agreements held at April 30, 2014 are disclosed after the Statement of Investments.
The number of swap contracts held at April 30, 2014 is representative of the swap contract activity for the fiscal year ended April 30, 2014.
Futures: Certain Funds may invest in futures contracts in accordance with their investment objectives. Each Fund does so for a variety of reasons including for cash management, hedging or non-hedging purposes in an attempt to achieve investment returns consistent with the Fund’s investment objective. A futures contract provides for the future sale by one party and purchase by another party of a specified quantity of the security or other financial instrument at a specified price and time. A futures contract on an index is an agreement pursuant to which two parties agree to take or make delivery of an amount of cash equal to the difference between the value of the index at the close of the last trading day of the contract and the price at which the index contract was originally written. Futures transactions may result in losses in excess of the amount invested in the futures contract. There can be no guarantee that there will be a correlation between price movements in the hedging vehicle and in the portfolio securities being hedged. An incorrect correlation could result in a loss on both the hedged securities in a Fund and the hedging vehicle so that the portfolio return might have been greater had hedging not been attempted. There can be no assurance that a liquid market will exist at a time when a Fund seeks to close out a futures contract or a futures option position. Lack of a liquid market for any reason may prevent a Fund from liquidating an unfavorable position, and the Fund would remain obligated to meet margin requirements until the position is closed. In addition, a Fund could be exposed to risk if the counterparties to the contracts are unable to meet the terms of their contracts. With exchange traded futures, there is minimal counterparty credit risk to the Funds since futures are exchange traded and the exchange’s clearinghouse, as counterparty to all exchange traded futures, guarantees the futures against default.
143 | April 30, 2014
Notes to Financial Statements
April 30, 2014
When a purchase or sale of a futures contract is made by a Fund, the Fund is required to deposit with its custodian (or broker, if legally permitted) a specified amount of liquid assets (“initial margin”). The margin required for a futures contract is set by the exchange on which the contract is traded and may be modified during the term of the contract. The initial margin is in the nature of a performance bond or good faith deposit on the futures contract that is returned to a Fund upon termination of the contract, assuming all contractual obligations have been satisfied. Each day a Fund may pay or receive cash, called “variation margin,” equal to the daily change in value of the futures contract. Such payments or receipts are recorded for financial statement purposes as unrealized gains or losses by a Fund. Variation margin does not represent a borrowing or loan by a Fund but is instead a settlement between a Fund and the broker of the amount one would owe the other if the futures contract expired. When the contract is closed, a Fund records a realized gain or loss equal to the difference between the value of the contract at the time it was opened and the value at the time it was closed. As of April 30, 2014, the CoreCommodity Fund had futures contracts outstanding with a net unrealized depreciation of $27,420. The number of futures contracts held at April 30, 2014 is representative of futures contracts activity during the fiscal year ended April 30, 2014.
Option Contracts: Each Fund may enter into options transactions for hedging purposes and for non-hedging purposes such as seeking to enhance return. Each Fund may write covered put and call options on any stocks or stock indices, currencies traded on domestic and foreign securities exchanges, or futures contracts on stock indices, interest rates and currencies traded on domestic and, to the extent permitted by the CFTC, foreign exchanges. A call option on an asset written by a Fund obligates the Fund to sell the specified asset to the holder (purchaser) at a stated price (the exercise price) if the option is exercised before a specified date (the expiration date). A put option on an asset written by a Fund obligates the Fund to buy the specified asset from the purchaser at the exercise price if the option is exercised before the expiration date. Premiums received when writing options are recorded as liabilities and are subsequently adjusted to the current value of the options written. Premiums received from writing options that expire are treated as realized gains. Premiums received from writing options, which are either exercised or closed, are offset against the proceeds received or amount paid on the transaction to determine realized gains or losses which are recorded on the Statement of Operations.
The CoreCommodity Fund had the following transactions in written covered call/put options during the fiscal year ended April 30, 2014:
| | | | | | | | | | |
| | | Number of Contracts | | Premiums |
Options Outstanding, at the beginning period | | | | – | | | | $ | – | |
Options written | | | | (3,621) | | | | | 1,332,198 | |
Options closed | | | | 316 | | | | | (118,915) | |
Options exercised | | | | 425 | | | | | (161,738) | |
Options expired | | | | 2,680 | | | | | (548,917) | |
Options Outstanding, at April 30, 2014 | | | | (200) | | | | $ | 502,628 | |
| | | | | | | | | | | |
Derivatives Instruments: The following tables disclose the amounts related to each Fund’s use of derivative instruments.
The effect of derivatives instruments on the Consolidated Statement of Assets and Liabilities as of April 30, 2014:
| | | | | | | | | | | | |
| Risk Exposure | | Asset Location | | Fair Value | | | Liability Location | | Fair Value | |
ALPS | CoreCommodity Management CompleteCommodities® Strategy Fund | | | | | | | |
Equity Contracts
(Purchased Options) | | Investments, at value | | $ | 4,771,850 | | | N/A | | $ | N/A | |
Equity Contracts
(Written Options) | | N/A | | | N/A | | | Written options, at value | | | 437,500 | |
Futures Contracts* | | Receivable for variation margin | | | 671,238 | | | Payable for variation
margin | | | 698,658 | |
Commodity Contracts
(Total Return Swap Contracts) | | Unrealized appreciation on
total return swap
contracts | | | 5,022,782 | | | Unrealized depreciation
on total return swap
contracts | | | 853,888 | |
Total | | | | $ | 10,465,870 | | | | | $ | 1,990,046 | |
| | | | | | | | | | | | | |
| | | | |
| | * Risk Exposure to Fund | | | | | | | | | | |
| | Commodity Contracts | | $ | 671,238 | | | | | $ | – | |
| | Equity Contracts | | | – | | | | | | 698,658 | |
| | | | | | |
| | | | $ | 671,238 | | | | | $ | 698,658 | |
| | | | | | |
144 | April 30, 2014
Notes to Financial Statements
April 30, 2014
The effect of derivatives instruments on the Consolidated Statement of Operations for the fiscal year ended April 30, 2014:
| | | | | | | | | | |
| Risk Exposure | | Statement of Operations Location | | Realized Gain/(Loss)
on Derivatives
Recognized in Income | | | Change in
Unrealized Gain/(Loss)
on Derivatives
Recognized
in Income | |
ALPS | CoreCommodity Management CompleteCommodities® Strategy Fund | | | | | |
Equity Contracts
(Purchased Options) | | Net realized loss on investments/Net change in unrealized appreciation on investments | | $ | (954,105) | | | $ | 1,098,556 | |
Equity Contracts
(Written Options) | | Net realized gain on written options/Net change in unrealized appreciation on written options | | | 240,680 | | | | 65,128 | |
Futures Contracts* | | Net realized loss on futures contracts/Net change in unrealized appreciation on futures contracts | | | (7,044,112) | | | | 1,887,507 | |
Commodity Contracts
(Total Return Swap Contracts) | | Net realized gain on total return swap contracts/Net change in unrealized appreciation on total return swap contracts | | | 6,067,345 | | | | 9,186,316 | |
Total | | | | $ | (1,690,192) | | | $ | 12,237,507 | |
| | | | | | | | | | | |
| | | |
| | *Risk Exposure to Fund | | | | | | | | |
| | Commodity Contracts | | $ | (2,551,041) | | | $ | 2,164,271 | |
| | Currency Contracts | | | (16,007) | | | | – | |
| | Equity Contracts | | | (4,499,724) | | | | (276,764) | |
| | Fixed Income Contracts | | | 22,660 | | | | – | |
| | | | | | |
| | | | $ | (7,044,112) | | | $ | 1,887,507 | |
| | | | | | |
| | | |
| Risk Exposure | | Statement of Operations Location | | Realized Gain/(Loss) on Derivatives
Recognized in Income | | | Change in
Unrealized Gain/(Loss) on Derivatives
Recognized in Income | |
ALPS | Kotak India Growth Fund | | | | | | | | | | |
Futures Contracts
(Equity Contracts) | | Net realized gain on futures contracts/Net change in unrealized appreciation on futures contracts | | $ | 10,181 | | | $ | – | |
Total | | | | $ | 10,181 | | | $ | – | |
| | | | | | | | | | | |
Certain derivative contracts are executed under either standardized netting agreements or, for exchange-traded derivatives, the relevant contracts for a particular exchange which contain enforceable netting provisions. A derivative netting arrangement creates an enforceable right of set-off that becomes effective, and affects the realization of settlement on individual assets, liabilities and collateral amounts, only following a specified event of default or early termination. Default events may include the failure to make payments or deliver securities timely, material adverse changes in financial condition or insolvency, the breach of minimum regulatory capital requirements, or loss of license, charter or other legal authorization necessary to perform under the contract.
145 | April 30, 2014
Notes to Financial Statements
April 30, 2014
The following table presents financial instruments that are subject to enforceable netting arrangements or other similar agreements as of April 30, 2014:
| | | | | | | | | | | | | | | | | | | | | | | | |
ALPS | CoreCommodity Management CompleteCommodities® Strategy Fund Offsetting of Derivatives Asset | |
| April 30, 2014 | | | | | | | | | | | | | | | | | | |
| | | | | | | | | | | | Gross Amounts Not
Offset in the
Statement of
Financial Position | |
| Description | | Gross Amounts of
Recognized Assets | | | Gross Amounts
Offset in the
Statement of
Financial Position | | | Net Amounts
Presented in the
Statement of
Financial Position | | | Financial
Instruments
Available for
Offset(a) | | | Cash Collateral
Received(a) | | | Net Amount
Receivable | |
Total Return Swap Contracts | | $ | 5,022,782 | | | $ | – | | | $ | 5,022,782 | | | $ | (853,888) | | | $ | – | | | $ | 4,168,894 | |
Total | | $ | 5,022,782 | | | $ | – | | | $ | 5,022,782 | | | $ | (853,888) | | | $ | – | | | $ | 4,168,894 | |
| | | | | | | | | | | | | | | | | | | | | | | | | |
|
ALPS | CoreCommodity Management CompleteCommodities® Strategy Fund Offsetting of Derivatives Liability | |
| April 30, 2014 | | | | | | | | | | | | | | | | | | |
| | | | | | | | | | | | Gross Amounts Not
Offset in the
Statement of
Financial Position | |
| Description | | Gross Amounts of
Recognized Liabilities | | | Gross Amounts
Offset in the
Statement of
Financial Position | | | Net Amounts
Presented in the
Statement of
Financial Position | | | Financial
Instruments
Available for
Offset(a) | | | Cash Collateral
Pledged(a) | | | Net Amount
Payable | |
Total Return Swap Contracts | | $ | 853,888 | | | $ | – | | | $ | 853,888 | | | $ | (853,888) | | | $ | – | | | $ | – | |
Total | | $ | 853,888 | | | $ | – | | | $ | 853,888 | | | $ | (853,888) | | | $ | – | | | $ | – | |
| | | | | | | | | | | | | | | | | | | | | | | | | |
| (a) | These amounts are limited to the derivative asset/liability balance and, accordingly, do not include excess collateral received/pledged. |
4. TAX BASIS INFORMATION
Tax Basis of Distributions to Shareholders: The character of distributions made during the year from net investment income or net realized gains may differ from its ultimate characterization for federal income tax purposes. Also, due to the timing of dividend distributions, the fiscal year in which amounts are distributed may differ from the fiscal year in which the income or realized gain were recorded by a Fund. The amounts and characteristics of tax basis distributions and composition of distributable earnings/(accumulated losses) are finalized at fiscal year-end.
The tax character of distributions paid by the Funds for the fiscal year or period ended April 30, 2014 were as follows:
| | | | | | | | | | | | |
| Fund | | Ordinary Income | | | Long-Term Capital Gain | | | Return of Capital | |
ALPS | Alerian MLP Infrastructure Index Fund | | $ | 227,947 | | | $ | – | | | $ | 235,856 | |
ALPS | CoreCommodity Management
CompleteCommodities® Strategy Fund | | | – | | | | – | | | | – | |
ALPS | Kotak India Growth Fund | | | 9,601 | | | | – | | | | – | |
ALPS | Red Rocks Listed Private Equity Fund | | | 23,299,948 | | | | – | | | | – | |
ALPS | WMC Disciplined Value Fund | | | 1,909,564 | | | | 222,794 | | | | – | |
Clough China Fund | | | 699,998 | | | | – | | | | – | |
RiverFront Conservative Income Builder Fund | | | 137,318 | | | | – | | | | – | |
RiverFront Dynamic Equity Income Fund | | | 983,577 | | | | 1,181,243 | | | | – | |
RiverFront Global Allocation Fund | | | 602,677 | | | | 348,551 | | | | – | |
RiverFront Global Growth Fund | | | 1,466,563 | | | | 5,048,799 | | | | – | |
RiverFront Moderate Growth & Income Fund | | | 3,583,646 | | | | 3,525,177 | | | | – | |
146 | April 30, 2014
Notes to Financial Statements
April 30, 2014
The tax character of distributions paid by the Funds for fiscal year or period ended April 30, 2013 were as follows:
| | | | | | | | | | | | | | | | | | | | |
| Fund | | | | | Ordinary Income | | | Long-Term Capital Gain | | | | | | Return of Capital | |
ALPS | Alerian MLP Infrastructure Index Fund | | $ | | | | | – | | | $ | – | | | $ | | | | | 49,338 | |
ALPS | CoreCommodity Management CompleteCommodities® Strategy Fund | | | | | | | – | | | | – | | | | | | | | 1,317,510 | |
ALPS | Kotak India Growth Fund | | | | | | | – | | | | – | | | | | | | | – | |
ALPS | Red Rocks Listed Private Equity Fund | | | | | | | 3,300,025 | | | | – | | | | | | | | – | |
ALPS | WMC Disciplined Value Fund | | | | | | | 890,012 | | | | – | | | | | | | | – | |
Clough China Fund | | | | | | | 100,016 | | | | – | | | | | | | | – | |
RiverFront Conservative Income Builder Fund | | | | | | | 16,480 | | | | – | | | | | | | | – | |
RiverFront Dynamic Equity Income Fund | | | | | | | 511,037 | | | | – | | | | | | | | – | |
RiverFront Global Allocation Fund | | | | | | | 250,390 | | | | – | | | | | | | | – | |
RiverFront Global Growth Fund | | | | | | | 802,738 | | | | – | | | | | | | | – | |
RiverFront Moderate Growth & Income Fund | | | | | | | 1,511,757 | | | | – | | | | | | | | – | |
Components of Distributable Earnings on a Tax Basis: At April 30, 2014, permanent differences in book and tax accounting were reclassified. These differences had no effect on net assets and were primarily attributed to differences in the treatment of commodity related exchange-traded funds, the differing tax treatment of foreign currency, investments in partnerships, Passive Foreign Investment Companies (“PFICs”) and certain other investments.
For the year ended April 30, 2014, the following reclassifications, which had no impact on results of operations or net assets, were recorded to reflect tax character:
| | | | | | | | | | | | | | | | | | | | | | | | |
| Fund | | | | | Paid-in Capital | | | | | | Accumulated Net
Investment Income | | | | | | Accumulated Net Realized Gain/(Loss) on Investments | |
ALPS | CoreCommodity Management CompleteCommodities® Strategy Fund | | $ | | | | | (3,790,371) | | | $ | | | | | 3,012,909 | | | $ | | | | | 777,462 | |
ALPS | Kotak India Growth Fund | | | | | | | (39,511) | | | | | | | | 36,801 | | | | | | | | 2,710 | |
ALPS | Red Rocks Listed Private Equity Fund | | | | | | | (50) | | | | | | | | 8,329,607 | | | | | | | | (8,329,557) | |
ALPS | WMC Disciplined Value Fund | | | | | | | (910,111) | | | | | | | | 8,230 | | | | | | | | 901,881 | |
Clough China Fund | | | | | | | – | | | | | | | | 36,740 | | | | | | | | (36,740) | |
RiverFront Conservative Income Builder Fund | | | | | | | (236) | | | | | | | | 236 | | | | | | | | – | |
RiverFront Dynamic Equity Income Fund | | | | | | | – | | | | | | | | – | | | | | | | | – | |
RiverFront Global Allocation Fund | | | | | | | – | | | | | | | | 16,289 | | | | | | | | (16,289) | |
RiverFront Global Growth Fund | | | | | | | – | | | | | | | | – | | | | | | | | – | |
RiverFront Moderate Growth & Income Fund | | | | | | | – | | | | | | | | – | | | | | | | | – | |
Included in the amounts reclassified was a net operating loss offset to Paid-in Capital as follows:
| | | | |
| Fund | | Amount | |
ALPS | Kotak India Growth Fund | | $ | 39,509 | |
As of April 30, 2014, the components of distributable earnings on a tax basis were as follows:
| | | | | | | | | | | | | | | | | | | | |
| | | Undistributed net
investment income | | | Accumulated net
realized gain/(loss)
on investments | | | Other cumulative
effect of timing
differences | | | Net unrealized
appreciation on
investments | | | Total | |
ALPS | CoreCommodity
Management
CompleteCommodities®
Strategy Fund | | $ | 1,912,384 | | | $ | (8,001,582) | | | $ | (45,845) | | | $ | 11,945,577 | | | $ | 5,810,534 | |
ALPS | Kotak India Growth Fund | | | – | | | | (204,212) | | | | – | | | | 623,517 | | | | 419,305 | |
ALPS | Red Rocks Listed Private
Equity Fund | | | 15,468,954 | | | | 1,422,627 | | | | – | | | | 56,078,581 | | | | 72,970,162 | |
ALPS | WMC Disciplined Value
Fund | | | – | | | | – | | | | – | | | | 34,502,651 | | | | 34,502,651 | |
Clough China Fund | | | 223,521 | | | | 108,710 | | | | – | | | | 6,216,452 | | | | 6,548,683 | |
RiverFront Conservative Income
Builder Fund | | | 82,007 | | | | 33,719 | | | | – | | | | 209,197 | | | | 324,923 | |
RiverFront Dynamic Equity
Income Fund | | | 749,369 | | | | 1,215,661 | | | | – | | | | 3,957,670 | | | | 5,922,700 | |
147 | April 30, 2014
Notes to Financial Statements
April 30, 2014
| | | | | | | | | | | | | | | | | | | | |
| | | Undistributed net
investment income | | | Accumulated net
realized gain/(loss) on investments | | | Other cumulative
effect of timing
differences | | | Net unrealized
appreciation on
investments | | | Total | |
RiverFront Global Allocation
Fund | | $ | 439,598 | | | $ | 1,010,977 | | | $ | – | | | $ | 3,014,154 | | | $ | 4,464,729 | |
RiverFront Global Growth Fund | | | 1,091,323 | | | | 2,083,729 | | | | – | | | | 8,824,832 | | | | 11,999,884 | |
RiverFront Moderate Growth &
Income Fund | | | 1,697,740 | | | | 2,046,938 | | | | – | | | | 8,940,477 | | | | 12,685,155 | |
| | | | | | | | | | | | | | | | | | | | |
Capital Losses: As of April 30, 2014 the following Funds had capital loss carryforwards which may reduce the Funds’ taxable income arising from future net realized gains on investments, if any, to the extent permitted by the Code and thus may reduce the amount of the distributions to shareholders which would otherwise be necessary to relieve the Funds of any liability for federal tax.
Under the recently enacted Regulated Investment Company Modernization Act of 2010, capital losses incurred by each fund in tax years beginning after December 22, 2010 will not be subject to expiration. In addition, such losses must be utilized prior to the losses incurred in the years preceding enactment.
Capital loss carryovers utilized during the period ended April 30, 2014, were:
| | | | |
| Fund | | Amount | |
ALPS | CoreCommodity Management CompleteCommodities® Strategy Fund | | $ | 178,887 | |
ALPS | Kotak India Growth Fund | | | 888 | |
ALPS | Red Rocks Listed Private Equity Fund | | | 15,619,793 | |
ALPS | WMC Disciplined Value Fund | | | 6,342,039 | |
Clough China Fund | | | 2,201,190 | |
Post-Enactment Capital Losses*:
Capital losses deferred to next tax year were as follows:
| | | | | | | | | | | | | | | | |
| Fund | | | | | Short-Term | | | | | | Long-Term | |
ALPS | CoreCommodity Management CompleteCommodities® Strategy Fund | | $ | | | | | 3,479,793 | | | $ | | | | | 120,713 | |
ALPS | Kotak India Growth Fund | | | | | | | 124,590 | | | | | | | | 22,688 | |
The Fund elects to defer to the year ended April 30, 2015, capital losses recognized during the period 11/1 – 4/30/2014 in the amount of:
| | | | |
| Fund | | Capital Losses Recognized | |
ALPS | CoreCommodity Management CompleteCommodities® Strategy Fund | | $ | 4,401,076 | |
ALPS | Kotak India Growth Fund | | | 56,934 | |
| * | Post-Enactment Capital Losses arise in fiscal years beginning after December 22, 2010, and exclude any election for late year capital loss (during the period November 1st to December 31st) deferred for the current fiscal year. As a result of the enactment of the Regulated Investment Company Act of 2010, pre-enactment capital loss carryforwards may be more likely to expire unused. Additionally, post-enactment capital losses that are carried forward will retain their character as either short-term or long-term losses rather than being considered all short-term as under previous law. |
Unrealized Appreciation and Depreciation on Investments: As of April 30, 2014, the costs of investments for federal income tax purposes and accumulated net unrealized appreciation/(depreciation) on investments were as follows:
| | | | | | | | | | | | | | | | | | | | |
| Fund | | Gross
Appreciation
(excess of value
over tax cost) | | | Gross
Depreciation
(excess of tax
cost over value) | | | Net Appreciation of
Foreign Currency
and Derivatives | | | Net Unrealized
Appreciation | | | Cost of Investments
for Income Tax
Purposes | |
ALPS | Alerian MLP Infrastructure Index Fund | | $ | 2,056,536 | | | $ | (49,939) | | | $ | – | | | $ | 2,006,597 | | | $ | 11,807,394 | |
ALPS | CoreCommodity Management CompleteCommodities® Strategy Fund | | | 34,510,566 | | | | (26,769,424) | | | | 4,204,435 | | | | 11,945,577 | | | | 371,129,030 | |
ALPS | Kotak India Growth Fund | | | 803,729 | | | | (181,229) | | | | 1,017 | | | | 623,517 | | | | 7,248,604 | |
ALPS | Red Rocks Listed Private Equity Fund | | | 60,346,316 | | | | (4,294,276) | | | | 26,541 | | | | 56,078,581 | | | | 364,527,143 | |
ALPS | WMC Disciplined Value Fund | | | 34,938,063 | | | | (435,412) | | | | – | | | | 34,502,651 | | | | 69,424,457 | |
148 | April 30, 2014
Notes to Financial Statements
April 30, 2014
| | | | | | | | | | | | | | | | | | | | |
| Fund | | Gross
Appreciation
(excess of value
over tax cost) | | | Gross
Depreciation
(excess of tax
cost over value) | | | Net Appreciation of
Foreign Currency
and Derivatives | | | Net Unrealized
Appreciation | | | Cost of Investments
for Income Tax
Purposes | |
Clough China Fund | | $ | 8,482,881 | | | $ | (2,271,012) | | | $ | 4,583 | | | $ | 6,216,452 | | | $ | 64,952,216 | |
RiverFront Conservative Income Builder Fund | | | 212,960 | | | | (3,763) | | | | – | | | | 209,197 | | | | 6,343,597 | |
RiverFront Dynamic Equity Income Fund | | | 4,330,933 | | | | (373,263) | | | | – | | | | 3,957,670 | | | | 54,235,097 | |
RiverFront Global Allocation Fund | | | 3,196,149 | | | | (181,995) | | | | – | | | | 3,014,154 | | | | 31,201,958 | |
RiverFront Global Growth Fund | | | 9,170,599 | | | | (345,767) | | | | – | | | | 8,824,832 | | | | 64,464,301 | |
RiverFront Moderate Growth & Income Fund | | | 9,096,500 | | | | (156,023) | | | | – | | | | 8,940,477 | | | | 121,701,930 | |
Deferred Tax Liability for ALPS | Alerian MLP Infrastructure Index Fund
Since the ALPS | Alerian MLP Infrastructure Index Fund will be subject to taxation on its taxable income, the NAV of Fund shares will also be reduced by the accrual of any deferred tax liabilities. The Index however is calculated without any adjustments for taxes. As a result, the Fund’s after tax performance could differ significantly from the Index even if the pretax performance of the Fund and the performance of the Index are closely correlated.
The Fund’s income tax expense/(benefit) consists of the following:
| | | | | | | | | | | | | | | | | | | | | | | | |
| April 30, 2014 | | | | | Current | | | | | | Deferred | | | | | | Total | |
Federal | | | | | | $ | 2,990 | | | | | | | $ | 424,574 | | | | | | | $ | 427,564 | |
State | | | | | | | 313 | | | | | | | | 27,710 | | | | | | | | 28,023 | |
| | | | |
Total tax expense | | | | | | $ | 3,303 | | | | | | | $ | 452,284 | | | | | | | $ | 455,587 | |
| | | | |
Deferred income taxes reflect the net tax effect of temporary differences between the carrying amounts of assets and liabilities for financial reporting and tax purposes.
Components of the Fund’s deferred tax assets and liabilities are as follows:
| | | | |
| | | As of April 30, 2014 | |
Non-current Deferred tax assets: | | | | |
Net Operating Loss Carryforward | | $ | 50,348 | |
Capital Loss Carryforward | | | – | |
Other | | | – | |
Less Non-current Deferred tax liabilities: | | | | |
Net unrealized gain on investment securities | | | (725,059) | |
Other | | | (3,518) | |
| | | | |
Net Deferred tax liability | | $ | (678,230) | |
| | | | |
Although the Fund currently has a net deferred tax liability, it reviews the recoverability of its deferred tax assets based upon the weight of available evidence. When assessing the recoverability of its deferred tax assets, significant weight was given to the effects of potential future realized and unrealized gains on investments and the period over which these deferred tax assets can be realized. Currently, any capital losses that may be generated by the Fund in the future are eligible to be carried back up to three years and can be carried forward for five years to offset capital gains recognized by the fund in those years. Net operating losses that may be generated by the Fund in the future are eligible to be carried back up to two years and can be carried forward for 20 years to offset income generated by the Fund in those years.
Based upon the Fund’s assessment, it has determined that it is more likely than not that its deferred tax assets will be realized through future taxable income of the appropriate character. Accordingly, no valuation allowance has been established for the Fund’s deferred tax assets. The Fund will continue to assess the need for a valuation allowance in the future. Significant declines in the fair value of its portfolio of investments may change the Fund’s assessment of the recoverability of these assets and may result in the recording of a valuation allowance against all or a portion of the Fund’s gross deferred tax assets.
149 | April 30, 2014
Notes to Financial Statements
April 30, 2014
Total income tax benefit (current and deferred) differs from the amount computed by applying the federal statutory income tax rate of 34% to net investment and realized and unrealized gain/(losses) on investment before taxes as follows:
| | | | |
| | | For the fiscal year ended
April 30, 2014 | |
Income tax expense at statutory rate | | $ | 429,409 | |
State income taxes (net of federal benefit) | | | 28,544 | |
Permanent differences, net | | | (1,968) | |
Change in estimated state referral rate | | | (232) | |
Other | | | (167) | |
| | | | |
Net income tax expense | | $ | 455,587 | |
| | | | |
|
The following is a tabular reconciliation of the total amounts of unrecognized tax benefits: | |
| |
| | | April 30, 2014 | |
Unrecognized tax benefit - Beginning | | $ | – | |
Gross increases - tax positions in prior period | | | – �� | |
Gross decreases - tax positions in prior period | | | – | |
Gross increases - tax positions in current period | | | – | |
Settlement | | | – | |
Lapse of statute of limitations | | | – | |
Unrecognized tax benefit - Ending | | $ | – | |
The Fund recognizes interest accrued related to unrecognized tax benefits and penalties as income tax expense. For the period from Inception to April 30, 2014, the Fund had no accrued penalties or interest.
The Fund recognizes the tax benefits of uncertain tax positions only where the position is “more likely than not” to be sustained assuming examination by tax authorities. Management has analyzed the Fund’s tax positions, and has concluded that no liability for unrecognized tax benefits should be recorded related to uncertain tax positions taken on U.S. tax returns and state tax returns filed since inception of the fund. No U.S. federal or state income tax returns are currently under examination. The Fund’s initial tax year will be for the period ended October 31, 2013 and this period remains subject to examination by tax authorities in the United States. Due to the nature of the Fund’s investments, the Fund may be required to file income tax returns in several states. The Fund is not aware of any tax positions for which it is reasonably possible that the total amounts of unrecognized tax benefits will change materially in the next 12 months.
5. SECURITIES TRANSACTIONS
Purchases and sales of securities, excluding short-term securities and U.S. Government Obligations during the fiscal year ended April 30, 2014 were as follows:
| | | | | | | | |
| Fund | | Purchases of Securities | | | Proceeds from Sales of
Securities | |
ALPS | Alerian MLP Infrastructure Index Fund | | $ | 14,570,210 | | | $ | 5,642,828 | |
ALPS | CoreCommodity Management CompleteCommodities® Strategy Fund(a) | | | 78,622,539 | | | | 61,580,414 | |
ALPS | Kotak India Growth Fund(b) | | | 4,404,497 | | | | 4,462,409 | |
ALPS | Red Rocks Listed Private Equity Fund | | | 235,463,748 | | | | 128,659,090 | |
ALPS | WMC Disciplined Value Fund | | | 18,496,543 | | | | 23,079,341 | |
Clough China Fund | | | 187,784,933 | | | | 180,823,861 | |
RiverFront Conservative Income Builder Fund | | | 8,395,987 | | | | 5,775,978 | |
RiverFront Dynamic Equity Income Fund | | | 61,912,441 | | | | 42,986,626 | |
RiverFront Global Allocation Fund | | | 33,012,681 | | | | 26,445,029 | |
RiverFront Global Growth Fund | | | 61,166,187 | | | | 52,290,654 | |
RiverFront Moderate Growth & Income Fund | | | 128,498,072 | | | | 113,983,759 | |
150 | April 30, 2014
Notes to Financial Statements
April 30, 2014
Purchases and sales of U. S. Government Obligations during the fiscal year ended April 30, 2014 were as follows:
| | | | | | | | |
| Fund | | Purchases of Securities | | | Proceeds from Sales of
Securities | |
ALPS | CoreCommodity Management CompleteCommodities® Strategy Fund | | $ | – | | | $ | 30,986,631 | |
| (a) | Purchases and Sales for ALPS | CoreCommodity Management CompleteCommodities® Strategy Fund are consolidated and include the balances of CoreCommodity Management Cayman Commodity Fund, Ltd. (wholly owned subsidiary). |
| (b) | Purchases and Sales for ALPS | Kotak India Growth Fund are consolidated and include the balances of Kotak Mauritius Portfolio (wholly owned subsidiary). |
6. BENEFICIAL INTEREST TRANSACTIONS
Shares redeemed within 90 days of purchase for ALPS | Red Rocks Listed Private Equity Fund and 30 days of purchase for ALPS | CoreCommodity Management CompleteCommodities® Strategy Fund, ALPS | Kotak India Growth Fund, and Clough China Fund, may incur a 2% short-term redemption fee deducted from the redemption amount. The ALPS | Alerian MLP Infrastructure Index Fund, ALPS | WMC Disciplined Value Fund, RiverFront Conservative Income Builder Fund, RiverFront Dynamic Equity Income Fund, RiverFront Global Allocation Fund, RiverFront Global Growth Fund, and RiverFront Moderate Growth & Income Fund shares do not incur redemption fees.
For the fiscal year ended April 30, 2014, the amounts listed below were retained by the Funds. These amounts are reflected in “Shares redeemed” in the Statements of Changes in Net Assets.
| | | | | | | | | | |
| | | Redemption Fee Retained |
| Fund | | For the Year Ended April 30, 2014 | | For the Year Ended April 30, 2013 |
ALPS | CoreCommodity Management CompleteCommodities® Strategy Fund - Class A | | | | $ 28,999 | | | | | $ 17,040 | |
ALPS | CoreCommodity Management CompleteCommodities® Strategy Fund - Class C | | | | 55 | | | | | 186 | |
ALPS | CoreCommodity Management CompleteCommodities® Strategy Fund - Class I | | | | 15,328 | | | | | 10,053 | |
ALPS | Kotak India Growth Fund - Class A | | | | 1,100 | | | | | 393 | |
ALPS | Kotak India Growth Fund - Class I | | | | – | | | | | 196 | |
ALPS | Red Rocks Listed Private Equity Fund - Class A | | | | 15,705 | | | | | 15,999 | |
ALPS | Red Rocks Listed Private Equity Fund - Class C | | | | 472 | | | | | 228 | |
ALPS | Red Rocks Listed Private Equity Fund - Class I | | | | 46,273 | | | | | 9,757 | |
Clough China Fund - Class A | | | | 9,336 | | | | | 564 | |
Clough China Fund - Class C | | | | 145 | | | | | 2 | |
Clough China Fund - Class I | | | | 7,776 | | | | | 22,029 | |
151 | April 30, 2014
Notes to Financial Statements
April 30, 2014
Transactions in shares of capital stock were as follows:
| | | | | | | | |
| | | ALPS | Alerian MLP Infrastructure Index Fund | |
| | | For the
Year Ended
April 30, 2014 | | | For the Period January 2, 2013
(Commencement) to
April 30, 2013 | |
Class A | | | | | | | | |
Shares sold | | | 840,863 | | | | 82,771 | |
Dividends reinvested | | | 22,014 | | | | 806 | |
Shares redeemed | | | (214,096) | | | | (1) | |
Net increase in shares outstanding | | | 648,781 | | | | 83,576 | |
| | | | | | | | | |
| | | | | | | | | |
Class C | | | | | | | | |
Shares sold | | | 307,622 | | | | 50,001 | |
Dividends reinvested | | | 5,355 | | | | 758 | |
Shares redeemed | | | (56,783) | | | | (1) | |
Net increase in shares outstanding | | | 256,194 | | | | 50,758 | |
| | | | | | | | | |
| | | | | | | | | |
Class I | | | | | | | | |
Shares sold | | | 149,751 | | | | 200,001 | |
Dividends reinvested | | | 10,785 | | | | 3,031 | |
Shares redeemed | | | (229,611) | | | | (1) | |
Net increase/(decrease) in shares outstanding | | | (69,075) | | | | 203,031 | |
| | | | | | | | | |
| | | | | | | | | |
| |
| | | ALPS | CoreCommodity Management
CompleteCommodities® Strategy Fund | |
| | | For the
Year Ended April 30, 2014 | | | For the Year Ended April 30, 2013 | |
Class A | | | | | | | | |
Shares sold | | | 7,651,538 | | | | 8,530,181 | |
Dividends reinvested | | | – | | | | 38,287 | |
Shares redeemed | | | (7,315,182) | | | | (6,220,651) | |
Net increase in shares outstanding | | | 336,356 | | | | 2,347,817 | |
| | | | | | | | | |
| | | | | | | | | |
Class C | | | | | | | | |
Shares sold | | | 566,736 | | | | 806,811 | |
Dividends reinvested | | | – | | | | 4,974 | |
Shares redeemed | | | (1,145,365) | | | | (549,258) | |
Net increase/(decrease) in shares outstanding | | | (578,629) | | | | 262,527 | |
| | | | | | | | | |
| | | | | | | | | |
Class I | | | | | | | | |
Shares sold | | | 22,908,918 | | | | 14,771,425 | |
Dividends reinvested | | | – | | | | 52,410 | |
Shares redeemed | | | (16,450,540) | | | | (4,279,108) | |
Net increase in shares outstanding | | | 6,458,378 | | | | 10,544,727 | |
| | | | | | | | | |
| | | | | | | | | |
152 | April 30, 2014
Notes to Financial Statements
April 30, 2014
| | | | | | | | |
| | | ALPS | Kotak India Growth Fund | |
| | | For the Year Ended April 30, 2014 | | | For the Year Ended April 30, 2013 | |
Class A | | | | | | | | |
Shares sold | | | 276,089 | | | | 358,458 | |
Dividends reinvested | | | – | | | | – | |
Shares redeemed | | | (248,518) | | | | (156,778) | |
Net increase in shares outstanding | | | 27,571 | | | | 201,680 | |
| | | | | | | | | |
Class C | | | | | | | | |
Shares sold | | | 41,102 | | | | 58,597 | |
Dividends reinvested | | | – | | | | – | |
Shares redeemed | | | (50,514) | | | | (13,079) | |
Net increase/(decrease) in shares outstanding | | | (9,412) | | | | 45,518 | |
| | | | | | | | | |
Class I | | | | | | | | |
Shares sold | | | 36,244 | | | | 86,660 | |
Dividends reinvested | | | 964 | | | | – | |
Shares redeemed | | | (68,589) | | | | (56,376) | |
Net increase/(decrease) in shares outstanding | | | (31,381) | | | | 30,284 | |
| | | | | | | | | |
| |
| | | ALPS | Red Rocks Listed Private Equity Fund | |
| | | For the Year Ended April 30, 2014 | | | For the Year Ended April 30, 2013 | |
Class A | | | | | | | | |
Shares sold | | | 15,978,340 | | | | 5,739,840 | |
Dividends reinvested | | | 1,603,325 | | | | 248,170 | |
Shares redeemed | | | (5,633,930) | | | | (6,914,956) | |
Net increase/(decrease) in shares outstanding | | | 11,947,735 | | | | (926,946) | |
| | | | | | | | | |
Class C | | | | | | | | |
Shares sold | | | 1,074,269 | | | | 237,926 | |
Dividends reinvested | | | 55,528 | | | | 6,033 | |
Shares redeemed | | | (88,700) | | | | (116,850) | |
Net increase in shares outstanding | | | 1,041,097 | | | | 127,109 | |
| | | | | | | | | |
Class I | | | | | | | | |
Shares sold | | | 14,171,110 | | | | 11,839,555 | |
Dividends reinvested | | | 657,933 | | | | 127,149 | |
Shares redeemed | | | (8,859,864) | | | | (5,867,506) | |
Net increase in shares outstanding | | | 5,969,179 | | | | 6,099,198 | |
| | | | | | | | | |
Class R | | | | | | | | |
Shares sold | | | 56,083 | | | | 29,401 | |
Dividends reinvested | | | 3,972 | | | | 178 | |
Shares redeemed | | | (8,484) | | | | (5,330) | |
Net increase in shares outstanding | | | 51,571 | | | | 24,249 | |
| | | | | | | | | |
153 | April 30, 2014
Notes to Financial Statements
April 30, 2014
| | | | | | | | |
| | | ALPS | WMC Disciplined Value Fund | |
| | | For the Year Ended April 30, 2014 | | | For the Year Ended April 30, 2013 | |
Class A | | | | | | | | |
Shares sold | | | 222,748 | | | | 237,314 | |
Dividends reinvested | | | 100,951 | | | | 53,334 | |
Shares redeemed | | | (381,282) | | | | (620,571) | |
Net decrease in shares outstanding | | | (57,583) | | | | (329,923) | |
| | | | | | | | | |
Class C | | | | | | | | |
Shares sold | | | 2,541 | | | | 653 | |
Dividends reinvested | | | 187 | | | | 57 | |
Shares redeemed | | | (1,585) | | | | – | |
Net increase in shares outstanding | | | 1,143 | | | | 710 | |
| | | | | | | | | |
Class I | | | | | | | | |
Shares sold | | | 475,904 | | | | 596,565 | |
Dividends reinvested | | | 85,611 | | | | 44,131 | |
Shares redeemed | | | (751,779) | | | | (815,605) | |
Net decrease in shares outstanding | | | (190,264) | | | | (174,909) | |
| | | | | | | | | |
| |
| | | Clough China Fund | |
| | | For the Year Ended April 30, 2014 | | | For the Year Ended April 30, 2013 | |
Class A | | | | | | | | |
Shares sold | | | 620,113 | | | | 403,248 | |
Dividends reinvested | | | 17,364 | | | | 1,259 | |
Shares redeemed | | | (658,438) | | | | (537,081) | |
Net decrease in shares outstanding | | | (20,961) | | | | (132,574) | |
| | | | | | | | | |
Class C | | | | | | | | |
Shares sold | | | 192,333 | | | | 129,593 | |
Dividends reinvested | | | 983 | | | | – | |
Shares redeemed | | | (239,921) | | | | (190,104) | |
Net decrease in shares outstanding | | | (46,605) | | | | (60,511) | |
| | | | | | | | | |
Class I | | | | | | | | |
Shares sold | | | 791,750 | | | | 1,926,116 | |
Dividends reinvested | | | 7,137 | | | | 912 | |
Shares redeemed | | | (404,998) | | | | (2,279,485) | |
Net increase/(decrease) in shares outstanding | | | 393,889 | | | | (352,457) | |
| | | | | | | | | |
154 | April 30, 2014
Notes to Financial Statements
April 30, 2014
| | | | | | | | |
| | | RiverFront Conservative Income Builder Fund | |
| | | For the Year Ended April 30, 2014 | | | For the Period September 4, 2014 (Commencement) to April 30, 2013 | |
Class A | | | | | | | | |
Shares sold | | | 51,708 | | | | 57,836 | |
Dividends reinvested | | | 827 | | | | 47 | |
Shares redeemed | | | (8,730) | | | | – | |
Net increase in shares outstanding | | | 43,805 | | | | 57,883 | |
| | | | | | | | | |
Class C | | | | | | | | |
Shares sold | | | 237,894 | | | | 215,910 | |
Dividends reinvested | | | 6,490 | | | | 250 | |
Shares redeemed | | | (78,476) | | | | (658) | |
Net increase in shares outstanding | | | 165,908 | | | | 215,502 | |
| | | | | | | | | |
Class I | | | | | | | | |
Shares sold | | | 188,828 | | | | 74,254 | |
Dividends reinvested | | | 3,830 | | | | 1,217 | |
Shares redeemed | | | (132,582) | | | | (5,954) | |
Net increase in shares outstanding | | | 60,076 | | | | 69,517 | |
| | | | | | | | | |
| |
| | | RiverFront Dynamic Equity Income Fund | |
| | | For the Year Ended April 30, 2014 | | | For the Year Ended April 30, 2013 | |
Class A | | | | | | | | |
Shares sold | | | 601,943 | | | | 281,177 | |
Dividends reinvested | | | 36,711 | | | | 11,503 | |
Shares redeemed | | | (113,937) | | | | (264,787) | |
Net increase in shares outstanding | | | 524,717 | | | | 27,893 | |
| | | | | | | | | |
Class C | | | | | | | | |
Shares sold | | | 859,238 | | | | 407,618 | |
Dividends reinvested | | | 65,716 | | | | 16,294 | |
Shares redeemed | | | (241,047) | | | | (331,282) | |
Net increase in shares outstanding | | | 683,907 | | | | 92,630 | |
| | | | | | | | | |
Class I | | | | | | | | |
Shares sold | | | 794,021 | | | | 459,512 | |
Dividends reinvested | | | 54,114 | | | | 14,180 | |
Shares redeemed | | | (291,301) | | | | (230,931) | |
Net increase in shares outstanding | | | 556,834 | | | | 242,760 | |
| | | | | | | | | |
155 | April 30, 2014
Notes to Financial Statements
April 30, 2014
| | | | | | | | |
| | | RiverFront Global Allocation Fund | |
| | | For the Year Ended April 30, 2014 | | | For the Year Ended April 30, 2013 | |
Class A | | | | | | | | |
Shares sold | | | 145,922 | | | | 276,072 | |
Dividends reinvested | | | 21,838 | | | | 8,077 | |
Shares redeemed | | | (157,419) | | | | (126,146) | |
Net increase in shares outstanding | | | 10,341 | | | | 158,003 | |
| | | | | | | | | |
Class C | | | | | | | | |
Shares sold | | | 460,035 | | | | 224,493 | |
Dividends reinvested | | | 26,360 | | | | 6,887 | |
Shares redeemed | | | (164,939) | | | | (328,407) | |
Net increase/(decrease) in shares outstanding | | | 321,456 | | | | (97,027) | |
| | | | | | | | | |
Class I | | | | | | | | |
Shares sold | | | 357,419 | | | | 394,681 | |
Dividends reinvested | | | 24,973 | | | | 6,276 | |
Shares redeemed | | | (126,577) | | | | (159,373) | |
Net increase in shares outstanding | | | 255,815 | | | | 241,585 | |
| | | | | | | | | |
| |
| | | RiverFront Global Growth Fund | |
| | | For the Year Ended April 30, 2014 | | | For the Year Ended April 30, 2013 | |
Class A | | | | | | | | |
Shares sold | | | 711,148 | | | | 449,097 | |
Dividends reinvested | | | 73,149 | | | | 8,021 | |
Shares redeemed | | | (279,502) | | | | (276,448) | |
Net increase in shares outstanding | | | 504,795 | | | | 180,670 | |
| | | | | | | | | |
Class C | | | | | | | | |
Shares sold | | | 332,183 | | | | 171,120 | |
Dividends reinvested | | | 60,174 | | | | 5,393 | |
Shares redeemed | | | (114,858) | | | | (202,053) | |
Net increase/(decrease) in shares outstanding | | | 277,499 | | | | (25,540) | |
| | | | | | | | | |
Class I | | | | | | | | |
Shares sold | | | 312,894 | | | | 272,611 | |
Dividends reinvested | | | 75,213 | | | | 5,552 | |
Shares redeemed | | | (135,371) | | | | (207,050) | |
Net increase in shares outstanding | | | 252,736 | | | | 71,113 | |
| | | | | | | | | |
Class L | | | | | | | | |
Shares sold | | | 208,438 | | | | 206,678 | |
Dividends reinvested | | | 156,519 | | | | 27,327 | |
Shares redeemed | | | (297,731) | | | | (511,817) | |
Net increase/(decrease) in shares outstanding | | | 67,226 | | | | (277,812) | |
| | | | | | | | | |
Investor Class | | | | | | | | |
Shares sold | | | 17,783 | | | | 16,623 | |
Dividends reinvested | | | 52,483 | | | | 8,789 | |
Shares redeemed | | | (138,604) | | | | (167,484) | |
Net decrease in shares outstanding | | | (68,338) | | | | (142,073) | |
| | | | | | | | | |
156 | April 30, 2014
Notes to Financial Statements
April 30, 2014
| | | | | | | | |
| | | RiverFront Moderate Growth & Income Fund | |
| | | For the Year Ended April 30, 2014 | | | For the Year Ended April 30, 2013 | |
Class A | | | | | | | | |
Shares sold | | | 929,036 | | | | 1,025,931 | |
Dividends reinvested | | | 131,056 | | | | 40,069 | |
Shares redeemed | | | (964,205) | | | | (467,697) | |
Net increase in shares outstanding | | | 95,887 | | | | 598,303 | |
| | | | | | | | | |
Class C | | | | | | | | |
Shares sold | | | 1,598,320 | | | | 1,700,686 | |
Dividends reinvested | | | 231,095 | | | | 44,339 | |
Shares redeemed | | | (1,075,044) | | | | (792,564) | |
Net increase in shares outstanding | | | 754,371 | | | | 952,461 | |
| | | | | | | | | |
Class I | | | | | | | | |
Shares sold | | | 1,406,353 | | | | 1,805,781 | |
Dividends reinvested | | | 171,628 | | | | 35,557 | |
Shares redeemed | | | (642,198) | | | | (795,302) | |
Net increase in shares outstanding | | | 935,783 | | | | 1,046,036 | |
| | | | | | | | | |
157 | April 30, 2014
Notes to Financial Statements
April 30, 2014
7. AFFILIATED COMPANIES
Funds may invest in certain securities that are considered securities issued by affiliated companies. As defined by the Investment Company Act of 1940, an affiliated person, including an affiliated company, is one in which a Fund owns 5% or more of the outstanding voting securities, or a company which is under common ownership or control with the Fund. The purchases, sales, dividend income, capital gains, return of capital distributions received, shares and value of investments in affiliated companies for the year ended April 30, 2014 were as follows:
RiverFront Conservative Income Builder Fund
| | | | | | | | | | | | | | | | | | | | | | | | | | | | |
| Security Name | | Share
Balance
May 1,
2013 | | | Purchases | | | Sales | | | Share
Balance
April 30,
2014 | | | Dividend
Income | | | Realized
Loss | | | Market Value
April 30,
2014 | |
Riverfront Strategic Income Fund | | | – | | | | 21,549 | | | | 2,504 | | | | 19,045 | | | $ | 4,863 | | | $ | (270) | | | $ | 484,124 | |
| | | | | | | | | | | | | | | | | | | $ | 4,863 | | | $ | (270) | | | $ | 484,124 | |
| | | | | | | | | | | | | | | | | | | | | | | | | | | | | |
|
| RiverFront Dynamic Equity Income Fund | |
| Security Name | | Share
Balance
May 1,
2013 | | | Purchases | | | Sales | | | Share
Balance
April 30,
2014 | | | Dividend
Income | | | Realized
Gain | | | Market Value
April 30,
2014 | |
Riverfront Strategic Income Fund | | | – | | | | 125,419 | | | | – | | | | 125,419 | | | $ | 40,524 | | | $ | – | | | $ | 3,188,151 | |
| | | | | | | | | | | | | | | | | | | $ | 40,524 | | | $ | – | | | $ | 3,188,151 | |
| | | | | | | | | | | | | | | | | | | | | | | | | | | | | |
|
| RiverFront Global Allocation Fund | |
| Security Name | | Share
Balance
May 1,
2013 | | | Purchases | | | Sales | | | Share
Balance
April 30,
2014 | | | Dividend
Income | | | Realized
Gain | | | Market Value April 30,
2014 | |
Riverfront Strategic Income Fund | | | – | | | | 73,453 | | | | – | | | | 73,453 | | | $ | 24,674 | | | $ | – | | | $ | 1,867,175 | |
| | | | | | | | | | | | | | | | | | | $ | 24,674 | | | $ | – | | | $ | 1,867,175 | |
| | | | | | | | | | | | | | | | | | | | | | | | | | | | | |
|
| RiverFront Moderate Growth & Income Fund | |
| Security Name | | Share
Balance
May 1,
2013 | | | Purchases | | | Sales | | | Share
Balance
April 30,
2014 | | | Dividend
Income | | | Realized
Gain | | | Market Value
April 30,
2014 | |
Riverfront Strategic Income Fund | | | – | | | | 383,662 | | | | – | | | | 383,662 | | | $ | 106,997 | | | $ | – | | | $ | 9,752,688 | |
| | | | | | | | | | | | | | | | | | | $ | 106,997 | | | $ | – | | | $ | 9,752,688 | |
| | | | | | | | | | | | | | | | | | | | | | | | | | | | | |
158 | April 30, 2014
Notes to Financial Statements
April 30, 2014
8. MANAGEMENT AND RELATED-PARTY TRANSACTIONS
ALPS Advisors, Inc. (“AAI” or “Advisor”), subject to the authority of the Board, is responsible for the overall management and administration of each Fund’s business affairs. AAI has delegated daily management of the Funds listed below to the corresponding Sub-Advisor listed in the table below. Each Sub-Advisor manages the investments of the Fund in accordance with its investment objective, policies and limitations and investment guidelines established jointly by the Advisor and the Board.
| | |
| Fund | | Sub-Advisor |
ALPS | CoreCommodity Management CompleteCommodities®
Strategy Fund | | CoreCommodity Management, LLC (formerly CoreCommodity
Asset Management, LLC) |
ALPS | Kotak India Growth Fund | | Kotak Mahindra (UK) Limited |
ALPS | Red Rocks Listed Private Equity Fund | | Red Rocks Capital LLC |
ALPS | WMC Disciplined Value Fund | | Wellington Management Company, LLP |
Clough China Fund | | Clough Capital Partners, LP |
RiverFront Conservative Income Builder Fund | | RiverFront Investment Group, LLC |
RiverFront Dynamic Equity Income Fund | | RiverFront Investment Group, LLC |
RiverFront Global Allocation Fund | | RiverFront Investment Group, LLC |
RiverFront Global Growth Fund | | RiverFront Investment Group, LLC |
RiverFront Moderate Growth & Income Fund | | RiverFront Investment Group, LLC |
Pursuant to the Investment Advisory Agreement (the “Advisory Agreement”), each Fund pays the Advisor an annual management fee which is based on the Fund’s average daily net assets. The management fee is paid on a monthly basis. The following table reflects the Funds’ contractual management fee rates (expressed as an annual rate).
| | | | | |
| Fund | | Contractual Management Fee |
ALPS | Alerian MLP Infrastructure Index Fund | | | | 0.70 | % |
ALPS | CoreCommodity Management CompleteCommodities® Strategy Fund | | | | 0.85 | % |
ALPS | Kotak India Growth Fund | | | | 1.25 | % |
ALPS | Red Rocks Listed Private Equity Fund | | | | 0.85 | % |
ALPS | WMC Disciplined Value Fund | | | | 0.95 | %(a) |
Clough China Fund | | | | 1.35 | % |
RiverFront Conservative Income Builder Fund | | | | 0.85 | % |
RiverFront Dynamic Equity Income Fund | | | | 0.85 | % |
RiverFront Global Allocation Fund | | | | 0.85 | % |
RiverFront Global Growth Fund | | | | 0.85 | % |
RiverFront Moderate Growth & Income Fund | | | | 0.85 | % |
| (a) | The contractual management fee is 0.95% for the first $250 million of net assets, 0.85% for the next $250 million of net assets, and 0.75% for net assets in excess of $500 million. |
Pursuant to an Investment Sub-advisory Agreement, the Advisor pays each Sub-Advisor an annual sub-advisory management fee which is based on each Fund’s average daily assets. The Advisor is required to pay all fees due to each Sub-Advisor out of the management fee the Advisor receives from each Fund. The following table reflects the Funds’ contractual sub-advisory fee rates.
| | | | |
| Fund | | Average Daily Net Assets
of the Fund | | Contractual Sub-Advisory Fee |
ALPS | CoreCommodity Management CompleteCommodities® Strategy Fund | | All Asset Levels | | 0.75% |
ALPS | Kotak India Growth Fund | | First $50 Million | | 1.15% |
| | Over $50 Million | | 1.05% |
ALPS | Red Rocks Listed Private Equity Fund | | All Asset Levels | | 0.57% |
ALPS | WMC Disciplined Value Fund | | First $250 Million | | 0.50% |
| | $250 Million - $500 Million | | 0.40% |
| | Over $500 Million | | 0.30% |
159 | April 30, 2014
Notes to Financial Statements
April 30, 2014
| | | | |
| Fund | | Average Daily Net Assets
of the Fund | | Contractual Sub-Advisory Fee |
Clough China Fund | | All Asset Levels | | 0.90% |
RiverFront Conservative Income Builder Fund | | All Asset Levels | | 0.60% |
RiverFront Dynamic Equity Income Fund | | All Asset Levels | | 0.60% |
RiverFront Global Allocation Fund | | All Asset Levels | | 0.60% |
RiverFront Global Growth Fund | | All Asset Levels | | 0.60% |
RiverFront Moderate Growth & Income Fund | | All Asset Levels | | 0.60% |
The Advisor and each Sub-Advisor have contractually agreed to limit the amount of each Fund’s total annual expenses, exclusive of distribution and service (12b-1) fees (except Clough China Class A, Class C and Class I shares), shareholder service fees (except ALPS | WMC Disciplined Value Class A shares, and Clough China Class A shares and Class C shares), acquired fund fees and expenses, brokerage expenses, interest expense, taxes and extraordinary expenses, that exceed the following annual rates below. These agreements are reevaluated on an annual basis based on the terms disclosed below.
| | | | | | | | | | | | | | |
| | | | | | | | | | | | | | | Term of Expense |
| Fund | | Class A | | Class C | | Class I | | Class Inv | | Class L | | Class R | | Limit Agreement |
ALPS | Alerian MLP Infrastructure Index Fund | | 0.85% | | 0.85% | | 0.85% | | N/A | | N/A | | N/A | | 12/31/12 - 8/31/14 |
ALPS | CoreCommodity Management | | | | | | | | | | | | | | |
CompleteCommodities® Strategy Fund | | 1.05% | | 1.05% | | 1.15% | | N/A | | N/A | | N/A | | 9/11/13 - 9/11/15 |
ALPS | Kotak India Growth Fund | | 1.60% | | 1.60% | | 1.60% | | N/A | | N/A | | N/A | | 9/1/13 - 8/31/14 |
ALPS | Red Rocks Listed Private Equity Fund | | 1.25% | | 1.25% | | 1.25% | | N/A | | N/A | | 1.25% | | 9/1/13 - 8/31/14 |
ALPS | WMC Disciplined Value Fund | | 1.15% | | 1.15% | | 1.15% | | N/A | | N/A | | N/A | | 9/1/13 - 8/31/14 |
Clough China Fund | | 1.95% | | 2.70% | | 1.70% | | N/A | | N/A | | N/A | | 9/1/13 - 8/31/14(a) |
RiverFront Conservative Income Builder Fund | | 0.90% | | 0.90% | | 0.90% | | N/A | | N/A | | N/A | | 9/1/13 - 8/31/14 |
RiverFront Dynamic Equity Income Fund | | 0.90% | | 0.90% | | 0.90% | | N/A | | N/A | | N/A | | 9/1/13 - 8/31/14 |
RiverFront Global Allocation Fund | | 0.90% | | 0.90% | | 0.90% | | N/A | | N/A | | N/A | | 9/1/13 - 8/31/14 |
RiverFront Global Growth Fund | | 0.90% | | 0.90% | | 0.90% | | 0.90% | | 0.90% | | N/A | | 9/1/13 - 8/31/14 |
RiverFront Moderate Growth & Income Fund | | 0.90% | | 0.90% | | 0.90% | | N/A | | N/A | | N/A | | 9/1/13 - 8/31/14 |
| (a) | As of April 30, 2014, effective September 1, 2014, the Adviser agreed to limit the Total Annual Fund Operating Expenses (as defined above) of the Fund to an annual rate of 3.00% for Class A shares, 3.75% for Class C shares and 2.75% for Class I shares through December 31, 2018. |
The Advisor and each Sub-Advisor are permitted to recover expenses they have waived or reimbursed, on a class-by-class basis, through the agreements described above to the extent that expenses in later periods fall below the annual limits set forth in these agreements. Clough China Fund is not obligated to pay any such waived or reimbursed fees and expenses more than one year after the end of the fiscal year in which the fees or expenses were waived or reimbursed. The ALPS | Alerian MLP Infrastructure Index Fund, The ALPS | CoreCommodity Management CompleteCommodities® Strategy Fund, ALPS | Kotak India Growth Fund, ALPS | Red Rocks Listed Private Equity Fund, ALPS | WMC Disciplined Value Fund, RiverFront Conservative Income Builder Fund, RiverFront Global Growth Fund, RiverFront Dynamic Equity Income Fund, RiverFront Global Allocation Fund and RiverFront Moderate Growth & Income Fund are not obligated to pay any such waived or reimbursed fees and expenses more than three years after the end of the fiscal year in which the fees or expenses were waived or reimbursed. At April 30, 2014, the Advisor and Sub-Advisor may seek reimbursement of previously waived and reimbursed fees as follows:
| | | | | | | | | | | | | | | | |
| Fund | | Expires 2015 | | | Expires 2016 | | | Expires 2017 | | | Total | |
ALPS | Alerian MLP Infrastructure Index Fund - Class A | | $ | N/A | | | $ | 9,499 | | | $ | 95,994 | | | $ | 105,493 | |
ALPS | Alerian MLP Infrastructure Index Fund - Class C | | | N/A | | | | 9,045 | | | | 28,674 | | | | 37,719 | |
ALPS | Alerian MLP Infrastructure Index Fund - Class I | | | N/A | | | | 36,196 | | | | 38,321 | | | | 74,517 | |
ALPS | CoreCommodity Management CompleteCommodities®
Strategy Fund - Class A | | | 92,408 | | | | 91,338 | | | | 55,147 | | | | 238,893 | |
ALPS | CoreCommodity Management CompleteCommodities®
Strategy Fund - Class C | | | 22,973 | | | | 17,117 | | | | 9,066 | | | | 49,156 | |
ALPS | CoreCommodity Management CompleteCommodities®
Strategy Fund - Class I | | | 132,927 | | | | 21,636 | | | | 30,311 | | | | 184,874 | |
160 | April 30, 2014
Notes to Financial Statements
April 30, 2014
| | | | | | | | | | | | | | | | |
| Fund | | Expires 2015 | | | Expires 2016 | | | Expires 2017 | | | Total | |
ALPS | Kotak India Growth Fund - Class A | | $ | 162,829 | | | $ | 188,194 | | | $ | 198,350 | | | $ | 549,373 | |
ALPS | Kotak India Growth Fund - Class C | | | 55,637 | | | | 37,562 | | | | 38,130 | | | | 131,329 | |
ALPS | Kotak India Growth Fund - Class I | | | 156,766 | | | | 121,202 | | | | 87,957 | | | | 365,925 | |
ALPS | Red Rocks Listed Private Equity Fund - Class A | | | 187,199 | | | | 11,372 | | | | N/A | | | | 198,571 | |
ALPS | Red Rocks Listed Private Equity Fund - Class C | | | N/A | | | | N/A | | | | N/A | | | | N/A | |
ALPS | Red Rocks Listed Private Equity Fund - Class I | | | 74,332 | | | | 23,023 | | | | N/A | | | | 97,355 | |
ALPS | Red Rocks Listed Private Equity Fund - Class R | | | N/A | | | | N/A | | | | N/A | | | | N/A | |
ALPS | WMC Disciplined Value Fund - Class A | | | 76,957 | | | | 50,013 | | | | 39,957 | | | | 166,927 | |
ALPS | WMC Disciplined Value Fund - Class C | | | 35 | | | | 90 | | | | 81 | | | | 206 | |
ALPS | WMC Disciplined Value Fund - Class I | | | 50,344 | | | | 36,903 | | | | 31,790 | | | | 119,037 | |
Clough China Fund - Class A | | | 40,594 | | | | N/A | | | | N/A | | | | 40,594 | |
Clough China Fund - Class C | | | 18,643 | | | | N/A | | | | N/A | | | | 18,643 | |
Clough China Fund - Class I | | | 40,939 | | | | N/A | | | | N/A | | | | 40,939 | |
RiverFront Conservative Income Builder Fund - Class A | | | N/A | | | | 6,224 | | | | 14,608 | | | | 20,832 | |
RiverFront Conservative Income Builder Fund - Class C | | | N/A | | | | 38,763 | | | | 50,536 | | | | 89,299 | |
RiverFront Conservative Income Builder Fund - Class I | | | N/A | | | | 21,584 | | | | 23,541 | | | | 45,125 | |
RiverFront Dynamic Equity Income Fund - Class A | | | 28,156 | | | | 25,434 | | | | 28,302 | | | | 81,892 | |
RiverFront Dynamic Equity Income Fund - Class C | | | 50,238 | | | | 54,152 | | | | 55,724 | | | | 160,114 | |
RiverFront Dynamic Equity Income Fund - Class I | | | 22,483 | | | | 29,280 | | | | 39,925 | | | | 91,688 | |
RiverFront Global Allocation Fund - Class A | | | 34,374 | | | | 32,881 | | | | 31,141 | | | | 98,396 | |
RiverFront Global Allocation Fund - Class C | | | 52,289 | | | | 44,218 | | | | 41,816 | | | | 138,323 | |
RiverFront Global Allocation Fund - Class I | | | 16,751 | | | | 21,009 | | | | 30,843 | | | | 68,603 | |
RiverFront Global Growth Fund - Class A | | | 28,761 | | | | 22,444 | | | | 28,381 | | | | 79,586 | |
RiverFront Global Growth Fund - Class C | | | 25,941 | | | | 23,097 | | | | 22,962 | | | | 72,000 | |
RiverFront Global Growth Fund - Class I | | | 20,698 | | | | 18,595 | | | | 27,339 | | | | 66,632 | |
RiverFront Global Growth Fund - Class L | | | 105,363 | | | | 78,131 | | | | 60,282 | | | | 243,776 | |
RiverFront Global Growth Fund - Investor Class | | | 49,504 | | | | 31,778 | | | | 22,272 | | | | 103,554 | |
RiverFront Moderate Growth & Income Fund - Class A | | | 31,744 | | | | 49,603 | | | | 52,042 | | | | 133,389 | |
RiverFront Moderate Growth & Income Fund - Class C | | | 64,551 | | | | 92,197 | | | | 96,176 | | | | 252,924 | |
RiverFront Moderate Growth & Income Fund - Class I | | | 21,391 | | | | 38,570 | | | | 55,830 | | | | 115,791 | |
ALPS Portfolio Solutions Distributor, Inc. (the “Distributor”) acts as the distributor of the Funds’ shares pursuant to a Distribution Agreement with the Trust. Prior to April 30, 2014, the distributor was ALPS Distributors, Inc. Shares are sold on a continuous basis by the Distributor, as agent for the Funds, and the Distributor has agreed to use its best efforts to solicit orders for the sale of Funds’ shares, although it is not obliged to sell any particular amount of shares. The Distributor is not entitled to any compensation for its services. The Distributor is registered as a broker-dealer with the Securities and Exchange Commission. The Funds’ Distributor is also the distributor of the Select Sector SPDR exchange traded funds (the “Underlying Sector ETFs”). As required by exemptive relief obtained by the Underlying Sector ETFs, the Advisor will reimburse any applicable Fund an amount equal to the distribution fee received by the Distributor from the Underlying Sector ETFs attributable to such Fund’s investment in the Underlying Sector ETFs, for so long as the Distributor acts as distributor to such Fund and the Underlying Sector ETFs.
Each Fund has adopted a Distribution and Services Plan (the “Plan”) pursuant to Rule 12b-1 of the 1940 Act for the Class A, Class C, Class R (ALPS | Red Rocks Listed Private Equity Fund only), and Investor Class (RiverFront Global Growth Fund only) shares. The Plan allows a Fund to use Class A, Class C, Class R and Investor Class assets to pay fees in connection with the distribution and marketing of Class A, Class C, Class R and Investor Class shares and/or the provision of shareholder services to Class A, Class C, Class R and Investor Class shareholders. The Plan permits payment for services in connection with the administration of plans or programs that use Class A, Class C, Class R and Investor Class shares of a Fund, if any, as their funding medium and for related expenses. The Plan permits a Fund to make total payments at an annual rate of up to 0.25% of a Fund’s average daily net assets attributable to its Class A and Investor Class shares, 0.75% of a Fund’s average daily net assets attributable to its Class C shares and 0.50% of the ALPS | Red Rocks Listed Private Equity Fund’s average daily net assets attributable to its Class R shares.
161 | April 30, 2014
Notes to Financial Statements
April 30, 2014
Because these fees are paid out of a Fund’s Class A, Class C, Class R and Investor Class assets, if any, on an ongoing basis, over time they will increase the cost of an investment in Class A, Class C, Class R and Investor Class shares, if any, and Plan fees may cost an investor more than other types of sales charges.
The ALPS | Alerian MLP Infrastructure Index Fund Class A and Class C shares, ALPS | Kotak India Growth Fund Class A and Class C shares, ALPS | Red Rocks Listed Private Equity Fund Class A and Class C shares, ALPS | WMC Disciplined Value Fund Class C shares, Clough China Fund Class C shares, ALPS | CoreCommodity Management CompleteCommodities® Strategy Fund Class A and Class C shares, RiverFront Conservative Income Builder Fund Class C shares, RiverFront Dynamic Equity Income Fund Class C shares, RiverFront Global Allocation Fund Class C shares, RiverFront Global Growth Fund Class C Shares, and the RiverFront Moderate Growth & Income Fund Class C shares have adopted a shareholder services plan (“Shareholder Services Plan”). Under the Shareholder Services Plan for each Fund, the Funds are authorized to pay banks and their affiliates and other institutions, including broker-dealers and Fund affiliates (“Participating Organizations”), an aggregate fee in an amount not to exceed on an annual basis 0.15% for ALPS | Alerian MLP Infrastructure Index Fund Class A shares, ALPS | Kotak India Growth Fund Class A shares, ALPS | Red Rocks Listed Private Equity Fund Class A shares, and ALPS | CoreCommodity Management CompleteCommodities® Strategy Fund Class A shares, and not to exceed 0.25% for the ALPS | Alerian MLP Infrastructure Index Fund Class C shares, ALPS | Kotak India Growth Fund Class C shares, ALPS | Red Rocks Listed Private Equity Fund Class C shares, ALPS | WMC Disciplined Value Fund Class C shares, Clough China Fund Class C shares, ALPS | CoreCommodity Management CompleteCommodities® Strategy Fund Class C shares, RiverFront Conservative Income Builder Fund Class C shares, RiverFront Dynamic Equity Income Fund Class C shares, RiverFront Global Allocation Fund Class C shares, RiverFront Global Growth Fund Class C Shares, and the RiverFront Moderate Growth & Income Fund Class C shares of the average daily net asset value of the Class A shares and Class C shares, respectively, attributable to or held in the name of a Participating Organization for its clients as compensation for providing shareholder service activities, which do not include distribution services, pursuant to an agreement with a Participating Organization. Shareholder Services plan fees are included with distribution and service fees on the Statements of Operations.
Certain intermediaries may charge networking, omnibus account or other administrative fees with respect to transactions in shares of each Fund. Transactions may be processed through the National Securities Clearing Corporation or similar systems or processed on a manual basis. These fees generally are paid by the Fund to the Distributor, which uses such fees to reimburse intermediaries. In the event an intermediary receiving payments from the Distributor on behalf of the Fund converts from a networking structure to an omnibus account structure or otherwise experiences increased costs, fees borne by the Fund may increase. Networking fees are shown in the Statements of Operations, if applicable to the Fund.
ALPS Fund Services, Inc. (“ALPS”) serves as administrator to the Funds and the Funds have agreed to pay expenses incurred in connection with their administrative activities. Pursuant to an Administrative Agreement, ALPS provides operational services to the Funds including, but not limited to fund accounting and fund administration and generally assists in the Funds’ operations.
ALPS Price MeadowsSM (“APM”), a division of ALPS, provides administration services to the CoreCommodity Management Cayman Commodity Fund Ltd. and receives an annual fee of $50,000 for such services.
The Annual Administrative Fee is based on each Fund’s average daily net assets and will be billed monthly, at the following:
| | | | | | | |
| | | Average Daily Net Assets | | |
| Fund | | of the Fund | | Annual Administrative Fee |
ALPS | Alerian MLP Infrastructure Index Fund | | All Asset Levels | | | | 0.10 | % |
ALPS | CoreCommodity Management CompleteCommodities® Strategy Fund | | All Asset Levels | | | | 0.10 | %* |
ALPS | Kotak India Growth Fund | | All Asset Levels | | | | 0.15 | %** |
ALPS | Red Rocks Listed Private Equity Fund | | First $500 Million | | | | 0.08 | % |
| | $500 Million - $1 Billion | | | | 0.06 | % |
| | Over $1 Billion | | | | 0.04 | % |
ALPS | WMC Disciplined Value Fund | | All Asset Levels | | | | 0.15 | % |
Clough China Fund | | All Asset Levels | | | | 0.15 | % |
RiverFront Conservative Income Builder Fund | | All Asset Levels | | | | 0.10 | % |
RiverFront Dynamic Equity Income Fund | | All Asset Levels | | | | 0.10 | % |
RiverFront Global Allocation Fund | | All Asset Levels | | | | 0.10 | % |
RiverFront Global Growth Fund | | All Asset Levels | | | | 0.10 | % |
RiverFront Moderate Growth & Income Fund | | All Asset Levels | | | | 0.10 | % |
| * | Subject to a minimum annual fee of $57,140. |
| ** | Subject to a minimum annual fee of $100,000. |
162 | April 30, 2014
Notes to Financial Statements
April 30, 2014
9. INDEMNIFICATIONS
Under the Trust’s organizational documents, its officers and Trustees are indemnified against certain liability arising out of the performance of their duties to the Trust. Additionally, in the normal course of business, the Trust enters into contracts with service providers that may contain general indemnification clauses which may permit indemnification to the extent permissible under applicable law. The Trust’s maximum exposure under these arrangements is unknown, as this would involve future claims that may be made against the Trust that have not yet occurred.
10. NEW ACCOUNTING PRONOUNCEMENTS
In June 2013, the Financial Accounting Standards Board (the “FASB”) issued Accounting Standards Update (“ASU”) No. 2013-08, Financial Services-Investment Companies (Topic 946): Amendments to the Scope, Measurement, and Disclosure Requirements. The FASB standard identifies characteristics a company must assess to determine whether it is considered an investment company for financial reporting purposes. This ASU is effective for fiscal years beginning after December 15, 2013. The Funds believe the adoption of this ASU will not have a material impact on their financial statements.
163 | April 30, 2014
Report of Independent Registered Public Accounting Firm
To the Shareholders and Board of Trustees of Financial Investors Trust:
We have audited the accompanying statements of assets and liabilities, including the statements of investments, of ALPS | Red Rocks Listed Private Equity Fund, ALPS | WMC Disciplined Value Fund, Clough China Fund, ALPS | Alerian MLP Infrastructure Index Fund, RiverFront Conservative Income Builder Fund, RiverFront Global Growth Fund, RiverFront Dynamic Equity Income Fund, RiverFront Global Allocation Fund, RiverFront Moderate Growth & Income Fund, nine of the funds of Financial Investors Trust (the “Trust”), as of April 30, 2014, the related statements of operations for the year then ended, and the statements of changes in net assets and the financial highlights for the periods presented (as to the Clough China Fund, the financial highlights for each of the four years in the period ended April 30, 2014, and the period August 1, 2009 to April 30, 2010) (as to the RiverFront Global Growth Fund, the financial highlights for each of the three years in the period ended April 30, 2014, the period January 1, 2011 to April 30, 2011, and for the year ended December 31, 2010). We have also audited the accompanying consolidated statements of assets and liabilities, including the consolidated statements of investments, of ALPS | Kotak India Growth Fund and ALPS | CoreCommodity Management CompleteCommodities Strategy Fund, two of the funds of the Trust, as of April 30, 2014, and the related consolidated statements of operations for the year then ended, the consolidated statements of changes in net assets for each of the two years in the period then ended, and the consolidated financial highlights for each of the periods presented. These financial statements and financial highlights for these eleven funds are the responsibility of the Trust’s management. Our responsibility is to express an opinion on these financial statements and financial highlights based on our audits. The financial highlights of the Clough China Fund for the year ended July 31, 2009 were audited by other auditors whose report, dated September 21, 2009, expressed an unqualified opinion on such financial highlights. The financial highlights of the RiverFront Global Growth Fund for the year ended December 31, 2009 were audited by other auditors whose report, dated February 26, 2010, expressed an unqualified opinion on such financial highlights.
We conducted our audits in accordance with the standards of the Public Company Accounting Oversight Board (United States). Those standards require that we plan and perform the audit to obtain reasonable assurance about whether the financial statements and financial highlights are free of material misstatement. The Trust is not required to have, nor were we engaged to perform, an audit of its internal control over financial reporting. Our audits included consideration of internal control over financial reporting as a basis for designing audit procedures that are appropriate in the circumstances, but not for the purpose of expressing an opinion on the effectiveness of the Trust’s internal control over financial reporting. Accordingly, we express no such opinion. An audit also includes examining, on a test basis, evidence supporting the amounts and disclosures in the financial statements, assessing the accounting principles used and significant estimates made by management, as well as evaluating the overall financial statement presentation. Our procedures included confirmation of securities owned as of April 30, 2014, by correspondence with the custodian and brokers, where replies were not received from brokers, we performed other auditing procedures. We believe that our audits provide a reasonable basis for our opinion.
In our opinion, the financial statements and financial highlights referred to above present fairly, in all material respects, the financial position of each of the eleven funds constituting Financial Investors Trust as of April 30, 2014, the results of their operations for the year then ended, and the changes in their net assets and the financial highlights for the periods presented, in conformity with accounting principles generally accepted in the United States of America (as to the Clough China Fund, the financial highlights for each of the four years in the period ended April 30, 2014, and the period August 1, 2009 to April 30, 2010) (as to the RiverFront Global Growth Fund, the financial highlights for each of the three years in the period ended April 30, 2014, the period January 1, 2011 to April 30, 2011, and for the year ended December 31, 2010).
DELOITTE & TOUCHE LLP
Denver, Colorado
June 26, 2014
164 | April 30, 2014
| | |
| Additional Information | | |
| | April 30, 2014 (Unaudited) |
1. FUND HOLDINGS
The Funds file their complete schedule of portfolio holdings with the Securities and Exchange Commission (the “SEC”) for the first and third quarters of each fiscal year on Form N-Q within 60 days after the end of the period. Copies of the Funds’ Form N-Q are available without charge on the SEC website at http://www.sec.gov. You may also review and copy the Form N-Q at the SEC’s Public Reference Room in Washington, D.C. For more information about the operation of the Public Reference Room, please call the SEC at 1-800-SEC-0330.
2. FUND PROXY VOTING POLICIES, PROCEDURES AND SUMMARIES
Fund policies and procedures used in determining how to vote proxies and information regarding how each of the Funds voted proxies relating to portfolio securities during the most recent prior 12-month period ending June 30 are available without charge, (1) upon request, by calling (toll-free) (866) 759-5679 and (2) on the SEC’s website at http://www.sec.gov.
3. TAX DESIGNATIONS
The Funds designate the following as a percentage of taxable ordinary income distributions, or up to the maximum amount allowable, for the calendar year ended December 31, 2013:
| | | | | | | | | | |
| | | Qualified Dividend | | Dividend Received |
| | | Income | | Deduction |
ALPS | Red Rocks Listed Private Equity Fund | | | | 6.16 | % | | | | 0.05 | % |
ALPS | WMC Disciplined Value Fund | | | | 69.01 | % | | | | 68.03 | % |
Clough China Fund | | | | 100.00 | % | | | | 0.00 | % |
RiverFront Conservative Income Builder Fund | | | | 1.52 | % | | | | 1.33 | % |
RiverFront Dynamic Equity Income Fund | | | | 3.39 | % | | | | 3.42 | % |
RiverFront Global Allocation Fund | | | | 3.00 | % | | | | 3.01 | % |
RiverFront Global Growth Fund | | | | 3.31 | % | | | | 3.32 | % |
RiverFront Moderate Growth & Income Fund | | | | 2.36 | % | | | | 2.37 | % |
In early 2014, if applicable, shareholders of record received this information for the distribution paid to them by the Funds during the calendar year 2013 via Form 1099. The Funds will notify shareholders in early 2015 of amounts paid to them by the Funds, if any, during the calendar year 2014.
The Funds designate the following as a long term capital gain distribution:
| | |
| | | Long-Term Gain Distribution |
ALPS | WMC Disciplined Value Fund | | $ 222,794 |
RiverFront Dynamic Equity Income Fund | | 1,181,243 |
RiverFront Global Allocation Fund | | 348,551 |
RiverFront Global Growth Fund | | 5,048,799 |
RiverFront Moderate Growth & Income Fund | | 3,525,177 |
Pursuant to Section 853 (c) of the Internal Revenue Code, the Clough China Fund, designates $102,748, as foreign taxes paid, and $2,287,673, as foreign source income earned between May 1, 2013 and April 30, 2014.
4. SHAREHOLDER MEETING
A Special Meeting of Shareholders of the ALPS | CoreCommodity Management CompleteCommoditiesSM Strategy Fund (the “Fund”) was held on November 12, 2013 to approve a new Investment Sub-Advisory Agreement among Financial Investors Trust (the “Trust”) on behalf of the Fund, ALPS Advisors, Inc. and CoreCommodity Management, LLC (the “Proposal”) and adjourned, until December 16, 2013 and further adjourned until January 15, 2014. The Special Meeting was reconvened on January 15, 2014 and the Proposal was voted on and approved by the Shareholders of the Fund.
The January 15, 2014 voting results were as follows:
| | | | | | |
| Matter | | Voter Type | | Shares | |
Approval of a new Investment Sub-Advisory Agreement among Financial | | For | | | 11,722,211.000 | |
Investors Trust, on behalf of the Fund, ALPS Advisors and CoreCommodity | | Against | | | 4,113,635.000 | |
Management, LLC | | Abstain | | | 396,374.394 | |
165 | April 30, 2014
| | |
| Trustees and Officers | | |
| | April 30, 2014 (Unaudited) |
Additional information regarding the Funds’ trustees is included in the Statement of Additional Information, which can be obtained without charge by calling (toll-free) (866) 759-5679.
INDEPENDENT TRUSTEES
| | | | | | | | | | |
Name,
Address*
& Year of
Birth | | Position(s)
Held with
Fund | | Term of Office
and Length of
Time Served** | | Principal Occupation(s) During Past 5 Years*** | | Number of
Funds in
Fund
Complex
Overseen by
Trustee**** | | Other Directorships
Held by Trustee |
| | | | | |
Mary K. Anstine, 1940 | | Trustee | | Ms. Anstine was elected at a special meeting of shareholders held on March 21, 1997 and re-elected at a special meeting of shareholders held on August 7, 2009. | | Ms. Anstine was President/Chief Executive Officer of HealthONE Alliance, Denver, Colorado, and former Executive Vice President of First Interstate Bank of Denver. Ms. Anstine is also Trustee/Director of AV Hunter Trust and Colorado Uplift Board. Ms. Anstine was formerly a Director of the Trust Bank of Colorado (later purchased and now known as Northern Trust Bank), HealthONE and Denver Area Council of the Boy Scouts of America, and a member of the American Bankers Association Trust Executive Committee. | | 59 | | Ms. Anstine is a Trustee of ALPS ETF Trust (21 funds); ALPS Variable Investment Trust (8 funds); Reaves Utility Income Fund (1 fund); and Westcore Trust (12 funds). |
John R. Moran, Jr., 1930 | | Trustee | | Mr. Moran was elected at a special meeting of shareholders held on March 21, 1997 and re-elected at a special meeting of shareholders held on August 7, 2009. | | Mr. Moran is formerly President and CEO of The Colorado Trust, a private foundation serving the health and hospital community in the state of Colorado. Currently, Mr. Moran is a member of the Treasurer’s Investment Advisory Committee for the University of Colorado. | | 30 | | None. |
Jeremy W. Deems, 1976 | | Trustee | | Mr. Deems was appointed as a Trustee at the March 11, 2008 meeting of the Board of Trustees and elected at a special meeting of shareholders held on August 7, 2009. | | Mr. Deems is the Co-Founder, Chief Operations Officer and Chief Financial Officer of Green Alpha Advisors, LLC. Mr. Deems is Co-Portfolio Manager of the Shelton Green Alpha Fund. Prior to joining Green Alpha Advisors, Mr. Deems was CFO and Treasurer of Forward Management, LLC, ReFlow Management Co., LLC, ReFlow Fund, LLC, a private investment fund, and Sutton Place Management, LLC, an administrative services company, from 2004 to June 2007. | | 59 | | Mr. Deems is a Trustee of ALPS ETF Trust (21 funds); ALPS Variable Investment Trust (8 funds) and Reaves Utility Income Fund (1 fund). |
| * | All communications to Trustees and Officers may be directed to Financial Investors Trust c/o 1290 Broadway, Suite 1100, Denver, CO 80203. |
| ** | This is the period for which the Trustee or Officer began serving the Trust. Each Trustee and/or Officer serves an indefinite term, until his successor is elected. |
| *** | Except as otherwise indicated, each individual has held the office shown or other offices in the same company for the last five years. |
| **** | The Fund Complex includes all series of the Trust, currently 30, and any other investment companies for which any Trustee serves as Trustee for and which ALPS Advisors, Red Rocks, Wellington Management, Clough Capital, CoreCommodity Management, RiverFront or Kotak provides investment advisory services (currently 43 funds, 0 funds, 0 funds, 3 funds, 0 funds, 1 funds and 0 funds, respectively). |
166 | April 30, 2014
| | |
| Trustees and Officers | | |
| | April 30, 2014 (Unaudited) |
INDEPENDENT TRUSTEES
| | | | | | | | | | |
Name,
Address*
& Year
of Birth | | Position(s)
Held with
Fund | | Term of Office
and Length of
Time Served** | | Principal Occupation(s) During Past 5 Years*** | | Number of
Funds in
Fund
Complex
Overseen by
Trustee**** | | Other Directorships
Held by Trustee |
| | | | | |
Jerry G. Rutledge, 1944 | | Trustee | | Mr. Rutledge was elected at a special meeting of shareholders held on August 7, 2009. | | Mr. Rutledge is the President and owner of Rutledge’s Inc., a retail clothing business. He was from 1994 to 2007 a Regent of the University of Colorado. | | 34 | | Mr. Rutledge is a Trustee of Principal Real Estate Income Fund (1 fund), Clough Global Allocation Fund (1 fund), Clough Global Equity Fund (1 fund) and Clough Global Opportunities Fund (1 fund). |
| | | | | |
Michael “Ross” Shell, 1970 | | Trustee | | Mr. Shell was elected at a special meeting of shareholders held on August 7, 2009. | | Mr. Shell is Founder and CEO of Red Idea, LLC, a strategic consulting/early stage venture firm (since June 2008). From 1999 to 2009, he was a part-owner and Director of Tesser, Inc., a brand agency. From December 2005 to May 2008, he was Director, Marketing and Investor Relations, of Woodbourne, a REIT/real estate hedge fund and private equity firm. Prior to this, from May 2004 to November 2005, he worked as a business strategy consultant; from June 2003 to April 2004, he was on the Global Client Services team of IDEO, a product design/innovation firm; and from 1999 to 2003, he was President of Tesser, Inc. Mr. Shell graduated with honors from Stanford University with a degree in Political Science. | | 30 | | None. |
| * | All communications to Trustees and Officers may be directed to Financial Investors Trust c/o 1290 Broadway, Suite 1100, Denver, CO 80203. |
| ** | This is the period for which the Trustee or Officer began serving the Trust. Each Trustee and/or Officer serves an indefinite term, until his successor is elected. |
| *** | Except as otherwise indicated, each individual has held the office shown or other offices in the same company for the last five years. |
| **** | The Fund Complex includes all series of the Trust, currently 30, and any other investment companies for which any Trustee serves as Trustee for and which ALPS Advisors, Red Rocks, Wellington Management, Clough Capital, CoreCommodity Management, RiverFront or Kotak provides investment advisory services (currently 43 funds, 0 funds, 0 funds, 3 funds, 0 funds, 1 funds and 0 funds, respectively). |
167 | April 30, 2014
| | |
| Trustees and Officers | | |
| | April 30, 2014 (Unaudited) |
INTERESTED TRUSTEE
| | | | | | | | | | |
Name,
Address*
& Year of Birth | | Position(s)
Held with
Fund | | Term of Office
and Length of
Time Served** | | Principal Occupation(s) During Past 5 Years*** | | Number of
Funds in
Fund
Complex
Overseen by
Trustee**** | | Other Directorships
Held by Trustee |
| | | | | |
Edmund J. Burke, 1961 | | Trustee, Chairman and President | | Mr. Burke was elected as Chairman at the August 28, 2009 meeting of the Board of Trustees. Mr. Burke was elected as Trustee at a special meeting of shareholders held on August 7, 2009. Mr. Burke was elected President of the Trust at the December 17, 2002 meeting of the Board of Trustees. | | Mr. Burke is President and a Director of ALPS Holdings, Inc. (“AHI”) (since 2005) and Director of Boston Financial Data Services, Inc. (“BFDS”), ALPS Advisors, Inc. (“AAI”), ALPS Distributors, Inc. (“ADI”), ALPS Fund Services, Inc. (“AFS”) and ALPS Portfolio Solutions Distributor, Inc. (“APSD”) and from 2001-2008, was President of AAI, ADI, AFS and APSD. Because of his positions with AHI, BFDS, AAI, ADI, AFS and APSD, Mr. Burke is deemed an affiliate of the Trust as defined under the 1940 Act. Mr. Burke is Trustee and President of the Clough Global Allocation Fund (Trustee since 2006; President since 2004); Trustee and President of the Clough Global Equity Fund (Trustee since 2006; President since 2005); Trustee and President of the Clough Global Opportunities Fund (since 2006); Trustee of the Liberty All-Star Equity Fund; and Director of the Liberty All-Star Growth Fund, Inc. | | 35 | | Mr. Burke is a Trustee of Clough Global Allocation Fund (1 fund); Clough Global Equity Fund (1 fund); Clough Global Opportunities Fund (1 fund); Trustee of the Liberty All-Star Equity Fund (1 fund); and Director of the Liberty All-Star Growth Fund, Inc. (1 fund). |
| * | All communications to Trustees and Officers may be directed to Financial Investors Trust c/o 1290 Broadway, Suite 1100, Denver, CO 80203. |
| ** | This is the period for which the Trustee or Officer began serving the Trust. Each Trustee and/or Officer serves an indefinite term, until his successor is elected. |
| *** | Except as otherwise indicated, each individual has held the office shown or other offices in the same company for the last five years. |
| **** | The Fund Complex includes all series of the Trust, currently 30, and any other investment companies for which any Trustee serves as Trustee for and which ALPS Advisors, Red Rocks, Wellington Management, Clough Capital, CoreCommodity Management, RiverFront or Kotak provides investment advisory services (currently 43 funds, 0 funds, 0 funds, 3 funds, 0 funds, 1 funds and 0 funds, respectively). |
168 | April 30, 2014
| | |
| Trustees and Officers | | |
| | April 30, 2014 (Unaudited) |
OFFICERS
| | | | | | |
Name, Address* & Year of Birth | | Position(s) Held with Fund | | Term of Office and Length of Time Served** | | Principal Occupation(s) During Past 5 Years*** |
| | | |
Kimberly R. Storms, 1972 | | Treasurer | | Ms. Storms was elected Treasurer of the Trust at the March 12, 2013 meeting of the Board of Trustees. | | Ms. Storms is Senior Vice President - Director of Fund Administration of ALPS. Ms. Storms joined ALPS in 1998 as Assistant Controller. Because of her position with ALPS, Ms. Storms is deemed an affiliate of the Trust as defined under the 1940 Act. Ms. Storms is also Treasurer of BPV Family of Funds and ALPS Series Trust; Assistant Treasurer of Liberty All-Star Equity Fund and Liberty All-Star Growth Fund, Inc.; Assistant Treasurer of Tilson Funds; and Chief Financial Officer of The Arbitrage Funds. |
| | | |
David T. Buhler, 1971 | | Secretary | | Mr. Buhler was elected Secretary of the Trust at the September 11, 2012 meeting of the Board of Trustees. | | Mr. Buhler joined ALPS in June 2010. He is currently Vice President and Senior Associate Counsel of ALPS, AAI, ADI and APSD. Prior to joining ALPS, Mr. Buhler served as Associate General Counsel and Assistant Secretary of Founders Asset Management LLC from 2006 to 2009. Because of his position with ALPS, Mr. Buhler is deemed an affiliate of the Trust as defined under the 1940 Act. Mr. Buhler is also the Secretary ALPS Variable Investment Trust and Westcore Trust. |
| | | |
Ted Uhl, 1974 | | Chief Compliance Officer (“CCO”) | | Mr. Uhl was appointed CCO of the Trust at the June 8, 2010 meeting of the Board of Trustees. | | Mr. Uhl joined ALPS in October 2006, and is currently Deputy Compliance Officer of ALPS. Prior to his current role, Mr. Uhl served as Senior Risk Manager for ALPS from October 2006 until June 2010. Before joining ALPS, Mr. Uhl served a Sr. Analyst with Enenbach and Associates (RIA), and a Sr. Financial Analyst at Sprint. Because of his position with ALPS, Mr. Uhl is deemed an affiliate of the Trust as defined under the 1940 Act. Mr. Uhl is also CCO of the Clough Global Funds, Reaves Utility Income Fund, Drexel Hamilton Funds and Transparent Value Trust. |
| * | All communications to Trustees and Officers may be directed to Financial Investors Trust c/o 1290 Broadway, Suite 1100, Denver, CO 80203. |
| ** | This is the period for which the Trustee or Officer began serving the Trust. Each Trustee and/or Officer serves an indefinite term, until his successor is elected. |
| *** | Except as otherwise indicated, each individual has held the office shown or other offices in the same company for the last five years. |
| **** | The Fund Complex includes all series of the Trust, currently 30, and any other investment companies for which any Trustee serves as Trustee for and which ALPS Advisors, Red Rocks, Wellington Management, Clough Capital, CoreCommodity Management, RiverFront or Kotak provides investment advisory services (currently 43 funds, 0 funds, 0 funds, 3 funds, 0 funds, 1 funds and 0 funds, respectively). |
169 | April 30, 2014
| | | | |
| | ANNUAL REPORT | April 30, 2014 | | |
| | The Management Commentaries included in this shareholder report contain certain forward-looking statements about the factors that may affect the performance of the Funds in the future. These statements are based on Fund management’s predictions and expectations concerning certain future events and their expected impact on the Funds, such as performance of the economy as a whole and of specific industry sectors, changes in the levels of interest rates, the impact of developing world events, and other factors that may influence the future performance of the Funds. Management believes these forward-looking statements to be reasonable, although they are inherently uncertain and difficult to predict. Actual events may cause adjustments in portfolio management strategies from those currently expected to be employed. Must be accompanied or preceded by a prospectus. Investors are reminded to read the prospectus carefully before investing. ALPS Portfolio Solutions Distributor, Inc., distributor. ALP000783 | | |
| | |

| | Grandeur Peak Funds® |
TABLE OF CONTENTS
| | |
| Grandeur Peak Funds® | | Shareholder Letter |
April 30, 2014 (Unaudited) |

April 30, 2014
Dear Fellow Investors,
Market Commentary
Destitutus ventis, remos adhibe: “If the wind will not serve, take to the oars.”
Grandeur Peak Global Advisors was launched on July 1, 2011. “The Market” using the Russell Global Index as a proxy is up about 30% since that date. And yet, by the measures that we use to evaluate companies, we don’t think company fundamentals have improved that much. So we’ve had a nice market wind in our sails, but that certainly can’t go on forever. We’re happy to have enjoyed some strong returns since the October 2011 launch of our first mutual funds, but we’ve recently been worried about increasing valuations and are actually hoping the market will take a breather.
So what do we do? As an investment team we have to “take to the oars” and figure out which names we should be rotating to and, to a lesser degree, finding new names. This, of course is easier said than done, but we thought it would be good to go over the process we use so you could get a better understanding of how we attempt to generate returns for our portfolios.
The Grandeur Peak Process of Investing
While there are approximately 10,000 stocks in the Russell Global Index, there are around 30,000 publicly listed companies globally that we consider investible. Our goal is to look at the financials of all 30,000 companies at least twice a year and make a determination as to which of these companies we will add to our research universe. What we’re looking for in these screens is certain characteristics (e.g. growth rates, profitability, cash flow generation, low debt, etc.) that we believe are indicative of high quality companies. We employ a very systematic approach to screening the universe whereby over the course of a 52-week schedule we screen the entire universe at least twice, and hopefully minimize the number of high quality companies that slip through the cracks.
| | |
Annual Report | April 30, 2014 | | 1 |
| | |
| Grandeur Peak Funds® | | Shareholder Letter |
April 30, 2014 (Unaudited) |
For us, a great (high quality) company must also operate in a good business. We look for companies that have plenty of headroom to grow. They typically have a nice opportunity to gain market share and improve profitability as well. Another important characteristic indicative of a great business is a strong and sustainable competitive advantage. We love to see a sticky customer base with steady recurring revenue, a diverse customer base with little risk of revenue drying up if a large customer or two were to leave, and strong bargaining power with suppliers and customers.
The third important aspect of a good company is the motivation, integrity, and skill of the management team. In many cases turning a good business into a great company requires the right management team. This is why we travel so much. We think it’s important to meet management face-to-face and to build a long-term relationship with them to understand the firm’s true potential.
Finally, we make a distinction between good companies and good stocks. Finding a great company is only half the battle. If a great company’s stock isn’t attractively priced, it might not make a very good investment.
After identifying what we believe are high quality companies (i.e. high quality financials, high quality business model, and high quality management team), our investment decisions can be boiled down to a 3D matrix through which we analyze stocks along three key measures: Company Quality (good, better, best), Stock Value (poor, fair, good) and Business Momentum (decelerating, stable, accelerating). When we speak of “momentum” we’re not talking about stock price momentum or technicals, but rather fundamental business momentum—how well the business is doing. Where in the QVM matrix a company currently sits helps us decide when to buy, hold, trim or sell.
Since we launched our first funds 2 1⁄2 years ago we’ve narrowed the universe of 30,000 companies down to around 2,000 companies in our core research universe. We maintain four core lists to keep track of these companies:
| | — | | Owned: Companies we own in one or more of our funds. |
| | — | | Red Hot: Companies that have recently caught our attention because of their numbers. We want to get them deep into our research process as quickly as possible, as this may be a great time to buy before others discover them. |
| | — | | Watch A: Companies we’ve researched and would like to own, however something is currently amiss on the value/momentum continuum so we have not yet purchased. We will watch closely for the right entry point. |
| | — | | Watch B: Companies we’ve researched and found them to still be maturing and not yet ready for purchase, but they could be one day. We will revisit regularly to see how they are progressing. |
We have three other lists that we also maintain to help us keep an eye on other companies:
| | — | | Hot: Companies that we are just getting to know. They have interesting numbers so we want to get them into our research process within a few months, but they are less of a priority than the Red Hot names. |
| | |
| 2 | | 1.855.377.7325 | www.GrandeurPeakGlobal.com |
| | |
| Grandeur Peak Funds® | | Shareholder Letter |
April 30, 2014 (Unaudited) |
| | — | | Blue-chip: High quality larger cap companies that we know and follow, often as competitors to our smaller companies. At times we may own them, but they are typically more efficiently priced with less compelling growth opportunities. |
| | — | | Watch C: Companies we’ve researched and have decided to pass on due to quality. We will still keep an eye on them as they can provide good learning for us as well. |
Perhaps our biggest disappointment is when we let an opportunity slip through the cracks. At the start of 2014 we had 139 companies on our Red Hot list. There were 23 of these stocks that were up over 20% during the first quarter, with the best stock up almost 110%. These are the ones that, for the short term anyway, may have gotten away. However, there were 61 companies on our red hot list that were down during the quarter, so if our initial research is favorable on these companies we may have a good buying opportunity.
Perhaps more interesting is our Watch A list. Of the 420 names on this list, 195 were down during the first quarter of 2014. Meanwhile, 78 of the companies we own in the portfolios were up over 20% for the quarter, so our Watch A list gives us candidates with which to refresh the portfolios. Consequently, even though we’re pretty worried about the current state of valuations given moderate company fundamentals/momentum, we’re taking to the oars and rowing hard to try to build interesting portfolios at justified valuations.
Portfolio Performance
For the fiscal year ended April 30, 2014, the Global Opportunities Fund – Investor Class was up 24.31%, vs 14.24% for the Russell Global Small Cap Index, and the International Opportunities Fund – Investor Class was up 24.59%, vs 10.68% for the Russell Global ex-U.S. Small Cap Index. The Global Reach Fund – Investor Class was launched less than a year ago (June 19, 2013), but since inception it was up 25.31%, vs 14.92% for the Russell Global Small Cap Index. Similarly, the Emerging Markets Opportunities Fund – Investor Class was launched just over 4 months ago and increased 5.30%, vs 4.99% for the Russell Emerging Markets Small Cap Index. Please see pages 6, 8, 10 and 12, respectively, for full standardized performance of the Funds.
Our process all starts with our “umbrella” Global Reach Fund. The focus we’ve put on making sure each industry team is working well seems to be showing up in the Global Reach Fund’s recent performance. Hats off to the entire team here. We’re also off to a decent start with the Emerging Markets Opportunities Fund. The first four months were a tough and volatile period for emerging markets, but Spencer Stewart and Blake Walker, with help from Zach Larkin, have been rowing hard.
We’re frankly less happy with the Global Opportunities and International Opportunities Funds as of late. Both funds had a good fiscal year, which is great, but the obvious question is why they have lagged the Reach portfolio by so much in the first four months of 2014? I think there is a combination of factors: 1) our highest conviction stocks (the ones held in the Opportunities Funds) have performed really well over the past three years, and although we do look to rotate our portfolio based on value, we are not heavy traders in our favorite long-term names, 2) we have had an abnormal amount of noise in some of our high conviction names due to the Russian invasion of Ukraine, a food safety allegation, a bribery allegation, a China regulatory issue, and several short attacks, and 3) we, as the PMs of Global and International Opportunities, could do better. I feel like we may not be reacting quickly enough to our industry teams. The good news is that this is fixable, and as the industry teams continue to improve on the process we should be able to refine our focus on these two funds.
| | |
Annual Report | April 30, 2014 | | 3 |
| | |
| Grandeur Peak Funds® | | Shareholder Letter |
April 30, 2014 (Unaudited) |
On the year, we had a fairly balanced mix of tailwinds and headwinds by sector and country, but ultimately the bulk of our outperformance came from stock picking. We did quite well in the IT, health care, industrials, and financial sectors, but we had a few companies hurt us in the consumer sector. Energy & materials continued to be any area of significant underweight, although our picks there outperformed. Our weakest region was Africa/Middle East, but our weight there was quite small. Meanwhile, we had a great year in Asia/Pacific, and also picked up nice gains in Western Europe.
Our focus remains at the company level, not on sectors or countries. In our global funds we’ve seen a shift over the last several quarters towards higher weights in emerging markets. This is not a macro call, in fact, from a macro standpoint we think we may be early on this rotation, but we are simply finding a greater number of interesting companies at reasonable valuations in these countries right now. Looking out five years we believe we will look back in hindsight and say these were good investments, but there is greater near-term uncertainty on how the markets will view them.
Business Update
We now have roughly $2.1 billion under management as a firm. Frankly we’re a little surprised to have reached this level in less than three years. Earlier this year we made the tough decision to hard close the Global Opportunities and International Opportunities Funds. We also soft closed the Emerging Markets Opportunities Fund and the Global Reach Fund. We know it’s frustrating to clients for us to close our funds, but we really do believe it’s in the best interest of our existing shareholders. We committed to this from day one and we’re following through.
We feel like this level of assets is a nice spot—big enough, but not too big. Our size affords us resources we wouldn’t have otherwise. We’ve built out our team a little, and we are investing in the business (e.g. upgrading our trading system). For the balance of 2014 our priorities are: 1) seeking to maintain the highest quality portfolios, 2) investing in our team and tools, 3) continuing our focus on the back-end of our research process, and 4) taking care of our existing clients.
Thank you for your continued trust.
Sincerely,
| | |
Robert Gardiner | | Blake Walker |
| Chief Executive Officer & Portfolio Manager | | Chief Investment Officer & Portfolio Manager |
The objective of all Grandeur Peak Funds is long-term growth of capital.
RISKS: Mutual fund investing involves risks and loss of principal is possible. Investing in small and micro cap funds will be more volatile and loss of principal could be greater than investing in large cap or more diversified funds. Investing in foreign securities entails special risks, such as currency fluctuations and political uncertainties, which are described in more detail in the prospectus. Investments in emerging markets are subject to the same risks as other foreign securities and may be subject to greater risks than investments in foreign countries with more established economies and securities markets.
An investor should consider investment objectives, risks, charges, and expenses carefully before investing. To obtain a Grandeur Peak Funds prospectus, containing this and other information, visit www.grandeurpeakglobal.com or call 1-855-377-PEAK (7325). Please read it carefully before investing.
| | |
| 4 | | 1.855.377.7325 | www.GrandeurPeakGlobal.com |
| | |
| Grandeur Peak Funds® | | Shareholder Letter |
April 30, 2014 (Unaudited) |
The views and information discussed in this commentary are as of the date of publication, are subject to change, and may not reflect the writer’s current views. The views expressed represent an assessment of market conditions at a specific point in time, are opinions only and should not be relied upon as investment advice regarding a particular investment or markets in general. Such information does not constitute a recommendation to buy or sell specific securities or investment vehicles. It should not be assumed that any investment will be profitable or will equal the performance of the Funds or any securities or any sectors mentioned herein. The subject matter contained herein has been derived from several sources believed to be reliable and accurate at the time of compilation. Grandeur Peak Global Advisors, LLC does not accept any liability for losses either direct or consequential caused by the use of this information. Past performance does not guarantee future results.
CFA® is trademark owned by CFA Institute.
ALPS Distributors, Inc. is the Distributor for the Grandeur Peak Funds.
| | |
Annual Report | April 30, 2014 | | 5 |
| | |
| Grandeur Peak Emerging Markets Opportunities Fund | | Performance Update |
April 30, 2014 (Unaudited) |
Cumulative Total Return Performance for the periods ended April 30, 2014
| | | | | | | | | | | | | | | | |
| | | Calendar | | | Since | | | Expense Ratio | |
| | | YTD | | | Inception(a) | | | Gross | | | Net(b) | |
Grandeur Peak Emerging Markets
Opportunities Fund – Investor (GPEOX) | | | 4.36% | | | | 5.30% | | | | 2.01% | | | | 1.95% | |
Grandeur Peak Emerging Markets
Opportunities Fund – Institutional (GPEIX) | | | 4.46% | | | | 5.40% | | | | 1.76% | | | | 1.70% | |
Russell Emerging Markets Small Cap Index(c) | | | 3.02% | | | | 4.99% | | | | | | | | | |
| (a) | Fund inception date of October 17, 2011. |
| (b) | Grandeur Peak Global Advisors, LLC (the “Adviser”), has agreed to waive and/or reimburse fees or expenses in order to limit Total Annual Fund Operating Expenses After Fee Waiver/Expense Reimbursement (excluding acquired fund fees and expenses, brokerage expenses, interest expenses, taxes and extraordinary expenses) to 1.95% of the Fund’s average daily net assets for the Investor Class and 1.70% of the Fund’s average daily net assets for the Institutional Class. This agreement is in effect through August 31, 2014. The Fund may have to repay some of these waivers and reimbursements to the Adviser in the following three years. This agreement may not be terminated or modified prior to this date except with the approval of the Fund’s Board of Trustees. |
| (c) | The Russell Emerging Markets Small Cap Index seeks to measure the performance of the small-cap equity universe of emerging countries. The index is not actively managed and does not reflect any deductions for fees, expense, or taxes. An investor may not invest directly in an index. |
Returns for periods greater than 1 year are annualized.
The returns shown above do not reflect the deduction of taxes a shareholder would pay on Fund distributions or redemption of Fund shares.
Performance data quoted represents past performance. Past performance does not guarantee future results. Investment return and principal value of an investment will fluctuate so that an investor’s shares, when sold or redeemed, may be worth more or less than the original cost. Current performance data may be higher or lower than actual data quoted. For the most current month-end performance data, please call 1-855-377-PEAK (7325).
Growth of $10,000 for the period ended April 30, 2014
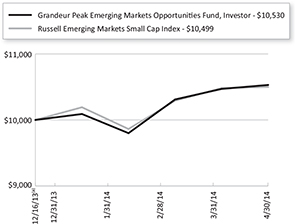
| | |
| 6 | | 1.855.377.7325 | www.GrandeurPeakGlobal.com |
| | |
| Grandeur Peak Emerging Markets Opportunities Fund | | Performance Update |
April 30, 2014 (Unaudited) |
The graphs shown above represent a hypothetical investment of $10,000 in the Fund’s Investor Class shares for the period from inception to 4/30/2014. All returns reflect reinvested dividends, but do not reflect the deduction of taxes that an investor would pay on distributions or redemptions.
The Fund also offers Institutional Class shares, performance for which is not reflected in the graphs above. The performance of Institutional Class shares may be higher or lower than the performance of the Investor Class shares shown in the graphs above based upon differences in fees paid by shareholders investing in the Investor Class shares and Institutional Class shares.
| | | | |
Regional Allocation (as a % of Net Assets)* | |
Asia ex Japan | | | 76.5% | |
Latin America | | | 8.7% | |
Africa/Middle East | | | 7.4% | |
Europe | | | 2.5% | |
North America | | | 1.9% | |
Cash, Cash Equivalents, & Other Net Assets | | | 3.0% | |
Total | | | 100.0% | |
| |
Industry Sector Allocation (as a % of Net Assets)* | | | | |
Technology | | | 21.6% | |
Industrials | | | 21.1% | |
Consumer | | | 20.2% | |
Financials | | | 17.1% | |
Health Care | | | 10.4% | |
Energy & Materials | | | 6.6% | |
Cash, Cash Equivalents, & Other Net Assets | | | 3.0% | |
Total | | | 100.0% | |
| |
Top 10 Holdings (as a % of Net Assets)* | | | | |
Man Wah Holdings, Ltd. | | | 2.8% | |
CETIP SA - Mercados Organizados | | | 1.7% | |
SPT Energy Group, Inc. | | | 1.6% | |
Value Partners Group, Ltd. | | | 1.5% | |
Hy-Lok Corp. | | | 1.4% | |
KONA@I Co., Ltd. | | | 1.4% | |
Voltronic Power Technology Corp. | | | 1.3% | |
Pepsi-Cola Products Philippines, Inc. | | | 1.2% | |
Cleanaway Co., Ltd. | | | 1.2% | |
Sinmag Equipment Corp. | | | 1.1% | |
Total | | | 15.2% | |
| * | Holdings are subject to change. Tables present indicative values only. |
| | |
Annual Report | April 30, 2014 | | 7 |
| | |
| Grandeur Peak Global Opportunities Fund | | Performance Update |
April 30, 2014 (Unaudited) |
Cumulative Total Return Performance for the periods ended April 30, 2014
| | | | | | | | | | | | | | |
| | | | | Calendar | | Since | | Expense Ratio | |
| | | 6 months | | YTD | | Inception(a) | | Gross | | | Net(b) | |
Grandeur Peak Global Opportunities
Fund – Investor (GPGOX) | | 4.98% | | 0.61% | | 24.87% | | | 1.68% | | | | 1.68% | |
Grandeur Peak Global Opportunities
Fund – Institutional (GPGIX) | | 5.40% | | 0.91% | | 25.43% | | | 1.44% | | | | 1.44% | |
Russell Global Small Cap Index(c) | | 3.80% | | 0.73% | | 16.93% | | | | | | | | |
Russell Global Index(d) | | 5.63% | | 2.23% | | 17.41% | | | | | | | | |
| (a) | Fund inception date of October 17, 2011. |
| (b) | Grandeur Peak Global Advisors, LLC (the “Adviser”), has agreed to waive and/or reimburse fees or expenses in order to limit Total Annual Fund Operating Expenses After Fee Waiver/Expense Reimbursement (excluding acquired fund fees and expenses, brokerage expenses, interest expenses, taxes and extraordinary expenses) to 1.75% of the Fund’s average daily net assets for the Investor Class and 1.50% of the Fund’s average daily net assets for the Institutional Class. This agreement is in effect through August 31, 2014. The Fund may have to repay some of these waivers and reimbursements to the Adviser in the following three years. This agreement may not be terminated or modified prior to this date except with the approval of the Fund’s Board of Trustees. |
| (c) | The Russell Global Small Cap Index seeks to measure the performance of the small-cap segment of the global equity universe. The index is not actively managed and does not reflect any deductions for fees, expense, or taxes. An investor may not invest directly in an index. |
| (d) | The Russell Global Index seeks to measure the performance of the global equity universe. The index is not actively managed and does not reflect any deductions for fees, expense, or taxes. An investor may not invest directly in an index. |
Returns for periods greater than 1 year are annualized.
The returns shown above do not reflect the deduction of taxes a shareholder would pay on Fund distributions or redemption of Fund shares.
Performance data quoted represents past performance. Past performance does not guarantee future results. Investment return and principal value of an investment will fluctuate so that an investor’s shares, when sold or redeemed, may be worth more or less than the original cost. Current performance data may be higher or lower than actual data quoted. For the most current month-end performance data, please call 1-855-377-PEAK (7325).
| | |
| 8 | | 1.855.377.7325 | www.GrandeurPeakGlobal.com |
| | |
| Grandeur Peak Global Opportunities Fund | | Performance Update |
April 30, 2014 (Unaudited) |
Growth of $10,000 for the period ended April 30, 2014
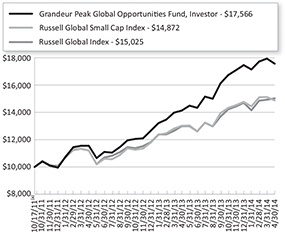
The graphs shown above represent a hypothetical investment of $10,000 in the Fund’s Investor Class shares for the period from inception to 4/30/2014. All returns reflect reinvested dividends, but do not reflect the deduction of taxes that an investor would pay on distributions or redemptions.
The Fund also offers Institutional Class shares, performance for which is not reflected in the graphs above. The performance of Institutional Class shares may be higher or lower than the performance of the Investor Class shares shown in the graphs above based upon differences in fees paid by shareholders investing in the Investor Class shares and Institutional Class shares.
| | | | |
Regional Allocation (as a % of Net Assets)* | | | | |
North America | | | 32.8% | |
Asia ex Japan | | | 28.6% | |
Europe | | | 20.9% | |
Latin America | | | 5.1% | |
Japan | | | 3.9% | |
Australia/New Zealand | | | 3.2% | |
Africa/Middle East | | | 1.5% | |
Cash, Cash Equivalents, & Other Net Assets | | | 4.0% | |
Total | | | 100.0% | |
| |
Industry Sector Allocation (as a % of Net Assets)* | | | | |
Technology | | | 24.8% | |
Industrials | | | 22.2% | |
Financials | | | 20.7% | |
Consumer | | | 12.1% | |
Health Care | | | 11.1% | |
Energy & Materials | | | 5.1% | |
Cash, Cash Equivalents, & Other Net Assets | | | 4.0% | |
Total | | | 100.0% | |
| | |
Annual Report | April 30, 2014 | | 9 |
| | |
| Grandeur Peak Global Opportunities Fund | | Performance Update |
April 30, 2014 (Unaudited) |
| | | | |
Top 10 Holdings (as a % of Net Assets)* | | | | |
First Republic Bank | | | 2.7% | |
Magellan Financial Group, Ltd. | | | 2.2% | |
Roadrunner Transportation Systems, Inc. | | | 2.1% | |
RPS Group PLC | | | 1.7% | |
Melexis NV | | | 1.6% | |
Clinigen Group PLC | | | 1.6% | |
Universal Truckload Services, Inc. | | | 1.3% | |
CETIP SA - Mercados Organizados | | | 1.3% | |
Hy-Lok Corp. | | | 1.1% | |
Man Wah Holdings, Ltd. | | | 1.0% | |
Total | | | 16.6% | |
| * | Holdings are subject to change. Tables present indicative values only. |
| | |
| 10 | | 1.855.377.7325 | www.GrandeurPeakGlobal.com |
| | |
| Grandeur Peak Global Reach Fund | | Performance Update |
April 30, 2014 (Unaudited) |
Cumulative Total Return Performance for the periods ended April 30, 2014
| | | | | | | | | | | | | | |
| | | | | Calendar | | Since | | Expense Ratio | |
| | | 6 months | | YTD | | Inception(a) | | Gross | | | Net(b) | |
Grandeur Peak Global Reach
Fund – Investor (GPROX) | | 9.06% | | 4.90% | | 25.31% | | | 1.91% | | | | 1.60% | |
Grandeur Peak Global Reach
Fund – Institutional (GPRIX) | | 9.28% | | 4.99% | | 25.45% | | | 1.75% | | | | 1.35% | |
Russell Global Small Cap Index(c) | | 3.80% | | 0.73% | | 14.92% | | | | | | | | |
Russell Global Index(d) | | 5.63% | | 2.23% | | 16.20% | | | | | | | | |
| (a) | Fund inception date of June 19, 2013. |
| (b) | Grandeur Peak Global Advisors, LLC (the “Adviser”), has agreed to waive and/or reimburse fees or expenses in order to limit Total Annual Fund Operating Expenses After Fee Waiver/Expense Reimbursement (excluding acquired fund fees and expenses, brokerage expenses, interest expenses, taxes and extraordinary expenses) to 1.60% of the Fund’s average daily net assets for the Investor Class and 1.35% of the Fund’s average daily net assets for the Institutional Class. This agreement is in effect through August 31, 2014. The Fund may have to repay some of these waivers and reimbursements to the Adviser in the following three years. This agreement may not be terminated or modified prior to this date except with the approval of the Fund’s Board of Trustees. |
| (c) | The Russell Global Small Cap Index seeks to measure the performance of the small-cap segment of the global equity universe. The index is not actively managed and does not reflect any deductions for fees, expense, or taxes. An investor may not invest directly in an index. |
| (d) | The Russell Global Index seeks to measure the performance of the global equity universe. The index is not actively managed and does not reflect any deductions for fees, expense, or taxes. An investor may not invest directly in an index. |
Returns for periods greater than 1 year are annualized.
The returns shown above do not reflect the deduction of taxes a shareholder would pay on Fund distributions or redemption of Fund shares.
Performance data quoted represents past performance. Past performance does not guarantee future results. Investment return and principal value of an investment will fluctuate so that an investor’s shares, when sold or redeemed, may be worth more or less than the original cost. Current performance data may be higher or lower than actual data quoted. For the most current month-end performance data, please call 1-855-377-PEAK (7325).
| | |
Annual Report | April 30, 2014 | | 11 |
| | |
| Grandeur Peak Global Reach Fund | | Performance Update |
April 30, 2014 (Unaudited) |
Growth of $10,000 for the period ended April 30, 2014
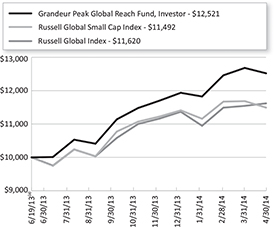
The graphs shown above represent a hypothetical investment of $10,000 in the Fund’s Investor Class shares for the period from inception to 4/30/2014. All returns reflect reinvested dividends, but do not reflect the deduction of taxes that an investor would pay on distributions or redemptions.
The Fund also offers Institutional Class shares, performance for which is not reflected in the graphs above. The performance of Institutional Class shares may be higher or lower than the performance of the Investor Class shares shown in the graphs above based upon differences in fees paid by shareholders investing in the Investor Class shares and Institutional Class shares.
| | | | |
Regional Allocation (as a % of Net Assets)* | |
Asia ex Japan | | | 32.2% | |
North America | | | 24.4% | |
Europe | | | 16.1% | |
Japan | | | 5.2% | |
Latin America | | | 4.0% | |
Africa/Middle East | | | 3.8% | |
Australia/New Zealand | | | 2.3% | |
Cash, Cash Equivalents, & Other Net Assets | | | 12.0% | |
Total | | | 100.0% | |
| |
Industry Sector Allocation (as a % of Net Assets)* | | | | |
Industrials | | | 20.2% | |
Financials | | | 18.1% | |
Technology | | | 17.7% | |
Consumer | | | 16.4% | |
Health Care | | | 11.6% | |
Energy & Materials | | | 4.0% | |
Cash, Cash Equivalents, & Other Net Assets | | | 12.0% | |
Total | | | 100.0% | |
| | |
| 12 | | 1.855.377.7325 | www.GrandeurPeakGlobal.com |
| | |
| Grandeur Peak Global Reach Fund | | Performance Update |
April 30, 2014 (Unaudited) |
| | | | |
Top 10 Holdings (as a % of Net Assets)* | |
Roadrunner Transportation Systems, Inc. | | | 2.0% | |
Magellan Financial Group, Ltd. | | | 1.6% | |
First Republic Bank | | | 1.6% | |
Man Wah Holdings, Ltd. | | | 1.2% | |
Petra Foods, Ltd. | | | 1.2% | |
Shaklee Global Group, Inc. | | | 1.0% | |
Wesco Aircraft Holdings, Inc. | | | 0.8% | |
Hy-Lok Corp. | | | 0.8% | |
China Medical System Holdings, Ltd. | | | 0.8% | |
CETIP SA - Mercados Organizados | | | 0.8% | |
Total | | | 11.8% | |
| * | Holdings are subject to change. Tables present indicative values only. |
| | |
Annual Report | April 30, 2014 | | 13 |
| | |
| Grandeur Peak International Opportunities Fund | | Performance Update |
| | April 30, 2014 (Unaudited) |
Cumulative Total Return Performance for the periods ended April 30, 2014
| | | | | | | | | | |
| | | | | Calendar | | Since | | Expense Ratio |
| | | 6 months | | YTD | | Inception(a) | | Gross | | Net(b) |
Grandeur Peak International Opportunities Fund – Investor (GPIOX) | | 8.15% | | 4.28% | | 25.44% | | 1.73% | | 1.73% |
Grandeur Peak International Opportunities Fund – Institutional (GPIIX) | | 8.30% | | 4.27% | | 25.70% | | 1.46% | | 1.46% |
Russell Global ex-U.S. Small Cap Index(c) | | 4.24% | | 3.07% | | 13.57% | | | | |
| (a) | Fund inception date of October 17, 2011. |
| (b) | Grandeur Peak Global Advisors, LLC (the “Adviser”),has agreed to waive and/or reimburse fees or expenses in order to limit Total Annual Fund Operating Expenses After Fee Waiver/Expense Reimbursement (excluding acquired fund fees and expenses, brokerage expenses, interest expenses, taxes and extraordinary expenses) to 1.75% of the Fund’s average daily net assets for the Investor Class and 1.50% of the Fund’s average daily net assets for the Institutional Class. This agreement is in effect through August 31, 2014. The Fund may have to repay some of these waivers and reimbursements to the Adviser in the following three years. This agreement may not be terminated or modified prior to this date except with the approval of the Fund’s Board of Trustees. |
| (c) | The Russell Global ex-U.S. Small Cap Index seeks to measure the performance of the small-cap segment of the global equity universe, excluding companies assigned to the United States. The index is not actively managed and does not reflect any deductions for fees, expense, or taxes. An investor may not invest directly in an index. |
Returns for periods greater than 1 year are annualized.
The returns shown above do not reflect the deduction of taxes a shareholder would pay on Fund distributions or redemption of Fund shares.
Performance data quoted represents past performance. Past performance does not guarantee future results. Investment return and principal value of an investment will fluctuate so that an investor’s shares, when sold or redeemed, may be worth more or less than the original cost. Current performance data may be higher or lower than actual data quoted. For the most current month-end performance data, please call 1-855-377-PEAK (7325).
Growth of $10,000 for the period ended April 30, 2014
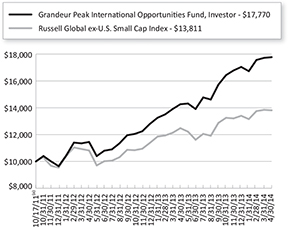
| | |
| 14 | | 1.855.377.7325 | www.GrandeurPeakGlobal.com |
| | |
| Grandeur Peak International Opportunities Fund | | Performance Update |
April 30, 2014 (Unaudited) |
The graphs shown above represent a hypothetical investment of $10,000 in the Fund’s Investor Class shares for the period from inception to 4/30/2014. All returns reflect reinvested dividends, but do not reflect the deduction of taxes that an investor would pay on distributions or redemptions.
The Fund also offers Institutional Class shares, performance for which is not reflected in the graphs above. The performance of Institutional Class shares may be higher or lower than the performance of the Investor Class shares shown in the graphs above based upon differences in fees paid by shareholders investing in the Investor Class shares and Institutional Class shares.
| | | | |
Regional Allocation (as a % of Net Assets)* | |
Asia ex Japan | | | 39.5% | |
Europe | | | 26.8% | |
Japan | | | 5.9% | |
Latin America | | | 5.8% | |
North America | | | 4.4% | |
Africa/Middle East | | | 3.5% | |
Australia/New Zealand | | | 3.3% | |
Cash, Cash Equivalents, & Other Net Assets | | | 10.8% | |
Total | | | 100.0% | |
| |
Industry Sector Allocation (as a % of Net Assets)* | | | | |
Industrials | | | 21.0% | |
Technology | | | 19.6% | |
Financials | | | 16.5% | |
Consumer | | | 15.9% | |
Health Care | | | 10.8% | |
Energy & Materials | | | 5.4% | |
Cash, Cash Equivalents, & Other Net Assets | | | 10.8% | |
Total | | | 100.0% | |
| |
Top 10 Holdings (as a % of Net Assets)* | | | | |
Magellan Financial Group, Ltd. | | | 2.1% | |
RPS Group PLC | | | 1.7% | |
Melexis NV | | | 1.6% | |
Clinigen Group PLC | | | 1.5% | |
CETIP SA - Mercados Organizados | | | 1.5% | |
Home Capital Group, Inc. | | | 1.4% | |
Hy-Lok Corp. | | | 1.4% | |
China Medical System Holdings, Ltd. | | | 1.3% | |
Trancom Co., Ltd. | | | 1.1% | |
Man Wah Holdings, Ltd. | | | 1.1% | |
Total | | | 14.7% | |
| * | Holdings are subject to change. Tables present indicative values only. |
| | |
Annual Report | April 30, 2014 | | 15 |
| | |
| Grandeur Peak Funds® | | Disclosure of Fund Expenses |
| | April 30, 2014 (Unaudited) |
As a shareholder of a Fund, you incur two types of costs: direct costs, such as short-term redemption fees and wire fees, and indirect costs, including management fees, and other fund operating expenses. This example is intended to help you understand your indirect costs, also referred to as “ongoing costs” (in dollars), of investing in the Fund and to compare these costs with the ongoing costs of investing in other mutual funds.
This example is based on an investment of $1,000 invested at the beginning of the period and held for the entire six-month period of November 1, 2013 through April 30, 2014.
Actual Expenses The first line of the table below provides information about actual account values and actual expenses. You may use the information in this line, together with the amount you invested at the beginning of the period, to estimate the expenses that you paid over the period. Simply divide your account value by $1,000 (for example, an $8,600 account value divided by $1,000 = 8.6), then multiply the result by the number in the first line under the heading “Expenses Paid During Period” to estimate the expenses you paid on your account during this period.
Hypothetical Example for Comparison Purposes The second line of the table provides information about hypothetical account values and hypothetical expenses based on the Fund’s actual expense ratio and an assumed rate of return of 5% per year before expenses, which is not the Fund’s actual return. The hypothetical account values and expenses may not be used to estimate the actual ending account balance or expenses you paid for the period. You may use this information to compare ongoing costs of investing in the Fund and other funds. To do so, compare this 5% hypothetical example with the 5% hypothetical examples that appear in the shareholder reports of other funds.
Please note that the expenses shown in the table are meant to highlight your ongoing costs only and do not reflect any direct costs, such as wire fees or low balance fees. Therefore, the second line of the table is useful in comparing ongoing costs only and will not help you determine the relative total costs of owning different funds. In addition, if these direct costs were included, your costs would be higher.
| | | | | | | | |
| | | Beginning Account
Value November 1, 2013 | | Ending Account
Value April 30, 2014 | | Expense Ratio(a) | | Expenses Paid During period November 1, 2013 - April 30, 2014(b) |
Grandeur Peak Emerging Markets Opportunities Fund | | |
Institutional Class(c) | | | | | | | | |
Actual | | $ 1,000.00 | | $ 1,054.00 | | 1.70% | | $ 6.46 |
Hypothetical
(5% return before expenses) | | $ 1,000.00 | | $ 1,016.36 | | 1.70% | | $ 8.50 |
Investor Class(c) | | | | | | | | |
Actual | | $ 1,000.00 | | $ 1,053.00 | | 1.95% | | $ 7.40 |
Hypothetical
(5% return before expenses) | | $ 1,000.00 | | $ 1,015.12 | | 1.95% | | $ 9.74 |
| | |
| 16 | | 1.855.377.7325 | www.GrandeurPeakGlobal.com |
| | |
| Grandeur Peak Funds® | | Disclosure of Fund Expenses |
April 30, 2014 (Unaudited) |
| | | | | | | | |
| | | Beginning Account Value November 1, 2013 | | Ending Account Value April 30, 2014 | | Expense Ratio(a) | | Expenses Paid During period November 1, 2013 -
April 30, 2014(b) |
Grandeur Peak Global Opportunities Fund | | | | |
Institutional Class | | | | | | | | |
Actual | | $ 1,000.00 | | $ 1,054.00 | | 1.40% | | $ 7.13 |
Hypothetical
(5% return before expenses) | | $ 1,000.00 | | $ 1,017.85 | | 1.40% | | $ 7.00 |
Investor Class | | | | | | | | |
Actual | | $ 1,000.00 | | $ 1,049.80 | | 1.65% | | $ 8.39 |
Hypothetical
(5% return before expenses) | | $ 1,000.00 | | $ 1,016.61 | | 1.65% | | $ 8.25 |
Grandeur Peak Global Reach Fund | | | | |
Institutional Class | | | | | | | | |
Actual | | $ 1,000.00 | | $ 1,092.80 | | 1.35% | | $ 7.01 |
Hypothetical
(5% return before expenses) | | $ 1,000.00 | | $ 1,018.10 | | 1.35% | | $ 6.76 |
Investor Class | | | | | | | | |
Actual | | $ 1,000.00 | | $ 1,090.60 | | 1.60% | | $ 8.29 |
Hypothetical
(5% return before expenses) | | $ 1,000.00 | | $ 1,016.86 | | 1.60% | | $ 8.00 |
Grandeur Peak International Opportunities Fund | | | | |
Institutional Class | | | | | | | | |
Actual | | $ 1,000.00 | | $ 1,083.00 | | 1.44% | | $ 7.44 |
Hypothetical
(5% return before expenses) | | $ 1,000.00 | | $ 1,017.65 | | 1.44% | | $ 7.20 |
Investor Class | | | | | | | | |
Actual | | $ 1,000.00 | | $ 1,081.50 | | 1.71% | | $ 8.83 |
Hypothetical
(5% return before expenses) | | $ 1,000.00 | | $ 1,016.31 | | 1.71% | | $ 8.55 |
| (a) | The Fund’s expense ratios have been annualized based on the Fund’s most recent fiscal half-year expenses. |
| (b) | Expenses are equal to the Fund’s annualized expense ratio multiplied by the average account value over the period, multiplied by the number of days in the most recent fiscal half-year 181/365 (to reflect the half-year period). |
| (c) | The Grandeur Peak Emerging Markets Opportunities Fund’s inception date is December 16, 2013. |
| | |
Annual Report | April 30, 2014 | | 17 |
| | |
| Grandeur Peak Emerging Markets Opportunities Fund | | Portfolio of Investments |
April 30, 2014 |
| | | | | | | | |
| | | | | | Value | |
| | | Shares | | | (Note 2) | |
| |
COMMON STOCKS (96.47%) | | | | | | | | |
Brazil (6.07%) | | | | | | | | |
Abril Educacao SA | | | 56,400 | | | $ | 720,888 | |
Banco Daycoval SA | | | 555,937 | | | | 2,243,943 | |
CETIP SA - Mercados Organizados | | | 374,100 | | | | 4,743,046 | |
Cia de Locacao das Americas | | | 749,800 | | | | 971,823 | |
Even Construtora e Incorporadora SA | | | 228,700 | | | | 743,615 | |
Odontoprev SA | | | 356,700 | | | | 1,439,758 | |
Raia Drogasil SA | | | 90,200 | | | | 773,461 | |
Tegma Gestao Logistica | | | 273,500 | | | | 2,304,772 | |
Totvs SA | | | 66,400 | | | | 1,089,618 | |
Valid Solucoes SA | | | 143,300 | | | | 2,208,867 | |
| | | | | | | | |
| | | | | | | 17,239,791 | |
| | | | | | | | |
| | |
China (16.26%) | | | | | | | | |
51job, Inc., ADR(a) | | | 14,800 | | | | 998,112 | |
AAC Technologies Holdings, Inc. | | | 141,000 | | | | 787,481 | |
Bolina Holding Co., Ltd. | | | 3,997,000 | | | | 1,443,528 | |
China Animal Healthcare, Ltd.(a) | | | 1,642,000 | | | | 1,071,659 | |
China Biologic Products, Inc.(a) | | | 20,639 | | | | 754,355 | |
China Lesso Group Holdings, Ltd. | | | 2,528,000 | | | | 1,343,406 | |
China Medical System Holdings, Ltd. | | | 1,901,000 | | | | 2,250,908 | |
China Pioneer Pharma Holdings, Ltd.(a) | | | 2,391,000 | | | | 1,279,855 | |
China Shineway Pharmaceutical Group, Ltd. | | | 823,000 | | | | 1,441,560 | |
Credit China Holdings, Ltd. | | | 1,900,000 | | | | 325,940 | |
Ctrip.com International, Ltd., ADR(a) | | | 6,200 | | | | 289,788 | |
Dongpeng Holdings Co., Ltd.(a) | | | 7,141,000 | | | | 2,938,209 | |
Far East Horizon, Ltd. | | | 4,278,500 | | | | 2,897,236 | |
Freetech Road Recycling Technology Holdings, Ltd.(a) | | | 4,914,200 | | | | 1,248,683 | |
Labixiaoxin Snacks Group, Ltd.(b) | | | 8,214,000 | | | | 2,701,643 | |
Le Saunda Holdings, Ltd. | | | 1,792,000 | | | | 855,210 | |
Man Wah Holdings, Ltd. | | | 4,791,300 | | | | 7,848,562 | |
Mindray Medical International, Ltd., ADR | | | 53,800 | | | | 1,778,628 | |
Montage Technology Group, Ltd.(a) | | | 122,420 | | | | 2,545,112 | |
Noah Holdings, Ltd., Sponsored ADR(a) | | | 76,200 | | | | 1,025,652 | |
O2Micro International, Ltd., ADR(a) | | | 222,200 | | | | 799,920 | |
Phoenix New Media, Ltd., ADR(a) | | | 98,100 | | | | 907,425 | |
Sihuan Pharmaceutical Holdings Group, Ltd. | | | 951,000 | | | | 1,047,542 | |
SPT Energy Group, Inc. | | | 8,331,000 | | | | 4,523,892 | |
Tao Heung Holdings, Ltd. | | | 797,000 | | | | 510,914 | |
See Notes to Financial Statements.
| | |
| 18 | | 1.855.377.7325 | www.GrandeurPeakGlobal.com |
| | |
| Grandeur Peak Emerging Markets Opportunities Fund | | Portfolio of Investments |
April 30, 2014 |
| | | | | | | | |
| | | Shares | | | Value (Note 2) | |
| |
China (continued) | | | | | | | | |
Tsui Wah Holdings, Ltd. | | | 2,066,000 | | | $ | 1,049,928 | |
WuXi PharmaTech Cayman, Inc., ADR(a) | | | 43,850 | | | | 1,490 ,900 | |
| | | | | | | | |
| | | | | | | 46,156,048 | |
| | | | | | | | |
| | |
Colombia (2.09%) | | | | | | | | |
Gran Tierra Energy, Inc.(a) | | | 393,200 | | | | 2,811,380 | |
Parex Resources, Inc.(a) | | | 310,900 | | | | 3,108,858 | |
| | | | | | | | |
| | | | | | | 5,920,238 | |
| | | | | | | | |
| | |
Georgia (0.54%) | | | | | | | | |
Bank of Georgia Holdings PLC | | | 35,090 | | | | 1,542,164 | |
| | | | | | | | |
| | |
Greece (0.47%) | | | | | | | | |
Sarantis SA | | | 136,400 | | | | 1,343,563 | |
| | | | | | | | |
| | |
Hong Kong (3.44%) | | | | | | | | |
ASR Holdings, Ltd. | | | 10,197,500 | | | | 1,723,051 | |
China South City Holdings, Ltd. | | | 2,263,000 | | | | 945,720 | |
Playmates Toys, Ltd.(a) | | | 3,528,000 | | | | 1,483,471 | |
Value Partners Group, Ltd. | | | 6,693,800 | | | | 4,299,670 | |
Vitasoy International Holdings, Ltd. | | | 955,900 | | | | 1,309,393 | |
| | | | | | | | |
| | | | | | | 9,761,305 | |
| | | | | | | | |
| | |
India (13.41%) | | | | | | | | |
Accelya Kale Solutions, Ltd. | | | 80,381 | | | | 1,017,640 | |
Agro Tech Foods, Ltd. | | | 87,700 | | | | 709,350 | |
AIA Engineering, Ltd. | | | 109,750 | | | | 1,098,228 | |
Ajanta Pharma, Ltd. | | | 79,804 | | | | 1,313,131 | |
Allahabad Bank | | | 895,400 | | | | 1,485,282 | |
Amara Raja Batteries, Ltd. | | | 218,500 | | | | 1,482,206 | |
Bajaj Corp., Ltd. | | | 286,950 | | | | 1,000,745 | |
Bajaj Finance, Ltd. | | | 50,400 | | | | 1,562,513 | |
Cera Sanitaryware, Ltd. | | | 52,088 | | | | 830,739 | |
Crisil, Ltd. | | | 73,505 | | | | 1,582,219 | |
eClerx Services, Ltd. | | | 76,479 | | | | 1,538,202 | |
Engineers India, Ltd. | | | 481,300 | | | | 1,823,777 | |
Glenmark Pharmaceuticals, Ltd. | | | 153,200 | | | | 1,535,556 | |
Infotech Enterprises, Ltd. | | | 269,795 | | | | 1,404,106 | |
Jammu & Kashmir Bank, Ltd. | | | 52,933 | | | | 1,470,039 | |
KPIT Cummins Infosystems, Ltd. | | | 1,092,780 | | | | 3,129,864 | |
See Notes to Financial Statements.
| | |
Annual Report | April 30, 2014 | | 19 |
| | |
| Grandeur Peak Emerging Markets Opportunities Fund | | Portfolio of Investments |
April 30, 2014 |
| | | | | | | | |
| | | Shares | | | Value (Note 2) | |
| |
India (continued) | | | | | | | | |
Mahindra & Mahindra Financial Services, Ltd. | | | 159,000 | | | $ | 648,627 | |
NIIT Technologies, Ltd. | | | 222,275 | | | | 1,495,469 | |
Persistent Systems, Ltd. | | | 93,908 | | | | 1,568,403 | |
PI Industries, Ltd. | | | 250,475 | | | | 1,037,988 | |
Poly Medicure, Ltd. | | | 36,600 | | | | 281,440 | |
Repco Home Finance, Ltd. | | | 241,527 | | | | 1,498,456 | |
Suprajit Engineering, Ltd. | | | 837,202 | | | | 1,023,686 | |
Supreme Industries, Ltd. | | | 280,500 | | | | 2,121,132 | |
Unichem Laboratories, Ltd. | | | 326,100 | | | | 1,165,666 | |
Vaibhav Global, Ltd.(a) | | | 159,537 | | | | 1,932,087 | |
Vakrangee Software, Ltd. | | | 912,900 | | | | 1,492,364 | |
Vinati Organics, Ltd. | | | 156,063 | | | | 689,301 | |
V-Mart Retail, Ltd. | | | 19,283 | | | | 102,114 | |
| | | | | | | | |
| | | | | | | 38,040,330 | |
| | | | | | | | |
| | |
Indonesia (3.19%) | | | | | | | | |
Arwana Citramulia Tbk PT | | | 8,375,700 | | | | 713,581 | |
Astra Graphia Tbk PT | | | 5,816,000 | | | | 1,006,098 | |
Bank Tabungan Pensiunan Nasional Tbk PT(a) | | | 3,657,600 | | | | 1,289,168 | |
Bekasi Fajar Industrial Estate Tbk PT(a) | | | 22,622,300 | | | | 997,913 | |
Express Transindo Utama Tbk PT(a) | | | 13,689,900 | | | | 1,533,401 | |
Lippo Cikarang Tbk PT(a) | | | 821,000 | | | | 541,463 | |
Tempo Scan Pacific Tbk PT | | | 8,821,500 | | | | 2,212,719 | |
Ultrajaya Milk Industry & Trading Co. Tbk PT(a) | | | 2,020,900 | | | | 745,504 | |
| | | | | | | | |
| | | | | | | 9,039,847 | |
| | | | | | | | |
| | |
Kazakhstan (0.27%) | | | | | | | | |
Nostrum Oil & Gas LP, GDR(c) | | | 75,947 | | | | 759,470 | |
| | | | | | | | |
| | |
Malaysia (4.90%) | | | | | | | | |
AEON Credit Service M Bhd | | | 644,400 | | | | 2,861,369 | |
Berjaya Food Bhd | | | 2,511,600 | | | | 1,153,698 | |
CB Industrial Product Holding Bhd | | | 974,500 | | | | 1,402,588 | |
Freight Management Holdings Bhd | | | 271,000 | | | | 149,380 | |
JobStreet Corp. Bhd | | | 398,200 | | | | 292,660 | |
Kossan Rubber Industries | | | 1,912,000 | | | | 2,400,612 | |
My EG Services Bhd | | | 1,046,900 | | | | 884,840 | |
Padini Holdings Bhd | | | 3,273,000 | | | | 2,004,593 | |
Power Root Bhd | | | 2,376,000 | | | | 1,346,072 | |
See Notes to Financial Statements.
| | |
| 20 | | 1.855.377.7325 | www.GrandeurPeakGlobal.com |
| | |
| Grandeur Peak Emerging Markets Opportunities Fund | | Portfolio of Investments |
April 30, 2014 |
| | | | | | | | |
| | | Shares | | | Value (Note 2) | |
| |
Malaysia (continued) | | | | | | | | |
Uzma Bhd | | | 753,900 | | | $ | 1,408,296 | |
| | | | | | | | |
| | | | | | | 13,904,108 | |
| | | | | | | | |
| | |
Mexico (1.54%) | | | | | | | | |
Credito Real SA | | | 809,000 | | | | 1,469,869 | |
Genomma Lab Internacional SAB de CV, Class B(a) | | | 365,900 | | | | 929,381 | |
Medica Sur SAB de CV | | | 575,920 | | | | 1,958,949 | |
| | | | | | | | |
| | | | | | | 4,358,199 | |
| | | | | | | | |
| | |
Oman (0.52%) | | | | | | | | |
Al Anwar Ceramic Tile Co. | | | 965,377 | | | | 1,479,409 | |
| | | | | | | | |
| | |
Philippines (4.10%) | | | | | | | | |
Concepcion Industrial Corp. | | | 2,147,500 | | | | 1,565,585 | |
Pepsi-Cola Products Philippines, Inc. | | | 30,964,500 | | | | 3,472,914 | |
Puregold Price Club, Inc. | | | 950,800 | | | | 980,019 | |
RFM Corp. | | | 10,913,500 | | | | 1,591,246 | |
Robinsons Land Corp. | | | 1,985,300 | | | | 993,095 | |
Security Bank Corp. | | | 1,121,100 | | | | 3,020,281 | |
| | | | | | | | |
| | | | | | | 11,623,140 | |
| | | | | | | | |
| | |
Poland (1.22%) | | | | | | | | |
KRUK SA(a) | | | 39,601 | | | | 1,089,546 | |
Magellan SA(a) | | | 43,048 | | | | 988,171 | |
Wawel SA | | | 1,490 | | | | 639,278 | |
Work Service SA(a) | | | 147,648 | | | | 736,374 | |
| | | | | | | | |
| | | | | | | 3,453,369 | |
| | | | | | | | |
| | |
Russia (0.22%) | | | | | | | | |
MD Medical Group Investments PLC, GDR(c) | | | 99,524 | | | | 613,565 | |
| | | | | | | | |
| | |
Singapore (1.11%) | | | | | | | | |
Petra Foods, Ltd. | | | 490,400 | | | | 1,388,626 | |
Technovator International, Ltd.(a) | | | 3,333,000 | | | | 1,758,294 | |
| | | | | | | | |
| | | | | | | 3,146,920 | |
| | | | | | | | |
| | |
South Africa (6.75%) | | | | | | | | |
Blue Label Telecoms, Ltd. | | | 2,585,730 | | | | 2,241,515 | |
Clicks Group, Ltd. | | | 385,800 | | | | 2,352,461 | |
See Notes to Financial Statements.
| | |
Annual Report | April 30, 2014 | | 21 |
| | |
| Grandeur Peak Emerging Markets Opportunities Fund | | Portfolio of Investments |
April 30, 2014 |
| | | | | | | | |
| | | Shares | | | Value (Note 2) | |
| |
South Africa (continued) | | | | | | | | |
Comair, Ltd. | | | 5,021,573 | | | $ | 2,362,700 | |
Ellies Holdings, Ltd.(a) | | | 3,472,708 | | | | 1,369,872 | |
EOH Holdings, Ltd. | | | 274,624 | | | | 2,192,711 | |
Interwaste Holdings, Ltd.(a) | | | 3,248,499 | | | | 453,904 | |
Italtile, Ltd. | | | 923,279 | | | | 702,080 | |
MiX Telematics, Ltd., ADR(a) | | | 135,730 | | | | 1,425,165 | |
OneLogix Group, Ltd. | | | 2,142,622 | | | | 773,914 | |
Super Group, Ltd.(a) | | | 1,112,369 | | | | 2,995,429 | |
Transaction Capital, Ltd. | | | 4,568,406 | | | | 2,279,752 | |
| | | | | | | | |
| | | | | | | 19,149,503 | |
| | | | | | | | |
| | |
South Korea (9.93%) | | | | | | | | |
Daum Communications Corp. | | | 12,500 | | | | 906,078 | |
Duksan Hi-Metal Co., Ltd.(a) | | | 54,500 | | | | 1,010,041 | |
ENF Technology Co., Ltd. | | | 117,800 | | | | 1,046,554 | |
Global Display Co., Ltd. | | | 137,375 | | | | 1,449,131 | |
Handsome Co., Ltd. | | | 37,000 | | | | 934,579 | |
Hanssem Co., Ltd. | | | 15,800 | | | | 1,290,545 | |
Hy-Lok Corp. | | | 140,180 | | | | 4,076,656 | |
iMarketKorea, Inc. | | | 26,300 | | | | 792,843 | |
ISC Co., Ltd. | | | 67,032 | | | | 1,245,538 | |
Koh Young Technology, Inc. | | | 93,644 | | | | 2,229,403 | |
Kolao Holdings | | | 36,952 | | | | 917,274 | |
KONA@I Co., Ltd. | | | 108,650 | | | | 4,048,219 | |
KT Skylife Co., Ltd. | | | 44,860 | | | | 1,050,626 | |
LEENO Industrial, Inc. | | | 48,545 | | | | 1,397,671 | |
LF Corp. | | | 38,460 | | | | 997,511 | |
Suprema, Inc.(a) | | | 29,039 | | | | 718,036 | |
Vieworks Co., Ltd. | | | 91,193 | | | | 2,299,020 | |
Wins Technet Co., Ltd. | | | 131,012 | | | | 1,781,398 | |
| | | | | | | | |
| | | | | | | 28,191,123 | |
| | | | | | | | |
| | |
Taiwan (13.95%) | | | | | | | | |
ASPEED Technology, Inc. | | | 166,000 | | | | 1,434,731 | |
Chipbond Technology Corp. | | | 407,000 | | | | 695,450 | |
Cleanaway Co., Ltd. | | | 585,000 | | | | 3,312,637 | |
Cowealth Medical Holding Co., Ltd. | | | 325,000 | | | | 1,076,230 | |
Cub Elecparts, Inc. | | | 149,000 | | | | 1,317,405 | |
DYNACOLOR, Inc. | | | 568,000 | | | | 1,474,641 | |
Elan Microelectronics Corp. | | | 872,000 | | | | 1,611,286 | |
See Notes to Financial Statements.
| | |
| 22 | | 1.855.377.7325 | www.GrandeurPeakGlobal.com |
| | |
| Grandeur Peak Emerging Markets Opportunities Fund | | Portfolio of Investments |
April 30, 2014 |
| | | | | | | | |
| | | Shares | | | Value (Note 2) | |
| |
Taiwan (continued) | | | | | | | | |
King’s Town Bank | | | 355,000 | | | $ | 329,161 | |
Ledlink Optics, Inc. | | | 289,000 | | | | 854,616 | |
Novatek Microelectronics Corp. | | | 622,000 | | | | 2,873,336 | |
On-Bright Electronics, Inc. | | | 96,000 | | | | 871,051 | |
Polyronics Tech Corp. | | | 839,000 | | | | 2,000,397 | |
Richtek Technology Corp. | | | 124,000 | | | | 710,378 | |
Silergy Corp.(a) | | | 332,000 | | | | 2,748,526 | |
Sinmag Equipment Corp. | | | 585,000 | | | | 3,254,520 | |
Solidwizard Technology Co., Ltd. | | | 263,000 | | | | 1,310,733 | |
Sporton International, Inc. | | | 661,000 | | | | 2,900,275 | |
St. Shine Optical Co., Ltd. | | | 58,000 | | | | 1,227,300 | |
Test Research, Inc. | | | 919,000 | | | | 1,539,883 | |
TSC Auto ID Technology Co., Ltd. | | | 214,000 | | | | 1,736,208 | |
UDE Corp. | | | 767,000 | | | | 2,603,401 | |
Voltronic Power Technology Corp. | | | 569,400 | | | | 3,705,116 | |
| | | | | | | | |
| | | | | | | 39,587,281 | |
| | | | | | | | |
| | |
Thailand (2.98%) | | | | | | | | |
Beauty Community PCL | | | 2,469,200 | | | | 1,526,081 | |
Jubilee Enterprise PCL | | | 1,265,000 | | | | 1,045,697 | |
LPN Development PCL | | | 5,571,800 | | | | 2,995,962 | |
Nok Airlines PCL | | | 3,348,000 | | | | 1,862,299 | |
Premier Marketing PCL | | | 3,600,300 | | | | 1,034,697 | |
| | | | | | | | |
| | | | | | | 8,464,736 | |
| | | | | | | | |
| | |
Turkey (2.61%) | | | | | | | | |
Albaraka Turk Katilim Bankasi AS | | | 824,977 | | | | 652,465 | |
EGE Seramik Sanayi ve Ticaret AS | | | 746,872 | | | | 1,018,679 | |
Emlak Konut Gayrimenkul Yatirim Ortakligi AS, REIT | | | 619,300 | | | | 809,485 | |
Is Girisim Sermayesi Yatirim Ortakligi AS | | | 571,302 | | | | 700,752 | |
Koza Altin Isletmeleri AS | | | 48,000 | | | | 478,511 | |
Pegasus Hava Tasimaciligi AS(a) | | | 77,500 | | | | 1,035,022 | |
Pinar SUT Mamulleri Sanayii AS | | | 154,600 | | | | 1,336,198 | |
TAV Havalimanlari Holding AS | | | 77,100 | | | | 617,077 | |
Uyum Gida Ihtiyac Maddeleri Sanayi ve Ticaret AS(a) | | | 679,858 | | | | 756,632 | |
| | | | | | | | |
| | | | | | | 7,404,821 | |
| | | | | | | | |
| | |
United Arab Emirates (0.14%) | | | | | | | | |
Aramex PJSC | | | 451,125 | | | | 385,666 | |
| | | | | | | | |
See Notes to Financial Statements.
| | |
Annual Report | April 30, 2014 | | 23 |
| | |
| Grandeur Peak Emerging Markets Opportunities Fund | | Portfolio of Investments |
April 30, 2014 |
| | | | | | | | |
| | | Shares | | | Value (Note 2) | |
| |
United States (0.31%) | | | | | | | | |
First Cash Financial Services, Inc.(a) | | | 18,100 | | | $ | 882,737 | |
| | | | | | | | |
| | |
Vietnam (0.45%) | | | | | | | | |
Viet Nam Dairy Products JSC | | | 195,680 | | | | 1,290,147 | |
| | | | | | | | |
| | |
TOTAL COMMON STOCKS (Cost $263,896,844) | | | | | | | 273,737,480 | |
| | | | | | | | |
| | |
PREFERRED STOCKS (0.52%) | | | | | | | | |
Brazil (0.52%) | | | | | | | | |
Banco ABC Brasil SA | | | 252,904 | | | | 1,480,164 | |
| | | | | | | | |
| | |
TOTAL PREFERRED STOCKS (Cost $1,271,989) | | | | | | | 1,480,164 | |
| | | | | | | | |
| | |
TOTAL INVESTMENTS (96.99%) (Cost $265,168,833) | | | | | | $ | 275,217,644 | |
| | |
Assets In Excess Of Other Liabilities (3.01%) | | | | | | | 8,553,252 | |
| | | | | | | | |
| | |
NET ASSETS (100.00%) | | | | | | $ | 283,770,896 | |
| | | | | | | | |
| (a) | Non-Income Producing Security. |
| (b) | Fair valued security under the procedures approved by the Fund’s Board of Trustees. |
| (c) | Security was purchased pursuant to Regulation S under the Securities Act of 1933, which exempts securities offered and sold outside of the United States from registration. Such security cannot be sold in the United States without either an effective registration statement filed pursuant to the Securities Act of 1933, or pursuant to an exemption from registration. The security has been deemed liquid under guidelines approved by the Fund’s Board of Trustees. As of April 30, 2014, the aggregate market value of those securities was $1,373,035, representing 0.48% of net assets. |
Common Abbreviations:
ADR - American Depositary Receipt.
AS - Aktieselskab is the Danish term for a stock-based corporation.
Bhd - Berhad is the Malaysian term for public limited company.
GDR - Global Depositary Receipt.
JSC - Joint Stock Company.
LP - Limited Partnerships.
Ltd. - Limited.
See Notes to Financial Statements.
| | |
| 24 | | 1.855.377.7325 | www.GrandeurPeakGlobal.com |
| | |
| Grandeur Peak Emerging Markets Opportunities Fund | | Portfolio of Investments |
April 30, 2014 |
PCL - Public Company Limited.
PJSC - Public Joint Stock Company.
PLC - Public Limited Company.
REIT - Real Estate Investment Trust.
SA - Generally designates corporations in various countries, mostly those employing the civil law.
SAB de CV - A variable capital company.
Tbk PT - Terbuka Perseroan Terbatas is an Indonesian term for a limited liability company.
Holdings are subject to change.
For Fund compliance purposes, the Fund’s geographical classifications refer to any one or more of the country sub-classifications used by one or more widely recognized market indexes or ratings group indexes, and/or as defined by Fund management. This definition may not apply for purposes of this report, which may combine sub-classifications for reporting ease. Geographical regions are shown as a percentage of net assets.
See Notes to Financial Statements.
| | |
Annual Report | April 30, 2014 | | 25 |
| | |
| Grandeur Peak Global Opportunities Fund | | Portfolio of Investments |
April 30, 2014 |
| | | | | | | | |
| | | Shares | | | Value (Note 2) | |
| |
COMMON STOCKS (95.63%) | | | | | | | | |
Australia (3.24%) | | | | | | | | |
ALS, Ltd. | | | 209,306 | | | $ | 1,458,335 | |
Countplus, Ltd. | | | 315,836 | | | | 513,469 | |
CTI Logistics, Ltd. | | | 1,421,632 | | | | 2,628,176 | |
Magellan Financial Group, Ltd. | | | 1,331,500 | | | | 15,461,990 | |
Super Retail Group, Ltd. | | | 224,522 | | | | 2,119,175 | |
Webjet, Ltd. | | | 309,300 | | | | 790,181 | |
| | | | | | | | |
| | | | | | | 22,971,326 | |
| | | | | | | | |
| | |
Austria (0.41%) | | | | | | | | |
Palfinger AG | | | 79,000 | | | | 2,915,372 | |
| | | | | | | | |
| | |
Belgium (1.58%) | | | | | | | | |
Melexis NV | | | 278,534 | | | | 11,214,007 | |
| | | | | | | | |
| | |
Brazil (3.05%) | | | | | | | | |
Banco Daycoval SA | | | 1,290,500 | | | | 5,208,880 | |
CETIP SA - Mercados Organizados | | | 716,288 | | | | 9,081,494 | |
Tegma Gestao Logistica | | | 482,500 | | | | 4,066,005 | |
Valid Solucoes SA | | | 211,000 | | | | 3,252,414 | |
| | | | | | | | |
| | | | | | | 21,608,793 | |
| | | | | | | | |
| | |
Britain (7.88%) | | | | | | | | |
Abcam PLC | | | 121,865 | | | | 812,735 | |
Blinkx PLC(a) | | | 2,871,294 | | | | 4,157,045 | |
Bovis Homes Group PLC | | | 248,355 | | | | 3,314,727 | |
Brammer PLC | | | 399,279 | | | | 3,163,397 | |
Clinigen Group PLC | | | 1,350,003 | | | | 11,060,460 | |
EMIS Group PLC | | | 369,800 | | | | 3,936,633 | |
Halma PLC | | | 87,900 | | | | 833,319 | |
Hunting PLC | | | 222,000 | | | | 3,172,874 | |
IG Group Holdings PLC | | | 341,800 | | | | 3,670,305 | |
N Brown Group PLC | | | 142,580 | | | | 1,234,949 | |
Premier Oil PLC | | | 746,255 | | | | 4,268,778 | |
Robert Walters PLC | | | 140,483 | | | | 756,637 | |
RPS Group PLC | | | 2,443,284 | | | | 12,148,766 | |
Ted Baker PLC | | | 38,479 | | | | 1,201,251 | |
Ultra Electronics Holdings PLC | | | 74,450 | | | | 2,131,884 | |
| | | | | | | | |
| | | | | | | 55,863,760 | |
| | | | | | | | |
See Notes to Financial Statements.
| | |
| 26 | | 1.855.377.7325 | www.GrandeurPeakGlobal.com |
| | |
| Grandeur Peak Global Opportunities Fund | | Portfolio of Investments |
April 30, 2014 |
| | | | | | | | |
| | | Shares | | | Value (Note 2) | |
| |
Canada (1.93%) | | | | | | | | |
Contrans Group, Inc., Class A | | | 21,400 | | | $ | 280,765 | |
Halogen Software, Inc.(a) | | | 115,600 | | | | 1,001,962 | |
Home Capital Group, Inc. | | | 164,928 | | | | 6,968,492 | |
Richelieu Hardware, Ltd. | | | 70,655 | | | | 3,164,503 | |
Stantec, Inc. | | | 38,464 | | | | 2,279,660 | |
| | | | | | | | |
| | | | | | | 13,695,382 | |
| | | | | | | | |
| | |
China (6.93%) | | | | | | | | |
China Medical System Holdings, Ltd. | | | 5,759,927 | | | | 6,820,130 | |
Dongpeng Holdings Co., Ltd.(a) | | | 13,426,000 | | | | 5,524,212 | |
Far East Horizon, Ltd. | | | 5,619,000 | | | | 3,804,971 | |
Labixiaoxin Snacks Group, Ltd.(b) | | | 12,351,000 | | | | 4,062,331 | |
Le Saunda Holdings, Ltd. | | | 4,653,200 | | | | 2,220,683 | |
Man Wah Holdings, Ltd. | | | 4,507,200 | | | | 7,383,182 | |
Montage Technology Group, Ltd.(a) | | | 250,070 | | | | 5,198,955 | |
NQ Mobile, Inc., ADR(a) | | | 49,000 | | | | 605,640 | |
O2Micro International, Ltd., ADR(a) | | | 530,892 | | | | 1,911,211 | |
Pacific Online, Ltd. | | | 3,298,853 | | | | 1,787,085 | |
Sihuan Pharmaceutical Holdings Group, Ltd. | | | 2,018,000 | | | | 2,222,860 | |
SPT Energy Group, Inc. | | | 7,000,000 | | | | 3,801,134 | |
Tao Heung Holdings, Ltd. | | | 1,971,300 | | | | 1,263,695 | |
WuXi PharmaTech Cayman, Inc., ADR(a) | | | 75,500 | | | | 2,567,000 | |
| | | | | | | | |
| | | | | | | 49,173,089 | |
| | | | | | | | |
| | |
Colombia (1.61%) | | | | | | | | |
Gran Tierra Energy, Inc.(a) | | | 884,775 | | | | 6,326,141 | |
Parex Resources, Inc.(a) | | | 507,300 | | | | 5,072,769 | |
| | | | | | | | |
| | | | | | | 11,398,910 | |
| | | | | | | | |
| | |
France (1.79%) | | | | | | | | |
Argan | | | 33,200 | | | | 736,959 | |
Audika Groupe(a) | | | 75,200 | | | | 1,378,180 | |
Esker SA | | | 31,547 | | | | 842,070 | |
Medicrea International(a) | | | 108,996 | | | | 1,380,596 | |
MGI Digital Graphic Technology(a) | | | 39,250 | | | | 1,633,601 | |
Neurones | | | 45,508 | | | | 984,912 | |
Prodware(a) | | | 199,300 | | | | 2,798,163 | |
Sartorius Stedim Biotech | | | 7,313 | | | | 1,389,957 | |
Thermador Groupe | | | 13,992 | | | | 1,548,865 | |
| | | | | | | | |
| | | | | | | 12,693,303 | |
| | | | | | | | |
See Notes to Financial Statements.
| | |
Annual Report | April 30, 2014 | | 27 |
| | |
| Grandeur Peak Global Opportunities Fund | | Portfolio of Investments |
April 30, 2014 |
| | | | | | | | |
| | | Shares | | | Value (Note 2) | |
| |
Georgia (0.72%) | | | | | | | | |
Bank of Georgia Holdings PLC | | | 115,800 | | | $ | 5,089,272 | |
| | | | | | | | |
| | |
Germany (2.02%) | | | | | | | | |
Bertrandt AG | | | 35,455 | | | | 5,363,995 | |
CompuGroup Medical AG | | | 21,708 | | | | 578,539 | |
Nexus AG | | | 160,092 | | | | 2,480,893 | |
Softing AG | | | 75,599 | | | | 1,520,790 | |
Wirecard AG | | | 104,085 | | | | 4,363,108 | |
| | | | | | | | |
| | | | | | | 14,307,325 | |
| | | | | | | | |
| | |
Hong Kong (0.81%) | | | | | | | | |
ASR Holdings, Ltd. | | | 6,464,200 | | | | 1,092,243 | |
Value Partners Group, Ltd. | | | 4,808,000 | | | | 3,088,352 | |
Vitasoy International Holdings, Ltd. | | | 1,135,483 | | | | 1,555,386 | |
| | | | | | | | |
| | | | | | | 5,735,981 | |
| | | | | | | | |
| | |
India (4.44%) | | | | | | | | |
Ajanta Pharma, Ltd. | | | 154,100 | | | | 2,535,630 | |
Bajaj Corp., Ltd. | | | 470,496 | | | | 1,640,866 | |
Bajaj Finance, Ltd. | | | 73,475 | | | | 2,277,889 | |
City Union Bank, Ltd. | | | 801,867 | | | | 778,402 | |
Crisil, Ltd. | | | 95,500 | | | | 2,055,669 | |
eClerx Services, Ltd. | | | 131,800 | | | | 2,650,859 | |
Glenmark Pharmaceuticals, Ltd. | | | 414,000 | | | | 4,149,610 | |
Infotech Enterprises, Ltd. | | | 359,116 | | | | 1,868,963 | |
Jammu & Kashmir Bank, Ltd. | | | 73,700 | | | | 2,046,774 | |
KPIT Cummins Infosystems, Ltd. | | | 860,350 | | | | 2,464,154 | |
Mahindra & Mahindra Financial Services, Ltd. | | | 323,700 | | | | 1,320,507 | |
Persistent Systems, Ltd. | | | 164,100 | | | | 2,740,713 | |
Supreme Industries, Ltd. | | | 293,800 | | | | 2,221,706 | |
Vakrangee Software, Ltd. | | | 1,677,900 | | | | 2,742,949 | |
| | | | | | | | |
| | | | | | | 31,494,691 | |
| | | | | | | | |
| | |
Indonesia (1.05%) | | | | | | | | |
Astra Graphia Tbk PT | | | 8,281,400 | | | | 1,432,582 | |
Express Transindo Utama Tbk PT(a) | | | 17,548,500 | | | | 1,965,602 | |
Lippo Cikarang Tbk PT(a) | | | 2,069,000 | | | | 1,364,540 | |
Ultrajaya Milk Industry & Trading Co. Tbk PT(a) | | | 7,281,500 | | | | 2,686,122 | |
| | | | | | | | |
| | | | | | | 7,448,846 | |
| | | | | | | | |
See Notes to Financial Statements.
| | |
| 28 | | 1.855.377.7325 | www.GrandeurPeakGlobal.com |
| | |
| Grandeur Peak Global Opportunities Fund | | Portfolio of Investments |
April 30, 2014 |
| | | | | | | | |
| | | Shares | | | Value (Note 2) | |
| |
Ireland (1.36%) | | | | | | | | |
Beazley PLC | | | 716,000 | | | $ | 2,964,193 | |
Kentz Corp., Ltd. | | | 550,100 | | | | 6,705,818 | |
| | | | | | | | |
| | | | | | | 9,670,011 | |
| | | | | | | | |
| | |
Israel (0.40%) | | | | | | | | |
SodaStream International, Ltd.(a) | | | 66,800 | | | | 2,841,004 | |
| | | | | | | | |
| | |
Japan (3.91%) | | | | | | | | |
AIT Corp. | | | 329,200 | | | | 2,453,665 | |
Arcland Service Co., Ltd. | | | 28,300 | | | | 935,629 | |
Benefit One, Inc. | | | 244,000 | | | | 2,126,512 | |
CMIC Co., Ltd. | | | 96,020 | | | | 1,536,545 | |
CyberAgent, Inc. | | | 46,300 | | | | 1,906,617 | |
Future Architect, Inc. | | | 276,100 | | | | 1,631,187 | |
GCA Savvian Corp. | | | 292,800 | | | | 2,256,824 | |
Hiday Hidaka Corp. | | | 117,600 | | | | 2,708,935 | |
Monogatari Corp. | | | 78,100 | | | | 2,815,068 | |
Seria Co., Ltd. | | | 40,000 | | | | 1,565,022 | |
Shaklee Global Group, Inc.(a) | | | 11,000 | | | | 417,470 | |
SK Kaken Co., Ltd. | | | 21,000 | | | | 1,417,323 | |
Syuppin Co., Ltd. | | | 48,900 | | | | 624,194 | |
Trancom Co., Ltd. | | | 148,270 | | | | 5,213,779 | |
Watts Co., Ltd. | | | 11,100 | | | | 107,813 | |
| | | | | | | | |
| | | | | | | 27,716,583 | |
| | | | | | | | |
| | |
Luxembourg (0.59%) | | | | | | | | |
L’Occitane International SA | | | 1,702,753 | | | | 4,181,688 | |
| | | | | | | | |
| | |
Malaysia (2.08%) | | | | | | | | |
AEON Credit Service M Bhd | | | 777,280 | | | | 3,451,404 | |
Berjaya Food Bhd | | | 1,893,000 | | | | 869,545 | |
JobStreet Corp. Bhd | | | 411,100 | | | | 302,140 | |
Kossan Rubber Industries | | | 1,342,800 | | | | 1,685,953 | |
My EG Services Bhd | | | 4,371,500 | | | | 3,694,791 | |
Padini Holdings Bhd | | | 6,077,650 | | | | 3,722,340 | |
Uzma Bhd | | | 537,500 | | | | 1,004,058 | |
| | | | | | | | |
| | | | | | | 14,730,231 | |
| | | | | | | | |
| | |
Mexico (0.28%) | | | | | | | | |
Genomma Lab Internacional SAB de CV, Class B(a) | | | 794,200 | | | | 2,017,257 | |
| | | | | | | | |
See Notes to Financial Statements.
| | |
Annual Report | April 30, 2014 | | 29 |
| | |
| Grandeur Peak Global Opportunities Fund | | Portfolio of Investments |
April 30, 2014 |
| | | | | | | | |
| | | Shares | | | Value (Note 2) | |
| |
Norway (0.50%) | | | | | | | | |
Opera Software ASA | | | 276,200 | | | $ | 3,563,841 | |
| | | | | | | | |
| | |
Philippines (0.94%) | | | | | | | | |
Pepsi-Cola Products Philippines, Inc. | | | 22,499,900 | | | | 2,523,542 | |
Security Bank Corp. | | | 1,530,640 | | | | 4,123,595 | |
| | | | | | | | |
| | | | | | | 6,647,137 | |
| | | | | | | | |
| | |
Russia (0.04%) | | | | | | | | |
MD Medical Group Investments PLC, GDR(c) | | | 40,900 | | | | 252,148 | |
| | | | | | | | |
| | |
Singapore (1.84%) | | | | | | | | |
ARA Asset Management, Ltd. | | | 1,582,888 | | | | 2,304,196 | |
Breadtalk Group, Ltd. | | | 1,598,625 | | | | 1,785,176 | |
CSE Global, Ltd. | | | 2,944,250 | | | | 1,397,327 | |
Goodpack, Ltd. | | | 1,521,800 | | | | 2,913,233 | |
Parkson Retail Asia, Ltd. | | | 1,155,000 | | | | 852,177 | |
Petra Foods, Ltd. | | | 858,000 | | | | 2,429,529 | |
Riverstone Holdings, Ltd. | | | 2,133,600 | | | | 1,395,511 | |
| | | | | | | | |
| | | | | | | 13,077,149 | |
| | | | | | | | |
| | |
South Africa (0.99%) | | | | | | | | |
Clicks Group, Ltd. | | | 173,785 | | | | 1,059,675 | |
EOH Holdings, Ltd. | | | 153,300 | | | | 1,224,010 | |
MiX Telematics, Ltd., ADR(a) | | | 117,000 | | | | 1,228,500 | |
Super Group, Ltd.(a) | | | 1,309,307 | | | | 3,525,751 | |
| | | | | | | | |
| | | | | | | 7,037,936 | |
| | | | | | | | |
| | |
South Korea (4.62%) | | | | | | | | |
Daum Communications Corp. | | | 31,000 | | | | 2,247,072 | |
Duksan Hi-Metal Co., Ltd.(a) | | | 100,600 | | | | 1,864,405 | |
Global Display Co., Ltd. | | | 206,100 | | | | 2,174,093 | |
Handsome Co., Ltd. | | | 56,700 | | | | 1,432,178 | |
Hanssem Co., Ltd. | | | 28,100 | | | | 2,295,210 | |
Hy-Lok Corp. | | | 259,250 | | | | 7,539,400 | |
ISC Co., Ltd. | | | 168,100 | | | | 3,123,507 | |
Koh Young Technology, Inc. | | | 123,546 | | | | 2,941,287 | |
KONA@I Co., Ltd. | | | 97,900 | | | | 3,647,682 | |
KT Skylife Co., Ltd. | | | 51,000 | | | | 1,194,426 | |
LEENO Industrial, Inc. | | | 114,000 | | | | 3,282,203 | |
See Notes to Financial Statements.
| | |
| 30 | | 1.855.377.7325 | www.GrandeurPeakGlobal.com |
| | |
| Grandeur Peak Global Opportunities Fund | | Portfolio of Investments |
April 30, 2014 |
| | | | | | | | |
| | | Shares | | | Value (Note 2) | |
| |
South Korea (continued) | | | | | | | | |
LF Corp. | | | 40,350 | | | $ | 1,046,531 | |
| | | | | | | | |
| | | | | | | 32,787,994 | |
| | | | | | | | |
| | |
Sweden (3.54%) | | | | | | | | |
AddTech AB, Class B | | | 212,427 | | | | 3,242,500 | |
Beijer Alma AB | | | 112,000 | | | | 3,160,776 | |
Bufab Holding AB(a) | | | 670,628 | | | | 6,600,872 | |
Cloetta AB, Class B(a) | | | 629,200 | | | | 2,070,819 | |
Indutrade AB | | | 43,600 | | | | 1,890,929 | |
Moberg Pharma AB(a) | | | 245,880 | | | | 1,142,010 | |
Nibe Industrier AB, Class B | | | 100,000 | | | | 2,806,742 | |
Opus Group AB | | | 2,135,278 | | | | 4,187,013 | |
| | | | | | | | |
| | | | | | | 25,101,661 | |
| | | | | | | | |
| | |
Switzerland (0.47%) | | | | | | | | |
VZ Holding AG | | | 19,956 | | | | 3,349,053 | |
| | | | | | | | |
| | |
Taiwan (4.49%) | | | | | | | | |
ASPEED Technology, Inc. | | | 197,900 | | | | 1,710,441 | |
Cub Elecparts, Inc. | | | 348,300 | | | | 3,079,545 | |
Novatek Microelectronics Corp. | | | 565,000 | | | | 2,610,024 | |
On-Bright Electronics, Inc. | | | 320,000 | | | | 2,903,504 | |
Pacific Hospital Supply Co. | | | 391,150 | | | | 1,010,322 | |
Polyronics Tech Corp. | | | 1,167,200 | | | | 2,782,913 | |
Silergy Corp.(a) | | | 332,000 | | | | 2,748,526 | |
Sporton International, Inc. | | | 1,337,596 | | | | 5,868,980 | |
Test Research, Inc. | | | 944,708 | | | | 1,582,960 | |
TSC Auto ID Technology Co., Ltd. | | | 135,000 | | | | 1,095,271 | |
UDE Corp. | | | 1,397,000 | | | | 4,741,788 | |
Voltronic Power Technology Corp. | | | 262,000 | | | | 1,704,848 | |
| | | | | | | | |
| | | | | | | 31,839,122 | |
| | | | | | | | |
| | |
Thailand (0.66%) | | | | | | | | |
LPN Development PCL | | | 4,770,000 | | | | 2,564,833 | |
Premier Marketing PCL | | | 7,328,000 | | | | 2,106,007 | |
| | | | | | | | |
| | | | | | | 4,670,840 | |
| | | | | | | | |
| | |
Turkey (0.73%) | | | | | | | | |
Albaraka Turk Katilim Bankasi AS | | | 2,623,683 | | | | 2,075,040 | |
Emlak Konut Gayrimenkul Yatirim Ortakligi AS, REIT | | | 1,053,000 | | | | 1,376,373 | |
See Notes to Financial Statements.
| | |
Annual Report | April 30, 2014 | | 31 |
| | |
| Grandeur Peak Global Opportunities Fund | | Portfolio of Investments |
April 30, 2014 |
| | | | | | | | |
| | | Shares | | | Value (Note 2) | |
| |
Turkey (continued) | | | | | | | | |
TAV Havalimanlari Holding AS | | | 215,500 | | | $ | 1,724,775 | |
| | | | | | | | |
| | | | | | | 5,176,188 | |
| | | | | | | | |
| | |
United Arab Emirates (0.09%) | | | | | | | | |
Aramex PJSC | | | 755,100 | | | | 645,534 | |
| | | | | | | | |
| | |
United States (30.64%) | | | | | | | | |
Abaxis, Inc.(a) | | | 111,330 | | | | 4,521,111 | |
ABIOMED, Inc.(a) | | | 226,800 | | | | 5,372,892 | |
Altisource Asset Management Corp.(a) | | | 1,925 | | | | 1,883,131 | |
Altisource Residential Corp. | | | 96,600 | | | | 2,716,392 | |
Ambarella, Inc.(a) | | | 124,400 | | | | 3,091,340 | |
Amsurg Corp.(a) | | | 33,230 | | | | 1,439,191 | |
Aratana Therapeutics, Inc.(a) | | | 120,800 | | | | 1,664,624 | |
Ares Capital Corp. | | | 152,747 | | | | 2,622,666 | |
BioDelivery Sciences International, Inc.(a) | | | 23,400 | | | | 208,494 | |
Carbonite, Inc.(a) | | | 80,525 | | | | 796,392 | |
Cardica, Inc.(a) | | | 1,049,800 | | | | 1,123,286 | |
Cardtronics, Inc.(a) | | | 67,450 | | | | 2,258,226 | |
Cempra, Inc.(a) | | | 319,200 | | | | 2,911,104 | |
Covance, Inc.(a) | | | 30,332 | | | | 2,677,709 | |
CRA International, Inc.(a) | | | 109,273 | | | | 2,378,873 | |
Diamond Hill Investment Group, Inc. | | | 32,300 | | | | 3,834,656 | |
Ellie Mae, Inc.(a) | | | 97,900 | | | | 2,387,781 | |
EPAM Systems, Inc.(a) | | | 128,800 | | | | 4,009,544 | |
ePlus, Inc.(a) | | | 10,800 | | | | 540,432 | |
Everyday Health, Inc.(a) | | | 28,000 | | | | 394,520 | |
First Cash Financial Services, Inc.(a) | | | 68,700 | | | | 3,350,499 | |
First Republic Bank | | | 378,500 | | | | 19,212,660 | |
Geospace Technologies Corp.(a) | | | 32,100 | | | | 1,865,973 | |
Grand Canyon Education, Inc.(a) | | | 45,300 | | | | 1,953,336 | |
Inphi Corp.(a) | | | 178,400 | | | | 2,638,536 | |
Integrated Silicon Solution, Inc.(a) | | | 253,100 | | | | 3,659,826 | |
Jones Energy, Inc., Class A(a) | | | 252,761 | | | | 3,910,213 | |
Knight Transportation, Inc. | | | 217,595 | | | | 5,163,530 | |
LGI Homes, Inc.(a) | | | 287,100 | | | | 4,226,112 | |
Littelfuse, Inc. | | | 43,100 | | | | 3,902,705 | |
Manitex International, Inc.(a) | | | 221,355 | | | | 3,643,503 | |
Manning & Napier, Inc. | | | 135,350 | | | | 2,249,517 | |
MarketAxess Holdings, Inc. | | | 78,400 | | | | 4,224,192 | |
Maxim Integrated Products, Inc. | | | 141,475 | | | | 4,589,449 | |
See Notes to Financial Statements.
| | |
| 32 | | 1.855.377.7325 | www.GrandeurPeakGlobal.com |
| | |
| Grandeur Peak Global Opportunities Fund | | Portfolio of Investments |
April 30, 2014 |
| | | | | | | | |
| | | Shares | | | Value (Note 2) | |
| |
United States (continued) | | | | | | | | |
MaxLinear, Inc., Class A(a) | | | 444,900 | | | $ | 3,501,363 | |
Meridian Bioscience, Inc. | | | 59,700 | | | | 1,192,209 | |
Micrel, Inc. | | | 247,919 | | | | 2,469,273 | |
Microchip Technology, Inc. | | | 105,145 | | | | 4,998,593 | |
Navigant Consulting, Inc.(a) | | | 98,910 | | | | 1,661,688 | |
NorthStar Realty Finance Corp., REIT | | | 215,100 | | | | 3,445,902 | |
Nu Skin Enterprises, Inc., Class A | | | 20,800 | | | | 1,809,600 | |
Pegasystems, Inc. | | | 144,500 | | | | 2,394,365 | |
Pericom Semiconductor Corp.(a) | | | 409,460 | | | | 3,304,342 | |
Portfolio Recovery Associates, Inc.(a) | | | 42,365 | | | | 2,421,160 | |
Power Integrations, Inc. | | | 131,475 | | | | 6,209,564 | |
Q2 Holdings, Inc.(a) | | | 54,900 | | | | 674,172 | |
RealPage, Inc.(a) | | | 151,900 | | | | 2,696,225 | |
Redwood Trust, Inc., REIT | | | 133,800 | | | | 2,916,840 | |
Resources Connection, Inc. | | | 254,675 | | | | 3,466,127 | |
Roadrunner Transportation Systems, Inc.(a) | | | 610,000 | | | | 15,024,300 | |
SEI Investments Co. | | | 70,200 | | | | 2,273,076 | |
Signature Bank(a) | | | 21,400 | | | | 2,542,748 | |
Silicon Laboratories, Inc.(a) | | | 49,640 | | | | 2,231,318 | |
Sonus Networks, Inc.(a) | | | 779,800 | | | | 2,549,946 | |
Staar Surgical Co.(a) | | | 405,000 | | | | 6,889,050 | |
Synaptics, Inc.(a) | | | 43,900 | | | | 2,728,385 | |
Syntel, Inc.(a) | | | 50,400 | | | | 4,048,128 | |
Transcat, Inc.(a) | | | 7,152 | | | | 70,376 | |
TriMas Corp.(a) | | | 71,300 | | | | 2,556,818 | |
TriNet Group, Inc.(a) | | | 35,700 | | | | 765,765 | |
Universal Truckload Services, Inc. | | | 387,457 | | | | 9,554,690 | |
Virtusa Corp.(a) | | | 110,900 | | | | 3,656,373 | |
Vocera Communications, Inc.(a) | | | 94,500 | | | | 1,441,125 | |
Wesco Aircraft Holdings, Inc.(a) | | | 192,500 | | | | 3,900,050 | |
Whitestone, REIT | | | 172,450 | | | | 2,419,474 | |
| | | | | | | | |
| | | | | | | 217,235,460 | |
| | | | | | | | |
| | |
TOTAL COMMON STOCKS (Cost $554,744,709) | | | | | | | 678,150,894 | |
| | | | | | | | |
See Notes to Financial Statements.
| | |
Annual Report | April 30, 2014 | | 33 |
| | |
| Grandeur Peak Global Opportunities Fund | | Portfolio of Investments |
April 30, 2014 |
| | | | | | | | |
| | | Shares | | | Value (Note 2) | |
| |
PREFERRED STOCKS (0.41%) | | | | | | | | |
Brazil (0.41%) | | | | | | | | |
Banco ABC Brasil SA | | | 490,158 | | | $ | 2,868,735 | |
| | | | | | | | |
| | |
TOTAL PREFERRED STOCKS (Cost $2,690,532) | | | | | | | 2,868,735 | |
| | | | | | | | |
| | |
TOTAL INVESTMENTS (96.04%) (Cost $557,435,241) | | | | | | $ | 681,019,629 | |
| | |
Assets In Excess Of Other Liabilities (3.96%) | | | | | | | 28,096,692 | |
| | | | | | | | |
| | |
NET ASSETS (100.00%) | | | | | | $ | 709,116,321 | |
| | | | | | | | |
| (a) | Non-Income Producing Security. |
| (b) | Fair valued security under the procedures approved by the Fund’s Board of Trustees. |
| (c) | Security was purchased pursuant to Regulation S under the Securities Act of 1933, which exempts securities offered and sold outside of the United States from registration. Such security cannot be sold in the United States without either an effective registration statement filed pursuant to the Securities Act of 1933, or pursuant to an exemption from registration. The security has been deemed liquid under guidelines approved by the Fund’s Board of Trustees. As of April 30, 2014, the aggregate market value of those securities was $252,148, representing 0.04% of net assets. |
Common Abbreviations:
AB - Aktiebolag is the Swedish equivalent of the term corporation.
ADR - American Depositary Receipt.
AG - Aktiengesellschaft is a German term that refers to a corporation that is limited by shares, i.e., owned by shareholders.
AS - Aktieselskab is the Danish term for a stock-based corporation.
ASA - Allmennaksjeselskap is the Norwegian term for public limited company.
Bhd - Berhad is the Malaysian term for public limited company.
GDR - Global Depositary Receipt.
Ltd. - Limited.
NV - Naamloze Vennootschap is the Dutch term for a public limited liability corporation.
PCL - Public Company Limited.
PJSC - Public Joint Stock Company.
PLC - Public Limited Company.
REIT - Real Estate Investment Trust.
SA - Generally designates corporations in various countries, mostly those employing the civil law.
SAB de CV - A variable capital company.
Tbk PT - Terbuka Perseroan Terbatas is an Indonesian term for a limited liability company.
Holdings are subject to change.
See Notes to Financial Statements.
| | |
| 34 | | 1.855.377.7325 | www.GrandeurPeakGlobal.com |
| | |
| Grandeur Peak Global Opportunities Fund | | Portfolio of Investments |
April 30, 2014 |
For Fund compliance purposes, the Fund’s geographical classifications refer to any one or more of the country sub-classifications used by one or more widely recognized market indexes or ratings group indexes, and/or as defined by Fund management. This definition may not apply for purposes of this report, which may combine sub-classifications for reporting ease. Geographical regions are shown as a percentage of net assets.
See Notes to Financial Statements.
| | |
Annual Report | April 30, 2014 | | 35 |
| | |
| Grandeur Peak Global Reach Fund | | Portfolio of Investments |
April 30, 2014 |
| | | | | | | | |
| | | Shares | | | Value (Note 2) | |
| |
COMMON STOCKS (87.72%) | | | | | | | | |
Australia (2.26%) | | | | | | | | |
ALS, Ltd. | | | 7,988 | | | $ | 55,656 | |
Countplus, Ltd. | | | 112,900 | | | | 183,547 | |
CTI Logistics, Ltd. | | | 162,123 | | | | 299,717 | |
Lycopodium, Ltd. | | | 17,400 | | | | 52,696 | |
Magellan Financial Group, Ltd. | | | 190,400 | | | | 2,211,012 | |
Medical Developments International, Ltd. | | | 14,728 | | | | 17,103 | |
Navitas, Ltd. | | | 7,443 | | | | 50,822 | |
Super Retail Group, Ltd. | | | 3,525 | | | | 33,271 | |
Webjet, Ltd. | | | 54,300 | | | | 138,723 | |
| | | | | | | | |
| | | | | | | 3,042,547 | |
| | | | | | | | |
| | |
Austria (0.01%) | | | | | | | | |
Palfinger AG | | | 250 | | | | 9,226 | |
| | | | | | | | |
| | |
Belgium (0.50%) | | | | | | | | |
Melexis NV | | | 16,769 | | | | 675,134 | |
| | | | | | | | |
| | |
Brazil (2.64%) | | | | | | | | |
All America Latina Logistica SA | | | 29,700 | | | | 116,949 | |
Arezzo Industria e Comercio SA | | | 3,100 | | | | 34,646 | |
Banco Daycoval SA | | | 193,300 | | | | 780,222 | |
CETIP SA - Mercados Organizados | | | 84,000 | | | | 1,064,998 | |
Cia de Locacao das Americas | | | 170,200 | | | | 220,598 | |
Cia Hering | | | 10,000 | | | | 106,649 | |
Even Construtora e Incorporadora SA | | | 34,500 | | | | 112,176 | |
JSL SA | | | 39,900 | | | | 215,091 | |
Odontoprev SA | | | 48,700 | | | | 196,569 | |
Raia Drogasil SA | | | 4,400 | | | | 37,730 | |
Tegma Gestao Logistica | | | 43,900 | | | | 369,943 | |
Totvs SA | | | 7,800 | | | | 127,997 | |
Valid Solucoes SA | | | 10,500 | | | | 161,850 | |
| | | | | | | | |
| | | | | | | 3,545,418 | |
| | | | | | | | |
| | |
Britain (4.88%) | | | | | | | | |
Advanced Medical Solutions Group PLC | | | 144,288 | | | | 302,691 | |
Afren PLC(a) | | | 55,000 | | | | 146,257 | |
Blinkx PLC(a) | | | 393,000 | | | | 568,983 | |
boohoo.com PLC(a) | | | 168,500 | | | | 150,782 | |
Bovis Homes Group PLC | | | 46,142 | | | | 615,845 | |
Brammer PLC | | | 22,900 | | | | 181,432 | |
See Notes to Financial Statements.
| | |
| 36 | | 1.855.377.7325 | www.GrandeurPeakGlobal.com |
| | |
| Grandeur Peak Global Reach Fund | | Portfolio of Investments |
April 30, 2014 |
| | | | | | | | |
| | | Shares | | | Value (Note 2) | |
| |
Britain (continued) | | | | | | | | |
Brit PLC(a) | | | 86,000 | | | $ | 308,916 | |
Clinigen Group PLC | | | 100,285 | | | | 821,627 | |
Dotdigital Group PLC | | | 290,300 | | | | 167,873 | |
EMIS Group PLC | | | 18,935 | | | | 201,569 | |
Globo PLC(a) | | | 80,000 | | | | 74,289 | |
Halma PLC | | | 3,036 | | | | 28,782 | |
Hunting PLC | | | 28,800 | | | | 411,616 | |
IDOX PLC | | | 214,900 | | | | 144,227 | |
IG Group Holdings PLC | | | 56,519 | | | | 606,910 | |
Premier Oil PLC | | | 46,400 | | | | 265,420 | |
RPS Group PLC | | | 150,900 | | | | 750,322 | |
Ted Baker PLC | | | 4,210 | | | | 131,429 | |
Topps Tiles PLC | | | 126,576 | | | | 274,617 | |
Tracsis PLC | | | 15,000 | | | | 77,624 | |
Ultra Electronics Holdings PLC | | | 4,050 | | | | 115,972 | |
WANdisco PLC(a) | | | 15,300 | | | | 210,534 | |
| | | | | | | | |
| | | | | | | 6,557,717 | |
| | | | | | | | |
| | |
Canada (1.44%) | | | | | | | | |
Cipher Pharmaceuticals, Inc.(a) | | | 42,400 | | | | 326,496 | |
Contrans Group, Inc., Class A | | | 21,300 | | | | 279,453 | |
Halogen Software, Inc.(a) | | | 7,100 | | | | 61,539 | |
Home Capital Group, Inc. | | | 18,930 | | | | 799,825 | |
Richelieu Hardware, Ltd. | | | 3,000 | | | | 134,364 | |
Stantec, Inc. | | | 1,800 | | | | 106,681 | |
TransForce, Inc. | | | 10,200 | | | | 222,696 | |
| | | | | | | | |
| | | | | | | 1,931,054 | |
| | | | | | | | |
| | |
Chile (0.09%) | | | | | | | | |
CFR Pharmaceuticals SA | | | 592,000 | | | | 120,655 | |
| | | | | | | | |
| | |
China (8.83%) | | | | | | | | |
51job, Inc., ADR(a) | | | 2,600 | | | | 175,344 | |
Bolina Holding Co., Ltd. | | | 783,500 | | | | 282,963 | |
CapitaRetail China Trust, REIT | | | 218,956 | | | | 258,479 | |
China Animal Healthcare, Ltd.(a) | | | 229,900 | | | | 150,045 | |
China Biologic Products, Inc.(a) | | | 3,200 | | | | 116,960 | |
China Lesso Group Holdings, Ltd. | | | 627,000 | | | | 333,195 | |
China Medical System Holdings, Ltd. | | | 903,000 | | | | 1,069,211 | |
China Pioneer Pharma Holdings, Ltd.(a) | | | 459,000 | | | | 245,694 | |
China Shineway Pharmaceutical Group, Ltd. | | | 87,000 | | | | 152,389 | |
See Notes to Financial Statements.
| | |
Annual Report | April 30, 2014 | | 37 |
| | |
| Grandeur Peak Global Reach Fund | | Portfolio of Investments |
April 30, 2014 |
| | | | | | | | |
| | | Shares | | | Value (Note 2) | |
| |
China (continued) | | | | | | | | |
Credit China Holdings, Ltd. | | | 720,000 | | | $ | 123,514 | |
Dongpeng Holdings Co., Ltd.(a) | | | 2,127,400 | | | | 875,332 | |
Far East Horizon, Ltd. | | | 977,000 | | | | 661,587 | |
Freetech Road Recycling Technology Holdings, Ltd.(a) | | | 1,500,000 | | | | 381,145 | |
Hilong Holding, Ltd. | | | 330,000 | | | | 171,960 | |
Labixiaoxin Snacks Group, Ltd.(b) | | | 2,864,000 | | | | 941,990 | |
Le Saunda Holdings, Ltd. | | | 422,000 | | | | 201,394 | |
Man Wah Holdings, Ltd. | | | 973,300 | | | | 1,594,349 | |
Mindray Medical International, Ltd., ADR | | | 16,100 | | | | 532,266 | |
Montage Technology Group, Ltd.(a) | | | 48,260 | | | | 1,003,325 | |
Noah Holdings, Ltd., Sponsored ADR(a) | | | 9,900 | | | | 133,254 | |
NQ Mobile, Inc., ADR(a) | | | 13,351 | | | | 165,018 | |
O2Micro International, Ltd., ADR(a) | | | 21,150 | | | | 76,140 | |
Pacific Online, Ltd. | | | 240,000 | | | | 130,015 | |
Phoenix New Media, Ltd., ADR(a) | | | 13,000 | | | | 120,250 | |
Sany Heavy Equipment International Holdings Co., Ltd. | | | 485,000 | | | | 112,602 | |
Shanghai Fudan-Zhangjiang Bio-Pharmaceutical Co., Ltd., Class H(a) | | | 153,000 | | | | 133,405 | |
Sihuan Pharmaceutical Holdings Group, Ltd. | | | 226,000 | | | | 248,943 | |
SPT Energy Group, Inc. | | | 1,160,000 | | | | 629,902 | |
Sungy Mobile, Ltd., ADR(a) | | | 3,200 | | | | 52,352 | |
Tao Heung Holdings, Ltd. | | | 98,000 | | | | 62,823 | |
Tsui Wah Holdings, Ltd. | | | 629,000 | | | | 319,654 | |
WuXi PharmaTech Cayman, Inc., ADR(a) | | | 12,385 | | | | 421,090 | |
| | | | | | | | |
| | | | | | | 11,876,590 | |
| | | | | | | | |
| | |
Colombia (1.00%) | | | | | | | | |
BBVA Colombia SA(a) | | | 1,400,000 | | | | 207,378 | |
Gran Tierra Energy, Inc.(a) | | | 92,400 | | | | 660,660 | |
Parex Resources, Inc.(a) | | | 47,900 | | | | 478,978 | |
| | | | | | | | |
| | | | | | | 1,347,016 | |
| | | | | | | | |
| | |
Finland (0.22%) | | | | | | | | |
BasWare OYJ | | | 3,700 | | | | 174,682 | |
Revenio Group OYJ | | | 5,550 | | | | 123,428 | |
| | | | | | | | |
| | | | | | | 298,110 | |
| | | | | | | | |
| | |
France (2.48%) | | | | | | | | |
1000mercis | | | 2,150 | | | | 149,140 | |
See Notes to Financial Statements.
| | |
| 38 | | 1.855.377.7325 | www.GrandeurPeakGlobal.com |
| | |
| Grandeur Peak Global Reach Fund | | Portfolio of Investments |
April 30, 2014 |
| | | | | | | | |
| | | Shares | | | Value (Note 2) | |
| |
France (continued) | | | | | | | | |
Akka Technologies SA | | | 8,377 | | | $ | 303,329 | |
Argan | | | 10,900 | | | | 241,953 | |
Audika Groupe(a) | | | 7,200 | | | | 131,953 | |
Ausy(a) | | | 2,300 | | | | 96,652 | |
Esker SA | | | 14,200 | | | | 379,035 | |
GameLoft SE(a) | | | 12,600 | | | | 125,336 | |
Groupe Gorge | | | 10,200 | | | | 309,340 | |
ID Logistics Group(a) | | | 1,200 | | | | 121,698 | |
Medicrea International(a) | | | 19,000 | | | | 240,663 | |
MGI Digital Graphic Technology(a) | | | 8,000 | | | | 332,963 | |
NetGem SA | | | 14,800 | | | | 74,534 | |
Norbert Dentressangle SA | | | 1,200 | | | | 205,771 | |
Prodware(a) | | | 29,100 | | | | 408,563 | |
Sartorius Stedim Biotech | | | 760 | | | | 144,451 | |
Thermador Groupe | | | 600 | | | | 66,418 | |
| | | | | | | | |
| | | | | | | 3,331,799 | |
| | | | | | | | |
| | |
Georgia (0.60%) | | | | | | | | |
Bank of Georgia Holdings PLC | | | 18,400 | | | | 808,658 | |
| | | | | | | | |
| | |
Germany (1.33%) | | | | | | | | |
2G Energy AG | | | 5,100 | | | | 241,875 | |
CompuGroup Medical AG | | | 1,914 | | | | 51,010 | |
Elmos Semiconductor AG | | | 12,100 | | | | 243,242 | |
GAGFAH SA(a) | | | 8,200 | | | | 129,462 | |
LPKF Laser & Electronics AG | | | 7,800 | | | | 174,656 | |
Nexus AG | | | 26,714 | | | | 413,978 | |
Softing AG | | | 8,300 | | | | 166,967 | |
Tomorrow Focus AG | | | 32,100 | | | | 184,815 | |
Wirecard AG | | | 4,200 | | | | 176,059 | |
| | | | | | | | |
| | | | | | | 1,782,064 | |
| | | | | | | | |
| | |
Greece (0.43%) | | | | | | | | |
Hellenic Exchanges - Athens Stock Exchange SA Holding | | | 8,700 | | | | 102,353 | |
Sarantis SA | | | 47,600 | | | | 468,868 | |
| | | | | | | | |
| | | | | | | 571,221 | |
| | | | | | | | |
| | |
Hong Kong (1.18%) | | | | | | | | |
ASR Holdings, Ltd. | | | 3,257,000 | | | | 550,329 | |
Playmates Toys, Ltd.(a) | | | 274,000 | | | | 115,213 | |
See Notes to Financial Statements.
| | |
Annual Report | April 30, 2014 | | 39 |
| | |
| Grandeur Peak Global Reach Fund | | Portfolio of Investments |
April 30, 2014 |
| | | | | | | | |
| | | Shares | | | Value (Note 2) | |
| |
Hong Kong (continued) | | | | | | | | |
Value Partners Group, Ltd. | | | 753,000 | | | $ | 483,679 | |
Vitasoy International Holdings, Ltd. | | | 316,000 | | | | 432,857 | |
| | | | | | | | |
| | | | | | | 1,582,078 | |
| | | | | | | | |
| | |
India (5.42%) | | | | | | | | |
Accelya Kale Solutions, Ltd. | | | 12,300 | | | | 155,720 | |
AIA Engineering, Ltd. | | | 24,200 | | | | 242,161 | |
Ajanta Pharma, Ltd. | | | 9,462 | | | | 155,692 | |
Allahabad Bank | | | 91,000 | | | | 150,950 | |
Amara Raja Batteries, Ltd. | | | 43,600 | | | | 295,763 | |
Bajaj Corp., Ltd. | | | 27,000 | | | | 94,163 | |
Bajaj Finance, Ltd. | | | 12,400 | | | | 384,428 | |
Biocon, Ltd. | | | 14,600 | | | | 113,999 | |
Cera Sanitaryware, Ltd. | | | 4,605 | | | | 73,444 | |
Crisil, Ltd. | | | 12,600 | | | | 271,219 | |
Dewan Housing Finance Corp., Ltd. | | | 50,400 | | | | 189,141 | |
eClerx Services, Ltd. | | | 10,900 | | | | 219,229 | |
Engineers India, Ltd. | | | 68,400 | | | | 259,186 | |
Glenmark Pharmaceuticals, Ltd. | | | 65,100 | | | | 652,511 | |
Infotech Enterprises, Ltd. | | | 78,200 | | | | 406,980 | |
Ipca Laboratories, Ltd. | | | 9,350 | | | | 129,596 | |
Jammu & Kashmir Bank, Ltd. | | | 8,800 | | | | 244,391 | |
KPIT Cummins Infosystems, Ltd. | | | 103,600 | | | | 296,724 | |
La Opala RG, Ltd. | | | 16,501 | | | | 224,131 | |
Mahindra & Mahindra Financial Services, Ltd. | | | 24,030 | | | | 98,028 | |
NIIT Technologies, Ltd. | | | 25,800 | | | | 173,583 | |
Persistent Systems, Ltd. | | | 23,100 | | | | 385,804 | |
Poly Medicure, Ltd. | | | 30,667 | | | | 235,818 | |
Procter & Gamble Hygiene & Health Care, Ltd. | | | 1,000 | | | | 56,421 | |
Repco Home Finance, Ltd. | | | 50,100 | | | | 310,825 | |
Suprajit Engineering, Ltd. | | | 99,900 | | | | 122,152 | |
Supreme Industries, Ltd. | | | 38,000 | | | | 287,355 | |
Unichem Laboratories, Ltd. | | | 85,795 | | | | 306,680 | |
Vaibhav Global, Ltd.(a) | | | 30,100 | | | | 364,529 | |
Vakrangee Software, Ltd. | | | 114,000 | | | | 186,362 | |
Vinati Organics, Ltd. | | | 24,400 | | | | 107,770 | |
V-Mart Retail, Ltd. | | | 18,567 | | | | 98,322 | |
| | | | | | | | |
| | | | | | | 7,293,077 | |
| | | | | | | | |
| | |
Indonesia (1.22%) | | | | | | | | |
Astra Graphia Tbk PT | | | 698,000 | | | | 120,746 | |
See Notes to Financial Statements.
| | |
| 40 | | 1.855.377.7325 | www.GrandeurPeakGlobal.com |
| | |
| Grandeur Peak Global Reach Fund | | Portfolio of Investments |
April 30, 2014 |
| | | | | | | | |
| | | Shares | | | Value (Note 2) | |
| |
Indonesia (continued) | | | | | | | | |
Bank Tabungan Pensiunan Nasional Tbk PT(a) | | | 897,000 | | | $ | 316,159 | |
Express Transindo Utama Tbk PT(a) | | | 3,723,000 | | | | 417,012 | |
Lippo Cikarang Tbk PT(a) | | | 294,000 | | | | 193,898 | |
Tempo Scan Pacific Tbk PT | | | 530,000 | | | | 132,941 | |
Ultrajaya Milk Industry & Trading Co. Tbk PT(a) | | | 1,251,500 | | | | 461,674 | |
| | | | | | | | |
| | | | | | | 1,642,430 | |
| | | | | | | | |
| | |
Ireland (0.91%) | | | | | | | | |
Beazley PLC | | | 62,300 | | | | 257,918 | |
Irish Residential Properties, REIT PLC(a) | | | 304,768 | | | | 435,503 | |
Kentz Corp., Ltd. | | | 43,800 | | | | 533,930 | |
| | | | | | | | |
| | | | | | | 1,227,351 | |
| | | | | | | | |
| | |
Israel (0.85%) | | | | | | | | |
Caesar Stone Sdot Yam, Ltd. | | | 1,115 | | | | 58,181 | |
Magic Software Enterprises, Ltd. | | | 28,700 | | | | 232,183 | |
Sarin Technologies, Ltd. | | | 222,000 | | | | 490,500 | |
SodaStream International, Ltd.(a) | | | 8,600 | | | | 365,758 | |
| | | | | | | | |
| | | | | | | 1,146,622 | |
| | | | | | | | |
| | |
Italy (0.07%) | | | | | | | | |
Cosmo Pharmaceuticals SpA | | | 700 | | | | 94,648 | |
| | | | | | | | |
| | |
Japan (5.16%) | | | | | | | | |
AIT Corp. | | | 49,600 | | | | 369,690 | |
Arcland Service Co., Ltd. | | | 13,000 | | | | 429,794 | |
Benefit One, Inc. | | | 28,700 | | | | 250,127 | |
CMIC Co., Ltd. | | | 7,400 | | | | 118,417 | |
CyberAgent, Inc. | | | 5,700 | | | | 234,724 | |
Daikokutenbussan Co. | | | 4,000 | | | | 103,839 | |
Future Architect, Inc. | | | 53,100 | | | | 313,713 | |
GCA Savvian Corp. | | | 53,200 | | | | 410,051 | |
Gurunavi, Inc. | | | 21,400 | | | | 277,770 | |
Hiday Hidaka Corp. | | | 5,040 | | | | 116,097 | |
Mamezou Holdings Co., Ltd. | | | 25,000 | | | | 85,587 | |
Mani, Inc. | | | 2,900 | | | | 129,491 | |
Monogatari Corp. | | | 18,000 | | | | 648,799 | |
Nakanishi, Inc. | | | 2,600 | | | | 88,756 | |
Seria Co., Ltd. | | | 1,000 | | | | 39,126 | |
Shaklee Global Group, Inc.(a) | | | 34,000 | | | | 1,290,361 | |
SK Kaken Co., Ltd. | | | 6,000 | | | | 404,949 | |
See Notes to Financial Statements.
| | |
Annual Report | April 30, 2014 | | 41 |
| | |
| Grandeur Peak Global Reach Fund | | Portfolio of Investments |
April 30, 2014 |
| | | | | | | | |
| | | Shares | | | Value (Note 2) | |
| |
Japan (continued) | | | | | | | | |
Syuppin Co., Ltd. | | | 48,100 | | | $ | 613,983 | |
Trancom Co., Ltd. | | | 29,000 | | | | 1,019,758 | |
| | | | | | | | |
| | | | | | | 6,945,032 | |
| | | | | | | | |
| | |
Kazakhstan (0.06%) | | | | | | | | |
Nostrum Oil & Gas LP, GDR(c) | | | 8,700 | | | | 87,000 | |
| | | | | | | | |
| | |
Luxembourg (0.36%) | | | | | | | | |
L’Occitane International SA | | | 194,500 | | | | 477,661 | |
| | | | | | | | |
| | |
Malaysia (1.55%) | | | | | | | | |
AEON Credit Service M Bhd | | | 104,100 | | | | 462,242 | |
Berjaya Food Bhd | | | 363,000 | | | | 166,743 | |
CB Industrial Product Holding Bhd | | | 123,100 | | | | 177,177 | |
Freight Management Holdings Bhd | | | 121,900 | | | | 67,193 | |
JobStreet Corp. Bhd | | | 62,600 | | | | 46,008 | |
Kossan Rubber Industries | | | 197,000 | | | | 247,343 | |
My EG Services Bhd | | | 358,400 | | | | 302,920 | |
Padini Holdings Bhd | | | 309,500 | | | | 189,558 | |
Power Root Bhd | | | 752,400 | | | | 426,256 | |
| | | | | | | | |
| | | | | | | 2,085,440 | |
| | | | | | | | |
| | |
Mexico (0.79%) | | | | | | | | |
Credito Real SA | | | 226,700 | | | | 411,890 | |
Genomma Lab Internacional SAB de CV, Class B(a) | | | 180,000 | | | | 457,198 | |
Medica Sur SAB de CV | | | 58,081 | | | | 197,558 | |
| | | | | | | | |
| | | | | | | 1,066,646 | |
| | | | | | | | |
| | |
Netherlands (0.15%) | | | | | | | | |
Aalberts Industries NV | | | 3,100 | | | | 103,154 | |
Brunel International NV | | | 1,500 | | | | 101,668 | |
| | | | | | | | |
| | | | | | | 204,822 | |
| | | | | | | | |
| | |
Norway (0.29%) | | | | | | | | |
Medistim ASA | | | 29,350 | | | | 118,500 | |
Opera Software ASA | | | 20,600 | | | | 265,804 | |
| | | | | | | | |
| | | | | | | 384,304 | |
| | | | | | | | |
| | |
Philippines (1.82%) | | | | | | | | |
COL Financial Group, Inc. | | | 145,800 | | | | 56,580 | |
Concepcion Industrial Corp. | | | 236,000 | | | | 172,050 | |
See Notes to Financial Statements.
| | |
| 42 | | 1.855.377.7325 | www.GrandeurPeakGlobal.com |
| | |
| Grandeur Peak Global Reach Fund | | Portfolio of Investments |
April 30, 2014 |
| | | | | | | | |
| | | Shares | | | Value (Note 2) | |
| |
Philippines (continued) | | | | | | | | |
Pepsi-Cola Products Philippines, Inc. | | | 5,890,100 | | | $ | 660,621 | |
Puregold Price Club, Inc. | | | 240,000 | | | | 247,376 | |
RFM Corp. | | | 2,954,100 | | | | 430,723 | |
Robinsons Land Corp. | | | 479,300 | | | | 239,758 | |
Security Bank Corp. | | | 239,500 | | | | 645,221 | |
| | | | | | | | |
| | | | | | | 2,452,329 | |
| | | | | | | | |
| | |
Poland (0.94%) | | | | | | | | |
Ac SA | | | 9,600 | | | | 122,075 | |
KRUK SA(a) | | | 6,600 | | | | 181,586 | |
Magellan SA(a) | | | 8,100 | | | | 185,936 | |
Quercus TFI SA | | | 49,600 | | | | 116,315 | |
Wawel SA | | | 905 | | | | 388,286 | |
Work Service SA(a) | | | 55,100 | | | | 274,804 | |
| | | | | | | | |
| | | | | | | 1,269,002 | |
| | | | | | | | |
| | |
Russia (0.05%) | | | | | | | | |
MD Medical Group Investments PLC, GDR(c) | | | 11,855 | | | | 73,086 | |
| | | | | | | | |
| | |
Singapore (2.42%) | | | | | | | | |
ARA Asset Management, Ltd. | | | 144,000 | | | | 209,620 | |
Breadtalk Group, Ltd. | | | 115,000 | | | | 128,420 | |
CSE Global, Ltd. | | | 614,000 | | | | 291,401 | |
Goodpack, Ltd. | | | 128,200 | | | | 245,418 | |
Midas Holdings, Ltd. | | | 297,000 | | | | 111,342 | |
Parkson Retail Asia, Ltd. | | | 63,000 | | | | 46,482 | |
Petra Foods, Ltd. | | | 547,000 | | | | 1,548,895 | |
Riverstone Holdings, Ltd. | | | 465,400 | | | | 304,401 | |
Super Group, Ltd. | | | 58,000 | | | | 161,921 | |
Technovator International, Ltd.(a) | | | 391,000 | | | | 206,269 | |
| | | | | | | | |
| | | | | | | 3,254,169 | |
| | | | | | | | |
| | |
South Africa (2.87%) | | | | | | | | |
ARB Holdings, Ltd. | | | 390,300 | | | | 250,418 | |
Clicks Group, Ltd. | | | 102,300 | | | | 623,786 | |
Comair, Ltd. | | | 1,071,002 | | | | 503,917 | |
Ellies Holdings, Ltd.(a) | | | 388,700 | | | | 153,330 | |
EOH Holdings, Ltd. | | | 9,600 | | | | 76,650 | |
Interwaste Holdings, Ltd.(a) | | | 2,583,152 | | | | 360,937 | |
Invicta Holdings, Ltd. | | | 10,200 | | | | 116,253 | |
Italtile, Ltd. | | | 235,000 | | | | 178,699 | |
See Notes to Financial Statements.
| | |
Annual Report | April 30, 2014 | | 43 |
| | |
| Grandeur Peak Global Reach Fund | | Portfolio of Investments |
April 30, 2014 |
| | | | | | | | |
| | | Shares | | | Value (Note 2) | |
| |
South Africa (continued) | | | | | | | | |
MiX Telematics, Ltd., ADR(a) | | | 26,200 | | | $ | 275,100 | |
OneLogix Group, Ltd. | | | 627,938 | | | | 226,811 | |
Pinnacle Technology Holdings, Ltd. | | | 22,500 | | | | 27,803 | |
Super Group, Ltd.(a) | | | 277,100 | | | | 746,185 | |
Transaction Capital, Ltd. | | | 524,700 | | | | 261,839 | |
Value Group, Ltd. | | | 122,000 | | | | 62,041 | |
| | | | | | | | |
| | | | | | | 3,863,769 | |
| | | | | | | | |
| | |
South Korea (3.44%) | | | | | | | | |
Daum Communications Corp. | | | 1,350 | | | | 97,856 | |
Duksan Hi-Metal Co., Ltd.(a) | | | 13,300 | | | | 246,487 | |
ENF Technology Co., Ltd. | | | 10,000 | | | | 88,842 | |
Global Display Co., Ltd. | | | 7,850 | | | | 82,807 | |
Handsome Co., Ltd. | | | 5,000 | | | | 126,294 | |
Hanssem Co., Ltd. | | | 5,370 | | | | 438,622 | |
Hy-Lok Corp. | | | 38,590 | | | | 1,122,258 | |
iMarketKorea, Inc. | | | 4,020 | | | | 121,187 | |
ISC Co., Ltd. | | | 24,485 | | | | 454,962 | |
Koh Young Technology, Inc. | | | 5,100 | | | | 121,417 | |
KONA@I Co., Ltd. | | | 8,300 | | | | 309,252 | |
KT Skylife Co., Ltd. | | | 4,800 | | | | 112,417 | |
LEENO Industrial, Inc. | | | 9,100 | | | | 262,000 | |
LF Corp. | | | 5,200 | | | | 134,869 | |
Sung Kwang Bend Co., Ltd. | | | 13,100 | | | | 306,170 | |
Suprema, Inc.(a) | | | 5,400 | | | | 133,524 | |
Vieworks Co., Ltd. | | | 11,600 | | | | 292,442 | |
Wins Technet Co., Ltd. | | | 12,500 | | | | 169,965 | |
| | | | | | | | |
| | | | | | | 4,621,371 | |
| | | | | | | | |
| | |
Spain (0.23%) | | | | | | | | |
Let’s GOWEX SA | | | 10,700 | | | | 304,018 | |
| | | | | | | | |
| | |
Sweden (2.30%) | | | | | | | | |
AddTech AB, Class B | | | 3,700 | | | | 56,477 | |
Beijer Alma AB | | | 15,500 | | | | 437,429 | |
Bufab Holding AB(a) | | | 104,850 | | | | 1,032,020 | |
Cloetta AB, Class B(a) | | | 56,900 | | | | 187,269 | |
IAR Systems Group AB | | | 6,800 | | | | 69,546 | |
Moberg Pharma AB(a) | | | 23,352 | | | | 108,460 | |
Nibe Industrier AB, Class B | | | 3,900 | | | | 109,463 | |
Odd Molly International AB(a) | | | 31,420 | | | | 251,275 | |
See Notes to Financial Statements.
| | |
| 44 | | 1.855.377.7325 | www.GrandeurPeakGlobal.com |
| | |
| Grandeur Peak Global Reach Fund | | Portfolio of Investments |
April 30, 2014 |
| | | | | | | | |
| | | Shares | | | Value (Note 2) | |
| |
Sweden (continued) | | | | | | | | |
Opus Group AB | | | 362,497 | | | $ | 710,811 | |
Vitec Software Group AB, Class B | | | 8,700 | | | | 128,783 | |
| | | | | | | | |
| | | | | | | 3,091,533 | |
| | | | | | | | |
| | |
Switzerland (0.39%) | | | | | | | | |
VZ Holding AG | | | 3,100 | | | | 520,248 | |
| | | | | | | | |
| | |
Taiwan (3.67%) | | | | | | | | |
ASPEED Technology, Inc. | | | 22,100 | | | | 191,009 | |
Chipbond Technology Corp. | | | 100,000 | | | | 170,872 | |
Cleanaway Co., Ltd. | | | 64,000 | | | | 362,408 | |
Cowealth Medical Holding Co., Ltd. | | | 55,000 | | | | 182,131 | |
Cub Elecparts, Inc. | | | 30,000 | | | | 265,249 | |
DYNACOLOR, Inc. | | | 77,000 | | | | 199,907 | |
King’s Town Bank | | | 339,000 | | | | 314,326 | |
Ledlink Optics, Inc. | | | 12,888 | | | | 38,112 | |
Novatek Microelectronics Corp. | | | 54,000 | | | | 249,454 | |
On-Bright Electronics, Inc. | | | 23,000 | | | | 208,689 | |
Pacific Hospital Supply Co. | | | 28,000 | | | | 72,323 | |
Polyronics Tech Corp. | | | 149,000 | | | | 355,255 | |
Richtek Technology Corp. | | | 22,000 | | | | 126,035 | |
Silergy Corp.(a) | | | 45,000 | | | | 372,541 | |
Sinmag Equipment Corp. | | | 45,000 | | | | 250,348 | |
Sporton International, Inc. | | | 135,540 | | | | 594,710 | |
Test Research, Inc. | | | 140,440 | | | | 235,322 | |
TSC Auto ID Technology Co., Ltd. | | | 29,000 | | | | 235,281 | |
UDE Corp. | | | 115,000 | | | | 390,341 | |
Voltronic Power Technology Corp. | | | 19,000 | | | | 123,634 | |
| | | | | | | | |
| | | | | | | 4,937,947 | |
| | | | | | | | |
| | |
Thailand (0.83%) | | | | | | | | |
Jubilee Enterprise PCL | | | 227,600 | | | | 188,143 | |
LPN Development PCL | | | 665,700 | | | | 357,947 | |
Nok Airlines PCL | | | 413,600 | | | | 230,062 | |
Premier Marketing PCL | | | 1,179,800 | | | | 339,065 | |
| | | | | | | | |
| | | | | | | 1,115,217 | |
| | | | | | | | |
| | |
Turkey (1.61%) | | | | | | | | |
Albaraka Turk Katilim Bankasi AS | | | 321,400 | | | | 254,192 | |
EGE Seramik Sanayi ve Ticaret AS | | | 269,700 | | | | 367,851 | |
Emlak Konut Gayrimenkul Yatirim Ortakligi AS, REIT | | | 134,900 | | | | 176,327 | |
See Notes to Financial Statements.
| | |
Annual Report | April 30, 2014 | | 45 |
| | |
| Grandeur Peak Global Reach Fund | | Portfolio of Investments |
April 30, 2014 |
| | | | | | | | |
| | | Shares | | | Value (Note 2) | |
| |
Turkey (continued) | | | | | | | | |
Is Girisim Sermayesi Yatirim Ortakligi AS | | | 104,500 | | | $ | 128,178 | |
Koza Altin Isletmeleri AS | | | 4,600 | | | | 45,857 | |
Pegasus Hava Tasimaciligi AS(a) | | | 22,650 | | | | 302,494 | |
Pinar SUT Mamulleri Sanayii AS | | | 57,700 | | | | 498,698 | |
TAV Havalimanlari Holding AS | | | 23,000 | | | | 184,083 | |
Uyum Gida Ihtiyac Maddeleri Sanayi ve Ticaret AS(a) | | | 182,900 | | | | 203,554 | |
| | | | | | | | |
| | | | | | | 2,161,234 | |
| | | | | | | | |
| | |
United States (22.19%) | | | | | | | | |
Abaxis, Inc.(a) | | | 12,500 | | | | 507,625 | |
ABIOMED, Inc.(a) | | | 37,750 | | | | 894,297 | |
Altisource Asset Management Corp.(a) | | | 260 | | | | 254,345 | |
Altisource Residential Corp. | | | 19,000 | | | | 534,280 | |
Ambarella, Inc.(a) | | | 10,950 | | | | 272,107 | |
Amber Road, Inc.(a) | | | 4,500 | | | | 59,940 | |
Amedica Corp.(a) | | | 22,000 | | | | 147,400 | |
Aratana Therapeutics, Inc.(a) | | | 19,600 | | | | 270,088 | |
Ares Capital Corp. | | | 6,950 | | | | 119,331 | |
Asure Software, Inc.(a) | | | 18,500 | | | | 111,370 | |
Atwood Oceanics, Inc.(a) | | | 2,250 | | | | 111,510 | |
BioDelivery Sciences International, Inc.(a) | | | 75,700 | | | | 674,487 | |
Carbonite, Inc.(a) | | | 38,400 | | | | 379,776 | |
Cardica, Inc.(a) | | | 148,600 | | | | 159,002 | |
Cardtronics, Inc.(a) | | | 5,600 | | | | 187,488 | |
Ceco Environmental Corp. | | | 3,500 | | | | 55,615 | |
Cempra, Inc.(a) | | | 52,900 | | | | 482,448 | |
Computer Task Group, Inc. | | | 6,236 | | | | 98,591 | |
Covance, Inc.(a) | | | 1,000 | | | | 88,280 | |
CRA International, Inc.(a) | | | 5,400 | | | | 117,558 | |
Diamond Hill Investment Group, Inc. | | | 2,700 | | | | 320,544 | |
Ellie Mae, Inc.(a) | | | 4,700 | | | | 114,633 | |
Enanta Pharmaceuticals, Inc.(a) | | | 1,600 | | | | 59,536 | |
Enservco Corp.(a) | | | 51,200 | | | | 100,352 | |
EPAM Systems, Inc.(a) | | | 9,300 | | | | 289,509 | |
ePlus, Inc.(a) | | | 5,900 | | | | 295,236 | |
Everyday Health, Inc.(a) | | | 4,280 | | | | 60,305 | |
Exact Sciences Corp.(a) | | | 45,550 | | | | 546,600 | |
First Cash Financial Services, Inc.(a) | | | 7,275 | | | | 354,802 | |
First of Long Island Corp. | | | 4,550 | | | | 165,029 | |
First Republic Bank | | | 43,050 | | | | 2,185,218 | |
Fresh Market, Inc.(a) | | | 1,700 | | | | 63,070 | |
See Notes to Financial Statements.
| | |
| 46 | | 1.855.377.7325 | www.GrandeurPeakGlobal.com |
| | |
| Grandeur Peak Global Reach Fund | | Portfolio of Investments |
April 30, 2014 |
| | | | | | | | |
| | | Shares | | | Value (Note 2) | |
| |
United States (continued) | | | | | | | | |
Geospace Technologies Corp.(a) | | | 3,910 | | | $ | 227,288 | |
Grand Canyon Education, Inc.(a) | | | 3,300 | | | | 142,296 | |
HCC Insurance Holdings, Inc. | | | 3,815 | | | | 175,261 | |
HeartWare International, Inc.(a) | | | 700 | | | | 59,472 | |
Home BancShares, Inc. | | | 11,300 | | | | 358,323 | |
Inphi Corp.(a) | | | 13,800 | | | | 204,102 | |
Integrated Silicon Solution, Inc.(a) | | | 31,900 | | | | 461,274 | |
InvenSense, Inc.(a) | | | 5,600 | | | | 120,568 | |
IPC The Hospitalist Co., Inc.(a) | | | 3,700 | | | | 149,850 | |
Jones Energy, Inc., Class A(a) | | | 20,900 | | | | 323,323 | |
KEYW Holding Corp.(a) | | | 13,940 | | | | 179,129 | |
LGI Homes, Inc.(a) | | | 33,300 | | | | 490,176 | |
Littelfuse, Inc. | | | 2,125 | | | | 192,419 | |
LSB Industries, Inc.(a) | | | 1,850 | | | | 70,652 | |
Manitex International, Inc.(a) | | | 23,900 | | | | 393,394 | |
Manning & Napier, Inc. | | | 7,910 | | | | 131,464 | |
Marin Software, Inc.(a) | | | 26,000 | | | | 243,880 | |
MarketAxess Holdings, Inc. | | | 8,230 | | | | 443,432 | |
Mavenir Systems, Inc.(a) | | | 15,500 | | | | 231,260 | |
Maxim Integrated Products, Inc. | | | 8,335 | | | | 270,387 | |
MaxLinear, Inc., Class A(a) | | | 53,500 | | | | 421,045 | |
Medical Properties Trust, Inc., REIT | | | 7,800 | | | | 105,300 | |
Meridian Bioscience, Inc. | | | 1,850 | | | | 36,945 | |
Micrel, Inc. | | | 26,750 | | | | 266,430 | |
Microchip Technology, Inc. | | | 7,525 | | | | 357,739 | |
Micronet Enertec Technologies, Inc.(a) | | | 12,000 | | | | 48,600 | |
Navigant Consulting, Inc.(a) | | | 15,850 | | | | 266,280 | |
NorthStar Realty Finance Corp., REIT | | | 29,200 | | | | 467,784 | |
Nu Skin Enterprises, Inc., Class A | | | 2,645 | | | | 230,115 | |
NxStage Medical, Inc.(a) | | | 29,400 | | | | 336,336 | |
Pegasystems, Inc. | | | 4,300 | | | | 71,251 | |
Performant Financial Corp.(a) | | | 48,495 | | | | 422,391 | |
Pericom Semiconductor Corp.(a) | | | 32,450 | | | | 261,872 | |
Portfolio Recovery Associates, Inc.(a) | | | 1,655 | | | | 94,583 | |
Power Integrations, Inc. | | | 21,165 | | | | 999,623 | |
Q2 Holdings, Inc.(a) | | | 7,100 | | | | 87,188 | |
RealPage, Inc.(a) | | | 15,975 | | | | 283,556 | |
Redwood Trust, Inc., REIT | | | 13,780 | | | | 300,404 | |
Resources Connection, Inc. | | | 8,600 | | | | 117,046 | |
Roadrunner Transportation Systems, Inc.(a) | | | 109,150 | | | | 2,688,365 | |
Ruckus Wireless, Inc.(a) | | | 16,850 | | | | 176,083 | |
See Notes to Financial Statements.
| | |
Annual Report | April 30, 2014 | | 47 |
| | |
| Grandeur Peak Global Reach Fund | | Portfolio of Investments |
April 30, 2014 |
| | | | | | | | |
| | | Shares | | | Value (Note 2) | |
| |
United States (continued) | | | | | | | | |
Rush Enterprises, Inc., Class A(a) | | | 12,000 | | | $ | 385,200 | |
SEI Investments Co. | | | 9,550 | | | | 309,229 | |
Signature Bank(a) | | | 4,975 | | | | 591,130 | |
Silicon Laboratories, Inc.(a) | | | 1,200 | | | | 53,940 | |
Sonus Networks, Inc.(a) | | | 57,800 | | | | 189,006 | |
Spirit Airlines, Inc.(a) | | | 950 | | | | 53,998 | |
Staar Surgical Co.(a) | | | 45,444 | | | | 773,002 | |
Streamline Health Solutions, Inc.(a) | | | 23,300 | | | | 116,500 | |
Synaptics, Inc.(a) | | | 7,700 | | | | 478,555 | |
Syntel, Inc.(a) | | | 3,500 | | | | 281,120 | |
Tandy Leather Factory, Inc.(a) | | | 14,300 | | | | 139,997 | |
TearLab Corp.(a) | | | 28,200 | | | | 121,824 | |
Transcat, Inc.(a) | | | 51,360 | | | | 505,382 | |
TriMas Corp.(a) | | | 17,200 | | | | 616,792 | |
TriNet Group, Inc.(a) | | | 4,995 | | | | 107,143 | |
Universal Truckload Services, Inc. | | | 17,700 | | | | 436,482 | |
Virtusa Corp.(a) | | | 4,100 | | | | 135,177 | |
Vocera Communications, Inc.(a) | | | 5,900 | | | | 89,975 | |
Wesco Aircraft Holdings, Inc.(a) | | | 55,900 | | | | 1,132,534 | |
Whitestone, REIT | | | 23,500 | | | | 329,705 | |
| | | | | | | | |
| | | | | | | 29,833,949 | |
| | | | | | | | |
| | |
Vietnam (0.24%) | | | | | | | | |
DHG Pharmaceutical JSC | | | 20,000 | | | | 133,760 | |
Viet Nam Dairy Products JSC | | | 29,030 | | | | 191,399 | |
| | | | | | | | |
| | | | | | | 325,159 | |
| | | | | | | | |
| | |
TOTAL COMMON STOCKS (Cost $110,764,083) | | | | | | | 117,957,351 | |
| | | | | | | | |
| | |
PREFERRED STOCKS (0.23%) | | | | | | | | |
Brazil (0.23%) | | | | | | | | |
Banco ABC Brasil SA | | | 54,255 | | | | 317,537 | |
| | | | | | | | |
| | |
TOTAL PREFERRED STOCKS (Cost $287,207) | | | | | | | 317,537 | |
| | | | | | | | |
See Notes to Financial Statements.
| | |
| 48 | | 1.855.377.7325 | www.GrandeurPeakGlobal.com |
| | |
| Grandeur Peak Global Reach Fund | | Portfolio of Investments |
April 30, 2014 |
| | | | |
| |
TOTAL INVESTMENTS (87.95%) (Cost $111,051,290) | | $ | 118,274,888 | |
| |
Assets In Excess Of Other Liabilities (12.05%) | | | 16,198,778 | |
| | | | |
| |
NET ASSETS (100.00%) | | $ | 134,473,666 | |
| | | | |
| (a) | Non-Income Producing Security. |
| (b) | Fair valued security under the procedures approved by the Fund’s Board of Trustees. |
| (c) | Security was purchased pursuant to Regulation S under the Securities Act of 1933, which exempts securities offered and sold outside of the United States from registration. Such security cannot be sold in the United States without either an effective registration statement filed pursuant to the Securities Act of 1933, or pursuant to an exemption from registration. The security has been deemed liquid under guidelines approved by the Fund’s Board of Trustees. As of April 30, 2014, the aggregate market value of those securities was $160,086, representing 0.12% of net assets. |
Common Abbreviations:
AB - Aktiebolag is the Swedish equivalent of the term corporation.
ADR - American Depositary Receipt.
AG - Aktiengesellschaft is a German term that refers to a corporation that is limited by shares, i.e., owned by shareholders.
AS - Aktieselskab is the Danish term for a stock-based corporation.
ASA - Allmennaksjeselskap is the Norwegian term for public limited company.
Bhd - Berhad is the Malaysian term for public limited company.
GDR - Global Depositary Receipt.
JSC - Joint Stock Company.
LP - Limited Partnerships.
Ltd. - Limited.
NV - Naamloze Vennootschap is the Dutch term for a public limited liability corporation.
OYJ - Julkinen Osakeyhtiö is the Finnish term for a public limited company.
PCL - Public Company Limited.
PLC - Public Limited Company.
REIT - Real Estate Investment Trust.
SA - Generally designates corporations in various countries, mostly those employing the civil law.
SAB de CV - A variable capital company.
SE - A European Company which can operate on a Europe-wide basis and be governed by community law directly applicable in all member states.
SpA - Societa’ Per Azioni is an Italian shared company.
Tbk PT - Terbuka Perseroan Terbatas is an Indonesian term for a limited liability company.
Holdings are subject to change.
For Fund compliance purposes, the Fund’s geographical classifications refer to any one or more of the country sub-classifications used by one or more widely recognized market indexes or ratings group indexes, and/or as defined by Fund management. This definition may not apply for purposes of this report, which may combine sub-classifications for reporting ease. Geographical regions are shown as a percentage of net assets.
See Notes to Financial Statements.
| | |
Annual Report | April 30, 2014 | | 49 |
| | |
| Grandeur Peak International Opportunities Fund | | Portfolio of Investments |
April 30, 2014 |
| | | | | | | | |
| | | Shares | | | Value (Note 2) | |
| |
COMMON STOCKS (88.67%) | | | | | | | | |
Australia (3.29%) | | | | | | | | |
ALS, Ltd. | | | 293,185 | | | $ | 2,042,759 | |
Countplus, Ltd. | | | 974,352 | | | | 1,584,047 | |
CTI Logistics, Ltd. | | | 1,407,259 | | | | 2,601,605 | |
Magellan Financial Group, Ltd. | | | 1,477,240 | | | | 17,154,390 | |
Medical Developments International, Ltd. | | | 576,538 | | | | 669,503 | |
Super Retail Group, Ltd. | | | 158,000 | | | | 1,491,300 | |
Webjet, Ltd. | | | 435,318 | | | | 1,112,125 | |
| | | | | | | | |
| | | | | | | 26,655,729 | |
| | | | | | | | |
| | |
Austria (0.14%) | | | | | | | | |
Palfinger AG | | | 30,283 | | | | 1,117,547 | |
| | | | | | | | |
| | |
Belgium (1.57%) | | | | | | | | |
Melexis NV | | | 316,323 | | | | 12,735,424 | |
| | | | | | | | |
| | |
Brazil (3.87%) | | | | | | | | |
Banco Daycoval SA | | | 1,579,600 | | | | 6,375,782 | |
CETIP SA - Mercados Organizados | | | 977,995 | | | | 12,399,560 | |
Even Construtora e Incorporadora SA | | | 847,000 | | | | 2,754,008 | |
Tegma Gestao Logistica | | | 607,144 | | | | 5,116,374 | |
Valid Solucoes SA | | | 309,200 | | | | 4,766,097 | |
| | | | | | | | |
| | | | | | | 31,411,821 | |
| | | | | | | | |
| | |
Britain (10.18%) | | | | | | | | |
Abcam PLC | | | 196,510 | | | | 1,310,553 | |
Advanced Medical Solutions Group PLC | | | 2,088,529 | | | | 4,381,369 | |
Blinkx PLC(a) | | | 3,174,500 | | | | 4,596,025 | |
Bovis Homes Group PLC | | | 313,200 | | | | 4,180,195 | |
Brammer PLC | | | 471,317 | | | | 3,734,138 | |
Brit PLC(a) | | | 638,100 | | | | 2,292,088 | |
Clinigen Group PLC | | | 1,525,182 | | | | 12,495,687 | |
EMIS Group PLC | | | 605,500 | | | | 6,445,731 | |
Globo PLC(a) | | | 2,716,310 | | | | 2,522,406 | |
Halma PLC | | | 245,129 | | | | 2,323,900 | |
Hunting PLC | | | 403,100 | | | | 5,761,196 | |
IG Group Holdings PLC | | | 503,800 | | | | 5,409,887 | |
N Brown Group PLC | | | 226,495 | | | | 1,961,774 | |
Premier Oil PLC | | | 883,280 | | | | 5,052,598 | |
RPS Group PLC | | | 2,821,790 | | | | 14,030,816 | |
Ted Baker PLC | | | 49,809 | | | | 1,554,954 | |
See Notes to Financial Statements.
| | |
| 50 | | 1.855.377.7325 | www.GrandeurPeakGlobal.com |
| | |
| Grandeur Peak International Opportunities Fund | | Portfolio of Investments |
April 30, 2014 |
| | | | | | | | |
| | | Shares | | | Value (Note 2) | |
| |
Britain (continued) | | | | | | | | |
Tracsis PLC | | | 253,100 | | | $ | 1,309,772 | |
Ultra Electronics Holdings PLC | | | 113,500 | | | | 3,250,084 | |
| | | | | | | | |
| | | | | | | 82,613,173 | |
| | | | | | | | |
| | |
Canada (3.08%) | | | | | | | | |
Contrans Group, Inc., Class A | | | 116,700 | | | | 1,531,085 | |
Halogen Software, Inc.(a) | | | 136,700 | | | | 1,184,846 | |
Home Capital Group, Inc. | | | 275,460 | | | | 11,638,659 | |
Richelieu Hardware, Ltd. | | | 97,450 | | | | 4,364,601 | |
Stantec, Inc. | | | 69,976 | | | | 4,147,293 | |
TransForce, Inc. | | | 97,400 | | | | 2,126,529 | |
| | | | | | | | |
| | | | | | | 24,993,013 | |
| | | | | | | | |
| | |
China (8.30%) | | | | | | | | |
China Medical System Holdings, Ltd. | | | 8,674,123 | | | | 10,270,729 | |
China Pioneer Pharma Holdings, Ltd.(a) | | | 3,577,000 | | | | 1,914,697 | |
Dongpeng Holdings Co., Ltd.(a) | | | 16,080,400 | | | | 6,616,382 | |
Far East Horizon, Ltd. | | | 8,621,000 | | | | 5,837,810 | |
Labixiaoxin Snacks Group, Ltd.(b) | | | 14,500,000 | | | | 4,769,152 | |
Le Saunda Holdings, Ltd. | | | 4,989,800 | | | | 2,381,321 | |
Man Wah Holdings, Ltd. | | | 5,568,900 | | | | 9,122,338 | |
Montage Technology Group, Ltd.(a) | | | 273,580 | | | | 5,687,728 | |
NQ Mobile, Inc., ADR(a) | | | 99,666 | | | | 1,231,872 | |
O2Micro International, Ltd., ADR(a) | | | 569,914 | | | | 2,051,690 | |
Pacific Online, Ltd. | | | 5,136,152 | | | | 2,782,404 | |
Sihuan Pharmaceutical Holdings Group, Ltd. | | | 2,242,000 | | | | 2,469,599 | |
SPT Energy Group, Inc. | | | 11,598,000 | | | | 6,297,936 | |
Tao Heung Holdings, Ltd. | | | 3,019,700 | | | | 1,935,768 | |
WuXi PharmaTech Cayman, Inc., ADR(a) | | | 117,500 | | | | 3,995,000 | |
| | | | | | | | |
| | | | | | | 67,364,426 | |
| | | | | | | | |
| | |
Colombia (1.53%) | | | | | | | | |
Gran Tierra Energy, Inc.(a) | | | 1,015,750 | | | | 7,262,612 | |
Parex Resources, Inc.(a) | | | 513,100 | | | | 5,130,766 | |
| | | | | | | | |
| | | | | | | 12,393,378 | |
| | | | | | | | |
| | |
Finland (0.52%) | | | | | | | | |
BasWare OYJ | | | 39,743 | | | | 1,876,324 | |
Revenio Group OYJ | | | 106,000 | | | | 2,357,353 | |
| | | | | | | | |
| | | | | | | 4,233,677 | |
| | | | | | | | |
See Notes to Financial Statements.
| | |
Annual Report | April 30, 2014 | | 51 |
| | |
| Grandeur Peak International Opportunities Fund | | Portfolio of Investments |
April 30, 2014 |
| | | | | | | | |
| | | Shares | | | Value (Note 2) | |
| |
France (2.61%) | | | | | | | | |
Argan | | | 36,200 | | | $ | 803,552 | |
Audika Groupe(a) | | | 122,381 | | | | 2,242,859 | |
Esker SA | | | 78,800 | | | | 2,103,374 | |
GameLoft SE(a) | | | 251,700 | | | | 2,503,731 | |
Medicrea International(a) | | | 112,338 | | | | 1,422,927 | |
MGI Digital Graphic Technology(a) | | | 53,050 | | | | 2,207,963 | |
Neurones | | | 79,220 | | | | 1,714,528 | |
Prodware(a) | | | 268,000 | | | | 3,762,708 | |
Sartorius Stedim Biotech | | | 14,012 | | | | 2,663,213 | |
Thermador Groupe | | | 15,765 | | | | 1,745,130 | |
| | | | | | | | |
| | | | | | | 21,169,985 | |
| | | | | | | | |
| | |
Georgia (0.74%) | | | | | | | | |
Bank of Georgia Holdings PLC | | | 137,311 | | | | 6,034,655 | |
| | | | | | | | |
| | |
Germany (2.44%) | | | | | | | | |
Bertrandt AG | | | 37,500 | | | | 5,673,384 | |
CompuGroup Medical AG | | | 42,300 | | | | 1,127,335 | |
Nexus AG | | | 364,726 | | | | 5,652,039 | |
Softing AG | | | 96,691 | | | | 1,945,088 | |
Wirecard AG | | | 128,770 | | | | 5,397,871 | |
| | | | | | | | |
| | | | | | | 19,795,717 | |
| | | | | | | | |
| | |
Hong Kong (1.37%) | | | | | | | | |
ASR Holdings, Ltd. | | | 21,380,000 | | | | 3,612,535 | |
Value Partners Group, Ltd. | | | 7,090,000 | | | | 4,554,163 | |
Vitasoy International Holdings, Ltd. | | | 2,163,338 | | | | 2,963,343 | |
| | | | | | | | |
| | | | | | | 11,130,041 | |
| | | | | | | | |
| | |
India (5.66%) | | | | | | | | |
Ajanta Pharma, Ltd. | | | 175,249 | | | | 2,883,626 | |
Amara Raja Batteries, Ltd. | | | 453,100 | | | | 3,073,628 | |
Bajaj Corp., Ltd. | | | 476,500 | | | | 1,661,805 | |
Bajaj Finance, Ltd. | | | 114,200 | | | | 3,540,456 | |
Cera Sanitaryware, Ltd. | | | 64,866 | | | | 1,034,533 | |
City Union Bank, Ltd. | | | 838,865 | | | | 814,317 | |
Crisil, Ltd. | | | 82,500 | | | | 1,775,839 | |
Glenmark Pharmaceuticals, Ltd. | | | 643,100 | | | | 6,445,927 | |
Infotech Enterprises, Ltd. | | | 458,767 | | | | 2,387,581 | |
Jammu & Kashmir Bank, Ltd. | | | 89,000 | | | | 2,471,681 | |
KPIT Cummins Infosystems, Ltd. | | | 1,646,321 | | | | 4,715,277 | |
See Notes to Financial Statements.
| | |
| 52 | | 1.855.377.7325 | www.GrandeurPeakGlobal.com |
| | |
| Grandeur Peak International Opportunities Fund | | Portfolio of Investments |
April 30, 2014 |
| | | | | | | | |
| | | Shares | | | Value (Note 2) | |
| |
India (continued) | | | | | | | | |
Mahindra & Mahindra Financial Services, Ltd. | | | 352,300 | | | $ | 1,437,179 | |
Persistent Systems, Ltd. | | | 184,600 | | | | 3,083,094 | |
Supreme Industries, Ltd. | | | 352,400 | | | | 2,664,837 | |
Unichem Laboratories, Ltd. | | | 747,305 | | | | 2,671,292 | |
Vaibhav Global, Ltd.(a) | | | 191,000 | | | | 2,313,122 | |
Vakrangee Software, Ltd. | | | 1,805,600 | | | | 2,951,706 | |
| | | | | | | | |
| | | | | | | 45,925,900 | |
| | | | | | | | |
| | |
Indonesia (1.05%) | | | | | | | | |
Astra Graphia Tbk PT | | | 8,869,700 | | | | 1,534,351 | |
Express Transindo Utama Tbk PT(a) | | | 22,620,500 | | | | 2,533,715 | |
Lippo Cikarang Tbk PT(a) | | | 2,329,000 | | | | 1,536,014 | |
Ultrajaya Milk Industry & Trading Co. Tbk PT(a) | | | 7,977,500 | | | | 2,942,874 | |
| | | | | | | | |
| | | | | | | 8,546,954 | |
| | | | | | | | |
| | |
Ireland (2.03%) | | | | | | | | |
Beazley PLC | | | 897,200 | | | | 3,714,348 | |
Irish Residential Properties, REIT PLC(a) | | | 2,907,600 | | | | 4,154,867 | |
Kentz Corp., Ltd. | | | 708,000 | | | | 8,630,648 | |
| | | | | | | | |
| | | | | | | 16,499,863 | |
| | | | | | | | |
| | |
Israel (0.87%) | | | | | | | | |
Sarin Technologies, Ltd. | | | 1,249,000 | | | | 2,759,616 | |
SodaStream International, Ltd.(a) | | | 100,700 | | | | 4,282,771 | |
| | | | | | | | |
| | | | | | | 7,042,387 | |
| | | | | | | | |
| | |
Japan (5.86%) | | | | | | | | |
AIT Corp. | | | 339,800 | | | | 2,532,671 | |
Arcland Service Co., Ltd. | | | 50,200 | | | | 1,659,666 | |
Benefit One, Inc. | | | 470,100 | | | | 4,097,022 | |
CMIC Co., Ltd. | | | 132,755 | | | | 2,124,392 | |
CyberAgent, Inc. | | | 46,600 | | | | 1,918,971 | |
Daikokutenbussan Co. | | | 62,000 | | | | 1,609,507 | |
Future Architect, Inc. | | | 464,700 | | | | 2,745,428 | |
GCA Savvian Corp. | | | 367,400 | | | | 2,831,821 | |
Gurunavi, Inc. | | | 180,000 | | | | 2,336,382 | |
Hiday Hidaka Corp. | | | 176,760 | | | | 4,071,696 | |
Monogatari Corp. | | | 100,900 | | | | 3,636,881 | |
Nakanishi, Inc. | | | 58,500 | | | | 1,997,017 | |
Seria Co., Ltd. | | | 77,000 | | | | 3,012,667 | |
Shaklee Global Group, Inc.(a) | | | 12,000 | | | | 455,421 | |
See Notes to Financial Statements.
| | |
Annual Report | April 30, 2014 | | 53 |
| | |
| Grandeur Peak International Opportunities Fund | | Portfolio of Investments |
April 30, 2014 |
| | | | | | | | |
| | | Shares | | | Value (Note 2) | |
| |
Japan (continued) | | | | | | | | |
SK Kaken Co., Ltd. | | | 35,000 | | | $ | 2,362,205 | |
Syuppin Co., Ltd. | | | 54,200 | | | | 691,847 | |
Trancom Co., Ltd. | | | 259,790 | | | | 9,135,277 | |
Watts Co., Ltd. | | | 36,100 | | | | 350,636 | |
| | | | | | | | |
| | | | | | | 47,569,507 | |
| | | | | | | | |
| | |
Luxembourg (0.76%) | | | | | | | | |
L’Occitane International SA | | | 2,522,712 | | | | 6,195,375 | |
| | | | | | | | |
| | |
Malaysia (3.27%) | | | | | | | | |
AEON Credit Service M Bhd | | | 1,056,340 | | | | 4,690,531 | |
Berjaya Food Bhd | | | 3,950,800 | | | | 1,814,791 | |
CB Industrial Product Holding Bhd | | | 1,337,400 | | | | 1,924,906 | |
JobStreet Corp. Bhd | | | 417,000 | | | | 306,477 | |
Kossan Rubber Industries | | | 1,763,000 | | | | 2,213,536 | |
My EG Services Bhd | | | 7,175,700 | | | | 6,064,900 | |
Padini Holdings Bhd | | | 8,523,750 | | | | 5,220,487 | |
Uzma Bhd | | | 2,319,200 | | | | 4,332,298 | |
| | | | | | | | |
| | | | | | | 26,567,926 | |
| | | | | | | | |
| | |
Mexico (0.52%) | | | | | | | | |
Genomma Lab Internacional SAB de CV, Class B(a) | | | 1,648,400 | | | | 4,186,913 | |
| | | | | | | | |
| | |
Netherlands (0.23%) | | | | | | | | |
Aalberts Industries NV | | | 56,169 | | | | 1,869,053 | |
| | | | | | | | |
| | |
Norway (0.75%) | | | | | | | | |
Medistim ASA | | | 417,000 | | | | 1,683,630 | |
Opera Software ASA | | | 343,400 | | | | 4,430,930 | |
| | | | | | | | |
| | | | | | | 6,114,560 | |
| | | | | | | | |
| | |
Oman (0.30%) | | | | | | | | |
Al Anwar Ceramic Tile Co. | | | 1,575,000 | | | | 2,413,636 | |
| | | | | | | | |
| | |
Philippines (2.09%) | | | | | | | | |
COL Financial Group, Inc. | | | 2,849,000 | | | | 1,105,601 | |
Pepsi-Cola Products Philippines, Inc. | | | 45,267,500 | | | | 5,077,108 | |
Puregold Price Club, Inc. | | | 1,432,000 | | | | 1,476,007 | |
RFM Corp. | | | 20,104,700 | | | | 2,931,372 | |
See Notes to Financial Statements.
| | |
| 54 | | 1.855.377.7325 | www.GrandeurPeakGlobal.com |
| | |
| Grandeur Peak International Opportunities Fund | | Portfolio of Investments |
April 30, 2014 |
| | | | | | | | |
| | | Shares | | | Value (Note 2) | |
| |
Philippines (continued) | | | | | | | | |
Security Bank Corp. | | | 2,356,760 | | | $ | 6,349,190 | |
| | | | | | | | |
| | | | | | | 16,939,278 | |
| | | | | | | | |
| | |
Russia (0.12%) | | | | | | | | |
MD Medical Group Investments PLC, GDR(c) | | | 157,000 | | | | 967,905 | |
| | | | | | | | |
| | |
Singapore (2.75%) | | | | | | | | |
ARA Asset Management, Ltd. | | | 2,460,212 | | | | 3,581,309 | |
Breadtalk Group, Ltd. | | | 2,900,375 | | | | 3,238,833 | |
CSE Global, Ltd. | | | 4,910,055 | | | | 2,330,289 | |
Goodpack, Ltd. | | | 2,257,000 | | | | 4,320,651 | |
Parkson Retail Asia, Ltd. | | | 2,251,000 | | | | 1,660,824 | |
Petra Foods, Ltd. | | | 1,849,600 | | | | 5,237,361 | |
Riverstone Holdings, Ltd. | | | 2,940,000 | | | | 1,922,948 | |
| | | | | | | | |
| | | | | | | 22,292,215 | |
| | | | | | | | |
| | |
South Africa (2.20%) | | | | | | | | |
Clicks Group, Ltd. | | | 273,485 | | | | 1,667,607 | |
Ellies Holdings, Ltd.(a) | | | 3,854,240 | | | | 1,520,374 | |
EOH Holdings, Ltd. | | | 294,856 | | | | 2,354,252 | |
Italtile, Ltd. | | | 3,988,625 | | | | 3,033,031 | |
MiX Telematics, Ltd., ADR(a) | | | 164,500 | | | | 1,727,250 | |
OneLogix Group, Ltd. | | | 2,450,980 | | | | 885,293 | |
Pinnacle Technology Holdings, Ltd. | | | 655,600 | | | | 810,114 | |
Super Group, Ltd.(a) | | | 1,966,797 | | | | 5,296,265 | |
Value Group, Ltd. | | | 1,017,368 | | | | 517,363 | |
| | | | | | | | |
| | | | | | | 17,811,549 | |
| | | | | | | | |
| | |
South Korea (6.38%) | | | | | | | | |
Daum Communications Corp. | | | 44,800 | | | | 3,247,382 | |
Duksan Hi-Metal Co., Ltd.(a) | | | 211,600 | | | | 3,921,552 | |
ENF Technology Co., Ltd. | | | 144,600 | | | | 1,284,649 | |
Global Display Co., Ltd. | | | 245,750 | | | | 2,592,350 | |
Handsome Co., Ltd. | | | 103,600 | | | | 2,616,820 | |
Hanssem Co., Ltd. | | | 43,100 | | | | 3,520,410 | |
Hy-Lok Corp. | | | 377,828 | | | | 10,987,837 | |
ISC Co., Ltd. | | | 190,500 | | | | 3,539,727 | |
Koh Young Technology, Inc. | | | 138,550 | | | | 3,298,490 | |
KONA@I Co., Ltd. | | | 178,400 | | | | 6,647,053 | |
Korean Reinsurance Co. | | | 129,642 | | | | 1,279,733 | |
KT Skylife Co., Ltd. | | | 79,100 | | | | 1,852,531 | |
See Notes to Financial Statements.
| | |
Annual Report | April 30, 2014 | | 55 |
| | |
| Grandeur Peak International Opportunities Fund | | Portfolio of Investments |
April 30, 2014 |
| | | | | | | | |
| | | Shares | | | Value (Note 2) | |
| |
South Korea (continued) | | | | | | | | |
LEENO Industrial, Inc. | | | 112,220 | | | $ | 3,230,954 | |
LF Corp. | | | 70,470 | | | | 1,827,733 | |
Wins Technet Co., Ltd. | | | 140,300 | | | | 1,907,689 | |
| | | | | | | | |
| | | | | | | 51,754,910 | |
| | | | | | | | |
| | |
Sweden (4.29%) | | | | | | | | |
AddTech AB, Class B | | | 274,990 | | | | 4,197,465 | |
Beijer Alma AB | | | 151,600 | | | | 4,278,336 | |
Bufab Holding AB(a) | | | 705,362 | | | | 6,942,753 | |
Cloetta AB, Class B(a) | | | 811,800 | | | | 2,671,791 | |
Indutrade AB | | | 69,850 | | | | 3,029,390 | |
Moberg Pharma AB(a) | | | 260,000 | | | | 1,207,591 | |
Nibe Industrier AB, Class B | | | 207,800 | | | | 5,832,411 | |
Odd Molly International AB(a) | | | 72,938 | | | | 583,307 | |
Opus Group AB | | | 3,104,612 | | | | 6,087,755 | |
| | | | | | | | |
| | | | | | | 34,830,799 | |
| | | | | | | | |
| | |
Switzerland (0.49%) | | | | | | | | |
VZ Holding AG | | | 23,802 | | | | 3,994,495 | |
| | | | | | | | |
| | |
Taiwan (6.61%) | | | | | | | | |
ASPEED Technology, Inc. | | | 218,900 | | | | 1,891,943 | |
Cleanaway Co., Ltd. | | | 476,000 | | | | 2,695,410 | |
Cowealth Medical Holding Co., Ltd. | | | 837,000 | | | | 2,771,707 | |
Cub Elecparts, Inc. | | | 567,900 | | | | 5,021,170 | |
Ledlink Optics, Inc. | | | 229,613 | | | | 679,000 | |
Novatek Microelectronics Corp. | | | 668,000 | | | | 3,085,834 | |
On-Bright Electronics, Inc. | | | 330,000 | | | | 2,994,238 | |
Pacific Hospital Supply Co. | | | 415,700 | | | | 1,073,733 | |
Polyronics Tech Corp. | | | 2,390,300 | | | | 5,699,106 | |
Richtek Technology Corp. | | | 144,000 | | | | 824,955 | |
Silergy Corp.(a) | | | 485,000 | | | | 4,015,167 | |
Sinmag Equipment Corp. | | | 325,000 | | | | 1,808,067 | |
Sporton International, Inc. | | | 2,040,530 | | | | 8,953,249 | |
Test Research, Inc. | | | 1,706,252 | | | | 2,859,009 | |
TSC Auto ID Technology Co., Ltd. | | | 451,000 | | | | 3,659,017 | |
UDE Corp. | | | 1,444,000 | | | | 4,901,318 | |
Voltronic Power Technology Corp. | | | 113,000 | | | | 735,297 | |
| | | | | | | | |
| | | | | | | 53,668,220 | |
| | | | | | | | |
See Notes to Financial Statements.
| | |
| 56 | | 1.855.377.7325 | www.GrandeurPeakGlobal.com |
| | |
| Grandeur Peak International Opportunities Fund | | Portfolio of Investments |
April 30, 2014 |
| | | | | | | | |
| | | Shares | | | Value
(Note 2) | |
| |
Thailand (0.81%) | | | | | | | | |
LPN Development PCL | | | 6,569,000 | | | $ | 3,532,157 | |
Premier Marketing PCL | | | 10,552,000 | | | | 3,032,559 | |
| | | | | | | | |
| | | | | | | 6,564,716 | |
| | | | | | | | |
| | |
Turkey (1.05%) | | | | | | | | |
Albaraka Turk Katilim Bankasi AS | | | 3,783,500 | | | | 2,992,326 | |
Emlak Konut Gayrimenkul Yatirim Ortakligi AS, REIT | | | 1,505,100 | | | | 1,967,311 | |
TAV Havalimanlari Holding AS | | | 445,200 | | | | 3,563,202 | |
| | | | | | | | |
| | | | | | | 8,522,839 | |
| | | | | | | | |
| | |
United Arab Emirates (0.17%) | | | | | | | | |
Aramex PJSC | | | 1,561,000 | | | | 1,334,497 | |
| | | | | | | | |
| | |
United States (0.77%) | | | | | | | | |
First Cash Financial Services, Inc.(a) | | | 85,700 | | | | 4,179,589 | |
Nu Skin Enterprises, Inc., Class A | | | 24,100 | | | | 2,096,700 | |
| | | | | | | | |
| | | | | | | 6,276,289 | |
| | | | | | | | |
| | |
TOTAL COMMON STOCKS (Cost $590,132,200) | | | | | | | 719,538,372 | |
| | | | | | | | |
| | |
PREFERRED STOCKS (0.43%) | | | | | | | | |
Brazil (0.43%) | | | | | | | | |
Banco ABC Brasil SA | | | 595,706 | | | | 3,486,473 | |
| | | | | | | | |
| | |
TOTAL PREFERRED STOCKS (Cost $3,218,453) | | | | | | | 3,486,473 | |
| | | | | | | | |
| | |
RIGHTS (0.01%) | | | | | | | | |
Sweden (0.01%) | | | | | | | | |
HIQ International AB, Rights, Strike Price 2.60 SEK (expiring 05/06/14)(a) | | | 180,000 | | | | 71,699 | |
| | | | | | | | |
| | |
TOTAL RIGHTS (Cost $0) | | | | | | | 71,699 | |
| | | | | | | | |
See Notes to Financial Statements.
| | |
Annual Report | April 30, 2014 | | 57 |
| | |
| Grandeur Peak International Opportunities Fund | | Portfolio of Investments |
April 30, 2014 |
| | | | |
| |
TOTAL INVESTMENTS (89.11%) (Cost $593,350,653) | | $ | 723,096,544 | |
| |
Assets In Excess Of Other Liabilities (10.89%) | | | 88,325,966 | |
| | | | |
| |
NET ASSETS (100.00%) | | $ | 811,422,510 | |
| | | | |
| (a) | Non-Income Producing Security. |
| (b) | Fair valued security under the procedures approved by the Fund’s Board of Trustees. |
| (c) | Security was purchased pursuant to Regulation S under the Securities Act of 1933, which exempts securities offered and sold outside of the United States from registration. Such security cannot be sold in the United States without either an effective registration statement filed pursuant to the Securities Act of 1933, or pursuant to an exemption from registration. The security has been deemed liquid under guidelines approved by the Fund’s Board of Trustees. As of April 30, 2014, the aggregate market value of those securities was $967,905, representing 0.12% of net assets. |
Common Abbreviations:
AB - Aktiebolag is the Swedish equivalent of the term corporation.
ADR - American Depositary Receipt.
AG - Aktiengesellschaft is a German term that refers to a corporation that is limited by shares, i.e., owned by shareholders.
AS - Aktieselskab is the Danish term for a stock-based corporation.
ASA - Allmennaksjeselskap is the Norwegian term for public limited company.
Bhd - Berhad is the Malaysian term for public limited company.
GDR - Global Depositary Receipt.
Ltd. - Limited.
NV - Naamloze Vennootschap is the Dutch term for a public limited liability corporation.
OYJ - Julkinen Osakeyhtiö is the Finnish term for a public limited company.
PCL - Public Company Limited.
PJSC - Public Joint Stock Company.
PLC - Public Limited Company.
REIT - Real Estate Investment Trust.
SA - Generally designates corporations in various countries, mostly those employing the civil law.
SAB de CV - A variable capital company.
SE - A European Company which can operate on a Europe-wide basis and be governed by community law directly applicable in all member states.
SEK - Swedish Krona
Tbk PT - Terbuka Perseroan Terbatas is an Indonesian term for a limited liability company.
Holdings are subject to change.
For Fund compliance purposes, the Fund’s geographical classifications refer to any one or more of the country sub-classifications used by one or more widely recognized market indexes or ratings group indexes, and/or as defined by Fund management. This definition may not apply for purposes of this report, which may combine sub-classifications for reporting ease. Geographical regions are shown as a percentage of net assets.
See Notes to Financial Statements.
| | |
| 58 | | 1.855.377.7325 | www.GrandeurPeakGlobal.com |
| | |
| Grandeur Peak Funds® | | Statements of Assets and Liabilities |
| |
| April 30, 2014 |
| | | | | | | | |
| | | Grandeur Peak
Emerging Markets
Opportunities Fund | | | Grandeur Peak
Global Opportunities
Fund | |
ASSETS | | | | | | | | |
Investments, at value (Cost - see below) | | $ | 275,217,644 | | | $ | 681,019,629 | |
Cash | | | 2,215,497 | | | | 10,188,451 | |
Foreign cash, at value
(Cost $4,678,505 and $23,334,446, respectively) | | | 4,702,975 | | | | 23,574,573 | |
Dividends and interest receivable | | | 157,860 | | | | 999,624 | |
Receivable for investments sold | | | 1,842,508 | | | | 665,385 | |
Receivable for fund shares subscribed | | | 773,011 | | | | 896,361 | |
Deferred offering cost | | | 22,096 | | | | – | |
Prepaid and other assets | | | 11,719 | | | | 17,084 | |
Total assets | | | 284,943,310 | | | | 717,361,107 | |
| | |
LIABILITIES | | | | | | | | |
Payable for investments purchased | | | 180,021 | | | | 6,323,994 | |
Foreign capital gains tax | | | 460,487 | | | | 676,770 | |
Payable for fund shares redeemed | | | 51,112 | | | | 232,830 | |
Advisory fees payable | | | 269,055 | | | | 735,992 | |
Administration fees payable | | | 10,052 | | | | 24,709 | |
Custodian fees payable | | | 131,836 | | | | 114,787 | |
Payable for trustee fees and expenses | | | 1,816 | | | | 5,772 | |
Payable for chief compliance officer fee | | | 414 | | | | 1,316 | |
Payable for principal financial officer fees | | | 104 | | | | 329 | |
Distribution and service fees payable | | | 5,473 | | | | 44,986 | |
Payable for transfer agency fees | | | 3,133 | | | | 9,764 | |
Accrued expenses and other liabilities | | | 58,911 | | | | 73,537 | |
Total liabilities | | | 1,172,414 | | | | 8,244,786 | |
NET ASSETS | | $ | 283,770,896 | | | $ | 709,116,321 | |
| | | | | | | | | |
| | |
NET ASSETS CONSISTS OF | | | | | | | | |
Paid-in capital (Note 5) | | $ | 272,982,842 | | | $ | 573,207,144 | |
Accumulated net investment loss | | | (271,674) | | | | (705,800) | |
Accumulated net realized gain on investments and
foreign currency transactions | | | 1,448,136 | | | | 13,462,044 | |
Net unrealized appreciation on investments and
translation of assets and liabilities in foreign
currencies | | | 9,611,592 | | | | 123,152,933 | |
NET ASSETS | | $ | 283,770,896 | | | $ | 709,116,321 | |
| | |
| | |
INVESTMENTS, AT COST | | $ | 265,168,833 | | | $ | 557,435,241 | |
See Notes to Financial Statements.
| | |
Annual Report | April 30, 2014 | | 59 |
| | |
| Grandeur Peak Funds® | | Statements of Assets and Liabilities (continued) |
| |
| April 30, 2014 |
| | | | | | | | |
| | | Grandeur Peak
Emerging Markets
Opportunities Fund | | | Grandeur Peak
Global Opportunities
Fund | |
PRICING OF SHARES | | | | | | | | |
Investor Class | | | | | | | | |
Net Assets | | $ | 27,951,746 | | | $ | 216,246,870 | |
Net Asset Value, offering and redemption price per share | | $ | 10.53 | | | $ | 3.31 | |
Shares of beneficial interest outstanding | | | 2,655,103 | | | | 65,234,837 | |
Institutional Class | | | | | | | | |
Net Assets | | $ | 255,819,150 | | | $ | 492,869,451 | |
Net Asset Value, offering and redemption price per share | | $ | 10.54 | | | $ | 3.34 | |
Shares of beneficial interest outstanding | | | 24,275,066 | | | | 147,680,114 | |
See Notes to Financial Statements.
| | |
| 60 | | 1.855.377.7325 | www.GrandeurPeakGlobal.com |
| | |
| Grandeur Peak Funds® | | Statements of Assets and Liabilities |
April 30, 2014 |
| | | | | | | | |
| | | Grandeur Peak
Global Reach Fund | | | Grandeur Peak
International
Opportunities Fund | |
ASSETS | | | | | | | | |
Investments, at value (Cost - see below) | | $ | 118,274,888 | | | $ | 723,096,544 | |
Cash | | | 18,502,574 | | | | 51,980,530 | |
Foreign cash, at value | | | | | | | | |
(Cost $561,407 and $39,039,360, respectively) | | | 565,555 | | | | 39,412,810 | |
Dividends and interest receivable | | | 107,015 | | | | 1,452,749 | |
Receivable for investments sold | | | 319,383 | | | | 696,209 | |
Receivable for fund shares subscribed | | | 3,762,196 | | | | 100,987 | |
Deferred offering cost | | | 6,790 | | | | – | |
Prepaid and other assets | | | 40,678 | | | | 26,483 | |
Total assets | | | 141,579,079 | | | | 816,766,312 | |
| | |
LIABILITIES | | | | | | | | |
Payable for investments purchased | | | 6,816,132 | | | | 2,982,757 | |
Foreign capital gains tax | | | 107,198 | | | | 836,315 | |
Payable for fund shares redeemed | | | 92 | | | | 373,848 | |
Advisory fees payable | | | 53,900 | | | | 823,887 | |
Administration fees payable | | | 6,885 | | | | 27,502 | |
Custodian fees payable | | | 71,439 | | | | 172,614 | |
Payable for trustee fees and expenses | | | 739 | | | | 6,296 | |
Payable for chief compliance officer fee | | | 168 | | | | 1,436 | |
Payable for principal financial officer fees | | | 42 | | | | 359 | |
Distribution and service fees payable | | | 7,226 | | | | 30,733 | |
Payable for transfer agency fees | | | 3,468 | | | | 7,238 | |
Accrued expenses and other liabilities | | | 38,124 | | | | 80,817 | |
Total liabilities | | | 7,105,413 | | | | 5,343,802 | |
NET ASSETS | | $ | 134,473,666 | | | $ | 811,422,510 | |
| | | | | | | | | |
| | |
NET ASSETS CONSISTS OF | | | | | | | | |
Paid-in capital (Note 5) | | $ | 126,228,405 | | | $ | 666,534,379 | |
Accumulated net investment loss | | | (32,886) | | | | (597,470) | |
Accumulated net realized gain on investments and
foreign currency transactions | | | 1,168,653 | | | | 16,196,090 | |
Net unrealized appreciation on investments and
translation of assets and liabilities in foreign
currencies | | | 7,109,494 | | | | 129,289,511 | |
NET ASSETS | | $ | 134,473,666 | | | $ | 811,422,510 | |
| | | | | | | | | |
| | |
INVESTMENTS, AT COST | | $ | 111,051,290 | | | $ | 593,350,653 | |
See Notes to Financial Statements.
| | |
Annual Report | April 30, 2014 | | 61 |
| | |
| Grandeur Peak Funds® | | Statements of Assets and Liabilities (continued) |
| April 30, 2014 |
| | | | | | | | |
| | | Grandeur Peak Global Reach Fund | | | Grandeur Peak International Opportunities Fund | |
PRICING OF SHARES | | | | | | | | |
Investor Class | | | | | | | | |
Net Assets | | $ | 46,162,956 | | | $ | 153,295,562 | |
Net Asset Value, offering and redemption price per share | | $ | 12.43 | | | $ | 3.41 | |
Shares of beneficial interest outstanding | | | 3,714,709 | | | | 44,994,190 | |
Institutional Class | | | | | | | | |
Net Assets | | $ | 88,310,710 | | | $ | 658,126,948 | |
Net Asset Value, offering and redemption price per share | | $ | 12.42 | | | $ | 3.42 | |
Shares of beneficial interest outstanding | | | 7,111,118 | | | | 192,636,685 | |
See Notes to Financial Statements.
| | |
| 62 | | 1.855.377.7325 | www.GrandeurPeakGlobal.com |
| | |
| Grandeur Peak Funds® | | Statements of Operations |
For the Year Ended April 30, 2014 |
| | | | | | | | |
| | �� | Grandeur Peak
Emerging Markets
Opportunities Fund(a) | | | Grandeur Peak
Global Opportunities
Fund | |
INVESTMENT INCOME | | | | | | | | |
Dividends | | $ | 932,865 | | | $ | 8,815,881 | |
Interest | | | 1,495 | | | | 16,405 | |
Foreign taxes withheld | | | (43,168) | | | | (560,747) | |
Total investment income | | | 891,192 | | | | 8,271,539 | |
EXPENSES | | | | | | | | |
Investment advisor fees (Note 6) | | | 899,691 | | | | 6,809,040 | |
Recoupment of previously waived fees (Note 6) | | | – | | | | 208,564 | |
Administrative fees | | | 29,216 | | | | 230,882 | |
Distribution and service fees - Investor Class | | | 15,922 | | | | 450,750 | |
Transfer agent fees | | | 11,832 | | | | 82,875 | |
Professional fees | | | 21,644 | | | | 36,498 | |
Printing fees | | | 7,066 | | | | 42,980 | |
Registration fees | | | 38,152 | | | | 86,519 | |
Custodian fees | | | 131,837 | | | | 260,530 | |
Trustee fees and expenses | | | 3,496 | | | | 21,278 | |
Chief compliance officer fees | | | 1,578 | | | | 16,233 | |
Principal financial officer fees | | | 397 | | | | 4,507 | |
Offering costs | | | 23,685 | | | | – | |
Other expenses | | | 3,523 | | | | 22,121 | |
Total expenses | | | 1,188,039 | | | | 8,272,777 | |
Less fees waived/reimbursed by investment advisor (Note 6) | | | (39,198) | | | | – | |
Total net expenses | | | 1,148,841 | | | | 8,272,777 | |
NET INVESTMENT LOSS | | | (257,649) | | | | (1,238) | |
| | |
REALIZED AND UNREALIZED GAIN/(LOSS) ON INVESTMENTS | | | | | | | | |
Net realized gain on investments | | | 1,543,521 | | | | 35,788,417 | |
Net realized loss on foreign currency transactions | | | (142,106) | | | | (419,023) | |
Net change in unrealized appreciation on investments (net of foreign capital gains tax of $460,487 and $676,770, respectively) | | | 9,588,324 | | | | 71,369,324 | |
Net change in unrealized appreciation on translation of assets and liabilities in foreign currencies | | | 23,268 | | | | 210,979 | |
NET REALIZED AND UNREALIZED GAIN ON INVESTMENTS
AND FOREIGN CURRENCY TRANSACTIONS | | | 11,013,007 | | | | 106,949,697 | |
NET INCREASE IN NET ASSETS RESULTING FROM
OPERATIONS | | $ | 10,755,358 | | | $ | 106,948,459 | |
| | |
| (a) | Represents the period December 16, 2013 (inception) to April 30, 2014. |
See Notes to Financial Statements.
| | |
Annual Report | April 30, 2014 | | 63 |
| | |
| Grandeur Peak Funds® | | Statements of Operations |
| For the Year Ended April 30, 2014 |
| | | | | | | | |
| | | Grandeur Peak
Global Reach Fund(a) | | | Grandeur Peak
International
Opportunities Fund | |
INVESTMENT INCOME | | | | | | | | |
Dividends | | $ | 727,416 | | | $ | 11,896,774 | |
Interest | | | 356 | | | | 10,384 | |
Foreign taxes withheld | | | (43,498) | | | | (969,892) | |
Total investment income | | | 684,274 | | | | 10,937,266 | |
EXPENSES | | | | | | | | |
Investment advisor fees (Note 6) | | | 497,207 | | | | 7,210,210 | |
Recoupment of previously waived fees (Note 6) | | | – | | | | 281,842 | |
Administrative fees | | | 37,044 | | | | 246,658 | |
Distribution and service fees - Investor Class | | | 41,170 | | | | 291,652 | |
Transfer agent fees | | | 27,013 | | | | 64,783 | |
Professional fees | | | 23,071 | | | | 37,669 | |
Printing fees | | | 4,746 | | | | 33,012 | |
Registration fees | | | 13,503 | | | | 116,574 | |
Custodian fees | | | 121,452 | | | | 407,942 | |
Trustee fees and expenses | | | 1,850 | | | | 23,131 | |
Chief compliance officer fees | | | 1,263 | | | | 17,115 | |
Principal financial officer fees | | | 323 | | | | 4,773 | |
Offering costs | | | 42,774 | | | | – | |
Other expenses | | | 5,207 | | | | 21,666 | |
Total expenses | | | 816,623 | | | | 8,757,027 | |
Less fees waived/reimbursed by investment advisor (Note 6) | | | (165,234) | | | | – | |
Total net expenses | | | 651,389 | | | | 8,757,027 | |
NET INVESTMENT INCOME | | | 32,885 | | | | 2,180,239 | |
| | |
REALIZED AND UNREALIZED GAIN/(LOSS) ON INVESTMENTS | | | | | | | | |
Net realized gain on investments | | | 1,656,959 | | | | 33,574,275 | |
Net realized loss on foreign currency transactions | | | (77,110) | | | | (813,122) | |
Net change in unrealized appreciation on investments (net of foreign capital gains tax of $107,198 and $836,315, respectively) | | | 7,116,400 | | | | 90,217,106 | |
Net change in unrealized appreciation/(depreciation) on translation of assets and liabilities in foreign currencies | | | (6,906) | | | | 438,867 | |
NET REALIZED AND UNREALIZED GAIN ON INVESTMENTS
AND FOREIGN CURRENCY TRANSACTIONS | | | 8,689,343 | | | | 123,417,126 | |
NET INCREASE IN NET ASSETS RESULTING FROM
OPERATIONS | | $ | 8,722,228 | | | $ | 125,597,365 | |
| | |
| (a) | Represents the period June 19, 2013 (inception) to April 30, 2014. |
See Notes to Financial Statements.
| | |
| 64 | | 1.855.377.7325 | www.GrandeurPeakGlobal.com |
| | |
| Grandeur Peak Emerging Markets Opportunities Fund | | Statement of Changes in Net Assets |
|
| | | | |
| | | For the Period
December 16, 2013
(Inception) to
April 30, 2014 | |
OPERATIONS | | | | |
Net investment loss | | $ | (257,649) | |
Net realized gain on investments and foreign currency transactions | | | 1,401,415 | |
Net change in unrealized appreciation on investments and foreign currency translations | | | 9,611,592 | |
Net increase in net assets resulting from operations | | | 10,755,358 | |
| |
CAPITAL SHARE TRANSACTIONS (NOTE 5) | | | | |
Investor Class | | | | |
Proceeds from sales of shares | | | 28,115,421 | |
Cost of shares redeemed | | | (1,134,670) | |
Redemption fees | | | 2,526 | |
Net increase from capital shares transactions | | | 26,983,277 | |
| |
Institutional Class | | | | |
Proceeds from sales of shares | | | 246,808,127 | |
Cost of shares redeemed | | | (776,919) | |
Redemption fees | | | 1,053 | |
Net increase from capital shares transactions | | | 246,032,261 | |
| |
Net increase in net assets | | | 283,770,896 | |
| |
NET ASSETS | | | | |
Beginning of period | | | – | |
End of period* | | $ | 283,770,896 | |
| | |
| |
*Including accumulated net investment loss of: | | $ | (271,674) | |
See Notes to Financial Statements.
| | |
Annual Report | April 30, 2014 | | 65 |
| | |
| Grandeur Peak Emerging Markets Opportunities Fund | | Statement of Changes in Net Assets (continued) |
|
| | | | |
| | | For the Period
December 16, 2013
(Inception) to
April 30, 2014 | |
OTHER INFORMATION | | | | |
Shares Transactions | | | | |
Investor Class | | | | |
Issued | | | 2,766,379 | |
Redeemed | | | (111,276) | |
Net increase in share transactions | | | 2,655,103 | |
| |
Institutional Class | | | | |
Issued | | | 24,349,676 | |
Redeemed | | | (74,610) | |
Net increase in share transactions | | | 24,275,066 | |
| | |
See Notes to Financial Statements.
| | |
| 66 | | 1.855.377.7325 | www.GrandeurPeakGlobal.com |
| | |
| Grandeur Peak Global Opportunities Fund | | Statements of Changes in Net Assets |
|
| | | | | | | | |
| | | For the Year Ended April 30, 2014 | | | For the Year Ended April 30, 2013 | |
OPERATIONS | | | | | | | | |
Net investment income/(loss) | | $ | (1,238) | | | $ | 608,061 | |
Net realized gain on investments and foreign currency transactions | | | 35,369,394 | | | | 5,510,252 | |
Net change in unrealized appreciation on investments and foreign currency translations | | | 71,580,303 | | | | 43,088,931 | |
Net increase in net assets resulting from operations | | | 106,948,459 | | | | 49,207,244 | |
| | |
DISTRIBUTIONS TO SHAREHOLDERS (NOTE 3) | | | | | | | | |
Net investment income | | | | | | | | |
Investor Class | | | – | | | | (499,095) | |
Institutional Class | | | (550,548) | | | | (815,023) | |
Net realized gains on investments | | | | | | | | |
Investor Class | | | (7,710,181) | | | | (1,304,234) | |
Institutional Class | | | (16,434,044) | | | | (1,691,595) | |
Net decrease in net assets from distributions | | | (24,694,773) | | | | (4,309,947) | |
| | |
CAPITAL SHARE TRANSACTIONS (NOTE 5) | | | | | | | | |
Investor Class | | | | | | | | |
Proceeds from sales of shares | | | 77,017,540 | | | | 54,013,215 | |
Distributions reinvested | | | 7,430,355 | | | | 1,777,862 | |
Cost of shares redeemed | | | (29,512,700) | | | | (15,078,229) | |
Redemption fees | | | 3,666 | | | | 6,976 | |
Net increase from capital shares transactions | | | 54,938,861 | | | | 40,719,824 | |
| | |
Institutional Class | | | | | | | | |
Proceeds from sales of shares | | | 236,191,571 | | | | 119,663,878 | |
Distributions reinvested | | | 16,039,187 | | | | 2,431,109 | |
Cost of shares redeemed | | | (30,650,202) | | | | (8,266,338) | |
Redemption fees | | | 5,551 | | | | 682 | |
Net increase from capital shares transactions | | | 221,586,107 | | | | 113,829,331 | |
| | |
Net increase in net assets | | | 358,778,654 | | | | 199,446,452 | |
| | |
NET ASSETS | | | | | | | | |
Beginning of year | | | 350,337,667 | | | | 150,891,215 | |
End of year* | | $ | 709,116,321 | | | $ | 350,337,667 | |
| | |
| | |
*Including accumulated net investment loss of: | | $ | (705,800) | | | $ | (865,742) | |
See Notes to Financial Statements.
| | |
Annual Report | April 30, 2014 | | 67 |
| | |
| Grandeur Peak Global Opportunities Fund | | Statements of Changes in Net Assets (continued) |
|
| | | | | | | | |
| | | For the Year Ended April 30, 2014 | | | For the Year Ended April 30, 2013 | |
OTHER INFORMATION | | | | | | | | |
Shares Transactions | | | | | | | | |
Investor Class | | | | | | | | |
Issued | | | 24,473,188 | | | | 21,496,144 | |
Issued in lieu of cash distributions | | | 2,286,263 | | | | 725,658 | |
Redeemed | | | (9,301,622) | | | | (6,120,849) | |
Net increase in share transactions | | | 17,457,829 | | | | 16,100,953 | |
| | |
| | |
Institutional Class | | | | | | | | |
Issued | | | 74,111,902 | | | | 47,178,631 | |
Issued in lieu of cash distributions | | | 4,904,950 | | | | 988,256 | |
Redeemed | | | (9,571,700) | | | | (3,450,605) | |
Net increase in share transactions | | | 69,445,152 | | | | 44,716,282 | |
| | |
See Notes to Financial Statements.
| | |
| 68 | | 1.855.377.7325 | www.GrandeurPeakGlobal.com |
| | |
| Grandeur Peak Global Reach Fund | | Statement of Changes in Net Assets |
|
| | | | |
| | | For the Period
June 19, 2013
(Inception) to
April 30, 2014 | |
OPERATIONS | | | | |
Net investment income | | $ | 32,885 | |
Net realized gain on investments and foreign currency transactions | | | 1,579,849 | |
Net change in unrealized appreciation on investments and foreign currency translations | | | 7,109,494 | |
Net increase in net assets resulting from operations | | | 8,722,228 | |
| |
DISTRIBUTIONS TO SHAREHOLDERS (NOTE 3) | | | | |
Net investment income | | | | |
Investor Class | | | (44,891) | |
Institutional Class | | | (108,748) | |
Net realized gains on investments | | | | |
Investor Class | | | (171,869) | |
Institutional Class | | | (195,310) | |
Net decrease in net assets from distributions | | | (520,818) | |
| |
CAPITAL SHARE TRANSACTIONS (NOTE 5) | | | | |
Investor Class | | | | |
Proceeds from sales of shares | | | 56,808,405 | |
Distributions reinvested | | | 209,868 | |
Cost of shares redeemed | | | (13,615,726) | |
Redemption fees | | | 7,176 | |
Net increase from capital shares transactions | | | 43,409,723 | |
| |
Institutional Class | | | | |
Proceeds from sales of shares | | | 86,258,768 | |
Distributions reinvested | | | 295,528 | |
Cost of shares redeemed | | | (3,696,595) | |
Redemption fees | | | 4,832 | |
Net increase from capital shares transactions | | | 82,862,533 | |
| |
Net increase in net assets | | | 134,473,666 | |
| |
NET ASSETS | | | | |
Beginning of year | | | – | |
End of year* | | $ | 134,473,666 | |
| | |
| |
*Including accumulated net investment loss of: | | $ | (32,886) | |
See Notes to Financial Statements.
| | |
Annual Report | April 30, 2014 | | 69 |
| | |
| Grandeur Peak Global Reach Fund | | Statement of Changes in Net Assets (continued) |
|
| | | | |
| | | For the Period
June 19, 2013
(Inception) to
April 30, 2014 | |
OTHER INFORMATION | | | | |
Shares Transactions | | | | |
Investor Class | | | | |
Issued | | | 4,831,859 | |
Issued in lieu of cash distributions | | | 17,984 | |
Redeemed | | | (1,135,134) | |
Net increase in share transactions | | | 3,714,709 | |
| | |
| | |
| |
Institutional Class | | | | |
Issued | | | 7,398,753 | |
Issued in lieu of cash distributions | | | 25,367 | |
Redeemed | | | (313,002) | |
Net increase in share transactions | | | 7,111,118 | |
| | |
| | |
See Notes to Financial Statements.
| | |
| 70 | | 1.855.377.7325 | www.GrandeurPeakGlobal.com |
| | |
| Grandeur Peak International Opportunities Fund | | Statements of Changes in Net Assets |
|
| | | | | | | | |
| | | For the Year Ended
April 30, 2014 | | | For the Year Ended
April 30, 2013 | |
OPERATIONS | | | | | | | | |
Net investment income | | $ | 2,180,239 | | | $ | 628,938 | |
Net realized gain on investments and foreign currency transactions | | | 32,761,153 | | | | 2,834,127 | |
Net change in unrealized appreciation on investments and foreign currency translations | | | 90,655,973 | | | | 35,271,629 | |
Net increase in net assets resulting from operations | | | 125,597,365 | | | | 38,734,694 | |
| | |
DISTRIBUTIONS TO SHAREHOLDERS (NOTE 3) | | | | | | | | |
Net investment income | | | | | | | | |
Investor Class | | | (850,286) | | | | (130,100) | |
Institutional Class | | | (4,248,374) | | | | (937,970) | |
Net realized gains on investments | | | | | | | | |
Investor Class | | | (3,131,062) | | | | (53,171) | |
Institutional Class | | | (12,702,647) | | | | (333,531) | |
Net decrease in net assets from distributions | | | (20,932,369) | | | | (1,454,772) | |
| | |
CAPITAL SHARE TRANSACTIONS (NOTE 5) | | | | | | | | |
Investor Class | | | | | | | | |
Proceeds from sales of shares | | | 55,833,951 | | | | 85,888,034 | |
Distributions reinvested | | | 3,836,965 | | | | 161,260 | |
Cost of shares redeemed | | | (23,996,762) | | | | (6,392,115) | |
Redemption fees | | | 9,771 | | | | 16,442 | |
Net increase from capital shares transactions | | | 35,683,925 | | | | 79,673,621 | |
| | |
Institutional Class | | | | | | | | |
Proceeds from sales of shares | | | 332,595,278 | | | | 170,464,416 | |
Distributions reinvested | | | 15,198,982 | | | | 1,149,105 | |
Cost of shares redeemed | | | (24,245,014) | | | | (5,787,933) | |
Redemption fees | | | 12,327 | | | | 1,265 | |
Net increase from capital shares transactions | | | 323,561,573 | | | | 165,826,853 | |
| | |
Net increase in net assets | | | 463,910,494 | | | | 282,780,396 | |
| | |
NET ASSETS | | | | | | | | |
Beginning of year | | | 347,512,016 | | | | 64,731,620 | |
End of year* | | $ | 811,422,510 | | | $ | 347,512,016 | |
| | |
| | |
*Including accumulated net investment loss of: | | $ | (597,470) | | | $ | (643,664) | |
See Notes to Financial Statements.
| | |
Annual Report | April 30, 2014 | | 71 |
| | |
| Grandeur Peak International Opportunities Fund | | Statements of Changes in Net Assets (continued) |
|
| | | | | | | | |
| | | For the Year Ended
April 30, 2014 | | | For the
Year Ended
April 30, 2013 | |
OTHER INFORMATION | | | | | | | | |
Shares Transactions | | | | | | | | |
Investor Class | | | | | | | | |
Issued | | | 17,554,569 | | | | 32,421,152 | |
Issued in lieu of cash distributions | | | 1,195,316 | | | | 63,992 | |
Redeemed | | | (7,842,523) | | | | (2,456,449) | |
Net increase in share transactions | | | 10,907,362 | | | | 30,028,695 | |
| | |
| | |
Institutional Class | | | | | | | | |
Issued | | | 107,001,298 | | | | 66,055,460 | |
Issued in lieu of cash distributions | | | 4,720,181 | | | | 455,994 | |
Redeemed | | | (7,558,233) | | | | (2,280,523) | |
Net increase in share transactions | | | 104,163,246 | | | | 64,230,931 | |
| | |
See Notes to Financial Statements.
| | |
| 72 | | 1.855.377.7325 | www.GrandeurPeakGlobal.com |
| | |
| Grandeur Peak Emerging Markets Opportunities Fund | | Financial Highlights |
For a share outstanding throughout the period presented. |
| | | | |
| Investor Class | | For the Period
December 16, 2013
(Inception) to
April 30, 2014 | |
NET ASSET VALUE, BEGINNING OF PERIOD | | | $ 10.00 | |
| |
INCOME FROM INVESTMENT OPERATIONS | | | | |
Net investment loss(a) | | | (0.05 | ) |
Net realized and unrealized gain on investments | | | 0.58 | |
Total income from investment operations | | | 0.53 | |
| |
REDEMPTION FEES ADDED TO PAID-IN CAPITAL | | | 0.00 | (b) |
| |
INCREASE IN NET ASSET VALUE | | | 0.53 | |
NET ASSET VALUE, END OF PERIOD | | | $ 10.53 | |
| | |
| |
TOTAL RETURN | | | 5.30 | %(c) |
| |
RATIOS AND SUPPLEMENTAL DATA | | | | |
Net assets, end of period (in 000s) | | | $ 27,952 | |
| |
RATIOS TO AVERAGE NET ASSETS | | | | |
Expenses (excluding fees waived/reimbursed by investment advisor) | | | 2.01 | %(d)(e) |
Expenses (including fees waived/reimbursed by investment advisor) | | | 1.95 | %(d)(e) |
Net investment loss | | | (0.55 | )%(d) |
| |
PORTFOLIO TURNOVER RATE | | | 26 | %(c) |
| (a) | Per share numbers have been calculated using the average shares method. |
| (b) | Less than $0.005 per share. |
| (e) | Expense ratios before reductions for startup periods may not be representative of longer term operating periods. |
See Notes to Financial Statements.
| | |
Annual Report | April 30, 2014 | | 73 |
| | |
| Grandeur Peak Emerging Markets Opportunities Fund | | Financial Highlights |
For a share outstanding throughout the period presented. |
| | | | |
| Institutional Class | | For the Period
December 16, 2013
(Inception) to
April 30, 2014 | |
NET ASSET VALUE, BEGINNING OF PERIOD | | | $ 10.00 | |
| |
INCOME FROM INVESTMENT OPERATIONS | | | (0.03 | ) |
Net investment loss(a) | | | | |
Net realized and unrealized gain on investments | | | 0.57 | |
Total income from investment operations | | | 0.54 | |
| |
REDEMPTION FEES ADDED TO PAID-IN CAPITAL | | | 0.00 | (b) |
| |
INCREASE IN NET ASSET VALUE | | | 0.54 | |
NET ASSET VALUE, END OF PERIOD | | | $ 10.54 | |
| | |
| |
TOTAL RETURN | | | 5.40 | %(c) |
| |
RATIOS AND SUPPLEMENTAL DATA | | | | |
Net assets, end of period (in 000s) | | | $ 255,819 | |
| |
RATIOS TO AVERAGE NET ASSETS | | | | |
Expenses (excluding fees waived/reimbursed by investment advisor) | | | 1.76 | %(d)(e) |
Expenses (including fees waived/reimbursed by investment advisor) | | | 1.70 | %(d)(e) |
Net investment loss | | | (0.37 | )%(d) |
| |
PORTFOLIO TURNOVER RATE | | | 26 | %(c) |
| (a) | Per share numbers have been calculated using the average shares method. |
| (b) | Less than $0.005 per share. |
| (e) | Expense ratios before reductions for startup periods may not be representative of longer term operating periods. |
See Notes to Financial Statements.
| | |
| 74 | | 1.855.377.7325 | www.GrandeurPeakGlobal.com |
| | |
| Grandeur Peak Global Opportunities Fund | | Financial Highlights |
For a share outstanding throughout the periods presented. |
| | | | | | | | | | | | |
| Investor Class | | Year Ended
April 30, 2014 | | | Year Ended
April 30, 2013 | | | For the Period
October 17, 2011
(Inception) to
April 30, 2012 | |
NET ASSET VALUE, BEGINNING OF PERIOD | | | $ 2.77 | | | | $ 2.31 | | | | $ 2.00 | |
| | | |
INCOME FROM INVESTMENT OPERATIONS | | | | | | | | | | | | |
Net investment income/(loss)(a) | | | (0.00) | (b) | | | 0.00 | (b) | | | (0.00) | (b) |
Net realized and unrealized gain on investments | | | 0.67 | | | | 0.51 | | | | 0.31 | |
Total income from investment operations | | | 0.67 | | | | 0.51 | | | | 0.31 | |
| | | |
DISTRIBUTIONS | | | | | | | | | | | | |
From net investment income | | | – | | | | (0.01) | | | | – | |
From net realized gain on investments | | | (0.13) | | | | (0.04) | | | | – | |
Total distributions | | | (0.13) | | | | (0.05) | | | | – | |
| | | |
REDEMPTION FEES ADDED TO PAID-IN CAPITAL | | | 0.00 | (b) | | | 0.00 | (b) | | | 0.00 | (b) |
| | | |
INCREASE IN NET ASSET VALUE | | | 0.54 | | | | 0.46 | | | | 0.31 | |
NET ASSET VALUE, END OF PERIOD | | | $ 3.31 | | | | $ 2.77 | | | | $ 2.31 | |
| | |
| | | |
TOTAL RETURN | | | 24.31% | | | | 22.34% | | | | 15.50% | (c) |
| | | |
RATIOS AND SUPPLEMENTAL DATA | | | | | | | | | | | | |
Net assets, end of period (in 000s) | | | $ 216,247 | | | | $ 132,384 | | | | $ 73,154 | |
| | | |
RATIOS TO AVERAGE NET ASSETS | | | | | | | | | | | | |
Expenses (excluding fees waived/reimbursed by investment advisor) | | | 1.68% | | | | 1.76% | | | | 2.30% | (d) |
Expenses (including fees waived/reimbursed by investment advisor) | | | 1.68% | | | | 1.75% | | | | 1.75% | (d) |
Net investment income/(loss) | | | (0.15)% | | | | 0.19% | | | | (0.04)% | (d) |
| | | |
PORTFOLIO TURNOVER RATE | | | 38% | | | | 35% | | | | 42% | (c) |
| (a) | Per share numbers have been calculated using the average shares method. |
| (b) | Less than $0.005 per share. |
See Notes to Financial Statements.
| | |
Annual Report | April 30, 2014 | | 75 |
| | |
| Grandeur Peak Global Opportunities Fund | | Financial Highlights |
For a share outstanding throughout the periods presented. |
| | | | | | | | | | | | |
| Institutional Class | | Year Ended
April 30, 2014 | | | Year Ended
April 30, 2013 | | | For the Period
October 17, 2011
(Inception) to
April 30, 2012 | |
NET ASSET VALUE, BEGINNING OF PERIOD | | | $ 2.79 | | | | $ 2.32 | | | | $ 2.00 | |
| | | |
INCOME FROM INVESTMENT OPERATIONS | | | | | | | | | | | | |
Net investment income(a) | | | 0.00 | (b) | | | 0.01 | | | | 0.00 | (b) |
Net realized and unrealized gain on investments | | | 0.68 | | | | 0.52 | | | | 0.32 | |
Total income from investment operations | | | 0.68 | | | | 0.53 | | | | 0.32 | |
| | | |
DISTRIBUTIONS | | | | | | | | | | | | |
From net investment income | | | (0.00) | (c) | | | (0.02) | | | | – | |
From net realized gain on investments | | | (0.13) | | | | (0.04) | | | | – | |
Total distributions | | | (0.13) | | | | (0.06) | | | | – | |
| | | |
REDEMPTION FEES ADDED TO PAID-IN CAPITAL | | | 0.00 | (b) | | | 0.00 | (b) | | | 0.00 | (b) |
| | | |
INCREASE IN NET ASSET VALUE | | | 0.55 | | | | 0.47 | | | | 0.32 | |
NET ASSET VALUE, END OF PERIOD | | | $ 3.34 | | | | $ 2.79 | | | | $ 2.32 | |
| | |
| | | |
TOTAL RETURN | | | 24.67% | | | | 22.86% | | | | 16.00% | (d) |
| | | |
RATIOS AND SUPPLEMENTAL DATA | | | | | | | | | | | | |
Net assets, end of period (in 000s) | | | $ 492,869 | | | | $ 217,953 | | | | $ 77,737 | |
| | | |
RATIOS TO AVERAGE NET ASSETS | | | | | | | | | | | | |
Expenses (excluding fees waived/reimbursed by investment advisor) | | | 1.44% | | | | 1.51% | | | | 2.03% | (e) |
Expenses (including fees waived/reimbursed by investment advisor) | | | 1.44% | | | | 1.50% | | | | 1.50% | (e) |
Net investment income | | | 0.08% | | | | 0.37% | | | | 0.40% | (e) |
| | | |
PORTFOLIO TURNOVER RATE | | | 38% | | | | 35% | | | | 42% | (d) |
| (a) | Per share numbers have been calculated using the average shares method. |
| (b) | Less than $0.005 per share. |
| (c) | Less than $(0.005) per share. |
See Notes to Financial Statements.
| | |
| 76 | | 1.855.377.7325 | www.GrandeurPeakGlobal.com |
| | |
| Grandeur Peak Global Reach Fund | | Financial Highlights |
For a share outstanding throughout the period presented. |
| | | | |
| Investor Class | | For the Period
June 19, 2013
(Inception) to
April 30, 2014 | |
NET ASSET VALUE, BEGINNING OF PERIOD | | | $ 10.00 | |
| |
INCOME FROM INVESTMENT OPERATIONS | | | | |
Net investment loss(a) | | | (0.02) | |
Net realized and unrealized gain on investments | | | 2.54 | |
Total income from investment operations | | | 2.52 | |
| |
DISTRIBUTIONS | | | | |
From net investment income | | | (0.02) | |
From net realized gain on investments | | | (0.08) | |
Total distributions | | | (0.10) | |
| |
REDEMPTION FEES ADDED TO PAID-IN CAPITAL | | | 0.01 | |
| |
INCREASE IN NET ASSET VALUE | | | 2.43 | |
NET ASSET VALUE, END OF PERIOD | | | $ 12.43 | |
| | |
| |
TOTAL RETURN | | | 25.31% | (b) |
| |
RATIOS AND SUPPLEMENTAL DATA | | | | |
Net assets, end of period (in 000s) | | | $ 46,163 | |
| |
RATIOS TO AVERAGE NET ASSETS | | | | |
Expenses (excluding fees waived/reimbursed by investment advisor) | | | 1.91% | (c)(d) |
Expenses (including fees waived/reimbursed by investment advisor) | | | 1.60% | (c)(d) |
Net investment loss | | | (0.17)% | (c) |
| |
PORTFOLIO TURNOVER RATE | | | 39% | (b) |
| (a) | Per share numbers have been calculated using the average shares method. |
| (d) | Expense ratios before reductions for startup periods may not be representative of longer term operating periods. |
See Notes to Financial Statements.
| | |
Annual Report | April 30, 2014 | | 77 |
| | |
| Grandeur Peak Global Reach Fund | | Financial Highlights |
For a share outstanding throughout the period presented. |
| | | | |
| Institutional Class | | For the Period
June 19, 2013
(Inception) to
April 30, 2014 | |
NET ASSET VALUE, BEGINNING OF PERIOD | | | $ 10.00 | |
| |
INCOME FROM INVESTMENT OPERATIONS | | | | |
Net investment income(a) | | | 0.02 | |
Net realized and unrealized gain on investments | | | 2.52 | |
Total income from investment operations | | | 2.54 | |
| |
DISTRIBUTIONS | | | | |
From net investment income | | | (0.04) | |
From net realized gain on investments | | | (0.08) | |
Total distributions | | | (0.12) | |
| |
REDEMPTION FEES ADDED TO PAID-IN CAPITAL | | | 0.00 | (b) |
| |
INCREASE IN NET ASSET VALUE | | | 2.42 | |
NET ASSET VALUE, END OF PERIOD | | | $ 12.42 | |
| | |
| |
TOTAL RETURN | | | 25.45% | (c) |
| |
RATIOS AND SUPPLEMENTAL DATA | | | | |
Net assets, end of period (in 000s) | | | $ 88,311 | |
| |
RATIOS TO AVERAGE NET ASSETS | | | | |
Expenses (excluding fees waived/reimbursed by investment advisor) | | | 1.75% | (d)(e) |
Expenses (including fees waived/reimbursed by investment advisor) | | | 1.35% | (d)(e) |
Net investment income | | | 0.21% | (d) |
| |
PORTFOLIO TURNOVER RATE | | | 39% | (c) |
| (a) | Per share numbers have been calculated using the average shares method. |
| (b) | Less than $0.005 per share. |
| (e) | Expense ratios before reductions for startup periods may not be representative of longer term operating periods. |
See Notes to Financial Statements.
| | |
| 78 | | 1.855.377.7325 | www.GrandeurPeakGlobal.com |
| | |
| Grandeur Peak International Opportunities Fund | | Financial Highlights |
For a share outstanding throughout the periods presented. |
| | | | | | | | | | | | |
| Investor Class | | Year Ended
April 30, 2014 | | | Year Ended
April 30, 2013 | | | For the Period
October 17, 2011
(Inception) to
April 30, 2012 | |
NET ASSET VALUE, BEGINNING OF PERIOD | | | $ 2.83 | | | | $ 2.29 | | | | $ 2.00 | |
| | | |
INCOME FROM INVESTMENT OPERATIONS | | | | | | | | | | | | |
Net investment income(a) | | | 0.01 | | | | 0.01 | | | | 0.00 | (b) |
Net realized and unrealized gain on investments | | | 0.68 | | | | 0.55 | | | | 0.29 | |
Total income from investment operations | | | 0.69 | | | | 0.56 | | | | 0.29 | |
| | | |
DISTRIBUTIONS | | | | | | | | | | | | |
From net investment income | | | (0.02) | | | | (0.01) | | | | – | |
From net realized gain on investments | | | (0.09) | | | | (0.01) | | | | – | |
Total distributions | | | (0.11) | | | | (0.02) | | | | – | |
| | | |
REDEMPTION FEES ADDED TO PAID-IN CAPITAL | | | 0.00 | (b) | | | 0.00 | (b) | | | 0.00 | (b) |
| | | |
INCREASE IN NET ASSET VALUE | | | 0.58 | | | | 0.54 | | | | 0.29 | |
NET ASSET VALUE, END OF PERIOD | | | $ 3.41 | | | | $ 2.83 | | | | $ 2.29 | |
| | |
| | | |
TOTAL RETURN | | | 24.59% | | | | 24.57% | | | | 14.50% | (c) |
| | | |
RATIOS AND SUPPLEMENTAL DATA | | | | | | | | | | | | |
Net assets, end of period (in 000s) | | | $ 153,296 | | | | $ 96,550 | | | | $ 9,274 | |
| | | |
RATIOS TO AVERAGE NET ASSETS | | | | | | | | | | | | |
Expenses (excluding fees waived/reimbursed by investment advisor) | | | 1.73% | | | | 1.88% | | | | 2.94% | (d) |
Expenses (including fees waived/reimbursed by investment advisor) | | | 1.73% | | | | 1.75% | | | | 1.75% | (d) |
Net investment income | | | 0.20% | | | | 0.26% | | | | 0.33% | (d) |
| | | |
PORTFOLIO TURNOVER RATE | | | 37% | | | | 52% | | | | 24% | (c) |
| (a) | Per share numbers have been calculated using the average shares method. |
| (b) | Less than $0.005 per share. |
See Notes to Financial Statements.
| | |
Annual Report | April 30, 2014 | | 79 |
| | |
| Grandeur Peak International Opportunities Fund | | Financial Highlights |
For a share outstanding throughout the periods presented. |
| | | | | | | | | | | | |
| Institutional Class | | Year Ended
April 30, 2014 | | | Year Ended
April 30, 2013 | | | For the Period
October 17, 2011
(Inception) to
April 30, 2012 | |
NET ASSET VALUE, BEGINNING OF PERIOD | | | $ 2.84 | | | | $ 2.29 | | | | $ 2.00 | |
| | | |
INCOME FROM INVESTMENT OPERATIONS | | | | | | | | | | | | |
Net investment income(a) | | | 0.01 | | | | 0.01 | | | | 0.01 | |
Net realized and unrealized gain on investments | | | 0.69 | | | | 0.57 | | | | 0.28 | |
Total income from investment operations | | | 0.70 | | | | 0.58 | | | | 0.29 | |
| | | |
DISTRIBUTIONS | | | | | | | | | | | | |
From net investment income | | | (0.03) | | | | (0.02) | | | | – | |
From net realized gain on investments | | | (0.09) | | | | (0.01) | | | | – | |
Total distributions | | | (0.12) | | | | (0.03) | | | | – | |
| | | |
REDEMPTION FEES ADDED TO PAID-IN CAPITAL | | | 0.00 | (b) | | | 0.00 | (b) | | | 0.00 | (b) |
| | | |
INCREASE IN NET ASSET VALUE | | | 0.58 | | | | 0.55 | | | | 0.29 | |
NET ASSET VALUE, END OF PERIOD | | | $ 3.42 | | | | $ 2.84 | | | | $ 2.29 | |
| | |
| | | |
TOTAL RETURN | | | 24.70% | | | | 25.11% | | | | 14.50% | (c) |
| | | |
RATIOS AND SUPPLEMENTAL DATA | | | | | | | | | | | | |
Net assets, end of period (in 000s) | | | $ 658,127 | | | | $ 250,962 | | | | $ 55,458 | |
| | | |
RATIOS TO AVERAGE NET ASSETS | | | | | | | | | | | | |
Expenses (excluding fees waived/reimbursed by investment advisor) | | | 1.46% | | | | 1.59% | | | | 2.50% | (d) |
Expenses (including fees waived/reimbursed by investment advisor) | | | 1.46% | | | | 1.50% | | | | 1.50% | (d) |
Net investment income | | | 0.42% | | | | 0.51% | | | | 0.56% | (d) |
| | | |
PORTFOLIO TURNOVER RATE | | | 37% | | | | 52% | | | | 24% | (c) |
| (a) | Per share numbers have been calculated using the average shares method. |
| (b) | Less than $0.005 per share. |
See Notes to Financial Statements.
| | |
| 80 | | 1.855.377.7325 | www.GrandeurPeakGlobal.com |
| | |
| Grandeur Peak Funds® | | Notes to Financial Statements |
April 30, 2014 |
1. ORGANIZATION
Financial Investors Trust (the “Trust”), a Delaware statutory trust, is an open-end management investment company registered under the Investment Company Act of 1940, as amended (“1940 Act”). As of April 30, 2014, the Trust had 30 registered funds. This Annual report describes the Grandeur Peak Emerging Markets Opportunities Fund, Grandeur Peak Global Opportunities Fund, Grandeur Peak Global Reach Fund, and Grandeur Peak International Opportunity Fund (individually a “Fund” and collectively, the “Funds”). The Grandeur Peak Emerging Markets Opportunities Fund seeks long-term growth of capital and invests primarily in small and micro-cap companies domiciled in emerging or frontier markets. The Grandeur Peak Global Opportunities Fund seeks long-term growth of capital and invests primarily in foreign and domestic small and micro cap companies. The Grandeur Peak Global Reach Fund seeks long-term growth of capital and invests primarily in foreign and domestic small and micro cap companies. The Grandeur Peak International Opportunities Fund seeks long-term growth of capital and invests primarily in foreign small and micro cap companies. The Funds offer Investor Class and Institutional Class shares. All classes of shares have identical rights to earnings, assets and voting privileges, except for class specific expenses and exclusive rights to vote on matters affecting only individual classes. The Grandeur Peak Global Opportunities Fund and Grandeur Peak International Opportunities Fund are registered as non-diversified investment companies for purpose of the 1940 Act. As a result of ongoing operations, it is possible that one or both Funds may become diversified investment companies, which would occur at the earliest on or about October, 2014. In such case, the Fund(s) may not resume operating in a non-diversified manner without first obtaining shareholder approval.
2. SIGNIFICANT ACCOUNTING POLICIES
The accompanying financial statements were prepared in accordance with accounting principles generally accepted in the United States of America (“U.S. GAAP”). The preparation of financial statements in conformity with U.S. GAAP requires management to make certain estimates and assumptions that affect the reported amounts of assets and liabilities and disclosures of contingent assets and liabilities at the date of the financial statements and the reported amounts of revenue and expenses during the period. Actual results could differ from those estimates. The following is a summary of significant accounting policies consistently followed by the Funds in preparation of their financial statements.
Investment Valuation: The Funds generally value their securities based on market prices determined at the close of regular trading on the New York Stock Exchange (“NYSE”), normally 4:00 p.m. Eastern Time, on each day the NYSE is open for trading.
For equity securities and mutual funds that are traded on an exchange, the market price is usually the closing sale or official closing price on that exchange. In the case of equity securities not traded on an exchange, or if such closing prices are not otherwise available, the securities are valued at the mean of the most recent bid and ask prices on such day. Redeemable securities issued by open-end registered investment companies are valued at the investment company’s applicable net asset value.
Equity securities that are primarily traded on foreign securities exchanges are valued at the closing values of such securities on their respective foreign exchanges, except when an event occurs subsequent to the close of the foreign exchange and the close of the NYSE that was likely to have changed such value. In such an event, the fair value of those securities are determined in good faith
| | |
Annual Report | April 30, 2014 | | 81 |
| | |
| Grandeur Peak Funds® | | Notes to Financial Statements |
April 30, 2014 |
through consideration of other factors in accordance with procedures established by and under the general supervision of the Board of Trustees (the “Board”). The Funds will use a fair valuation model provided by an independent pricing service, which is intended to reflect fair value when a security’s value or a meaningful portion of each Fund’s portfolio is believed to have been materially affected by a valuation event that has occurred between the close of the exchange or market on which the security is traded and the close of the regular trading day on the NYSE. The Funds’ valuation procedures set forth certain triggers which instruct when to use the fair valuation model.
Forward currency exchange contracts have a market value determined by the prevailing foreign currency exchange daily rates and current foreign currency exchange forward rates. The foreign currency exchange forward rates are calculated using an automated system that estimates rates on the basis of the current day foreign currency exchange rates and forward foreign currency exchange rates supplied by a pricing service.
When such prices or quotations are not available, or when the Fair Value Committee appointed by the Board believes that they are unreliable, securities may be priced using fair value procedures approved by the Board.
Fair Value Measurements: The Funds disclose the classification of their fair value measurements following a three-tier hierarchy based on the inputs used to measure fair value. Inputs refer broadly to the assumptions that market participants would use in pricing the asset or liability, including assumptions about risk. Inputs may be observable or unobservable. Observable inputs reflect the assumptions market participants would use in pricing the asset or liability that are developed based on market data obtained from sources independent of the reporting entity. Unobservable inputs reflect the reporting entity’s own assumptions about the assumptions market participants would use in pricing the asset or liability that are developed based on the best information available.
Various inputs are used in determining the value of the Funds’ investments as of the end of the reporting period. When inputs used fall into different levels of the fair value hierarchy, the level in the hierarchy within which the fair value measurement falls is determined based on the lowest level input that is significant to the fair value measurement in its entirety. The designated input levels are not necessarily an indication of the risk or liquidity associated with these investments. These inputs are categorized in the following hierarchy under applicable financial accounting standards:
Level 1 – Unadjusted quoted prices in active markets for identical investments, unrestricted assets or liabilities that the Funds have the ability to access at the measurement date;
Level 2 – Quoted prices which are not active, quoted prices for similar assets or liabilities in active markets or inputs other than quoted prices that are observable (either directly or indirectly) for substantially the full term of the asset or liability; and
Level 3 – Significant unobservable prices or inputs (including the Funds’ own assumptions in determining the fair value of investments) where there is little or no market activity for the asset or liability at the measurement date.
| | |
| 82 | | 1.855.377.7325 | www.GrandeurPeakGlobal.com |
| | |
| Grandeur Peak Funds® | | Notes to Financial Statements |
April 30, 2014 |
The following is a summary of each Fund’s investments in the fair value hierarchy as of April 30, 2014:
| | | | | | | | | | | | | | | | |
Investments in Securities at Value(a) | | Level 1 - Quoted
and Unadjusted
Prices | | | Level 2 - Other
Significant
Observable
Inputs | | | Level 3 -
Significant
Unobservable
Inputs | | | Total | |
Grandeur Peak Emerging Markets Opportunities Fund | | | | | | | | | | | | | | | | |
Common Stocks | | | | | | | | | | | | | | | | |
China | | $ | 43,454,405 | | | $ | – | | | $ | 2,701,643 | | | $ | 46,156,048 | |
Colombia | | | 5,920,238 | | | | – | | | | – | | | | 5,920,238 | |
Other | | | 221,661,194 | | | | – | | | | – | | | | 221,661,194 | |
Preferred Stocks | | | 1,480,164 | | | | – | | | | – | | | | 1,480,164 | |
Total | | $ | 272,516,001 | | | $ | – | | | $ | 2,701,643 | | | $ | 275,217,644 | |
| | |
| (a) | For detailed descriptions of countries, see the accompanying Portfolio of Investments. |
| | | | | | | | | | | | | | | | |
Investments in Securities at Value(a) | | Level 1 - Quoted and Unadjusted Prices | | | Level 2 - Other
Significant
Observable
Inputs | | | Level 3 -
Significant
Unobservable
Inputs | | | Total | |
Grandeur Peak Global Opportunities Fund | | | | | | | | | | | | | | | | |
Common Stocks | | | | | | | | | | | | | | | | |
China | | $ | 45,110,758 | | | $ | – | | | $ | 4,062,331 | | | $ | 49,173,089 | |
Colombia | | | 11,398,910 | | | | – | | | | – | | | | 11,398,910 | |
Other | | | 617,578,895 | | | | – | | | | – | | | | 617,578,895 | |
Preferred Stocks | | | 2,868,735 | | | | – | | | | – | | | | 2,868,735 | |
Total | | $ | 676,957,298 | | | $ | – | | | $ | 4,062,331 | | | $ | 681,019,629 | |
| | |
| (a) | For detailed descriptions of countries, see the accompanying Portfolio of Investments. |
| | | | | | | | | | | | | | | | |
Investments in Securities at Value(a) | | Level 1 - Quoted
and Unadjusted
Prices | | | Level 2 - Other
Significant
Observable
Inputs | | | Level 3 -
Significant
Unobservable
Inputs | | | Total | |
Grandeur Peak Global Reach Fund | | | | | | | | | | | | | | | | |
Common Stocks | | | | | | | | | | | | | | | | |
China | | $ | 10,934,600 | | | $ | – | | | $ | 941,990 | | | $ | 11,876,590 | |
Colombia | | | 1,139,638 | | | | 207,378 | | | | – | | | | 1,347,016 | |
Other | | | 104,733,745 | | | | – | | | | – | | | | 104,733,745 | |
Preferred Stocks | | | 317,537 | | | | – | | | | – | | | | 317,537 | |
Total | | $ | 117,125,520 | | | $ | 207,378 | | | $ | 941,990 | | | $ | 118,274,888 | |
| | |
| (a) | For detailed descriptions of countries, see the accompanying Portfolio of Investments. |
| | |
Annual Report | April 30, 2014 | | 83 |
| | |
| Grandeur Peak Funds® | | Notes to Financial Statements |
April 30, 2014 |
| | | | | | | | | | | | | | | | |
Investments in Securities at Value(a) | | Level 1 - Quoted
and Unadjusted
Prices | | | Level 2 - Other
Significant
Observable
Inputs | | | Level 3 - Significant
Unobservable
Inputs | | | Total | |
Grandeur Peak International Opportunities Fund | | | | | | | | | | | | | | | | |
Common Stocks | | | | | | | | | | | | | | | | |
China | | $ | 62,595,274 | | | $ | – | | | $ | 4,769,152 | | | $ | 67,364,426 | |
Colombia | | | 12,393,378 | | | | – | | | | – | | | | 12,393,378 | |
Other | | | 639,780,568 | | | | – | | | | – | | | | 639,780,568 | |
Preferred Stocks | | | 3,486,473 | | | | – | | | | – | | | | 3,486,473 | |
Rights | | | 71,699 | | | | – | | | | – | | | | 71,699 | |
Total | | $ | 718,327,392 | | | $ | – | | | $ | 4,769,152 | | | $ | 723,096,544 | |
| | |
| (a) | For detailed descriptions of countries, see the accompanying Portfolio of Investments. |
The Funds recognize transfers between levels as of the end of the period. For the fiscal year ended April 30, 2014, the Funds did not have any transfers between Level 1 and Level 2 securities.
| | |
| 84 | | 1.855.377.7325 | www.GrandeurPeakGlobal.com |
| | |
| Grandeur Peak Funds® | | Notes to Financial Statements |
April 30, 2014 |
The following is a reconciliation of the investments in which significant unobservable inputs (Level 3) were used in determining fair value:
| | | | | | | | | | | | | | | | | | | | |
| | | Balance as
of April 30,
2013 | | | Transfer In* | | | Unrealized Appreciation/ (Depreciation) | | | Balance as
of April 30,
2014 | | | Net change in
unrealized
depreciation
included in the
Statement of
Operations
attributable to
Level 3 investments
still held at April 30, 2014 | |
| | | | |
| Grandeur Peak Emerging Markets Opportunities Fund | | | | | | | | | | | | | | | | | | | | |
| Common Stocks | | $ | – | | | $ | 2,701,643 | | | $ | – | | | $ | 2,701,643 | | | | $(2,015,757) | |
| | | | |
| Total | | $ | – | | | $ | 2,701,643 | | | $ | – | | | $ | 2,701,643 | | | | $(2,015,757) | |
| | | | |
| | | | | |
Grandeur Peak Global Opportunities Fund | | | | | | | | | | | | | | | | | | | | |
| Common Stocks | | $ | – | | | $ | 4,062,331 | | | $ | – | | | $ | 4,062,331 | | | | $(2,441,932) | |
| | | | |
| Total | | $ | – | | | $ | 4,062,331 | | | $ | – | | | $ | 4,062,331 | | | | $(2,441,932) | |
| | | | |
| | | | | |
Grandeur Peak Global Reach Fund | | | | | | | | | | | | | | | | | | | | |
| Common Stocks | | $ | – | | | $ | 941,990 | | | $ | – | | | $ | 941,990 | | | | $(447,377) | |
| | | | |
| Total | | $ | – | | | $ | 941,990 | | | $ | – | | | $ | 941,990 | | | | $(447,377) | |
| | | | |
| | | | | |
Grandeur Peak International Opportunities Fund | | | | | | | | | | | | | | | | | | | | |
| Common Stocks | | $ | – | | | $ | 4,769,152 | | | $ | – | | | $ | 4,769,152 | | | | $(3,057,462) | |
| | | | |
| Total | | $ | – | | | $ | 4,769,152 | | | $ | – | | | $ | 4,769,152 | | | | $(3,057,462) | |
| | | | |
| * | The above transfers were due to the Fund’s lack of a closing market price. |
Net change in unrealized appreciation/depreciation on Level 3 securities is included on the Statements of Assets and Liabilities under Net unrealized appreciation on investments and translation of assets and liabilities in foreign currencies.
| | |
Annual Report | April 30, 2014 | | 85 |
| | |
| Grandeur Peak Funds® | | Notes to Financial Statements |
April 30, 2014 |
The table below provided additional information about the Level 3 Fair Value Measurements as of April 30, 2014:
Quantitative Information about Level 3 Fair Value Measurements
Grandeur Peak Emerging Markets Opportunities Fund
| | | | | | | | |
| Asset Class | | Fair Value (USD) | | Valuation Technique | | Unobservable Input (a) | | Input Value |
Foreign Common Stock | | $2,701,643 | | Discounted last quoted exchange price | | Discount for lack of liquidity | | 15% |
Grandeur Peak Global Opportunities Fund | | | | | | | | |
| Asset Class | | Fair Value (USD) | | Valuation Technique | | Unobservable Input(a) | | Input Value |
Foreign Common Stock | | $4,062,331 | | Discounted last quoted exchange price | | Discount for lack of liquidity | | 15% |
Grandeur Peak Global Reach Fund | | | | | | | | |
| Asset Class | | Fair Value (USD) | | Valuation Technique | | Unobservable Input(a) | | Input Value |
Foreign Common Stock | | $941,990 | | Discounted last quoted exchange price | | Discount for lack of liquidity | | 15% |
Grandeur Peak International Opportunities Fund | | | | | | | | |
| Asset Class | | Fair Value (USD) | | Valuation Technique | | Unobservable Input(a) | | Input Value |
Foreign Common Stock | | $4,769,152 | | Discounted last quoted exchange price | | Discount for lack of liquidity | | 15% |
| (a) | A change to the unobservable input may result in a significant change to the value of the investment as follows: |
| | | | |
| Unobservable Input | | Impact to Value if Input Increases | | Impact to Value if Input Decreases |
Discount for Lack of Liquidity | | Decrease | | Increase |
Investment Transactions and Investment Income: Investment transactions are accounted for on the date the investments are purchased or sold (trade date). Realized gains and losses from investment transactions are reported on an identified cost basis. Interest income, which includes accretion of discounts and amortization of premiums, is accrued and recorded as earned. Dividend income is recognized on the ex-dividend date or for certain foreign securities, as soon as information is available to the Funds. All of the realized and unrealized gains and losses and net investment income, are allocated daily to each class in proportion to its average daily net assets.
| | |
| 86 | | 1.855.377.7325 | www.GrandeurPeakGlobal.com |
| | |
| Grandeur Peak Funds® | | Notes to Financial Statements |
April 30, 2014 |
Cash Management Transactions: The Funds subscribe to the Brown Brothers Harriman & Co. (“BBH”) Cash Management Service (“CMS”), whereby cash balances are automatically swept into overnight offshore demand deposits with either the BBH Grand Cayman branch or a branch of a pre-approved commercial bank. This fully automated program allows the Funds to earn interest on cash balances. Excess cash with deposit institutions domiciled outside of the U.S. are subject to sovereign actions in the jurisdiction of the deposit institution including, but not limited to, freeze, seizure or diminution. Cash balances in the BBH CMS are included on the statements of assets and liabilities under cash and foreign cash. As of April 30, 2014, the Funds had the following cash balances participating in the BBH CMS:
| | |
| Fund | | |
Grandeur Peak Emerging Markets Opportunities Fund | | $ 2,215,335 |
Grandeur Peak Global Opportunities Fund | | $ 10,187,933 |
Grandeur Peak Global Reach Fund | | $ 18,502,324 |
Grandeur Peak International Opportunities Fund | | $ 51,979,057 |
As of April 30, 2014, the Funds had the following foreign cash balances participating in the BBH CMS (cost and value of foreign cash balances are equal):
| | | | |
| Fund | | | |
Grandeur Peak Emerging Markets Opportunities Fund | | $ | 643,470 | |
Grandeur Peak Global Opportunities Fund | | $ | 14,898,018 | |
Grandeur Peak Global Reach Fund | | $ | 358,790 | |
Grandeur Peak International Opportunities Fund | | $ | 23,337,724 | |
Foreign Securities: The Funds may directly purchase securities of foreign issuers. Investing in securities of foreign issuers involves special risks not typically associated with investing in securities of U.S. issuers. The risks include possible reevaluation of currencies, the inability to repatriate foreign currency, less complete financial information about companies and possible future adverse political and economic developments. Moreover, securities of many foreign issuers and their markets may be less liquid and their prices more volatile than those of securities of comparable U.S. issuers.
Foreign Currency Translation: The books and records of the Funds are maintained in U.S. dollars. Investment valuations and other assets and liabilities initially expressed in foreign currencies are converted each business day into U.S. dollars based upon current exchange rates. Prevailing foreign exchange rates may generally be obtained at the close of the NYSE (normally, 4:00 p.m. Eastern Time). The portion of realized and unrealized gains or losses on investments due to fluctuations in foreign currency exchange rates is not separately disclosed and is included in realized and unrealized gains or losses on investments, when applicable.
Foreign Currency Spot Contracts: The Funds may enter into foreign currency spot contracts to facilitate transactions in foreign securities or to convert foreign currency receipts into U.S. dollars. A foreign currency spot contract is an agreement between two parties to buy and sell currencies at the current market rate, for settlement generally within two business days. The U.S. dollar value of the contracts is determined using current currency exchange rates supplied by a pricing service.
| | |
Annual Report | April 30, 2014 | | 87 |
| | |
| Grandeur Peak Funds® | | Notes to Financial Statements |
April 30, 2014 |
The contract is marked-to-market daily for settlements beyond one day and any change in market value is recorded as an unrealized gain or loss. When the contract is closed, a realized gain or loss is recorded equal to the difference between the value on the open and close date. Losses may arise from changes in the value of the foreign currency, or if the counterparties do not perform under the contract’s terms. The maximum potential loss from such contracts is the aggregate face value in U.S. dollars at the time the contract was opened.
Trust Expenses: Some expenses of the Trust can be directly attributed to the Funds. Expenses which cannot be directly attributed to the Funds are apportioned among all funds in the Trust based on average net assets of each fund.
Fund and Class Expenses: Expenses that are specific to a Fund or class of shares of a Fund are charged directly to that Fund or share class. Expenses that are common to all Funds generally are allocated among the Funds in proportion to their average daily net assets. Fees provided under the distribution (Rule 12b-1) and/or shareholder service plans for a particular class of the Funds are charged to the operations of such class.
Offering Costs: Offering costs, including costs of printing initial prospectuses, legal and registration fees, are being amortized over twelve months from the inception date of the Funds. As of April 30, 2014, $22,096 and $6,790, of offering costs remain to be amortized for Grandeur Peak Emerging Markets Opportunities Fund and Grandeur Peak Global Reach Fund, respectively.
Federal Income Taxes: The Funds comply with the requirements under Subchapter M of the Internal Revenue Code of 1986, as amended, applicable to regulated investment companies and intend to distribute substantially all of their net taxable income and net capital gains, if any, each year so that it will not be subject to excise tax on undistributed income and gains. The Funds are not subject to income taxes to the extent such distributions are made.
As of and during the year ended April 30, 2014, the Funds did not have a liability for any unrecognized tax benefits. The Funds file U.S. federal, state, and local tax returns as required. The Funds’ tax returns are subject to examination by the relevant tax authorities until expiration of the applicable statute of limitations, which is generally three years after the filing of the tax return for federal purposes and four years for most state returns. Tax returns for open years have incorporated no uncertain tax positions that require a provision for income taxes.
Distributions to Shareholders: Each Fund normally pays dividends and distributes capital gains, if any, on an annual basis. Income dividend distributions are derived from interest and other income each Fund receives from their investments, including short term capital gains. Long term capital gain distributions are derived from gains realized when each Fund sells a security it has owned for more than a year. Each Fund may make additional distributions and dividends at other times if the portfolio manager believes doing so may be necessary for each Fund to avoid or reduce taxes. The Funds intend to pass through foreign tax credits to shareholders.
3. TAX BASIS INFORMATION
Reclassifications: As of April 30, 2014, permanent differences in book and tax accounting were reclassified. These differences had no effect on net assets and are primarily attributed to the differing book/tax treatment of foreign currency transactions, non-deductible expenses, the netting of net investment loss, and certain other investments. The reclassifications were as follows:
| | |
| 88 | | 1.855.377.7325 | www.GrandeurPeakGlobal.com |
| | |
| Grandeur Peak Funds® | | Notes to Financial Statements |
April 30, 2014 |
| | | | | | | | | | | | |
| Fund | | Paid-in Capital | | | Accumulated Net
Investment Loss | | | Accumulated Net
Realized Gain on
Investments | |
Grandeur Peak Emerging Markets Opportunities Fund | | | $ (32,696) | | | $ | (14,025) | | | $ | 46,721 | |
Grandeur Peak Global Opportunities Fund | | | – | | | | 711,728 | | | | (711,728) | |
Grandeur Peak Global Reach Fund | | | (43,851) | | | | 87,868 | | | | (44,017) | |
Grandeur Peak International Opportunities Fund | | | – | | | | 2,964,615 | | | | (2,964,615) | |
Tax Basis of Investments: As of April 30, 2014, the aggregate cost of investments, gross unrealized appreciation/ (depreciation) and net unrealized appreciation for Federal tax purposes was as follows:
| | | | | | | | | | | | | | | | | | | | |
| | | Gross
Appreciation
(excess of
value over tax
cost) | | | Gross
Depreciation
(excess of tax
cost over value) | | | Net Depreciation of
Foreign
Currency | | | Net Unrealized
Appreciation | | | Cost of
Investments for
Income Tax
Purposes | |
Grandeur Peak Emerging Markets Opportunities Fund | | $ | 20,725,568 | | | $ | (11,261,272 | ) | | $ | (437,219 | ) | | $ | 9,027,077 | | | $ | 265,753,348 | |
Grandeur Peak Global Opportunities Fund | | | 146,561,622 | | | | (23,806,782 | ) | | | (431,455 | ) | | | 122,323,385 | | | | 558,264,789 | |
Grandeur Peak Global Reach Fund | | | 11,703,280 | | | | (4,616,925 | ) | | | (114,104 | ) | | | 6,972,251 | | | | 111,188,533 | |
Grandeur Peak International Opportunities Fund | | | 158,517,265 | | | | (29,576,863 | ) | | | (456,380 | ) | | | 128,484,022 | | | | 594,156,142 | |
| | |
Annual Report | April 30, 2014 | | 89 |
| | |
| Grandeur Peak Funds® | | Notes to Financial Statements |
April 30, 2014 |
Components of Earnings: As of April 30, 2014, components of distributable earnings on a tax basis were as follows:
| | | | | | | | | | | | | | | | |
| | | Undistributed Ordinary Income | | | Accumulated
Capital Gains | | | Net Unrealized
Appreciation on Investments
and Foreign
Currency | | | Total Distributable Earnings | |
Grandeur Peak Emerging Markets Opportunities Fund | | | $ 1,760,977 | | | | $ – | | | | $ 9,027,077 | | | | $ 10,788,054 | |
Grandeur Peak Global Opportunities Fund | | | 2,478,336 | | | | 11,107,456 | | | | 122,323,385 | | | | 135,909,177 | |
Grandeur Peak Global Reach Fund | | | 1,272,670 | | | | 340 | | | | 6,972,251 | | | | 8,245,261 | |
Grandeur Peak International Opportunities Fund | | | 9,780,043 | | | | 6,624,066 | | | | 128,484,022 | | | | 144,888,131 | |
Capital Losses: As of April 30, 2014, the Funds have no accumulated capital loss carryforwards.
Tax Basis of Distributions to Shareholders: The character of distributions made during the year from net investment income or net realized gains may differ from its ultimate characterization for federal income tax purposes. Also, due to the timing of dividend distributions, the fiscal year in which amounts are distributed may differ from the fiscal year in which the income or realized gain were recorded by the Funds.
The tax character of distributions paid by the Funds for the fiscal year and or period ended April 30, 2014 were as follows:
| | | | | | | | |
| | | Ordinary Income | | | Long-Term Capital
Gain | |
Grandeur Peak Emerging Markets Opportunities Fund | | $ | – | | | $ | – | |
Grandeur Peak Global Opportunities Fund | | | 12,405,055 | | | | 12,289,718 | |
Grandeur Peak Global Reach Fund | | | 520,818 | | | | – | |
Grandeur Peak International Opportunities Fund | | | 16,309,161 | | | | 4,623,208 | |
The tax character of distributions paid by the Funds for the fiscal year and or period ended April 30, 2013 were as follows:
| | | | | | | | |
| | | Ordinary Income | | | Long-Term Capital
Gain | |
Grandeur Peak Global Opportunities Fund | | $ | 4,298,437 | | | $ | 11,510 | |
Grandeur Peak International Opportunities Fund | | | 1,378,397 | | | | 76,375 | |
| | |
| 90 | | 1.855.377.7325 | www.GrandeurPeakGlobal.com |
| | |
| Grandeur Peak Funds® | | Notes to Financial Statements |
April 30, 2014 |
4. SECURITIES TRANSACTIONS
The cost of purchases and proceeds from sales of securities (excluding short term securities) during the year ended April 30, 2014 were as follows:
| | | | | | | | |
| Fund | | Purchases of
Securities | | | Proceeds From Sales
of Securities | |
| |
Grandeur Peak Emerging Markets Opportunities Fund | | $ | 310,660,748 | | | | $ 47,036,308 | |
Grandeur Peak Global Opportunities Fund | | | 443,383,675 | | | | 191,595,216 | |
Grandeur Peak Global Reach Fund | | | 130,126,449 | | | | 20,711,110 | |
Grandeur Peak International Opportunities Fund | | | 481,385,075 | | | | 191,765,384 | |
5. SHARES OF BENEFICIAL INTEREST
The capitalization of the Trust consists of an unlimited number of shares of beneficial interest with no par value per share. Holders of the shares of the Funds of the Trust have one vote for each share held and a proportionate fraction of a vote for each fractional share. All shares issued and outstanding are fully paid and are non-assessable, transferable and redeemable at the option of the shareholder. Shares have no pre-emptive rights.
Shares redeemed within 60 days of purchase may incur a 2% short-term redemption fee deducted from the redemption amount. For the year ended April 30, 2014 and the year ended April 30, 2013, the redemption fees charged by the Funds are presented in the Statements of Changes in Net Assets.
6. MANAGEMENT AND RELATED-PARTY TRANSACTIONS
Grandeur Peak Global Advisors, LLC (the “Adviser” or “Grandeur Peak Global Advisors”), subject to the authority of the Board, is responsible for the overall management and administration of the Funds’ business affairs. The Adviser manages the investments of the Funds in accordance with the Funds’ investment objective, policies and limitations and investment guidelines established jointly by the Adviser and the Trustees. Pursuant to the Advisory Agreement, (the “Advisory Agreement”), each Fund pays the Adviser an annual management fee based on each Fund’s average daily net assets. The management fee is paid on a monthly basis. The following table reflects the Funds’ advisory fee rates.
| | | | | | | | |
| Fund | | | | | Advisory Fee | |
Grandeur Peak Emerging Markets Opportunities Fund | | | | | | | 1.35% | |
Grandeur Peak Global Opportunities Fund | | | 1.25% | | | | | |
Grandeur Peak Global Reach Fund | | | | | | | 1.10% | |
Grandeur Peak International Opportunities Fund | | | | | | | 1.25% | |
With respect to the Grandeur Peak Global Opportunities Fund and the Grandeur Peak International Opportunities Fund, the Adviser has contractually agreed to limit certain of each Fund’s expenses to 1.75% of the Fund’s average daily net assets in the Investor Class shares and 1.50% of the Fund’s average daily net assets in the Institutional Class shares until August 31, 2014. With respect to the Grandeur Peak Emerging Markets Opportunities Fund, the Adviser has contractually agreed to limit certain of the Fund’s expenses to 1.95% of the Fund’s average daily net assets in the Investor Class shares and 1.70% of the Fund’s average daily net assets in the Institutional Class shares until August 31, 2014. With respect to the Grandeur Peak Global Reach
| | |
Annual Report | April 30, 2014 | | 91 |
| | |
| Grandeur Peak Funds® | | Notes to Financial Statements |
April 30, 2014 |
Fund, the Adviser has contractually agreed to limit certain of the Fund’s expenses to 1.60% of the Fund’s average daily net assets in the Investor Class shares and 1.35% of the Fund’s average daily net assets in the Institutional Class shares until August 31, 2014. Pursuant to these agreements, each Fund will reimburse the Adviser for any fee waivers and expense reimbursements made by the Adviser, provided that any such reimbursements made by the Funds to the Adviser will not cause the Funds’ expense limitation to exceed expense limitations in existence at the time the expense was incurred, or at the time of the reimbursement, whichever is lower, and the reimbursement is made within three years after the expenses were incurred.
For the year ended April 30, 2014, the fee waivers and/or reimbursements were as follows:
| | | | | | | | | | | | |
| Fund | | Fees Waived/
Reimbursed By
Adviser | | | Recoupment of
Previously
Waived Fees By
Adviser | | | Total | |
| | |
Grandeur Peak Emerging Markets Opportunities Fund | | | | | | | | | | | | |
Investor Class | | $ | 3,666 | | | $ | – | | | $ | 3,666 | |
Institutional Class | | | 35,532 | | | | – | | | | 35,532 | |
Grandeur Peak Global Opportunities Fund | | | | | | | | | | | | |
Investor Class | | $ | – | | | $ | (66,162) | | | $ | (66,162) | |
Institutional Class | | | – | | | | (142,402) | | | | (142,402) | |
Grandeur Peak Global Reach Fund | | | | | | | | | | | | |
Investor Class | | $ | 50,773 | | | $ | – | | | $ | 50,773 | |
Institutional Class | | | 114,461 | | | | – | | | | 114,461 | |
Grandeur Peak International Opportunities Fund | | | | | | | | | | | | |
Investor Class | | $ | – | | | $ | (76,169) | | | $ | (76,169) | |
Institutional Class | | | – | | | | (205,673) | | | | (205,673) | |
As of April 30, 2014, the balances of recoupable expenses for each Fund were as follows:
| | | | | | | | |
| Fund | | Expires 2017 | | | Total | |
| | |
Grandeur Peak Emerging Markets Opportunities Fund | | | | | | | | |
Investor Class | | $ | 3,666 | | | $ | 3,666 | |
Institutional Class | | | 35,532 | | | | 35,532 | |
Grandeur Peak Global Reach Fund | | | | | | | | |
Investor Class | | $ | 50,773 | | | $ | 50,773 | |
Institutional Class | | | 114,461 | | | | 114,461 | |
Administrator Fees and Expenses
ALPS Fund Services, Inc. (“ALPS” and the “Administrator”) (an affiliate of ALPS Distributors, Inc.) serves as administrator to the Funds, and each Fund has agreed to pay expenses incurred in connection with its administrative activities. Pursuant to the Administration, Bookkeeping and Pricing Services Agreement (the “Agreement”), ALPS will provide operational services to the Funds including, but not limited to fund accounting and fund administration and generally assist in each Fund’s operations.
| | |
| 92 | | 1.855.377.7325 | www.GrandeurPeakGlobal.com |
| | |
| Grandeur Peak Funds® | | Notes to Financial Statements |
April 30, 2014 |
Prior to the June 19, 2013 inception of the Grandeur Peak Global Reach Fund, the Annual Administrative Fee was billed monthly in total and allocated to the Grandeur Peak Global Opportunities Fund and the Grandeur Peak International Fund in the amount of the greater of (a) the annual minimum for both Funds of $205,000 or (b) following basis point fee schedule:
| | | | |
| Average Total Net Assets | | Contractual Fee | | |
Between $0-$500M | | 0.05% | | |
$500M-$1B | | 0.03% | | |
Above $1B | | 0.02% | | |
The minimum annual total fee of $205,000 was increased to $285,000 with the commencement of the Grandeur Peak Global Reach Fund on June 19, 2013 and increased to $360,000 with the inception of the Grandeur Peak Emerging Markets Opportunities Fund on December 16, 2013.
The Administrator is also reimbursed by the Funds for certain out-of-pocket expenses.
Transfer Agent
ALPS serves as transfer, dividend paying and shareholder servicing agent for the Funds. ALPS receives an annual minimum fee, a fee based upon the number of shareholder accounts, and is also reimbursed by the Funds for certain out-of-pocket expenses.
Compliance Services
ALPS provides services that assist the Trust’s Chief Compliance Officer in monitoring and testing the policies and procedures of the Trust in conjunction with requirements under Rule 38a-1 under the 1940 Act and receives an annual base fee. ALPS is reimbursed for certain out-of-pocket expenses by the Funds.
Principal Financial Officer
ALPS receives an annual fee for providing principal financial officer services to the Funds.
Distributor: ALPS Distributors, Inc. (“ADI” or the “Distributor”) (an affiliate of ALPS) acts as the distributor of the Funds’ shares pursuant to a Distribution Agreement with the Trust. Shares are sold on a continuous basis by ADI as agent for the Funds, and ADI has agreed to use its best efforts to solicit orders for the sale of each Fund’s shares, although it is not obliged to sell any particular amount of shares. ADI is not entitled to any compensation for its services as Distributor. ADI is registered as a broker-dealer with the Securities and Exchange Commission.
Each Fund has adopted a Distribution and Services (12b-1) Plan pursuant to Rule 12b-1 of the 1940 Act (the “Plan”) for its Investor Class shares. The Plan allows the Funds to use Investor Class assets to pay fees in connection with the distribution and marketing of Investor Class shares and/or the provision of shareholder services to Investor Class shareholders. The Plan permits payment for services in connection with the administration of plans or programs that use Investor Class shares of each Fund as their funding medium and for related expenses. The Plan permits the Funds to make total payments at an annual rate of up to 0.25% of each Fund’s average daily net assets attributable to its Investor Class shares. The expenses of the Plan are reflected as distribution and service fees in the Statement of Operations.
| | |
Annual Report | April 30, 2014 | | 93 |
| | |
| Grandeur Peak Funds® | | Notes to Financial Statements |
April 30, 2014 |
7. INDEMNIFICATIONS
Under the Trust’s organizational documents, its officers and Trustees are indemnified against certain liability arising out of the performance of their duties to the Trust. Additionally, in the normal course of business, the Trust enters into contracts with service providers that may contain general indemnification clauses, which may permit indemnification to the extent permissible under applicable law. The Trust’s maximum exposure under these arrangements is unknown, as this would involve future claims that may be made against the Trust that have not yet occurred.
8. NEW ACCOUNTING PRONOUNCEMENTS
In June 2013, the Financial Accounting Standards Board (the “FASB”) issued Accounting Standards Update (“ASU”) No. 2013-08, Financial Services-Investment Companies (Topic 946): Amendments to the Scope, Measurement, and Disclosure Requirements. The FASB standard identifies characteristics a company must assess to determine whether it is considered an investment company for financial reporting purposes. This ASU is effective for fiscal years beginning after December 15, 2013. The Funds believe the adoption of this ASU will not have a material impact on their financial statements.
| | |
| 94 | | 1.855.377.7325 | www.GrandeurPeakGlobal.com |
| | |
| | Report of Independent Registered |
| Grandeur Peak Funds® | | Public Accounting Firm |
To the Shareholders and Board of Trustees of Financial Investors Trust:
We have audited the accompanying statements of assets and liabilities, including the portfolios of investments, of Grandeur Peak Global Opportunities Fund, Grandeur Peak International Opportunities Fund, Grandeur Peak Emerging Markets Opportunities Fund, and Grandeur Peak Global Reach Fund (the “Funds”), four of the portfolios constituting Financial Investors Trust, as of April 30, 2014, the related statements of operations for the year then ended, the statements of changes in net assets for each of the two years in the period then ended, and the financial highlights for each of the periods presented (as to the Grandeur Peak Emerging Markets Fund, the related statements of operations and statements of changes in net assets for the period from December 16, 2013 (inception) to April 30, 2014) (as to the Grandeur Peak Global Reach Fund, the related statements of operations and statements of changes in net assets for the period from June 19, 2013 (inception) to April 30, 2014). These financial statements and financial highlights are the responsibility of the Funds’ management. Our responsibility is to express an opinion on these financial statements and financial highlights based on our audits.
We conducted our audits in accordance with the standards of the Public Company Accounting Oversight Board (United States). Those standards require that we plan and perform the audit to obtain reasonable assurance about whether the financial statements and financial highlights are free of material misstatement. The Funds are not required to have, nor were we engaged to perform, an audit of their internal control over financial reporting. Our audits included consideration of internal control over financial reporting as a basis for designing audit procedures that are appropriate in the circumstances, but not for the purpose of expressing an opinion on the effectiveness of the Funds’ internal control over financial reporting. Accordingly, we express no such opinion. An audit also includes examining, on a test basis, evidence supporting the amounts and disclosures in the financial statements, assessing the accounting principles used and significant estimates made by management, as well as evaluating the overall financial statement presentation. Our procedures included confirmation of securities owned as of April 30, 2014, by correspondence with the custodian and brokers; where replies were not received from brokers, we performed other auditing procedures. We believe that our audits provide a reasonable basis for our opinion.
In our opinion, the financial statements and financial highlights referred to above present fairly, in all material respects, the financial position of Grandeur Peak Global Opportunities Fund, Grandeur Peak International Opportunities Fund, Grandeur Peak Emerging Markets Opportunities Fund and Grandeur Peak Global Reach Fund of Financial Investors Trust as of April 30, 2014, and the results of their operations, the changes in their net assets, and the financial highlights for the periods presented in conformity with accounting principles generally accepted in the United States of America.
DELOITTE & TOUCHE LLP
Denver, Colorado
June 26, 2014
| | |
Annual Report | April 30, 2014 | | 95 |
| | |
| Grandeur Peak Funds® | | Disclosure Regarding Approval of Fund Advisory Agreement |
| | April 30, 2014 (Unaudited) |
GRANDEUR PEAK EMERGING MARKETS OPPORTUNITIES FUND
On March 12, 2013, the Trustees met in person to discuss, among other things, the approval of the Investment Advisory Agreement between the Trust and Grandeur Peak Global Advisors, LLC (“Grandeur Peak”) (the “Investment Advisory Agreement”) in accordance with Section 15(c) of the 1940 Act. The Independent Trustees met with independent legal counsel during executive session and discussed the Investment Advisory Agreement and other related materials.
In approving the Investment Advisory Agreement with Grandeur Peak, the Trustees, including the Independent Trustees, considered the following factors with respect to the Grandeur Peak Emerging Markets Opportunities Fund (the “Grandeur Peak Fund” or the “Fund”):
Investment Advisory Fee Rate: The Trustees reviewed and considered the contractual annual advisory fee to be paid by the Trust, on behalf of the Grandeur Peak Fund, to Grandeur Peak of 1.35% of the Grandeur Peak Fund’s daily average net assets, in light of the extent and quality of the advisory services to be provided by Grandeur Peak to the Fund.
The Trustees considered the information they received comparing the Grandeur Peak Fund’s contractual annual advisory fee and overall expenses with those of funds in both the relevant expense group and universe of funds provided by an independent provider of investment company data.
Based on such information, the Trustees determined that the contractual annual advisory fee of 1.35% and the total expense ratio of 1.70% and 1.95% for the Institutional Class and Investor Class Shares, respectively, of the Grandeur Peak Fund, taking into account the contractual fee waiver in place, are comparable to others within the Fund’s anticipated peer universe.
Nature, Extent and Quality of the Services under the Investment Advisory Agreement: The Trustees received and considered information regarding the nature, extent and quality of services to be provided to the Grandeur Peak Fund under the Investment Advisory Agreement. The Trustees reviewed certain background materials supplied by Grandeur Peak in its presentation, including its Form ADV.
The Trustees reviewed and considered Grandeur Peak’s investment advisory personnel, its history as an asset manager and its performance and the amount of assets currently under management. The Trustees also reviewed the research and decision-making processes utilized by Grandeur Peak, including the methods adopted to seek to achieve compliance with the investment objectives, policies and restrictions of the Grandeur Peak Fund.
The Trustees considered the background and experience of Grandeur Peak’s management in connection with the Grandeur Peak Fund, including reviewing the qualifications, backgrounds and responsibilities of the management team primarily responsible for the day-to-day portfolio management of the Grandeur Peak Fund and the extent of the resources devoted to research and analysis of actual and potential investments.
The Trustees also reviewed, among other things, Grandeur Peak’s insider trading policies and procedures and its Code of Ethics.
| | |
| 96 | | 1.855.377.7325 | www.GrandeurPeakGlobal.com |
| | |
| Grandeur Peak Funds® | | Disclosure Regarding Approval of Fund Advisory Agreement |
April 30, 2014 (Unaudited) |
Performance: The Trustees noted that since the Grandeur Peak Fund has not yet begun operations, there is no fund performance to be reviewed or analyzed at this time. The Trustees also considered the limitations on the comparability of performance information for certain related funds and accounts. The Trustees considered Grandeur Peak’s reputation generally and its investment techniques, risk management controls and decision-making processes.
The Adviser’s Profitability: The Trustees received and considered a projected profitability analysis prepared by Grandeur Peak based on the fees payable under the Investment Advisory Agreement. The Trustees considered the profits, if any, anticipated to be realized by Grandeur Peak in connection with the operation of the Grandeur Peak Fund. The Board then reviewed and discussed Grandeur Peak’s financial statements in order to analyze the financial condition and stability and profitability of the adviser.
Economies of Scale: The Trustees considered whether economies of scale in the provision of services to the Grandeur Peak Fund will be passed along to the shareholders under the proposed agreement.
Other Benefits to the Adviser: The Trustees reviewed and considered any other incidental benefits derived or to be derived by Grandeur Peak from its relationship with the Grandeur Peak Fund, including soft dollar arrangements.
The Board summarized its deliberations with respect to the Investment Advisory Agreement with Grandeur Peak. In selecting Grandeur Peak and the fees charged under the Investment Advisory Agreement, the Trustees concluded that no single factor reviewed by the Trustees was identified by the Trustees to be determinative as the principal factor in whether to approve the Investment Advisory Agreement. Further, the Independent Trustees were advised by separate independent legal counsel throughout the process. The Trustees, including all of the Independent Trustees, concluded that:
| | — | | the investment advisory fees to be received by Grandeur Peak with respect to the Grandeur Peak Fund were comparable to others within the Fund’s peer universe; |
| | — | | the nature, extent and quality of services to be rendered by Grandeur Peak under the Investment Advisory Agreement were adequate; |
| | — | | there was no performance history for the Grandeur Peak Fund for the Board to consider; |
| | — | | the terms of the proposed fee waiver and expense limitation agreement between the Trust, on behalf of the Grandeur Peak Fund, and Grandeur Peak, were not unreasonable; |
| | — | | the profit, if any, anticipated to be realized by Grandeur Peak in connection with the operation of the Grandeur Peak Fund is not unreasonable to the Fund; and |
| | — | | there were no material economies of scale or other incidental benefits accruing to Grandeur Peak in connection with its relationship to the Grandeur Peak Fund. |
Based on the Trustees’ deliberations and their evaluation of the information described above, the Trustees, including all of the Independent Trustees, concluded that Grandeur Peak’s compensation for investment advisory services is consistent with the best interests of the Grandeur Peak Fund and its shareholders.
| | |
Annual Report | April 30, 2014 | | 97 |
| | |
| Grandeur Peak Funds® | | Additional Information |
April 30, 2014 (Unaudited) |
1. FUND HOLDINGS
The Funds file their complete schedule of portfolio holdings with the Securities and Exchange Commission (the “SEC”) for the first and third quarters of each fiscal year on Form N-Q within 60 days after the end of the period. Copies of the Funds’ Form N-Q are available without charge on the SEC website at http://www.sec.gov. You may also review and copy the Form N-Q at the SEC’s Public Reference Room in Washington, DC. For more information about the operation of the Public Reference Room, please call the SEC at 1-800-SEC-0330.
2. FUND PROXY VOTING POLICIES, PROCEDURES AND SUMMARIES
The Funds’ policies and procedures used in determining how to vote proxies and information regarding how the Funds voted proxies relating to portfolio securities during the most recent prior 12-month period ending June 30 are available without charge, (1) upon request, by calling (toll-free) 855-377-PEAK(7325) and (2) on the SEC’s website at http://www.sec.gov.
3. TAX DESIGNATIONS
The Funds designate the following for federal income tax purposes for distributions made during the calendar year ended December 31, 2013:
| | | | | | | | | | | | | | | | | | | | |
| | | Global
Opportunities Fund | | International
Opportunities Fund | | Reach Fund | | Emerging Markets Opportunities Fund |
Dividend Received Deduction | | | | 6.39 | % | | | | 0.33 | % | | | | 4.43 | % | | | | — | |
Qualified Dividend Income | | | | 28.52 | % | | | | 23.92 | % | | | | 22.44 | % | | | | — | |
In early 2014, if applicable, shareholders of record received this information for the distributions paid to them by the Funds during the calendar year 2013 via Form 1099. The Funds will notify shareholders in early 2015 of amounts paid to them by the Funds, if any, during the calendar year 2014.
Pursuant to Section 852(b)(3) of the Internal Revenue Code, Grandeur Peak Global Opportunities Fund and Grandeur Peak International Opportunities Fund designated $12,289,718 and $4,623,208 respectively, as long-term capital gain dividends.
Please consult a tax advisor if you have questions about federal or state income tax laws, or how to prepare your tax returns.
| | |
| 98 | | 1.855.377.7325 | www.GrandeurPeakGlobal.com |
| | |
| Grandeur Peak Funds® | | Trustees and Officers |
| April 30, 2014 (Unaudited) |
Additional information regarding the Fund’s trustees is included in the Statement of Additional Information, which can be obtained without charge by calling 855-377-PEAK.
INDEPENDENT TRUSTEES
| | | | | | | | | | |
Name,
Address*
& Year of
Birth | | Position(s)
Held with
Fund | | Term of Office
and Length of
Time Served** | | Principal Occupation(s) During Past 5 Years*** | | Number of
Funds in
Fund
Complex
Overseen
by Trustee**** | | Other Directorships Held by Trustee |
Mary K. Anstine, 1940 | | Trustee | | Ms. Anstine was elected at a special meeting of shareholders held on March 21, 1997 and re-elected at a special meeting of shareholders held on August 7, 2009. | | Ms. Anstine was President/Chief Executive Officer of HealthONE Alliance, Denver, Colorado, and former Executive Vice President of First Interstate Bank of Denver. Ms. Anstine is also Trustee/ Director of AV Hunter Trust and Colorado Uplift Board. Ms. Anstine was formerly a Director of the Trust Bank of Colorado (later purchased and now known as Northern Trust Bank), HealthONE and Denver Area Council of the Boy Scouts of America, and a member of the American Bankers Association Trust Executive Committee. | | 30 | | Ms. Anstine is a Trustee of ALPS ETF Trust (21 funds); ALPS Variable Investment Trust (8 funds); Reaves Utility Income Fund (1 fund); and Westcore Trust (12 funds). |
| * | All communications to Trustees and Officers may be directed to Financial Investors Trust c/o 1290 Broadway, Suite 1100, Denver, CO 80203. |
| ** | This is the period for which the Trustee or Officer began serving the Trust. Each Trustee and/or Officer serves an indefinite term, until his successor is elected. |
| *** | Except as otherwise indicated, each individual has held the office shown or other offices in the same company for the last five years. |
| **** | The Fund Complex includes all series of the Trust (currently 30) and any other investment companies for which any Trustee serves as Trustee for and which Grandeur Peak Global Advisors, LLC, provides investment advisory services (currently none). |
| | |
Annual Report | April 30, 2014 | | 99 |
| | |
| Grandeur Peak Funds® | | Trustees and Officers |
April 30, 2014 (Unaudited) |
INDEPENDENT TRUSTEES
| | | | | | | | | | |
Name, Address*
& Year of
Birth | | Position(s) Held with Fund | | Term of Office and Length of Time
Served** | | Principal Occupation(s) During Past 5 Years*** | | Number of
Funds in
Fund
Complex
Overseen by Trustee**** | | Other Directorships Held by Trustee |
John R. Moran, Jr., 1930 | | Trustee | | Mr. Moran was elected at a special meeting of shareholders held on March 21, 1997 and re-elected at a special meeting of shareholders held on August 7, 2009. | | Mr. Moran is formerly President and CEO of The Colorado Trust, a private foundation serving the health and hospital community in the state of Colorado Currently, Mr. Moran is a member of the Treasurer’s Investment Advisory Committee for the University of Colorado. | | 30 | | None. |
Jeremy W. Deems, 1976 | | Trustee | | Mr. Deems was appointed as a Trustee at the March 11, 2008 meeting of the Board of Trustees and elected at a special meeting of shareholders held on August 7, 2009. | | Mr. Deems is the Co-Founder, Chief Operations Officer and Chief Financial Officer of Green Alpha Advisors, LLC. Mr. Deems is Co-Portfolio Manager of the Shelton Green Alpha Fund. Prior to joining Green Alpha Advisors, Mr. Deems was CFO and Treasurer of Forward Management, LLC, ReFlow Management Co., LLC, ReFlow Fund, LLC, a private investment fund, and Sutton Place Management, LLC, an administrative services company, from 2004 to June 2007. | | 30 | | Mr. Deems is a Trustee of ALPS ETF Trust (21 funds); ALPS Variable Investment Trust (8 funds) and Reaves Utility Income Fund (1 fund). |
| * | All communications to Trustees and Officers may be directed to Financial Investors Trust c/o 1290 Broadway, Suite 1100, Denver, CO 80203. |
| ** | This is the period for which the Trustee or Officer began serving the Trust. Each Trustee and/or Officer serves an indefinite term, until his successor is elected. |
| *** | Except as otherwise indicated, each individual has held the office shown or other offices in the same company for the last five years. |
| **** | The Fund Complex includes all series of the Trust (currently 30) and any other investment companies for which any Trustee serves as Trustee for and which Grandeur Peak Global Advisors, LLC, provides investment advisory services (currently none). |
| | |
| 100 | | 1.855.377.7325 | www.GrandeurPeakGlobal.com |
| | |
| Grandeur Peak Funds® | | Trustees and Officers |
April 30, 2014 (Unaudited) |
INDEPENDENT TRUSTEES
| | | | | | | | | | |
Name,
Address*
& Year of
Birth | | Position(s) Held with Fund | | Term of Office and Length of Time Served** | | Principal Occupation(s) During Past 5 Years*** | | Number of Funds in Fund Complex Overseen by Trustee**** | | Other Directorships Held by Trustee |
Jerry G. Rutledge, 1944 | | Trustee | | Mr. Rutledge was elected at a special meeting of shareholders held on August 7, 2009. | | Mr. Rutledge is the President and owner of Rutledge’s Inc., a retail clothing business. He was from 1994 to 2007 a Regent of the University of Colorado. | | 30 | | Mr. Rutledge is a Trustee of Principal Real Estate Income Fund (1 fund), Clough Global Allocation Fund (1 fund), Clough Global Equity Fund (1 fund) and Clough Global Opportunities Fund (1 fund). |
Michael “Ross” Shell, 1970 | | Trustee | | Mr. Shell was elected at a special meeting of shareholders held on August 7, 2009. | | Mr. Shell is Founder and CEO of Red Idea, LLC, a strategic consulting/early stage venture firm (since June 2008). From 1999 to 2009, he was a part-owner and Director of Tesser, Inc., a brand agency. From December 2005 to May 2008, he was Director, Marketing and Investor Relations, of Woodbourne, a REIT/real estate hedge fund and private equity firm. Prior to this, from May 2004 to November 2005, he worked as a business strategy consultant; from June 2003 to April 2004, he was on the Global Client Services team of IDEO, a product design/innovation firm; and from 1999 to 2003, he was President of Tesser, Inc. Mr. Shell graduated with honors from Stanford University with a degree in Political Science. | | 30 | | None. |
| | |
Annual Report | April 30, 2014 | | 101 |
| | |
| Grandeur Peak Funds® | | Trustees and Officers |
April 30, 2014 (Unaudited) |
INTERESTED TRUSTEE
| | | | | | | | | | |
Name, Address* & Year of Birth | | Position(s) Held with Fund | | Term of Office and Length of Time Served** | | Principal Occupation(s) During Past 5 Years*** | | Number of Funds in Fund Complex Overseen by Trustee**** | | Other Directorships Held by Trustee |
Edmund J. Burke, 1961 | | Trustee, Chairman and President | | Mr. Burke was elected as Chairman at the August 28, 2009 meeting of the Board of Trustees. Mr. Burke was elected as Trustee at a special meeting of shareholders held on August 7, 2009. Mr. Burke was elected President of the Trust at the December 17, 2002 meeting of the Board of Trustees. | | Mr. Burke is President and a Director of ALPS Holdings, Inc. (“AHI”) (since 2005) and Director of Boston Financial Data Services, Inc. (“BFDS”), ALPS Advisors, Inc. (“AAI”), ALPS Distributors, Inc. (“ADI”), ALPS Fund Services, Inc. (“AFS”) and ALPS Portfolio Solutions Distributor, Inc. (“APSD”) and from 2001-2008, was President of AAI, ADI, AFS and APSD. Because of his positions with AHI, BFDS, AAI, ADI, AFS and APSD, Mr. Burke is deemed an affiliate of the Trust as defined under the 1940 Act. Mr. Burke is Trustee and President of the Clough Global Allocation Fund (Trustee since 2006; President since 2004); Trustee and President of the Clough Global Equity Fund (Trustee since 2006; President since 2005); Trustee and President of the Clough Global Opportunities Fund (since 2006); Trustee of the Liberty All-Star Equity Fund; and Director of the Liberty All-Star Growth Fund, Inc. | | 30 | | Mr. Burke is a Trustee of Clough Global Allocation Fund (1 fund); Clough Global Equity Fund (1 fund); Clough Global Opportunities Fund (1 fund); Trustee of the Liberty All-Star Equity Fund (1 fund); and Director of the Liberty All-Star Growth Fund, Inc. (1 fund). |
| * | All communications to Trustees and Officers may be directed to Financial Investors Trust c/o 1290 Broadway, Suite 1100, Denver, CO 80203. |
| ** | This is the period for which the Trustee or Officer began serving the Trust. Each Trustee and/or Officer serves an indefinite term, until his successor is elected. |
| *** | Except as otherwise indicated, each individual has held the office shown or other offices in the same company for the last five years. |
| **** | The Fund Complex includes all series of the Trust (currently 30) and any other investment companies for which any Trustee serves as Trustee for and which Grandeur Peak Global Advisors, LLC, provides investment advisory services (currently none). |
| | |
| 102 | | 1.855.377.7325 | www.GrandeurPeakGlobal.com |
| | |
| Grandeur Peak Funds® | | Trustees and Officers |
April 30, 2014 (Unaudited) |
OFFICERS
| | | | | | |
Name, Address* & Year of Birth | | Position(s) Held with Fund | | Term of Office and
Length of Time Served** | | Principal Occupation(s) During Past 5 Years** |
Kimberly R. Storms, 1972 | | Treasurer | | Ms. Storms was elected Treasurer of the Trust at the March 12, 2013 meeting of the Board of Trustees. | | Ms. Storms is Senior Vice President - Director of Fund Administration of ALPS. Ms. Storms joined ALPS in 1998 as Assistant Controller. Because of her position with ALPS, Ms. Storms is deemed an affiliate of the Trust as defined under the 1940 Act. Ms. Storms is also Treasurer of BPV Family of Funds and ALPS Series Trust; Assistant Treasurer of Liberty All-Star Equity Fund and Liberty All-Star Growth Fund, Inc.; Assistant Treasurer of Tilson Funds; and Chief Financial Officer of The Arbitrage Funds. |
David T. Buhler, 1971 | | Secretary | | Mr. Buhler was elected Secretary of the Trust at the September 11, 2012 meeting of the Board of Trustees. | | Mr. Buhler joined ALPS in June 2010. He is currently Vice President and Senior Associate Counsel of ALPS, AAI, ADI and APSD. Prior to joining ALPS, Mr. Buhler served as Associate General Counsel and Assistant Secretary of Founders Asset Management LLC from 2006 to 2009. Because of his position with ALPS, Mr. Buhler is deemed an affiliate of the Trust as defined under the 1940 Act. Mr. Buhler is also the Secretary ALPS Variable Investment Trust and Westcore Trust. |
Ted Uhl, 1974 | | Chief Compliance Officer (“CCO”) | | Mr. Uhl was appointed CCO of the Trust at the June 8, 2010 meeting of the Board of Trustees. | | Mr. Uhl joined ALPS in October 2006, and is currently Deputy Compliance Officer of ALPS. Prior to his current role, Mr. Uhl served as Senior Risk Manager for ALPS from October 2006 until June 2010. Before joining ALPS, Mr. Uhl served a Sr. Analyst with Enenbach and Associates (RIA), and a Sr. Financial Analyst at Sprint. Because of his position with ALPS, Mr. Uhl is deemed an affiliate of the Trust as defined under the 1940 Act. Mr. Uhl is also CCO of the Clough Global Funds, Reaves Utility Income Fund, Drexel Hamilton Funds and Transparent Value Trust. |
| | |
Annual Report | April 30, 2014 | | 103 |
Page Intentionally Left Blank

| | |
| Redmont Funds | | Shareholder Letter |
| | April 30, 2014 (Unaudited) |
Performance Discussion:
REDMONT RESOLUTE FUND I
Table 1 notes the performance for Fund I as of quarter end under standard reporting (since inception) as well as of April 30th.
Table 1i. ii. iii. iv. v.
Performance (amounts greater than one year are annualized)
| | | | | | | | | | | | |
| Redmont Resolute Fund I | | Average Annualized Performance Data As of March 31, 2014 | | Average Annualized Performance Data
As of April 30, 2014 |
| | | Year-to-Date | | 1-Year | | Since Inception
(12/30/11) | | Year-to-Date | | 1-Year | | Since Funding
(12/30/11) |
Resolute Fund I - I Class | | 0.28% | | 3.09% | | 3.69% | | 0.09% | | 1.36% | | 3.48% |
Resolute Fund I - A Class | | 0.19% | | 2.62% | | 3.28% | | 0.00% | | 0.70% | | 3.08% |
Load Adjusted | | -5.34% | | -3.03% | | 0.73% | | -5.52% | | -4.85% | | 0.62% |
HFRX Global Index | | 1.11% | | 4.61% | | 5.03% | | 0.38% | | 3.21% | | 4.52% |
S&P 500® Total Return Index | | 1.81% | | 21.77% | | 21.93% | | 2.56% | | 20.35% | | 21.44% |
Morningstar Multi-Alternative
Universe | | 0.03% | | 1.99% | | 3.01% | | 0.06% | | 1.39% | | 2.91% |
| | | Gross Expense
Ratio | | Less Expense
Waivers | | Net Expense
Ratio | | Net Ratio ex Dividend & Short Expense |
Resolute Fund I - I Class | | 7.24% | | -4.77% | | 2.47% | | | | 2.36% | | |
Resolute Fund I - A Class | | 7.64% | | -4.77% | | 2.87% | | | | 2.76% | | |
This performance analysis section shows the fund’s historical performance. Past performance is not indicative of future results. Investment return and value of shares will fluctuate. Upon redemption, shares may be worth more or less than their original cost. The current performance may be higher or lower than the quoted performance. Call 1-855-268-2242 or visit www.redmontfunds.com for the most recent month end performance results. The Fund has a redemption fee of 2.00% for shares redeemed within the first 90 days of purchase. Maximum Offering Price (MOP) for Class A includes the Fund’s maximum sales charge of 5.50%. Performance shown at NAV does not include these sales charges and would have been lower had it been taken into account.
Fund I underperformed the HFRX Global Index by approximately 150 basis pointsvi (depending on the share class) over the twelve months ending April 30, 2014. This was due primarily to three months – May & June 2013 and January 2014. Since inception, the Fund has outperformed the HFRX Global Index during strong equity markets and underperformed the Index during market declines. The main factor driving that performance profile is the Fund’s higher level of net equity exposure relative to the HFRX Global Index. As we have discussed in previous letters, the Fund seeks to perform in line with the equity markets over time with less volatility. In order to accomplish this objective, the Fund must maintain a minimum level of net equity exposure or it will not be able to keep up enough in strong markets. Though hedge fund exposure can vary greatly over time, we anticipate outperforming the Index in up markets and underperforming in down markets and to outperform the Index over a full market cycle.
Relative to the S&P 500® Total Return Index, the Fund has performed as we expected-participating but trailing in strong up markets while generally protecting capital (not experiencing as negative a return as the index) and outperforming in negative markets.
When compared to the peer group (Morningstar MultiAlternative Universe), the Fund has outperformed the Universe over all time periods – by over 120 basis points during the past twelve months and approximately 50 basis points annualized since inception. As with the HFRX Global Index, the Universe is very diverse and contains a number of market-neutral and other low net equity strategies that cause the average net equity exposure for the Universe to be considerably less than our Fund. So we anticipate outperforming the Universe in up markets and underperforming in down markets - recent performance has been consistent with our expectations.
| | |
Annual Report | April 30, 2014 | | 1 |
| | |
| Redmont Funds | | Shareholder Letter |
| | April 30, 2014 (Unaudited) |
REDMONT RESOLUTE FUND II
Table 2 notes the performance for Fund II as of quarter end under standard reporting (since inception) as well as of April 30th.
Table 2 i. ii. iii. iv. v.
Performance (amounts greater than one year are annualized)
| | | | | | | | | | | | |
| Redmont Resolute Fund II | | Average Annualized Performance Data
As of March 31, 2014 | | Average Annualized Performance Data
As of April 30, 2014 |
| | | Year-to-Date | | 1-Year | | Since Inception
(12/30/11) | | Year-to-Date | | 1-Year | | Since Funding
(12/30/11) |
Resolute Fund II - I Class | | 0.63% | | 4.54% | | 6.18% | | 0.63% | | 2.85% | | 5.97% |
HFRX Global Index | | 1.11% | | 4.61% | | 5.03% | | 0.38% | | 3.21% | | 4.52% |
S&P 500® Total Return Index | | 1.81% | | 21.77% | | 21.93% | | 2.56% | | 20.35% | | 21.44% |
Morningstar Multi-Alternative
Universe | | 0.03% | | 1.99% | | 3.01% | | 0.06% | | 1.39% | | 2.91% |
| | | Gross Expense
Ratio | | Less Expense
Waivers | | Net Expense
Ratio | | Net Ratio ex Dividend & Short Expense |
Resolute Fund II - I Class | | 2.68% | | -1.39% | | 1.29% | | | | 1.18% | | |
This performance analysis section shows the fund’s historical performance. Past performance is not indicative of future results. Investment return and value of shares will fluctuate. Upon redemption, shares may be worth more or less than their original cost. The current performance may be higher or lower than the quoted performance. Call 1-855-268-2242 or visit www.redmontfunds.com for the most recent month end performance results. The Fund has a redemption fee of 2.00% for shares redeemed within the first 90 days of purchase. Performance shown at NAV does not include these sales charges and would have been lower had it been taken into account.
Fund II underperformed the HFRX Global Index by 36 basis points over the twelve months ending April 30, 2014. Since inception, the Fund has outperformed the HFRX Global Index by over 140 basis points annualized by performing well during strong equity markets underperforming the Index during market declines. The main factor driving that performance profile is the Fund’s higher level of net equity exposure relative to the HFRX Global Index. As we have discussed in previous letters, the Fund seeks to perform in line with the equity markets over time with less volatility. In order to accomplish this objective, the Fund must maintain a minimum level of net equity exposure or it will not be able to keep up enough in strong markets. Though hedge fund exposure can vary greatly over time, we anticipate outperforming the Index in up markets and underperforming in down markets and to outperform the Index over a full market cycle.
Relative to the S&P 500® Total Return Index, the Fund has performed as we expected – participating but trailing in strong up markets while protecting capital and outperforming in negative markets.
When compared to the peer group (Morningstar MultiAlternative Universe), the Fund has outperformed the Universe over all time periods – by over 140 basis points during the past twelve months and 300 basis points annualized since inception. As with the HFRX Global Index, the Universe is very diverse and contains a number of market - neutral and other low net equity strategies that cause the average net equity exposure for the Universe to be considerably less than our Fund. So we anticipate outperforming the Universe in up markets and underperforming in down markets - recent performance has been consistent with our expectations.
Underlying Allocation Weights & Performance:
Each Fund consists of three main asset classes:
| | • | | Tactical Asset Allocation vii. - with two underlying portfolios (both mutual funds); |
| | • | | Long/Short Equity viii. - with four underlying portfolios (two mutual funds and two separate accounts); and |
| | • | | Opportunistic/Other ix. - with four underlying portfolios (two mutual funds and two separate accounts). |
| | |
| Redmont Funds | | Shareholder Letter |
| | April 30, 2014 (Unaudited) |
The current allocation remained roughly unchanged during the fiscal year ending April 30, 2014. Figure 1 lists the long-term target asset allocation for the Funds as well as the allocation for Fund I and Fund II as of April 30th.
Figure 1
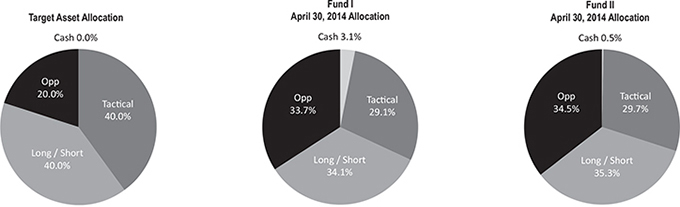
Holdings and allocations subject to change.
All three allocations performed well over the trailing twelve months. The underlying funds’ performance varied as expected with the funds with a higher net exposure outperforming the funds with a lower net exposure. Long/Short and Tactical were the leading contributors while Opportunistic did not perform quite as strongly (which is to be expected given their more defensive nature).
Several manager changes we made during the fiscal year:
| | • | | Tactical – one manager was redeemed in the first quarter of 2014 after they experienced a change to the portfolio management team and a resulting change to their investment process. The proceeds were reinvested into the other existing Tactical managers. |
| | • | | Long/Short – one manager converted from a mutual fund position to a separate account in the second quarter of 2013. Another mutual fund position was replaced by a separate account in the summer of 2013. In December 2013, that replacement manager experienced a significant outflow from and investor and that manager was replaced due to concerns over the long-term viability of the firm. They were replaced by another separate account manager during the first quarter of 2014. |
| | • | | Opportunistic – one manager, which included two separate mutual fund positions, was replaced in the third quarter of 2013 by two separate account managers. The manager was replaced because the risk/return profile of their portfolios was different than we expected and did not represent the profile we wanted for this allocation. |
We do anticipate a few more changes over the coming fiscal year as the funds continue to transition from their start as a fund-of-mutual funds to more of a multi-manager approach with underlying mutual funds and separate accounts.
Closing:
We appreciate your investment in the Redmont Resolute Fund. Please feel free to contact us with any questions.
Sincerely,

R. Scott Graham, CFA & Michael T. Lytle, CFA
Portfolio Managers x.
| | |
Annual Report | April 30, 2014 | | 3 |
| | |
| Redmont Funds | | Shareholder Letter |
| | April 30, 2014 (Unaudited) |
IMPORTANT NOTES AND DISCLOSURES
The Fund’s investment objectives, risks, charges and expenses must be considered before investing. The prospectus contains this and other important information about the investment company, and may be obtained by calling 1-855-268-2242 or by visiting www.redmontfunds.com. Read it carefully before investing.
The views and information discussed in this commentary are as of the date of publication, are subject to change, and may not reflect the writer’s current views. The views expressed represent an assessment of market conditions at a specific point in time, are opinions only and should not be relied upon as investment advice regarding a particular investment or markets in general. Such information does not constitute a recommendation to buy or sell specific securities or investment vehicles. It should not be assumed that any investment will be profitable or will equal the performance of the portfolios or any securities or any sectors mentioned herein. The subject matter contained herein has been derived from several sources believed to be reliable and accurate at the time of compilation. Highland Associates, Inc. does not accept any liability for losses either direct or consequential caused by the use of this information.
RISKS:
The Fund is structured as a Fund-of-Funds. There are certain risks associated with the use of a fund-of-funds structure. These risks include, but are not limited to higher expenses, allocation risk, underlying manager and fund risk, and transparency risk. Investments such as sub-advisers and mutual funds which focus on alternative strategies are subject to increased risk and loss of principal and are not suitable for all investors.
The Fund’s investments may subject the Fund to significantly greater volatility than investments in traditional securities and involve substantial risks, including risk of a significant portion on their principal value. The commodities markets and the prices of various commodities may fluctuate widely based on a variety of factors. Because the Fund’s performance is linked to the performance of highly volatile commodities, investors should consider purchasing shares of the Fund only as part of an overall diversified portfolio and should be willing to assume the risks of potentially significant fluctuations in the value of the Fund. Additional risks of Commodity Futures-Linked Investments include liquidity risk and counterparty credit risk.
Another principal risk of investing in the Fund is equity risk, which is the risk that the value of the securities held by the Fund will fall due to general market and economic conditions, perceptions regarding the industries in which the issuers of securities held by the Fund participate or factors relating to specific companies in which the Fund invest.
The Fund’s investments in non-U.S. issuers may be even more volatile and may present more risks than investments in U.S. issuers. The Fund is new and has a limited operating history. Equity investments in commodity-related companies may not move in the same direction and to the same extent as the underlying commodities.
This Fund is not suitable for all investors. Subject to investment risks, including possible loss of the principal amount invested.
| ii. | The HFRX Global Index is designed to be representative of the overall composition of the hedge fund universe, and includes convertible arbitrage, distressed securities, equity hedge, equity market neutral, event driven, macro, merger arbitrage, and relative value strategies. The index is not actively managed and does not reflect any deductions for fees, expense or taxes. An investor may not invest directly in an index. |
| iii. | The S&P 500 Index is an unmanaged index of 500 common stocks chosen for market size, liquidity, and industry group representation. It is a market-value weighted index. The index is not actively managed and does not reflect any deductions for fees, expense or taxes. An investor may not invest directly in an index. |
| iv. | The Morningstar Multi-Alternative Universe is designed to represent the exposure to alternative investment tactics. Funds in this category have the majority of their assets exposed to alternative strategies. An investor’s exposure to different tactics may change slightly over time in response to market movements. Funds in this category include both funds with static allocations to alternative strategies and funds tactically allocating among alternative strategies and asset classes. The gross short exposure is greater than 20%. |
| v. | Highland Associates, Inc. (the “Adviser”) has agreed, with respect to each share class of the Fund, contractually to waive a portion of its Management Fee and/or reimburse Fund expenses in two ways. First, the Adviser will waive the portion of its 1.50% Management Fee and/or reimburse the Fund (or share class, as applicable) by an amount equal to any amount over the total of (i) 0.50% plus (ii) any sub-advisory fees paid by the Adviser (“Sub-Advisory Fees”). Second, and after the fee waiver and/or expense reimbursement described above has been applied, to the extent the Fund’s total annual expenses (exclusive of Distribution and Service (12b-1) Fees, Swap Fees and Expenses, Shareholder Services Fees, Acquired Fund Fees and Expenses, Sub-Advisory Fees, brokerage expenses, interest expense, taxes and extraordinary expenses) exceed 1.40% of the Fund’s average daily net assets, the Adviser has contractually agreed to also either reduce the fee payable by the amount of such excess, and/or to reimburse the Fund (or share class, as applicable) by the amount of such excess. This agreement is in effect through August 31, 2017. The Adviser will be permitted to recover expenses it has borne through the agreement to limit total annual expenses for each share class to 1.40% of the Fund’s average daily net assets, on a class-by-class basis, to the extent that the Fund’s expenses in later periods fall |
| | |
| Redmont Funds | | Shareholder Letter |
| | April 30, 2014 (Unaudited) |
| | below the annual rates set forth in the relevant agreement. The Fund will not be obligated to pay any such deferred fees and expenses more than three years after the end of the fiscal year in which the fees and expense were deferred. The Adviser may not discontinue this agreement to waive fees and/or reimburse expenses without the approval by the Fund’s Board of Trustees. |
| vi. | Basis Point = 0.01%, 100 basis points would equal 1.0% |
| vii. | The tactical asset allocation strategy is designed to provide investors with fluid exposure to global markets including primarily cash, fixed income, and equities. |
| viii. | The long/short equity strategy is designed to provide investors with hedged equity exposure using both fundamental and quantitative analysis. |
| ix. | The other strategies allocation is designed to provide investors with exposure that has a lower correlation with the other segments of the Fund. The classification consists of but is not limited to trading strategies, managed futures, arbitrage, distressed securities, etc. |
| x. | ALPS Distributors, Inc. is the distributor for the Redmont Funds. R. Scott Graham and Michael T. Lytle are registered representatives of ALPS Distributors, Inc. CFA Institute Marks are trademarks owned by the CFA Institute. |
| | |
Annual Report | April 30, 2014 | | 5 |
| | |
| Redmont Resolute Fund I | | Performance Update |
| | April 30, 2014 |
Performance (for the period ended April 30, 2014)
Redmont Resolute Fund I
| | | | | | | | | | | | |
Cumulative Total Return (for the period ended April 30, 2014) | | | Year-to-Date | | | | 1 Year | | | | Since Inception | * |
Class A (NAV)(a) | | | 0.00% | | | | 0.70% | | | | 3.08% | |
Class I (NAV) | | | 0.09% | | | | 1.36% | | | | 3.48% | |
HFRX Global Hedge Fund Index(b) | | | 0.38% | | | | 3.23% | | | | 4.53% | |
S&P 500® Total Return Index(c) | | | 2.56% | | | | 20.44% | | | | 21.49% | |
Dow Jones U.S. Select Dividend
Index(d) | | | 5.94% | | | | 18.47% | | | | 19.49% | |
| * | Fund inception date of 12/30/11. |
| (a) | Net Asset Value (NAV) is the share price without sales charges. |
| (b) | The HFRX Global Hedge Fund Index is designed to be representative of the overall composition of the hedge fund universe, and includes convertible arbitrage, distressed securities, equity hedge, equity market neutral, event driven, macro, merger arbitrage, and relative value strategies. The index is not actively managed and does not reflect any deduction of fees, expenses or taxes. An investor may not invest directly in an index. |
| (c) | The S&P 500® Total Return Index is the Standard & Poor’s composite index of 500 stocks, a widely recognized, unmanaged index of common stock prices. The index is not actively managed and does not reflect any deduction of fees, expenses or taxes. An investor may not invest directly in an index. |
| (d) | The Dow Jones U.S. Select Dividend Index represents the country’s top stocks by dividend yield, selected annually and subject to screening and buffering criteria. The index is not actively managed and does not reflect any deductions of fees, expenses or taxes. An investor may not invest directly in an index. |
Performance data quoted represents past performance. Past performance does not guarantee future results. Investment return and principal value of an investment will fluctuate so that an investor’s shares, when sold or redeemed, may be worth more or less than the original cost. Current performance data may be higher or lower than actual data quoted. For the most current month-end performance data please call 1-855-268-2242.
The table does not reflect the deduction of taxes that a shareholder would pay on Fund distributions or the redemption of Fund shares.
Performance of $10,000 Initial Investment (for the period ended April 30, 2014)
Comparison of change in value of a $10,000 investment (includes applicable sales loads)
| | | | |
| | | Top Ten Holdings* (for the period ended April 30, 2014) |
| | | As a percentage of Net Assets |
| | | FPA Crescent Fund | | 14.72% |
| | | |
| | | BlackRock Global Allocation Fund, Inc., Class I | | 14.60% |
| | | |
| | | PIMCO Short-Term Fund, Institutional Class | | 10.58% |
| | | |
| | | Diamond Hill Long-Short Fund, Class Y | | 9.78% |
| | | |
| | | MainStay Marketfield Fund, Class I | | 9.30% |
| | | |
| | | AQR Risk Parity Fund, Class I | | 6.55% |
| | | |
| | | AQR Multi Strategy Alternative Fund, Class I | | 6.28% |
| | | |
| | | Exxon Mobil Corp. | | 0.13% |
| | | |
| | | Johnson & Johnson | | 0.10% |
| | | |
| | | EQT Corp. | | 0.08% |
| | | |
| | | Top Ten Holdings | | 72.12% |
| | |
| | | * Holdings are subject to change. Table presents indicative values only. |
| | | |
| | | | | |
| | | |
| | | | | |
| | | |
| | | | | |
| | | |
| | | | | |
| | | |
| | | | | |
| | | |
| | | | | |
| | | |
| | | | | |
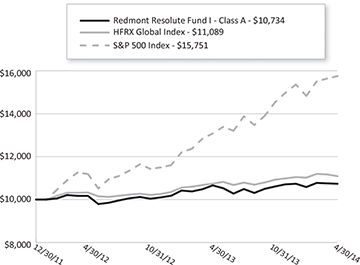
The chart represents historical performance of a hypothetical investment of $10,000 in the Fund since inception. Past performance does not guarantee future results. This chart does not reflect the deduction of taxes that a shareholder would pay on Fund distributions or the redemption of Fund shares.
| | |
| Redmont Resolute Fund II | | Performance Update |
| | April 30, 2014 |
Performance (for the period ended April 30, 2014)
Redmont Resolute Fund II
| | | | | | | | | | | | |
Cumulative Total Return (for the period ended April 30, 2014) | | | Year-to-Date | | | | 1 Year | | | | Since Inception | * |
Class I (NAV) | | | 0.63% | | | | 2.85% | | | | 5.97% | |
HFRX Global Hedge Fund Index(a) | | | 0.38% | | | | 3.23% | | | | 4.53% | |
S&P 500® Total Return Index(b) | | | 2.56% | | | | 20.44% | | | | 21.49% | |
Dow Jones U.S. Select Dividend
Index(c) | | | 5.94% | | | | 18.47% | | | | 19.49% | |
| * | Fund inception date of 12/30/11. |
| (a) | The HFRX Global Hedge Fund Index is designed to be representative of the overall composition of the hedge fund universe and includes convertible arbitrage, distressed securities, equity hedge, equity market neutral, event driven, macro, merger arbitrage and relative value strategies. The index is not actively managed and does not reflect any deduction of fees, expenses or taxes. An investor may not invest directly in an index. |
| (b) | The S&P 500® Total Return Index is the Standard & Poor’s composite index of 500 stocks, a widely recognized, unmanaged index of common stock prices. The index is not actively managed and does not reflect any deduction of fees, expenses or taxes. An investor may not invest directly in an index. |
| (c) | The Dow Jones U.S. Select Dividend Index represents the country’s top stocks by dividend yield, selected annually and subject to screening and buffering criteria. The index is not actively managed and does not reflect any deductions of fees, expenses or taxes. An investor may not invest directly in an index. |
Performance data quoted represents past performance. Past performance does not guarantee future results. Investment return and principal value of an investment will fluctuate so that an investor’s shares, when sold or redeemed, may be worth more or less than the original cost. Current performance data may be higher or lower than actual data quoted. For the most current month-end performance data please call 1-855-268-2242.
The table does not reflect the deduction of taxes that a shareholder would pay on Fund distributions or the redemption of Fund shares.
Performance of $10,000 Initial Investment (for the period ended April 30, 2014)
Comparison of change in value of a $10,000 investment
| | | | |
| | | Top Ten Holdings* (for the period ended April 30, 2014) |
| | | | |
| | | As a percentage of Net Assets |
| | | FPA Crescent Fund | | 15.03% |
| | | |
| | | BlackRock Global Allocation Fund, Inc., Class I | | 14.92% |
| | | |
| | | PIMCO Short-Term Fund, Institutional Class | | 12.34% |
| | | |
| | | Diamond Hill Long-Short Fund, Class Y | | 8.81% |
| | | |
| | | MainStay Marketfield Fund, Class I | | 8.74% |
| | | |
| | | AQR Risk Parity Fund, Class I | | 5.16% |
| | | |
| | | AQR Multi Strategy Alternative Fund, Class I | | 5.06% |
| | | |
| | | Exxon Mobil Corp. | | 0.15% |
| | | |
| | | Johnson & Johnson | | 0.11% |
| | | |
| | | EQT Corp. | | 0.09% |
| | | |
| | | Top Ten Holdings | | 70.41% |
| | |
| | | * Holdings are subject to change. Table presents indicative values only. |
| | | |
| | | | | |
| | | |
| | | | | |
| | | |
| | | | | |
| | | |
| | | | | |
| | | |
| | | | | |
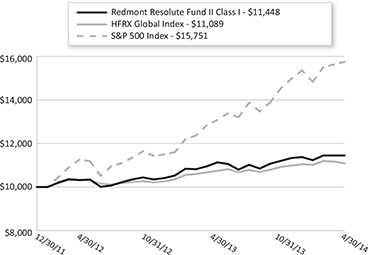
The chart represents historical performance of a hypothetical investment of $10,000 in the Fund since inception. Past performance does not guarantee future results. This chart does not reflect the deduction of taxes that a shareholder would pay on Fund distributions or the redemption of Fund shares.
| | |
Annual Report | April 30, 2014 | | 7 |
| | |
| Redmont Funds | | Disclosure of Fund Expenses |
| | April 30, 2014 (Unaudited) |
As a shareholder of the Funds, you incur two types of costs: (1) transaction costs, including applicable sales charges (loads), redemption fees, wire fees and low balance fees; and (2) ongoing costs, including management fees, distribution and service (12b-1) fees, shareholder services fees and other Fund expenses. This example is intended to help you understand your indirect costs, also referred to as “ongoing costs” (in dollars), of investing in the Fund and to compare these costs with the ongoing costs of investing in other mutual funds.
This example is based on an investment of $1,000 invested at the beginning of the period and held for the six-month period of November 1, 2013 through April 30, 2014.
Actual Expenses The first line of the table below provides information about actual account values and actual expenses. You may use the information in this line, together with the amount you invested at the beginning of the period, to estimate the expenses that you paid over the period. Simply divide your account value by $1,000 (for example, an $8,600 account value divided by $1,000 = 8.6), then multiply the result by the number in the first line under the heading “Expenses Paid During Period” to estimate the expenses you paid on your account during this period.
Hypothetical Example for Comparison Purposes The second line of the table provides information about hypothetical account values and hypothetical expenses based on the Fund’s actual expense ratio and an assumed rate of return of 5% per year before expenses, which is not the Fund’s actual return. The hypothetical account values and expenses may not be used to estimate the actual ending account balance or expenses you paid for the period. You may use this information to compare ongoing costs of investing in the Fund and other funds. To do so, compare this 5% hypothetical example with the 5% hypothetical examples that appear in the shareholder reports of other funds.
Please note that the expenses shown in the table are meant to highlight your ongoing costs only and do not reflect any transactional costs, such as applicable sales charges (loads), redemption fees, wire fees and low balance fees. Therefore, the second line of the table is useful in comparing ongoing costs only and will not help you determine the relative total costs of owning different funds. In addition, if these transaction costs were included, your costs would be higher.
| | | | | | | | |
| | BEGINNING
ACCOUNT VALUE
11/01/13
| | ENDING
ACCOUNT VALUE
04/30/14
| | EXPENSE
RATIO(a)
| | EXPENSES PAID
DURING PERIOD 11/01/13-04/30/14(b)
|
Redmont Resolute Fund I | | | | | | | | |
Class A | | | | | | | | |
Actual | | $ 1,000.00 | | $ 1,011.80 | | 1.98% | | $ 9.88 |
Hypothetical (5% return before expenses) | | $ 1,000.00 | | $ 1,014.98 | | 1.98% | | $ 9.89 |
Class I | | | | | | | | |
Actual | | $ 1,000.00 | | $ 1,013.60 | | 1.60% | | $ 7.99 |
Hypothetical (5% return before expenses) | | $ 1,000.00 | | $ 1,016.86 | | 1.60% | | $ 8.00 |
| | | | |
Redmont Resolute Fund II | | | | | | | | |
Class I | | | | | | | | |
Actual | | $ 1,000.00 | | $ 1,022.00 | | 0.30% | | $ 1.50 |
Hypothetical (5% return before expenses) | | $ 1,000.00 | | $ 1,023.31 | | 0.30% | | $ 1.51 |
| (a) | Annualized, based on the Fund’s most recent fiscal half year expenses. |
| (b) | Expenses are equal to the Fund’s annualized expense ratio multiplied by the average account value over the period, multiplied by the number of days in the most recent fiscal half-year (181)/365 (to reflect the half-year period). |
| | |
| Redmont Resolute Fund I | | Schedule of Investments |
| | April 30, 2014 |
| | | | | | | | |
| Description | | Shares | | | Value (Note 2) | |
COMMON STOCKS (7.63%) | | | | | | | | |
ADVERTISING (0.05%) | | | | | | | | |
Millennial Media, Inc.(a) | | | 53 | | | $ | 338 | |
Omnicom Group, Inc.(b) | | | 26 | | | | 1,760 | |
| | | | | | | | |
| | | | | | | 2,098 | |
| | | | | | | | |
| | |
AEROSPACE & DEFENSE (0.29%) | | | | | | | | |
Cubic Corp. | | | 27 | | | | 1,281 | |
Curtiss-Wright Corp. | | | 7 | | | | 448 | |
Lockheed Martin Corp.(b) | | | 17 | | | | 2,790 | |
Northrop Grumman Corp.(b) | | | 11 | | | | 1,337 | |
Raytheon Co.(b) | | | 17 | | | | 1,623 | |
The Boeing Co. | | | 14 | | | | 1,806 | |
Triumph Group, Inc.(b) | | | 25 | | | | 1,620 | |
United Technologies Corp.(b) | | | 10 | | | | 1,183 | |
| | | | | | | | |
| | | | | | | 12,088 | |
| | | | | | | | |
| | |
AGRICULTURE (0.04%) | | | | | | | | |
Lorillard, Inc.(b) | | | 28 | | | | 1,664 | |
| | | | | | | | |
| | |
AUTO PARTS & EQUIPMENT (0.16%) | | | | | | | | |
Lear Corp.(b) | | | 31 | | | | 2,575 | |
Tenneco, Inc.(a) | | | 37 | | | | 2,215 | |
TRW Automotive Holdings Corp.(a) | | | 27 | | | | 2,169 | |
| | | | | | | | |
| | | | | | | 6,959 | |
| | | | | | | | |
| | |
BANKS (0.75%) | | | | | | | | |
Bank of America Corp.(b) | | | 145 | | | | 2,195 | |
BB&T Corp.(b) | | | 64 | | | | 2,389 | |
Capital One Financial Corp.(b) | | | 39 | | | | 2,882 | |
Citigroup, Inc.(b) | | | 57 | | | | 2,731 | |
Comerica, Inc. | | | 8 | | | | 386 | |
Fifth Third Bancorp(b) | | | 125 | | | | 2,576 | |
Huntington Bancshares, Inc.(b) | | | 197 | | | | 1,805 | |
JPMorgan Chase & Co.(b) | | | 53 | | | | 2,967 | |
Morgan Stanley | | | 16 | | | | 495 | |
Regions Financial Corp.(b) | | | 222 | | | | 2,251 | |
State Street Corp.(b) | | | 37 | | | | 2,389 | |
SunTrust Banks, Inc.(b) | | | 30 | | | | 1,148 | |
The Goldman Sachs Group, Inc.(b) | | | 12 | | | | 1,918 | |
The PNC Financial Services Group, Inc.(b) | | | 23 | | | | 1,933 | |
US Bancorp(b) | | | 18 | | | | 734 | |
Wells Fargo & Co.(b) | | | 60 | | | | 2,978 | |
| | | | | | | | |
| | | | | | | 31,777 | |
| | | | | | | | |
| | |
BEVERAGES (0.04%) | | | | | | | | |
Constellation Brands, Inc., Class A(a)(b) | | | 21 | | | | 1,677 | |
| | | | | | | | |
| | |
BIOTECHNOLOGY (0.07%) | | | | | | | | |
Amgen, Inc. | | | 17 | | | | 1,900 | |
See Notes to Financial Statements.
| | |
Annual Report | April 30, 2014 | | 9 |
| | |
| Redmont Resolute Fund I | | Schedule of Investments |
| | April 30, 2014 |
| | | | | | | | |
| Description | | Shares | | | Value (Note 2) | |
BIOTECHNOLOGY (continued) | | | | | | | | |
Celgene Corp.(a) | | | 7 | | | $ | 1,029 | |
| | | | | | | | |
| | | | | | | 2,929 | |
| | | | | | | | |
| | |
BUILDING MATERIALS (0.05%) | | | | | | | | |
Masco Corp. | | | 96 | | | | 1,929 | |
| | | | | | | | |
| | |
CHEMICALS (0.16%) | | | | | | | | |
Albemarle Corp. | | | 13 | | | | 872 | |
Chemtura Corp.(a) | | | 63 | | | | 1,405 | |
HB Fuller Co. | | | 10 | | | | 463 | |
Huntsman Corp.(b) | | | 96 | | | | 2,405 | |
LyondellBasell Industries NV, Class A(b) | | | 17 | | | | 1,572 | |
Minerals Technologies, Inc. | | | 4 | | | | 238 | |
| | | | | | | | |
| | | | | | | 6,955 | |
| | | | | | | | |
| | |
COAL (0.04%) | | | | | | | | |
Cloud Peak Energy, Inc.(a) | | | 88 | | | | 1,733 | |
| | | | | | | | |
| | |
COMMERCIAL SERVICES (0.34%) | | | | | | | | |
Alliance Data Systems Corp.(a) | | | 2 | | | | 484 | |
Apollo Education Group, Inc.(a) | | | 51 | | | | 1,472 | |
Equifax, Inc. | | | 22 | | | | 1,558 | |
FTI Consulting, Inc.(a)(b) | | | 16 | | | | 549 | |
Global Payments, Inc. | | | 10 | | | | 668 | |
Live Nation Entertainment, Inc.(a) | | | 84 | | | | 1,754 | |
Manpowergroup, Inc.(b) | | | 27 | | | | 2,196 | |
Moody’s Corp.(b) | | | 18 | | | | 1,413 | |
Robert Half International, Inc.(b) | | | 37 | | | | 1,658 | |
Total System Services, Inc. | | | 29 | | | | 921 | |
Towers Watson & Co., Class A | | | 10 | | | | 1,122 | |
Vantiv, Inc., Class A(a) | | | 26 | | | | 799 | |
| | | | | | | | |
| | | | | | | 14,594 | |
| | | | | | | | |
| | |
COMPUTERS (0.32%) | | | | | | | | |
Apple, Inc.(b) | | | 2 | | | | 1,180 | |
Brocade Communications Systems, Inc. | | | 304 | | | | 2,830 | |
EMC Corp.(b) | | | 90 | | | | 2,322 | |
NetApp, Inc.(b) | | | 61 | | | | 2,172 | |
Seagate Technology PLC(b) | | | 45 | | | | 2,366 | |
Western Digital Corp.(b) | | | 33 | | | | 2,909 | |
| | | | | | | | |
| | | | | | | 13,779 | |
| | | | | | | | |
| | |
DISTRIBUTION & WHOLESALE (0.06%) | | | | | | | | |
Arrow Electronics, Inc.(a)(b) | | | 45 | | | | 2,554 | |
| | | | | | | | |
| | |
DIVERSIFIED FINANCIAL SERVICES (0.17%) | | | | | | | | |
Discover Financial Services(b) | | | 41 | | | | 2,292 | |
Raymond James Financial, Inc.(b) | | | 22 | | | | 1,093 | |
SLM Corp. | | | 58 | | | | 1,494 | |
See Notes to Financial Statements.
| | |
| Redmont Resolute Fund I | | Schedule of Investments |
| | April 30, 2014 |
| | | | | | | | |
| Description | | Shares | | | Value (Note 2) | |
DIVERSIFIED FINANCIAL SERVICES (continued) | | | | | | | | |
TD Ameritrade Holding Corp.(b) | | | 38 | | | $ | 1,212 | |
The Charles Schwab Corp.(b) | | | 48 | | | | 1,274 | |
| | | | | | | | |
| | | | | | | 7,365 | |
| | | | | | | | |
| | |
ELECTRICAL COMPONENTS & EQUIPMENT (0.03%) | | | | | | | | |
Hubbell, Inc., Class B(b) | | | 11 | | | | 1,295 | |
| | | | | | | | |
| | |
ELECTRONICS (0.26%) | | | | | | | | |
Agilent Technologies, Inc. | | | 26 | | | | 1,405 | |
Avnet, Inc.(b) | | | 51 | | | | 2,200 | |
Flextronics International Ltd.(a)(b) | | | 269 | | | | 2,418 | |
Honeywell International, Inc.(b) | | | 13 | | | | 1,208 | |
Jabil Circuit, Inc. | | | 119 | | | | 2,054 | |
TE Connectivity Ltd. | | | 14 | | | | 826 | |
Tyco International Ltd.(b) | | | 24 | | | | 981 | |
| | | | | | | | |
| | | | | | | 11,092 | |
| | | | | | | | |
| | |
ENTERTAINMENT (0.03%) | | | | | | | | |
Six Flags Entertainment Corp. | | | 29 | | | | 1,164 | |
| | | | | | | | |
| | |
FOOD (0.10%) | | | | | | | | |
Tyson Foods, Inc., Class A(b) | | | 66 | | | | 2,770 | |
Unilever NV, NY Registered Shares(b) | | | 32 | | | | 1,370 | |
| | | | | | | | |
| | | | | | | 4,140 | |
| | | | | | | | |
| | |
FOREST PRODUCTS & PAPER (0.05%) | | | | | | | | |
International Paper Co.(b) | | | 49 | | | | 2,286 | |
| | | | | | | | |
| | |
HEALTHCARE - PRODUCTS (0.17%) | | | | | | | | |
Boston Scientific Corp.(a) | | | 86 | | | | 1,084 | |
CareFusion Corp.(a)(b) | | | 19 | | | | 742 | |
Covidien PLC(b) | | | 21 | | | | 1,496 | |
Integra LifeSciences Holdings Corp.(a)(b) | | | 13 | | | | 593 | |
Masimo Corp.(a) | | | 25 | | | | 669 | |
Medtronic, Inc. | | | 25 | | | | 1,470 | |
Varian Medical Systems, Inc.(a) | | | 12 | | | | 955 | |
| | | | | | | | |
| | | | | | | 7,009 | |
| | | | | | | | |
| | |
HEALTHCARE - SERVICES (0.27%) | | | | | | | | |
DaVita HealthCare Partners, Inc.(a)(b) | | | 24 | | | | 1,663 | |
ICON PLC(a) | | | 33 | | | | 1,279 | |
Laboratory Corp. of America Holdings (a) | | | 18 | | | | 1,777 | |
Quest Diagnostics, Inc. | | | 29 | | | | 1,622 | |
Select Medical Holdings Corp. | | | 113 | | | | 1,577 | |
UnitedHealth Group, Inc. | | | 16 | | | | 1,201 | |
Universal Health Services, Inc., Class B(b) | | | 26 | | | | 2,127 | |
| | | | | | | | |
| | | | | | | 11,246 | |
| | | | | | | | |
See Notes to Financial Statements.
| | |
Annual Report | April 30, 2014 | | 11 |
| | |
| Redmont Resolute Fund I | | Schedule of Investments |
| | April 30, 2014 |
| | | | | | | | |
| Description | | Shares | | | Value (Note 2) | |
HOUSEWARES (0.04%) | | | | | | | | |
Newell Rubbermaid, Inc.(b) | | | 62 | | | $ | 1,867 | |
| | | | | | | | |
| | |
INSURANCE (0.51%) | | | | | | | | |
ACE Ltd.(b) | | | 20 | | | | 2,047 | |
Alleghany Corp.(a) | | | 4 | | | | 1,632 | |
Axis Capital Holdings Ltd.(b) | | | 29 | | | | 1,327 | |
Berkshire Hathaway, Inc., Class B(a)(b) | | | 17 | | | | 2,191 | |
Endurance Specialty Holdings Ltd. | | | 28 | | | | 1,423 | |
MetLife, Inc.(b) | | | 26 | | | | 1,361 | |
Reinsurance Group of America, Inc.(b) | | | 13 | | | | 997 | |
The Allstate Corp.(b) | | | 37 | | | | 2,107 | |
The Travelers Cos., Inc.(b) | | | 23 | | | | 2,083 | |
Torchmark Corp.(b) | | | 12 | | | | 956 | |
Validus Holdings Ltd.(b) | | | 51 | | | | 1,890 | |
WR Berkley Corp. | | | 42 | | | | 1,858 | |
XL Group PLC | | | 52 | | | | 1,630 | |
| | | | | | | | |
| | | | | | | 21,502 | |
| | | | | | | | |
| | |
INTERNET (0.17%) | | | | | | | | |
Baidu, Inc., ADR(a) | | | 4 | | | | 615 | |
CDW Corp. | | | 51 | | | | 1,438 | |
Conversant, Inc.(a) | | | 26 | | | | 635 | |
eBay, Inc.(a) | | | 16 | | | | 829 | |
Expedia, Inc. | | | 11 | | | | 781 | |
Google, Inc., Class C(a) | | | 1 | | | | 527 | |
Groupon, Inc.(a) | | | 20 | | | | 140 | |
NetEase, Inc., ADR | | | 14 | | | | 953 | |
Perfect World Co. Ltd., ADR | | | 15 | | | | 279 | |
SINA Corp.(a) | | | 7 | | | | 335 | |
Yahoo!, Inc(a) | | | 22 | | | | 791 | |
| | | | | | | | |
| | | | | | | 7,323 | |
| | | | | | | | |
| | |
INTERNET SOFTWARE & SERVICES (0.01%) | | | | | | | | |
Google, Inc., Class A(a) | | | 1 | | | | 535 | |
| | | | | | | | |
| | |
MEDIA (0.38%) | | | | | | | | |
CBS Corp., Class B(b) | | | 23 | | | | 1,328 | |
Comcast Corp., Class A(b) | | | 45 | | | | 2,329 | |
Liberty Global PLC, Class A(a) | | | 9 | | | | 358 | |
Liberty Global PLC, Class C(a) | | | 77 | | | | 2,959 | |
Liberty Media Corp., Class A(a)(b) | | | 11 | | | | 1,427 | |
News Corp., Class A(a) | | | 98 | | | | 1,668 | |
Phoenix New Media Ltd., ADR(a) | | | 60 | | | | 555 | |
The Walt Disney Co.(b) | | | 18 | | | | 1,428 | |
Time Warner Cable, Inc.(b) | | | 9 | | | | 1,273 | |
Time Warner, Inc.(b) | | | 21 | | | | 1,396 | |
Viacom, Inc., Class B(b) | | | 17 | | | | 1,445 | |
| | | | | | | | |
| | | | | | | 16,166 | |
| | | | | | | | |
See Notes to Financial Statements.
| | |
| Redmont Resolute Fund I | | Schedule of Investments |
| | April 30, 2014 |
| | | | | | | | |
| Description | | Shares | | | Value (Note 2) | |
METAL FABRICATE & HARDWARE (0.04%) | | | | | | | | |
Global Brass & Copper Holdings, Inc. | | | 84 | | | $ | 1,332 | |
The Timken Co. | | | 6 | | | | 379 | |
| | | | | | | | |
| | | | | | | 1,711 | |
| | | | | | | | |
| | |
MINING (0.01%) | | | | | | | | |
Yamana Gold, Inc. | | | 72 | | | | 538 | |
| | | | | | | | |
| | |
MISCELLANEOUS MANUFACTURING (0.17%) | | | | | | | | |
Actuant Corp., Class A | | | 10 | | | | 339 | |
Carlisle Cos., Inc.(b) | | | 19 | | | | 1,563 | |
Crane Co. | | | 25 | | | | 1,818 | |
Danaher Corp. | | | 18 | | | | 1,321 | |
Dover Corp. | | | 4 | | | | 346 | |
Parker Hannifin Corp.(b) | | | 4 | | | | 507 | |
Textron, Inc. | | | 37 | | | | 1,513 | |
| | | | | | | | |
| | | | | | | 7,407 | |
| | | | | | | | |
| | |
OIL & GAS (0.89%) | | | | | | | | |
Canadian Natural Resources Ltd.(b) | | | 36 | | | | 1,468 | |
Diamondback Energy, Inc.(a) | | | 30 | | | | 2,158 | |
Energen Corp. | | | 30 | | | | 2,337 | |
EOG Resources, Inc.(b) | | | 23 | | | | 2,254 | |
EQT Corp. | | | 32 | | | | 3,488 | |
Exxon Mobil Corp.(b) | | | 56 | | | | 5,735 | |
Gulfport Energy Corp.(a) | | | 20 | | | | 1,473 | |
Kosmos Energy Ltd.(a) | | | 94 | | | | 1,027 | |
Marathon Petroleum Corp. | | | 23 | | | | 2,138 | |
Occidental Petroleum Corp.(b) | | | 35 | | | | 3,351 | |
Pacific Drilling SA(a) | | | 84 | | | | 832 | |
Phillips 66(b) | | | 31 | | | | 2,580 | |
QEP Resources, Inc. | | | 80 | | | | 2,455 | |
Rice Energy, Inc.(a) | | | 84 | | | | 2,495 | |
Rosetta Resources, Inc.(a) | | | 6 | | | | 284 | |
Valero Energy Corp. | | | 26 | | | | 1,486 | |
Western Refining, Inc. | | | 53 | | | | 2,306 | |
| | | | | | | | |
| | | | | | | 37,867 | |
| | | | | | | | |
| | |
OIL & GAS SERVICES (0.08%) | | | | | | | | |
Halliburton Co.(b) | | | 18 | | | | 1,135 | |
Schlumberger Ltd.(b) | | | 21 | | | | 2,133 | |
| | | | | | | | |
| | | | | | | 3,268 | |
| | | | | | | | |
| | |
PACKAGING & CONTAINERS (0.23%) | | | | | | | | |
Berry Plastics Group, Inc.(a)(b) | | | 108 | | | | 2,429 | |
Crown Holdings, Inc.(a)(b) | | | 47 | | | | 2,217 | |
Graphic Packaging Holding Co.(a)(b) | | | 339 | | | | 3,478 | |
Owens-Illinois, Inc.(a) | | | 55 | | | | 1,748 | |
| | | | | | | | |
| | | | | | | 9,872 | |
| | | | | | | | |
| | |
PHARMACEUTICALS (0.64%) | | | | | | | | |
AbbVie, Inc.(b) | | | 57 | | | | 2,968 | |
See Notes to Financial Statements.
| | |
Annual Report | April 30, 2014 | | 13 |
| | |
| Redmont Resolute Fund I | | Schedule of Investments |
| | April 30, 2014 |
| | | | | | | | |
| Description | | Shares | | | Value (Note 2) | |
PHARMACEUTICALS (continued) | | | | | | | | |
Bayer AG, ADR | | | 8 | | | $ | 1,114 | |
Cardinal Health, Inc.(b) | | | 27 | | | | 1,877 | |
Endo International PLC(a) | | | 11 | | | | 692 | |
Express Scripts Holding Co.(a)(b) | | | 27 | | | | 1,798 | |
Johnson & Johnson | | | 40 | | | | 4,052 | |
McKesson Corp. | | | 11 | | | | 1,861 | |
Novartis AG, ADR | | | 29 | | | | 2,521 | |
Omnicare, Inc.(b) | | | 31 | | | | 1,837 | |
Pfizer, Inc.(b) | | | 109 | | | | 3,409 | |
Sanofi, ADR(b) | | | 37 | | | | 1,991 | |
Teva Pharmaceutical Industries Ltd., ADR | | | 65 | | | | 3,176 | |
| | | | | | | | |
| | | | | | | 27,296 | |
| | | | | | | | |
| | |
REAL ESTATE INVESTMENT TRUSTS (0.12%) | | | | | | | | |
American Capital Agency Corp. | | | 50 | | | | 1,135 | |
American Homes 4 Rent, Class A | | | 44 | | | | 706 | |
American Residential Properties, Inc.(a) | | | 35 | | | | 629 | |
Annaly Capital Management, Inc. | | | 72 | | | | 832 | |
Boston Properties, Inc. | | | 5 | | | | 586 | |
Equity Residential(b) | | | 9 | | | | 535 | |
Post Properties, Inc. | | | 16 | | | | 803 | |
| | | | | | | | |
| | | | | | | 5,226 | |
| | | | | | | | |
| | |
RETAIL (0.23%) | | | | | | | | |
CVS Caremark Corp.(b) | | | 31 | | | | 2,254 | |
Foot Locker, Inc. | | | 39 | | | | 1,815 | |
Macy’s, Inc.(b) | | | 31 | | | | 1,780 | |
Rite Aid Corp.(a) | | | 312 | | | | 2,278 | |
The Home Depot, Inc. | | | 19 | | | | 1,511 | |
| | | | | | | | |
| | | | | | | 9,638 | |
| | | | | | | | |
| | |
SAVINGS & LOANS (0.02%) | | | | | | | | |
First Niagara Financial Group, Inc.(b) | | | 72 | | | | 642 | |
| | | | | | | | |
| | |
SEMICONDUCTORS (0.25%) | | | | | | | | |
Analog Devices, Inc. | | | 8 | | | | 410 | |
Avago Technologies Ltd. | | | 46 | | | | 2,921 | |
LSI Corp. | | | 110 | | | | 1,226 | |
ON Semiconductor Corp.(a)(b) | | | 212 | | | | 1,995 | |
QUALCOMM, Inc.(b) | | | 17 | | | | 1,338 | |
Texas Instruments, Inc.(b) | | | 42 | | | | 1,909 | |
TriQuint Semiconductor, Inc.(a) | | | 63 | | | | 893 | |
| | | | | | | | |
| | | | | | | 10,692 | |
| | | | | | | | |
| | |
SHIPBUILDING (0.04%) | | | | | | | | |
Huntington Ingalls Industries, Inc.(b) | | | 18 | | | | 1,854 | |
| | | | | | | | |
| | |
SOFTWARE (0.16%) | | | | | | | | |
Activision Blizzard, Inc.(b) | | | 37 | | | | 740 | |
CA, Inc. | | | 34 | | | | 1,025 | |
See Notes to Financial Statements.
| | |
| Redmont Resolute Fund I | | Schedule of Investments |
| | April 30, 2014 |
| | | | | | | | | | |
| Description | | | | Shares | | | Value (Note 2) | |
SOFTWARE (continued) | | | | | | | | | | |
Fidelity National Information Services, Inc. | | | | | 17 | | | $ | 908 | |
Microsoft Corp.(b) | | | | | 66 | | | | 2,667 | |
Oracle Corp. | | | | | 35 | | | | 1,431 | |
| | | | | | | | | | |
| | | | | | | | | 6,771 | |
| | | | | | | | | | |
| | | |
TELECOMMUNICATIONS (0.16%) | | | | | | | | | | |
Amdocs Ltd.(b) | | | | | 29 | | | | 1,349 | |
Cisco Systems, Inc.(b) | | | | | 56 | | | | 1,294 | |
Harris Corp. | | | | | 17 | | | | 1,250 | |
Motorola Solutions, Inc. | | | | | 29 | | | | 1,844 | |
Vodafone Group PLC, ADR | | | | | 9 | | | | 342 | |
Windstream Holdings, Inc. | | | | | 72 | | | | 653 | |
| | | | | | | | | | |
| | | | | | | | | 6,732 | |
| | | | | | | | | | |
| | | |
TRANSPORTATION (0.03%) | | | | | | | | | | |
Norfolk Southern Corp.(b) | | | | | 15 | | | | 1,418 | |
| | | | | | | | | | |
| | | |
TOTAL COMMON STOCKS | | | | | | | | | | |
(Cost $282,295) | | | | | | | | | 324,658 | |
| | | |
LIMITED PARTNERSHIPS (0.03%) | | | | | | | | | | |
CHEMICALS (0.03%) | | | | | | | | | | |
CVR Partners LP | | | | | 64 | | | | 1,366 | |
| | | | | | | | | | |
| | | |
TOTAL LIMITED PARTNERSHIPS | | | | | | | | | | |
(Cost $1,331) | | | | | | | | | 1,366 | |
| | | |
OPEN-END MUTUAL FUNDS (71.81%) | | | | | | | | | | |
AQR Multi Strategy Alternative Fund, Class I | | | | | 27,647 | | | | 267,066 | |
AQR Risk Parity Fund, Class I | | | | | 24,641 | | | | 278,448 | |
BlackRock Global Allocation Fund, Inc., Class I | | | | | 28,740 | | | | 621,069 | |
Diamond Hill Long-Short Fund, Class Y | | | | | 18,039 | | | | 415,978 | |
FPA Crescent Fund | | | | | 18,648 | | | | 625,997 | |
MainStay Marketfield Fund, Class I | | | | | 22,207 | | | | 395,502 | |
PIMCO Short-Term Fund, Institutional Class | | | | | 45,555 | | | | 450,085 | |
| | | | | | | | | | |
| | | | | | | | | 3,054,145 | |
| | | | | | | | | | |
| | | |
TOTAL OPEN-END MUTUAL FUNDS | | | | | | | | | | |
(Cost $2,871,283) | | | | | | | | | 3,054,145 | |
| | | |
| | | 7-Day Yield | | Shares | | | Value (Note 2) | |
SHORT TERM INVESTMENTS (12.69%) | | | | | | | | | | |
Dreyfus Treasury Cash Management Fund, Institutional Class | | 0.010% | | | 539,641 | | | | 539,641 | |
| | | | | | | | | | |
| | | |
TOTAL SHORT TERM INVESTMENTS (Cost $539,641) | | | | | | | | | 539,641 | |
See Notes to Financial Statements.
| | |
Annual Report | April 30, 2014 | | 15 |
| | |
| Redmont Resolute Fund I | | Schedule of Investments |
| | April 30, 2014 |
| | | | | | | | |
| Description | | | | | Value (Note 2) | |
TOTAL INVESTMENTS (92.16%) (Cost $3,694,550) | | | | | | $ | 3,919,810 | |
| | |
SEGREGATED CASH WITH BROKERS (11.60%)(c) | | | | | | | 493,450 | |
| | |
SECURITIES SOLD SHORT (-3.78%) | | | | | | | | |
(Proceeds $153,183) | | | | | | | (160,943) | |
| | |
OTHER ASSETS IN EXCESS OF LIABILITIES (0.02%) | | | | | | | 1,022 | |
NET ASSETS (100.00%) | | | | | | $ | 4,253,339 | |
| | | | | | | | | |
| | |
SCHEDULE OF SECURITIES SOLD SHORT | | | | | | | | |
| | | Shares | | | Value (Note 2) | |
COMMON STOCKS (-3.73%) | | | | | | | | |
APPAREL (-0.05%) | | | | | | | | |
Deckers Outdoor Corp. | | | (13) | | | $ | (1,026) | |
Under Armour, Inc., Class A | | | (18) | | | | (880) | |
| | | | | | | | |
| | | | | | | (1,906) | |
| | | | | | | | |
AUTO PARTS & EQUIPMENT (-0.03%) | | | | | | | | |
Autoliv, Inc. | | | (6) | | | | (612) | |
Dorman Products, Inc. | | | (12) | | | | (691) | |
| | | | | | | | |
| | | | | | | (1,303) | |
| | | | | | | | |
BANKS (-0.33%) | | | | | | | | |
Bank of Hawaii Corp. | | | (16) | | | | (883) | |
Community Bank System, Inc. | | | (38) | | | | (1,413) | |
CVB Financial Corp. | | | (70) | | | | (1,012) | |
First Financial Bankshares, Inc. | | | (22) | | | | (1,299) | |
HDFC Bank Ltd., ADR | | | (28) | | | | (1,121) | |
Northern Trust Corp. | | | (18) | | | | (1,085) | |
TCF Financial Corp. | | | (58) | | | | (911) | |
Trustmark Corp. | | | (53) | | | | (1,212) | |
UMB Financial Corp. | | | (17) | | | | (998) | |
United Bankshares, Inc. | | | (47) | | | | (1,375) | |
Valley National Bancorp | | | (130) | | | | (1,303) | |
Westamerica Bancorporation | | | (31) | | | | (1,575) | |
| | | | | | | | |
| | | | | | | (14,187) | |
| | | | | | | | |
| | |
BEVERAGES (-0.02%) | | | | | | | | |
Keurig Green Mountain, Inc. | | | (11) | | | | (1,030) | |
| | | | | | | | |
| | |
BIOTECHNOLOGY (-0.03%) | | | | | | | | |
Seattle Genetics, Inc. | | | (30) | | | | (1,154) | |
| | | | | | | | |
| | |
BUILDING MATERIALS (-0.05%) | | | | | | | | |
Simpson Manufacturing Co., Inc. | | | (7) | | | | (229) | |
Trex Co., Inc. | | | (13) | | | | (1,021) | |
Vulcan Materials Co. | | | (15) | | | | (968) | |
| | | | | | | | |
| | | | | | | (2,218) | |
| | | | | | | | |
| | |
CHEMICALS (-0.11%) | | | | | | | | |
Air Products & Chemicals, Inc. | | | (10) | | | | (1,175) | |
EI du Pont de Nemours & Co. | | | (9) | | | | (606) | |
See Notes to Financial Statements.
| | |
| Redmont Resolute Fund I | | Schedule of Investments |
| | April 30, 2014 |
| | | | | | | | |
| | | Shares | | | Value (Note 2) | |
CHEMICALS (-0.11%) (continued) | | | | | | | | |
FMC Corp. | | | (6) | | | $ | (462) | |
Intrepid Potash, Inc. | | | (56) | | | | (913) | |
NewMarket Corp. | | | (2) | | | | (745) | |
Zep, Inc. | | | (45) | | | | (778) | |
| | | | | | | | |
| | | | | | | (4,679) | |
| | | | | | | | |
| | |
COMMERCIAL SERVICES (-0.10%) | | | | | | | | |
Iron Mountain, Inc. | | | (46) | | | | (1,308) | |
Monro Muffler Brake, Inc. | | | (30) | | | | (1,692) | |
Ritchie Bros. Auctioneers, Inc. | | | (53) | | | | (1,325) | |
| | | | | | | | |
| | | | | | | (4,325) | |
| | | | | | | | |
| | |
COMPUTERS (-0.13%) | | | | | | | | |
3D Systems Corp. | | | (26) | | | | (1,231) | |
IHS, Inc., Class A | | | (11) | | | | (1,327) | |
Infosys Ltd., ADR | | | (29) | | | | (1,557) | |
Wipro Ltd., ADR | | | (134) | | | | (1,603) | |
| | | | | | | | |
| | | | | | | (5,718) | |
| | | | | | | | |
| | |
DISTRIBUTION & WHOLESALE (-0.02%) | | | | | | | | |
Fastenal Co. | | | (12) | | | | (601) | |
WW Grainger, Inc. | | | (1) | | | | (254) | |
| | | | | | | | |
| | | | | | | (855) | |
| | | | | | | | |
| | |
DIVERSIFIED FINANCIAL SERVICES (-0.07%) | | | | | | | | |
Eaton Vance Corp. | | | (29) | | | | (1,046) | |
Financial Engines, Inc. | | | (3) | | | | (133) | |
Greenhill & Co., Inc. | | | (22) | | | | (1,103) | |
WisdomTree Investments, Inc. | | | (47) | | | | (531) | |
| | | | | | | | |
| | | | | | | (2,813) | |
| | | | | | | | |
| | |
ELECTRIC (-0.09%) | | | | | | | | |
NextEra Energy, Inc. | | | (7) | | | | (699) | |
Ormat Technologies, Inc. | | | (14) | | | | (373) | |
Pepco Holdings, Inc. | | | (51) | | | | (1,365) | |
TECO Energy, Inc. | | | (77) | | | | (1,383) | |
| | | | | | | | |
| | | | | | | (3,820) | |
| | | | | | | | |
| | |
ELECTRONICS (-0.08%) | | | | | | | | |
Itron, Inc. | | | (45) | | | | (1,710) | |
National Instruments Corp. | | | (62) | | | | (1,693) | |
| | | | | | | | |
| | | | | | | (3,403) | |
| | | | | | | | |
| | |
FOOD (-0.24%) | | | | | | | | |
Annie’s, Inc. | | | (15) | | | | (488) | |
Campbell Soup Co. | | | (28) | | | | (1,274) | |
Flowers Foods, Inc. | | | (61) | | | | (1,252) | |
The Hillshire Brands Co. | | | (39) | | | | (1,390) | |
McCormick & Co., Inc. | | | (19) | | | | (1,353) | |
Mondelez International, Inc., Class A | | | (38) | | | | (1,355) | |
Snyder’s-Lance, Inc. | | | (37) | | | | (983) | |
United Natural Foods, Inc. | | | (11) | | | | (759) | |
Whole Foods Market, Inc. | | | (28) | | | | (1,391) | |
| | | | | | | | |
| | | | | | | (10,245) | |
| | | | | | | | |
| | |
FOREST PRODUCTS & PAPER (-0.04%) | | | | | | | | |
Resolute Forest Products, Inc. | | | (48) | | | | (857) | |
Wausau Paper Corp. | | | (69) | | | | (825) | |
| | | | | | | | |
| | | | | | | (1,682) | |
| | | | | | | | |
See Notes to Financial Statements.
| | |
Annual Report | April 30, 2014 | | 17 |
| | |
| Redmont Resolute Fund I | | Schedule of Investments |
| | April 30, 2014 |
| | | | | | | | |
| | | Shares | | | Value (Note 2) | |
GAS (-0.04%) | | | | | | | | |
NiSource, Inc. | | | (41) | | | $ | (1,489) | |
| | | | | | | | |
| | |
HAND & MACHINE TOOLS (-0.02%) | | | | | | | | |
Kennametal, Inc. | | | (9) | | | | (421) | |
Regal-Beloit Corp. | | | (6) | | | | (448) | |
| | | | | | | | |
| | | | | | | (869) | |
| | | | | | | | |
| | |
HEALTHCARE - PRODUCTS (-0.04%) | | | | | | | | |
ResMed, Inc. | | | (33) | | | | (1,645) | |
| | | | | | | | |
| | |
HEALTHCARE - SERVICES (-0.03%) | | | | | | | | |
Health Net, Inc. | | | (38) | | | | (1,305) | |
| | | | | | | | |
| | |
HOME BUILDERS (-0.02%) | | | | | | | | |
MDC Holdings, Inc. | | | (23) | | | | (635) | |
| | | | | | | | |
| | |
HOUSEHOLD PRODUCTS & WARES (-0.06%) | | | | | | | | |
The Clorox Co. | | | (14) | | | | (1,270) | |
The Scotts Miracle-Gro Co., Class A | | | (19) | | | | (1,163) | |
| | | | | | | | |
| | | | | | | (2,433) | |
| | | | | | | | |
| | |
HOUSEWARES (-0.01%) | | | | | | | | |
The Toro Co. | | | (6) | | | | (381) | |
| | | | | | | | |
| | |
INTERNET (-0.23%) | | | | | | | | |
58.com, Inc., ADR | | | (6) | | | | (239) | |
Bankrate, Inc. | | | (20) | | | | (350) | |
Cogent Communications Group, Inc. | | | (28) | | | | (965) | |
E-Commerce China Dangdang, Inc., ADR, Class A | | | (43) | | | | (464) | |
Equinix, Inc. | | | (8) | | | | (1,502) | |
Internap Network Services Corp. | | | (90) | | | | (605) | |
Netflix, Inc. | | | (3) | | | | (966) | |
Rackspace Hosting, Inc. | | | (13) | | | | (377) | |
Shutterfly, Inc. | | | (9) | | | | (368) | |
Shutterstock, Inc. | | | (3) | | | | (218) | |
Twitter, Inc. | | | (12) | | | | (468) | |
Yandex NV, Class A | | | (19) | | | | (504) | |
Yelp, Inc. | | | (7) | | | | (408) | |
Zillow, Inc., Class A | | | (16) | | | | (1,739) | |
Zynga, Inc., Class A | | | (120) | | | | (486) | |
| | | | | | | | |
| | | | | | | (9,659) | |
| | | | | | | | |
| | |
MACHINERY - DIVERSIFIED (-0.06%) | | | | | | | | |
Briggs & Stratton Corp. | | | (19) | | | | (406) | |
Deere & Co. | | | (4) | | | | (373) | |
The Manitowoc Co., Inc. | | | (13) | | | | (413) | |
Nordson Corp. | | | (6) | | | | (446) | |
Roper Industries, Inc. | | | (8) | | | | (1,112) | |
| | | | | | | | |
| | | | | | | (2,750) | |
| | | | | | | | |
| | |
METAL FABRICATE & HARDWARE (-0.01%) | | | | | | | | |
Sun Hydraulics Corp. | | | (9) | | | | (368) | |
| | | | | | | | |
| | |
MINING (-0.02%) | | | | | | | | |
Teck Resources Ltd., Class B | | | (40) | | | | (911) | |
| | | | | | | | |
See Notes to Financial Statements.
| | |
| Redmont Resolute Fund I | | Schedule of Investments |
| | April 30, 2014 |
| | | | | | | | |
| | | Shares | | | Value (Note 2) | |
MISCELLANEOUS MANUFACTURING (-0.13%) | | | | | | | | |
AptarGroup, Inc. | | | (17) | | | $ | (1,146) | |
AZZ, Inc. | | | (29) | | | | (1,259) | |
Proto Labs, Inc. | | | (28) | | | | (1,695) | |
Raven Industries, Inc. | | | (21) | | | | (649) | |
Trinity Industries, Inc. | | | (11) | | | | (826) | |
| | | | | | | | |
| | | | | | | (5,575) | |
| | | | | | | | |
| | |
OIL & GAS (-0.40%) | | | | | | | | |
Approach Resources, Inc. | | | (13) | | | | (270) | |
Atwood Oceanics, Inc. | | | (21) | | | | (1,041) | |
Bill Barrett Corp. | | | (38) | | | | (900) | |
Cabot Oil & Gas Corp. | | | (25) | | | | (982) | |
Carrizo Oil & Gas, Inc. | | | (26) | | | | (1,431) | |
Chesapeake Energy Corp. | | | (42) | | | | (1,207) | |
ConocoPhillips | | | (21) | | | | (1,560) | |
Continental Resources, Inc. | | | (15) | | | | (2,078) | |
Energy XXI Bermuda Ltd. | | | (44) | | | | (1,053) | |
Goodrich Petroleum Corp. | | | (36) | | | | (905) | |
HollyFrontier Corp. | | | (28) | | | | (1,473) | |
Matador Resources Co. | | | (59) | | | | (1,694) | |
Oasis Petroleum, Inc. | | | (18) | | | | (837) | |
Ultra Petroleum Corp. | | | (51) | | | | (1,520) | |
| | | | | | | | |
| | | | | | | (16,951) | |
| | | | | | | | |
| | |
OIL & GAS SERVICES (-0.05%) | | | | | | | | |
RPC, Inc. | | | (36) | | | | (800) | |
Weatherford International Ltd. | | | (71) | | | | (1,491) | |
| | | | | | | | |
| | | | | | | (2,291) | |
| | | | | | | | |
| | |
REAL ESTATE INVESTMENT TRUSTS (-0.24%) | | | | | | | | |
HCP, Inc. | | | (44) | | | | (1,842) | |
Health Care REIT, Inc. | | | (28) | | | | (1,766) | |
Omega Healthcare Investors, Inc. | | | (49) | | | | (1,704) | |
Plum Creek Timber Co., Inc. | | | (38) | | | | (1,657) | |
Realty Income Corp. | | | (39) | | | | (1,695) | |
Rouse Properties, Inc. | | | (82) | | | | (1,377) | |
| | | | | | | | |
| | | | | | | (10,041) | |
| | | | | | | | |
| | |
RETAIL (-0.31%) | | | | | | | | |
AutoNation, Inc. | | | (13) | | | | (689) | |
Bob Evans Farms, Inc. | | | (28) | | | | (1,312) | |
Buffalo Wild Wings, Inc. | | | (10) | | | | (1,461) | |
Cabela’s, Inc. | | | (21) | | | | (1,378) | |
The Cheesecake Factory, Inc. | | | (29) | | | | (1,302) | |
Guess?, Inc. | | | (45) | | | | (1,211) | |
Krispy Kreme Doughnuts, Inc. | | | (70) | | | | (1,228) | |
L Brands, Inc. | | | (27) | | | | (1,463) | |
Lululemon Athletica, Inc. | | | (20) | | | | (919) | |
Panera Bread Co., Class A | | | (7) | | | | (1,071) | |
Sally Beauty Holdings, Inc. | | | (42) | | | | (1,151) | |
| | | | | | | | |
| | | | | | | (13,185) | |
| | | | | | | | |
| | |
SAVINGS & LOANS (-0.02%) | | | | | | | | |
Astoria Financial Corp. | | | (69) | | | | (915) | |
| | | | | | | | |
| | |
SEMICONDUCTORS (-0.09%) | | | | | | | | |
Cirrus Logic, Inc. | | | (24) | | | | (535) | |
See Notes to Financial Statements.
| | |
Annual Report | April 30, 2014 | | 19 |
| | |
| Redmont Resolute Fund I | | Schedule of Investments |
| | April 30, 2014 |
| | | | | | | | |
| | | Shares | | | Value (Note 2) | |
SEMICONDUCTORS (-0.09%) (continued) | | | | | | | | |
Hittite Microwave Corp. | | | (30) | | | $ | (1,781) | |
International Rectifier Corp. | | | (58) | | | | (1,510) | |
| | | | | | | | |
| | | | | | | (3,826) | |
| | | | | | | | |
| | |
SOFTWARE (-0.31%) | | | | | | | | |
Acxiom Corp. | | | (13) | | | | (367) | |
Aspen Technology, Inc. | | | (21) | | | | (903) | |
athenahealth, Inc. | | | (6) | | | | (742) | |
Blackbaud, Inc. | | | (62) | | | | (1,888) | |
Concur Technologies, Inc. | | | (11) | | | | (885) | |
Glu Mobile, Inc. | | | (117) | | | | (468) | |
NetSuite, Inc. | | | (16) | | | | (1,237) | |
Red Hat, Inc. | | | (24) | | | | (1,168) | |
Rocket Fuel, Inc. | | | (5) | | | | (160) | |
Salesforce.com, Inc. | | | (35) | | | | (1,808) | |
Sungy Mobile Ltd., ADR | | | (5) | | | | (82) | |
Synchronoss Technologies, Inc. | | | (35) | | | | (1,065) | |
Tyler Technologies, Inc. | | | (13) | | | | (1,061) | |
The Ultimate Software Group, Inc. | | | (8) | | | | (957) | |
VMware, Inc., Class A | | | (4) | | | | (370) | |
| | | | | | | | |
| | | | | | | (13,161) | |
| | | | | | | | |
| | |
TELECOMMUNICATIONS (-0.19%) | | | | | | | | |
America Movil SAB de CV, ADR | | | (54) | | | | (1,084) | |
Ciena Corp. | | | (40) | | | | (791) | |
Finisar Corp. | | | (41) | | | | (1,072) | |
Infinera Corp. | | | (114) | | | | (1,022) | |
Level 3 Communications, Inc. | | | (20) | | | | (861) | |
Sprint Corp. | | | (132) | | | | (1,122) | |
Telefonica SA, ADR | | | (71) | | | | (1,189) | |
ViaSat, Inc. | | | (15) | | | | (963) | |
| | | | | | | | |
| | | | | | | (8,104) | |
| | | | | | | | |
| | |
TOYS, GAMES & HOBBIES (0.00%)(d) | | | | | | | | |
LeapFrog Enterprises, Inc. | | | (21) | | | | (144) | |
| | | | | | | | |
| | |
TRANSPORTATION (-0.06%) | | | | | | | | |
Hub Group, Inc., Class A | | | (18) | | | | (804) | |
JB Hunt Transport Services, Inc. | | | (15) | | | | (1,141) | |
Kansas City Southern | | | (8) | | | | (807) | |
| | | | | | | | |
| | | | | | | (2,752) | |
| | | | | | | | |
| | |
TOTAL COMMON STOCKS (Proceeds $151,008) | | | | | | | (158,728) | |
| | |
EXCHANGE TRADED FUNDS (-0.05%) | | | | | | | | |
United States Oil Fund LP | | | (61) | | | | (2,215) | |
| | | | | | | | |
| | |
TOTAL EXCHANGE TRADED FUNDS (-0.05%) (Proceeds $2,175) | | | | | | | (2,215) | |
| | |
TOTAL SECURITIES SOLD SHORT (Proceeds $153,183) | | | | | | $ | (160,943) | |
| | | | | | | | | |
See Notes to Financial Statements.
| | |
| Redmont Resolute Fund I | | Schedule of Investments |
| | April 30, 2014 |
| (a) | Non-income producing security. |
| (b) | Security position either entirely or partially held in a segregated account as collateral for securities sold short. Aggregate total market value of $132,255. |
| (c) | Includes cash which is being held as collateral for securities sold short and total return swap contracts. |
Common Abbreviations:
ADR – American Depositary Receipt.
AG – Aktiengesellschaft is a German term that refers to a corporation that is limited by shares, i.e., owned by shareholders.
AQR – AQR Capital Management LLC.
FPA – First Pacific Advisors LLC.
LP – Limited Partnership.
Ltd. – Limited.
NV – Naamloze Vennootschap is the Dutch term for a public limited liability corporation.
PIMCO – Pacific Investment Management Company.
PLC – Public Limited Company.
SA – Generally designates corporations in various countries, mostly those employing the civil law.
SAB de CV – A variable capital company.
TOTAL RETURN SWAP CONTRACTS*
| | | | | | | | | | | | | | | | | | |
| Counterparty | | Reference Obligation | | Notional Amount | | | Rate Paid by the Fund | | | Termination Date | | | Unrealized Appreciation | |
Morgan Stanley | | Loeb King Multi Segregated
Portfolio | | $ | 449,218 | | | | 1-Month LIBOR BBA | | | | 09/02/2014 | | | $ | 411 | |
Morgan Stanley | | Melchior Segregated Portfolio | | | 280,380 | | | | 1-Month LIBOR BBA | | | | 03/20/2019 | | | | 524 | |
Morgan Stanley | | Trilogy Segregated Portfolio | | | 449,278 | | | | 1-Month LIBOR BBA | | | | 09/02/2014 | | | | 300 | |
| | | | | | | | | | | | | | | | | | |
| | | | $ | 1,178,876 | | | | | | | | | | | $ | 1,235 | |
| | | | | | | | | | | | | | | | | | |
| * | The Fund receives payments based on any positive return of the Reference Obligation less the rate paid by the Fund. The Fund makes payments on any negative return of such Reference Obligation plus the rate paid by the Fund. |
See Notes to Financial Statements.
| | |
Annual Report | April 30, 2014 | | 21 |
| | |
| Redmont Resolute Fund II | | Schedule of Investments |
| | April 30, 2014 |
| | | | | | | | |
| Description | | Shares | | | Value (Note 2) | |
COMMON STOCKS (8.73%) | | | | | | | | |
ADVERTISING (0.06%) | | | | | | | | |
Millennial Media, Inc.(a) | | | 8,561 | | | $ | 54,705 | |
Omnicom Group, Inc.(b) | | | 4,201 | | | | 284,323 | |
| | | | | | | | |
| | | | | | | 339,028 | |
| | | | | | | | |
| | |
AEROSPACE & DEFENSE (0.33%) | | | | | | | | |
Cubic Corp. | | | 4,350 | | | | 206,320 | |
Curtiss-Wright Corp. | | | 1,131 | | | | 72,316 | |
Lockheed Martin Corp.(b) | | | 2,777 | | | | 455,817 | |
Northrop Grumman Corp.(b) | | | 1,775 | | | | 215,680 | |
Raytheon Co.(b) | | | 2,758 | | | | 263,334 | |
The Boeing Co. | | | 2,299 | | | | 296,617 | |
Triumph Group, Inc.(b) | | | 4,107 | | | | 266,175 | |
United Technologies Corp.(b) | | | 1,697 | | | | 200,806 | |
| | | | | | | | |
| | | | | | | 1,977,065 | |
| | | | | | | | |
| | |
AGRICULTURE (0.04%) | | | | | | | | |
Lorillard, Inc.(b) | | | 4,494 | | | | 267,033 | |
| | | | | | | | |
| | |
AUTO PARTS & EQUIPMENT (0.19%) | | | | | | | | |
Lear Corp.(b) | | | 4,969 | | | | 412,725 | |
Tenneco, Inc.(a) | | | 6,063 | | | | 362,992 | |
TRW Automotive Holdings Corp.(a) | | | 4,405 | | | | 353,942 | |
| | | | | | | | |
| | | | | | | 1,129,659 | |
| | | | | | | | |
| | |
BANKS (0.86%) | | | | | | | | |
Bank of America Corp.(b) | | | 23,570 | | | | 356,850 | |
BB&T Corp.(b) | | | 10,452 | | | | 390,173 | |
Capital One Financial Corp.(b) | | | 6,419 | | | | 474,364 | |
Citigroup, Inc.(b) | | | 9,342 | | | | 447,575 | |
Comerica, Inc. | | | 1,303 | | | | 62,857 | |
Fifth Third Bancorp(b) | | | 20,285 | | | | 418,074 | |
Huntington Bancshares, Inc.(b) | | | 32,111 | | | | 294,137 | |
JPMorgan Chase & Co.(b) | | | 8,685 | | | | 486,186 | |
Morgan Stanley | | | 2,683 | | | | 82,985 | |
Regions Financial Corp.(b) | | | 36,138 | | | | 366,439 | |
State Street Corp.(b) | | | 6,088 | | | | 393,041 | |
SunTrust Banks, Inc.(b) | | | 4,950 | | | | 189,387 | |
The Goldman Sachs Group, Inc.(b) | | | 2,004 | | | | 320,279 | |
The PNC Financial Services Group, Inc.(b) | | | 3,742 | | | | 314,478 | |
US Bancorp(b) | | | 2,988 | | | | 121,851 | |
Wells Fargo & Co.(b) | | | 9,790 | | | | 485,976 | |
| | | | | | | | |
| | | | | | | 5,204,652 | |
| | | | | | | | |
| | |
BEVERAGES (0.05%) | | | | | | | | |
Constellation Brands, Inc., Class A(a)(b) | | | 3,483 | | | | 278,083 | |
| | | | | | | | |
| | |
BIOTECHNOLOGY (0.08%) | | | | | | | | |
Amgen, Inc. | | | 2,810 | | | | 314,017 | |
See Notes to Financial Statements.
| | |
| Redmont Resolute Fund II | | Schedule of Investments |
| | April 30, 2014 |
| | | | | | | | |
| Description | | Shares | | | Value (Note 2) | |
BIOTECHNOLOGY (continued) | | | | | | | | |
Celgene Corp.(a) | | | 1,076 | | | $ | 158,183 | |
| | | | | | | | |
| | | | | | | 472,200 | |
| | | | | | | | |
| | |
BUILDING MATERIALS (0.05%) | | | | | | | | |
Masco Corp. | | | 15,605 | | | | 313,504 | |
| | | | | | | | |
| | |
CHEMICALS (0.19%) | | | | | | | | |
Albemarle Corp. | | | 2,084 | | | | 139,711 | |
Chemtura Corp.(a) | | | 10,312 | | | | 229,957 | |
HB Fuller Co. | | | 1,627 | | | | 75,379 | |
Huntsman Corp.(b) | | | 15,555 | | | | 389,653 | |
LyondellBasell Industries NV, Class A(b) | | | 2,706 | | | | 250,305 | |
Minerals Technologies, Inc. | | | 659 | | | | 39,204 | |
| | | | | | | | |
| | | | | | | 1,124,209 | |
| | | | | | | | |
| | |
COAL (0.05%) | | | | | | | | |
Cloud Peak Energy, Inc.(a) | | | 14,388 | | | | 283,300 | |
| | | | | | | | |
| | |
COMMERCIAL SERVICES (0.39%) | | | | | | | | |
Alliance Data Systems Corp.(a) | | | 325 | | | | 78,617 | |
Apollo Education Group, Inc.(a) | | | 8,313 | | | | 239,913 | |
Equifax, Inc.(b) | | | 3,571 | | | | 252,862 | |
FTI Consulting, Inc.(a)(b) | | | 2,666 | | | | 91,444 | |
Global Payments, Inc. | | | 1,612 | | | | 107,730 | |
Live Nation Entertainment, Inc.(a) | | | 13,735 | | | | 286,787 | |
Manpowergroup, Inc.(b) | | | 4,378 | | | | 356,107 | |
Moody’s Corp.(b) | | | 2,954 | | | | 231,889 | |
Robert Half International, Inc.(b) | | | 5,958 | | | | 266,918 | |
Total System Services, Inc. | | | 4,756 | | | | 151,098 | |
Towers Watson & Co., Class A | | | 1,580 | | | | 177,308 | |
Vantiv, Inc., Class A(a) | | | 4,188 | | | | 128,781 | |
| | | | | | | | |
| | | | | | | 2,369,454 | |
| | | | | | | | |
| | |
COMPUTERS (0.37%) | | | | | | | | |
Apple, Inc. | | | 330 | | | | 194,730 | |
Brocade Communications Systems, Inc.(b) | | | 49,458 | | | | 460,454 | |
EMC Corp.(b) | | | 14,693 | | | | 379,079 | |
NetApp, Inc.(b) | | | 9,916 | | | | 353,109 | |
Seagate Technology PLC | | | 7,288 | | | | 383,203 | |
Western Digital Corp.(b) | | | 5,317 | | | | 468,587 | |
| | | | | | | | |
| | | | | | | 2,239,162 | |
| | | | | | | | |
| | |
DISTRIBUTION & WHOLESALE (0.07%) | | | | | | | | |
Arrow Electronics, Inc.(a)(b) | | | 7,376 | | | | 418,588 | |
| | | | | | | | |
| | |
DIVERSIFIED FINANCIAL SERVICES (0.20%) | | | | | | | | |
Discover Financial Services(b) | | | 6,723 | | | | 375,816 | |
Raymond James Financial, Inc.(b) | | | 3,650 | | | | 181,405 | |
SLM Corp. | | | 9,422 | | | | 242,617 | |
See Notes to Financial Statements.
| | |
Annual Report | April 30, 2014 | | 23 |
| | |
| Redmont Resolute Fund II | | Schedule of Investments |
| | April 30, 2014 |
| | | | | | | | |
| Description | | Shares | | | Value (Note 2) | |
DIVERSIFIED FINANCIAL SERVICES (continued) | | | | | | | | |
TD Ameritrade Holding Corp.(b) | | | 6,115 | | | $ | 195,068 | |
The Charles Schwab Corp.(b) | | | 7,746 | | | | 205,656 | |
| | | | | | | | |
| | | | | | | 1,200,562 | |
| | | | | | | | |
| | |
ELECTRICAL COMPONENTS & EQUIPMENT (0.03%) | | | | | | | | |
Hubbell, Inc., Class B(b) | | | 1,797 | | | | 211,543 | |
| | | | | | | | |
| | |
ELECTRONICS (0.30%) | | | | | | | | |
Agilent Technologies, Inc. | | | 4,264 | | | | 230,426 | |
Avnet, Inc.(b) | | | 8,216 | | | | 354,356 | |
Flextronics International Ltd.(a)(b) | | | 43,734 | | | | 393,169 | |
Honeywell International, Inc.(b) | | | 2,129 | | | | 197,784 | |
Jabil Circuit, Inc. | | | 19,383 | | | | 334,551 | |
TE Connectivity Ltd. | | | 2,336 | | | | 137,777 | |
Tyco International Ltd.(b) | | | 3,860 | | | | 157,874 | |
| | | | | | | | |
| | | | | | | 1,805,937 | |
| | | | | | | | |
| | |
ENTERTAINMENT (0.03%) | | | | | | | | |
Six Flags Entertainment Corp. | | | 4,719 | | | | 189,421 | |
| | | | | | | | |
| | |
FOOD (0.11%) | | | | | | | | |
Tyson Foods, Inc., Class A(b) | | | 10,803 | | | | 453,402 | |
Unilever NV, NY Registered Shares(b) | | | 5,177 | | | | 221,679 | |
| | | | | | | | |
| | | | | | | 675,081 | |
| | | | | | | | |
| | |
FOREST PRODUCTS & PAPER (0.06%) | | | | | | | | |
International Paper Co.(b) | | | 7,978 | | | | 372,174 | |
| | | | | | | | |
| | |
HEALTHCARE - PRODUCTS (0.19%) | | | | | | | | |
Boston Scientific Corp.(a) | | | 13,957 | | | | 175,998 | |
CareFusion Corp.(a)(b) | | | 3,052 | | | | 119,211 | |
Covidien PLC(b) | | | 3,440 | | | | 245,100 | |
Integra LifeSciences Holdings Corp.(a) | | | 2,165 | | | | 98,681 | |
Masimo Corp.(a) | | | 4,064 | | | | 108,753 | |
Medtronic, Inc. | | | 4,143 | | | | 243,691 | |
Varian Medical Systems, Inc.(a) | | | 1,955 | | | | 155,520 | |
| | | | | | | | |
| | | | | | | 1,146,954 | |
| | | | | | | | |
| | |
HEALTHCARE - SERVICES (0.30%) | | | | | | | | |
DaVita HealthCare Partners, Inc.(a)(b) | | | 3,862 | | | | 267,637 | |
ICON PLC(a) | | | 5,417 | | | | 210,017 | |
Laboratory Corp. of America Holdings(a) | | | 2,938 | | | | 289,981 | |
Quest Diagnostics, Inc. | | | 4,666 | | | | 260,969 | |
Select Medical Holdings Corp. | | | 18,328 | | | | 255,859 | |
UnitedHealth Group, Inc.(b) | | | 2,665 | | | | 199,982 | |
Universal Health Services, Inc., Class B(b) | | | 4,188 | | | | 342,536 | |
| | | | | | | | |
| | | | | | | 1,826,981 | |
| | | | | | | | |
See Notes to Financial Statements.
| | |
| Redmont Resolute Fund II | | Schedule of Investments |
| | April 30, 2014 |
| | | | | | | | |
| Description | | Shares | | | Value (Note 2) | |
HOUSEWARES (0.05%) | | | | | | | | |
Newell Rubbermaid, Inc.(b) | | | 10,038 | | | $ | 302,244 | |
| | | | | | | | |
| | |
INSURANCE (0.58%) | | | | | | | | |
ACE Ltd.(b) | | | 3,268 | | | | 334,382 | |
Alleghany Corp.(a) | | | 665 | | | | 271,307 | |
Axis Capital Holdings Ltd.(b) | | | 4,652 | | | | 212,829 | |
Berkshire Hathaway, Inc., Class B(a)(b) | | | 2,800 | | | | 360,780 | |
Endurance Specialty Holdings Ltd. | | | 4,588 | | | | 233,162 | |
MetLife, Inc.(b) | | | 4,204 | | | | 220,079 | |
Reinsurance Group of America, Inc.(b) | | | 2,089 | | | | 160,247 | |
The Allstate Corp.(b) | | | 6,014 | | | | 342,497 | |
The Travelers Cos., Inc.(b) | | | 3,812 | | | | 345,291 | |
Torchmark Corp.(b) | | | 2,003 | | | | 159,639 | |
Validus Holdings Ltd.(b) | | | 8,251 | | | | 305,865 | |
WR Berkley Corp. | | | 6,800 | | | | 300,832 | |
XL Group PLC | | | 8,487 | | | | 266,068 | |
| | | | | | | | |
| | | | | | | 3,512,978 | |
| | | | | | | | |
| | |
INTERNET (0.19%) | | | | | | | | |
Baidu, Inc., ADR(a) | | | 636 | | | | 97,849 | |
CDW Corp. | | | 8,285 | | | | 233,554 | |
Conversant, Inc.(a) | | | 4,158 | | | | 101,622 | |
eBay, Inc.(a) | | | 2,628 | | | | 136,209 | |
Expedia, Inc.(b) | | | 1,822 | | | | 129,344 | |
Google, Inc., Class C(a) | | | 120 | | | | 63,199 | |
Groupon, Inc.(a) | | | 3,307 | | | | 23,116 | |
NetEase, Inc., ADR(b) | | | 2,200 | | | | 149,798 | |
Perfect World Co. Ltd., ADR | | | 2,464 | | | | 45,830 | |
SINA Corp.(a)(b) | | | 1,131 | | | | 54,062 | |
Yahoo!, Inc(a) | | | 3,594 | | | | 129,204 | |
| | | | | | | | |
| | | | | | | 1,163,787 | |
| | | | | | | | |
| | |
INTERNET SOFTWARE & SERVICES (0.01%) | | | | | | | | |
Google, Inc., Class A(a) | | | 120 | | | | 64,186 | |
| | | | | | | | |
| | |
MEDIA (0.43%) | | | | | | | | |
CBS Corp., Class B(b) | | | 3,811 | | | | 220,123 | |
Comcast Corp., Class A(b) | | | 7,351 | | | | 380,488 | |
Liberty Global PLC, Class A(a) | | | 1,398 | | | | 55,668 | |
Liberty Global PLC, Class C(a) | | | 12,579 | | | | 483,411 | |
Liberty Media Corp., Class A(a)(b) | | | 1,757 | | | | 227,901 | |
News Corp., Class A(a) | | | 15,878 | | | | 270,244 | |
Phoenix New Media Ltd., ADR(a) | | | 9,741 | | | | 90,104 | |
The Walt Disney Co.(b) | | | 2,881 | | | | 228,579 | |
Time Warner Cable, Inc.(b) | | | 1,383 | | | | 195,639 | |
Time Warner, Inc.(b) | | | 3,479 | | | | 231,214 | |
Viacom, Inc., Class B(b) | | | 2,696 | | | | 229,106 | |
| | | | | | | | |
| | | | | | | 2,612,477 | |
| | | | | | | | |
See Notes to Financial Statements.
| | |
Annual Report | April 30, 2014 | | 25 |
| | |
| Redmont Resolute Fund II | | Schedule of Investments |
| | April 30, 2014 |
| | | | | | | | |
| Description | | Shares | | | Value (Note 2) | |
METAL FABRICATE & HARDWARE (0.05%) | | | | | | | | |
Global Brass & Copper Holdings, Inc. | | | 13,628 | | | $ | 216,140 | |
The Timken Co. | | | 940 | | | | 59,295 | |
| | | | | | | | |
| | | | | | | 275,435 | |
| | | | | | | | |
| | |
MINING (0.01%) | | | | | | | | |
Yamana Gold, Inc. | | | 11,661 | | | | 87,224 | |
| | | | | | | | |
| | |
MISCELLANEOUS MANUFACTURING (0.20%) | | | | | | | | |
Actuant Corp., Class A | | | 1,695 | | | | 57,393 | |
Carlisle Cos., Inc.(b) | | | 3,139 | | | | 258,183 | |
Crane Co. | | | 4,108 | | | | 298,775 | |
Danaher Corp. | | | 2,894 | | | | 212,362 | |
Dover Corp.(b) | | | 686 | | | | 59,270 | |
Parker Hannifin Corp.(b) | | | 708 | | | | 89,831 | |
Textron, Inc.(b) | | | 6,094 | | | | 249,244 | |
| | | | | | | | |
| | | | | | | 1,225,058 | |
| | | | | | | | |
| | |
OIL & GAS (1.02%) | | | | | | | | |
Canadian Natural Resources Ltd.(b) | | | 5,923 | | | | 241,481 | |
Diamondback Energy, Inc.(a)(b) | | | 4,915 | | | | 353,585 | |
Energen Corp.(b) | | | 4,800 | | | | 373,968 | |
EOG Resources, Inc. | | | 3,705 | | | | 363,090 | |
EQT Corp. | | | 5,253 | | | | 572,524 | |
Exxon Mobil Corp.(b) | | | 9,039 | | | | 925,684 | |
Gulfport Energy Corp.(a) | | | 3,206 | | | | 236,186 | |
Kosmos Energy Ltd.(a) | | | 15,332 | | | | 167,425 | |
Marathon Petroleum Corp. | | | 3,799 | | | | 353,117 | |
Occidental Petroleum Corp.(b) | | | 5,747 | | | | 550,275 | |
Pacific Drilling SA(a) | | | 13,669 | | | | 135,460 | |
Phillips 66 | | | 4,980 | | | | 414,436 | |
QEP Resources, Inc. | | | 12,937 | | | | 397,037 | |
Rice Energy, Inc.(a)(b) | | | 13,611 | | | | 404,247 | |
Rosetta Resources, Inc.(a) | | | 1,016 | | | | 48,097 | |
Valero Energy Corp. | | | 4,153 | | | | 237,427 | |
Western Refining, Inc. | | | 8,609 | | | | 374,492 | |
| | | | | | | | |
| | | | | | | 6,148,531 | |
| | | | | | | | |
| | |
OIL & GAS SERVICES (0.09%) | | | | | | | | |
Halliburton Co.(b) | | | 2,937 | | | | 185,237 | |
Schlumberger Ltd.(b) | | | 3,439 | | | | 349,230 | |
| | | | | | | | |
| | | | | | | 534,467 | |
| | | | | | | | |
| | |
PACKAGING & CONTAINERS (0.26%) | | | | | | | | |
Berry Plastics Group, Inc.(a)(b) | | | 17,530 | | | | 394,250 | |
Crown Holdings, Inc.(a)(b) | | | 7,671 | | | | 361,841 | |
Graphic Packaging Holding Co.(a)(b) | | | 55,119 | | | | 565,521 | |
Owens-Illinois, Inc.(a) | | | 8,873 | | | | 281,984 | |
| | | | | | | | |
| | | | | | | 1,603,596 | |
| | | | | | | | |
| | |
PHARMACEUTICALS (0.73%) | | | | | | | | |
AbbVie, Inc.(b) | | | 9,203 | | | | 479,292 | |
See Notes to Financial Statements.
| | |
| Redmont Resolute Fund II | | Schedule of Investments |
| | April 30, 2014 |
| | | | | | | | |
| Description | | Shares | | | Value (Note 2) | |
PHARMACEUTICALS (continued) | | | | | | | | |
Bayer AG, ADR | | | 1,330 | | | $ | 185,162 | |
Cardinal Health, Inc.(b) | | | 4,396 | | | | 305,566 | |
Endo International PLC(a)(b) | | | 1,770 | | | | 111,413 | |
Express Scripts Holding Co.(a)(b) | | | 4,466 | | | | 297,346 | |
Johnson & Johnson(b) | | | 6,465 | | | | 654,840 | |
McKesson Corp. | | | 1,753 | | | | 296,590 | |
Novartis AG, ADR | | | 4,722 | | | | 410,531 | |
Omnicare, Inc.(b) | | | 5,106 | | | | 302,633 | |
Pfizer, Inc.(b) | | | 17,674 | | | | 552,843 | |
Sanofi, ADR(b) | | | 5,948 | | | | 320,002 | |
Teva Pharmaceutical Industries Ltd., ADR | | | 10,573 | | | | 516,597 | |
| | | | | | | | |
| | | | | | | 4,432,815 | |
| | | | | | | | |
| | |
REAL ESTATE INVESTMENT TRUSTS (0.14%) | | | | | | | | |
American Capital Agency Corp. | | | 8,055 | | | | 182,929 | |
American Homes 4 Rent, Class A | | | 7,212 | | | | 115,753 | |
American Residential Properties, Inc.(a) | | | 5,697 | | | | 102,375 | |
Annaly Capital Management, Inc. | | | 11,727 | | | | 135,447 | |
Boston Properties, Inc.(b) | | | 866 | | | | 101,443 | |
Equity Residential(b) | | | 1,542 | | | | 91,656 | |
Post Properties, Inc. | | | 2,584 | | | | 129,743 | |
| | | | | | | | |
| | | | | | | 859,346 | |
| | | | | | | | |
| | |
RETAIL (0.26%) | | | | | | | | |
CVS Caremark Corp.(b) | | | 5,031 | | | | 365,854 | |
Foot Locker, Inc.(b) | | | 6,365 | | | | 296,164 | |
Macy’s, Inc.(b) | | | 5,042 | | | | 289,562 | |
Rite Aid Corp.(a) | | | 50,806 | | | | 370,884 | |
The Home Depot, Inc. | | | 3,094 | | | | 246,004 | |
| | | | | | | | |
| | | | | | | 1,568,468 | |
| | | | | | | | |
| | |
SAVINGS & LOANS (0.02%) | | | | | | | | |
First Niagara Financial Group, Inc. | | | 11,718 | | | | 104,525 | |
| | | | | | | | |
| | |
SEMICONDUCTORS (0.29%) | | | | | | | | |
Analog Devices, Inc. | | | 1,341 | | | | 68,780 | |
Avago Technologies Ltd. | | | 7,559 | | | | 479,996 | |
LSI Corp. | | | 17,884 | | | | 199,228 | |
ON Semiconductor Corp.(a)(b) | | | 34,555 | | | | 325,163 | |
QUALCOMM, Inc.(b) | | | 2,786 | | | | 219,286 | |
Texas Instruments, Inc.(b) | | | 6,885 | | | | 312,923 | |
TriQuint Semiconductor, Inc.(a) | | | 10,239 | | | | 145,189 | |
| | | | | | | | |
| | | | | | | 1,750,565 | |
| | | | | | | | |
| | |
SHIPBUILDING (0.05%) | | | | | | | | |
Huntington Ingalls Industries, Inc.(b) | | | 2,962 | | | | 305,086 | |
| | | | | | | | |
| | |
SOFTWARE (0.18%) | | | | | | | | |
Activision Blizzard, Inc.(b) | | | 5,985 | | | | 119,760 | |
CA, Inc. | | | 5,487 | | | | 165,378 | |
See Notes to Financial Statements.
| | |
Annual Report | April 30, 2014 | | 27 |
| | |
| Redmont Resolute Fund II | | Schedule of Investments |
| | April 30, 2014 |
| | | | | | | | | | |
| Description | | | | Shares | | | Value (Note 2) | |
SOFTWARE (continued) | | | | | | | | | | |
Fidelity National Information Services, Inc. | | | | | 2,796 | | | $ | 149,390 | |
Microsoft Corp.(b) | | | | | 10,728 | | | | 433,411 | |
Oracle Corp. | | | | | 5,717 | | | | 233,711 | |
| | | | | | | | | | |
| | | | | | | | | 1,101,650 | |
| | | | | | | | | | |
| | | |
TELECOMMUNICATIONS (0.18%) | | | | | | | | | | |
Amdocs Ltd.(b) | | | | | 4,757 | | | | 221,343 | |
Cisco Systems, Inc.(b) | | | | | 9,122 | | | | 210,809 | |
Harris Corp.(b) | | | | | 2,791 | | | | 205,194 | |
Motorola Solutions, Inc. | | | | | 4,672 | | | | 297,046 | |
Vodafone Group PLC, ADR | | | | | 1,482 | | | | 56,257 | |
Windstream Holdings, Inc. | | | | | 11,653 | | | | 105,693 | |
| | | | | | | | | | |
| | | | | | | | | 1,096,342 | |
| | | | | | | | | | |
| | | |
TRANSPORTATION (0.04%) | | | | | | | | | | |
Norfolk Southern Corp.(b) | | | | | 2,483 | | | | 234,718 | |
| | | | | | | | | | |
| | | |
TOTAL COMMON STOCKS (Cost $46,017,145) | | | | | | | | | 52,828,088 | |
| | | |
LIMITED PARTNERSHIPS (0.04%) | | | | | | | | | | |
| | | |
CHEMICALS (0.04%) | | | | | | | | | | |
CVR Partners LP | | | | | 10,448 | | | | 222,960 | |
| | | | | | | | | | |
| | | |
TOTAL LIMITED PARTNERSHIPS (Cost $217,307) | | | | | | | | | 222,960 | |
| | | |
OPEN-END MUTUAL FUNDS (70.07%) | | | | | | | | | | |
AQR Multi Strategy Alternative Fund, Class I | | | | | 3,170,320 | | | | 30,625,294 | |
AQR Risk Parity Fund, Class I | | | | | 2,760,844 | | | | 31,197,535 | |
BlackRock Global Allocation Fund, Inc., Class I | | | | | 4,177,257 | | | | 90,270,534 | |
Diamond Hill Long-Short Fund, Class Y | | | | | 2,311,029 | | | | 53,292,326 | |
FPA Crescent Fund | | | | | 2,709,418 | | | | 90,955,175 | |
MainStay Marketfield Fund, Class I | | | | | 2,968,767 | | | | 52,873,749 | |
PIMCO Short-Term Fund, Institutional Class | | | | | 7,554,872 | | | | 74,642,133 | |
| | | | | | | | | | |
| | | | | | | | | 423,856,746 | |
| | | | | | | | | | |
| | | |
TOTAL OPEN-END MUTUAL FUNDS (Cost $395,371,378) | | | | | | | | | 423,856,746 | |
| | | |
| | | 7-Day Yield | | Shares | | | Value (Note 2) | |
SHORT TERM INVESTMENTS (11.70%) | | | | | | | | | | |
Dreyfus Treasury Cash Management Fund, Institutional Class | | 0.010% | | | 70,788,529 | | | | 70,788,529 | |
| | | | | | | | | | |
| | | |
TOTAL SHORT TERM INVESTMENTS (Cost $70,788,529) | | | | | | | | | 70,788,529 | |
See Notes to Financial Statements.
| | |
| Redmont Resolute Fund II | | Schedule of Investments |
| | April 30, 2014 |
| | | | | | | | |
| Description | | | | | Value (Note 2) | |
TOTAL INVESTMENTS (90.54%) (Cost $512,394,359) | | | | | | $ | 547,696,323 | |
| | |
SEGREGATED CASH WITH BROKERS (13.75%)(c) | | | | | | | 83,153,315 | |
| | |
SECURITIES SOLD SHORT (-4.32%) (Proceeds $24,950,448) | | | | | | | (26,157,444) | |
| | |
OTHER ASSETS IN EXCESS OF LIABILITIES (0.03%) | | | | | | | 257,131 | |
NET ASSETS (100.00%) | | | | | | $ | 604,949,325 | |
| | | | | | | | | |
| | |
SCHEDULE OF SECURITIES SOLD SHORT | | | | | | | | |
| | |
| | | Shares | | | Value (Note 2) | |
COMMON STOCKS (-4.26%) | | | | | | | | |
APPAREL (-0.05%) | | | | | | | | |
Deckers Outdoor Corp. | | | (2,132) | | | $ | (168,321) | |
Under Armour, Inc., Class A | | | (2,957) | | | | (144,568) | |
| | | | | | | | |
| | | | | | | (312,889) | |
| | | | | | | | |
| | |
AUTO PARTS & EQUIPMENT (-0.04%) | | | | | | | | |
Autoliv, Inc. | | | (1,007) | | | | (102,694) | |
Dorman Products, Inc. | | | (1,936) | | | | (111,417) | |
| | | | | | | | |
| | | | | | | (214,111) | |
| | | | | | | | |
| | |
BANKS (-0.38%) | | | | | | | | |
Bank of Hawaii Corp. | | | (2,620) | | | | (144,545) | |
Community Bank System, Inc. | | | (6,216) | | | | (231,173) | |
CVB Financial Corp. | | | (11,425) | | | | (165,206) | |
First Financial Bankshares, Inc. | | | (3,628) | | | | (214,233) | |
HDFC Bank Ltd., ADR | | | (4,527) | | | | (181,306) | |
Northern Trust Corp. | | | (2,928) | | | | (176,412) | |
TCF Financial Corp. | | | (9,422) | | | | (147,925) | |
Trustmark Corp. | | | (8,670) | | | | (198,283) | |
UMB Financial Corp. | | | (2,791) | | | | (163,860) | |
United Bankshares, Inc. | | | (7,659) | | | | (224,026) | |
Valley National Bancorp | | | (21,095) | | | | (211,372) | |
Westamerica Bancorporation | | | (5,121) | | | | (260,249) | |
| | | | | | | | |
| | | | | | | (2,318,590) | |
| | | | | | | | |
| | |
BEVERAGES (-0.03%) | | | | | | | | |
Keurig Green Mountain, Inc. | | | (1,823) | | | | (170,779) | |
| | | | | | | | |
| | |
BIOTECHNOLOGY (-0.03%) | | | | | | | | |
Seattle Genetics, Inc. | | | (4,879) | | | | (187,744) | |
| | | | | | | | |
| | |
BUILDING MATERIALS (-0.06%) | | | | | | | | |
Simpson Manufacturing Co., Inc. | | | (1,042) | | | | (34,167) | |
Trex Co., Inc. | | | (2,120) | | | | (166,462) | |
Vulcan Materials Co. | | | (2,513) | | | | (162,164) | |
| | | | | | | | |
| | | | | | | (362,793) | |
| | | | | | | | |
| | |
CHEMICALS (-0.12%) | | | | | | | | |
Air Products & Chemicals, Inc. | | | (1,600) | | | | (188,032) | |
EI du Pont de Nemours & Co. | | | (1,446) | | | | (97,345) | |
See Notes to Financial Statements.
| | |
Annual Report | April 30, 2014 | | 29 |
| | |
| Redmont Resolute Fund II | | Schedule of Investments |
| | April 30, 2014 |
| | | | | | | | |
| | | Shares | | | Value (Note 2) | |
CHEMICALS (-0.12%) (continued) | | | | | | | | |
FMC Corp. | | | (911) | | | $ | (70,147) | |
Intrepid Potash, Inc. | | | (9,043) | | | | (147,401) | |
NewMarket Corp. | | | (332) | | | | (123,610) | |
Zep, Inc. | | | (7,364) | | | | (127,323) | |
| | | | | | | | |
| | | | | | | (753,858) | |
| | | | | | | | |
| | |
COMMERCIAL SERVICES (-0.12%) | | | | | | | | |
Iron Mountain, Inc. | | | (7,470) | | | | (212,447) | |
Monro Muffler Brake, Inc. | | | (4,856) | | | | (273,878) | |
Ritchie Bros. Auctioneers, Inc. | | | (8,544) | | | | (213,600) | |
| | | | | | | | |
| | | | | | | (699,925) | |
| | | | | | | | |
| | |
COMPUTERS (-0.15%) | | | | | | | | |
3D Systems Corp. | | | (4,200) | | | | (198,828) | |
IHS, Inc., Class A | | | (1,793) | | | | (216,290) | |
Infosys Ltd., ADR | | | (4,772) | | | | (256,304) | |
Wipro Ltd., ADR | | | (21,718) | | | | (259,747) | |
| | | | | | | | |
| | | | | | | (931,169) | |
| | | | | | | | |
| | |
DISTRIBUTION & WHOLESALE (-0.02%) | | | | | | | | |
Fastenal Co. | | | (1,955) | | | | (97,907) | |
WW Grainger, Inc. | | | (128) | | | | (32,563) | |
| | | | | | | | |
| | | | | | | (130,470) | |
| | | | | | | | |
| | |
DIVERSIFIED FINANCIAL SERVICES (-0.08%) | | | | | | | | |
Eaton Vance Corp. | | | (4,677) | | | | (168,699) | |
Financial Engines, Inc. | | | (531) | | | | (23,497) | |
Greenhill & Co., Inc. | | | (3,556) | | | | (178,333) | |
WisdomTree Investments, Inc. | | | (7,743) | | | | (87,419) | |
| | | | | | | | |
| | | | | | | (457,948) | |
| | | | | | | | |
| | |
ELECTRIC (-0.10%) | | | | | | | | |
NextEra Energy, Inc. | | | (1,185) | | | | (118,322) | |
Ormat Technologies, Inc. | | | (2,295) | | | | (61,231) | |
Pepco Holdings, Inc. | | | (8,292) | | | | (221,894) | |
TECO Energy, Inc. | | | (12,523) | | | | (224,913) | |
| | | | | | | | |
| | | | | | | (626,360) | |
| | | | | | | | |
| | |
ELECTRONICS (-0.09%) | | | | | | | | |
Itron, Inc. | | | (7,275) | | | | (276,450) | |
National Instruments Corp. | | | (10,138) | | | | (276,869) | |
| | | | | | | | |
| | | | | | | (553,319) | |
| | | | | | | | |
| | |
FOOD (-0.28%) | | | | | | | | |
Annie’s, Inc. | | | (2,398) | | | | (77,959) | |
Campbell Soup Co. | | | (4,621) | | | | (210,209) | |
Flowers Foods, Inc. | | | (9,935) | | | | (203,866) | |
The Hillshire Brands Co. | | | (6,340) | | | | (226,021) | |
McCormick & Co., Inc. | | | (3,016) | | | | (214,739) | |
Mondelez International, Inc., Class A | | | (6,259) | | | | (223,134) | |
Snyder’s-Lance, Inc. | | | (5,951) | | | | (158,059) | |
United Natural Foods, Inc. | | | (1,862) | | | | (128,534) | |
Whole Foods Market, Inc. | | | (4,519) | | | | (224,594) | |
| | | | | | | | |
| | | | | | | (1,667,115) | |
| | | | | | | | |
| | |
FOREST PRODUCTS & PAPER (-0.05%) | | | | | | | | |
Resolute Forest Products, Inc. | | | (7,754) | | | | (138,331) | |
Wausau Paper Corp. | | | (11,252) | | | | (134,574) | |
| | | | | | | | |
| | | | | | | (272,905) | |
| | | | | | | | |
See Notes to Financial Statements.
| | |
| Redmont Resolute Fund II | | Schedule of Investments |
| | April 30, 2014 |
| | | | | | | | |
| | | Shares | | | Value (Note 2) | |
GAS (-0.04%) | | | | | | | | |
NiSource, Inc. | | | (6,738) | | | $ | (244,724) | |
| | | | | | | | |
| | |
HAND & MACHINE TOOLS (-0.02%) | | | | | | | | |
Kennametal, Inc. | | | (1,503) | | | | (70,235) | |
Regal-Beloit Corp. | | | (952) | | | | (71,143) | |
| | | | | | | | |
| | | | | | | (141,378) | |
| | | | | | | | |
| | |
HEALTHCARE - PRODUCTS (-0.04%) | | | | | | | | |
ResMed, Inc. | | | (5,368) | | | | (267,595) | |
| | | | | | | | |
| | |
HEALTHCARE - SERVICES (-0.04%) | | | | | | | | |
Health Net, Inc. | | | (6,237) | | | | (214,116) | |
| | | | | | | | |
| | |
HOME BUILDERS (-0.02%) | | | | | | | | |
MDC Holdings, Inc. | | | (3,724) | | | | (102,782) | |
| | | | | | | | |
| | |
HOUSEHOLD PRODUCTS & WARES (-0.06%) | | | | | | | | |
The Clorox Co. | | | (2,265) | | | | (205,435) | |
The Scotts Miracle-Gro Co., Class A | | | (3,027) | | | | (185,283) | |
| | | | | | | | |
| | | | | | | (390,718) | |
| | | | | | | | |
| | |
HOUSEWARES (-0.01%) | | | | | | | | |
The Toro Co. | | | (1,036) | | | | (65,827) | |
| | | | | | | | |
| | |
INTERNET (-0.26%) | | | | | | | | |
58.com, Inc., ADR | | | (975) | | | | (38,786) | |
Bankrate, Inc. | | | (3,287) | | | | (57,588) | |
Cogent Communications Group, Inc. | | | (4,567) | | | | (157,424) | |
E-Commerce China Dangdang, Inc., ADR, Class A | | | (7,001) | | | | (75,541) | |
Equinix, Inc. | | | (1,243) | | | | (233,448) | |
Internap Network Services Corp. | | | (14,650) | | | | (98,448) | |
Netflix, Inc. | | | (510) | | | | (164,240) | |
Rackspace Hosting, Inc. | | | (2,103) | | | | (61,029) | |
Shutterfly, Inc. | | | (1,401) | | | | (57,343) | |
Shutterstock, Inc. | | | (457) | | | | (33,137) | |
Twitter, Inc. | | | (1,922) | | | | (74,900) | |
Yandex NV, Class A | | | (3,079) | | | | (81,594) | |
Yelp, Inc. | | | (1,090) | | | | (63,569) | |
Zillow, Inc., Class A | | | (2,585) | | | | (280,990) | |
Zynga, Inc., Class A | | | (19,582) | | | | (79,307) | |
| | | | | | | | |
| | | | | | | (1,557,344) | |
| | | | | | | | |
| | |
MACHINERY - DIVERSIFIED (-0.07%) | | | | | | | | |
Briggs & Stratton Corp. | | | (3,021) | | | | (64,559) | |
Deere & Co. | | | (694) | | | | (64,778) | |
The Manitowoc Co., Inc. | | | (2,106) | | | | (66,929) | |
Nordson Corp. | | | (921) | | | | (68,476) | |
Roper Industries, Inc. | | | (1,276) | | | | (177,300) | |
| | | | | | | | |
| | | | | | | (442,042) | |
| | | | | | | | |
| | |
METAL FABRICATE & HARDWARE (-0.01%) | | | | | | | | |
Sun Hydraulics Corp. | | | (1,445) | | | | (59,072) | |
| | | | | | | | |
| | |
MINING (-0.03%) | | | | | | | | |
Teck Resources Ltd., Class B | | | (6,550) | | | | (149,144) | |
| | | | | | | | |
See Notes to Financial Statements.
| | |
Annual Report | April 30, 2014 | | 31 |
| | |
| Redmont Resolute Fund II | | Schedule of Investments |
| | April 30, 2014 |
| | | | | | | | |
| | | Shares | | | Value (Note 2) | |
MISCELLANEOUS MANUFACTURING (-0.15%) | | | | | | | | |
AptarGroup, Inc. | | | (2,791) | | | $ | (188,169) | |
AZZ, Inc. | | | (4,795) | | | | (208,199) | |
Proto Labs, Inc. | | | (4,620) | | | | (279,695) | |
Raven Industries, Inc. | | | (3,456) | | | | (106,790) | |
Trinity Industries, Inc. | | | (1,747) | | | | (131,130) | |
| | | | | | | | |
| | | | | | | (913,983) | |
| | | | | | | | |
| | |
OIL & GAS (-0.46%) | | | | | | | | |
Approach Resources, Inc. | | | (2,098) | | | | (43,533) | |
Atwood Oceanics, Inc. | | | (3,488) | | | | (172,865) | |
Bill Barrett Corp. | | | (6,223) | | | | (147,361) | |
Cabot Oil & Gas Corp. | | | (4,138) | | | | (162,541) | |
Carrizo Oil & Gas, Inc. | | | (4,297) | | | | (236,421) | |
Chesapeake Energy Corp. | | | (6,901) | | | | (198,404) | |
ConocoPhillips | | | (3,406) | | | | (253,100) | |
Continental Resources, Inc. | | | (2,408) | | | | (333,556) | |
Energy XXI Bermuda Ltd. | | | (7,156) | | | | (171,243) | |
Goodrich Petroleum Corp. | | | (5,788) | | | | (145,568) | |
HollyFrontier Corp. | | | (4,576) | | | | (240,652) | |
Matador Resources Co. | | | (9,563) | | | | (274,649) | |
Oasis Petroleum, Inc. | | | (2,885) | | | | (134,181) | |
Ultra Petroleum Corp. | | | (8,347) | | | | (248,741) | |
| | | | | | | | |
| | | | | | | (2,762,815) | |
| | | | | | | | |
| | |
OIL & GAS SERVICES (-0.06%) | | | | | | | | |
RPC, Inc. | | | (5,833) | | | | (129,668) | |
Weatherford International Ltd. | | | (11,587) | | | | (243,327) | |
| | | | | | | | |
| | | | | | | (372,995) | |
| | | | | | | | |
| | |
REAL ESTATE INVESTMENT TRUSTS (-0.27%) | | | | | | | | |
HCP, Inc. | | | (7,133) | | | | (298,587) | |
Health Care REIT, Inc. | | | (4,543) | | | | (286,618) | |
Omega Healthcare Investors, Inc. | | | (7,959) | | | | (276,814) | |
Plum Creek Timber Co., Inc. | | | (6,211) | | | | (270,800) | |
Realty Income Corp. | | | (6,346) | | | | (275,734) | |
Rouse Properties, Inc. | | | (13,283) | | | | (223,021) | |
| | | | | | | | |
| | | | | | | (1,631,574) | |
| | | | | | | | |
| | |
RETAIL (-0.36%) | | | | | | | | |
AutoNation, Inc. | | | (2,115) | | | | (112,074) | |
Bob Evans Farms, Inc. | | | (4,507) | | | | (211,243) | |
Buffalo Wild Wings, Inc. | | | (1,666) | | | | (243,436) | |
Cabela’s, Inc. | | | (3,465) | | | | (227,339) | |
The Cheesecake Factory, Inc. | | | (4,635) | | | | (208,065) | |
Guess?, Inc. | | | (7,267) | | | | (195,555) | |
Krispy Kreme Doughnuts, Inc. | | | (11,342) | | | | (198,939) | |
L Brands, Inc. | | | (4,374) | | | | (237,071) | |
Lululemon Athletica, Inc. | | | (3,236) | | | | (148,629) | |
Panera Bread Co., Class A | | | (1,172) | | | | (179,281) | |
Sally Beauty Holdings, Inc. | | | (6,871) | | | | (188,334) | |
| | | | | | | | |
| | | | | | | (2,149,966) | |
| | | | | | | | |
| | |
SAVINGS & LOANS (-0.02%) | | | | | | | | |
Astoria Financial Corp. | | | (11,150) | | | | (147,849) | |
| | | | | | | | |
| | |
SEMICONDUCTORS (-0.10%) | | | | | | | | |
Cirrus Logic, Inc. | | | (3,961) | | | | (88,330) | |
See Notes to Financial Statements.
| | |
| Redmont Resolute Fund II | | Schedule of Investments |
| | April 30, 2014 |
| | | | | | | | |
| | | Shares | | | Value (Note 2) | |
SEMICONDUCTORS (-0.10%) (continued) | | | | | | | | |
Hittite Microwave Corp. | | | (4,811) | | | $ | (285,581) | |
International Rectifier Corp. | | | (9,435) | | | | (245,688) | |
| | | | | | | | |
| | | | | | | (619,599) | |
| | | | | | | | |
| | |
SOFTWARE (-0.35%) | | | | | | | | |
Acxiom Corp. | | | (2,163) | | | | (61,083) | |
Aspen Technology, Inc. | | | (3,363) | | | | (144,575) | |
athenahealth, Inc. | | | (897) | | | | (110,905) | |
Blackbaud, Inc. | | | (10,116) | | | | (308,032) | |
Concur Technologies, Inc. | | | (1,868) | | | | (150,318) | |
Glu Mobile, Inc. | | | (18,968) | | | | (75,872) | |
NetSuite, Inc. | | | (2,536) | | | | (196,058) | |
Red Hat, Inc. | | | (3,889) | | | | (189,200) | |
Rocket Fuel, Inc. | | | (813) | | | | (26,073) | |
Salesforce.com, Inc. | | | (5,613) | | | | (289,911) | |
Sungy Mobile Ltd., ADR | | | (789) | | | | (12,908) | |
Synchronoss Technologies, Inc. | | | (5,677) | | | | (172,808) | |
Tyler Technologies, Inc. | | | (2,110) | | | | (172,282) | |
The Ultimate Software Group, Inc. | | | (1,289) | | | | (154,203) | |
VMware, Inc., Class A | | | (613) | | | | (56,709) | |
| | | | | | | | |
| | | | | | | (2,120,937) | |
| | | | | | | | |
| | |
TELECOMMUNICATIONS (-0.22%) | | | | | | | | |
America Movil SAB de CV, ADR | | | (8,824) | | | | (177,186) | |
Ciena Corp. | | | (6,494) | | | | (128,386) | |
Finisar Corp. | | | (6,685) | | | | (174,813) | |
Infinera Corp. | | | (18,620) | | | | (166,835) | |
Level 3 Communications, Inc. | | | (3,206) | | | | (137,954) | |
Sprint Corp. | | | (21,453) | | | | (182,351) | |
Telefonica SA, ADR | | | (11,477) | | | | (192,240) | |
ViaSat, Inc. | | | (2,430) | | | | (156,030) | |
| | | | | | | | |
| | | | | | | (1,315,795) | |
| | | | | | | | |
| | |
TOYS, GAMES & HOBBIES (0.00%)(d) | | | | | | | | |
LeapFrog Enterprises, Inc. | | | (3,405) | | | | (23,324) | |
| | | | | | | | |
| | |
TRANSPORTATION (-0.07%) | | | | | | | | |
Hub Group, Inc., Class A | | | (2,931) | | | | (130,869) | |
JB Hunt Transport Services, Inc. | | | (2,365) | | | | (179,977) | |
Kansas City Southern | | | (1,290) | | | | (130,135) | |
| | | | | | | | |
| | | | | | | (440,981) | |
| | | | | | | | |
| | |
TOTAL COMMON STOCKS (Proceeds $24,594,147) | | | | | | | (25,794,535) | |
| | |
EXCHANGE TRADED FUNDS (-0.06%) | | | | | | | | |
United States Oil Fund LP | | | (9,992) | | | | (362,909) | |
| | | | | | | | |
| | |
TOTAL EXCHANGE TRADED FUNDS (-0.06%) (Proceeds $356,301) | | | | | | | (362,909) | |
| | |
TOTAL SECURITIES SOLD SHORT (Proceeds $24,950,448) | | | | | | $ | (26,157,444) | |
| | | | | | | | | |
See Notes to Financial Statements.
| | |
Annual Report | April 30, 2014 | | 33 |
| | |
| Redmont Resolute Fund II | | Schedule of Investments |
| | April 30, 2014 |
SCHEDULE OF WRITTEN OPTIONS
| | | | | | | | | | | | |
| | | Number of
Contracts | | Exercise
Price | | Maturity
Date | | | Value (Note 2) | |
WRITTEN OPTIONS | | | | | | | | | | | | |
Call Options | | | | | | | | | | | | |
Exxon Mobil Corp. | | (39) | | $97.50 | | | 07/19/2014 | | | $ | (20,962) | |
Exxon Mobil Corp. | | (45) | | 90.00 | | | 07/19/2014 | | | | (57,825) | |
Occidental Petroleum Corp. | | (37) | | 90.00 | | | 05/17/2014 | | | | (22,293) | |
| | | | | | | | | | | | |
| | | | |
TOTAL WRITTEN OPTIONS (Proceeds $55,327) | | | | | | | | | | $ | (101,080) | |
| | | | | | | | | | | | |
| (a) | Non-income producing security. |
| (b) | Security position either entirely or partially held in a segregated account as collateral for securities sold short and written options. Aggregate total market value of $22,560,289. |
| (c) | Includes cash which is being held as collateral for securities sold short, written options and total return swap contracts. |
Common Abbreviations:
ADR - American Depositary Receipt.
AG - Aktiengesellschaft is a German term that refers to a corporation that is limited by shares, i.e., owned by shareholders.
AQR - AQR Capital Management LLC.
FPA - First Pacific Advisors LLC.
LP - Limited Partnership.
Ltd. - Limited.
NV - Naamloze Vennootschap is the Dutch term for a public limited liability corporation.
PIMCO - Pacific Investment Management Company.
PLC - Public Limited Company.
SA - Generally designates corporations in various countries, mostly those employing the civil law.
SAB de CV - A variable capital company.
TOTAL RETURN SWAP CONTRACTS*
| | | | | | | | | | | | | | | | |
| Counterparty | | Reference Obligation | | Notional Amount | | | Rate Paid by the Fund | | Termination
Date | | | Unrealized
Appreciation | |
Morgan Stanley | | Loeb King Multi Segregated Portfolio | | $ | 74,420,514 | | | 1-Month LIBOR BBA | | | 09/02/2014 | | | $ | 68,038 | |
Morgan Stanley | | Melchior Segregated Portfolio | | | 48,909,120 | | | 1-Month LIBOR BBA | | | 03/20/2019 | | | | 91,475 | |
Morgan Stanley | | Trilogy Segregated Portfolio | | | 74,430,429 | | | 1-Month LIBOR BBA | | | 09/02/2014 | | | | 49,693 | |
| | | | | | | | | | | | | | | | |
| | | | $ | 197,760,063 | | | | | | | | | $ | 209,206 | |
| | | | | | | | | | | | | | | | |
| * | The Fund receives payments based on any positive return of the Reference Obligation less the rate paid by the Fund. The Fund makes payments on any negative return of such Reference Obligation plus the rate paid by the Fund. |
See Notes to Financial Statements.
| | |
| Redmont Funds | | Statements of Assets and Liabilities |
| | April 30, 2014 |
| | | | | | | | |
| | | REDMONT RESOLUTE FUND I | | | REDMONT RESOLUTE
FUND II | |
ASSETS | | | | | | | | |
Investments, at value | | $ | 3,919,810 | | | $ | 547,696,323 | |
Unrealized appreciation on total return swap contracts | | | 1,235 | | | | 209,206 | |
Deposits with brokers for securities sold short and written options | | | 135,450 | | | | 21,843,315 | |
Deposits with brokers for total return swap contracts | | | 358,000 | | | | 61,310,000 | |
Receivable for investments sold | | | 6,386 | | | | 1,044,807 | |
Receivable due from adviser | | | 7,821 | | | | – | |
Receivable for dividends | | | 512 | | | | 84,697 | |
Receivable for interest on total return swap contracts | | | 309 | | | | 52,656 | |
Other assets | | | 12,352 | | | | 5,943 | |
Total assets | | | 4,441,875 | | | | 632,246,947 | |
LIABILITIES | | | | | | | | |
Securities sold short (Proceeds $153,183 and $24,950,448, respectively) | | | 160,943 | | | | 26,157,444 | |
Written options, at value (Premiums received $– and $55,327, respectively) | | | – | | | | 101,080 | |
Investment advisory fees payable | | | – | | | | 220,866 | |
Distributions and service fees payable | | | 39 | | | | N/A | |
Payable for dividend expense on securities sold short | | | 89 | | | | 14,433 | |
Payable for investments purchased | | | 4,053 | | | | 628,897 | |
Trustee fees and expenses payable | | | 33 | | | | 5,790 | |
Chief compliance officer fee payable | | | 32 | | | | 3,908 | |
Principal financial officer fees payable | | | – | | | | 821 | |
Administration fees payable | | | 1,784 | | | | 27,525 | |
Transfer agent fees payable | | | 5,785 | | | | 4,039 | |
Professional fees payable | | | 12,517 | | | | 28,569 | |
Custody fees payable | | | 2,917 | | | | 11,163 | |
Accrued expenses and other liabilities | | | 344 | | | | 93,087 | |
Total liabilities | | | 188,536 | | | | 27,297,622 | |
NET ASSETS | | $ | 4,253,339 | | | $ | 604,949,325 | |
| | | | | | | | | |
NET ASSETS CONSIST OF | | | | | | | | |
Paid-in capital (Note 6) | | $ | 4,062,442 | | | $ | 574,043,861 | |
Accumulated net investment loss | | | (24,033) | | | | (965,202) | |
Accumulated net realized loss on investments, securities sold short, written options, and total return swap contracts | | | (3,805) | | | | (2,387,755) | |
Net unrealized appreciation on investments, securities sold short, written options, and total return swap contracts | | | 218,735 | | | | 34,258,421 | |
NET ASSETS | | $ | 4,253,339 | | | $ | 604,949,325 | |
| | | | | | | | | |
INVESTMENTS, AT COST | | $ | 3,694,550 | | | $ | 512,394,359 | |
PRICING OF SHARES | | | | | | | | |
Class A: | | | | | | | | |
Net Asset Value, offering and redemption price per share(a) | | $ | 10.61 | | | | N/A | |
Net Assets | | $ | 103,867 | | | | N/A | |
shares of beneficial interest outstanding (unlimited number of shares, no par value common stock authorized) | | | 9,794 | | | | N/A | |
Maximum offering price per share ((NAV/0.9450), based on maximum sales charge of 5.50% of the offering price) | | $ | 11.23 | | | | N/A | |
Class I: | | | | | | | | |
Net Asset Value, offering and redemption price per share | | $ | 10.70 | | | $ | 11.18 | |
Net Assets | | $ | 4,149,472 | | | $ | 604,949,325 | |
shares of beneficial interest outstanding (unlimited number of shares, no par value common stock authorized) | | | 387,727 | | | | 54,134,098 | |
| (a) | Redemption price per share may be reduced for any applicable contingent deferred sales charge. For a description of a possible sales charge, please see the Fund’s Prospectus. |
See Notes to Financial Statements.
| | |
Annual Report | April 30, 2014 | | 35 |
| | |
| Redmont Funds | | Statements of Operations |
| | For the Year Ended April 30, 2014 |
| | | | | | | | |
| | | REDMONT RESOLUTE FUND I | | | REDMONT
RESOLUTE FUND II | |
INVESTMENT INCOME | | | | | | | | |
Dividends | | $ | 51,851 | | | $ | 8,913,302 | |
Foreign taxes withheld | | | (52) | | | | (7,741) | |
Total investment income | | | 51,799 | | | | 8,905,561 | |
| | |
EXPENSES | | | | | | | | |
Investment advisory fees (Note 7) | | | 56,621 | | | | 9,046,973 | |
Broker fees and charges on securities sold short | | | 832 | | | | 135,921 | |
Administration fees | | | 13,807 | | | | 292,233 | |
Transfer agency fees | | | 43,625 | | | | 36,410 | |
Distribution and service fees | | | | | | | | |
Class A | | | 132 | | | | N/A | |
Professional fees | | | 15,249 | | | | 59,964 | |
Custody fees | | | 15,548 | | | | 65,759 | |
Reports to shareholders and printing fees | | | 1,870 | | | | 27,342 | |
Trustee fees and expenses | | | 147 | | | | 23,318 | |
Registration/filing fees | | | 30,734 | | | | 89,663 | |
Chief compliance officer fees | | | 291 | | | | 45,818 | |
Principal financial officer fees | | | 51 | | | | 9,930 | |
Dividend expense on securities sold short | | | 2,005 | | | | 321,105 | |
Other | | | 2,330 | | | | 15,122 | |
Total expenses before waivers | | | 183,242 | | | | 10,169,558 | |
Less fees waived/reimbursed by investment adviser (Note 7) | | | | | | | | |
Class A | | | (1,102) | | | | N/A | |
Class I | | | (116,869) | | | | (8,433,858) | |
Total net expenses | | | 65,271 | | | | 1,735,700 | |
NET INVESTMENT INCOME/(LOSS) | | | (13,472) | | | | 7,169,861 | |
Net realized gain/(loss) on investments | | | 30,136 | | | | (1,199,038) | |
Net realized loss on securities sold short | | | (16,665) | | | | (2,683,353) | |
Net realized gain on written options | | | – | | | | 22,045 | |
Net realized loss on total return swap contracts | | | (11,978) | | | | (2,031,264) | |
Net realized gain distributions from other investment companies | | | 31,794 | | | | 5,662,182 | |
Net change in unrealized appreciation on investments | | | 50,567 | | | | 11,904,986 | |
Net change in unrealized depreciation on securities sold short | | | (7,760) | | | | (1,206,996) | |
Net change in unrealized depreciation on written options | | | – | | | | (45,753) | |
Net change in unrealized appreciation on total return swap contracts | | | 1,235 | | | | 209,206 | |
NET REALIZED AND UNREALIZED GAIN ON INVESTMENTS | | | 77,329 | | | | 10,632,015 | |
NET INCREASE IN NET ASSETS RESULTING FROM OPERATIONS | | $ | 63,857 | | | $ | 17,801,876 | |
| | | | | | | | | |
See Notes to Financial Statements.
| | |
| Redmont Funds | | Statements of Changes in Net Assets |
| | |
| | | | | | | | |
| | | REDMONT RESOLUTE FUND I | |
| | | For the Year Ended
April 30, 2014 | | | For the Year Ended
April 30, 2013 | |
| | | | | | | | |
OPERATIONS | | | | | | | | |
Net investment loss | | $ | (13,472) | | | $ | (4,460) | |
Net realized gain/(loss) on investments, securities sold short and total return swap contracts | | | 1,493 | | | | (10,443) | |
Net realized gain distributions from other investment companies | | | 31,794 | | | | 11,634 | |
Net change in unrealized appreciation on investments, securities sold short and total return swap contracts | | | 44,042 | | | | 163,454 | |
Net increase in net assets resulting from operations | | | 63,857 | | | | 160,185 | |
DISTRIBUTIONS (NOTE 4) | | | | | | | | |
Net investment income | | | | | | | | |
Class A | | | – | | | | (275) | |
Class I | | | – | | | | (7,274) | |
Net realized gains on investments | | | | | | | | |
Class A | | | (291) | | | | (5) | |
Class I | | | (35,858) | | | | (98) | |
Net decrease in net assets from distributions | | | (36,149) | | | | (7,652) | |
BENEFICIAL INTEREST TRANSACTIONS (NOTE 6) | | | | | | | | |
Shares sold | | | | | | | | |
Class A | | | 81,978 | | | | 142,500 | |
Class I | | | 1,070,517 | | | | 2,373,333 | |
Dividends reinvested | | | | | | | | |
Class A | | | 291 | | | | 280 | |
Class I | | | 35,858 | | | | 7,372 | |
Shares redeemed, net of redemption fees | | | | | | | | |
Class A | | | – | | | | (127,534) | |
Class I | | | (179,407) | | | | (284,445) | |
Net increase in net assets derived from beneficial interest transactions | | | 1,009,237 | | | | 2,111,506 | |
Net increase in Net Assets | | | 1,036,945 | | | | 2,264,039 | |
| | |
NET ASSETS: | | | | | | | | |
Beginning of period | | | 3,216,394 | | | | 952,355 | |
End of period* | | $ | 4,253,339 | | | $ | 3,216,394 | |
| | | | | | | | | |
* Includes accumulated net investment loss of: | | $ | (24,033) | | | $ | (12,111) | |
See Notes to Financial Statements.
| | |
Annual Report | April 30, 2014 | | 37 |
| | |
| Redmont Funds | | Statements of Changes in Net Assets |
| | |
| | | | | | | | |
| | | REDMONT RESOLUTE FUND II | |
| | | For the Year Ended
April 30, 2014 | | | For the Year Ended
April 30, 2013 | |
OPERATIONS | | | | | | | | |
Net investment income | | $ | 7,169,861 | | | $ | 2,831,911 | |
Net realized loss on investments, securities sold short, written options and total return swap contracts | | | (5,891,610) | | | | (986,160) | |
Net realized gain distributions from other investment companies | | | 5,662,182 | | | | 1,545,786 | |
Net change in unrealized appreciation on investments, securities sold short, written options and total return swap contracts | | | 10,861,443 | | | | 21,817,523 | |
Net increase in net assets resulting from operations | | | 17,801,876 | | | | 25,209,060 | |
DISTRIBUTIONS (NOTE 4) | | | | | | | | |
Net investment income | | | | | | | | |
Class I | | | (6,549,225) | | | | (2,358,905) | |
Net realized gains on investments | | | | | | | | |
Class I | | | (4,724,816) | | | | – | |
Net decrease in net assets from distributions | | | (11,274,041) | | | | (2,358,905) | |
BENEFICIAL INTEREST TRANSACTIONS (NOTE 6) | | | | | | | | |
Shares sold | | | | | | | | |
Class I | | | 278,165,907 | | | | 347,412,602 | |
Dividends reinvested | | | | | | | | |
Class I | | | 11,258,768 | | | | 2,358,905 | |
Shares redeemed, net of redemption fees | | | | | | | | |
Class I | | | (137,322,440) | | | | (4,800,000) | |
Net increase in net assets derived from beneficial interest transactions | | | 152,102,235 | | | | 344,971,507 | |
Net increase in Net Assets | | | 158,630,070 | | | | 367,821,662 | |
| | |
NET ASSETS: | | | | | | | | |
Beginning of period | | | 446,319,255 | | | | 78,497,593 | |
End of period* | | $ | 604,949,325 | | | $ | 446,319,255 | |
| | | | | | | | | |
* Includes accumulated net investment income/(loss) of: | | $ | (965,202) | | | $ | 466,558 | |
See Notes to Financial Statements.
| | |
| Redmont Resolute Fund I | | Financial Highlights |
| | For a share outstanding throughout the periods presented |
| | | | | | | | | | | | |
| | | CLASS A | |
| |
| For the
Year Ended
April 30, 2014 |
| |
| For the
Year Ended
April 30, 2013 |
| |
| For the
Period Ended
April 30, 2012 (a) |
|
| | | |
NET ASSET VALUE, BEGINNING OF PERIOD | | $ | 10.63 | | | $ | 10.17 | | | $ | 10.00 | |
INCOME/(LOSS) FROM OPERATIONS | | | | | | | | | | | | |
Net investment loss(b) | | | (0.10) | | | | (0.04) | | | | (0.07) | |
Net realized and unrealized gain on investments | | | 0.17 | | | | 0.52 | | | | 0.24 | |
| | | | | | | | | | | | |
Total from Investment Operations | | | 0.07 | | | | 0.48 | | | | 0.17 | |
| | | | | | | | | | | | |
| | | |
LESS DISTRIBUTIONS | | | | | | | | | | | | |
Net investment income | | | – | | | | (0.03) | | | | – | |
Net realized gain on investments | | | (0.09) | | | | (0.00)(c | ) | | | – | |
| | | | | | | | | | | | |
Total Distributions | | | (0.09) | | | | (0.03) | | | | – | |
| | | | | | | | | | | | |
REDEMPTION FEES ADDED TO PAID IN CAPITAL | | | – | | | | 0.01 | | | | – | |
| | | | | | | | | | | | |
NET INCREASE/(DECREASE) IN NET ASSET VALUE | | | (0.02) | | | | 0.46 | | | | 0.17 | |
| | | | | | | | | | | | |
NET ASSET VALUE, END OF PERIOD | | $ | 10 .61 | | | $ | 10 .63 | | | $ | 10 .17 | |
| | | | | | | | | | | | |
TOTAL RETURN(d) | | | 0.70 | % | | | 4.81 | % | | | 1.70 | % |
| | | |
RATIOS/SUPPLEMENTAL DATA | | | | | | | | | | | | |
Net assets, End of Period (000s) | | $ | 104 | | | $ | 21 | | | $ | 1 | |
RATIOS TO AVERAGE NET ASSETS: | | | | | | | | | | | | |
Operating expenses excluding reimbursement/waiver(e) | | | 5.38% | (f) | | | 6.47 | % | | | 689.76% | (g) |
Operating expenses including reimbursement/waiver(e) | | | 2.08% | (f) | | | 2.30 | % | | | 2.30% | (g) |
Net investment loss including reimbursement/waiver(e) | | | (0.99) | % | | | (0.38) | % | | | (2.21)% | (g) |
PORTFOLIO TURNOVER RATE | |
| 91
| %
| | | 25 | % | | | 13% | (h) |
| (a) | The Fund’s inception was December 30, 2011. |
| (b) | Calculated using the average shares method. |
| (c) | Less than $0.005 per share. |
| (d) | Total investment return is calculated assuming a purchase of a common share at the opening of the first day and a sale at closing on the last day of each period reported. Dividends and distributions, if any, are assumed for purposes of this calculation to be reinvested at prices obtained under the Fund’s dividend reinvestment plan. Total returns would have been lower had certain expenses not been waived during the period. Total investment returns do not reflect brokerage commissions, if any, and are not annualized. |
| (e) | The ratios exclude the impact of expenses of the underlying funds in which the Fund invests as represented in the Schedule of Investments. |
| (f) | Dividend and interest expense on securities sold short totaled 0.08% of average net assets for the year ended April 30, 2014. |
See Notes to Financial Statements.
| | |
Annual Report | April 30, 2014 | | 39 |
| | |
| Redmont Resolute Fund I | | Financial Highlights |
| | For a share outstanding throughout the periods presented |
| | | | | | | | | | | | |
| | | | | | CLASS I | | | | |
| |
| For the
Year Ended
April 30, 2014 |
| |
| For the
Year Ended
April 30, 2013 |
| |
| For the
Period Ended
April 30, 2012 (a) |
|
| | | |
NET ASSET VALUE, BEGINNING OF PERIOD | | $ | 10.65 | | | $ | 10.18 | | | $ | 10.00 | |
INCOME/(LOSS) FROM OPERATIONS | | | | | | | | | | | | |
Net investment loss(b) | | | (0.04) | | | | (0.02) | | | | (0.06) | |
Net realized and unrealized gain on investments | | | 0.18 | | | | 0.52 | | | | 0.24 | |
| | | | | | | | | | | | |
Total from Investment Operations | | | 0.14 | | | | 0.50 | | | | 0.18 | |
| | | | | | | | | | | | |
| | | |
LESS DISTRIBUTIONS | | | | | | | | | | | | |
Net investment income | | | – | | | | (0.03) | | | | – | |
Net realized gain on investments | | | (0.09) | | | | (0.00)(c | ) | | | – | |
| | | | | | | | | | | | |
Total Distributions | | | (0.09) | | | | (0.03) | | | | – | |
| | | | | | | | | | | | |
NET INCREASE IN NET ASSET VALUE | | | 0.05 | | | | 0.47 | | | | 0.18 | |
| | | | | | | | | | | | |
NET ASSET VALUE, END OF PERIOD | | $ | 10 .70 | | | $ | 10 .65 | | | $ | 10 .18 | |
| | | | | | | | | | | | |
TOTAL RETURN(d) | | | 1.36 | % | | | 4.96 | % | | | 1.80 | % |
| | | |
RATIOS/SUPPLEMENTAL DATA | | | | | | | | | | | | |
Net assets, End of Period (000s) | | $ | 4,149 | | | $ | 3,195 | | | $ | 951 | |
RATIOS TO AVERAGE NET ASSETS: | | | | | | | | | | | | |
Operating expenses excluding reimbursement/waiver(e) | | | 4.85% | (f) | | | 5.87 | % | | | 19.86% | (g) |
Operating expenses including reimbursement/waiver(e) | | | 1.73% | (f) | | | 1.90 | % | | | 1.90% | (g) |
Net investment loss including reimbursement/waiver(e) | | | (0.35) | % | | | (0.23) | % | | | (1.78)% | (g) |
PORTFOLIO TURNOVER RATE | | | 91 | % | | | 25 | % | | | 13% | (h) |
| (a) | The Fund’s inception was December 30, 2011. |
| (b) | Calculated using the average shares method. |
| (c) | Less than $0.005 per share. |
| (d) | Total investment return is calculated assuming a purchase of a common share at the opening of the first day and a sale at closing on the last day of each period reported. Dividends and distributions, if any, are assumed for purposes of this calculation to be reinvested at prices obtained under the Fund’s dividend reinvestment plan. Total returns would have been lower had certain expenses not been waived during the period. Total investment returns do not reflect brokerage commissions, if any, and are not annualized. |
| (e) | The ratios exclude the impact of expenses of the underlying funds in which the Fund invests as represented in the Schedule of Investments. |
| (f) | Dividend and interest expense on securities sold short totaled 0.08% of average net assets for the year ended April 30, 2014. |
See Notes to Financial Statements.
| | |
| Redmont Resolute Fund II | | Financial Highlights |
| | For a share outstanding throughout the periods presented |
| | | | | | | | | | | | |
| | | CLASS I | |
| |
| For the
Year Ended
April 30, 2014 |
| |
| For the
Year Ended
April 30, 2013 |
| |
| For the
Period Ended
April 30, 2012 (a) |
|
| | | |
NET ASSET VALUE, BEGINNING OF PERIOD | | $ | 11.05 | | | $ | 10.34 | | | $ | 10.00 | |
INCOME/(LOSS) FROM OPERATIONS | | | | | | | | | | | | |
Net investment income/(loss)(b) | | | 0.13 | | | | 0.11 | | | | (0.03) | |
Net realized and unrealized gain on investments | | | 0.19 | | | | 0.68 | | | | 0.37 | |
| | | | | | | | | | | | |
Total from Investment Operations | | | 0.32 | | | | 0.79 | | | | 0.34 | |
| | | | | | | | | | | | |
| | | |
LESS DISTRIBUTIONS | | | | | | | | | | | | |
Net investment income | | | (0.11) | | | | (0.08) | | | | – | |
Net realized gain on investments | | | (0.08) | | | | – | | | | – | |
| | | | | | | | | | | | |
Total Distributions | | | (0.19) | | | | (0.08) | | | | – | |
| | | | | | | | | | | | |
NET INCREASE IN NET ASSET VALUE | | | 0.13 | | | | 0.71 | | | | 0.34 | |
| | | | | | | | | | | | |
NET ASSET VALUE, END OF PERIOD | | $ | 11 .18 | | | $ | 11 .05 | | | $ | 10 .34 | |
| | | | | | | | | | | | |
TOTAL RETURN(c) | | | 2.85 | % | | | 7.65 | % | | | 3.40 | % |
| | | |
RATIOS/SUPPLEMENTAL DATA | | | | | | | | | | | | |
Net assets, End of Period (000s) | | $ | 604,949 | | | $ | 446,319 | | | $ | 78,498 | |
RATIOS TO AVERAGE NET ASSETS: | | | | | | | | | | | | |
Operating expenses excluding reimbursement/waiver(d) | | | 1.69% | (e) | | | 1.32 | % | | | 1.63% | (f) |
Operating expenses including reimbursement/waiver(d) | | | 0.29% | (e) | | | 0.22 | % | | | 1.13% | (f) |
Net investment income/(loss) including reimbursement/waiver(d) | | | 1.19 | % | | | 1.08 | % | | | (0.97)% | (f) |
PORTFOLIO TURNOVER RATE | | | 114 | % | | | 51 | % | | | 18% | (g) |
| (a) | The Fund’s inception was December 30, 2011. |
| (b) | Calculated using the average shares method. |
| (c) | Total investment return is calculated assuming a purchase of a common share at the opening of the first day and a sale at closing on the last day of each period reported. Dividends and distributions, if any, are assumed for purposes of this calculation to be reinvested at prices obtained under the Fund’s dividend reinvestment plan. Total returns would have been lower had certain expenses not been waived during the period. Total investment returns do not reflect brokerage commissions, if any, and are not annualized. |
| (d) | The ratios exclude the impact of expenses of the underlying funds in which the Fund invests as represented in the Schedule of Investments. |
| (e) | Dividend and interest expense on securities sold short totaled 0.08% of average net assets for the year ended April 30, 2014. |
See Notes to Financial Statements.
| | |
Annual Report | April 30, 2014 | | 41 |
| | |
| Redmont Funds | | Notes to Financial Statements |
| | April 30, 2014 |
1. ORGANIZATION
Financial Investors Trust (the “Trust”), a Delaware statutory trust, is an open-end management investment company registered under the Investment Company Act of 1940, as amended (“1940 Act”). As of April 30, 2014, the Trust has 30 registered funds. This annual report describes the Redmont Resolute Fund I and Redmont Resolute Fund II (each a “Fund” and collectively, the “Funds”). The Funds seek to provide long-term total return with reduced volatility and reduced correlation to the conventional stock and bond markets. The Funds pursue their objectives primarily by allocating their assets among (i) investment sub-advisers (the “Sub-Advisers”) who manage alternative or hedging investment strategies, (ii) other open-end investment companies registered under the Investment Company Act of 1940, as amended (the “1940 Act”) that use alternative or hedging strategies, and (iii) derivatives, principally total return swaps on reference pools of securities which may be managed by unaffiliated parties, for the purposes of seeking economic exposure to alternative or hedging strategies. The Redmont Resolute Fund I offers Class A and Class I shares and the Redmont Resolute Fund II offers Class I shares. All classes of shares of a particular Fund have identical rights to earnings, assets and voting privileges, except for class specific expenses and exclusive rights to vote on matters affecting only individual classes.
2. SIGNIFICANT ACCOUNTING POLICIES
The accompanying financial statements were prepared in accordance with accounting principles generally accepted in the United States of America (“U.S. GAAP”). The preparation of financial statements in conformity with U.S. GAAP requires management to make certain estimates and assumptions that affect the reported amounts of assets and liabilities and disclosures of contingent assets and liabilities at the date of the financial statements and the reported amounts of revenue and expenses during the period. Actual results could differ from those estimates. The following is a summary of significant accounting policies consistently followed by the Funds in preparation of their financial statements.
Investment Valuation: The Funds generally value their securities based on market prices determined at the close of regular trading on the New York Stock Exchange (“NYSE”), normally 4:00 p.m. Eastern Time, on each day the NYSE is open for trading.
For equity securities and mutual funds that are traded on an exchange, the market price is usually the closing sale or official closing price on that exchange. In the case of equity securities not traded on an exchange, or if such closing prices are not otherwise available, the securities are valued at the mean of the most recent bid and ask prices on such day. Redeemable securities issued by open-end registered investment companies are valued at the investment company’s applicable net asset value, with the exception of exchange-traded open-end investment companies, which are priced as equity securities.
The market price for debt obligations is generally the price supplied by an independent third-party pricing service approved by the Board of Trustees (the “Board”), which may use a matrix, formula or other objective method that takes into consideration quotations from dealers, market transactions in comparable investments, market indices and yield curves. If vendors are unable to supply a price, or if the price supplied is deemed to be unreliable, the market price may be determined using quotations received from one or more brokers–dealers that make a market in the security. Short–term debt obligations that will mature in 60 days or less are valued at amortized cost, unless it is determined that using this method would not reflect an investment’s fair value.
Each Fund may pay or receive cash as collateral on these contracts which may be recorded as an asset and/or liability. The Fund must set aside liquid assets, or engage in other appropriate measures, to cover its obligations under these contracts. Swaps are marked to market daily using either pricing vendor quotations, counterparty prices or model prices and the change in value, if any, is recorded as an unrealized gain or loss. Upfront payments made and/or received by the Fund are recorded as an asset and/or liability and realized gains or losses are recognized ratably over the contract’s term/event, with the exception of forward starting interest rate swaps, whose realized gains or losses are recognized ratably from the effective start date. Periodic payments received or made on swap contracts are recorded as realized gains or losses. Gains or losses are realized upon termination of a swap contract and are recorded on the Statements of Operations.
When such prices or quotations are not available, or when the Fair Value Committee appointed by the Board believes that they are unreliable, securities may be priced using fair value procedures approved by the Board.
Fair Value Measurements: The Funds disclose the classification of their fair value measurements following a three-tier hierarchy based on the inputs used to measure fair value. Inputs refer broadly to the assumptions that market participants would use in pricing the asset or liability, including assumptions about risk. Inputs may be observable or unobservable. Observable inputs reflect the assumptions market participants would use in pricing the asset or liability that are developed based on market data obtained from sources independent of the reporting entity. Unobservable inputs reflect the reporting entity’s own assumptions about the assumptions market participants would use in pricing the asset or liability that are developed based on the best information available.
Various inputs are used in determining the value of the Funds’ investments as of the end of the reporting period. When inputs used fall into different levels of the fair value hierarchy, the level in the hierarchy within which the fair value measurement falls is determined based on the lowest level input
| | |
| Redmont Funds | | Notes to Financial Statements |
| | April 30, 2014 |
that is significant to the fair value measurement in its entirety. The designated input levels are not necessarily an indication of the risk or liquidity associated with these investments. These inputs are categorized in the following hierarchy under applicable financial accounting standards:
| | |
Level 1 – | | Unadjusted quoted prices in active markets for identical investments, unrestricted assets or liabilities that the Funds have the ability to access at the measurement date; |
| |
Level 2 – | | Quoted prices which are not active, quoted prices for similar assets or liabilities in active markets or inputs other than quoted prices that are observable (either directly or indirectly) for substantially the full term of the asset or liability; and |
| |
Level 3 – | | Significant unobservable prices or inputs (including the Funds’ own assumptions in determining the fair value of investments) where there is little or no market activity for the asset or liability at the measurement date. |
The following is a summary of the inputs used to value the Funds’ investments as of April 30, 2014:
Redmont Resolute Fund I
| | | | | | | | | | | | | | | | |
| Investments in Securities at Value | | Level 1 -
Quoted Prices | | | Level 2 -
Other Significant
Observable Inputs | | | Level 3 -
Significant
Unobservable Inputs | | | Total | |
Common Stocks | | $ | 324,658 | | | $ | – | | | $ | – | | | $ | 324,658 | |
Limited Partnerships | | | 1,366 | | | | – | | | | – | | | | 1,366 | |
Open-End Mutual Funds | | | 3,054,145 | | | | – | | | | – | | | | 3,054,145 | |
Short Term Investments | | | 539,641 | | | | – | | | | – | | | | 539,641 | |
Total | | $ | 3,919,810 | | | $ | – | | | $ | – | | | $ | 3,919,810 | |
| | |
| | | | |
| Other Financial Instruments | | | | | | | | | | | | |
Assets: | | | | | | | | | | | | | | | | |
Total Return Swap Contracts | | $ | – | | | $ | 1,235 | | | $ | – | | | $ | 1,235 | |
Liabilities: | | | | | | | | | | | | | | | | |
Securities Sold Short | | $ | (158,728) | | | $ | – | | | $ | – | | | $ | (158,728) | |
Exchange Traded Funds Sold Short | | | (2,215) | | | | – | | | | – | | | | (2,215) | |
Total | | $ | (160,943) | | | $ | 1,235 | | | $ | – | | | $ | (159,708) | |
| | |
Redmont Resolute Fund II
| | | | | | | | | | | | | | | | |
| Investments in Securities at Value | | Level 1 -
Quoted Prices | | | Level 2 -
Other Significant
Observable Inputs | | | Level 3 -
Significant
Unobservable Inputs | | | Total | |
Common Stocks | | $ | 52,828,088 | | | $ | – | | | $ | – | | | $ | 52,828,088 | |
Limited Partnerships | | | 222,960 | | | | – | | | | – | | | | 222,960 | |
Open-End Mutual Funds | | | 423,856,746 | | | | – | | | | – | | | | 423,856,746 | |
Short Term Investments | | | 70,788,529 | | | | – | | | | – | | | | 70,788,529 | |
Total | | $ | 547,696,323 | | | $ | – | | | $ | – | | | $ | 547,696,323 | |
| | |
| | | | |
| Other Financial Instruments | | | | | | | | | | | | |
Assets: | | | | | | | | | | | | | | | | |
Total Return Swap Contracts | | $ | – | | | $ | 209,206 | | | $ | – | | | $ | 209,206 | |
Liabilities: | | | | | | | | | | | | | | | | |
Securities Sold Short | | $ | (25,794,535) | | | $ | – | | | $ | – | | | $ | (25,794,535) | |
Exchange Traded Funds Sold Short | | | (362,909) | | | | – | | | | – | | | | (362,909) | |
Written Options | | | (101,080) | | | | – | | | | – | | | | (101,080) | |
Total | | $ | (26,258,524) | | | $ | 209,206 | | | $ | – | | | $ | (26,049,318) | |
| | |
The Funds recognize transfers between levels as of the end of the period. For the year ended April 30, 2014, the Funds did not have any transfers between Level 1 and Level 2 securities. There were no Level 3 securities held during the period.
Trust Expenses: Some expenses of the Trust can be directly attributed to the Funds. Expenses which cannot be directly attributed to the Funds are apportioned among all funds in the Trust based on average net assets of each fund.
| | |
Annual Report | April 30, 2014 | | 43 |
| | |
| Redmont Funds | | Notes to Financial Statements |
| | April 30, 2014 |
Fund and Class Expenses: Expenses that are specific to a Fund or class of shares of a Fund are charged directly to that Fund or share class. Expenses that are common to all Funds generally are allocated among the Funds in proportion to their average daily net assets. Fees provided under the distribution (Rule 12b-1) and/or shareholder service plans for a particular class of the Fund are charged to the operations of such class.
Federal Income Taxes: The Funds comply with the requirements under Subchapter M of the Internal Revenue Code of 1986, as amended, applicable to regulated investment companies and intend to distribute substantially all of their net taxable income and net capital gains, if any, each year so that the Funds will not be subject to excise tax on undistributed income and gains. The Funds are not subject to income taxes to the extent such distributions are made.
As of and during the year ended April 30, 2014, the Funds did not have a liability for any unrecognized tax benefits. The Funds file U.S. federal, state, and local tax returns as required. The Funds’ tax returns are subject to examination by the relevant tax authorities until expiration of the applicable statute of limitations, which is generally three years after the filing of the tax return for federal purposes and four years for most state returns. Tax returns for open years have incorporated no uncertain tax positions that require a provision for income taxes.
Investment Transactions and Investment Income: Investment transactions are accounted for on the date the investments are purchased or sold (trade date basis). Net realized gains and losses from investment transactions are reported on an identified cost basis. Interest income, which includes accretion of discounts and amortization of premiums, is accrued and recorded as earned. Dividend income is recognized on the ex-dividend date or for certain foreign securities, as soon as information is available to the Funds. All of the realized and unrealized gains and losses and net investment income, are allocated daily to each class in proportion its average daily net assets.
Short Sales: Each Fund may make short sales of securities consistent with its strategies. A short sale is a transaction in which a Fund sells a security it does not own in anticipation that the market price of that security will decline.
When a Fund makes a short sale, it must borrow the security sold short and deliver it to the broker dealer through which it made the short sale as collateral for its obligation to deliver the security upon conclusion of the sale. The Fund may have to pay a fee to borrow particular securities and is often obligated to pay over any accrued interest and dividends on such borrowed securities.
If the price of the security sold short increases between the time of the short sale and the time that a Fund replaces the borrowed security, the Fund will incur a loss; conversely, if the price declines, the Fund will realize a capital gain. Any gain will be decreased, and any loss increased, by the transaction costs described above. The successful use of short selling may be adversely affected by imperfect correlation between movements in the price of the security sold short and the securities being hedged.
To the extent that a Fund engages in short sales, it will provide collateral to the broker-dealer and (except in the case of short sales “against the box”) will maintain additional asset coverage in the form of segregated or “earmarked” assets determined to be liquid in accordance with procedures established by the Board and that is equal to the current market value of the securities sold short, or will ensure that such positions are covered by “offsetting” positions, until the Fund replaces the borrowed security. A short sale is “against the box” to the extent that the Fund contemporaneously owns, or has the right to obtain at no added cost, securities identical to those sold short. Each Fund may engage in short selling to the extent permitted by the federal securities laws and rules and interpretations thereunder. To the extent a Fund engages in short selling in foreign (non-U.S.) jurisdictions, the Fund will do so to the extent permitted by the laws and regulations of such jurisdiction.
Distributions to Shareholders: Each Fund normally pays dividends and distributes capital gains, if any, on an annual basis. Income dividend distributions are derived from interest and other income each Fund receives from their investments, including distributions of short term capital gains. Capital gain distributions are derived from gains realized when each Fund sells a security it has owned for more than a year. Each Fund may make additional distributions and dividends at other times if its portfolio manager or managers believe doing so may be necessary for each Fund to avoid or reduce taxes.
3. DERIVATIVE INSTRUMENTS
Swap Contracts: Each Fund may enter into swap transactions for hedging purposes or to seek to increase total return. At the present time, the Funds primarily enter into swap transactions for the purpose of increasing total return. Risks may arise as a result of the failure of the counterparty to the swap contract to comply with the terms of the swap contract. The loss incurred by the failure of a counterparty is generally limited to the net payment to be received by the Funds and/or the termination value at the end of the contract.
Therefore, the Funds consider the creditworthiness of each counterparty to a contract in evaluating potential credit risk. Additionally, risks may arise from unanticipated movements in interest rates or in the value of the underlying reference asset or index. Entering into these agreements
| | |
| Redmont Funds | | Notes to Financial Statements |
| | April 30, 2014 |
involves, to varying degrees, market risk, liquidity risk and elements of credit, legal and documentation risk that are not directly reflected in the amounts recognized in the Statements of Assets and Liabilities.
Each Fund invests in total return swaps to obtain exposure to a security or market without owning such security or investing directly in that market or to transfer the risk/return of one market (e.g., fixed income) to another market (e.g., equity) (equity risk and/or interest rate risk). Total return swaps are agreements in which there is an exchange of cash flows whereby one party commits to make payments based on the total return (coupons plus capital gains/losses) of an underlying instrument in exchange for fixed or floating rate interest payments. To the extent the total return of the instrument or index underlying the transaction exceeds or falls short of the offsetting interest rate obligation, the Fund will receive a payment from or make a payment to the counterparty. Swap agreements held at April 30, 2014 are disclosed in the Schedule of Investments.
International Swaps and Derivatives Association, Inc. Master Agreements (“ISDA Master Agreements”) govern OTC financial derivative transactions entered into by the Funds and those counterparties. The ISDA Master Agreements maintain provisions for general obligations, representations, agreements, collateral and events of default or termination. Events of termination include conditions that may entitle counterparties to elect to terminate early and cause settlement of all outstanding transactions under the applicable ISDA Master Agreement. Any election to early terminate could be material to the financial statements.
The number of swap contracts held at April 30, 2014 is representative of the swap contract activity for the fiscal year ended April 30, 2014.
Option Contracts: Each Fund may enter into options transactions for hedging purposes and for non-hedging purposes such as seeking to enhance return. Each Fund may write covered put and call options on any stocks or stock indices, currencies traded on domestic and foreign securities exchanges, or futures contracts on stock indices, interest rates and currencies traded on domestic and, to the extent permitted by the CFTC, foreign exchanges. A call option on an asset written by a Fund obligates the Fund to sell the specified asset to the holder (purchaser) at a stated price (the exercise price) if the option is exercised before a specified date (the expiration date). A put option on an asset written by a Fund obligates the Fund to buy the specified asset from the purchaser at the exercise price if the option is exercised before the expiration date. Premiums received when writing options are recorded as liabilities and are subsequently adjusted to the current value of the options written. Premiums received from writing options that expire are treated as realized gains. Premiums received from writing options, which are either exercised or closed, are offset against the proceeds received or amount paid on the transaction to determine realized gains or losses which are recorded on the Statement of Operations.
Written option activity for the year ended April 30, 2014 was as follows:
Redmont Resolute Fund II
| | | | | | | | |
| | | Written Call Options | |
| | | Contracts | | | Premiums | |
Outstanding, April 30, 2013 | | | – | | | $ | – | |
Written | | | (254 | ) | | | 136,192 | |
Exercised | | | 85 | | | | (37,321 | ) |
Expired | | | 9 | | | | (2,809 | ) |
Closed | | | 54 | | | | (40,735 | ) |
Split | | | (15 | ) | | | – | |
Outstanding, April 30, 2014 | | | (121 | ) | | $ | 55,327 | |
| | |
Risk Exposure: The following tables disclose the amounts related to each Fund’s use of derivative instruments.
The effect of derivatives instruments on the Statements of Assets and Liabilities as of April 30, 2014:
| | | | | | | | | | | | |
| Risk Exposure | | Asset Derivatives Statements of
Assets and Liabilities Location | | Fair Value | | | Liability Derivatives Statements
of Assets and Liabilities Location | | Fair Value | |
Redmont Resolute Fund I | | | | | | | | | | | | |
Equity Contracts (Total Return Swap Contracts) | | Unrealized appreciation on total return swap contracts | | | 1,235 | | | Unrealized depreciation on total return swap contracts | | $ | – | |
Total | | | | $ | 1,235 | | | | | $ | – | |
| | |
| | |
Annual Report | April 30, 2014 | | 45 |
| | |
| Redmont Funds | | Notes to Financial Statements |
| | April 30, 2014 |
| | | | | | | | | | | | |
| Risk Exposure | | Asset Derivatives Statements of
Assets and Liabilities Location | | Fair Value | | | Liability Derivatives Statements
of Assets and Liabilities Location | | Fair Value | |
Redmont Resolute Fund II | | | | | | | | | | | | |
Equity Contracts (Total Return Swap Contracts) | | Unrealized appreciation on total return swap contracts | | $ | 209,206 | | | Unrealized depreciation on total return swap contracts | | $ | – | |
Equity Contracts (Written Options) | | N/A | | $ | N/A | | | Written options, at value | | | 101,080 | |
Total | | | | $ | 209,206 | | | | | $ | 101,080 | |
| | | | | | | | | | | | | |
The effect of derivatives instruments on the Statements of Operations for the year ended April 30, 2014:
| | | | | | | | | | |
| Risk Exposure | | Statement of Operations Location | | Realized
Gain/(Loss)
on Derivatives
Recognized in
Income | | | Change in
Unrealized
Appreciation/(Depreciation)
on Derivatives
Recognized
in Income | |
Redmont Resolute Fund I | | | | | | | | | | |
Equity Contracts
(Total Return Swap Contracts) | | Net realized loss on total return swap contracts/Net change in unrealized appreciation on total return swap contracts | | $ | (11,978 | ) | | $ | 1,235 | |
Total | | | | $ | (11,978 | ) | | $ | 1,235 | |
| | | | | | | | | | | |
| Redmont Resolute Fund II | | | | | | | | |
Equity Contracts
(Total Return Swap Contracts) | | Net realized loss on total return swap contracts/Net change in unrealized appreciation on total return swap contracts | | $ | (2,031,264 | ) | | $ | 209,206 | |
Equity Contracts
(Written Options) | | Net realized gain on written options/Net change in unrealized depreciation on written options | | | 22,045 | | | | (45,753 | ) |
Total | | | | $ | (2,009,219 | ) | | $ | 163,453 | |
| | | | | | | | | | | |
Certain derivative contracts and repurchase agreements are executed under either standardized netting agreements or, for exchange-traded derivatives, the relevant contracts for a particular exchange which contain enforceable netting provisions. A derivative netting arrangement creates an enforceable right of set-off that becomes effective, and affects the realization of settlement on individual assets, liabilities and collateral amounts, only following a specified event of default or early termination. Default events may include the failure to make payments or deliver securities timely, material adverse changes in financial condition or insolvency, the breach of minimum regulatory capital requirements, or loss of license, charter or other legal authorization necessary to perform under the contract.
The following table presents financial instruments that are subject to enforceable netting arrangements or other similar agreements as of April 30, 2014:
Redmont Resolute Fund I
Offsetting of Derivatives Assets
April 30, 2014
| | | | | | | | | | | | | | | | | | | | | | | | |
| | | | | | | | | | | | Gross Amounts Not Offset in the Statement of Financial Position | |
| Description | | Gross
Amounts of
Recognized
Assets | | | Gross Amounts
Offset in the
Statement of
Financial Position | | | Net Amounts
Presented in the
Statement of
Financial Position | | | Financial
Instruments
Available
for Offset | | | Cash Collateral
Received | | | Net Receivable
Amount | |
Total Return Swap Contracts | | $ | 1,235 | | | $ | – | | | $ | 1,235 | | | $ | – | | | $ | – | | | $ | 1,235 | |
Total | | $ | 1,235 | | | $ | – | | | $ | 1,235 | | | $ | – | | | $ | – | | | $ | 1,235 | |
| | | | | | | | | | |
| | |
| Redmont Funds | | Notes to Financial Statements |
| | April 30, 2014 |
Redmont Resolute Fund II
Offsetting of Derivatives Assets
April 30, 2014
| | | | | | | | | | | | | | | | | | | | | | | | |
| | | | | | | | | | | | Gross Amounts
Not Offset in the
Statement of
Financial Position | |
| Description | | Gross Amounts of
Recognized
Assets | | | Gross Amounts
Offset in the
Statement of
Financial Position | | | Net Amounts
Presented in the
Statement of
Financial Position | | | Financial
Instruments
Available for
Offset | | | Cash Collateral
Received | | | Net Receivable
Amount | |
Total Return Swap Contracts | | $ | 209,206 | | | $ | – | | | $ | 209,206 | | | $ | – | | | $ | – | | | $ | 209,206 | |
Total | | $ | 209,206 | | | $ | – | | | $ | 209,206 | | | $ | – | | | $ | – | | | $ | 209,206 | |
| | |
4. TAX BASIS INFORMATION
Reclassifications: As of April 30, 2014, permanent differences in book and tax accounting were reclassified. These differences had no effect on net assets and were primarily attributed to minor differences between book and tax characterizations of distributions to shareholders and investment in passive foreign investment companies and swaps. The reclassifications were as follows:
| | | | | | | | | | | | |
| | | Undistributed Net
Investment
Income/(Loss) | | | Accumulated Net
Realized Gain/(Loss)
on Investments | | | Paid-in Capital | |
Redmont Resolute Fund I | | $ | 1,550 | | | $ | (1,549 | ) | | $ | (1 | ) |
Redmont Resolute Fund II | | | (2,052,396 | ) | | | 2,149,662 | | | | (97,266 | ) |
Tax Basis of Investments: As of April 30, 2014, the aggregate cost of investments, gross unrealized appreciation/(depreciation) and net unrealized appreciation for Federal tax purposes were as follows:
| | | | | | | | | | | | | | | | | | | | |
| | | Gross Appreciation
(excess of value over tax
cost) | | | Gross Depreciation
(excess of tax cost over
value) | | | Net Appreciation/
(Depreciation) of
Derivatives | | | Net Unrealized
Appreciation | | | Cost of Investments for
Income Tax Purposes | |
Redmont Resolute Fund I | | $ | 238,409 | | | $ | (16,473 | ) | | $ | (6,525 | ) | | $ | 215,411 | | | $ | 3,697,874 | |
Redmont Resolute Fund II | | | 35,914,662 | | | | (1,317,905 | ) | | | (1,043,542 | ) | | | 33,553,215 | | | | 513,099,565 | |
Components of Earnings: As of April 30, 2014, components of distributable earnings were as follows:
| | | | | | | | | | | | | | | | |
| | | Accumulated Capital
Gain/(Loss)
Undistributed | | | Ordinary Income
Undistributed | | | Net Unrealized
Appreciation | | | Other Cumulative
Effect of Timing
Differences | |
Redmont Resolute Fund I | | $ | 6,388 | | | $ | – | | | $ | 215,411 | | | $ | (30,902 | ) |
Redmont Resolute Fund II | | | (1,692,981 | ) | | | – | | | | 33,553,215 | | | | (954,770 | ) |
As of April 30, 2014, the Redmont Resolute Fund I and the Redmont Resolute Fund II elected to defer to the period ending April 30, 2015, capital losses recognized during the period November 1, 2013 to April 30, 2014 in the amounts of $6,934 and $1,692,981, respectively.
As of April 30, 2014, the Redmont Resolute Fund I and the Redmont Resolute Fund II elected to defer to the year ending April 30, 2015, late year ordinary losses in the amount of $23,968 and $954,770, respectively.
Capital Losses: As of April 30, 2014, the Funds have no accumulated capital loss carryforwards.
| | |
Annual Report | April 30, 2014 | | 47 |
| | |
| Redmont Funds | | Notes to Financial Statements |
| | April 30, 2014 |
Tax Basis of Distributions to Shareholders: The character of distributions made during the year from net investment income or net realized gains may differ from its ultimate characterization for federal income tax purposes. Also, due to the timing of dividend distributions, the fiscal year in which amounts are distributed may differ from the fiscal year in which the income or realized gain were recorded by the Funds.
The tax character of distributions paid by the Funds for the fiscal year ended April 30, 2014, were as follows:
| | | | | | | | |
| | | Ordinary Income | | | Long-Term Capital Gains | |
Redmont Resolute Fund I | | $ | 24,591 | | | $ | 11,558 | |
Redmont Resolute Fund II | | | 8,831,574 | | | | 2,442,467 | |
The tax character of distributions paid by the Funds for the fiscal year ended April 30, 2013, were as follows:
| | | | | | | | | | | | |
| | | Ordinary Income | | | Long-Term Capital Gains | |
Redmont Resolute Fund I | | $ | | | | | 7,652 | | | | N/A | |
Redmont Resolute Fund II | | | 2,358,905 | | | | N/A | |
5. SECURITIES TRANSACTIONS
Purchases and sales of securities, excluding short-term securities during the year ended April 30, 2014 were as follows:
| | | | | | | | |
| Fund | | Purchases of Securities | | | Proceeds From Sales of Securities | |
Redmont Resolute Fund I | | $ | 3,167,589 | | | $ | 3,082,749 | |
Redmont Resolute Fund II | | | 626,943,266 | | | | 600,036,852 | |
6. BENEFICIAL SHARE TRANSACTIONS
The capitalization of the Trust consists of an unlimited number of shares of beneficial interest with no par value per share. Holders of the shares of the Funds of the Trust have one vote for each share held and a proportionate fraction of a vote for each fractional share. All shares issued and outstanding are fully paid and are non-assessable, transferable and redeemable at the option of the shareholder. Shares have no pre-emptive rights.
| | |
| Redmont Funds | | Notes to Financial Statements |
| | April 30, 2014 |
Transactions in common shares were as follows:
Redmont Resolute Fund I
| | | | | | | | |
| Class A: | | For the
Year Ended
April 30, 2014 | | | For the
Year Ended
April 30, 2013 | |
Common Shares Outstanding - Beginning of Period | | | 2,016 | | | | 101 | |
Common Shares Sold | | | 7,751 | | | | 14,144 | |
Common Shares Issued as Reinvestment of Dividends | | | 27 | | | | 27 | |
Common Shares Redeemed | | | – | | | | (12,256) | |
Common Shares Outstanding - End of Period | | | 9,794 | | | | 2,016 | |
| | |
| |
| | | | | | | | |
| Class I: | | For the
Year Ended
April 30, 2014 | | | For the
Year Ended
April 30, 2013 | |
Common Shares Outstanding - Beginning of Period | | | 299,893 | | | | 93,449 | |
Common Shares Sold | | | 101,486 | | | | 233,443 | |
Common Shares Issued as Reinvestment of Dividends | | | 3,354 | | | | 724 | |
Common Shares Redeemed | | | (17,006) | | | | (27,723) | |
Common Shares Outstanding - End of Period | | | 387,727 | | | | 299,893 | |
| | |
| | | | | | | | |
| Redmont Resolute Fund II | | | | | | |
| Class I: | | For the
Year Ended
April 30, 2014 | | | For the
Year Ended
April 30, 2013 | |
Common Shares Outstanding - Beginning of Period | | | 40,383,121 | | | | 7,591,661 | |
Common Shares Sold | | | 25,080,731 | | | | 33,012,452 | |
Common Shares Issued as Reinvestment of Dividends | | | 1,013,390 | | | | 225,485 | |
Common Shares Redeemed | | | (12,343,144) | | | | (446,477) | |
Common Shares Outstanding - End of Period | | | 54,134,098 | | | | 40,383,121 | |
| | |
Shares redeemed within 30 days of purchase may incur a 2% short-term redemption fee deducted from the redemption amount. Redemption fees are reflected in the “Shares redeemed, net of redemption fees” in the Statements of Changes in Net Assets. For the year ended April 30, 2014 and the year ended April 30, 2013, the Funds retained fees as follows:
| | | | | | |
| Fund | | For the year ended April 30, 2014 | | For the year ended April 30, 2013 | |
Redmont Resolute Fund I | | $- | | | $51 | |
Redmont Resolute Fund II | | - | | | - | |
7. MANAGEMENT AND RELATED PARTY TRANSACTIONS
Investment Advisory
Highland Associates, Inc. (“Highland” or the Adviser”), subject to the authority of the Board, is responsible for the overall management and administration of the Funds’ business affairs. Pursuant to the Investment Advisory Agreement (the “Advisory Agreement”), the Adviser is entitled to an investment advisory fee, computed daily and payable monthly of 1.50% of the average daily net assets for each Fund. Prior to December 5, 2012, the Adviser was entitled to an investment advisory fee, computed daily and payable monthly of 0.50% of the average daily net assets for each Fund.
As of April 1, 2013 the Adviser adopted an Investment Sub-Advisory Agreement (the “Sub-Advisory Agreement”) with Robeco Investment Management, Inc. (the “Sub-Adviser”) in accordance with the Funds’ investment objective, policies and limitations and investment guidelines established jointly by the Adviser and the Board. The Adviser determines the allocation of each Fund’s assets among the Sub-Adviser and Underlying Funds. The Funds are not required to invest with any minimum number of sub-advisers or Underlying Funds, and do not have minimum or maximum limitations with respect to allocations of assets to any Sub-Adviser, investment strategy or market sector. Highland may change the allocation of each of the Fund’s assets among the available investment options, and may add or remove sub-advisers, at any time. The Sub-Adviser
| | |
Annual Report | April 30, 2014 | | 49 |
| | |
| Redmont Funds | | Notes to Financial Statements |
| | April 30, 2014 |
is responsible for the day-to-day management of its allocated portion of Fund assets. Highland has ultimate responsibility, subject to the oversight of the Board of the Funds, to oversee the Sub-Adviser, and to recommend their hiring, termination and replacement.
Pursuant to the Sub-Advisory Agreement, the Adviser pays the Sub-Adviser an annual sub-advisory management fee which is based on each Fund’s average quarterly market value of the assets managed by the Sub-Adviser. The Adviser is required to pay all fees due to the Sub-Adviser out of the management fee the Adviser receives from each Fund. The following table reflects the Funds’ contractual sub-advisory fee rates.
| | | | |
| Sub-Adviser | | Average Daily
Market Value of the Fund | | Contractual
Sub-Advisory Fee |
| | First $50 Million | | 1.25% |
Robeco Investment Management, Inc. | | Over $50 Million | | 1.00% |
Effective September 1, 2013, the Adviser has agreed, with respect to Redmont Resolute Fund I’s Class A and Class I shares, to contractually to waive the portion of its 1.50% Management Fee in excess of the sum of 0.50% plus any sub-advisory fees paid by the Adviser to the Sub-Advisor, and/or reimburse the Fund (or class, as applicable) by the amount of such excess. In addition, after giving effect to the foregoing fee waiver and/or expense reimbursement, the Adviser has contractually agreed to limit the amount of the Fund’s total annual expenses (exclusive of Distribution and Service (12b-1) Fees, Shareholder Services Fees, swap fees and expenses, acquired fund fees and expenses, Sub-Advisory Fees, brokerage expenses, interest expense, taxes and extraordinary expenses) to 1.40% of the average daily net assets. The agreement is in effect through August 31, 2017. Pursuant to this agreement, the Fund will reimburse the Adviser for any fee waivers and expense reimbursements made by the Adviser, provided that any such reimbursements made by the Fund to the Adviser will not cause the Fund’s expense limitation to exceed expense limitations in existence at the time the expense was incurred, or at the time of the reimbursement, whichever is lower, and the reimbursement is made within three years after the expenses were incurred.
Prior to September 1, 2013, the Adviser had contractually agreed to limit the amount of the Redmont Resolute Fund I’s total annual expenses (exclusive of Distribution and Service (12b-1) Fees, Shareholder Services Fees, acquired fund fees and expenses, Sub-Advisory Fees, brokerage expenses, interest expense, taxes and extraordinary expenses) to 1.90% of the average daily net assets.
For the year ended April 30, 2014, the fee waivers and/or reimbursements were as follows:
| | | | |
| Fund | | Fees Waived/Reimbursed By Adviser | | Recoupment of Previously
Waived Fees by Adviser |
Redmont Resolute Fund I – Class A | | $ 1,102 | | $ - |
Redmont Resolute Fund I – Class I | | $ 116,869 | | $ - |
As of April 30, 2014, the balances of recoupable expenses for each Fund were as follows:
| | | | | | | | | | | | | | | | |
| Fund | | Expires 2017 | | | Expires 2016 | | | Expires 2015 | | | Total | |
Redmont Resolute Fund I – Class A | | $ | 801 | | | $ | 2,377 | | | $ | 2,270 | | | $ | 5,448 | |
Redmont Resolute Fund I – Class I | | | 83,109 | | | | 61,265 | | | | 30,963 | | | | 175,337 | |
The Adviser has agreed, with respect to the Redmont Resolute Fund II Class I shares, to waive the portion of its 1.50% Management Fee in excess of any sub-advisory fees paid by the Adviser to Sub-Advisor. This agreement is in effect through August 31, 2017. Prior to December 5, 2012, the Adviser had agreed contractually to waive the total amount of Redmont Resolute Fund II’s 0.50% management fees.
Fund Accounting Fees and Expenses
ALPS Fund Services, Inc. (“ALPS” and the “Administrator”) (an affiliate of ALPS Distributors, Inc.) provides administrative, fund accounting and other services to the Funds under the Administration, Bookkeeping and Pricing Services Agreement with the Trust. Prior to the April 1, 2013 initiation of the Sub-Advisory Agreement, ALPS was paid fees, accrued on a daily basis and billed on a monthly basis in total and allocated to each Fund, based on the greater of (a) an annual total fee for both Funds of $200,000 from the first to the last, or projected last, day of the then current year of service under the Agreement; or (b) following basis point fee schedule:
| | |
| Average Total Net Assets | | Contractual Fee |
Between $0-$500M | | 0.05% |
$500M-$1B | | 0.03% |
Above $1B | | 0.02% |
| | |
| Redmont Funds | | Notes to Financial Statements |
| | April 30, 2014 |
The minimum annual total fee of $200,000 was increased to $234,000 with the initiation of the Sub-Advisory Agreement on April 1, 2013.
The Administrator is also reimbursed by the Funds for certain out-of-pocket expenses.
Transfer Agent
ALPS serves as transfer, dividend paying and shareholder servicing agent for the Funds. ALPS receives an annual minimum fee, a fee based upon the number of shareholder accounts, and is also reimbursed by the Funds for certain out-of-pocket expenses.
Compliance Services
ALPS provides services that assist the Trust’s Chief Compliance Officer in monitoring and testing the policies and procedures of the Trust in conjunction with requirements under Rule 38a-1 under the 1940 Act and receives an annual base fee. ALPS is reimbursed for certain out-of-pocket expenses by the Funds.
Principal Financial Officer
ALPS receives an annual fee for providing principal financial officer services to the Funds.
Distributor
ALPS Distributors, Inc. (“ADI” or the “Distributor”) (an affiliate of ALPS) acts as the distributor of the Funds’ shares pursuant to a Distribution Agreement with the Trust. Shares are sold on a continuous basis by ADI as agent for the Funds, and ADI has agreed to use its best efforts to solicit orders for the sale of Funds’ shares, although it is not obliged to sell any particular amount of shares. ADI is not entitled to any compensation for its services as Distributor. ADI is registered as a broker-dealer with the Securities and Exchange Commission.
The Redmont Resolute Fund I has adopted a Distribution and Services Plan (the “Plan”) pursuant to Rule 12b-1 of the 1940 Act for Class A shares. The Plan allows the Fund to use Class A assets to pay fees in connection with the distribution and marketing of Class A shares and/or the provision of shareholder services to Class A shareholders. The Plan permits payment for services in connection with the administration of plans or programs that use Class A shares of the Fund, if any, as their funding medium and for related expenses. The Plan permits the Fund to make total payments at an annual rate of up to 0.25% of the Fund’s average daily net assets attributable to its Class A shares. Because these fees are paid out of the Fund’s Class A assets, if any, on an ongoing basis, over time they will increase the cost of an investment in Class A shares, if any, and Plan fees may cost an investor more than other types of sales charges.
The Redmont Resolute Fund I has adopted a shareholder services plan (“Shareholder Services Plan”) for Class A shares. Under the Shareholder Services Plan the Fund is authorized to pay banks and their affiliates and other institutions, including broker-dealers and Fund affiliates (“Participating Organizations”), an aggregate fee in an amount not to exceed on an annual basis 0.15% for Class A shares of the average daily net asset value of the Class A shares, respectively, attributable to or held in the name of a Participating Organization for its clients as compensation for providing shareholder service activities, which do not include distribution services, pursuant to an agreement with a Participating Organization. Shareholder Services plan fees are included with distribution and service fees on the Statement of Operations.
8. INDEMNIFICATIONS
Under the Trust’s organizational documents, its officers and Trustees are indemnified against certain liability arising out of the performance of their duties to the Trust. Additionally, in the normal course of business, the Trust enters into contracts with service providers that may contain general indemnification clauses which may permit indemnification to the extent permissible under applicable law. The Trust’s maximum exposure under these arrangements is unknown, as this would involve future claims that may be made against the Trust that have not yet occurred.
9. NEW ACCOUNTING PRONOUNCEMENTS
In June 2013, the Financial Accounting Standards Board (the “FASB”) issued Accounting Standards Update (“ASU”) No. 2013-08, Financial Services-Investment Companies (Topic 946): Amendments to the Scope, Measurement, and Disclosure Requirements. The FASB standard identifies characteristics a company must assess to determine whether it is considered an investment company for financial reporting purposes. This ASU is effective for fiscal years beginning after December 15, 2013. The Funds believe the adoption of this ASU will not have a material impact on their financial statements.
| | |
Annual Report | April 30, 2014 | | 51 |
| | |
| Redmont Funds | | Report of Independent Registered Public Accounting Firm |
| | April 30, 2014 |
To the Shareholders and Board of Trustees of Financial Investors Trust:
We have audited the accompanying statements of assets and liabilities, including the schedules of investments, of Redmont Resolute Fund I and Redmont Resolute Fund II (the “Funds”), two of the portfolios constituting Financial Investors Trust, as of April 30, 2014, and the related statements of operations for the year then ended, the statements of changes in net assets for each of the two years in the period then ended, and the financial highlights for each of the two years in the period then ended and for the period from December 30, 2011 (inception) to April 30, 2012. These financial statements and financial highlights are the responsibility of the Funds’ management. Our responsibility is to express an opinion on these financial statements and financial highlights based on our audits.
We conducted our audits in accordance with the standards of the Public Company Accounting Oversight Board (United States). Those standards require that we plan and perform the audit to obtain reasonable assurance about whether the financial statements and financial highlights are free of material misstatement. The Funds are not required to have, nor were we engaged to perform, an audit of their internal control over financial reporting. Our audits included consideration of internal control over financial reporting as a basis for designing audit procedures that are appropriate in the circumstances, but not for the purpose of expressing an opinion on the effectiveness of the Funds’ internal control over financial reporting. Accordingly, we express no such opinion. An audit also includes examining, on a test basis, evidence supporting the amounts and disclosures in the financial statements, assessing the accounting principles used and significant estimates made by management, as well as evaluating the overall financial statement presentation. Our procedures included confirmation of securities owned as of April 30, 2014, by correspondence with the custodian and brokers, where replies were not received from brokers, we performed other auditing procedures. We believe that our audits provide a reasonable basis for our opinion. We believe that our audits provide a reasonable basis for our opinion.
In our opinion, the financial statements and financial highlights referred to above present fairly, in all material respects, the financial position of Redmont Resolute Fund I and Redmont Resolute Fund II of Financial Investors Trust as of April 30, 2014, the results of their operations for the year then ended, and the changes in their net assets for each of the two years in the period then ended, and the financial highlights for each of the two years in the period then ended and for the period from December 30, 2011 (inception) to April 30, 2012, in conformity with accounting principles generally accepted in the United States of America.
DELOITTE & TOUCHE LLP
Denver, Colorado
June 26, 2014
| | |
| Redmont Funds | | Disclosure Regarding Approval of Fund Advisory Agreements |
| | April 30, 2014 (Unaudited) |
REDMONT RESOLUTE FUND I AND REDMONT RESOLUTE FUND II
On December 10, 2013, the Trustees met in person to discuss, among other things, the approval of the investment advisory agreement between the Trust and Highland Associates, Inc. (“Highland”) (the “Investment Advisory Agreement”), in accordance with Section 15(c) of the 1940 Act. The Independent Trustees met with independent legal counsel during executive session and discussed the Investment Advisory Agreement and other related materials.
In renewing and approving the Investment Advisory Agreement with Highland, the Trustees, including the Independent Trustees, considered the following factors with respect to the Redmont Resolute Fund I and Redmont Resolute Fund II (the “Redmont Funds”):
Investment Advisory Fee Rate: The Trustees reviewed and considered the contractual annual advisory fee to be paid by the Trust, on behalf of the Redmont Funds, to Highland of 1.50% of each of the Redmont Funds’ daily average net assets, in light of the extent and quality of the advisory services to be provided by Highland to the Redmont Funds.
The Trustees considered the information they received comparing the Redmont Funds contractual annual advisory fee and overall net expenses with those of funds in both the relevant expense peer group provided by an independent provider of investment company data.
Based on such information, the Trustees determined that the contractual annual advisory fee of 1.50% of the daily average net assets of each of the Redmont Funds and the total net expense ratio of 1.90% for Class I Shares of Redmont Fund I and 2.30% for Class A Shares of Redmont Fund I, although generally higher than each respective peer group median, were reasonable in light of the generally favorable recent performance of each share class of Redmont Fund I compared with their respective peer groups. The Trustees also determined that the annual advisory fee of 1.50%, which was currently waived by Highland in its entirety, and total net expense ratio of 0.22%, for Redmont Fund II, was significantly lower than the Fund’s peer group median.
Nature, Extent and Quality of the Services under the Advisory Agreement: The Trustees received and considered information regarding the nature, extent and quality of services provided to the Redmont Funds under the Advisory Agreement. The Trustees reviewed certain background materials supplied by Highland in its presentation, including its Form ADV, financial statements and Compliance Policies and Procedures.
The Trustees reviewed and considered Highland’s investment advisory personnel, its history as an asset manager, its performance and the amount of assets currently under management by Highland. The Trustees also reviewed the research and decision-making processes utilized by Highland, including the methods adopted to seek to achieve compliance with the investment objectives, policies and restrictions of the Redmont Funds.
The Trustees considered the background and experience of Highland’s management in connection with the Redmont Funds, including reviewing the qualifications, backgrounds and responsibilities of the management team primarily responsible for the day-to-day portfolio management of the Redmont Funds and the extent of the resources devoted to research and analysis of actual and potential investments.
The Trustees also reviewed the accompanying Compliance-related materials and further noted that they have received reports on these services and Compliance issues at each regular Board meeting throughout the year related to the services rendered by Highland and the Redmont Fund’s sub-advisers with respect to the Redmont Funds.
Performance: The Trustees reviewed performance information for each Redmont Fund for the three-month and 1-year periods ended September 30, 2013. That review included a comparison of each Redmont Fund’s performance to the performance of a universe of comparable funds selected by an independent provider of investment company data. The Trustees noted the generally favorable performance of the each Redmont Fund compared against funds identified by an independent provider of investment company data.
The Adviser’s Profitability: The Trustees received a profitability analysis prepared by Highland based on the fees payable under the Investment Advisory Agreement. Although not currently profitable to Highland, the Trustees noted Highland’s stated ongoing commitment to the Redmont Funds. The Board then reviewed Highland’s financial statements in order to analyze the financial condition and stability and profitability of Highland.
Economies of Scale: The Trustees considered whether economies of scale in the provision of services to the Redmont Funds will be passed along to the shareholders under the proposed agreement, and noted that economies primarily resulted from the fact that each Redmont Fund was managed with the same investment strategies and policies.
Other Benefits to the Adviser: The Trustees reviewed and considered any other benefits derived or to be derived by Highland from its relationship with the Redmont Funds, including the fact that Highland did not use soft dollars in connection with either Fund.
| | |
Annual Report | April 30, 2014 | | 53 |
| | |
| Redmont Funds | | Disclosure Regarding Approval of Fund Advisory Agreements |
| | April 30, 2014 (Unaudited) |
The Board summarized its deliberations with respect to the Investment Advisory Agreement with Highland. In selecting Highland and approving the investment advisory agreement and fees under such agreement, the Trustees concluded that no single factor reviewed by the Trustees was identified by the Trustees to be determinative as the principal factor in whether to approve the investment advisory agreement. Further, the Independent Trustees were advised by separate independent legal counsel throughout the process. The Trustees, including all of the Independent Trustees, concluded that:
| | • | | the investment advisory fees to be received by Highland with respect to the Redmont Funds were, although higher than applicable peer group medians, within an acceptable range of the median when considered in light of Highland’s agreement to waive fees and/or reimburse total fund expenses with respect to Redmont Fund I, and Highland’s agreement to waive its advisory fee altogether in connection with Redmont Fund II, and in light of each Redmont Fund’s performance relative to its peer group; |
| | • | | the nature, extent and quality of services rendered by Highland under the Investment Advisory Agreement were adequate; |
| | • | | the performance of the Redmont Funds was generally favorable compared with the performance of the funds in the applicable peer universe provided by an independent provider of investment company data; |
| | • | | the profit, if any, anticipated to be realized by Highland in connection with the operation of the Redmont Funds is fair to the Trust, and its commitment to the Redmont Funds despite any losses; and |
| | • | | to the extent there were any material economies of scale or other benefits accruing to Highland in connection with its relationship with the Redmont Funds, their benefits had been substantially passed through to shareholders. |
Based on the Trustees’ deliberations and their evaluation of the information described above, the Trustees, including all of the Independent Trustees, concluded that Highland’s compensation for investment advisory services is consistent with the best interests of the Redmont Funds and their shareholders.
| | |
| Redmont Funds | | Additional Information |
| | April 30, 2014 (Unaudited) |
1. FUND HOLDINGS
The Funds file their complete schedule of portfolio holdings with the Securities and Exchange Commission (the “SEC”) for the first and third quarters of each fiscal year on Form N-Q within 60 days after the end of the period. Copies of the Funds’ Form N-Q are available without charge on the SEC website at http://www.sec.gov. You may also review and copy the Form N-Q at the SEC’s Public Reference Room in Washington, D.C. For more information about the operation of the Public Reference Room, please call the SEC at 1-800-SEC-0330.
2. FUND PROXY VOTING POLICIES, PROCEDURES AND SUMMARIES
Fund policies and procedures used in determining how to vote proxies and information regarding how each of the Funds voted proxies relating to portfolio securities during the most recent prior 12-month period ending June 30 are available without charge, (1) upon request, by calling (toll-free) (866) 759-5679 and (2) on the SEC’s website at http://www.sec.gov.
3. TAX DESIGNATIONS
The Fund designates the following for federal income tax purposes for distributions made during the calendar year ended December 31, 2013:
| | | | |
| | | QDI | | DRD |
Redmont Resolute Fund I | | 56.14% | | 11.52% |
Redmont Resolute Fund II | | 20.54% | | 4.84% |
In early 2014, if applicable, shareholders of record received this information for the distribution paid to them by the Fund during the calendar year 2013 via Form 1099. The Fund will notify shareholders in early 2015 of amounts paid to them by the Funds, if any, during the calendar year 2014.
Pursuant to Section 852(b)(3) of the Internal Revenue Code, Redmont Resolute I designates $11,558 and Redmont Resolute II designates 2,442,467 as long-term capital gain distributions.
Please consult a tax advisor if you have questions about federal or state income tax laws, or how to prepare your tax returns.
| | |
Annual Report | April 30, 2014 | | 55 |
| | |
| Redmont Funds | | Trustees and Officers |
| | April 30, 2014 (Unaudited) |
Additional information regarding the Fund’s trustees is included in the Statement of Additional Information, which can be obtained without charge by calling 866-759-5679.
INDEPENDENT TRUSTEES
| | | | | | | | | | | | | | |
Name,
Address* & Year of Birth | | Position(s) Held with
Fund | | | Term of Office
and Length of
Time Served** | | Principal Occupation(s) During Past 5 Years*** | | Number of
Funds in
Fund
Complex
Overseen by
Trustee**** | | | Other
Directorships
Held by
Trustee |
Mary K. Anstine, 1940 | | | Trustee | | | Ms. Anstine was elected at a special meeting of shareholders held on March 21, 1997 and re-elected at a special meeting of shareholders held on August 7, 2009. | | Ms. Anstine was President/Chief Executive Officer of HealthONE Alliance, Denver, Colorado, and former Executive Vice President of First Interstate Bank of Denver. Ms. Anstine is also Trustee/Director of AV Hunter Trust and Colorado Uplift Board. Ms. Anstine was formerly a Director of the Trust Bank of Colorado (later purchased and now known as Northern Trust Bank), HealthONE and Denver Area Council of the Boy Scouts of America, and a member of the American Bankers Association Trust Executive Committee. | | | 30 | | | Ms. Anstine is a Trustee of ALPS ETF Trust (21 funds); ALPS Variable Investment Trust (8 funds); Reaves Utility Income Fund (1 fund); and Westcore Trust (12 funds). |
John R. Moran, Jr., 1930 | | | Trustee | | | Mr. Moran was elected at a special meeting of shareholders held on March 21, 1997 and re-elected at a special meeting of shareholders held on August 7, 2009. | | Mr. Moran is formerly President and CEO of The Colorado Trust, a private foundation serving the health and hospital community in the state of Colorado Currently, Mr. Moran is a member of the Treasurer’s Investment Advisory Committee for the University of Colorado. | | | 30 | | | None. |
Jeremy W. Deems, 1976 | | | Trustee | | | Mr. Deems was appointed as a Trustee at the March 11, 2008 meeting of the Board of Trustees and elected at a special meeting of shareholders held on August 7, 2009. | | Mr. Deems is the Co-Founder, Chief Operations Officer and Chief Financial Officer of Green Alpha Advisors, LLC. Mr. Deems is Co-Portfolio Manager of the Shelton Green Alpha Fund. Prior to joining Green Alpha Advisors, Mr. Deems was CFO and Treasurer of Forward Management, LLC, ReFlow Management Co., LLC, ReFlow Fund, LLC, a private investment fund, and Sutton Place Management, LLC, an administrative services company, from 2004 to June 2007. | | | 30 | | | Mr. Deems is a Trustee of ALPS ETF Trust (21 funds); ALPS Variable Investment Trust (8 funds) and Reaves Utility Income Fund (1 fund). |
Jerry G. Rutledge, 1944 | | | Trustee | | | Mr. Rutledge was elected at a special meeting of shareholders held on August 7, 2009. | | Mr. Rutledge is the President and owner of Rutledge’s Inc., a retail clothing business. He was from 1994 to 2007 a Regent of the University of Colorado. | | | 30 | | | Mr. Rutledge is a Trustee of Principal Real Estate Income Fund (1 fund), Clough Global Allocation Fund (1 fund), Clough Global Equity Fund (1 fund) and Clough Global Opportunities Fund (1 fund). |
Michael “Ross” Shell, 1970 | | | Trustee | | | Mr. Shell was elected at a special meeting of shareholders held on August 7, 2009. | | Mr. Shell is Founder and CEO of Red Idea, LLC, a strategic consulting/early stage venture firm (since June 2008). From 1999 to 2009, he was a part-owner and Director of Tesser, Inc., a brand agency. From December 2005 to May 2008, he was Director, Marketing and Investor Relations, of Woodbourne, a REIT/real estate hedge fund and private equity firm. Prior to this, from May 2004 to November 2005, he worked as a business strategy consultant; from June 2003 to April 2004, he was on the Global Client Services team of IDEO, a product design/innovation firm; and from 1999 to 2003, he was President of Tesser, Inc. Mr. Shell graduated with honors from Stanford University with a degree in Political Science. | | | 30 | | | None. |
| | |
| Redmont Funds | | Trustees and Officers |
| | April 30, 2014 (Unaudited) |
INTERESTED TRUSTEE
| | | | | | | | | | | | |
Name,
Address* & Year of Birth | | Position(s)
Held with
Fund | | Term of Office
and Length of
Time Served** | | Principal Occupation(s) During Past 5 Years*** | | Number of
Funds in
Fund
Complex
Overseen by
Trustee**** | | | Other Directorships
Held by Trustee |
Edmund J. Burke, 1961 | | Trustee,
Chairman
and
President | | Mr. Burke was elected as Chairman at the August 28, 2009 meeting of the Board of Trustees. Mr. Burke was elected as Trustee at a special meeting of shareholders held on August 7, 2009. Mr. Burke was elected President of the Trust at the December 17, 2002 meeting of the Board of Trustees. | | Mr. Burke is President and a Director of ALPS Holdings, Inc. (“AHI”) (since 2005) and Director of Boston Financial Data Services, Inc. (“BFDS”), ALPS Advisors, Inc. (“AAI”), ALPS Distributors, Inc. (“ADI”), ALPS Fund Services, Inc. (“AFS”) and ALPS Portfolio Solutions Distributor, Inc. (“APSD”) and from 2001-2008, was President of AAI, ADI, AFS and APSD. Because of his positions with AHI, BFDS, AAI, ADI, AFS and APSD, Mr. Burke is deemed an affiliate of the Trust as defined under the 1940 Act. Mr. Burke is Trustee and President of the Clough Global Allocation Fund (Trustee since 2006; President since 2004); Trustee and President of the Clough Global Equity Fund (Trustee since 2006; President since 2005); Trustee and President of the Clough Global Opportunities Fund (since 2006); Trustee of the Liberty All-Star Equity Fund; and Director of the Liberty All-Star Growth Fund, Inc. | | | 30 | | | Mr. Burke is a Trustee of Clough Global Allocation Fund (1 fund); Clough Global Equity Fund (1 fund); Clough Global Opportunities Fund (1 fund); Trustee of the Liberty All-Star Equity Fund (1 fund); and Director of the Liberty All-Star Growth Fund, Inc. (1 fund). |
OFFICERS
| | | | | | |
Name,
Address* & Year of Birth | | Position(s)
Held with
Fund | | Term of Office
And Length of
Time Served** | | Principal Occupation(s) During Past 5 Years*** |
Kimberly R. Storms, 1972 | | Treasurer | | Ms. Storms was elected Treasurer of the Trust at the March 12, 2013 meeting of the Board of Trustees. | | Ms. Storms is Senior Vice President - Director of Fund Administration of ALPS. Ms. Storms joined ALPS in 1998 as Assistant Controller. Because of her position with ALPS, Ms. Storms is deemed an affiliate of the Trust as defined under the 1940 Act. Ms. Storms is also Treasurer of BPV Family of Funds and ALPS Series Trust; Assistant Treasurer of Liberty All-Star Equity Fund and Liberty All-Star Growth Fund, Inc.; Assistant Treasurer of Tilson Funds; and Chief Financial Officer of The Arbitrage Funds. |
David T. Buhler, 1971 | | Secretary | | Mr. Buhler was elected Secretary of the Trust at the September 11, 2012 meeting of the Board of Trustees. | | Mr. Buhler joined ALPS in June 2010. He is currently Vice President and Senior Associate Counsel of ALPS, AAI, ADI and APSD. Prior to joining ALPS, Mr. Buhler served as Associate General Counsel and Assistant Secretary of Founders Asset Management LLC from 2006 to 2009. Because of his position with ALPS, Mr. Buhler is deemed an affiliate of the Trust as defined under the 1940 Act. Mr. Buhler is also the Secretary ALPS Variable Investment Trust and Westcore Trust. |
Ted Uhl, 1974 | | Chief
Compliance
Officer
(“CCO”) | | Mr. Uhl was appointed CCO of the Trust at the June 8, 2010 meeting of the Board of Trustees. | | Mr. Uhl joined ALPS in October 2006, and is currently Deputy Compliance Officer of ALPS. Prior to his current role, Mr. Uhl served as Senior Risk Manager for ALPS from October 2006 until June 2010. Before joining ALPS, Mr. Uhl served a Sr. Analyst with Enenbach and Associates (RIA), and a Sr. Financial Analyst at Sprint. Because of his position with ALPS, Mr. Uhl is deemed an affiliate of the Trust as defined under the 1940 Act. Mr. Uhl is also CCO of the Clough Global Funds, Reaves Utility Income Fund, Drexel Hamilton Funds and Transparent Value Trust. |
| * | All communications to Trustees and Officers may be directed to Financial Investors Trust c/o 1290 Broadway, Suite 1100, Denver, CO 80203. |
| ** | This is the period for which the Trustee or Officer began serving the Trust. Each Trustee and/or Officer serves an indefinite term, until his successor is elected. |
| *** | Except as otherwise indicated, each individual has held the office shown or other offices in the same company for the last five years. |
| **** | The Fund Complex includes all series of the Trust (currently 30) and any other investment companies for which any Trustee serves as Trustee for and which Highland Associates, Inc.,. Turner Investments, L.P. and Robeco Investment Management, Inc. provides investment advisory services (currently 0, 0, and 0). |
| | |
Annual Report | April 30, 2014 | | 57 |

| | |
| The Disciplined Growth Investors Fund | | Shareholder Letter |
| | April 30, 2014 (Unaudited) |
April 30, 2014
Dear Shareholders,
Late in 2013 we published a piece entitled “You Gotta Know When to Hold ‘Em”. The piece was far longer than our normal efforts and reflects our view that the investment environment has entered a new and important era. We hope you will read it. The piece can be found on our website.1
The year of 2013 resembled a magic carpet ride, as the stock market rose steadily with no corrections of any significance. History and prudence suggests that 2014 will be a more challenging year.
A little bit of history should give us some guidance about 2014 and beyond. At the end of 2008, we published a piece about the prevailing valuations of stocks during that time. Our conclusion, based on our internal forecasts and research, is that the equity portion of your mutual fund would likely generate unusually high returns over our forecast time horizon. In the five years since then, equity indices have shown historically high returns. The DGI Fund benefitted from our equity returns for the last two-and-a-half years of this period (the Fund’s inception was August 12, 2011). From inception through April 30, 2014, the Fund compounded annually at 17.17%.
Even after the strong one-year performance of 15.02% through April 30, 2014, the equity portion of your mutual fund portfolio was priced to yield a return in excess of our hurdle rate2 of 12% over the next seven years. The bond portion of your mutual fund portfolio was priced to yield a return of 2-4% over the next seven years.
Whether the equity portion of the DGI Fund will achieve the hurdle rate in 2014 is anybody’s guess. Many major macroeconomic and political imbalances remain in force. This list includes but is not limited to:
| | 1. | The Federal Reserve Bank has radically changed its balance sheet. Investors do not know how the new and extreme leverage will affect future Fed operations. Also, the Fed faces a threat from Bitcoin or other peer-to-peer payments (“virtual currencies”). |
| | 2. | The U.S. Government faces another fiscal cliff-hanger this year. |
| 1 | The article can be located at: |
| | http://dginv.com/documents/52dd55d42644f/KNOW_WHEN_TO_HOLD_EM_FINAL.pdf and is not associated with the DGI Fund Website. |
| 2 | Disciplined Growth Investors uses a forward-looking “hurdle rate” as a qualification for any stock’s purchase into a portfolio. For The DGI Fund, before we make an initial purchase of a stock or an additional purchase, that stock must show at minimum a 12% annual return over the next seven years, based on our internal modeling and research. Stocks already in the portfolio showing less than a 12% return are not automatically sold, but we will not add to such positions. |
| | |
Annual Report | April 30, 2014 | | 1 |
| | |
| The Disciplined Growth Investors Fund | | Shareholder Letter |
| | April 30, 2014 (Unaudited) |
| | 3. | China is showing signs of major economic issues; nearly all of them have negative implications for worldwide growth. Problems in China could significantly favor U.S. investments relative to other countries. |
| | 4. | There are more political hotspots around the world than I can remember, including Iran, North Korea, Syria, Iraq, Egypt, Turkey, China-Japan, the Ukraine and Israel-Palestine. |
| | 5. | Al Qaeda is resurgent in its new, decentralized network. |
| | 6. | The energy boom in the United States is likely to threaten the cash flow and the stability of the Mideast; many of the countries affected are listed in item number four. |
Each of the above issues has the potential to disrupt stock prices over the short term. When these issues fade, new ones will take their place. This means that the short-term outlook for the stock market is unclear. Our response to this lack of visibility is threefold:
| | 1. | We will monitor macroeconomic events as they occur. Our focus will be to evaluate whether any of the above issues (or any others) are likely to have a significant long-term effect on the underlying businesses of your portfolio holdings. |
| | 2. | We will continue to focus our efforts on the current portfolio holdings, seeking to ensure the companies are achieving their long-term goals and their stocks are well-priced. |
| | 3. | We will keep your portfolio balanced with a tilt to the asset class offering the superior long-term prospects, adjusted for risk. As of today we believe equities have a longer-term tailwind while bonds offer significantly lower expected long-term returns. Accordingly, we have invested your mutual fund portfolio to the maximum extent possible in equities. On the bond side, our goal is to carefully control maturity risk. |
The first quarter of calendar year 2014 suggests that this year will be more challenging than 2013. The DGI Fund achieved a modest first quarter gain. The stock market has become choppier in the early part of the second quarter. So the magic carpet ride is at least temporarily over but the cloudier investment environment may contain a silver lining for those who maintain a consistent investment discipline. A difficult market environment can open up significant investment opportunities. Even though we do not have clarity on when the stock market environment will improve, we are now seeing some nice opportunities beginning to emerge. We remain focused on investing in a reasonable number of those opportunities.
Thank you for your patience.
Fredrick K. Martin, CFA
Chief Investment Officer
Disciplined Growth Investors, Inc.
| | |
2 | | 1-855-DGI-FUND (344-3863) | www.DGIfund.com |
| | |
| The Disciplined Growth Investors Fund | | Shareholder Letter |
| | April 30, 2014 (Unaudited) |
The views and information discussed in this commentary are as of the date of publication, are subject to change, and may not reflect the writer’s current views. The views expressed represent an assessment of market conditions at a specific point in time, are opinions only and should not be relied upon as investment advice regarding a particular investment or markets in general. Such information does not constitute a recommendation to buy or sell specific securities or investment vehicles. It should not be assumed that any investment will be profitable or will equal the performance of the Fund or any securities or any sectors mentioned herein. The subject matter contained herein has been derived from several sources believed to be reliable and accurate at the time of compilation. Disciplined Growth Investors, Inc. does not accept any liability for losses either direct or consequential caused by the use of this information.
Fred Martin is a registered representative of ALPS Distributors, Inc.
ALPS Distributors, Inc. is the Distributor for The Disciplined Growth Investors Fund.
| | |
Annual Report | April 30, 2014 | | 3 |
| | |
| The Disciplined Growth Investors Fund | | Performance Update |
| | April 30, 2014 (Unaudited) |
Cumulative Total Return Performance (for the period ended April 30, 2014)
| | | | | | | | | | | | | | | | | | | | | | | | |
| | | 1 month | | | Quarter | | | 6 month | | | YTD | | | 1 Year | | | Since
Inception* | |
Disciplined Growth
Investors Fund | | | -1.57 | % | �� | | 2.22 | % | | | 5.26 | % | | | -0.82 | % | | | 15.02 | % | | | 17.17 | % |
S&P 500® Total Return Index(1) | | | 0.74 | % | | | 6.23 | % | | | 8.36 | % | | | 2.56 | % | | | 20.44 | % | | | 21.44 | % |
| * | Fund Inception date of August 12, 2011 |
| (1) | The S&P 500® Total Return Index is an unmanaged index of 500 common stocks chosen for market size, liquidity and industry group representation. It is a market-value weighted index. The index is not actively managed and does not reflect any deductions for fees, expenses or taxes. An investor may not invest directly in an index. |
The returns shown above do not reflect the deductions of taxes a shareholder would pay on Fund distributions or redemptions of Fund shares.
Returns less than one year are cumulative.
Performance data quoted represents past performance. Past performance does not guarantee future results. Investment return and principal value of an investment will fluctuate so that an investor’s shares, when sold or redeemed, may be worth more or less than the original cost. Current performance data may be higher or lower than actual data quoted. For the most current month-end performance data please call 1.855.DGI.FUND.
| | |
4 | | 1-855-DGI-FUND (344-3863) | www.DGIfund.com |
| | |
| The Disciplined Growth Investors Fund | | Performance Update |
| | April 30, 2014 (Unaudited) |
Growth of $10,000 Investment in the Fund (for the period ended April 30, 2014)
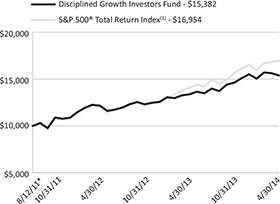
The chart represents historical performance of a hypothetical investment of $10,000 in the Fund since inception. Past performance does not guarantee future results. This chart does not reflect the deduction of taxes that a shareholder would pay on Fund distributions or the redemption of Fund shares.
Investing in the Fund is subject to investment risks, including possible loss of the principal amount invested.
Industry Sector Allocation
(as a % of Net Assets)*
| | | | | | | | |
| | | Technology | | | 25.33 | % | | |
| | | Consumer Discretionary | | | 19.63 | % | | |
| | | Producer Durables | | | 10.78 | % | | |
| | | Health Care | | | 7.14 | % | | |
| | | Financial Services | | | 2.12 | % | | |
| | | Industrials | | | 2.11 | % | | |
| | | Energy | | | 2.08 | % | | |
| | | Information Technology | | | 1.66 | % | | |
| | | Utilities | | | 1.20 | % | | |
| | | Asset/Mortgage Backed Securities | | | 0.19 | % | | |
| | | Corporate Bond | | | 22.89 | % | | |
| | | Foreign Government Bonds | | | 0.60 | % | | |
| | | Government & Agency Obligations | | | 0.17 | % | | |
| | | Other Assets in Excess of Liabilities | | | 4.10 | % | | |
* Holdings are subject to change. Tables present indicative values only.
Top Ten Holdings (as a % of Net Assets)*
| | | | | | | | |
| | | TJX Cos., Inc. | | | 4.61 | % | | |
| | | Intuit, Inc. | | | 3.56 | % | | |
| | | Middleby Corp. | | | 3.16 | % | | |
| | | Seagate Technology PLC | | | 3.03 | % | | |
| | | Open Text Corp. | | | 2.87 | % | | |
| | | Plexus Corp. | | | 2.74 | % | | |
| | | Edwards Lifesciences Corp. | | | 2.60 | % | | |
| | | Trimble Navigation Ltd. | | | 2.55 | % | | |
| | | Cabela’s, Inc. | | | 2.50 | % | | |
| | | L Brands, Inc. | | | 2.19 | % | | |
| | | Top Ten Holdings | | | 29.81 | % | | |
| | |
Annual Report | April 30, 2014 | | 5 |
| | |
| The Disciplined Growth Investors Fund | | Disclosure of Fund Expenses |
| | April 30, 2014 (Unaudited) |
As a shareholder of a Fund, you incur two types of costs: direct costs, such as short-term redemption fees and wire fees, balance fees, and indirect costs, including management fees, and other fund operating expenses. This example is intended to help you understand your indirect costs, also referred to as “ongoing costs” (in dollars), of investing in the Fund and to compare these costs with the ongoing costs of investing in other mutual funds.
This example is based on an investment of $1,000 invested at the beginning of the period and held for the entire six-month period of November 1, 2013 through April 30, 2014.
Actual Expenses The first line of the table below provides information about actual account values and actual expenses. You may use the information in this line, together with the amount you invested at the beginning of the period, to estimate the expenses that you paid over the period. Simply divide your account value by $1,000 (for example, an $8,600 account value divided by $1,000 = 8.6), then multiply the result by the number in the first line under the heading “Expenses Paid During Period” to estimate the expenses you paid on your account during this period.
Hypothetical Example for Comparison Purposes The second line of the table provides information about hypothetical account values and hypothetical expenses based on the Fund’s actual expense ratio and an assumed rate of return of 5% per year before expenses, which is not the Fund’s actual return. The hypothetical account values and expenses may not be used to estimate the actual ending account balance or expenses you paid for the period. You may use this information to compare ongoing costs of investing in the Fund and other funds. To do so, compare this 5% hypothetical example with the 5% hypothetical examples that appear in the shareholder reports of other funds.
Please note that the expenses shown in the table are meant to highlight your ongoing costs only and do not reflect any direct costs, such as wire fees or low balance fees. Therefore, the second line of the table is useful in comparing ongoing costs only and will not help you determine the relative total costs of owning different funds. In addition, if these direct costs were included, your costs would be higher.
| | | | | | | | |
| | | Beginning Account
Value
11/1/2013 | | Ending Account
Value
4/30/2014 | | Expense Ratio(a) | | Expenses Paid
During period
11/1/2013 -
4/30/2014(b) |
Actual | | $ 1,000.00 | | $ 1,052.60 | | 0.78% | | $ 3.97 |
Hypothetical
(5% return before expenses) | | $ 1,000.00 | | $ 1,020.93 | | 0.78% | | $ 3.91 |
| (a) | The Fund’s expense ratios have been annualized based on the Fund’s most recent fiscal half-year expenses. |
| (b) | Expenses are equal to the Fund’s annualized expense ratio, multiplied by the average account value over the period, multiplied by the number of days in the most recent fiscal half-year (181)/365 (to reflect the half-year period). |
| | |
6 | | 1-855-DGI-FUND (344-3863) | www.DGIfund.com |
| | |
| The Disciplined Growth Investors Fund | | Portfolio of Investments |
| | April 30, 2014 |
| | | | | | | | |
| | | Shares | | | Value (Note 2) | |
COMMON STOCKS (72.05%) | | | | | | | | |
CONSUMER DISCRETIONARY (19.63%) | | | | | | | | |
Auto & Auto Parts (1.43%) | | | | | | | | |
Gentex Corp. | | | 43,250 | | | $ | 1,239,978 | |
| | | | | | | | |
| | |
Consumer Products (5.26%) | | | | | | | | |
Ethan Allen Interiors, Inc. | | | 41,269 | | | | 1,002,011 | |
Garmin Ltd. | | | 23,413 | | | | 1,336,882 | |
Ralph Lauren Corp. | | | 8,531 | | | | 1,291,338 | |
Select Comfort Corp.(a) | | | 50,711 | | | | 933,082 | |
| | | | | | | | |
| | | | | | | 4,563,313 | |
| | | | | | | | |
| | |
Leisure (2.27%) | | | | | | | | |
Cheesecake Factory, Inc. | | | 13,650 | | | | 612,749 | |
Royal Caribbean Cruises Ltd. | | | 25,525 | | | | 1,356,143 | |
| | | | | | | | |
| | | | | | | 1,968,892 | |
| | | | | | | | |
| | |
Media (0.72%) | | | | | | | | |
DreamWorks Animation SKG, Inc. -
Class A(a) | | | 25,812 | | | | 620,262 | |
| | | | | | | | |
| | |
Retail (9.29%) | | | | | | | | |
Cabela’s, Inc.(a) | | | 33,000 | | | | 2,165,130 | |
L Brands, Inc. | | | 35,080 | | | | 1,901,336 | |
TJX Cos., Inc. | | | 68,675 | | | | 3,995,511 | |
| | | | | | | | |
| | | | | | | 8,061,977 | |
| | | | | | | | |
Textiles, Apparel & Luxury Goods (0.66%) | | | | | | | | |
Tumi Holdings, Inc.(a) | | | 28,025 | | | | 572,271 | |
| | | | | | | | |
| | |
TOTAL CONSUMER DISCRETIONARY | | | | | | | 17,026,693 | |
| | | | | | | | |
| | |
ENERGY (2.08%) | | | | | | | | |
Energy Equipment & Services (1.32%) | | | | | | | | |
Noble Corp. PLC | | | 37,132 | | | | 1,144,037 | |
| | | | | | | | |
| | |
Oil, Gas & Consumable Fuels (0.76%) | | | | | | | | |
Ultra Petroleum Corp.(a) | | | 22,100 | | | | 658,580 | |
| | | | | | | | |
| | |
TOTAL ENERGY | | | | | | | 1,802,617 | |
| | | | | | | | |
| | |
Annual Report | April 30, 2014 | | 7 |
| | |
| The Disciplined Growth Investors Fund | | Portfolio of Investments |
| | April 30, 2014 |
| | | | | | | | |
| | | Shares | | | Value
(Note 2) | |
FINANCIAL SERVICES (2.12%) | | | | | | | | |
Banks (0.65%) | | | | | | | | |
TCF Financial Corp. | | | 35,775 | | | $ | 561,668 | |
| | | | | | | | |
| | |
Investment Banking & Brokerage (1.47%) | | | | | | | | |
E*Trade Financial Corp.(a) | | | 27,571 | | | | 618,969 | |
Janus Capital Group, Inc. | | | 54,225 | | | | 657,749 | |
| | | | | | | | |
| | | | | | | 1,276,718 | |
| | | | | | | | |
| | |
TOTAL FINANCIAL SERVICES | | | | | | | 1,838,386 | |
| | | | | | | | |
| | |
HEALTH CARE (7.14%) | | | | | | | | |
Biotechnology (0.81%) | | | | | | | | |
Myriad Genetics, Inc.(a) | | | 16,625 | | | | 701,741 | |
| | | | | | | | |
| | |
Medical Equipment & Services (5.34%) | | | | | | | | |
Edwards Lifesciences Corp.(a) | | | 27,650 | | | | 2,252,646 | |
Intuitive Surgical, Inc.(a) | | | 3,362 | | | | 1,216,035 | |
Varian Medical Systems, Inc.(a) | | | 14,600 | | | | 1,161,430 | |
| | | | | | | | |
| | | | | | | 4,630,111 | |
| | | | | | | | |
| | |
Medical Specialties (0.99%) | | | | | | | | |
Align Technology, Inc.(a) | | | 17,075 | | | | 860,409 | |
| | | | | | | | |
| | |
TOTAL HEALTH CARE | | | | | | | 6,192,261 | |
| | | | | | | | |
| | |
INDUSTRIALS (2.11%) | | | | | | | | |
Machinery-Diversified (0.74%) | | | | | | | | |
Graco, Inc. | | | 8,825 | | | | 639,813 | |
| | | | | | | | |
| | |
Professional Services (1.37%) | | | | | | | | |
Corporate Executive Board Co. | | | 17,225 | | | | 1,188,869 | |
| | | | | | | | |
| | |
TOTAL INDUSTRIALS | | | | | | | 1,828,682 | |
| | | | | | | | |
| | |
INFORMATION TECHNOLOGY (1.66%) | | | | | | | | |
Consumer Finance & Credit Services (1.66%) | | | | | | | | |
FactSet Research Systems, Inc. | | | 13,544 | | | | 1,442,436 | |
| | | | | | | | |
| | |
TOTAL INFORMATION TECHNOLOGY | | | | | | | 1,442,436 | |
| | | | | | | | |
| | |
8 | | 1-855-DGI-FUND (344-3863) | www.DGIfund.com |
| | |
| The Disciplined Growth Investors Fund | | Portfolio of Investments |
| | April 30, 2014 |
| | | | | | | | |
| | | Shares | | | Value
(Note 2) | |
PRODUCER DURABLES (10.78%) | | | | | | | | |
Machinery (3.16%) | | | | | | | | |
Middleby Corp.(a) | | | 10,843 | | | $ | 2,737,641 | |
| | | | | | | | |
| | |
Manufacturing & Production (2.02%) | | | | | | | | |
Eaton Corp. PLC | | | 24,164 | | | | 1,755,273 | |
| | | | | | | | |
| | |
Scientific Instruments & Services (2.91%) | | | | | | | | |
Brady Corp. - Class A | | | 11,900 | | | | 306,901 | |
Trimble Navigation Ltd.(a) | | | 57,625 | | | | 2,214,529 | |
| | | | | | | | |
| | | | | | | 2,521,430 | |
| | | | | | | | |
| | |
Software (0.57%) | | | | | | | | |
Paychex, Inc. | | | 11,925 | | | | 498,584 | |
| | | | | | | | |
| | |
Transportation & Freight (2.12%) | | | | | | | | |
JetBlue Airways Corp.(a) | | | 74,450 | | | | 588,527 | |
Landstar System, Inc. | | | 19,800 | | | | 1,247,202 | |
| | | | | | | | |
| | | | | | | 1,835,729 | |
| | | | | | | | |
| | |
TOTAL PRODUCER DURABLES | | | | | | | 9,348,657 | |
| | | | | | | | |
| | |
TECHNOLOGY (25.33%) | | | | | | | | |
Computers (1.39%) | | | | | | | | |
IHS, Inc. - Class A(a) | | | 4,600 | | | | 554,898 | |
Imation Corp.(a) | | | 800 | | | | 3,456 | |
Teradata Corp.(a) | | | 14,300 | | | | 650,078 | |
| | | | | | | | |
| | | | | | | 1,208,432 | |
| | | | | | | | |
| | |
Electronics (7.71%) | | | | | | | | |
ARM Holdings PLC ADR | | | 19,812 | | | | 901,842 | |
Microchip Technology, Inc. | | | 19,400 | | | | 922,276 | |
Open Text Corp. | | | 50,462 | | | | 2,489,795 | |
Plexus Corp.(a) | | | 56,725 | | | | 2,377,912 | |
| | | | | | | | |
| | | | | | | 6,691,825 | |
| | | | | | | | |
| | |
Annual Report | April 30, 2014 | | 9 |
| | |
| The Disciplined Growth Investors Fund | | Portfolio of Investments |
| | April 30, 2014 |
| | | | | | | | |
| | | Shares | | | Value (Note 2) | |
TECHNOLOGY (continued) | | | | | | | | |
Information Technology (14.35%) | | | | | | | | |
Akamai Technologies, Inc.(a) | | | 32,850 | | | $ | 1,743,350 | |
Apple, Inc. | | | 1,243 | | | | 733,482 | |
Autodesk, Inc.(a) | | | 37,750 | | | | 1,812,755 | |
Dolby Laboratories, Inc. - Class A(a) | | | 14,400 | | | | 573,840 | |
Intuit, Inc. | | | 40,775 | | | | 3,088,706 | |
Seagate Technology PLC | | | 50,037 | | | | 2,630,945 | |
Yahoo!, Inc.(a) | | | 51,775 | | | | 1,861,311 | |
| | | | | | | | |
| | | | | | | 12,444,389 | |
| | | | | | | | |
| | |
Software (0.02%) | | | | | | | | |
RealPage, Inc.(a) | | | 825 | | | | 14,644 | |
| | | | | | | | |
| | |
Telecommunications (1.86%) | | | | | | | | |
Plantronics, Inc. | | | 26,500 | | | | 1,154,605 | |
ViaSat, Inc.(a) | | | 7,219 | | | | 463,532 | |
| | | | | | | | |
| | | | | | | 1,618,137 | |
| | | | | | | | |
| | |
TOTAL TECHNOLOGY | | | | | | | 21,977,427 | |
| | | | | | | | |
| | |
UTILITIES (1.20%) | | | | | | | | |
Utilities (1.20%) | | | | | | | | |
tw telecom, Inc.(a) | | | 33,900 | | | | 1,040,391 | |
| | | | | | | | |
| | |
TOTAL UTILITIES | | | | | | | 1,040,391 | |
| | | | | | | | |
| | |
TOTAL COMMON STOCKS
(Cost $45,577,932) | | | | | | | 62,497,550 | |
| | | | | | | | |
| | |
| | | Principal
Amount | | | Value
(Note 2) | |
ASSET/MORTGAGE BACKED SECURITIES (0.19%) | | | | | | | | |
Government National Mortgage Association, Series
2005-93
5.500% 12/20/2034 | | $ | 159,018 | | | | 167,663 | |
| | | | | | | | |
| | |
TOTAL ASSET/MORTGAGE BACKED SECURITIES
(Cost $174,328) | | | | | | | 167,663 | |
| | | | | | | | |
| | |
CORPORATE BONDS (22.89%) | | | | | | | | |
21st Century Fox America, Inc.
6.900% 03/01/2019 | | | 120,000 | | | | 145,000 | |
| | |
10 | | 1-855-DGI-FUND (344-3863) | www.DGIfund.com |
| | |
| The Disciplined Growth Investors Fund | | Portfolio of Investments |
| | April 30, 2014 |
| | | | | | | | |
| | | Principal
Amount | | | Value
(Note 2) | |
CORPORATE BONDS (continued) | | | | | | | | |
Affiliated Computer Services, Inc.
5.125% 06/01/2015 | | $ | 123,000 | | | $ | 128,712 | |
Ameren Illinois Co.
9.750% 11/15/2018 | | | 221,000 | | | | 289,087 | |
American Express Co.
5.500% 09/12/2016 | | | 387,000 | | | | 427,970 | |
American International Group, Inc.
5.850% 01/16/2018 | | | 263,000 | | | | 300,430 | |
Anheuser-Busch InBev Worldwide, Inc.
5.375% 01/15/2020 | | | 262,000 | | | | 302,056 | |
Arizona Public Service Co.
8.750% 03/01/2019 | | | 189,000 | | | | 243,742 | |
AT&T, Inc.
5.500% 02/01/2018 | | | 418,000 | | | | 474,335 | |
CenterPoint Energy Resources Corp.
6.125% 11/01/2017 | | | 195,000 | | | | 222,695 | |
Coca-Cola HBC Finance BV
5.500% 09/17/2015 | | | 225,000 | | | | 238,296 | |
Comcast Cable Communications Holdings, Inc.
9.455% 11/15/2022 | | | 196,000 | | | | 281,443 | |
Commonwealth Edison Co.
5.800% 03/15/2018 | | | 215,000 | | | | 246,423 | |
Connecticut Light & Power Co., Series 09-A
5.500% 02/01/2019 | | | 178,000 | | | | 203,610 | |
ConocoPhillips Holding Co.
6.950% 04/15/2029 | | | 225,000 | | | | 302,522 | |
Consolidated Edison Co. of New York, Inc.
7.125% 12/01/2018 | | | 386,000 | | | | 469,964 | |
Corning, Inc.
6.625% 05/15/2019 | | | 250,000 | | | | 300,941 | |
Corporacion Andina de Fomento
5.750% 01/12/2017 | | | 1,000 | | | | 1,121 | |
8.125% 06/04/2019 | | | 187,000 | | | | 234,139 | |
CSX Corp.
7.375% 02/01/2019 | | | 192,000 | | | | 235,319 | |
CVS Caremark Corp.
4.125% 05/15/2021 | | | 185,000 | | | | 198,849 | |
DCP Midstream Operating LP
3.875% 03/15/2023 | | | 260,000 | | | | 259,543 | |
Diageo Capital PLC
5.750% 10/23/2017 | | | 419,000 | | | | 480,027 | |
Dominion Resources, Inc.
2.250% 09/01/2015 | | | 500,000 | | | | 510,518 | |
| | |
Annual Report | April 30, 2014 | | 11 |
| | |
| The Disciplined Growth Investors Fund | | Portfolio of Investments |
| | April 30, 2014 |
| | | | | | | | |
| | | Principal
Amount | | | Value
(Note 2) | |
CORPORATE BONDS (continued) | | | | | | | | |
Edison International
3.750% 09/15/2017 | | $ | 190,000 | | | $ | 202,807 | |
El Paso Natural Gas Co. LLC
5.950% 04/15/2017 | | | 264,000 | | | | 298,596 | |
Emerson Electric Co.
5.000% 04/15/2019 | | | 137,000 | | | | 154,816 | |
Energy Transfer Partners LP
9.700% 03/15/2019 | | | 190,000 | | | | 247,081 | |
Enterprise Products Operating LLC
5.200% 09/01/2020 | | | 225,000 | | | | 255,259 | |
Fluor Corp.
3.375% 09/15/2021 | | | 212,000 | | | | 214,853 | |
General Electric Capital Corp.
5.875% 01/14/2038 | | | 234,000 | | | | 280,773 | |
Georgia Power Co.
5.400% 06/01/2018 | | | 220,000 | | | | 250,600 | |
Health Care REIT, Inc.
6.200% 06/01/2016 | | | 225,000 | | | | 248,987 | |
International Business Machines Corp.
7.625% 10/15/2018 | | | 374,000 | | | | 463,773 | |
Johnson & Johnson
5.850% 07/15/2038 | | | 189,000 | | | | 238,265 | |
Joy Global, Inc.
6.000% 11/15/2016 | | | 433,000 | | | | 480,475 | |
JPMorgan Chase & Co.
1.800% 01/25/2018 | | | 300,000 | | | | 299,901 | |
Lockheed Martin Corp.
4.250% 11/15/2019 | | | 221,000 | | | | 243,624 | |
Lubrizol Corp.
8.875% 02/01/2019 | | | 235,000 | | | | 303,262 | |
McDonald’s Corp.
6.300% 03/01/2038 | | | 176,000 | | | | 226,125 | |
Merck & Co., Inc.
5.950% 12/01/2028 | | | 246,000 | | | | 299,245 | |
MetLife, Inc.
6.750% 06/01/2016 | | | 373,000 | | | | 417,783 | |
National Rural Utilities Cooperative Finance Corp.
10.375% 11/01/2018 | | | 345,000 | | | | 466,883 | |
Nevada Power Co.
7.125% 03/15/2019 | | | 242,000 | | | | 297,294 | |
Noble Energy, Inc.
8.250% 03/01/2019 | | | 238,000 | | | | 297,593 | |
Nucor Corp.
5.750% 12/01/2017 | | | 210,000 | | | | 237,415 | |
| | |
12 | | 1-855-DGI-FUND (344-3863) | www.DGIfund.com |
| | |
| The Disciplined Growth Investors Fund | | Portfolio of Investments |
| | April 30, 2014 |
| | | | | | | | |
| | | Principal
Amount | | | Value
(Note 2) | |
CORPORATE BONDS (continued) | | | | | | | | |
Ohio Power Co., Series M
5.375% 10/01/2021 | | $ | 260,000 | | | $ | 302,072 | |
Oncor Electric Delivery Co. LLC
7.000% 09/01/2022 | | | 241,000 | | | | 303,450 | |
ONEOK Partners LP
6.150% 10/01/2016 | | | 347,000 | | | | 389,904 | |
Pepsi Bottling Group, Inc., Series B
7.000% 03/01/2029 | | | 230,000 | | | | 304,490 | |
Plains All American Pipeline LP / Plains All American Finance Corp.
6.125% 01/15/2017 | | | 265,000 | | | | 298,151 | |
8.750% 05/01/2019 | | | 155,000 | | | | 200,097 | |
PSEG Power LLC
5.320% 09/15/2016 | | | 440,000 | | | | 484,137 | |
5.500% 12/01/2015 | | | 183,000 | | | | 195,994 | |
Puget Energy, Inc.
5.625% 07/15/2022 | | | 263,000 | | | | 304,365 | |
Republic Services, Inc.
5.500% 09/15/2019 | | | 124,000 | | | | 142,090 | |
Rio Tinto Finance USA Ltd.
9.000% 05/01/2019 | | | 195,000 | | | | 256,366 | |
Royal Bank of Scotland Group PLC, Series 1
9.118% Perpetual Maturity (b) | | | 3,000 | | | | 3,052 | |
Safeway, Inc.
5.625% 08/15/2014 | | | 37,000 | | | | 37,510 | |
Sempra Energy
6.500% 06/01/2016 | | | 432,000 | | | | 479,289 | |
TCI Communications, Inc.
8.750% 08/01/2015 | | | 691,000 | | | | 760,951 | |
Texas Gas Transmission LLC
4.600% 06/01/2015 | | | 187,000 | | | | 193,774 | |
Total System Services, Inc.
2.375% 06/01/2018 | | | 305,000 | | | | 302,491 | |
TransCanada PipeLines Ltd.
7.250% 08/15/2038 | | | 184,000 | | | | 251,670 | |
Unilever Capital Corp.
4.800% 02/15/2019 | | | 265,000 | | | | 298,141 | |
United Parcel Service, Inc.
6.200% 01/15/2038 | | | 178,000 | | | | 228,102 | |
US Bank
3.778% 04/29/2020 (c) | | | 230,000 | | | | 236,441 | |
Verizon Communications, Inc.
3.650% 09/14/2018 | | | 280,000 | | | | 299,199 | |
| | |
Annual Report | April 30, 2014 | | 13 |
| | |
| The Disciplined Growth Investors Fund | | Portfolio of Investments |
| | April 30, 2014 |
| | | | | | | | | | | | |
| | | | | | Principal
Amount | | | Value
(Note 2) | |
CORPORATE BONDS (continued) | | | | | | | | | | | | |
Viacom, Inc.
2.500% 09/01/2018 | | | | | | $ | 295,000 | | | $ | 300,965 | |
Wal-Mart Stores, Inc.
6.200% 04/15/2038 | | | | | | | 187,000 | | | | 238,316 | |
Waste Management, Inc.
7.375% 03/11/2019 | | | | | | | 104,000 | | | | 125,386 | |
| | | | | | | | | | | | |
| | | |
TOTAL CORPORATE BONDS
(Cost $19,692,750) | | | | | | | | | | | 19,858,555 | |
| | | | | | | | | | | | |
| | | |
FOREIGN GOVERNMENT BONDS (0.60%) | | | | | | | | | | | | |
Israel Government AID Bonds
5.500% 12/04/2023 | | | | | | | 186,000 | | | | 223,981 | |
Israel Government AID Bonds, Series 8-Z, Zero Coupon
02/15/2020 | | | | | | | 68,000 | | | | 59,584 | |
Province of Quebec Canada, Series NN
7.125% 02/09/2024 | | | | | | | 181,000 | | | | 233,231 | |
| | | | | | | | | | | | |
| | | |
TOTAL FOREIGN GOVERNMENT BONDS
(Cost $530,173) | | | | | | | | | | | 516,796 | |
| | | | | | | | | | | | |
| | | |
GOVERNMENT & AGENCY OBLIGATIONS (0.17%) | | | | | | | | | | | | |
U.S. Treasury Bonds
4.750% 05/15/2014 | | | | | | | 75,000 | | | | 75,138 | |
6.500% 11/15/2026 | | | | | | | 28,000 | | | | 38,824 | |
U.S. Treasury Notes
4.500% 11/15/2015 | | | | | | | 16,000 | | | | 17,047 | |
4.500% 02/15/2016 | | | | | | | 13,000 | | | | 13,975 | |
| | | | | | | | | | | | |
| | | |
TOTAL GOVERNMENT & AGENCY OBLIGATIONS
(Cost $146,642) | | | | | | | | | | | 144,984 | |
| | | | | | | | | | | | |
| | | |
| | | 7-Day
Yield | | | Shares | | | Value
(Note 2) | |
SHORT TERM INVESTMENTS (3.84%) | | | | | | | | | | | | |
Fidelity Institutional Money Market
Government Portfolio - Class I | | | 0.01 | % | | | 3,329,290 | | | | 3,329,290 | |
| | | | | | | | | | | | |
| | | |
TOTAL SHORT TERM INVESTMENTS
(Cost $3,329,290) | | | | | | | | | | | 3,329,290 | |
| | | | | | | | | | | | |
| | |
14 | | 1-855-DGI-FUND (344-3863) | www.DGIfund.com |
| | |
| The Disciplined Growth Investors Fund | | Portfolio of Investments |
| | April 30, 2014 |
| | | | | | | | |
| | | | | | | Value (Note 2) | |
TOTAL INVESTMENTS (99.74%)
(Cost $69,451,115) | | | | | | $ | 86,514,838 | |
| | | |
Other Assets In Excess Of Liabilities (0.26%) | | | | | | | 225,772 | |
| | | | | | | | |
| | | |
NET ASSETS (100.00%) | | | | | | $ | 86,740,610 | |
| | | | | | | | |
| (a) | Non-Income Producing Security. |
| (b) | This security has no contractual maturity date, is not redeemable and contractually pays an indefinite stream of interest. |
| (c) | The coupon rate shown on floating or adjustable rate securities represents the rate at period end. |
Common Abbreviations:
ADR - American Depositary Receipt.
AID - Agency for International Development.
BV - Besloten Vennootschap is the Dutch term for private limited liability company.
LLC - Limited Liability Company.
LP - Limited Partnership.
Ltd.- Limited.
PLC - Public Limited Company.
REIT - Real Estate Investment Trust.
Holdings are subject to change.
For Fund compliance purposes, the Fund’s industry classifications refer to any one or more of the industry sub-classifications used by one or more widely recognized market indexes or ratings group indexes, and/or as defined by Fund management. This definition may not apply for purposes of this report, which may combine industry sub-classifications for reporting ease. Industries are shown as a percent of net assets.
See Notes to Financial Statements.
| | |
Annual Report | April 30, 2014 | | 15 |
| | |
| The Disciplined Growth Investors Fund | | Statement of Assets and Liabilities |
| | April 30, 2014 |
| | | | |
ASSETS | | | | |
Investments, at value | | $ | 86,514,838 | |
Receivable for shares sold | | | 1,500 | |
Dividends and interest receivable | | | 291,078 | |
| |
Total assets | | | 86,807,416 | |
| |
| |
LIABILITIES | | | | |
Payable for shares redeemed | | | 11,000 | |
Payable to adviser | | | 55,806 | |
| |
Total liabilities | | | 66,806 | |
| |
NET ASSETS | | $ | 86,740,610 | |
| |
| |
NET ASSETS CONSIST OF | | | | |
Paid-in capital (Note 5) | | $ | 69,390,849 | |
Accumulated net investment income | | | 5,773 | |
Accumulated net realized gain on investments | | | 280,265 | |
Net unrealized appreciation on investments | | | 17,063,723 | |
| |
NET ASSETS | | $ | 86,740,610 | |
| |
| |
INVESTMENTS, AT COST | | $ | 69,451,115 | |
| |
PRICING OF SHARES | | | | |
Net Asset Value, offering and redemption price per share | | $ | 15.02 | |
Shares of beneficial interest outstanding | | | 5,774,899 | |
| | |
See Notes to Financial Statements. |
16 | | 1-855-DGI-FUND (344-3863) | www.DGIfund.com |
| | |
| The Disciplined Growth Investors Fund | | Statement of Operations |
| | |
| | | | |
| | | For the
Year Ended
April 30, 2014 | |
| |
INVESTMENT INCOME | | | | |
Dividends | | $ | 542,390 | |
Foreign taxes withheld | | | (6,134) | |
Interest | | | 431,351 | |
| |
Total investment income | | | 967,607 | |
| |
| |
EXPENSES | | | | |
Investment advisory fees (Note 6) | | | 603,488 | |
| |
Total expenses | | | 603,488 | |
| |
NET INVESTMENT INCOME | | | 364,119 | |
| |
| |
REALIZED AND UNREALIZED GAIN ON INVESTMENTS | | | | |
Net realized gain on investments | | | 359,277 | |
Net change in unrealized appreciation on investments | | | 9,603,782 | |
| |
NET REALIZED AND UNREALIZED GAIN ON INVESTMENTS | | | 9,963,059 | |
| |
NET INCREASE IN NET ASSETS RESULTING FROM OPERATIONS | | $ | 10,327,178 | |
| |
| | |
See Notes to Financial Statements. | | |
Annual Report | April 30, 2014 | | 17 |
| | |
| The Disciplined Growth Investors Fund | | Statements of Changes in Net Assets |
| | |
| | | | | | | | |
| | | For the
Year Ended
April 30, 2014 | | | For the
Year Ended
April 30, 2013 | |
OPERATIONS | | | | | | | | |
Net investment income | | $ | 364,119 | | | $ | 415,008 | |
Net realized gain on investments | | | 359,277 | | | | 261,618 | |
Net change in unrealized appreciation on investments | | | 9,603,782 | | | | 4,182,524 | |
| |
Net increase in net assets resulting from operations | | | 10,327,178 | | | | 4,859,150 | |
| |
|
DISTRIBUTIONS (Note 3) | |
From net investment income | | | (381,779) | | | | (383,921) | |
From net realized gains on investments | | | (278,995) | | | | (176,427) | |
| |
Net decrease in net assets from distributions | | | (660,774) | | | | (560,348) | |
| |
|
CAPITAL SHARE TRANSACTIONS (Note 5) | |
Proceeds from sales of shares | | | 13,673,561 | | | | 29,863,013 | |
Issued to shareholders in reinvestment of distributions | | | 656,043 | | | | 560,205 | |
Cost of shares redeemed, net of redemption fees | | | (4,222,784) | | | | (3,432,700) | |
| |
Net increase from capital share transactions | | | 10,106,820 | | | | 26,990,518 | |
| |
| | |
Net increase in net assets | | | 19,773,224 | | | | 31,289,320 | |
| |
|
NET ASSETS | |
Beginning of period | | | 66,967,386 | | | | 35,678,066 | |
| |
End of period* | | $ | 86,740,610 | | | $ | 66,967,386 | |
| |
| | |
*Including accumulated net investment income of: | | $ | 5,773 | | | $ | 18,206 | |
|
OTHER INFORMATION | |
Share Transactions | | | | | | | | |
Issued | | | 938,053 | | | | 2,376,536 | |
Issued in lieu of cash distributions | | | 45,106 | | | | 45,306 | |
Redeemed | | | (293,031) | | | | (277,179) | |
| |
Net increase in share transactions | | | 690,128 | | | | 2,144,663 | |
| |
| | |
See Notes to Financial Statements. |
18 | | 1-855-DGI-FUND (344-3863) | www.DGIfund.com |
| | |
| The Disciplined Growth Investors Fund | | Financial Highlights |
| | For a share outstanding during the periods presented. |
| | | | | | | | | | | | | | | | | | |
| | | For the Year
Ended
April 30, 2014 | | | For the Year
Ended
April 30, 2013 | | | For the Period
August 12,
2011
(Inception) to
April 30, 2012 | | |
|
NET ASSET VALUE, BEGINNING OF PERIOD | | $ | 13.17 | | | $ | 12.13 | | | | | $ | 10.00 | | | | | |
| | | | | | |
INCOME FROM OPERATIONS | | | | | | | | | | | | | | | | | | |
Net investment income(a) | | | 0.07 | | | | 0.11 | | | | | | 0.05 | | | | | |
Net realized and unrealized gain on investments | | | 1.90 | | | | 1.09 | | | | | | 2.11 | | | | | |
|
Total from investment operations | | | 1.97 | | | | 1.20 | | | | | | 2.16 | | | | | |
|
| | | | | | |
DISTRIBUTIONS | | | | | | | | | | | | | | | | | | |
From net investment income | | | (0.07 | ) | | | (0.11 | ) | | | | | (0.03 | ) | | | | |
From net realized gain on investments | | | (0.05 | ) | | | (0.05 | ) | | | | | – | | | | | |
|
Total distributions | | | (0.12 | ) | | | (0.16 | ) | | | | | (0.03 | ) | | | | |
|
| | | | | | |
REDEMPTION FEES ADDED TO PAID-IN CAPITAL | | | – | | | | – | | | | | | – | | | | | |
|
| | | | | | |
INCREASE IN NET ASSET VALUE | | | 1.85 | | | | 1.04 | | | | | | 2.13 | | | | | |
|
NET ASSET VALUE, END OF PERIOD | | $ | 15.02 | | | $ | 13.17 | | | | | $ | 12.13 | | | | | |
|
| | | | | | |
TOTAL RETURN | | | 15.02 | % | | | 9.93 | % | | | | | 21.65 | % (b) | | | | |
| | | | | | |
RATIOS AND SUPPLEMENTAL DATA | | | | | | | | | | | | | | | | | | |
| Net assets, end of period (000’s) | | $ | 86,741 | | | $ | 66,967 | | | | | $ | 35,678 | | | | | |
| | | | | | |
RATIOS TO AVERAGE NET ASSETS | | | | | | | | | | | | | | | | | | |
| Expenses | | | 0.78 | % | | | 0.78 | % | | | | | 0.77 | % (c) | | | | |
| Net investment income | | | 0.47 | % | | | 0.90 | % | | | | | 0.60 | % (c) | | | | |
| | | | | | |
PORTFOLIO TURNOVER RATE | | | 10 | % | | | 10 | % | | | | | 6 | % (b) | | | | |
| (a) | Per share numbers have been calculated using the average shares method. |
| | |
See Notes to Financial Statements. | | |
Annual Report | April 30, 2014 | | 19 |
| | |
| The Disciplined Growth Investors Fund | | Notes to Financial Statements |
| | April 30, 2014 |
1. ORGANIZATION
Financial Investors Trust (the “Trust”), a Delaware statutory trust, is an open-end management investment company registered under the Investment Company Act of 1940, as amended (“1940 Act”). As of April 30, 2014, the Trust had 30 registered funds. This annual report describes The Disciplined Growth Investors Fund (the “Fund”). The Fund seeks long-term capital growth and as a secondary objective, modest income with reasonable risk. The Fund pursues its investment objective by normally investing approximately 60% of its assets in equity securities and approximately 40% in fixed-income securities and cash equivalents.
2. SIGNIFICANT ACCOUNTING POLICIES
The accompanying financial statements were prepared in accordance with accounting principles generally accepted in the United States of America (“U.S. GAAP”). The preparation of financial statements in conformity with U.S. GAAP requires management to make certain estimates and assumptions that affect the reported amounts of assets and liabilities and disclosures of contingent assets and liabilities at the date of the financial statements and the reported amounts of revenue and expenses during the period. Actual results could differ from those estimates. The following is a summary of significant accounting policies consistently followed by the Fund in preparation of their financial statements.
Investment Valuation: The Fund generally values its securities based on market prices determined at the close of regular trading on the New York Stock Exchange (“NYSE”), normally 4:00 p.m. Eastern Time, on each day the NYSE is open for trading.
For equity securities and mutual funds that are traded on an exchange, the market price is usually the closing sale or official closing price on that exchange. In the case of equity securities not traded on an exchange, or if such closing prices are not otherwise available, the securities are valued at the mean of the most recent bid and ask prices on such day. Redeemable securities issued by open-end registered investment companies are valued at the investment company’s applicable net asset value, with the exception of exchange-traded open-end investment companies, which are priced as equity securities.
The market price for debt obligations is generally the price supplied by an independent third-party pricing service approved by the Board of Trustees (the “Board”), which may use a matrix, formula or other objective method that takes into consideration quotations from dealers, market transactions in comparable investments, market indices and yield curves. If vendors are unable to supply a price, or if the price supplied is deemed to be unreliable, the market price may be determined using quotations received from one or more broker-dealers that make a market in the security. Short-term debt obligations that will mature in 60 days or less are valued at amortized cost, unless it is determined that using this method would not reflect an investment’s fair value.
When such prices or quotations are not available, or when the Fair Value Committee appointed by the Board believes that they are unreliable, securities may be priced using fair value procedures approved by the Board.
| | |
20 | | 1-855-DGI-FUND (344-3863) | www.DGIfund.com |
| | |
| The Disciplined Growth Investors Fund | | Notes to Financial Statements |
| | April 30, 2014 |
Fair Value Measurements: The Fund discloses the classification of its fair value measurements following a three-tier hierarchy based on the inputs used to measure fair value. Inputs refer broadly to the assumptions that market participants would use in pricing the asset or liability, including assumptions about risk. Inputs may be observable or unobservable. Observable inputs reflect the assumptions market participants would use in pricing the asset or liability that are developed based on market data obtained from sources independent of the reporting entity. Unobservable inputs reflect the reporting entity’s own assumptions about the assumptions market participants would use in pricing the asset or liability that are developed based on the best information available.
Various inputs are used in determining the value of the Fund’s investments as of the end of the reporting period. When inputs used fall into different levels of the fair value hierarchy, the level in the hierarchy within which the fair value measurement falls is determined based on the lowest level input that is significant to the fair value measurement in its entirety. The designated input levels are not necessarily an indication of the risk or liquidity associated with these investments. These inputs are categorized in the following hierarchy under applicable financial accounting standards:
| | |
Level 1 – | | Unadjusted quoted prices in active markets for identical investments, unrestricted assets or liabilities that the Fund has the ability to access at the measurement date; |
| |
Level 2 – | | Quoted prices which are not active, quoted prices for similar assets or liabilities in active markets or inputs other than quoted prices that are observable (either directly or indirectly) for substantially the full term of the asset or liability; and |
| |
Level 3 – | | Significant unobservable prices or inputs (including the Fund’s own assumptions in determining the fair value of investments) where there is little or no market activity for the asset or liability at the measurement date. |
The following is a summary of each input used to value the Fund as of April 30, 2014:
| | | | | | | | | | | | | | | | |
Investments in Securities at
Value | | Level 1 -
Unadjusted
Quoted Prices | | | Level 2 - Other
Significant
Observable
Inputs | | | Level 3 -
Significant
Unobservable
Inputs | | | Total | |
| |
Common Stocks(a) | | $ | 62,497,550 | | | $ | – | | | $ | – | | | $ | 62,497,550 | |
Asset/Mortgage Backed Securities | | | – | | | | 167,663 | | | | – | | | | 167,663 | |
Corporate Bonds | | | – | | | | 19,858,555 | | | | – | | | | 19,858,555 | |
Foreign Government Bonds | | | – | | | | 516,796 | | | | – | | | | 516,796 | |
Government & Agency Obligations | | | – | | | | 144,984 | | | | – | | | | 144,984 | |
Short Term Investments | | | 3,329,290 | | | | – | | | | – | | | | 3,329,290 | |
| |
TOTAL | | $ | 65,826,840 | | | $ | 20,687,998 | | | $ | – | | | $ | 86,514,838 | |
| |
| (a) | For detailed descriptions of the underlying industries, see the accompanying Portfolio of Investments. |
| | |
Annual Report | April 30, 2014 | | 21 |
| | |
| The Disciplined Growth Investors Fund | | Notes to Financial Statements |
| | April 30, 2014 |
The Fund recognizes transfers between levels as of the end of the period. For the year ended April 30, 2014, the Fund did not have any transfers between Level 1 and Level 2 securities. For the year ended April 30, 2014, the Fund did not have any securities that used unobservable inputs (Level 3) in determining fair value.
Investment Transactions and Investment Income: Investment transactions are accounted for on the date the investments are purchased or sold (trade date). Realized gains and losses from investment transactions are reported on an identified cost basis. Interest income, which includes accretion of discounts, is accrued and recorded as earned. Dividend income is recognized on the ex-dividend date or for certain foreign securities, as soon as information is available to the Fund.
Trust Expenses: Some expenses of the Trust can be directly attributed to the Fund. Expenses which cannot be directly attributed to the Fund are apportioned among all funds in the Trust based on average net assets of each fund.
Fund Expenses: Expenses that are specific to the Fund are charged directly to the Fund.
Federal Income Taxes: The Fund complies with the requirements under Subchapter M of the Internal Revenue Code of 1986, as amended, applicable to regulated investment companies and intends to distribute substantially all of their net taxable income and net capital gains, if any, each year so that it will not be subject to excise tax on undistributed income and gains. The Fund is not subject to income taxes to the extent such distributions are made.
As of and during the year ended April 30, 2014, the Fund did not have a liability for any unrecognized tax benefits. The Fund files U.S. federal, state, and local tax returns as required. The Fund’s tax returns are subject to examination by the relevant tax authorities until expiration of the applicable statute of limitations, which is generally three years after the filing of the tax return for federal purposes and four years for most state returns. Tax returns for open years have incorporated no uncertain tax positions that require a provision for income taxes.
Distributions to Shareholders: The Fund normally pays dividends, if any, quarterly and distributes capital gains, if any, on an annual basis. Income dividend distributions are derived from interest and other income the Fund receives from its investments, including short term capital gains. Long term capital gain distributions are derived from gains realized when the Fund sells a security it has owned for more than a year. The Fund may make additional distributions and dividends at other times if the portfolio manager believes doing so may be necessary for the Fund to avoid or reduce taxes.
| | |
22 | | 1-855-DGI-FUND (344-3863) | www.DGIfund.com |
| | |
| The Disciplined Growth Investors Fund | | Notes to Financial Statements |
| | April 30, 2014 |
3. TAX BASIS INFORMATION
Reclassifications: As of April 30, 2014, permanent differences in book and tax accounting were reclassified. These differences had no effect on net assets and were primarily attributed to minor differences between book and tax characterizations of paydown transactions. The reclassifications were as follows:
| | | | | | | | | | | | |
| Fund | | Paid-in Capital | | | Accumulated Net
Investment Income | | | Accumulated Net
Realized Loss on
Investments | |
Disciplined Growth Investors Fund | | $ | – | | | $ | 5,227 | | | $ | (5,227 | ) |
The differences were primarily attributed to investments in mortgage backed securities.
Tax Basis of Investments: As of April 30, 2014, the aggregate cost of investments, gross unrealized appreciation/(depreciation) and net unrealized appreciation for Federal tax purposes was as follows:
| | | | |
| | | Disciplined Growth
Investors Fund | |
Gross appreciation
(excess of value over tax cost) | | $ | 18,241,565 | |
Gross depreciation
(excess of tax cost over value) | | | (1,177,842 | ) |
Net unrealized appreciation | | $ | 17,063,723 | |
| | |
Cost of investments for income tax purposes | | $ | 69,451,115 | |
| | |
Components of Earnings: As of April 30, 2014, components of distributable earnings were as follows:
| | | | |
Undistributed ordinary income | | $ | 5,773 | |
Accumulated captial gains | | | 280,265 | |
Net unrealized appreciation on investments | | | 17,063,723 | |
Total | | $ | 17,349,761 | |
| | |
Capital Losses: As of April 30, 2014, the Fund has no accumulated capital loss carryforwards.
Tax Basis of Distributions to Shareholders: The character of distributions made during the year from net investment income or net realized gains may differ from its ultimate characterization for federal income tax purposes. Also, due to the timing of dividend distributions, the fiscal year in which amounts are distributed may differ from the fiscal year in which the income or realized gain was recorded by the Fund.
| | |
Annual Report | April 30, 2014 | | 23 |
| | |
| The Disciplined Growth Investors Fund | | Notes to Financial Statements |
| | April 30, 2014 |
The tax character of distributions paid during the year ended April 30, 2014, were as follows:
| | | | | | | | |
| | | Ordinary Income | | | Long-Term Capital
Gain | |
The Disciplined Growth Investors Fund | | $ | 381,779 | | | $ | 278,995 | |
The tax character of distributions paid during the year ended April 30, 2013, were as follows:
| | | | | | | | |
| | | Ordinary Income | | | Long-Term Capital
Gain | |
The Disciplined Growth Investors Fund | | $ | 560,348 | | | $ | – | |
4. SECURITIES TRANSACTIONS
During the year ended April 30, 2014, equity holdings, asset/mortgage backed securities, fixed income securities and rights were transferred in-kind. The intent of the transfers was to save on equity transaction costs both for the new shareholders at the institution they transferred from and for the Fund on the addition of assets. The assets of two separate accounts were transferred-in-kind into the Fund in the amount of $4,857,251.
The cost of purchases and proceeds from sales of securities (excluding short-term securities, transfers-in-kind, and U.S. Government Obligations) during the year ended April 30, 2014, were as follows:
| | | | | | | | |
| Fund | | Purchases of
Securities | | | Proceeds From Sales of
Securities | |
The Disciplined Growth Investors Fund | | $ | 11,395,689 | | | $ | 7,548,054 | |
Investment transactions in U.S. government and agency securities (excluding transfers-in-kind) for the year ended April 30, 2014 were as follows:
| | | | | | | | |
| Fund | | Purchases of
Securities | | | Proceeds From Sales
of Securities | |
The Disciplined Growth Investors Fund | | $ | 0 | | | $ | 3,000 | |
5. SHARES OF BENEFICIAL INTEREST
The capitalization of the Trust consists of an unlimited number of shares of beneficial interest with no par value per share. Holders of the shares of the Fund of the Trust have one vote for each share held and a proportionate fraction of a vote for each fractional share. All shares issued and outstanding are fully paid and are non-assessable, transferable and redeemable at the option of the shareholder. Shares have no pre-emptive rights.
Shares redeemed within 90 days of purchase may incur a 2% short-term redemption fee deducted from the redemption amount. For the year ended April 30, 2014 and April 30, 2013, the Fund did not receive any redemption fees.
| | |
24 | | 1-855-DGI-FUND (344-3863) | www.DGIfund.com |
| | |
| The Disciplined Growth Investors Fund | | Notes to Financial Statements |
| | April 30, 2014 |
6. MANAGEMENT AND RELATED-PARTY TRANSACTIONS
Disciplined Growth Investors, Inc. (the “Adviser” or “DGI”), subject to the authority of the Board, is responsible for the overall management and administration of the Fund’s business affairs. DGI manages the investments of the Fund in accordance with the Fund’s investment objective, policies and limitations and investment guidelines established jointly by the Adviser and the Trustees. Pursuant to the Advisory Agreement, the Fund pays the Adviser a unitary fee for the services and facilities it provides payable on a monthly basis at the annual rate of 0.78% of the Fund’s average daily net assets.
Out of the unitary management fee, the Adviser pays substantially all expenses of the Fund, including the cost of transfer agency, custody, fund administration, bookkeeping and pricing services, legal, audit and other services, except for interest expenses, brokerage expenses, taxes and extraordinary expenses not incurred in the ordinary course of the Fund’s business. Also included are Trustee fees which were $3,105 for the year ended April 30, 2014.
Fund Administrator Fees and Expenses
ALPS Fund Services, Inc. (“ALPS” and the “Administrator”) (an affiliate of ALPS Distributors, Inc.) serves as administrator to the Fund, and the Fund has agreed to pay expenses incurred in connection with its administrative activities. Pursuant to the Administration, Bookkeeping and Pricing Services Agreement (the “Agreement”), ALPS will provide operational services to the Fund including, but not limited to fund accounting and fund administration and generally assist in the Fund’s operations.
Annual Administrative Fee, billed monthly, in the amount of the greater of (a) $150,000 annual minimum or (b) following basis point fee schedule:
| | | | | | | | | | |
| Average Total Net Assets | | Contractual Fee | | |
Between $0-$500M | | 0.05% | | |
$500M-$1B | | 0.03% | | |
Above $1B | | 0.02% | | |
The Administrator is also reimbursed by the Fund for certain out-of-pocket expenses. The administrative fee and out-of-pocket expenses are included in the unitary fee paid to the Adviser.
Transfer Agent
ALPS serves as transfer, dividend paying and shareholder servicing agent for the Fund. ALPS receives an annual minimum fee, a fee based upon the number of shareholder accounts, and is also reimbursed by the Fund for certain out-of-pocket expenses. The fee is included in the unitary fee paid to the Adviser.
Compliance Services
ALPS provides services that assist the Trust’s Chief Compliance Officer in monitoring and testing the policies and procedures of the Trust in conjunction with requirements under Rule 38a-1 under the 1940 Act and receives an annual base fee. ALPS is reimbursed for certain out-of-pocket expenses. The fee is included in the unitary fee paid to the Adviser.
| | |
Annual Report | April 30, 2014 | | 25 |
| | |
| The Disciplined Growth Investors Fund | | Notes to Financial Statements |
| | April 30, 2014 |
Principal Financial Officer
ALPS receives an annual fee for providing principal financial officer services to the Fund. The fee is included in the unitary fee paid to the Adviser.
Distributor
ALPS Distributors, Inc. (“ADI” or the “Distributor”) (an affiliate of ALPS) acts as the distributor of the Fund’s shares pursuant to a Distribution Agreement with the Trust. Shares are sold on a continuous basis by ADI as agent for the Fund, and ADI has agreed to use its best efforts to solicit orders for the sale of the Fund’s shares, although it is not obliged to sell any particular amount of shares. ADI is not entitled to any compensation for its services as Distributor. ADI is registered as a broker-dealer with the Securities and Exchange Commission.
7. INDEMNIFICATIONS
Under the Trust’s organizational documents, its officers and Trustees are indemnified against certain liability arising out of the performance of their duties to the Trust. Additionally, in the normal course of business, the Trust enters into contracts with service providers that may contain general indemnification clauses, which may permit indemnification to the extent permissible under applicable law. The Trust’s maximum exposure under these arrangements is unknown, as this would involve future claims that may be made against the Trust that have not yet occurred.
8. NEW ACCOUNTING PRONOUNCEMENTS
In June 2013, the Financial Accounting Standards Board (the “FASB”) issued Accounting Standards Update (“ASU”) No. 2013-08, Financial Services-Investment Companies (Topic 946): Amendments to the Scope, Measurement, and Disclosure Requirements. The FASB standard identifies characteristics a company must assess to determine whether it is considered an investment company for financial reporting purposes. This ASU is effective for fiscal years beginning after December 15, 2013. The Funds believe the adoption of this ASU will not have a material impact on their financial statements.
| | |
26 | | 1-855-DGI-FUND (344-3863) | www.DGIfund.com |
| | |
| The Disciplined Growth Investors Fund | | Report of Independent Registered Public Accounting Firm |
| | |
To the Shareholders and Board of Trustees of Financial Investors Trust:
We have audited the accompanying statement of assets and liabilities, including the portfolio of investments, of The Disciplined Growth Investors Fund (the “Fund”), one of the portfolios constituting Financial Investors Trust, as of April 30, 2014, the related statement of operations for the year then ended, the statements of changes in net assets for each of the two years in the period then ended, and the financial highlights for each of the two years in the period then ended and the period from August 12, 2011 (inception) to April 30, 2012. These financial statements and financial highlights are the responsibility of the Fund’s management. Our responsibility is to express an opinion on these financial statements and financial highlights based on our audits.
We conducted our audits in accordance with the standards of the Public Company Accounting Oversight Board (United States). Those standards require that we plan and perform the audit to obtain reasonable assurance about whether the financial statements and financial highlights are free of material misstatement. The Fund is not required to have, nor were we engaged to perform, an audit of its internal control over financial reporting. Our audits included consideration of internal control over financial reporting as a basis for designing audit procedures that are appropriate in the circumstances, but not for the purpose of expressing an opinion on the effectiveness of the Fund’s internal control over financial reporting. Accordingly, we express no such opinion. An audit also includes examining, on a test basis, evidence supporting the amounts and disclosures in the financial statements, assessing the accounting principles used and significant estimates made by management, as well as evaluating the overall financial statement presentation. Our procedures included confirmation of securities owned as of April 30, 2014, by correspondence with the custodian. We believe that our audits provide a reasonable basis for our opinion.
In our opinion, the financial statements and financial highlights referred to above present fairly, in all material respects, the financial position of The Disciplined Growth Investors Fund of Financial Investors Trust, as of April 30, 2014, the results of its operations for the year then ended, the changes in its net assets for each of the two years in the period then ended, and the financial highlights for each of the two years in the period then ended and the period from August 12, 2011 to April 30, 2012, in conformity with accounting principles generally accepted in the United States of America.
DELOITTE & TOUCHE LLP
Denver, Colorado
June 26, 2014
| | |
Annual Report | April 30, 2014 | | 27 |
| | |
| The Disciplined Growth Investors Fund | | Additional Information |
| | April 30, 2014 (Unaudited) |
1. FUND HOLDINGS
The Fund files its complete schedule of portfolio holdings with the Securities and Exchange Commission (the “SEC”) for the first and third quarters of each fiscal year on Form N-Q within 60 days after the end of the period. Copies of the Fund’s Form N-Q are available without charge on the SEC website at http://www.sec.gov. You may also review and copy the Form N-Q at the SEC’s Public Reference Room in Washington, DC. For more information about the operation of the Public Reference Room, please call the SEC at 1-800-SEC-0330.
2. FUND PROXY VOTING POLICIES, PROCEDURES AND SUMMARIES
The Fund’s policies and procedures used in determining how to vote proxies and information regarding how the Fund voted proxies relating to portfolio securities during the most recent prior 12-month period ending June 30 are available without charge, (1) upon request, by calling (toll-free) 855-DGI-Fund and (2) on the SEC’s website at http://www.sec.gov.
3. TAX DESIGNATIONS
The Fund designates the following for federal income tax purposes for distributions made during the calendar year ended December 31, 2013:
| | |
Dividend Received Deduction | | 96.79% |
Qualified Dividend Income | | 100.00% |
Pursuant to Section 852(b)(3) of the Internal Revenue Code, the Disciplined Growth Investors Fund designated $278,995 as long-term capital gain dividends.
In early 2014, if applicable, shareholders of record received this information for the distributions paid to them by the Fund during the calendar year 2013 via Form 1099. The Fund will notify shareholders in early 2015 of amounts paid to them by the Fund, if any, during the calendar year 2014.
Please consult a tax advisor if you have questions about federal or state income tax laws, or how to prepare your tax returns.
| | |
28 | | 1-855-DGI-FUND (344-3863) | www.DGIfund.com |
| | |
| The Disciplined Growth Investors Fund | | Trustees and Officers |
| | April 30, 2014 (Unaudited) |
Additional information regarding the Fund’s trustees is included in the Statement of Additional Information, which can be obtained without charge by calling 855-DGI-Fund.
INDEPENDENT TRUSTEES
| | | | | | | | | | |
Name, Address* & Year
of Birth | | Position(s) Held with Fund | | Term of Office
and Length of
Time Served** | | Principal Occupation(s) During Past 5 Years*** | | Number of Funds in Fund Complex Overseen by Trustee**** | | Other Directorships Held by Trustee |
| Mary K. Anstine, 1940 | | Trustee | | Ms. Anstine was elected at a special meeting of shareholders held on March 21, 1997 and re-elected at a special meeting of shareholders held on August 7, 2009. | | Ms. Anstine was President/Chief Executive Officer of HealthONE Alliance, Denver, Colorado, and former Executive Vice President of First Interstate Bank of Denver. Ms. Anstine is also Trustee/Director of AV Hunter Trust and Colorado Uplift Board. Ms. Anstine was formerly a Director of the Trust Bank of Colorado (later purchased and now known as Northern Trust Bank), HealthONE and Denver Area Council of the Boy Scouts of America, and a member of the American Bankers Association Trust Executive Committee. | | 30 | | Ms. Anstine is a Trustee of ALPS ETF Trust (21 funds); ALPS Variable Investment Trust (8 funds); Reaves Utility Income Fund (1 fund); and Westcore Trust (12 funds). |
John R. Moran, Jr.,
1930 | | Trustee | | Mr. Moran was elected at a special meeting of shareholders held on March 21, 1997 and re-elected at a special meeting of shareholders held on August 7, 2009. | | Mr. Moran is formerly President and CEO of The Colorado Trust, a private foundation serving the health and hospital community in the state of Colorado. Currently, Mr. Moran is a member of the Treasurer’s Investment Advisory Committee for the University of Colorado. | | 30 | | None. |
| * | All communications to Trustees and Officers may be directed to Financial Investors Trust c/o 1290 Broadway, Suite 1100, Denver, CO 80203. |
| ** | This is the period for which the Trustee or Officer began serving the Trust. Each Trustee and/or Officer serves an indefinite term, until his successor is elected. |
| *** | Except as otherwise indicated, each individual has held the office shown or other offices in the same company for the last five years. |
| **** | The Fund Complex includes all series of the Trust (currently 30) and any other investment companies for which any Trustee serves as Trustee for and which Disciplined Growth Investors, Inc. provides investment advisory services (currently none). |
| | |
Annual Report | April 30, 2014 | | 29 |
| | |
| The Disciplined Growth Investors Fund | | Trustees and Officers |
| | April 30, 2014 (Unaudited) |
INDEPENDENT TRUSTEES (continued)
| | | | | | | | | | |
Name, Address* & Year of Birth | | Position(s) Held with Fund | | Term of Office
and Length of
Time Served** | | Principal Occupation(s) During Past 5 Years*** | | Number of Funds in Fund Complex Overseen by Trustee**** | | Other Directorships Held by Trustee |
Jeremy W. Deems, 1976 | | Trustee | | Mr. Deems was appointed as a Trustee at the March 11, 2008 meeting of the Board of Trustees and elected at a special meeting of shareholders held on August 7, 2009. | | Mr. Deems is the Co-Founder, Chief Operations Officer and Chief Financial Officer of Green Alpha Advisors, LLC. Mr. Deems is Co-Portfolio Manager of the Shelton Green Alpha Fund. Prior to joining Green Alpha Advisors, Mr. Deems was CFO and Treasurer of Forward Management, LLC, ReFlow Management Co., LLC, ReFlow Fund, LLC, a private investment fund, and Sutton Place Management, LLC, an administrative services company, from 2004 to June 2007. | | 30 | | Mr. Deems is a Trustee of ALPS ETF Trust (21 funds); ALPS Variable Investment Trust (8 funds) and Reaves Utility Income Fund (1 fund). |
Jerry G. Rutledge 1944 | | Trustee | | Mr. Rutledge was elected at a special meeting of shareholders held on August 7, 2009 | | Mr. Rutledge is the President and owner of Rutledge’s Inc., a retail clothing business. He was from 1994 to 2007 a Regent of the University of Colorado. | | 30 | | Mr. Rutledge is a Trustee of Principal Real Estate Income Fund (1 fund), Clough Global Allocation Fund (1 fund), Clough Global Equity Fund (1 fund) and Clough Global Opportunities Fund (1 fund). |
| * | All communications to Trustees and Officers may be directed to Financial Investors Trust c/o 1290 Broadway, Suite 1100, Denver, CO 80203. |
| ** | This is the period for which the Trustee or Officer began serving the Trust. Each Trustee and/or Officer serves an indefinite term, until his successor is elected. |
| *** | Except as otherwise indicated, each individual has held the office shown or other offices in the same company for the last five years. |
| **** | The Fund Complex includes all series of the Trust (currently 30) and any other investment companies for which any Trustee serves as Trustee for and which Disciplined Growth Investors, Inc. provides investment advisory services (currently none). |
| | |
30 | | 1-855-DGI-FUND (344-3863) | www.DGIfund.com |
| | |
| The Disciplined Growth Investors Fund | | Trustees and Officers |
| | April 30, 2014 (Unaudited) |
INDEPENDENT TRUSTEES (continued)
| | | | | | | | | | |
Name, Address* & Year of Birth | | Position(s) Held with Fund | | Term of Office and Length of Time Served** | | Principal Occupation(s) During Past 5 Years*** | | Number of Funds in Fund Complex Overseen by Trustee**** | | Other Directorships Held by Trustee |
Michael “Ross” Shell, 1970 | | Trustee | | Mr. Shell was elected at a special meeting of shareholders held on August 7, 2009 | | Mr. Shell is Founder and CEO of Red Idea, LLC, a strategic consulting/early stage venture firm (since June 2008). From 1999 to 2009, he was a part-owner and Director of Tesser, Inc., a brand agency. From December 2005 to May 2008, he was Director, Marketing and Investor Relations, of Woodbourne, a REIT/real estate hedge fund and private equity firm. Prior to this, from May 2004 to November 2005, he worked as a business strategy consultant; from June 2003 to April 2004, he was on the Global Client Services team of IDEO, a product design/innovation firm; and from 1999 to 2003, he was President of Tesser, Inc. Mr. Shell graduated with honors from Stanford University with a degree in Political Science. | | 30 | | None. |
| | |
Annual Report | April 30, 2014 | | 31 |
| | |
| The Disciplined Growth Investors Fund | | Trustees and Officers |
| | April 30, 2014 (Unaudited) |
INTERESTED TRUSTEE
| | | | | | | | | | |
Name, Address* & Year of Birth | | Position(s) Held with Fund | | Term of Office and Length of Time Served** | | Principal Occupation(s) During Past 5 Years*** | | Number of Funds in Fund Complex Overseen by Trustee**** | | Other Directorships Held by Trustee |
Edmund J. Burke, 1961 | | Trustee,
Chairman
and
President | | Mr. Burke was elected as Chairman at the August 28, 2009 meeting of the Board of Trustees. Mr. Burke was elected as Trustee at a special meeting of shareholders held on August 7, 2009. Mr. Burke was elected President of the Trust at the December 17, 2002 meeting of the Board of Trustees. | | Mr. Burke is President and a Director of ALPS Holdings, Inc. (“AHI”) (since 2005) and Director of Boston Financial Data Services, Inc. (“BFDS”), ALPS Advisors, Inc. (“AAI”), ALPS Distributors, Inc. (“ADI”), ALPS Fund Services, Inc. (“AFS”) and ALPS Portfolio Solutions Distributor, Inc. (“APSD”) and from 2001-2008, was President of AAI, ADI, AFS and APSD. Because of his positions with AHI, BFDS, AAI, ADI, AFS and APSD, Mr. Burke is deemed an affiliate of the Trust as defined under the 1940 Act. Mr. Burke is Trustee and President of the Clough Global Allocation Fund (Trustee since 2006; President since 2004); Trustee and President of the Clough Global Equity Fund (Trustee since 2006; President since 2005); Trustee and President of the Clough Global Opportunities Fund (since 2006); Trustee of the Liberty All-Star Equity Fund; and Director of the Liberty All-Star Growth Fund, Inc. | | 30 | | Mr. Burke is a Trustee of Clough Global Allocation Fund (1 fund); Clough Global Equity Fund (1 fund); Clough Global Opportunities Fund (1 fund); Trustee of the Liberty All-Star Equity Fund (1 fund); and Director of the Liberty All-Star Growth Fund, Inc. (1 fund). |
| * | All communications to Trustees and Officers may be directed to Financial Investors Trust c/o 1290 Broadway, Suite 1100, Denver, CO 80203. |
| ** | This is the period for which the Trustee or Officer began serving the Trust. Each Trustee and/or Officer serves an indefinite term, until his successor is elected. |
| *** | Except as otherwise indicated, each individual has held the office shown or other offices in the same company for the last five years. |
| **** | The Fund Complex includes all series of the Trust (currently 30) and any other investment companies for which any Trustee serves as Trustee for and which Disciplined Growth Investors, Inc. provides investment advisory services (currently none). |
| | |
32 | | 1-855-DGI-FUND (344-3863) | www.DGIfund.com |
| | |
| The Disciplined Growth Investors Fund | | Trustees and Officers |
| | April 30, 2014 (Unaudited) |
OFFICERS
| | | | | | |
Name, Address* & Year of Birth | | Position(s) Held with Fund | | Term of Office and Length of Time Served** | | Principal Occupation(s) During Past 5 Years*** |
Kimberly R. Storms, 1972 | | Treasurer | | Ms. Storms was elected Treasurer of the Trust at the March 12, 2013 meeting of the Board of Trustees. | | Ms. Storms is Senior Vice President - Director of Fund Administration of ALPS. Ms. Storms joined ALPS in 1998 as Assistant Controller. Because of her position with ALPS, Ms. Storms is deemed an affiliate of the Trust as defined under the 1940 Act. Ms. Storms is also Treasurer of BPV Family of Funds and ALPS Series Trust; Assistant Treasurer of Liberty All-Star Equity Fund and Liberty All-Star Growth Fund, Inc.; Assistant Treasurer of Tilson Funds; and Chief Financial Officer of The Arbitrage Funds. |
David T. Buhler, 1971 | | Secretary | | Mr. Buhler was elected Secretary of the Trust at the September 11, 2012 meeting of the Board of Trustees. | | Mr. Buhler joined ALPS in June 2010. He is currently Vice President and Senior Associate Counsel of ALPS, AAI, ADI and APSD. Prior to joining ALPS, Mr. Buhler served as Associate General Counsel and Assistant Secretary of Founders Asset Management LLC from 2006 to 2009. Because of his position with ALPS, Mr. Buhler is deemed an affiliate of the Trust as defined under the 1940 Act. Mr. Buhler is also the Secretary ALPS Variable Investment Trust and Westcore Trust. |
| Ted Uhl, 1974 | | Chief Compliance Officer (“CCO”) | | Mr. Uhl was appointed CCO of the Trust at the June 8, 2010 meeting of the Board of Trustees. | | Mr. Uhl joined ALPS in October 2006, and is currently Deputy Compliance Officer of ALPS. Prior to his current role, Mr. Uhl served as Senior Risk Manager for ALPS from October 2006 until June 2010. Before joining ALPS, Mr. Uhl served a Sr. Analyst with Enenbach and Associates (RIA), and a Sr. Financial Analyst at Sprint. Because of his position with ALPS, Mr. Uhl is deemed an affiliate of the Trust as defined under the 1940 Act. Mr. Uhl is also CCO of the Clough Global Funds, Reaves Utility Income Fund, Drexel Hamilton Funds and Transparent Value Trust. |
| | |
Annual Report | April 30, 2014 | | 33 |

TABLE OF CONTENTS
| | |
Emerald Banking and Finance Fund | | Manager Commentary |
| | April 30, 2014 (Unaudited) |
April 30, 2014
Dear Shareholder:
Investment Results
Bank stocks outperformed the broad market during the fiscal year. The SNL Small Cap U.S. Bank & Thrift Index1 gained 24.37% versus a 19.03% gain delivered by the Standard & Poor’s 500 Index2 and a gain of 20.50% for the Russell 2000 Index3. The Emerald Banking and Finance Fund Class A (without sales load) posted a 30.03% return, continuing its outperformance of the broader market Standard & Poor’s 500 and Russell 2000 indices, as well as the SNL Small Cap U.S. Bank & Thrift Index. Larger sized banks have not led the market as they did in the first half of our fiscal year but they did outperform the broader market: the SNL Large Cap U.S. Bank & Thrift index4 was up 21.63% versus 19.03% for the S&P 500.
Investment Analysis
The fact that smaller sized banks have outperformed the broader market is no surprise to us as we believe that banks and financials in general, should lead the market higher during a new bull market phase and yes - we still believe that we are in a long term bull market despite the recent pull-back. In our October, 2013 shareholder letter we stated that we believed that the outperformance by the small cap financials versus the market and the large cap financials will continue into 2014. Well that certainly has not been the case as first quarter 2014 earnings were a bit weak as in general we experienced margin compression. We believe the first quarter margin compression was the result of new loans coming into the loan portfolios at lower rates than those loans they were replacing. The lower yields we believe are the result of increased competition for loans that has been driven by pricing and the inability for banks in general to reduce their cost of deposits. We cautioned that the path of what we believe is a longer term bull market would not be a straight line “up and to the right.” Despite having passed the five year anniversary of the beginning of the financial crisis, we believe the bull cycle in small community banks is still in its early stages.
At April 30th 2014, the ten year U.S. Treasury note was yielding 2.65% after peaking during the third quarter of 2013 at 2.98% though it remains up 0.55% from early May of this year. Generally, a steeper long end results from a strengthening economy but we believe the steepening yield curve resulted more from the anticipation of “tapering” than the strengthening economy. Regardless, if and when rates stabilize above the 3% level, we believe upward EPS (or “earnings per share”) revisions will follow. More important to earnings at community banks would be an increase in short term rates as many variable rate C&I (commercial and industrial) loans are indexed off short term LIBOR which has decreased ever so slightly during the fiscal year. (LIBOR - the London Interbank Offered Rate - is the average interest rate estimated by leading banks in London that they would be charged if borrowing from other banks).
Market Outlook
Banks and thrifts have seen their multiples expand considerably in the last 12 months, with institutions that have shown the ability to grow leading the way. Banks and thrifts traded at an average price to tangible book value of 169% as of April 30th, down from roughly 175% when 2014 kicked off, but up significantly from 126.3% in 2013. We believe that this increase in bank currencies has helped acquirers engineer financially attractive deals that have often been praised by the marketplace. Sellers have been willing to take buyers’ stock simply because the currency has greater value today than it did in the recent past. Sellers have also seen the value of that currency increase after a deal is announced, particularly in cases of “transformational” transactions or when buyers have subsequently announced additional accretive acquisitions. With such support for many deals, it is not surprising that many of the banks trading at the highest price to tangible book value multiples are active acquirers in the bank space. We believe that the opportunity for mergers & acquisitions activity will continue throughout 2014 and into 2015 as the challenging rate and regulatory environment is encouraging many banks to consider not only selling, but to entertain combinations with institutions that are similar to their own size.
We believe that premium valuations will continue to be awarded to the acquirers but also to those banks that are delivering superior loan growth. While we expect not only banks growing by acquisition will continue to receive premium valuation but also those banks that can grow loans at a faster pace than their peers. However, an unusually severe winter coupled with strong loan growth in Q4’13 contributed to a slight decline in loan growth for the nation’s community banks in the first quarter of 2014. However, we remain encouraged that many of the banks that we follow have confirmed their original loan growth estimates for 2014 or in some instances increased guidance for loan growth despite the lackluster first quarter.
While we believe the interest rate environment presents an ongoing challenge and seems likely to do so well into 2015, we believe that notable management teams are focused on ongoing improvements in their bank’s cost structure and driving deposit growth in preparation for higher interest rates. With the sustained low interest rate environment, the industry had for years deemphasized the importance of deposits. We believe that the industry’s outlook for improved loan growth and expectations for rate hikes occurring, sooner rather than later, has brought the focus on core deposits front and center.
We believe that the market remains in the early stages of a long term recovery in bank stocks and remain confident in our expectations for improved fundamentals and continued consolidation amongst the small-to-mid capitalization bank and thrift stocks. However, we continue to
| | |
Annual Report | April 30, 2014 | | 1 |
| | |
Emerald Banking and Finance Fund | | Manager Commentary |
| | April 30, 2014 (Unaudited) |
believe stock selection remains paramount as earnings power remains challenging due to increased capital requirements, regulatory burdens, and a slow loan growth environment. This type of “stock pickers market” falls directly into the strengths of Emerald’s 10-Step research process and this combined with any increase in short term interest rates which are more directly beneficial to revenue growth at community banks as many variable rate C&I loans are indexed off short term LIBOR will provide momentum for the Fund in 2014.
| | |
Top Five Contributors to Return Included | | Top Five Detractors to Return Included |
BofI Holding, Inc. | | Health Insurance Innovations, Inc. |
Bank of the Ozarks, Inc. | | Glimcher Realty Trust |
Independent Bank Group, Inc. | | Walker & Dunlop, Inc. |
Signature Bank | | Campus Crest Communities, Inc. |
Home BancShares, Inc. | | American Campus Communities, Inc. |
| |

| |  |
Kenneth G. Mertz II, CFA | | Steven E. Russell, Esq. |
Chief Investment Officer | | Portfolio Manager |
Portfolio Manager | | |
| |
Emerald Mutual Fund Advisers Trust | | |
| (1) | SNL Small Cap Bank & Thrift Index: Includes all publicly traded (NYSE, NYSE Amex, NASDAQ, OTC BB, Pink Sheets) Banks and Thrifts in SNL’s coverage universe with $250M to $1B Total Common Market Capitalization as of most recent pricing data. Source: SNL Financial, data as of April 30, 2013. |
| (2) | The S&P 500® Total Return Index is an unmanaged index of 500 common stocks chosen for the market size, liquidity and industry group representation. It is a market-value weighted index. The index is not actively managed and does not reflect any deduction for fees, expenses or taxes. An investor may not invest directly into the index. |
| (3) | The Russell 2000® Index measures the performance of the small-cap segment of the U.S. equity universe. The Russell 2000® is a subset of the Russell 3000® Index representing approximately 10% of the total market capitalization of that index. It includes approximately 2000 of the smallest securities based on a combination of their market cap and current index membership. The index is not actively managed and does not reflect any deduction for fees, expenses or taxes. An investor may not invest directly into the index |
| (4) | SNL Large Cap U.S. Bank & Thrift Index: Includes all publicly traded (NYSE, NYSE Amex, NASDAQ, OTC BB, Pink Sheets) Banks and Thrifts in SNL’s coverage universe with greater than $5 billion Total Common Market Capitalization as of most recent pricing data. Source: SNL Financial, data as of April 30, 2013. |
| | |
2 | | www.emeraldmutualfunds.com |
| | |
Emerald Banking and Finance Fund | | Manager Commentary |
| | April 30, 2014 (Unaudited) |
| | | | | | |
TOP TEN HOLDINGS (as a % of Net Assets)* | | | | | | |
California Republic Bancorp | | | 3.51% | | | |
| | | |
PacWest Bancorp | | | 3.13% | | | |
| | | |
Bank of the Ozarks, Inc. | | | 3.09% | | | |
| | | |
Signature Bank | | | 2.94% | | | |
| | | |
SVB Financial Group | | | 2.61% | | | |
| | | |
BankUnited, Inc. | | | 2.44% | | | |
| | | |
Independent Bank Group, Inc. | | | 2.21% | | | |
| | | |
Eagle Bancorp, Inc. | | | 2.17% | | | |
| | | |
Customers Bancorp, Inc. | | | 2.16% | | | |
| | | |
Old Second Bancorp, Inc. | | | 2.15% | | | |
| | | |
Top Ten Holdings | | | 26.41% | | | |
| | | |
| |
INDUSTRY SECTOR ALLOCATION (as a % of Net Assets) | | | |
Banks: Diversified | | | 73.82% | | | |
| | | |
Banks: Savings, Thrift & Mortgage Lending | | | 6.88% | | | |
| | | |
Insurance: Property-Casualty | | | 5.22% | | | |
| | | |
Commercial Banks | | | 3.89% | | | |
| | | |
Asset Management & Custodian | | | 2.66% | | | |
| | | |
Consumer Lending | | | 1.46% | | | |
| | | |
Real Estate Investment Trusts (REITs) | | | 1.26% | | | |
| | | |
Commercial Finance & Mortgage Companies | | | 0.87% | | | |
| | | |
Leisure Equipment & Products | | | 0.85% | | | |
| | | |
Diversified Financial Services | | | 0.81% | | | |
| | | |
Financial Data & Services | | | 0.64% | | | |
| | | |
Real Estate Management & Development | | | 0.26% | | | |
| | | |
Cash, Cash Equivalents, & Other Net Assets | | | 1.38% | | | |
| | | |
* Holdings are subject to change. Tables present indicative values only. | | | |
| | | | | | |
| | | | | | |
| | | | | | |
| | | | | | |
| | | | | | |
| | | | | | |
| | | | | | |
| | | | | | |
| | | | | | |
| | | | | | |
| | | | | | |
| | | | | | |
| | | | | | |
| | | | | | |
| | | | | | |
| | | | | | |
| | | | | | |
| | | | | | |
GROWTH OF $10,000 INVESTMENT IN THE FUND (for the year ended April 30, 2014)
Comparison of change in value of a $10,000 investment (includes applicable sales loads)
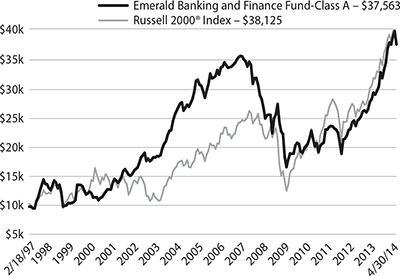
The chart represents historical performance of a hypothetical investment of $10,000 in the Fund since inception. Past performance does not guarantee future results. This chart does not reflect the deduction of taxes that a shareholder would pay on Fund distributions or the redemption of Fund shares.
| | | | | | | | | | | | | | |
AVERAGE ANNUAL TOTAL RETURN (for the period ended April 30, 2014) |
| | | | | | | | | | | | | | | | | | | | | | | | | | | | | | | | | | | |
| | | | | | | | | | | Since | | Expense Ratio |
| | | 1 Year | | 3 Year | | 5 Year | | 10 Year | | Inception1 | | Gross2 | | Net2 |
Class A (NAV) | | | | 30.03% | | | | | 17.10% | | | | | 14.95% | | | | | 3.70% | | | | | 8.31% | | | | | 1.72% | | | | | 1.72% | |
Class A (MOP) | | | | 23.86% | | | | | 15.22% | | | | | 13.84% | | | | | 3.20% | | | | | 8.00% | | | | | 1.72% | | | | | 1.72% | |
Russell 2000® Index† | | | | 20.50% | | | | | 10.74% | | | | | 19.84% | | | | | 8.67% | | | | | 8.09% | | | | | | | | | | | |
Class C (NAV) | | | | 29.25% | | | | | 16.40% | | | | | 14.23% | | | | | 3.06% | | | | | 8.50% | | | | | 2.38% | | | | | 2.38% | |
Class C (CDSC) | | | | 28.25% | | | | | 16.40% | | | | | 14.23% | | | | | 3.06% | | | | | 8.50% | | | | | 2.38% | | | | | 2.38% | |
Russell 2000® Index | | | | 20.50% | | | | | 10.74% | | | | | 19.84% | | | | | 8.67% | | | | | 8.09% | | | | | | | | | | | |
Investor Class | | | | 30.06% | | | | | 17.26% | | | | | – | | | | | – | | | | | 13.48% | | | | | 1.69% | | | | | 1.69% | |
Russell 2000® Index | | | | 20.50% | | | | | 10.74% | | | | | 19.84% | | | | | 8.67% | | | | | 8.09% | | | | | | | | | | | |
Institutional Class | | | | 30.47% | | | | | – | | | | | – | | | | | – | | | | | 23.41% | | | | | 1.37% | | | | | 1.37% | |
Russell 2000® Index | | | | 20.50% | | | | | 10.74% | | | | | 19.84% | | | | | 8.67% | | | | | 8.09% | | | | | | | | | | | |
The performance quoted represents past performance, does not guarantee future results and current performance may be lower or higher than the data quoted. The investment return and principal value of an investment will fluctuate so that shares, when redeemed, may be worth more or less than their original cost. Performance data current to the most recent month end may be obtained at www.emeraldmutualfunds.com.
Performance shown for periods prior to March 16, 2012, reflects the performance of the Forward Banking & Finance Fund, a series of Forward Funds (as a result of a reorganization of the Forward Banking & Finance Fund into the Emerald Banking & Finance Fund).
Maximum Offering Price (MOP) for Class A shares includes the Fund’s maximum sales charge of 4.75%. Performance shown at NAV does not include these sales charges and would have been lower had it been taken into account.
| | |
Annual Report | April 30, 2014 | | 3 |
| | |
Emerald Banking and Finance Fund | | Manager Commentary |
| | April 30, 2014 (Unaudited) |
A Contingent Deferred Sales Charge (CDSC) of 1.00% may apply to Class C shares redeemed within the first 12 months after a purchase.
| 1 | Inception Dates - Class A: 02/18/1997, Class C: 07/01/2000, Class Institutional: 03/19/2012, Class Investor: 03/16/2010 |
| 2 | Emerald Mutual Fund Advisers Trust (“Emerald” or the “Adviser”) has agreed contractually to waive a portion of its fees and reimburse other expenses until August 31, 2014 in amounts necessary to limit the Fund’s operating expenses (exclusive of Acquired Fund Fees and Expenses, brokerage expenses, interest expenses, taxes and extraordinary expense) for Class A, Class C, Institutional Class, and Investor Class shares to an annual rate (as percentage of the Fund’s average daily net assets) of 1.84%, 2.49%, 1.54% and 1.89% respectively. The Adviser will be permitted to recover, on a class-by-class basis, expenses it has borne through the agreement described above to the extent that the Fund’s expenses in later periods fall below the annual rates set forth in the relevant agreement. The Fund will not be obligated to pay any such deferred fees and expenses more than three years after the year(s) in which the fees and expense were incurred. The Adviser may not discontinue this waiver prior to August 31, 2014, without the approval by the Fund’s Board of Trustees. |
| † | The Russell 2000® Index measures the performance of the small-cap segment of the U.S. equity universe. The Russell 2000® is a subset of the Russell 3000® Index representing approximately 10% of the total market capitalization of that index. It includes approximately 2000 of the smallest securities based on a combination of their market cap and current index membership. The index is not actively managed and does not reflect any deductions for fees, expenses or taxes. An investor may not invest directly into an index. |
Important Risks
The views and information discussed in this commentary are as of the date of publication, are subject to change, and may not reflect the writer’s current views. The views expressed represent an assessment of market conditions at a specific point in time, are opinions only and should not be relied upon as investment advice regarding a particular investment or markets in general. Such information does not constitute a recommendation to buy or sell specific securities or investment vehicles. It should not be assumed that any investment will be profitable or will equal the performance of the Fund or any securities or any sectors mentioned herein. The subject matter contained herein has been derived from several sources believed to be reliable and accurate at the time of compilation. Emerald Mutual Fund Advisors Trust does not accept any liability for losses either direct or consequential caused by the use of this information.
A fund that concentrates in a particular industry will involve a greater degree of risk than a fund with a more diversified portfolio. Investing in smaller companies generally will present greater investment risks, including: greater price volatility, greater sensitivity to changing economic conditions and less liquidity than the securities of larger, more mature companies.
| | |
4 | | www.emeraldmutualfunds.com |
| | |
| Emerald Growth Fund | | Manager Commentary |
| | April 30, 2014 (Unaudited) |
April 30, 2014
Dear Shareholder:
Investment Results
The performance of the Emerald Growth Fund’s Class A shares (without sales load), for the twelve months ended April 30, 2014, reflected a gain of 26.01% outpacing the Russell 2000 Growth Index1 which gained 21.46%.
The climate of the last twelve months was favorable for small capitalization stocks driving a 20.5% return for the Russell 2000 Index2. Within small caps, the growth style was a particular standout, with the Russell 2000 Growth surging 21.46% for the year, topping the Russell 2000 Value Index3 gain of 19.61%.
Investment Analysis
Over the last twelve months, the market, the economy, the consumer and the investment community made a significant amount of progress toward putting the financial crisis in the rearview mirror. Significant gains in the equity market and in housing values helped to further solidify the consumer’s balance sheet, giving consumers the confidence to again invest in new homes, remodel their existing homes and buy new cars at rates we haven’t experienced since the financial crisis began in 2008. At the corporate level, strong gains in the equity markets have also helped the average pension fund make significant progress toward regaining their funded status. According to Towers Watson, pension funding levels for 418 of the Fortune 1000 companies, rose 16 percentage points to end 2013 at 93%. While still not the 100% funding achieved in 2007, the path to full funding appears much more attainable given recent market gains. Strong gains in the market has also helped drive an acceleration in deal activity with domestic merger and acquisition activity increasing 11% year over year and surpassing $1 trillion in deal value. Again, representing the highest levels achieved since the start of the financial crisis. The initial public offering market similarly accelerated with the total number of companies coming public during 2013 increasing 59% to 230 and the amount raised climbing 31% to $62 billion, levels that haven’t been witnessed since 2007.
The resolution of the government’s action against the major banks associated with mortgage lending with the record $13 billion settlement with JP Morgan as well as the government’s crackdown on insider trading with the landmark case against SAC Capital should also go a long way toward restoring investor confidence in the integrity of the market.
As noted above, the Emerald Growth Fund outperformed its benchmark for the trailing 12-month period ended April 30, 2014. At the sector level relative outperformance was driven by stock selection within the healthcare, energy, financial services and materials sectors, which offset relative underperformance within the technology, consumer staples and producer durables sectors.
The healthcare sector represented the largest source of relative outperformance for the portfolio. Stock selection within the biotechnology and pharmaceutical industries were the largest drivers of the relative outperformance as the portfolio was able to participate in and benefit from the resurgence in drug development, specifically in the areas of rare diseases, that has been the driving force behind the industries outperformance over the better part of the last two years. At the stock level, shares of Intercept Pharmaceuticals were the largest contributor to return. Shares of Intercept Pharmaceuticals appreciated in response to the company’s announcement that a government sponsored study of their drug, Obetacholic Acid (OCA), was stopped early due to profound efficacy for treatment of non-alcoholic steatohepatitis (NASH). NASH is a large market, affecting approximately 2-3% of the US population. This is just one example of the innovation that is currently ongoing within the biotechnology industry.
The outperformance in the aforementioned was partially offset by relative underperformance within the technology, consumer staples and producer durables sectors. Performance within the technology sector was challenged during the trailing period due to stock selection within the communications technology industry. Performance within the consumer staples and producer durables sectors lagged only as result of the sectors underweighting relative to the index as stock selection within both of these sectors was a positive contributor to return.
Market Outlook
From a macro-economic perspective, although 2014 got off to a challenging start due to the polar vortex and record setting snowfall dampened domestic gross domestic product (GDP) growth and earnings growth alike, Emerald continues to believe that earnings growth across all capitalizations are poised to accelerate in 2014, in conjunction with accelerating global developed market growth. The domestic macro-economic backdrop is looking more positive after a weak start to the year, with recent strength in the Institute for Supply Management Survey results, auto sales and a brightening picture for non-residential construction. While weather has certainly hindered investment during the early part of calendar 2014, we continue to believe that a reacceleration in domestic capital investment remains an opportunity. Further, we believe that the innovation cycle that has fueled earnings growth over the last three years remains ongoing and broad-based with opportunities spanning biotechnology, medical devices, exploration and production, software (cloud delivery) and security to financial services, materials and industrials. Small capitalization stocks, in our opinion, have, and continue to be, at the epicenter of this innovation cycle.
| | |
Annual Report | April 30, 2014 | | 5 |
| | |
| Emerald Growth Fund | | Manager Commentary |
| | April 30, 2014 (Unaudited) |
As always, Emerald remains focused on utilizing its fundamental bottom-up research process to identify the best growth opportunities within the small capitalization universe.
| | | | |
| | |
Top Contributors to Return Included | | Top Detractors to Return Included | | |
Intercept Pharmaceuticals Inc. | | Infinity Pharmaceuticals, Inc. | | |
NPS Pharmaceuticals, Inc. | | Imperva, Inc. | | |
Spirit Airlines, Inc. | | Tile Shop Holdings, Inc. | | |
Insys Therapeutics, Inc. | | Rally Software Development Corp. | | |
Magnum Hunter Resources Corporation | | Aruba Networks, Inc. | | |
| | |

| |  | |  |
Kenneth G. Mertz II, CFA | | Stacey L. Sears | | Joseph W. Garner |
Chief Investment Officer | | Portfolio Manager | | Portfolio Manager |
Portfolio Manager | | | | |
| | |
Emerald Mutual Fund Advisers Trust | | | | |
| (1) | The Russell 2000® Growth Index measures the performance of the small-cap growth segment of the U.S. equity universe. It includes those Russell 2000® Index companies with higher price-to-value ratios and higher forecasted growth values. The index is not actively managed and does not reflect any deductions for fees, expenses or taxes. An investor may not invest directly into the index. |
| (2) | The Russell 2000® Index measures the performance of the small-cap segment of the U.S. equity universe. The Russell 2000® is a subset of the Russell 3000® Index representing approximately 10% of the total market capitalization of that index. It includes approximately 2000 of the smallest securities based on a combination of their market cap and current index membership. The index is not actively managed and does not reflect any deduction for fees, expenses or taxes. An investor may not invest directly into the index. |
| (3) | The Russell 2000® Value Index measures the performance of small-cap value segment of the U.S. equity universe. It includes those Russell 2000® companies with lower price-to-book ratios and lower forecasted growth values. The Russell 2000® Value Index is constructed to provide a comprehensive and unbiased barometer for the small-cap value segment. The Index is completely reconstituted annually to ensure larger stocks do not distort the performance and characteristics of the true small-cap opportunity set and that the represented companies continue to reflect value characteristics. The index is not actively managed and does not reflect any deductions for fees, expenses or taxes. An investor may not invest directly into the index. |
| | |
6 | | www.emeraldmutualfunds.com |
| | |
| Emerald Growth Fund | | Manager Commentary |
| | April 30, 2014 (Unaudited) |
| | | | | | |
TOP TEN HOLDINGS (as a % of Net Assets)* | | | |
Spirit Airlines, Inc. | | | 2.99% | | | |
| | | |
Trex Co., Inc. | | | 2.78% | | | |
| | | |
MWI Veterinary Supply, Inc. | | | 2.74% | | | |
| | | |
Bank of the Ozarks, Inc. | | | 1.88% | | | |
| | | |
Acadia Healthcare Co., Inc. | | | 1.67% | | | |
| | | |
PolyOne Corp. | | | 1.62% | | | |
| | | |
Magnum Hunter Resources Corp. | | | 1.62% | | | |
| | | |
H&E Equipment Services, Inc. | | | 1.60% | | | |
| | | |
Opus Bank | | | 1.58% | | | |
| | | |
HomeAway, Inc. | | | 1.45% | | | |
| | | |
Top Ten Holdings | | | 19.93% | | | |
| | | |
| | | | | | |
| INDUSTRY SECTOR ALLOCATION | | | |
(as a % of Net Assets) | | | | | | |
Health Care | | | 22.56% | | | |
| | | |
Financial Services | | | 16.54% | | | |
| | | |
Technology | | | 15.78% | | | |
| | | |
Producer Durables | | | 15.23% | | | |
| | | |
Consumer Discretionary | | | 15.19% | | | |
| | | |
Materials & Processing | | | 7.43% | | | |
| | | |
Energy | | | 4.62% | | | |
| | | |
Utilities | | | 1.82% | | | |
| | | |
Cash, Cash Equivalents, & Other Net Assets | | | 0.83% | | | |
| | | |
* Holdings are subject to change. Tables present indicative values only. | | | |
| | | | | | |
| | | | | | |
| | | | | | |
| | | | | | |
| | | | | | |
| | | | | | |
| | | | | | |
| | | | | | |
| | | | | | |
| | | | | | |
| | | | | | |
| | | | | | |
| | | | | | |
| | | | | | |
| | | | | | |
| | | | | | |
| | | | | | |
| | | | | | |
| | | | | | |
| | | | | | |
| | | | | | |
| | | | | | |
| | | | | | |
| | | | | | |
| | | | | | |
| | | | | | |
| | | | | | |
| | | | | | |
GROWTH OF $10,000 INVESTMENT IN THE FUND (for the year ended April 30, 2014)
Comparison of change in value of a $10,000 investment (includes applicable sales loads)
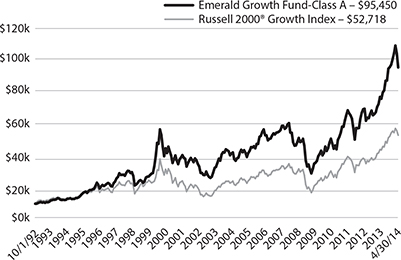
The chart represents historical performance of a hypothetical investment of $10,000 in the Fund since inception. Past performance does not guarantee future results. This chart does not reflect the deduction of taxes that a shareholder would pay on Fund distributions or the redemption of Fund shares.
| | | | | | | | | | | | | | |
AVERAGE ANNUAL TOTAL RETURN (for the year ended April 30, 2014) |
| | | | | | | | | | | | | | | | | | | | | | | | | | | | |
| | | | | | |
| | | | | | | | | | | | | | | Since | | | Expense Ratio | |
| | | 1 Year | | | 3 Year | | | 5 Year | | | 10 Year | | | Inception1 | | | Gross2 | | | Net2 | |
Class A (NAV) | | | 26.01 | % | | | 11.74 | % | | | 22.37 | % | | | 9.06 | % | | | 11.27 | % | | | 1.31 | % | | | 1.29 | % |
Class A (MOP) | | | 20.01 | % | | | 9.93 | % | | | 21.20 | % | | | 8.53 | % | | | 11.02 | % | | | 1.31 | % | | | 1.29 | % |
Russell 2000® Growth Index† | | | 21.46 | % | | | 10.33 | % | | | 20.50 | % | | | 8.85 | % | | | 8.01 | % | | | | | | | | |
Class C (NAV) | | | 25.19 | % | | | 11.00 | % | | | 21.58 | % | | | 8.40 | % | | | 5.04 | % | | | 1.96 | % | | | 1.94 | % |
Class C (CDSC) | | | 24.19 | % | | | 11.00 | % | | | 21.58 | % | | | 8.40 | % | | | 5.04 | % | | | 1.96 | % | | | 1.94 | % |
Russell 2000® Growth Index | | | 21.46 | % | | | 10.33 | % | | | 20.50 | % | | | 8.85 | % | | | 8.01 | % | | | | | | | | |
Investor Class | | | 25.93 | % | | | | – | | | | – | | | | – | | | 12.22 | % | | | 1.34 | % | | | 1.34 | % |
Russell 2000® Growth Index | | | 21.46 | % | | | 10.33 | % | | | 20.50 | % | | | 8.85 | % | | | 8.01 | % | | | | | | | | |
Institutional Class | | | 26.35 | % | | | 12.06 | % | | | 22.73 | % | | | | – | | | 18.23 | % | | | 1.00 | % | | | 0.99 | % |
Russell 2000® Growth Index | | | 21.46 | % | | | 10.33 | % | | | 20.50 | % | | | 8.85 | % | | | | – | | | | | | | | |
The performance quoted represents past performance, does not guarantee future results and current performance may be lower or higher than the data quoted. The investment return and principal value of an investment will fluctuate so that shares, when redeemed, may be worth more or less than their original cost. Performance data current to the most recent month end may be obtained at www.emeraldmutualfunds.com.
Performance shown for periods prior to March 16, 2012, reflects the performance of the Forward Growth Fund, a series of Forward Funds (as a result of a reorganization of the Forward Growth Fund into the Emerald Growth Fund).
| | |
Annual Report | April 30, 2014 | | 7 |
| | |
| Emerald Growth Fund | | Manager Commentary |
| | April 30, 2014 (Unaudited) |
Maximum Offering Price (MOP) for Class A shares includes the Fund’s maximum sales charge of 4.75%. Performance shown at NAV does not include these sales charges and would have been lower had it been taken into account.
A Contingent Deferred Sales Charge (CDSC) of 1.00% may apply to Class C shares redeemed within the first 12 months after a purchase.
| 1 | Inception Dates – Class A: 10/01/1992, Class C: 07/01/2000, Class Institutional: 10/21/2008, Class Investor: 05/01/2011 |
| 2 | Emerald Mutual Fund Advisers Trust (“Emerald” or the “Adviser”) has agreed contractually to waive a portion of its fees and reimburse other expenses until August 31, 2014 in amounts necessary to limit the Fund’s operating expenses (exclusive of Acquired Fund Fees and Expenses, brokerage expenses, interest expenses, taxes and extraordinary expense) for Class A, Class C, Institutional Class, and Investor Class shares to an annual rate (as percentage of the Fund’s average daily net assets) of 1.29%, 1.94%, 0.99% and 1.34% respectively. The Adviser will be permitted to recover, on a class-by-class basis, expenses it has borne through the agreement described above to the extent that the Fund’s expenses in later periods fall below the annual rates set forth in the relevant agreement. The Fund will not be obligated to pay any such deferred fees and expenses more than three years after the year(s) in which the fees and expense were incurred. The Adviser may not discontinue this waiver prior to August 31, 2014, without the approval by the Fund’s Board of Trustees. |
| † | The Russell 2000® Growth Index measures the performance of the small-cap growth segment of the U.S. equity universe. It includes those Russell 2000® Index companies with higher price-to-value ratios and higher forecasted growth values. The index is not actively managed and does not reflect any deduction for fees, expenses or taxes. An Investor may not invest directly into an index. |
Important Risks
The views and information discussed in this commentary are as of the date of publication, are subject to change, and may not reflect the writer’s current views. The views expressed represent an assessment of market conditions at a specific point in time, are opinions only and should not be relied upon as investment advice regarding a particular investment or markets in general. Such information does not constitute a recommendation to buy or sell specific securities or investment vehicles. It should not be assumed that any investment will be profitable or will equal the performance of the Fund or any securities or any sectors mentioned herein. The subject matter contained herein has been derived from several sources believed to be reliable and accurate at the time of compilation. The Fund does not accept any liability for losses either direct or consequential caused by the use of this information.
Investing in smaller companies generally will present greater investment risks, including: greater price volatility, greater sensitivity to changing economic conditions and less liquidity than the securities of larger, more mature companies.
| | |
8 | | www.emeraldmutualfunds.com |
| | |
| Emerald Funds | | Disclosure of Fund Expenses |
| | April 30, 2014 (Unaudited) |
As a shareholder of the Funds, you incur two types of costs: (1) transaction costs, including applicable sales charges (loads); and (2) ongoing costs, including management fees, distribution and service (12b-1) fees, shareholder services fees and other Fund expenses. This example is intended to help you understand your ongoing costs (in dollars) of investing in the Funds and to compare these costs with the ongoing costs of investing in other mutual funds. The example is based on an investment of $1,000 invested at the beginning of the (six-month) period and held for the entire period November 1, 2013 through April 30, 2014.
Actual Expenses
The first line for each share class of each Fund in the table provides information about actual account values and actual expenses. You may use this information, together with the amount you invested, to estimate the expenses that you paid over the period. Simply divide your account value by $1,000 (for example, an $8,600 account value divided by $1,000 = 8.6), then multiply the result by the number in the applicable line under the heading entitled “Expenses Paid During Period” to estimate the expenses you paid on your account during this period.
Hypothetical Example For Comparison Purposes
The second line for each share class of each Fund in the table below provides information about hypothetical account values and hypothetical expenses based on the Fund’s actual expense ratio and an assumed rate of return of 5% per year before expenses, which is not the Fund’s actual return. The hypothetical account values and expenses may not be used to estimate the actual ending account balance or expenses you paid for the period. You may use this information to compare the ongoing costs of investing in the Funds and other funds. To do so, compare this 5% hypothetical example with the 5% hypothetical examples that appear in the shareholder reports of other funds.
Please note that the expenses shown in the table below are meant to highlight your ongoing costs only and do not reflect any transactional costs, such as sales charges (loads), redemption fees or exchange fees. Therefore, the second line for each share class of each Fund within the table is useful in comparing ongoing costs only, and will not help you determine the relative total costs of owning different funds. If these transactional costs were included, your costs would have been higher.
| | | | | | | | |
| Emerald Banking and Finance Fund | | Beginning
Account Value
11/01/13 | | Ending
Account Value
04/30/14 | | Expense
Ratio(a) | | Expense Paid
During Period
11/01/13 - 4/30/14(b) |
Class A | | | | | | | | |
Actual | | $ 1,000.00 | | $ 1,092.90 | | 1.64% | | $ 8.51 |
Hypothetical (5% return before expenses) | | $ 1,000.00 | | $ 1,016.66 | | 1.64% | | $ 8.20 |
| | | | | | | | | |
Class C | | | | | | | | |
Actual | | $ 1,000.00 | | $ 1,089.50 | | 2.30% | | $ 11.92 |
Hypothetical (5% return before expenses) | | $ 1,000.00 | | $ 1,013.39 | | 2.30% | | $ 11.48 |
| | | | | | | | | |
Institutional Class | | | | | | | | |
Actual | | $ 1,000.00 | | $ 1,094.50 | | 1.33% | | $ 6.91 |
Hypothetical (5% return before expenses) | | $ 1,000.00 | | $ 1,018.20 | | 1.33% | | $ 6.66 |
| | | | | | | | | |
Investor Class | | | | | | | | |
Actual | | $ 1,000.00 | | $ 1,093.10 | | 1.60% | | $ 8.30 |
Hypothetical (5% return before expenses) | | $ 1,000.00 | | $ 1,016.86 | | 1.60% | | $ 8.00 |
| (a) | The Fund’s expense ratios have been based on the Fund’s most recent fiscal half-year expenses. |
| (b) | Expenses are equal to the Fund’s annualized expense ratio multiplied by the average account value over the period, multiplied by the number of days in the most recent fiscal half-year (181)/365 (to reflect the half-year period). |
| | |
Annual Report | April 30, 2014 | | 9 |
| | |
| Emerald Funds | | Disclosure of Fund Expenses |
| | April 30, 2014 (Unaudited) |
| | | | | | | | |
| Emerald Growth Fund | | Beginning
Account Value
11/01/13 | | Ending
Account Value
04/30/14 | | Expense
Ratio(a) | | Expense Paid
During Period
11/01/13 - 4/30/14(b) |
Class A | | | | | | | | |
Actual | | $ 1,000.00 | | $ 997.90 | | 1.29% | | $ 6.39 |
Hypothetical (5% return before expenses) | | $ 1,000.00 | | $ 1,018.40 | | 1.29% | | $ 6.46 |
| | | | | | | | | |
Class C | | | | | | | | |
Actual | | $ 1,000.00 | | $ 994.60 | | 1.94% | | $ 9.59 |
Hypothetical (5% return before expenses) | | $ 1,000.00 | | $ 1,015.17 | | 1.94% | | $ 9.69 |
| | | | | | | | | |
Institutional Class | | | | | | | | |
Actual | | $ 1,000.00 | | $ 998.90 | | 0.99% | | $ 4.91 |
Hypothetical (5% return before expenses) | | $ 1,000.00 | | $ 1,019.89 | | 0.99% | | $ 4.96 |
| | | | | | | | | |
Investor Class | | | | | | | | |
Actual | | $ 1,000.00 | | $ 997.30 | | 1.34% | | $ 6.64 |
Hypothetical (5% return before expenses) | | $ 1,000.00 | | $ 1,018.15 | | 1.34% | | $ 6.71 |
| (a) | The Fund’s expense ratios have been based on the Fund’s most recent fiscal half-year expenses. |
| (b) | Expenses are equal to the Fund’s annualized expense ratio multiplied by the average account value over the period, multiplied by the number of days in the most recent fiscal half-year (181)/365 (to reflect the half-year period). |
| | |
10 | | www.emeraldmutualfunds.com |
| | |
| Emerald Banking and Finance Fund | | Schedule of Investments |
| | April 30, 2014 |
| | | | | | | | | | |
Shares | | | | | Value
(Note 2) | |
COMMON STOCKS: 98.62% | |
Consumer Discretionary: 0.85% | |
| | | Leisure Equipment & Products: 0.85% | |
| | | 53,830 | | | Diamond Resorts International, Inc.(a) | | $ | 1,007,160 | |
| | | | | | | | | | |
| | | | | | | | | | |
Financial Services: 97.77% | |
| | | Asset Management & Custodian: 2.66% | |
| | | 35,380 | | | Apollo Global Management LLC, Class A | | | 959,860 | |
| | | 10,284 | | | Artisan Partners Asset Management, Inc., Class A | | | 597,192 | |
| | | 18,220 | | | KKR & Co. LP | | | 413,776 | |
| | | 50,000 | | | Silvercrest Asset Management Group, Inc., Class A | | | 870,000 | |
| | | 26,770 | | | WisdomTree Investments, Inc.(a) | | | 302,233 | |
| | | | | | | | | 3,143,061 | |
| | | | | | | | | | |
| | | | Banks: Diversified: 73.82% | |
| | | 37,200 | | | Alerus Financial Corp. | | | 1,962,300 | |
| | | 25,532 | | | American Business Bank(a) | | | 741,449 | |
| | | 94,090 | | | Ameris Bancorp(a) | | | 2,001,294 | |
| | | 31,650 | | | Atlas Financial Holdings, Inc.(a) | | | 441,834 | |
| | | 60,968 | | | Bank of the Ozarks, Inc. | | | 3,651,983 | |
| | | 87,453 | | | BankUnited, Inc. | | | 2,885,074 | |
| | | 95,070 | | | BNC Bancorp | | | 1,549,641 | |
| | | 3,235 | | | Bofl Holding, Inc.(a) | | | 260,773 | |
| | | 38,500 | | | Bridge Bancorp, Inc. | | | 936,320 | |
| | | 18,290 | | | Bryn Mawr Bank Corp. | | | 498,951 | |
| | | 156,489 | | | California Republic Bancorp(a) | | | 4,146,959 | |
| | | 154,670 | | | Cascade Bancorp(a) | | | 731,589 | |
| | | 54,424 | | | Center Bancorp, Inc. | | | 1,007,388 | |
| | | 48,270 | | | Centerstate Banks, Inc. | | | 529,522 | |
| | | 7,571 | | | Citizens Financial Services, Inc. | | | 399,370 | |
| | | 206,178 | | | CoBiz Financial, Inc. | | | 2,070,027 | |
| | | 89,500 | | | CommerceWest Bank(a) | | | 1,181,400 | |
| | | 13,874 | | | CommunityOne Bancorp(a) | | | 135,272 | |
| | | 46,280 | | | ConnectOne Bancorp, Inc.(a) | | | 2,221,440 | |
| | | 922 | | | Consumers Bancorp, Inc. | | | 18,440 | |
| | | 23,426 | | | Cortland Bancorp | | | 275,021 | |
| | | 70,029 | | | CU Bancorp(a) | | | 1,271,026 | |
| | | 116,075 | | | Customers Bancorp, Inc.(a) | | | 2,557,132 | |
| | | 76,890 | | | Eagle Bancorp, Inc.(a) | | | 2,567,357 | |
| | | 23,220 | | | East West Bancorp, Inc. | | | 801,322 | |
| | | 8,450 | | | Evans Bancorp, Inc. | | | 190,759 | |
| | | 117,085 | | | EverBank Financial Corp. | | | 2,191,831 | |
| | | 104,453 | | | Farmers National Banc Corp. | | | 799,065 | |
| | | 65,100 | | | First Bank(a) | | | 413,385 | |
| | | 29,445 | | | First Business Financial Services, Inc. | | | 1,331,208 | |
| | | 21,150 | | | First Financial Bankshares, Inc. | | | 1,248,908 | |
| | | 27,322 | | | First Financial Holdings, Inc. | | | 1,570,195 | |
| | | 78,450 | | | First NBC Bank Holding Co.(a) | | | 2,439,795 | |
| | | 26,150 | | | First of Long Island Corp. | | | 948,461 | |
| | | | | | | | | | |
| Shares | | | | | Value
(Note 2) | |
| | | | Banks: Diversified (continued) | |
| | | 126,310 | | | Flagstar Bancorp, Inc.(a) | | $ | 2,223,056 | |
| | | 22,506 | | | Guaranty Bancorp | | | 283,351 | |
| | | 106,537 | | | Heritage Oaks Bancorp(a) | | | 789,439 | |
| | | 50,540 | | | Home BancShares, Inc. | | | 1,602,623 | |
| | | 16,003 | | | HopFed Bancorp, Inc. | | | 182,114 | |
| | | 59,296 | | | Howard Bancorp, Inc.(a) | | | 639,211 | |
| | | 15,250 | | | Independent Bank Corp. | | | 566,080 | |
| | | 50,000 | | | Independent Bank Corporation | | | 651,000 | |
| | | 53,000 | | | Independent Bank Group, Inc. | | | 2,608,130 | |
| | | 34,233 | | | Investors Bancorp, Inc. | | | 915,048 | |
| | | 14,700 | | | John Marshall Bank(a) | | | 267,393 | |
| | | 13,203 | | | Lakeland Financial Corp. | | | 483,230 | |
| | | 20,777 | | | Meridian Interstate Bancorp,
Inc.(a) | | | 525,035 | |
| | | 29,870 | | | Meta Financial Group, Inc. | | | 1,251,852 | |
| | | 52,180 | | | Northeast Bancorp | | | 507,190 | |
| | | 6,224 | | | Oak Valley Bancorp | | | 61,369 | |
| | | 73,738 | | | Old Line Bancshares, Inc. | | | 1,251,334 | |
| | | 120,532 | | | Pacific Premier Bancorp, Inc.(a) | | | 1,645,262 | |
| | | 93,875 | | | PacWest Bancorp | | | 3,695,859 | |
| | | 55,882 | | | Peoples Bancorp, Inc. | | | 1,456,844 | |
| | | 33,413 | | | Peoples Financial Corp.(a) | | | 451,243 | |
| | | 24,300 | | | Pinnacle Financial Partners, Inc. | | | 840,051 | |
| | | 40,440 | | | PrivateBancorp, Inc. | | | 1,114,931 | |
| | | 12,080 | | | Prosperity Bancshares, Inc. | | | 712,720 | |
| | | 12,860 | | | Renasant Corp. | | | 350,049 | |
| | | 84,050 | | | Shore Bancshares, Inc.(a) | | | 797,635 | |
| | | 29,220 | | | Signature Bank(a) | | | 3,471,920 | |
| | | 31,940 | | | Simmons First National Corp., Class A | | | 1,154,950 | |
| | | 5,582 | | | Southern Missouri Bancorp, Inc. | | | 197,045 | |
| | | 20,598 | | | Southern National Bancorp of Virginia, Inc. | | | 212,777 | |
| | | 61,563 | | | Square 1 Financial, Inc.,
Class A(a) | | | 1,160,463 | |
| | | 28,878 | | | SVB Financial Group(a) | | | 3,080,994 | |
| | | 52,682 | | | Talmer Bancorp, Inc., Class A(a) | | | 706,466 | |
| | | 39,070 | | | Texas Capital Bancshares,
Inc.(a) | | | 2,195,343 | |
| | | 171,288 | | | VantageSouth Bancshares,
Inc.(a) | | | 1,051,708 | |
| | | 24,349 | | | Washington Banking Co. | | | 418,803 | |
| | | 53,500 | | | WashingtonFirst Bankshares, Inc. | | | 829,250 | |
| | | 38,229 | | | Western Alliance Bancorp(a) | | | 881,943 | |
| | | | | | | | | 87,210,202 | |
| | | | | | | | | | |
| | | | Banks: Savings, Thrift & Mortgage Lending: 6.88% | |
| | | 225,594 | | | Atlantic Coast Financial Corp.(a) | | | 970,054 | |
| | | 11,750 | | | Bridge Capital Holdings(a) | | | 263,200 | |
| | | 36,162 | | | Elmira Savings Bank | | | 836,065 | |
| | | 12,500 | | | Flushing Financial Corp. | | | 240,250 | |
| | | 81,731 | | | Heritage Financial Corp. | | | 1,320,773 | |
| | | 21,460 | | | Heritage Financial Group, Inc. | | | 413,105 | |
| | | 11,680 | | | Home Bancorp, Inc.(a) | | | 236,520 | |
| | | 18,520 | | | Home Federal Bancorp, Inc. | | | 337,990 | |
| | | 36,429 | | | Mackinac Financial Corp. | | | 473,577 | |
| | | 53,750 | | | Opus Bank(a) | | | 1,614,113 | |
| | | 104,750 | | | Sterling Bancorp | | | 1,252,810 | |
| | |
Annual Report | April 30, 2014 | | 11 |
| | |
| Emerald Banking and Finance Fund | | Schedule of Investments |
| | April 30, 2014 |
| | | | | | | | |
| Shares | | | | | Value
(Note 2) | |
| Banks: Savings, Thrift & Mortgage Lending (continued) | |
| | 7,930 | | | Territorial Bancorp, Inc. | | $ | 162,248 | |
| | | | | | | 8,120,705 | |
| | | | | | | | |
| Commercial Banks: 3.89% | |
| | 9,000 | | | 1st Enterprise Bank(a) | | | 200,250 | |
| | 90,134 | | | First Capital Bancorp, Inc.(a) | | | 362,339 | |
| | 153,100 | | | First Security Group, Inc.(a) | | | 290,890 | |
| | 532,555 | | | Old Second Bancorp, Inc.(a) | | | 2,534,962 | |
| | 21,400 | | | Seacoast Commerce Bank(a) | | | 194,740 | |
| | 42,510 | | | Stonegate Bank | | | 1,015,989 | |
| | | | | | | 4,599,170 | |
| | | | | | | | |
| Commercial Finance & Mortgage Companies: 0.87% | |
| | 32,000 | | | Ladder Capital Corp.,
Class A(a) | | | 572,480 | |
| | 21,829 | | | Safeguard Scientifics, Inc.(a) | | | 458,627 | |
| | | | | | | 1,031,107 | |
| | | | | | | | |
| Consumer Lending: 1.46% | |
| | 40,970 | | | Santander Consumer USA Holdings, Inc.(a) | | | 931,658 | |
| | 27,087 | | | Tree.com, Inc.(a) | | | 787,690 | |
| | | | | | | 1,719,348 | |
| | | | | | | | |
| Diversified Financial Services: 0.81% | |
| | 13,960 | | | Evercore Partners, Inc., Class A | | | 745,883 | |
| | 4,550 | | | LPL Financial Holdings, Inc. | | | 215,442 | |
| | | | | | | 961,325 | |
| | | | | | | | |
| Financial Data & Services: 0.64% | |
| | 15,022 | | | Cass Information Systems, Inc. | | | 758,761 | |
| | | | | | | | |
| Insurance: Property-Casualty: 5.22% | |
| | 41,320 | | | AmTrust Financial Services, Inc. | | | 1,597,845 | |
| | 40,000 | | | Federated National Holding Co. | | | 777,200 | |
| | 87,660 | | | Hilltop Holdings, Inc.(a) | | | 1,958,324 | |
| | 50,000 | | | Kingstone Cos., Inc. | | | 335,000 | |
| | 98,165 | | | United Insurance Holdings Corp. | | | 1,497,016 | |
| | | | | | | 6,165,385 | |
| | | | | | | | |
| Real Estate Investment Trusts (REITs): 1.26% | |
| | 27,780 | | | DiamondRock Hospitality Co. | | | 340,861 | |
| | 53,010 | | | Physicians Realty Trust | | | 727,297 | |
| | 5,060 | | | Saul Centers, Inc. | | | 232,203 | |
| | 5,290 | | | Tanger Factory Outlet Centers, Inc. | | | 188,747 | |
| | | | | | | 1,489,108 | |
| | | | | | | | |
| Real Estate Management & Development: 0.26% | |
| | 18,140 | | | Marcus & Millichap, Inc.(a) | | | 299,854 | |
| | | | | | | | |
| | | | | | | | |
| | | | Total Common Stocks (Cost $90,933,035) | | | 116,505,186 | |
| | | | | | | | |
| Shares | | | | | Value
(Note 2) | |
| SHORT TERM INVESTMENTS: 1.18% | |
| | | | Dreyfus Government Cash Management Fund - Institutional Class
| | | | |
| | 1,396,865 | | | 0.010% (7-Day Yield) | | $ | 1,396,865 | |
| | | | | | | | |
| | | | Total Short Term Investments (Cost $1,396,865) | | | 1,396,865 | |
| | | | | | | | |
| | | | Total Investments: 99.80% (Cost $92,329,900) | | | 117,902,051 | |
| | | | | | | | |
| | | | Other Assets | | | | |
| | | | | | | | |
| | | | In Excess Of Liabilities: 0.20% | | | 238,725 | |
| | | | | | | | |
| | | | | | | | |
| | | | Net Assets: 100.00% | | $ | 118,140,776 | |
(a) Non-income producing security.
Holdings are subject to change.
For Fund compliance purposes, the Fund’s industry classifications refer to any one or more of the industry sub-classifications used by one or more widely recognized market indexes or ratings group indexes, and/or as defined by Fund management. This definition may not apply for purposes of this report, which may combine industry sub-classifications for reporting ease. Industries are shown as a percentage of net assets.
See Notes to Financial Statements.
| | |
12 | | www.emeraldmutualfunds.com |
| | |
| Emerald Growth Fund | | Schedule of Investments |
| | April 30, 2014 |
| | | | | | | | |
| Shares | | | | | Value (Note 2) | |
| COMMON STOCKS: 99.17% | |
| Consumer Discretionary: 15.19% | |
| | 105,450 | | | Black Diamond, Inc.(a) | | $ | 1,175,767 | |
| | 47,558 | | | Carmike Cinemas, Inc.(a) | | | 1,410,570 | |
| | 127,860 | | | Chegg, Inc.(a) | | | 673,822 | |
| | 195,730 | | | Christopher & Banks Corp.(a) | | | 1,221,355 | |
| | 37,379 | | | Chuy’s Holdings, Inc.(a) | | | 1,343,775 | |
| | 168,833 | | | Diversified Restaurant Holdings,
Inc.(a) | | | 845,853 | |
| | 25,699 | | | Five Below, Inc.(a) | | | 1,035,927 | |
| | 117,950 | | | Gray Television, Inc.(a) | | | 1,326,937 | |
| | 106,380 | | | HomeAway, Inc.(a) | | | 3,470,116 | |
| | 57,247 | | | Jack in the Box, Inc. | | | 3,065,004 | |
| | 88,410 | | | Kate Spade & Co.(a) | | | 3,074,016 | |
| | 37,159 | | | Lithia Motors, Inc., Class A | | | 2,760,171 | |
| | 20,535 | | | Lumber Liquidators Holdings,
Inc.(a) | | | 1,789,831 | |
| | 70,319 | | | Malibu Boats, Inc., Class A(a) | | | 1,565,301 | |
| | 22,190 | | | MarineMax, Inc.(a) | | | 356,371 | |
| | 103,931 | | | Multimedia Games Holding Co.,
Inc.(a) | | | 3,034,785 | |
| | 35,165 | | | Penske Automotive Group, Inc. | | | 1,612,667 | |
| | 35,372 | | | Red Robin Gourmet Burgers,
Inc.(a) | | | 2,404,589 | |
| | 27,670 | | | The Marcus Corp. | | | 462,919 | |
| | 206,419 | | | Tile Shop Holdings, Inc.(a) | | | 2,909,476 | |
| | 79,855 | | | Tilly’s, Inc., Class A(a) | | | 902,362 | |
| | | | | | | 36,441,614 | |
| | | | | | | | |
| Energy: 4.62% | |
| | 29,439 | | | Diamondback Energy, Inc.(a) | | | 2,117,842 | |
| | 25,135 | | | Gulfport Energy Corp.(a) | | | 1,851,695 | |
| | 455,733 | | | Magnum Hunter Resources Corp.(a) | | | 3,873,731 | |
| | 92,863 | | | Rex Energy Corp.(a) | | | 1,955,695 | |
| | 45,780 | | | Sanchez Energy Corp.(a) | | | 1,294,658 | |
| | | | | | | 11,093,621 | |
| | | | | | | | |
| Financial Services: 16.54% | |
| | 64,645 | | | AmTrust Financial Services, Inc. | | | 2,499,822 | |
| | 75,212 | | | Bank of the Ozarks, Inc. | | | 4,505,199 | |
| | 50,000 | | | California Republic Bancorp(a) | | | 1,325,000 | |
| | 213,082 | | | CoBiz Financial, Inc. | | | 2,139,343 | |
| | 19,246 | | | ConnectOne Bancorp, Inc.(a) | | | 923,808 | |
| | 70,030 | | | Customers Bancorp, Inc.(a) | | | 1,542,761 | |
| | 45,286 | | | Evercore Partners, Inc., Class A | | | 2,419,631 | |
| | 18,472 | | | Financial Engines, Inc. | | | 817,386 | |
| | 18,257 | | | First Financial Holdings, Inc. | | | 1,049,230 | |
| | 30,640 | | | First Internet Bancorp | | | 668,871 | |
| | 83,594 | | | First NBC Bank Holding Co.(a) | | | 2,599,773 | |
| | 20,870 | | | Hilltop Holdings, Inc.(a) | | | 466,236 | |
| | 118,203 | | | Howard Bancorp, Inc.(a) | | | 1,274,228 | |
| | 21,870 | | | Independent Bank Group, Inc. | | | 1,076,223 | |
| | 78,300 | | | Ladder Capital Corp., Class A(a) | | | 1,400,787 | |
| | 125,840 | | | Opus Bank(a) | | | 3,778,975 | |
| | 73,544 | | | Pacific Premier Bancorp, Inc.(a) | | | 1,003,876 | |
| | 44,200 | | | PacWest Bancorp | | | 1,740,154 | |
| | 36,429 | | | Peoples Bancorp, Inc. | | | 949,704 | |
| | | | | | | | |
| Shares | | | | | Value (Note 2) | |
| Financial Services (continued) | |
| | 100,947 | | | Square 1 Financial, Inc.,
Class A(a) | | $ | 1,902,851 | |
| | 31,701 | | | SVB Financial Group(a) | | | 3,382,180 | |
| | 44,179 | | | Talmer Bancorp, Inc., Class A(a) | | | 592,440 | |
| | 17,610 | | | Texas Capital Bancshares,
Inc.(a) | | | 989,506 | |
| | 55,150 | | | WisdomTree Investments, Inc.(a) | | | 622,644 | |
| | | | | | | 39,670,628 | |
| | | | | | | | |
| Health Care: 22.56% | |
| | 95,561 | | | Acadia Healthcare Co., Inc.(a) | | | 4,015,473 | |
| | 45,810 | | | Adamas Pharmaceuticals, Inc.(a) | | | 845,195 | |
| | 48,550 | | | Alnylam Pharmaceuticals, Inc.(a) | | | 2,404,682 | |
| | 27,360 | | | ANI Pharmaceuticals, Inc.(a) | | | 851,170 | |
| | 4,230 | | | athenahealth, Inc.(a) | | | 522,997 | |
| | 47,180 | | | AtriCure, Inc.(a) | | | 726,572 | |
| | 127,298 | | | Cambrex Corp.(a) | | | 2,608,336 | |
| | 37,415 | | | Cara Therapeutics, Inc.(a) | | | 538,402 | |
| | 60,801 | | | Cepheid, Inc.(a) | | | 2,643,628 | |
| | 74,280 | | | Cynosure, Inc., Class A(a) | | | 1,822,831 | |
| | 154,611 | | | Depomed, Inc.(a) | | | 2,166,100 | |
| | 59,180 | | | Epizyme, Inc.(a) | | | 1,291,308 | |
| | 34,989 | | | Everyday Health, Inc.(a) | | | 492,995 | |
| | 174,684 | | | Horizon Pharma, Inc.(a) | | | 2,477,019 | |
| | 92,150 | | | Icad, Inc.(a) | | | 799,862 | |
| | 61,827 | | | Inogen, Inc.(a) | | | 872,379 | |
| | 366,820 | | | Inovio Pharmaceuticals, Inc.(a) | | | 869,363 | |
| | 8,551 | | | Intercept Pharmaceuticals,
Inc.(a) | | | 2,258,490 | |
| | 75,540 | | | InterMune, Inc.(a) | | | 2,423,323 | |
| | 61,370 | | | Intrexon Corp.(a) | | | 1,158,666 | |
| | 30,814 | | | Isis Pharmaceuticals, Inc.(a) | | | 819,961 | |
| | 40,032 | | | LDR Holding Corp.(a) | | | 997,598 | |
| | 50,326 | | | MacroGenics, Inc.(a) | | | 1,003,500 | |
| | 41,991 | | | MWI Veterinary Supply, Inc.(a) | | | 6,577,470 | |
| | 75,247 | | | NanoString Technologies, Inc.(a) | | | 1,220,506 | |
| | 61,040 | | | Neurocrine Biosciences, Inc.(a) | | | 855,781 | |
| | 93,473 | | | NPS Pharmaceuticals, Inc.(a) | | | 2,488,251 | |
| | 66,489 | | | Omnicell, Inc.(a) | | | 1,760,629 | |
| | 62,560 | | | OvaScience, Inc.(a) | | | 507,987 | |
| | 48,064 | | | Portola Pharmaceuticals, Inc.(a) | | | 1,127,581 | |
| | 57,492 | | | Sarepta Therapeutics, Inc.(a) | | | 2,134,678 | |
| | 36,340 | | | Surgical Care Affiliates, Inc.(a) | | | 1,067,669 | |
| | 17,218 | | | Tandem Diabetes Care, Inc.(a) | | | 302,520 | |
| | 30,440 | | | Thoratec Corp.(a) | | | 997,823 | |
| | 5,560 | | | Ultragenyx Pharmaceutical,
Inc.(a) | | | 215,617 | |
| | 30,000 | | | Verastem, Inc.(a) | | | 250,500 | |
| | | | | | | 54,116,862 | |
| | | | | | | | |
| Materials & Processing: 7.43% | |
| | 25,180 | | | Acuity Brands, Inc. | | | 3,136,672 | |
| | 46,913 | | | Apogee Enterprises, Inc. | | | 1,490,426 | |
| | 103,778 | | | PolyOne Corp. | | | 3,888,562 | |
| | 84,808 | | | Trex Co., Inc.(a) | | | 6,659,124 | |
| | |
Annual Report | April 30, 2014 | | 13 |
| | |
| Emerald Growth Fund | | Schedule of Investments |
| | April 30, 2014 |
| | | | | | | | |
| Shares | | | | | Value (Note 2) | |
| Materials & Processing (continued) | |
| | 58,440 | | | US Silica Holdings, Inc. | | $ | 2,639,735 | |
| | | | | | | 17,814,519 | |
| | | | | | | | |
| Producer Durables: 15.23% | |
| | 33,990 | | | Astronics Corp.(a) | | | 1,941,509 | |
| | 22,790 | | | Control4 Corp.(a) | | | 402,471 | |
| | 63,561 | | | FARO Technologies, Inc.(a) | | | 2,536,084 | |
| | 99,851 | | | H&E Equipment Services,
Inc.(a) | | | 3,849,256 | |
| | 11,760 | | | HEICO Corp. | | | 650,563 | |
| | 130,023 | | | Kforce, Inc. | | | 3,006,132 | |
| | 40,790 | | | Korn/Ferry International(a) | | | 1,184,949 | |
| | 12,292 | | | Middleby Corp.(a) | | | 3,103,484 | |
| | 79,620 | | | Primoris Services Corp. | | | 2,227,767 | |
| | 24,020 | | | Proto Labs, Inc.(a) | | | 1,454,171 | |
| | 117,347 | | | Roadrunner Transportation Systems, Inc.(a) | | | 2,890,257 | |
| | 125,983 | | | Spirit Airlines, Inc.(a) | | | 7,160,874 | |
| | 42,657 | | | Tutor Perini Corp.(a) | | | 1,262,647 | |
| | 139,860 | | | Wesco Aircraft Holdings,
Inc.(a) | | | 2,833,564 | |
| | 23,100 | | | WESCO International, Inc.(a) | | | 2,027,718 | |
| | | | | | | 36,531,446 | |
| | | | | | | | |
| Technology: 15.78% | |
| | 42,377 | | | A10 Networks, Inc.(a) | | | 554,715 | |
| | 89,598 | | | Applied Optoelectronics, Inc.(a) | | | 2,015,955 | |
| | 113,150 | | | Aruba Networks, Inc.(a) | | | 2,236,975 | |
| | 49,636 | | | CalAmp Corp.(a) | | | 881,039 | |
| | 57,886 | | | Cavium, Inc.(a) | | | 2,452,630 | |
| | 68,340 | | | ChannelAdvisor Corp.(a) | | | 1,793,241 | |
| | 77,281 | | | EPAM Systems, Inc.(a) | | | 2,405,757 | |
| | 68,445 | | | Gigamon, Inc.(a) | | | 1,079,378 | |
| | 146,350 | | | Global Eagle Entertainment,
Inc.(a) | | | 1,614,240 | |
| | 152,770 | | | Glu Mobile, Inc.(a) | | | 611,080 | |
| | 26,290 | | | Guidewire Software, Inc.(a) | | | 992,710 | |
| | 45,920 | | | Imperva, Inc.(a) | | | 1,050,650 | |
| | 64,008 | | | Infoblox, Inc.(a) | | | 1,255,837 | |
| | 101,754 | | | Inphi Corp.(a) | | | 1,504,942 | |
| | 25,549 | | | IPG Photonics Corp.(a) | | | 1,651,232 | |
| | 49,069 | | | Ixia, Inc.(a) | | | 609,437 | |
| | 50,480 | | | Methode Electronics, Inc. | | | 1,400,315 | |
| | 71,615 | | | Microsemi Corp.(a) | | | 1,684,385 | |
| | 191,982 | | | Neonode, Inc.(a) | | | 1,027,104 | |
| | 73,837 | | | PDF Solutions, Inc.(a) | | | 1,385,920 | |
| | 102,320 | | | Proofpoint, Inc.(a) | | | 2,603,021 | |
| | 9,220 | | | Q2 Holdings, Inc.(a) | | | 113,222 | |
| | 83,107 | | | Qlik Technologies, Inc.(a) | | | 1,826,692 | |
| | 78,801 | | | Rally Software Development
Corp.(a) | | | 1,030,717 | |
| | 34,063 | | | Reis, Inc. | | | 560,677 | |
| | 80,021 | | | Saba Software, Inc.(a) | | | 880,231 | |
| | 63,752 | | | Transact Technologies, Inc. | | | 681,509 | |
| | | | | | | | |
| Shares | | | | | Value (Note 2) | |
| Technology (continued) | |
| | 16,200 | | | Ultimate Software Group, Inc.(a) | | | $1,938,006 | |
| | | | | | | 37,841,617 | |
| | | | | | | | |
| Utilities: 1.82% | |
| | 269,807 | | | 8x8, Inc.(a) | | | 2,617,128 | |
| | 164,960 | | | ORBCOMM, Inc.(a) | | | 1,034,299 | |
| | 184,570 | | | Vonage Holdings Corp.(a) | | | 708,749 | |
| | | | | | | 4,360,176 | |
| | | | | | | | |
| | | | Total Common Stocks (Cost $192,795,658) | | | 237,870,483 | |
| | | | | | | | |
| WARRANTS: 0.00% | |
| | 41,894 | | | Magnum Hunter Resources Corp., Strike Price $8.50 (expiring 04/15/16)(a) | | | 0 | |
| | | | | | | | |
| | | | Total Warrants (Cost $0) | | | 0 | |
| | | | | | | | |
| SHORT TERM INVESTMENTS: 1.11% | |
| | 2,656,090 | | | Dreyfus Government Cash Management Fund - Institutional Class 0.010% (7-Day Yield) | | | 2,656,090 | |
| | | | | | | | |
| | | | Total Short Term Investments
(Cost $2,656,090) | | | 2,656,090 | |
| | | | | | | | |
| | | | | | | | |
| | | | Total Investments: 100.28%
(Cost $195,451,748) | | | 240,526,573 | |
| | | | | | | | |
| | | | Liabilities In Excess Of Other Assets: (0.28)% | | | (671,813 | ) |
| | | | | | | | |
| | | | Net Assets: 100.00% | | | $239,854,760 | |
(a) Non-income producing security.
Holdings are subject to change.
For Fund compliance purposes, the Fund’s industry classifications refer to any one or more of the industry sub-classifications used by one or more widely recognized market indexes or ratings group indexes, and/or as defined by Fund management. This definition may not apply for purposes of this report, which may combine industry sub-classifications for reporting ease. Industries are shown as a percentage of net assets.
See Notes to Financial Statements.
| | |
14 | | www.emeraldmutualfunds.com |
| | |
| Emerald Funds | | Statements of Assets and Liabilities |
| | April 30, 2014 |
| | | | | | | | |
| | | Emerald Banking
and Finance
Fund | | | Emerald Growth
Fund | |
ASSETS: | | | | | | | | |
Investments, at value | | $ | 117,902,051 | | | $ | 240,526,573 | |
Cash | | | – | | | | 31 | |
Receivable for investments sold | | | 525,134 | | | | 1,406,285 | |
Receivable for shares sold | | | 221,947 | | | | 597,227 | |
Interest and dividends receivable | | | 28,420 | | | | 15,337 | |
Other assets | | | 25,692 | | | | 30,529 | |
| | | | | | | | |
Total Assets | | | 118,703,244 | | | | 242,575,982 | |
| | | | | | | | |
LIABILITIES: | | | | | | | | |
Payable for investments purchased | | | – | | | | 2,162,652 | |
Payable for shares redeemed | | | 352,503 | | | | 270,790 | |
Investment advisory fees payable | | | 97,340 | | | | 144,374 | |
Payable to fund accounting and administration | | | 6,848 | | | | 13,050 | |
Payable for distribution and service fees | | | 64,089 | | | | 74,075 | |
Payable for trustee fees and expenses | | | 876 | | | | 2,050 | |
Payable for transfer agency fees | | | 10,104 | | | | 10,827 | |
Payable for chief compliance officer fee | | | 998 | | | | 2,336 | |
Payable for principal financial officer fee | | | 249 | | | | 584 | |
Payable for professional fees | | | 17,289 | | | | 17,771 | |
Accrued expenses and other liabilities | | | 12,172 | | | | 22,713 | |
| | | | | | | | |
Total Liabilities | | | 562,468 | | | | 2,721,222 | |
| | | | | | | | |
NET ASSETS | | $ | 118,140,776 | | | $ | 239,854,760 | |
| | | | | | | | |
NET ASSETS CONSIST OF: | | | | | | | | |
Paid-in capital (Note 5) | | $ | 98,355,824 | | | $ | 179,792,463 | |
Accumulated net investment loss | | | (252,612) | | | | – | |
Accumulated net realized gain/(loss) on investments | | | (5,534,587) | | | | 14,987,472 | |
Net unrealized appreciation on investments | | | 25,572,151 | | | | 45,074,825 | |
| | | | | | | | |
NET ASSETS | | $ | 118,140,776 | | | $ | 239,854,760 | |
| | | | | | | | |
INVESTMENTS, AT COST | | $ | 92,329,900 | | | $ | 195,451,748 | |
PRICING OF SHARES | | | | | | | | |
Class A: (a) | | | | | | | | |
Net Asset Value, offering and redemption price per share | | $ | 26.11 | | | $ | 18.11 | |
Net Assets | | $ | 48,621,939 | | | $ | 77,899,596 | |
Shares of beneficial interest outstanding | | | 1,862,276 | | | | 4,301,851 | |
Maximum offering price per share (NAV/.9525, based on maximum sales charge of 4.75% of the offering price) | | $ | 27.41 | | | $ | 19.01 | |
Class C: (a) | | | | | | | | |
Net Asset Value, offering and redemption price per share | | $ | 23.86 | | | $ | 16.07 | |
Net Assets | | $ | 28,221,822 | | | $ | 11,644,681 | |
Shares of beneficial interest outstanding | | | 1,183,045 | | | | 724,802 | |
Institutional Class: | | | | | | | | |
Net Asset Value, offering and redemption price per share | | $ | 26.29 | | | $ | 18.49 | |
Net Assets | | $ | 22,061,733 | | | $ | 134,440,411 | |
Shares of beneficial interest outstanding | | | 839,154 | | | | 7,269,488 | |
Investor Class: | | | | | | | | |
Net Asset Value, offering and redemption price per share | | $ | 25.01 | | | $ | 18.06 | |
Net Assets | | $ | 19,235,282 | | | $ | 15,870,072 | |
Shares of beneficial interest outstanding | | | 769,064 | | | | 878,535 | |
| (a) | Redemption price per share may be reduced for any applicable contingent deferred sales charge. For a description of a possible sales charge, please see the Funds’ Prospectus. |
See Notes to Financial Statements.
| | |
Annual Report | April 30, 2014 | | 15 |
| | |
| Emerald Funds | | Statements of Operations |
| | For the Year Ended April 30, 2014 |
| | | | | | | | |
| | | Emerald Banking
and Finance
Fund | | | Emerald Growth
Fund | |
INVESTMENT INCOME: | | | | | | | | |
Dividends | | $ | 983,018 | | | $ | 328,185 | |
Foreign taxes withheld | | | (588) | | | | – | |
Securities lending income | | | – | | | | 43 | |
| | | | | | | | |
Total Investment Income | | | 982,430 | | | | 328,228 | |
| | | | | | | | |
EXPENSES: | | | | | | | | |
Investment advisory fee (Note 6) | | | 828,386 | | | | 1,466,386 | |
Recoupment of previously waived fees | | | 33,080 | | | | 1,047 | |
Administration fee | | | 66,894 | | | | 149,642 | |
Custodian fee | | | 10,635 | | | | 21,979 | |
Professional fees | | | 19,075 | | | | 20,714 | |
Transfer agent fee | | | 86,504 | | | | 79,119 | |
Trustee fees and expenses | | | 3,195 | | | | 7,722 | |
Registration/filing fees | | | 48,795 | | | | 58,873 | |
Reports to shareholder and printing fees | | | 12,373 | | | | 16,506 | |
Distribution and service fees | | | | | | | | |
Class A | | | 133,210 | | | | 219,601 | |
Class C | | | 229,339 | | | | 82,118 | |
Institutional Class | | | 4,983 | | | | 53,928 | |
Investor Class | | | 37,774 | | | | 31,334 | |
Chief compliance officer fee | | | 11,714 | | | | 28,286 | |
Principal financial officer fee | | | 2,929 | | | | 7,072 | |
Other | | | 10,256 | | �� | | 17,372 | |
| | | | | | | | |
Total expenses before waiver | | | 1,539,142 | | | | 2,261,699 | |
Less fees waived/reimbursed by investment adviser (Note 6) | | | – | | | | (29,719) | |
| | | | | | | | |
Total Net Expenses | | | 1,539,142 | | | | 2,231,980 | |
| | | | | | | | |
NET INVESTMENT LOSS: | | | (556,712) | | | | (1,903,752) | |
| | | | | | | | |
Net realized gain on investments | | | 5,639,073 | | | | 28,529,898 | |
Net change in unrealized appreciation on investments | | | 12,763,257 | | | | 6,894,266 | |
| | | | | | | | |
NET REALIZED AND UNREALIZED GAIN ON INVESTMENTS | | | 18,402,330 | | | | 35,424,164 | |
| | | | | | | | |
NET INCREASE IN NET ASSETS RESULTING FROM OPERATIONS | | $ | 17,845,618 | | | $ | 33,520,412 | |
| | | | | | | | |
See Notes to Financial Statements.
| | |
16 | | www.emeraldmutualfunds.com |
| | |
| Emerald Banking and Finance Fund | | Statements of Changes in Net Assets |
| | |
| | | | | | | | | | | | | | |
| | | Year Ended
April 30, 2014 | | | | Year Ended
April 30, 2013 |
OPERATIONS: | | | | | | | | | | | | | | |
Net investment loss | | $ | (556,712) | | | | | | | $ | (119,902) | | | |
Net realized gain on investments | | | 5,639,073 | | | | | | | | 5,057,984 | | | |
Net change in unrealized appreciation on investments | | | 12,763,257 | | | | | | | | 2,441,099 | | | |
| | | | | | | | |
Net increase in net assets resulting from operations | | | 17,845,618 | | | | | | | | 7,379,181 | | | |
| | | | | | | | |
| | | | | |
SHARE TRANSACTIONS (NOTE 5): | | | | | | | | | | | | | | |
Class A | | | | | | | | | | | | | | |
Proceeds from sale of shares | | | 25,659,372 | | | | | | | | 16,828,917 | | | |
Cost of shares redeemed | | | (11,200,208) | | | | | | | | (16,569,563) | | | |
| | | | | | | | |
Net increase from share transactions | | | 14,459,164 | | | | | | | | 259,354 | | | |
| | | | | | | | |
Class C | | | | | | | | | | | | | | |
Proceeds from sale of shares | | | 7,599,293 | | | | | | | | 3,125,343 | | | |
Cost of shares redeemed | | | (2,355,553) | | | | | | | | (2,586,830) | | | |
| | | | | | | | |
Net increase from share transactions | | | 5,243,740 | | | | | | | | 538,513 | | | |
| | | | | | | | |
Institutional Class | | | | | | | | | | | | | | |
Proceeds from sale of shares | | | 16,536,237 | | | | | | | | 4,004,050 | | | |
Cost of shares redeemed | | | (608,192) | | | | | | | | (26,445) | | | |
| | | | | | | | |
Net increase from share transactions | | | 15,928,045 | | | | | | | | 3,977,605 | | | |
| | | | | | | | |
Investor Class | | | | | | | | | | | | | | |
Proceeds from sale of shares | | | 12,230,717 | | | | | | | | 4,980,596 | | | |
Cost of shares redeemed | | | (1,343,232) | | | | | | | | (111,720) | | | |
| | | | | | | | |
Net increase from share transactions | | | 10,887,485 | | | | | | | | 4,868,876 | | | |
| | | | | | | | |
Net increase in net assets | | $ | 64,364,052 | | | | | | | $ | 17,023,529 | | | |
| | | | | | | | |
NET ASSETS: | | | | | | | | | | | | | | |
Beginning of period | | | 53,776,724 | | | | | | | | 36,753,195 | | | |
| | | | | | | | |
End of period (including accumulated net investment loss of $(252,612) and $0, respectively) | | $ | 118,140,776 | | | | | | | $ | 53,776,724 | | | |
| | | | | | | | |
| | | | | |
Other Information: | | | | | | | | | | | | | | |
SHARE TRANSACTIONS: | | | | | | | | | | | | | | |
Class A | | | | | | | | | | | | | | |
Sold | | | 1,038,680 | | | | | | | | 900,183 | | | |
Redeemed | | | (446,319) | | | | | | | | (889,933) | | | |
| | | | | | | | |
Net increase in shares outstanding | | | 592,361 | | | | | | | | 10,250 | | | |
| | | | | | | | |
Class C | | | | | | | | | | | | | | |
Sold | | | 329,912 | | | | | | | | 179,911 | | | |
Redeemed | | | (105,783) | | | | | | | | (156,661) | | | |
| | | | | | | | |
Net increase in shares outstanding | | | 224,129 | | | | | | | | 23,250 | | | |
| | | | | | | | |
Institutional Class | | | | | | | | | | | | | | |
Sold | | | 649,087 | | | | | | | | 215,452 | | | |
Redeemed | | | (24,418) | | | | | | | | (1,412) | | | |
| | | | | | | | |
Net increase in shares outstanding | | | 624,669 | | | | | | | | 214,040 | | | |
| | | | | | | | |
Investor Class | | | | | | | | | | | | | | |
Sold | | | 500,859 | | | | | | | | 289,184 | | | |
Redeemed | | | (57,090) | | | | | | | | (6,528) | | | |
| | | | | | | | |
Net increase in shares outstanding | | | 443,769 | | | | | | | | 282,656 | | | |
| | | | | | | | |
See Notes to Financial Statements.
| | |
Annual Report | April 30, 2014 | | 17 |
| | |
| Emerald Growth Fund | | Statements of Changes in Net Assets |
| | |
| | | | | | | | | | | | | | |
| | | Year Ended
April 30, 2014 | | | | Year Ended
April 30, 2013 |
OPERATIONS: | | | | | | | | | | | | | | |
Net investment loss | | $ | (1,903,752) | | | | | | | $ | (1,027,711) | | | |
Net realized gain on investments | | | 28,529,898 | | | | | | | | 11,995,509 | | | |
Net change in unrealized appreciation on investments | | | 6,894,266 | | | | | | | | 148,175 | | | |
| | | | | | | | |
Net increase in net assets resulting from operations | | | 33,520,412 | | | | | | | | 11,115,973 | | | |
| | | | | | | | |
| | | | | |
DISTRIBUTIONS TO SHAREHOLDERS (NOTE 3): | | | | | | | | | | | | | | |
From net realized gains on investments | | | | | | | | | | | | | | |
Class A | | | (5,103,134) | | | | | | | | (4,685,787) | | | |
Class C | | | (786,150) | | | | | | | | (490,319) | | | |
Institutional Class | | | (9,804,217) | | | | | | | | (8,763,223) | | | |
Investor Class | | | (833,989) | | | | | | | | (164,347) | | | |
| | | | | | | | |
Net decrease in net assets from distributions | | | (16,527,490) | | | | | | | | (14,103,676) | | | |
| | | | | | | | |
SHARE TRANSACTIONS (NOTE 5): | | | | | | | | | | | | | | |
Class A | | | | | | | | | | | | | | |
Proceeds from sale of shares | | | 32,230,458 | | | | | | | | 8,448,904 | | | |
Issued to shareholders in reinvestment of distributions | | | 4,588,579 | | | | | | | | 4,124,748 | | | |
Cost of shares redeemed | | | (10,981,411) | | | | | | | | (7,040,533) | | | |
| | | | | | | | |
Net increase from share transactions | | | 25,837,626 | | | | | | | | 5,533,119 | | | |
| | | | | | | | |
Class C | | | | | | | | | | | | | | |
Proceeds from sale of shares | | | 6,810,627 | | | | | | | | 2,232,832 | | | |
Issued to shareholders in reinvestment of distributions | | | 672,071 | | | | | | | | 398,442 | | | |
Cost of shares redeemed | | | (998,140) | | | | | | | | (635,817) | | | |
| | | | | | | | |
Net increase from share transactions | | | 6,484,558 | | | | | | | | 1,995,457 | | | |
| | | | | | | | |
Institutional Class | | | | | | | | | | | | | | |
Proceeds from sale of shares | | | 44,708,051 | | | | | | | | 11,472,743 | | | |
Issued to shareholders in reinvestment of distributions | | | 9,632,675 | | | | | | | | 8,744,099 | | | |
Cost of shares redeemed | | | (17,935,648) | | | | | | | | (15,124,866) | | | |
| | | | | | | | |
Net increase from share transactions | | | 36,405,078 | | | | | | | | 5,091,976 | | | |
| | | | | | | | |
Investor Class | | | | | | | | | | | | | | |
Proceeds from sale of shares | | | 16,794,225 | | | | | | | | 773,551 | | | |
Issued to shareholders in reinvestment of distributions | | | 824,690 | | | | | | | | 164,347 | | | |
Cost of shares redeemed | | | (3,115,720) | | | | | | | | (190,984) | | | |
| | | | | | | | |
Net increase from share transactions | | | 14,503,195 | | | | | | | | 746,914 | | | |
| | | | | | | | |
Net increase in net assets | | $ | 100,223,379 | | | | | | | $ | 10,379,763 | | | |
| | | | | | | | |
NET ASSETS: | | | | | | | | | | | | | | |
Beginning of period | | | 139,631,381 | | | | | | | | 129,251,618 | | | |
| | | | | | | | |
End of period (including accumulated net investment loss of $0 and $(390,898), respectively) | | $ | 239,854,760 | | | | | | | $ | 139,631,381 | | | |
| | | | | | | | |
| | |
18 | | www.emeraldmutualfunds.com |
| | |
| Emerald Growth Fund | | Statements of Changes in Net Assets |
| | |
| | | | | | | | | | | | | | |
| | | Year Ended
April 30, 2014 | | | | Year Ended
April 30, 2013 |
Other Information: | | | | | | | | | | | | | | |
SHARE TRANSACTIONS: | | | | | | | | | | | | | | |
Class A | | | | | | | | | | | | | | |
Sold | | | 1,651,050 | | | | | | | | 563,949 | | | |
Distributions reinvested | | | 244,086 | | | | | | | | 297,172 | | | |
Redeemed | | | (580,859) | | | | | | | | (465,853) | | | |
| | | | | | | | |
Net increase in shares outstanding | | | 1,314,277 | | | | | | | | 395,268 | | | |
| | | | | | | | |
Class C | | | | | | | | | | | | | | |
Sold | | | 391,694 | | | | | | | | 163,382 | | | |
Distributions reinvested | | | 40,196 | | | | | | | | 31,748 | | | |
Redeemed | | | (58,625) | | | | | | | | (46,882) | | | |
| | | | | | | | |
Net increase in shares outstanding | | | 373,265 | | | | | | | | 148,248 | | | |
| | | | | | | | |
Institutional Class | | | | | | | | | | | | | | |
Sold | | | 2,251,862 | | | | | | | | 745,549 | | | |
Distributions reinvested | | | 502,225 | | | | | | | | 620,149 | | | |
Redeemed | | | (922,587) | | | | | | | | (1,001,795) | | | |
| | | | | | | | |
Net increase in shares outstanding | | | 1,831,500 | | | | | | | | 363,903 | | | |
| | | | | | | | |
Investor Class | | | | | | | | | | | | | | |
Sold | | | 878,538 | | | | | | | | 51,913 | | | |
Distributions reinvested | | | 43,960 | | | | | | | | 11,857 | | | |
Redeemed | | | (162,295) | | | | | | | | (12,514) | | | |
| | | | | | | | |
Net increase in shares outstanding | | | 760,203 | | | | | | | | 51,256 | | | |
| | | | | | | | |
See Notes to Financial Statements.
| | |
Annual Report | April 30, 2014 | | 19 |
| | |
| Emerald Banking and Finance Fund | | Financial Highlights |
| | For a share outstanding throughout the periods presented |
| | | | | | | | | | | | | | | | | | | | | | | | | | | | | | |
| | | CLASS A |
| | | Year Ended
April 30,
2014 | | Year Ended
April 30,
2013 | | For the Period
January 1, 2012
to
April 30, 2012
(a)(b) | | Year Ended
December 31,
2011 | | Year Ended
December 31,
2010 | | Year Ended
December 31,
2009 |
NET ASSET VALUE, BEGINNING OF PERIOD | | | $ | 20.08 | | | | $ | 16.96 | | | | $ | 15.16 | | | | $ | 15.89 | | | | $ | 13.62 | | | | $ | 15.39 | |
INCOME/(LOSS) FROM OPERATIONS:(c) | | | | | | | | | | | | | | | | | | | | | | | | | | | | | | |
Net investment income/(loss) | | | | (0.13)(d) | | | | | (0.01)(d) | | | | | (0.01)(d) | | | | | (0.03)(d) | | | | | (0.04) | | | | | 0.02(d) | |
Net realized and unrealized gain/(loss) on investments | | | | 6.16 | | | | | 3.13 | | | | | 1.81 | | | | | (0.70) | | | | | 2.31 | | | | | (1.76) | |
| | | | | | | | | | | | | | | | | | | | | | | | | | | | | | |
Total from Investment Operations | | | | 6.03 | | | | | 3.12 | | | | | 1.80 | | | | | (0.73) | | | | | 2.27 | | | | | (1.74) | |
| | | | | | | | | | | | | | | | | | | | | | | | | | | | | | |
| | | | | | |
LESS DISTRIBUTIONS: | | | | | | | | | | | | | | | | | | | | | | | | | | | | | | |
From investment income | | | | – | | | | | – | | | | | – | | | | | – | | | | | – | | | | | (0.03) | |
| | | | | | | | | | | | | | | | | | | | | | | | | | | | | | |
Total Distributions | | | | – | | | | | – | | | | | – | | | | | – | | | | | – | | | | | (0.03) | |
| | | | | | | | | | | | | | | | | | | | | | | | | | | | | | |
NET INCREASE/(DECREASE) IN NET ASSET VALUE | | | | 6.03 | | | | | 3.12 | | | | | 1.80 | | | | | (0.73) | | | | | 2.27 | | | | | (1.77) | |
| | | | | | | | | | | | | | | | | | | | | | | | | | | | | | |
NET ASSET VALUE, END OF PERIOD | | | $ | 26.11 | | | | $ | 20.08 | | | | $ | 16.96 | | | | $ | 15.16 | | | | $ | 15.89 | | | | $ | 13.62 | |
| | | | | | | | | | | | | | | | | | | | | | | | | | | | | | |
| | | | | | |
TOTAL RETURN(e) | | | | 30.03 | % | | | | 18.40 | % | | | | 11.87% | (f) | | | | (4.59) | % | | | | 16.67 | % | | | | (11.29) | % |
RATIOS/SUPPLEMENTAL DATA: | | | | | | | | | | | | | | | | | | | | | | | | | | | | | | |
Net Assets, End of Period (000s) | | | $ | 48,622 | | | | $ | 25,496 | | | | $ | 21,363 | | | | $ | 20,412 | | | | $ | 26,756 | | | | $ | 22,675 | |
RATIOS TO AVERAGE NET ASSETS: | | | | | | | | | | | | | | | | | | | | | | | | | | | | | | |
Net Investment income/(loss) | | | | (0.53)% | | | | | (0.06)% | | | | | (0.24)% | (g) | | | | (0.22)% | | | | | (0.22)% | | | | | 0.15% | |
Operating expenses excluding reimbursement/waiver | | | | 1.72% | | | | | 1.88% | | | | | 1.96% | (g) | | | | 1.90% | | | | | 1.95% | | | | | 1.88% | |
Operating expenses including reimbursement/waiver | | | | 1.72% | | | | | 1.84% | | | | | 1.85% | (g) | | | | n/a | | | | | n/a | | | | | n/a | |
PORTFOLIO TURNOVER RATE | | | | 34% | | | | | 53% | | | | | 9% | (f) | | | | 27% | | | | | 48% | | | | | 43% | |
| (a) | Prior to its March 16, 2012 reorganization with and into the Emerald Banking and Finance Fund, the Fund was known as the Forward Banking and Finance Fund. |
| (b) | Effective March 13, 2012 the Board approved changing the fiscal year-end of the Fund from December 31 to April 30. |
| (c) | The amount shown for a share outstanding throughout the period may not correlate with the Statement of Operations for the period due to the timing of sales and redemptions of Fund shares in relation to income earned and/or fluctuating market value of the investments of the Fund. |
| (d) | Per share amounts are based upon average shares outstanding. |
| (e) | Total return does not reflect the effect of sales charges. |
See Notes to Financial Statements.
| | |
20 | | www.emeraldmutualfunds.com |
| | |
| Emerald Banking and Finance Fund | | Financial Highlights |
| | For a share outstanding throughout the periods presented |
| | | | | | | | | | | | | | | | | | | | | | | | | | | | | | |
| | | CLASS C |
| | | Year Ended
April 30, 2014 | | Year Ended
April 30, 2013 | | For the Period
January 1, 2012
to
April 30, 2012 (a)(b) | | Year Ended
December 31,
2011 | | Year Ended
December 31,
2010 | | Year Ended
December 31,
2009 |
NET ASSET VALUE, BEGINNING OF PERIOD | | | $ | 18.46 | | | | $ | 15.70 | | | | $ | 14.06 | | | | $ | 14.82 | | | | $ | 12.77 | | | | $ | 14.52 | |
INCOME/(LOSS) FROM OPERATIONS:(c) | | | | | | | | | | | | | | | | | | | | | | | | | | | | | | |
Net investment loss | | | | (0.26)(d) | | | | | (0.11)(d) | | | | | (0.04)(d) | | | | | (0.11)(d) | | | | | (0.18) | | | | | (0.19) | |
Net realized and unrealized gain/(loss) on investments | | | | 5.66 | | | | | 2.87 | | | | | 1.68 | | | | | (0.65) | | | | | 2.23 | | | | | (1.56) | |
| | | | | | | | | | | | | | | | | | | | | | | | | | | | | | |
Total from Investment Operations | | | | 5.40 | | | | | 2.76 | | | | | 1.64 | | | | | (0.76) | | | | | 2.05 | | | | | (1.75) | |
| | | | | | | | | | | | | | | | | | | | | | | | | | | | | | |
| | | | | | |
NET INCREASE/(DECREASE) IN NET ASSET VALUE | | | | 5.40 | | | | | 2.76 | | | | | 1.64 | | | | | (0.76) | | | | | 2.05 | | | | | (1.75) | |
| | | | | | | | | | | | | | | | | | | | | | | | | | | | | | |
NET ASSET VALUE, END OF PERIOD | | | $ | 23.86 | | | | $ | 18.46 | | | | $ | 15.70 | | | | $ | 14.06 | | | | $ | 14.82 | | | | $ | 12.77 | |
| | | | | | | | | | | | | | | | | | | | | | | | | | | | | | |
| | | | | | |
TOTAL RETURN(e) | | | | 29.25 | % | | | | 17.58 | % | | | | 11.66% | (f) | | | | (5.13) | % | | | | 16.05 | % | | | | (12.05) | % |
RATIOS/SUPPLEMENTAL DATA: | | | | | | | | | | | | | | | | | | | | | | | | | | | | | | |
Net Assets, End of Period (000s) | | | $ | 28,222 | | | | $ | 17,705 | | | | $ | 14,690 | | | | $ | 13,675 | | | | $ | 17,872 | | | | $ | 16,907 | |
RATIOS TO AVERAGE NET ASSETS: | | | | | | | | | | | | | | | | | | | | | | | | | | | | | | |
Net Investment loss | | | | (1.18) | % | | | | (0.68) | % | | | | (0.82)% | (g) | | | | (0.77) | % | | | | (0.77) | % | | | | (0.47) | % |
Operating expenses excluding reimbursement/waiver | | | | 2.38 | % | | | | 2.54 | % | | | | 2.55% | (g) | | | | 2.45 | % | | | | 2.50 | % | | | | 2.49 | % |
Operating expenses including reimbursement/waiver | | | | 2.38 | % | | | | 2.49 | % | | | | 2.44% | (g) | | | | n | /a | | | | n | /a | | | | n | /a |
PORTFOLIO TURNOVER RATE | | | | 34 | % | | | | 53 | % | | | | 9% | (f) | | | | 27 | % | | | | 48 | % | | | | 43 | % |
| (a) | Prior to its March 16, 2012 reorganization with and into the Emerald Banking and Finance Fund, the Fund was known as the Forward Banking and Finance Fund. |
| (b) | Effective March 13, 2012 the Board approved changing the fiscal year-end of the Fund from December 31 to April 30. |
| (c) | The amount shown for a share outstanding throughout the period may not correlate with the Statement of Operations for the period due to the timing of sales and redemptions of Fund shares in relation to income earned and/or fluctuating market value of the investments of the Fund. |
| (d) | Per share amounts are based upon average shares outstanding. |
| (e) | Total return does not reflect the effect of sales charges. |
See Notes to Financial Statements.
| | |
Annual Report | April 30, 2014 | | 21 |
| | |
| Emerald Banking and Finance Fund | | Financial Highlights |
| | For a share outstanding throughout the periods presented |
| | | | | | | | | | | | | | | |
| | | INSTITUTIONAL CLASS |
| | | Year Ended
April 30, 2014 | | Year Ended
April 30, 2013 | | For the Period
March 16, 2012
to
April 30, 2012 (a) |
NET ASSET VALUE, BEGINNING OF PERIOD | | | $ | 20.15 | | | | $ | 16.96 | | | | $ | 16.85 | |
INCOME/(LOSS) FROM OPERATIONS: | | | | | | | | | | | | | | | |
Net investment income/(loss)(b) | | | | (0.06) | | | | | 0.01 | | | | | (0.01) | |
Net realized and unrealized gain on investments | | | | 6.20 | | | | | 3.18 | | | | | 0.12 | |
| | | | | | | | | | | | | | | |
Total from Investment Operations | | | | 6.14 | | | | | 3.19 | | | | | 0.11 | |
| | | | | | | | | | | | | | | |
| | | |
NET INCREASE IN NET ASSET VALUE | | | | 6.14 | | | | | 3.19 | | | | | 0.11 | |
| | | | | | | | | | | | | | | |
NET ASSET VALUE, END OF PERIOD | | | $ | 26.29 | | | | $ | 20.15 | | | | $ | 16.96 | |
| | | | | | | | | | | | | | | |
| | | |
TOTAL RETURN | | | | 30.47 | % | | | | 18.81 | % | | | | 0.65% | (c) |
RATIOS/SUPPLEMENTAL DATA: | | | | | | | | | | | | | | | |
Net Assets, End of Period (000s) | | | $ | 22,062 | | | | $ | 4,321 | | | | $ | 8 | |
RATIOS TO AVERAGE NET ASSETS: | | | | | | | | | | | | | | | |
Net Investment income/(loss) | | | | (0.23) | % | | | | 0.06 | % | | | | (0.27)% | (d) |
Operating expenses excluding reimbursement/waiver | | | | 1.37 | % | | | | 1.62 | % | | | | 1.83% | (d) |
Operating expenses including reimbursement/waiver | | | | 1.37 | % | | | | 1.54 | % | | | | 1.53% | (d) |
PORTFOLIO TURNOVER RATE | | | | 34 | % | | | | 53 | % | | | | 9%(c) | (e) |
| (a) | The Fund began offering Institutional Class shares on March 16, 2012. |
| (b) | Per share amounts are based upon average shares outstanding. |
| (e) | Portfolio turnover rate is calculated at the Fund level and represents the period ended April 30, 2012. |
See Notes to Financial Statements.
| | |
22 | | www.emeraldmutualfunds.com |
| | |
| Emerald Banking and Finance Fund | | Financial Highlights |
| | For a share outstanding throughout the periods presented |
| | | | | | | | | | | | | | | | | | | | | | | | | |
| | | INVESTOR CLASS |
| | | Year Ended
April 30, 2014 | | Year Ended
April 30, 2013 | | For the Period
January 1, 2012
to
April 30, 2012 (a)(b) | | Year Ended
December 31,
2011 | | Period Ended
December 31,
2010(c) |
NET ASSET VALUE, BEGINNING OF PERIOD | | | $ | 19.23 | | | | $ | 16.25 | | | | $ | 14.50 | | | | $ | 15.14 | | | | $ | 14.85 | |
INCOME/(LOSS) FROM OPERATIONS:(d) | | | | | | | | | | | | | | | | | | | | | | | | | |
Net investment income/(loss)(e) | | | | (0.12) | | | | | (0.01) | | | | | (0.00)(f) | | | | | 0.07 | | | | | (0.02) | |
Net realized and unrealized gain/(loss) on investments | | | | 5.90 | | | | | 2.99 | | | | | 1.75 | | | | | (0.71) | | | | | 0.31 | |
| | | | | | | | | | | | | | | | | | | | | | | | | |
Total from Investment Operations | | | | 5.78 | | | | | 2.98 | | | | | 1.75 | | | | | (0.64) | | | | | 0.29 | |
| | | | | | | | | | | | | | | | | | | | | | | | | |
| | | | | |
NET INCREASE/(DECREASE) IN NET ASSET VALUE | | | | 5.78 | | | | | 2.98 | | | | | 1.75 | | | | | (0.64) | | | | | 0.29 | |
| | | | | | | | | | | | | | | | | | | | | | | | | |
NET ASSET VALUE, END OF PERIOD | | | $ | 25.01 | | | | $ | 19.23 | | | | $ | 16.25 | | | | $ | 14.50 | | | | $ | 15.14 | |
| | | | | | | | | | | | | | | | | | | | | | | | | |
| | | | | |
TOTAL RETURN | | | | 30.06 | % | | | | 18.34 | % | | | | 12.07% | (g) | | | | (4.23) | % | | | | 1.95% | (g) |
RATIOS/SUPPLEMENTAL DATA: | | | | | | | | | | | | | | | | | | | | | | | | | |
Net Assets, End of Period (000s) | | | $ | 19,235 | | | | $ | 6,255 | | | | $ | 693 | | | | $ | 136 | | | | $ | 4 | |
RATIOS TO AVERAGE NET ASSETS: | | | | | | | | | | | | | | | | | | | | | | | | | |
Net Investment income/(loss) | | | | (0.53) | % | | | | (0.08) | % | | | | (0.07)% | (h) | | | | 0.47 | % | | | | (0.20)% | (h) |
Operating expenses excluding reimbursement/waiver | | | | 1.69 | % | | | | 1.94 | % | | | | 1.88% | (h) | | | | 1.48 | % | | | | 1.83% | (h) |
Operating expenses including reimbursement/waiver | | | | 1.69 | % | | | | 1.89 | % | | | | 1.72% | (h) | | | | n | /a | | | | n | /a |
PORTFOLIO TURNOVER RATE | | | | 34 | % | | | | 53 | % | | | | 9% | (g) | | | | 27 | % | | | | 48% | (i) |
| (a) | Prior to its March 16, 2012 reorganization with and into the Emerald Banking and Finance Fund, the Fund was known as the Forward Banking and Finance Fund. |
| (b) | Effective March 13, 2012 the Board approved changing the fiscal year-end of the Fund from December 31 to April 30. |
| (c) | The Fund began offering Investor Class shares on March 16, 2010. |
| (d) | The amount shown for a share outstanding throughout the period may not correlate with the Statement of Operations for the period due to the timing of sales and redemptions of Fund shares in relation to income earned and/or fluctuating market value of the investments of the Fund. |
| (e) | Per share amounts are based upon average shares outstanding. |
| (f) | Less than $0.005 per share. |
| (i) | Portfolio turnover rate is calculated at the Fund level and represents the year ended December 31, 2010. |
See Notes to Financial Statements.
| | |
Annual Report | April 30, 2014 | | 23 |
| | |
| Emerald Growth Fund | | Financial Highlights |
| | For a share outstanding throughout the periods presented |
| | | | | | | | | | | | | | | | | | | | | | | | | | | | | | |
| | | CLASS A |
| | | Year Ended
April 30, 2014 | | Year Ended
April 30, 2013 | | For the Period
January 1, 2012
to
April 30, 2012 (a)(b) | | Year Ended
December 31,
2011 | | Year Ended
December 31,
2010 | | Year Ended
December 31,
2009 |
NET ASSET VALUE, BEGINNING OF PERIOD | | | $ | 15.60 | | | | $ | 16.20 | | | | $ | 13.37 | | | | $ | 13.57 | | | | $ | 10.63 | | | | $ | 7.99 | |
INCOME/(LOSS) FROM OPERATIONS: | | | | | | | | | | | | | | | | | | | | | | | | | | | | | | |
Net investment loss | | | | (0.21)(c) | | | | | (0.15)(c) | | | | | (0.05)(c) | | | | | (0.14)(c) | | | | | (0.12) | | | | | (0.11) | |
Net realized and unrealized gain/(loss) on investments | | | | 4.33 | | | | | 1.40 | | | | | 2.88 | | | | | (0.06) | | | | | 3.06 | | | | | 2.75 | |
| | | | | | | | | | | | | | | | | | | | | | | | | | | | | | |
Total from Investment Operations | | | | 4.12 | | | | | 1.25 | | | | | 2.83 | | | | | (0.20) | | | | | 2.94 | | | | | 2.64 | |
| | | | | | | | | | | | | | | | | | | | | | | | | | | | | | |
| | | | | | |
LESS DISTRIBUTIONS: | | | | | | | | | | | | | | | | | | | | | | | | | | | | | | |
From capital gains | | | | (1.61) | | | | | (1.85) | | | | | – | | | | | – | | | | | – | | | | | – | |
| | | | | | | | | | | | | | | | | | | | | | | | | | | | | | |
Total Distributions | | | | (1.61) | | | | | (1.85) | | | | | – | | | | | – | | | | | – | | | | | – | |
| | | | | | | | | | | | | | | | | | | | | | | | | | | | | | |
NET INCREASE/(DECREASE) IN NET ASSET VALUE | | | | 2.51 | | | | | (0.60) | | | | | 2.83 | | | | | (0.20) | | | | | 2.94 | | | | | 2.64 | |
| | | | | | | | | | | | | | | | | | | | | | | | | | | | | | |
NET ASSET VALUE, END OF PERIOD | | | $ | 18.11 | | | | $ | 15.60 | | | | $ | 16.20 | | | | $ | 13.37 | | | | $ | 13.57 | | | | $ | 10.63 | |
| | | | | | | | | | | | | | | | | | | | | | | | | | | | | | |
| | | | | | |
TOTAL RETURN(d) | | | | 26.01 | % | | | | 9.14 | % | | | | 21.17% | (e) | | | | (1.47) | % | | | | 27.66 | % | | | | 33.04 | % |
RATIOS/SUPPLEMENTAL DATA: | | | | | | | | | | | | | | | | | | | | | | | | | | | | | | |
Net Assets, End of Period (000s) | | | $ | 77,900 | | | | $ | 46,605 | | | | $ | 41,991 | | | | $ | 37,008 | | | | $ | 46,785 | | | | $ | 51,177 | |
RATIOS TO AVERAGE NET ASSETS: | | | | | | | | | | | | | | | | | | | | | | | | | | | | | | |
Net Investment loss | | | | (1.12) | % | | | | (1.01) | % | | | | (1.02)% | (f) | | | | (1.03) | % | | | | (0.85) | % | | | | (1.03) | % |
Operating expenses excluding reimbursement/waiver | | | | 1.31 | % | | | | 1.38 | % | | | | 1.36% | (f) | | | | 1.36 | % | | | | 1.41 | % | | | | 1.38 | % |
Operating expenses including reimbursement/waiver | | | | 1.29 | % | | | | 1.29 | % | | | | 1.29% | (f) | | | | 1.29 | % | | | | 1.29 | % | | | | 1.29% | (g) |
PORTFOLIO TURNOVER RATE | | | | 70 | % | | | | 78 | % | | | | 28% | (e) | | | | 75 | % | | | | 78 | % | | | | 113 | % |
| (a) | Prior to its March 16, 2012 reorganization with and into the Emerald Growth Fund, the Fund was known as the Forward Growth Fund. |
| (b) | Effective March 13, 2012 the Board approved changing the fiscal year-end of the Fund from December 31 to April 30. |
| (c) | Per share amounts are based upon average shares outstanding. |
| (d) | Total return does not reflect the effect of sales charges. |
| (g) | Effective January 1, 2009, the Advisor agreed to limit expenses at 1.29%. |
See Notes to Financial Statements.
| | |
24 | | www.emeraldmutualfunds.com |
| | |
| Emerald Growth Fund | | Financial Highlights |
| | For a share outstanding throughout the periods presented |
| | | | | | | | | | | | | | | | | | | | | | | | | | | | | | |
| | | CLASS C |
| | | Year Ended
April 30, 2014 | | Year Ended
April 30, 2013 | | For the Period
January 1, 2012
to
April 30, 2012
(a)(b) | | Year Ended
December 31,
2011 | | Year Ended
December 31,
2010 | | Year Ended
December 31,
2009 |
NET ASSET VALUE, BEGINNING OF PERIOD | | | $ | 14.07 | | | | $ | 14.89 | | | | $ | 12.31 | | | | $ | 12.58 | | | | $ | 9.92 | | | | $ | 7.49 | |
INCOME/(LOSS) FROM OPERATIONS: | | | | | | | | | | | | | | | | | | | | | | | | | | | | | | |
Net investment loss | | | | (0.30)(c) | | | | | (0.23)(c) | | | | | (0.08)(c) | | | | | (0.22)(c) | | | | | (0.03) | | | | | (0.36) | |
Net realized and unrealized gain/(loss) on investments | | | | 3.91 | | | | | 1.26 | | | | | 2.66 | | | | | (0.05) | | | | | 2.69 | | | | | 2.79 | |
| | | | | | | | | | | | | | | | | | | | | | | | | | | | | | |
Total from Investment Operations | | | | 3.61 | | | | | 1.03 | | | | | 2.58 | | | | | (0.27) | | | | | 2.66 | | | | | 2.43 | |
| | | | | | | | | | | | | | | | | | | | | | | | | | | | | | |
| | | | | | |
LESS DISTRIBUTIONS: | | | | | | | | | | | | | | | | | | | | | | | | | | | | | | |
From capital gains | | | | (1.61) | | | | | (1.85) | | | | | – | | | | | – | | | | | – | | | | | – | |
| | | | | | | | | | | | | | | | | | | | | | | | | | | | | | |
Total Distributions | | | | (1.61) | | | | | (1.85) | | | | | – | | | | | – | | | | | – | | | | | – | |
| | | | | | | | | | | | | | | | | | | | | | | | | | | | | | |
NET INCREASE/(DECREASE) IN NET ASSET VALUE | | | | 2.00 | | | | | (0.82) | | | | | 2.58 | | | | | (0.27) | | | | | 2.66 | | | | | 2.43 | |
| | | | | | | | | | | | | | | | | | | | | | | | | | | | | | |
NET ASSET VALUE, END OF PERIOD | | | $ | 16.07 | | | | $ | 14.07 | | | | $ | 14.89 | | | | $ | 12.31 | | | | $ | 12.58 | | | | $ | 9.92 | |
| | | | | | | | | | | | | | | | | | | | | | | | | | | | | | |
| | | | | | |
TOTAL RETURN(d) | | | | 25.19 | % | | | | 8.43 | % | | | | 20.96% | (e) | | | | (2.15) | % | | | | 26.81 | % | | | | 32.44 | % |
RATIOS/SUPPLEMENTAL DATA: | | | | | | | | | | | | | | | | | | | | | | | | | | | | | | |
Net Assets, End of Period (000s) | | | $ | 11,645 | | | | $ | 4,946 | | | | $ | 3,026 | | | | $ | 2,743 | | | | $ | 2,812 | | | | $ | 2,555 | |
RATIOS TO AVERAGE NET ASSETS: | | | | | | | | | | | | | | | | | | | | | | | | | | | | | | |
Net Investment loss | | | | (1.77) | % | | | | (1.65) | % | | | | (1.67)% | (f) | | | | (1.68) | % | | | | (1.48) | % | | | | (1.68) | % |
Operating expenses excluding reimbursement/waiver | | | | 1.96 | % | | | | 2.03 | % | | | | 2.01% | (f) | | | | 2.01 | % | | | | 2.06 | % | | | | 2.04 | % |
Operating expenses including reimbursement/waiver | | | | 1.94 | % | | | | 1.94 | % | | | | 1.94% | (f) | | | | 1.94 | % | | | | 1.94 | % | | | | 1.94% | (g) |
PORTFOLIO TURNOVER RATE | | | | 70 | % | | | | 78 | % | | | | 28% | (e) | | | | 75 | % | | | | 78 | % | | | | 113 | % |
| (a) | Prior to its March 16, 2012 reorganization with and into the Emerald Growth Fund, the Fund was known as the Forward Growth Fund. |
| (b) | Effective March 13, 2012 the Board approved changing the fiscal year-end of the Fund from December 31 to April 30. |
| (c) | Per share amounts are based upon average shares outstanding. |
| (d) | Total return does not reflect the effect of sales charges. |
| (g) | Effective January 1, 2009, the Advisor agreed to limit expenses at 1.94%. |
See Notes to Financial Statements.
| | |
Annual Report | April 30, 2014 | | 25 |
| | |
| Emerald Growth Fund | | Financial Highlights |
| | For a share outstanding throughout the periods presented |
| | | | | | | | | | | | | | | | | | | | | | | | | | | | | | |
| | | INSTITUTIONAL CLASS |
| | | Year Ended
April 30, 2014 | | Year Ended
April 30, 2013 | | For the Period
January 1, 2012
to
April 30, 2012
(a)(b) | | Year Ended
December 31,
2011 | | Year Ended
December 31,
2010 | | Year Ended
December 31,
2009 |
NET ASSET VALUE, BEGINNING OF PERIOD | | | $ | 15.86 | | | | $ | 16.39 | | | | $ | 13.51 | | | | $ | 13.67 | | | | $ | 10.68 | | | | $ | 8.00 | |
INCOME/(LOSS) FROM OPERATIONS: | | | | | | | | | | | | | | | | | | | | | | | | | | | | | | |
Net investment loss | | | | (0.16) | (c) | | | | (0.11)(c) | | | | | (0.04)(c) | | | | | (0.10)(c) | | | | | (0.06) | | | | | (0.17) | |
Net realized and unrealized gain/(loss) on investments | | | | 4.40 | | | | | 1.43 | | | | | 2.92 | | | | | (0.06) | | | | | 3.05 | | | | | 2.85 | |
| | | | | | | | | | | | | | | | | | | | | | | | | | | | | | |
Total from Investment Operations | | | | 4.24 | | | | | 1.32 | | | | | 2.88 | | | | | (0.16) | | | | | 2.99 | | | | | 2.68 | |
| | | | | | | | | | | | | | | | | | | | | | | | | | | | | | |
| | | | | | |
LESS DISTRIBUTIONS: | | | | | | | | | | | | | | | | | | | | | | | | | | | | | | |
From capital gains | | | | (1.61) | | | | | (1.85) | | | | | – | | | | | – | | | | | – | | | | | – | |
| | | | | | | | | | | | | | | | | | | | | | | | | | | | | | |
Total Distributions | | | | (1.61) | | | | | (1.85) | | | | | – | | | | | – | | | | | – | | | | | – | |
| | | | | | | | | | | | | | | | | | | | | | | | | | | | | | |
NET INCREASE/(DECREASE) IN NET ASSET VALUE | | | | 2.63 | | | | | (0.53) | | | | | 2.88 | | | | | (0.16) | | | | | 2.99 | | | | | 2.68 | |
| | | | | | | | | | | | | | | | | | | | | | | | | | | | | | |
NET ASSET VALUE, END OF PERIOD | | | $ | 18.49 | | | | $ | 15.86 | | | | $ | 16.39 | | | | $ | 13.51 | | | | $ | 13.67 | | | | $ | 10.68 | |
| | | | | | | | | | | | | | | | | | | | | | | | | | | | | | |
| | | | | | |
TOTAL RETURN | | | | 26.35 | % | | | | 9.47 | % | | | | 21.32% | (d) | | | | (1.17) | % | | | | 28.00 | % | | | | 33.50 | % |
RATIOS/SUPPLEMENTAL DATA: | | | | | | | | | | | | | | | | | | | | | | | | | | | | | | |
Net Assets, End of Period (000s) | | | $ | 134,440 | | | | $ | 86,238 | | | | $ | 83,149 | | | | $ | 64,930 | | | | $ | 64,880 | | | | $ | 47,091 | |
RATIOS TO AVERAGE NET ASSETS: | | | | | | | | | | | | | | | | | | | | | | | | | | | | | | |
Net Investment loss | | | | (0.82)% | | | | | (0.71)% | | | | | (0.72)% | (e) | | | | (0.72)% | | | | | (0.52)% | | | | | (0.73)% | |
Operating expenses excluding reimbursement/waiver | | | | 1.00% | | | | | 1.08% | | | | | 1.06% | (e) | | | | 1.06% | | | | | 1.11% | | | | | 1.08% | |
Operating expenses including reimbursement/
waiver | | | | 0.99% | | | | | 0.99% | | | | | 0.99% | (e) | | | | 0.99% | | | | | 0.99% | | | | | 0.99% | (f) |
PORTFOLIO TURNOVER RATE | | | | 70% | | | | | 78% | | | | | 28% | (d) | | | | 75% | | | | | 78% | | | | | 113% | |
| (a) | Prior to its March 16, 2012 reorganization with and into the Emerald Growth Fund, the Fund was known as the Forward Growth Fund. |
| (b) | Effective March 13, 2012 the Board approved changing the fiscal year-end of the Fund from December 31 to April 30. |
| (c) | Per share amounts are based upon average shares outstanding. |
| (f) | Effective January 1, 2009, the Advisor agreed to limit expenses at 0.99%. |
See Notes to Financial Statements.
| | |
26 | | www.emeraldmutualfunds.com |
| | |
| Emerald Growth Fund | | Financial Highlights |
| | For a share outstanding throughout the periods presented |
| | | | | | | | | | | | | | | | | | | | |
| | | INVESTOR CLASS |
| | | Year Ended
April 30, 2014 | | Year Ended
April 30, 2013 | | For the Period
January 1, 2012
to
April 30, 2012
(a)(b) | | Period Ended
December 31,
2011 (c) |
NET ASSET VALUE, BEGINNING OF PERIOD | | | $ | 15.57 | | | | $ | 16.18 | | | | $ | 13.35 | | | | $ | 15.74 | |
INCOME/(LOSS) FROM OPERATIONS: | | | | | | | | | | | | | | | | | | | | |
Net investment loss(d) | | | | (0.23) | | | | | (0.16) | | | | | (0.05) | | | | | (0.09) | |
Net realized and unrealized gain/(loss) on investments | | | | 4.33 | | | | | 1.40 | | | | | 2.88 | | | | | (2.30) | |
| | | | | | | | | | | | | | | | | | | | |
Total from Investment Operations | | | | 4.10 | | | | | 1.24 | | | | | 2.83 | | | | | (2.39) | |
| | | | | | | | | | | | | | | | | | | | |
| | | | |
LESS DISTRIBUTIONS: | | | | | | | | | | | | | | | | | | | | |
From capital gains | | | | (1.61) | | | | | (1.85) | | | | | – | | | | | – | |
| | | | | | | | | | | | | | | | | | | | |
Total Distributions | | | | (1.61) | | | | | (1.85) | | | | | – | | | | | – | |
| | | | | | | | | | | | | | | | | | | | |
NET INCREASE/(DECREASE) IN NET ASSET VALUE | | | | 2.49 | | | | | (0.61) | | | | | 2.83 | | | | | (2.39) | |
| | | | | | | | | | | | | | | | | | | | |
NET ASSET VALUE, END OF PERIOD | | | $ | 18.06 | | | | $ | 15.57 | | | | $ | 16.18 | | | | $ | 13.35 | |
| | | | | | | | | | | | | | | | | | | | |
| | | | |
TOTAL RETURN | | | | 25.93 | % | | | | 9.08 | % | | | | 21.20% | (e) | | | | (15.18)% | (e) |
RATIOS/SUPPLEMENTAL DATA: | | | | | | | | | | | | | | | | | | | | |
Net Assets, End of Period (000s) | | | $ | 15,870 | | | | $ | 1,842 | | | | $ | 1,085 | | | | $ | 879 | |
RATIOS TO AVERAGE NET ASSETS: | | | | | | | | | | | | | | | | | | | | |
Net Investment loss | | | | (1.18) | % | | | | (1.05) | % | | | | (1.07)% | (f) | | | | (1.00)% | (f) |
Operating expenses excluding reimbursement/waiver | | | | 1.34 | % | | | | 1.43 | % | | | | 1.41% | (f) | | | | 1.43% | (f) |
Operating expenses including reimbursement/waiver | | | | 1.34 | % | | | | 1.34 | % | | | | 1.34% | (f) | | | | 1.34% | (f) |
PORTFOLIO TURNOVER RATE | | | | 70 | % | | | | 78 | % | | | | 28% | (e) | | | | 75% | (g) |
| (a) | Prior to its March 16, 2012 reorganization with and into the Emerald Growth Fund, the Fund was known as the Forward Growth Fund. |
| (b) | Effective March 13, 2012 the Board approved changing the fiscal year-end of the Fund from December 31 to April 30. |
| (c) | The Fund began offering Investor Class shares on May 2, 2011. |
| (d) | Per share amounts are based upon average shares outstanding. |
| (g) | Portfolio turnover is calculated at the Fund level and represents the year ended December 31, 2011. |
See Notes to Financial Statements.
| | |
Annual Report | April 30, 2014 | | 27 |
| | |
| Emerald Funds | | Notes to Financial Statements |
| | April 30, 2014 |
1. ORGANIZATION
Financial Investors Trust (the “Trust”), a Delaware statutory trust, is an open-end management investment company registered under the Investment Company Act of 1940, as amended (the “1940 Act”). As of April 30, 2014, the Trust had 30 registered funds. This annual report describes the Emerald Banking and Finance Fund and Emerald Growth Fund (each a “Fund” and collectively, the “Funds”). Prior to March 16, 2012, the Emerald Banking and Finance Fund was known as the Forward Banking and Finance Fund and the Emerald Growth Fund was known as the Forward Growth Fund. Effective March 13, 2012, the Board of Trustees (the “Board”) approved changing the fiscal year end of the Funds from December 31 to April 30.
The Emerald Banking and Finance Fund seeks to achieve long term growth through capital appreciation with income as a secondary objective and invests primarily in equity securities of companies principally engaged in the banking or financial services industries.
The Emerald Growth Fund seeks to achieve long-term growth through capital appreciation and invests in equity securities, including common stocks, preferred stocks, and securities convertible into common or preferred stocks.
2. SIGNIFICANT ACCOUNTING POLICIES
The accompanying financial statements were prepared in accordance with accounting principles generally accepted in the United States of America (“U.S. GAAP”). The preparation of financial statements in conformity with U.S. GAAP requires management to make certain estimates and assumptions that affect the reported amounts of assets and liabilities and disclosures of contingent assets and liabilities at the date of the financial statements and the reported amounts of revenue and expenses during the period. Actual results could differ from those estimates. The following is a summary of significant accounting policies consistently followed by the Funds in preparation of their financial statements.
Investment Valuation: The Funds generally value their securities based on market prices determined at the close of regular trading on the New York Stock Exchange (“NYSE”), normally, 4:00 p.m. Eastern time, on each business day the NYSE is open for trading.
For equity securities and mutual funds that are traded on an exchange, the market price is usually the closing sale or official closing price on that exchange. In the case of equity securities not traded on an exchange, or if such closing prices are not otherwise available, the securities are valued at the mean of the most recent bid and ask prices on such day. Redeemable securities issued by open-end registered investment companies are valued at the investment company’s applicable net asset value.
The market price for debt obligations is generally the price supplied by an independent third-party pricing service approved by the Board of Trustees (the “Board”), which may use a matrix, formula or other objective method that takes into consideration quotations from dealers, market transactions in comparable investments, market indices and yield curves. If vendors are unable to supply a price, or if the price supplied is deemed to be unreliable, the market price may be determined using quotations received from one or more brokers–dealers that make a market in the security. Short–term debt obligations that will mature in 60 days or less are valued at amortized cost, unless it is determined that using this method would not reflect an investment’s fair value. Investments in non-exchange traded funds are fair valued at their respective net asset values.
Equity securities that are primarily traded on foreign securities exchanges are valued at the preceding closing values of such securities on their respective exchanges, except when an occurrence subsequent to the time a value was so established is likely to have changed such value. In such an event, the fair values of those securities are determined in good faith through consideration of other factors in accordance with procedures established by and under the general supervision of the Board.
When such prices or quotations are not available, or when the Fair Value Committee appointed by the Board believes that they are unreliable, securities may be priced using fair value procedures approved by the Board.
Fair Value Measurements: A three-tier hierarchy has been established to classify fair value measurements for disclosure purposes. Inputs refer broadly to the assumptions that market participants would use in pricing the asset or liability, including assumptions about risk. Inputs may be observable or unobservable. Observable inputs are inputs that reflect the assumptions market participants would use in pricing the asset or liability that are developed based on market data obtained from sources independent of the reporting entity. Unobservable inputs are inputs that reflect the reporting entity’s own assumptions about the assumptions market participants would use in pricing the asset or liability that are developed based on the best information available. Various inputs are used in determining the value of each Fund’s investments as of the reporting period end. The designated input levels are not necessarily an indication of the risk or liquidity associated with these investments. These inputs are categorized in the following hierarchy under applicable financial accounting standards:
| | |
Level 1 – | | Unadjusted quoted prices in active markets for identical investments, unrestricted assets or liabilities that the Funds have the ability to access at the measurement date; |
| |
Level 2 – | | Quoted prices which are not active, quoted prices for similar assets or liabilities in active markets or inputs other than quoted prices that are observable (either directly or indirectly) for substantially the full term of the asset or liability; and |
| | |
28 | | www.emeraldmutualfunds.com |
| | |
| Emerald Funds | | Notes to Financial Statements |
| | April 30, 2014 |
| | |
Level 3 – | | Significant unobservable prices or inputs (including the Funds’ own assumptions in determining the fair value of investments) where there is little or no market activity for the asset or liability at the measurement date. |
The following is a summary of each input used to value the Funds as of April 30, 2014:
| | | | | | | | | | | | | | | | |
| Investments in Securities at Value | | Level 1 -
Quoted Prices | | | Level 2 -
Other Significant
Observable Inputs | | | Level 3 -
Significant
Unobservable
Inputs | | | Total | |
Emerald Banking and Finance Fund | | | | | | | | | | | | | | | | |
Common Stocks | | | | | | | | | | | | | | | | |
Banks: Diversified | | $ | 87,191,762 | | | $ | 18,440 | | | $ | – | | | $ | 87,210,202 | |
Commercial Banks | | | 4,204,180 | | | | 394,990 | | | | – | | | | 4,599,170 | |
Other(a) | | | 24,695,814 | | | | – | | | | – | | | | 24,695,814 | |
Short Term Investments | | | 1,396,865 | | | | – | | | | – | | | | 1,396,865 | |
TOTAL | | $ | 117,488,621 | | | $ | 413,430 | | | $ | – | | | $ | 117,902,051 | |
| | |
| | | | | | | | | | | | | | | | |
| Investments in Securities at Value | | Level 1 -
Quoted Prices | | | Level 2 -
Other Significant
Observable Inputs | | | Level 3 -
Significant
Unobservable
Inputs | | | Total | |
Emerald Growth Fund | | | | | | | | | | | | | | | | |
Common Stocks(a) | | $ | 237,870,483 | | | $ | – | | | $ | – | | | $ | 237,870,483 | |
Warrants | | | – | | | | – | | | | – | | | | – | |
Short Term Investments | | | 2,656,090 | | | | – | | | | – | | | | 2,656,090 | |
TOTAL | | $ | 240,526,573 | | | $ | – | | | $ | – | | | $ | 240,526,573 | |
| | |
| (a) | For detailed descriptions of sector and industry, see the accompanying Schedule of Investments. |
The Funds recognize transfers between levels as of the end of the period. For the year ended April 30, 2014, the Emerald Banking and Finance Fund had a security with a market value of $18,440 transfer from Level 1 to Level 2 due to the Fund’s lack of a closing market price. The Emerald Banking and Finance Fund also had a security with a market value of $741,449 transfer from level 2 to level 1 due to the Funds’ use of closing market prices. For the year ended April 30, 2014, the Emerald Growth Fund did not have any transfers between Level 1 and Level 2 securities.
For the year ended April 30, 2014, the Funds did not have any securities that used significant unobservable inputs (Level 3) in determining fair value.
Investment Transactions and Investment Income: Investment transactions are accounted for on the date the investments are purchased or sold (trade date). Realized gains and losses from investment transactions are reported on an identified cost basis, which is the same basis the Funds use for federal income tax purposes. Interest income, which includes accretion of discounts, is accrued and recorded as earned. Dividend income is recognized on the ex-dividend date or for certain foreign securities, as soon as information is available to the Funds. All of the realized and unrealized gains and losses and net investment income, are allocated daily to each class in proportion to its average daily net assets.
Real Estate Investment Trusts (“REITs”): The Funds may invest a portion of their assets in REITs and are subject to certain risks associated with direct investment in REITs. REITs may be affected by changes in the value of their underlying properties and by defaults by borrowers or tenants. REITs depend generally on their ability to generate cash flow to make distributions to shareowners, and certain REITs have self-liquidation provisions by which mortgages held may be paid in full and distributions of capital returns may be made at any time. In addition, the performance of a REIT may be affected by its failure to qualify for tax-free pass-through of income under the Internal Revenue Code of 1986, as amended (the “Code”), or its failure to maintain exemption from registration under the 1940 Act.
Trust Expenses: Some expenses of the Trust can be directly attributed to the Funds. Expenses which cannot be directly attributed to the Funds are apportioned among all funds in the Trust based on average net assets of each fund.
Fund and Class Expenses: Expenses that are specific to a Fund or class of shares of a Fund are charged directly to that Fund or share class. All expenses of the Fund, other than class specific expenses, are allocated daily to each class in proportion to its average daily net assets. Expenses that are common to the Funds generally are allocated among the Funds in proportion to their average daily net assets. Fees provided under the distribution (Rule 12b-1) and/or shareholder service plans for a particular class of the Funds are charged to the operations of such class.
| | |
Annual Report | April 30, 2014 | | 29 |
| | |
| Emerald Funds | | Notes to Financial Statements |
| | April 30, 2014 |
Federal Income Taxes: Each Fund complies with the requirements under Subchapter M of the Internal Revenue Code of 1986, as amended, applicable to regulated investment companies and intends to distribute substantially all of its net taxable income and net capital gains, if any, each year so that the Funds will not be subject to excise tax on undistributed income and gains. The Funds are not subject to income taxes to the extent such distributions are made.
As of and during the year ended April 30, 2014, the Funds did not have a liability for any unrecognized tax benefits. The Funds file U.S. federal, state, and local tax returns as required. The Funds’ tax returns are subject to examination by the relevant tax authorities until expiration of the applicable statute of limitations, which is generally three years after the filing of the tax return for federal purposes and four years for most state returns. Tax returns for open years have incorporated no uncertain tax positions that require a provision for income taxes.
Distributions to Shareholders: Each Fund normally pays dividends and distributes capital gains, if any, on an annual basis. Income dividend distributions are derived from interest and other income each Fund receives from its investments, including short-term capital gains. Long term capital gain distributions are derived from gains realized when each Fund sells a security it has owned for more than a year. Each Fund may make additional distributions and dividends at other times if the portfolio manager believes doing so may be necessary for each Fund to avoid or reduce taxes.
3. TAX BASIS INFORMATION
Reclassifications: As of April 30, 2014, permanent differences on book and tax accounting were reclassified. These differences had no effect on net assets and were primarily attributed to treatment of certain investments and net investment loss. These reclassifications were as follows:
| | | | | | | | | | | | |
| | | Undistributed Net
Investment Income | | | Accumulated Net
Realized Gain/(Loss)
on Investments | | | Paid-in Capital | |
Emerald Banking and Finance Fund | | $ | 304,100 | | | $ | 46,956 | | | $ | (351,056 | ) |
Emerald Growth Fund | | | 2,294,650 | | | | (2,294,650 | ) | | | – | |
Included in those amounts reclassified was a net operating loss offset to Paid-in capital for the Emerald Banking and Finance Fund for $470,958.
Tax Basis of Investments: As of April 30, 2014, the aggregate cost of investments, gross unrealized appreciation/(depreciation) and net unrealized appreciation/(depreciation) for Federal tax purposes was as follows:
| | | | | | | | | | | | | | | | |
| | | Gross Appreciation
(excess of value over tax
cost) | | | Gross Depreciation
(excess of tax cost over
value) | | | Net Unrealized
Appreciation | | | Cost of Investments for
Income Tax Purposes | |
Emerald Banking and Finance Fund | | $ | 28,005,518 | | | $ | (2,408,852 | ) | | $ | 25,596,666 | | | $ | 92,305,385 | |
Emerald Growth Fund | | | 59,722,664 | | | | (14,876,794 | ) | | | 44,845,870 | | | | 195,680,703 | |
Components of Earnings: As of April 30, 2014, components of distributable earnings were as follows:
| | | | | | | | |
| | | Emerald Banking and
Finance Fund | | | Emerald Growth Fund | |
Undistributed ordinary income | | $ | – | | | $ | 7,294,238 | |
Accumulated capital gains/(losses) | | | (5,559,102 | ) | | | 7,922,189 | |
Net unrealized appreciation on investments | | | 25,596,666 | | | | 44,845,870 | |
Other cumulative effect of timing differences | | | (252,612 | ) | | | – | |
Total | | $ | 19,784,952 | | | $ | 60,062,297 | |
| | |
As of April 30, 2014, Emerald Banking & Finance Fund elects to defer to the period ending April 30, 2015, late year ordinary losses in the amount of $252,612.
Capital Losses: As of April 30, 2014, the Funds had capital loss carryforwards which may reduce the Funds’ taxable income arising from future net realized gains on investments, if any, to the extent permitted by the Code and thus may reduce the amount of the distributions to shareholders which would otherwise be necessary to relieve the Funds of any liability for federal tax. Pursuant to the Code, such capital loss carryforwards will expire as follows:
| | | | | | | | |
| | | Expiring in 2017 | | | Expiring in 2018 | |
Emerald Banking and Finance Fund | | $ | 3,968,187 | | | $ | 1,370,886 | |
| | |
30 | | www.emeraldmutualfunds.com |
| | |
| Emerald Funds | | Notes to Financial Statements |
| | April 30, 2014 |
During the year ended April 30, 2014, $5,859,103 of capital loss carryforwards were utilized by the Emerald Banking and Finance Fund.
The Emerald Banking and Finance Fund elects to defer to the period ending April 30, 2015 capital losses recognized during the period November 30, 2013 to April 30, 2014 in the amount of $220,029.
Tax Basis of Distributions to Shareholders: The character of distributions made during the year from net investment income or net realized gains may differ from its ultimate characterization for federal income tax purposes. Also, due to the timing of dividend distributions, the fiscal year in which amounts are distributed may differ from the fiscal year in which the income or realized gain were recorded by each Fund.
The tax character of distributions paid by the Funds for the fiscal year ended April 30, 2014, were as follows:
| | | | | | | | |
| | | Ordinary Income | | | Long-Term Capital Gain | |
Emerald Banking and Finance Fund | | $ | – | | | $ | – | |
Emerald Growth Fund | | | 1,100,217 | | | | 15,427,273 | |
The tax character of distributions paid by the Funds for the fiscal year ended April 30, 2013, were as follows:
| | | | | | | | |
| | | Ordinary Income | | | Long-Term Capital Gain | |
Emerald Banking and Finance Fund | | $ | – | | | $ | – | |
Emerald Growth Fund | | | – | | | | 14,103,676 | |
4. SECURITIES TRANSACTIONS
The cost of purchases and proceeds from sales of securities (excluding short-term securities) during the year ended April 30, 2014, was as follows:
| | | | | | | | |
| Funds | | Cost of Investments
Purchased | | | Proceeds from
Investments Sold | |
Emerald Banking and Finance Fund | | $ | 73,532,719 | | | $ | 27,750,631 | |
Emerald Growth Fund | | | 198,050,548 | | | | 133,970,646 | |
5. SHARES OF BENEFICIAL INTEREST
The capitalization of the Trust consists of an unlimited number of shares of beneficial interest with no par value per share. Holders of the shares of the Funds of the Trust have one vote for each share held and a proportionate fraction of a vote for each fractional share. All shares issued and outstanding are fully paid and are non-assessable, transferable and redeemable at the option of the shareholder. Shares have no pre-emptive rights.
6. MANAGEMENT AND RELATED-PARTY TRANSACTIONS
Emerald Mutual Fund Advisers Trust, (“the Adviser”), subject to the authority of the Board, is responsible for the overall management and administration of the Funds’ business affairs. The Adviser manages the investments of the Funds in accordance with the Funds’ investment objective, policies and limitations and investment guidelines established jointly by the Adviser and the Trustees. Pursuant to the Advisory Agreement, the Funds pay the Adviser fees for the services and facilities it provides payable on a monthly basis at the annual rate set forth below of the Funds’ average daily net assets.
| | |
Emerald Banking and Finance Fund | | |
| |
Average Total Net Assets | | Contractual Fee |
Between $0-$100M | | 1.00% |
Above $100M | | 0.90% |
| |
Emerald Growth Fund | | |
| |
Average Total Net Assets | | Contractual Fee |
Between $0-$250M | | 0.75% |
$250M-$500M | | 0.65% |
$500M-$750M | | 0.55% |
Above $750M | | 0.45% |
| | |
Annual Report | April 30, 2014 | | 31 |
| | |
| Emerald Funds | | Notes to Financial Statements |
| | April 30, 2014 |
The Adviser has contractually agreed to limit the total amount of “Management Fees” and “Other Expenses” that it is entitled to receive from both Funds through August 31, 2014, with respect to the Funds’ different classes, to the extent the Total Annual Fund Operating Expenses of a Fund (exclusive of acquired fund fees and expenses, brokerage expenses, interest expense, taxes and extraordinary expenses) exceed the annual rates (as a percentage of each Funds average daily net assets) set forth on the tables below. The Adviser will reduce the fee payable with respect to such Fund to the extent of such excess, and/or shall reimburse the Fund (or class) by the amount of such excess. The waiver or reimbursement shall be allocated to each class of the Fund in the same manner as the underlying expenses or fees were allocated.
Emerald Banking and Finance Fund
| | | | | | |
| Class A | | Class C | | Institutional Class | | Investor Class |
| 1.84% | | 2.49% | | 1.54% | | 1.89% |
Emerald Growth Fund
| | | | | | |
| Class A | | Class C | | Institutional Class | | Investor Class |
| 1.29% | | 1.94% | | 0.99% | | 1.34% |
For the year ended April 30, 2014, the fee waivers and/or reimbursements were as follows:
| | | | |
| Fund | | Fees Waived/Reimbursed By Adviser | | Recoupment of Past Waived Fees By
Adviser |
Emerald Banking and Finance Fund |
Class A | | $ – | | $ 17,195 |
Class C | | – | | 12,767 |
Institutional Class | | – | | 1,064 |
Investor Class | | – | | 2,054 |
Emerald Growth Fund | | | | |
Class A | | $ 11,560 | | $ – |
Class C | | 1,471 | | – |
Institutional Class | | 16,688 | | – |
Investor Class | | – | | 1,047 |
As of April 30, 2014, the balances of recoupable expenses for each Fund were as follows:
| | | | | | | | | | | | | | | | |
| Fund | | Expires 2015 | | | Expires 2016 | | | Expires 2017 | | | Total | |
Emerald Banking and Finance Fund | | | | | | | | | | | | | | | | |
Class A | | $ | – | | | $ | – | | | $ | – | | | $ | – | |
Class C | | | – | | | | – | | | | – | | | | – | |
Institutional Class | | | – | | | | – | | | | – | | | | – | |
Investor Class | | | – | | | | – | | | | – | | | | – | |
Emerald Growth Fund | | | | | | | | | | | | | | | | |
Class A | | $ | 6,877 | | | $ | 37,509 | | | $ | 11,560 | | | $ | 55,946 | |
Class C | | | 518 | | | | 3,189 | | | | 1,471 | | | | 5,178 | |
Institutional Class | | | 13,614 | | | | 70,871 | | | | 16,688 | | | | 101,173 | |
Investor Class | | | – | | | | 397 | | | | – | | | | 397 | |
The Emerald Banking and Finance and Emerald Growth Funds will not be obligated to pay any such deferred fees and expenses more than three years after the year(s) in which the fees and expense were incurred.
Distributor: ALPS Distributors, Inc. (“ADI” or the “Distributor”) (an affiliate of ALPS Fund Services Inc. (“ALPS”)) acts as the distributor of the Funds’ shares pursuant to a Distribution Agreement with the Trust. Shares are sold on a continuous basis by ADI as agent for the Funds, and ADI has agreed to use its best efforts to solicit orders for the sale of Funds’ shares, although it is not obliged to sell any particular amount of shares. ADI is not entitled to any compensation for its services as Distributor. ADI is registered as a broker-dealer with the Securities and Exchange Commission.
Each Fund has adopted a separate Distribution and Services Plan (each a “Plan” and collectively, the “Plans”) pursuant to Rule 12b-1 of the 1940 Act. The Plans allow each Fund, as applicable, to use each Fund’s assets to pay fees in connection with the distribution and marketing of the Funds’ shares and/or the provision of shareholder services to the Funds’ shareholders. The Plan permits payment for services in connection with the administration of plans or programs that use shares of each Fund as their funding medium and for related expenses. The Plans permit each Fund to
| | |
32 | | www.emeraldmutualfunds.com |
| | |
| Emerald Funds | | Notes to Financial Statements |
| | April 30, 2014 |
make total payments at an annual rate of up to 0.35%, 0.75% and 0.25% of the average daily net asset value of Class A, Class C and Investor Class, respectively. Because these fees are paid out of the Funds’ assets on an ongoing basis, over time they will increase the cost of an investment in the Funds, and Plan fees may cost an investor more than other types of sales charges.
Each Fund has adopted a Shareholder Services Plan (a “Shareholder Services Plan”) with respect to its shares. Under the Shareholder Services Plan, each Fund is authorized to pay banks and their affiliates and other institutions, including broker-dealers and Fund affiliates (“Participating Organizations”), an aggregate fee in an amount not to exceed on an annual basis 0.25%, 0.05% and 0.15% of the average daily net asset value of Class C, Institutional Class and Investor Class, respectively, of the Funds attributable to or held in the name of a Participating Organization for its clients as compensation for providing services pursuant to an agreement with a Participating Organization. Any amount of such payment not paid during the Funds’ fiscal year for such service activities shall be reimbursed to the Funds as soon as practicable after the end of the fiscal year. Shareholder Services Plan fees are included with distribution and service fees on the Statement of Operations.
Fund Administrator Fees and Expenses: ALPS (an affiliate of ADI) serves as administrator to the Funds, and each Fund has agreed to pay expenses incurred in connection with its administrative activities. Pursuant to the Administration, Bookkeeping and Pricing Services Agreement (the “Agreement”), ALPS will provide operational services to the Funds including, but not limited to, fund accounting and fund administration and generally assist in each Fund’s operations.
The annual administrative fee, billed monthly in total and allocated to each Fund, in the amount of the greater of (a) the annual minimum for all Funds of $140,000 in Year 1 of operations and $200,000 in subsequent years or (b) following basis point fee schedule:
| | |
| Average Total Net Assets | | Contractual Fee |
Between $0-$500M | | 0.06% |
$500M-$1B | | 0.04% |
Above $1B | | 0.025% |
The Administrator is also reimbursed by the Funds for certain out-of-pocket expenses.
Transfer Agent: ALPS serves as transfer, dividend paying and shareholder servicing agent for the Funds. ALPS receives an annual minimum fee, a fee based upon the number of shareholder accounts, and is also reimbursed by the Funds for certain out-of-pocket expenses.
Compliance Services: ALPS provides services that assist the Trust’s Chief Compliance Officer in monitoring and testing the policies and procedures of the Trust in conjunction with requirements under Rule 38a-1 under the 1940 Act and receives an annual base fee. ALPS is reimbursed for certain out-of-pocket expenses by the Funds.
Principal Financial Officer: ALPS receives an annual fee for providing principal financial officer services to the Funds.
7. INDEMNIFICATIONS
Under the Trust’s organizational documents, its officers and Trustees are indemnified against certain liability arising out of the performance of their duties to the Trust. Additionally, in the normal course of business, the Trust enters into contracts with service providers that may contain general indemnification clauses, which may permit indemnification to the extent permissible under applicable law. The Trust’s maximum exposure under these arrangements is unknown, as this would involve future claims that may be made against the Trust that have not yet occurred.
8. NEW ACCOUNTING PRONOUNCEMENTS
In June 2013, the Financial Accounting Standards Board (the “FASB”) issued Accounting Standards Update (“ASU”) No. 2013-08, Financial Services-Investment Companies (Topic 946): Amendments to the Scope, Measurement, and Disclosure Requirements. The FASB standard identifies characteristics a company must assess to determine whether it is considered an investment company for financial reporting purposes. This ASU is effective for fiscal years beginning after December 15, 2013. The Funds believe the adoption of this ASU will not have a material impact on their financial statements.
| | |
Annual Report | April 30, 2014 | | 33 |
| | |
| | | Report of Independent Registered Public Accounting Firm |
| | |
To the Shareholders and Board of Trustees of Financial Investors Trust:
We have audited the accompanying statements of assets and liabilities, including the schedules of investments, of Emerald Banking and Finance Fund and Emerald Growth Fund (the “Funds”), two of the portfolios of Financial Investors Trust as of April 30, 2014, the related statements of operations for the year then ended, the statements of changes in net assets for each of the two years in the period then ended, and the financial highlights for each of the two years in the period then ended and the period from January 1, 2012 to April 30, 2012. These financial statements and financial highlights are the responsibility of the Funds’ management. Our responsibility is to express an opinion on these financial statements and financial highlights based on our audits. The financial highlights for each of the three years in the period ended December 31, 2011 were audited by other auditors whose report, dated February 28, 2012, expressed an unqualified opinion on such financial highlights.
We conducted our audits in accordance with the standards of the Public Company Accounting Oversight Board (United States). Those standards require that we plan and perform the audit to obtain reasonable assurance about whether the financial statements and financial highlights are free of material misstatement. The Funds are not required to have, nor were we engaged to perform, an audit of their internal control over financial reporting. Our audits included consideration of internal control over financial reporting as a basis for designing audit procedures that are appropriate in the circumstances, but not for the purpose of expressing an opinion on the effectiveness of the Funds’ internal control over financial reporting. Accordingly, we express no such opinion. An audit also includes examining, on a test basis, evidence supporting the amounts and disclosures in the financial statements, assessing the accounting principles used and significant estimates made by management, as well as evaluating the overall financial statement presentation. Our procedures included confirmation of securities owned as of April 30, 2014, by correspondence with the custodian and brokers, where replies were not received from brokers, we performed other auditing procedures. We believe that our audits provide a reasonable basis for our opinion.
In our opinion, the financial statements and financial highlights referred to above present fairly, in all material respects, the financial position of Emerald Banking and Finance Fund and Emerald Growth Fund of Financial Investors Trust as of April 30, 2014, the results of their operations for the year then ended, the changes in their net assets for each of the two years in the period then ended, and the financial highlights for each of the two years in the period then ended and the period from January 1, 2012 to April 30, 2012, in conformity with accounting principles generally accepted in the United States of America.
DELOITTE & TOUCHE LLP
Denver, Colorado
June 26, 2014
| | |
34 | | www.emeraldmutualfunds.com |
| | |
| | | Disclosure Regarding Approval of Fund Advisory Agreements |
| | April 30, 2014 (Unaudited) |
On December 10, 2013, the Trustees met in person to discuss, among other things, the approval of the investment advisory agreement between the Trust and Emerald Mutual Funds Advisors Trust (“Emerald”) (the “Investment Advisory Agreement”), in accordance with Section 15(c) of the 1940 Act. The Independent Trustees met with independent legal counsel during executive session and discussed the Investment Advisory Agreement and other related materials.
In renewing and approving the Investment Advisory Agreement with Emerald, the Trustees, including the Independent Trustees, considered the following factors with respect to the Emerald Growth Fund and Emerald Banking and Finance Fund (the “Emerald Funds”):
Investment Advisory Fee Rate: The Trustees reviewed and considered the contractual annual advisory fee to be paid by the Trust, on behalf of the Emerald Funds, to Emerald of 1.00% and 0.75% of the average daily net assets of the Emerald Banking and Finance Fund and the Emerald Growth Fund, respectively, in light of the extent and quality of the advisory services provided by Emerald to the Emerald Funds.
The Trustees considered the information they received comparing the Emerald Funds’ contractual annual advisory fee and overall net expenses with those of funds in both the relevant expense peer group provided by an independent provider of investment company data.
Based on such information, the Trustees determined that the contractual annual advisory fee of 1.00% and the total net expense ratio of 1.84%, 1.89%, 2.49% and 1.54% of the Class A, Investor Class, Class C and Institutional Class Shares, respectively, of the Emerald Banking and Finance Fund, although generally greater than each respective peer group median, were reasonable in light of the generally favorable recent performance of the Fund compared with its peer group. The Trustees also determined that the contractual annual advisory fee of 0.75% and the total net expense ratio of 1.29%, 1.34%, 1.94% and 0.99% of the Class A, Investors Class, Class C and Institutional Class Shares, respectively, of the Emerald Growth Fund, were generally lower than their respective peer group medians.
Nature, Extent and Quality of the Services under the Advisory Agreement: The Trustees received and considered information regarding the nature, extent and quality of services provided to the Emerald Funds under the Investment Advisory Agreement. The Trustees reviewed certain background materials supplied by Emerald in its presentation, including its Form ADV and Summary of Compliance Policies.
The Trustees reviewed and considered Emerald’s investment advisory personnel, its history as an asset manager, its performance and the amount of assets currently under management by Emerald. The Trustees also reviewed the research and decision-making processes utilized by Emerald, including the methods adopted to seek to achieve compliance with the investment objectives, policies and restrictions of the Emerald Funds.
The Trustees considered the background and experience of Emerald’s management in connection with the Emerald Funds, including reviewing the qualifications, backgrounds and responsibilities of the management team primarily responsible for the day-to-day portfolio management of the Emerald Funds and the extent of the resources devoted to research and analysis of actual and potential investments.
The Trustees also reviewed the accompanying Compliance-related materials and further noted that they have received reports on these services and Compliance issues at each regular Board meeting throughout the year related to the services rendered by Emerald with respect to the Emerald Funds.
Performance: The Trustees reviewed performance information for each Emerald Fund for the three-month, 1-year, 3-year, 5-year and 10-year periods, depending on share class inception date, ended September 30, 2013. That review included a comparison of each Emerald Fund’s performance to the performance of a universe of comparable funds selected by an independent provider of investment company data. The Trustees noted the generally favorable performance of the Emerald Growth Fund compared with its peer performance universe, and the generally favorable comparable performance of the Emerald Banking and Finance Fund over the most recent 3-month period.
The Adviser’s Profitability: The Trustees discussed the profitability of Emerald with respect to the Emerald Funds based on information provided by Emerald. Information provided included the gross revenue attributable to each Emerald Fund, and the percentage they represented of Emerald’s total revenue as a whole. The Trustees noted Emerald’s statements that the Emerald Funds were profitable to Emerald, which was expected to continue over the next 24 months as assets were expected to grow. The Board then reviewed Emerald’s financial statements in order to analyze the financial condition and stability of Emerald.
Economies of Scale: The Trustees considered whether economies of scale in the provision of services to the Emerald Funds will be passed along to the shareholders under the proposed agreement taking into account Emerald’s statements regarding its expectations for achieving economies of scale through growth of assets.
| | |
Annual Report | April 30, 2014 | | 35 |
| | |
| | | Disclosure Regarding Approval of Fund Advisory Agreements |
| | April 30, 2014 (Unaudited) |
Other Benefits to the Adviser: The Trustees reviewed and considered any other benefits derived or to be derived by Emerald from its relationship with the Emerald Funds, including soft dollar arrangements taking into account Emerald’s statements regarding its expectations for achieving economies of scale through growth of assets.
The Board summarized its deliberations with respect to the Investment Advisory Agreement with Emerald. In selecting Emerald and approving the Investment Advisory Agreement and fees under such agreement, the Trustees concluded that no single factor reviewed by the Trustees was identified by the Trustees to be determinative as the principal factor in whether to approve the investment advisory agreement. Further, the Independent Trustees were advised by separate independent legal counsel throughout the process. The Trustees, including all of the Independent Trustees, concluded that:
| | • | | the investment advisory fees to be received by Emerald and total net expenses with respect to the Emerald Funds were, although in the case of the Emerald Banking and Finance Fund higher than the applicable peer group medians, within an acceptable range of the median, and in the case of the Emerald Growth Fund were actually lower than the applicable peer group median; |
| | • | | the nature, extent and quality of services rendered by Emerald under the Investment Advisory Agreement were adequate; |
| | • | | the performance of the Emerald Funds were either, in the case of the Emerald Growth Fund, within an acceptable range of the performance of the funds in the applicable peer universe provided by an independent provider of investment company data, or, in the case of the Emerald Banking and Finance Fund more favorable; |
| | • | | The Emerald Funds were expected to be profitable to Emerald, and such profit is fair to the Trust; and |
| | • | | to the extent there were any material economies of scale or other benefits accruing to Emerald in connection with its relationship with the Emerald Funds, their benefits had been substantially passed through to shareholders. |
Based on the Trustees’ deliberations and their evaluation of the information described above, the Trustees, including all of the Independent Trustees, concluded that Emerald’s compensation for investment advisory services is consistent with the best interests of the Emerald Funds and their shareholders.
| | |
36 | | www.emeraldmutualfunds.com |
| | |
| Emerald Funds | | Additional Information |
| | April 30, 2014 (Unaudited) |
1. FUND HOLDINGS
The Funds file their complete schedule of portfolio holdings with the Securities and Exchange Commission (the “SEC”) for the first and third quarters of each fiscal year on Form N-Q within 60 days after the end of the period. Copies of the Funds’ Form N-Q are available without charge on the SEC website at http://www.sec.gov. You may also review and copy the Form N-Q at the SEC’s Public Reference Room in Washington, DC. For more information about the operation of the Public Reference Room, please call the SEC at 1-800-SEC-0330.
2. FUND PROXY VOTING POLICIES, PROCEDURES AND SUMMARIES
Each Fund’s policies and procedures used in determining how to vote proxies and information regarding how the Funds voted proxies relating to portfolio securities during the most recent prior 12-month period ending June 30 are available without charge, (1) upon request, by calling (toll-free) (855) 828-9909 and (2) on the SEC’s website at http://www.sec.gov.
3. TAX INFORMATION (UNAUDITED)
The Funds designate the following for federal income tax purposes for distributions made during the calendar year ended December 31, 2013:
| | | | | | | | |
| | | QDI | | | DRD | |
Emerald Banking and Finance Fund | | | 0.00 | % | | | 0.00 | % |
Emerald Growth Fund | | | 24.61 | % | | | 24.88 | % |
In early 2014, if applicable, shareholders of record received this information for the distribution paid to them by the Funds during the calendar year 2013 via Form 1099. The Funds will notify shareholders in early 2015 of amounts paid to them by the Funds, if any, during the calendar year 2014.
Please consult a tax advisor if you have questions about federal or state income tax laws, or how to prepare your tax returns.
| | |
Annual Report | April 30, 2014 | | 37 |
| | |
| Emerald Funds | | Trustees & Officers |
| | April 30, 2014 (Unaudited) |
Additional information regarding the Fund’s trustees is included in the Statement of Additional Information, which can be obtained without charge by calling 855-828-9909.
INDEPENDENT TRUSTEES
| | | | | | | | | | | | |
| | | Name, Address* & Year of Birth | | Position(s) Held with Fund | | Term of Office and Length of Time Served** | | Principal Occupation(s) During Past 5 Years*** | | Number of Funds in Fund Complex Overseen by Trustee**** | | Other Directorships Held by Trustee |
| | | | | | |
| | | Mary K. Anstine, 1940 | | Trustee | | Ms. Anstine was elected at a special meeting of shareholders held on March 21, 1997 and re-elected at a special meeting of shareholders held on August 7, 2009. | | Ms. Anstine was President/Chief Executive Officer of HealthONE Alliance, Denver, Colorado, and former Executive Vice President of First Interstate Bank of Denver. Ms. Anstine is also Trustee/Director of AV Hunter Trust and Colorado Uplift Board. Ms. Anstine was formerly a Director of the Trust Bank of Colorado (later purchased and now known as Northern Trust Bank), HealthONE and Denver Area Council of the Boy Scouts of America, and a member of the American Bankers Association Trust Executive Committee. | | 30 | | Ms. Anstine is a Trustee of ALPS ETF Trust (21 funds); ALPS Variable Investment Trust (8 funds); Reaves Utility Income Fund (1 fund); and Westcore Trust (12 funds). |
| | | | | | |
| | | John R. Moran, Jr., 1930 | | Trustee | | Mr. Moran was elected at a special meeting of shareholders held on March 21, 1997 and re-elected at a special meeting of shareholders held on August 7, 2009. | | Mr. Moran is formerly President and CEO of The Colorado Trust, a private foundation serving the health and hospital community in the state of Colorado Currently, Mr. Moran is a member of the Treasurer’s Investment Advisory Committee for the University of Colorado. | | 30 | | None. |
| * | All communications to Trustees and Officers may be directed to Financial Investors Trust c/o 1290 Broadway, Suite 1100, Denver, CO 80203. |
| ** | This is the period for which the Trustee or Officer began serving the Trust. Each Trustee and/or Officer serves an indefinite term, until his successor is elected. |
| *** | Except as otherwise indicated, each individual has held the office shown or other offices in the same company for the last five years. |
| **** | The Fund Complex includes all series of the Trust (currently 30) and any other investment companies for which any Trustee serves as Trustee for and which Emerald Mutual Fund Advisers Trust provides investment advisory services (currently none). |
| | |
38 | | www.emeraldmutualfunds.com |
| | |
| Emerald Funds | | Trustees & Officers |
| | April 30, 2014 (Unaudited) |
INDEPENDENT TRUSTEES
| | | | | | | | | | | | |
| | | Name, Address* & Year of Birth | | Position(s) Held with Fund | | Term of Office and Length of Time Served** | | Principal Occupation(s) During Past 5 Years*** | | Number of Funds in Fund Complex Overseen by Trustee**** | | Other Directorships Held by Trustee |
| | | | | | |
| | | Jeremy W. Deems, 1976 | | Trustee | | Mr. Deems was appointed as a Trustee at the March 11, 2008 meeting of the Board of Trustees and elected at a special meeting of shareholders held on August 7, 2009. | | Mr. Deems is the Co-Founder, Chief Operations Officer and Chief Financial Officer of Green Alpha Advisors, LLC. Mr. Deems is Co-Portfolio Manager of the Shelton Green Alpha Fund. Prior to joining Green Alpha Advisors, Mr. Deems was CFO and Treasurer of Forward Management, LLC, ReFlow Management Co., LLC, ReFlow Fund, LLC, a private investment fund, and Sutton Place Management, LLC, an administrative services company, from 2004 to June 2007. | | 30 | | Mr. Deems is a Trustee of ALPS ETF Trust (21 funds); ALPS Variable Investment Trust (8 funds) and Reaves Utility Income Fund (1 fund). |
| | | | | | |
| | | Jerry G. Rutledge, 1944 | | Trustee | | Mr. Rutledge was elected at a special meeting of shareholders held on August 7, 2009. | | Mr. Rutledge is the President and owner of Rutledge’s Inc., a retail clothing business. Mr. Rutledge is currently Director of the American National Bank. He was from 1994 to 2007 a Regent of the University of Colorado. | | 30 | | Mr. Rutledge is a Trustee of Clough Global Allocation Fund (1 fund), Clough Global Equity Fund (1 fund) and Clough Global Opportunities Fund (1 fund). |
| | | | | | |
| | | Michael “Ross” Shell, 1970 | | Trustee | | Mr. Shell was elected at a special meeting of shareholders held on August 7, 2009. | | Mr. Shell is Founder and CEO of Red Idea, LLC, a strategic consulting/early stage venture firm (since June 2008). From 1999 to 2009, he was a part-owner and Director of Tesser, Inc., a brand agency. From December 2005 to May 2008, he was Director, Marketing and Investor Relations, of Woodbourne, a REIT/real estate hedge fund and private equity firm. Prior to this, from May 2004 to November 2005, he worked as a business strategy consultant; from June 2003 to April 2004, he was on the Global Client Services team of IDEO, a product design/innovation firm; and from 1999 to 2003, he was President of Tesser, Inc. Mr. Shell graduated with honors from Stanford University with a degree in Political Science. | | 30 | | None. |
| * | All communications to Trustees and Officers may be directed to Financial Investors Trust c/o 1290 Broadway, Suite 1100, Denver, CO 80203. |
| ** | This is the period for which the Trustee or Officer began serving the Trust. Each Trustee and/or Officer serves an indefinite term, until his successor is elected. |
| *** | Except as otherwise indicated, each individual has held the office shown or other offices in the same company for the last five years. |
| **** | The Fund Complex includes all series of the Trust (currently 30) and any other investment companies for which any Trustee serves as Trustee for and which Emerald Mutual Fund Advisers Trust provides investment advisory services (currently none). |
| | |
Annual Report | April 30, 2014 | | 39 |
| | |
| Emerald Funds | | Trustees & Officers |
| | April 30, 2014 (Unaudited) |
INTERESTED TRUSTEE
| | | | | | | | | | | | |
| | | Name, Address* & Year of Birth | | Position(s) Held with Fund | | Term of Office and Length of Time Served** | | Principal Occupation(s) During Past 5 Years*** | | Number of Funds in Fund Complex Overseen by Trustee**** | | Other Directorships Held by Trustee |
| | | | | | |
| | | Edmund J. Burke, 1961 | | Trustee, Chairman and President | | Mr. Burke was elected as Chairman at the August 28, 2009 meeting of the Board of Trustees. Mr. Burke was elected as Trustee at a special meeting of shareholders held on August 7, 2009. Mr. Burke was elected President of the Trust at the December 17, 2002 meeting of the Board of Trustees. | | Mr. Burke is President and a Director of ALPS Holdings, Inc. (“AHI”) (since 2005) and Director of Boston Financial Data Services, Inc. (“BFDS”), ALPS Advisors, Inc. (“AAI”), ALPS Distributors, Inc. (“ADI”), ALPS Fund Services, Inc. (“AFS”) and ALPS Portfolio Solutions Distributor, Inc. (“APSD”) and from 2001-2008, was President of AAI, ADI, AFS and APSD. Because of his positions with AHI, BFDS, AAI, ADI, AFS and APSD, Mr. Burke is deemed an affiliate of the Trust as defined under the 1940 Act. Mr. Burke is Trustee and President of the Clough Global Allocation Fund (Trustee since 2006; President since 2004); Trustee and President of the Clough Global Equity Fund (Trustee since 2006; President since 2005); Trustee and President of the Clough Global Opportunities Fund (since 2006); Trustee of the Liberty All-Star Equity Fund; and Director of the Liberty All-Star Growth Fund, Inc. | | 30 | | Mr. Burke is a Trustee of Clough Global Allocation Fund (1 fund); Clough Global Equity Fund (1 fund); Clough Global Opportunities Fund (1 fund); Trustee of the Liberty All-Star Equity Fund (1 fund); and Director of the Liberty All-Star Growth Fund, Inc. (1 fund). |
| | |
40 | | www.emeraldmutualfunds.com |
| | |
| Emerald Funds | | Trustees & Officers |
| | April 30, 2014 (Unaudited) |
OFFICERS
| | | | | | |
Name, Address* & Year of Birth | | Position(s) Held
with Fund | | Term of Office and Length of Time Served** | | Principal Occupation(s) During Past 5 Years*** |
| | | |
Kimberly R. Storms, 1972 | | Treasurer | | Ms. Storms was elected Treasurer of the Trust at the March 12, 2013 meeting of the Board of Trustees. | | Ms. Storms is Senior Vice President - Director of Fund Administration of ALPS. Ms. Storms joined ALPS in 1998 as Assistant Controller. Because of her position with ALPS, Ms. Storms is deemed an affiliate of the Trust as defined under the 1940 Act. Ms. Storms is also Treasurer of BPV Family of Funds and ALPS Series Trust; Assistant Treasurer of Liberty All-Star Equity Fund and Liberty All-Star Growth Fund, Inc.; Assistant Treasurer of Tilson Funds; and Chief Financial Officer of The Arbitrage Funds. |
| | | |
David T. Buhler, 1971 | | Secretary | | Mr. Buhler was elected Secretary of the Trust at the September 11, 2012 meeting of the Board of Trustees. | | Mr. Buhler joined ALPS in June 2010. He is currently Vice President and Senior Associate Counsel of ALPS, AAI, ADI and APSD. Prior to joining ALPS, Mr. Buhler served as Associate General Counsel and Assistant Secretary of Founders Asset Management LLC from 2006 to 2009. Because of his position with ALPS, Mr. Buhler is deemed an affiliate of the Trust as defined under the 1940 Act. Mr. Buhler is also the Secretary ALPS Variable Investment Trust and Westcore Trust. |
| | | |
Ted Uhl, 1974 | | Chief Compliance Officer (“CCO”) | | Mr. Uhl was appointed CCO of the Trust at the June 8, 2010 meeting of the Board of Trustees. | | Mr. Uhl joined ALPS in October 2006, and is currently Deputy Compliance Officer of ALPS. Prior to his current role, Mr. Uhl served as Senior Risk Manager for ALPS from October 2006 until June 2010. Before joining ALPS, Mr. Uhl served a Sr. Analyst with Enenbach and Associates (RIA), and a Sr. Financial Analyst at Sprint. Because of his position with ALPS, Mr. Uhl is deemed an affiliate of the Trust as defined under the 1940 Act. Mr. Uhl is also CCO of the Clough Global Funds, Reaves Utility Income Fund, Drexel Hamilton Funds and Transparent Value Trust. |
| * | All communications to Trustees and Officers may be directed to Financial Investors Trust c/o 1290 Broadway, Suite 1100, Denver, CO 80203. |
| ** | This is the period for which the Trustee or Officer began serving the Trust. Each Trustee and/or Officer serves an indefinite term, until his successor is elected. |
| *** | Except as otherwise indicated, each individual has held the office shown or other offices in the same company for the last five years. |
| | |
Annual Report | April 30, 2014 | | 41 |

| | (a) | The Registrant, as of the end of the period covered by this report, has adopted a code of ethics that applies to the Registrant’s principal executive officer, principal financial officer, principal accounting officer or controller or any persons performing similar functions on behalf of the Registrant. |
| | (c) | During the period covered by this report, no amendments to the provisions of the code of ethics adopted in Item 2(a) above were made. |
| | (d) | During the period covered by this report, no implicit or explicit waivers to the provisions of the code of ethics adopted in Item 2(a) above were granted. |
| | (f) | The Registrant’s Code of Ethics is attached as an Exhibit to this report. |
| Item 3. | Audit Committee Financial Expert. |
The Board of Trustees of the Registrant has determined that the Registrant has at least one Audit Committee Financial Expert serving on its audit committee. The Board of Trustees of the Registrant has designated Jeremy W. Deems as the Registrant’s “Audit Committee Financial Expert.” Mr. Deems is “independent” as defined in paragraph (a)(2) of Item 3 to Form N-CSR.
| Item 4. | Principal Accountant Fees and Services. |
| | (a) | Audit Fees: For the Registrant’s fiscal years ended April 30, 2014 and April 30, 2013, the aggregate fees billed for professional services rendered by the principal accountant for the audit of the Registrant’s annual financial statements were $447,000 and $407,000, respectively. |
| | (b) | Audit-Related Fees: For the Registrant’s fiscal years ended April 30, 2014 and April 30, 2013, the aggregate fees billed for assurance and related services by the principal accountant that were reasonably related to the performance of the audit of the Registrant’s financial statements and are not reported under paragraph (a) of this Item were $0 and $0, respectively. |
| | (c) | Tax Fees: For the Registrant’s fiscal years ended April 30, 2014 and April 30, 2013, the aggregate fees billed for professional services rendered by the principal accountant for tax compliance, tax advice and tax planning were $112,280 and $104,120, respectively. The fiscal year 2014 and 2013 tax fees were for services for dividend calculation, excise tax preparation and tax return preparation. |
| | (d) | All Other Fees: For the Registrant’s fiscal years ended April 30, 2014 and April 30, 2013, no fees were billed to Registrant by the principal accountant for services other than the services reported in paragraphs (a) through (c) of this Item. |
| | (e)(1) | Audit Committee Pre-Approval Policies and Procedures: All services to be performed by the Registrant’s principal accountant must be pre-approved by the Registrant’s audit committee. |
| | (e)(2) | No services described in paragraphs (b) through (d) of this Item were approved by the Registrant’s audit committee pursuant to paragraph (c)(7)(i)(C) of Rule 2-01 of Regulation S-X. |
| | (g) | The aggregate non-audit fees billed by the Registrant’s accountant to the Registrant, and rendered to the Registrant’s investment adviser (not including any sub-adviser whose role is primarily portfolio management and is subcontracted with or overseen by another investment adviser), and any entity controlling, controlled by, or under common control with the adviser that provides ongoing services to the Registrant, in each of the last two fiscal years of the Registrant were $153,978 in 2014 and $128,443 in 2013. These fees consisted of non-audit fees billed to (i) the Registrant of $112,280 in 2014 and $104,120 in 2013 as described in response to paragraph (c) above and (ii) to ALPS Fund Services, Inc. (“AFS”), an entity under common control with ALPS Advisors, Inc., the Registrant’s investment adviser, of $41,698 in 2014 and $24,323 in 2013. The non-audit fees billed to AFS related to SSAE 16 services and other compliance-related matters. |
| | (h) | The Registrant’s audit committee has considered whether the provision of non-audit services that were rendered to the Registrant’s investment adviser (not including any sub-adviser whose role is primarily portfolio management and is subcontracted with or overseen by another investment adviser), and any entity controlling, controlled by, or under common control with the investment adviser that provides ongoing services to the Registrant that were not pre-approved pursuant to paragraph (c)(7)(ii) of Rule 2-01 of Regulation S-X, is compatible with maintaining the principal accountant’s independence. The Registrant’s audit committee determined that the provision of such non-audit services is compatible with maintaining the principal accountant’s independence. |
| Item 5. | Audit Committee of Listed Registrants. |
Not applicable.
| | (a) | Schedule of Investments is included as part of the Reports to Stockholders filed under Item 1 of this Form N-CSR. |
| Item 7. | Disclosure of Proxy Voting Policies and Procedures for Closed-End Management Investment Companies. |
Not applicable to Registrant.
| Item 8. | Portfolio Managers of Closed-End Management Investment Companies. |
Not applicable to Registrant.
| Item 9. | Purchases of Equity Securities by Closed-End Management Investment Company and Affiliated Purchasers. |
Not applicable to Registrant.
| Item 10. | Submission of Matters to a Vote of Security Holders. |
There have been no material changes to the procedures by which shareholders may recommend nominees to the Registrant’s Board of Trustees, where those changes were implemented after the Registrant last provided disclosure in response to the requirements of Item 407(c)(2)(iv) of Regulation S-K, or this Item.
| Item 11. | Controls and Procedures. |
| | (a) | The Registrant’s principal executive officer and principal financial officer have concluded that the Registrant’s disclosure controls and procedures (as defined in Rule 30a-3(c) under the Investment Company Act of 1940, as amended) are effective based on their evaluation of these controls and procedures as of a date within 90 days of the filing date of this report. |
| | (b) | There was no change in the Registrant’s internal control over financial reporting (as defined in Rule 30a-3(d) under the Investment Company Act of 1940, as amended) during the second fiscal quarter of the period covered by this report that has materially affected, or is reasonably likely to materially affect, the Registrant’s internal control over financial reporting. |
| | (a)(1) | Registrant’s Code of Ethics for Principal Executive and Senior Financial Officers, which is the subject of the disclosure required by Item 2 of Form N-CSR, is incorporated by reference to Exhibit 12(a)(1) to the Registrant’s Certified Shareholder Report on Form N-CSR, File No. 811-8194, filed on July 7, 2008. |
| | (a)(2) | The certifications required by Rule 30a-2(a) of the Investment Company Act of 1940, as amended, and Section 302 of the Sarbanes-Oxley Act of 2002 are attached hereto as Exhibit 99.Cert. |
| | (b) | The certifications by the Registrant’s principal executive officer and principal financial officer, as required by Rule 30a-2(b) of the Investment Company Act of 1940, as amended, and Section 906 of the Sarbanes-Oxley Act of 2002 are attached hereto as Exhibit 99.906Cert. |
SIGNATURES
Pursuant to the requirements of the Securities Exchange Act of 1934 and the Investment Company Act of 1940, the Registrant has duly caused this report to be signed on its behalf by the undersigned, thereunto duly authorized.
FINANCIAL INVESTORS TRUST
| | |
| By: | | /s/ Edmund J. Burke |
| | Edmund J. Burke (Principal Executive Officer) |
| | President |
| |
| Date: | | July 7, 2014 |
Pursuant to the requirements of the Securities Exchange Act of 1934 and the Investment Company Act of 1940, this report has been signed below by the following persons on behalf of the Registrant and in the capacities and on the dates indicated.
| | |
| FINANCIAL INVESTORS TRUST |
| |
| By: | | /s/ Edmund J. Burke |
| | Edmund J. Burke (Principal Executive Officer) |
| | President |
| |
| Date: | | July 7, 2014 |
| |
| By: | | /s/ Kimberly R. Storms |
| | Kimberly R. Storms (Principal Financial Officer) |
| | Treasurer |
| |
| Date: | | July 7, 2014 |